UNITED STATES
SECURITIES AND EXCHANGE COMMISSION
Washington, D.C. 20549
FORM N-CSR
CERTIFIED SHAREHOLDER REPORT OF REGISTERED
MANAGEMENT INVESTMENT COMPANIES
Investment Company Act file number 811-4008
Fidelity Investment Trust
(Exact name of registrant as specified in charter)
245 Summer St., Boston, MA 02210
(Address of principal executive offices) (Zip code)
Marc Bryant, Secretary
245 Summer St.
Boston, Massachusetts 02210
(Name and address of agent for service)
Registrant's telephone number, including area code:
617-563-7000
Date of fiscal year end: | October 31 |
|
|
Date of reporting period: | April 30, 2016 |
Item 1.
Reports to Stockholders
Fidelity Advisor® Canada Fund - Semi-Annual Report April 30, 2016 Class A, Class T, Class B and Class C are classes of Fidelity® Canada Fund |
 |
Contents
To view a fund's proxy voting guidelines and proxy voting record for the 12-month period ended June 30, visit http://www.fidelity.com/proxyvotingresults or visit the Securities and Exchange Commission's (SEC) web site at http://www.sec.gov.
You may also call 1-877-208-0098 to request a free copy of the proxy voting guidelines.
Standard & Poor's, S&P and S&P 500 are registered service marks of The McGraw-Hill Companies, Inc. and have been licensed for use by Fidelity Distributors Corporation.
Other third-party marks appearing herein are the property of their respective owners.
All other marks appearing herein are registered or unregistered trademarks or service marks of FMR LLC or an affiliated company. © 2016 FMR LLC. All rights reserved.
This report and the financial statements contained herein are submitted for the general information of the shareholders of the Fund. This report is not authorized for distribution to prospective investors in the Fund unless preceded or accompanied by an effective prospectus.
A fund files its complete schedule of portfolio holdings with the SEC for the first and third quarters of each fiscal year on Form N-Q. Forms N-Q are available on the SEC’s web site at http://www.sec.gov. A fund's Forms N-Q may be reviewed and copied at the SEC’s Public Reference Room in Washington, DC. Information regarding the operation of the SEC's Public Reference Room may be obtained by calling 1-800-SEC-0330.
For a complete list of a fund's portfolio holdings, view the most recent holdings listing, semiannual report, or annual report on Fidelity's web site at http://www.fidelity.com, http://www.advisor.fidelity.com, or http://www.401k.com, as applicable.
NOT FDIC INSURED •MAY LOSE VALUE •NO BANK GUARANTEE
Neither the Fund nor Fidelity Distributors Corporation is a bank.
Investment Summary (Unaudited)
Geographic Diversification (% of fund's net assets)
| As of April 30, 2016 | ||
| Canada | 94.1% | |
| United States of America* | 3.0% | |
| United Kingdom | 0.9% | |
| Bailiwick of Jersey | 0.8% | |
| France | 0.4% | |
| Israel | 0.3% | |
| Ireland | 0.3% | |
| Netherlands | 0.2% | |

* Includes Short-Term investments and Net Other Assets (Liabilities).
Percentages are based on country or territory of incorporation and are adjusted for the effect of futures contracts, if applicable.
| As of October 31, 2015 | ||
| Canada | 94.4% | |
| United States of America* | 3.3% | |
| United Kingdom | 0.9% | |
| Bailiwick of Jersey | 0.7% | |
| Israel | 0.3% | |
| Sweden | 0.3% | |
| Ireland | 0.1% | |

* Includes Short-Term investments and Net Other Assets (Liabilities).
Percentages are based on country or territory of incorporation and are adjusted for the effect of futures contracts, if applicable.
Asset Allocation as of April 30, 2016
| % of fund's net assets | % of fund's net assets 6 months ago | |
| Stocks | 98.0 | 97.8 |
| Short-Term Investments and Net Other Assets (Liabilities) | 2.0 | 2.2 |
Top Ten Stocks as of April 30, 2016
| % of fund's net assets | % of fund's net assets 6 months ago | |
| Royal Bank of Canada (Banks) | 10.0 | 8.9 |
| The Toronto-Dominion Bank (Banks) | 9.2 | 8.3 |
| Canadian National Railway Co. (Road & Rail) | 5.5 | 6.1 |
| Suncor Energy, Inc. (Oil, Gas & Consumable Fuels) | 5.1 | 5.7 |
| Enbridge, Inc. (Oil, Gas & Consumable Fuels) | 3.4 | 4.4 |
| Rogers Communications, Inc. Class B (non-vtg.) (Wireless Telecommunication Services) | 3.3 | 3.8 |
| TELUS Corp. (Diversified Telecommunication Services) | 3.0 | 3.9 |
| Sun Life Financial, Inc. (Insurance) | 2.9 | 4.1 |
| Power Corp. of Canada (sub. vtg.) (Insurance) | 2.6 | 2.2 |
| Bank of Nova Scotia (Banks) | 2.3 | 1.6 |
| 47.3 |
Market Sectors as of April 30, 2016
| % of fund's net assets | % of fund's net assets 6 months ago | |
| Financials | 33.3 | 33.1 |
| Energy | 20.9 | 20.7 |
| Materials | 13.8 | 10.2 |
| Consumer Staples | 8.3 | 8.7 |
| Industrials | 7.2 | 8.2 |
| Telecommunication Services | 6.5 | 7.7 |
| Information Technology | 3.8 | 3.3 |
| Consumer Discretionary | 3.1 | 2.6 |
| Health Care | 0.7 | 3.0 |
| Utilities | 0.4 | 0.3 |
Market Sectors may include more than one industry category.
The Fund may invest up to 35% of its total assets in any industry that represents more than 20% of the Canadian market. As of April 30, 2016, the Fund did not have more than 25% of its total assets invested in any one industry.
Investments April 30, 2016 (Unaudited)
Showing Percentage of Net Assets
| Common Stocks - 98.0% | |||
| Shares | Value | ||
| CONSUMER DISCRETIONARY - 3.1% | |||
| Auto Components - 0.5% | |||
| Magna International, Inc. Class A (sub. vtg.) | 147,200 | $6,182,705 | |
| Hotels, Restaurants & Leisure - 0.2% | |||
| Cara Operations Ltd. | 106,400 | 2,752,645 | |
| Media - 1.4% | |||
| Corus Entertainment, Inc. Class B (non-vtg.) | 501,600 | 5,001,208 | |
| DHX Media Ltd. | 773,000 | 4,713,039 | |
| Quebecor, Inc. Class B (sub. vtg.) | 331,500 | 8,866,773 | |
| 18,581,020 | |||
| Specialty Retail - 0.3% | |||
| AutoCanada, Inc. (a) | 204,700 | 3,349,399 | |
| Textiles, Apparel & Luxury Goods - 0.7% | |||
| Gildan Activewear, Inc. | 298,790 | 9,280,184 | |
| TOTAL CONSUMER DISCRETIONARY | 40,145,953 | ||
| CONSUMER STAPLES - 8.3% | |||
| Beverages - 0.5% | |||
| Molson Coors Brewing Co. Class B | 60,600 | 5,795,178 | |
| Food & Staples Retailing - 6.8% | |||
| Alimentation Couche-Tard, Inc. Class B (sub. vtg.) | 540,800 | 23,706,065 | |
| George Weston Ltd. | 333,900 | 28,975,079 | |
| Jean Coutu Group, Inc. Class A (sub. vtg.) | 496,900 | 7,556,270 | |
| Metro, Inc. Class A (sub. vtg.) | 471,795 | 15,789,170 | |
| North West Co., Inc. | 507,200 | 11,274,255 | |
| 87,300,839 | |||
| Food Products - 0.3% | |||
| AGT Food & Ingredients, Inc. | 121,700 | 3,934,129 | |
| Personal Products - 0.2% | |||
| Edgewell Personal Care Co. (b) | 38,900 | 3,192,523 | |
| Tobacco - 0.5% | |||
| Imperial Tobacco Group PLC | 109,910 | 5,971,725 | |
| TOTAL CONSUMER STAPLES | 106,194,394 | ||
| ENERGY - 20.9% | |||
| Energy Equipment & Services - 1.4% | |||
| Canadian Energy Services & Technology Corp. | 1,930,100 | 5,891,674 | |
| Pason Systems, Inc. | 390,300 | 5,673,924 | |
| ZCL Composites, Inc. | 968,300 | 6,359,123 | |
| 17,924,721 | |||
| Oil, Gas & Consumable Fuels - 19.5% | |||
| ARC Resources Ltd. (a) | 748,000 | 12,620,674 | |
| Canadian Natural Resources Ltd. | 724,198 | 21,748,450 | |
| Cenovus Energy, Inc. | 1,329,400 | 21,074,174 | |
| Enbridge, Inc. | 1,057,200 | 43,915,887 | |
| Imperial Oil Ltd. | 637,700 | 21,148,240 | |
| Keyera Corp. (a) | 239,704 | 7,720,123 | |
| Painted Pony Petroleum Ltd. (b) | 825,000 | 3,892,564 | |
| Paramount Resources Ltd. Class A (a)(b) | 385,100 | 2,802,234 | |
| Parkland Fuel Corp. | 341,700 | 6,517,001 | |
| Peyto Exploration & Development Corp. | 385,600 | 9,843,602 | |
| PrairieSky Royalty Ltd. | 601,629 | 12,668,397 | |
| Raging River Exploration, Inc. (b) | 821,400 | 6,657,877 | |
| Spartan Energy Corp. (b) | 2,605,300 | 5,959,362 | |
| Suncor Energy, Inc. | 2,250,000 | 66,045,668 | |
| Whitecap Resources, Inc. | 1,051,500 | 7,886,040 | |
| 250,500,293 | |||
| TOTAL ENERGY | 268,425,014 | ||
| FINANCIALS - 33.3% | |||
| Banks - 21.5% | |||
| Bank of Nova Scotia | 559,100 | 29,320,778 | |
| Royal Bank of Canada | 2,075,800 | 128,912,361 | |
| The Toronto-Dominion Bank | 2,643,500 | 117,669,144 | |
| 275,902,283 | |||
| Capital Markets - 1.0% | |||
| Amundi SA | 103,800 | 4,776,830 | |
| Ashmore Group PLC (a) | 1,186,200 | 5,322,707 | |
| Uranium Participation Corp. (b) | 624,800 | 2,300,611 | |
| 12,400,148 | |||
| Insurance - 9.2% | |||
| Fairfax Financial Holdings Ltd. (sub. vtg.) | 29,600 | 15,865,147 | |
| Intact Financial Corp. | 295,625 | 21,876,768 | |
| Manulife Financial Corp. | 724,500 | 10,682,434 | |
| Power Corp. of Canada (sub. vtg.) | 1,347,500 | 32,745,098 | |
| Sun Life Financial, Inc. | 1,099,400 | 37,502,447 | |
| 118,671,894 | |||
| Real Estate Investment Trusts - 1.6% | |||
| Allied Properties (REIT) | 382,300 | 10,770,945 | |
| H&R REIT/H&R Finance Trust | 604,700 | 10,564,297 | |
| 21,335,242 | |||
| TOTAL FINANCIALS | 428,309,567 | ||
| HEALTH CARE - 0.7% | |||
| Pharmaceuticals - 0.7% | |||
| Teva Pharmaceutical Industries Ltd. sponsored ADR | 82,400 | 4,486,680 | |
| Valeant Pharmaceuticals International, Inc. (Canada) (b) | 148,921 | 4,968,004 | |
| 9,454,684 | |||
| INDUSTRIALS - 7.2% | |||
| Airlines - 0.5% | |||
| WestJet Airlines Ltd. | 361,700 | 6,053,798 | |
| Professional Services - 0.6% | |||
| Stantec, Inc. | 282,200 | 7,233,245 | |
| Stantec, Inc. ADR | 52,700 | 1,342,806 | |
| 8,576,051 | |||
| Road & Rail - 6.1% | |||
| Canadian National Railway Co. | 1,146,800 | 70,615,899 | |
| TransForce, Inc. | 415,100 | 7,834,198 | |
| 78,450,097 | |||
| TOTAL INDUSTRIALS | 93,079,946 | ||
| INFORMATION TECHNOLOGY - 3.8% | |||
| Electronic Equipment & Components - 0.2% | |||
| Avigilon Corp. (a)(b) | 213,600 | 2,744,267 | |
| IT Services - 1.4% | |||
| CGI Group, Inc. Class A (sub. vtg.) (b) | 396,300 | 18,104,659 | |
| Software - 2.2% | |||
| Constellation Software, Inc. | 35,500 | 13,873,492 | |
| Open Text Corp. | 257,814 | 14,434,872 | |
| 28,308,364 | |||
| TOTAL INFORMATION TECHNOLOGY | 49,157,290 | ||
| MATERIALS - 13.8% | |||
| Chemicals - 2.2% | |||
| Agrium, Inc. | 213,900 | 18,432,189 | |
| LyondellBasell Industries NV Class A | 28,800 | 2,380,896 | |
| Monsanto Co. | 39,100 | 3,662,888 | |
| Potash Corp. of Saskatchewan, Inc. | 203,600 | 3,602,391 | |
| 28,078,364 | |||
| Construction Materials - 0.3% | |||
| CRH PLC | 139,700 | 4,065,676 | |
| Containers & Packaging - 1.2% | |||
| CCL Industries, Inc. Class B | 62,600 | 11,462,780 | |
| Winpak Ltd. | 113,500 | 3,916,008 | |
| 15,378,788 | |||
| Metals & Mining - 9.5% | |||
| Agnico Eagle Mines Ltd. (Canada) | 418,700 | 19,792,059 | |
| Continental Gold, Inc. (b) | 1,142,500 | 2,522,296 | |
| Franco-Nevada Corp. | 83,300 | 5,848,992 | |
| Goldcorp, Inc. | 1,301,500 | 26,222,938 | |
| Labrador Iron Ore Royalty Corp. (a) | 368,800 | 4,320,842 | |
| Lundin Mining Corp. (b) | 2,504,500 | 9,840,747 | |
| Randgold Resources Ltd. | 102,964 | 10,284,896 | |
| Silver Wheaton Corp. | 853,200 | 17,877,284 | |
| Tahoe Resources, Inc. | 759,900 | 10,731,990 | |
| Teck Resources Ltd. Class B (sub. vtg.) | 654,800 | 8,016,042 | |
| Torex Gold Resources, Inc. (b) | 3,556,100 | 6,320,318 | |
| 121,778,404 | |||
| Paper & Forest Products - 0.6% | |||
| Stella-Jones, Inc. | 109,300 | 4,178,785 | |
| Western Forest Products, Inc. | 1,809,500 | 3,244,899 | |
| 7,423,684 | |||
| TOTAL MATERIALS | 176,724,916 | ||
| TELECOMMUNICATION SERVICES - 6.5% | |||
| Diversified Telecommunication Services - 3.2% | |||
| Manitoba Telecom Services, Inc. | 96,500 | 2,525,751 | |
| TELUS Corp. | 1,216,300 | 38,562,536 | |
| 41,088,287 | |||
| Wireless Telecommunication Services - 3.3% | |||
| Rogers Communications, Inc. Class B (non-vtg.) | 1,099,400 | 42,759,799 | |
| TOTAL TELECOMMUNICATION SERVICES | 83,848,086 | ||
| UTILITIES - 0.4% | |||
| Electric Utilities - 0.4% | |||
| Hydro One Ltd. | 244,600 | 4,592,951 | |
| TOTAL COMMON STOCKS | |||
| (Cost $1,011,771,553) | 1,259,932,801 | ||
| Money Market Funds - 2.4% | |||
| Fidelity Cash Central Fund, 0.38% (c) | 20,320,612 | 20,320,612 | |
| Fidelity Securities Lending Cash Central Fund, 0.42% (c)(d) | 10,341,617 | 10,341,617 | |
| TOTAL MONEY MARKET FUNDS | |||
| (Cost $30,662,229) | 30,662,229 | ||
| TOTAL INVESTMENT PORTFOLIO - 100.4% | |||
| (Cost $1,042,433,782) | 1,290,595,030 | ||
| NET OTHER ASSETS (LIABILITIES) - (0.4)% | (4,985,358) | ||
| NET ASSETS - 100% | $1,285,609,672 |
Legend
(a) Security or a portion of the security is on loan at period end.
(b) Non-income producing
(c) Affiliated fund that is generally available only to investment companies and other accounts managed by Fidelity Investments. The rate quoted is the annualized seven-day yield of the fund at period end. A complete unaudited listing of the fund's holdings as of its most recent quarter end is available upon request. In addition, each Fidelity Central Fund's financial statements are available on the SEC's website or upon request.
(d) Investment made with cash collateral received from securities on loan.
Affiliated Central Funds
Information regarding fiscal year to date income earned by the Fund from investments in Fidelity Central Funds is as follows:
| Fund | Income earned |
| Fidelity Cash Central Fund | $43,503 |
| Fidelity Securities Lending Cash Central Fund | 952,909 |
| Total | $996,412 |
Investment Valuation
The following is a summary of the inputs used, as of April 30, 2016, involving the Fund's assets and liabilities carried at fair value. The inputs or methodology used for valuing securities may not be an indication of the risk associated with investing in those securities. For more information on valuation inputs, and their aggregation into the levels used below, please refer to the Investment Valuation section in the accompanying Notes to Financial Statements.
| Valuation Inputs at Reporting Date: | ||||
| Description | Total | Level 1 | Level 2 | Level 3 |
| Investments in Securities: | ||||
| Equities: | ||||
| Consumer Discretionary | $40,145,953 | $40,145,953 | $-- | $-- |
| Consumer Staples | 106,194,394 | 106,194,394 | -- | -- |
| Energy | 268,425,014 | 268,425,014 | -- | -- |
| Financials | 428,309,567 | 428,309,567 | -- | -- |
| Health Care | 9,454,684 | 9,454,684 | -- | -- |
| Industrials | 93,079,946 | 93,079,946 | -- | -- |
| Information Technology | 49,157,290 | 49,157,290 | -- | -- |
| Materials | 176,724,916 | 162,374,344 | 14,350,572 | -- |
| Telecommunication Services | 83,848,086 | 83,848,086 | -- | -- |
| Utilities | 4,592,951 | 4,592,951 | -- | -- |
| Money Market Funds | 30,662,229 | 30,662,229 | -- | -- |
| Total Investments in Securities: | $1,290,595,030 | $1,276,244,458 | $14,350,572 | $-- |
See accompanying notes which are an integral part of the financial statements.
Financial Statements
Statement of Assets and Liabilities
| April 30, 2016 (Unaudited) | ||
| Assets | ||
| Investment in securities, at value (including securities loaned of $9,857,677) — See accompanying schedule: Unaffiliated issuers (cost $1,011,771,553) | $1,259,932,801 | |
| Fidelity Central Funds (cost $30,662,229) | 30,662,229 | |
| Total Investments (cost $1,042,433,782) | $1,290,595,030 | |
| Foreign currency held at value (cost $40,845) | 40,845 | |
| Receivable for investments sold | 14,117,371 | |
| Receivable for fund shares sold | 683,671 | |
| Dividends receivable | 2,510,752 | |
| Distributions receivable from Fidelity Central Funds | 195,666 | |
| Prepaid expenses | 1,745 | |
| Other receivables | 3,103 | |
| Total assets | 1,308,148,183 | |
| Liabilities | ||
| Payable for investments purchased | $7,933,946 | |
| Payable for fund shares redeemed | 3,028,172 | |
| Accrued management fee | 878,006 | |
| Distribution and service plan fees payable | 32,252 | |
| Other affiliated payables | 283,687 | |
| Other payables and accrued expenses | 40,831 | |
| Collateral on securities loaned, at value | 10,341,617 | |
| Total liabilities | 22,538,511 | |
| Net Assets | $1,285,609,672 | |
| Net Assets consist of: | ||
| Paid in capital | $1,082,592,424 | |
| Undistributed net investment income | 5,545,722 | |
| Accumulated undistributed net realized gain (loss) on investments and foreign currency transactions | (50,751,002) | |
| Net unrealized appreciation (depreciation) on investments and assets and liabilities in foreign currencies | 248,222,528 | |
| Net Assets | $1,285,609,672 | |
| Calculation of Maximum Offering Price | ||
| Class A: | ||
| Net Asset Value and redemption price per share ($47,435,581 ÷ 993,715 shares) | $47.74 | |
| Maximum offering price per share (100/94.25 of $47.74) | $50.65 | |
| Class T: | ||
| Net Asset Value and redemption price per share ($11,413,979 ÷ 240,120 shares) | $47.53 | |
| Maximum offering price per share (100/96.50 of $47.53) | $49.25 | |
| Class B: | ||
| Net Asset Value and offering price per share ($2,218,869 ÷ 47,287 shares)(a) | $46.92 | |
| Class C: | ||
| Net Asset Value and offering price per share ($19,909,120 ÷ 426,363 shares)(a) | $46.70 | |
| Canada: | ||
| Net Asset Value, offering price and redemption price per share ($1,195,964,152 ÷ 24,956,980 shares) | $47.92 | |
| Class I: | ||
| Net Asset Value, offering price and redemption price per share ($8,667,971 ÷ 181,174 shares) | $47.84 |
(a) Redemption price per share is equal to net asset value less any applicable contingent deferred sales charge.
See accompanying notes which are an integral part of the financial statements.
Statement of Operations
| Six months ended April 30, 2016 (Unaudited) | ||
| Investment Income | ||
| Dividends | $17,965,445 | |
| Interest | 40 | |
| Income from Fidelity Central Funds (including $952,909 from security lending) | 996,412 | |
| Income before foreign taxes withheld | 18,961,897 | |
| Less foreign taxes withheld | (2,585,887) | |
| Total income | 16,376,010 | |
| Expenses | ||
| Management fee | ||
| Basic fee | $4,221,805 | |
| Performance adjustment | 1,593,391 | |
| Transfer agent fees | 1,437,412 | |
| Distribution and service plan fees | 189,908 | |
| Accounting and security lending fees | 281,330 | |
| Custodian fees and expenses | 11,972 | |
| Independent trustees' compensation | 2,724 | |
| Registration fees | 66,487 | |
| Audit | 39,975 | |
| Legal | 2,162 | |
| Miscellaneous | 4,401 | |
| Total expenses before reductions | 7,851,567 | |
| Expense reductions | (9,373) | 7,842,194 |
| Net investment income (loss) | 8,533,816 | |
| Realized and Unrealized Gain (Loss) | ||
| Net realized gain (loss) on: | ||
| Investment securities: | ||
| Unaffiliated issuers | (38,078,868) | |
| Foreign currency transactions | (188,472) | |
| Total net realized gain (loss) | (38,267,340) | |
| Change in net unrealized appreciation (depreciation) on: Investment securities | 98,783,700 | |
| Assets and liabilities in foreign currencies | 77,536 | |
| Total change in net unrealized appreciation (depreciation) | 98,861,236 | |
| Net gain (loss) | 60,593,896 | |
| Net increase (decrease) in net assets resulting from operations | $69,127,712 |
See accompanying notes which are an integral part of the financial statements.
Statement of Changes in Net Assets
| Six months ended April 30, 2016 (Unaudited) | Year ended October 31, 2015 | |
| Increase (Decrease) in Net Assets | ||
| Operations | ||
| Net investment income (loss) | $8,533,816 | $20,629,341 |
| Net realized gain (loss) | (38,267,340) | (6,996,196) |
| Change in net unrealized appreciation (depreciation) | 98,861,236 | (283,157,405) |
| Net increase (decrease) in net assets resulting from operations | 69,127,712 | (269,524,260) |
| Distributions to shareholders from net investment income | (17,462,078) | (24,029,674) |
| Distributions to shareholders from net realized gain | (1,771,774) | (262,730,704) |
| Total distributions | (19,233,852) | (286,760,378) |
| Share transactions - net increase (decrease) | (154,046,279) | (304,156,881) |
| Redemption fees | 34,509 | 128,345 |
| Total increase (decrease) in net assets | (104,117,910) | (860,313,174) |
| Net Assets | ||
| Beginning of period | 1,389,727,582 | 2,250,040,756 |
| End of period (including undistributed net investment income of $5,545,722 and undistributed net investment income of $14,473,984, respectively) | $1,285,609,672 | $1,389,727,582 |
See accompanying notes which are an integral part of the financial statements.
Financial Highlights — Fidelity Canada Fund Class A
| Six months ended (Unaudited) April 30, | Years ended October 31, | |||||
| 2016 | 2015 | 2014 | 2013 | 2012 | 2011 | |
| Selected Per–Share Data | ||||||
| Net asset value, beginning of period | $45.25 | $60.56 | $57.31 | $53.65 | $52.20 | $53.81 |
| Income from Investment Operations | ||||||
| Net investment income (loss)A | .24 | .45 | .47 | .60 | .57 | .34 |
| Net realized and unrealized gain (loss) | 2.73 | (8.04) | 3.13 | 3.63 | 1.50 | (1.17) |
| Total from investment operations | 2.97 | (7.59) | 3.60 | 4.23 | 2.07 | (.83) |
| Distributions from net investment income | (.42) | (.50) | (.03) | (.57) | (.33) | (.35) |
| Distributions from net realized gain | (.06) | (7.22) | (.32) | – | (.29) | (.44) |
| Total distributions | (.48) | (7.72) | (.35) | (.57) | (.62) | (.79) |
| Redemption fees added to paid in capitalA | –B | –B | –B | –B | –B | .01 |
| Net asset value, end of period | $47.74 | $45.25 | $60.56 | $57.31 | $53.65 | $52.20 |
| Total ReturnC,D,E | 6.66% | (14.32)% | 6.32% | 7.98% | 4.04% | (1.64)% |
| Ratios to Average Net AssetsF,G | ||||||
| Expenses before reductions | 1.57%H | 1.43% | 1.29% | 1.19% | 1.08% | 1.12% |
| Expenses net of fee waivers, if any | 1.57%H | 1.43% | 1.29% | 1.19% | 1.08% | 1.12% |
| Expenses net of all reductions | 1.57%H | 1.43% | 1.29% | 1.18% | 1.08% | 1.12% |
| Net investment income (loss) | 1.14%H | .90% | .79% | 1.11% | 1.11% | .59% |
| Supplemental Data | ||||||
| Net assets, end of period (000 omitted) | $47,436 | $58,286 | $95,004 | $116,661 | $159,597 | $215,369 |
| Portfolio turnover rateI | 37%H | 24% | 85% | 64% | 86% | 104% |
A Calculated based on average shares outstanding during the period.
B Amount represents less than $.005 per share.
C Total returns for periods of less than one year are not annualized.
D Total returns would have been lower if certain expenses had not been reduced during the applicable periods shown.
E Total returns do not include the effect of the sales charges.
F Fees and expenses of any underlying Fidelity Central Funds are not included in the Fund's expense ratio. The Fund indirectly bears its proportionate share of the expenses of any underlying Fidelity Central Funds.
G Expense ratios reflect operating expenses of the class. Expenses before reductions do not reflect amounts reimbursed by the investment adviser or reductions from brokerage service arrangements or reductions from other expense offset arrangements and do not represent the amount paid by the class during periods when reimbursements or reductions occur. Expenses net of fee waivers reflect expenses after reimbursement by the investment adviser but prior to reductions from brokerage service arrangements or other expense offset arrangements. Expenses net of all reductions represent the net expenses paid by the class.
H Annualized
I Amount does not include the portfolio activity of any underlying Fidelity Central Funds.
See accompanying notes which are an integral part of the financial statements.
Financial Highlights — Fidelity Canada Fund Class T
| Six months ended (Unaudited) April 30, | Years ended October 31, | |||||
| 2016 | 2015 | 2014 | 2013 | 2012 | 2011 | |
| Selected Per–Share Data | ||||||
| Net asset value, beginning of period | $44.99 | $60.22 | $57.14 | $53.48 | $52.01 | $53.64 |
| Income from Investment Operations | ||||||
| Net investment income (loss)A | .18 | .29 | .29 | .45 | .43 | .17 |
| Net realized and unrealized gain (loss) | 2.71 | (8.00) | 3.11 | 3.63 | 1.49 | (1.16) |
| Total from investment operations | 2.89 | (7.71) | 3.40 | 4.08 | 1.92 | (.99) |
| Distributions from net investment income | (.29) | (.30) | – | (.42) | (.16) | (.21) |
| Distributions from net realized gain | (.06) | (7.22) | (.32) | – | (.29) | (.44) |
| Total distributions | (.35) | (7.52) | (.32) | (.42) | (.45) | (.65) |
| Redemption fees added to paid in capitalA | –B | –B | –B | –B | –B | .01 |
| Net asset value, end of period | $47.53 | $44.99 | $60.22 | $57.14 | $53.48 | $52.01 |
| Total ReturnC,D,E | 6.49% | (14.58)% | 5.99% | 7.69% | 3.74% | (1.93)% |
| Ratios to Average Net AssetsF,G | ||||||
| Expenses before reductions | 1.85%H | 1.75% | 1.59% | 1.47% | 1.36% | 1.42% |
| Expenses net of fee waivers, if any | 1.85%H | 1.75% | 1.59% | 1.47% | 1.36% | 1.42% |
| Expenses net of all reductions | 1.85%H | 1.75% | 1.59% | 1.46% | 1.36% | 1.42% |
| Net investment income (loss) | .86%H | .58% | .48% | .83% | .83% | .30% |
| Supplemental Data | ||||||
| Net assets, end of period (000 omitted) | $11,414 | $12,820 | $21,989 | $23,751 | $29,626 | $34,323 |
| Portfolio turnover rateI | 37%H | 24% | 85% | 64% | 86% | 104% |
A Calculated based on average shares outstanding during the period.
B Amount represents less than $.005 per share.
C Total returns for periods of less than one year are not annualized.
D Total returns would have been lower if certain expenses had not been reduced during the applicable periods shown.
E Total returns do not include the effect of the sales charges.
F Fees and expenses of any underlying Fidelity Central Funds are not included in the Fund's expense ratio. The Fund indirectly bears its proportionate share of the expenses of any underlying Fidelity Central Funds.
G Expense ratios reflect operating expenses of the class. Expenses before reductions do not reflect amounts reimbursed by the investment adviser or reductions from brokerage service arrangements or reductions from other expense offset arrangements and do not represent the amount paid by the class during periods when reimbursements or reductions occur. Expenses net of fee waivers reflect expenses after reimbursement by the investment adviser but prior to reductions from brokerage service arrangements or other expense offset arrangements. Expenses net of all reductions represent the net expenses paid by the class.
H Annualized
I Amount does not include the portfolio activity of any underlying Fidelity Central Funds.
See accompanying notes which are an integral part of the financial statements.
Financial Highlights — Fidelity Canada Fund Class B
| Six months ended (Unaudited) April 30, | Years ended October 31, | |||||
| 2016 | 2015 | 2014 | 2013 | 2012 | 2011 | |
| Selected Per–Share Data | ||||||
| Net asset value, beginning of period | $44.22 | $59.27 | $56.53 | $52.89 | $51.37 | $53.03 |
| Income from Investment Operations | ||||||
| Net investment income (loss)A | .08 | .05 | (.01) | .18 | .17 | (.11) |
| Net realized and unrealized gain (loss) | 2.68 | (7.88) | 3.07 | 3.60 | 1.49 | (1.14) |
| Total from investment operations | 2.76 | (7.83) | 3.06 | 3.78 | 1.66 | (1.25) |
| Distributions from net investment income | – | – | – | (.14) | – | (.01) |
| Distributions from net realized gain | (.06) | (7.22) | (.32) | – | (.14) | (.41) |
| Total distributions | (.06) | (7.22) | (.32) | (.14) | (.14) | (.42) |
| Redemption fees added to paid in capitalA | –B | –B | –B | –B | –B | .01 |
| Net asset value, end of period | $46.92 | $44.22 | $59.27 | $56.53 | $52.89 | $51.37 |
| Total ReturnC,D,E | 6.25% | (14.99)% | 5.45% | 7.17% | 3.25% | (2.41)% |
| Ratios to Average Net AssetsF,G | ||||||
| Expenses before reductions | 2.33%H | 2.22% | 2.09% | 1.96% | 1.85% | 1.91% |
| Expenses net of fee waivers, if any | 2.33%H | 2.22% | 2.09% | 1.96% | 1.85% | 1.91% |
| Expenses net of all reductions | 2.33%H | 2.22% | 2.09% | 1.95% | 1.85% | 1.91% |
| Net investment income (loss) | .38%H | .11% | (.01)% | .34% | .34% | (.20)% |
| Supplemental Data | ||||||
| Net assets, end of period (000 omitted) | $2,219 | $2,678 | $6,290 | $7,737 | $9,804 | $11,866 |
| Portfolio turnover rateI | 37%H | 24% | 85% | 64% | 86% | 104% |
A Calculated based on average shares outstanding during the period.
B Amount represents less than $.005 per share.
C Total returns for periods of less than one year are not annualized.
D Total returns would have been lower if certain expenses had not been reduced during the applicable periods shown.
E Total returns do not include the effect of the contingent deferred sales charge.
F Fees and expenses of any underlying Fidelity Central Funds are not included in the Fund's expense ratio. The Fund indirectly bears its proportionate share of the expenses of any underlying Fidelity Central Funds.
G Expense ratios reflect operating expenses of the class. Expenses before reductions do not reflect amounts reimbursed by the investment adviser or reductions from brokerage service arrangements or reductions from other expense offset arrangements and do not represent the amount paid by the class during periods when reimbursements or reductions occur. Expenses net of fee waivers reflect expenses after reimbursement by the investment adviser but prior to reductions from brokerage service arrangements or other expense offset arrangements. Expenses net of all reductions represent the net expenses paid by the class.
H Annualized
I Amount does not include the portfolio activity of any underlying Fidelity Central Funds.
See accompanying notes which are an integral part of the financial statements.
Financial Highlights — Fidelity Canada Fund Class C
| Six months ended (Unaudited) April 30, | Years ended October 31, | |||||
| 2016 | 2015 | 2014 | 2013 | 2012 | 2011 | |
| Selected Per–Share Data | ||||||
| Net asset value, beginning of period | $44.02 | $59.04 | $56.27 | $52.61 | $51.19 | $52.87 |
| Income from Investment Operations | ||||||
| Net investment income (loss)A | .09 | .07 | .02 | .20 | .19 | (.08) |
| Net realized and unrealized gain (loss) | 2.67 | (7.85) | 3.07 | 3.58 | 1.46 | (1.14) |
| Total from investment operations | 2.76 | (7.78) | 3.09 | 3.78 | 1.65 | (1.22) |
| Distributions from net investment income | (.02) | (.02) | – | (.12) | – | (.03) |
| Distributions from net realized gain | (.06) | (7.22) | (.32) | – | (.23) | (.44) |
| Total distributions | (.08) | (7.24) | (.32) | (.12) | (.23) | (.47) |
| Redemption fees added to paid in capitalA | –B | –B | –B | –B | –B | .01 |
| Net asset value, end of period | $46.70 | $44.02 | $59.04 | $56.27 | $52.61 | $51.19 |
| Total ReturnC,D,E | 6.28% | (14.96)% | 5.53% | 7.21% | 3.26% | (2.36)% |
| Ratios to Average Net AssetsF,G | ||||||
| Expenses before reductions | 2.30%H | 2.19% | 2.03% | 1.93% | 1.82% | 1.86% |
| Expenses net of fee waivers, if any | 2.30%H | 2.19% | 2.03% | 1.92% | 1.82% | 1.86% |
| Expenses net of all reductions | 2.29%H | 2.18% | 2.03% | 1.92% | 1.82% | 1.86% |
| Net investment income (loss) | .41%H | .14% | .04% | .37% | .37% | (.15)% |
| Supplemental Data | ||||||
| Net assets, end of period (000 omitted) | $19,909 | $21,610 | $38,749 | $46,040 | $66,500 | $87,990 |
| Portfolio turnover rateI | 37%H | 24% | 85% | 64% | 86% | 104% |
A Calculated based on average shares outstanding during the period.
B Amount represents less than $.005 per share.
C Total returns for periods of less than one year are not annualized.
D Total returns would have been lower if certain expenses had not been reduced during the applicable periods shown.
E Total returns do not include the effect of the contingent deferred sales charge.
F Fees and expenses of any underlying Fidelity Central Funds are not included in the Fund's expense ratio. The Fund indirectly bears its proportionate share of the expenses of any underlying Fidelity Central Funds.
G Expense ratios reflect operating expenses of the class. Expenses before reductions do not reflect amounts reimbursed by the investment adviser or reductions from brokerage service arrangements or reductions from other expense offset arrangements and do not represent the amount paid by the class during periods when reimbursements or reductions occur. Expenses net of fee waivers reflect expenses after reimbursement by the investment adviser but prior to reductions from brokerage service arrangements or other expense offset arrangements. Expenses net of all reductions represent the net expenses paid by the class.
H Annualized
I Amount does not include the portfolio activity of any underlying Fidelity Central Funds.
See accompanying notes which are an integral part of the financial statements.
Financial Highlights — Fidelity Canada Fund
| Six months ended (Unaudited) April 30, | Years ended October 31, | |||||
| 2016 | 2015 | 2014 | 2013 | 2012 | 2011 | |
| Selected Per–Share Data | ||||||
| Net asset value, beginning of period | $45.55 | $60.95 | $57.72 | $54.05 | $52.59 | $54.14 |
| Income from Investment Operations | ||||||
| Net investment income (loss)A | .31 | .60 | .66 | .77 | .73 | .52 |
| Net realized and unrealized gain (loss) | 2.73 | (8.09) | 3.13 | 3.66 | 1.51 | (1.18) |
| Total from investment operations | 3.04 | (7.49) | 3.79 | 4.43 | 2.24 | (.66) |
| Distributions from net investment income | (.61) | (.69) | (.24) | (.76) | (.49) | (.46) |
| Distributions from net realized gain | (.06) | (7.22) | (.32) | – | (.29) | (.44) |
| Total distributions | (.67) | (7.91) | (.56) | (.76) | (.78) | (.90) |
| Redemption fees added to paid in capitalA | –B | –B | –B | –B | –B | .01 |
| Net asset value, end of period | $47.92 | $45.55 | $60.95 | $57.72 | $54.05 | $52.59 |
| Total ReturnC,D | 6.83% | (14.08)% | 6.64% | 8.32% | 4.36% | (1.33)% |
| Ratios to Average Net AssetsE,F | ||||||
| Expenses before reductions | 1.26%G | 1.15% | .98% | .87% | .77% | .82% |
| Expenses net of fee waivers, if any | 1.26%G | 1.15% | .98% | .87% | .77% | .82% |
| Expenses net of all reductions | 1.26%G | 1.14% | .98% | .86% | .77% | .82% |
| Net investment income (loss) | 1.45%G | 1.18% | 1.09% | 1.42% | 1.42% | .90% |
| Supplemental Data | ||||||
| Net assets, end of period (000 omitted) | $1,195,964 | $1,279,488 | $2,057,843 | $2,262,380 | $2,992,597 | $3,778,765 |
| Portfolio turnover rateH | 37%G | 24% | 85% | 64% | 86% | 104% |
A Calculated based on average shares outstanding during the period.
B Amount represents less than $.005 per share.
C Total returns for periods of less than one year are not annualized.
D Total returns would have been lower if certain expenses had not been reduced during the applicable periods shown.
E Fees and expenses of any underlying Fidelity Central Funds are not included in the Fund's expense ratio. The Fund indirectly bears its proportionate share of the expenses of any underlying Fidelity Central Funds.
F Expense ratios reflect operating expenses of the class. Expenses before reductions do not reflect amounts reimbursed by the investment adviser or reductions from brokerage service arrangements or reductions from other expense offset arrangements and do not represent the amount paid by the class during periods when reimbursements or reductions occur. Expenses net of fee waivers reflect expenses after reimbursement by the investment adviser but prior to reductions from brokerage service arrangements or other expense offset arrangements. Expenses net of all reductions represent the net expenses paid by the class.
G Annualized
H Amount does not include the portfolio activity of any underlying Fidelity Central Funds.
See accompanying notes which are an integral part of the financial statements.
Financial Highlights — Fidelity Canada Fund Class I
| Six months ended (Unaudited) April 30, | Years ended October 31, | |||||
| 2016 | 2015 | 2014 | 2013 | 2012 | 2011 | |
| Selected Per–Share Data | ||||||
| Net asset value, beginning of period | $45.44 | $60.80 | $57.57 | $53.91 | $52.44 | $54.02 |
| Income from Investment Operations | ||||||
| Net investment income (loss)A | .32 | .61 | .65 | .78 | .74 | .51 |
| Net realized and unrealized gain (loss) | 2.73 | (8.07) | 3.12 | 3.64 | 1.50 | (1.18) |
| Total from investment operations | 3.05 | (7.46) | 3.77 | 4.42 | 2.24 | (.67) |
| Distributions from net investment income | (.59) | (.68) | (.22) | (.76) | (.48) | (.48) |
| Distributions from net realized gain | (.06) | (7.22) | (.32) | – | (.29) | (.44) |
| Total distributions | (.65) | (7.90) | (.54) | (.76) | (.77) | (.92) |
| Redemption fees added to paid in capitalA | –B | –B | –B | –B | –B | .01 |
| Net asset value, end of period | $47.84 | $45.44 | $60.80 | $57.57 | $53.91 | $52.44 |
| Total ReturnC,D | 6.85% | (14.05)% | 6.62% | 8.34% | 4.38% | (1.35)% |
| Ratios to Average Net AssetsE,F | ||||||
| Expenses before reductions | 1.21%G | 1.13% | 1.00% | .86% | .76% | .82% |
| Expenses net of fee waivers, if any | 1.21%G | 1.12% | 1.00% | .86% | .76% | .82% |
| Expenses net of all reductions | 1.21%G | 1.12% | 1.00% | .85% | .76% | .82% |
| Net investment income (loss) | 1.50%G | 1.21% | 1.08% | 1.43% | 1.42% | .89% |
| Supplemental Data | ||||||
| Net assets, end of period (000 omitted) | $8,668 | $14,846 | $30,165 | $30,831 | $59,245 | $68,112 |
| Portfolio turnover rateH | 37%G | 24% | 85% | 64% | 86% | 104% |
A Calculated based on average shares outstanding during the period.
B Amount represents less than $.005 per share.
C Total returns for periods of less than one year are not annualized.
D Total returns would have been lower if certain expenses had not been reduced during the applicable periods shown.
E Fees and expenses of any underlying Fidelity Central Funds are not included in the Fund's expense ratio. The Fund indirectly bears its proportionate share of the expenses of any underlying Fidelity Central Funds.
F Expense ratios reflect operating expenses of the class. Expenses before reductions do not reflect amounts reimbursed by the investment adviser or reductions from brokerage service arrangements or reductions from other expense offset arrangements and do not represent the amount paid by the class during periods when reimbursements or reductions occur. Expenses net of fee waivers reflect expenses after reimbursement by the investment adviser but prior to reductions from brokerage service arrangements or other expense offset arrangements. Expenses net of all reductions represent the net expenses paid by the class.
G Annualized
H Amount does not include the portfolio activity of any underlying Fidelity Central Funds.
See accompanying notes which are an integral part of the financial statements.
Notes to Financial Statements (Unaudited)
For the period ended April 30, 2016
1. Organization.
Fidelity Canada Fund (the Fund) is a fund of Fidelity Investment Trust (the Trust) and is authorized to issue an unlimited number of shares. The Trust is registered under the Investment Company Act of 1940, as amended (the 1940 Act), as an open-end management investment company organized as a Massachusetts business trust. The Fund offers Class A, Class T, Class C, Canada and Class I shares, each of which, along with Class B shares, has equal rights as to assets and voting privileges. Class B shares are closed to new accounts and additional purchases, except for exchanges and reinvestments. Each class has exclusive voting rights with respect to matters that affect that class. Class B shares will automatically convert to Class A shares after a maximum holding period of seven years from the initial date of purchase.
During the period, the Board of Trustees approved the conversion of all existing Class B shares into Class A shares, effective on or about July 1, 2016, regardless of the length of times shares have been held.
2. Investments in Fidelity Central Funds.
The Fund invests in Fidelity Central Funds, which are open-end investment companies generally available only to other investment companies and accounts managed by the investment adviser and its affiliates. The Fund's Schedule of Investments lists each of the Fidelity Central Funds held as of period end, if any, as an investment of the Fund, but does not include the underlying holdings of each Fidelity Central Fund. As an Investing Fund, the Fund indirectly bears its proportionate share of the expenses of the underlying Fidelity Central Funds.
The Money Market Central Funds seek preservation of capital and current income and are managed by Fidelity Investments Money Management, Inc. (FIMM), an affiliate of the investment adviser. Annualized expenses of the Money Market Central Funds as of their most recent shareholder report date are less than .005%.
A complete unaudited list of holdings for each Fidelity Central Fund is available upon request or at the Securities and Exchange Commission (the SEC) website at www.sec.gov. In addition, the financial statements of the Fidelity Central Funds are available on the SEC website or upon request.
3. Significant Accounting Policies.
The financial statements have been prepared in conformity with accounting principles generally accepted in the United States of America (GAAP), which require management to make certain estimates and assumptions at the date of the financial statements. Actual results could differ from those estimates. Subsequent events, if any, through the date that the financial statements were issued have been evaluated in the preparation of the financial statements. The following summarizes the significant accounting policies of the Fund:
Investment Valuation. Investments are valued as of 4:00 p.m. Eastern time on the last calendar day of the period. The Board of Trustees (the Board) has delegated the day to day responsibility for the valuation of the Fund's investments to the Fidelity Management & Research Company (FMR) Fair Value Committee (the Committee). In accordance with valuation policies and procedures approved by the Board, the Fund attempts to obtain prices from one or more third party pricing vendors or brokers to value its investments. When current market prices, quotations or currency exchange rates are not readily available or reliable, investments will be fair valued in good faith by the Committee, in accordance with procedures adopted by the Board. Factors used in determining fair value vary by investment type and may include market or investment specific events. The frequency with which these procedures are used cannot be predicted and they may be utilized to a significant extent. The Committee oversees the Fund's valuation policies and procedures and reports to the Board on the Committee's activities and fair value determinations. The Board monitors the appropriateness of the procedures used in valuing the Fund's investments and ratifies the fair value determinations of the Committee.
The Fund categorizes the inputs to valuation techniques used to value its investments into a disclosure hierarchy consisting of three levels as shown below:
- Level 1 – quoted prices in active markets for identical investments
- Level 2 – other significant observable inputs (including quoted prices for similar investments, interest rates, prepayment speeds, etc.)
- Level 3 – unobservable inputs (including the Fund's own assumptions based on the best information available)
Valuation techniques used to value the Fund's investments by major category are as follows:
Equity securities, including restricted securities, for which market quotations are readily available, are valued at the last reported sale price or official closing price as reported by a third party pricing vendor on the primary market or exchange on which they are traded and are categorized as Level 1 in the hierarchy. In the event there were no sales during the day or closing prices are not available, securities are valued at the last quoted bid price or may be valued using the last available price and are generally categorized as Level 2 in the hierarchy. For foreign equity securities, when market or security specific events arise, comparisons to the valuation of American Depositary Receipts (ADRs), futures contracts, Exchange-Traded Funds (ETFs) and certain indexes as well as quoted prices for similar securities may be used and would be categorized as Level 2 in the hierarchy. Utilizing these techniques may result in transfers between Level 1 and Level 2. For equity securities, including restricted securities, where observable inputs are limited, assumptions about market activity and risk are used and these securities may be categorized as Level 3 in the hierarchy.
Investments in open-end mutual funds, including the Fidelity Central Funds, are valued at their closing net asset value (NAV) each business day and are categorized as Level 1 in the hierarchy.
Changes in valuation techniques may result in transfers in or out of an assigned level within the disclosure hierarchy. The aggregate value of investments by input level as of April 30, 2016 is included at the end of the Fund's Schedule of Investments.
Foreign Currency. The Fund may use foreign currency contracts to facilitate transactions in foreign-denominated securities. Gains and losses from these transactions may arise from changes in the value of the foreign currency or if the counterparties do not perform under the contracts' terms.
Foreign-denominated assets, including investment securities, and liabilities are translated into U.S. dollars at the exchange rates at period end. Purchases and sales of investment securities, income and dividends received and expenses denominated in foreign currencies are translated into U.S. dollars at the exchange rate in effect on the transaction date.
The effects of exchange rate fluctuations on investments are included with the net realized and unrealized gain (loss) on investment securities. Other foreign currency transactions resulting in realized and unrealized gain (loss) are disclosed separately.
Investment Transactions and Income. For financial reporting purposes, the Fund's investment holdings and NAV include trades executed through the end of the last business day of the period. The NAV per share for processing shareholder transactions is calculated as of the close of business of the New York Stock Exchange (NYSE), normally 4:00 p.m. Eastern time and includes trades executed through the end of the prior business day. Gains and losses on securities sold are determined on the basis of identified cost and may include proceeds received from litigation. Dividend income is recorded on the ex-dividend date, except for certain dividends from foreign securities where the ex-dividend date may have passed, which are recorded as soon as the Fund is informed of the ex-dividend date. Non-cash dividends included in dividend income, if any, are recorded at the fair market value of the securities received. Income and capital gain distributions from Fidelity Central Funds, if any, are recorded on the ex-dividend date. Distributions received on securities that represent a return of capital or capital gain are recorded as a reduction of cost of investments and/or as a realized gain. Subsequent to ex-dividend date the Fund determines the components of these distributions, based upon receipt of tax filings or other correspondence relating to the underlying investment. Interest income is accrued as earned and includes coupon interest and amortization of premium and accretion of discount on debt securities as applicable. Investment income is recorded net of foreign taxes withheld where recovery of such taxes is uncertain.
Class Allocations and Expenses. Investment income, realized and unrealized capital gains and losses, common expenses of the Fund, and certain fund-level expense reductions, if any, are allocated daily on a pro-rata basis to each class based on the relative net assets of each class to the total net assets of the Fund. Each class differs with respect to transfer agent and distribution and service plan fees incurred. Certain expense reductions may also differ by class. For the reporting period, the allocated portion of income and expenses to each class as a percent of its average net assets may vary due to the timing of recording these transactions in relation to fluctuating net assets of the classes. Expenses directly attributable to a fund are charged to that fund. Expenses attributable to more than one fund are allocated among the respective funds on the basis of relative net assets or other appropriate methods. Expense estimates are accrued in the period to which they relate and adjustments are made when actual amounts are known.
Income Tax Information and Distributions to Shareholders. Each year, the Fund intends to qualify as a regulated investment company under Subchapter M of the Internal Revenue Code, including distributing substantially all of its taxable income and realized gains. As a result, no provision for U.S. Federal income taxes is required. The Fund files a U.S. federal tax return, in addition to state and local tax returns as required. The Fund's federal income tax returns are subject to examination by the Internal Revenue Service (IRS) for a period of three fiscal years after they are filed. State and local tax returns may be subject to examination for an additional fiscal year depending on the jurisdiction. Foreign taxes are provided for based on the Fund's understanding of the tax rules and rates that exist in the foreign markets in which it invests.
Distributions are declared and recorded on the ex-dividend date. Income dividends and capital gain distributions are declared separately for each class. Income and capital gain distributions are determined in accordance with income tax regulations, which may differ from GAAP.
Capital accounts within the financial statements are adjusted for permanent book-tax differences. These adjustments have no impact on net assets or the results of operations. Capital accounts are not adjusted for temporary book-tax differences which will reverse in a subsequent period.
Book-tax differences are primarily due to foreign currency transactions, passive foreign investment companies (PFIC), deferred trustees compensation and losses deferred due to wash sales.
The federal tax cost of investment securities and unrealized appreciation (depreciation) as of period end were as follows:
| Gross unrealized appreciation | $314,151,043 |
| Gross unrealized depreciation | (74,008,231) |
| Net unrealized appreciation (depreciation) on securities | $240,142,812 |
| Tax cost | $1,050,452,218 |
Short-Term Trading (Redemption) Fees. Shares held by investors in the Fund less than 90 days may have been subject to a redemption fee equal to 1.50% of the NAV of shares redeemed. All redemption fees, which reduce the proceeds of the shareholder redemption, are retained by the Fund and accounted for as an addition to paid in capital.
4. Purchases and Sales of Investments.
Purchases and sales of securities, other than short-term securities, aggregated $222,288,695 and $383,011,745, respectively.
5. Fees and Other Transactions with Affiliates.
Management Fee. Fidelity Management & Research Company (the investment adviser) and its affiliates provide the Fund with investment management related services for which the Fund pays a monthly management fee. The management fee is the sum of an individual fund fee rate that is based on an annual rate of .45% of the Fund's average net assets and an annualized group fee rate that averaged .25% during the period. The group fee rate is based upon the average net assets of all the mutual funds advised by the investment adviser, including any mutual funds previously advised by the investment adviser that are currently advised by Fidelity SelectCo, LLC, an affiliate of the investment adviser. The group fee rate decreases as assets under management increase and increases as assets under management decrease. In addition, the management fee is subject to a performance adjustment (up to a maximum of +/- .20% of the Fund's average net assets over a 36 month performance period). The upward or downward adjustment to the management fee is based on the relative investment performance of Canada as compared to its benchmark index, the S&P/TSX Composite Index, over the same 36 month performance period. For the reporting period, the total annualized management fee rate, including the performance adjustment, was .96% of the Fund's average net assets. The performance adjustment included in the management fee rate may be higher or lower than the maximum performance adjustment rate due to the difference between the average net assets for the reporting and performance periods.
Distribution and Service Plan Fees. In accordance with Rule 12b-1 of the 1940 Act, the Fund has adopted separate Distribution and Service Plans for each class of shares. Certain classes pay Fidelity Distributors Corporation (FDC), an affiliate of the investment adviser, separate Distribution and Service Fees, each of which is based on an annual percentage of each class' average net assets. In addition, FDC may pay financial intermediaries for selling shares of the Fund and providing shareholder support services. For the period, the Distribution and Service Fee rates, total fees and amounts retained by FDC were as follows:
| Distribution Fee | Service Fee | Total Fees | Retained by FDC | |
| Class A | -% | .25% | $58,105 | $– |
| Class T | .25% | .25% | 27,541 | – |
| Class B | .75% | .25% | 11,113 | 8,335 |
| Class C | .75% | .25% | 93,149 | 2,665 |
| $189,908 | $11,000 |
Sales Load. FDC may receive a front-end sales charge of up to 5.75% for selling Class A shares and 3.50% for selling Class T shares, some of which is paid to financial intermediaries for selling shares of the Fund. Depending on the holding period, FDC may receive contingent deferred sales charges levied on Class A, Class T, Class B, and Class C redemptions. The deferred sales charges range from 5.00% to 1.00% for Class B shares, 1.00% for Class C shares, 1.00% for certain purchases of Class A shares and .25% for certain purchases of Class T shares.
For the period, sales charge amounts retained by FDC were as follows:
| Retained by FDC | |
| Class A | $2,637 |
| Class T | 1,094 |
| Class B(a) | 1,397 |
| Class C(a) | 597 |
| $5,725 |
(a) When Class B and Class C shares are initially sold, FDC pays commissions from its own resources to financial intermediaries through which the sales are made.
Transfer Agent Fees. Fidelity Investments Institutional Operations Company, Inc., (FIIOC), an affiliate of the investment adviser, is the transfer, dividend disbursing and shareholder servicing agent for each class of the Fund. FIIOC receives account fees and asset-based fees that vary according to the account size and type of account of the shareholders of the respective classes of the Fund. FIIOC pays for typesetting, printing and mailing of shareholder reports, except proxy statements.
For the period, transfer agent fees for each class were as follows:
| Amount | % of Class-Level Average Net Assets(a) | |
| Class A | $67,198 | .29 |
| Class T | 17,829 | .32 |
| Class B | 3,332 | .30 |
| Class C | 25,128 | .27 |
| Canada | 1,314,704 | .23 |
| Class I | 9,221 | .18 |
| $1,437,412 |
(a) Annualized
Accounting and Security Lending Fees. Fidelity Service Company, Inc. (FSC), an affiliate of the investment adviser, maintains the Fund's accounting records. The accounting fee is based on the level of average net assets for each month. Under a separate contract, FSC administers the security lending program. The security lending fee is based on the number and duration of lending transactions.
Brokerage Commissions. The Fund placed a portion of its portfolio transactions with brokerage firms which are affiliates of the investment adviser. Brokerage commissions are included in net realized gain (loss) and change in net unrealized appreciation (depreciation) in the Statement of Operations. The commissions paid to these affiliated firms were $294 for the period.
Interfund Trades. The Fund may purchase from or sell securities to other Fidelity Funds under procedures adopted by the Board. The procedures have been designed to ensure these interfund trades are executed in accordance with Rule 17a-7 of the 1940 Act. Interfund trades are included within the respective purchases and sales amounts shown in the Purchases and Sales of Investments note.
6. Committed Line of Credit.
The Fund participates with other funds managed by the investment adviser or an affiliate in a $4.25 billion credit facility (the "line of credit") to be utilized for temporary or emergency purposes to fund shareholder redemptions or for other short-term liquidity purposes. The Fund has agreed to pay commitment fees on its pro-rata portion of the line of credit, which amounted to $1,071 and is reflected in Miscellaneous expenses on the Statement of Operations. During the period, the Fund did not borrow on this line of credit.
7. Security Lending.
The Fund lends portfolio securities through a lending agent from time to time in order to earn additional income. For equity securities, a lending agent is used and may loan securities to certain qualified borrowers, including Fidelity Capital Markets (FCM), a broker-dealer affiliated with the Fund. On the settlement date of the loan, the Fund receives collateral (in the form of U.S. Treasury obligations, letters of credit and/or cash) against the loaned securities and maintains collateral in an amount not less than 100% of the market value of the loaned securities during the period of the loan. The market value of the loaned securities is determined at the close of business of the Fund and any additional required collateral is delivered to the Fund on the next business day. The Fund or borrower may terminate the loan at any time, and if the borrower defaults on its obligation to return the securities loaned because of insolvency or other reasons, the Fund may apply collateral received from the borrower against the obligation. The Fund may experience delays and costs in recovering the securities loaned. Any cash collateral received is invested in the Fidelity Securities Lending Cash Central Fund. The value of loaned securities and cash collateral at period end are disclosed on the Fund's Statement of Assets and Liabilities. Security lending income represents the income earned on investing cash collateral, less rebates paid to borrowers and any lending agent fees associated with the loan, plus any premium payments received for lending certain types of securities. Security lending income is presented in the Statement of Operations as a component of income from Fidelity Central Funds, and includes $2,028 from securities loaned to FCM.
8. Expense Reductions.
Commissions paid to certain brokers with whom the investment adviser, or its affiliates, places trades on behalf of the Fund include an amount in addition to trade execution, which may be rebated back to the Fund to offset certain expenses. This amount totaled $4,918 for the period. In addition, through arrangements with the Fund's custodian, credits realized as a result of certain uninvested cash balances were used to reduce the Fund's expenses. During the period, these credits reduced the Fund's custody expenses by $21.
In addition, during the period the investment adviser reimbursed and/or waived a portion of fund-level operating expenses in the amount of $4,434.
9. Distributions to Shareholders.
Distributions to shareholders of each class were as follows:
| Six months ended April 30, 2016 | Year ended October 31, 2015 | |
| From net investment income | ||
| Class A | $482,934 | $783,478 |
| Class T | 79,315 | 106,245 |
| Class C | 8,502 | 12,920 |
| Canada | 16,735,044 | 22,800,214 |
| Class I | 156,283 | 326,817 |
| Total | $17,462,078 | $24,029,674 |
| From net realized gain | ||
| Class A | $69,321 | $11,358,847 |
| Class T | 16,639 | 2,548,483 |
| Class B | 3,460 | 742,098 |
| Class C | 28,339 | 4,664,328 |
| Canada | 1,638,014 | 239,967,215 |
| Class I | 16,001 | 3,449,733 |
| Total | $1,771,774 | $262,730,704 |
10. Share Transactions.
Share transactions for each class were as follows and may contain automatic conversions between classes or exchanges between affiliated funds:
| Shares | Shares | Dollars | Dollars | |
| Six months ended April 30, 2016 | Year ended October 31, 2015 | Six months ended April 30, 2016 | Year ended October 31, 2015 | |
| Class A | ||||
| Shares sold | 36,639 | 153,407 | $1,582,358 | $8,099,168 |
| Reinvestment of distributions | 11,425 | 200,582 | 496,287 | 10,552,616 |
| Shares redeemed | (342,515) | (634,705) | (14,730,138) | (31,737,294) |
| Net increase (decrease) | (294,451) | (280,716) | $(12,651,493) | $(13,085,510) |
| Class T | ||||
| Shares sold | 9,827 | 21,812 | $408,970 | $1,102,045 |
| Reinvestment of distributions | 2,169 | 49,518 | 93,951 | 2,597,730 |
| Shares redeemed | (56,853) | (151,491) | (2,357,721) | (7,597,599) |
| Net increase (decrease) | (44,857) | (80,161) | $(1,854,800) | $(3,897,824) |
| Class B | ||||
| Shares sold | 499 | 1,663 | $21,790 | $85,823 |
| Reinvestment of distributions | 68 | 12,380 | 2,895 | 641,184 |
| Shares redeemed | (13,828) | (59,611) | (579,039) | (2,906,257) |
| Net increase (decrease) | (13,261) | (45,568) | $(554,354) | $(2,179,250) |
| Class C | ||||
| Shares sold | 24,743 | 42,631 | $1,052,682 | $2,146,853 |
| Reinvestment of distributions | 731 | 75,003 | 31,141 | 3,864,885 |
| Shares redeemed | (90,006) | (283,087) | (3,720,124) | (13,692,762) |
| Net increase (decrease) | (64,532) | (165,453) | $(2,636,301) | $(7,681,024) |
| Canada | ||||
| Shares sold | 779,017 | 1,250,697 | $33,585,544 | $63,450,179 |
| Reinvestment of distributions | 388,588 | 4,716,591 | 16,926,879 | 249,177,482 |
| Shares redeemed | (4,297,518) | (11,643,757) | (180,976,780) | (581,614,067) |
| Net increase (decrease) | (3,129,913) | (5,676,469) | $(130,464,357) | $(268,986,406) |
| Class I | ||||
| Shares sold | 70,963 | 66,679 | $2,977,708 | $3,430,310 |
| Reinvestment of distributions | 2,849 | 49,883 | 123,890 | 2,628,352 |
| Shares redeemed | (219,360) | (285,976) | (8,986,572) | (14,385,529) |
| Net increase (decrease) | (145,548) | (169,414) | $(5,884,974) | $(8,326,867) |
11. Other.
The Fund's organizational documents provide former and current trustees and officers with a limited indemnification against liabilities arising in connection with the performance of their duties to the Fund. In the normal course of business, the Fund may also enter into contracts that provide general indemnifications. The Fund's maximum exposure under these arrangements is unknown as this would be dependent on future claims that may be made against the Fund. The risk of material loss from such claims is considered remote.
Shareholder Expense Example
As a shareholder of the Fund, you incur two types of costs: (1) transaction costs, including sales charges (loads) on purchase payments or redemption proceeds, redemption fees and (2) ongoing costs, including management fees, distribution and/or service (12b-1) fees and other Fund expenses. This Example is intended to help you understand your ongoing costs (in dollars) of investing in the Fund and to compare these costs with the ongoing costs of investing in other mutual funds.
The Example is based on an investment of $1,000 invested at the beginning of the period and held for the entire period (November 1, 2015 to April 30, 2016).
Actual Expenses
The first line of the accompanying table for each class of the Fund provides information about actual account values and actual expenses. You may use the information in this line, together with the amount you invested, to estimate the expenses that you paid over the period. Simply divide your account value by $1,000.00 (for example, an $8,600 account value divided by $1,000.00 = 8.6), then multiply the result by the number in the first line for a class of the Fund under the heading entitled "Expenses Paid During Period" to estimate the expenses you paid on your account during this period. A small balance maintenance fee of $12.00 that is charged once a year may apply for certain accounts with a value of less than $2,000. This fee is not included in the table below. If it was, the estimate of expenses you paid during the period would be higher, and your ending account value lower, by this amount. In addition, the Fund, as a shareholder in the underlying Fidelity Central Funds, will indirectly bear its pro-rata share of the fees and expenses incurred by the underlying Fidelity Central Funds. These fees and expenses are not included in the Fund's annualized expense ratio used to calculate the expense estimate in the table below.
Hypothetical Example for Comparison Purposes
The second line of the accompanying table for each class of the Fund provides information about hypothetical account values and hypothetical expenses based on a Class' actual expense ratio and an assumed rate of return of 5% per year before expenses, which is not the Class' actual return. The hypothetical account values and expenses may not be used to estimate the actual ending account balance or expenses you paid for the period. You may use this information to compare the ongoing costs of investing in the Fund and other funds. To do so, compare this 5% hypothetical example with the 5% hypothetical examples that appear in the shareholder reports of the other funds. A small balance maintenance fee of $12.00 that is charged once a year may apply for certain accounts with a value of less than $2,000. This fee is not included in the table below. If it was, the estimate of expenses you paid during the period would be higher, and your ending account value lower, by this amount. In addition, the Fund, as a shareholder in the underlying Fidelity Central Funds, will indirectly bear its pro-rata share of the fees and expenses incurred by the underlying Fidelity Central Funds. These fees and expenses are not included in the Fund's annualized expense ratio used to calculate the expense estimate in the table below.
Please note that the expenses shown in the table are meant to highlight your ongoing costs only and do not reflect any transaction costs. Therefore, the second line of the table is useful in comparing ongoing costs only, and will not help you determine the relative total costs of owning different funds. In addition, if these transactional costs were included, your costs would have been higher.
| Annualized Expense Ratio-A | Beginning Account Value November 1, 2015 | Ending Account Value April 30, 2016 | Expenses Paid During Period-B November 1, 2015 to April 30, 2016 | |
| Class A | 1.57% | |||
| Actual | $1,000.00 | $1,066.60 | $8.07 | |
| Hypothetical-C | $1,000.00 | $1,017.06 | $7.87 | |
| Class T | 1.85% | |||
| Actual | $1,000.00 | $1,064.90 | $9.50 | |
| Hypothetical-C | $1,000.00 | $1,015.66 | $9.27 | |
| Class B | 2.33% | |||
| Actual | $1,000.00 | $1,062.50 | $11.95 | |
| Hypothetical-C | $1,000.00 | $1,013.28 | $11.66 | |
| Class C | 2.30% | |||
| Actual | $1,000.00 | $1,062.80 | $11.80 | |
| Hypothetical-C | $1,000.00 | $1,013.43 | $11.51 | |
| Canada | 1.26% | |||
| Actual | $1,000.00 | $1,068.30 | $6.48 | |
| Hypothetical-C | $1,000.00 | $1,018.60 | $6.32 | |
| Class I | 1.21% | |||
| Actual | $1,000.00 | $1,068.50 | $6.22 | |
| Hypothetical-C | $1,000.00 | $1,018.85 | $6.07 |
A Annualized expense ratio reflects expenses net of applicable fee waivers.
B Expenses are equal to each Class' annualized expense ratio, multiplied by the average account value over the period, multiplied by 182/366 (to reflect the one-half year period).
C 5% return per year before expenses
![]()
ACAN-SANN-0616
1.843168.108
Fidelity Advisor® Canada Fund - Semi-Annual Report April 30, 2016 Class I is a class of Fidelity® Canada Fund |
|
Contents
To view a fund's proxy voting guidelines and proxy voting record for the 12-month period ended June 30, visit http://www.fidelity.com/proxyvotingresults or visit the Securities and Exchange Commission's (SEC) web site at http://www.sec.gov.
You may also call 1-877-208-0098 to request a free copy of the proxy voting guidelines.
Standard & Poor's, S&P and S&P 500 are registered service marks of The McGraw-Hill Companies, Inc. and have been licensed for use by Fidelity Distributors Corporation.
Other third-party marks appearing herein are the property of their respective owners.
All other marks appearing herein are registered or unregistered trademarks or service marks of FMR LLC or an affiliated company. © 2016 FMR LLC. All rights reserved.
This report and the financial statements contained herein are submitted for the general information of the shareholders of the Fund. This report is not authorized for distribution to prospective investors in the Fund unless preceded or accompanied by an effective prospectus.
A fund files its complete schedule of portfolio holdings with the SEC for the first and third quarters of each fiscal year on Form N-Q. Forms N-Q are available on the SEC’s web site at http://www.sec.gov. A fund's Forms N-Q may be reviewed and copied at the SEC’s Public Reference Room in Washington, DC. Information regarding the operation of the SEC's Public Reference Room may be obtained by calling 1-800-SEC-0330.
For a complete list of a fund's portfolio holdings, view the most recent holdings listing, semiannual report, or annual report on Fidelity's web site at http://www.fidelity.com, http://www.advisor.fidelity.com, or http://www.401k.com, as applicable.
NOT FDIC INSURED •MAY LOSE VALUE •NO BANK GUARANTEE
Neither the Fund nor Fidelity Distributors Corporation is a bank.
Investment Summary (Unaudited)
Geographic Diversification (% of fund's net assets)
| As of April 30, 2016 | ||
| Canada | 94.1% | |
| United States of America* | 3.0% | |
| United Kingdom | 0.9% | |
| Bailiwick of Jersey | 0.8% | |
| France | 0.4% | |
| Israel | 0.3% | |
| Ireland | 0.3% | |
| Netherlands | 0.2% | |

* Includes Short-Term investments and Net Other Assets (Liabilities).
Percentages are based on country or territory of incorporation and are adjusted for the effect of futures contracts, if applicable.
| As of October 31, 2015 | ||
| Canada | 94.4% | |
| United States of America* | 3.3% | |
| United Kingdom | 0.9% | |
| Bailiwick of Jersey | 0.7% | |
| Israel | 0.3% | |
| Sweden | 0.3% | |
| Ireland | 0.1% | |

* Includes Short-Term investments and Net Other Assets (Liabilities).
Percentages are based on country or territory of incorporation and are adjusted for the effect of futures contracts, if applicable.
Asset Allocation as of April 30, 2016
| % of fund's net assets | % of fund's net assets 6 months ago | |
| Stocks | 98.0 | 97.8 |
| Short-Term Investments and Net Other Assets (Liabilities) | 2.0 | 2.2 |
Top Ten Stocks as of April 30, 2016
| % of fund's net assets | % of fund's net assets 6 months ago | |
| Royal Bank of Canada (Banks) | 10.0 | 8.9 |
| The Toronto-Dominion Bank (Banks) | 9.2 | 8.3 |
| Canadian National Railway Co. (Road & Rail) | 5.5 | 6.1 |
| Suncor Energy, Inc. (Oil, Gas & Consumable Fuels) | 5.1 | 5.7 |
| Enbridge, Inc. (Oil, Gas & Consumable Fuels) | 3.4 | 4.4 |
| Rogers Communications, Inc. Class B (non-vtg.) (Wireless Telecommunication Services) | 3.3 | 3.8 |
| TELUS Corp. (Diversified Telecommunication Services) | 3.0 | 3.9 |
| Sun Life Financial, Inc. (Insurance) | 2.9 | 4.1 |
| Power Corp. of Canada (sub. vtg.) (Insurance) | 2.6 | 2.2 |
| Bank of Nova Scotia (Banks) | 2.3 | 1.6 |
| 47.3 |
Market Sectors as of April 30, 2016
| % of fund's net assets | % of fund's net assets 6 months ago | |
| Financials | 33.3 | 33.1 |
| Energy | 20.9 | 20.7 |
| Materials | 13.8 | 10.2 |
| Consumer Staples | 8.3 | 8.7 |
| Industrials | 7.2 | 8.2 |
| Telecommunication Services | 6.5 | 7.7 |
| Information Technology | 3.8 | 3.3 |
| Consumer Discretionary | 3.1 | 2.6 |
| Health Care | 0.7 | 3.0 |
| Utilities | 0.4 | 0.3 |
Market Sectors may include more than one industry category.
The Fund may invest up to 35% of its total assets in any industry that represents more than 20% of the Canadian market. As of April 30, 2016, the Fund did not have more than 25% of its total assets invested in any one industry.
Investments April 30, 2016 (Unaudited)
Showing Percentage of Net Assets
| Common Stocks - 98.0% | |||
| Shares | Value | ||
| CONSUMER DISCRETIONARY - 3.1% | |||
| Auto Components - 0.5% | |||
| Magna International, Inc. Class A (sub. vtg.) | 147,200 | $6,182,705 | |
| Hotels, Restaurants & Leisure - 0.2% | |||
| Cara Operations Ltd. | 106,400 | 2,752,645 | |
| Media - 1.4% | |||
| Corus Entertainment, Inc. Class B (non-vtg.) | 501,600 | 5,001,208 | |
| DHX Media Ltd. | 773,000 | 4,713,039 | |
| Quebecor, Inc. Class B (sub. vtg.) | 331,500 | 8,866,773 | |
| 18,581,020 | |||
| Specialty Retail - 0.3% | |||
| AutoCanada, Inc. (a) | 204,700 | 3,349,399 | |
| Textiles, Apparel & Luxury Goods - 0.7% | |||
| Gildan Activewear, Inc. | 298,790 | 9,280,184 | |
| TOTAL CONSUMER DISCRETIONARY | 40,145,953 | ||
| CONSUMER STAPLES - 8.3% | |||
| Beverages - 0.5% | |||
| Molson Coors Brewing Co. Class B | 60,600 | 5,795,178 | |
| Food & Staples Retailing - 6.8% | |||
| Alimentation Couche-Tard, Inc. Class B (sub. vtg.) | 540,800 | 23,706,065 | |
| George Weston Ltd. | 333,900 | 28,975,079 | |
| Jean Coutu Group, Inc. Class A (sub. vtg.) | 496,900 | 7,556,270 | |
| Metro, Inc. Class A (sub. vtg.) | 471,795 | 15,789,170 | |
| North West Co., Inc. | 507,200 | 11,274,255 | |
| 87,300,839 | |||
| Food Products - 0.3% | |||
| AGT Food & Ingredients, Inc. | 121,700 | 3,934,129 | |
| Personal Products - 0.2% | |||
| Edgewell Personal Care Co. (b) | 38,900 | 3,192,523 | |
| Tobacco - 0.5% | |||
| Imperial Tobacco Group PLC | 109,910 | 5,971,725 | |
| TOTAL CONSUMER STAPLES | 106,194,394 | ||
| ENERGY - 20.9% | |||
| Energy Equipment & Services - 1.4% | |||
| Canadian Energy Services & Technology Corp. | 1,930,100 | 5,891,674 | |
| Pason Systems, Inc. | 390,300 | 5,673,924 | |
| ZCL Composites, Inc. | 968,300 | 6,359,123 | |
| 17,924,721 | |||
| Oil, Gas & Consumable Fuels - 19.5% | |||
| ARC Resources Ltd. (a) | 748,000 | 12,620,674 | |
| Canadian Natural Resources Ltd. | 724,198 | 21,748,450 | |
| Cenovus Energy, Inc. | 1,329,400 | 21,074,174 | |
| Enbridge, Inc. | 1,057,200 | 43,915,887 | |
| Imperial Oil Ltd. | 637,700 | 21,148,240 | |
| Keyera Corp. (a) | 239,704 | 7,720,123 | |
| Painted Pony Petroleum Ltd. (b) | 825,000 | 3,892,564 | |
| Paramount Resources Ltd. Class A (a)(b) | 385,100 | 2,802,234 | |
| Parkland Fuel Corp. | 341,700 | 6,517,001 | |
| Peyto Exploration & Development Corp. | 385,600 | 9,843,602 | |
| PrairieSky Royalty Ltd. | 601,629 | 12,668,397 | |
| Raging River Exploration, Inc. (b) | 821,400 | 6,657,877 | |
| Spartan Energy Corp. (b) | 2,605,300 | 5,959,362 | |
| Suncor Energy, Inc. | 2,250,000 | 66,045,668 | |
| Whitecap Resources, Inc. | 1,051,500 | 7,886,040 | |
| 250,500,293 | |||
| TOTAL ENERGY | 268,425,014 | ||
| FINANCIALS - 33.3% | |||
| Banks - 21.5% | |||
| Bank of Nova Scotia | 559,100 | 29,320,778 | |
| Royal Bank of Canada | 2,075,800 | 128,912,361 | |
| The Toronto-Dominion Bank | 2,643,500 | 117,669,144 | |
| 275,902,283 | |||
| Capital Markets - 1.0% | |||
| Amundi SA | 103,800 | 4,776,830 | |
| Ashmore Group PLC (a) | 1,186,200 | 5,322,707 | |
| Uranium Participation Corp. (b) | 624,800 | 2,300,611 | |
| 12,400,148 | |||
| Insurance - 9.2% | |||
| Fairfax Financial Holdings Ltd. (sub. vtg.) | 29,600 | 15,865,147 | |
| Intact Financial Corp. | 295,625 | 21,876,768 | |
| Manulife Financial Corp. | 724,500 | 10,682,434 | |
| Power Corp. of Canada (sub. vtg.) | 1,347,500 | 32,745,098 | |
| Sun Life Financial, Inc. | 1,099,400 | 37,502,447 | |
| 118,671,894 | |||
| Real Estate Investment Trusts - 1.6% | |||
| Allied Properties (REIT) | 382,300 | 10,770,945 | |
| H&R REIT/H&R Finance Trust | 604,700 | 10,564,297 | |
| 21,335,242 | |||
| TOTAL FINANCIALS | 428,309,567 | ||
| HEALTH CARE - 0.7% | |||
| Pharmaceuticals - 0.7% | |||
| Teva Pharmaceutical Industries Ltd. sponsored ADR | 82,400 | 4,486,680 | |
| Valeant Pharmaceuticals International, Inc. (Canada) (b) | 148,921 | 4,968,004 | |
| 9,454,684 | |||
| INDUSTRIALS - 7.2% | |||
| Airlines - 0.5% | |||
| WestJet Airlines Ltd. | 361,700 | 6,053,798 | |
| Professional Services - 0.6% | |||
| Stantec, Inc. | 282,200 | 7,233,245 | |
| Stantec, Inc. ADR | 52,700 | 1,342,806 | |
| 8,576,051 | |||
| Road & Rail - 6.1% | |||
| Canadian National Railway Co. | 1,146,800 | 70,615,899 | |
| TransForce, Inc. | 415,100 | 7,834,198 | |
| 78,450,097 | |||
| TOTAL INDUSTRIALS | 93,079,946 | ||
| INFORMATION TECHNOLOGY - 3.8% | |||
| Electronic Equipment & Components - 0.2% | |||
| Avigilon Corp. (a)(b) | 213,600 | 2,744,267 | |
| IT Services - 1.4% | |||
| CGI Group, Inc. Class A (sub. vtg.) (b) | 396,300 | 18,104,659 | |
| Software - 2.2% | |||
| Constellation Software, Inc. | 35,500 | 13,873,492 | |
| Open Text Corp. | 257,814 | 14,434,872 | |
| 28,308,364 | |||
| TOTAL INFORMATION TECHNOLOGY | 49,157,290 | ||
| MATERIALS - 13.8% | |||
| Chemicals - 2.2% | |||
| Agrium, Inc. | 213,900 | 18,432,189 | |
| LyondellBasell Industries NV Class A | 28,800 | 2,380,896 | |
| Monsanto Co. | 39,100 | 3,662,888 | |
| Potash Corp. of Saskatchewan, Inc. | 203,600 | 3,602,391 | |
| 28,078,364 | |||
| Construction Materials - 0.3% | |||
| CRH PLC | 139,700 | 4,065,676 | |
| Containers & Packaging - 1.2% | |||
| CCL Industries, Inc. Class B | 62,600 | 11,462,780 | |
| Winpak Ltd. | 113,500 | 3,916,008 | |
| 15,378,788 | |||
| Metals & Mining - 9.5% | |||
| Agnico Eagle Mines Ltd. (Canada) | 418,700 | 19,792,059 | |
| Continental Gold, Inc. (b) | 1,142,500 | 2,522,296 | |
| Franco-Nevada Corp. | 83,300 | 5,848,992 | |
| Goldcorp, Inc. | 1,301,500 | 26,222,938 | |
| Labrador Iron Ore Royalty Corp. (a) | 368,800 | 4,320,842 | |
| Lundin Mining Corp. (b) | 2,504,500 | 9,840,747 | |
| Randgold Resources Ltd. | 102,964 | 10,284,896 | |
| Silver Wheaton Corp. | 853,200 | 17,877,284 | |
| Tahoe Resources, Inc. | 759,900 | 10,731,990 | |
| Teck Resources Ltd. Class B (sub. vtg.) | 654,800 | 8,016,042 | |
| Torex Gold Resources, Inc. (b) | 3,556,100 | 6,320,318 | |
| 121,778,404 | |||
| Paper & Forest Products - 0.6% | |||
| Stella-Jones, Inc. | 109,300 | 4,178,785 | |
| Western Forest Products, Inc. | 1,809,500 | 3,244,899 | |
| 7,423,684 | |||
| TOTAL MATERIALS | 176,724,916 | ||
| TELECOMMUNICATION SERVICES - 6.5% | |||
| Diversified Telecommunication Services - 3.2% | |||
| Manitoba Telecom Services, Inc. | 96,500 | 2,525,751 | |
| TELUS Corp. | 1,216,300 | 38,562,536 | |
| 41,088,287 | |||
| Wireless Telecommunication Services - 3.3% | |||
| Rogers Communications, Inc. Class B (non-vtg.) | 1,099,400 | 42,759,799 | |
| TOTAL TELECOMMUNICATION SERVICES | 83,848,086 | ||
| UTILITIES - 0.4% | |||
| Electric Utilities - 0.4% | |||
| Hydro One Ltd. | 244,600 | 4,592,951 | |
| TOTAL COMMON STOCKS | |||
| (Cost $1,011,771,553) | 1,259,932,801 | ||
| Money Market Funds - 2.4% | |||
| Fidelity Cash Central Fund, 0.38% (c) | 20,320,612 | 20,320,612 | |
| Fidelity Securities Lending Cash Central Fund, 0.42% (c)(d) | 10,341,617 | 10,341,617 | |
| TOTAL MONEY MARKET FUNDS | |||
| (Cost $30,662,229) | 30,662,229 | ||
| TOTAL INVESTMENT PORTFOLIO - 100.4% | |||
| (Cost $1,042,433,782) | 1,290,595,030 | ||
| NET OTHER ASSETS (LIABILITIES) - (0.4)% | (4,985,358) | ||
| NET ASSETS - 100% | $1,285,609,672 |
Legend
(a) Security or a portion of the security is on loan at period end.
(b) Non-income producing
(c) Affiliated fund that is generally available only to investment companies and other accounts managed by Fidelity Investments. The rate quoted is the annualized seven-day yield of the fund at period end. A complete unaudited listing of the fund's holdings as of its most recent quarter end is available upon request. In addition, each Fidelity Central Fund's financial statements are available on the SEC's website or upon request.
(d) Investment made with cash collateral received from securities on loan.
Affiliated Central Funds
Information regarding fiscal year to date income earned by the Fund from investments in Fidelity Central Funds is as follows:
| Fund | Income earned |
| Fidelity Cash Central Fund | $43,503 |
| Fidelity Securities Lending Cash Central Fund | 952,909 |
| Total | $996,412 |
Investment Valuation
The following is a summary of the inputs used, as of April 30, 2016, involving the Fund's assets and liabilities carried at fair value. The inputs or methodology used for valuing securities may not be an indication of the risk associated with investing in those securities. For more information on valuation inputs, and their aggregation into the levels used below, please refer to the Investment Valuation section in the accompanying Notes to Financial Statements.
| Valuation Inputs at Reporting Date: | ||||
| Description | Total | Level 1 | Level 2 | Level 3 |
| Investments in Securities: | ||||
| Equities: | ||||
| Consumer Discretionary | $40,145,953 | $40,145,953 | $-- | $-- |
| Consumer Staples | 106,194,394 | 106,194,394 | -- | -- |
| Energy | 268,425,014 | 268,425,014 | -- | -- |
| Financials | 428,309,567 | 428,309,567 | -- | -- |
| Health Care | 9,454,684 | 9,454,684 | -- | -- |
| Industrials | 93,079,946 | 93,079,946 | -- | -- |
| Information Technology | 49,157,290 | 49,157,290 | -- | -- |
| Materials | 176,724,916 | 162,374,344 | 14,350,572 | -- |
| Telecommunication Services | 83,848,086 | 83,848,086 | -- | -- |
| Utilities | 4,592,951 | 4,592,951 | -- | -- |
| Money Market Funds | 30,662,229 | 30,662,229 | -- | -- |
| Total Investments in Securities: | $1,290,595,030 | $1,276,244,458 | $14,350,572 | $-- |
See accompanying notes which are an integral part of the financial statements.
Financial Statements
Statement of Assets and Liabilities
| April 30, 2016 (Unaudited) | ||
| Assets | ||
| Investment in securities, at value (including securities loaned of $9,857,677) — See accompanying schedule: Unaffiliated issuers (cost $1,011,771,553) | $1,259,932,801 | |
| Fidelity Central Funds (cost $30,662,229) | 30,662,229 | |
| Total Investments (cost $1,042,433,782) | $1,290,595,030 | |
| Foreign currency held at value (cost $40,845) | 40,845 | |
| Receivable for investments sold | 14,117,371 | |
| Receivable for fund shares sold | 683,671 | |
| Dividends receivable | 2,510,752 | |
| Distributions receivable from Fidelity Central Funds | 195,666 | |
| Prepaid expenses | 1,745 | |
| Other receivables | 3,103 | |
| Total assets | 1,308,148,183 | |
| Liabilities | ||
| Payable for investments purchased | $7,933,946 | |
| Payable for fund shares redeemed | 3,028,172 | |
| Accrued management fee | 878,006 | |
| Distribution and service plan fees payable | 32,252 | |
| Other affiliated payables | 283,687 | |
| Other payables and accrued expenses | 40,831 | |
| Collateral on securities loaned, at value | 10,341,617 | |
| Total liabilities | 22,538,511 | |
| Net Assets | $1,285,609,672 | |
| Net Assets consist of: | ||
| Paid in capital | $1,082,592,424 | |
| Undistributed net investment income | 5,545,722 | |
| Accumulated undistributed net realized gain (loss) on investments and foreign currency transactions | (50,751,002) | |
| Net unrealized appreciation (depreciation) on investments and assets and liabilities in foreign currencies | 248,222,528 | |
| Net Assets | $1,285,609,672 | |
| Calculation of Maximum Offering Price | ||
| Class A: | ||
| Net Asset Value and redemption price per share ($47,435,581 ÷ 993,715 shares) | $47.74 | |
| Maximum offering price per share (100/94.25 of $47.74) | $50.65 | |
| Class T: | ||
| Net Asset Value and redemption price per share ($11,413,979 ÷ 240,120 shares) | $47.53 | |
| Maximum offering price per share (100/96.50 of $47.53) | $49.25 | |
| Class B: | ||
| Net Asset Value and offering price per share ($2,218,869 ÷ 47,287 shares)(a) | $46.92 | |
| Class C: | ||
| Net Asset Value and offering price per share ($19,909,120 ÷ 426,363 shares)(a) | $46.70 | |
| Canada: | ||
| Net Asset Value, offering price and redemption price per share ($1,195,964,152 ÷ 24,956,980 shares) | $47.92 | |
| Class I: | ||
| Net Asset Value, offering price and redemption price per share ($8,667,971 ÷ 181,174 shares) | $47.84 |
(a) Redemption price per share is equal to net asset value less any applicable contingent deferred sales charge.
See accompanying notes which are an integral part of the financial statements.
Statement of Operations
| Six months ended April 30, 2016 (Unaudited) | ||
| Investment Income | ||
| Dividends | $17,965,445 | |
| Interest | 40 | |
| Income from Fidelity Central Funds (including $952,909 from security lending) | 996,412 | |
| Income before foreign taxes withheld | 18,961,897 | |
| Less foreign taxes withheld | (2,585,887) | |
| Total income | 16,376,010 | |
| Expenses | ||
| Management fee | ||
| Basic fee | $4,221,805 | |
| Performance adjustment | 1,593,391 | |
| Transfer agent fees | 1,437,412 | |
| Distribution and service plan fees | 189,908 | |
| Accounting and security lending fees | 281,330 | |
| Custodian fees and expenses | 11,972 | |
| Independent trustees' compensation | 2,724 | |
| Registration fees | 66,487 | |
| Audit | 39,975 | |
| Legal | 2,162 | |
| Miscellaneous | 4,401 | |
| Total expenses before reductions | 7,851,567 | |
| Expense reductions | (9,373) | 7,842,194 |
| Net investment income (loss) | 8,533,816 | |
| Realized and Unrealized Gain (Loss) | ||
| Net realized gain (loss) on: | ||
| Investment securities: | ||
| Unaffiliated issuers | (38,078,868) | |
| Foreign currency transactions | (188,472) | |
| Total net realized gain (loss) | (38,267,340) | |
| Change in net unrealized appreciation (depreciation) on: Investment securities | 98,783,700 | |
| Assets and liabilities in foreign currencies | 77,536 | |
| Total change in net unrealized appreciation (depreciation) | 98,861,236 | |
| Net gain (loss) | 60,593,896 | |
| Net increase (decrease) in net assets resulting from operations | $69,127,712 |
See accompanying notes which are an integral part of the financial statements.
Statement of Changes in Net Assets
| Six months ended April 30, 2016 (Unaudited) | Year ended October 31, 2015 | |
| Increase (Decrease) in Net Assets | ||
| Operations | ||
| Net investment income (loss) | $8,533,816 | $20,629,341 |
| Net realized gain (loss) | (38,267,340) | (6,996,196) |
| Change in net unrealized appreciation (depreciation) | 98,861,236 | (283,157,405) |
| Net increase (decrease) in net assets resulting from operations | 69,127,712 | (269,524,260) |
| Distributions to shareholders from net investment income | (17,462,078) | (24,029,674) |
| Distributions to shareholders from net realized gain | (1,771,774) | (262,730,704) |
| Total distributions | (19,233,852) | (286,760,378) |
| Share transactions - net increase (decrease) | (154,046,279) | (304,156,881) |
| Redemption fees | 34,509 | 128,345 |
| Total increase (decrease) in net assets | (104,117,910) | (860,313,174) |
| Net Assets | ||
| Beginning of period | 1,389,727,582 | 2,250,040,756 |
| End of period (including undistributed net investment income of $5,545,722 and undistributed net investment income of $14,473,984, respectively) | $1,285,609,672 | $1,389,727,582 |
See accompanying notes which are an integral part of the financial statements.
Financial Highlights — Fidelity Canada Fund Class A
| Six months ended (Unaudited) April 30, | Years ended October 31, | |||||
| 2016 | 2015 | 2014 | 2013 | 2012 | 2011 | |
| Selected Per–Share Data | ||||||
| Net asset value, beginning of period | $45.25 | $60.56 | $57.31 | $53.65 | $52.20 | $53.81 |
| Income from Investment Operations | ||||||
| Net investment income (loss)A | .24 | .45 | .47 | .60 | .57 | .34 |
| Net realized and unrealized gain (loss) | 2.73 | (8.04) | 3.13 | 3.63 | 1.50 | (1.17) |
| Total from investment operations | 2.97 | (7.59) | 3.60 | 4.23 | 2.07 | (.83) |
| Distributions from net investment income | (.42) | (.50) | (.03) | (.57) | (.33) | (.35) |
| Distributions from net realized gain | (.06) | (7.22) | (.32) | – | (.29) | (.44) |
| Total distributions | (.48) | (7.72) | (.35) | (.57) | (.62) | (.79) |
| Redemption fees added to paid in capitalA | –B | –B | –B | –B | –B | .01 |
| Net asset value, end of period | $47.74 | $45.25 | $60.56 | $57.31 | $53.65 | $52.20 |
| Total ReturnC,D,E | 6.66% | (14.32)% | 6.32% | 7.98% | 4.04% | (1.64)% |
| Ratios to Average Net AssetsF,G | ||||||
| Expenses before reductions | 1.57%H | 1.43% | 1.29% | 1.19% | 1.08% | 1.12% |
| Expenses net of fee waivers, if any | 1.57%H | 1.43% | 1.29% | 1.19% | 1.08% | 1.12% |
| Expenses net of all reductions | 1.57%H | 1.43% | 1.29% | 1.18% | 1.08% | 1.12% |
| Net investment income (loss) | 1.14%H | .90% | .79% | 1.11% | 1.11% | .59% |
| Supplemental Data | ||||||
| Net assets, end of period (000 omitted) | $47,436 | $58,286 | $95,004 | $116,661 | $159,597 | $215,369 |
| Portfolio turnover rateI | 37%H | 24% | 85% | 64% | 86% | 104% |
A Calculated based on average shares outstanding during the period.
B Amount represents less than $.005 per share.
C Total returns for periods of less than one year are not annualized.
D Total returns would have been lower if certain expenses had not been reduced during the applicable periods shown.
E Total returns do not include the effect of the sales charges.
F Fees and expenses of any underlying Fidelity Central Funds are not included in the Fund's expense ratio. The Fund indirectly bears its proportionate share of the expenses of any underlying Fidelity Central Funds.
G Expense ratios reflect operating expenses of the class. Expenses before reductions do not reflect amounts reimbursed by the investment adviser or reductions from brokerage service arrangements or reductions from other expense offset arrangements and do not represent the amount paid by the class during periods when reimbursements or reductions occur. Expenses net of fee waivers reflect expenses after reimbursement by the investment adviser but prior to reductions from brokerage service arrangements or other expense offset arrangements. Expenses net of all reductions represent the net expenses paid by the class.
H Annualized
I Amount does not include the portfolio activity of any underlying Fidelity Central Funds.
See accompanying notes which are an integral part of the financial statements.
Financial Highlights — Fidelity Canada Fund Class T
| Six months ended (Unaudited) April 30, | Years ended October 31, | |||||
| 2016 | 2015 | 2014 | 2013 | 2012 | 2011 | |
| Selected Per–Share Data | ||||||
| Net asset value, beginning of period | $44.99 | $60.22 | $57.14 | $53.48 | $52.01 | $53.64 |
| Income from Investment Operations | ||||||
| Net investment income (loss)A | .18 | .29 | .29 | .45 | .43 | .17 |
| Net realized and unrealized gain (loss) | 2.71 | (8.00) | 3.11 | 3.63 | 1.49 | (1.16) |
| Total from investment operations | 2.89 | (7.71) | 3.40 | 4.08 | 1.92 | (.99) |
| Distributions from net investment income | (.29) | (.30) | – | (.42) | (.16) | (.21) |
| Distributions from net realized gain | (.06) | (7.22) | (.32) | – | (.29) | (.44) |
| Total distributions | (.35) | (7.52) | (.32) | (.42) | (.45) | (.65) |
| Redemption fees added to paid in capitalA | –B | –B | –B | –B | –B | .01 |
| Net asset value, end of period | $47.53 | $44.99 | $60.22 | $57.14 | $53.48 | $52.01 |
| Total ReturnC,D,E | 6.49% | (14.58)% | 5.99% | 7.69% | 3.74% | (1.93)% |
| Ratios to Average Net AssetsF,G | ||||||
| Expenses before reductions | 1.85%H | 1.75% | 1.59% | 1.47% | 1.36% | 1.42% |
| Expenses net of fee waivers, if any | 1.85%H | 1.75% | 1.59% | 1.47% | 1.36% | 1.42% |
| Expenses net of all reductions | 1.85%H | 1.75% | 1.59% | 1.46% | 1.36% | 1.42% |
| Net investment income (loss) | .86%H | .58% | .48% | .83% | .83% | .30% |
| Supplemental Data | ||||||
| Net assets, end of period (000 omitted) | $11,414 | $12,820 | $21,989 | $23,751 | $29,626 | $34,323 |
| Portfolio turnover rateI | 37%H | 24% | 85% | 64% | 86% | 104% |
A Calculated based on average shares outstanding during the period.
B Amount represents less than $.005 per share.
C Total returns for periods of less than one year are not annualized.
D Total returns would have been lower if certain expenses had not been reduced during the applicable periods shown.
E Total returns do not include the effect of the sales charges.
F Fees and expenses of any underlying Fidelity Central Funds are not included in the Fund's expense ratio. The Fund indirectly bears its proportionate share of the expenses of any underlying Fidelity Central Funds.
G Expense ratios reflect operating expenses of the class. Expenses before reductions do not reflect amounts reimbursed by the investment adviser or reductions from brokerage service arrangements or reductions from other expense offset arrangements and do not represent the amount paid by the class during periods when reimbursements or reductions occur. Expenses net of fee waivers reflect expenses after reimbursement by the investment adviser but prior to reductions from brokerage service arrangements or other expense offset arrangements. Expenses net of all reductions represent the net expenses paid by the class.
H Annualized
I Amount does not include the portfolio activity of any underlying Fidelity Central Funds.
See accompanying notes which are an integral part of the financial statements.
Financial Highlights — Fidelity Canada Fund Class B
| Six months ended (Unaudited) April 30, | Years ended October 31, | |||||
| 2016 | 2015 | 2014 | 2013 | 2012 | 2011 | |
| Selected Per–Share Data | ||||||
| Net asset value, beginning of period | $44.22 | $59.27 | $56.53 | $52.89 | $51.37 | $53.03 |
| Income from Investment Operations | ||||||
| Net investment income (loss)A | .08 | .05 | (.01) | .18 | .17 | (.11) |
| Net realized and unrealized gain (loss) | 2.68 | (7.88) | 3.07 | 3.60 | 1.49 | (1.14) |
| Total from investment operations | 2.76 | (7.83) | 3.06 | 3.78 | 1.66 | (1.25) |
| Distributions from net investment income | – | – | – | (.14) | – | (.01) |
| Distributions from net realized gain | (.06) | (7.22) | (.32) | – | (.14) | (.41) |
| Total distributions | (.06) | (7.22) | (.32) | (.14) | (.14) | (.42) |
| Redemption fees added to paid in capitalA | –B | –B | –B | –B | –B | .01 |
| Net asset value, end of period | $46.92 | $44.22 | $59.27 | $56.53 | $52.89 | $51.37 |
| Total ReturnC,D,E | 6.25% | (14.99)% | 5.45% | 7.17% | 3.25% | (2.41)% |
| Ratios to Average Net AssetsF,G | ||||||
| Expenses before reductions | 2.33%H | 2.22% | 2.09% | 1.96% | 1.85% | 1.91% |
| Expenses net of fee waivers, if any | 2.33%H | 2.22% | 2.09% | 1.96% | 1.85% | 1.91% |
| Expenses net of all reductions | 2.33%H | 2.22% | 2.09% | 1.95% | 1.85% | 1.91% |
| Net investment income (loss) | .38%H | .11% | (.01)% | .34% | .34% | (.20)% |
| Supplemental Data | ||||||
| Net assets, end of period (000 omitted) | $2,219 | $2,678 | $6,290 | $7,737 | $9,804 | $11,866 |
| Portfolio turnover rateI | 37%H | 24% | 85% | 64% | 86% | 104% |
A Calculated based on average shares outstanding during the period.
B Amount represents less than $.005 per share.
C Total returns for periods of less than one year are not annualized.
D Total returns would have been lower if certain expenses had not been reduced during the applicable periods shown.
E Total returns do not include the effect of the contingent deferred sales charge.
F Fees and expenses of any underlying Fidelity Central Funds are not included in the Fund's expense ratio. The Fund indirectly bears its proportionate share of the expenses of any underlying Fidelity Central Funds.
G Expense ratios reflect operating expenses of the class. Expenses before reductions do not reflect amounts reimbursed by the investment adviser or reductions from brokerage service arrangements or reductions from other expense offset arrangements and do not represent the amount paid by the class during periods when reimbursements or reductions occur. Expenses net of fee waivers reflect expenses after reimbursement by the investment adviser but prior to reductions from brokerage service arrangements or other expense offset arrangements. Expenses net of all reductions represent the net expenses paid by the class.
H Annualized
I Amount does not include the portfolio activity of any underlying Fidelity Central Funds.
See accompanying notes which are an integral part of the financial statements.
Financial Highlights — Fidelity Canada Fund Class C
| Six months ended (Unaudited) April 30, | Years ended October 31, | |||||
| 2016 | 2015 | 2014 | 2013 | 2012 | 2011 | |
| Selected Per–Share Data | ||||||
| Net asset value, beginning of period | $44.02 | $59.04 | $56.27 | $52.61 | $51.19 | $52.87 |
| Income from Investment Operations | ||||||
| Net investment income (loss)A | .09 | .07 | .02 | .20 | .19 | (.08) |
| Net realized and unrealized gain (loss) | 2.67 | (7.85) | 3.07 | 3.58 | 1.46 | (1.14) |
| Total from investment operations | 2.76 | (7.78) | 3.09 | 3.78 | 1.65 | (1.22) |
| Distributions from net investment income | (.02) | (.02) | – | (.12) | – | (.03) |
| Distributions from net realized gain | (.06) | (7.22) | (.32) | – | (.23) | (.44) |
| Total distributions | (.08) | (7.24) | (.32) | (.12) | (.23) | (.47) |
| Redemption fees added to paid in capitalA | –B | –B | –B | –B | –B | .01 |
| Net asset value, end of period | $46.70 | $44.02 | $59.04 | $56.27 | $52.61 | $51.19 |
| Total ReturnC,D,E | 6.28% | (14.96)% | 5.53% | 7.21% | 3.26% | (2.36)% |
| Ratios to Average Net AssetsF,G | ||||||
| Expenses before reductions | 2.30%H | 2.19% | 2.03% | 1.93% | 1.82% | 1.86% |
| Expenses net of fee waivers, if any | 2.30%H | 2.19% | 2.03% | 1.92% | 1.82% | 1.86% |
| Expenses net of all reductions | 2.29%H | 2.18% | 2.03% | 1.92% | 1.82% | 1.86% |
| Net investment income (loss) | .41%H | .14% | .04% | .37% | .37% | (.15)% |
| Supplemental Data | ||||||
| Net assets, end of period (000 omitted) | $19,909 | $21,610 | $38,749 | $46,040 | $66,500 | $87,990 |
| Portfolio turnover rateI | 37%H | 24% | 85% | 64% | 86% | 104% |
A Calculated based on average shares outstanding during the period.
B Amount represents less than $.005 per share.
C Total returns for periods of less than one year are not annualized.
D Total returns would have been lower if certain expenses had not been reduced during the applicable periods shown.
E Total returns do not include the effect of the contingent deferred sales charge.
F Fees and expenses of any underlying Fidelity Central Funds are not included in the Fund's expense ratio. The Fund indirectly bears its proportionate share of the expenses of any underlying Fidelity Central Funds.
G Expense ratios reflect operating expenses of the class. Expenses before reductions do not reflect amounts reimbursed by the investment adviser or reductions from brokerage service arrangements or reductions from other expense offset arrangements and do not represent the amount paid by the class during periods when reimbursements or reductions occur. Expenses net of fee waivers reflect expenses after reimbursement by the investment adviser but prior to reductions from brokerage service arrangements or other expense offset arrangements. Expenses net of all reductions represent the net expenses paid by the class.
H Annualized
I Amount does not include the portfolio activity of any underlying Fidelity Central Funds.
See accompanying notes which are an integral part of the financial statements.
Financial Highlights — Fidelity Canada Fund
| Six months ended (Unaudited) April 30, | Years ended October 31, | |||||
| 2016 | 2015 | 2014 | 2013 | 2012 | 2011 | |
| Selected Per–Share Data | ||||||
| Net asset value, beginning of period | $45.55 | $60.95 | $57.72 | $54.05 | $52.59 | $54.14 |
| Income from Investment Operations | ||||||
| Net investment income (loss)A | .31 | .60 | .66 | .77 | .73 | .52 |
| Net realized and unrealized gain (loss) | 2.73 | (8.09) | 3.13 | 3.66 | 1.51 | (1.18) |
| Total from investment operations | 3.04 | (7.49) | 3.79 | 4.43 | 2.24 | (.66) |
| Distributions from net investment income | (.61) | (.69) | (.24) | (.76) | (.49) | (.46) |
| Distributions from net realized gain | (.06) | (7.22) | (.32) | – | (.29) | (.44) |
| Total distributions | (.67) | (7.91) | (.56) | (.76) | (.78) | (.90) |
| Redemption fees added to paid in capitalA | –B | –B | –B | –B | –B | .01 |
| Net asset value, end of period | $47.92 | $45.55 | $60.95 | $57.72 | $54.05 | $52.59 |
| Total ReturnC,D | 6.83% | (14.08)% | 6.64% | 8.32% | 4.36% | (1.33)% |
| Ratios to Average Net AssetsE,F | ||||||
| Expenses before reductions | 1.26%G | 1.15% | .98% | .87% | .77% | .82% |
| Expenses net of fee waivers, if any | 1.26%G | 1.15% | .98% | .87% | .77% | .82% |
| Expenses net of all reductions | 1.26%G | 1.14% | .98% | .86% | .77% | .82% |
| Net investment income (loss) | 1.45%G | 1.18% | 1.09% | 1.42% | 1.42% | .90% |
| Supplemental Data | ||||||
| Net assets, end of period (000 omitted) | $1,195,964 | $1,279,488 | $2,057,843 | $2,262,380 | $2,992,597 | $3,778,765 |
| Portfolio turnover rateH | 37%G | 24% | 85% | 64% | 86% | 104% |
A Calculated based on average shares outstanding during the period.
B Amount represents less than $.005 per share.
C Total returns for periods of less than one year are not annualized.
D Total returns would have been lower if certain expenses had not been reduced during the applicable periods shown.
E Fees and expenses of any underlying Fidelity Central Funds are not included in the Fund's expense ratio. The Fund indirectly bears its proportionate share of the expenses of any underlying Fidelity Central Funds.
F Expense ratios reflect operating expenses of the class. Expenses before reductions do not reflect amounts reimbursed by the investment adviser or reductions from brokerage service arrangements or reductions from other expense offset arrangements and do not represent the amount paid by the class during periods when reimbursements or reductions occur. Expenses net of fee waivers reflect expenses after reimbursement by the investment adviser but prior to reductions from brokerage service arrangements or other expense offset arrangements. Expenses net of all reductions represent the net expenses paid by the class.
G Annualized
H Amount does not include the portfolio activity of any underlying Fidelity Central Funds.
See accompanying notes which are an integral part of the financial statements.
Financial Highlights — Fidelity Canada Fund Class I
| Six months ended (Unaudited) April 30, | Years ended October 31, | |||||
| 2016 | 2015 | 2014 | 2013 | 2012 | 2011 | |
| Selected Per–Share Data | ||||||
| Net asset value, beginning of period | $45.44 | $60.80 | $57.57 | $53.91 | $52.44 | $54.02 |
| Income from Investment Operations | ||||||
| Net investment income (loss)A | .32 | .61 | .65 | .78 | .74 | .51 |
| Net realized and unrealized gain (loss) | 2.73 | (8.07) | 3.12 | 3.64 | 1.50 | (1.18) |
| Total from investment operations | 3.05 | (7.46) | 3.77 | 4.42 | 2.24 | (.67) |
| Distributions from net investment income | (.59) | (.68) | (.22) | (.76) | (.48) | (.48) |
| Distributions from net realized gain | (.06) | (7.22) | (.32) | – | (.29) | (.44) |
| Total distributions | (.65) | (7.90) | (.54) | (.76) | (.77) | (.92) |
| Redemption fees added to paid in capitalA | –B | –B | –B | –B | –B | .01 |
| Net asset value, end of period | $47.84 | $45.44 | $60.80 | $57.57 | $53.91 | $52.44 |
| Total ReturnC,D | 6.85% | (14.05)% | 6.62% | 8.34% | 4.38% | (1.35)% |
| Ratios to Average Net AssetsE,F | ||||||
| Expenses before reductions | 1.21%G | 1.13% | 1.00% | .86% | .76% | .82% |
| Expenses net of fee waivers, if any | 1.21%G | 1.12% | 1.00% | .86% | .76% | .82% |
| Expenses net of all reductions | 1.21%G | 1.12% | 1.00% | .85% | .76% | .82% |
| Net investment income (loss) | 1.50%G | 1.21% | 1.08% | 1.43% | 1.42% | .89% |
| Supplemental Data | ||||||
| Net assets, end of period (000 omitted) | $8,668 | $14,846 | $30,165 | $30,831 | $59,245 | $68,112 |
| Portfolio turnover rateH | 37%G | 24% | 85% | 64% | 86% | 104% |
A Calculated based on average shares outstanding during the period.
B Amount represents less than $.005 per share.
C Total returns for periods of less than one year are not annualized.
D Total returns would have been lower if certain expenses had not been reduced during the applicable periods shown.
E Fees and expenses of any underlying Fidelity Central Funds are not included in the Fund's expense ratio. The Fund indirectly bears its proportionate share of the expenses of any underlying Fidelity Central Funds.
F Expense ratios reflect operating expenses of the class. Expenses before reductions do not reflect amounts reimbursed by the investment adviser or reductions from brokerage service arrangements or reductions from other expense offset arrangements and do not represent the amount paid by the class during periods when reimbursements or reductions occur. Expenses net of fee waivers reflect expenses after reimbursement by the investment adviser but prior to reductions from brokerage service arrangements or other expense offset arrangements. Expenses net of all reductions represent the net expenses paid by the class.
G Annualized
H Amount does not include the portfolio activity of any underlying Fidelity Central Funds.
See accompanying notes which are an integral part of the financial statements.
Notes to Financial Statements (Unaudited)
For the period ended April 30, 2016
1. Organization.
Fidelity Canada Fund (the Fund) is a fund of Fidelity Investment Trust (the Trust) and is authorized to issue an unlimited number of shares. The Trust is registered under the Investment Company Act of 1940, as amended (the 1940 Act), as an open-end management investment company organized as a Massachusetts business trust. The Fund offers Class A, Class T, Class C, Canada and Class I shares, each of which, along with Class B shares, has equal rights as to assets and voting privileges. Class B shares are closed to new accounts and additional purchases, except for exchanges and reinvestments. Each class has exclusive voting rights with respect to matters that affect that class. Class B shares will automatically convert to Class A shares after a maximum holding period of seven years from the initial date of purchase.
During the period, the Board of Trustees approved the conversion of all existing Class B shares into Class A shares, effective on or about July 1, 2016, regardless of the length of times shares have been held.
2. Investments in Fidelity Central Funds.
The Fund invests in Fidelity Central Funds, which are open-end investment companies generally available only to other investment companies and accounts managed by the investment adviser and its affiliates. The Fund's Schedule of Investments lists each of the Fidelity Central Funds held as of period end, if any, as an investment of the Fund, but does not include the underlying holdings of each Fidelity Central Fund. As an Investing Fund, the Fund indirectly bears its proportionate share of the expenses of the underlying Fidelity Central Funds.
The Money Market Central Funds seek preservation of capital and current income and are managed by Fidelity Investments Money Management, Inc. (FIMM), an affiliate of the investment adviser. Annualized expenses of the Money Market Central Funds as of their most recent shareholder report date are less than .005%.
A complete unaudited list of holdings for each Fidelity Central Fund is available upon request or at the Securities and Exchange Commission (the SEC) website at www.sec.gov. In addition, the financial statements of the Fidelity Central Funds are available on the SEC website or upon request.
3. Significant Accounting Policies.
The financial statements have been prepared in conformity with accounting principles generally accepted in the United States of America (GAAP), which require management to make certain estimates and assumptions at the date of the financial statements. Actual results could differ from those estimates. Subsequent events, if any, through the date that the financial statements were issued have been evaluated in the preparation of the financial statements. The following summarizes the significant accounting policies of the Fund:
Investment Valuation. Investments are valued as of 4:00 p.m. Eastern time on the last calendar day of the period. The Board of Trustees (the Board) has delegated the day to day responsibility for the valuation of the Fund's investments to the Fidelity Management & Research Company (FMR) Fair Value Committee (the Committee). In accordance with valuation policies and procedures approved by the Board, the Fund attempts to obtain prices from one or more third party pricing vendors or brokers to value its investments. When current market prices, quotations or currency exchange rates are not readily available or reliable, investments will be fair valued in good faith by the Committee, in accordance with procedures adopted by the Board. Factors used in determining fair value vary by investment type and may include market or investment specific events. The frequency with which these procedures are used cannot be predicted and they may be utilized to a significant extent. The Committee oversees the Fund's valuation policies and procedures and reports to the Board on the Committee's activities and fair value determinations. The Board monitors the appropriateness of the procedures used in valuing the Fund's investments and ratifies the fair value determinations of the Committee.
The Fund categorizes the inputs to valuation techniques used to value its investments into a disclosure hierarchy consisting of three levels as shown below:
- Level 1 – quoted prices in active markets for identical investments
- Level 2 – other significant observable inputs (including quoted prices for similar investments, interest rates, prepayment speeds, etc.)
- Level 3 – unobservable inputs (including the Fund's own assumptions based on the best information available)
Valuation techniques used to value the Fund's investments by major category are as follows:
Equity securities, including restricted securities, for which market quotations are readily available, are valued at the last reported sale price or official closing price as reported by a third party pricing vendor on the primary market or exchange on which they are traded and are categorized as Level 1 in the hierarchy. In the event there were no sales during the day or closing prices are not available, securities are valued at the last quoted bid price or may be valued using the last available price and are generally categorized as Level 2 in the hierarchy. For foreign equity securities, when market or security specific events arise, comparisons to the valuation of American Depositary Receipts (ADRs), futures contracts, Exchange-Traded Funds (ETFs) and certain indexes as well as quoted prices for similar securities may be used and would be categorized as Level 2 in the hierarchy. Utilizing these techniques may result in transfers between Level 1 and Level 2. For equity securities, including restricted securities, where observable inputs are limited, assumptions about market activity and risk are used and these securities may be categorized as Level 3 in the hierarchy.
Investments in open-end mutual funds, including the Fidelity Central Funds, are valued at their closing net asset value (NAV) each business day and are categorized as Level 1 in the hierarchy.
Changes in valuation techniques may result in transfers in or out of an assigned level within the disclosure hierarchy. The aggregate value of investments by input level as of April 30, 2016 is included at the end of the Fund's Schedule of Investments.
Foreign Currency. The Fund may use foreign currency contracts to facilitate transactions in foreign-denominated securities. Gains and losses from these transactions may arise from changes in the value of the foreign currency or if the counterparties do not perform under the contracts' terms.
Foreign-denominated assets, including investment securities, and liabilities are translated into U.S. dollars at the exchange rates at period end. Purchases and sales of investment securities, income and dividends received and expenses denominated in foreign currencies are translated into U.S. dollars at the exchange rate in effect on the transaction date.
The effects of exchange rate fluctuations on investments are included with the net realized and unrealized gain (loss) on investment securities. Other foreign currency transactions resulting in realized and unrealized gain (loss) are disclosed separately.
Investment Transactions and Income. For financial reporting purposes, the Fund's investment holdings and NAV include trades executed through the end of the last business day of the period. The NAV per share for processing shareholder transactions is calculated as of the close of business of the New York Stock Exchange (NYSE), normally 4:00 p.m. Eastern time and includes trades executed through the end of the prior business day. Gains and losses on securities sold are determined on the basis of identified cost and may include proceeds received from litigation. Dividend income is recorded on the ex-dividend date, except for certain dividends from foreign securities where the ex-dividend date may have passed, which are recorded as soon as the Fund is informed of the ex-dividend date. Non-cash dividends included in dividend income, if any, are recorded at the fair market value of the securities received. Income and capital gain distributions from Fidelity Central Funds, if any, are recorded on the ex-dividend date. Distributions received on securities that represent a return of capital or capital gain are recorded as a reduction of cost of investments and/or as a realized gain. Subsequent to ex-dividend date the Fund determines the components of these distributions, based upon receipt of tax filings or other correspondence relating to the underlying investment. Interest income is accrued as earned and includes coupon interest and amortization of premium and accretion of discount on debt securities as applicable. Investment income is recorded net of foreign taxes withheld where recovery of such taxes is uncertain.
Class Allocations and Expenses. Investment income, realized and unrealized capital gains and losses, common expenses of the Fund, and certain fund-level expense reductions, if any, are allocated daily on a pro-rata basis to each class based on the relative net assets of each class to the total net assets of the Fund. Each class differs with respect to transfer agent and distribution and service plan fees incurred. Certain expense reductions may also differ by class. For the reporting period, the allocated portion of income and expenses to each class as a percent of its average net assets may vary due to the timing of recording these transactions in relation to fluctuating net assets of the classes. Expenses directly attributable to a fund are charged to that fund. Expenses attributable to more than one fund are allocated among the respective funds on the basis of relative net assets or other appropriate methods. Expense estimates are accrued in the period to which they relate and adjustments are made when actual amounts are known.
Income Tax Information and Distributions to Shareholders. Each year, the Fund intends to qualify as a regulated investment company under Subchapter M of the Internal Revenue Code, including distributing substantially all of its taxable income and realized gains. As a result, no provision for U.S. Federal income taxes is required. The Fund files a U.S. federal tax return, in addition to state and local tax returns as required. The Fund's federal income tax returns are subject to examination by the Internal Revenue Service (IRS) for a period of three fiscal years after they are filed. State and local tax returns may be subject to examination for an additional fiscal year depending on the jurisdiction. Foreign taxes are provided for based on the Fund's understanding of the tax rules and rates that exist in the foreign markets in which it invests.
Distributions are declared and recorded on the ex-dividend date. Income dividends and capital gain distributions are declared separately for each class. Income and capital gain distributions are determined in accordance with income tax regulations, which may differ from GAAP.
Capital accounts within the financial statements are adjusted for permanent book-tax differences. These adjustments have no impact on net assets or the results of operations. Capital accounts are not adjusted for temporary book-tax differences which will reverse in a subsequent period.
Book-tax differences are primarily due to foreign currency transactions, passive foreign investment companies (PFIC), deferred trustees compensation and losses deferred due to wash sales.
The federal tax cost of investment securities and unrealized appreciation (depreciation) as of period end were as follows:
| Gross unrealized appreciation | $314,151,043 |
| Gross unrealized depreciation | (74,008,231) |
| Net unrealized appreciation (depreciation) on securities | $240,142,812 |
| Tax cost | $1,050,452,218 |
Short-Term Trading (Redemption) Fees. Shares held by investors in the Fund less than 90 days may have been subject to a redemption fee equal to 1.50% of the NAV of shares redeemed. All redemption fees, which reduce the proceeds of the shareholder redemption, are retained by the Fund and accounted for as an addition to paid in capital.
4. Purchases and Sales of Investments.
Purchases and sales of securities, other than short-term securities, aggregated $222,288,695 and $383,011,745, respectively.
5. Fees and Other Transactions with Affiliates.
Management Fee. Fidelity Management & Research Company (the investment adviser) and its affiliates provide the Fund with investment management related services for which the Fund pays a monthly management fee. The management fee is the sum of an individual fund fee rate that is based on an annual rate of .45% of the Fund's average net assets and an annualized group fee rate that averaged .25% during the period. The group fee rate is based upon the average net assets of all the mutual funds advised by the investment adviser, including any mutual funds previously advised by the investment adviser that are currently advised by Fidelity SelectCo, LLC, an affiliate of the investment adviser. The group fee rate decreases as assets under management increase and increases as assets under management decrease. In addition, the management fee is subject to a performance adjustment (up to a maximum of +/- .20% of the Fund's average net assets over a 36 month performance period). The upward or downward adjustment to the management fee is based on the relative investment performance of Canada as compared to its benchmark index, the S&P/TSX Composite Index, over the same 36 month performance period. For the reporting period, the total annualized management fee rate, including the performance adjustment, was .96% of the Fund's average net assets. The performance adjustment included in the management fee rate may be higher or lower than the maximum performance adjustment rate due to the difference between the average net assets for the reporting and performance periods.
Distribution and Service Plan Fees. In accordance with Rule 12b-1 of the 1940 Act, the Fund has adopted separate Distribution and Service Plans for each class of shares. Certain classes pay Fidelity Distributors Corporation (FDC), an affiliate of the investment adviser, separate Distribution and Service Fees, each of which is based on an annual percentage of each class' average net assets. In addition, FDC may pay financial intermediaries for selling shares of the Fund and providing shareholder support services. For the period, the Distribution and Service Fee rates, total fees and amounts retained by FDC were as follows:
| Distribution Fee | Service Fee | Total Fees | Retained by FDC | |
| Class A | -% | .25% | $58,105 | $– |
| Class T | .25% | .25% | 27,541 | – |
| Class B | .75% | .25% | 11,113 | 8,335 |
| Class C | .75% | .25% | 93,149 | 2,665 |
| $189,908 | $11,000 |
Sales Load. FDC may receive a front-end sales charge of up to 5.75% for selling Class A shares and 3.50% for selling Class T shares, some of which is paid to financial intermediaries for selling shares of the Fund. Depending on the holding period, FDC may receive contingent deferred sales charges levied on Class A, Class T, Class B, and Class C redemptions. The deferred sales charges range from 5.00% to 1.00% for Class B shares, 1.00% for Class C shares, 1.00% for certain purchases of Class A shares and .25% for certain purchases of Class T shares.
For the period, sales charge amounts retained by FDC were as follows:
| Retained by FDC | |
| Class A | $2,637 |
| Class T | 1,094 |
| Class B(a) | 1,397 |
| Class C(a) | 597 |
| $5,725 |
(a) When Class B and Class C shares are initially sold, FDC pays commissions from its own resources to financial intermediaries through which the sales are made.
Transfer Agent Fees. Fidelity Investments Institutional Operations Company, Inc., (FIIOC), an affiliate of the investment adviser, is the transfer, dividend disbursing and shareholder servicing agent for each class of the Fund. FIIOC receives account fees and asset-based fees that vary according to the account size and type of account of the shareholders of the respective classes of the Fund. FIIOC pays for typesetting, printing and mailing of shareholder reports, except proxy statements.
For the period, transfer agent fees for each class were as follows:
| Amount | % of Class-Level Average Net Assets(a) | |
| Class A | $67,198 | .29 |
| Class T | 17,829 | .32 |
| Class B | 3,332 | .30 |
| Class C | 25,128 | .27 |
| Canada | 1,314,704 | .23 |
| Class I | 9,221 | .18 |
| $1,437,412 |
(a) Annualized
Accounting and Security Lending Fees. Fidelity Service Company, Inc. (FSC), an affiliate of the investment adviser, maintains the Fund's accounting records. The accounting fee is based on the level of average net assets for each month. Under a separate contract, FSC administers the security lending program. The security lending fee is based on the number and duration of lending transactions.
Brokerage Commissions. The Fund placed a portion of its portfolio transactions with brokerage firms which are affiliates of the investment adviser. Brokerage commissions are included in net realized gain (loss) and change in net unrealized appreciation (depreciation) in the Statement of Operations. The commissions paid to these affiliated firms were $294 for the period.
Interfund Trades. The Fund may purchase from or sell securities to other Fidelity Funds under procedures adopted by the Board. The procedures have been designed to ensure these interfund trades are executed in accordance with Rule 17a-7 of the 1940 Act. Interfund trades are included within the respective purchases and sales amounts shown in the Purchases and Sales of Investments note.
6. Committed Line of Credit.
The Fund participates with other funds managed by the investment adviser or an affiliate in a $4.25 billion credit facility (the "line of credit") to be utilized for temporary or emergency purposes to fund shareholder redemptions or for other short-term liquidity purposes. The Fund has agreed to pay commitment fees on its pro-rata portion of the line of credit, which amounted to $1,071 and is reflected in Miscellaneous expenses on the Statement of Operations. During the period, the Fund did not borrow on this line of credit.
7. Security Lending.
The Fund lends portfolio securities through a lending agent from time to time in order to earn additional income. For equity securities, a lending agent is used and may loan securities to certain qualified borrowers, including Fidelity Capital Markets (FCM), a broker-dealer affiliated with the Fund. On the settlement date of the loan, the Fund receives collateral (in the form of U.S. Treasury obligations, letters of credit and/or cash) against the loaned securities and maintains collateral in an amount not less than 100% of the market value of the loaned securities during the period of the loan. The market value of the loaned securities is determined at the close of business of the Fund and any additional required collateral is delivered to the Fund on the next business day. The Fund or borrower may terminate the loan at any time, and if the borrower defaults on its obligation to return the securities loaned because of insolvency or other reasons, the Fund may apply collateral received from the borrower against the obligation. The Fund may experience delays and costs in recovering the securities loaned. Any cash collateral received is invested in the Fidelity Securities Lending Cash Central Fund. The value of loaned securities and cash collateral at period end are disclosed on the Fund's Statement of Assets and Liabilities. Security lending income represents the income earned on investing cash collateral, less rebates paid to borrowers and any lending agent fees associated with the loan, plus any premium payments received for lending certain types of securities. Security lending income is presented in the Statement of Operations as a component of income from Fidelity Central Funds, and includes $2,028 from securities loaned to FCM.
8. Expense Reductions.
Commissions paid to certain brokers with whom the investment adviser, or its affiliates, places trades on behalf of the Fund include an amount in addition to trade execution, which may be rebated back to the Fund to offset certain expenses. This amount totaled $4,918 for the period. In addition, through arrangements with the Fund's custodian, credits realized as a result of certain uninvested cash balances were used to reduce the Fund's expenses. During the period, these credits reduced the Fund's custody expenses by $21.
In addition, during the period the investment adviser reimbursed and/or waived a portion of fund-level operating expenses in the amount of $4,434.
9. Distributions to Shareholders.
Distributions to shareholders of each class were as follows:
| Six months ended April 30, 2016 | Year ended October 31, 2015 | |
| From net investment income | ||
| Class A | $482,934 | $783,478 |
| Class T | 79,315 | 106,245 |
| Class C | 8,502 | 12,920 |
| Canada | 16,735,044 | 22,800,214 |
| Class I | 156,283 | 326,817 |
| Total | $17,462,078 | $24,029,674 |
| From net realized gain | ||
| Class A | $69,321 | $11,358,847 |
| Class T | 16,639 | 2,548,483 |
| Class B | 3,460 | 742,098 |
| Class C | 28,339 | 4,664,328 |
| Canada | 1,638,014 | 239,967,215 |
| Class I | 16,001 | 3,449,733 |
| Total | $1,771,774 | $262,730,704 |
10. Share Transactions.
Share transactions for each class were as follows and may contain automatic conversions between classes or exchanges between affiliated funds:
| Shares | Shares | Dollars | Dollars | |
| Six months ended April 30, 2016 | Year ended October 31, 2015 | Six months ended April 30, 2016 | Year ended October 31, 2015 | |
| Class A | ||||
| Shares sold | 36,639 | 153,407 | $1,582,358 | $8,099,168 |
| Reinvestment of distributions | 11,425 | 200,582 | 496,287 | 10,552,616 |
| Shares redeemed | (342,515) | (634,705) | (14,730,138) | (31,737,294) |
| Net increase (decrease) | (294,451) | (280,716) | $(12,651,493) | $(13,085,510) |
| Class T | ||||
| Shares sold | 9,827 | 21,812 | $408,970 | $1,102,045 |
| Reinvestment of distributions | 2,169 | 49,518 | 93,951 | 2,597,730 |
| Shares redeemed | (56,853) | (151,491) | (2,357,721) | (7,597,599) |
| Net increase (decrease) | (44,857) | (80,161) | $(1,854,800) | $(3,897,824) |
| Class B | ||||
| Shares sold | 499 | 1,663 | $21,790 | $85,823 |
| Reinvestment of distributions | 68 | 12,380 | 2,895 | 641,184 |
| Shares redeemed | (13,828) | (59,611) | (579,039) | (2,906,257) |
| Net increase (decrease) | (13,261) | (45,568) | $(554,354) | $(2,179,250) |
| Class C | ||||
| Shares sold | 24,743 | 42,631 | $1,052,682 | $2,146,853 |
| Reinvestment of distributions | 731 | 75,003 | 31,141 | 3,864,885 |
| Shares redeemed | (90,006) | (283,087) | (3,720,124) | (13,692,762) |
| Net increase (decrease) | (64,532) | (165,453) | $(2,636,301) | $(7,681,024) |
| Canada | ||||
| Shares sold | 779,017 | 1,250,697 | $33,585,544 | $63,450,179 |
| Reinvestment of distributions | 388,588 | 4,716,591 | 16,926,879 | 249,177,482 |
| Shares redeemed | (4,297,518) | (11,643,757) | (180,976,780) | (581,614,067) |
| Net increase (decrease) | (3,129,913) | (5,676,469) | $(130,464,357) | $(268,986,406) |
| Class I | ||||
| Shares sold | 70,963 | 66,679 | $2,977,708 | $3,430,310 |
| Reinvestment of distributions | 2,849 | 49,883 | 123,890 | 2,628,352 |
| Shares redeemed | (219,360) | (285,976) | (8,986,572) | (14,385,529) |
| Net increase (decrease) | (145,548) | (169,414) | $(5,884,974) | $(8,326,867) |
11. Other.
The Fund's organizational documents provide former and current trustees and officers with a limited indemnification against liabilities arising in connection with the performance of their duties to the Fund. In the normal course of business, the Fund may also enter into contracts that provide general indemnifications. The Fund's maximum exposure under these arrangements is unknown as this would be dependent on future claims that may be made against the Fund. The risk of material loss from such claims is considered remote.
Shareholder Expense Example
As a shareholder of the Fund, you incur two types of costs: (1) transaction costs, including sales charges (loads) on purchase payments or redemption proceeds, redemption fees and (2) ongoing costs, including management fees, distribution and/or service (12b-1) fees and other Fund expenses. This Example is intended to help you understand your ongoing costs (in dollars) of investing in the Fund and to compare these costs with the ongoing costs of investing in other mutual funds.
The Example is based on an investment of $1,000 invested at the beginning of the period and held for the entire period (November 1, 2015 to April 30, 2016).
Actual Expenses
The first line of the accompanying table for each class of the Fund provides information about actual account values and actual expenses. You may use the information in this line, together with the amount you invested, to estimate the expenses that you paid over the period. Simply divide your account value by $1,000.00 (for example, an $8,600 account value divided by $1,000.00 = 8.6), then multiply the result by the number in the first line for a class of the Fund under the heading entitled "Expenses Paid During Period" to estimate the expenses you paid on your account during this period. A small balance maintenance fee of $12.00 that is charged once a year may apply for certain accounts with a value of less than $2,000. This fee is not included in the table below. If it was, the estimate of expenses you paid during the period would be higher, and your ending account value lower, by this amount. In addition, the Fund, as a shareholder in the underlying Fidelity Central Funds, will indirectly bear its pro-rata share of the fees and expenses incurred by the underlying Fidelity Central Funds. These fees and expenses are not included in the Fund's annualized expense ratio used to calculate the expense estimate in the table below.
Hypothetical Example for Comparison Purposes
The second line of the accompanying table for each class of the Fund provides information about hypothetical account values and hypothetical expenses based on a Class' actual expense ratio and an assumed rate of return of 5% per year before expenses, which is not the Class' actual return. The hypothetical account values and expenses may not be used to estimate the actual ending account balance or expenses you paid for the period. You may use this information to compare the ongoing costs of investing in the Fund and other funds. To do so, compare this 5% hypothetical example with the 5% hypothetical examples that appear in the shareholder reports of the other funds. A small balance maintenance fee of $12.00 that is charged once a year may apply for certain accounts with a value of less than $2,000. This fee is not included in the table below. If it was, the estimate of expenses you paid during the period would be higher, and your ending account value lower, by this amount. In addition, the Fund, as a shareholder in the underlying Fidelity Central Funds, will indirectly bear its pro-rata share of the fees and expenses incurred by the underlying Fidelity Central Funds. These fees and expenses are not included in the Fund's annualized expense ratio used to calculate the expense estimate in the table below.
Please note that the expenses shown in the table are meant to highlight your ongoing costs only and do not reflect any transaction costs. Therefore, the second line of the table is useful in comparing ongoing costs only, and will not help you determine the relative total costs of owning different funds. In addition, if these transactional costs were included, your costs would have been higher.
| Annualized Expense Ratio-A | Beginning Account Value November 1, 2015 | Ending Account Value April 30, 2016 | Expenses Paid During Period-B November 1, 2015 to April 30, 2016 | |
| Class A | 1.57% | |||
| Actual | $1,000.00 | $1,066.60 | $8.07 | |
| Hypothetical-C | $1,000.00 | $1,017.06 | $7.87 | |
| Class T | 1.85% | |||
| Actual | $1,000.00 | $1,064.90 | $9.50 | |
| Hypothetical-C | $1,000.00 | $1,015.66 | $9.27 | |
| Class B | 2.33% | |||
| Actual | $1,000.00 | $1,062.50 | $11.95 | |
| Hypothetical-C | $1,000.00 | $1,013.28 | $11.66 | |
| Class C | 2.30% | |||
| Actual | $1,000.00 | $1,062.80 | $11.80 | |
| Hypothetical-C | $1,000.00 | $1,013.43 | $11.51 | |
| Canada | 1.26% | |||
| Actual | $1,000.00 | $1,068.30 | $6.48 | |
| Hypothetical-C | $1,000.00 | $1,018.60 | $6.32 | |
| Class I | 1.21% | |||
| Actual | $1,000.00 | $1,068.50 | $6.22 | |
| Hypothetical-C | $1,000.00 | $1,018.85 | $6.07 |
A Annualized expense ratio reflects expenses net of applicable fee waivers.
B Expenses are equal to each Class' annualized expense ratio, multiplied by the average account value over the period, multiplied by 182/366 (to reflect the one-half year period).
C 5% return per year before expenses
![]()
ACANI-SANN-0616
1.843161.108
Fidelity Advisor® China Region Fund - Semi-Annual Report April 30, 2016 Class A, Class T, Class B and Class C are classes of Fidelity® China Region Fund |
|
Contents
To view a fund's proxy voting guidelines and proxy voting record for the 12-month period ended June 30, visit http://www.fidelity.com/proxyvotingresults or visit the Securities and Exchange Commission's (SEC) web site at http://www.sec.gov.
You may also call 1-877-208-0098 to request a free copy of the proxy voting guidelines.
Standard & Poor's, S&P and S&P 500 are registered service marks of The McGraw-Hill Companies, Inc. and have been licensed for use by Fidelity Distributors Corporation.
Other third-party marks appearing herein are the property of their respective owners.
All other marks appearing herein are registered or unregistered trademarks or service marks of FMR LLC or an affiliated company. © 2016 FMR LLC. All rights reserved.
This report and the financial statements contained herein are submitted for the general information of the shareholders of the Fund. This report is not authorized for distribution to prospective investors in the Fund unless preceded or accompanied by an effective prospectus.
A fund files its complete schedule of portfolio holdings with the SEC for the first and third quarters of each fiscal year on Form N-Q. Forms N-Q are available on the SEC’s web site at http://www.sec.gov. A fund's Forms N-Q may be reviewed and copied at the SEC’s Public Reference Room in Washington, DC. Information regarding the operation of the SEC's Public Reference Room may be obtained by calling 1-800-SEC-0330.
For a complete list of a fund's portfolio holdings, view the most recent holdings listing, semiannual report, or annual report on Fidelity's web site at http://www.fidelity.com, http://www.advisor.fidelity.com, or http://www.401k.com, as applicable.
NOT FDIC INSURED •MAY LOSE VALUE •NO BANK GUARANTEE
Neither the Fund nor Fidelity Distributors Corporation is a bank.
Investment Summary (Unaudited)
Geographic Diversification (% of fund's net assets)
| As of April 30, 2016 | ||
| China | 37.1% | |
| Cayman Islands | 26.7% | |
| Taiwan | 18.9% | |
| Hong Kong | 6.2% | |
| United Kingdom | 3.5% | |
| Bermuda | 3.3% | |
| Netherlands | 2.8% | |
| British Virgin Islands | 1.1% | |
| United States of America* | 0.4% | |
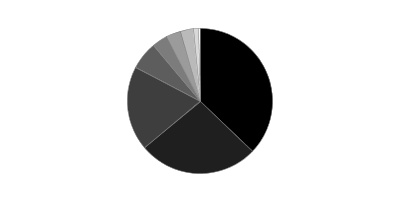
* Includes Short-Term investments and Net Other Assets (Liabilities).
Percentages are based on country or territory of incorporation and are adjusted for the effect of futures contracts, if applicable.
| As of October 31, 2015 | ||
| China | 49.0% | |
| Cayman Islands | 25.8% | |
| Hong Kong | 8.7% | |
| Bermuda | 5.0% | |
| Taiwan | 3.7% | |
| Netherlands | 3.0% | |
| United Kingdom | 1.7% | |
| Bailiwick of Jersey | 1.7% | |
| United States of America* | 1.4% | |

* Includes Short-Term investments and Net Other Assets (Liabilities).
Percentages are based on country or territory of incorporation and are adjusted for the effect of futures contracts, if applicable.
Asset Allocation as of April 30, 2016
| % of fund's net assets | % of fund's net assets 6 months ago | |
| Stocks | 99.6 | 98.6 |
| Short-Term Investments and Net Other Assets (Liabilities) | 0.4 | 1.4 |
Top Ten Stocks as of April 30, 2016
| % of fund's net assets | % of fund's net assets 6 months ago | |
| Tencent Holdings Ltd. (Internet Software & Services) | 7.9 | 6.0 |
| Taiwan Semiconductor Manufacturing Co. Ltd. (Semiconductors & Semiconductor Equipment) | 7.6 | 0.0 |
| Alibaba Group Holding Ltd. sponsored ADR (Internet Software & Services) | 2.7 | 0.6 |
| Ping An Insurance (Group) Co. of China Ltd. (H Shares) (Insurance) | 2.7 | 2.8 |
| China Construction Bank Corp. (H Shares) (Banks) | 2.6 | 4.9 |
| Kweichow Moutai Co. Ltd. (Beverages) | 2.4 | 1.4 |
| Industrial & Commercial Bank of China Ltd. (H Shares) (Banks) | 2.3 | 2.3 |
| Chongqing Changan Automobile Co. Ltd. (B Shares) (Automobiles) | 2.2 | 2.2 |
| BBMG Corp. (H Shares) (Construction Materials) | 2.1 | 1.8 |
| China Pacific Insurance (Group) Co. Ltd. (H Shares) (Insurance) | 2.0 | 2.3 |
| 34.5 |
Market Sectors as of April 30, 2016
| % of fund's net assets | % of fund's net assets 6 months ago | |
| Information Technology | 27.8 | 14.0 |
| Financials | 22.1 | 37.8 |
| Consumer Discretionary | 19.8 | 14.4 |
| Industrials | 9.8 | 12.9 |
| Materials | 5.6 | 6.7 |
| Telecommunication Services | 4.1 | 2.4 |
| Consumer Staples | 4.1 | 2.0 |
| Health Care | 3.3 | 5.5 |
| Utilities | 2.9 | 1.3 |
| Energy | 0.1 | 1.6 |
Market Sectors may include more than one industry category.
The Fund may invest up to 35% of its total assets in any industry that represents more than 20% of the Hong Kong, Taiwanese and Chinese markets. As of April 30, 2016, the Fund did not have more than 25% of its total assets invested in any one industry.
Percentages shown as 0.0% may reflect amounts less than 0.05%.
Investments April 30, 2016 (Unaudited)
Showing Percentage of Net Assets
| Common Stocks - 98.9% | |||
| Shares | Value | ||
| CONSUMER DISCRETIONARY - 19.1% | |||
| Auto Components - 0.8% | |||
| Weifu High-Technology Co. Ltd. (B Shares) | 4,257,836 | $9,002,116 | |
| Automobiles - 2.2% | |||
| Chongqing Changan Automobile Co. Ltd. (B Shares) | 13,112,941 | 22,686,340 | |
| Diversified Consumer Services - 1.4% | |||
| New Oriental Education & Technology Group, Inc. sponsored ADR | 297,200 | 11,638,352 | |
| TAL Education Group ADR (a) | 51,000 | 2,950,860 | |
| 14,589,212 | |||
| Hotels, Restaurants & Leisure - 3.2% | |||
| China CYTS Tours Holding Co. Ltd. | 887,536 | 2,725,375 | |
| China International Travel Service Corp. Ltd. (A Shares) | 753,281 | 5,121,899 | |
| Huangshan Tourism Development Co. Ltd. | 5,899,876 | 12,377,940 | |
| Shanghai Jin Jiang International Hotel Co. Ltd. (H Shares) | 13,520,000 | 5,550,538 | |
| Tuniu Corp. Class A sponsored ADR (a)(b) | 742,800 | 7,895,964 | |
| 33,671,716 | |||
| Household Durables - 4.2% | |||
| Haier Electronics Group Co. Ltd. | 5,492,000 | 9,223,978 | |
| Nien Made Enterprise Co. Ltd. | 800,000 | 6,290,437 | |
| Qingdao Haier Co. Ltd. | 3,099,822 | 3,988,464 | |
| Sundart Holdings Ltd. | 20,000,000 | 11,680,502 | |
| Techtronic Industries Co. Ltd. | 3,582,500 | 13,429,610 | |
| 44,612,991 | |||
| Internet & Catalog Retail - 2.3% | |||
| Ctrip.com International Ltd. ADR (a) | 286,000 | 12,472,460 | |
| Qunar Cayman Islands Ltd. sponsored ADR (a)(b) | 285,000 | 11,630,850 | |
| 24,103,310 | |||
| Media - 0.3% | |||
| Poly Culture Group Corp. Ltd. (H Shares) | 1,148,800 | 2,704,631 | |
| Multiline Retail - 0.0% | |||
| Lifestyle International Holdings Ltd. | 339,000 | 561,562 | |
| Specialty Retail - 1.7% | |||
| Chow Tai Fook Jewellery Group Ltd. | 16,335,200 | 11,354,113 | |
| Luk Fook Holdings International Ltd. | 2,830,000 | 6,445,257 | |
| 17,799,370 | |||
| Textiles, Apparel & Luxury Goods - 3.0% | |||
| Anta Sports Products Ltd. | 1,169,000 | 2,977,711 | |
| ECLAT Textile Co. Ltd. | 390,000 | 4,448,968 | |
| Lao Feng Xiang Co. Ltd. (B Shares) | 2,499,988 | 9,502,454 | |
| Pacific Textile Holdings Ltd. | 4,000,000 | 5,150,096 | |
| Shenzhou International Group Holdings Ltd. | 522,000 | 2,698,493 | |
| Toung Loong Textile Manufacturing Co. Ltd. | 2,375,000 | 6,315,590 | |
| 31,093,312 | |||
| TOTAL CONSUMER DISCRETIONARY | 200,824,560 | ||
| CONSUMER STAPLES - 4.1% | |||
| Beverages - 2.4% | |||
| Kweichow Moutai Co. Ltd. | 656,346 | 25,466,920 | |
| Food Products - 1.7% | |||
| China Modern Dairy Holdings Ltd. (b) | 34,000,000 | 6,240,081 | |
| Unified-President Enterprises Corp. | 6,240,000 | 11,242,547 | |
| 17,482,628 | |||
| TOTAL CONSUMER STAPLES | 42,949,548 | ||
| ENERGY - 0.1% | |||
| Energy Equipment & Services - 0.1% | |||
| China Oilfield Services Ltd. (H Shares) | 1,192,000 | 1,034,064 | |
| FINANCIALS - 22.1% | |||
| Banks - 7.7% | |||
| China Construction Bank Corp. (H Shares) | 43,894,000 | 27,878,267 | |
| Hangzhou Hikvision Digital Technology Co. Ltd. ELS (BNP Paribas Warrant Program) warrants 11/27/17 (a)(c) | 2,810,800 | 13,228,980 | |
| Industrial & Commercial Bank of China Ltd. (H Shares) | 44,543,000 | 23,848,363 | |
| Midea Group Co. Ltd. ELS (BNP Paribas Arbitrage Warrant Program) warrants 2/10/17 (a)(c) | 3,090,600 | 15,323,987 | |
| 80,279,597 | |||
| Capital Markets - 3.5% | |||
| Hangzhou Robam Appliances Co. Ltd. ELS (UBS Warrant Programme) warrants 1/15/18 (a)(c) | 512,858 | 4,075,740 | |
| Shanghai Bestway Marine Engineering Design Co. Ltd. ELS warrants 3/5/17 (a)(c) | 2,798,094 | 12,274,522 | |
| Shenzhen Airport Co. Ltd. ELS (UBS Warrant Programme) (A Shares) warrants 2/17/17 (a)(c) | 8,765,531 | 10,614,957 | |
| Wuliangye Yibin Co. Ltd. ELS (UBS Warrant Programme) warrants 3/7/19 (a)(c) | 1,071,282 | 4,699,440 | |
| Yunnan Baiyao Group Co. Ltd. ELS (UBS Warrant Programme) (A Shares) warrants 2/17/17 (a)(c) | 559,455 | 5,223,786 | |
| 36,888,445 | |||
| Insurance - 7.2% | |||
| AIA Group Ltd. | 3,432,400 | 20,541,562 | |
| China Pacific Insurance (Group) Co. Ltd. (H Shares) | 6,041,400 | 21,183,844 | |
| PICC Property & Casualty Co. Ltd. (H Shares) | 3,164,000 | 5,755,562 | |
| Ping An Insurance (Group) Co. of China Ltd. (H Shares) | 6,024,500 | 28,273,483 | |
| 75,754,451 | |||
| Real Estate Management & Development - 3.7% | |||
| Beijing Capital Land Ltd. (H Shares) | 35,170,000 | 13,865,732 | |
| Cheung Kong Property Holdings Ltd. | 2,848,000 | 19,450,390 | |
| Sun Hung Kai Properties Ltd. | 456,000 | 5,747,024 | |
| 39,063,146 | |||
| TOTAL FINANCIALS | 231,985,639 | ||
| HEALTH CARE - 3.3% | |||
| Health Care Providers & Services - 0.0% | |||
| China National Accord Medicines Corp. Ltd. | 24,173 | 132,319 | |
| Life Sciences Tools & Services - 1.0% | |||
| JHL Biotech, Inc. (a) | 3,976,696 | 10,753,317 | |
| Pharmaceuticals - 2.3% | |||
| Jiangsu Hengrui Medicine Co. Ltd. | 735,988 | 5,306,712 | |
| Lee's Pharmaceutical Holdings Ltd. | 8,273,500 | 6,694,421 | |
| Livzon Pharmaceutical Group, Inc. | 2,485,700 | 11,484,017 | |
| 23,485,150 | |||
| TOTAL HEALTH CARE | 34,370,786 | ||
| INDUSTRIALS - 9.8% | |||
| Air Freight & Logistics - 0.4% | |||
| Sinotrans Air Transportation Development Co. Ltd. (A Shares) | 1,599,830 | 4,541,960 | |
| Airlines - 3.0% | |||
| Air China Ltd. (H Shares) | 6,648,000 | 5,033,096 | |
| China Eastern Airlines Corp. Ltd. (H Shares) (a) | 26,446,000 | 14,458,119 | |
| China Southern Airlines Ltd. (H Shares) | 20,194,000 | 12,662,503 | |
| 32,153,718 | |||
| Construction & Engineering - 1.6% | |||
| Beijing Urban Consolidated & Development Group Ltd. (H Shares) | 20,963,000 | 12,108,422 | |
| China Energy Engineering Corp. Ltd. | 27,132,000 | 4,735,774 | |
| 16,844,196 | |||
| Electrical Equipment - 1.3% | |||
| Harbin Electric Machinery Co. Ltd.(H Shares) (b) | 21,974,000 | 8,993,794 | |
| Jiangnan Group Ltd. | 25,552,000 | 4,304,437 | |
| 13,298,231 | |||
| Machinery - 0.8% | |||
| Lonking Holdings Ltd. | 28,600,000 | 4,774,187 | |
| Sinotruk Hong Kong Ltd. | 8,000,000 | 4,028,249 | |
| 8,802,436 | |||
| Marine - 1.5% | |||
| China Shipping Development Co. Ltd. (H Shares) | 18,762,000 | 13,322,169 | |
| Sinotrans Shipping Ltd. (b) | 12,186,000 | 2,143,439 | |
| 15,465,608 | |||
| Trading Companies & Distributors - 1.0% | |||
| Summit Ascent Holdings Ltd. (a)(b) | 48,136,000 | 10,321,526 | |
| Transportation Infrastructure - 0.2% | |||
| Shanghai International Airport Co. Ltd. | 472,000 | 1,983,784 | |
| TOTAL INDUSTRIALS | 103,411,459 | ||
| INFORMATION TECHNOLOGY - 27.8% | |||
| Electronic Equipment & Components - 4.1% | |||
| Hon Hai Precision Industry Co. Ltd. (Foxconn) | 4,464,000 | 10,654,565 | |
| Largan Precision Co. Ltd. | 156,000 | 10,962,449 | |
| Sunny Optical Technology Group Co. Ltd. (b) | 2,700,000 | 8,327,490 | |
| Tongda Group Holdings Ltd. | 65,800,000 | 13,516,242 | |
| 43,460,746 | |||
| Internet Software & Services - 11.3% | |||
| 58.com, Inc. ADR (a) | 141,178 | 7,715,378 | |
| Alibaba Group Holding Ltd. sponsored ADR (a) | 370,900 | 28,537,046 | |
| Tencent Holdings Ltd. | 4,060,800 | 82,630,438 | |
| 118,882,862 | |||
| Semiconductors & Semiconductor Equipment - 10.1% | |||
| Advanced Semiconductor Engineering, Inc. | 13,995,000 | 13,445,636 | |
| Taiwan Semiconductor Manufacturing Co. Ltd. | 17,294,000 | 79,332,048 | |
| Vanguard International Semiconductor Corp. | 8,434,000 | 12,910,915 | |
| 105,688,599 | |||
| Software - 0.8% | |||
| China City Railway Transportation Technology Holdings Co. Ltd. (a) | 48,540,000 | 8,406,447 | |
| Technology Hardware, Storage & Peripherals - 1.5% | |||
| ADLINK Technology, Inc. | 3,682,844 | 7,593,023 | |
| Axiomtek Co. Ltd. | 2,000,000 | 4,272,049 | |
| HTC Corp. | 1,410,000 | 3,596,694 | |
| 15,461,766 | |||
| TOTAL INFORMATION TECHNOLOGY | 291,900,420 | ||
| MATERIALS - 5.6% | |||
| Construction Materials - 3.3% | |||
| BBMG Corp. (H Shares) | 30,808,000 | 22,515,344 | |
| China Shanshui Cement Group Ltd. (a)(b) | 20,656,000 | 9,200,458 | |
| TCC International Holdings Ltd. | 15,608,000 | 3,128,099 | |
| 34,843,901 | |||
| Metals & Mining - 2.3% | |||
| Fushan International Energy Group Ltd. | 2,778,000 | 417,665 | |
| Jiangxi Copper Co. Ltd. (H Shares) | 4,214,000 | 5,144,924 | |
| Zhaojin Mining Industry Co. Ltd. (H Shares) | 9,357,000 | 8,085,303 | |
| Zijin Mining Group Co. Ltd. (H Shares) | 31,580,000 | 10,535,752 | |
| 24,183,644 | |||
| TOTAL MATERIALS | 59,027,545 | ||
| TELECOMMUNICATION SERVICES - 4.1% | |||
| Diversified Telecommunication Services - 4.1% | |||
| China Telecom Corp. Ltd. (H Shares) | 13,024,000 | 6,447,744 | |
| China Unicom Ltd. | 13,784,000 | 16,131,254 | |
| Chunghwa Telecom Co. Ltd. | 4,980,000 | 16,804,012 | |
| CITIC 1616 Holdings Ltd. | 9,294,000 | 3,858,505 | |
| 43,241,515 | |||
| UTILITIES - 2.9% | |||
| Independent Power and Renewable Electricity Producers - 2.1% | |||
| Beijing Jingneng Clean Energy Co. Ltd. (H Shares) | 42,174,000 | 13,306,264 | |
| Huaneng Renewables Corp. Ltd. (H Shares) | 31,944,000 | 9,426,176 | |
| 22,732,440 | |||
| Water Utilities - 0.8% | |||
| Beijing Enterprises Water Group Ltd. | 13,838,000 | 8,253,479 | |
| TOTAL UTILITIES | 30,985,919 | ||
| TOTAL COMMON STOCKS | |||
| (Cost $1,082,335,076) | 1,039,731,455 | ||
| Nonconvertible Preferred Stocks - 0.7% | |||
| CONSUMER DISCRETIONARY - 0.7% | |||
| Internet & Catalog Retail - 0.7% | |||
| China Internet Plus Holdings Ltd. Series A-11 (d) | |||
| (Cost $6,268,244) | 1,983,088 | 7,656,108 | |
| Money Market Funds - 3.5% | |||
| Fidelity Cash Central Fund, 0.38% (e) | 5,975,098 | 5,975,098 | |
| Fidelity Securities Lending Cash Central Fund, 0.42% (e)(f) | 31,037,646 | 31,037,646 | |
| TOTAL MONEY MARKET FUNDS | |||
| (Cost $37,012,744) | 37,012,744 | ||
| TOTAL INVESTMENT PORTFOLIO - 103.1% | |||
| (Cost $1,125,616,064) | 1,084,400,307 | ||
| NET OTHER ASSETS (LIABILITIES) - (3.1)% | (32,970,981) | ||
| NET ASSETS - 100% | $1,051,429,326 |
Security Type Abbreviations
ELS – Equity-Linked Security
Legend
(a) Non-income producing
(b) Security or a portion of the security is on loan at period end.
(c) Security exempt from registration under Rule 144A of the Securities Act of 1933. These securities may be resold in transactions exempt from registration, normally to qualified institutional buyers. At the end of the period, the value of these securities amounted to $65,441,412 or 6.2% of net assets.
(d) Restricted securities - Investment in securities not registered under the Securities Act of 1933 (excluding 144A issues). At the end of the period, the value of restricted securities (excluding 144A issues) amounted to $7,656,108 or 0.7% of net assets.
(e) Affiliated fund that is generally available only to investment companies and other accounts managed by Fidelity Investments. The rate quoted is the annualized seven-day yield of the fund at period end. A complete unaudited listing of the fund's holdings as of its most recent quarter end is available upon request. In addition, each Fidelity Central Fund's financial statements are available on the SEC's website or upon request.
(f) Investment made with cash collateral received from securities on loan.
Additional information on each restricted holding is as follows:
| Security | Acquisition Date | Acquisition Cost |
| China Internet Plus Holdings Ltd. Series A-11 | 1/26/15 | $6,268,244 |
Affiliated Central Funds
Information regarding fiscal year to date income earned by the Fund from investments in Fidelity Central Funds is as follows:
| Fund | Income earned |
| Fidelity Cash Central Fund | $46,081 |
| Fidelity Securities Lending Cash Central Fund | 787,517 |
| Total | $833,598 |
Investment Valuation
The following is a summary of the inputs used, as of April 30, 2016, involving the Fund's assets and liabilities carried at fair value. The inputs or methodology used for valuing securities may not be an indication of the risk associated with investing in those securities. For more information on valuation inputs, and their aggregation into the levels used below, please refer to the Investment Valuation section in the accompanying Notes to Financial Statements.
| Valuation Inputs at Reporting Date: | ||||
| Description | Total | Level 1 | Level 2 | Level 3 |
| Investments in Securities: | ||||
| Equities: | ||||
| Consumer Discretionary | $208,480,668 | $129,048,069 | $71,776,491 | $7,656,108 |
| Consumer Staples | 42,949,548 | 36,709,467 | 6,240,081 | -- |
| Energy | 1,034,064 | -- | 1,034,064 | -- |
| Financials | 231,985,639 | -- | 231,985,639 | -- |
| Health Care | 34,370,786 | 16,192,348 | 18,178,438 | -- |
| Industrials | 103,411,459 | 6,525,744 | 96,885,715 | -- |
| Information Technology | 291,900,420 | 86,242,119 | 205,658,301 | -- |
| Materials | 59,027,545 | -- | 49,827,087 | 9,200,458 |
| Telecommunication Services | 43,241,515 | 16,804,012 | 26,437,503 | -- |
| Utilities | 30,985,919 | -- | 30,985,919 | -- |
| Money Market Funds | 37,012,744 | 37,012,744 | -- | -- |
| Total Investments in Securities: | $1,084,400,307 | $328,534,503 | $739,009,238 | $16,856,566 |
The following is a summary of transfers between Level 1 and Level 2 for the period ended April 30, 2016. Transfers are assumed to have occurred at the beginning of the period, and are primarily attributable to the valuation techniques used for foreign equity securities, as discussed in the accompanying Notes to Financial Statements:
| Transfers | Total |
| Level 1 to Level 2 | $0 |
| Level 2 to Level 1 | $86,068,185 |
The following is a reconciliation of Investments in Securities and Derivative Instruments for which Level 3 inputs were used in determining value:
| Investments in Securities: | |
| Equities - Consumer Discretionary | |
| Beginning Balance | $12,373,756 |
| Net Realized Gain (Loss) on Investment Securities | -- |
| Net Unrealized Gain (Loss) on Investment Securities | 1,388 |
| Cost of Purchases | -- |
| Proceeds of Sales | -- |
| Amortization/Accretion | -- |
| Transfers into Level 3 | -- |
| Transfers out of Level 3 | (4,719,036) |
| Ending Balance | $7,656,108 |
| The change in unrealized gain (loss) for the period attributable to Level 3 securities held at April 30, 2016 | $1,388 |
| Equities - Health Care | |
| Beginning Balance | $14,369,442 |
| Net Realized Gain (Loss) on Investment Securities | -- |
| Net Unrealized Gain (Loss) on Investment Securities | -- |
| Cost of Purchases | -- |
| Proceeds of Sales | -- |
| Amortization/Accretion | -- |
| Transfers into Level 3 | -- |
| Transfers out of Level 3 | (14,369,442) |
| Ending Balance | $-- |
| The change in unrealized gain (loss) for the period attributable to Level 3 securities held at April 30, 2016 | $-- |
| Equities - Industrials | |
| Beginning Balance | $15,897,809 |
| Net Realized Gain (Loss) on Investment Securities | -- |
| Net Unrealized Gain (Loss) on Investment Securities | -- |
| Cost of Purchases | -- |
| Proceeds of Sales | -- |
| Amortization/Accretion | -- |
| Transfers into Level 3 | -- |
| Transfers out of Level 3 | (15,897,809) |
| Ending Balance | $-- |
| The change in unrealized gain (loss) for the period attributable to Level 3 securities held at April 30, 2016 | $-- |
| Equities - Materials | |
| Beginning Balance | $14,440,021 |
| Net Realized Gain (Loss) on Investment Securities | -- |
| Net Unrealized Gain (Loss) on Investment Securities | (5,239,563) |
| Cost of Purchases | -- |
| Proceeds of Sales | -- |
| Amortization/Accretion | -- |
| Transfers into Level 3 | -- |
| Transfers out of Level 3 | -- |
| Ending Balance | $9,200,458 |
| The change in unrealized gain (loss) for the period attributable to Level 3 securities held at April 30, 2016 | $(5,239,563) |
The information used in the above reconciliations represents fiscal year to date activity for any Investments in Securities identified as using Level 3 inputs at either the beginning or the end of the current fiscal period. Transfers into Level 3 were attributable to a lack of observable market data resulting from decreases in market activity, decreases in liquidity, security restructurings or corporate actions. Transfers out of Level 3 were attributable to observable market data becoming available for those securities. Transfers in or out of Level 3 represent the beginning value of any Security or Instrument where a change in the pricing level occurred from the beginning to the end of the period. The cost of purchases and the proceeds of sales may include securities received or delivered through corporate actions or exchanges. Realized and unrealized gains (losses) disclosed in the reconciliations are included in Net Gain (Loss) on the Fund's Statement of Operations.
See accompanying notes which are an integral part of the financial statements.
Financial Statements
Statement of Assets and Liabilities
| April 30, 2016 (Unaudited) | ||
| Assets | ||
| Investment in securities, at value (including securities loaned of $29,468,457) — See accompanying schedule: Unaffiliated issuers (cost $1,088,603,320) | $1,047,387,563 | |
| Fidelity Central Funds (cost $37,012,744) | 37,012,744 | |
| Total Investments (cost $1,125,616,064) | $1,084,400,307 | |
| Receivable for investments sold | 2,260,855 | |
| Receivable for fund shares sold | 629,803 | |
| Dividends receivable | 8,617 | |
| Distributions receivable from Fidelity Central Funds | 130,378 | |
| Prepaid expenses | 1,007 | |
| Other receivables | 31,340 | |
| Total assets | 1,087,462,307 | |
| Liabilities | ||
| Payable for investments purchased | $25,401 | |
| Payable for fund shares redeemed | 3,982,214 | |
| Accrued management fee | 631,699 | |
| Distribution and service plan fees payable | 17,253 | |
| Other affiliated payables | 241,879 | |
| Other payables and accrued expenses | 96,889 | |
| Collateral on securities loaned, at value | 31,037,646 | |
| Total liabilities | 36,032,981 | |
| Net Assets | $1,051,429,326 | |
| Net Assets consist of: | ||
| Paid in capital | $1,281,182,139 | |
| Accumulated net investment loss | (4,948,592) | |
| Accumulated undistributed net realized gain (loss) on investments and foreign currency transactions | (183,588,248) | |
| Net unrealized appreciation (depreciation) on investments and assets and liabilities in foreign currencies | (41,215,973) | |
| Net Assets | $1,051,429,326 | |
| Calculation of Maximum Offering Price | ||
| Class A: | ||
| Net Asset Value and redemption price per share ($22,818,837 ÷ 1,000,986 shares) | $22.80 | |
| Maximum offering price per share (100/94.25 of $22.80) | $24.19 | |
| Class T: | ||
| Net Asset Value and redemption price per share ($5,221,259 ÷ 229,672 shares) | $22.73 | |
| Maximum offering price per share (100/96.50 of $22.73) | $23.55 | |
| Class B: | ||
| Net Asset Value and offering price per share ($535,037 ÷ 23,668 shares)(a) | $22.61 | |
| Class C: | ||
| Net Asset Value and offering price per share ($11,435,356 ÷ 512,571 shares)(a) | $22.31 | |
| China Region: | ||
| Net Asset Value, offering price and redemption price per share ($995,658,703 ÷ 43,200,582 shares) | $23.05 | |
| Class I: | ||
| Net Asset Value, offering price and redemption price per share ($15,760,134 ÷ 687,981 shares) | $22.91 |
(a) Redemption price per share is equal to net asset value less any applicable contingent deferred sales charge.
See accompanying notes which are an integral part of the financial statements.
Statement of Operations
| Six months ended April 30, 2016 (Unaudited) | ||
| Investment Income | ||
| Dividends | $289,863 | |
| Income from Fidelity Central Funds (including $787,517 from security lending) | 833,598 | |
| Total income | 1,123,461 | |
| Expenses | ||
| Management fee | $3,992,712 | |
| Transfer agent fees | 1,273,934 | |
| Distribution and service plan fees | 110,852 | |
| Accounting and security lending fees | 269,796 | |
| Custodian fees and expenses | 188,324 | |
| Independent trustees' compensation | 2,600 | |
| Registration fees | 81,227 | |
| Audit | 57,221 | |
| Legal | 1,907 | |
| Interest | 133 | |
| Miscellaneous | 4,958 | |
| Total expenses before reductions | 5,983,664 | |
| Expense reductions | (5,348) | 5,978,316 |
| Net investment income (loss) | (4,854,855) | |
| Realized and Unrealized Gain (Loss) | ||
| Net realized gain (loss) on: | ||
| Investment securities: | ||
| Unaffiliated issuers | (180,006,367) | |
| Foreign currency transactions | 268,756 | |
| Total net realized gain (loss) | (179,737,611) | |
| Change in net unrealized appreciation (depreciation) on: Investment securities | 46,758,426 | |
| Assets and liabilities in foreign currencies | (118) | |
| Total change in net unrealized appreciation (depreciation) | 46,758,308 | |
| Net gain (loss) | (132,979,303) | |
| Net increase (decrease) in net assets resulting from operations | $(137,834,158) |
See accompanying notes which are an integral part of the financial statements.
Statement of Changes in Net Assets
| Six months ended April 30, 2016 (Unaudited) | Year ended October 31, 2015 | |
| Increase (Decrease) in Net Assets | ||
| Operations | ||
| Net investment income (loss) | $(4,854,855) | $23,670,929 |
| Net realized gain (loss) | (179,737,611) | 235,474,014 |
| Change in net unrealized appreciation (depreciation) | 46,758,308 | (344,541,210) |
| Net increase (decrease) in net assets resulting from operations | (137,834,158) | (85,396,267) |
| Distributions to shareholders from net investment income | (15,103,497) | (13,114,934) |
| Distributions to shareholders from net realized gain | (159,831,115) | (172,413,722) |
| Total distributions | (174,934,612) | (185,528,656) |
| Share transactions - net increase (decrease) | 20,511,269 | 200,238,928 |
| Redemption fees | 123,475 | 2,391,591 |
| Total increase (decrease) in net assets | (292,134,026) | (68,294,404) |
| Net Assets | ||
| Beginning of period | 1,343,563,352 | 1,411,857,756 |
| End of period (including accumulated net investment loss of $4,948,592 and undistributed net investment income of $15,009,760, respectively) | $1,051,429,326 | $1,343,563,352 |
See accompanying notes which are an integral part of the financial statements.
Financial Highlights — Fidelity China Region Fund Class A
| Six months ended (Unaudited) April 30, | Years ended October 31, | |||||
| 2016 | 2015 | 2014 | 2013 | 2012 | 2011 | |
| Selected Per–Share Data | ||||||
| Net asset value, beginning of period | $29.34 | $34.18 | $35.56 | $28.53 | $27.28 | $31.61 |
| Income from Investment Operations | ||||||
| Net investment income (loss)A | (.14) | .40B | .21 | .30 | .36 | .33 |
| Net realized and unrealized gain (loss) | (2.54) | (.83) | 2.01C | 7.06 | 1.42 | (4.33) |
| Total from investment operations | (2.68) | (.43) | 2.22 | 7.36 | 1.78 | (4.00) |
| Distributions from net investment income | (.27) | (.22) | (.30) | (.34) | (.19) | (.31) |
| Distributions from net realized gain | (3.59) | (4.24) | (3.31) | – | (.34) | (.03) |
| Total distributions | (3.86) | (4.46) | (3.61) | (.34) | (.53) | (.34) |
| Redemption fees added to paid in capitalA | –D | .05 | .01 | .01 | –D | .01 |
| Net asset value, end of period | $22.80 | $29.34 | $34.18 | $35.56 | $28.53 | $27.28 |
| Total ReturnE,F,G | (10.57)% | (1.45)% | 6.45%C | 26.07% | 6.70% | (12.79)% |
| Ratios to Average Net AssetsH,I | ||||||
| Expenses before reductions | 1.33%J | 1.28% | 1.35% | 1.35% | 1.36% | 1.37% |
| Expenses net of fee waivers, if any | 1.32%J | 1.28% | 1.35% | 1.35% | 1.36% | 1.37% |
| Expenses net of all reductions | 1.32%J | 1.26% | 1.35% | 1.31% | 1.29% | 1.31% |
| Net investment income (loss) | (1.13)%J | 1.26%B | .64% | .94% | 1.35% | 1.07% |
| Supplemental Data | ||||||
| Net assets, end of period (000 omitted) | $22,819 | $32,761 | $21,728 | $20,623 | $13,539 | $14,808 |
| Portfolio turnover rateK | 80%J | 151% | 87% | 92% | 107% | 87% |
A Calculated based on average shares outstanding during the period.
B Net Investment income per share reflects a large, non-recurring dividend which amounted to $.13 per share. Excluding this non-recurring dividend, the ratio of net investment income (loss) to average net assets would have been .85%.
C Amount includes a reimbursement from the adviser for an operations error which amounted to $.01 per share. Excluding this reimbursement, the total return would have been 6.42%.
D Amount represents less than $.005 per share.
E Total returns for periods of less than one year are not annualized.
F Total returns would have been lower if certain expenses had not been reduced during the applicable periods shown.
G Total returns do not include the effect of the sales charges.
H Fees and expenses of any underlying Fidelity Central Funds are not included in the Fund's expense ratio. The Fund indirectly bears its proportionate share of the expenses of any underlying Fidelity Central Funds.
I Expense ratios reflect operating expenses of the class. Expenses before reductions do not reflect amounts reimbursed by the investment adviser or reductions from brokerage service arrangements or reductions from other expense offset arrangements and do not represent the amount paid by the class during periods when reimbursements or reductions occur. Expenses net of fee waivers reflect expenses after reimbursement by the investment adviser but prior to reductions from brokerage service arrangements or other expense offset arrangements. Expenses net of all reductions represent the net expenses paid by the class.
J Annualized
K Amount does not include the portfolio activity of any underlying Fidelity Central Funds.
See accompanying notes which are an integral part of the financial statements.
Financial Highlights — Fidelity China Region Fund Class T
| Six months ended (Unaudited) April 30, | Years ended October 31, | |||||
| 2016 | 2015 | 2014 | 2013 | 2012 | 2011 | |
| Selected Per–Share Data | ||||||
| Net asset value, beginning of period | $29.18 | $34.02 | $35.40 | $28.40 | $27.13 | $31.48 |
| Income from Investment Operations | ||||||
| Net investment income (loss)A | (.18) | .30B | .12 | .21 | .29 | .25 |
| Net realized and unrealized gain (loss) | (2.55) | (.83) | 1.99C | 7.04 | 1.40 | (4.32) |
| Total from investment operations | (2.73) | (.53) | 2.11 | 7.25 | 1.69 | (4.07) |
| Distributions from net investment income | (.13) | (.12) | (.19) | (.26) | (.08) | (.27) |
| Distributions from net realized gain | (3.59) | (4.24) | (3.31) | – | (.34) | (.03) |
| Total distributions | (3.72) | (4.36) | (3.50) | (.26) | (.42) | (.29)D |
| Redemption fees added to paid in capitalA | –E | .05 | .01 | .01 | –E | .01 |
| Net asset value, end of period | $22.73 | $29.18 | $34.02 | $35.40 | $28.40 | $27.13 |
| Total ReturnF,G,H | (10.75)% | (1.79)% | 6.15%C | 25.74% | 6.38% | (13.04)% |
| Ratios to Average Net AssetsI,J | ||||||
| Expenses before reductions | 1.68%K | 1.62% | 1.65% | 1.64% | 1.64% | 1.63% |
| Expenses net of fee waivers, if any | 1.68%K | 1.62% | 1.65% | 1.64% | 1.64% | 1.63% |
| Expenses net of all reductions | 1.68%K | 1.60% | 1.65% | 1.60% | 1.57% | 1.57% |
| Net investment income (loss) | (1.48)%K | .92%B | .35% | .65% | 1.06% | .81% |
| Supplemental Data | ||||||
| Net assets, end of period (000 omitted) | $5,221 | $6,409 | $6,305 | $5,965 | $4,349 | $5,281 |
| Portfolio turnover rateL | 80%K | 151% | 87% | 92% | 107% | 87% |
A Calculated based on average shares outstanding during the period.
B Net Investment income per share reflects a large, non-recurring dividend which amounted to $.13 per share. Excluding this non-recurring dividend, the ratio of net investment income (loss) to average net assets would have been .51%.
C Amount includes a reimbursement from the adviser for an operations error which amounted to $.01 per share. Excluding this reimbursement, the total return would have been 6.12%.
D Total distributions of $.29 per share is comprised of distributions from net investment income of $.268 and distributions from net realized gain of $.025 per share.
E Amount represents less than $.005 per share.
F Total returns for periods of less than one year are not annualized.
G Total returns would have been lower if certain expenses had not been reduced during the applicable periods shown.
H Total returns do not include the effect of the sales charges.
I Fees and expenses of any underlying Fidelity Central Funds are not included in the Fund's expense ratio. The Fund indirectly bears its proportionate share of the expenses of any underlying Fidelity Central Funds.
J Expense ratios reflect operating expenses of the class. Expenses before reductions do not reflect amounts reimbursed by the investment adviser or reductions from brokerage service arrangements or reductions from other expense offset arrangements and do not represent the amount paid by the class during periods when reimbursements or reductions occur. Expenses net of fee waivers reflect expenses after reimbursement by the investment adviser but prior to reductions from brokerage service arrangements or other expense offset arrangements. Expenses net of all reductions represent the net expenses paid by the class.
K Annualized
L Amount does not include the portfolio activity of any underlying Fidelity Central Funds.
See accompanying notes which are an integral part of the financial statements.
Financial Highlights — Fidelity China Region Fund Class B
| Six months ended (Unaudited) April 30, | Years ended October 31, | |||||
| 2016 | 2015 | 2014 | 2013 | 2012 | 2011 | |
| Selected Per–Share Data | ||||||
| Net asset value, beginning of period | $28.97 | $33.79 | $35.12 | $28.16 | $26.94 | $31.23 |
| Income from Investment Operations | ||||||
| Net investment income (loss)A | (.23) | .14B | (.04) | .06 | .16 | .10 |
| Net realized and unrealized gain (loss) | (2.54) | (.80) | 1.99C | 6.99 | 1.40 | (4.29) |
| Total from investment operations | (2.77) | (.66) | 1.95 | 7.05 | 1.56 | (4.19) |
| Distributions from net investment income | – | – | – | (.10) | – | (.08) |
| Distributions from net realized gain | (3.59) | (4.21) | (3.29) | – | (.34) | (.03) |
| Total distributions | (3.59) | (4.21) | (3.29) | (.10) | (.34) | (.11) |
| Redemption fees added to paid in capitalA | –D | .05 | .01 | .01 | –D | .01 |
| Net asset value, end of period | $22.61 | $28.97 | $33.79 | $35.12 | $28.16 | $26.94 |
| Total ReturnE,F,G | (10.95)% | (2.23)% | 5.68%C | 25.12% | 5.90% | (13.45)% |
| Ratios to Average Net AssetsH,I | ||||||
| Expenses before reductions | 2.11%J | 2.10% | 2.11% | 2.10% | 2.11% | 2.12% |
| Expenses net of fee waivers, if any | 2.11%J | 2.10% | 2.11% | 2.10% | 2.11% | 2.12% |
| Expenses net of all reductions | 2.11%J | 2.07% | 2.11% | 2.07% | 2.04% | 2.06% |
| Net investment income (loss) | (1.91)%J | .44%B | (.12)% | .19% | .59% | .32% |
| Supplemental Data | ||||||
| Net assets, end of period (000 omitted) | $535 | $803 | $1,215 | $1,494 | $1,533 | $1,801 |
| Portfolio turnover rateK | 80%J | 151% | 87% | 92% | 107% | 87% |
A Calculated based on average shares outstanding during the period.
B Net Investment income per share reflects a large, non-recurring dividend which amounted to $.13 per share. Excluding this non-recurring dividend, the ratio of net investment income (loss) to average net assets would have been .04%.
C Amount includes a reimbursement from the adviser for an operations error which amounted to $.01 per share. Excluding this reimbursement, the total return would have been 5.65%.
D Amount represents less than $.005 per share.
E Total returns for periods of less than one year are not annualized.
F Total returns would have been lower if certain expenses had not been reduced during the applicable periods shown.
G Total returns do not include the effect of the contingent deferred sales charge.
H Fees and expenses of any underlying Fidelity Central Funds are not included in the Fund's expense ratio. The Fund indirectly bears its proportionate share of the expenses of any underlying Fidelity Central Funds.
I Expense ratios reflect operating expenses of the class. Expenses before reductions do not reflect amounts reimbursed by the investment adviser or reductions from brokerage service arrangements or reductions from other expense offset arrangements and do not represent the amount paid by the class during periods when reimbursements or reductions occur. Expenses net of fee waivers reflect expenses after reimbursement by the investment adviser but prior to reductions from brokerage service arrangements or other expense offset arrangements. Expenses net of all reductions represent the net expenses paid by the class.
J Annualized
K Amount does not include the portfolio activity of any underlying Fidelity Central Funds.
See accompanying notes which are an integral part of the financial statements.
Financial Highlights — Fidelity China Region Fund Class C
| Six months ended (Unaudited) April 30, | Years ended October 31, | |||||
| 2016 | 2015 | 2014 | 2013 | 2012 | 2011 | |
| Selected Per–Share Data | ||||||
| Net asset value, beginning of period | $28.68 | $33.56 | $34.99 | $28.07 | $26.86 | $31.19 |
| Income from Investment Operations | ||||||
| Net investment income (loss)A | (.22) | .15B | (.02) | .06 | .16 | .10 |
| Net realized and unrealized gain (loss) | (2.50) | (.80) | 1.97C | 6.97 | 1.39 | (4.28) |
| Total from investment operations | (2.72) | (.65) | 1.95 | 7.03 | 1.55 | (4.18) |
| Distributions from net investment income | (.06) | (.04) | (.08) | (.12) | – | (.13) |
| Distributions from net realized gain | (3.59) | (4.24) | (3.31) | – | (.34) | (.03) |
| Total distributions | (3.65) | (4.28) | (3.39) | (.12) | (.34) | (.16) |
| Redemption fees added to paid in capitalA | –D | .05 | .01 | .01 | –D | .01 |
| Net asset value, end of period | $22.31 | $28.68 | $33.56 | $34.99 | $28.07 | $26.86 |
| Total ReturnE,F,G | (10.90)% | (2.21)% | 5.71%C | 25.14% | 5.88% | (13.46)% |
| Ratios to Average Net AssetsH,I | ||||||
| Expenses before reductions | 2.08%J | 2.05% | 2.07% | 2.10% | 2.11% | 2.12% |
| Expenses net of fee waivers, if any | 2.08%J | 2.05% | 2.07% | 2.10% | 2.11% | 2.12% |
| Expenses net of all reductions | 2.08%J | 2.02% | 2.07% | 2.07% | 2.04% | 2.06% |
| Net investment income (loss) | (1.88)%J | .49%B | (.07)% | .19% | .59% | .32% |
| Supplemental Data | ||||||
| Net assets, end of period (000 omitted) | $11,435 | $14,355 | $10,445 | $6,957 | $4,515 | $5,230 |
| Portfolio turnover rateK | 80%J | 151% | 87% | 92% | 107% | 87% |
A Calculated based on average shares outstanding during the period.
B Net Investment income per share reflects a large, non-recurring dividend which amounted to $.13 per share. Excluding this non-recurring dividend, the ratio of net investment income (loss) to average net assets would have been .09%.
C Amount includes a reimbursement from the adviser for an operations error which amounted to $.01 per share. Excluding this reimbursement, the total return would have been 5.68%.
D Amount represents less than $.005 per share.
E Total returns for periods of less than one year are not annualized.
F Total returns would have been lower if certain expenses had not been reduced during the applicable periods shown.
G Total returns do not include the effect of the contingent deferred sales charge.
H Fees and expenses of any underlying Fidelity Central Funds are not included in the Fund's expense ratio. The Fund indirectly bears its proportionate share of the expenses of any underlying Fidelity Central Funds.
I Expense ratios reflect operating expenses of the class. Expenses before reductions do not reflect amounts reimbursed by the investment adviser or reductions from brokerage service arrangements or reductions from other expense offset arrangements and do not represent the amount paid by the class during periods when reimbursements or reductions occur. Expenses net of fee waivers reflect expenses after reimbursement by the investment adviser but prior to reductions from brokerage service arrangements or other expense offset arrangements. Expenses net of all reductions represent the net expenses paid by the class.
J Annualized
K Amount does not include the portfolio activity of any underlying Fidelity Central Funds.
See accompanying notes which are an integral part of the financial statements.
Financial Highlights — Fidelity China Region Fund
| Six months ended (Unaudited) April 30, | Years ended October 31, | |||||
| 2016 | 2015 | 2014 | 2013 | 2012 | 2011 | |
| Selected Per–Share Data | ||||||
| Net asset value, beginning of period | $29.66 | $34.51 | $35.83 | $28.73 | $27.49 | $31.81 |
| Income from Investment Operations | ||||||
| Net investment income (loss)A | (.10) | .51B | .33 | .41 | .45 | .44 |
| Net realized and unrealized gain (loss) | (2.58) | (.84) | 2.03C | 7.11 | 1.42 | (4.37) |
| Total from investment operations | (2.68) | (.33) | 2.36 | 7.52 | 1.87 | (3.93) |
| Distributions from net investment income | (.35) | (.33) | (.38) | (.43) | (.29) | (.38) |
| Distributions from net realized gain | (3.59) | (4.24) | (3.31) | – | (.34) | (.03) |
| Total distributions | (3.93)D | (4.57) | (3.69) | (.43) | (.63) | (.40)E |
| Redemption fees added to paid in capitalA | –F | .05 | .01 | .01 | –F | .01 |
| Net asset value, end of period | $23.05 | $29.66 | $34.51 | $35.83 | $28.73 | $27.49 |
| Total ReturnG,H | (10.45)% | (1.14)% | 6.83%C | 26.51% | 7.01% | (12.52)% |
| Ratios to Average Net AssetsI,J | ||||||
| Expenses before reductions | 1.03%K | .99% | 1.01% | 1.02% | 1.04% | 1.04% |
| Expenses net of fee waivers, if any | 1.03%K | .98% | 1.01% | 1.02% | 1.04% | 1.04% |
| Expenses net of all reductions | 1.02%K | .96% | 1.01% | .98% | .98% | .98% |
| Net investment income (loss) | (.83)%K | 1.55%B | .99% | 1.27% | 1.66% | 1.40% |
| Supplemental Data | ||||||
| Net assets, end of period (000 omitted) | $995,659 | $1,262,274 | $1,352,761 | $1,425,828 | $1,265,488 | $1,515,084 |
| Portfolio turnover rateL | 80%K | 151% | 87% | 92% | 107% | 87% |
A Calculated based on average shares outstanding during the period.
B Net Investment income per share reflects a large, non-recurring dividend which amounted to $.13 per share. Excluding this non-recurring dividend, the ratio of net investment income (loss) to average net assets would have been 1.15%.
C Amount includes a reimbursement from the adviser for an operations error which amounted to $.01 per share. Excluding this reimbursement, the total return would have been 6.80%.
D Total distributions of $3.93 per share is comprised of distributions from net investment income of $.345 and distributions from net realized gain of $3.588 per share.
E Total distributions of $.40 per share is comprised of distributions from net investment income of $.376 and distributions from net realized gain of $.025 per share.
F Amount represents less than $.005 per share.
G Total returns for periods of less than one year are not annualized.
H Total returns would have been lower if certain expenses had not been reduced during the applicable periods shown.
I Fees and expenses of any underlying Fidelity Central Funds are not included in the Fund's expense ratio. The Fund indirectly bears its proportionate share of the expenses of any underlying Fidelity Central Funds.
J Expense ratios reflect operating expenses of the class. Expenses before reductions do not reflect amounts reimbursed by the investment adviser or reductions from brokerage service arrangements or reductions from other expense offset arrangements and do not represent the amount paid by the class during periods when reimbursements or reductions occur. Expenses net of fee waivers reflect expenses after reimbursement by the investment adviser but prior to reductions from brokerage service arrangements or other expense offset arrangements. Expenses net of all reductions represent the net expenses paid by the class.
K Annualized
L Amount does not include the portfolio activity of any underlying Fidelity Central Funds.
See accompanying notes which are an integral part of the financial statements.
Financial Highlights — Fidelity China Region Fund Class I
| Six months ended (Unaudited) April 30, | Years ended October 31, | |||||
| 2016 | 2015 | 2014 | 2013 | 2012 | 2011 | |
| Selected Per–Share Data | ||||||
| Net asset value, beginning of period | $29.51 | $34.39 | $35.75 | $28.68 | $27.46 | $31.79 |
| Income from Investment Operations | ||||||
| Net investment income (loss)A | (.10) | .51B | .34 | .42 | .45 | .43 |
| Net realized and unrealized gain (loss) | (2.55) | (.84) | 2.02C | 7.10 | 1.42 | (4.37) |
| Total from investment operations | (2.65) | (.33) | 2.36 | 7.52 | 1.87 | (3.94) |
| Distributions from net investment income | (.36) | (.36) | (.43) | (.46) | (.31) | (.37) |
| Distributions from net realized gain | (3.59) | (4.24) | (3.31) | – | (.34) | (.03) |
| Total distributions | (3.95) | (4.60) | (3.73)D | (.46) | (.65) | (.40) |
| Redemption fees added to paid in capitalA | –E | .05 | .01 | .01 | –E | .01 |
| Net asset value, end of period | $22.91 | $29.51 | $34.39 | $35.75 | $28.68 | $27.46 |
| Total ReturnF,G | (10.43)% | (1.14)% | 6.87%C | 26.58% | 7.02% | (12.56)% |
| Ratios to Average Net AssetsH,I | ||||||
| Expenses before reductions | 1.00%J | .97% | .98% | .97% | 1.04% | 1.06% |
| Expenses net of fee waivers, if any | 1.00%J | .97% | .98% | .97% | 1.04% | 1.06% |
| Expenses net of all reductions | 1.00%J | .95% | .98% | .93% | .98% | 1.01% |
| Net investment income (loss) | (.80)%J | 1.57%B | 1.01% | 1.32% | 1.66% | 1.38% |
| Supplemental Data | ||||||
| Net assets, end of period (000 omitted) | $15,760 | $26,961 | $19,404 | $10,206 | $1,958 | $2,034 |
| Portfolio turnover rateK | 80%J | 151% | 87% | 92% | 107% | 87% |
A Calculated based on average shares outstanding during the period.
B Net Investment income per share reflects a large, non-recurring dividend which amounted to $.13 per share. Excluding this non-recurring dividend, the ratio of net investment income (loss) to average net assets would have been 1.16%.
C Amount includes a reimbursement from the adviser for an operations error which amounted to $.01 per share. Excluding this reimbursement, the total return would have been 6.84%.
D Total distributions of $3.73 per share is comprised of distributions from net investment income of $.425 and distributions from net realized gain of $3.306 per share.
E Amount represents less than $.005 per share.
F Total returns for periods of less than one year are not annualized.
G Total returns would have been lower if certain expenses had not been reduced during the applicable periods shown.
H Fees and expenses of any underlying Fidelity Central Funds are not included in the Fund's expense ratio. The Fund indirectly bears its proportionate share of the expenses of any underlying Fidelity Central Funds.
I Expense ratios reflect operating expenses of the class. Expenses before reductions do not reflect amounts reimbursed by the investment adviser or reductions from brokerage service arrangements or reductions from other expense offset arrangements and do not represent the amount paid by the class during periods when reimbursements or reductions occur. Expenses net of fee waivers reflect expenses after reimbursement by the investment adviser but prior to reductions from brokerage service arrangements or other expense offset arrangements. Expenses net of all reductions represent the net expenses paid by the class.
J Annualized
K Amount does not include the portfolio activity of any underlying Fidelity Central Funds.
See accompanying notes which are an integral part of the financial statements.
Notes to Financial Statements (Unaudited)
For the period ended April 30, 2016
1. Organization.
Fidelity China Region Fund (the Fund) is a fund of Fidelity Investment Trust (the Trust) and is authorized to issue an unlimited number of shares. The Trust is registered under the Investment Company Act of 1940, as amended (the 1940 Act), as an open-end management investment company organized as a Massachusetts business trust. The Fund offers Class A, Class T, Class C, China Region and Class I shares, each of which, along with Class B shares, has equal rights as to assets and voting privileges. Class B shares are closed to new accounts and additional purchases, except for exchanges and reinvestments. Each class has exclusive voting rights with respect to matters that affect that class. Class B shares will automatically convert to Class A shares after a maximum holding period of seven years from the initial date of purchase. The Fund's investments in emerging markets can be subject to social, economic, regulatory, and political uncertainties and can be extremely volatile.
During the period, the Board of Trustees approved the conversion of all existing Class B shares into Class A shares, effective on or about July 1, 2016, regardless of the length of times shares have been held.
2. Investments in Fidelity Central Funds.
The Fund invests in Fidelity Central Funds, which are open-end investment companies generally available only to other investment companies and accounts managed by the investment adviser and its affiliates. The Fund's Schedule of Investments lists each of the Fidelity Central Funds held as of period end, if any, as an investment of the Fund, but does not include the underlying holdings of each Fidelity Central Fund. As an Investing Fund, the Fund indirectly bears its proportionate share of the expenses of the underlying Fidelity Central Funds.
The Money Market Central Funds seek preservation of capital and current income and are managed by Fidelity Investments Money Management, Inc. (FIMM), an affiliate of the investment adviser. Annualized expenses of the Money Market Central Funds as of their most recent shareholder report date are less than .005%.
A complete unaudited list of holdings for each Fidelity Central Fund is available upon request or at the Securities and Exchange Commission (the SEC) website at www.sec.gov. In addition, the financial statements of the Fidelity Central Funds are available on the SEC website or upon request.
3. Significant Accounting Policies.
The financial statements have been prepared in conformity with accounting principles generally accepted in the United States of America (GAAP), which require management to make certain estimates and assumptions at the date of the financial statements. Actual results could differ from those estimates. Subsequent events, if any, through the date that the financial statements were issued have been evaluated in the preparation of the financial statements. The following summarizes the significant accounting policies of the Fund:
Investment Valuation. Investments are valued as of 4:00 p.m. Eastern time on the last calendar day of the period. The Board of Trustees (the Board) has delegated the day to day responsibility for the valuation of the Fund's investments to the Fidelity Management & Research Company (FMR) Fair Value Committee (the Committee). In accordance with valuation policies and procedures approved by the Board, the Fund attempts to obtain prices from one or more third party pricing vendors or brokers to value its investments. When current market prices, quotations or currency exchange rates are not readily available or reliable, investments will be fair valued in good faith by the Committee, in accordance with procedures adopted by the Board. Factors used in determining fair value vary by investment type and may include market or investment specific events. The frequency with which these procedures are used cannot be predicted and they may be utilized to a significant extent. The Committee oversees the Fund's valuation policies and procedures and reports to the Board on the Committee's activities and fair value determinations. The Board monitors the appropriateness of the procedures used in valuing the Fund's investments and ratifies the fair value determinations of the Committee.
The Fund categorizes the inputs to valuation techniques used to value its investments into a disclosure hierarchy consisting of three levels as shown below:
- Level 1 – quoted prices in active markets for identical investments
- Level 2 – other significant observable inputs (including quoted prices for similar investments, interest rates, prepayment speeds, etc.)
- Level 3 – unobservable inputs (including the Fund's own assumptions based on the best information available)
Valuation techniques used to value the Fund's investments by major category are as follows:
Equity securities, including restricted securities, for which market quotations are readily available, are valued at the last reported sale price or official closing price as reported by a third party pricing vendor on the primary market or exchange on which they are traded and are categorized as Level 1 in the hierarchy. In the event there were no sales during the day or closing prices are not available, securities are valued at the last quoted bid price or may be valued using the last available price and are generally categorized as Level 2 in the hierarchy. For foreign equity securities, when market or security specific events arise, comparisons to the valuation of American Depositary Receipts (ADRs), futures contracts, Exchange-Traded Funds (ETFs) and certain indexes as well as quoted prices for similar securities may be used and would be categorized as Level 2 in the hierarchy. Utilizing these techniques may result in transfers between Level 1 and Level 2. For equity securities, including restricted securities, where observable inputs are limited, assumptions about market activity and risk are used and these securities may be categorized as Level 3 in the hierarchy. Equity securities, including restricted securities, for which observable inputs are not available are valued using alternative valuation approaches, including the market approach and the income approach and are categorized as level 3 in the hierarchy. The market approach generally consists of using comparable market transactions while the income approach generally consists of using the net present value of estimated future cash flows, adjusted as appropriate for liquidity, credit, market and/or other risk factors.
Investments in open-end mutual funds, including the Fidelity Central Funds, are valued at their closing net asset value (NAV) each business day and are categorized as Level 1 in the hierarchy.
The following provides information on Level 3 securities held by the Fund that were valued at period end based on unobservable inputs. These amounts exclude valuations provided by a broker.
| Asset Type | Fair Value at 04/30/16 | Valuation Technique (s) | Unobservable Input | Amount or Range / Weighted Average | Impact to Valuation from an Increase in Input* |
| Equities | $16,856,566 | Adjusted transaction price | Proxy movement | 45.0% | Increase |
| Last transaction price | Transaction price | $3.86 | Increase |
* Represents the expected directional change in the fair value of the Level 3 investments that would result from an increase in the corresponding input. A decrease to the unobservable input would have the opposite effect. Significant changes in these inputs could result in significantly higher or lower fair value measurements.
Changes in valuation techniques may result in transfers in or out of an assigned level within the disclosure hierarchy. The aggregate value of investments by input level as of April 30, 2016, including information on transfers between Levels 1 and 2, as well as a roll forward of Level 3 investments, is included at the end of the Fund's Schedule of Investments.
Foreign Currency. The Fund may use foreign currency contracts to facilitate transactions in foreign-denominated securities. Gains and losses from these transactions may arise from changes in the value of the foreign currency or if the counterparties do not perform under the contracts' terms.
Foreign-denominated assets, including investment securities, and liabilities are translated into U.S. dollars at the exchange rates at period end. Purchases and sales of investment securities, income and dividends received and expenses denominated in foreign currencies are translated into U.S. dollars at the exchange rate in effect on the transaction date.
The effects of exchange rate fluctuations on investments are included with the net realized and unrealized gain (loss) on investment securities. Other foreign currency transactions resulting in realized and unrealized gain (loss) are disclosed separately.
Investment Transactions and Income. For financial reporting purposes, the Fund's investment holdings and NAV include trades executed through the end of the last business day of the period. The NAV per share for processing shareholder transactions is calculated as of the close of business of the New York Stock Exchange (NYSE), normally 4:00 p.m. Eastern time and includes trades executed through the end of the prior business day. Gains and losses on securities sold are determined on the basis of identified cost and may include proceeds received from litigation. Dividend income is recorded on the ex-dividend date, except for certain dividends from foreign securities where the ex-dividend date may have passed, which are recorded as soon as the Fund is informed of the ex-dividend date. Non-cash dividends included in dividend income, if any, are recorded at the fair market value of the securities received. Income and capital gain distributions from Fidelity Central Funds, if any, are recorded on the ex-dividend date. Investment income is recorded net of foreign taxes withheld where recovery of such taxes is uncertain.
Class Allocations and Expenses. Investment income, realized and unrealized capital gains and losses, common expenses of the Fund, and certain fund-level expense reductions, if any, are allocated daily on a pro-rata basis to each class based on the relative net assets of each class to the total net assets of the Fund. Each class differs with respect to transfer agent and distribution and service plan fees incurred. Certain expense reductions may also differ by class. For the reporting period, the allocated portion of income and expenses to each class as a percent of its average net assets may vary due to the timing of recording these transactions in relation to fluctuating net assets of the classes. Expenses directly attributable to a fund are charged to that fund. Expenses attributable to more than one fund are allocated among the respective funds on the basis of relative net assets or other appropriate methods. Expense estimates are accrued in the period to which they relate and adjustments are made when actual amounts are known.
Income Tax Information and Distributions to Shareholders. Each year, the Fund intends to qualify as a regulated investment company under Subchapter M of the Internal Revenue Code, including distributing substantially all of its taxable income and realized gains. As a result, no provision for U.S. Federal income taxes is required. The Fund files a U.S. federal tax return, in addition to state and local tax returns as required. The Fund's federal income tax returns are subject to examination by the Internal Revenue Service (IRS) for a period of three fiscal years after they are filed. State and local tax returns may be subject to examination for an additional fiscal year depending on the jurisdiction. Foreign taxes are provided for based on the Fund's understanding of the tax rules and rates that exist in the foreign markets in which it invests. The Fund is subject to a tax imposed on capital gains by certain countries in which it invests.
Distributions are declared and recorded on the ex-dividend date. Income dividends and capital gain distributions are declared separately for each class. Income and capital gain distributions are determined in accordance with income tax regulations, which may differ from GAAP.
Capital accounts within the financial statements are adjusted for permanent book-tax differences. These adjustments have no impact on net assets or the results of operations. Capital accounts are not adjusted for temporary book-tax differences which will reverse in a subsequent period.
Book-tax differences are primarily due to foreign currency transactions, certain foreign taxes, passive foreign investment companies (PFIC), deferred trustees compensation and losses deferred due to wash sales.
The federal tax cost of investment securities and unrealized appreciation (depreciation) as of period end were as follows:
| Gross unrealized appreciation | $83,242,428 |
| Gross unrealized depreciation | (128,294,828) |
| Net unrealized appreciation (depreciation) on securities | $(45,052,400) |
| Tax cost | $1,129,452,707 |
Short-Term Trading (Redemption) Fees. Shares held by investors in the Fund less than 90 days may have been subject to a redemption fee equal to 1.50% of the NAV of shares redeemed. All redemption fees, which reduce the proceeds of the shareholder redemption, are retained by the Fund and accounted for as an addition to paid in capital.
Restricted Securities. The Fund may invest in securities that are subject to legal or contractual restrictions on resale. These securities generally may be resold in transactions exempt from registration or to the public if the securities are registered. Disposal of these securities may involve time-consuming negotiations and expense, and prompt sale at an acceptable price may be difficult. Information regarding restricted securities is included at the end of the Fund's Schedule of Investments.
4. Purchases and Sales of Investments.
Purchases and sales of securities, other than short-term securities, aggregated $452,226,068 and $594,988,343, respectively.
5. Fees and Other Transactions with Affiliates.
Management Fee. Fidelity Management & Research Company (the investment adviser) and its affiliates provide the Fund with investment management related services for which the Fund pays a monthly management fee. The management fee is the sum of an individual fund fee rate that is based on an annual rate of .45% of the Fund's average net assets and an annualized group fee rate that averaged .25% during the period. The group fee rate is based upon the average net assets of all the mutual funds advised by the investment adviser, including any mutual funds previously advised by the investment adviser that are currently advised by Fidelity SelectCo, LLC, an affiliate of the investment adviser. The group fee rate decreases as assets under management increase and increases as assets under management decrease. For the reporting period, the total annualized management fee rate was .70% of the Fund's average net assets.
Distribution and Service Plan Fees. In accordance with Rule 12b-1 of the 1940 Act, the Fund has adopted separate Distribution and Service Plans for each class of shares. Certain classes pay Fidelity Distributors Corporation (FDC), an affiliate of the investment adviser, separate Distribution and Service Fees, each of which is based on an annual percentage of each class' average net assets. In addition, FDC may pay financial intermediaries for selling shares of the Fund and providing shareholder support services. For the period, the Distribution and Service Fee rates, total fees and amounts retained by FDC were as follows:
| Distribution Fee | Service Fee | Total Fees | Retained by FDC | |
| Class A | -% | .25% | $33,035 | $1,879 |
| Class T | .25% | .25% | 13,818 | 160 |
| Class B | .75% | .25% | 3,184 | 2,388 |
| Class C | .75% | .25% | 60,815 | 25,390 |
| $110,852 | $29,817 |
Sales Load. FDC may receive a front-end sales charge of up to 5.75% for selling Class A shares and 3.50% for selling Class T shares, some of which is paid to financial intermediaries for selling shares of the Fund. Depending on the holding period, FDC may receive contingent deferred sales charges levied on Class A, Class T, Class B, and Class C redemptions. The deferred sales charges range from 5.00% to 1.00% for Class B shares, 1.00% for Class C shares, 1.00% for certain purchases of Class A shares and .25% for certain purchases of Class T shares.
For the period, sales charge amounts retained by FDC were as follows:
| Retained by FDC | |
| Class A | $35,646 |
| Class T | 1,702 |
| Class B(a) | 160 |
| Class C(a) | 6,468 |
| $43,976 |
(a) When Class B and Class C shares are initially sold, FDC pays commissions from its own resources to financial intermediaries through which the sales are made.
Transfer Agent Fees. Fidelity Investments Institutional Operations Company, Inc., (FIIOC), an affiliate of the investment adviser, is the transfer, dividend disbursing and shareholder servicing agent for each class of the Fund. FIIOC receives account fees and asset-based fees that vary according to the account size and type of account of the shareholders of the respective classes of the Fund. FIIOC pays for typesetting, printing and mailing of shareholder reports, except proxy statements.
For the period, transfer agent fees for each class were as follows:
| Amount | % of Class-Level Average Net Assets(a) | |
| Class A | $35,754 | .27 |
| Class T | 10,433 | .38 |
| Class B | 973 | .31 |
| Class C | 16,540 | .27 |
| China Region | 1,190,656 | .22 |
| Class I | 19,578 | .20 |
| $1,273,934 |
(a) Annualized
Accounting and Security Lending Fees. Fidelity Service Company, Inc. (FSC), an affiliate of the investment adviser, maintains the Fund's accounting records. The accounting fee is based on the level of average net assets for each month. Under a separate contract, FSC administers the security lending program. The security lending fee is based on the number and duration of lending transactions.
Brokerage Commissions. The Fund placed a portion of its portfolio transactions with brokerage firms which are affiliates of the investment adviser. Brokerage commissions are included in net realized gain (loss) and change in net unrealized appreciation (depreciation) in the Statement of Operations. The commissions paid to these affiliated firms were $1,217 for the period.
Interfund Lending Program. Pursuant to an Exemptive Order issued by the SEC, the Fund, along with other registered investment companies having management contracts with FMR or other affiliated entities of FMR, may participate in an interfund lending program. This program provides an alternative credit facility allowing the funds to borrow from, or lend money to, other participating affiliated funds. At period end, there were no interfund loans outstanding. The Fund's activity in this program during the period for which loans were outstanding was as follows:
| Borrower or Lender | Average Loan Balance | Weighted Average Interest Rate | Interest Expense |
| Borrower | $7,322,000 | .65% | $133 |
Interfund Trades. The Fund may purchase from or sell securities to other Fidelity Funds under procedures adopted by the Board. The procedures have been designed to ensure these interfund trades are executed in accordance with Rule 17a-7 of the 1940 Act. Interfund trades are included within the respective purchases and sales amounts shown in the Purchases and Sales of Investments note.
6. Committed Line of Credit.
The Fund participates with other funds managed by the investment adviser or an affiliate in a $4.25 billion credit facility (the "line of credit") to be utilized for temporary or emergency purposes to fund shareholder redemptions or for other short-term liquidity purposes. The Fund has agreed to pay commitment fees on its pro-rata portion of the line of credit, which amounted to $1,030 and is reflected in Miscellaneous expenses on the Statement of Operations. During the period, the Fund did not borrow on this line of credit.
7. Security Lending.
The Fund lends portfolio securities through a lending agent from time to time in order to earn additional income. For equity securities, a lending agent is used and may loan securities to certain qualified borrowers, including Fidelity Capital Markets (FCM), a broker-dealer affiliated with the Fund. On the settlement date of the loan, the Fund receives collateral (in the form of U.S. Treasury obligations, letters of credit and/or cash) against the loaned securities and maintains collateral in an amount not less than 100% of the market value of the loaned securities during the period of the loan. The market value of the loaned securities is determined at the close of business of the Fund and any additional required collateral is delivered to the Fund on the next business day. The Fund or borrower may terminate the loan at any time, and if the borrower defaults on its obligation to return the securities loaned because of insolvency or other reasons, the Fund may apply collateral received from the borrower against the obligation. The Fund may experience delays and costs in recovering the securities loaned. Any cash collateral received is invested in the Fidelity Securities Lending Cash Central Fund. The value of loaned securities and cash collateral at period end are disclosed on the Fund's Statement of Assets and Liabilities. Security lending income represents the income earned on investing cash collateral, less rebates paid to borrowers and any lending agent fees associated with the loan, plus any premium payments received for lending certain types of securities. Security lending income is presented in the Statement of Operations as a component of income from Fidelity Central Funds, and includes $9,957 from securities loaned to FCM.
8. Expense Reductions.
Commissions paid to certain brokers with whom the investment adviser, or its affiliates, places trades on behalf of the Fund include an amount in addition to trade execution, which may be rebated back to the Fund to offset certain expenses. This amount totaled $781 for the period.
In addition, during the period the investment adviser reimbursed and/or waived a portion of fund-level operating expenses in the amount of $4,567.
9. Distributions to Shareholders.
Distributions to shareholders of each class were as follows:
| Six months ended April 30, 2016 | Year ended October 31, 2015 | |
| From net investment income | ||
| Class A | $297,014 | $147,088 |
| Class T | 28,522 | 22,529 |
| Class C | 29,301 | 12,652 |
| China Region | 14,431,516 | 12,728,622 |
| Class I | 317,144 | 204,043 |
| Total | $15,103,497 | $13,114,934 |
| From net realized gain | ||
| Class A | $3,946,989 | $2,783,517 |
| Class T | 763,704 | 789,251 |
| Class B | 93,006 | 149,794 |
| Class C | 1,752,229 | 1,276,956 |
| China Region | 150,087,760 | 165,004,911 |
| Class I | 3,187,427 | 2,409,293 |
| Total | $159,831,115 | $172,413,722 |
10. Share Transactions.
Share transactions for each class were as follows and may contain automatic conversions between classes or exchanges between affiliated funds:
| Shares | Shares | Dollars | Dollars | |
| Six months ended April 30, 2016 | Year ended October 31, 2015 | Six months ended April 30, 2016 | Year ended October 31, 2015 | |
| Class A | ||||
| Shares sold | 147,013 | 1,058,546 | $3,579,372 | $35,978,665 |
| Reinvestment of distributions | 162,605 | 93,297 | 4,157,811 | 2,812,898 |
| Shares redeemed | (425,054) | (671,056) | (9,695,535) | (22,101,227) |
| Net increase (decrease) | (115,436) | 480,787 | $(1,958,352) | $16,690,336 |
| Class T | ||||
| Shares sold | 25,114 | 151,664 | $590,683 | $5,390,399 |
| Reinvestment of distributions | 30,599 | 26,640 | 781,504 | 801,072 |
| Shares redeemed | (45,663) | (143,989) | (1,080,869) | (4,554,275) |
| Net increase (decrease) | 10,050 | 34,315 | $291,318 | $1,637,196 |
| Class B | ||||
| Shares sold | 28 | 2,771 | $647 | $95,500 |
| Reinvestment of distributions | 3,443 | 4,834 | 87,630 | 144,877 |
| Shares redeemed | (7,534) | (15,827) | (179,703) | (523,534) |
| Net increase (decrease) | (4,063) | (8,222) | $(91,426) | $(283,157) |
| Class C | ||||
| Shares sold | 69,272 | 412,366 | $1,686,759 | $14,420,908 |
| Reinvestment of distributions | 55,713 | 38,139 | 1,398,404 | 1,131,586 |
| Shares redeemed | (112,880) | (261,252) | (2,721,043) | (7,778,046) |
| Net increase (decrease) | 12,105 | 189,253 | $364,120 | $7,774,448 |
| China Region | ||||
| Shares sold | 2,127,375 | 18,091,274 | $51,586,381 | $635,141,274 |
| Reinvestment of distributions | 6,142,435 | 5,608,420 | 158,659,097 | 170,439,887 |
| Shares redeemed | (7,626,217) | (20,336,385) | (183,247,122) | (642,334,138) |
| Net increase (decrease) | 643,593 | 3,363,309 | $26,998,356 | $163,247,023 |
| Class I | ||||
| Shares sold | 193,468 | 1,017,162 | $5,004,992 | $33,130,120 |
| Reinvestment of distributions | 99,936 | 58,945 | 2,565,348 | 1,781,897 |
| Shares redeemed | (518,949) | (726,796) | (12,663,087) | (23,738,935) |
| Net increase (decrease) | (225,545) | 349,311 | $(5,092,747) | $11,173,082 |
11. Other.
The Fund's organizational documents provide former and current trustees and officers with a limited indemnification against liabilities arising in connection with the performance of their duties to the Fund. In the normal course of business, the Fund may also enter into contracts that provide general indemnifications. The Fund's maximum exposure under these arrangements is unknown as this would be dependent on future claims that may be made against the Fund. The risk of material loss from such claims is considered remote.
Shareholder Expense Example
As a shareholder of the Fund, you incur two types of costs: (1) transaction costs, including sales charges (loads) on purchase payments or redemption proceeds, redemption fees and (2) ongoing costs, including management fees, distribution and/or service (12b-1) fees and other Fund expenses. This Example is intended to help you understand your ongoing costs (in dollars) of investing in the Fund and to compare these costs with the ongoing costs of investing in other mutual funds.
The Example is based on an investment of $1,000 invested at the beginning of the period and held for the entire period (November 1, 2015 to April 30, 2016).
Actual Expenses
The first line of the accompanying table for each class of the Fund provides information about actual account values and actual expenses. You may use the information in this line, together with the amount you invested, to estimate the expenses that you paid over the period. Simply divide your account value by $1,000.00 (for example, an $8,600 account value divided by $1,000.00 = 8.6), then multiply the result by the number in the first line for a class of the Fund under the heading entitled "Expenses Paid During Period" to estimate the expenses you paid on your account during this period. A small balance maintenance fee of $12.00 that is charged once a year may apply for certain accounts with a value of less than $2,000. This fee is not included in the table below. If it was, the estimate of expenses you paid during the period would be higher, and your ending account value lower, by this amount. In addition, the Fund, as a shareholder in the underlying Fidelity Central Funds, will indirectly bear its pro-rata share of the fees and expenses incurred by the underlying Fidelity Central Funds. These fees and expenses are not included in the Fund's annualized expense ratio used to calculate the expense estimate in the table below.
Hypothetical Example for Comparison Purposes
The second line of the accompanying table for each class of the Fund provides information about hypothetical account values and hypothetical expenses based on a Class' actual expense ratio and an assumed rate of return of 5% per year before expenses, which is not the Class' actual return. The hypothetical account values and expenses may not be used to estimate the actual ending account balance or expenses you paid for the period. You may use this information to compare the ongoing costs of investing in the Fund and other funds. To do so, compare this 5% hypothetical example with the 5% hypothetical examples that appear in the shareholder reports of the other funds. A small balance maintenance fee of $12.00 that is charged once a year may apply for certain accounts with a value of less than $2,000. This fee is not included in the table below. If it was, the estimate of expenses you paid during the period would be higher, and your ending account value lower, by this amount. In addition, the Fund, as a shareholder in the underlying Fidelity Central Funds, will indirectly bear its pro-rata share of the fees and expenses incurred by the underlying Fidelity Central Funds. These fees and expenses are not included in the Fund's annualized expense ratio used to calculate the expense estimate in the table below.
Please note that the expenses shown in the table are meant to highlight your ongoing costs only and do not reflect any transaction costs. Therefore, the second line of the table is useful in comparing ongoing costs only, and will not help you determine the relative total costs of owning different funds. In addition, if these transactional costs were included, your costs would have been higher.
| Annualized Expense Ratio-A | Beginning Account Value November 1, 2015 | Ending Account Value April 30, 2016 | Expenses Paid During Period-B November 1, 2015 to April 30, 2016 | |
| Class A | 1.32% | |||
| Actual | $1,000.00 | $894.30 | $6.22 | |
| Hypothetical-C | $1,000.00 | $1,018.30 | $6.62 | |
| Class T | 1.68% | |||
| Actual | $1,000.00 | $892.50 | $7.91 | |
| Hypothetical-C | $1,000.00 | $1,016.51 | $8.42 | |
| Class B | 2.11% | |||
| Actual | $1,000.00 | $890.50 | $9.92 | |
| Hypothetical-C | $1,000.00 | $1,014.37 | $10.57 | |
| Class C | 2.08% | |||
| Actual | $1,000.00 | $891.00 | $9.78 | |
| Hypothetical-C | $1,000.00 | $1,014.52 | $10.42 | |
| China Region | 1.03% | |||
| Actual | $1,000.00 | $895.50 | $4.85 | |
| Hypothetical-C | $1,000.00 | $1,019.74 | $5.17 | |
| Class I | 1.00% | |||
| Actual | $1,000.00 | $895.70 | $4.71 | |
| Hypothetical-C | $1,000.00 | $1,019.89 | $5.02 |
A Annualized expense ratio reflects expenses net of applicable fee waivers.
B Expenses are equal to each Class' annualized expense ratio, multiplied by the average account value over the period, multiplied by 182/366 (to reflect the one-half year period).
C 5% return per year before expenses
![]()
AHKC-SANN-0616
1.861464.107
Fidelity Advisor® China Region Fund - Semi-Annual Report April 30, 2016 Class I is a class of Fidelity® China Region Fund |
|
Contents
To view a fund's proxy voting guidelines and proxy voting record for the 12-month period ended June 30, visit http://www.fidelity.com/proxyvotingresults or visit the Securities and Exchange Commission's (SEC) web site at http://www.sec.gov.
You may also call 1-877-208-0098 to request a free copy of the proxy voting guidelines.
Standard & Poor's, S&P and S&P 500 are registered service marks of The McGraw-Hill Companies, Inc. and have been licensed for use by Fidelity Distributors Corporation.
Other third-party marks appearing herein are the property of their respective owners.
All other marks appearing herein are registered or unregistered trademarks or service marks of FMR LLC or an affiliated company. © 2016 FMR LLC. All rights reserved.
This report and the financial statements contained herein are submitted for the general information of the shareholders of the Fund. This report is not authorized for distribution to prospective investors in the Fund unless preceded or accompanied by an effective prospectus.
A fund files its complete schedule of portfolio holdings with the SEC for the first and third quarters of each fiscal year on Form N-Q. Forms N-Q are available on the SEC’s web site at http://www.sec.gov. A fund's Forms N-Q may be reviewed and copied at the SEC’s Public Reference Room in Washington, DC. Information regarding the operation of the SEC's Public Reference Room may be obtained by calling 1-800-SEC-0330.
For a complete list of a fund's portfolio holdings, view the most recent holdings listing, semiannual report, or annual report on Fidelity's web site at http://www.fidelity.com, http://www.advisor.fidelity.com, or http://www.401k.com, as applicable.
NOT FDIC INSURED •MAY LOSE VALUE •NO BANK GUARANTEE
Neither the Fund nor Fidelity Distributors Corporation is a bank.
Investment Summary (Unaudited)
Geographic Diversification (% of fund's net assets)
| As of April 30, 2016 | ||
| China | 37.1% | |
| Cayman Islands | 26.7% | |
| Taiwan | 18.9% | |
| Hong Kong | 6.2% | |
| United Kingdom | 3.5% | |
| Bermuda | 3.3% | |
| Netherlands | 2.8% | |
| British Virgin Islands | 1.1% | |
| United States of America* | 0.4% | |

* Includes Short-Term investments and Net Other Assets (Liabilities).
Percentages are based on country or territory of incorporation and are adjusted for the effect of futures contracts, if applicable.
| As of October 31, 2015 | ||
| China | 49.0% | |
| Cayman Islands | 25.8% | |
| Hong Kong | 8.7% | |
| Bermuda | 5.0% | |
| Taiwan | 3.7% | |
| Netherlands | 3.0% | |
| United Kingdom | 1.7% | |
| Bailiwick of Jersey | 1.7% | |
| United States of America* | 1.4% | |

* Includes Short-Term investments and Net Other Assets (Liabilities).
Percentages are based on country or territory of incorporation and are adjusted for the effect of futures contracts, if applicable.
Asset Allocation as of April 30, 2016
| % of fund's net assets | % of fund's net assets 6 months ago | |
| Stocks | 99.6 | 98.6 |
| Short-Term Investments and Net Other Assets (Liabilities) | 0.4 | 1.4 |
Top Ten Stocks as of April 30, 2016
| % of fund's net assets | % of fund's net assets 6 months ago | |
| Tencent Holdings Ltd. (Internet Software & Services) | 7.9 | 6.0 |
| Taiwan Semiconductor Manufacturing Co. Ltd. (Semiconductors & Semiconductor Equipment) | 7.6 | 0.0 |
| Alibaba Group Holding Ltd. sponsored ADR (Internet Software & Services) | 2.7 | 0.6 |
| Ping An Insurance (Group) Co. of China Ltd. (H Shares) (Insurance) | 2.7 | 2.8 |
| China Construction Bank Corp. (H Shares) (Banks) | 2.6 | 4.9 |
| Kweichow Moutai Co. Ltd. (Beverages) | 2.4 | 1.4 |
| Industrial & Commercial Bank of China Ltd. (H Shares) (Banks) | 2.3 | 2.3 |
| Chongqing Changan Automobile Co. Ltd. (B Shares) (Automobiles) | 2.2 | 2.2 |
| BBMG Corp. (H Shares) (Construction Materials) | 2.1 | 1.8 |
| China Pacific Insurance (Group) Co. Ltd. (H Shares) (Insurance) | 2.0 | 2.3 |
| 34.5 |
Market Sectors as of April 30, 2016
| % of fund's net assets | % of fund's net assets 6 months ago | |
| Information Technology | 27.8 | 14.0 |
| Financials | 22.1 | 37.8 |
| Consumer Discretionary | 19.8 | 14.4 |
| Industrials | 9.8 | 12.9 |
| Materials | 5.6 | 6.7 |
| Telecommunication Services | 4.1 | 2.4 |
| Consumer Staples | 4.1 | 2.0 |
| Health Care | 3.3 | 5.5 |
| Utilities | 2.9 | 1.3 |
| Energy | 0.1 | 1.6 |
Market Sectors may include more than one industry category.
The Fund may invest up to 35% of its total assets in any industry that represents more than 20% of the Hong Kong, Taiwanese and Chinese markets. As of April 30, 2016, the Fund did not have more than 25% of its total assets invested in any one industry.
Percentages shown as 0.0% may reflect amounts less than 0.05%.
Investments April 30, 2016 (Unaudited)
Showing Percentage of Net Assets
| Common Stocks - 98.9% | |||
| Shares | Value | ||
| CONSUMER DISCRETIONARY - 19.1% | |||
| Auto Components - 0.8% | |||
| Weifu High-Technology Co. Ltd. (B Shares) | 4,257,836 | $9,002,116 | |
| Automobiles - 2.2% | |||
| Chongqing Changan Automobile Co. Ltd. (B Shares) | 13,112,941 | 22,686,340 | |
| Diversified Consumer Services - 1.4% | |||
| New Oriental Education & Technology Group, Inc. sponsored ADR | 297,200 | 11,638,352 | |
| TAL Education Group ADR (a) | 51,000 | 2,950,860 | |
| 14,589,212 | |||
| Hotels, Restaurants & Leisure - 3.2% | |||
| China CYTS Tours Holding Co. Ltd. | 887,536 | 2,725,375 | |
| China International Travel Service Corp. Ltd. (A Shares) | 753,281 | 5,121,899 | |
| Huangshan Tourism Development Co. Ltd. | 5,899,876 | 12,377,940 | |
| Shanghai Jin Jiang International Hotel Co. Ltd. (H Shares) | 13,520,000 | 5,550,538 | |
| Tuniu Corp. Class A sponsored ADR (a)(b) | 742,800 | 7,895,964 | |
| 33,671,716 | |||
| Household Durables - 4.2% | |||
| Haier Electronics Group Co. Ltd. | 5,492,000 | 9,223,978 | |
| Nien Made Enterprise Co. Ltd. | 800,000 | 6,290,437 | |
| Qingdao Haier Co. Ltd. | 3,099,822 | 3,988,464 | |
| Sundart Holdings Ltd. | 20,000,000 | 11,680,502 | |
| Techtronic Industries Co. Ltd. | 3,582,500 | 13,429,610 | |
| 44,612,991 | |||
| Internet & Catalog Retail - 2.3% | |||
| Ctrip.com International Ltd. ADR (a) | 286,000 | 12,472,460 | |
| Qunar Cayman Islands Ltd. sponsored ADR (a)(b) | 285,000 | 11,630,850 | |
| 24,103,310 | |||
| Media - 0.3% | |||
| Poly Culture Group Corp. Ltd. (H Shares) | 1,148,800 | 2,704,631 | |
| Multiline Retail - 0.0% | |||
| Lifestyle International Holdings Ltd. | 339,000 | 561,562 | |
| Specialty Retail - 1.7% | |||
| Chow Tai Fook Jewellery Group Ltd. | 16,335,200 | 11,354,113 | |
| Luk Fook Holdings International Ltd. | 2,830,000 | 6,445,257 | |
| 17,799,370 | |||
| Textiles, Apparel & Luxury Goods - 3.0% | |||
| Anta Sports Products Ltd. | 1,169,000 | 2,977,711 | |
| ECLAT Textile Co. Ltd. | 390,000 | 4,448,968 | |
| Lao Feng Xiang Co. Ltd. (B Shares) | 2,499,988 | 9,502,454 | |
| Pacific Textile Holdings Ltd. | 4,000,000 | 5,150,096 | |
| Shenzhou International Group Holdings Ltd. | 522,000 | 2,698,493 | |
| Toung Loong Textile Manufacturing Co. Ltd. | 2,375,000 | 6,315,590 | |
| 31,093,312 | |||
| TOTAL CONSUMER DISCRETIONARY | 200,824,560 | ||
| CONSUMER STAPLES - 4.1% | |||
| Beverages - 2.4% | |||
| Kweichow Moutai Co. Ltd. | 656,346 | 25,466,920 | |
| Food Products - 1.7% | |||
| China Modern Dairy Holdings Ltd. (b) | 34,000,000 | 6,240,081 | |
| Unified-President Enterprises Corp. | 6,240,000 | 11,242,547 | |
| 17,482,628 | |||
| TOTAL CONSUMER STAPLES | 42,949,548 | ||
| ENERGY - 0.1% | |||
| Energy Equipment & Services - 0.1% | |||
| China Oilfield Services Ltd. (H Shares) | 1,192,000 | 1,034,064 | |
| FINANCIALS - 22.1% | |||
| Banks - 7.7% | |||
| China Construction Bank Corp. (H Shares) | 43,894,000 | 27,878,267 | |
| Hangzhou Hikvision Digital Technology Co. Ltd. ELS (BNP Paribas Warrant Program) warrants 11/27/17 (a)(c) | 2,810,800 | 13,228,980 | |
| Industrial & Commercial Bank of China Ltd. (H Shares) | 44,543,000 | 23,848,363 | |
| Midea Group Co. Ltd. ELS (BNP Paribas Arbitrage Warrant Program) warrants 2/10/17 (a)(c) | 3,090,600 | 15,323,987 | |
| 80,279,597 | |||
| Capital Markets - 3.5% | |||
| Hangzhou Robam Appliances Co. Ltd. ELS (UBS Warrant Programme) warrants 1/15/18 (a)(c) | 512,858 | 4,075,740 | |
| Shanghai Bestway Marine Engineering Design Co. Ltd. ELS warrants 3/5/17 (a)(c) | 2,798,094 | 12,274,522 | |
| Shenzhen Airport Co. Ltd. ELS (UBS Warrant Programme) (A Shares) warrants 2/17/17 (a)(c) | 8,765,531 | 10,614,957 | |
| Wuliangye Yibin Co. Ltd. ELS (UBS Warrant Programme) warrants 3/7/19 (a)(c) | 1,071,282 | 4,699,440 | |
| Yunnan Baiyao Group Co. Ltd. ELS (UBS Warrant Programme) (A Shares) warrants 2/17/17 (a)(c) | 559,455 | 5,223,786 | |
| 36,888,445 | |||
| Insurance - 7.2% | |||
| AIA Group Ltd. | 3,432,400 | 20,541,562 | |
| China Pacific Insurance (Group) Co. Ltd. (H Shares) | 6,041,400 | 21,183,844 | |
| PICC Property & Casualty Co. Ltd. (H Shares) | 3,164,000 | 5,755,562 | |
| Ping An Insurance (Group) Co. of China Ltd. (H Shares) | 6,024,500 | 28,273,483 | |
| 75,754,451 | |||
| Real Estate Management & Development - 3.7% | |||
| Beijing Capital Land Ltd. (H Shares) | 35,170,000 | 13,865,732 | |
| Cheung Kong Property Holdings Ltd. | 2,848,000 | 19,450,390 | |
| Sun Hung Kai Properties Ltd. | 456,000 | 5,747,024 | |
| 39,063,146 | |||
| TOTAL FINANCIALS | 231,985,639 | ||
| HEALTH CARE - 3.3% | |||
| Health Care Providers & Services - 0.0% | |||
| China National Accord Medicines Corp. Ltd. | 24,173 | 132,319 | |
| Life Sciences Tools & Services - 1.0% | |||
| JHL Biotech, Inc. (a) | 3,976,696 | 10,753,317 | |
| Pharmaceuticals - 2.3% | |||
| Jiangsu Hengrui Medicine Co. Ltd. | 735,988 | 5,306,712 | |
| Lee's Pharmaceutical Holdings Ltd. | 8,273,500 | 6,694,421 | |
| Livzon Pharmaceutical Group, Inc. | 2,485,700 | 11,484,017 | |
| 23,485,150 | |||
| TOTAL HEALTH CARE | 34,370,786 | ||
| INDUSTRIALS - 9.8% | |||
| Air Freight & Logistics - 0.4% | |||
| Sinotrans Air Transportation Development Co. Ltd. (A Shares) | 1,599,830 | 4,541,960 | |
| Airlines - 3.0% | |||
| Air China Ltd. (H Shares) | 6,648,000 | 5,033,096 | |
| China Eastern Airlines Corp. Ltd. (H Shares) (a) | 26,446,000 | 14,458,119 | |
| China Southern Airlines Ltd. (H Shares) | 20,194,000 | 12,662,503 | |
| 32,153,718 | |||
| Construction & Engineering - 1.6% | |||
| Beijing Urban Consolidated & Development Group Ltd. (H Shares) | 20,963,000 | 12,108,422 | |
| China Energy Engineering Corp. Ltd. | 27,132,000 | 4,735,774 | |
| 16,844,196 | |||
| Electrical Equipment - 1.3% | |||
| Harbin Electric Machinery Co. Ltd.(H Shares) (b) | 21,974,000 | 8,993,794 | |
| Jiangnan Group Ltd. | 25,552,000 | 4,304,437 | |
| 13,298,231 | |||
| Machinery - 0.8% | |||
| Lonking Holdings Ltd. | 28,600,000 | 4,774,187 | |
| Sinotruk Hong Kong Ltd. | 8,000,000 | 4,028,249 | |
| 8,802,436 | |||
| Marine - 1.5% | |||
| China Shipping Development Co. Ltd. (H Shares) | 18,762,000 | 13,322,169 | |
| Sinotrans Shipping Ltd. (b) | 12,186,000 | 2,143,439 | |
| 15,465,608 | |||
| Trading Companies & Distributors - 1.0% | |||
| Summit Ascent Holdings Ltd. (a)(b) | 48,136,000 | 10,321,526 | |
| Transportation Infrastructure - 0.2% | |||
| Shanghai International Airport Co. Ltd. | 472,000 | 1,983,784 | |
| TOTAL INDUSTRIALS | 103,411,459 | ||
| INFORMATION TECHNOLOGY - 27.8% | |||
| Electronic Equipment & Components - 4.1% | |||
| Hon Hai Precision Industry Co. Ltd. (Foxconn) | 4,464,000 | 10,654,565 | |
| Largan Precision Co. Ltd. | 156,000 | 10,962,449 | |
| Sunny Optical Technology Group Co. Ltd. (b) | 2,700,000 | 8,327,490 | |
| Tongda Group Holdings Ltd. | 65,800,000 | 13,516,242 | |
| 43,460,746 | |||
| Internet Software & Services - 11.3% | |||
| 58.com, Inc. ADR (a) | 141,178 | 7,715,378 | |
| Alibaba Group Holding Ltd. sponsored ADR (a) | 370,900 | 28,537,046 | |
| Tencent Holdings Ltd. | 4,060,800 | 82,630,438 | |
| 118,882,862 | |||
| Semiconductors & Semiconductor Equipment - 10.1% | |||
| Advanced Semiconductor Engineering, Inc. | 13,995,000 | 13,445,636 | |
| Taiwan Semiconductor Manufacturing Co. Ltd. | 17,294,000 | 79,332,048 | |
| Vanguard International Semiconductor Corp. | 8,434,000 | 12,910,915 | |
| 105,688,599 | |||
| Software - 0.8% | |||
| China City Railway Transportation Technology Holdings Co. Ltd. (a) | 48,540,000 | 8,406,447 | |
| Technology Hardware, Storage & Peripherals - 1.5% | |||
| ADLINK Technology, Inc. | 3,682,844 | 7,593,023 | |
| Axiomtek Co. Ltd. | 2,000,000 | 4,272,049 | |
| HTC Corp. | 1,410,000 | 3,596,694 | |
| 15,461,766 | |||
| TOTAL INFORMATION TECHNOLOGY | 291,900,420 | ||
| MATERIALS - 5.6% | |||
| Construction Materials - 3.3% | |||
| BBMG Corp. (H Shares) | 30,808,000 | 22,515,344 | |
| China Shanshui Cement Group Ltd. (a)(b) | 20,656,000 | 9,200,458 | |
| TCC International Holdings Ltd. | 15,608,000 | 3,128,099 | |
| 34,843,901 | |||
| Metals & Mining - 2.3% | |||
| Fushan International Energy Group Ltd. | 2,778,000 | 417,665 | |
| Jiangxi Copper Co. Ltd. (H Shares) | 4,214,000 | 5,144,924 | |
| Zhaojin Mining Industry Co. Ltd. (H Shares) | 9,357,000 | 8,085,303 | |
| Zijin Mining Group Co. Ltd. (H Shares) | 31,580,000 | 10,535,752 | |
| 24,183,644 | |||
| TOTAL MATERIALS | 59,027,545 | ||
| TELECOMMUNICATION SERVICES - 4.1% | |||
| Diversified Telecommunication Services - 4.1% | |||
| China Telecom Corp. Ltd. (H Shares) | 13,024,000 | 6,447,744 | |
| China Unicom Ltd. | 13,784,000 | 16,131,254 | |
| Chunghwa Telecom Co. Ltd. | 4,980,000 | 16,804,012 | |
| CITIC 1616 Holdings Ltd. | 9,294,000 | 3,858,505 | |
| 43,241,515 | |||
| UTILITIES - 2.9% | |||
| Independent Power and Renewable Electricity Producers - 2.1% | |||
| Beijing Jingneng Clean Energy Co. Ltd. (H Shares) | 42,174,000 | 13,306,264 | |
| Huaneng Renewables Corp. Ltd. (H Shares) | 31,944,000 | 9,426,176 | |
| 22,732,440 | |||
| Water Utilities - 0.8% | |||
| Beijing Enterprises Water Group Ltd. | 13,838,000 | 8,253,479 | |
| TOTAL UTILITIES | 30,985,919 | ||
| TOTAL COMMON STOCKS | |||
| (Cost $1,082,335,076) | 1,039,731,455 | ||
| Nonconvertible Preferred Stocks - 0.7% | |||
| CONSUMER DISCRETIONARY - 0.7% | |||
| Internet & Catalog Retail - 0.7% | |||
| China Internet Plus Holdings Ltd. Series A-11 (d) | |||
| (Cost $6,268,244) | 1,983,088 | 7,656,108 | |
| Money Market Funds - 3.5% | |||
| Fidelity Cash Central Fund, 0.38% (e) | 5,975,098 | 5,975,098 | |
| Fidelity Securities Lending Cash Central Fund, 0.42% (e)(f) | 31,037,646 | 31,037,646 | |
| TOTAL MONEY MARKET FUNDS | |||
| (Cost $37,012,744) | 37,012,744 | ||
| TOTAL INVESTMENT PORTFOLIO - 103.1% | |||
| (Cost $1,125,616,064) | 1,084,400,307 | ||
| NET OTHER ASSETS (LIABILITIES) - (3.1)% | (32,970,981) | ||
| NET ASSETS - 100% | $1,051,429,326 |
Security Type Abbreviations
ELS – Equity-Linked Security
Legend
(a) Non-income producing
(b) Security or a portion of the security is on loan at period end.
(c) Security exempt from registration under Rule 144A of the Securities Act of 1933. These securities may be resold in transactions exempt from registration, normally to qualified institutional buyers. At the end of the period, the value of these securities amounted to $65,441,412 or 6.2% of net assets.
(d) Restricted securities - Investment in securities not registered under the Securities Act of 1933 (excluding 144A issues). At the end of the period, the value of restricted securities (excluding 144A issues) amounted to $7,656,108 or 0.7% of net assets.
(e) Affiliated fund that is generally available only to investment companies and other accounts managed by Fidelity Investments. The rate quoted is the annualized seven-day yield of the fund at period end. A complete unaudited listing of the fund's holdings as of its most recent quarter end is available upon request. In addition, each Fidelity Central Fund's financial statements are available on the SEC's website or upon request.
(f) Investment made with cash collateral received from securities on loan.
Additional information on each restricted holding is as follows:
| Security | Acquisition Date | Acquisition Cost |
| China Internet Plus Holdings Ltd. Series A-11 | 1/26/15 | $6,268,244 |
Affiliated Central Funds
Information regarding fiscal year to date income earned by the Fund from investments in Fidelity Central Funds is as follows:
| Fund | Income earned |
| Fidelity Cash Central Fund | $46,081 |
| Fidelity Securities Lending Cash Central Fund | 787,517 |
| Total | $833,598 |
Investment Valuation
The following is a summary of the inputs used, as of April 30, 2016, involving the Fund's assets and liabilities carried at fair value. The inputs or methodology used for valuing securities may not be an indication of the risk associated with investing in those securities. For more information on valuation inputs, and their aggregation into the levels used below, please refer to the Investment Valuation section in the accompanying Notes to Financial Statements.
| Valuation Inputs at Reporting Date: | ||||
| Description | Total | Level 1 | Level 2 | Level 3 |
| Investments in Securities: | ||||
| Equities: | ||||
| Consumer Discretionary | $208,480,668 | $129,048,069 | $71,776,491 | $7,656,108 |
| Consumer Staples | 42,949,548 | 36,709,467 | 6,240,081 | -- |
| Energy | 1,034,064 | -- | 1,034,064 | -- |
| Financials | 231,985,639 | -- | 231,985,639 | -- |
| Health Care | 34,370,786 | 16,192,348 | 18,178,438 | -- |
| Industrials | 103,411,459 | 6,525,744 | 96,885,715 | -- |
| Information Technology | 291,900,420 | 86,242,119 | 205,658,301 | -- |
| Materials | 59,027,545 | -- | 49,827,087 | 9,200,458 |
| Telecommunication Services | 43,241,515 | 16,804,012 | 26,437,503 | -- |
| Utilities | 30,985,919 | -- | 30,985,919 | -- |
| Money Market Funds | 37,012,744 | 37,012,744 | -- | -- |
| Total Investments in Securities: | $1,084,400,307 | $328,534,503 | $739,009,238 | $16,856,566 |
The following is a summary of transfers between Level 1 and Level 2 for the period ended April 30, 2016. Transfers are assumed to have occurred at the beginning of the period, and are primarily attributable to the valuation techniques used for foreign equity securities, as discussed in the accompanying Notes to Financial Statements:
| Transfers | Total |
| Level 1 to Level 2 | $0 |
| Level 2 to Level 1 | $86,068,185 |
The following is a reconciliation of Investments in Securities and Derivative Instruments for which Level 3 inputs were used in determining value:
| Investments in Securities: | |
| Equities - Consumer Discretionary | |
| Beginning Balance | $12,373,756 |
| Net Realized Gain (Loss) on Investment Securities | -- |
| Net Unrealized Gain (Loss) on Investment Securities | 1,388 |
| Cost of Purchases | -- |
| Proceeds of Sales | -- |
| Amortization/Accretion | -- |
| Transfers into Level 3 | -- |
| Transfers out of Level 3 | (4,719,036) |
| Ending Balance | $7,656,108 |
| The change in unrealized gain (loss) for the period attributable to Level 3 securities held at April 30, 2016 | $1,388 |
| Equities - Health Care | |
| Beginning Balance | $14,369,442 |
| Net Realized Gain (Loss) on Investment Securities | -- |
| Net Unrealized Gain (Loss) on Investment Securities | -- |
| Cost of Purchases | -- |
| Proceeds of Sales | -- |
| Amortization/Accretion | -- |
| Transfers into Level 3 | -- |
| Transfers out of Level 3 | (14,369,442) |
| Ending Balance | $-- |
| The change in unrealized gain (loss) for the period attributable to Level 3 securities held at April 30, 2016 | $-- |
| Equities - Industrials | |
| Beginning Balance | $15,897,809 |
| Net Realized Gain (Loss) on Investment Securities | -- |
| Net Unrealized Gain (Loss) on Investment Securities | -- |
| Cost of Purchases | -- |
| Proceeds of Sales | -- |
| Amortization/Accretion | -- |
| Transfers into Level 3 | -- |
| Transfers out of Level 3 | (15,897,809) |
| Ending Balance | $-- |
| The change in unrealized gain (loss) for the period attributable to Level 3 securities held at April 30, 2016 | $-- |
| Equities - Materials | |
| Beginning Balance | $14,440,021 |
| Net Realized Gain (Loss) on Investment Securities | -- |
| Net Unrealized Gain (Loss) on Investment Securities | (5,239,563) |
| Cost of Purchases | -- |
| Proceeds of Sales | -- |
| Amortization/Accretion | -- |
| Transfers into Level 3 | -- |
| Transfers out of Level 3 | -- |
| Ending Balance | $9,200,458 |
| The change in unrealized gain (loss) for the period attributable to Level 3 securities held at April 30, 2016 | $(5,239,563) |
The information used in the above reconciliations represents fiscal year to date activity for any Investments in Securities identified as using Level 3 inputs at either the beginning or the end of the current fiscal period. Transfers into Level 3 were attributable to a lack of observable market data resulting from decreases in market activity, decreases in liquidity, security restructurings or corporate actions. Transfers out of Level 3 were attributable to observable market data becoming available for those securities. Transfers in or out of Level 3 represent the beginning value of any Security or Instrument where a change in the pricing level occurred from the beginning to the end of the period. The cost of purchases and the proceeds of sales may include securities received or delivered through corporate actions or exchanges. Realized and unrealized gains (losses) disclosed in the reconciliations are included in Net Gain (Loss) on the Fund's Statement of Operations.
See accompanying notes which are an integral part of the financial statements.
Financial Statements
Statement of Assets and Liabilities
| April 30, 2016 (Unaudited) | ||
| Assets | ||
| Investment in securities, at value (including securities loaned of $29,468,457) — See accompanying schedule: Unaffiliated issuers (cost $1,088,603,320) | $1,047,387,563 | |
| Fidelity Central Funds (cost $37,012,744) | 37,012,744 | |
| Total Investments (cost $1,125,616,064) | $1,084,400,307 | |
| Receivable for investments sold | 2,260,855 | |
| Receivable for fund shares sold | 629,803 | |
| Dividends receivable | 8,617 | |
| Distributions receivable from Fidelity Central Funds | 130,378 | |
| Prepaid expenses | 1,007 | |
| Other receivables | 31,340 | |
| Total assets | 1,087,462,307 | |
| Liabilities | ||
| Payable for investments purchased | $25,401 | |
| Payable for fund shares redeemed | 3,982,214 | |
| Accrued management fee | 631,699 | |
| Distribution and service plan fees payable | 17,253 | |
| Other affiliated payables | 241,879 | |
| Other payables and accrued expenses | 96,889 | |
| Collateral on securities loaned, at value | 31,037,646 | |
| Total liabilities | 36,032,981 | |
| Net Assets | $1,051,429,326 | |
| Net Assets consist of: | ||
| Paid in capital | $1,281,182,139 | |
| Accumulated net investment loss | (4,948,592) | |
| Accumulated undistributed net realized gain (loss) on investments and foreign currency transactions | (183,588,248) | |
| Net unrealized appreciation (depreciation) on investments and assets and liabilities in foreign currencies | (41,215,973) | |
| Net Assets | $1,051,429,326 | |
| Calculation of Maximum Offering Price | ||
| Class A: | ||
| Net Asset Value and redemption price per share ($22,818,837 ÷ 1,000,986 shares) | $22.80 | |
| Maximum offering price per share (100/94.25 of $22.80) | $24.19 | |
| Class T: | ||
| Net Asset Value and redemption price per share ($5,221,259 ÷ 229,672 shares) | $22.73 | |
| Maximum offering price per share (100/96.50 of $22.73) | $23.55 | |
| Class B: | ||
| Net Asset Value and offering price per share ($535,037 ÷ 23,668 shares)(a) | $22.61 | |
| Class C: | ||
| Net Asset Value and offering price per share ($11,435,356 ÷ 512,571 shares)(a) | $22.31 | |
| China Region: | ||
| Net Asset Value, offering price and redemption price per share ($995,658,703 ÷ 43,200,582 shares) | $23.05 | |
| Class I: | ||
| Net Asset Value, offering price and redemption price per share ($15,760,134 ÷ 687,981 shares) | $22.91 |
(a) Redemption price per share is equal to net asset value less any applicable contingent deferred sales charge.
See accompanying notes which are an integral part of the financial statements.
Statement of Operations
| Six months ended April 30, 2016 (Unaudited) | ||
| Investment Income | ||
| Dividends | $289,863 | |
| Income from Fidelity Central Funds (including $787,517 from security lending) | 833,598 | |
| Total income | 1,123,461 | |
| Expenses | ||
| Management fee | $3,992,712 | |
| Transfer agent fees | 1,273,934 | |
| Distribution and service plan fees | 110,852 | |
| Accounting and security lending fees | 269,796 | |
| Custodian fees and expenses | 188,324 | |
| Independent trustees' compensation | 2,600 | |
| Registration fees | 81,227 | |
| Audit | 57,221 | |
| Legal | 1,907 | |
| Interest | 133 | |
| Miscellaneous | 4,958 | |
| Total expenses before reductions | 5,983,664 | |
| Expense reductions | (5,348) | 5,978,316 |
| Net investment income (loss) | (4,854,855) | |
| Realized and Unrealized Gain (Loss) | ||
| Net realized gain (loss) on: | ||
| Investment securities: | ||
| Unaffiliated issuers | (180,006,367) | |
| Foreign currency transactions | 268,756 | |
| Total net realized gain (loss) | (179,737,611) | |
| Change in net unrealized appreciation (depreciation) on: Investment securities | 46,758,426 | |
| Assets and liabilities in foreign currencies | (118) | |
| Total change in net unrealized appreciation (depreciation) | 46,758,308 | |
| Net gain (loss) | (132,979,303) | |
| Net increase (decrease) in net assets resulting from operations | $(137,834,158) |
See accompanying notes which are an integral part of the financial statements.
Statement of Changes in Net Assets
| Six months ended April 30, 2016 (Unaudited) | Year ended October 31, 2015 | |
| Increase (Decrease) in Net Assets | ||
| Operations | ||
| Net investment income (loss) | $(4,854,855) | $23,670,929 |
| Net realized gain (loss) | (179,737,611) | 235,474,014 |
| Change in net unrealized appreciation (depreciation) | 46,758,308 | (344,541,210) |
| Net increase (decrease) in net assets resulting from operations | (137,834,158) | (85,396,267) |
| Distributions to shareholders from net investment income | (15,103,497) | (13,114,934) |
| Distributions to shareholders from net realized gain | (159,831,115) | (172,413,722) |
| Total distributions | (174,934,612) | (185,528,656) |
| Share transactions - net increase (decrease) | 20,511,269 | 200,238,928 |
| Redemption fees | 123,475 | 2,391,591 |
| Total increase (decrease) in net assets | (292,134,026) | (68,294,404) |
| Net Assets | ||
| Beginning of period | 1,343,563,352 | 1,411,857,756 |
| End of period (including accumulated net investment loss of $4,948,592 and undistributed net investment income of $15,009,760, respectively) | $1,051,429,326 | $1,343,563,352 |
See accompanying notes which are an integral part of the financial statements.
Financial Highlights — Fidelity China Region Fund Class A
| Six months ended (Unaudited) April 30, | Years ended October 31, | |||||
| 2016 | 2015 | 2014 | 2013 | 2012 | 2011 | |
| Selected Per–Share Data | ||||||
| Net asset value, beginning of period | $29.34 | $34.18 | $35.56 | $28.53 | $27.28 | $31.61 |
| Income from Investment Operations | ||||||
| Net investment income (loss)A | (.14) | .40B | .21 | .30 | .36 | .33 |
| Net realized and unrealized gain (loss) | (2.54) | (.83) | 2.01C | 7.06 | 1.42 | (4.33) |
| Total from investment operations | (2.68) | (.43) | 2.22 | 7.36 | 1.78 | (4.00) |
| Distributions from net investment income | (.27) | (.22) | (.30) | (.34) | (.19) | (.31) |
| Distributions from net realized gain | (3.59) | (4.24) | (3.31) | – | (.34) | (.03) |
| Total distributions | (3.86) | (4.46) | (3.61) | (.34) | (.53) | (.34) |
| Redemption fees added to paid in capitalA | –D | .05 | .01 | .01 | –D | .01 |
| Net asset value, end of period | $22.80 | $29.34 | $34.18 | $35.56 | $28.53 | $27.28 |
| Total ReturnE,F,G | (10.57)% | (1.45)% | 6.45%C | 26.07% | 6.70% | (12.79)% |
| Ratios to Average Net AssetsH,I | ||||||
| Expenses before reductions | 1.33%J | 1.28% | 1.35% | 1.35% | 1.36% | 1.37% |
| Expenses net of fee waivers, if any | 1.32%J | 1.28% | 1.35% | 1.35% | 1.36% | 1.37% |
| Expenses net of all reductions | 1.32%J | 1.26% | 1.35% | 1.31% | 1.29% | 1.31% |
| Net investment income (loss) | (1.13)%J | 1.26%B | .64% | .94% | 1.35% | 1.07% |
| Supplemental Data | ||||||
| Net assets, end of period (000 omitted) | $22,819 | $32,761 | $21,728 | $20,623 | $13,539 | $14,808 |
| Portfolio turnover rateK | 80%J | 151% | 87% | 92% | 107% | 87% |
A Calculated based on average shares outstanding during the period.
B Net Investment income per share reflects a large, non-recurring dividend which amounted to $.13 per share. Excluding this non-recurring dividend, the ratio of net investment income (loss) to average net assets would have been .85%.
C Amount includes a reimbursement from the adviser for an operations error which amounted to $.01 per share. Excluding this reimbursement, the total return would have been 6.42%.
D Amount represents less than $.005 per share.
E Total returns for periods of less than one year are not annualized.
F Total returns would have been lower if certain expenses had not been reduced during the applicable periods shown.
G Total returns do not include the effect of the sales charges.
H Fees and expenses of any underlying Fidelity Central Funds are not included in the Fund's expense ratio. The Fund indirectly bears its proportionate share of the expenses of any underlying Fidelity Central Funds.
I Expense ratios reflect operating expenses of the class. Expenses before reductions do not reflect amounts reimbursed by the investment adviser or reductions from brokerage service arrangements or reductions from other expense offset arrangements and do not represent the amount paid by the class during periods when reimbursements or reductions occur. Expenses net of fee waivers reflect expenses after reimbursement by the investment adviser but prior to reductions from brokerage service arrangements or other expense offset arrangements. Expenses net of all reductions represent the net expenses paid by the class.
J Annualized
K Amount does not include the portfolio activity of any underlying Fidelity Central Funds.
See accompanying notes which are an integral part of the financial statements.
Financial Highlights — Fidelity China Region Fund Class T
| Six months ended (Unaudited) April 30, | Years ended October 31, | |||||
| 2016 | 2015 | 2014 | 2013 | 2012 | 2011 | |
| Selected Per–Share Data | ||||||
| Net asset value, beginning of period | $29.18 | $34.02 | $35.40 | $28.40 | $27.13 | $31.48 |
| Income from Investment Operations | ||||||
| Net investment income (loss)A | (.18) | .30B | .12 | .21 | .29 | .25 |
| Net realized and unrealized gain (loss) | (2.55) | (.83) | 1.99C | 7.04 | 1.40 | (4.32) |
| Total from investment operations | (2.73) | (.53) | 2.11 | 7.25 | 1.69 | (4.07) |
| Distributions from net investment income | (.13) | (.12) | (.19) | (.26) | (.08) | (.27) |
| Distributions from net realized gain | (3.59) | (4.24) | (3.31) | – | (.34) | (.03) |
| Total distributions | (3.72) | (4.36) | (3.50) | (.26) | (.42) | (.29)D |
| Redemption fees added to paid in capitalA | –E | .05 | .01 | .01 | –E | .01 |
| Net asset value, end of period | $22.73 | $29.18 | $34.02 | $35.40 | $28.40 | $27.13 |
| Total ReturnF,G,H | (10.75)% | (1.79)% | 6.15%C | 25.74% | 6.38% | (13.04)% |
| Ratios to Average Net AssetsI,J | ||||||
| Expenses before reductions | 1.68%K | 1.62% | 1.65% | 1.64% | 1.64% | 1.63% |
| Expenses net of fee waivers, if any | 1.68%K | 1.62% | 1.65% | 1.64% | 1.64% | 1.63% |
| Expenses net of all reductions | 1.68%K | 1.60% | 1.65% | 1.60% | 1.57% | 1.57% |
| Net investment income (loss) | (1.48)%K | .92%B | .35% | .65% | 1.06% | .81% |
| Supplemental Data | ||||||
| Net assets, end of period (000 omitted) | $5,221 | $6,409 | $6,305 | $5,965 | $4,349 | $5,281 |
| Portfolio turnover rateL | 80%K | 151% | 87% | 92% | 107% | 87% |
A Calculated based on average shares outstanding during the period.
B Net Investment income per share reflects a large, non-recurring dividend which amounted to $.13 per share. Excluding this non-recurring dividend, the ratio of net investment income (loss) to average net assets would have been .51%.
C Amount includes a reimbursement from the adviser for an operations error which amounted to $.01 per share. Excluding this reimbursement, the total return would have been 6.12%.
D Total distributions of $.29 per share is comprised of distributions from net investment income of $.268 and distributions from net realized gain of $.025 per share.
E Amount represents less than $.005 per share.
F Total returns for periods of less than one year are not annualized.
G Total returns would have been lower if certain expenses had not been reduced during the applicable periods shown.
H Total returns do not include the effect of the sales charges.
I Fees and expenses of any underlying Fidelity Central Funds are not included in the Fund's expense ratio. The Fund indirectly bears its proportionate share of the expenses of any underlying Fidelity Central Funds.
J Expense ratios reflect operating expenses of the class. Expenses before reductions do not reflect amounts reimbursed by the investment adviser or reductions from brokerage service arrangements or reductions from other expense offset arrangements and do not represent the amount paid by the class during periods when reimbursements or reductions occur. Expenses net of fee waivers reflect expenses after reimbursement by the investment adviser but prior to reductions from brokerage service arrangements or other expense offset arrangements. Expenses net of all reductions represent the net expenses paid by the class.
K Annualized
L Amount does not include the portfolio activity of any underlying Fidelity Central Funds.
See accompanying notes which are an integral part of the financial statements.
Financial Highlights — Fidelity China Region Fund Class B
| Six months ended (Unaudited) April 30, | Years ended October 31, | |||||
| 2016 | 2015 | 2014 | 2013 | 2012 | 2011 | |
| Selected Per–Share Data | ||||||
| Net asset value, beginning of period | $28.97 | $33.79 | $35.12 | $28.16 | $26.94 | $31.23 |
| Income from Investment Operations | ||||||
| Net investment income (loss)A | (.23) | .14B | (.04) | .06 | .16 | .10 |
| Net realized and unrealized gain (loss) | (2.54) | (.80) | 1.99C | 6.99 | 1.40 | (4.29) |
| Total from investment operations | (2.77) | (.66) | 1.95 | 7.05 | 1.56 | (4.19) |
| Distributions from net investment income | – | – | – | (.10) | – | (.08) |
| Distributions from net realized gain | (3.59) | (4.21) | (3.29) | – | (.34) | (.03) |
| Total distributions | (3.59) | (4.21) | (3.29) | (.10) | (.34) | (.11) |
| Redemption fees added to paid in capitalA | –D | .05 | .01 | .01 | –D | .01 |
| Net asset value, end of period | $22.61 | $28.97 | $33.79 | $35.12 | $28.16 | $26.94 |
| Total ReturnE,F,G | (10.95)% | (2.23)% | 5.68%C | 25.12% | 5.90% | (13.45)% |
| Ratios to Average Net AssetsH,I | ||||||
| Expenses before reductions | 2.11%J | 2.10% | 2.11% | 2.10% | 2.11% | 2.12% |
| Expenses net of fee waivers, if any | 2.11%J | 2.10% | 2.11% | 2.10% | 2.11% | 2.12% |
| Expenses net of all reductions | 2.11%J | 2.07% | 2.11% | 2.07% | 2.04% | 2.06% |
| Net investment income (loss) | (1.91)%J | .44%B | (.12)% | .19% | .59% | .32% |
| Supplemental Data | ||||||
| Net assets, end of period (000 omitted) | $535 | $803 | $1,215 | $1,494 | $1,533 | $1,801 |
| Portfolio turnover rateK | 80%J | 151% | 87% | 92% | 107% | 87% |
A Calculated based on average shares outstanding during the period.
B Net Investment income per share reflects a large, non-recurring dividend which amounted to $.13 per share. Excluding this non-recurring dividend, the ratio of net investment income (loss) to average net assets would have been .04%.
C Amount includes a reimbursement from the adviser for an operations error which amounted to $.01 per share. Excluding this reimbursement, the total return would have been 5.65%.
D Amount represents less than $.005 per share.
E Total returns for periods of less than one year are not annualized.
F Total returns would have been lower if certain expenses had not been reduced during the applicable periods shown.
G Total returns do not include the effect of the contingent deferred sales charge.
H Fees and expenses of any underlying Fidelity Central Funds are not included in the Fund's expense ratio. The Fund indirectly bears its proportionate share of the expenses of any underlying Fidelity Central Funds.
I Expense ratios reflect operating expenses of the class. Expenses before reductions do not reflect amounts reimbursed by the investment adviser or reductions from brokerage service arrangements or reductions from other expense offset arrangements and do not represent the amount paid by the class during periods when reimbursements or reductions occur. Expenses net of fee waivers reflect expenses after reimbursement by the investment adviser but prior to reductions from brokerage service arrangements or other expense offset arrangements. Expenses net of all reductions represent the net expenses paid by the class.
J Annualized
K Amount does not include the portfolio activity of any underlying Fidelity Central Funds.
See accompanying notes which are an integral part of the financial statements.
Financial Highlights — Fidelity China Region Fund Class C
| Six months ended (Unaudited) April 30, | Years ended October 31, | |||||
| 2016 | 2015 | 2014 | 2013 | 2012 | 2011 | |
| Selected Per–Share Data | ||||||
| Net asset value, beginning of period | $28.68 | $33.56 | $34.99 | $28.07 | $26.86 | $31.19 |
| Income from Investment Operations | ||||||
| Net investment income (loss)A | (.22) | .15B | (.02) | .06 | .16 | .10 |
| Net realized and unrealized gain (loss) | (2.50) | (.80) | 1.97C | 6.97 | 1.39 | (4.28) |
| Total from investment operations | (2.72) | (.65) | 1.95 | 7.03 | 1.55 | (4.18) |
| Distributions from net investment income | (.06) | (.04) | (.08) | (.12) | – | (.13) |
| Distributions from net realized gain | (3.59) | (4.24) | (3.31) | – | (.34) | (.03) |
| Total distributions | (3.65) | (4.28) | (3.39) | (.12) | (.34) | (.16) |
| Redemption fees added to paid in capitalA | –D | .05 | .01 | .01 | –D | .01 |
| Net asset value, end of period | $22.31 | $28.68 | $33.56 | $34.99 | $28.07 | $26.86 |
| Total ReturnE,F,G | (10.90)% | (2.21)% | 5.71%C | 25.14% | 5.88% | (13.46)% |
| Ratios to Average Net AssetsH,I | ||||||
| Expenses before reductions | 2.08%J | 2.05% | 2.07% | 2.10% | 2.11% | 2.12% |
| Expenses net of fee waivers, if any | 2.08%J | 2.05% | 2.07% | 2.10% | 2.11% | 2.12% |
| Expenses net of all reductions | 2.08%J | 2.02% | 2.07% | 2.07% | 2.04% | 2.06% |
| Net investment income (loss) | (1.88)%J | .49%B | (.07)% | .19% | .59% | .32% |
| Supplemental Data | ||||||
| Net assets, end of period (000 omitted) | $11,435 | $14,355 | $10,445 | $6,957 | $4,515 | $5,230 |
| Portfolio turnover rateK | 80%J | 151% | 87% | 92% | 107% | 87% |
A Calculated based on average shares outstanding during the period.
B Net Investment income per share reflects a large, non-recurring dividend which amounted to $.13 per share. Excluding this non-recurring dividend, the ratio of net investment income (loss) to average net assets would have been .09%.
C Amount includes a reimbursement from the adviser for an operations error which amounted to $.01 per share. Excluding this reimbursement, the total return would have been 5.68%.
D Amount represents less than $.005 per share.
E Total returns for periods of less than one year are not annualized.
F Total returns would have been lower if certain expenses had not been reduced during the applicable periods shown.
G Total returns do not include the effect of the contingent deferred sales charge.
H Fees and expenses of any underlying Fidelity Central Funds are not included in the Fund's expense ratio. The Fund indirectly bears its proportionate share of the expenses of any underlying Fidelity Central Funds.
I Expense ratios reflect operating expenses of the class. Expenses before reductions do not reflect amounts reimbursed by the investment adviser or reductions from brokerage service arrangements or reductions from other expense offset arrangements and do not represent the amount paid by the class during periods when reimbursements or reductions occur. Expenses net of fee waivers reflect expenses after reimbursement by the investment adviser but prior to reductions from brokerage service arrangements or other expense offset arrangements. Expenses net of all reductions represent the net expenses paid by the class.
J Annualized
K Amount does not include the portfolio activity of any underlying Fidelity Central Funds.
See accompanying notes which are an integral part of the financial statements.
Financial Highlights — Fidelity China Region Fund
| Six months ended (Unaudited) April 30, | Years ended October 31, | |||||
| 2016 | 2015 | 2014 | 2013 | 2012 | 2011 | |
| Selected Per–Share Data | ||||||
| Net asset value, beginning of period | $29.66 | $34.51 | $35.83 | $28.73 | $27.49 | $31.81 |
| Income from Investment Operations | ||||||
| Net investment income (loss)A | (.10) | .51B | .33 | .41 | .45 | .44 |
| Net realized and unrealized gain (loss) | (2.58) | (.84) | 2.03C | 7.11 | 1.42 | (4.37) |
| Total from investment operations | (2.68) | (.33) | 2.36 | 7.52 | 1.87 | (3.93) |
| Distributions from net investment income | (.35) | (.33) | (.38) | (.43) | (.29) | (.38) |
| Distributions from net realized gain | (3.59) | (4.24) | (3.31) | – | (.34) | (.03) |
| Total distributions | (3.93)D | (4.57) | (3.69) | (.43) | (.63) | (.40)E |
| Redemption fees added to paid in capitalA | –F | .05 | .01 | .01 | –F | .01 |
| Net asset value, end of period | $23.05 | $29.66 | $34.51 | $35.83 | $28.73 | $27.49 |
| Total ReturnG,H | (10.45)% | (1.14)% | 6.83%C | 26.51% | 7.01% | (12.52)% |
| Ratios to Average Net AssetsI,J | ||||||
| Expenses before reductions | 1.03%K | .99% | 1.01% | 1.02% | 1.04% | 1.04% |
| Expenses net of fee waivers, if any | 1.03%K | .98% | 1.01% | 1.02% | 1.04% | 1.04% |
| Expenses net of all reductions | 1.02%K | .96% | 1.01% | .98% | .98% | .98% |
| Net investment income (loss) | (.83)%K | 1.55%B | .99% | 1.27% | 1.66% | 1.40% |
| Supplemental Data | ||||||
| Net assets, end of period (000 omitted) | $995,659 | $1,262,274 | $1,352,761 | $1,425,828 | $1,265,488 | $1,515,084 |
| Portfolio turnover rateL | 80%K | 151% | 87% | 92% | 107% | 87% |
A Calculated based on average shares outstanding during the period.
B Net Investment income per share reflects a large, non-recurring dividend which amounted to $.13 per share. Excluding this non-recurring dividend, the ratio of net investment income (loss) to average net assets would have been 1.15%.
C Amount includes a reimbursement from the adviser for an operations error which amounted to $.01 per share. Excluding this reimbursement, the total return would have been 6.80%.
D Total distributions of $3.93 per share is comprised of distributions from net investment income of $.345 and distributions from net realized gain of $3.588 per share.
E Total distributions of $.40 per share is comprised of distributions from net investment income of $.376 and distributions from net realized gain of $.025 per share.
F Amount represents less than $.005 per share.
G Total returns for periods of less than one year are not annualized.
H Total returns would have been lower if certain expenses had not been reduced during the applicable periods shown.
I Fees and expenses of any underlying Fidelity Central Funds are not included in the Fund's expense ratio. The Fund indirectly bears its proportionate share of the expenses of any underlying Fidelity Central Funds.
J Expense ratios reflect operating expenses of the class. Expenses before reductions do not reflect amounts reimbursed by the investment adviser or reductions from brokerage service arrangements or reductions from other expense offset arrangements and do not represent the amount paid by the class during periods when reimbursements or reductions occur. Expenses net of fee waivers reflect expenses after reimbursement by the investment adviser but prior to reductions from brokerage service arrangements or other expense offset arrangements. Expenses net of all reductions represent the net expenses paid by the class.
K Annualized
L Amount does not include the portfolio activity of any underlying Fidelity Central Funds.
See accompanying notes which are an integral part of the financial statements.
Financial Highlights — Fidelity China Region Fund Class I
| Six months ended (Unaudited) April 30, | Years ended October 31, | |||||
| 2016 | 2015 | 2014 | 2013 | 2012 | 2011 | |
| Selected Per–Share Data | ||||||
| Net asset value, beginning of period | $29.51 | $34.39 | $35.75 | $28.68 | $27.46 | $31.79 |
| Income from Investment Operations | ||||||
| Net investment income (loss)A | (.10) | .51B | .34 | .42 | .45 | .43 |
| Net realized and unrealized gain (loss) | (2.55) | (.84) | 2.02C | 7.10 | 1.42 | (4.37) |
| Total from investment operations | (2.65) | (.33) | 2.36 | 7.52 | 1.87 | (3.94) |
| Distributions from net investment income | (.36) | (.36) | (.43) | (.46) | (.31) | (.37) |
| Distributions from net realized gain | (3.59) | (4.24) | (3.31) | – | (.34) | (.03) |
| Total distributions | (3.95) | (4.60) | (3.73)D | (.46) | (.65) | (.40) |
| Redemption fees added to paid in capitalA | –E | .05 | .01 | .01 | –E | .01 |
| Net asset value, end of period | $22.91 | $29.51 | $34.39 | $35.75 | $28.68 | $27.46 |
| Total ReturnF,G | (10.43)% | (1.14)% | 6.87%C | 26.58% | 7.02% | (12.56)% |
| Ratios to Average Net AssetsH,I | ||||||
| Expenses before reductions | 1.00%J | .97% | .98% | .97% | 1.04% | 1.06% |
| Expenses net of fee waivers, if any | 1.00%J | .97% | .98% | .97% | 1.04% | 1.06% |
| Expenses net of all reductions | 1.00%J | .95% | .98% | .93% | .98% | 1.01% |
| Net investment income (loss) | (.80)%J | 1.57%B | 1.01% | 1.32% | 1.66% | 1.38% |
| Supplemental Data | ||||||
| Net assets, end of period (000 omitted) | $15,760 | $26,961 | $19,404 | $10,206 | $1,958 | $2,034 |
| Portfolio turnover rateK | 80%J | 151% | 87% | 92% | 107% | 87% |
A Calculated based on average shares outstanding during the period.
B Net Investment income per share reflects a large, non-recurring dividend which amounted to $.13 per share. Excluding this non-recurring dividend, the ratio of net investment income (loss) to average net assets would have been 1.16%.
C Amount includes a reimbursement from the adviser for an operations error which amounted to $.01 per share. Excluding this reimbursement, the total return would have been 6.84%.
D Total distributions of $3.73 per share is comprised of distributions from net investment income of $.425 and distributions from net realized gain of $3.306 per share.
E Amount represents less than $.005 per share.
F Total returns for periods of less than one year are not annualized.
G Total returns would have been lower if certain expenses had not been reduced during the applicable periods shown.
H Fees and expenses of any underlying Fidelity Central Funds are not included in the Fund's expense ratio. The Fund indirectly bears its proportionate share of the expenses of any underlying Fidelity Central Funds.
I Expense ratios reflect operating expenses of the class. Expenses before reductions do not reflect amounts reimbursed by the investment adviser or reductions from brokerage service arrangements or reductions from other expense offset arrangements and do not represent the amount paid by the class during periods when reimbursements or reductions occur. Expenses net of fee waivers reflect expenses after reimbursement by the investment adviser but prior to reductions from brokerage service arrangements or other expense offset arrangements. Expenses net of all reductions represent the net expenses paid by the class.
J Annualized
K Amount does not include the portfolio activity of any underlying Fidelity Central Funds.
See accompanying notes which are an integral part of the financial statements.
Notes to Financial Statements (Unaudited)
For the period ended April 30, 2016
1. Organization.
Fidelity China Region Fund (the Fund) is a fund of Fidelity Investment Trust (the Trust) and is authorized to issue an unlimited number of shares. The Trust is registered under the Investment Company Act of 1940, as amended (the 1940 Act), as an open-end management investment company organized as a Massachusetts business trust. The Fund offers Class A, Class T, Class C, China Region and Class I shares, each of which, along with Class B shares, has equal rights as to assets and voting privileges. Class B shares are closed to new accounts and additional purchases, except for exchanges and reinvestments. Each class has exclusive voting rights with respect to matters that affect that class. Class B shares will automatically convert to Class A shares after a maximum holding period of seven years from the initial date of purchase. The Fund's investments in emerging markets can be subject to social, economic, regulatory, and political uncertainties and can be extremely volatile.
During the period, the Board of Trustees approved the conversion of all existing Class B shares into Class A shares, effective on or about July 1, 2016, regardless of the length of times shares have been held.
2. Investments in Fidelity Central Funds.
The Fund invests in Fidelity Central Funds, which are open-end investment companies generally available only to other investment companies and accounts managed by the investment adviser and its affiliates. The Fund's Schedule of Investments lists each of the Fidelity Central Funds held as of period end, if any, as an investment of the Fund, but does not include the underlying holdings of each Fidelity Central Fund. As an Investing Fund, the Fund indirectly bears its proportionate share of the expenses of the underlying Fidelity Central Funds.
The Money Market Central Funds seek preservation of capital and current income and are managed by Fidelity Investments Money Management, Inc. (FIMM), an affiliate of the investment adviser. Annualized expenses of the Money Market Central Funds as of their most recent shareholder report date are less than .005%.
A complete unaudited list of holdings for each Fidelity Central Fund is available upon request or at the Securities and Exchange Commission (the SEC) website at www.sec.gov. In addition, the financial statements of the Fidelity Central Funds are available on the SEC website or upon request.
3. Significant Accounting Policies.
The financial statements have been prepared in conformity with accounting principles generally accepted in the United States of America (GAAP), which require management to make certain estimates and assumptions at the date of the financial statements. Actual results could differ from those estimates. Subsequent events, if any, through the date that the financial statements were issued have been evaluated in the preparation of the financial statements. The following summarizes the significant accounting policies of the Fund:
Investment Valuation. Investments are valued as of 4:00 p.m. Eastern time on the last calendar day of the period. The Board of Trustees (the Board) has delegated the day to day responsibility for the valuation of the Fund's investments to the Fidelity Management & Research Company (FMR) Fair Value Committee (the Committee). In accordance with valuation policies and procedures approved by the Board, the Fund attempts to obtain prices from one or more third party pricing vendors or brokers to value its investments. When current market prices, quotations or currency exchange rates are not readily available or reliable, investments will be fair valued in good faith by the Committee, in accordance with procedures adopted by the Board. Factors used in determining fair value vary by investment type and may include market or investment specific events. The frequency with which these procedures are used cannot be predicted and they may be utilized to a significant extent. The Committee oversees the Fund's valuation policies and procedures and reports to the Board on the Committee's activities and fair value determinations. The Board monitors the appropriateness of the procedures used in valuing the Fund's investments and ratifies the fair value determinations of the Committee.
The Fund categorizes the inputs to valuation techniques used to value its investments into a disclosure hierarchy consisting of three levels as shown below:
- Level 1 – quoted prices in active markets for identical investments
- Level 2 – other significant observable inputs (including quoted prices for similar investments, interest rates, prepayment speeds, etc.)
- Level 3 – unobservable inputs (including the Fund's own assumptions based on the best information available)
Valuation techniques used to value the Fund's investments by major category are as follows:
Equity securities, including restricted securities, for which market quotations are readily available, are valued at the last reported sale price or official closing price as reported by a third party pricing vendor on the primary market or exchange on which they are traded and are categorized as Level 1 in the hierarchy. In the event there were no sales during the day or closing prices are not available, securities are valued at the last quoted bid price or may be valued using the last available price and are generally categorized as Level 2 in the hierarchy. For foreign equity securities, when market or security specific events arise, comparisons to the valuation of American Depositary Receipts (ADRs), futures contracts, Exchange-Traded Funds (ETFs) and certain indexes as well as quoted prices for similar securities may be used and would be categorized as Level 2 in the hierarchy. Utilizing these techniques may result in transfers between Level 1 and Level 2. For equity securities, including restricted securities, where observable inputs are limited, assumptions about market activity and risk are used and these securities may be categorized as Level 3 in the hierarchy. Equity securities, including restricted securities, for which observable inputs are not available are valued using alternative valuation approaches, including the market approach and the income approach and are categorized as level 3 in the hierarchy. The market approach generally consists of using comparable market transactions while the income approach generally consists of using the net present value of estimated future cash flows, adjusted as appropriate for liquidity, credit, market and/or other risk factors.
Investments in open-end mutual funds, including the Fidelity Central Funds, are valued at their closing net asset value (NAV) each business day and are categorized as Level 1 in the hierarchy.
The following provides information on Level 3 securities held by the Fund that were valued at period end based on unobservable inputs. These amounts exclude valuations provided by a broker.
| Asset Type | Fair Value at 04/30/16 | Valuation Technique (s) | Unobservable Input | Amount or Range / Weighted Average | Impact to Valuation from an Increase in Input* |
| Equities | $16,856,566 | Adjusted transaction price | Proxy movement | 45.0% | Increase |
| Last transaction price | Transaction price | $3.86 | Increase |
* Represents the expected directional change in the fair value of the Level 3 investments that would result from an increase in the corresponding input. A decrease to the unobservable input would have the opposite effect. Significant changes in these inputs could result in significantly higher or lower fair value measurements.
Changes in valuation techniques may result in transfers in or out of an assigned level within the disclosure hierarchy. The aggregate value of investments by input level as of April 30, 2016, including information on transfers between Levels 1 and 2, as well as a roll forward of Level 3 investments, is included at the end of the Fund's Schedule of Investments.
Foreign Currency. The Fund may use foreign currency contracts to facilitate transactions in foreign-denominated securities. Gains and losses from these transactions may arise from changes in the value of the foreign currency or if the counterparties do not perform under the contracts' terms.
Foreign-denominated assets, including investment securities, and liabilities are translated into U.S. dollars at the exchange rates at period end. Purchases and sales of investment securities, income and dividends received and expenses denominated in foreign currencies are translated into U.S. dollars at the exchange rate in effect on the transaction date.
The effects of exchange rate fluctuations on investments are included with the net realized and unrealized gain (loss) on investment securities. Other foreign currency transactions resulting in realized and unrealized gain (loss) are disclosed separately.
Investment Transactions and Income. For financial reporting purposes, the Fund's investment holdings and NAV include trades executed through the end of the last business day of the period. The NAV per share for processing shareholder transactions is calculated as of the close of business of the New York Stock Exchange (NYSE), normally 4:00 p.m. Eastern time and includes trades executed through the end of the prior business day. Gains and losses on securities sold are determined on the basis of identified cost and may include proceeds received from litigation. Dividend income is recorded on the ex-dividend date, except for certain dividends from foreign securities where the ex-dividend date may have passed, which are recorded as soon as the Fund is informed of the ex-dividend date. Non-cash dividends included in dividend income, if any, are recorded at the fair market value of the securities received. Income and capital gain distributions from Fidelity Central Funds, if any, are recorded on the ex-dividend date. Investment income is recorded net of foreign taxes withheld where recovery of such taxes is uncertain.
Class Allocations and Expenses. Investment income, realized and unrealized capital gains and losses, common expenses of the Fund, and certain fund-level expense reductions, if any, are allocated daily on a pro-rata basis to each class based on the relative net assets of each class to the total net assets of the Fund. Each class differs with respect to transfer agent and distribution and service plan fees incurred. Certain expense reductions may also differ by class. For the reporting period, the allocated portion of income and expenses to each class as a percent of its average net assets may vary due to the timing of recording these transactions in relation to fluctuating net assets of the classes. Expenses directly attributable to a fund are charged to that fund. Expenses attributable to more than one fund are allocated among the respective funds on the basis of relative net assets or other appropriate methods. Expense estimates are accrued in the period to which they relate and adjustments are made when actual amounts are known.
Income Tax Information and Distributions to Shareholders. Each year, the Fund intends to qualify as a regulated investment company under Subchapter M of the Internal Revenue Code, including distributing substantially all of its taxable income and realized gains. As a result, no provision for U.S. Federal income taxes is required. The Fund files a U.S. federal tax return, in addition to state and local tax returns as required. The Fund's federal income tax returns are subject to examination by the Internal Revenue Service (IRS) for a period of three fiscal years after they are filed. State and local tax returns may be subject to examination for an additional fiscal year depending on the jurisdiction. Foreign taxes are provided for based on the Fund's understanding of the tax rules and rates that exist in the foreign markets in which it invests. The Fund is subject to a tax imposed on capital gains by certain countries in which it invests.
Distributions are declared and recorded on the ex-dividend date. Income dividends and capital gain distributions are declared separately for each class. Income and capital gain distributions are determined in accordance with income tax regulations, which may differ from GAAP.
Capital accounts within the financial statements are adjusted for permanent book-tax differences. These adjustments have no impact on net assets or the results of operations. Capital accounts are not adjusted for temporary book-tax differences which will reverse in a subsequent period.
Book-tax differences are primarily due to foreign currency transactions, certain foreign taxes, passive foreign investment companies (PFIC), deferred trustees compensation and losses deferred due to wash sales.
The federal tax cost of investment securities and unrealized appreciation (depreciation) as of period end were as follows:
| Gross unrealized appreciation | $83,242,428 |
| Gross unrealized depreciation | (128,294,828) |
| Net unrealized appreciation (depreciation) on securities | $(45,052,400) |
| Tax cost | $1,129,452,707 |
Short-Term Trading (Redemption) Fees. Shares held by investors in the Fund less than 90 days may have been subject to a redemption fee equal to 1.50% of the NAV of shares redeemed. All redemption fees, which reduce the proceeds of the shareholder redemption, are retained by the Fund and accounted for as an addition to paid in capital.
Restricted Securities. The Fund may invest in securities that are subject to legal or contractual restrictions on resale. These securities generally may be resold in transactions exempt from registration or to the public if the securities are registered. Disposal of these securities may involve time-consuming negotiations and expense, and prompt sale at an acceptable price may be difficult. Information regarding restricted securities is included at the end of the Fund's Schedule of Investments.
4. Purchases and Sales of Investments.
Purchases and sales of securities, other than short-term securities, aggregated $452,226,068 and $594,988,343, respectively.
5. Fees and Other Transactions with Affiliates.
Management Fee. Fidelity Management & Research Company (the investment adviser) and its affiliates provide the Fund with investment management related services for which the Fund pays a monthly management fee. The management fee is the sum of an individual fund fee rate that is based on an annual rate of .45% of the Fund's average net assets and an annualized group fee rate that averaged .25% during the period. The group fee rate is based upon the average net assets of all the mutual funds advised by the investment adviser, including any mutual funds previously advised by the investment adviser that are currently advised by Fidelity SelectCo, LLC, an affiliate of the investment adviser. The group fee rate decreases as assets under management increase and increases as assets under management decrease. For the reporting period, the total annualized management fee rate was .70% of the Fund's average net assets.
Distribution and Service Plan Fees. In accordance with Rule 12b-1 of the 1940 Act, the Fund has adopted separate Distribution and Service Plans for each class of shares. Certain classes pay Fidelity Distributors Corporation (FDC), an affiliate of the investment adviser, separate Distribution and Service Fees, each of which is based on an annual percentage of each class' average net assets. In addition, FDC may pay financial intermediaries for selling shares of the Fund and providing shareholder support services. For the period, the Distribution and Service Fee rates, total fees and amounts retained by FDC were as follows:
| Distribution Fee | Service Fee | Total Fees | Retained by FDC | |
| Class A | -% | .25% | $33,035 | $1,879 |
| Class T | .25% | .25% | 13,818 | 160 |
| Class B | .75% | .25% | 3,184 | 2,388 |
| Class C | .75% | .25% | 60,815 | 25,390 |
| $110,852 | $29,817 |
Sales Load. FDC may receive a front-end sales charge of up to 5.75% for selling Class A shares and 3.50% for selling Class T shares, some of which is paid to financial intermediaries for selling shares of the Fund. Depending on the holding period, FDC may receive contingent deferred sales charges levied on Class A, Class T, Class B, and Class C redemptions. The deferred sales charges range from 5.00% to 1.00% for Class B shares, 1.00% for Class C shares, 1.00% for certain purchases of Class A shares and .25% for certain purchases of Class T shares.
For the period, sales charge amounts retained by FDC were as follows:
| Retained by FDC | |
| Class A | $35,646 |
| Class T | 1,702 |
| Class B(a) | 160 |
| Class C(a) | 6,468 |
| $43,976 |
(a) When Class B and Class C shares are initially sold, FDC pays commissions from its own resources to financial intermediaries through which the sales are made.
Transfer Agent Fees. Fidelity Investments Institutional Operations Company, Inc., (FIIOC), an affiliate of the investment adviser, is the transfer, dividend disbursing and shareholder servicing agent for each class of the Fund. FIIOC receives account fees and asset-based fees that vary according to the account size and type of account of the shareholders of the respective classes of the Fund. FIIOC pays for typesetting, printing and mailing of shareholder reports, except proxy statements.
For the period, transfer agent fees for each class were as follows:
| Amount | % of Class-Level Average Net Assets(a) | |
| Class A | $35,754 | .27 |
| Class T | 10,433 | .38 |
| Class B | 973 | .31 |
| Class C | 16,540 | .27 |
| China Region | 1,190,656 | .22 |
| Class I | 19,578 | .20 |
| $1,273,934 |
(a) Annualized
Accounting and Security Lending Fees. Fidelity Service Company, Inc. (FSC), an affiliate of the investment adviser, maintains the Fund's accounting records. The accounting fee is based on the level of average net assets for each month. Under a separate contract, FSC administers the security lending program. The security lending fee is based on the number and duration of lending transactions.
Brokerage Commissions. The Fund placed a portion of its portfolio transactions with brokerage firms which are affiliates of the investment adviser. Brokerage commissions are included in net realized gain (loss) and change in net unrealized appreciation (depreciation) in the Statement of Operations. The commissions paid to these affiliated firms were $1,217 for the period.
Interfund Lending Program. Pursuant to an Exemptive Order issued by the SEC, the Fund, along with other registered investment companies having management contracts with FMR or other affiliated entities of FMR, may participate in an interfund lending program. This program provides an alternative credit facility allowing the funds to borrow from, or lend money to, other participating affiliated funds. At period end, there were no interfund loans outstanding. The Fund's activity in this program during the period for which loans were outstanding was as follows:
| Borrower or Lender | Average Loan Balance | Weighted Average Interest Rate | Interest Expense |
| Borrower | $7,322,000 | .65% | $133 |
Interfund Trades. The Fund may purchase from or sell securities to other Fidelity Funds under procedures adopted by the Board. The procedures have been designed to ensure these interfund trades are executed in accordance with Rule 17a-7 of the 1940 Act. Interfund trades are included within the respective purchases and sales amounts shown in the Purchases and Sales of Investments note.
6. Committed Line of Credit.
The Fund participates with other funds managed by the investment adviser or an affiliate in a $4.25 billion credit facility (the "line of credit") to be utilized for temporary or emergency purposes to fund shareholder redemptions or for other short-term liquidity purposes. The Fund has agreed to pay commitment fees on its pro-rata portion of the line of credit, which amounted to $1,030 and is reflected in Miscellaneous expenses on the Statement of Operations. During the period, the Fund did not borrow on this line of credit.
7. Security Lending.
The Fund lends portfolio securities through a lending agent from time to time in order to earn additional income. For equity securities, a lending agent is used and may loan securities to certain qualified borrowers, including Fidelity Capital Markets (FCM), a broker-dealer affiliated with the Fund. On the settlement date of the loan, the Fund receives collateral (in the form of U.S. Treasury obligations, letters of credit and/or cash) against the loaned securities and maintains collateral in an amount not less than 100% of the market value of the loaned securities during the period of the loan. The market value of the loaned securities is determined at the close of business of the Fund and any additional required collateral is delivered to the Fund on the next business day. The Fund or borrower may terminate the loan at any time, and if the borrower defaults on its obligation to return the securities loaned because of insolvency or other reasons, the Fund may apply collateral received from the borrower against the obligation. The Fund may experience delays and costs in recovering the securities loaned. Any cash collateral received is invested in the Fidelity Securities Lending Cash Central Fund. The value of loaned securities and cash collateral at period end are disclosed on the Fund's Statement of Assets and Liabilities. Security lending income represents the income earned on investing cash collateral, less rebates paid to borrowers and any lending agent fees associated with the loan, plus any premium payments received for lending certain types of securities. Security lending income is presented in the Statement of Operations as a component of income from Fidelity Central Funds, and includes $9,957 from securities loaned to FCM.
8. Expense Reductions.
Commissions paid to certain brokers with whom the investment adviser, or its affiliates, places trades on behalf of the Fund include an amount in addition to trade execution, which may be rebated back to the Fund to offset certain expenses. This amount totaled $781 for the period.
In addition, during the period the investment adviser reimbursed and/or waived a portion of fund-level operating expenses in the amount of $4,567.
9. Distributions to Shareholders.
Distributions to shareholders of each class were as follows:
| Six months ended April 30, 2016 | Year ended October 31, 2015 | |
| From net investment income | ||
| Class A | $297,014 | $147,088 |
| Class T | 28,522 | 22,529 |
| Class C | 29,301 | 12,652 |
| China Region | 14,431,516 | 12,728,622 |
| Class I | 317,144 | 204,043 |
| Total | $15,103,497 | $13,114,934 |
| From net realized gain | ||
| Class A | $3,946,989 | $2,783,517 |
| Class T | 763,704 | 789,251 |
| Class B | 93,006 | 149,794 |
| Class C | 1,752,229 | 1,276,956 |
| China Region | 150,087,760 | 165,004,911 |
| Class I | 3,187,427 | 2,409,293 |
| Total | $159,831,115 | $172,413,722 |
10. Share Transactions.
Share transactions for each class were as follows and may contain automatic conversions between classes or exchanges between affiliated funds:
| Shares | Shares | Dollars | Dollars | |
| Six months ended April 30, 2016 | Year ended October 31, 2015 | Six months ended April 30, 2016 | Year ended October 31, 2015 | |
| Class A | ||||
| Shares sold | 147,013 | 1,058,546 | $3,579,372 | $35,978,665 |
| Reinvestment of distributions | 162,605 | 93,297 | 4,157,811 | 2,812,898 |
| Shares redeemed | (425,054) | (671,056) | (9,695,535) | (22,101,227) |
| Net increase (decrease) | (115,436) | 480,787 | $(1,958,352) | $16,690,336 |
| Class T | ||||
| Shares sold | 25,114 | 151,664 | $590,683 | $5,390,399 |
| Reinvestment of distributions | 30,599 | 26,640 | 781,504 | 801,072 |
| Shares redeemed | (45,663) | (143,989) | (1,080,869) | (4,554,275) |
| Net increase (decrease) | 10,050 | 34,315 | $291,318 | $1,637,196 |
| Class B | ||||
| Shares sold | 28 | 2,771 | $647 | $95,500 |
| Reinvestment of distributions | 3,443 | 4,834 | 87,630 | 144,877 |
| Shares redeemed | (7,534) | (15,827) | (179,703) | (523,534) |
| Net increase (decrease) | (4,063) | (8,222) | $(91,426) | $(283,157) |
| Class C | ||||
| Shares sold | 69,272 | 412,366 | $1,686,759 | $14,420,908 |
| Reinvestment of distributions | 55,713 | 38,139 | 1,398,404 | 1,131,586 |
| Shares redeemed | (112,880) | (261,252) | (2,721,043) | (7,778,046) |
| Net increase (decrease) | 12,105 | 189,253 | $364,120 | $7,774,448 |
| China Region | ||||
| Shares sold | 2,127,375 | 18,091,274 | $51,586,381 | $635,141,274 |
| Reinvestment of distributions | 6,142,435 | 5,608,420 | 158,659,097 | 170,439,887 |
| Shares redeemed | (7,626,217) | (20,336,385) | (183,247,122) | (642,334,138) |
| Net increase (decrease) | 643,593 | 3,363,309 | $26,998,356 | $163,247,023 |
| Class I | ||||
| Shares sold | 193,468 | 1,017,162 | $5,004,992 | $33,130,120 |
| Reinvestment of distributions | 99,936 | 58,945 | 2,565,348 | 1,781,897 |
| Shares redeemed | (518,949) | (726,796) | (12,663,087) | (23,738,935) |
| Net increase (decrease) | (225,545) | 349,311 | $(5,092,747) | $11,173,082 |
11. Other.
The Fund's organizational documents provide former and current trustees and officers with a limited indemnification against liabilities arising in connection with the performance of their duties to the Fund. In the normal course of business, the Fund may also enter into contracts that provide general indemnifications. The Fund's maximum exposure under these arrangements is unknown as this would be dependent on future claims that may be made against the Fund. The risk of material loss from such claims is considered remote.
Shareholder Expense Example
As a shareholder of the Fund, you incur two types of costs: (1) transaction costs, including sales charges (loads) on purchase payments or redemption proceeds, redemption fees and (2) ongoing costs, including management fees, distribution and/or service (12b-1) fees and other Fund expenses. This Example is intended to help you understand your ongoing costs (in dollars) of investing in the Fund and to compare these costs with the ongoing costs of investing in other mutual funds.
The Example is based on an investment of $1,000 invested at the beginning of the period and held for the entire period (November 1, 2015 to April 30, 2016).
Actual Expenses
The first line of the accompanying table for each class of the Fund provides information about actual account values and actual expenses. You may use the information in this line, together with the amount you invested, to estimate the expenses that you paid over the period. Simply divide your account value by $1,000.00 (for example, an $8,600 account value divided by $1,000.00 = 8.6), then multiply the result by the number in the first line for a class of the Fund under the heading entitled "Expenses Paid During Period" to estimate the expenses you paid on your account during this period. A small balance maintenance fee of $12.00 that is charged once a year may apply for certain accounts with a value of less than $2,000. This fee is not included in the table below. If it was, the estimate of expenses you paid during the period would be higher, and your ending account value lower, by this amount. In addition, the Fund, as a shareholder in the underlying Fidelity Central Funds, will indirectly bear its pro-rata share of the fees and expenses incurred by the underlying Fidelity Central Funds. These fees and expenses are not included in the Fund's annualized expense ratio used to calculate the expense estimate in the table below.
Hypothetical Example for Comparison Purposes
The second line of the accompanying table for each class of the Fund provides information about hypothetical account values and hypothetical expenses based on a Class' actual expense ratio and an assumed rate of return of 5% per year before expenses, which is not the Class' actual return. The hypothetical account values and expenses may not be used to estimate the actual ending account balance or expenses you paid for the period. You may use this information to compare the ongoing costs of investing in the Fund and other funds. To do so, compare this 5% hypothetical example with the 5% hypothetical examples that appear in the shareholder reports of the other funds. A small balance maintenance fee of $12.00 that is charged once a year may apply for certain accounts with a value of less than $2,000. This fee is not included in the table below. If it was, the estimate of expenses you paid during the period would be higher, and your ending account value lower, by this amount. In addition, the Fund, as a shareholder in the underlying Fidelity Central Funds, will indirectly bear its pro-rata share of the fees and expenses incurred by the underlying Fidelity Central Funds. These fees and expenses are not included in the Fund's annualized expense ratio used to calculate the expense estimate in the table below.
Please note that the expenses shown in the table are meant to highlight your ongoing costs only and do not reflect any transaction costs. Therefore, the second line of the table is useful in comparing ongoing costs only, and will not help you determine the relative total costs of owning different funds. In addition, if these transactional costs were included, your costs would have been higher.
| Annualized Expense Ratio-A | Beginning Account Value November 1, 2015 | Ending Account Value April 30, 2016 | Expenses Paid During Period-B November 1, 2015 to April 30, 2016 | |
| Class A | 1.32% | |||
| Actual | $1,000.00 | $894.30 | $6.22 | |
| Hypothetical-C | $1,000.00 | $1,018.30 | $6.62 | |
| Class T | 1.68% | |||
| Actual | $1,000.00 | $892.50 | $7.91 | |
| Hypothetical-C | $1,000.00 | $1,016.51 | $8.42 | |
| Class B | 2.11% | |||
| Actual | $1,000.00 | $890.50 | $9.92 | |
| Hypothetical-C | $1,000.00 | $1,014.37 | $10.57 | |
| Class C | 2.08% | |||
| Actual | $1,000.00 | $891.00 | $9.78 | |
| Hypothetical-C | $1,000.00 | $1,014.52 | $10.42 | |
| China Region | 1.03% | |||
| Actual | $1,000.00 | $895.50 | $4.85 | |
| Hypothetical-C | $1,000.00 | $1,019.74 | $5.17 | |
| Class I | 1.00% | |||
| Actual | $1,000.00 | $895.70 | $4.71 | |
| Hypothetical-C | $1,000.00 | $1,019.89 | $5.02 |
A Annualized expense ratio reflects expenses net of applicable fee waivers.
B Expenses are equal to each Class' annualized expense ratio, multiplied by the average account value over the period, multiplied by 182/366 (to reflect the one-half year period).
C 5% return per year before expenses
![]()
AHKCI-SANN-0616
1.861454.107
Fidelity® Diversified International Fund Semi-Annual Report April 30, 2016 |
|
Contents
To view a fund's proxy voting guidelines and proxy voting record for the 12-month period ended June 30, visit http://www.fidelity.com/proxyvotingresults or visit the Securities and Exchange Commission's (SEC) web site at http://www.sec.gov.
You may also call 1-800-835-5092 to request a free copy of the proxy voting guidelines.
Standard & Poor's, S&P and S&P 500 are registered service marks of The McGraw-Hill Companies, Inc. and have been licensed for use by Fidelity Distributors Corporation.
Other third-party marks appearing herein are the property of their respective owners.
All other marks appearing herein are registered or unregistered trademarks or service marks of FMR LLC or an affiliated company. © 2016 FMR LLC. All rights reserved.
This report and the financial statements contained herein are submitted for the general information of the shareholders of the Fund. This report is not authorized for distribution to prospective investors in the Fund unless preceded or accompanied by an effective prospectus.
A fund files its complete schedule of portfolio holdings with the SEC for the first and third quarters of each fiscal year on Form N-Q. Forms N-Q are available on the SEC’s web site at http://www.sec.gov. A fund's Forms N-Q may be reviewed and copied at the SEC’s Public Reference Room in Washington, DC. Information regarding the operation of the SEC's Public Reference Room may be obtained by calling 1-800-SEC-0330.
For a complete list of a fund's portfolio holdings, view the most recent holdings listing, semiannual report, or annual report on Fidelity's web site at http://www.fidelity.com, http://www.advisor.fidelity.com, or http://www.401k.com, as applicable.
NOT FDIC INSURED •MAY LOSE VALUE •NO BANK GUARANTEE
Neither the Fund nor Fidelity Distributors Corporation is a bank.
Investment Summary (Unaudited)
Geographic Diversification (% of fund's net assets)
| As of April 30, 2016 | ||
| United Kingdom | 15.6% | |
| Japan | 14.4% | |
| United States of America* | 9.9% | |
| Germany | 8.7% | |
| Switzerland | 4.7% | |
| France | 4.5% | |
| Netherlands | 4.4% | |
| Canada | 3.6% | |
| Ireland | 3.4% | |
| Other | 30.8% | |

* Includes Short-Term Investments and Net Other Assets (Liabilities).
Percentages are based on country or territory of incorporation and are adjusted for the effect of futures contracts, if applicable.
| As of October 31, 2015 | ||
| United Kingdom | 18.7% | |
| Japan | 14.6% | |
| United States of America* | 11.5% | |
| Germany | 8.0% | |
| Switzerland | 4.8% | |
| France | 4.1% | |
| Netherlands | 3.8% | |
| Ireland | 3.4% | |
| Canada | 3.2% | |
| Other | 27.9% | |
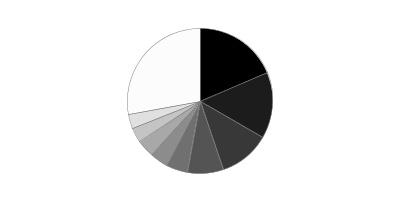
* Includes Short-Term Investments and Net Other Assets (Liabilities).
Percentages are based on country or territory of incorporation and are adjusted for the effect of futures contracts, if applicable.
Asset Allocation as of April 30, 2016
| % of fund's net assets | % of fund's net assets 6 months ago | |
| Stocks and Equity Futures | 98.9 | 96.1 |
| Other Investments | 0.0 | 0.1 |
| Short-Term Investments and Net Other Assets (Liabilities) | 1.1 | 3.8 |
Top Ten Stocks as of April 30, 2016
| % of fund's net assets | % of fund's net assets 6 months ago | |
| Novo Nordisk A/S Series B (Denmark, Pharmaceuticals) | 2.2 | 1.9 |
| ORIX Corp. (Japan, Diversified Financial Services) | 1.9 | 1.8 |
| Bayer AG (Germany, Pharmaceuticals) | 1.8 | 1.5 |
| Anheuser-Busch InBev SA NV (Belgium, Beverages) | 1.8 | 1.6 |
| AIA Group Ltd. (Hong Kong, Insurance) | 1.6 | 1.5 |
| Hoya Corp. (Japan, Health Care Equipment & Supplies) | 1.5 | 1.5 |
| Teva Pharmaceutical Industries Ltd. sponsored ADR (Israel, Pharmaceuticals) | 1.5 | 1.1 |
| Lloyds Banking Group PLC (United Kingdom, Banks) | 1.4 | 1.4 |
| Syngenta AG (Switzerland) (Switzerland, Chemicals) | 1.4 | 1.1 |
| Fresenius SE & Co. KGaA (Germany, Health Care Providers & Services) | 1.4 | 1.3 |
| 16.5 |
Market Sectors as of April 30, 2016
| % of fund's net assets | % of fund's net assets 6 months ago | |
| Financials | 21.4 | 22.3 |
| Health Care | 17.8 | 17.5 |
| Consumer Discretionary | 15.5 | 16.5 |
| Consumer Staples | 15.2 | 12.3 |
| Information Technology | 12.9 | 11.9 |
| Industrials | 6.1 | 6.2 |
| Materials | 3.6 | 3.7 |
| Energy | 3.3 | 2.6 |
| Telecommunication Services | 2.6 | 2.7 |
Percentages shown as 0.0% may reflect amounts less than 0.05%.
Investments April 30, 2016
Showing Percentage of Net Assets
| Common Stocks - 96.8% | |||
| Shares | Value | ||
| Australia - 1.2% | |||
| Ansell Ltd. (a) | 2,952,731 | $44,745,023 | |
| Australia & New Zealand Banking Group Ltd. | 4,907,320 | 89,950,864 | |
| CSL Ltd. | 218,565 | 17,479,433 | |
| Magellan Financial Group Ltd. | 3,017,095 | 49,322,036 | |
| Ramsay Health Care Ltd. | 877,853 | 43,352,535 | |
| TOTAL AUSTRALIA | 244,849,891 | ||
| Austria - 0.2% | |||
| Andritz AG | 730,000 | 40,883,209 | |
| Bailiwick of Jersey - 2.0% | |||
| Shire PLC | 2,402,900 | 149,945,770 | |
| Wolseley PLC | 2,636,396 | 147,669,995 | |
| WPP PLC | 5,247,109 | 122,586,031 | |
| TOTAL BAILIWICK OF JERSEY | 420,201,796 | ||
| Belgium - 2.6% | |||
| Anheuser-Busch InBev SA NV | 3,016,230 | 373,348,662 | |
| KBC Groep NV | 3,081,996 | 173,028,807 | |
| TOTAL BELGIUM | 546,377,469 | ||
| Canada - 3.6% | |||
| Alimentation Couche-Tard, Inc. Class B (sub. vtg.) | 4,721,481 | 206,966,968 | |
| Cenovus Energy, Inc. | 2,569,500 | 40,732,729 | |
| CGI Group, Inc. Class A (sub. vtg.) (a) | 3,291,700 | 150,378,771 | |
| Constellation Software, Inc. | 67,838 | 26,511,266 | |
| Fairfax India Holdings Corp. (a) | 5,973,900 | 66,310,290 | |
| Imperial Oil Ltd. | 1,636,900 | 54,285,016 | |
| Keyera Corp. (b) | 1,175,300 | 37,852,772 | |
| PrairieSky Royalty Ltd. (b) | 940,198 | 19,797,586 | |
| Suncor Energy, Inc. | 3,579,400 | 105,068,384 | |
| Tourmaline Oil Corp. (a) | 2,189,900 | 50,510,645 | |
| TOTAL CANADA | 758,414,427 | ||
| Cayman Islands - 1.0% | |||
| 58.com, Inc. ADR (a) | 385,400 | 21,062,110 | |
| Alibaba Group Holding Ltd. sponsored ADR (a) | 2,208,900 | 169,952,766 | |
| Regina Miracle International Holdings Ltd. (a) | 12,439,271 | 18,874,469 | |
| TOTAL CAYMAN ISLANDS | 209,889,345 | ||
| China - 0.8% | |||
| Inner Mongoli Yili Industries Co. Ltd. | 5,581,400 | 12,957,645 | |
| Kweichow Moutai Co. Ltd. | 2,230,910 | 86,561,672 | |
| Qingdao Haier Co. Ltd. | 45,397,678 | 58,412,069 | |
| Weifu High-Technology Co. Ltd. (B Shares) | 2,943,629 | 6,223,558 | |
| TOTAL CHINA | 164,154,944 | ||
| Curacao - 0.8% | |||
| Schlumberger Ltd. | 2,077,125 | 166,876,223 | |
| Denmark - 2.9% | |||
| Genmab A/S (a) | 925,476 | 137,119,158 | |
| NNIT A/S | 680,095 | 18,520,365 | |
| Novo Nordisk A/S Series B | 8,155,495 | 455,357,133 | |
| TOTAL DENMARK | 610,996,656 | ||
| Finland - 0.3% | |||
| Sampo Oyj (A Shares) | 1,329,300 | 58,038,244 | |
| France - 4.5% | |||
| Accor SA (b) | 2,377,982 | 105,335,707 | |
| Air Liquide SA | 241,570 | 27,398,058 | |
| ALTEN | 384,500 | 23,774,673 | |
| Amundi SA | 2,191,884 | 100,869,536 | |
| AXA SA | 5,561,800 | 140,433,209 | |
| Capgemini SA | 548,384 | 51,194,896 | |
| Danone SA | 1,194,034 | 83,658,056 | |
| Publicis Groupe SA | 618,016 | 45,735,174 | |
| Sanofi SA (b) | 3,489,550 | 287,631,608 | |
| VINCI SA | 576,300 | 43,051,375 | |
| Worldline SA (a)(c) | 1,339,000 | 37,502,609 | |
| TOTAL FRANCE | 946,584,901 | ||
| Germany - 7.6% | |||
| adidas AG | 1,203,800 | 155,209,100 | |
| Axel Springer Verlag AG | 439,500 | 24,538,444 | |
| Bayer AG | 3,288,262 | 379,346,358 | |
| Brenntag AG | 863,800 | 50,651,513 | |
| Continental AG | 522,000 | 114,641,948 | |
| Deutsche Boerse AG | 478,900 | 39,312,247 | |
| Deutsche Post AG | 686,477 | 20,164,069 | |
| Fresenius SE & Co. KGaA | 3,988,100 | 290,068,774 | |
| KION Group AG | 1,152,600 | 62,795,353 | |
| ProSiebenSat.1 Media AG | 2,859,290 | 145,759,816 | |
| Rational AG | 11,525 | 5,850,757 | |
| SAP AG | 2,818,181 | 221,117,434 | |
| Symrise AG | 1,253,800 | 83,067,501 | |
| TOTAL GERMANY | 1,592,523,314 | ||
| Hong Kong - 2.2% | |||
| AIA Group Ltd. | 56,237,800 | 336,561,075 | |
| China Resources Beer Holdings Co. Ltd. | 16,168,000 | 35,527,733 | |
| Hang Seng Bank Ltd. | 1,586,900 | 28,771,377 | |
| Techtronic Industries Co. Ltd. | 16,458,500 | 61,697,484 | |
| TOTAL HONG KONG | 462,557,669 | ||
| India - 3.1% | |||
| Apollo Hospitals Enterprise Ltd. | 1,724,846 | 34,072,106 | |
| Axis Bank Ltd. (a) | 6,056,162 | 43,069,769 | |
| Bharti Infratel Ltd. | 15,702,404 | 88,634,882 | |
| HCL Technologies Ltd. | 3,632,422 | 41,029,518 | |
| HDFC Bank Ltd. (a) | 10,285,876 | 209,079,292 | |
| Housing Development Finance Corp. Ltd. | 8,291,778 | 135,869,294 | |
| ITC Ltd. | 16,601,304 | 81,212,693 | |
| LIC Housing Finance Ltd. (a) | 3,164,765 | 22,025,741 | |
| TOTAL INDIA | 654,993,295 | ||
| Indonesia - 0.5% | |||
| PT Bank Central Asia Tbk | 49,958,200 | 49,435,434 | |
| PT Bank Rakyat Indonesia Tbk | 68,786,700 | 53,984,103 | |
| TOTAL INDONESIA | 103,419,537 | ||
| Ireland - 3.4% | |||
| Allergan PLC (a) | 729,200 | 157,915,552 | |
| DCC PLC (United Kingdom) | 815,289 | 72,190,327 | |
| Greencore Group PLC | 9,774,700 | 51,530,549 | |
| Horizon Pharma PLC (a) | 2,441,200 | 37,521,244 | |
| Kerry Group PLC Class A | 1,019,000 | 90,859,179 | |
| Medtronic PLC | 1,456,800 | 115,305,720 | |
| Ryanair Holdings PLC sponsored ADR | 2,206,132 | 178,586,385 | |
| TOTAL IRELAND | 703,908,956 | ||
| Isle of Man - 0.6% | |||
| Optimal Payments PLC (a) | 11,969,437 | 66,668,613 | |
| Playtech Ltd. | 5,256,097 | 61,785,167 | |
| TOTAL ISLE OF MAN | 128,453,780 | ||
| Israel - 2.1% | |||
| Check Point Software Technologies Ltd. (a) | 1,470,000 | 121,818,900 | |
| Teva Pharmaceutical Industries Ltd. sponsored ADR | 5,757,600 | 313,501,320 | |
| TOTAL ISRAEL | 435,320,220 | ||
| Italy - 0.7% | |||
| Intesa Sanpaolo SpA | 38,694,000 | 107,561,598 | |
| Mediaset SpA | 8,358,800 | 37,614,989 | |
| TOTAL ITALY | 145,176,587 | ||
| Japan - 14.4% | |||
| Astellas Pharma, Inc. | 15,834,200 | 213,486,090 | |
| Casio Computer Co. Ltd. (b) | 2,456,500 | 46,739,643 | |
| Dentsu, Inc. | 1,877,400 | 95,388,833 | |
| Don Quijote Holdings Co. Ltd. | 2,001,300 | 71,197,912 | |
| Fast Retailing Co. Ltd. | 96,700 | 25,461,332 | |
| Glory Ltd. (d) | 612,900 | 20,073,267 | |
| Hoya Corp. | 8,342,600 | 319,473,825 | |
| Japan Exchange Group, Inc. | 6,965,500 | 103,738,896 | |
| Japan Tobacco, Inc. | 5,285,100 | 215,938,294 | |
| KDDI Corp. | 7,392,800 | 212,955,026 | |
| Keyence Corp. | 416,310 | 249,533,311 | |
| Kubota Corp. | 750,000 | 10,925,142 | |
| Minebea Mitsumi, Inc. | 2,614,000 | 21,411,246 | |
| Misumi Group, Inc. | 2,029,200 | 28,022,800 | |
| Mitsubishi UFJ Financial Group, Inc. | 23,766,100 | 109,676,167 | |
| NGK Spark Plug Co. Ltd. | 1,653,600 | 32,978,359 | |
| Nippon Paint Holdings Co. Ltd. | 444,200 | 11,663,310 | |
| Nitori Holdings Co. Ltd. | 893,800 | 83,140,223 | |
| Olympus Corp. | 2,352,800 | 91,657,147 | |
| ORIX Corp. | 28,118,800 | 397,738,620 | |
| Rakuten, Inc. | 9,015,800 | 98,014,054 | |
| Seven & i Holdings Co. Ltd. | 2,509,900 | 102,410,039 | |
| SHIMANO, Inc. | 632,300 | 90,716,983 | |
| Shinsei Bank Ltd. | 26,481,000 | 37,115,145 | |
| SoftBank Corp. | 1,627,900 | 87,532,999 | |
| Suzuki Motor Corp. | 1,491,600 | 40,875,157 | |
| Tsuruha Holdings, Inc. | 1,526,000 | 146,367,261 | |
| Welcia Holdings Co. Ltd. | 614,600 | 32,464,695 | |
| TOTAL JAPAN | 2,996,695,776 | ||
| Korea (South) - 0.3% | |||
| Orion Corp. | 70,722 | 57,408,480 | |
| Luxembourg - 0.4% | |||
| Eurofins Scientific SA | 217,579 | 80,733,439 | |
| Netherlands - 4.4% | |||
| AerCap Holdings NV (a) | 1,739,700 | 69,605,397 | |
| Altice NV: | |||
| Class A (a) | 9,058,138 | 137,429,277 | |
| Class B (a) | 3,110,964 | 47,537,683 | |
| Gree Electric Appliances, Inc. of Zhuhai ELS (BNP Paribas Warrants Program) (A Shares)warrants 11/24/16 (a)(c) | 1,832,000 | 5,438,796 | |
| IMCD Group BV | 1,604,947 | 64,798,873 | |
| ING Groep NV (Certificaten Van Aandelen) | 10,426,800 | 127,689,822 | |
| NXP Semiconductors NV (a) | 906,600 | 77,314,848 | |
| RELX NV | 7,705,506 | 129,303,844 | |
| Unilever NV (Certificaten Van Aandelen) (Bearer) (b) | 5,700,157 | 250,407,003 | |
| TOTAL NETHERLANDS | 909,525,543 | ||
| New Zealand - 0.1% | |||
| Ryman Healthcare Group Ltd. | 2,763,492 | 17,231,402 | |
| Norway - 0.4% | |||
| Statoil ASA (b) | 5,237,700 | 92,190,303 | |
| Philippines - 0.2% | |||
| Alliance Global Group, Inc. | 150,892,156 | 46,517,195 | |
| Singapore - 0.6% | |||
| Broadcom Ltd. | 416,400 | 60,690,300 | |
| United Overseas Bank Ltd. | 4,329,000 | 59,872,402 | |
| TOTAL SINGAPORE | 120,562,702 | ||
| South Africa - 1.0% | |||
| Naspers Ltd. Class N | 1,502,599 | 206,171,751 | |
| Spain - 2.2% | |||
| Amadeus IT Holding SA Class A | 3,632,600 | 165,298,873 | |
| Hispania Activos Inmobiliarios SA (a) | 2,463,300 | 36,103,701 | |
| Inditex SA | 7,342,542 | 235,706,441 | |
| Telepizza Group SAU | 2,185,800 | 15,392,529 | |
| TOTAL SPAIN | 452,501,544 | ||
| Sweden - 2.7% | |||
| ASSA ABLOY AB (B Shares) | 4,478,400 | 93,912,864 | |
| Coor Service Management Holding AB (e) | 5,263,600 | 24,907,297 | |
| HEXPOL AB (B Shares) (b) | 1,620,800 | 16,752,038 | |
| Nordea Bank AB | 13,901,600 | 134,940,099 | |
| Svenska Cellulosa AB (SCA) (B Shares) | 6,608,800 | 208,128,501 | |
| Svenska Handelsbanken AB (A Shares) | 6,706,700 | 89,468,403 | |
| TOTAL SWEDEN | 568,109,202 | ||
| Switzerland - 4.7% | |||
| Actelion Ltd. | 671,276 | 108,462,191 | |
| Compagnie Financiere Richemont SA Series A | 532,865 | 35,531,583 | |
| Credit Suisse Group AG | 5,797,094 | 88,222,860 | |
| GAM Holding Ltd. | 990,613 | 12,908,019 | |
| Julius Baer Group Ltd. | 760,650 | 32,598,242 | |
| Roche Holding AG (participation certificate) | 618,734 | 156,545,411 | |
| Sika AG | 27,395 | 116,599,380 | |
| Syngenta AG (Switzerland) | 726,566 | 290,838,470 | |
| UBS Group AG | 8,657,887 | 149,818,539 | |
| TOTAL SWITZERLAND | 991,524,695 | ||
| Taiwan - 1.2% | |||
| Taiwan Semiconductor Manufacturing Co. Ltd. sponsored ADR | 10,430,600 | 246,057,854 | |
| Thailand - 0.2% | |||
| Kasikornbank PCL (For. Reg.) | 9,204,200 | 44,017,795 | |
| United Kingdom - 15.6% | |||
| AA PLC | 5,871,215 | 23,900,330 | |
| Associated British Foods PLC | 1,646,000 | 73,690,821 | |
| B&M European Value Retail S.A. | 27,155,047 | 110,065,654 | |
| British American Tobacco PLC sponsored ADR | 826,200 | 100,920,330 | |
| BT Group PLC | 24,345,500 | 157,809,263 | |
| Bunzl PLC | 1,849,170 | 55,092,042 | |
| Capita Group PLC | 3,160,500 | 46,225,825 | |
| Compass Group PLC | 6,437,376 | 114,639,295 | |
| Dignity PLC | 178,900 | 6,378,154 | |
| Essentra PLC (e) | 13,275,712 | 157,510,190 | |
| Halma PLC | 1,243,100 | 16,201,892 | |
| Howden Joinery Group PLC | 6,018,400 | 43,441,299 | |
| IMI PLC | 1,829,535 | 24,994,654 | |
| Imperial Tobacco Group PLC | 2,904,132 | 157,789,806 | |
| Indivior PLC | 10,338,900 | 24,291,547 | |
| ITV PLC | 43,061,500 | 141,694,288 | |
| Liberty Global PLC: | |||
| Class A (a) | 1,680,900 | 63,420,357 | |
| Class C (a) | 718,400 | 26,293,440 | |
| Lloyds Banking Group PLC | 306,526,900 | 300,859,529 | |
| London Stock Exchange Group PLC | 2,519,800 | 99,887,391 | |
| Melrose Industries PLC | 3,752,192 | 20,466,230 | |
| Micro Focus International PLC | 4,225,300 | 94,397,358 | |
| Next PLC | 1,913,500 | 142,172,050 | |
| Poundland Group PLC (e) | 15,009,178 | 37,720,736 | |
| Prudential PLC | 12,855,975 | 253,770,955 | |
| Reckitt Benckiser Group PLC | 2,273,387 | 221,470,848 | |
| Rio Tinto PLC | 621,100 | 20,835,605 | |
| Rolls-Royce Group PLC | 8,079,900 | 79,040,808 | |
| SABMiller PLC | 2,138,400 | 130,761,294 | |
| Schroders PLC | 1,512,300 | 55,551,786 | |
| Softcat PLC | 5,267,100 | 24,550,314 | |
| Sophos Group PLC | 5,554,717 | 16,662,712 | |
| Spectris PLC | 1,737,400 | 46,227,943 | |
| St. James's Place Capital PLC | 13,249,300 | 167,844,392 | |
| The Restaurant Group PLC | 6,201,467 | 24,927,563 | |
| Virgin Money Holdings Uk PLC | 11,584,682 | 61,800,324 | |
| Whitbread PLC | 1,838,197 | 103,997,334 | |
| TOTAL UNITED KINGDOM | 3,247,304,359 | ||
| United States of America - 8.3% | |||
| Alphabet, Inc.: | |||
| Class A | 108,805 | 77,020,883 | |
| Class C | 210,903 | 146,157,888 | |
| Amgen, Inc. | 703,400 | 111,348,220 | |
| Baxalta, Inc. | 1,278,200 | 53,620,490 | |
| Celgene Corp. (a) | 714,300 | 73,865,763 | |
| Coach, Inc. | 519,800 | 20,932,346 | |
| Cognizant Technology Solutions Corp. Class A (a) | 1,037,400 | 60,553,038 | |
| Coty, Inc. Class A (b) | 3,195,800 | 97,152,320 | |
| Fidelity National Information Services, Inc. | 530,700 | 34,920,060 | |
| Las Vegas Sands Corp. | 1,943,100 | 87,730,965 | |
| MasterCard, Inc. Class A | 1,636,500 | 158,724,135 | |
| McGraw Hill Financial, Inc. | 2,269,000 | 242,442,650 | |
| Mead Johnson Nutrition Co. Class A | 247,400 | 21,560,910 | |
| Molson Coors Brewing Co. Class B | 636,800 | 60,897,184 | |
| MSCI, Inc. Class A | 289,000 | 21,946,660 | |
| NJOY, Inc. (a)(f) | 9,361,812 | 1,198,312 | |
| Noble Energy, Inc. | 924,856 | 33,396,550 | |
| Oceaneering International, Inc. | 1,246,600 | 45,687,890 | |
| Phillips 66 Co. | 533,400 | 43,797,474 | |
| Qualcomm, Inc. | 1,726,000 | 87,197,520 | |
| Spectrum Brands Holdings, Inc. | 249,700 | 28,365,920 | |
| Verisk Analytics, Inc. (a) | 274,800 | 21,318,984 | |
| Visa, Inc. Class A | 2,191,300 | 169,256,012 | |
| Western Digital Corp. | 681,800 | 27,861,757 | |
| TOTAL UNITED STATES OF AMERICA | 1,726,953,931 | ||
| TOTAL COMMON STOCKS | |||
| (Cost $16,457,701,662) | 20,197,126,434 | ||
| Nonconvertible Preferred Stocks - 1.6% | |||
| Brazil - 0.5% | |||
| Itau Unibanco Holding SA | 10,727,500 | 102,526,110 | |
| Germany - 1.1% | |||
| Henkel AG & Co. KGaA | 1,864,900 | 212,857,045 | |
| Jungheinrich AG | 133,700 | 12,604,162 | |
| TOTAL GERMANY | 225,461,207 | ||
| United Kingdom - 0.0% | |||
| Rolls-Royce Group PLC | 573,672,900 | 838,222 | |
| TOTAL NONCONVERTIBLE PREFERRED STOCKS | |||
| (Cost $262,716,240) | 328,825,539 | ||
| Principal Amount | Value | ||
| Government Obligations - 0.0% | |||
| United States of America - 0.0% | |||
| U.S. Treasury Bills, yield at date of purchase 0.25% to 0.33% 5/26/16 to 7/28/16(g) | |||
| (Cost $6,617,073) | 6,620,000 | 6,617,900 | |
| Shares | Value | ||
| Money Market Funds - 3.3% | |||
| Fidelity Cash Central Fund, 0.38% (h) | 193,027,021 | 193,027,021 | |
| Fidelity Securities Lending Cash Central Fund, 0.42% (h)(i) | 489,239,092 | 489,239,092 | |
| TOTAL MONEY MARKET FUNDS | |||
| (Cost $682,266,113) | 682,266,113 | ||
| TOTAL INVESTMENT PORTFOLIO - 101.7% | |||
| (Cost $17,409,301,088) | 21,214,835,986 | ||
| NET OTHER ASSETS (LIABILITIES) - (1.7)% | (352,640,308) | ||
| NET ASSETS - 100% | $20,862,195,678 |
| Futures Contracts | |||
| Expiration Date | Underlying Face Amount at Value | Unrealized Appreciation/(Depreciation) | |
| Purchased | |||
| Equity Index Contracts | |||
| 1,256 CME Nikkei 225 Index Contracts (United States) | June 2016 | 100,009,000 | $(6,820,937) |
The face value of futures purchased as a percentage of Net Assets is 0.5%
Security Type Abbreviations
ELS – Equity-Linked Security
Categorizations in the Schedule of Investments are based on country or territory of incorporation.
Legend
(a) Non-income producing
(b) Security or a portion of the security is on loan at period end.
(c) Security exempt from registration under Rule 144A of the Securities Act of 1933. These securities may be resold in transactions exempt from registration, normally to qualified institutional buyers. At the end of the period, the value of these securities amounted to $42,941,405 or 0.2% of net assets.
(d) A portion of the security sold on a delayed delivery basis.
(e) Affiliated company
(f) Restricted securities - Investment in securities not registered under the Securities Act of 1933 (excluding 144A issues). At the end of the period, the value of restricted securities (excluding 144A issues) amounted to $1,198,312 or 0.0% of net assets.
(g) Security or a portion of the security was pledged to cover margin requirements for futures contracts. At period end, the value of securities pledged amounted to $6,617,900.
(h) Affiliated fund that is generally available only to investment companies and other accounts managed by Fidelity Investments. The rate quoted is the annualized seven-day yield of the fund at period end. A complete unaudited listing of the fund's holdings as of its most recent quarter end is available upon request. In addition, each Fidelity Central Fund's financial statements, which are not covered by the Fund's Report of Independent Registered Public Accounting Firm, are available on the SEC's website or upon request.
(i) Investment made with cash collateral received from securities on loan.
Additional information on each restricted holding is as follows:
| Security | Acquisition Date | Acquisition Cost |
| NJOY, Inc. | 6/7/13 - 2/14/14 | $10,471,244 |
Affiliated Central Funds
Information regarding fiscal year to date income earned by the Fund from investments in Fidelity Central Funds is as follows:
| Fund | Income earned |
| Fidelity Cash Central Fund | $900,333 |
| Fidelity Securities Lending Cash Central Fund | 2,758,295 |
| Total | $3,658,628 |
Other Affiliated Issuers
An affiliated company is a company in which the Fund has ownership of at least 5% of the voting securities. Fiscal year to date transactions with companies which are or were affiliates are as follows:
| Affiliate | Value, beginning of period | Purchases | Sales Proceeds* | Dividend Income | Value, end of period |
| Coor Service Management Holding AB | $22,025,249 | $-- | $564,115 | $1,114,274 | $24,907,297 |
| Essentra PLC | 176,517,577 | -- | 3,709,777 | 2,787,249 | 157,510,190 |
| Fairfax India Holdings Corp. | 64,252,650 | -- | 1,493,380 | -- | -- |
| Poundland Group PLC | 60,695,655 | 2,415,927 | 1,011,783 | 347,496 | 37,720,736 |
| Total | $323,491,131 | $2,415,927 | $6,779,055 | $4,249,019 | $220,138,223 |
* Includes the value of securities delivered through in-kind transactions, if applicable.
Investment Valuation
The following is a summary of the inputs used, as of April 30, 2016, involving the Fund's assets and liabilities carried at fair value. The inputs or methodology used for valuing securities may not be an indication of the risk associated with investing in those securities. For more information on valuation inputs, and their aggregation into the levels used below, please refer to the Investment Valuation section in the accompanying Notes to Financial Statements.
| Valuation Inputs at Reporting Date: | ||||
| Description | Total | Level 1 | Level 2 | Level 3 |
| Investments in Securities: | ||||
| Equities: | ||||
| Consumer Discretionary | $3,236,726,516 | $2,251,951,672 | $983,576,532 | $1,198,312 |
| Consumer Staples | 3,141,213,908 | 2,303,376,982 | 837,836,926 | -- |
| Energy | 690,195,572 | 598,005,269 | 92,190,303 | -- |
| Financials | 4,500,290,519 | 2,169,305,491 | 2,330,985,028 | -- |
| Health Care | 3,732,597,624 | 2,058,500,640 | 1,674,096,984 | -- |
| Industrials | 1,262,597,991 | 1,014,331,472 | 248,266,519 | -- |
| Information Technology | 2,690,733,121 | 2,220,082,376 | 470,650,745 | -- |
| Materials | 724,664,552 | 664,767,579 | 59,896,973 | -- |
| Telecommunication Services | 546,932,170 | 88,634,882 | 458,297,288 | -- |
| Government Obligations | 6,617,900 | -- | 6,617,900 | -- |
| Money Market Funds | 682,266,113 | 682,266,113 | -- | -- |
| Total Investments in Securities: | $21,214,835,986 | $14,051,222,476 | $7,162,415,198 | $1,198,312 |
| Derivative Instruments: | ||||
| Liabilities | ||||
| Futures Contracts | $(6,820,937) | $(6,820,937) | $-- | $-- |
| Total Liabilities | $(6,820,937) | $(6,820,937) | $-- | $-- |
| Total Derivative Instruments: | $(6,820,937) | $(6,820,937) | $-- | $-- |
The following is a summary of transfers between Level 1 and Level 2 for the period ended April 30, 2016. Transfers are assumed to have occurred at the beginning of the period, and are primarily attributable to the valuation techniques used for foreign equity securities, as discussed in the accompanying Notes to Financial Statements:
| Transfers | Total |
| Level 1 to Level 2 | $327,803,309 |
| Level 2 to Level 1 | $2,317,070,644 |
Value of Derivative Instruments
The following table is a summary of the Fund's value of derivative instruments by primary risk exposure as of April 30, 2016. For additional information on derivative instruments, please refer to the Derivative Instruments section in the accompanying Notes to Financial Statements.
| Primary Risk Exposure / Derivative Type | Value | |
| Asset | Liability | |
| Equity Risk | ||
| Futures Contracts(a) | $0 | $(6,820,937) |
| Total Equity Risk | 0 | (6,820,937) |
| Total Value of Derivatives | $0 | $(6,820,937) |
(a) Reflects gross cumulative appreciation (depreciation) on futures contracts as presented in the Schedule of Investments. In the Statement of Assets and Liabilities, the period end daily variation margin is included in receivable or payable for daily variation margin for derivative instruments, and the net cumulative appreciation (depreciation) is included in net unrealized appreciation (depreciation).
See accompanying notes which are an integral part of the financial statements.
Financial Statements
Statement of Assets and Liabilities
| April 30, 2016 | ||
| Assets | ||
| Investment in securities, at value (including securities loaned of $456,030,327) — See accompanying schedule: Unaffiliated issuers (cost $16,486,374,161) | $20,312,431,650 | |
| Fidelity Central Funds (cost $682,266,113) | 682,266,113 | |
| Other affiliated issuers (cost $240,660,814) | 220,138,223 | |
| Total Investments (cost $17,409,301,088) | $21,214,835,986 | |
| Foreign currency held at value (cost $1,167,659) | 1,167,659 | |
| Receivable for investments sold | ||
| Regular delivery | 73,143,255 | |
| Delayed delivery | 453,889 | |
| Receivable for fund shares sold | 14,641,483 | |
| Dividends receivable | 123,105,241 | |
| Distributions receivable from Fidelity Central Funds | 1,052,340 | |
| Prepaid expenses | 18,989 | |
| Other receivables | 1,595,224 | |
| Total assets | 21,430,014,066 | |
| Liabilities | ||
| Payable for investments purchased | $23,866,675 | |
| Payable for fund shares redeemed | 33,350,437 | |
| Accrued management fee | 14,746,567 | |
| Payable for daily variation margin for derivative instruments | 2,574,800 | |
| Other affiliated payables | 2,280,994 | |
| Other payables and accrued expenses | 1,759,823 | |
| Collateral on securities loaned, at value | 489,239,092 | |
| Total liabilities | 567,818,388 | |
| Net Assets | $20,862,195,678 | |
| Net Assets consist of: | ||
| Paid in capital | $17,325,464,003 | |
| Undistributed net investment income | 129,578,937 | |
| Accumulated undistributed net realized gain (loss) on investments and foreign currency transactions | (393,065,236) | |
| Net unrealized appreciation (depreciation) on investments and assets and liabilities in foreign currencies | 3,800,217,974 | |
| Net Assets | $20,862,195,678 | |
| Diversified International: | ||
| Net Asset Value, offering price and redemption price per share ($11,817,235,192 ÷ 345,097,099 shares) | $34.24 | |
| Class K: | ||
| Net Asset Value, offering price and redemption price per share ($9,044,960,486 ÷ 264,569,911 shares) | $34.19 |
See accompanying notes which are an integral part of the financial statements.
Statement of Operations
| Six months ended April 30, 2016 | ||
| Investment Income | ||
| Dividends (including $4,249,019 earned from other affiliated issuers) | $254,410,456 | |
| Interest | 41,262 | |
| Income from Fidelity Central Funds | 3,658,628 | |
| Income before foreign taxes withheld | 258,110,346 | |
| Less foreign taxes withheld | (18,972,856) | |
| Total income | 239,137,490 | |
| Expenses | ||
| Management fee | ||
| Basic fee | $71,844,117 | |
| Performance adjustment | 21,391,508 | |
| Transfer agent fees | 12,847,941 | |
| Accounting and security lending fees | 1,129,743 | |
| Custodian fees and expenses | 998,619 | |
| Independent trustees' compensation | 47,597 | |
| Appreciation in deferred trustee compensation account | 5 | |
| Registration fees | 95,852 | |
| Audit | 91,476 | |
| Legal | 32,513 | |
| Miscellaneous | 75,690 | |
| Total expenses before reductions | 108,555,061 | |
| Expense reductions | (238,137) | 108,316,924 |
| Net investment income (loss) | 130,820,566 | |
| Realized and Unrealized Gain (Loss) | ||
| Net realized gain (loss) on: | ||
| Investment securities: | ||
| Unaffiliated issuers | (177,598,081) | |
| Other affiliated issuers | 1,794,941 | |
| Foreign currency transactions | 1,239,915 | |
| Futures contracts | (6,473,079) | |
| Total net realized gain (loss) | (181,036,304) | |
| Change in net unrealized appreciation (depreciation) on: Investment securities | (837,341,372) | |
| Assets and liabilities in foreign currencies | 1,303,758 | |
| Futures contracts | (12,506,904) | |
| Total change in net unrealized appreciation (depreciation) | (848,544,518) | |
| Net gain (loss) | (1,029,580,822) | |
| Net increase (decrease) in net assets resulting from operations | $(898,760,256) |
See accompanying notes which are an integral part of the financial statements.
Statement of Changes in Net Assets
| Six months ended April 30, 2016 | Year ended October 31, 2015 | |
| Increase (Decrease) in Net Assets | ||
| Operations | ||
| Net investment income (loss) | $130,820,566 | $255,650,579 |
| Net realized gain (loss) | (181,036,304) | 526,274,148 |
| Change in net unrealized appreciation (depreciation) | (848,544,518) | 59,726,439 |
| Net increase (decrease) in net assets resulting from operations | (898,760,256) | 841,651,166 |
| Distributions to shareholders from net investment income | (211,286,764) | (285,525,428) |
| Distributions to shareholders from net realized gain | (103,786,301) | (625,108,082) |
| Total distributions | (315,073,065) | (910,633,510) |
| Share transactions - net increase (decrease) | (1,127,571,911) | (1,643,491,859) |
| Redemption fees | 78,123 | 259,689 |
| Total increase (decrease) in net assets | (2,341,327,109) | (1,712,214,514) |
| Net Assets | ||
| Beginning of period | 23,203,522,787 | 24,915,737,301 |
| End of period (including undistributed net investment income of $129,578,937 and undistributed net investment income of $210,045,135, respectively) | $20,862,195,678 | $23,203,522,787 |
See accompanying notes which are an integral part of the financial statements.
Financial Highlights — Fidelity Diversified International Fund
| Six months ended April 30, | Years ended October 31, | |||||
| 2016 | 2015 | 2014 | 2013 | 2012 | 2011 | |
| Selected Per–Share Data | ||||||
| Net asset value, beginning of period | $36.07 | $36.22 | $35.89 | $29.07 | $27.49 | $29.49 |
| Income from Investment Operations | ||||||
| Net investment income (loss)A | .20 | .36 | .60B | .44 | .42 | .53C |
| Net realized and unrealized gain (loss) | (1.56) | .80 | .28 | 6.90 | 1.65 | (1.99) |
| Total from investment operations | (1.36) | 1.16 | .88 | 7.34 | 2.07 | (1.46) |
| Distributions from net investment income | (.31) | (.40) | (.32) | (.46) | (.49) | (.46) |
| Distributions from net realized gain | (.16) | (.92) | (.23) | (.07) | – | (.08) |
| Total distributions | (.47) | (1.31)D | (.55) | (.52)E | (.49) | (.54) |
| Redemption fees added to paid in capitalA,F | – | – | – | – | – | – |
| Net asset value, end of period | $34.24 | $36.07 | $36.22 | $35.89 | $29.07 | $27.49 |
| Total ReturnG,H | (3.81)% | 3.29% | 2.48% | 25.66% | 7.72% | (5.07)% |
| Ratios to Average Net AssetsI,J | ||||||
| Expenses before reductions | 1.07%K | 1.00% | .93% | .94% | 1.01% | .90% |
| Expenses net of fee waivers, if any | 1.07%K | .99% | .93% | .94% | 1.01% | .89% |
| Expenses net of all reductions | 1.07%K | .99% | .92% | .92% | .99% | .87% |
| Net investment income (loss) | 1.17%K | .98% | 1.65%B | 1.38% | 1.53% | 1.78%C |
| Supplemental Data | ||||||
| Net assets, end of period (000 omitted) | $11,817,235 | $13,059,983 | $13,781,306 | $14,432,586 | $13,269,769 | $17,285,369 |
| Portfolio turnover rateL | 24%K,M | 31%M | 39%M | 52% | 35% | 45% |
A Calculated based on average shares outstanding during the period.
B Net Investment income per share reflects a large, non-recurring dividend which amounted to $.18 per share. Excluding this non-recurring dividend, the ratio of net investment income (loss) to average net assets would have been 1.16%.
C Net Investment income per share reflects a large, non-recurring dividend which amounted to $.10 per share. Excluding this non-recurring dividend, the ratio of net investment income (loss) to average net assets would have been 1.44%.
D Total distributions of $1.31 per share is comprised of distributions from net investment income of $.397 and distributions from net realized gain of $.917 per share.
E Total distributions of $.52 per share is comprised of distributions from net investment income of $.456 and distributions from net realized gain of $.068 per share.
F Amount represents less than $.005 per share.
G Total returns for periods of less than one year are not annualized.
H Total returns would have been lower if certain expenses had not been reduced during the applicable periods shown.
I Fees and expenses of any underlying Fidelity Central Funds are not included in the Fund's expense ratio. The Fund indirectly bears its proportionate share of the expenses of any underlying Fidelity Central Funds.
J Expense ratios reflect operating expenses of the class. Expenses before reductions do not reflect amounts reimbursed by the investment adviser or reductions from brokerage service arrangements or reductions from other expense offset arrangements and do not represent the amount paid by the class during periods when reimbursements or reductions occur. Expenses net of fee waivers reflect expenses after reimbursement by the investment adviser but prior to reductions from brokerage service arrangements or other expense offset arrangements. Expenses net of all reductions represent the net expenses paid by the class.
K Annualized
L Amount does not include the portfolio activity of any underlying Fidelity Central Funds.
M Portfolio turnover rate excludes securities received or delivered in-kind.
See accompanying notes which are an integral part of the financial statements.
Financial Highlights — Fidelity Diversified International Fund Class K
| Six months ended April 30, | Years ended October 31, | |||||
| 2016 | 2015 | 2014 | 2013 | 2012 | 2011 | |
| Selected Per–Share Data | ||||||
| Net asset value, beginning of period | $36.04 | $36.20 | $35.87 | $29.06 | $27.51 | $29.51 |
| Income from Investment Operations | ||||||
| Net investment income (loss)A | .22 | .40 | .65B | .49 | .47 | .58C |
| Net realized and unrealized gain (loss) | (1.55) | .80 | .28 | 6.90 | 1.63 | (1.97) |
| Total from investment operations | (1.33) | 1.20 | .93 | 7.39 | 2.10 | (1.39) |
| Distributions from net investment income | (.36) | (.45) | (.37) | (.51) | (.55) | (.53) |
| Distributions from net realized gain | (.16) | (.92) | (.23) | (.07) | – | (.08) |
| Total distributions | (.52) | (1.36)D | (.60) | (.58) | (.55) | (.61) |
| Redemption fees added to paid in capitalA,E | – | – | – | – | – | – |
| Net asset value, end of period | $34.19 | $36.04 | $36.20 | $35.87 | $29.06 | $27.51 |
| Total ReturnF,G | (3.74)% | 3.40% | 2.63% | 25.86% | 7.86% | (4.87)% |
| Ratios to Average Net AssetsH,I | ||||||
| Expenses before reductions | .94%J | .87% | .80% | .80% | .84% | .73% |
| Expenses net of fee waivers, if any | .94%J | .87% | .80% | .80% | .84% | .72% |
| Expenses net of all reductions | .94%J | .86% | .79% | .78% | .83% | .70% |
| Net investment income (loss) | 1.30%J | 1.10% | 1.78%B | 1.52% | 1.70% | 1.95%C |
| Supplemental Data | ||||||
| Net assets, end of period (000 omitted) | $9,044,960 | $10,143,540 | $11,134,431 | $11,541,599 | $8,885,304 | $8,115,192 |
| Portfolio turnover rateK | 24%J,L | 31%L | 39%L | 52% | 35% | 45% |
A Calculated based on average shares outstanding during the period.
B Net Investment income per share reflects a large, non-recurring dividend which amounted to $.18 per share. Excluding this non-recurring dividend, the ratio of net investment income (loss) to average net assets would have been 1.29%.
C Net Investment income per share reflects a large, non-recurring dividend which amounted to $.10 per share. Excluding this non-recurring dividend, the ratio of net investment income (loss) to average net assets would have been 1.61%.
D Total distributions of $1.36 per share is comprised of distributions from net investment income of $.446 and distributions from net realized gain of $.917 per share.
E Amount represents less than $.005 per share.
F Total returns for periods of less than one year are not annualized.
G Total returns would have been lower if certain expenses had not been reduced during the applicable periods shown.
H Fees and expenses of any underlying Fidelity Central Funds are not included in the Fund's expense ratio. The Fund indirectly bears its proportionate share of the expenses of any underlying Fidelity Central Funds.
I Expense ratios reflect operating expenses of the class. Expenses before reductions do not reflect amounts reimbursed by the investment adviser or reductions from brokerage service arrangements or reductions from other expense offset arrangements and do not represent the amount paid by the class during periods when reimbursements or reductions occur. Expenses net of fee waivers reflect expenses after reimbursement by the investment adviser but prior to reductions from brokerage service arrangements or other expense offset arrangements. Expenses net of all reductions represent the net expenses paid by the class.
J Annualized
K Amount does not include the portfolio activity of any underlying Fidelity Central Funds.
L Portfolio turnover rate excludes securities received or delivered in-kind.
See accompanying notes which are an integral part of the financial statements.
Notes to Financial Statements
For the period ended April 30, 2016
1. Organization.
Fidelity Diversified International Fund (the Fund) is a fund of Fidelity Investment Trust (the Trust) and is authorized to issue an unlimited number of shares. The Trust is registered under the Investment Company Act of 1940, as amended (the 1940 Act), as an open-end management investment company organized as a Massachusetts business trust. The Fund offers Diversified International and Class K shares, each of which has equal rights as to assets and voting privileges. Each class has exclusive voting rights with respect to matters that affect that class. The Fund's investments in emerging markets can be subject to social, economic, regulatory, and political uncertainties and can be extremely volatile.
2. Investments in Fidelity Central Funds.
The Fund invests in Fidelity Central Funds, which are open-end investment companies generally available only to other investment companies and accounts managed by the investment adviser and its affiliates. The Fund's Schedule of Investments lists each of the Fidelity Central Funds held as of period end, if any, as an investment of the Fund, but does not include the underlying holdings of each Fidelity Central Fund. As an Investing Fund, the Fund indirectly bears its proportionate share of the expenses of the underlying Fidelity Central Funds.
The Money Market Central Funds seek preservation of capital and current income and are managed by Fidelity Investments Money Management, Inc. (FIMM), an affiliate of the investment adviser. Annualized expenses of the Money Market Central Funds as of their most recent shareholder report date are less than .005%.
A complete unaudited list of holdings for each Fidelity Central Fund is available upon request or at the Securities and Exchange Commission (the SEC) website at www.sec.gov. In addition, the financial statements of the Fidelity Central Funds, which are not covered by the Fund's Report of Independent Registered Public Accounting Firm, are available on the SEC website or upon request.
3. Significant Accounting Policies.
The financial statements have been prepared in conformity with accounting principles generally accepted in the United States of America (GAAP), which require management to make certain estimates and assumptions at the date of the financial statements. Actual results could differ from those estimates. Subsequent events, if any, through the date that the financial statements were issued have been evaluated in the preparation of the financial statements. The following summarizes the significant accounting policies of the Fund:
Investment Valuation. Investments are valued as of 4:00 p.m. Eastern time on the last calendar day of the period. The Board of Trustees (the Board) has delegated the day to day responsibility for the valuation of the Fund's investments to the Fidelity Management & Research Company (FMR) Fair Value Committee (the Committee). In accordance with valuation policies and procedures approved by the Board, the Fund attempts to obtain prices from one or more third party pricing vendors or brokers to value its investments. When current market prices, quotations or currency exchange rates are not readily available or reliable, investments will be fair valued in good faith by the Committee, in accordance with procedures adopted by the Board. Factors used in determining fair value vary by investment type and may include market or investment specific events, changes in interest rates and credit quality. The frequency with which these procedures are used cannot be predicted and they may be utilized to a significant extent. The Committee oversees the Fund's valuation policies and procedures and reports to the Board on the Committee's activities and fair value determinations. The Board monitors the appropriateness of the procedures used in valuing the Fund's investments and ratifies the fair value determinations of the Committee.
The Fund categorizes the inputs to valuation techniques used to value its investments into a disclosure hierarchy consisting of three levels as shown below:
- Level 1 – quoted prices in active markets for identical investments
- Level 2 – other significant observable inputs (including quoted prices for similar investments, interest rates, prepayment speeds, etc.)
- Level 3 – unobservable inputs (including the Fund's own assumptions based on the best information available)
Valuation techniques used to value the Fund's investments by major category are as follows:
Equity securities, including restricted securities, for which market quotations are readily available, are valued at the last reported sale price or official closing price as reported by a third party pricing vendor on the primary market or exchange on which they are traded and are categorized as Level 1 in the hierarchy. In the event there were no sales during the day or closing prices are not available, securities are valued at the last quoted bid price or may be valued using the last available price and are generally categorized as Level 2 in the hierarchy. For foreign equity securities, when market or security specific events arise, comparisons to the valuation of American Depositary Receipts (ADRs), futures contracts, Exchange-Traded Funds (ETFs) and certain indexes as well as quoted prices for similar securities may be used and would be categorized as Level 2 in the hierarchy. Utilizing these techniques may result in transfers between Level 1 and Level 2. For equity securities, including restricted securities, where observable inputs are limited, assumptions about market activity and risk are used and these securities may be categorized as Level 3 in the hierarchy.
Debt securities, including restricted securities, are valued based on evaluated prices received from third party pricing vendors or from brokers who make markets in such securities. U.S. government and government agency obligations are valued by pricing vendors who utilize matrix pricing which considers yield or price of bonds of comparable quality, coupon, maturity and type or by broker-supplied prices. When independent prices are unavailable or unreliable, debt securities may be valued utilizing pricing methodologies which consider similar factors that would be used by third party pricing vendors. Debt securities are generally categorized as Level 2 in the hierarchy but may be Level 3 depending on the circumstances.
Futures contracts are valued at the settlement price established each day by the board of trade or exchange on which they are traded and are categorized as Level 1 in the hierarchy. Investments in open-end mutual funds, including the Fidelity Central Funds, are valued at their closing net asset value (NAV) each business day and are categorized as Level 1 in the hierarchy.
Changes in valuation techniques may result in transfers in or out of an assigned level within the disclosure hierarchy. The aggregate value of investments by input level as of April 30, 2016, information on transfers between Levels 1 and 2, is included at the end of the Fund's Schedule of Investments.
Foreign Currency. The Fund may use foreign currency contracts to facilitate transactions in foreign-denominated securities. Gains and losses from these transactions may arise from changes in the value of the foreign currency or if the counterparties do not perform under the contracts' terms.
Foreign-denominated assets, including investment securities, and liabilities are translated into U.S. dollars at the exchange rates at period end. Purchases and sales of investment securities, income and dividends received and expenses denominated in foreign currencies are translated into U.S. dollars at the exchange rate in effect on the transaction date.
The effects of exchange rate fluctuations on investments are included with the net realized and unrealized gain (loss) on investment securities. Other foreign currency transactions resulting in realized and unrealized gain (loss) are disclosed separately.
Investment Transactions and Income. For financial reporting purposes, the Fund's investment holdings and NAV include trades executed through the end of the last business day of the period. The NAV per share for processing shareholder transactions is calculated as of the close of business of the New York Stock Exchange (NYSE), normally 4:00 p.m. Eastern time and includes trades executed through the end of the prior business day. Gains and losses on securities sold are determined on the basis of identified cost and may include proceeds received from litigation. Dividend income is recorded on the ex-dividend date, except for certain dividends from foreign securities where the ex-dividend date may have passed, which are recorded as soon as the Fund is informed of the ex-dividend date. Non-cash dividends included in dividend income, if any, are recorded at the fair market value of the securities received. Income and capital gain distributions from Fidelity Central Funds, if any, are recorded on the ex-dividend date. Distributions received on securities that represent a return of capital or capital gain are recorded as a reduction of cost of investments and/or as a realized gain. Subsequent to ex-dividend date the Fund determines the components of these distributions, based upon receipt of tax filings or other correspondence relating to the underlying investment. Interest income is accrued as earned and includes coupon interest and amortization of premium and accretion of discount on debt securities as applicable. Investment income is recorded net of foreign taxes withheld where recovery of such taxes is uncertain.
Class Allocations and Expenses. Investment income, realized and unrealized capital gains and losses, common expenses of the Fund, and certain fund-level expense reductions, if any, are allocated daily on a pro-rata basis to each class based on the relative net assets of each class to the total net assets of the Fund. Each class differs with respect to transfer agent fees incurred. Certain expense reductions may also differ by class. For the reporting period, the allocated portion of income and expenses to each class as a percent of its average net assets may vary due to the timing of recording these transactions in relation to fluctuating net assets of the classes. Expenses directly attributable to a fund are charged to that fund. Expenses attributable to more than one fund are allocated among the respective funds on the basis of relative net assets or other appropriate methods. Expense estimates are accrued in the period to which they relate and adjustments are made when actual amounts are known.
Deferred Trustee Compensation. Under a Deferred Compensation Plan (the Plan), independent Trustees may elect to defer receipt of a portion of their annual compensation. Deferred amounts are invested in a cross-section of Fidelity funds, are marked-to-market and remain in the Fund until distributed in accordance with the Plan. The investment of deferred amounts and the offsetting payable to the Trustees are included in the accompanying Statement of Assets and Liabilities.
Income Tax Information and Distributions to Shareholders. Each year, the Fund intends to qualify as a regulated investment company under Subchapter M of the Internal Revenue Code, including distributing substantially all of its taxable income and realized gains. As a result, no provision for U.S. Federal income taxes is required. The Fund files a U.S. federal tax return, in addition to state and local tax returns as required. The Fund's federal income tax returns are subject to examination by the Internal Revenue Service (IRS) for a period of three fiscal years after they are filed. State and local tax returns may be subject to examination for an additional fiscal year depending on the jurisdiction. Foreign taxes are provided for based on the Fund's understanding of the tax rules and rates that exist in the foreign markets in which it invests.
Distributions are declared and recorded on the ex-dividend date. Income dividends and capital gain distributions are declared separately for each class. Income and capital gain distributions are determined in accordance with income tax regulations, which may differ from GAAP.
Capital accounts within the financial statements are adjusted for permanent book-tax differences. These adjustments have no impact on net assets or the results of operations. Capital accounts are not adjusted for temporary book-tax differences which will reverse in a subsequent period.
Book-tax differences are primarily due to in-kind transactions, futures contracts, foreign currency transactions, passive foreign investments companies (PFIC), market discount, partnerships, deferred trustees compensation and losses deferred due to wash sales.
The federal tax cost of investment securities and unrealized appreciation (depreciation) as of period end were as follows:
| Gross unrealized appreciation | $4,689,597,730 |
| Gross unrealized depreciation | (1,074,896,131) |
| Net unrealized appreciation (depreciation) on securities | $3,614,701,599 |
| Tax cost | $17,600,134,387 |
Short-Term Trading (Redemption) Fees. Shares held by investors in the Fund less than 30 days may have been subject to a redemption fee equal to 1.00% of the NAV of shares redeemed. All redemption fees, which reduce the proceeds of the shareholder redemption, are retained by the Fund and accounted for as an addition to paid in capital.
Delayed Delivery Transactions and When-Issued Securities. During the period, the Fund transacted in securities on a delayed delivery or when-issued basis. Payment and delivery may take place after the customary settlement period for that security. The price of the underlying securities and the date when the securities will be delivered and paid for are fixed at the time the transaction is negotiated. With respect to purchase commitments, the Fund identifies securities as segregated in its records with a value at least equal to the amount of the commitment. Losses may arise due to changes in the value of the underlying securities or if the counterparty does not perform under the contract's terms, or if the issuer does not issue the securities due to political, economic, or other factors.
Restricted Securities. The Fund may invest in securities that are subject to legal or contractual restrictions on resale. These securities generally may be resold in transactions exempt from registration or to the public if the securities are registered. Disposal of these securities may involve time-consuming negotiations and expense, and prompt sale at an acceptable price may be difficult. Information regarding restricted securities is included at the end of the Fund's Schedule of Investments.
4. Derivative Instruments.
Risk Exposures and the Use of Derivative Instruments. The Fund's investment objective allows the Fund to enter into various types of derivative contracts, including futures contracts. Derivatives are investments whose value is primarily derived from underlying assets, indices or reference rates and may be transacted on an exchange or over-the-counter (OTC). Derivatives may involve a future commitment to buy or sell a specified asset based on specified terms, to exchange future cash flows at periodic intervals based on a notional principal amount, or for one party to make one or more payments upon the occurrence of specified events in exchange for periodic payments from the other party.
The Fund used derivatives to increase returns and to manage exposure to certain risks as defined below. The success of any strategy involving derivatives depends on analysis of numerous economic factors, and if the strategies for investment do not work as intended, the Fund may not achieve its objectives.
The Fund's use of derivatives increased or decreased its exposure to the following risk:
| Equity Risk | Equity risk relates to the fluctuations in the value of financial instruments as a result of changes in market prices (other than those arising from interest rate risk or foreign exchange risk), whether caused by factors specific to an individual investment, its issuer, or all factors affecting all instruments traded in a market or market segment. |
The Fund is also exposed to additional risks from investing in derivatives, such as liquidity risk and counterparty credit risk. Liquidity risk is the risk that the Fund will be unable to close out the derivative in the open market in a timely manner. Counterparty credit risk is the risk that the counterparty will not be able to fulfill its obligation to the Fund. Counterparty credit risk related to exchange-traded futures contracts may be mitigated by the protection provided by the exchange on which they trade.
Investing in derivatives may involve greater risks than investing in the underlying assets directly and, to varying degrees, may involve risk of loss in excess of any initial investment and collateral received and amounts recognized in the Statement of Assets and Liabilities. In addition, there may be the risk that the change in value of the derivative contract does not correspond to the change in value of the underlying instrument.
Futures Contracts. A futures contract is an agreement between two parties to buy or sell a specified underlying instrument for a fixed price at a specified future date. The Fund used futures contracts to manage its exposure to the stock market.
Upon entering into a futures contract, a fund is required to deposit either cash or securities (initial margin) with a clearing broker in an amount equal to a certain percentage of the face value of the contract. Futures contracts are marked-to-market daily and subsequent daily payments (variation margin) are made or received by a fund depending on the daily fluctuations in the value of the futures contracts and are recorded as unrealized appreciation or (depreciation). This receivable and/or payable, if any, is included in daily variation margin for derivative instruments in the Statement of Assets and Liabilities. Realized gain or (loss) is recorded upon the expiration or closing of a futures contract.
Any open futures contracts at period end are presented in the Schedule of Investments under the caption "Futures Contracts". The underlying face amount at value reflects each contract's exposure to the underlying instrument or index at period end and is representative of volume of activity during the period. Securities deposited to meet initial margin requirements are identified in the Schedule of Investments.
During the period the Fund recognized net realized gain (loss) of $(6,473,079) and a change in net unrealized appreciation (depreciation) of $(12,506,904) related to its investment in futures contracts. These amounts are included in the Statement of Operations.
5. Purchases and Sales of Investments.
Purchases and sales of securities, other than short-term securities and in-kind transactions, aggregated $2,543,180,989 and $2,682,802,377, respectively.
Redemptions In-Kind. During the period, 14,413,032 shares of the Fund held by unaffiliated entities were redeemed in-kind for cash and investments with a value of $486,333,150. The net realized gain of $139,782,567 on investments delivered through in-kind redemptions is included in the accompanying Statement of Operations. The amount of in-kind redemptions is included in share transactions in the accompanying Statement of Changes in Net Assets as well as Note 11: Share Transactions. The Fund recognized no gain or loss for federal income tax purposes.
6. Fees and Other Transactions with Affiliates.
Management Fee. Fidelity Management & Research Company (the investment adviser) and its affiliates provide the Fund with investment management related services for which the Fund pays a monthly management fee. The management fee is the sum of an individual fund fee rate that is based on an annual rate of .424% of the Fund's average net assets and an annualized group fee rate that averaged .25% during the period. The group fee rate is based upon the average net assets of all the mutual funds advised by the investment adviser, including any mutual funds previously advised by the investment adviser that are currently advised by Fidelity SelectCo, LLC, an affiliate of the investment adviser. The group fee rate decreases as assets under management increase and increases as assets under management decrease. In addition, the management fee is subject to a performance adjustment (up to a maximum of +/- .20% of the Fund's average net assets over a 36 month performance period). The upward or downward adjustment to the management fee is based on the relative investment performance of Diversified International as compared to its benchmark index, the MSCI EAFE Index, over the same 36 month performance period. For the reporting period, the total annualized management fee rate, including the performance adjustment, was .87% of the Fund's average net assets. The performance adjustment included in the management fee rate may be higher or lower than the maximum performance adjustment rate due to the difference between the average net assets for the reporting and performance periods.
Transfer Agent Fees. Fidelity Investments Institutional Operations Company, Inc., (FIIOC), an affiliate of the investment adviser, is the transfer, dividend disbursing and shareholder servicing agent for each class of the Fund. FIIOC receives account fees and asset-based fees that vary according to the account size and type of account of the shareholders of Diversified International. FIIOC receives an asset-based fee of Class K's average net assets. FIIOC pays for typesetting, printing and mailing of shareholder reports, except proxy statements.
For the period, transfer agent fees for each class were as follows:
| Amount | % of Class-Level Average Net Assets(a) | |
| Diversified International | $10,659,258 | .18 |
| Class K | 2,188,683 | .05 |
| $12,847,941 |
(a) Annualized
Accounting and Security Lending Fees. Fidelity Service Company, Inc. (FSC), an affiliate of the investment adviser, maintains the Fund's accounting records. The accounting fee is based on the level of average net assets for each month. Under a separate contract, FSC administers the security lending program. The security lending fee is based on the number and duration of lending transactions.
Brokerage Commissions. The Fund placed a portion of its portfolio transactions with brokerage firms which are affiliates of the investment adviser. Brokerage commissions are included in net realized gain (loss) and change in net unrealized appreciation (depreciation) in the Statement of Operations. The commissions paid to these affiliated firms were $13,265 for the period.
Interfund Trades. The Fund may purchase from or sell securities to other Fidelity Funds under procedures adopted by the Board. The procedures have been designed to ensure these interfund trades are executed in accordance with Rule 17a-7 of the 1940 Act. Interfund trades are included within the respective purchases and sales amounts shown in the Purchases and Sales of Investments note.
7. Committed Line of Credit.
The Fund participates with other funds managed by the investment adviser or an affiliate in a $4.25 billion credit facility (the "line of credit") to be utilized for temporary or emergency purposes to fund shareholder redemptions or for other short-term liquidity purposes. The Fund has agreed to pay commitment fees on its pro-rata portion of the line of credit, which amounted to $19,093 and is reflected in Miscellaneous expenses on the Statement of Operations. During the period, the Fund did not borrow on this line of credit.
8. Security Lending.
The Fund lends portfolio securities through a lending agent from time to time in order to earn additional income. For equity securities, a lending agent is used and may loan securities to certain qualified borrowers, including Fidelity Capital Markets (FCM), a broker-dealer affiliated with the Fund. On the settlement date of the loan, the Fund receives collateral (in the form of U.S. Treasury obligations, letters of credit and/or cash) against the loaned securities and maintains collateral in an amount not less than 100% of the market value of the loaned securities during the period of the loan. The market value of the loaned securities is determined at the close of business of the Fund and any additional required collateral is delivered to the Fund on the next business day. The Fund or borrower may terminate the loan at any time, and if the borrower defaults on its obligation to return the securities loaned because of insolvency or other reasons, the Fund may apply collateral received from the borrower against the obligation. The Fund may experience delays and costs in recovering the securities loaned. Any cash collateral received is invested in the Fidelity Securities Lending Cash Central Fund. The value of loaned securities and cash collateral at period end are disclosed on the Fund's Statement of Assets and Liabilities. Security lending income represents the income earned on investing cash collateral, less rebates paid to borrowers and any lending agent fees associated with the loan, plus any premium payments received for lending certain types of securities. Security lending income is presented in the Statement of Operations as a component of income from Fidelity Central Funds. Total security lending income during the period amounted to $2,758,295. During the period, there were no securities loaned to FCM.
9. Expense Reductions.
Commissions paid to certain brokers with whom the investment adviser, or its affiliates, places trades on behalf of the Fund include an amount in addition to trade execution, which may be rebated back to the Fund to offset certain expenses. This amount totaled $156,463 for the period. In addition, through arrangements with the Fund's custodian, credits realized as a result of certain uninvested cash balances were used to reduce the Fund's expenses. During the period, these credits reduced the Fund's custody expenses by $956.
In addition, during the period the investment adviser reimbursed and/or waived a portion of fund-level operating expenses in the amount of $80,718.
10. Distributions to Shareholders.
Distributions to shareholders of each class were as follows:
| Six months ended April 30, 2016 | Year ended October 31, 2015 | |
| From net investment income | ||
| Diversified International | $111,194,421 | $149,948,658 |
| Class K | 100,092,343 | 135,576,770 |
| Total | $211,286,764 | $285,525,428 |
| From net realized gain | ||
| Diversified International | $58,466,749 | $346,354,986 |
| Class K | 45,319,552 | 278,753,096 |
| Total | $103,786,301 | $625,108,082 |
11. Share Transactions.
Share transactions for each class were as follows and may contain automatic conversions between classes or exchanges between affiliated funds:
| Shares | Shares | Dollars | Dollars | |
| Six months ended April 30, 2016 | Year ended October 31, 2015 | Six months ended April 30, 2016 | Year ended October 31, 2015 | |
| Diversified International | ||||
| Shares sold | 22,545,924 | 68,897,294 | $754,790,846 | $2,502,582,724 |
| Reinvestment of distributions | 4,457,297 | 13,245,636 | 158,724,354 | 468,498,147 |
| Shares redeemed | (43,948,563) | (100,568,411)(a) | (1,481,054,664) | (3,650,099,531)(a) |
| Net increase (decrease) | (16,945,342) | (18,425,481) | $(567,539,464) | $(679,018,660) |
| Class K | ||||
| Shares sold | 23,311,890 | 62,832,809 | $787,966,013 | $2,295,823,882 |
| Reinvestment of distributions | 4,092,651 | 11,737,390 | 145,411,895 | 414,329,866 |
| Shares redeemed | (44,273,186)(b) | (100,745,655)(a) | (1,493,410,355)(b) | (3,674,626,947)(a) |
| Net increase (decrease) | (16,868,645) | (26,175,456) | $(560,032,447) | $(964,473,199) |
(a) Amount includes in-kind redemptions
(b) Amount includes in-kind redemptions (see Note 5: Redemptions In-Kind).
12. Other.
The Fund's organizational documents provide former and current trustees and officers with a limited indemnification against liabilities arising in connection with the performance of their duties to the Fund. In the normal course of business, the Fund may also enter into contracts that provide general indemnifications. The Fund's maximum exposure under these arrangements is unknown as this would be dependent on future claims that may be made against the Fund. The risk of material loss from such claims is considered remote.
Report of Independent Registered Public Accounting Firm
To the Trustees of Fidelity Investment Trust and Shareholders of Fidelity Diversified International Fund:
We have audited the accompanying statement of assets and liabilities of Fidelity Diversified International Fund (the Fund), a fund of Fidelity Investment Trust, including the schedule of investments, as of April 30, 2016, and the related statement of operations for the six months then ended, the statement of changes in net assets for the six months ended April 30, 2016 and for the year ended October 31, 2015, and the financial highlights for the six months ended April 30, 2016 and for each of the five years in the period ended October 31, 2015. These financial statements and financial highlights are the responsibility of the Fund's management. Our responsibility is to express an opinion on these financial statements and financial highlights based on our audits.
We conducted our audits in accordance with the standards of the Public Company Accounting Oversight Board (United States). Those standards require that we plan and perform the audit to obtain reasonable assurance about whether the financial statements and financial highlights are free of material misstatement. The Fund is not required to have, nor were we engaged to perform, an audit of its internal control over financial reporting. Our audits included consideration of internal control over financial reporting as a basis for designing audit procedures that are appropriate in the circumstances, but not for the purpose of expressing an opinion on the effectiveness of the Fund's internal control over financial reporting. Accordingly, we express no such opinion. An audit also includes examining, on a test basis, evidence supporting the amounts and disclosures in the financial statements, assessing the accounting principles used and significant estimates made by management, as well as evaluating the overall financial statement presentation. Our procedures included confirmation of securities owned as of April 30, 2016, by correspondence with the custodians and brokers; when replies were not received from brokers, we performed other auditing procedures. We believe that our audits provide a reasonable basis for our opinion.
In our opinion, such financial statements and financial highlights referred to above present fairly, in all material respects, the financial position of Fidelity Diversified International Fund as of April 30, 2016, the results of its operations for the six-months then ended, the changes in its net assets for the six months ended April 30, 2016 and for the year ended October 31, 2015, and the financial highlights for the six months ended April 30, 2016 and for each of the five years in the period ended October 31, 2015, in conformity with accounting principles generally accepted in the United States of America.
DELOITTE & TOUCHE LLP
Boston, Massachusetts
June 15, 2016
Shareholder Expense Example
As a shareholder of the Fund, you incur two types of costs: (1) transaction costs, including redemption fees and (2) ongoing costs, including management fees and other Fund expenses. This Example is intended to help you understand your ongoing costs (in dollars) of investing in the Fund and to compare these costs with the ongoing costs of investing in other mutual funds.
The Example is based on an investment of $1,000 invested at the beginning of the period and held for the entire period (November 1, 2015 to April 30, 2016).
Actual Expenses
The first line of the accompanying table for each class of the Fund provides information about actual account values and actual expenses. You may use the information in this line, together with the amount you invested, to estimate the expenses that you paid over the period. Simply divide your account value by $1,000.00 (for example, an $8,600 account value divided by $1,000.00 = 8.6), then multiply the result by the number in the first line for a class of the Fund under the heading entitled "Expenses Paid During Period" to estimate the expenses you paid on your account during this period. A small balance maintenance fee of $12.00 that is charged once a year may apply for certain accounts with a value of less than $2,000. This fee is not included in the table below. If it was, the estimate of expenses you paid during the period would be higher, and your ending account value lower, by this amount. In addition, the Fund, as a shareholder in the underlying Fidelity Central Funds, will indirectly bear its pro-rata share of the fees and expenses incurred by the underlying Fidelity Central Funds. These fees and expenses are not included in the Fund's annualized expense ratio used to calculate the expense estimate in the table below.
Hypothetical Example for Comparison Purposes
The second line of the accompanying table for each class of the Fund provides information about hypothetical account values and hypothetical expenses based on a Class' actual expense ratio and an assumed rate of return of 5% per year before expenses, which is not the Class' actual return. The hypothetical account values and expenses may not be used to estimate the actual ending account balance or expenses you paid for the period. You may use this information to compare the ongoing costs of investing in the Fund and other funds. To do so, compare this 5% hypothetical example with the 5% hypothetical examples that appear in the shareholder reports of the other funds. A small balance maintenance fee of $12.00 that is charged once a year may apply for certain accounts with a value of less than $2,000. This fee is not included in the table below. If it was, the estimate of expenses you paid during the period would be higher, and your ending account value lower, by this amount. In addition, the Fund, as a shareholder in the underlying Fidelity Central Funds, will indirectly bear its pro-rata share of the fees and expenses incurred by the underlying Fidelity Central Funds. These fees and expenses are not included in the Fund's annualized expense ratio used to calculate the expense estimate in the table below.
Please note that the expenses shown in the table are meant to highlight your ongoing costs only and do not reflect any transaction costs. Therefore, the second line of the table is useful in comparing ongoing costs only, and will not help you determine the relative total costs of owning different funds. In addition, if these transactional costs were included, your costs would have been higher.
| Annualized Expense Ratio-A | Beginning Account Value November 1, 2015 | Ending Account Value April 30, 2016 | Expenses Paid During Period-B November 1, 2015 to April 30, 2016 | |
| Diversified International | 1.07% | |||
| Actual | $1,000.00 | $961.90 | $5.22 | |
| Hypothetical-C | $1,000.00 | $1,019.54 | $5.37 | |
| Class K | .94% | |||
| Actual | $1,000.00 | $962.60 | $4.59 | |
| Hypothetical-C | $1,000.00 | $1,020.19 | $4.72 |
A Annualized expense ratio reflects expenses net of applicable fee waivers.
B Expenses are equal to each Class' annualized expense ratio, multiplied by the average account value over the period, multiplied by 182/366 (to reflect the one-half year period).
C 5% return per year before expenses
![]()
Corporate Headquarters
245 Summer St.
Boston, MA 02210
www.fidelity.com
DIF-K-SANN-0616
1.863008.107
Fidelity's Broadly Diversified International Equity Funds Fidelity® Diversified International Fund Fidelity® International Capital Appreciation Fund Fidelity® Overseas Fund Fidelity® Worldwide Fund Semi-Annual Report April 30, 2016 |
|
Contents
Fidelity® Diversified International Fund | |
Fidelity® International Capital Appreciation Fund | |
Fidelity® Overseas Fund | |
Fidelity® Worldwide Fund | |
To view a fund's proxy voting guidelines and proxy voting record for the 12-month period ended June 30, visit http://www.fidelity.com/proxyvotingresults or visit the Securities and Exchange Commission's (SEC) web site at http://www.sec.gov.
You may also call 1-800-544-8544 to request a free copy of the proxy voting guidelines.
Standard & Poor's, S&P and S&P 500 are registered service marks of The McGraw-Hill Companies, Inc. and have been licensed for use by Fidelity Distributors Corporation.
Other third-party marks appearing herein are the property of their respective owners.
All other marks appearing herein are registered or unregistered trademarks or service marks of FMR LLC or an affiliated company. © 2016 FMR LLC. All rights reserved.
This report and the financial statements contained herein are submitted for the general information of the shareholders of the Funds. This report is not authorized for distribution to prospective investors in the Funds unless preceded or accompanied by an effective prospectus.
A fund files its complete schedule of portfolio holdings with the SEC for the first and third quarters of each fiscal year on Form N-Q. Forms N-Q are available on the SEC’s web site at http://www.sec.gov. A fund's Forms N-Q may be reviewed and copied at the SEC’s Public Reference Room in Washington, DC. Information regarding the operation of the SEC's Public Reference Room may be obtained by calling 1-800-SEC-0330.
For a complete list of a fund's portfolio holdings, view the most recent holdings listing, semiannual report, or annual report on Fidelity's web site at http://www.fidelity.com, http://www.advisor.fidelity.com, or http://www.401k.com, as applicable.
NOT FDIC INSURED •MAY LOSE VALUE •NO BANK GUARANTEE
Neither the Funds nor Fidelity Distributors Corporation is a bank.
Fidelity® Diversified International Fund
Investment Summary (Unaudited)
Geographic Diversification (% of fund's net assets)
| As of April 30, 2016 | ||
| United Kingdom | 15.6% | |
| Japan | 14.4% | |
| United States of America* | 9.9% | |
| Germany | 8.7% | |
| Switzerland | 4.7% | |
| France | 4.5% | |
| Netherlands | 4.4% | |
| Canada | 3.6% | |
| Ireland | 3.4% | |
| Other | 30.8% | |

* Includes Short-Term Investments and Net Other Assets (Liabilities).
Percentages are based on country or territory of incorporation and are adjusted for the effect of futures contracts, if applicable.
| As of October 31, 2015 | ||
| United Kingdom | 18.7% | |
| Japan | 14.6% | |
| United States of America* | 11.5% | |
| Germany | 8.0% | |
| Switzerland | 4.8% | |
| France | 4.1% | |
| Netherlands | 3.8% | |
| Ireland | 3.4% | |
| Canada | 3.2% | |
| Other | 27.9% | |

* Includes Short-Term Investments and Net Other Assets (Liabilities).
Percentages are based on country or territory of incorporation and are adjusted for the effect of futures contracts, if applicable.
Asset Allocation as of April 30, 2016
| % of fund's net assets | % of fund's net assets 6 months ago | |
| Stocks and Equity Futures | 98.9 | 96.1 |
| Other Investments | 0.0 | 0.1 |
| Short-Term Investments and Net Other Assets (Liabilities) | 1.1 | 3.8 |
Top Ten Stocks as of April 30, 2016
| % of fund's net assets | % of fund's net assets 6 months ago | |
| Novo Nordisk A/S Series B (Denmark, Pharmaceuticals) | 2.2 | 1.9 |
| ORIX Corp. (Japan, Diversified Financial Services) | 1.9 | 1.8 |
| Bayer AG (Germany, Pharmaceuticals) | 1.8 | 1.5 |
| Anheuser-Busch InBev SA NV (Belgium, Beverages) | 1.8 | 1.6 |
| AIA Group Ltd. (Hong Kong, Insurance) | 1.6 | 1.5 |
| Hoya Corp. (Japan, Health Care Equipment & Supplies) | 1.5 | 1.5 |
| Teva Pharmaceutical Industries Ltd. sponsored ADR (Israel, Pharmaceuticals) | 1.5 | 1.1 |
| Lloyds Banking Group PLC (United Kingdom, Banks) | 1.4 | 1.4 |
| Syngenta AG (Switzerland) (Switzerland, Chemicals) | 1.4 | 1.1 |
| Fresenius SE & Co. KGaA (Germany, Health Care Providers & Services) | 1.4 | 1.3 |
| 16.5 |
Market Sectors as of April 30, 2016
| % of fund's net assets | % of fund's net assets 6 months ago | |
| Financials | 21.4 | 22.3 |
| Health Care | 17.8 | 17.5 |
| Consumer Discretionary | 15.5 | 16.5 |
| Consumer Staples | 15.2 | 12.3 |
| Information Technology | 12.9 | 11.9 |
| Industrials | 6.1 | 6.2 |
| Materials | 3.6 | 3.7 |
| Energy | 3.3 | 2.6 |
| Telecommunication Services | 2.6 | 2.7 |
Percentages shown as 0.0% may reflect amounts less than 0.05%.
Fidelity® Diversified International Fund
Investments April 30, 2016
Showing Percentage of Net Assets
| Common Stocks - 96.8% | |||
| Shares | Value | ||
| Australia - 1.2% | |||
| Ansell Ltd. (a) | 2,952,731 | $44,745,023 | |
| Australia & New Zealand Banking Group Ltd. | 4,907,320 | 89,950,864 | |
| CSL Ltd. | 218,565 | 17,479,433 | |
| Magellan Financial Group Ltd. | 3,017,095 | 49,322,036 | |
| Ramsay Health Care Ltd. | 877,853 | 43,352,535 | |
| TOTAL AUSTRALIA | 244,849,891 | ||
| Austria - 0.2% | |||
| Andritz AG | 730,000 | 40,883,209 | |
| Bailiwick of Jersey - 2.0% | |||
| Shire PLC | 2,402,900 | 149,945,770 | |
| Wolseley PLC | 2,636,396 | 147,669,995 | |
| WPP PLC | 5,247,109 | 122,586,031 | |
| TOTAL BAILIWICK OF JERSEY | 420,201,796 | ||
| Belgium - 2.6% | |||
| Anheuser-Busch InBev SA NV | 3,016,230 | 373,348,662 | |
| KBC Groep NV | 3,081,996 | 173,028,807 | |
| TOTAL BELGIUM | 546,377,469 | ||
| Canada - 3.6% | |||
| Alimentation Couche-Tard, Inc. Class B (sub. vtg.) | 4,721,481 | 206,966,968 | |
| Cenovus Energy, Inc. | 2,569,500 | 40,732,729 | |
| CGI Group, Inc. Class A (sub. vtg.) (a) | 3,291,700 | 150,378,771 | |
| Constellation Software, Inc. | 67,838 | 26,511,266 | |
| Fairfax India Holdings Corp. (a) | 5,973,900 | 66,310,290 | |
| Imperial Oil Ltd. | 1,636,900 | 54,285,016 | |
| Keyera Corp. (b) | 1,175,300 | 37,852,772 | |
| PrairieSky Royalty Ltd. (b) | 940,198 | 19,797,586 | |
| Suncor Energy, Inc. | 3,579,400 | 105,068,384 | |
| Tourmaline Oil Corp. (a) | 2,189,900 | 50,510,645 | |
| TOTAL CANADA | 758,414,427 | ||
| Cayman Islands - 1.0% | |||
| 58.com, Inc. ADR (a) | 385,400 | 21,062,110 | |
| Alibaba Group Holding Ltd. sponsored ADR (a) | 2,208,900 | 169,952,766 | |
| Regina Miracle International Holdings Ltd. (a) | 12,439,271 | 18,874,469 | |
| TOTAL CAYMAN ISLANDS | 209,889,345 | ||
| China - 0.8% | |||
| Inner Mongoli Yili Industries Co. Ltd. | 5,581,400 | 12,957,645 | |
| Kweichow Moutai Co. Ltd. | 2,230,910 | 86,561,672 | |
| Qingdao Haier Co. Ltd. | 45,397,678 | 58,412,069 | |
| Weifu High-Technology Co. Ltd. (B Shares) | 2,943,629 | 6,223,558 | |
| TOTAL CHINA | 164,154,944 | ||
| Curacao - 0.8% | |||
| Schlumberger Ltd. | 2,077,125 | 166,876,223 | |
| Denmark - 2.9% | |||
| Genmab A/S (a) | 925,476 | 137,119,158 | |
| NNIT A/S | 680,095 | 18,520,365 | |
| Novo Nordisk A/S Series B | 8,155,495 | 455,357,133 | |
| TOTAL DENMARK | 610,996,656 | ||
| Finland - 0.3% | |||
| Sampo Oyj (A Shares) | 1,329,300 | 58,038,244 | |
| France - 4.5% | |||
| Accor SA (b) | 2,377,982 | 105,335,707 | |
| Air Liquide SA | 241,570 | 27,398,058 | |
| ALTEN | 384,500 | 23,774,673 | |
| Amundi SA | 2,191,884 | 100,869,536 | |
| AXA SA | 5,561,800 | 140,433,209 | |
| Capgemini SA | 548,384 | 51,194,896 | |
| Danone SA | 1,194,034 | 83,658,056 | |
| Publicis Groupe SA | 618,016 | 45,735,174 | |
| Sanofi SA (b) | 3,489,550 | 287,631,608 | |
| VINCI SA | 576,300 | 43,051,375 | |
| Worldline SA (a)(c) | 1,339,000 | 37,502,609 | |
| TOTAL FRANCE | 946,584,901 | ||
| Germany - 7.6% | |||
| adidas AG | 1,203,800 | 155,209,100 | |
| Axel Springer Verlag AG | 439,500 | 24,538,444 | |
| Bayer AG | 3,288,262 | 379,346,358 | |
| Brenntag AG | 863,800 | 50,651,513 | |
| Continental AG | 522,000 | 114,641,948 | |
| Deutsche Boerse AG | 478,900 | 39,312,247 | |
| Deutsche Post AG | 686,477 | 20,164,069 | |
| Fresenius SE & Co. KGaA | 3,988,100 | 290,068,774 | |
| KION Group AG | 1,152,600 | 62,795,353 | |
| ProSiebenSat.1 Media AG | 2,859,290 | 145,759,816 | |
| Rational AG | 11,525 | 5,850,757 | |
| SAP AG | 2,818,181 | 221,117,434 | |
| Symrise AG | 1,253,800 | 83,067,501 | |
| TOTAL GERMANY | 1,592,523,314 | ||
| Hong Kong - 2.2% | |||
| AIA Group Ltd. | 56,237,800 | 336,561,075 | |
| China Resources Beer Holdings Co. Ltd. | 16,168,000 | 35,527,733 | |
| Hang Seng Bank Ltd. | 1,586,900 | 28,771,377 | |
| Techtronic Industries Co. Ltd. | 16,458,500 | 61,697,484 | |
| TOTAL HONG KONG | 462,557,669 | ||
| India - 3.1% | |||
| Apollo Hospitals Enterprise Ltd. | 1,724,846 | 34,072,106 | |
| Axis Bank Ltd. (a) | 6,056,162 | 43,069,769 | |
| Bharti Infratel Ltd. | 15,702,404 | 88,634,882 | |
| HCL Technologies Ltd. | 3,632,422 | 41,029,518 | |
| HDFC Bank Ltd. (a) | 10,285,876 | 209,079,292 | |
| Housing Development Finance Corp. Ltd. | 8,291,778 | 135,869,294 | |
| ITC Ltd. | 16,601,304 | 81,212,693 | |
| LIC Housing Finance Ltd. (a) | 3,164,765 | 22,025,741 | |
| TOTAL INDIA | 654,993,295 | ||
| Indonesia - 0.5% | |||
| PT Bank Central Asia Tbk | 49,958,200 | 49,435,434 | |
| PT Bank Rakyat Indonesia Tbk | 68,786,700 | 53,984,103 | |
| TOTAL INDONESIA | 103,419,537 | ||
| Ireland - 3.4% | |||
| Allergan PLC (a) | 729,200 | 157,915,552 | |
| DCC PLC (United Kingdom) | 815,289 | 72,190,327 | |
| Greencore Group PLC | 9,774,700 | 51,530,549 | |
| Horizon Pharma PLC (a) | 2,441,200 | 37,521,244 | |
| Kerry Group PLC Class A | 1,019,000 | 90,859,179 | |
| Medtronic PLC | 1,456,800 | 115,305,720 | |
| Ryanair Holdings PLC sponsored ADR | 2,206,132 | 178,586,385 | |
| TOTAL IRELAND | 703,908,956 | ||
| Isle of Man - 0.6% | |||
| Optimal Payments PLC (a) | 11,969,437 | 66,668,613 | |
| Playtech Ltd. | 5,256,097 | 61,785,167 | |
| TOTAL ISLE OF MAN | 128,453,780 | ||
| Israel - 2.1% | |||
| Check Point Software Technologies Ltd. (a) | 1,470,000 | 121,818,900 | |
| Teva Pharmaceutical Industries Ltd. sponsored ADR | 5,757,600 | 313,501,320 | |
| TOTAL ISRAEL | 435,320,220 | ||
| Italy - 0.7% | |||
| Intesa Sanpaolo SpA | 38,694,000 | 107,561,598 | |
| Mediaset SpA | 8,358,800 | 37,614,989 | |
| TOTAL ITALY | 145,176,587 | ||
| Japan - 14.4% | |||
| Astellas Pharma, Inc. | 15,834,200 | 213,486,090 | |
| Casio Computer Co. Ltd. (b) | 2,456,500 | 46,739,643 | |
| Dentsu, Inc. | 1,877,400 | 95,388,833 | |
| Don Quijote Holdings Co. Ltd. | 2,001,300 | 71,197,912 | |
| Fast Retailing Co. Ltd. | 96,700 | 25,461,332 | |
| Glory Ltd. (d) | 612,900 | 20,073,267 | |
| Hoya Corp. | 8,342,600 | 319,473,825 | |
| Japan Exchange Group, Inc. | 6,965,500 | 103,738,896 | |
| Japan Tobacco, Inc. | 5,285,100 | 215,938,294 | |
| KDDI Corp. | 7,392,800 | 212,955,026 | |
| Keyence Corp. | 416,310 | 249,533,311 | |
| Kubota Corp. | 750,000 | 10,925,142 | |
| Minebea Mitsumi, Inc. | 2,614,000 | 21,411,246 | |
| Misumi Group, Inc. | 2,029,200 | 28,022,800 | |
| Mitsubishi UFJ Financial Group, Inc. | 23,766,100 | 109,676,167 | |
| NGK Spark Plug Co. Ltd. | 1,653,600 | 32,978,359 | |
| Nippon Paint Holdings Co. Ltd. | 444,200 | 11,663,310 | |
| Nitori Holdings Co. Ltd. | 893,800 | 83,140,223 | |
| Olympus Corp. | 2,352,800 | 91,657,147 | |
| ORIX Corp. | 28,118,800 | 397,738,620 | |
| Rakuten, Inc. | 9,015,800 | 98,014,054 | |
| Seven & i Holdings Co. Ltd. | 2,509,900 | 102,410,039 | |
| SHIMANO, Inc. | 632,300 | 90,716,983 | |
| Shinsei Bank Ltd. | 26,481,000 | 37,115,145 | |
| SoftBank Corp. | 1,627,900 | 87,532,999 | |
| Suzuki Motor Corp. | 1,491,600 | 40,875,157 | |
| Tsuruha Holdings, Inc. | 1,526,000 | 146,367,261 | |
| Welcia Holdings Co. Ltd. | 614,600 | 32,464,695 | |
| TOTAL JAPAN | 2,996,695,776 | ||
| Korea (South) - 0.3% | |||
| Orion Corp. | 70,722 | 57,408,480 | |
| Luxembourg - 0.4% | |||
| Eurofins Scientific SA | 217,579 | 80,733,439 | |
| Netherlands - 4.4% | |||
| AerCap Holdings NV (a) | 1,739,700 | 69,605,397 | |
| Altice NV: | |||
| Class A (a) | 9,058,138 | 137,429,277 | |
| Class B (a) | 3,110,964 | 47,537,683 | |
| Gree Electric Appliances, Inc. of Zhuhai ELS (BNP Paribas Warrants Program) (A Shares)warrants 11/24/16 (a)(c) | 1,832,000 | 5,438,796 | |
| IMCD Group BV | 1,604,947 | 64,798,873 | |
| ING Groep NV (Certificaten Van Aandelen) | 10,426,800 | 127,689,822 | |
| NXP Semiconductors NV (a) | 906,600 | 77,314,848 | |
| RELX NV | 7,705,506 | 129,303,844 | |
| Unilever NV (Certificaten Van Aandelen) (Bearer) (b) | 5,700,157 | 250,407,003 | |
| TOTAL NETHERLANDS | 909,525,543 | ||
| New Zealand - 0.1% | |||
| Ryman Healthcare Group Ltd. | 2,763,492 | 17,231,402 | |
| Norway - 0.4% | |||
| Statoil ASA (b) | 5,237,700 | 92,190,303 | |
| Philippines - 0.2% | |||
| Alliance Global Group, Inc. | 150,892,156 | 46,517,195 | |
| Singapore - 0.6% | |||
| Broadcom Ltd. | 416,400 | 60,690,300 | |
| United Overseas Bank Ltd. | 4,329,000 | 59,872,402 | |
| TOTAL SINGAPORE | 120,562,702 | ||
| South Africa - 1.0% | |||
| Naspers Ltd. Class N | 1,502,599 | 206,171,751 | |
| Spain - 2.2% | |||
| Amadeus IT Holding SA Class A | 3,632,600 | 165,298,873 | |
| Hispania Activos Inmobiliarios SA (a) | 2,463,300 | 36,103,701 | |
| Inditex SA | 7,342,542 | 235,706,441 | |
| Telepizza Group SAU | 2,185,800 | 15,392,529 | |
| TOTAL SPAIN | 452,501,544 | ||
| Sweden - 2.7% | |||
| ASSA ABLOY AB (B Shares) | 4,478,400 | 93,912,864 | |
| Coor Service Management Holding AB (e) | 5,263,600 | 24,907,297 | |
| HEXPOL AB (B Shares) (b) | 1,620,800 | 16,752,038 | |
| Nordea Bank AB | 13,901,600 | 134,940,099 | |
| Svenska Cellulosa AB (SCA) (B Shares) | 6,608,800 | 208,128,501 | |
| Svenska Handelsbanken AB (A Shares) | 6,706,700 | 89,468,403 | |
| TOTAL SWEDEN | 568,109,202 | ||
| Switzerland - 4.7% | |||
| Actelion Ltd. | 671,276 | 108,462,191 | |
| Compagnie Financiere Richemont SA Series A | 532,865 | 35,531,583 | |
| Credit Suisse Group AG | 5,797,094 | 88,222,860 | |
| GAM Holding Ltd. | 990,613 | 12,908,019 | |
| Julius Baer Group Ltd. | 760,650 | 32,598,242 | |
| Roche Holding AG (participation certificate) | 618,734 | 156,545,411 | |
| Sika AG | 27,395 | 116,599,380 | |
| Syngenta AG (Switzerland) | 726,566 | 290,838,470 | |
| UBS Group AG | 8,657,887 | 149,818,539 | |
| TOTAL SWITZERLAND | 991,524,695 | ||
| Taiwan - 1.2% | |||
| Taiwan Semiconductor Manufacturing Co. Ltd. sponsored ADR | 10,430,600 | 246,057,854 | |
| Thailand - 0.2% | |||
| Kasikornbank PCL (For. Reg.) | 9,204,200 | 44,017,795 | |
| United Kingdom - 15.6% | |||
| AA PLC | 5,871,215 | 23,900,330 | |
| Associated British Foods PLC | 1,646,000 | 73,690,821 | |
| B&M European Value Retail S.A. | 27,155,047 | 110,065,654 | |
| British American Tobacco PLC sponsored ADR | 826,200 | 100,920,330 | |
| BT Group PLC | 24,345,500 | 157,809,263 | |
| Bunzl PLC | 1,849,170 | 55,092,042 | |
| Capita Group PLC | 3,160,500 | 46,225,825 | |
| Compass Group PLC | 6,437,376 | 114,639,295 | |
| Dignity PLC | 178,900 | 6,378,154 | |
| Essentra PLC (e) | 13,275,712 | 157,510,190 | |
| Halma PLC | 1,243,100 | 16,201,892 | |
| Howden Joinery Group PLC | 6,018,400 | 43,441,299 | |
| IMI PLC | 1,829,535 | 24,994,654 | |
| Imperial Tobacco Group PLC | 2,904,132 | 157,789,806 | |
| Indivior PLC | 10,338,900 | 24,291,547 | |
| ITV PLC | 43,061,500 | 141,694,288 | |
| Liberty Global PLC: | |||
| Class A (a) | 1,680,900 | 63,420,357 | |
| Class C (a) | 718,400 | 26,293,440 | |
| Lloyds Banking Group PLC | 306,526,900 | 300,859,529 | |
| London Stock Exchange Group PLC | 2,519,800 | 99,887,391 | |
| Melrose Industries PLC | 3,752,192 | 20,466,230 | |
| Micro Focus International PLC | 4,225,300 | 94,397,358 | |
| Next PLC | 1,913,500 | 142,172,050 | |
| Poundland Group PLC (e) | 15,009,178 | 37,720,736 | |
| Prudential PLC | 12,855,975 | 253,770,955 | |
| Reckitt Benckiser Group PLC | 2,273,387 | 221,470,848 | |
| Rio Tinto PLC | 621,100 | 20,835,605 | |
| Rolls-Royce Group PLC | 8,079,900 | 79,040,808 | |
| SABMiller PLC | 2,138,400 | 130,761,294 | |
| Schroders PLC | 1,512,300 | 55,551,786 | |
| Softcat PLC | 5,267,100 | 24,550,314 | |
| Sophos Group PLC | 5,554,717 | 16,662,712 | |
| Spectris PLC | 1,737,400 | 46,227,943 | |
| St. James's Place Capital PLC | 13,249,300 | 167,844,392 | |
| The Restaurant Group PLC | 6,201,467 | 24,927,563 | |
| Virgin Money Holdings Uk PLC | 11,584,682 | 61,800,324 | |
| Whitbread PLC | 1,838,197 | 103,997,334 | |
| TOTAL UNITED KINGDOM | 3,247,304,359 | ||
| United States of America - 8.3% | |||
| Alphabet, Inc.: | |||
| Class A | 108,805 | 77,020,883 | |
| Class C | 210,903 | 146,157,888 | |
| Amgen, Inc. | 703,400 | 111,348,220 | |
| Baxalta, Inc. | 1,278,200 | 53,620,490 | |
| Celgene Corp. (a) | 714,300 | 73,865,763 | |
| Coach, Inc. | 519,800 | 20,932,346 | |
| Cognizant Technology Solutions Corp. Class A (a) | 1,037,400 | 60,553,038 | |
| Coty, Inc. Class A (b) | 3,195,800 | 97,152,320 | |
| Fidelity National Information Services, Inc. | 530,700 | 34,920,060 | |
| Las Vegas Sands Corp. | 1,943,100 | 87,730,965 | |
| MasterCard, Inc. Class A | 1,636,500 | 158,724,135 | |
| McGraw Hill Financial, Inc. | 2,269,000 | 242,442,650 | |
| Mead Johnson Nutrition Co. Class A | 247,400 | 21,560,910 | |
| Molson Coors Brewing Co. Class B | 636,800 | 60,897,184 | |
| MSCI, Inc. Class A | 289,000 | 21,946,660 | |
| NJOY, Inc. (a)(f) | 9,361,812 | 1,198,312 | |
| Noble Energy, Inc. | 924,856 | 33,396,550 | |
| Oceaneering International, Inc. | 1,246,600 | 45,687,890 | |
| Phillips 66 Co. | 533,400 | 43,797,474 | |
| Qualcomm, Inc. | 1,726,000 | 87,197,520 | |
| Spectrum Brands Holdings, Inc. | 249,700 | 28,365,920 | |
| Verisk Analytics, Inc. (a) | 274,800 | 21,318,984 | |
| Visa, Inc. Class A | 2,191,300 | 169,256,012 | |
| Western Digital Corp. | 681,800 | 27,861,757 | |
| TOTAL UNITED STATES OF AMERICA | 1,726,953,931 | ||
| TOTAL COMMON STOCKS | |||
| (Cost $16,457,701,662) | 20,197,126,434 | ||
| Nonconvertible Preferred Stocks - 1.6% | |||
| Brazil - 0.5% | |||
| Itau Unibanco Holding SA | 10,727,500 | 102,526,110 | |
| Germany - 1.1% | |||
| Henkel AG & Co. KGaA | 1,864,900 | 212,857,045 | |
| Jungheinrich AG | 133,700 | 12,604,162 | |
| TOTAL GERMANY | 225,461,207 | ||
| United Kingdom - 0.0% | |||
| Rolls-Royce Group PLC | 573,672,900 | 838,222 | |
| TOTAL NONCONVERTIBLE PREFERRED STOCKS | |||
| (Cost $262,716,240) | 328,825,539 | ||
| Principal Amount | Value | ||
| Government Obligations - 0.0% | |||
| United States of America - 0.0% | |||
| U.S. Treasury Bills, yield at date of purchase 0.25% to 0.33% 5/26/16 to 7/28/16(g) | |||
| (Cost $6,617,073) | 6,620,000 | 6,617,900 | |
| Shares | Value | ||
| Money Market Funds - 3.3% | |||
| Fidelity Cash Central Fund, 0.38% (h) | 193,027,021 | 193,027,021 | |
| Fidelity Securities Lending Cash Central Fund, 0.42% (h)(i) | 489,239,092 | 489,239,092 | |
| TOTAL MONEY MARKET FUNDS | |||
| (Cost $682,266,113) | 682,266,113 | ||
| TOTAL INVESTMENT PORTFOLIO - 101.7% | |||
| (Cost $17,409,301,088) | 21,214,835,986 | ||
| NET OTHER ASSETS (LIABILITIES) - (1.7)% | (352,640,308) | ||
| NET ASSETS - 100% | $20,862,195,678 |
| Futures Contracts | |||
| Expiration Date | Underlying Face Amount at Value | Unrealized Appreciation/(Depreciation) | |
| Purchased | |||
| Equity Index Contracts | |||
| 1,256 CME Nikkei 225 Index Contracts (United States) | June 2016 | 100,009,000 | $(6,820,937) |
The face value of futures purchased as a percentage of Net Assets is 0.5%
Security Type Abbreviations
ELS – Equity-Linked Security
Categorizations in the Schedule of Investments are based on country or territory of incorporation.
Legend
(a) Non-income producing
(b) Security or a portion of the security is on loan at period end.
(c) Security exempt from registration under Rule 144A of the Securities Act of 1933. These securities may be resold in transactions exempt from registration, normally to qualified institutional buyers. At the end of the period, the value of these securities amounted to $42,941,405 or 0.2% of net assets.
(d) A portion of the security sold on a delayed delivery basis.
(e) Affiliated company
(f) Restricted securities - Investment in securities not registered under the Securities Act of 1933 (excluding 144A issues). At the end of the period, the value of restricted securities (excluding 144A issues) amounted to $1,198,312 or 0.0% of net assets.
(g) Security or a portion of the security was pledged to cover margin requirements for futures contracts. At period end, the value of securities pledged amounted to $6,617,900.
(h) Affiliated fund that is generally available only to investment companies and other accounts managed by Fidelity Investments. The rate quoted is the annualized seven-day yield of the fund at period end. A complete unaudited listing of the fund's holdings as of its most recent quarter end is available upon request. In addition, each Fidelity Central Fund's financial statements, which are not covered by the Fund's Report of Independent Registered Public Accounting Firm, are available on the SEC's website or upon request.
(i) Investment made with cash collateral received from securities on loan.
Additional information on each restricted holding is as follows:
| Security | Acquisition Date | Acquisition Cost |
| NJOY, Inc. | 6/7/13 - 2/14/14 | $10,471,244 |
Affiliated Central Funds
Information regarding fiscal year to date income earned by the Fund from investments in Fidelity Central Funds is as follows:
| Fund | Income earned |
| Fidelity Cash Central Fund | $900,333 |
| Fidelity Securities Lending Cash Central Fund | 2,758,295 |
| Total | $3,658,628 |
Other Affiliated Issuers
An affiliated company is a company in which the Fund has ownership of at least 5% of the voting securities. Fiscal year to date transactions with companies which are or were affiliates are as follows:
| Affiliate | Value, beginning of period | Purchases | Sales Proceeds* | Dividend Income | Value, end of period |
| Coor Service Management Holding AB | $22,025,249 | $-- | $564,115 | $1,114,274 | $24,907,297 |
| Essentra PLC | 176,517,577 | -- | 3,709,777 | 2,787,249 | 157,510,190 |
| Fairfax India Holdings Corp. | 64,252,650 | -- | 1,493,380 | -- | -- |
| Poundland Group PLC | 60,695,655 | 2,415,927 | 1,011,783 | 347,496 | 37,720,736 |
| Total | $323,491,131 | $2,415,927 | $6,779,055 | $4,249,019 | $220,138,223 |
* Includes the value of securities delivered through in-kind transactions, if applicable.
Investment Valuation
The following is a summary of the inputs used, as of April 30, 2016, involving the Fund's assets and liabilities carried at fair value. The inputs or methodology used for valuing securities may not be an indication of the risk associated with investing in those securities. For more information on valuation inputs, and their aggregation into the levels used below, please refer to the Investment Valuation section in the accompanying Notes to Financial Statements.
| Valuation Inputs at Reporting Date: | ||||
| Description | Total | Level 1 | Level 2 | Level 3 |
| Investments in Securities: | ||||
| Equities: | ||||
| Consumer Discretionary | $3,236,726,516 | $2,251,951,672 | $983,576,532 | $1,198,312 |
| Consumer Staples | 3,141,213,908 | 2,303,376,982 | 837,836,926 | -- |
| Energy | 690,195,572 | 598,005,269 | 92,190,303 | -- |
| Financials | 4,500,290,519 | 2,169,305,491 | 2,330,985,028 | -- |
| Health Care | 3,732,597,624 | 2,058,500,640 | 1,674,096,984 | -- |
| Industrials | 1,262,597,991 | 1,014,331,472 | 248,266,519 | -- |
| Information Technology | 2,690,733,121 | 2,220,082,376 | 470,650,745 | -- |
| Materials | 724,664,552 | 664,767,579 | 59,896,973 | -- |
| Telecommunication Services | 546,932,170 | 88,634,882 | 458,297,288 | -- |
| Government Obligations | 6,617,900 | -- | 6,617,900 | -- |
| Money Market Funds | 682,266,113 | 682,266,113 | -- | -- |
| Total Investments in Securities: | $21,214,835,986 | $14,051,222,476 | $7,162,415,198 | $1,198,312 |
| Derivative Instruments: | ||||
| Liabilities | ||||
| Futures Contracts | $(6,820,937) | $(6,820,937) | $-- | $-- |
| Total Liabilities | $(6,820,937) | $(6,820,937) | $-- | $-- |
| Total Derivative Instruments: | $(6,820,937) | $(6,820,937) | $-- | $-- |
The following is a summary of transfers between Level 1 and Level 2 for the period ended April 30, 2016. Transfers are assumed to have occurred at the beginning of the period, and are primarily attributable to the valuation techniques used for foreign equity securities, as discussed in the accompanying Notes to Financial Statements:
| Transfers | Total |
| Level 1 to Level 2 | $327,803,309 |
| Level 2 to Level 1 | $2,317,070,644 |
Value of Derivative Instruments
The following table is a summary of the Fund's value of derivative instruments by primary risk exposure as of April 30, 2016. For additional information on derivative instruments, please refer to the Derivative Instruments section in the accompanying Notes to Financial Statements.
| Primary Risk Exposure / Derivative Type | Value | |
| Asset | Liability | |
| Equity Risk | ||
| Futures Contracts(a) | $0 | $(6,820,937) |
| Total Equity Risk | 0 | (6,820,937) |
| Total Value of Derivatives | $0 | $(6,820,937) |
(a) Reflects gross cumulative appreciation (depreciation) on futures contracts as presented in the Schedule of Investments. In the Statement of Assets and Liabilities, the period end daily variation margin is included in receivable or payable for daily variation margin for derivative instruments, and the net cumulative appreciation (depreciation) is included in net unrealized appreciation (depreciation).
See accompanying notes which are an integral part of the financial statements.
Fidelity® Diversified International Fund
Financial Statements
Statement of Assets and Liabilities
| April 30, 2016 | ||
| Assets | ||
| Investment in securities, at value (including securities loaned of $456,030,327) — See accompanying schedule: Unaffiliated issuers (cost $16,486,374,161) | $20,312,431,650 | |
| Fidelity Central Funds (cost $682,266,113) | 682,266,113 | |
| Other affiliated issuers (cost $240,660,814) | 220,138,223 | |
| Total Investments (cost $17,409,301,088) | $21,214,835,986 | |
| Foreign currency held at value (cost $1,167,659) | 1,167,659 | |
| Receivable for investments sold | ||
| Regular delivery | 73,143,255 | |
| Delayed delivery | 453,889 | |
| Receivable for fund shares sold | 14,641,483 | |
| Dividends receivable | 123,105,241 | |
| Distributions receivable from Fidelity Central Funds | 1,052,340 | |
| Prepaid expenses | 18,989 | |
| Other receivables | 1,595,224 | |
| Total assets | 21,430,014,066 | |
| Liabilities | ||
| Payable for investments purchased | $23,866,675 | |
| Payable for fund shares redeemed | 33,350,437 | |
| Accrued management fee | 14,746,567 | |
| Payable for daily variation margin for derivative instruments | 2,574,800 | |
| Other affiliated payables | 2,280,994 | |
| Other payables and accrued expenses | 1,759,823 | |
| Collateral on securities loaned, at value | 489,239,092 | |
| Total liabilities | 567,818,388 | |
| Net Assets | $20,862,195,678 | |
| Net Assets consist of: | ||
| Paid in capital | $17,325,464,003 | |
| Undistributed net investment income | 129,578,937 | |
| Accumulated undistributed net realized gain (loss) on investments and foreign currency transactions | (393,065,236) | |
| Net unrealized appreciation (depreciation) on investments and assets and liabilities in foreign currencies | 3,800,217,974 | |
| Net Assets | $20,862,195,678 | |
| Diversified International: | ||
| Net Asset Value, offering price and redemption price per share ($11,817,235,192 ÷ 345,097,099 shares) | $34.24 | |
| Class K: | ||
| Net Asset Value, offering price and redemption price per share ($9,044,960,486 ÷ 264,569,911 shares) | $34.19 |
See accompanying notes which are an integral part of the financial statements.
Statement of Operations
| Six months ended April 30, 2016 | ||
| Investment Income | ||
| Dividends (including $4,249,019 earned from other affiliated issuers) | $254,410,456 | |
| Interest | 41,262 | |
| Income from Fidelity Central Funds | 3,658,628 | |
| Income before foreign taxes withheld | 258,110,346 | |
| Less foreign taxes withheld | (18,972,856) | |
| Total income | 239,137,490 | |
| Expenses | ||
| Management fee | ||
| Basic fee | $71,844,117 | |
| Performance adjustment | 21,391,508 | |
| Transfer agent fees | 12,847,941 | |
| Accounting and security lending fees | 1,129,743 | |
| Custodian fees and expenses | 998,619 | |
| Independent trustees' compensation | 47,597 | |
| Appreciation in deferred trustee compensation account | 5 | |
| Registration fees | 95,852 | |
| Audit | 91,476 | |
| Legal | 32,513 | |
| Miscellaneous | 75,690 | |
| Total expenses before reductions | 108,555,061 | |
| Expense reductions | (238,137) | 108,316,924 |
| Net investment income (loss) | 130,820,566 | |
| Realized and Unrealized Gain (Loss) | ||
| Net realized gain (loss) on: | ||
| Investment securities: | ||
| Unaffiliated issuers | (177,598,081) | |
| Other affiliated issuers | 1,794,941 | |
| Foreign currency transactions | 1,239,915 | |
| Futures contracts | (6,473,079) | |
| Total net realized gain (loss) | (181,036,304) | |
| Change in net unrealized appreciation (depreciation) on: Investment securities | (837,341,372) | |
| Assets and liabilities in foreign currencies | 1,303,758 | |
| Futures contracts | (12,506,904) | |
| Total change in net unrealized appreciation (depreciation) | (848,544,518) | |
| Net gain (loss) | (1,029,580,822) | |
| Net increase (decrease) in net assets resulting from operations | $(898,760,256) |
See accompanying notes which are an integral part of the financial statements.
Statement of Changes in Net Assets
| Six months ended April 30, 2016 | Year ended October 31, 2015 | |
| Increase (Decrease) in Net Assets | ||
| Operations | ||
| Net investment income (loss) | $130,820,566 | $255,650,579 |
| Net realized gain (loss) | (181,036,304) | 526,274,148 |
| Change in net unrealized appreciation (depreciation) | (848,544,518) | 59,726,439 |
| Net increase (decrease) in net assets resulting from operations | (898,760,256) | 841,651,166 |
| Distributions to shareholders from net investment income | (211,286,764) | (285,525,428) |
| Distributions to shareholders from net realized gain | (103,786,301) | (625,108,082) |
| Total distributions | (315,073,065) | (910,633,510) |
| Share transactions - net increase (decrease) | (1,127,571,911) | (1,643,491,859) |
| Redemption fees | 78,123 | 259,689 |
| Total increase (decrease) in net assets | (2,341,327,109) | (1,712,214,514) |
| Net Assets | ||
| Beginning of period | 23,203,522,787 | 24,915,737,301 |
| End of period (including undistributed net investment income of $129,578,937 and undistributed net investment income of $210,045,135, respectively) | $20,862,195,678 | $23,203,522,787 |
See accompanying notes which are an integral part of the financial statements.
Financial Highlights — Fidelity Diversified International Fund
| Six months ended April 30, | Years ended October 31, | |||||
| 2016 | 2015 | 2014 | 2013 | 2012 | 2011 | |
| Selected Per–Share Data | ||||||
| Net asset value, beginning of period | $36.07 | $36.22 | $35.89 | $29.07 | $27.49 | $29.49 |
| Income from Investment Operations | ||||||
| Net investment income (loss)A | .20 | .36 | .60B | .44 | .42 | .53C |
| Net realized and unrealized gain (loss) | (1.56) | .80 | .28 | 6.90 | 1.65 | (1.99) |
| Total from investment operations | (1.36) | 1.16 | .88 | 7.34 | 2.07 | (1.46) |
| Distributions from net investment income | (.31) | (.40) | (.32) | (.46) | (.49) | (.46) |
| Distributions from net realized gain | (.16) | (.92) | (.23) | (.07) | – | (.08) |
| Total distributions | (.47) | (1.31)D | (.55) | (.52)E | (.49) | (.54) |
| Redemption fees added to paid in capitalA,F | – | – | – | – | – | – |
| Net asset value, end of period | $34.24 | $36.07 | $36.22 | $35.89 | $29.07 | $27.49 |
| Total ReturnG,H | (3.81)% | 3.29% | 2.48% | 25.66% | 7.72% | (5.07)% |
| Ratios to Average Net AssetsI,J | ||||||
| Expenses before reductions | 1.07%K | 1.00% | .93% | .94% | 1.01% | .90% |
| Expenses net of fee waivers, if any | 1.07%K | .99% | .93% | .94% | 1.01% | .89% |
| Expenses net of all reductions | 1.07%K | .99% | .92% | .92% | .99% | .87% |
| Net investment income (loss) | 1.17%K | .98% | 1.65%B | 1.38% | 1.53% | 1.78%C |
| Supplemental Data | ||||||
| Net assets, end of period (000 omitted) | $11,817,235 | $13,059,983 | $13,781,306 | $14,432,586 | $13,269,769 | $17,285,369 |
| Portfolio turnover rateL | 24%K,M | 31%M | 39%M | 52% | 35% | 45% |
A Calculated based on average shares outstanding during the period.
B Net Investment income per share reflects a large, non-recurring dividend which amounted to $.18 per share. Excluding this non-recurring dividend, the ratio of net investment income (loss) to average net assets would have been 1.16%.
C Net Investment income per share reflects a large, non-recurring dividend which amounted to $.10 per share. Excluding this non-recurring dividend, the ratio of net investment income (loss) to average net assets would have been 1.44%.
D Total distributions of $1.31 per share is comprised of distributions from net investment income of $.397 and distributions from net realized gain of $.917 per share.
E Total distributions of $.52 per share is comprised of distributions from net investment income of $.456 and distributions from net realized gain of $.068 per share.
F Amount represents less than $.005 per share.
G Total returns for periods of less than one year are not annualized.
H Total returns would have been lower if certain expenses had not been reduced during the applicable periods shown.
I Fees and expenses of any underlying Fidelity Central Funds are not included in the Fund's expense ratio. The Fund indirectly bears its proportionate share of the expenses of any underlying Fidelity Central Funds.
J Expense ratios reflect operating expenses of the class. Expenses before reductions do not reflect amounts reimbursed by the investment adviser or reductions from brokerage service arrangements or reductions from other expense offset arrangements and do not represent the amount paid by the class during periods when reimbursements or reductions occur. Expenses net of fee waivers reflect expenses after reimbursement by the investment adviser but prior to reductions from brokerage service arrangements or other expense offset arrangements. Expenses net of all reductions represent the net expenses paid by the class.
K Annualized
L Amount does not include the portfolio activity of any underlying Fidelity Central Funds.
M Portfolio turnover rate excludes securities received or delivered in-kind.
See accompanying notes which are an integral part of the financial statements.
Financial Highlights — Fidelity Diversified International Fund Class K
| Six months ended April 30, | Years ended October 31, | |||||
| 2016 | 2015 | 2014 | 2013 | 2012 | 2011 | |
| Selected Per–Share Data | ||||||
| Net asset value, beginning of period | $36.04 | $36.20 | $35.87 | $29.06 | $27.51 | $29.51 |
| Income from Investment Operations | ||||||
| Net investment income (loss)A | .22 | .40 | .65B | .49 | .47 | .58C |
| Net realized and unrealized gain (loss) | (1.55) | .80 | .28 | 6.90 | 1.63 | (1.97) |
| Total from investment operations | (1.33) | 1.20 | .93 | 7.39 | 2.10 | (1.39) |
| Distributions from net investment income | (.36) | (.45) | (.37) | (.51) | (.55) | (.53) |
| Distributions from net realized gain | (.16) | (.92) | (.23) | (.07) | – | (.08) |
| Total distributions | (.52) | (1.36)D | (.60) | (.58) | (.55) | (.61) |
| Redemption fees added to paid in capitalA,E | – | – | – | – | – | – |
| Net asset value, end of period | $34.19 | $36.04 | $36.20 | $35.87 | $29.06 | $27.51 |
| Total ReturnF,G | (3.74)% | 3.40% | 2.63% | 25.86% | 7.86% | (4.87)% |
| Ratios to Average Net AssetsH,I | ||||||
| Expenses before reductions | .94%J | .87% | .80% | .80% | .84% | .73% |
| Expenses net of fee waivers, if any | .94%J | .87% | .80% | .80% | .84% | .72% |
| Expenses net of all reductions | .94%J | .86% | .79% | .78% | .83% | .70% |
| Net investment income (loss) | 1.30%J | 1.10% | 1.78%B | 1.52% | 1.70% | 1.95%C |
| Supplemental Data | ||||||
| Net assets, end of period (000 omitted) | $9,044,960 | $10,143,540 | $11,134,431 | $11,541,599 | $8,885,304 | $8,115,192 |
| Portfolio turnover rateK | 24%J,L | 31%L | 39%L | 52% | 35% | 45% |
A Calculated based on average shares outstanding during the period.
B Net Investment income per share reflects a large, non-recurring dividend which amounted to $.18 per share. Excluding this non-recurring dividend, the ratio of net investment income (loss) to average net assets would have been 1.29%.
C Net Investment income per share reflects a large, non-recurring dividend which amounted to $.10 per share. Excluding this non-recurring dividend, the ratio of net investment income (loss) to average net assets would have been 1.61%.
D Total distributions of $1.36 per share is comprised of distributions from net investment income of $.446 and distributions from net realized gain of $.917 per share.
E Amount represents less than $.005 per share.
F Total returns for periods of less than one year are not annualized.
G Total returns would have been lower if certain expenses had not been reduced during the applicable periods shown.
H Fees and expenses of any underlying Fidelity Central Funds are not included in the Fund's expense ratio. The Fund indirectly bears its proportionate share of the expenses of any underlying Fidelity Central Funds.
I Expense ratios reflect operating expenses of the class. Expenses before reductions do not reflect amounts reimbursed by the investment adviser or reductions from brokerage service arrangements or reductions from other expense offset arrangements and do not represent the amount paid by the class during periods when reimbursements or reductions occur. Expenses net of fee waivers reflect expenses after reimbursement by the investment adviser but prior to reductions from brokerage service arrangements or other expense offset arrangements. Expenses net of all reductions represent the net expenses paid by the class.
J Annualized
K Amount does not include the portfolio activity of any underlying Fidelity Central Funds.
L Portfolio turnover rate excludes securities received or delivered in-kind.
See accompanying notes which are an integral part of the financial statements.
Notes to Financial Statements
For the period ended April 30, 2016
1. Organization.
Fidelity Diversified International Fund (the Fund) is a fund of Fidelity Investment Trust (the Trust) and is authorized to issue an unlimited number of shares. The Trust is registered under the Investment Company Act of 1940, as amended (the 1940 Act), as an open-end management investment company organized as a Massachusetts business trust. The Fund offers Diversified International and Class K shares, each of which has equal rights as to assets and voting privileges. Each class has exclusive voting rights with respect to matters that affect that class. The Fund's investments in emerging markets can be subject to social, economic, regulatory, and political uncertainties and can be extremely volatile.
2. Investments in Fidelity Central Funds.
The Fund invests in Fidelity Central Funds, which are open-end investment companies generally available only to other investment companies and accounts managed by the investment adviser and its affiliates. The Fund's Schedule of Investments lists each of the Fidelity Central Funds held as of period end, if any, as an investment of the Fund, but does not include the underlying holdings of each Fidelity Central Fund. As an Investing Fund, the Fund indirectly bears its proportionate share of the expenses of the underlying Fidelity Central Funds.
The Money Market Central Funds seek preservation of capital and current income and are managed by Fidelity Investments Money Management, Inc. (FIMM), an affiliate of the investment adviser. Annualized expenses of the Money Market Central Funds as of their most recent shareholder report date are less than .005%.
A complete unaudited list of holdings for each Fidelity Central Fund is available upon request or at the Securities and Exchange Commission (the SEC) website at www.sec.gov. In addition, the financial statements of the Fidelity Central Funds, which are not covered by the Fund's Report of Independent Registered Public Accounting Firm, are available on the SEC website or upon request.
3. Significant Accounting Policies.
The financial statements have been prepared in conformity with accounting principles generally accepted in the United States of America (GAAP), which require management to make certain estimates and assumptions at the date of the financial statements. Actual results could differ from those estimates. Subsequent events, if any, through the date that the financial statements were issued have been evaluated in the preparation of the financial statements. The following summarizes the significant accounting policies of the Fund:
Investment Valuation. Investments are valued as of 4:00 p.m. Eastern time on the last calendar day of the period. The Board of Trustees (the Board) has delegated the day to day responsibility for the valuation of the Fund's investments to the Fidelity Management & Research Company (FMR) Fair Value Committee (the Committee). In accordance with valuation policies and procedures approved by the Board, the Fund attempts to obtain prices from one or more third party pricing vendors or brokers to value its investments. When current market prices, quotations or currency exchange rates are not readily available or reliable, investments will be fair valued in good faith by the Committee, in accordance with procedures adopted by the Board. Factors used in determining fair value vary by investment type and may include market or investment specific events, changes in interest rates and credit quality. The frequency with which these procedures are used cannot be predicted and they may be utilized to a significant extent. The Committee oversees the Fund's valuation policies and procedures and reports to the Board on the Committee's activities and fair value determinations. The Board monitors the appropriateness of the procedures used in valuing the Fund's investments and ratifies the fair value determinations of the Committee.
The Fund categorizes the inputs to valuation techniques used to value its investments into a disclosure hierarchy consisting of three levels as shown below:
- Level 1 – quoted prices in active markets for identical investments
- Level 2 – other significant observable inputs (including quoted prices for similar investments, interest rates, prepayment speeds, etc.)
- Level 3 – unobservable inputs (including the Fund's own assumptions based on the best information available)
Valuation techniques used to value the Fund's investments by major category are as follows:
Equity securities, including restricted securities, for which market quotations are readily available, are valued at the last reported sale price or official closing price as reported by a third party pricing vendor on the primary market or exchange on which they are traded and are categorized as Level 1 in the hierarchy. In the event there were no sales during the day or closing prices are not available, securities are valued at the last quoted bid price or may be valued using the last available price and are generally categorized as Level 2 in the hierarchy. For foreign equity securities, when market or security specific events arise, comparisons to the valuation of American Depositary Receipts (ADRs), futures contracts, Exchange-Traded Funds (ETFs) and certain indexes as well as quoted prices for similar securities may be used and would be categorized as Level 2 in the hierarchy. Utilizing these techniques may result in transfers between Level 1 and Level 2. For equity securities, including restricted securities, where observable inputs are limited, assumptions about market activity and risk are used and these securities may be categorized as Level 3 in the hierarchy.
Debt securities, including restricted securities, are valued based on evaluated prices received from third party pricing vendors or from brokers who make markets in such securities. U.S. government and government agency obligations are valued by pricing vendors who utilize matrix pricing which considers yield or price of bonds of comparable quality, coupon, maturity and type or by broker-supplied prices. When independent prices are unavailable or unreliable, debt securities may be valued utilizing pricing methodologies which consider similar factors that would be used by third party pricing vendors. Debt securities are generally categorized as Level 2 in the hierarchy but may be Level 3 depending on the circumstances.
Futures contracts are valued at the settlement price established each day by the board of trade or exchange on which they are traded and are categorized as Level 1 in the hierarchy. Investments in open-end mutual funds, including the Fidelity Central Funds, are valued at their closing net asset value (NAV) each business day and are categorized as Level 1 in the hierarchy.
Changes in valuation techniques may result in transfers in or out of an assigned level within the disclosure hierarchy. The aggregate value of investments by input level as of April 30, 2016, information on transfers between Levels 1 and 2, is included at the end of the Fund's Schedule of Investments.
Foreign Currency. The Fund may use foreign currency contracts to facilitate transactions in foreign-denominated securities. Gains and losses from these transactions may arise from changes in the value of the foreign currency or if the counterparties do not perform under the contracts' terms.
Foreign-denominated assets, including investment securities, and liabilities are translated into U.S. dollars at the exchange rates at period end. Purchases and sales of investment securities, income and dividends received and expenses denominated in foreign currencies are translated into U.S. dollars at the exchange rate in effect on the transaction date.
The effects of exchange rate fluctuations on investments are included with the net realized and unrealized gain (loss) on investment securities. Other foreign currency transactions resulting in realized and unrealized gain (loss) are disclosed separately.
Investment Transactions and Income. For financial reporting purposes, the Fund's investment holdings and NAV include trades executed through the end of the last business day of the period. The NAV per share for processing shareholder transactions is calculated as of the close of business of the New York Stock Exchange (NYSE), normally 4:00 p.m. Eastern time and includes trades executed through the end of the prior business day. Gains and losses on securities sold are determined on the basis of identified cost and may include proceeds received from litigation. Dividend income is recorded on the ex-dividend date, except for certain dividends from foreign securities where the ex-dividend date may have passed, which are recorded as soon as the Fund is informed of the ex-dividend date. Non-cash dividends included in dividend income, if any, are recorded at the fair market value of the securities received. Income and capital gain distributions from Fidelity Central Funds, if any, are recorded on the ex-dividend date. Distributions received on securities that represent a return of capital or capital gain are recorded as a reduction of cost of investments and/or as a realized gain. Subsequent to ex-dividend date the Fund determines the components of these distributions, based upon receipt of tax filings or other correspondence relating to the underlying investment. Interest income is accrued as earned and includes coupon interest and amortization of premium and accretion of discount on debt securities as applicable. Investment income is recorded net of foreign taxes withheld where recovery of such taxes is uncertain.
Class Allocations and Expenses. Investment income, realized and unrealized capital gains and losses, common expenses of the Fund, and certain fund-level expense reductions, if any, are allocated daily on a pro-rata basis to each class based on the relative net assets of each class to the total net assets of the Fund. Each class differs with respect to transfer agent fees incurred. Certain expense reductions may also differ by class. For the reporting period, the allocated portion of income and expenses to each class as a percent of its average net assets may vary due to the timing of recording these transactions in relation to fluctuating net assets of the classes. Expenses directly attributable to a fund are charged to that fund. Expenses attributable to more than one fund are allocated among the respective funds on the basis of relative net assets or other appropriate methods. Expense estimates are accrued in the period to which they relate and adjustments are made when actual amounts are known.
Deferred Trustee Compensation. Under a Deferred Compensation Plan (the Plan), independent Trustees may elect to defer receipt of a portion of their annual compensation. Deferred amounts are invested in a cross-section of Fidelity funds, are marked-to-market and remain in the Fund until distributed in accordance with the Plan. The investment of deferred amounts and the offsetting payable to the Trustees are included in the accompanying Statement of Assets and Liabilities.
Income Tax Information and Distributions to Shareholders. Each year, the Fund intends to qualify as a regulated investment company under Subchapter M of the Internal Revenue Code, including distributing substantially all of its taxable income and realized gains. As a result, no provision for U.S. Federal income taxes is required. The Fund files a U.S. federal tax return, in addition to state and local tax returns as required. The Fund's federal income tax returns are subject to examination by the Internal Revenue Service (IRS) for a period of three fiscal years after they are filed. State and local tax returns may be subject to examination for an additional fiscal year depending on the jurisdiction. Foreign taxes are provided for based on the Fund's understanding of the tax rules and rates that exist in the foreign markets in which it invests.
Distributions are declared and recorded on the ex-dividend date. Income dividends and capital gain distributions are declared separately for each class. Income and capital gain distributions are determined in accordance with income tax regulations, which may differ from GAAP.
Capital accounts within the financial statements are adjusted for permanent book-tax differences. These adjustments have no impact on net assets or the results of operations. Capital accounts are not adjusted for temporary book-tax differences which will reverse in a subsequent period.
Book-tax differences are primarily due to in-kind transactions, futures contracts, foreign currency transactions, passive foreign investments companies (PFIC), market discount, partnerships, deferred trustees compensation and losses deferred due to wash sales.
The federal tax cost of investment securities and unrealized appreciation (depreciation) as of period end were as follows:
| Gross unrealized appreciation | $4,689,597,730 |
| Gross unrealized depreciation | (1,074,896,131) |
| Net unrealized appreciation (depreciation) on securities | $3,614,701,599 |
| Tax cost | $17,600,134,387 |
Short-Term Trading (Redemption) Fees. Shares held by investors in the Fund less than 30 days may have been subject to a redemption fee equal to 1.00% of the NAV of shares redeemed. All redemption fees, which reduce the proceeds of the shareholder redemption, are retained by the Fund and accounted for as an addition to paid in capital.
Delayed Delivery Transactions and When-Issued Securities. During the period, the Fund transacted in securities on a delayed delivery or when-issued basis. Payment and delivery may take place after the customary settlement period for that security. The price of the underlying securities and the date when the securities will be delivered and paid for are fixed at the time the transaction is negotiated. With respect to purchase commitments, the Fund identifies securities as segregated in its records with a value at least equal to the amount of the commitment. Losses may arise due to changes in the value of the underlying securities or if the counterparty does not perform under the contract's terms, or if the issuer does not issue the securities due to political, economic, or other factors.
Restricted Securities. The Fund may invest in securities that are subject to legal or contractual restrictions on resale. These securities generally may be resold in transactions exempt from registration or to the public if the securities are registered. Disposal of these securities may involve time-consuming negotiations and expense, and prompt sale at an acceptable price may be difficult. Information regarding restricted securities is included at the end of the Fund's Schedule of Investments.
4. Derivative Instruments.
Risk Exposures and the Use of Derivative Instruments. The Fund's investment objective allows the Fund to enter into various types of derivative contracts, including futures contracts. Derivatives are investments whose value is primarily derived from underlying assets, indices or reference rates and may be transacted on an exchange or over-the-counter (OTC). Derivatives may involve a future commitment to buy or sell a specified asset based on specified terms, to exchange future cash flows at periodic intervals based on a notional principal amount, or for one party to make one or more payments upon the occurrence of specified events in exchange for periodic payments from the other party.
The Fund used derivatives to increase returns and to manage exposure to certain risks as defined below. The success of any strategy involving derivatives depends on analysis of numerous economic factors, and if the strategies for investment do not work as intended, the Fund may not achieve its objectives.
The Fund's use of derivatives increased or decreased its exposure to the following risk:
| Equity Risk | Equity risk relates to the fluctuations in the value of financial instruments as a result of changes in market prices (other than those arising from interest rate risk or foreign exchange risk), whether caused by factors specific to an individual investment, its issuer, or all factors affecting all instruments traded in a market or market segment. |
The Fund is also exposed to additional risks from investing in derivatives, such as liquidity risk and counterparty credit risk. Liquidity risk is the risk that the Fund will be unable to close out the derivative in the open market in a timely manner. Counterparty credit risk is the risk that the counterparty will not be able to fulfill its obligation to the Fund. Counterparty credit risk related to exchange-traded futures contracts may be mitigated by the protection provided by the exchange on which they trade.
Investing in derivatives may involve greater risks than investing in the underlying assets directly and, to varying degrees, may involve risk of loss in excess of any initial investment and collateral received and amounts recognized in the Statement of Assets and Liabilities. In addition, there may be the risk that the change in value of the derivative contract does not correspond to the change in value of the underlying instrument.
Futures Contracts. A futures contract is an agreement between two parties to buy or sell a specified underlying instrument for a fixed price at a specified future date. The Fund used futures contracts to manage its exposure to the stock market.
Upon entering into a futures contract, a fund is required to deposit either cash or securities (initial margin) with a clearing broker in an amount equal to a certain percentage of the face value of the contract. Futures contracts are marked-to-market daily and subsequent daily payments (variation margin) are made or received by a fund depending on the daily fluctuations in the value of the futures contracts and are recorded as unrealized appreciation or (depreciation). This receivable and/or payable, if any, is included in daily variation margin for derivative instruments in the Statement of Assets and Liabilities. Realized gain or (loss) is recorded upon the expiration or closing of a futures contract.
Any open futures contracts at period end are presented in the Schedule of Investments under the caption "Futures Contracts". The underlying face amount at value reflects each contract's exposure to the underlying instrument or index at period end and is representative of volume of activity during the period. Securities deposited to meet initial margin requirements are identified in the Schedule of Investments.
During the period the Fund recognized net realized gain (loss) of $(6,473,079) and a change in net unrealized appreciation (depreciation) of $(12,506,904) related to its investment in futures contracts. These amounts are included in the Statement of Operations.
5. Purchases and Sales of Investments.
Purchases and sales of securities, other than short-term securities and in-kind transactions, aggregated $2,543,180,989 and $2,682,802,377, respectively.
Redemptions In-Kind. During the period, 14,413,032 shares of the Fund held by unaffiliated entities were redeemed in-kind for cash and investments with a value of $486,333,150. The net realized gain of $139,782,567 on investments delivered through in-kind redemptions is included in the accompanying Statement of Operations. The amount of in-kind redemptions is included in share transactions in the accompanying Statement of Changes in Net Assets as well as Note 11: Share Transactions. The Fund recognized no gain or loss for federal income tax purposes.
6. Fees and Other Transactions with Affiliates.
Management Fee. Fidelity Management & Research Company (the investment adviser) and its affiliates provide the Fund with investment management related services for which the Fund pays a monthly management fee. The management fee is the sum of an individual fund fee rate that is based on an annual rate of .424% of the Fund's average net assets and an annualized group fee rate that averaged .25% during the period. The group fee rate is based upon the average net assets of all the mutual funds advised by the investment adviser, including any mutual funds previously advised by the investment adviser that are currently advised by Fidelity SelectCo, LLC, an affiliate of the investment adviser. The group fee rate decreases as assets under management increase and increases as assets under management decrease. In addition, the management fee is subject to a performance adjustment (up to a maximum of +/- .20% of the Fund's average net assets over a 36 month performance period). The upward or downward adjustment to the management fee is based on the relative investment performance of Diversified International as compared to its benchmark index, the MSCI EAFE Index, over the same 36 month performance period. For the reporting period, the total annualized management fee rate, including the performance adjustment, was .87% of the Fund's average net assets. The performance adjustment included in the management fee rate may be higher or lower than the maximum performance adjustment rate due to the difference between the average net assets for the reporting and performance periods.
Transfer Agent Fees. Fidelity Investments Institutional Operations Company, Inc., (FIIOC), an affiliate of the investment adviser, is the transfer, dividend disbursing and shareholder servicing agent for each class of the Fund. FIIOC receives account fees and asset-based fees that vary according to the account size and type of account of the shareholders of Diversified International. FIIOC receives an asset-based fee of Class K's average net assets. FIIOC pays for typesetting, printing and mailing of shareholder reports, except proxy statements.
For the period, transfer agent fees for each class were as follows:
| Amount | % of Class-Level Average Net Assets(a) | |
| Diversified International | $10,659,258 | .18 |
| Class K | 2,188,683 | .05 |
| $12,847,941 |
(a) Annualized
Accounting and Security Lending Fees. Fidelity Service Company, Inc. (FSC), an affiliate of the investment adviser, maintains the Fund's accounting records. The accounting fee is based on the level of average net assets for each month. Under a separate contract, FSC administers the security lending program. The security lending fee is based on the number and duration of lending transactions.
Brokerage Commissions. The Fund placed a portion of its portfolio transactions with brokerage firms which are affiliates of the investment adviser. Brokerage commissions are included in net realized gain (loss) and change in net unrealized appreciation (depreciation) in the Statement of Operations. The commissions paid to these affiliated firms were $13,265 for the period.
Interfund Trades. The Fund may purchase from or sell securities to other Fidelity Funds under procedures adopted by the Board. The procedures have been designed to ensure these interfund trades are executed in accordance with Rule 17a-7 of the 1940 Act. Interfund trades are included within the respective purchases and sales amounts shown in the Purchases and Sales of Investments note.
7. Committed Line of Credit.
The Fund participates with other funds managed by the investment adviser or an affiliate in a $4.25 billion credit facility (the "line of credit") to be utilized for temporary or emergency purposes to fund shareholder redemptions or for other short-term liquidity purposes. The Fund has agreed to pay commitment fees on its pro-rata portion of the line of credit, which amounted to $19,093 and is reflected in Miscellaneous expenses on the Statement of Operations. During the period, the Fund did not borrow on this line of credit.
8. Security Lending.
The Fund lends portfolio securities through a lending agent from time to time in order to earn additional income. For equity securities, a lending agent is used and may loan securities to certain qualified borrowers, including Fidelity Capital Markets (FCM), a broker-dealer affiliated with the Fund. On the settlement date of the loan, the Fund receives collateral (in the form of U.S. Treasury obligations, letters of credit and/or cash) against the loaned securities and maintains collateral in an amount not less than 100% of the market value of the loaned securities during the period of the loan. The market value of the loaned securities is determined at the close of business of the Fund and any additional required collateral is delivered to the Fund on the next business day. The Fund or borrower may terminate the loan at any time, and if the borrower defaults on its obligation to return the securities loaned because of insolvency or other reasons, the Fund may apply collateral received from the borrower against the obligation. The Fund may experience delays and costs in recovering the securities loaned. Any cash collateral received is invested in the Fidelity Securities Lending Cash Central Fund. The value of loaned securities and cash collateral at period end are disclosed on the Fund's Statement of Assets and Liabilities. Security lending income represents the income earned on investing cash collateral, less rebates paid to borrowers and any lending agent fees associated with the loan, plus any premium payments received for lending certain types of securities. Security lending income is presented in the Statement of Operations as a component of income from Fidelity Central Funds. Total security lending income during the period amounted to $2,758,295. During the period, there were no securities loaned to FCM.
9. Expense Reductions.
Commissions paid to certain brokers with whom the investment adviser, or its affiliates, places trades on behalf of the Fund include an amount in addition to trade execution, which may be rebated back to the Fund to offset certain expenses. This amount totaled $156,463 for the period. In addition, through arrangements with the Fund's custodian, credits realized as a result of certain uninvested cash balances were used to reduce the Fund's expenses. During the period, these credits reduced the Fund's custody expenses by $956.
In addition, during the period the investment adviser reimbursed and/or waived a portion of fund-level operating expenses in the amount of $80,718.
10. Distributions to Shareholders.
Distributions to shareholders of each class were as follows:
| Six months ended April 30, 2016 | Year ended October 31, 2015 | |
| From net investment income | ||
| Diversified International | $111,194,421 | $149,948,658 |
| Class K | 100,092,343 | 135,576,770 |
| Total | $211,286,764 | $285,525,428 |
| From net realized gain | ||
| Diversified International | $58,466,749 | $346,354,986 |
| Class K | 45,319,552 | 278,753,096 |
| Total | $103,786,301 | $625,108,082 |
11. Share Transactions.
Share transactions for each class were as follows and may contain automatic conversions between classes or exchanges between affiliated funds:
| Shares | Shares | Dollars | Dollars | |
| Six months ended April 30, 2016 | Year ended October 31, 2015 | Six months ended April 30, 2016 | Year ended October 31, 2015 | |
| Diversified International | ||||
| Shares sold | 22,545,924 | 68,897,294 | $754,790,846 | $2,502,582,724 |
| Reinvestment of distributions | 4,457,297 | 13,245,636 | 158,724,354 | 468,498,147 |
| Shares redeemed | (43,948,563) | (100,568,411)(a) | (1,481,054,664) | (3,650,099,531)(a) |
| Net increase (decrease) | (16,945,342) | (18,425,481) | $(567,539,464) | $(679,018,660) |
| Class K | ||||
| Shares sold | 23,311,890 | 62,832,809 | $787,966,013 | $2,295,823,882 |
| Reinvestment of distributions | 4,092,651 | 11,737,390 | 145,411,895 | 414,329,866 |
| Shares redeemed | (44,273,186)(b) | (100,745,655)(a) | (1,493,410,355)(b) | (3,674,626,947)(a) |
| Net increase (decrease) | (16,868,645) | (26,175,456) | $(560,032,447) | $(964,473,199) |
(a) Amount includes in-kind redemptions
(b) Amount includes in-kind redemptions (see Note 5: Redemptions In-Kind).
12. Other.
The Fund's organizational documents provide former and current trustees and officers with a limited indemnification against liabilities arising in connection with the performance of their duties to the Fund. In the normal course of business, the Fund may also enter into contracts that provide general indemnifications. The Fund's maximum exposure under these arrangements is unknown as this would be dependent on future claims that may be made against the Fund. The risk of material loss from such claims is considered remote.
Fidelity® International Capital Appreciation Fund
Investment Summary (Unaudited)
Geographic Diversification (% of fund's net assets)
| As of April 30, 2016 | ||
| United States of America* | 22.2% | |
| United Kingdom | 14.9% | |
| Japan | 9.5% | |
| Germany | 9.0% | |
| Ireland | 4.5% | |
| Switzerland | 3.9% | |
| France | 3.4% | |
| Australia | 3.1% | |
| India | 2.9% | |
| Other | 26.6% | |
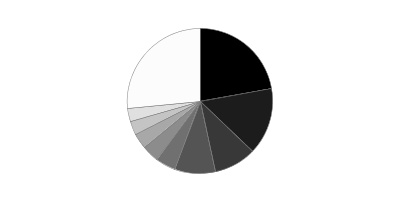
* Includes Short-Term Investments and Net Other Assets (Liabilities).
Percentages are based on country or territory of incorporation and are adjusted for the effect of futures contracts, if applicable.
| As of October 31, 2015 | ||
| United States of America* | 19.6% | |
| United Kingdom | 17.2% | |
| France | 7.4% | |
| Japan | 6.5% | |
| Germany | 6.4% | |
| Ireland | 4.2% | |
| Switzerland | 3.7% | |
| India | 3.6% | |
| Australia | 3.0% | |
| Other | 28.4% | |
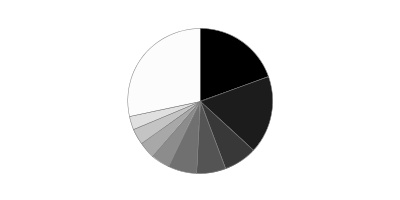
* Includes Short-Term Investments and Net Other Assets (Liabilities).
Percentages are based on country or territory of incorporation and are adjusted for the effect of futures contracts, if applicable.
Asset Allocation as of April 30, 2016
| % of fund's net assets | % of fund's net assets 6 months ago | |
| Stocks | 98.9 | 98.8 |
| Short-Term Investments and Net Other Assets (Liabilities) | 1.1 | 1.2 |
Top Ten Stocks as of April 30, 2016
| % of fund's net assets | % of fund's net assets 6 months ago | |
| Nestle SA (Switzerland, Food Products) | 1.9 | 0.0 |
| British American Tobacco PLC (United Kingdom) (United Kingdom, Tobacco) | 1.2 | 0.0 |
| Unilever PLC (United Kingdom, Personal Products) | 1.2 | 0.0 |
| Novo Nordisk A/S Series B sponsored ADR (Denmark, Pharmaceuticals) | 1.1 | 1.0 |
| Tencent Holdings Ltd. (Cayman Islands, Internet Software & Services) | 1.1 | 1.0 |
| Anheuser-Busch InBev SA NV (Belgium, Beverages) | 1.1 | 0.0 |
| Taiwan Semiconductor Manufacturing Co. Ltd. sponsored ADR (Taiwan, Semiconductors & Semiconductor Equipment) | 1.0 | 1.0 |
| Bayer AG (Germany, Pharmaceuticals) | 1.0 | 1.1 |
| AIA Group Ltd. (Hong Kong, Insurance) | 0.9 | 0.9 |
| SAP AG (Germany, Software) | 0.9 | 0.0 |
| 11.4 |
Market Sectors as of April 30, 2016
| % of fund's net assets | % of fund's net assets 6 months ago | |
| Information Technology | 19.2 | 17.3 |
| Consumer Staples | 17.1 | 4.3 |
| Industrials | 14.9 | 17.5 |
| Consumer Discretionary | 14.5 | 23.4 |
| Health Care | 11.9 | 16.9 |
| Financials | 11.7 | 11.8 |
| Materials | 8.1 | 7.6 |
| Telecommunication Services | 1.5 | 0.0 |
Percentages shown as 0.0% may reflect amounts less than 0.05%.
Fidelity® International Capital Appreciation Fund
Investments April 30, 2016 (Unaudited)
Showing Percentage of Net Assets
| Common Stocks - 98.4% | |||
| Shares | Value | ||
| Australia - 3.1% | |||
| Amcor Ltd. (a) | 739,349 | $8,657,326 | |
| CSL Ltd. | 118,612 | 9,485,830 | |
| Ramsay Health Care Ltd. | 151,179 | 7,465,934 | |
| realestate.com.au Ltd. | 167,472 | 6,484,017 | |
| Sydney Airport unit | 1,347,386 | 6,976,742 | |
| Transurban Group unit | 905,691 | 7,974,476 | |
| TOTAL AUSTRALIA | 47,044,325 | ||
| Bailiwick of Jersey - 1.7% | |||
| Experian PLC | 475,600 | 8,693,486 | |
| Wolseley PLC | 138,547 | 7,760,304 | |
| WPP PLC | 399,100 | 9,324,008 | |
| TOTAL BAILIWICK OF JERSEY | 25,777,798 | ||
| Belgium - 1.1% | |||
| Anheuser-Busch InBev SA NV | 130,630 | 16,169,369 | |
| Bermuda - 1.0% | |||
| Axalta Coating Systems (a) | 253,200 | 7,208,604 | |
| Markit Ltd. (a) | 204,500 | 7,135,005 | |
| TOTAL BERMUDA | 14,343,609 | ||
| Canada - 2.3% | |||
| Alimentation Couche-Tard, Inc. Class B (sub. vtg.) | 175,600 | 7,697,458 | |
| Canadian National Railway Co. | 172,730 | 10,636,104 | |
| CCL Industries, Inc. Class B | 42,720 | 7,822,523 | |
| Constellation Software, Inc. | 20,160 | 7,878,580 | |
| TOTAL CANADA | 34,034,665 | ||
| Cayman Islands - 2.4% | |||
| Alibaba Group Holding Ltd. sponsored ADR (a) | 137,430 | 10,573,864 | |
| Baidu.com, Inc. sponsored ADR (a) | 47,400 | 9,209,820 | |
| Tencent Holdings Ltd. | 805,700 | 16,394,638 | |
| TOTAL CAYMAN ISLANDS | 36,178,322 | ||
| Denmark - 1.6% | |||
| Coloplast A/S Series B | 97,100 | 7,274,294 | |
| Novo Nordisk A/S Series B sponsored ADR | 304,080 | 16,964,623 | |
| TOTAL DENMARK | 24,238,917 | ||
| Finland - 0.6% | |||
| Sampo Oyj (A Shares) | 192,900 | 8,422,160 | |
| France - 3.4% | |||
| Capgemini SA | 85,830 | 8,012,739 | |
| Dassault Systemes SA | 96,600 | 7,554,788 | |
| Essilor International SA | 67,175 | 8,695,663 | |
| L'Oreal SA (b) | 57,500 | 10,432,407 | |
| Sodexo SA | 71,630 | 7,233,338 | |
| VINCI SA (b) | 134,200 | 10,025,151 | |
| TOTAL FRANCE | 51,954,086 | ||
| Germany - 8.5% | |||
| adidas AG | 78,200 | 10,082,532 | |
| Axel Springer Verlag AG | 133,200 | 7,436,907 | |
| Bayer AG | 135,190 | 15,596,030 | |
| CTS Eventim AG | 218,483 | 7,652,821 | |
| Fresenius Medical Care AG & Co. KGaA | 91,900 | 7,998,710 | |
| Fresenius SE & Co. KGaA | 134,320 | 9,769,574 | |
| Henkel AG & Co. KGaA | 92,589 | 9,407,069 | |
| ProSiebenSat.1 Media AG | 151,460 | 7,721,071 | |
| SAP AG | 173,210 | 13,590,238 | |
| Scout24 Holding GmbH (a) | 213,913 | 7,841,789 | |
| Stroer Out-of-Home Media AG (b) | 147,200 | 7,247,708 | |
| Symrise AG | 117,600 | 7,791,305 | |
| United Internet AG | 155,578 | 7,595,195 | |
| Wirecard AG (b) | 198,611 | 8,577,127 | |
| TOTAL GERMANY | 128,308,076 | ||
| Hong Kong - 1.4% | |||
| AIA Group Ltd. | 2,325,400 | 13,916,603 | |
| Techtronic Industries Co. Ltd. | 1,925,500 | 7,218,064 | |
| TOTAL HONG KONG | 21,134,667 | ||
| India - 2.9% | |||
| Amara Raja Batteries Ltd. | 458,675 | 6,600,244 | |
| Asian Paints India Ltd. | 544,672 | 7,103,027 | |
| GlaxoSmithKline Consumer Healthcare Ltd. (a) | 73,935 | 6,564,332 | |
| HDFC Bank Ltd. (a) | 310,225 | 6,305,892 | |
| Housing Development Finance Corp. Ltd. | 572,928 | 9,388,013 | |
| Tata Consultancy Services Ltd. | 212,988 | 8,129,876 | |
| TOTAL INDIA | 44,091,384 | ||
| Indonesia - 0.5% | |||
| PT Bank Central Asia Tbk | 7,814,100 | 7,732,333 | |
| Ireland - 4.5% | |||
| Accenture PLC Class A | 64,900 | 7,328,508 | |
| Allegion PLC | 110,000 | 7,199,500 | |
| Allergan PLC (a) | 33,500 | 7,254,760 | |
| CRH PLC | 319,500 | 9,298,377 | |
| Kerry Group PLC Class A | 82,500 | 7,356,116 | |
| Kingspan Group PLC (Ireland) | 303,469 | 7,992,205 | |
| Medtronic PLC | 90,420 | 7,156,743 | |
| Paddy Power PLC (Ireland) | 62,580 | 8,387,479 | |
| Ryanair Holdings PLC sponsored ADR | 83,262 | 6,740,059 | |
| TOTAL IRELAND | 68,713,747 | ||
| Isle of Man - 0.5% | |||
| Playtech Ltd. | 633,869 | 7,451,100 | |
| Israel - 0.5% | |||
| Frutarom Industries Ltd. | 140,100 | 7,180,385 | |
| Italy - 1.0% | |||
| Atlantia SpA | 291,561 | 8,119,279 | |
| Recordati SpA | 277,621 | 7,053,977 | |
| TOTAL ITALY | 15,173,256 | ||
| Japan - 9.5% | |||
| Astellas Pharma, Inc. | 719,000 | 9,693,985 | |
| Daito Trust Construction Co. Ltd. | 53,900 | 7,623,199 | |
| Dentsu, Inc. | 170,400 | 8,657,855 | |
| Hoya Corp. | 215,700 | 8,260,075 | |
| Japan Tobacco, Inc. | 262,000 | 10,704,780 | |
| Kansai Paint Co. Ltd. | 436,300 | 7,630,736 | |
| Kao Corp. | 164,400 | 9,094,111 | |
| KDDI Corp. | 426,100 | 12,274,123 | |
| Keyence Corp. | 16,610 | 9,955,918 | |
| Misumi Group, Inc. | 495,700 | 6,845,507 | |
| Nippon Paint Holdings Co. Ltd. | 297,800 | 7,819,301 | |
| Nippon Telegraph & Telephone Corp. | 222,100 | 9,939,049 | |
| OBIC Co. Ltd. | 137,000 | 7,200,848 | |
| Olympus Corp. | 202,400 | 7,884,821 | |
| Sundrug Co. Ltd. | 92,200 | 6,551,346 | |
| Tsuruha Holdings, Inc. | 72,200 | 6,925,109 | |
| Unicharm Corp. | 338,100 | 6,988,893 | |
| TOTAL JAPAN | 144,049,656 | ||
| Korea (South) - 0.5% | |||
| LG Household & Health Care Ltd. | 9,187 | 8,074,985 | |
| Luxembourg - 0.5% | |||
| Eurofins Scientific SA | 20,700 | 7,680,806 | |
| Mexico - 2.0% | |||
| Grupo Aeroportuario del Pacifico S.A.B. de CV Series B | 824,200 | 7,765,506 | |
| Grupo Aeroportuario del Sureste S.A.B. de CV Series B | 467,420 | 7,178,120 | |
| Grupo Aeroportuario Norte S.A.B. de CV | 1,291,500 | 7,473,662 | |
| Megacable Holdings S.A.B. de CV unit | 1,527,400 | 7,053,438 | |
| TOTAL MEXICO | 29,470,726 | ||
| Netherlands - 1.1% | |||
| Koninklijke Ahold NV | 359,357 | 7,818,153 | |
| RELX NV | 559,451 | 9,387,984 | |
| TOTAL NETHERLANDS | 17,206,137 | ||
| Philippines - 2.4% | |||
| Ayala Corp. | 453,030 | 7,426,090 | |
| Ayala Land, Inc. | 9,465,800 | 6,973,317 | |
| GT Capital Holdings, Inc. | 232,625 | 6,760,888 | |
| SM Investments Corp. | 360,273 | 7,230,737 | |
| SM Prime Holdings, Inc. | 14,724,100 | 7,090,483 | |
| TOTAL PHILIPPINES | 35,481,515 | ||
| South Africa - 0.8% | |||
| Naspers Ltd. Class N | 86,197 | 11,827,099 | |
| Spain - 1.6% | |||
| Aena SA (a) | 57,530 | 8,204,697 | |
| Amadeus IT Holding SA Class A | 199,200 | 9,064,454 | |
| Grifols SA ADR | 473,720 | 7,446,878 | |
| TOTAL SPAIN | 24,716,029 | ||
| Sweden - 1.7% | |||
| ASSA ABLOY AB (B Shares) | 458,362 | 9,611,935 | |
| Hexagon AB (B Shares) | 210,200 | 8,381,353 | |
| Svenska Cellulosa AB (SCA) (B Shares) | 253,800 | 7,992,830 | |
| TOTAL SWEDEN | 25,986,118 | ||
| Switzerland - 3.9% | |||
| Geberit AG (Reg.) | 20,900 | 8,024,049 | |
| Givaudan SA | 4,030 | 7,939,852 | |
| Nestle SA | 374,126 | 27,924,649 | |
| Partners Group Holding AG | 17,500 | 7,205,775 | |
| Sika AG | 1,880 | 8,001,710 | |
| TOTAL SWITZERLAND | 59,096,035 | ||
| Taiwan - 1.0% | |||
| Taiwan Semiconductor Manufacturing Co. Ltd. sponsored ADR | 665,900 | 15,708,581 | |
| Thailand - 0.4% | |||
| Airports of Thailand PCL (For. Reg.) | 593,800 | 6,665,796 | |
| United Kingdom - 14.9% | |||
| Aon PLC | 67,630 | 7,109,266 | |
| Auto Trader Group PLC | 1,483,000 | 8,125,820 | |
| British American Tobacco PLC (United Kingdom) | 296,300 | 18,066,030 | |
| Bunzl PLC | 261,042 | 7,777,185 | |
| Compass Group PLC | 512,476 | 9,126,372 | |
| Dignity PLC | 202,012 | 7,202,144 | |
| Diploma PLC | 628,359 | 6,716,097 | |
| Essentra PLC | 602,800 | 7,151,944 | |
| Halma PLC | 530,200 | 6,910,339 | |
| Hargreaves Lansdown PLC | 381,400 | 7,166,654 | |
| Howden Joinery Group PLC | 1,209,990 | 8,733,806 | |
| Imperial Tobacco Group PLC | 220,275 | 11,968,171 | |
| Intertek Group PLC | 170,200 | 8,099,759 | |
| ITV PLC | 2,435,946 | 8,015,504 | |
| London Stock Exchange Group PLC | 192,654 | 7,636,997 | |
| Moneysupermarket.com Group PLC | 1,673,000 | 7,673,298 | |
| Persimmon PLC | 289,300 | 8,399,262 | |
| Provident Financial PLC | 178,500 | 7,600,157 | |
| Prudential PLC | 582,869 | 11,505,562 | |
| Reckitt Benckiser Group PLC | 126,580 | 12,331,284 | |
| Rightmove PLC | 128,654 | 7,252,376 | |
| Sage Group PLC | 845,500 | 7,313,582 | |
| St. James's Place Capital PLC | 594,576 | 7,532,190 | |
| Unilever PLC | 403,400 | 18,004,076 | |
| Worldpay Group PLC (a) | 2,085,800 | 8,134,222 | |
| TOTAL UNITED KINGDOM | 225,552,097 | ||
| United States of America - 21.1% | |||
| A.O. Smith Corp. | 93,330 | 7,206,943 | |
| Acuity Brands, Inc. | 29,010 | 7,075,249 | |
| Adobe Systems, Inc. (a) | 73,500 | 6,925,170 | |
| Alphabet, Inc. Class C | 9,740 | 6,749,917 | |
| Altria Group, Inc. | 116,300 | 7,293,173 | |
| Amazon.com, Inc. (a) | 12,070 | 7,961,251 | |
| Amphenol Corp. Class A | 124,292 | 6,939,222 | |
| AutoZone, Inc. (a) | 8,300 | 6,351,409 | |
| Cerner Corp. (a) | 127,500 | 7,157,850 | |
| Constellation Brands, Inc. Class A (sub. vtg.) | 46,560 | 7,266,154 | |
| Danaher Corp. | 71,600 | 6,927,300 | |
| Domino's Pizza, Inc. | 50,130 | 6,059,714 | |
| Ecolab, Inc. | 66,160 | 7,607,077 | |
| Equifax, Inc. | 60,000 | 7,215,000 | |
| Estee Lauder Companies, Inc. Class A | 66,060 | 6,333,172 | |
| Facebook, Inc. Class A (a) | 63,540 | 7,471,033 | |
| FactSet Research Systems, Inc. | 47,060 | 7,094,295 | |
| Fiserv, Inc. (a) | 62,785 | 6,135,350 | |
| FleetCor Technologies, Inc. (a) | 48,910 | 7,565,399 | |
| Gartner, Inc. Class A (a) | 81,900 | 7,139,223 | |
| HEICO Corp. Class A | 152,900 | 7,825,422 | |
| Henry Schein, Inc. (a) | 37,100 | 6,258,770 | |
| Home Depot, Inc. | 52,700 | 7,056,003 | |
| International Flavors & Fragrances, Inc. | 60,500 | 7,227,935 | |
| Kimberly-Clark Corp. | 55,730 | 6,976,839 | |
| MasterCard, Inc. Class A | 78,730 | 7,636,023 | |
| McGraw Hill Financial, Inc. | 73,663 | 7,870,892 | |
| Mettler-Toledo International, Inc. (a) | 20,620 | 7,380,929 | |
| Molson Coors Brewing Co. Class B | 71,200 | 6,808,856 | |
| Moody's Corp. | 72,930 | 6,980,860 | |
| MSCI, Inc. Class A | 101,100 | 7,677,534 | |
| NIKE, Inc. Class B | 122,830 | 7,239,600 | |
| O'Reilly Automotive, Inc. (a) | 25,000 | 6,567,000 | |
| Philip Morris International, Inc. | 66,400 | 6,515,168 | |
| PPG Industries, Inc. | 66,146 | 7,301,857 | |
| Reynolds American, Inc. | 147,100 | 7,296,160 | |
| ServiceMaster Global Holdings, Inc. (a) | 192,100 | 7,361,272 | |
| Sherwin-Williams Co. | 23,710 | 6,812,120 | |
| SS&C Technologies Holdings, Inc. | 114,400 | 6,995,560 | |
| Starbucks Corp. | 118,300 | 6,652,009 | |
| The Walt Disney Co. | 72,807 | 7,518,051 | |
| Thermo Fisher Scientific, Inc. | 48,000 | 6,924,000 | |
| TransDigm Group, Inc. (a) | 29,530 | 6,729,001 | |
| Verisk Analytics, Inc. (a) | 90,800 | 7,044,264 | |
| Visa, Inc. Class A | 95,268 | 7,358,500 | |
| TOTAL UNITED STATES OF AMERICA | 318,488,526 | ||
| TOTAL COMMON STOCKS | |||
| (Cost $1,284,443,860) | 1,487,952,305 | ||
| Nonconvertible Preferred Stocks - 0.5% | |||
| Germany - 0.5% | |||
| Sartorius AG (non-vtg.) | |||
| (Cost $3,329,255) | 27,684 | 6,829,671 | |
| Money Market Funds - 3.0% | |||
| Fidelity Cash Central Fund, 0.38% (c) | 15,351,484 | 15,351,484 | |
| Fidelity Securities Lending Cash Central Fund, 0.42% (c)(d) | 29,820,585 | 29,820,585 | |
| TOTAL MONEY MARKET FUNDS | |||
| (Cost $45,172,069) | 45,172,069 | ||
| TOTAL INVESTMENT PORTFOLIO - 101.9% | |||
| (Cost $1,332,945,184) | 1,539,954,045 | ||
| NET OTHER ASSETS (LIABILITIES) - (1.9)% | (28,524,974) | ||
| NET ASSETS - 100% | $1,511,429,071 |
Categorizations in the Schedule of Investments are based on country or territory of incorporation.
Legend
(a) Non-income producing
(b) Security or a portion of the security is on loan at period end.
(c) Affiliated fund that is generally available only to investment companies and other accounts managed by Fidelity Investments. The rate quoted is the annualized seven-day yield of the fund at period end. A complete unaudited listing of the fund's holdings as of its most recent quarter end is available upon request. In addition, each Fidelity Central Fund's financial statements are available on the SEC's website or upon request.
(d) Investment made with cash collateral received from securities on loan.
Affiliated Central Funds
Information regarding fiscal year to date income earned by the Fund from investments in Fidelity Central Funds is as follows:
| Fund | Income earned |
| Fidelity Cash Central Fund | $25,856 |
| Fidelity Securities Lending Cash Central Fund | 215,095 |
| Total | $240,951 |
Investment Valuation
The following is a summary of the inputs used, as of April 30, 2016, involving the Fund's assets and liabilities carried at fair value. The inputs or methodology used for valuing securities may not be an indication of the risk associated with investing in those securities. For more information on valuation inputs, and their aggregation into the levels used below, please refer to the Investment Valuation section in the accompanying Notes to Financial Statements.
| Valuation Inputs at Reporting Date: | ||||
| Description | Total | Level 1 | Level 2 | Level 3 |
| Investments in Securities: | ||||
| Equities: | ||||
| Consumer Discretionary | $219,957,718 | $185,631,419 | $34,326,299 | $-- |
| Consumer Staples | 258,560,690 | 159,974,488 | 98,586,202 | -- |
| Financials | 174,154,165 | 134,802,909 | 39,351,256 | -- |
| Health Care | 180,233,923 | 139,122,038 | 41,111,885 | -- |
| Industrials | 230,333,779 | 215,727,968 | 14,605,811 | -- |
| Information Technology | 286,774,450 | 239,632,808 | 47,141,642 | -- |
| Materials | 122,554,079 | 97,805,665 | 24,748,414 | -- |
| Telecommunication Services | 22,213,172 | -- | 22,213,172 | -- |
| Money Market Funds | 45,172,069 | 45,172,069 | -- | -- |
| Total Investments in Securities: | $1,539,954,045 | $1,217,869,364 | $322,084,681 | $-- |
The following is a summary of transfers between Level 1 and Level 2 for the period ended April 30, 2016. Transfers are assumed to have occurred at the beginning of the period, and are primarily attributable to the valuation techniques used for foreign equity securities, as discussed in the accompanying Notes to Financial Statements:
| Transfers | Total |
| Level 1 to Level 2 | $6,062,456 |
| Level 2 to Level 1 | $108,102,946 |
See accompanying notes which are an integral part of the financial statements.
Fidelity® International Capital Appreciation Fund
Financial Statements
Statement of Assets and Liabilities
| April 30, 2016 (Unaudited) | ||
| Assets | ||
| Investment in securities, at value (including securities loaned of $27,886,463) — See accompanying schedule: Unaffiliated issuers (cost $1,287,773,115) | $1,494,781,976 | |
| Fidelity Central Funds (cost $45,172,069) | 45,172,069 | |
| Total Investments (cost $1,332,945,184) | $1,539,954,045 | |
| Foreign currency held at value (cost $53,670) | 53,670 | |
| Receivable for fund shares sold | 805,201 | |
| Dividends receivable | 6,065,806 | |
| Distributions receivable from Fidelity Central Funds | 142,726 | |
| Prepaid expenses | 756 | |
| Other receivables | 931,482 | |
| Total assets | 1,547,953,686 | |
| Liabilities | ||
| Payable for fund shares redeemed | $5,146,271 | |
| Accrued management fee | 1,073,944 | |
| Other affiliated payables | 294,885 | |
| Other payables and accrued expenses | 188,930 | |
| Collateral on securities loaned, at value | 29,820,585 | |
| Total liabilities | 36,524,615 | |
| Net Assets | $1,511,429,071 | |
| Net Assets consist of: | ||
| Paid in capital | $1,357,847,176 | |
| Undistributed net investment income | 4,198,921 | |
| Accumulated undistributed net realized gain (loss) on investments and foreign currency transactions | (57,606,751) | |
| Net unrealized appreciation (depreciation) on investments and assets and liabilities in foreign currencies | 206,989,725 | |
| Net Assets, for 90,417,151 shares outstanding | $1,511,429,071 | |
| Net Asset Value, offering price and redemption price per share ($1,511,429,071 ÷ 90,417,151 shares) | $16.72 |
See accompanying notes which are an integral part of the financial statements.
Statement of Operations
| Six months ended April 30, 2016 (Unaudited) | ||
| Investment Income | ||
| Dividends | $13,153,463 | |
| Income from Fidelity Central Funds | 240,951 | |
| Income before foreign taxes withheld | 13,394,414 | |
| Less foreign taxes withheld | (1,001,858) | |
| Total income | 12,392,556 | |
| Expenses | ||
| Management fee | ||
| Basic fee | $4,943,130 | |
| Performance adjustment | 1,113,412 | |
| Transfer agent fees | 1,393,532 | |
| Accounting and security lending fees | 320,514 | |
| Custodian fees and expenses | 170,711 | |
| Independent trustees' compensation | 3,025 | |
| Registration fees | 52,495 | |
| Audit | 55,792 | |
| Legal | 2,564 | |
| Interest | 3,691 | |
| Miscellaneous | 4,403 | |
| Total expenses before reductions | 8,063,269 | |
| Expense reductions | (52,069) | 8,011,200 |
| Net investment income (loss) | 4,381,356 | |
| Realized and Unrealized Gain (Loss) | ||
| Net realized gain (loss) on: | ||
| Investment securities: | ||
| Unaffiliated issuers | (52,367,834) | |
| Foreign currency transactions | (367,855) | |
| Total net realized gain (loss) | (52,735,689) | |
| Change in net unrealized appreciation (depreciation) on: Investment securities (net of decrease in deferred foreign taxes of $22,283) | 51,262,087 | |
| Assets and liabilities in foreign currencies | 97,401 | |
| Total change in net unrealized appreciation (depreciation) | 51,359,488 | |
| Net gain (loss) | (1,376,201) | |
| Net increase (decrease) in net assets resulting from operations | $3,005,155 |
See accompanying notes which are an integral part of the financial statements.
Statement of Changes in Net Assets
| Six months ended April 30, 2016 (Unaudited) | Year ended October 31, 2015 | |
| Increase (Decrease) in Net Assets | ||
| Operations | ||
| Net investment income (loss) | $4,381,356 | $8,312,623 |
| Net realized gain (loss) | (52,735,689) | 16,976,120 |
| Change in net unrealized appreciation (depreciation) | 51,359,488 | 29,186,149 |
| Net increase (decrease) in net assets resulting from operations | 3,005,155 | 54,474,892 |
| Distributions to shareholders from net investment income | (5,627,463) | (6,239,324) |
| Distributions to shareholders from net realized gain | (15,577,465) | (55,136,629) |
| Total distributions | (21,204,928) | (61,375,953) |
| Share transactions | ||
| Proceeds from sales of shares | 409,365,582 | 558,668,618 |
| Reinvestment of distributions | 16,837,345 | 49,986,231 |
| Cost of shares redeemed | (276,249,813) | (367,867,221) |
| Net increase (decrease) in net assets resulting from share transactions | 149,953,114 | 240,787,628 |
| Redemption fees | 15,794 | 29,377 |
| Total increase (decrease) in net assets | 131,769,135 | 233,915,944 |
| Net Assets | ||
| Beginning of period | 1,379,659,936 | 1,145,743,992 |
| End of period (including undistributed net investment income of $4,198,921 and undistributed net investment income of $5,445,028, respectively) | $1,511,429,071 | $1,379,659,936 |
| Other Information | ||
| Shares | ||
| Sold | 25,880,423 | 33,275,916 |
| Issued in reinvestment of distributions | 1,001,031 | 2,996,776 |
| Redeemed | (17,696,639) | (21,588,593) |
| Net increase (decrease) | 9,184,815 | 14,684,099 |
See accompanying notes which are an integral part of the financial statements.
Financial Highlights — Fidelity International Capital Appreciation Fund
| Six months ended (Unaudited) April 30, | Years ended October 31, | |||||
| 2016 | 2015 | 2014 | 2013 | 2012 | 2011 | |
| Selected Per–Share Data | ||||||
| Net asset value, beginning of period | $16.98 | $17.22 | $16.28 | $13.12 | $11.89 | $12.63 |
| Income from Investment Operations | ||||||
| Net investment income (loss)A | .05 | .11 | .13 | .13 | .12 | .13B |
| Net realized and unrealized gain (loss) | (.05) | .56 | .93 | 3.16 | 1.24 | (.62) |
| Total from investment operations | –C | .67 | 1.06 | 3.29 | 1.36 | (.49) |
| Distributions from net investment income | (.07) | (.09) | (.12) | (.13) | (.12) | (.15) |
| Distributions from net realized gain | (.19) | (.81) | – | – | (.01) | (.10) |
| Total distributions | (.26) | (.91)D | (.12) | (.13) | (.13) | (.25) |
| Redemption fees added to paid in capitalA,C | – | – | – | – | – | – |
| Net asset value, end of period | $16.72 | $16.98 | $17.22 | $16.28 | $13.12 | $11.89 |
| Total ReturnE,F | (.01)% | 3.96% | 6.55% | 25.24% | 11.57% | (4.03)% |
| Ratios to Average Net AssetsG,H | ||||||
| Expenses before reductions | 1.14%I | 1.13% | 1.14% | 1.17% | 1.22% | 1.16% |
| Expenses net of fee waivers, if any | 1.14%I | 1.13% | 1.14% | 1.17% | 1.22% | 1.16% |
| Expenses net of all reductions | 1.13%I | 1.11% | 1.14% | 1.12% | 1.19% | 1.09% |
| Net investment income (loss) | .62%I | .64% | .74% | .87% | 1.01% | 1.02%B |
| Supplemental Data | ||||||
| Net assets, end of period (000 omitted) | $1,511,429 | $1,379,660 | $1,145,744 | $939,945 | $730,515 | $555,568 |
| Portfolio turnover rateJ | 160 %I | 187% | 178% | 136% | 127% | 254% |
A Calculated based on average shares outstanding during the period.
B Net Investment income per share reflects a large, non-recurring dividend which amounted to $.03 per share. Excluding this non-recurring dividend, the ratio of net investment income (loss) to average net assets would have been .78%.
C Amount represents less than $.005 per share.
D Total distributions of $.91 per share is comprised of distributions from net investment income of $.092 and distributions from net realized gain of $.813 per share.
E Total returns for periods of less than one year are not annualized.
F Total returns would have been lower if certain expenses had not been reduced during the applicable periods shown.
G Fees and expenses of any underlying Fidelity Central Funds are not included in the Fund's expense ratio. The Fund indirectly bears its proportionate share of the expenses of any underlying Fidelity Central Funds.
H Expense ratios reflect operating expenses of the Fund. Expenses before reductions do not reflect amounts reimbursed by the investment adviser or reductions from brokerage service arrangements or reductions from other expense offset arrangements and do not represent the amount paid by the Fund during periods when reimbursements or reductions occur. Expenses net of fee waivers reflect expenses after reimbursement by the investment adviser but prior to reductions from brokerage service arrangements or other expense offset arrangements. Expenses net of all reductions represent the net expenses paid by the Fund.
I Annualized
J Amount does not include the portfolio activity of any underlying Fidelity Central Funds.
See accompanying notes which are an integral part of the financial statements.
Notes to Financial Statements (Unaudited)
For the period ended April 30, 2016
1. Organization.
Fidelity International Capital Appreciation Fund (the Fund) is a fund of Fidelity Investment Trust (the Trust) and is authorized to issue an unlimited number of shares. Share transactions on the Statement of Changes in Net Assets may contain exchanges between affiliated funds. The Trust is registered under the Investment Company Act of 1940, as amended (the 1940 Act), as an open-end management investment company organized as a Massachusetts business trust. The Fund's investments in emerging markets can be subject to social, economic, regulatory, and political uncertainties and can be extremely volatile.
2. Investments in Fidelity Central Funds.
The Fund invests in Fidelity Central Funds, which are open-end investment companies generally available only to other investment companies and accounts managed by the investment adviser and its affiliates. The Fund's Schedule of Investments lists each of the Fidelity Central Funds held as of period end, if any, as an investment of the Fund, but does not include the underlying holdings of each Fidelity Central Fund. As an Investing Fund, the Fund indirectly bears its proportionate share of the expenses of the underlying Fidelity Central Funds.
The Money Market Central Funds seek preservation of capital and current income and are managed by Fidelity Investments Money Management, Inc. (FIMM), an affiliate of the investment adviser. Annualized expenses of the Money Market Central Funds as of their most recent shareholder report date are less than .005%.
A complete unaudited list of holdings for each Fidelity Central Fund is available upon request or at the Securities and Exchange Commission (the SEC) website at www.sec.gov. In addition, the financial statements of the Fidelity Central Funds are available on the SEC website or upon request.
3. Significant Accounting Policies.
The financial statements have been prepared in conformity with accounting principles generally accepted in the United States of America (GAAP), which require management to make certain estimates and assumptions at the date of the financial statements. Actual results could differ from those estimates. Subsequent events, if any, through the date that the financial statements were issued have been evaluated in the preparation of the financial statements. The following summarizes the significant accounting policies of the Fund:
Investment Valuation. Investments are valued as of 4:00 p.m. Eastern time on the last calendar day of the period. The Board of Trustees (the Board) has delegated the day to day responsibility for the valuation of the Fund's investments to the Fidelity Management & Research Company (FMR) Fair Value Committee (the Committee). In accordance with valuation policies and procedures approved by the Board, the Fund attempts to obtain prices from one or more third party pricing vendors or brokers to value its investments. When current market prices, quotations or currency exchange rates are not readily available or reliable, investments will be fair valued in good faith by the Committee, in accordance with procedures adopted by the Board. Factors used in determining fair value vary by investment type and may include market or investment specific events. The frequency with which these procedures are used cannot be predicted and they may be utilized to a significant extent. The Committee oversees the Fund's valuation policies and procedures and reports to the Board on the Committee's activities and fair value determinations. The Board monitors the appropriateness of the procedures used in valuing the Fund's investments and ratifies the fair value determinations of the Committee.
The Fund categorizes the inputs to valuation techniques used to value its investments into a disclosure hierarchy consisting of three levels as shown below:
- Level 1 – quoted prices in active markets for identical investments
- Level 2 – other significant observable inputs (including quoted prices for similar investments, interest rates, prepayment speeds, etc.)
- Level 3 – unobservable inputs (including the Fund's own assumptions based on the best information available)
Valuation techniques used to value the Fund's investments by major category are as follows:
Equity securities, including restricted securities, for which market quotations are readily available, are valued at the last reported sale price or official closing price as reported by a third party pricing vendor on the primary market or exchange on which they are traded and are categorized as Level 1 in the hierarchy. In the event there were no sales during the day or closing prices are not available, securities are valued at the last quoted bid price or may be valued using the last available price and are generally categorized as Level 2 in the hierarchy. For foreign equity securities, when market or security specific events arise, comparisons to the valuation of American Depositary Receipts (ADRs), futures contracts, Exchange-Traded Funds (ETFs) and certain indexes as well as quoted prices for similar securities may be used and would be categorized as Level 2 in the hierarchy. Utilizing these techniques may result in transfers between Level 1 and Level 2. For equity securities, including restricted securities, where observable inputs are limited, assumptions about market activity and risk are used and these securities may be categorized as Level 3 in the hierarchy.
Investments in open-end mutual funds, including the Fidelity Central Funds, are valued at their closing net asset value (NAV) each business day and are categorized as Level 1 in the hierarchy.
Changes in valuation techniques may result in transfers in or out of an assigned level within the disclosure hierarchy. The aggregate value of investments by input level as of April 30, 2016, including information on transfers between Levels 1 and 2, is included at the end of the Fund's Schedule of Investments.
Foreign Currency. The Fund may use foreign currency contracts to facilitate transactions in foreign-denominated securities. Gains and losses from these transactions may arise from changes in the value of the foreign currency or if the counterparties do not perform under the contracts' terms.
Foreign-denominated assets, including investment securities, and liabilities are translated into U.S. dollars at the exchange rates at period end. Purchases and sales of investment securities, income and dividends received and expenses denominated in foreign currencies are translated into U.S. dollars at the exchange rate in effect on the transaction date.
The effects of exchange rate fluctuations on investments are included with the net realized and unrealized gain (loss) on investment securities. Other foreign currency transactions resulting in realized and unrealized gain (loss) are disclosed separately.
Investment Transactions and Income. For financial reporting purposes, the Fund's investment holdings and NAV include trades executed through the end of the last business day of the period. The NAV per share for processing shareholder transactions is calculated as of the close of business of the New York Stock Exchange (NYSE), normally 4:00 p.m. Eastern time and includes trades executed through the end of the prior business day. Gains and losses on securities sold are determined on the basis of identified cost and may include proceeds received from litigation. Dividend income is recorded on the ex-dividend date, except for certain dividends from foreign securities where the ex-dividend date may have passed, which are recorded as soon as the Fund is informed of the ex-dividend date. Non-cash dividends included in dividend income, if any, are recorded at the fair market value of the securities received. Income and capital gain distributions from Fidelity Central Funds, if any, are recorded on the ex-dividend date. Distributions received on securities that represent a return of capital or capital gain are recorded as a reduction of cost of investments and/or as a realized gain. Subsequent to ex-dividend date the Fund determines the components of these distributions, based upon receipt of tax filings or other correspondence relating to the underlying investment. Investment income is recorded net of foreign taxes withheld where recovery of such taxes is uncertain.
Expenses. Expenses directly attributable to a fund are charged to that fund. Expenses attributable to more than one fund are allocated among the respective funds on the basis of relative net assets or other appropriate methods. Expense estimates are accrued in the period to which they relate and adjustments are made when actual amounts are known.
Income Tax Information and Distributions to Shareholders. Each year, the Fund intends to qualify as a regulated investment company under Subchapter M of the Internal Revenue Code, including distributing substantially all of its taxable income and realized gains. As a result, no provision for U.S. Federal income taxes is required. The Fund files a U.S. federal tax return, in addition to state and local tax returns as required. The Fund's federal income tax returns are subject to examination by the Internal Revenue Service (IRS) for a period of three fiscal years after they are filed. State and local tax returns may be subject to examination for an additional fiscal year depending on the jurisdiction. Foreign taxes are provided for based on the Fund's understanding of the tax rules and rates that exist in the foreign markets in which it invests. The Fund is subject to a tax imposed on capital gains by certain countries in which it invests.
Distributions are declared and recorded on the ex-dividend date. Income and capital gain distributions are determined in accordance with income tax regulations, which may differ from GAAP.
Capital accounts within the financial statements are adjusted for permanent book-tax differences. These adjustments have no impact on net assets or the results of operations. Capital accounts are not adjusted for temporary book-tax differences which will reverse in a subsequent period.
Book-tax differences are primarily due to foreign currency transactions, certain foreign taxes, passive foreign investment companies (PFIC), partnerships, deferred trustees compensation and losses deferred due to wash sales.
The federal tax cost of investment securities and unrealized appreciation (depreciation) as of period end were as follows:
| Gross unrealized appreciation | $214,044,214 |
| Gross unrealized depreciation | (15,415,876) |
| Net unrealized appreciation (depreciation) on securities | $198,628,338 |
| Tax cost | $1,341,325,707 |
Short-Term Trading (Redemption) Fees. Shares held by investors in the Fund less than 30 days may have been subject to a redemption fee equal to 1.00% of the NAV of shares redeemed. All redemption fees, which reduce the proceeds of the shareholder redemption, are retained by the Fund and accounted for as an addition to paid in capital.
4. Purchases and Sales of Investments.
Purchases and sales of securities, other than short-term securities, aggregated $1,264,246,512 and $1,130,950,262, respectively.
5. Fees and Other Transactions with Affiliates.
Management Fee. Fidelity Management & Research Company and its affiliates provide the Fund with investment management related services for which the Fund pays a monthly management fee. The management fee is the sum of an individual fund fee rate that is based on an annual rate of .45% of the Fund's average net assets and an annualized group fee rate that averaged .25% during the period. The group fee rate is based upon the average net assets of all the mutual funds advised by the investment adviser, including any mutual funds previously advised by the investment adviser that are currently advised by Fidelity SelectCo, LLC, an affiliate of the investment adviser. The group fee rate decreases as assets under management increase and increases as assets under management decrease. In addition, the management fee is subject to a performance adjustment (up to a maximum of +/- .20% of the Fund's average net assets over a 36 month performance period). The upward or downward adjustment to the management fee is based on the Fund's relative investment performance as compared to its benchmark index, the MSCI All Country World ex USA Index, over the same 36 month performance period. For the reporting period, the total annualized management fee rate, including the performance adjustment, was .86% of the Fund's average net assets. The performance adjustment included in the management fee rate may be higher or lower than the maximum performance adjustment rate due to the difference between the average net assets for the reporting and performance periods.
Transfer Agent Fees. Fidelity Investments Institutional Operations Company, Inc. (FIIOC), an affiliate of the investment adviser, is the Fund's transfer, dividend disbursing and shareholder servicing agent. FIIOC receives account fees and asset-based fees that vary according to account size and type of account. FIIOC pays for typesetting, printing and mailing of shareholder reports, except proxy statements. For the period, the transfer agent fees were equivalent to an annualized rate of .20% of average net assets.
Accounting and Security Lending Fees. Fidelity Service Company, Inc. (FSC), an affiliate of the investment adviser, maintains the Fund's accounting records. The accounting fee is based on the level of average net assets for each month. Under a separate contract, FSC administers the security lending program. The security lending fee is based on the number and duration of lending transactions.
Brokerage Commissions. The Fund placed a portion of its portfolio transactions with brokerage firms which are affiliates of the investment adviser. Brokerage commissions are included in net realized gain (loss) and change in net unrealized appreciation (depreciation) in the Statement of Operations. The commissions paid to these affiliated firms were $4,896 for the period.
Interfund Lending Program. Pursuant to an Exemptive Order issued by the SEC, the Fund, along with other registered investment companies having management contracts with Fidelity Management & Research Company (FMR) or other affiliated entities of FMR, may participate in an interfund lending program. This program provides an alternative credit facility allowing the funds to borrow from, or lend money to, other participating affiliated funds. At period end, there were no interfund loans outstanding. The Fund's activity in this program during the period for which loans were outstanding was as follows:
| Borrower or Lender | Average Loan Balance | Weighted Average Interest Rate | Interest Expense |
| Borrower | $11,346,261 | .51% | $3,691 |
Interfund Trades. The Fund may purchase from or sell securities to other Fidelity Funds under procedures adopted by the Board. The procedures have been designed to ensure these interfund trades are executed in accordance with Rule 17a-7 of the 1940 Act. Interfund trades are included within the respective purchases and sales amounts shown in the Purchases and Sales of Investments note.
6. Committed Line of Credit.
The Fund participates with other funds managed by the investment adviser or an affiliate in a $4.25 billion credit facility (the "line of credit") to be utilized for temporary or emergency purposes to fund shareholder redemptions or for other short-term liquidity purposes. The Fund has agreed to pay commitment fees on its pro-rata portion of the line of credit, which amounted to $1,231 and is reflected in Miscellaneous expenses on the Statement of Operations. During the period, the Fund did not borrow on this line of credit.
7. Security Lending.
The Fund lends portfolio securities through a lending agent from time to time in order to earn additional income. For equity securities, a lending agent is used and may loan securities to certain qualified borrowers, including Fidelity Capital Markets (FCM), a broker-dealer affiliated with the Fund. On the settlement date of the loan, the Fund receives collateral (in the form of U.S. Treasury obligations, letters of credit and/or cash) against the loaned securities and maintains collateral in an amount not less than 100% of the market value of the loaned securities during the period of the loan. The market value of the loaned securities is determined at the close of business of the Fund and any additional required collateral is delivered to the Fund on the next business day. The Fund or borrower may terminate the loan at any time, and if the borrower defaults on its obligation to return the securities loaned because of insolvency or other reasons, the Fund may apply collateral received from the borrower against the obligation. The Fund may experience delays and costs in recovering the securities loaned. Any cash collateral received is invested in the Fidelity Securities Lending Cash Central Fund. The value of loaned securities and cash collateral at period end are disclosed on the Fund's Statement of Assets and Liabilities. Security lending income represents the income earned on investing cash collateral, less rebates paid to borrowers and any lending agent fees associated with the loan, plus any premium payments received for lending certain types of securities. Security lending income is presented in the Statement of Operations as a component income from Fidelity Central Funds. Total security lending income during the period amounted to $215,095. During the period, there were no securities loaned to FCM.
8. Expense Reductions.
Commissions paid to certain brokers with whom the investment adviser, or its affiliates, places trades on behalf of the Fund include an amount in addition to trade execution, which may be rebated back to the Fund to offset certain expenses. This amount totaled $47,044 for the period.
In addition, during the period the investment adviser reimbursed and/or waived a portion of operating expenses in the amount of $5,025.
9. Other.
The Fund's organizational documents provide former and current trustees and officers with a limited indemnification against liabilities arising in connection with the performance of their duties to the Fund. In the normal course of business, the Fund may also enter into contracts that provide general indemnifications. The Fund's maximum exposure under these arrangements is unknown as this would be dependent on future claims that may be made against the Fund. The risk of material loss from such claims is considered remote.
At the end of the period, Strategic Advisers International II Fund was the owner of record of approximately 22% of the total outstanding shares of the Fund. Mutual funds managed by the investment adviser or its affiliates were the owners of record, in the aggregate, of approximately 29% of the total outstanding shares of the Fund.
Fidelity® Overseas Fund
Investment Summary (Unaudited)
Geographic Diversification (% of fund's net assets)
| As of April 30, 2016 | ||
| United Kingdom | 22.0% | |
| Japan | 17.5% | |
| Germany | 8.8% | |
| United States of America* | 8.1% | |
| France | 8.0% | |
| Switzerland | 7.9% | |
| Sweden | 4.1% | |
| Netherlands | 2.7% | |
| Ireland | 2.6% | |
| Other | 18.3% | |
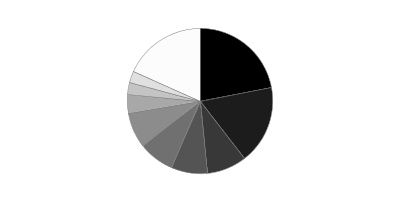
* Includes Short-Term Investments and Net Other Assets (Liabilities).
Percentages are based on country or territory of incorporation and are adjusted for the effect of futures contracts, if applicable.
| As of October 31, 2015 | ||
| United Kingdom | 27.6% | |
| Japan | 18.2% | |
| Switzerland | 7.8% | |
| Germany | 7.0% | |
| United States of America* | 6.7% | |
| France | 6.6% | |
| Sweden | 3.4% | |
| Australia | 2.9% | |
| Ireland | 2.8% | |
| Other | 17.0% | |
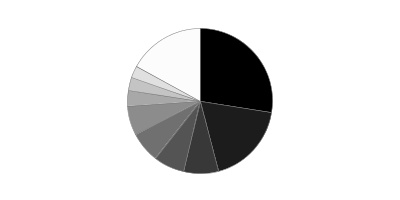
* Includes Short-Term Investments and Net Other Assets (Liabilities).
Percentages are based on country or territory of incorporation and are adjusted for the effect of futures contracts, if applicable.
Asset Allocation as of April 30, 2016
| % of fund's net assets | % of fund's net assets 6 months ago | |
| Stocks | 97.6 | 98.2 |
| Short-Term Investments and Net Other Assets (Liabilities) | 2.4 | 1.8 |
Top Ten Stocks as of April 30, 2016
| % of fund's net assets | % of fund's net assets 6 months ago | |
| Nestle SA (Switzerland, Food Products) | 2.2 | 2.1 |
| Novartis AG (Switzerland, Pharmaceuticals) | 1.8 | 0.0 |
| Bayer AG (Germany, Pharmaceuticals) | 1.6 | 1.5 |
| Total SA (France, Oil, Gas & Consumable Fuels) | 1.6 | 1.3 |
| Sanofi SA (France, Pharmaceuticals) | 1.5 | 1.7 |
| Anheuser-Busch InBev SA NV (Belgium, Beverages) | 1.3 | 1.2 |
| SAP AG (Germany, Software) | 1.2 | 0.0 |
| UBS Group AG (Switzerland, Capital Markets) | 1.1 | 1.2 |
| AIA Group Ltd. (Hong Kong, Insurance) | 1.1 | 1.1 |
| Fresenius SE & Co. KGaA (Germany, Health Care Providers & Services) | 1.1 | 1.2 |
| 14.5 |
Market Sectors as of April 30, 2016
| % of fund's net assets | % of fund's net assets 6 months ago | |
| Financials | 21.2 | 22.6 |
| Health Care | 16.3 | 15.8 |
| Consumer Discretionary | 14.8 | 16.2 |
| Consumer Staples | 12.0 | 11.9 |
| Information Technology | 11.1 | 9.6 |
| Industrials | 10.4 | 11.3 |
| Materials | 6.5 | 5.5 |
| Telecommunication Services | 3.0 | 3.5 |
| Energy | 2.3 | 1.8 |
Percentages shown as 0.0% may reflect amounts less than 0.05%.
Fidelity® Overseas Fund
Investments April 30, 2016 (Unaudited)
Showing Percentage of Net Assets
| Common Stocks - 96.6% | |||
| Shares | Value | ||
| Australia - 2.4% | |||
| Amcor Ltd. (a) | 3,956,685 | $46,330,368 | |
| Ansell Ltd. (a) | 527,656 | 7,995,981 | |
| Aub Group Ltd. | 2,948,275 | 19,502,972 | |
| Australia & New Zealand Banking Group Ltd. | 1,452,585 | 26,625,791 | |
| Flight Centre Travel Group Ltd. (b) | 736,160 | 22,003,350 | |
| Life Healthcare Group Ltd. | 1,672,012 | 1,728,987 | |
| TOTAL AUSTRALIA | 124,187,449 | ||
| Austria - 0.4% | |||
| Andritz AG | 380,700 | 21,320,873 | |
| Bailiwick of Jersey - 2.2% | |||
| Regus PLC | 5,936,170 | 25,361,708 | |
| Sanne Group PLC | 1,181,000 | 7,614,290 | |
| Wolseley PLC | 575,693 | 32,245,756 | |
| WPP PLC | 2,177,633 | 50,875,137 | |
| TOTAL BAILIWICK OF JERSEY | 116,096,891 | ||
| Belgium - 2.2% | |||
| Anheuser-Busch InBev SA NV | 562,012 | 69,565,792 | |
| KBC Groep NV | 821,837 | 46,139,410 | |
| TOTAL BELGIUM | 115,705,202 | ||
| Bermuda - 0.4% | |||
| Markit Ltd. (a) | 606,400 | 21,157,296 | |
| Canada - 0.9% | |||
| Constellation Software, Inc. | 64,400 | 25,167,686 | |
| Open Text Corp. | 353,900 | 19,814,677 | |
| TOTAL CANADA | 44,982,363 | ||
| Cayman Islands - 0.2% | |||
| Lifestyle International Holdings Ltd. | 5,835,500 | 9,666,645 | |
| Denmark - 0.5% | |||
| NNIT A/S | 876,493 | 23,868,680 | |
| France - 8.0% | |||
| ALTEN | 378,200 | 23,385,127 | |
| Amundi SA | 671,200 | 30,888,328 | |
| AXA SA | 1,569,900 | 39,639,343 | |
| Capgemini SA | 349,800 | 32,655,903 | |
| Christian Dior SA | 137,297 | 24,108,449 | |
| Ipsen SA | 293,700 | 17,773,518 | |
| Publicis Groupe SA | 574,300 | 42,500,049 | |
| Sanofi SA (b) | 925,747 | 76,306,142 | |
| Sodexo SA | 326,500 | 32,970,610 | |
| Total SA | 1,618,300 | 81,790,152 | |
| Zodiac Aerospace | 694,311 | 16,278,051 | |
| TOTAL FRANCE | 418,295,672 | ||
| Germany - 7.8% | |||
| adidas AG | 422,700 | 54,499,823 | |
| Axel Springer Verlag AG | 559,800 | 31,255,111 | |
| Bayer AG | 720,997 | 83,176,945 | |
| CompuGroup Medical AG | 466,300 | 18,314,033 | |
| Continental AG | 143,000 | 31,405,744 | |
| Deutsche Post AG | 1,508,219 | 44,301,312 | |
| Fresenius SE & Co. KGaA | 777,800 | 56,572,175 | |
| mutares AG | 422,100 | 7,008,221 | |
| SAP AG | 822,193 | 64,510,124 | |
| Wirecard AG (b) | 389,600 | 16,825,094 | |
| TOTAL GERMANY | 407,868,582 | ||
| Hong Kong - 1.7% | |||
| AIA Group Ltd. | 9,619,800 | 57,570,713 | |
| Techtronic Industries Co. Ltd. | 7,906,000 | 29,636,984 | |
| TOTAL HONG KONG | 87,207,697 | ||
| Indonesia - 0.4% | |||
| PT Bank Rakyat Indonesia Tbk | 29,074,800 | 22,818,030 | |
| Ireland - 2.6% | |||
| Allergan PLC (a) | 95,900 | 20,768,104 | |
| DCC PLC (United Kingdom) | 307,600 | 27,236,654 | |
| Kerry Group PLC Class A | 424,964 | 37,891,934 | |
| Medtronic PLC | 407,400 | 32,245,710 | |
| United Drug PLC (United Kingdom) | 2,088,200 | 18,673,181 | |
| TOTAL IRELAND | 136,815,583 | ||
| Isle of Man - 0.4% | |||
| Playtech Ltd. | 1,856,301 | 21,820,729 | |
| Israel - 0.5% | |||
| Frutarom Industries Ltd. | 534,972 | 27,418,308 | |
| Italy - 2.2% | |||
| DiaSorin S.p.A. | 420,800 | 24,573,689 | |
| Mediaset SpA | 6,103,900 | 27,467,834 | |
| OVS (a) | 3,316,500 | 21,646,082 | |
| Recordati SpA | 933,500 | 23,718,984 | |
| Reply SpA | 113,362 | 16,134,781 | |
| TOTAL ITALY | 113,541,370 | ||
| Japan - 17.5% | |||
| Ai Holdings Corp. | 1,147,100 | 32,778,765 | |
| Arc Land Sakamoto Co. Ltd. | 1,049,000 | 10,891,921 | |
| Astellas Pharma, Inc. | 3,444,300 | 46,438,099 | |
| Bridgestone Corp. | 910,500 | 33,513,162 | |
| Broadleaf Co. Ltd. | 514,300 | 5,082,346 | |
| Casio Computer Co. Ltd. (b) | 1,205,900 | 22,944,570 | |
| Daito Trust Construction Co. Ltd. | 291,800 | 41,269,933 | |
| Dentsu, Inc. | 648,000 | 32,924,238 | |
| Fukuda Denshi Co. Ltd. | 147,200 | 8,037,089 | |
| GMO Internet, Inc. | 1,223,400 | 14,364,585 | |
| Hoya Corp. | 1,141,100 | 43,697,598 | |
| Iriso Electronics Co. Ltd. | 290,700 | 13,843,440 | |
| Japan Tobacco, Inc. | 1,212,000 | 49,519,822 | |
| KDDI Corp. | 1,687,600 | 48,612,556 | |
| Keyence Corp. | 58,490 | 35,058,498 | |
| Leopalace21 Corp. (a) | 1,802,900 | 10,818,353 | |
| Makita Corp. | 496,500 | 31,320,913 | |
| Miraca Holdings, Inc. | 492,300 | 20,921,341 | |
| Misumi Group, Inc. | 1,842,600 | 25,445,896 | |
| Nakanishi, Inc. (c) | 645,100 | 21,142,738 | |
| NGK Spark Plug Co. Ltd. | 1,207,900 | 24,089,598 | |
| Nippon Paint Holdings Co. Ltd. | 1,020,700 | 26,800,406 | |
| Nitori Holdings Co. Ltd. | 322,200 | 29,970,664 | |
| NOF Corp. (c) | 1,181,000 | 9,296,079 | |
| OBIC Co. Ltd. | 431,900 | 22,701,068 | |
| Olympus Corp. | 1,270,500 | 49,494,392 | |
| ORIX Corp. | 2,813,100 | 39,791,119 | |
| Shinsei Bank Ltd. | 16,258,000 | 22,786,830 | |
| Ship Healthcare Holdings, Inc. | 855,300 | 21,107,435 | |
| SoftBank Corp. | 441,600 | 23,745,053 | |
| Software Service, Inc. | 108,400 | 4,186,863 | |
| Sundrug Co. Ltd. | 410,900 | 29,196,833 | |
| The Suruga Bank Ltd. | 829,300 | 16,124,882 | |
| Tsuruha Holdings, Inc. | 336,600 | 32,285,203 | |
| VT Holdings Co. Ltd. | 3,332,400 | 16,837,525 | |
| TOTAL JAPAN | 917,039,813 | ||
| Luxembourg - 0.4% | |||
| Eurofins Scientific SA | 52,259 | 19,390,882 | |
| Netherlands - 2.7% | |||
| Arcadis NV (b) | 772,600 | 13,230,174 | |
| IMCD Group BV | 1,012,578 | 40,882,293 | |
| ING Groep NV (Certificaten Van Aandelen) | 4,140,500 | 50,705,845 | |
| Koninklijke Philips Electronics NV | 1,297,500 | 35,653,445 | |
| TOTAL NETHERLANDS | 140,471,757 | ||
| New Zealand - 0.8% | |||
| EBOS Group Ltd. | 2,276,701 | 25,371,715 | |
| Trade Maine Group Ltd. | 5,178,779 | 16,489,336 | |
| TOTAL NEW ZEALAND | 41,861,051 | ||
| Panama - 0.3% | |||
| Copa Holdings SA Class A | 241,400 | 15,389,250 | |
| Portugal - 0.6% | |||
| NOS SGPS SA | 4,289,900 | 30,774,620 | |
| Spain - 1.4% | |||
| Amadeus IT Holding SA Class A | 1,135,500 | 51,670,118 | |
| Grifols SA ADR | 1,331,600 | 20,932,752 | |
| TOTAL SPAIN | 72,602,870 | ||
| Sweden - 4.1% | |||
| Addlife AB (a) | 42,593 | 538,350 | |
| Alfa Laval AB (b) | 1,157,800 | 18,252,711 | |
| HEXPOL AB (B Shares) (b) | 2,850,100 | 29,457,664 | |
| Nordea Bank AB | 4,984,800 | 48,386,474 | |
| Svenska Cellulosa AB (SCA) (B Shares) | 1,605,900 | 50,574,016 | |
| Svenska Handelsbanken AB (A Shares) | 2,201,800 | 29,372,348 | |
| Swedbank AB (A Shares) | 1,842,800 | 39,745,339 | |
| TOTAL SWEDEN | 216,326,902 | ||
| Switzerland - 7.9% | |||
| Credit Suisse Group AG | 2,714,777 | 41,314,733 | |
| Julius Baer Group Ltd. | 732,530 | 31,393,138 | |
| Nestle SA | 1,543,139 | 115,179,409 | |
| Novartis AG | 1,275,417 | 97,062,119 | |
| Sika AG | 8,220 | 34,986,198 | |
| Syngenta AG (Switzerland) | 88,162 | 35,290,533 | |
| UBS Group AG | 3,469,516 | 60,037,492 | |
| TOTAL SWITZERLAND | 415,263,622 | ||
| Taiwan - 0.4% | |||
| Taiwan Semiconductor Manufacturing Co. Ltd. | 4,310,000 | 19,771,084 | |
| United Kingdom - 22.0% | |||
| Aberdeen Asset Management PLC | 2,892,700 | 12,625,059 | |
| Aon PLC | 226,200 | 23,778,144 | |
| Ashmore Group PLC (b) | 5,032,900 | 22,583,587 | |
| British American Tobacco PLC (United Kingdom) | 814,400 | 49,655,669 | |
| BT Group PLC | 8,518,600 | 55,218,171 | |
| Capita Group PLC | 1,914,900 | 28,007,541 | |
| Cineworld Group PLC | 3,627,900 | 27,458,694 | |
| Close Brothers Group PLC | 1,386,800 | 24,559,033 | |
| Compass Group PLC | 1,932,000 | 34,405,807 | |
| Dechra Pharmaceuticals PLC | 474,295 | 7,664,759 | |
| Diageo PLC | 1,781,860 | 48,174,534 | |
| Diploma PLC | 2,053,503 | 21,948,481 | |
| Elementis PLC | 5,004,700 | 15,787,941 | |
| Essentra PLC | 2,771,843 | 32,886,637 | |
| Exova Group Ltd. PLC | 8,056,935 | 18,835,825 | |
| Hikma Pharmaceuticals PLC | 589,972 | 18,999,308 | |
| Hilton Food Group PLC | 1,138,579 | 9,366,263 | |
| Howden Joinery Group PLC | 4,019,500 | 29,013,077 | |
| IMI PLC | 1,164,999 | 15,915,928 | |
| Intertek Group PLC | 475,000 | 22,605,086 | |
| ITV PLC | 10,239,000 | 33,691,530 | |
| James Fisher and Sons PLC | 945,156 | 19,541,358 | |
| Jardine Lloyd Thompson Group PLC | 1,387,474 | 17,576,757 | |
| John Wood Group PLC | 1,765,596 | 16,110,855 | |
| London Stock Exchange Group PLC | 747,345 | 29,625,503 | |
| Melrose Industries PLC | 965,385 | 5,265,666 | |
| Micro Focus International PLC | 1,261,900 | 28,192,087 | |
| Next PLC | 241,400 | 17,935,894 | |
| Prudential PLC | 2,745,192 | 54,188,811 | |
| Reckitt Benckiser Group PLC | 548,300 | 53,414,780 | |
| Rio Tinto PLC | 1,347,700 | 45,210,344 | |
| Rolls-Royce Group PLC | 1,834,566 | 17,946,457 | |
| Rotork PLC | 3,702,547 | 10,116,656 | |
| SABMiller PLC | 536,700 | 32,818,737 | |
| Schroders PLC | 986,900 | 36,252,105 | |
| Senior Engineering Group PLC | 4,960,700 | 15,772,359 | |
| Shawbrook Group PLC | 4,800,286 | 20,101,946 | |
| Sinclair Pharma PLC (a) | 10,370,587 | 5,455,074 | |
| Softcat PLC | 4,743,200 | 22,108,380 | |
| Spectris PLC | 724,800 | 19,285,146 | |
| Spirax-Sarco Engineering PLC | 399,510 | 19,934,859 | |
| St. James's Place Capital PLC | 3,594,305 | 45,533,269 | |
| The Restaurant Group PLC | 2,659,400 | 10,689,787 | |
| Vodafone Group PLC | 7,625,732 | 24,568,872 | |
| Whitbread PLC | 544,300 | 30,794,169 | |
| TOTAL UNITED KINGDOM | 1,151,620,945 | ||
| United States of America - 5.7% | |||
| Alphabet, Inc. Class C | 51,593 | 35,754,465 | |
| Cognizant Technology Solutions Corp. Class A (a) | 550,500 | 32,132,685 | |
| Fidelity National Information Services, Inc. | 453,700 | 29,853,460 | |
| McGraw Hill Financial, Inc. | 485,300 | 51,854,305 | |
| McKesson Corp. | 153,117 | 25,696,095 | |
| Moody's Corp. | 215,500 | 20,627,660 | |
| MSCI, Inc. Class A | 553,200 | 42,010,008 | |
| PPG Industries, Inc. | 296,600 | 32,741,674 | |
| Verisk Analytics, Inc. (a) | 375,600 | 29,139,048 | |
| TOTAL UNITED STATES OF AMERICA | 299,809,400 | ||
| TOTAL COMMON STOCKS | |||
| (Cost $4,712,053,578) | 5,053,093,566 | ||
| Nonconvertible Preferred Stocks - 1.0% | |||
| Germany - 1.0% | |||
| Henkel AG & Co. KGaA | 460,400 | 52,549,404 | |
| United Kingdom - 0.0% | |||
| Rolls-Royce Group PLC | 130,254,186 | 190,321 | |
| Rolls-Royce Group PLC (C Shares) (a) | 170,064,268 | 248,489 | |
| TOTAL UNITED KINGDOM | 438,810 | ||
| TOTAL NONCONVERTIBLE PREFERRED STOCKS | |||
| (Cost $44,266,796) | 52,988,214 | ||
| Money Market Funds - 5.8% | |||
| Fidelity Cash Central Fund, 0.38% (d) | 117,556,732 | 117,556,732 | |
| Fidelity Securities Lending Cash Central Fund, 0.42% (d)(e) | 182,936,671 | 182,936,671 | |
| TOTAL MONEY MARKET FUNDS | |||
| (Cost $300,493,403) | 300,493,403 | ||
| TOTAL INVESTMENT PORTFOLIO - 103.4% | |||
| (Cost $5,056,813,777) | 5,406,575,183 | ||
| NET OTHER ASSETS (LIABILITIES) - (3.4)% | (177,557,639) | ||
| NET ASSETS - 100% | $5,229,017,544 |
Categorizations in the Schedule of Investments are based on country or territory of incorporation.
Legend
(a) Non-income producing
(b) Security or a portion of the security is on loan at period end.
(c) Security or a portion of the security purchased on a delayed delivery or when-issued basis.
(d) Affiliated fund that is generally available only to investment companies and other accounts managed by Fidelity Investments. The rate quoted is the annualized seven-day yield of the fund at period end. A complete unaudited listing of the fund's holdings as of its most recent quarter end is available upon request. In addition, each Fidelity Central Fund's financial statements are available on the SEC's website or upon request.
(e) Investment made with cash collateral received from securities on loan.
Affiliated Central Funds
Information regarding fiscal year to date income earned by the Fund from investments in Fidelity Central Funds is as follows:
| Fund | Income earned |
| Fidelity Cash Central Fund | $212,653 |
| Fidelity Securities Lending Cash Central Fund | 1,917,406 |
| Total | $2,130,059 |
Investment Valuation
The following is a summary of the inputs used, as of April 30, 2016, involving the Fund's assets and liabilities carried at fair value. The inputs or methodology used for valuing securities may not be an indication of the risk associated with investing in those securities. For more information on valuation inputs, and their aggregation into the levels used below, please refer to the Investment Valuation section in the accompanying Notes to Financial Statements.
| Valuation Inputs at Reporting Date: | ||||
| Description | Total | Level 1 | Level 2 | Level 3 |
| Investments in Securities: | ||||
| Equities: | ||||
| Consumer Discretionary | $780,460,410 | $442,204,110 | $338,256,300 | $-- |
| Consumer Staples | 630,192,396 | 252,766,146 | 377,426,250 | -- |
| Energy | 117,442,365 | 35,652,213 | 81,790,152 | -- |
| Financials | 1,112,027,067 | 701,131,073 | 410,895,994 | -- |
| Health Care | 841,852,738 | 453,458,922 | 388,393,816 | -- |
| Industrials | 552,845,752 | 383,878,430 | 168,967,322 | -- |
| Information Technology | 582,910,248 | 374,800,338 | 208,109,910 | -- |
| Materials | 336,206,152 | 254,899,323 | 81,306,829 | -- |
| Telecommunication Services | 152,144,652 | -- | 152,144,652 | -- |
| Money Market Funds | 300,493,403 | 300,493,403 | -- | -- |
| Total Investments in Securities: | $5,406,575,183 | $3,199,283,958 | $2,207,291,225 | $-- |
The following is a summary of transfers between Level 1 and Level 2 for the period ended April 30, 2016. Transfers are assumed to have occurred at the beginning of the period, and are primarily attributable to the valuation techniques used for foreign equity securities, as discussed in the accompanying Notes to Financial Statements:
| Transfers | Total |
| Level 1 to Level 2 | $23,308,879 |
| Level 2 to Level 1 | $328,385,769 |
See accompanying notes which are an integral part of the financial statements.
Fidelity® Overseas Fund
Financial Statements
Statement of Assets and Liabilities
| April 30, 2016 (Unaudited) | ||
| Assets | ||
| Investment in securities, at value (including securities loaned of $170,331,062) — See accompanying schedule: Unaffiliated issuers (cost $4,756,320,374) | $5,106,081,780 | |
| Fidelity Central Funds (cost $300,493,403) | 300,493,403 | |
| Total Investments (cost $5,056,813,777) | $5,406,575,183 | |
| Cash | 41,952 | |
| Foreign currency held at value (cost $1,154) | 2,229 | |
| Receivable for investments sold | ||
| Regular delivery | 8,642,354 | |
| Delayed delivery | 403,612 | |
| Receivable for fund shares sold | 8,438,111 | |
| Dividends receivable | 29,088,821 | |
| Distributions receivable from Fidelity Central Funds | 590,022 | |
| Prepaid expenses | 2,567 | |
| Other receivables | 276,286 | |
| Total assets | 5,454,061,137 | |
| Liabilities | ||
| Payable for investments purchased | ||
| Regular delivery | $16,585,383 | |
| Delayed delivery | 1,080,140 | |
| Payable for fund shares redeemed | 19,794,003 | |
| Accrued management fee | 3,485,251 | |
| Other affiliated payables | 787,010 | |
| Other payables and accrued expenses | 375,135 | |
| Collateral on securities loaned, at value | 182,936,671 | |
| Total liabilities | 225,043,593 | |
| Net Assets | $5,229,017,544 | |
| Net Assets consist of: | ||
| Paid in capital | $6,080,442,578 | |
| Undistributed net investment income | 57,390,251 | |
| Accumulated undistributed net realized gain (loss) on investments and foreign currency transactions | (1,259,003,036) | |
| Net unrealized appreciation (depreciation) on investments and assets and liabilities in foreign currencies | 350,187,751 | |
| Net Assets | $5,229,017,544 | |
| Overseas: | ||
| Net Asset Value, offering price and redemption price per share ($4,494,719,160 ÷ 110,726,753 shares) | $40.59 | |
| Class K: | ||
| Net Asset Value, offering price and redemption price per share ($734,298,384 ÷ 18,127,284 shares) | $40.51 |
See accompanying notes which are an integral part of the financial statements.
Statement of Operations
| Six months ended April 30, 2016 (Unaudited) | ||
| Investment Income | ||
| Dividends | $65,804,086 | |
| Special dividends | 22,808,863 | |
| Income from Fidelity Central Funds | 2,130,059 | |
| Income before foreign taxes withheld | 90,743,008 | |
| Less foreign taxes withheld | (5,835,176) | |
| Total income | 84,907,832 | |
| Expenses | ||
| Management fee | ||
| Basic fee | $16,234,438 | |
| Performance adjustment | 3,314,418 | |
| Transfer agent fees | 3,786,434 | |
| Accounting and security lending fees | 788,465 | |
| Custodian fees and expenses | 229,672 | |
| Independent trustees' compensation | 10,280 | |
| Appreciation in deferred trustee compensation account | 64 | |
| Registration fees | 117,068 | |
| Audit | 47,586 | |
| Legal | 15,236 | |
| Miscellaneous | 13,969 | |
| Total expenses before reductions | 24,557,630 | |
| Expense reductions | (42,177) | 24,515,453 |
| Net investment income (loss) | 60,392,379 | |
| Realized and Unrealized Gain (Loss) | ||
| Net realized gain (loss) on: | ||
| Investment securities: | ||
| Unaffiliated issuers | (17,439,922) | |
| Foreign currency transactions | 1,968,001 | |
| Total net realized gain (loss) | (15,471,921) | |
| Change in net unrealized appreciation (depreciation) on: Investment securities | (86,717,449) | |
| Assets and liabilities in foreign currencies | (217,135) | |
| Total change in net unrealized appreciation (depreciation) | (86,934,584) | |
| Net gain (loss) | (102,406,505) | |
| Net increase (decrease) in net assets resulting from operations | $(42,014,126) |
See accompanying notes which are an integral part of the financial statements.
Statement of Changes in Net Assets
| Six months ended April 30, 2016 (Unaudited) | Year ended October 31, 2015 | |
| Increase (Decrease) in Net Assets | ||
| Operations | ||
| Net investment income (loss) | $60,392,379 | $50,015,823 |
| Net realized gain (loss) | (15,471,921) | 123,820,228 |
| Change in net unrealized appreciation (depreciation) | (86,934,584) | 99,378,276 |
| Net increase (decrease) in net assets resulting from operations | (42,014,126) | 273,214,327 |
| Distributions to shareholders from net investment income | (49,659,846) | (58,590,311) |
| Distributions to shareholders from net realized gain | (685,981) | – |
| Total distributions | (50,345,827) | (58,590,311) |
| Share transactions - net increase (decrease) | 785,462,967 | 955,711,893 |
| Redemption fees | 39,729 | 55,180 |
| Total increase (decrease) in net assets | 693,142,743 | 1,170,391,089 |
| Net Assets | ||
| Beginning of period | 4,535,874,801 | 3,365,483,712 |
| End of period (including undistributed net investment income of $57,390,251 and undistributed net investment income of $46,657,718, respectively) | $5,229,017,544 | $4,535,874,801 |
See accompanying notes which are an integral part of the financial statements.
Financial Highlights — Fidelity Overseas Fund
| Six months ended (Unaudited) April 30, | Years ended October 31, | |||||
| 2016 | 2015 | 2014 | 2013 | 2012 | 2011 | |
| Selected Per–Share Data | ||||||
| Net asset value, beginning of period | $41.56 | $39.02 | $39.22 | $31.35 | $29.28 | $31.56 |
| Income from Investment Operations | ||||||
| Net investment income (loss)A | .49B | .52 | .77C | .54 | .73 | .47 |
| Net realized and unrealized gain (loss) | (1.03) | 2.69 | (.28) | 8.10 | 2.19 | (2.27) |
| Total from investment operations | (.54) | 3.21 | .49 | 8.64 | 2.92 | (1.80) |
| Distributions from net investment income | (.43) | (.67) | (.51) | (.77) | (.83) | (.48) |
| Distributions from net realized gain | (.01) | – | (.18) | – | (.02) | – |
| Total distributions | (.43)D | (.67) | (.69) | (.77) | (.85) | (.48) |
| Redemption fees added to paid in capitalA,E | – | – | – | – | – | – |
| Net asset value, end of period | $40.59 | $41.56 | $39.02 | $39.22 | $31.35 | $29.28 |
| Total ReturnF,G | (1.31)% | 8.34% | 1.27% | 28.17% | 10.37% | (5.83)% |
| Ratios to Average Net AssetsH,I | ||||||
| Expenses before reductions | 1.04%J | 1.04% | 1.04% | 1.09% | .69% | .73% |
| Expenses net of fee waivers, if any | 1.04%J | 1.04% | 1.04% | 1.09% | .69% | .73% |
| Expenses net of all reductions | 1.03%J | 1.03% | 1.04% | 1.06% | .67% | .67% |
| Net investment income (loss) | 2.48%B,J | 1.28% | 1.93%C | 1.54% | 2.52% | 1.44% |
| Supplemental Data | ||||||
| Net assets, end of period (000 omitted) | $4,494,719 | $3,844,290 | $2,738,667 | $1,874,922 | $1,639,725 | $2,215,717 |
| Portfolio turnover rateK | 31%J | 28% | 41% | 42% | 90% | 77% |
A Calculated based on average shares outstanding during the period.
B Net Investment income per share reflects a large, non-recurring dividend which amounted to $.19 per share. Excluding this non-recurring dividend, the ratio of net investment income (loss) to average net assets would have been 1.54%.
C Net Investment income per share reflects a large, non-recurring dividend which amounted to $.24 per share. Excluding this non-recurring dividend, the ratio of net investment income (loss) to average net assets would have been 1.34%.
D Total distributions of $.43 per share is comprised of distributions from net investment income of $.428 and distributions from net realized gain of $.006 per share.
E Amount represents less than $.005 per share.
F Total returns for periods of less than one year are not annualized.
G Total returns would have been lower if certain expenses had not been reduced during the applicable periods shown.
H Fees and expenses of any underlying Fidelity Central Funds are not included in the Fund's expense ratio. The Fund indirectly bears its proportionate share of the expenses of any underlying Fidelity Central Funds.
I Expense ratios reflect operating expenses of the class. Expenses before reductions do not reflect amounts reimbursed by the investment adviser or reductions from brokerage service arrangements or reductions from other expense offset arrangements and do not represent the amount paid by the class during periods when reimbursements or reductions occur. Expenses net of fee waivers reflect expenses after reimbursement by the investment adviser but prior to reductions from brokerage service arrangements or other expense offset arrangements. Expenses net of all reductions represent the net expenses paid by the class.
J Annualized
K Amount does not include the portfolio activity of any underlying Fidelity Central Funds.
See accompanying notes which are an integral part of the financial statements.
Financial Highlights — Fidelity Overseas Fund Class K
| Six months ended (Unaudited) April 30, | Years ended October 31, | |||||
| 2016 | 2015 | 2014 | 2013 | 2012 | 2011 | |
| Selected Per–Share Data | ||||||
| Net asset value, beginning of period | $41.49 | $38.96 | $39.17 | $31.32 | $29.29 | $31.59 |
| Income from Investment Operations | ||||||
| Net investment income (loss)A | .51B | .57 | .82C | .60 | .79 | .52 |
| Net realized and unrealized gain (loss) | (1.01) | 2.68 | (.28) | 8.08 | 2.18 | (2.27) |
| Total from investment operations | (.50) | 3.25 | .54 | 8.68 | 2.97 | (1.75) |
| Distributions from net investment income | (.47) | (.72) | (.58) | (.83) | (.92) | (.55) |
| Distributions from net realized gain | (.01) | – | (.18) | – | (.02) | – |
| Total distributions | (.48) | (.72) | (.75)D | (.83) | (.94) | (.55) |
| Redemption fees added to paid in capitalA,E | – | – | – | – | – | – |
| Net asset value, end of period | $40.51 | $41.49 | $38.96 | $39.17 | $31.32 | $29.29 |
| Total ReturnF,G | (1.24)% | 8.47% | 1.41% | 28.37% | 10.59% | (5.67)% |
| Ratios to Average Net AssetsH,I | ||||||
| Expenses before reductions | .91%J | .91% | .90% | .93% | .51% | .56% |
| Expenses net of fee waivers, if any | .91%J | .91% | .90% | .92% | .51% | .55% |
| Expenses net of all reductions | .91%J | .90% | .90% | .90% | .48% | .50% |
| Net investment income (loss) | 2.61%B,J | 1.40% | 2.06%C | 1.71% | 2.70% | 1.61% |
| Supplemental Data | ||||||
| Net assets, end of period (000 omitted) | $734,298 | $691,585 | $626,817 | $562,490 | $265,484 | $291,323 |
| Portfolio turnover rateK | 31%J | 28% | 41% | 42% | 90% | 77% |
A Calculated based on average shares outstanding during the period.
B Net Investment income per share reflects a large, non-recurring dividend which amounted to $.19 per share. Excluding this non-recurring dividend, the ratio of net investment income (loss) to average net assets would have been 1.67%.
C Net Investment income per share reflects a large, non-recurring dividend which amounted to $.24 per share. Excluding this non-recurring dividend, the ratio of net investment income (loss) to average net assets would have been 1.47%.
D Total distributions of $.75 per share is comprised of distributions from net investment income of $.575 and distributions from net realized gain of $.177 per share.
E Amount represents less than $.005 per share.
F Total returns for periods of less than one year are not annualized.
G Total returns would have been lower if certain expenses had not been reduced during the applicable periods shown.
H Fees and expenses of any underlying Fidelity Central Funds are not included in the Fund's expense ratio. The Fund indirectly bears its proportionate share of the expenses of any underlying Fidelity Central Funds.
I Expense ratios reflect operating expenses of the class. Expenses before reductions do not reflect amounts reimbursed by the investment adviser or reductions from brokerage service arrangements or reductions from other expense offset arrangements and do not represent the amount paid by the class during periods when reimbursements or reductions occur. Expenses net of fee waivers reflect expenses after reimbursement by the investment adviser but prior to reductions from brokerage service arrangements or other expense offset arrangements. Expenses net of all reductions represent the net expenses paid by the class.
J Annualized
K Amount does not include the portfolio activity of any underlying Fidelity Central Funds.
See accompanying notes which are an integral part of the financial statements.
Notes to Financial Statements (Unaudited)
For the period ended April 30, 2016
1. Organization.
Fidelity Overseas Fund (the Fund) is a fund of Fidelity Investment Trust (the Trust) and is authorized to issue an unlimited number of shares. The Trust is registered under the Investment Company Act of 1940, as amended (the 1940 Act), as an open-end management investment company organized as a Massachusetts business trust. The Fund offers Overseas and Class K shares, each of which has equal rights as to assets and voting privileges. Each class has exclusive voting rights with respect to matters that affect that class.
2. Investments in Fidelity Central Funds.
The Fund invests in Fidelity Central Funds, which are open-end investment companies generally available only to other investment companies and accounts managed by the investment adviser and its affiliates. The Fund's Schedule of Investments lists each of the Fidelity Central Funds held as of period end, if any, as an investment of the Fund, but does not include the underlying holdings of each Fidelity Central Fund. As an Investing Fund, the Fund indirectly bears its proportionate share of the expenses of the underlying Fidelity Central Funds.
The Money Market Central Funds seek preservation of capital and current income and are managed by Fidelity Investments Money Management, Inc. (FIMM), an affiliate of the investment adviser. Annualized expenses of the Money Market Central Funds as of their most recent shareholder report date are less than .005%.
A complete unaudited list of holdings for each Fidelity Central Fund is available upon request or at the Securities and Exchange Commission (the SEC) website at www.sec.gov. In addition, the financial statements of the Fidelity Central Funds are available on the SEC website or upon request.
3. Significant Accounting Policies.
The financial statements have been prepared in conformity with accounting principles generally accepted in the United States of America (GAAP), which require management to make certain estimates and assumptions at the date of the financial statements. Actual results could differ from those estimates. Subsequent events, if any, through the date that the financial statements were issued have been evaluated in the preparation of the financial statements. The following summarizes the significant accounting policies of the Fund:
Investment Valuation. Investments are valued as of 4:00 p.m. Eastern time on the last calendar day of the period. The Board of Trustees (the Board) has delegated the day to day responsibility for the valuation of the Fund's investments to the Fidelity Management & Research Company (FMR) Fair Value Committee (the Committee). In accordance with valuation policies and procedures approved by the Board, the Fund attempts to obtain prices from one or more third party pricing vendors or brokers to value its investments. When current market prices, quotations or currency exchange rates are not readily available or reliable, investments will be fair valued in good faith by the Committee, in accordance with procedures adopted by the Board. Factors used in determining fair value vary by investment type and may include market or investment specific events. The frequency with which these procedures are used cannot be predicted and they may be utilized to a significant extent. The Committee oversees the Fund's valuation policies and procedures and reports to the Board on the Committee's activities and fair value determinations. The Board monitors the appropriateness of the procedures used in valuing the Fund's investments and ratifies the fair value determinations of the Committee.
The Fund categorizes the inputs to valuation techniques used to value its investments into a disclosure hierarchy consisting of three levels as shown below:
- Level 1 – quoted prices in active markets for identical investments
- Level 2 – other significant observable inputs (including quoted prices for similar investments, interest rates, prepayment speeds, etc.)
- Level 3 – unobservable inputs (including the Fund's own assumptions based on the best information available)
Valuation techniques used to value the Fund's investments by major category are as follows:
Equity securities, including restricted securities, for which market quotations are readily available, are valued at the last reported sale price or official closing price as reported by a third party pricing vendor on the primary market or exchange on which they are traded and are categorized as Level 1 in the hierarchy. In the event there were no sales during the day or closing prices are not available, securities are valued at the last quoted bid price or may be valued using the last available price and are generally categorized as Level 2 in the hierarchy. For foreign equity securities, when market or security specific events arise, comparisons to the valuation of American Depositary Receipts (ADRs), futures contracts, Exchange-Traded Funds (ETFs) and certain indexes as well as quoted prices for similar securities may be used and would be categorized as Level 2 in the hierarchy. Utilizing these techniques may result in transfers between Level 1 and Level 2. For equity securities, including restricted securities, where observable inputs are limited, assumptions about market activity and risk are used and these securities may be categorized as Level 3 in the hierarchy.
Investments in open-end mutual funds, including the Fidelity Central Funds, are valued at their closing net asset value (NAV) each business day and are categorized as Level 1 in the hierarchy.
Changes in valuation techniques may result in transfers in or out of an assigned level within the disclosure hierarchy. The aggregate value of investments by input level as of April 30, 2016, including information on transfers between Levels 1 and 2 is included at the end of the Fund's Schedule of Investments.
Foreign Currency. The Fund may use foreign currency contracts to facilitate transactions in foreign-denominated securities. Gains and losses from these transactions may arise from changes in the value of the foreign currency or if the counterparties do not perform under the contracts' terms.
Foreign-denominated assets, including investment securities, and liabilities are translated into U.S. dollars at the exchange rates at period end. Purchases and sales of investment securities, income and dividends received and expenses denominated in foreign currencies are translated into U.S. dollars at the exchange rate in effect on the transaction date.
The effects of exchange rate fluctuations on investments are included with the net realized and unrealized gain (loss) on investment securities. Other foreign currency transactions resulting in realized and unrealized gain (loss) are disclosed separately.
Investment Transactions and Income. For financial reporting purposes, the Fund's investment holdings and NAV include trades executed through the end of the last business day of the period. The NAV per share for processing shareholder transactions is calculated as of the close of business of the New York Stock Exchange (NYSE), normally 4:00 p.m. Eastern time and includes trades executed through the end of the prior business day. Gains and losses on securities sold are determined on the basis of identified cost and may include proceeds received from litigation. Dividend income is recorded on the ex-dividend date, except for certain dividends from foreign securities where the ex-dividend date may have passed, which are recorded as soon as the Fund is informed of the ex-dividend date. Non-cash dividends included in dividend income, if any, are recorded at the fair market value of the securities received. Income and capital gain distributions from Fidelity Central Funds, if any, are recorded on the ex-dividend date. Distributions received on securities that represent a return of capital or capital gain are recorded as a reduction of cost of investments and/or as a realized gain. Subsequent to ex-dividend date the Fund determines the components of these distributions, based upon receipt of tax filings or other correspondence relating to the underlying investment. Large, non-recurring dividends recognized by the Fund are presented separately on the Statement of Operations as "Special Dividends" and the impact of these dividends is presented in the Financial Highlights. Investment income is recorded net of foreign taxes withheld where recovery of such taxes is uncertain.
Class Allocations and Expenses. Investment income, realized and unrealized capital gains and losses, common expenses of the Fund, and certain fund-level expense reductions, if any, are allocated daily on a pro-rata basis to each class based on the relative net assets of each class to the total net assets of the Fund. Each class differs with respect to transfer agent fees incurred. Certain expense reductions may also differ by class. For the reporting period, the allocated portion of income and expenses to each class as a percent of its average net assets may vary due to the timing of recording these transactions in relation to fluctuating net assets of the classes. Expenses directly attributable to a fund are charged to that fund. Expenses attributable to more than one fund are allocated among the respective funds on the basis of relative net assets or other appropriate methods. Expense estimates are accrued in the period to which they relate and adjustments are made when actual amounts are known.
Deferred Trustee Compensation. Under a Deferred Compensation Plan (the Plan), independent Trustees may elect to defer receipt of a portion of their annual compensation. Deferred amounts are invested in a cross-section of Fidelity funds, are marked-to-market and remain in the Fund until distributed in accordance with the Plan. The investment of deferred amounts and the offsetting payable to the Trustees are included in the accompanying Statement of Assets and Liabilities.
Income Tax Information and Distributions to Shareholders. Each year, the Fund intends to qualify as a regulated investment company under Subchapter M of the Internal Revenue Code, including distributing substantially all of its taxable income and realized gains. As a result, no provision for U.S. Federal income taxes is required. The Fund files a U.S. federal tax return, in addition to state and local tax returns as required. The Fund's federal income tax returns are subject to examination by the Internal Revenue Service (IRS) for a period of three fiscal years after they are filed. State and local tax returns may be subject to examination for an additional fiscal year depending on the jurisdiction. Foreign taxes are provided for based on the Fund's understanding of the tax rules and rates that exist in the foreign markets in which it invests.
Distributions are declared and recorded on the ex-dividend date. Income dividends and capital gain distributions are declared separately for each class. Income and capital gain distributions are determined in accordance with income tax regulations, which may differ from GAAP.
Capital accounts within the financial statements are adjusted for permanent book-tax differences. These adjustments have no impact on net assets or the results of operations. Capital accounts are not adjusted for temporary book-tax differences which will reverse in a subsequent period.
Book-tax differences are primarily due to foreign currency transactions, passive foreign investment companies (PFIC), deferred trustees compensation, capital loss carryforwards and losses deferred due to wash sales.
The federal tax cost of investment securities and unrealized appreciation (depreciation) as of period end were as follows:
| Gross unrealized appreciation | $668,130,456 |
| Gross unrealized depreciation | (318,887,140) |
| Net unrealized appreciation (depreciation) on securities | $349,243,316 |
| Tax cost | $5,057,331,867 |
Capital loss carryforwards are only available to offset future capital gains of the Fund to the extent provided by regulations and may be limited. Under the Regulated Investment Company Modernization Act of 2010 (the Act), the Fund is permitted to carry forward capital losses incurred in taxable years beginning after December 22, 2010 for an unlimited period and such capital losses are required to be used prior to any losses that expire. The capital loss carryforward information presented below, including any applicable limitation, is estimated as of prior fiscal period end and is subject to adjustment.
| Fiscal year of expiration | |
| 2016 | $(293,353,140) |
| 2017 | (939,719,765) |
| Total capital loss carryforward | $(1,233,072,905) |
Short-Term Trading (Redemption) Fees. Shares held by investors in the Fund less than 30 days may have been subject to a redemption fee equal to 1.00% of the NAV of shares redeemed. All redemption fees, which reduce the proceeds of the shareholder redemption, are retained by the Fund and accounted for as an addition to paid in capital.
Delayed Delivery Transactions and When-Issued Securities. During the period, the Fund transacted in securities on a delayed delivery or when-issued basis. Payment and delivery may take place after the customary settlement period for that security. The price of the underlying securities and the date when the securities will be delivered and paid for are fixed at the time the transaction is negotiated. The securities purchased on a delayed delivery or when-issued basis are identified as such in the Fund's Schedule of Investments. With respect to purchase commitments, the Fund identifies securities as segregated in its records with a value at least equal to the amount of the commitment. Losses may arise due to changes in the value of the underlying securities or if the counterparty does not perform under the contract's terms, or if the issuer does not issue the securities due to political, economic, or other factors.
4. Purchases and Sales of Investments.
Purchases and sales of securities, other than short-term securities, aggregated $1,493,569,715 and $739,215,640, respectively.
5. Fees and Other Transactions with Affiliates.
Management Fee. Fidelity Management & Research Company (the investment adviser) and its affiliates provide the Fund with investment management related services for which the Fund pays a monthly management fee. The management fee is the sum of an individual fund fee rate that is based on an annual rate of .424% of the Fund's average net assets and an annualized group fee rate that averaged .25% during the period. The group fee rate is based upon the average net assets of all the mutual funds advised by the investment adviser, including any mutual funds previously advised by the investment adviser that are currently advised by Fidelity SelectCo, LLC, an affiliate of the investment adviser. The group fee rate decreases as assets under management increase and increases as assets under management decrease. In addition, the management fee is subject to a performance adjustment (up to a maximum of +/- .20% of the Fund's average net assets over a 36 month performance period). The upward or downward adjustment to the management fee is based on the relative investment performance of Overseas as compared to its benchmark index, the MSCI EAFE Index, over the same 36 month performance period. For the reporting period, the total annualized management fee rate, including the performance adjustment, was .81% of the Fund's average net assets. The performance adjustment included in the management fee rate may be higher or lower than the maximum performance adjustment rate due to the difference between the average net assets for the reporting and performance periods.
Transfer Agent Fees. Fidelity Investments Institutional Operations Company, Inc. (FIIOC), an affiliate of the investment adviser, is the transfer, dividend disbursing and shareholder servicing agent for each class of the Fund. FIIOC receives account fees and asset-based fees that vary according to the account size and type of account of the shareholders of Overseas. FIIOC receives an asset-based fee of Class K's average net assets. FIIOC pays for typesetting, printing and mailing of shareholder reports, except proxy statements.
For the period, transfer agent fees for each class were as follows:
| Amount | % of Class-Level Average Net Assets(a) | |
| Overseas | $3,622,377 | .18 |
| Class K | 164,057 | .05 |
| $3,786,434 |
(a) Annualized
Accounting and Security Lending Fees. Fidelity Service Company, Inc. (FSC), an affiliate of the investment adviser, maintains the Fund's accounting records. The accounting fee is based on the level of average net assets for each month. Under a separate contract, FSC administers the security lending program. The security lending fee is based on the number and duration of lending transactions.
Brokerage Commissions. The Fund placed a portion of its portfolio transactions with brokerage firms which are affiliates of the investment adviser. Brokerage commissions are included in net realized gain (loss) and change in net unrealized appreciation (depreciation) in the Statement of Operations. The commissions paid to these affiliated firms were $3,175 for the period.
Interfund Trades. The Fund may purchase from or sell securities to other Fidelity Funds under procedures adopted by the Board. The procedures have been designed to ensure these interfund trades are executed in accordance with Rule 17a-7 of the 1940 Act. Interfund trades are included within the respective purchases and sales amounts shown in the Purchases and Sales of Investments note.
6. Committed Line of Credit.
The Fund participates with other funds managed by the investment adviser or an affiliate in a $4.25 billion credit facility (the "line of credit") to be utilized for temporary or emergency purposes to fund shareholder redemptions or for other short-term liquidity purposes. The Fund has agreed to pay commitment fees on its pro-rata portion of the line of credit, which amounted to $4,184 and is reflected in Miscellaneous expenses on the Statement of Operations. During the period, the Fund did not borrow on this line of credit.
7. Security Lending.
The Fund lends portfolio securities through a lending agent from time to time in order to earn additional income. For equity securities, a lending agent is used and may loan securities to certain qualified borrowers, including Fidelity Capital Markets (FCM), a broker-dealer affiliated with the Fund. On the settlement date of the loan, the Fund receives collateral (in the form of U.S. Treasury obligations, letters of credit and/or cash) against the loaned securities and maintains collateral in an amount not less than 100% of the market value of the loaned securities during the period of the loan. The market value of the loaned securities is determined at the close of business of the Fund and any additional required collateral is delivered to the Fund on the next business day. The Fund or borrower may terminate the loan at any time, and if the borrower defaults on its obligation to return the securities loaned because of insolvency or other reasons, the Fund may apply collateral received from the borrower against the obligation. The Fund may experience delays and costs in recovering the securities loaned. Any cash collateral received is invested in the Fidelity Securities Lending Cash Central Fund. The value of loaned securities and cash collateral at period end are disclosed on the Fund's Statement of Assets and Liabilities. Security lending income represents the income earned on investing cash collateral, less rebates paid to borrowers and any lending agent fees associated with the loan, plus any premium payments received for lending certain types of securities. Security lending income is presented in the Statement of Operations as a component of income from Fidelity Central Funds. Total security lending income during the period amounted to $1,917,406. During the period, there were no securities loaned to FCM.
8. Expense Reductions.
Commissions paid to certain brokers with whom the investment adviser, or its affiliates, places trades on behalf of the Fund include an amount in addition to trade execution, which may be rebated back to the Fund to offset certain expenses. This amount totaled $24,807 for the period. In addition, through arrangements with the Fund's custodian credits realized as a result of certain uninvested cash balances were used to reduce the Fund's expenses. During the period, these credits reduced the Fund's custody expenses by $248.
In addition, during the period the investment adviser reimbursed and/or waived a portion of fund-level operating expenses in the amount of $17,122.
9. Distributions to Shareholders.
Distributions to shareholders of each class were as follows:
| Six months ended April 30, 2016 | Year ended October 31, 2015 | |
| From net investment income | ||
| Overseas | $41,702,378 | $46,955,922 |
| Class K | 7,957,468 | 11,634,389 |
| Total | $49,659,846 | $58,590,311 |
| From net realized gain | ||
| Overseas | $584,612 | $– |
| Class K | 101,369 | – |
| Total | $685,981 | $– |
10. Share Transactions.
Share transactions for each class were as follows and may contain automatic conversions between classes or exchanges between affiliated funds:
| Shares | Shares | Dollars | Dollars | |
| Six months ended April 30, 2016 | Year ended October 31, 2015 | Six months ended April 30, 2016 | Year ended October 31, 2015 | |
| Overseas | ||||
| Shares sold | 24,942,391 | 34,064,489 | $990,623,129 | $1,419,067,045 |
| Reinvestment of distributions | 981,115 | 1,181,070 | 40,667,201 | 46,087,315 |
| Shares redeemed | (7,706,033) | (12,920,043) | (302,885,946) | (529,687,795) |
| Net increase (decrease) | 18,217,473 | 22,325,516 | $728,404,384 | $935,466,565 |
| Class K | ||||
| Shares sold | 2,965,450 | 4,973,273 | $115,891,575 | $202,328,225 |
| Reinvestment of distributions | 194,940 | 298,984 | 8,058,837 | 11,634,389 |
| Shares redeemed | (1,703,694) | (4,690,550) | (66,891,829) | (193,717,286) |
| Net increase (decrease) | 1,456,696 | 581,707 | $57,058,583 | $20,245,328 |
11. Other.
The Fund's organizational documents provide former and current trustees and officers with a limited indemnification against liabilities arising in connection with the performance of their duties to the Fund. In the normal course of business, the Fund may also enter into contracts that provide general indemnifications. The Fund's maximum exposure under these arrangements is unknown as this would be dependent on future claims that may be made against the Fund. The risk of material loss from such claims is considered remote.
At the end of the period, Strategic Advisers International Fund was the owner of record of approximately 12% of the total outstanding shares of the Fund. Mutual funds managed by the investment adviser or its affiliates were the owners of record, in the aggregate, of approximately 35% of the total outstanding shares of the Fund.
Fidelity® Worldwide Fund
Investment Summary (Unaudited)
Geographic Diversification (% of fund's net assets)
| As of April 30, 2016 | ||
| United States of America* | 54.9% | |
| Japan | 7.3% | |
| United Kingdom | 6.6% | |
| France | 3.9% | |
| Canada | 3.7% | |
| Germany | 3.7% | |
| Ireland | 2.2% | |
| Switzerland | 1.8% | |
| Sweden | 1.6% | |
| Other | 14.3% | |

* Includes Short-Term Investments and Net Other Assets (Liabilities).
Percentages are based on country or territory of incorporation and are adjusted for the effect of futures contracts, if applicable.
| As of October 31, 2015 | ||
| United States of America* | 51.9% | |
| United Kingdom | 8.9% | |
| Japan | 6.9% | |
| France | 5.5% | |
| Netherlands | 3.1% | |
| Switzerland | 2.6% | |
| Germany | 2.4% | |
| Ireland | 1.9% | |
| Canada | 1.6% | |
| Other | 15.2% | |

* Includes Short-Term Investments and Net Other Assets (Liabilities).
Percentages are based on country or territory of incorporation and are adjusted for the effect of futures contracts, if applicable.
Asset Allocation as of April 30, 2016
| % of fund's net assets | % of fund's net assets 6 months ago | |
| Stocks | 99.4 | 98.4 |
| Other Investments | 0.0 | 0.1 |
| Short-Term Investments and Net Other Assets (Liabilities) | 0.6 | 1.5 |
Top Ten Stocks as of April 30, 2016
| % of fund's net assets | % of fund's net assets 6 months ago | |
| Adobe Systems, Inc. (United States of America, Software) | 2.8 | 2.9 |
| Alphabet, Inc. Class A (United States of America, Internet Software & Services) | 2.8 | 3.0 |
| McGraw Hill Financial, Inc. (United States of America, Diversified Financial Services) | 1.9 | 0.8 |
| AutoZone, Inc. (United States of America, Specialty Retail) | 1.8 | 1.4 |
| PayPal Holdings, Inc. (United States of America, IT Services) | 1.8 | 1.2 |
| Kansas City Southern (United States of America, Road & Rail) | 1.8 | 0.0 |
| Bristol-Myers Squibb Co. (United States of America, Pharmaceuticals) | 1.8 | 0.7 |
| MSCI, Inc. Class A (United States of America, Diversified Financial Services) | 1.7 | 0.0 |
| Reynolds American, Inc. (United States of America, Tobacco) | 1.7 | 1.0 |
| Visa, Inc. Class A (United States of America, IT Services) | 1.7 | 1.7 |
| 19.8 |
Market Sectors as of April 30, 2016
| % of fund's net assets | % of fund's net assets 6 months ago | |
| Information Technology | 18.1 | 21.9 |
| Financials | 16.0 | 17.0 |
| Consumer Discretionary | 14.3 | 16.1 |
| Health Care | 13.5 | 12.9 |
| Consumer Staples | 12.9 | 10.5 |
| Industrials | 12.4 | 8.4 |
| Energy | 5.7 | 6.1 |
| Telecommunication Services | 3.5 | 2.7 |
| Materials | 2.7 | 2.3 |
| Utilities | 0.3 | 0.6 |
Percentages shown as 0.0% may reflect amounts less than 0.05%.
Fidelity® Worldwide Fund
Investments April 30, 2016 (Unaudited)
Showing Percentage of Net Assets
| Common Stocks - 99.3% | |||
| Shares | Value | ||
| Australia - 1.1% | |||
| 1-Page Ltd. (a) | 188,555 | $138,350 | |
| Ansell Ltd. (a) | 120,679 | 1,828,742 | |
| Australia & New Zealand Banking Group Ltd. | 183,181 | 3,357,696 | |
| Burson Group Ltd. | 486,326 | 1,841,494 | |
| Magellan Financial Group Ltd. | 81,493 | 1,332,209 | |
| Mantra Group Ltd. | 551,523 | 1,551,597 | |
| Ramsay Health Care Ltd. | 76,655 | 3,785,587 | |
| Spark Infrastructure Group unit | 1,965,824 | 3,094,059 | |
| TOTAL AUSTRALIA | 16,929,734 | ||
| Austria - 0.2% | |||
| Andritz AG | 28,200 | 1,579,324 | |
| Erste Group Bank AG | 65,200 | 1,875,390 | |
| TOTAL AUSTRIA | 3,454,714 | ||
| Bailiwick of Jersey - 0.6% | |||
| Integrated Diagnostics Holdings PLC | 332,800 | 1,547,520 | |
| Randgold Resources Ltd. sponsored ADR | 16,310 | 1,639,155 | |
| Regus PLC | 695,121 | 2,969,837 | |
| Wizz Air Holdings PLC (a) | 34,000 | 933,967 | |
| Wolseley PLC | 34,027 | 1,905,923 | |
| TOTAL BAILIWICK OF JERSEY | 8,996,402 | ||
| Belgium - 0.7% | |||
| Anheuser-Busch InBev SA NV | 67,411 | 8,344,127 | |
| KBC Groep NV | 55,093 | 3,093,020 | |
| TOTAL BELGIUM | 11,437,147 | ||
| Bermuda - 0.1% | |||
| PAX Global Technology Ltd. | 1,889,000 | 1,626,846 | |
| Canada - 3.7% | |||
| Alimentation Couche-Tard, Inc. Class B (sub. vtg.) | 52,000 | 2,279,429 | |
| Cenovus Energy, Inc. | 916,300 | 14,525,550 | |
| Constellation Software, Inc. | 9,200 | 3,595,384 | |
| Franco-Nevada Corp. | 19,800 | 1,389,168 | |
| Keyera Corp. | 63,000 | 2,029,035 | |
| PrairieSky Royalty Ltd. (b) | 897,799 | 18,904,798 | |
| Suncor Energy, Inc. | 39,400 | 1,156,533 | |
| The Toronto-Dominion Bank | 308,000 | 13,709,891 | |
| TOTAL CANADA | 57,589,788 | ||
| Cayman Islands - 0.6% | |||
| Alibaba Group Holding Ltd. sponsored ADR (a) | 31,400 | 2,415,916 | |
| Ctrip.com International Ltd. ADR (a) | 19,200 | 837,312 | |
| Goodbaby International Holdings Ltd. (a) | 5,171,000 | 2,896,250 | |
| Lee's Pharmaceutical Holdings Ltd. | 433,629 | 350,867 | |
| New Oriental Education & Technology Group, Inc. sponsored ADR | 54,800 | 2,145,968 | |
| TOTAL CAYMAN ISLANDS | 8,646,313 | ||
| Chile - 0.2% | |||
| Vina San Pedro SA | 357,223,088 | 3,519,919 | |
| China - 0.2% | |||
| Jiangsu Hengrui Medicine Co. Ltd. | 264,160 | 1,904,679 | |
| Kweichow Moutai Co. Ltd. | 41,800 | 1,621,884 | |
| TOTAL CHINA | 3,526,563 | ||
| Cyprus - 0.0% | |||
| SPDI Secure Property Development & Investment PLC (a) | 31,822 | 7,963 | |
| Denmark - 0.7% | |||
| NNIT A/S | 115,550 | 3,146,661 | |
| Novo Nordisk A/S Series B | 126,380 | 7,056,351 | |
| TOTAL DENMARK | 10,203,012 | ||
| Finland - 0.3% | |||
| Sampo Oyj (A Shares) | 94,300 | 4,117,209 | |
| France - 3.9% | |||
| Accor SA (b) | 101,869 | 4,512,416 | |
| ALTEN | 40,600 | 2,510,408 | |
| Altran Technologies SA | 155,600 | 2,308,190 | |
| Amundi SA | 38,700 | 1,780,957 | |
| Atos Origin SA | 28,300 | 2,518,889 | |
| AXA SA | 261,900 | 6,612,869 | |
| Capgemini SA | 52,200 | 4,873,179 | |
| Cegedim SA (a) | 35,010 | 961,315 | |
| Havas SA | 308,841 | 2,584,389 | |
| Sanofi SA | 31,628 | 2,606,987 | |
| Sodexo SA | 25,800 | 2,605,335 | |
| SR Teleperformance SA | 18,900 | 1,696,689 | |
| Total SA | 262,323 | 13,258,010 | |
| Unibail-Rodamco | 9,400 | 2,518,652 | |
| VINCI SA | 119,900 | 8,956,897 | |
| TOTAL FRANCE | 60,305,182 | ||
| Germany - 3.7% | |||
| adidas AG | 39,000 | 5,028,373 | |
| Axel Springer Verlag AG | 43,237 | 2,414,036 | |
| Bayer AG | 23,400 | 2,699,513 | |
| Beiersdorf AG | 15,300 | 1,372,810 | |
| Continental AG | 18,000 | 3,953,171 | |
| Deutsche Boerse AG | 32,400 | 2,659,672 | |
| Deutsche Telekom AG | 197,700 | 3,470,312 | |
| Fresenius SE & Co. KGaA | 29,600 | 2,152,914 | |
| GEA Group AG | 48,856 | 2,265,114 | |
| KION Group AG | 90,889 | 4,951,767 | |
| LEG Immobilien AG | 27,743 | 2,567,101 | |
| Nexus AG | 47,000 | 823,405 | |
| ProSiebenSat.1 Media AG | 70,700 | 3,604,118 | |
| Rational AG | 6,700 | 3,401,308 | |
| SAP AG | 86,403 | 6,779,270 | |
| Siemens AG | 43,936 | 4,597,826 | |
| Symrise AG | 39,500 | 2,616,977 | |
| United Internet AG | 28,291 | 1,381,144 | |
| TOTAL GERMANY | 56,738,831 | ||
| Greece - 0.1% | |||
| Folli Follie SA | 59,300 | 1,221,215 | |
| Hong Kong - 1.2% | |||
| AIA Group Ltd. | 1,415,000 | 8,468,217 | |
| China Resources Beer Holdings Co. Ltd. | 1,100,000 | 2,417,152 | |
| Techtronic Industries Co. Ltd. | 2,162,500 | 8,106,499 | |
| TOTAL HONG KONG | 18,991,868 | ||
| India - 1.1% | |||
| Bharti Infratel Ltd. | 667,227 | 3,766,276 | |
| Dr Lal Pathlabs Ltd. | 46,973 | 696,617 | |
| HDFC Bank Ltd. (a) | 21,187 | 430,665 | |
| HDFC Bank Ltd. sponsored ADR | 89,493 | 5,626,425 | |
| Housing Development Finance Corp. Ltd. | 385,477 | 6,316,436 | |
| Lupin Ltd. | 1,335 | 32,302 | |
| TOTAL INDIA | 16,868,721 | ||
| Indonesia - 0.0% | |||
| PT Kino Indonesia Tbk | 234,500 | 86,773 | |
| Ireland - 2.2% | |||
| Alkermes PLC (a) | 159,495 | 6,339,926 | |
| Cairn Homes PLC (a) | 1,347,939 | 1,728,672 | |
| CRH PLC | 70,100 | 2,040,113 | |
| Dalata Hotel Group PLC (a) | 372,400 | 1,880,071 | |
| Green REIT PLC | 621,300 | 1,025,867 | |
| Greencore Group PLC | 1,373,041 | 7,238,438 | |
| Irish Continental Group PLC unit | 7,900 | 46,586 | |
| James Hardie Industries PLC CDI | 115,144 | 1,622,297 | |
| Kerry Group PLC Class A | 56,100 | 5,002,159 | |
| Medtronic PLC | 35,000 | 2,770,250 | |
| Ryanair Holdings PLC sponsored ADR | 53,600 | 4,338,920 | |
| TOTAL IRELAND | 34,033,299 | ||
| Isle of Man - 0.4% | |||
| Optimal Payments PLC (a) | 794,588 | 4,425,779 | |
| Playtech Ltd. | 94,225 | 1,107,610 | |
| TOTAL ISLE OF MAN | 5,533,389 | ||
| Israel - 1.2% | |||
| Bezeq The Israel Telecommunication Corp. Ltd. | 3,079,900 | 6,569,552 | |
| Frutarom Industries Ltd. | 66,100 | 3,387,748 | |
| Partner Communications Co. Ltd. (a) | 177,040 | 921,104 | |
| Teva Pharmaceutical Industries Ltd. sponsored ADR | 140,700 | 7,661,115 | |
| TOTAL ISRAEL | 18,539,519 | ||
| Italy - 0.6% | |||
| De Longhi SpA | 106,950 | 2,462,733 | |
| Intesa Sanpaolo SpA | 1,894,200 | 5,265,498 | |
| Mediaset SpA | 189,800 | 854,109 | |
| Telecom Italia SpA (a) | 1,187,300 | 1,159,367 | |
| TOTAL ITALY | 9,741,707 | ||
| Japan - 7.3% | |||
| A/S One Corp. | 67,300 | 2,426,706 | |
| ACOM Co. Ltd. (a)(b) | 186,100 | 970,816 | |
| Ain Holdings, Inc. | 37,900 | 1,841,106 | |
| Aozora Bank Ltd. | 577,000 | 2,047,205 | |
| Asahi Group Holdings | 68,700 | 2,180,335 | |
| Astellas Pharma, Inc. (c) | 412,200 | 5,557,525 | |
| Broadleaf Co. Ltd. | 104,700 | 1,034,652 | |
| Casio Computer Co. Ltd. | 134,100 | 2,551,511 | |
| Daiichikosho Co. Ltd. | 46,200 | 1,936,786 | |
| Daito Trust Construction Co. Ltd. | 14,200 | 2,008,338 | |
| Dentsu, Inc. (c) | 78,700 | 3,998,669 | |
| Don Quijote Holdings Co. Ltd. | 71,000 | 2,525,884 | |
| Hoya Corp. (c) | 98,300 | 3,764,327 | |
| Japan Exchange Group, Inc. | 115,400 | 1,718,680 | |
| Japan Tobacco, Inc. (c) | 119,400 | 4,878,438 | |
| KDDI Corp. (c) | 281,300 | 8,103,053 | |
| Keyence Corp. (c) | 4,060 | 2,433,536 | |
| Misumi Group, Inc. (c) | 191,700 | 2,647,334 | |
| Mitsubishi UFJ Financial Group, Inc. | 507,500 | 2,342,019 | |
| Monex Group, Inc. | 844,900 | 2,179,604 | |
| NEC Corp. | 458,000 | 1,114,669 | |
| Nidec Corp. | 19,300 | 1,414,189 | |
| Nintendo Co. Ltd. | 18,300 | 2,477,839 | |
| Nippon Kanzai Co. Ltd. | 107,000 | 1,637,128 | |
| Nippon Telegraph & Telephone Corp. | 60,300 | 2,698,445 | |
| Olympus Corp. (c) | 195,400 | 7,612,124 | |
| ORIX Corp. (c) | 495,400 | 7,007,401 | |
| Seven & i Holdings Co. Ltd. (c) | 64,400 | 2,627,677 | |
| Seven Bank Ltd. (c) | 666,300 | 2,831,247 | |
| Shinsei Bank Ltd. | 919,000 | 1,288,049 | |
| Shionogi & Co. Ltd. | 57,900 | 2,955,341 | |
| Sony Corp. | 231,600 | 5,609,728 | |
| Sundrug Co. Ltd. (c) | 39,300 | 2,792,493 | |
| Tsuruha Holdings, Inc. (c) | 58,000 | 5,563,107 | |
| United Arrows Ltd. | 63,100 | 2,535,495 | |
| VT Holdings Co. Ltd. | 280,200 | 1,415,759 | |
| Welcia Holdings Co. Ltd. | 76,800 | 4,056,766 | |
| TOTAL JAPAN | 112,783,981 | ||
| Kenya - 0.1% | |||
| Safaricom Ltd. | 6,251,600 | 1,058,439 | |
| Luxembourg - 0.4% | |||
| Eurofins Scientific SA | 7,900 | 2,931,322 | |
| Grand City Properties SA | 100,234 | 2,213,970 | |
| Senvion SA | 54,800 | 963,193 | |
| TOTAL LUXEMBOURG | 6,108,485 | ||
| Marshall Islands - 0.1% | |||
| Hoegh LNG Partners LP | 49,800 | 897,396 | |
| Netherlands - 1.3% | |||
| AerCap Holdings NV (a) | 31,800 | 1,272,318 | |
| IMCD Group BV | 127,200 | 5,135,632 | |
| ING Groep NV (Certificaten Van Aandelen) | 314,600 | 3,852,689 | |
| Unilever NV (Certificaten Van Aandelen) (Bearer) | 233,500 | 10,257,618 | |
| TOTAL NETHERLANDS | 20,518,257 | ||
| New Zealand - 0.3% | |||
| EBOS Group Ltd. | 210,137 | 2,341,781 | |
| Ryman Healthcare Group Ltd. | 436,814 | 2,723,698 | |
| TOTAL NEW ZEALAND | 5,065,479 | ||
| Norway - 0.7% | |||
| Statoil ASA | 602,500 | 10,604,780 | |
| Philippines - 0.2% | |||
| D&L Industries, Inc. | 8,349,900 | 1,597,727 | |
| SM Investments Corp. | 106,630 | 2,140,081 | |
| TOTAL PHILIPPINES | 3,737,808 | ||
| South Africa - 0.7% | |||
| Distell Group Ltd. | 126,410 | 1,411,931 | |
| EOH Holdings Ltd. | 184,122 | 1,792,038 | |
| Naspers Ltd. Class N | 54,500 | 7,477,950 | |
| TOTAL SOUTH AFRICA | 10,681,919 | ||
| Spain - 1.0% | |||
| Amadeus IT Holding SA Class A | 103,000 | 4,686,942 | |
| Atresmedia Corporacion de Medios de Comunicacion SA | 108,300 | 1,409,981 | |
| Hispania Activos Inmobiliarios SA (a) | 76,100 | 1,115,370 | |
| Inditex SA | 126,730 | 4,068,220 | |
| Mediaset Espana Comunicacion SA | 183,300 | 2,380,126 | |
| Merlin Properties Socimi SA | 162,800 | 1,892,104 | |
| TOTAL SPAIN | 15,552,743 | ||
| Sweden - 1.6% | |||
| ASSA ABLOY AB (B Shares) | 214,400 | 4,496,007 | |
| Getinge AB (B Shares) | 152,600 | 3,226,654 | |
| HEXPOL AB (B Shares) (b) | 189,000 | 1,953,440 | |
| Indutrade AB | 13,200 | 740,178 | |
| Nordea Bank AB | 314,800 | 3,055,702 | |
| Saab AB (B Shares) | 65,000 | 2,223,474 | |
| Sandvik AB (b) | 142,700 | 1,464,237 | |
| Svenska Cellulosa AB (SCA) (B Shares) | 189,000 | 5,952,107 | |
| Svenska Handelsbanken AB (A Shares) | 154,000 | 2,054,384 | |
| TOTAL SWEDEN | 25,166,183 | ||
| Switzerland - 1.8% | |||
| Chubb Ltd. | 14,000 | 1,650,040 | |
| GAM Holding Ltd. | 88,177 | 1,148,976 | |
| Julius Baer Group Ltd. | 59,790 | 2,562,347 | |
| Novartis AG | 83,226 | 6,333,687 | |
| Partners Group Holding AG | 15,318 | 6,307,318 | |
| Schindler Holding AG (participation certificate) | 10,829 | 1,972,090 | |
| Syngenta AG (Switzerland) | 10,848 | 4,342,366 | |
| UBS Group AG | 246,320 | 4,262,391 | |
| TOTAL SWITZERLAND | 28,579,215 | ||
| Taiwan - 0.1% | |||
| JHL Biotech, Inc. (a) | 295,104 | 797,986 | |
| United Kingdom - 6.6% | |||
| AA PLC | 246,910 | 1,005,112 | |
| Associated British Foods PLC | 48,600 | 2,175,804 | |
| B&M European Value Retail S.A. | 583,765 | 2,366,134 | |
| BAE Systems PLC | 275,100 | 1,919,279 | |
| BCA Marketplace PLC | 511,600 | 1,246,497 | |
| BHP Billiton PLC | 192,312 | 2,627,846 | |
| BT Group PLC | 385,900 | 2,501,431 | |
| Bunzl PLC | 127,500 | 3,798,588 | |
| Cineworld Group PLC | 138,500 | 1,048,273 | |
| CMC Markets PLC | 654,000 | 2,388,980 | |
| Compass Group PLC | 131,200 | 2,336,461 | |
| Countryside Properties PLC (a) | 263,300 | 894,476 | |
| Diploma PLC | 147,500 | 1,576,526 | |
| GlaxoSmithKline PLC | 259,900 | 5,554,702 | |
| Hilton Food Group PLC | 350,100 | 2,880,019 | |
| Howden Joinery Group PLC | 675,800 | 4,877,979 | |
| Imperial Tobacco Group PLC | 222,944 | 12,113,186 | |
| ITV PLC | 586,400 | 1,929,555 | |
| Lloyds Banking Group PLC | 4,388,300 | 4,307,165 | |
| London Stock Exchange Group PLC | 10,881 | 431,334 | |
| McCarthy & Stone PLC | 298,600 | 1,012,215 | |
| Melrose Industries PLC | 98,908 | 539,491 | |
| Micro Focus International PLC | 239,300 | 5,346,197 | |
| Moneysupermarket.com Group PLC | 393,500 | 1,804,807 | |
| Persimmon PLC | 92,000 | 2,671,041 | |
| Reckitt Benckiser Group PLC | 54,500 | 5,309,330 | |
| Rex Bionics PLC (a) | 100,000 | 53,332 | |
| Rio Tinto PLC | 79,100 | 2,653,512 | |
| SABMiller PLC | 44,000 | 2,690,562 | |
| Shawbrook Group PLC | 574,700 | 2,406,646 | |
| Softcat PLC | 114,400 | 533,226 | |
| Spirax-Sarco Engineering PLC | 33,846 | 1,688,857 | |
| St. James's Place Capital PLC | 318,800 | 4,038,613 | |
| Standard Chartered PLC (United Kingdom) | 353,550 | 2,852,091 | |
| Taylor Wimpey PLC | 761,900 | 2,051,720 | |
| Virgin Money Holdings Uk PLC | 423,100 | 2,257,094 | |
| Vodafone Group PLC | 1,878,909 | 6,053,540 | |
| Workspace Group PLC | 48,900 | 596,609 | |
| TOTAL UNITED KINGDOM | 102,538,230 | ||
| United States of America - 54.3% | |||
| AAON, Inc. | 53,000 | 1,405,560 | |
| Activision Blizzard, Inc. | 66,000 | 2,275,020 | |
| Acuity Brands, Inc. | 22,000 | 5,365,580 | |
| Adobe Systems, Inc. (a) | 466,224 | 43,927,622 | |
| Air Products & Chemicals, Inc. | 7,000 | 1,021,230 | |
| Alaska Air Group, Inc. | 255,400 | 17,987,822 | |
| Albemarle Corp. U.S. | 110,000 | 7,277,600 | |
| Alphabet, Inc. Class A | 62,000 | 43,888,560 | |
| Amazon.com, Inc. (a) | 30,000 | 19,787,700 | |
| American Tower Corp. | 237,000 | 24,856,560 | |
| ANSYS, Inc. (a) | 91,000 | 8,260,070 | |
| Applied Materials, Inc. | 129,000 | 2,640,630 | |
| AT&T, Inc. | 335,000 | 13,004,700 | |
| AutoZone, Inc. (a) | 37,100 | 28,390,033 | |
| Bats Global Markets, Inc. | 39,300 | 931,803 | |
| BlackRock, Inc. Class A | 5,000 | 1,781,650 | |
| bluebird bio, Inc. (a) | 33,000 | 1,463,550 | |
| Boston Scientific Corp.(a) | 225,000 | 4,932,000 | |
| Bristol-Myers Squibb Co. | 374,900 | 27,060,282 | |
| Cigna Corp. | 17,000 | 2,355,180 | |
| CME Group, Inc. | 98,000 | 9,007,180 | |
| Cognizant Technology Solutions Corp. Class A (a) | 266,000 | 15,526,420 | |
| ConocoPhillips Co. | 361,000 | 17,252,190 | |
| Constellation Brands, Inc. Class A (sub. vtg.) | 110,600 | 17,260,236 | |
| Cummins, Inc. | 3,000 | 351,090 | |
| CVS Health Corp. | 61,000 | 6,130,500 | |
| D.R. Horton, Inc. | 118,000 | 3,547,080 | |
| Danaher Corp. | 28,300 | 2,738,025 | |
| E*TRADE Financial Corp. (a) | 127,000 | 3,197,860 | |
| Edwards Lifesciences Corp. (a) | 29,000 | 3,080,090 | |
| Electronic Arts, Inc. (a) | 108,000 | 6,679,800 | |
| Equifax, Inc. | 17,000 | 2,044,250 | |
| Estee Lauder Companies, Inc. Class A | 225,000 | 21,570,750 | |
| Extra Space Storage, Inc. | 83,000 | 7,050,850 | |
| Facebook, Inc. Class A (a) | 155,500 | 18,283,690 | |
| Gilead Sciences, Inc. | 66,000 | 5,821,860 | |
| Global Payments, Inc. | 31,400 | 2,266,452 | |
| HealthSouth Corp. warrants 1/17/17 (a) | 341 | 1,231 | |
| Hess Corp. | 155,000 | 9,241,100 | |
| Home Depot, Inc. | 92,000 | 12,317,880 | |
| Intercept Pharmaceuticals, Inc. (a) | 44,500 | 6,707,930 | |
| Interpublic Group of Companies, Inc. | 191,000 | 4,381,540 | |
| Ionis Pharmaceuticals, Inc. (a) | 37,000 | 1,515,890 | |
| J.B. Hunt Transport Services, Inc. | 15,000 | 1,243,200 | |
| Kansas City Southern | 294,000 | 27,856,500 | |
| Level 3 Communications, Inc. (a) | 83,000 | 4,337,580 | |
| Lockheed Martin Corp. | 38,000 | 8,830,440 | |
| lululemon athletica, Inc. (a) | 48,000 | 3,146,400 | |
| MasterCard, Inc. Class A | 225,000 | 21,822,750 | |
| McGraw Hill Financial, Inc. | 276,549 | 29,549,261 | |
| Medivation, Inc. (a) | 345,082 | 19,945,740 | |
| Molson Coors Brewing Co. Class B | 133,400 | 12,757,042 | |
| Monster Beverage Corp. | 10,000 | 1,442,200 | |
| MSCI, Inc. Class A | 339,300 | 25,766,442 | |
| Newell Brands, Inc. | 196,000 | 8,925,840 | |
| NewMarket Corp. | 9,140 | 3,711,388 | |
| NIKE, Inc. Class B | 214,000 | 12,613,160 | |
| Norfolk Southern Corp. | 189,000 | 17,030,790 | |
| Northrop Grumman Corp. | 44,000 | 9,075,440 | |
| NVIDIA Corp. | 11,900 | 422,807 | |
| O'Reilly Automotive, Inc. (a) | 24,000 | 6,304,320 | |
| PACCAR, Inc. | 69,000 | 4,064,790 | |
| PayPal Holdings, Inc. (a) | 716,000 | 28,052,880 | |
| Phillips 66 Co. | 14,000 | 1,149,540 | |
| Post Holdings, Inc. (a) | 127,800 | 9,181,152 | |
| Prestige Brands Holdings, Inc. (a) | 332,000 | 18,850,960 | |
| Priceline Group, Inc. (a) | 5,000 | 6,718,300 | |
| Public Storage | 9,000 | 2,203,290 | |
| PVH Corp. | 25,000 | 2,390,000 | |
| Raytheon Co. | 21,000 | 2,653,350 | |
| Regal Beloit Corp. | 30,000 | 1,932,600 | |
| Reynolds American, Inc. | 517,000 | 25,643,200 | |
| Salesforce.com, Inc. (a) | 125,300 | 9,497,740 | |
| ServiceMaster Global Holdings, Inc. (a) | 32,500 | 1,245,400 | |
| Sherwin-Williams Co. | 13,000 | 3,735,030 | |
| Skechers U.S.A., Inc. Class A (sub. vtg.) (a) | 23,200 | 766,760 | |
| SLM Corp. (a) | 72,443 | 490,439 | |
| Southwest Airlines Co. | 18,000 | 802,980 | |
| Spectrum Brands Holdings, Inc. | 43,000 | 4,884,800 | |
| Spirit Airlines, Inc. (a) | 223,900 | 9,835,927 | |
| The NASDAQ OMX Group, Inc. | 45,000 | 2,776,950 | |
| Ultragenyx Pharmaceutical, Inc. (a) | 21,700 | 1,467,354 | |
| Under Armour, Inc. Class A (sub. vtg.) (a) | 10,000 | 439,400 | |
| Union Pacific Corp. | 50,000 | 4,361,500 | |
| UnitedHealth Group, Inc. | 146,000 | 19,225,280 | |
| Visa, Inc. Class A | 330,500 | 25,527,820 | |
| Xylem, Inc. | 69,000 | 2,882,820 | |
| TOTAL UNITED STATES OF AMERICA | 840,148,608 | ||
| TOTAL COMMON STOCKS | |||
| (Cost $1,334,730,075) | 1,536,355,623 | ||
| Nonconvertible Preferred Stocks - 0.1% | |||
| Cayman Islands - 0.1% | |||
| China Internet Plus Holdings Ltd. Series A-11 (d) | |||
| (Cost $1,166,878) | 369,166 | 1,425,239 | |
| Money Market Funds - 2.1% | |||
| Fidelity Cash Central Fund, 0.38% (e) | 25,131,066 | 25,131,066 | |
| Fidelity Securities Lending Cash Central Fund, 0.42% (e)(f) | 7,590,746 | 7,590,746 | |
| TOTAL MONEY MARKET FUNDS | |||
| (Cost $32,721,812) | 32,721,812 | ||
| TOTAL INVESTMENT PORTFOLIO - 101.5% | |||
| (Cost $1,368,618,765) | 1,570,502,674 | ||
| NET OTHER ASSETS (LIABILITIES) - (1.5)% | (22,547,155) | ||
| NET ASSETS - 100% | $1,547,955,519 |
Categorizations in the Schedule of Investments are based on country or territory of incorporation.
Legend
(a) Non-income producing
(b) Security or a portion of the security is on loan at period end.
(c) A portion of the security sold on a delayed delivery basis.
(d) Restricted securities - Investment in securities not registered under the Securities Act of 1933 (excluding 144A issues). At the end of the period, the value of restricted securities (excluding 144A issues) amounted to $1,425,239 or 0.1% of net assets.
(e) Affiliated fund that is generally available only to investment companies and other accounts managed by Fidelity Investments. The rate quoted is the annualized seven-day yield of the fund at period end. A complete unaudited listing of the fund's holdings as of its most recent quarter end is available upon request. In addition, each Fidelity Central Fund's financial statements are available on the SEC's website or upon request.
(f) Investment made with cash collateral received from securities on loan.
Additional information on each restricted holding is as follows:
| Security | Acquisition Date | Acquisition Cost |
| China Internet Plus Holdings Ltd. Series A-11 | 1/26/15 | $1,166,878 |
Affiliated Central Funds
Information regarding fiscal year to date income earned by the Fund from investments in Fidelity Central Funds is as follows:
| Fund | Income earned |
| Fidelity Cash Central Fund | $52,860 |
| Fidelity Securities Lending Cash Central Fund | 115,427 |
| Total | $168,287 |
Investment Valuation
The following is a summary of the inputs used, as of April 30, 2016, involving the Fund's assets and liabilities carried at fair value. The inputs or methodology used for valuing securities may not be an indication of the risk associated with investing in those securities. For more information on valuation inputs, and their aggregation into the levels used below, please refer to the Investment Valuation section in the accompanying Notes to Financial Statements.
| Valuation Inputs at Reporting Date: | ||||
| Description | Total | Level 1 | Level 2 | Level 3 |
| Investments in Securities: | ||||
| Equities: | ||||
| Consumer Discretionary | $218,964,167 | $182,404,671 | $35,134,257 | $1,425,239 |
| Consumer Staples | 197,483,050 | 165,816,646 | 31,666,404 | -- |
| Energy | 89,018,932 | 65,156,142 | 23,862,790 | -- |
| Financials | 250,165,204 | 194,713,004 | 55,452,200 | -- |
| Health Care | 206,083,498 | 161,864,881 | 44,218,617 | -- |
| Industrials | 192,772,231 | 178,650,552 | 14,121,679 | -- |
| Information Technology | 283,977,132 | 265,991,431 | 17,985,701 | -- |
| Materials | 41,615,597 | 34,294,126 | 7,321,471 | -- |
| Telecommunication Services | 53,643,799 | 29,657,651 | 23,986,148 | -- |
| Utilities | 4,057,252 | 4,057,252 | -- | -- |
| Money Market Funds | 32,721,812 | 32,721,812 | -- | -- |
| Total Investments in Securities: | $1,570,502,674 | $1,315,328,168 | $253,749,267 | $1,425,239 |
The following is a summary of transfers between Level 1 and Level 2 for the period ended April 30, 2016. Transfers are assumed to have occurred at the beginning of the period, and are primarily attributable to the valuation techniques used for foreign equity securities, as discussed in the accompanying Notes to Financial Statements:
| Transfers | Total |
| Level 1 to Level 2 | $9,091,486 |
| Level 2 to Level 1 | $46,637,934 |
See accompanying notes which are an integral part of the financial statements.
Fidelity® Worldwide Fund
Financial Statements
Statement of Assets and Liabilities
| April 30, 2016 (Unaudited) | ||
| Assets | ||
| Investment in securities, at value (including securities loaned of $7,029,594) — See accompanying schedule: Unaffiliated issuers (cost $1,335,896,953) | $1,537,780,862 | |
| Fidelity Central Funds (cost $32,721,812) | 32,721,812 | |
| Total Investments (cost $1,368,618,765) | $1,570,502,674 | |
| Foreign currency held at value (cost $56,309) | 55,661 | |
| Receivable for investments sold | ||
| Regular delivery | 56,537,304 | |
| Delayed delivery | 3,448,730 | |
| Receivable for fund shares sold | 748,207 | |
| Dividends receivable | 3,847,525 | |
| Distributions receivable from Fidelity Central Funds | 50,420 | |
| Prepaid expenses | 1,213 | |
| Other receivables | 57,052 | |
| Total assets | 1,635,248,786 | |
| Liabilities | ||
| Payable to custodian bank | $2,570,144 | |
| Payable for investments purchased | 51,436,354 | |
| Payable for fund shares redeemed | 24,394,053 | |
| Accrued management fee | 869,060 | |
| Distribution and service plan fees payable | 21,526 | |
| Other affiliated payables | 296,749 | |
| Other payables and accrued expenses | 114,635 | |
| Collateral on securities loaned, at value | 7,590,746 | |
| Total liabilities | 87,293,267 | |
| Net Assets | $1,547,955,519 | |
| Net Assets consist of: | ||
| Paid in capital | $1,389,384,590 | |
| Undistributed net investment income | 5,568,061 | |
| Accumulated undistributed net realized gain (loss) on investments and foreign currency transactions | (48,853,510) | |
| Net unrealized appreciation (depreciation) on investments and assets and liabilities in foreign currencies | 201,856,378 | |
| Net Assets | $1,547,955,519 | |
| Calculation of Maximum Offering Price | ||
| Class A: | ||
| Net Asset Value and redemption price per share ($31,310,008 ÷ 1,451,507 shares) | $21.57 | |
| Maximum offering price per share (100/94.25 of $21.57) | $22.89 | |
| Class T: | ||
| Net Asset Value and redemption price per share ($12,729,077 ÷ 593,461 shares) | $21.45 | |
| Maximum offering price per share (100/96.50 of $21.45) | $22.23 | |
| Class B: | ||
| Net Asset Value and offering price per share ($260,690 ÷ 12,281 shares)(a) | $21.23 | |
| Class C: | ||
| Net Asset Value and offering price per share ($11,119,959 ÷ 525,510 shares)(a) | $21.16 | |
| Worldwide: | ||
| Net Asset Value, offering price and redemption price per share ($1,468,611,488 ÷ 67,368,997 shares) | $21.80 | |
| Class I: | ||
| Net Asset Value, offering price and redemption price per share ($23,924,297 ÷ 1,102,338 shares) | $21.70 |
(a) Redemption price per share is equal to net asset value less any applicable contingent deferred sales charge.
See accompanying notes which are an integral part of the financial statements.
Statement of Operations
| Six months ended April 30, 2016 (Unaudited) | ||
| Investment Income | ||
| Dividends | $15,209,013 | |
| Interest | 2,357 | |
| Income from Fidelity Central Funds | 168,287 | |
| Income before foreign taxes withheld | 15,379,657 | |
| Less foreign taxes withheld | (836,245) | |
| Total income | 14,543,412 | |
| Expenses | ||
| Management fee | ||
| Basic fee | $5,237,370 | |
| Performance adjustment | 226,333 | |
| Transfer agent fees | 1,535,248 | |
| Distribution and service plan fees | 126,742 | |
| Accounting and security lending fees | 243,129 | |
| Custodian fees and expenses | 82,458 | |
| Independent trustees' compensation | 3,434 | |
| Registration fees | 83,611 | |
| Audit | 68,029 | |
| Legal | 3,483 | |
| Miscellaneous | 5,229 | |
| Total expenses before reductions | 7,615,066 | |
| Expense reductions | (26,777) | 7,588,289 |
| Net investment income (loss) | 6,955,123 | |
| Realized and Unrealized Gain (Loss) | ||
| Net realized gain (loss) on: | ||
| Investment securities: | ||
| Unaffiliated issuers (net of foreign taxes of $2,129) | (43,599,935) | |
| Foreign currency transactions | 348,368 | |
| Total net realized gain (loss) | (43,251,567) | |
| Change in net unrealized appreciation (depreciation) on: Investment securities (net of decrease in deferred foreign taxes of $31,438) | 1,538,838 | |
| Assets and liabilities in foreign currencies | (102,488) | |
| Total change in net unrealized appreciation (depreciation) | 1,436,350 | |
| Net gain (loss) | (41,815,217) | |
| Net increase (decrease) in net assets resulting from operations | $(34,860,094) |
See accompanying notes which are an integral part of the financial statements.
Statement of Changes in Net Assets
| Six months ended April 30, 2016 (Unaudited) | Year ended October 31, 2015 | |
| Increase (Decrease) in Net Assets | ||
| Operations | ||
| Net investment income (loss) | $6,955,123 | $8,944,137 |
| Net realized gain (loss) | (43,251,567) | 60,531,683 |
| Change in net unrealized appreciation (depreciation) | 1,436,350 | (24,468,691) |
| Net increase (decrease) in net assets resulting from operations | (34,860,094) | 45,007,129 |
| Distributions to shareholders from net investment income | (9,278,911) | (4,942,326) |
| Distributions to shareholders from net realized gain | (52,672,015) | (154,486,836) |
| Total distributions | (61,950,926) | (159,429,162) |
| Share transactions - net increase (decrease) | 20,375,577 | 128,269,740 |
| Redemption fees | 6,138 | 21,658 |
| Total increase (decrease) in net assets | (76,429,305) | 13,869,365 |
| Net Assets | ||
| Beginning of period | 1,624,384,824 | 1,610,515,459 |
| End of period (including undistributed net investment income of $5,568,061 and undistributed net investment income of $7,891,849, respectively) | $1,547,955,519 | $1,624,384,824 |
See accompanying notes which are an integral part of the financial statements.
Financial Highlights — Fidelity Worldwide Fund Class A
| Six months ended (Unaudited) April 30, | Years ended October 31, | |||||
| 2016 | 2015 | 2014 | 2013 | 2012 | 2011 | |
| Selected Per–Share Data | ||||||
| Net asset value, beginning of period | $22.88 | $24.64 | $25.18 | $19.69 | $17.89 | $17.50 |
| Income from Investment Operations | ||||||
| Net investment income (loss)A | .06 | .06 | .02 | .02 | .10 | .05 |
| Net realized and unrealized gain (loss) | (.55) | .58 | 1.46 | 5.66 | 1.72 | .47 |
| Total from investment operations | (.49) | .64 | 1.48 | 5.68 | 1.82 | .52 |
| Distributions from net investment income | (.07) | – | (.04) | (.11) | (.02) | (.08) |
| Distributions from net realized gain | (.75) | (2.40) | (1.98) | (.08) | – | (.05) |
| Total distributions | (.82) | (2.40) | (2.02) | (.19) | (.02) | (.13) |
| Redemption fees added to paid in capitalA,B | – | – | – | – | – | – |
| Net asset value, end of period | $21.57 | $22.88 | $24.64 | $25.18 | $19.69 | $17.89 |
| Total ReturnC,D,E | (2.27)% | 2.73% | 6.29% | 29.10% | 10.20% | 2.94% |
| Ratios to Average Net AssetsF,G | ||||||
| Expenses before reductions | 1.27%H | 1.27% | 1.31% | 1.45% | 1.43% | 1.41% |
| Expenses net of fee waivers, if any | 1.27%H | 1.26% | 1.31% | 1.45% | 1.43% | 1.40% |
| Expenses net of all reductions | 1.27%H | 1.26% | 1.31% | 1.42% | 1.41% | 1.38% |
| Net investment income (loss) | .60%H | .27% | .10% | .09% | .52% | .28% |
| Supplemental Data | ||||||
| Net assets, end of period (000 omitted) | $31,310 | $31,043 | $33,788 | $28,661 | $18,723 | $13,153 |
| Portfolio turnover rateI | 124%H | 151% | 163% | 161% | 186% | 203% |
A Calculated based on average shares outstanding during the period.
B Amount represents less than $.005 per share.
C Total returns for periods of less than one year are not annualized.
D Total returns would have been lower if certain expenses had not been reduced during the applicable periods shown.
E Total returns do not include the effect of the sales charges.
F Fees and expenses of any underlying Fidelity Central Funds are not included in the Fund's expense ratio. The Fund indirectly bears its proportionate share of the expenses of any underlying Fidelity Central Funds.
G Expense ratios reflect operating expenses of the class. Expenses before reductions do not reflect amounts reimbursed by the investment adviser or reductions from brokerage service arrangements or reductions from other expense offset arrangements and do not represent the amount paid by the class during periods when reimbursements or reductions occur. Expenses net of fee waivers reflect expenses after reimbursement by the investment adviser but prior to reductions from brokerage service arrangements or other expense offset arrangements. Expenses net of all reductions represent the net expenses paid by the class.
H Annualized
I Amount does not include the portfolio activity of any underlying Fidelity Central Funds.
See accompanying notes which are an integral part of the financial statements.
Financial Highlights — Fidelity Worldwide Fund Class T
| Six months ended (Unaudited) April 30, | Years ended October 31, | |||||
| 2016 | 2015 | 2014 | 2013 | 2012 | 2011 | |
| Selected Per–Share Data | ||||||
| Net asset value, beginning of period | $22.72 | $24.49 | $25.05 | $19.61 | $17.83 | $17.46 |
| Income from Investment Operations | ||||||
| Net investment income (loss)A | .03 | (.01) | (.04) | (.04) | .05 | .01 |
| Net realized and unrealized gain (loss) | (.55) | .57 | 1.46 | 5.63 | 1.73 | .45 |
| Total from investment operations | (.52) | .56 | 1.42 | 5.59 | 1.78 | .46 |
| Distributions from net investment income | – | – | – | (.07) | – | (.04) |
| Distributions from net realized gain | (.75) | (2.33) | (1.98) | (.08) | – | (.05) |
| Total distributions | (.75) | (2.33) | (1.98) | (.15) | – | (.09) |
| Redemption fees added to paid in capitalA,B | – | – | – | – | – | – |
| Net asset value, end of period | $21.45 | $22.72 | $24.49 | $25.05 | $19.61 | $17.83 |
| Total ReturnC,D,E | (2.38)% | 2.36% | 6.05% | 28.73% | 9.98% | 2.61% |
| Ratios to Average Net AssetsF,G | ||||||
| Expenses before reductions | 1.57%H | 1.57% | 1.58% | 1.71% | 1.68% | 1.66% |
| Expenses net of fee waivers, if any | 1.57%H | 1.56% | 1.58% | 1.70% | 1.68% | 1.65% |
| Expenses net of all reductions | 1.57%H | 1.56% | 1.58% | 1.68% | 1.66% | 1.63% |
| Net investment income (loss) | .30%H | (.04)% | (.17)% | (.16)% | .26% | .03% |
| Supplemental Data | ||||||
| Net assets, end of period (000 omitted) | $12,729 | $13,055 | $12,160 | $9,822 | $5,550 | $2,187 |
| Portfolio turnover rateI | 124%H | 151% | 163% | 161% | 186% | 203% |
A Calculated based on average shares outstanding during the period.
B Amount represents less than $.005 per share.
C Total returns for periods of less than one year are not annualized.
D Total returns would have been lower if certain expenses had not been reduced during the applicable periods shown.
E Total returns do not include the effect of the sales charges.
F Fees and expenses of any underlying Fidelity Central Funds are not included in the Fund's expense ratio. The Fund indirectly bears its proportionate share of the expenses of any underlying Fidelity Central Funds.
G Expense ratios reflect operating expenses of the class. Expenses before reductions do not reflect amounts reimbursed by the investment adviser or reductions from brokerage service arrangements or reductions from other expense offset arrangements and do not represent the amount paid by the class during periods when reimbursements or reductions occur. Expenses net of fee waivers reflect expenses after reimbursement by the investment adviser but prior to reductions from brokerage service arrangements or other expense offset arrangements. Expenses net of all reductions represent the net expenses paid by the class.
H Annualized
I Amount does not include the portfolio activity of any underlying Fidelity Central Funds.
See accompanying notes which are an integral part of the financial statements.
Financial Highlights — Fidelity Worldwide Fund Class B
| Six months ended (Unaudited) April 30, | Years ended October 31, | |||||
| 2016 | 2015 | 2014 | 2013 | 2012 | 2011 | |
| Selected Per–Share Data | ||||||
| Net asset value, beginning of period | $22.55 | $24.21 | $24.82 | $19.44 | $17.77 | $17.39 |
| Income from Investment Operations | ||||||
| Net investment income (loss)A | (.02) | (.13) | (.17) | (.14) | (.04) | (.09) |
| Net realized and unrealized gain (loss) | (.55) | .57 | 1.45 | 5.59 | 1.71 | .47 |
| Total from investment operations | (.57) | .44 | 1.28 | 5.45 | 1.67 | .38 |
| Distributions from net investment income | – | – | – | – | – | – |
| Distributions from net realized gain | (.75) | (2.10) | (1.89) | (.07) | – | – |
| Total distributions | (.75) | (2.10) | (1.89) | (.07) | – | – |
| Redemption fees added to paid in capitalA,B | – | – | – | – | – | – |
| Net asset value, end of period | $21.23 | $22.55 | $24.21 | $24.82 | $19.44 | $17.77 |
| Total ReturnC,D,E | (2.65)% | 1.88% | 5.49% | 28.13% | 9.40% | 2.19% |
| Ratios to Average Net AssetsF,G | ||||||
| Expenses before reductions | 2.06%H | 2.08% | 2.09% | 2.19% | 2.18% | 2.16% |
| Expenses net of fee waivers, if any | 2.06%H | 2.08% | 2.09% | 2.19% | 2.18% | 2.16% |
| Expenses net of all reductions | 2.06%H | 2.07% | 2.09% | 2.17% | 2.16% | 2.13% |
| Net investment income (loss) | (.19)%H | (.55)% | (.68)% | (.65)% | (.23)% | (.47)% |
| Supplemental Data | ||||||
| Net assets, end of period (000 omitted) | $261 | $367 | $573 | $710 | $304 | $256 |
| Portfolio turnover rateI | 124%H | 151% | 163% | 161% | 186% | 203% |
A Calculated based on average shares outstanding during the period.
B Amount represents less than $.005 per share.
C Total returns for periods of less than one year are not annualized.
D Total returns would have been lower if certain expenses had not been reduced during the applicable periods shown.
E Total returns do not include the effect of the contingent deferred sales charge.
F Fees and expenses of any underlying Fidelity Central Funds are not included in the Fund's expense ratio. The Fund indirectly bears its proportionate share of the expenses of any underlying Fidelity Central Funds.
G Expense ratios reflect operating expenses of the class. Expenses before reductions do not reflect amounts reimbursed by the investment adviser or reductions from brokerage service arrangements or reductions from other expense offset arrangements and do not represent the amount paid by the class during periods when reimbursements or reductions occur. Expenses net of fee waivers reflect expenses after reimbursement by the investment adviser but prior to reductions from brokerage service arrangements or other expense offset arrangements. Expenses net of all reductions represent the net expenses paid by the class.
H Annualized
I Amount does not include the portfolio activity of any underlying Fidelity Central Funds.
See accompanying notes which are an integral part of the financial statements.
Financial Highlights — Fidelity Worldwide Fund Class C
| Six months ended (Unaudited) April 30, | Years ended October 31, | |||||
| 2016 | 2015 | 2014 | 2013 | 2012 | 2011 | |
| Selected Per–Share Data | ||||||
| Net asset value, beginning of period | $22.48 | $24.12 | $24.78 | $19.41 | $17.74 | $17.36 |
| Income from Investment Operations | ||||||
| Net investment income (loss)A | (.02) | (.12) | (.15) | (.14) | (.04) | (.09) |
| Net realized and unrealized gain (loss) | (.55) | .57 | 1.44 | 5.58 | 1.71 | .47 |
| Total from investment operations | (.57) | .45 | 1.29 | 5.44 | 1.67 | .38 |
| Distributions from net investment income | – | – | – | – | – | – |
| Distributions from net realized gain | (.75) | (2.09) | (1.95) | (.07) | – | – |
| Total distributions | (.75) | (2.09) | (1.95) | (.07) | – | – |
| Redemption fees added to paid in capitalA,B | – | – | – | – | – | – |
| Net asset value, end of period | $21.16 | $22.48 | $24.12 | $24.78 | $19.41 | $17.74 |
| Total ReturnC,D,E | (2.66)% | 1.90% | 5.55% | 28.12% | 9.41% | 2.19% |
| Ratios to Average Net AssetsF,G | ||||||
| Expenses before reductions | 2.06%H | 2.07% | 2.04% | 2.15% | 2.18% | 2.16% |
| Expenses net of fee waivers, if any | 2.06%H | 2.07% | 2.04% | 2.14% | 2.18% | 2.15% |
| Expenses net of all reductions | 2.06%H | 2.06% | 2.03% | 2.12% | 2.16% | 2.13% |
| Net investment income (loss) | (.19)%H | (.54)% | (.63)% | (.60)% | (.23)% | (.47)% |
| Supplemental Data | ||||||
| Net assets, end of period (000 omitted) | $11,120 | $11,231 | $9,229 | $10,778 | $1,726 | $1,297 |
| Portfolio turnover rateI | 124%H | 151% | 163% | 161% | 186% | 203% |
A Calculated based on average shares outstanding during the period.
B Amount represents less than $.005 per share.
C Total returns for periods of less than one year are not annualized.
D Total returns would have been lower if certain expenses had not been reduced during the applicable periods shown.
E Total returns do not include the effect of the contingent deferred sales charge.
F Fees and expenses of any underlying Fidelity Central Funds are not included in the Fund's expense ratio. The Fund indirectly bears its proportionate share of the expenses of any underlying Fidelity Central Funds.
G Expense ratios reflect operating expenses of the class. Expenses before reductions do not reflect amounts reimbursed by the investment adviser or reductions from brokerage service arrangements or reductions from other expense offset arrangements and do not represent the amount paid by the class during periods when reimbursements or reductions occur. Expenses net of fee waivers reflect expenses after reimbursement by the investment adviser but prior to reductions from brokerage service arrangements or other expense offset arrangements. Expenses net of all reductions represent the net expenses paid by the class.
H Annualized
I Amount does not include the portfolio activity of any underlying Fidelity Central Funds.
See accompanying notes which are an integral part of the financial statements.
Financial Highlights — Fidelity Worldwide Fund
| Six months ended (Unaudited) April 30, | Years ended October 31, | |||||
| 2016 | 2015 | 2014 | 2013 | 2012 | 2011 | |
| Selected Per–Share Data | ||||||
| Net asset value, beginning of period | $23.14 | $24.92 | $25.41 | $19.85 | $18.02 | $17.58 |
| Income from Investment Operations | ||||||
| Net investment income (loss)A | .10 | .13 | .11 | .10 | .16 | .11 |
| Net realized and unrealized gain (loss) | (.55) | .58 | 1.47 | 5.70 | 1.74 | .48 |
| Total from investment operations | (.45) | .71 | 1.58 | 5.80 | 1.90 | .59 |
| Distributions from net investment income | (.14) | (.08) | (.09) | (.16) | (.07) | (.10) |
| Distributions from net realized gain | (.75) | (2.41) | (1.98) | (.08) | – | (.05) |
| Total distributions | (.89) | (2.49) | (2.07) | (.24) | (.07) | (.15) |
| Redemption fees added to paid in capitalA,B | – | – | – | – | – | – |
| Net asset value, end of period | $21.80 | $23.14 | $24.92 | $25.41 | $19.85 | $18.02 |
| Total ReturnC,D | (2.08)% | 3.01% | 6.64% | 29.54% | 10.56% | 3.32% |
| Ratios to Average Net AssetsE,F | ||||||
| Expenses before reductions | .96%G | .96% | .98% | 1.11% | 1.11% | 1.08% |
| Expenses net of fee waivers, if any | .96%G | .96% | .97% | 1.11% | 1.11% | 1.08% |
| Expenses net of all reductions | .95%G | .95% | .97% | 1.08% | 1.09% | 1.05% |
| Net investment income (loss) | .91%G | .57% | .44% | .43% | .84% | .60% |
| Supplemental Data | ||||||
| Net assets, end of period (000 omitted) | $1,468,611 | $1,543,516 | $1,535,658 | $1,464,415 | $1,081,240 | $1,114,694 |
| Portfolio turnover rateH | 124%G | 151% | 163% | 161% | 186% | 203% |
A Calculated based on average shares outstanding during the period.
B Amount represents less than $.005 per share.
C Total returns for periods of less than one year are not annualized.
D Total returns would have been lower if certain expenses had not been reduced during the applicable periods shown.
E Fees and expenses of any underlying Fidelity Central Funds are not included in the Fund's expense ratio. The Fund indirectly bears its proportionate share of the expenses of any underlying Fidelity Central Funds.
F Expense ratios reflect operating expenses of the class. Expenses before reductions do not reflect amounts reimbursed by the investment adviser or reductions from brokerage service arrangements or reductions from other expense offset arrangements and do not represent the amount paid by the class during periods when reimbursements or reductions occur. Expenses net of fee waivers reflect expenses after reimbursement by the investment adviser but prior to reductions from brokerage service arrangements or other expense offset arrangements. Expenses net of all reductions represent the net expenses paid by the class.
G Annualized
H Amount does not include the portfolio activity of any underlying Fidelity Central Funds.
See accompanying notes which are an integral part of the financial statements.
Financial Highlights — Fidelity Worldwide Fund Class I
| Six months ended (Unaudited) April 30, | Years ended October 31, | |||||
| 2016 | 2015 | 2014 | 2013 | 2012 | 2011 | |
| Selected Per–Share Data | ||||||
| Net asset value, beginning of period | $23.03 | $24.81 | $25.31 | $19.78 | $17.98 | $17.57 |
| Income from Investment Operations | ||||||
| Net investment income (loss)A | .09 | .13 | .10 | .08 | .14 | .10 |
| Net realized and unrealized gain (loss) | (.56) | .58 | 1.47 | 5.68 | 1.74 | .47 |
| Total from investment operations | (.47) | .71 | 1.57 | 5.76 | 1.88 | .57 |
| Distributions from net investment income | (.11) | (.07) | (.09) | (.15) | (.08) | (.11) |
| Distributions from net realized gain | (.75) | (2.41) | (1.98) | (.08) | – | (.05) |
| Total distributions | (.86) | (2.49)B | (2.07) | (.23) | (.08) | (.16) |
| Redemption fees added to paid in capitalA,C | – | – | – | – | – | – |
| Net asset value, end of period | $21.70 | $23.03 | $24.81 | $25.31 | $19.78 | $17.98 |
| Total ReturnD,E | (2.17)% | 3.00% | 6.63% | 29.44% | 10.49% | 3.23% |
| Ratios to Average Net AssetsF,G | ||||||
| Expenses before reductions | 1.05%H | .98% | 1.01% | 1.17% | 1.18% | 1.13% |
| Expenses net of fee waivers, if any | 1.05%H | .98% | 1.01% | 1.17% | 1.18% | 1.13% |
| Expenses net of all reductions | 1.05%H | .97% | 1.00% | 1.14% | 1.16% | 1.10% |
| Net investment income (loss) | .82%H | .55% | .40% | .37% | .77% | .56% |
| Supplemental Data | ||||||
| Net assets, end of period (000 omitted) | $23,924 | $25,173 | $19,107 | $10,639 | $4,291 | $3,086 |
| Portfolio turnover rateI | 124%H | 151% | 163% | 161% | 186% | 203% |
A Calculated based on average shares outstanding during the period.
B Total distributions of $2.49 per share is comprised of distributions from net investment income of $.074 and distributions from net realized gain of $2.413 per share.
C Amount represents less than $.005 per share.
D Total returns for periods of less than one year are not annualized.
E Total returns would have been lower if certain expenses had not been reduced during the applicable periods shown.
F Fees and expenses of any underlying Fidelity Central Funds are not included in the Fund's expense ratio. The Fund indirectly bears its proportionate share of the expenses of any underlying Fidelity Central Funds.
G Expense ratios reflect operating expenses of the class. Expenses before reductions do not reflect amounts reimbursed by the investment adviser or reductions from brokerage service arrangements or reductions from other expense offset arrangements and do not represent the amount paid by the class during periods when reimbursements or reductions occur. Expenses net of fee waivers reflect expenses after reimbursement by the investment adviser but prior to reductions from brokerage service arrangements or other expense offset arrangements. Expenses net of all reductions represent the net expenses paid by the class.
H Annualized
I Amount does not include the portfolio activity of any underlying Fidelity Central Funds.
See accompanying notes which are an integral part of the financial statements.
Notes to Financial Statements (Unaudited)
For the period ended April 30, 2016
1. Organization.
Fidelity Worldwide Fund (the Fund) is a fund of Fidelity Investment Trust (the Trust) and is authorized to issue an unlimited number of shares. The Trust is registered under the Investment Company Act of 1940, as amended (the 1940 Act), as an open-end management investment company organized as a Massachusetts business trust. The Fund offers Class A, Class T, Class C, Worldwide and Class I shares, each of which, along with Class B shares, has equal rights as to assets and voting privileges. Class B shares are closed to new accounts and additional purchases, except for exchanges and reinvestments. Each class has exclusive voting rights with respect to matters that affect that class. Class B shares will automatically convert to Class A shares after a maximum holding period of seven years from the initial date of purchase.
During the period, the Board of Trustees approved the conversion of all existing Class B shares into Class A shares, effective on or about July 1, 2016, regardless of the length of times shares have been held.
2. Investments in Fidelity Central Funds.
The Fund invests in Fidelity Central Funds, which are open-end investment companies generally available only to other investment companies and accounts managed by the investment adviser and its affiliates. The Fund's Schedule of Investments lists each of the Fidelity Central Funds held as of period end, if any, as an investment of the Fund, but does not include the underlying holdings of each Fidelity Central Fund. As an Investing Fund, the Fund indirectly bears its proportionate share of the expenses of the underlying Fidelity Central Funds.
The Money Market Central Funds seek preservation of capital and current income and are managed by Fidelity Investments Money Management, Inc. (FIMM), an affiliate of the investment adviser. Annualized expenses of the Money Market Central Funds as of their most recent shareholder report date are less than .005%.
A complete unaudited list of holdings for each Fidelity Central Fund is available upon request or at the Securities and Exchange Commission (the SEC) website at www.sec.gov. In addition, the financial statements of the Fidelity Central Funds are available on the SEC website or upon request.
3. Significant Accounting Policies.
The financial statements have been prepared in conformity with accounting principles generally accepted in the United States of America (GAAP), which require management to make certain estimates and assumptions at the date of the financial statements. Actual results could differ from those estimates. Subsequent events, if any, through the date that the financial statements were issued have been evaluated in the preparation of the financial statements. The following summarizes the significant accounting policies of the Fund:
Investment Valuation. Investments are valued as of 4:00 p.m. Eastern time on the last calendar day of the period. The Board of Trustees (the Board) has delegated the day to day responsibility for the valuation of the Fund's investments to the Fidelity Management & Research Company (FMR) Fair Value Committee (the Committee). In accordance with valuation policies and procedures approved by the Board, the Fund attempts to obtain prices from one or more third party pricing vendors or brokers to value its investments. When current market prices, quotations or currency exchange rates are not readily available or reliable, investments will be fair valued in good faith by the Committee, in accordance with procedures adopted by the Board. Factors used in determining fair value vary by investment type and may include market or investment specific events. The frequency with which these procedures are used cannot be predicted and they may be utilized to a significant extent. The Committee oversees the Fund's valuation policies and procedures and reports to the Board on the Committee's activities and fair value determinations. The Board monitors the appropriateness of the procedures used in valuing the Fund's investments and ratifies the fair value determinations of the Committee.
The Fund categorizes the inputs to valuation techniques used to value its investments into a disclosure hierarchy consisting of three levels as shown below:
- Level 1 – quoted prices in active markets for identical investments
- Level 2 – other significant observable inputs (including quoted prices for similar investments, interest rates, prepayment speeds, etc.)
- Level 3 – unobservable inputs (including the Fund's own assumptions based on the best information available)
Valuation techniques used to value the Fund's investments by major category are as follows:
Equity securities, including restricted securities, for which market quotations are readily available, are valued at the last reported sale price or official closing price as reported by a third party pricing vendor on the primary market or exchange on which they are traded and are categorized as Level 1 in the hierarchy. In the event there were no sales during the day or closing prices are not available, securities are valued at the last quoted bid price or may be valued using the last available price and are generally categorized as Level 2 in the hierarchy. For foreign equity securities, when market or security specific events arise, comparisons to the valuation of American Depositary Receipts (ADRs), futures contracts, Exchange-Traded Funds (ETFs) and certain indexes as well as quoted prices for similar securities may be used and would be categorized as Level 2 in the hierarchy. Utilizing these techniques may result in transfers between Level 1 and Level 2. For equity securities, including restricted securities, where observable inputs are limited, assumptions about market activity and risk are used and these securities may be categorized as Level 3 in the hierarchy.
Investments in open-end mutual funds, including the Fidelity Central Funds, are valued at their closing net asset value (NAV) each business day and are categorized as Level 1 in the hierarchy.
Changes in valuation techniques may result in transfers in or out of an assigned level within the disclosure hierarchy. The aggregate value of investments by input level as of April 30, 2016, including information on transfers between Levels 1 and 2 is included at the end of the Fund's Schedule of Investments.
Foreign Currency. The Fund may use foreign currency contracts to facilitate transactions in foreign-denominated securities. Gains and losses from these transactions may arise from changes in the value of the foreign currency or if the counterparties do not perform under the contracts' terms.
Foreign-denominated assets, including investment securities, and liabilities are translated into U.S. dollars at the exchange rates at period end. Purchases and sales of investment securities, income and dividends received and expenses denominated in foreign currencies are translated into U.S. dollars at the exchange rate in effect on the transaction date.
The effects of exchange rate fluctuations on investments are included with the net realized and unrealized gain (loss) on investment securities. Other foreign currency transactions resulting in realized and unrealized gain (loss) are disclosed separately.
Investment Transactions and Income. For financial reporting purposes, the Fund's investment holdings and NAV include trades executed through the end of the last business day of the period. The NAV per share for processing shareholder transactions is calculated as of the close of business of the New York Stock Exchange (NYSE), normally 4:00 p.m. Eastern time and includes trades executed through the end of the prior business day. Gains and losses on securities sold are determined on the basis of identified cost and may include proceeds received from litigation. Dividend income is recorded on the ex-dividend date, except for certain dividends from foreign securities where the ex-dividend date may have passed, which are recorded as soon as the Fund is informed of the ex-dividend date. Non-cash dividends included in dividend income, if any, are recorded at the fair market value of the securities received. Income and capital gain distributions from Fidelity Central Funds, if any, are recorded on the ex-dividend date. Distributions received on securities that represent a return of capital or capital gain are recorded as a reduction of cost of investments and/or as a realized gain. Subsequent to ex-dividend date the Fund determines the components of these distributions, based upon receipt of tax filings or other correspondence relating to the underlying investment. Interest income is accrued as earned and includes coupon interest and amortization of premium and accretion of discount on debt securities as applicable. Investment income is recorded net of foreign taxes withheld where recovery of such taxes is uncertain.
Class Allocations and Expenses. Investment income, realized and unrealized capital gains and losses, common expenses of the Fund, and certain fund-level expense reductions, if any, are allocated daily on a pro-rata basis to each class based on the relative net assets of each class to the total net assets of the Fund. Each class differs with respect to transfer agent and distribution and service plan fees incurred. Certain expense reductions may also differ by class. For the reporting period, the allocated portion of income and expenses to each class as a percent of its average net assets may vary due to the timing of recording these transactions in relation to fluctuating net assets of the classes. Expenses directly attributable to a fund are charged to that fund. Expenses attributable to more than one fund are allocated among the respective funds on the basis of relative net assets or other appropriate methods. Expense estimates are accrued in the period to which they relate and adjustments are made when actual amounts are known.
Income Tax Information and Distributions to Shareholders. Each year, the Fund intends to qualify as a regulated investment company under Subchapter M of the Internal Revenue Code, including distributing substantially all of its taxable income and realized gains. As a result, no provision for U.S. Federal income taxes is required. The Fund files a U.S. federal tax return, in addition to state and local tax returns as required. The Fund's federal income tax returns are subject to examination by the Internal Revenue Service (IRS) for a period of three fiscal years after they are filed. State and local tax returns may be subject to examination for an additional fiscal year depending on the jurisdiction. Foreign taxes are provided for based on the Fund's understanding of the tax rules and rates that exist in the foreign markets in which it invests. The Fund is subject to a tax imposed on capital gains by certain countries in which it invests.
Distributions are declared and recorded on the ex-dividend date. Income dividends and capital gain distributions are declared separately for each class. Income and capital gain distributions are determined in accordance with income tax regulations, which may differ from GAAP.
Capital accounts within the financial statements are adjusted for permanent book-tax differences. These adjustments have no impact on net assets or the results of operations. Capital accounts are not adjusted for temporary book-tax differences which will reverse in a subsequent period.
Book-tax differences are primarily due to futures contracts, foreign currency transactions, certain foreign taxes, passive foreign investment companies (PFIC), partnerships, deferred trustees compensation and losses deferred due to wash sales.
The federal tax cost of investment securities and unrealized appreciation (depreciation) as of period end were as follows:
| Gross unrealized appreciation | $244,600,092 |
| Gross unrealized depreciation | (44,752,721) |
| Net unrealized appreciation (depreciation) on securities | $199,847,371 |
| Tax cost | $1,370,655,303 |
Short-Term Trading (Redemption) Fees. Shares held by investors in the Fund less than 30 days may have been subject to a redemption fee equal to 1.00% of the NAV of shares redeemed. All redemption fees, which reduce the proceeds of the shareholder redemption, are retained by the Fund and accounted for as an addition to paid in capital.
Delayed Delivery Transactions and When-Issued Securities. During the period, the Fund transacted in securities on a delayed delivery or when-issued basis. Payment and delivery may take place after the customary settlement period for that security. The price of the underlying securities and the date when the securities will be delivered and paid for are fixed at the time the transaction is negotiated. With respect to purchase commitments, the Fund identifies securities as segregated in its records with a value at least equal to the amount of the commitment. Losses may arise due to changes in the value of the underlying securities or if the counterparty does not perform under the contract's terms, or if the issuer does not issue the securities due to political, economic, or other factors.
Restricted Securities. The Fund may invest in securities that are subject to legal or contractual restrictions on resale. These securities generally may be resold in transactions exempt from registration or to the public if the securities are registered. Disposal of these securities may involve time-consuming negotiations and expense, and prompt sale at an acceptable price may be difficult. Information regarding restricted securities is included at the end of the Fund's Schedule of Investments.
4. Purchases and Sales of Investments.
Purchases and sales of securities, other than short-term securities, aggregated $959,804,322 and $977,150,164, respectively.
5. Fees and Other Transactions with Affiliates.
Management Fee. Fidelity Management & Research Company (the investment adviser) and its affiliates provide the Fund with investment management related services for which the Fund pays a monthly management fee. The management fee is the sum of an individual fund fee rate that is based on an annual rate of .424% of the Fund's average net assets and an annualized group fee rate that averaged .25% during the period. The group fee rate is based upon the average net assets of all the mutual funds advised by the investment adviser, including any mutual funds previously advised by the investment adviser that are currently advised by Fidelity SelectCo, LLC, an affiliate of the investment adviser. The group fee rate decreases as assets under management increase and increases as assets under management decrease. In addition, the management fee is subject to a performance adjustment (up to a maximum of +/- .20% of the Fund's average net assets over a 36 month performance period). The upward or downward adjustment to the management fee is based on the relative investment performance of Worldwide as compared to its benchmark index, the MSCI World Index, over the same 36 month performance period. For the reporting period, the total annualized management fee rate, including the performance adjustment, was .70% of the Fund's average net assets. The performance adjustment included in the management fee rate may be higher or lower than the maximum performance adjustment rate due to the difference between the average net assets for the reporting and performance periods.
Distribution and Service Plan Fees. In accordance with Rule 12b-1 of the 1940 Act, the Fund has adopted separate Distribution and Service Plans for each class of shares. Certain classes pay Fidelity Distributors Corporation (FDC), an affiliate of the investment adviser, separate Distribution and Service Fees, each of which is based on an annual percentage of each class' average net assets. In addition, FDC may pay financial intermediaries for selling shares of the Fund and providing shareholder support services. For the period, the Distribution and Service Fee rates, total fees and amounts retained by FDC were as follows:
| Distribution Fee | Service Fee | Total Fees | Retained by FDC | |
| Class A | -% | .25% | $38,402 | $948 |
| Class T | .25% | .25% | 31,350 | 111 |
| Class B | .75% | .25% | 1,507 | 1,130 |
| Class C | .75% | .25% | 55,483 | 14,385 |
| $126,742 | $16,574 |
Sales Load. FDC may receive a front-end sales charge of up to 5.75% for selling Class A shares and 3.50% for selling Class T shares, some of which is paid to financial intermediaries for selling shares of the Fund. Depending on the holding period, FDC may receive contingent deferred sales charges levied on Class A, Class T, Class B, and Class C redemptions. The deferred sales charges range from 5.00% to 1.00% for Class B shares, 1.00% for Class C shares, 1.00% for certain purchases of Class A shares and .25% for certain purchases of Class T shares.
For the period, sales charge amounts retained by FDC were as follows:
| Retained by FDC | |
| Class A | $9,190 |
| Class T | 2,320 |
| Class B(a) | 69 |
| Class C(a) | 1,068 |
| $12,647 |
(a) When Class B and Class C shares are initially sold, FDC pays commissions from its own resources to financial intermediaries through which the sales are made.
Transfer Agent Fees. Fidelity Investments Institutional Operations Company, Inc., (FIIOC), an affiliate of the investment adviser, is the transfer, dividend disbursing and shareholder servicing agent for each class of the Fund. FIIOC receives account fees and asset-based fees that vary according to the account size and type of account of the shareholders of the respective classes of the Fund. FIIOC pays for typesetting, printing and mailing of shareholder reports, except proxy statements.
For the period, transfer agent fees for each class were as follows:
| Amount | % of Class-Level Average Net Assets(a) | |
| Class A | $39,375 | .26 |
| Class T | 19,127 | .30 |
| Class B | 451 | .30 |
| Class C | 16,541 | .30 |
| Worldwide | 1,424,795 | .19 |
| Class I | 34,959 | .29 |
| $1,535,248 |
(a) Annualized
Accounting and Security Lending Fees. Fidelity Service Company, Inc. (FSC), an affiliate of the investment adviser, maintains the Fund's accounting records. The accounting fee is based on the level of average net assets for each month. Under a separate contract, FSC administers the security lending program. The security lending fee is based on the number and duration of lending transactions.
Brokerage Commissions. The Fund placed a portion of its portfolio transactions with brokerage firms which are affiliates of the investment adviser. Brokerage commissions are included in net realized gain (loss) and change in net unrealized appreciation (depreciation) in the Statement of Operations. The commissions paid to these affiliated firms were $9,611 for the period.
Interfund Trades. The Fund may purchase from or sell securities to other Fidelity Funds under procedures adopted by the Board. The procedures have been designed to ensure these interfund trades are executed in accordance with Rule 17a-7 of the 1940 Act. Interfund trades are included within the respective purchases and sales amounts shown in the Purchases and Sales of Investments note.
6. Committed Line of Credit.
The Fund participates with other funds managed by the investment adviser or an affiliate in a $4.25 billion credit facility (the "line of credit") to be utilized for temporary or emergency purposes to fund shareholder redemptions or for other short-term liquidity purposes. The Fund has agreed to pay commitment fees on its pro-rata portion of the line of credit, which amounted to $1,379 and is reflected in Miscellaneous expenses on the Statement of Operations. During the period, the Fund did not borrow on this line of credit.
7. Security Lending.
The Fund lends portfolio securities through a lending agent from time to time in order to earn additional income. For equity securities, a lending agent is used and may loan securities to certain qualified borrowers, including Fidelity Capital Markets (FCM), a broker-dealer affiliated with the Fund. On the settlement date of the loan, the Fund receives collateral (in the form of U.S. Treasury obligations, letters of credit and/or cash) against the loaned securities and maintains collateral in an amount not less than 100% of the market value of the loaned securities during the period of the loan. The market value of the loaned securities is determined at the close of business of the Fund and any additional required collateral is delivered to the Fund on the next business day. The Fund or borrower may terminate the loan at any time, and if the borrower defaults on its obligation to return the securities loaned because of insolvency or other reasons, the Fund may apply collateral received from the borrower against the obligation. The Fund may experience delays and costs in recovering the securities loaned. Any cash collateral received is invested in the Fidelity Securities Lending Cash Central Fund. The value of loaned securities and cash collateral at period end are disclosed on the Fund's Statement of Assets and Liabilities. Security lending income represents the income earned on investing cash collateral, less rebates paid to borrowers and any lending agent fees associated with the loan, plus any premium payments received for lending certain types of securities. Security lending income is presented in the Statement of Operations as a component of income from Fidelity Central Funds. Total security lending income during the period amounted to $115,427. During the period, there were no securities loaned to FCM.
8. Expense Reductions.
Commissions paid to certain brokers with whom the investment adviser, or its affiliates, places trades on behalf of the Fund include an amount in addition to trade execution, which may be rebated back to the Fund to offset certain expenses. This amount totaled $20,702 for the period. In addition, through arrangements with the Fund's custodian, credits realized as a result of certain uninvested cash balances were used to reduce the Fund's expenses. During the period, these credits reduced the Fund's custody expenses by $297.
In addition, during the period the investment adviser reimbursed and/or waived a portion of fund-level operating expenses in the amount of $5,778.
9. Distributions to Shareholders.
Distributions to shareholders of each class were as follows:
| Six months ended April 30, 2016 | Year ended October 31, 2015 | |
| From net investment income | ||
| Class A | $95,208 | $– |
| Class T | 2,313 | – |
| Worldwide | 9,064,407 | 4,895,242 |
| Class I | 116,983 | 47,084 |
| Total | $9,278,911 | $4,942,326 |
| From net realized gain | ||
| Class A | $1,050,091 | $3,318,115 |
| Class T | 433,754 | 1,143,314 |
| Class B | 11,494 | 47,493 |
| Class C | 384,211 | 790,219 |
| Worldwide | 49,987,535 | 147,652,391 |
| Class I | 804,930 | 1,535,304 |
| Total | $52,672,015 | $154,486,836 |
10. Share Transactions.
Share transactions for each class were as follows and may contain automatic conversions between classes or exchanges between affiliated funds:
| Shares | Shares | Dollars | Dollars | |
| Six months ended April 30, 2016 | Year ended October 31, 2015 | Six months ended April 30, 2016 | Year ended October 31, 2015 | |
| Class A | ||||
| Shares sold | 230,209 | 416,197 | $4,950,696 | $9,650,572 |
| Reinvestment of distributions | 49,536 | 143,319 | 1,105,146 | 3,239,009 |
| Shares redeemed | (185,147) | (573,622) | (3,904,065) | (12,962,950) |
| Net increase (decrease) | 94,598 | (14,106) | $2,151,777 | $(73,369) |
| Class T | ||||
| Shares sold | 57,758 | 129,216 | $1,237,003 | $2,974,281 |
| Reinvestment of distributions | 19,370 | 50,075 | 430,197 | 1,126,698 |
| Shares redeemed | (58,217) | (101,388) | (1,245,210) | (2,303,572) |
| Net increase (decrease) | 18,911 | 77,903 | $421,990 | $1,797,407 |
| Class B | ||||
| Shares sold | 457 | 3,860 | $8,675 | $90,877 |
| Reinvestment of distributions | 487 | 1,857 | 10,726 | 41,646 |
| Shares redeemed | (4,925) | (13,140) | (103,223) | (300,445) |
| Net increase (decrease) | (3,981) | (7,423) | $(83,822) | $(167,922) |
| Class C | ||||
| Shares sold | 71,518 | 216,209 | $1,499,591 | $4,944,508 |
| Reinvestment of distributions | 15,568 | 31,721 | 341,870 | 709,279 |
| Shares redeemed | (61,233) | (130,941) | (1,257,272) | (2,958,600) |
| Net increase (decrease) | 25,853 | 116,989 | $584,189 | $2,695,187 |
| Worldwide | ||||
| Shares sold | 4,864,505 | 10,346,856 | $104,200,239 | $242,784,559 |
| Reinvestment of distributions | 2,542,668 | 6,500,654 | 57,260,887 | 148,214,908 |
| Shares redeemed | (6,730,731) | (11,769,221) | (144,609,657) | (274,209,696) |
| Net increase (decrease) | 676,442 | 5,078,289 | $16,851,469 | $116,789,771 |
| Class I | ||||
| Shares sold | 286,917 | 842,969 | $6,199,126 | $19,464,651 |
| Reinvestment of distributions | 28,687 | 64,929 | 643,439 | 1,473,244 |
| Shares redeemed | (306,329) | (584,975) | (6,392,591) | (13,709,229) |
| Net increase (decrease) | 9,275 | 322,923 | $449,974 | $7,228,666 |
11. Other.
The Fund's organizational documents provide former and current trustees and officers with a limited indemnification against liabilities arising in connection with the performance of their duties to the Fund. In the normal course of business, the Fund may also enter into contracts that provide general indemnifications. The Fund's maximum exposure under these arrangements is unknown as this would be dependent on future claims that may be made against the Fund. The risk of material loss from such claims is considered remote.
Report of Independent Registered Public Accounting Firm
To the Trustees of Fidelity Investment Trust and Shareholders of Fidelity Diversified International Fund:
We have audited the accompanying statement of assets and liabilities of Fidelity Diversified International Fund (the Fund), a fund of Fidelity Investment Trust, including the schedule of investments, as of April 30, 2016, and the related statement of operations for the six months then ended, the statement of changes in net assets for the six months ended April 30, 2016 and for the year ended October 31, 2015, and the financial highlights for the six months ended April 30, 2016 and for each of the five years in the period ended October 31, 2015. These financial statements and financial highlights are the responsibility of the Fund's management. Our responsibility is to express an opinion on these financial statements and financial highlights based on our audits.
We conducted our audits in accordance with the standards of the Public Company Accounting Oversight Board (United States). Those standards require that we plan and perform the audit to obtain reasonable assurance about whether the financial statements and financial highlights are free of material misstatement. The Fund is not required to have, nor were we engaged to perform, an audit of its internal control over financial reporting. Our audits included consideration of internal control over financial reporting as a basis for designing audit procedures that are appropriate in the circumstances, but not for the purpose of expressing an opinion on the effectiveness of the Fund's internal control over financial reporting. Accordingly, we express no such opinion. An audit also includes examining, on a test basis, evidence supporting the amounts and disclosures in the financial statements, assessing the accounting principles used and significant estimates made by management, as well as evaluating the overall financial statement presentation. Our procedures included confirmation of securities owned as of April 30, 2016, by correspondence with the custodians and brokers; when replies were not received from brokers, we performed other auditing procedures. We believe that our audits provide a reasonable basis for our opinion.
In our opinion, such financial statements and financial highlights referred to above present fairly, in all material respects, the financial position of Fidelity Diversified International Fund as of April 30, 2016, the results of its operations for the six-months then ended, the changes in its net assets for the six months ended April 30, 2016 and for the year ended October 31, 2015, and the financial highlights for the six months ended April 30, 2016 and for each of the five years in the period ended October 31, 2015, in conformity with accounting principles generally accepted in the United States of America.
DELOITTE & TOUCHE LLP
Boston, Massachusetts
June 15, 2016
Shareholder Expense Example
As a shareholder of the Fund, you incur two types of costs: (1) transaction costs, including sales charges (loads) on purchase payments or redemption proceeds, redemption fees and (2) ongoing costs, including management fees, distribution and/or service (12b-1) fees and other Fund expenses. This Example is intended to help you understand your ongoing costs (in dollars) of investing in the Fund and to compare these costs with the ongoing costs of investing in other mutual funds.
The Example is based on an investment of $1,000 invested at the beginning of the period and held for the entire period (November 1, 2015 to April 30, 2016).
Actual Expenses
The first line of the accompanying table for each class of each Fund provides information about actual account values and actual expenses. You may use the information in this line, together with the amount you invested, to estimate the expenses that you paid over the period. Simply divide your account value by $1,000.00 (for example, an $8,600 account value divided by $1,000.00 = 8.6), then multiply the result by the number in the first line for a class of the Fund under the heading entitled "Expenses Paid During Period" to estimate the expenses you paid on your account during this period. A small balance maintenance fee of $12.00 that is charged once a year may apply for certain accounts with a value of less than $2,000. This fee is not included in the table below. If it was, the estimate of expenses you paid during the period would be higher, and your ending account value lower, by this amount. In addition, the Fund, as a shareholder in the underlying Fidelity Central Funds, will indirectly bear its pro-rata share of the fees and expenses incurred by the underlying Fidelity Central Funds. These fees and expenses are not included in the Fund's annualized expense ratio used to calculate the expense estimate in the table below.
Hypothetical Example for Comparison Purposes
The second line of the accompanying table for each class of each Fund provides information about hypothetical account values and hypothetical expenses based on a Class' actual expense ratio and an assumed rate of return of 5% per year before expenses, which is not the Class' actual return. The hypothetical account values and expenses may not be used to estimate the actual ending account balance or expenses you paid for the period. You may use this information to compare the ongoing costs of investing in the Fund and other funds. To do so, compare this 5% hypothetical example with the 5% hypothetical examples that appear in the shareholder reports of the other funds. A small balance maintenance fee of $12.00 that is charged once a year may apply for certain accounts with a value of less than $2,000. This fee is not included in the table below. If it was, the estimate of expenses you paid during the period would be higher, and your ending account value lower, by this amount. In addition, the Fund, as a shareholder in the underlying Fidelity Central Funds, will indirectly bear its pro-rata share of the fees and expenses incurred by the underlying Fidelity Central Funds. These fees and expenses are not included in the Fund's annualized expense ratio used to calculate the expense estimate in the table below.
Please note that the expenses shown in the table are meant to highlight your ongoing costs only and do not reflect any transaction costs. Therefore, the second line of the table is useful in comparing ongoing costs only, and will not help you determine the relative total costs of owning different funds. In addition, if these transactional costs were included, your costs would have been higher.
| Annualized Expense Ratio-A | Beginning Account Value November 1, 2015 | Ending Account Value April 30, 2016 | Expenses Paid During Period-B November 1, 2015 to April 30, 2016 | |
| Fidelity Diversified International Fund | ||||
| Diversified International | 1.07% | |||
| Actual | $1,000.00 | $961.90 | $5.22 | |
| Hypothetical-C | $1,000.00 | $1,019.54 | $5.37 | |
| Class K | .94% | |||
| Actual | $1,000.00 | $962.60 | $4.59 | |
| Hypothetical-C | $1,000.00 | $1,020.19 | $4.72 | |
| Fidleity International Capital Appreciation Fund | ||||
| International Capital Appreciation | 1.14% | |||
| Actual | $1,000.00 | $999.90 | $5.67 | |
| Hypothetical-C | $1,000.00 | $1,019.19 | $5.72 | |
| Fidelity Overseas Fund | ||||
| Overseas | 1.04% | |||
| Actual | $1,000.00 | $986.90 | $5.14 | |
| Hypothetical-C | $1,000.00 | $1,019.69 | $5.22 | |
| Class K | .91% | |||
| Actual | $1,000.00 | $987.60 | $4.50 | |
| Hypothetical-C | $1,000.00 | $1,020.34 | $4.57 | |
| Fidelity Worldwide Fund | ||||
| Class A | 1.27% | |||
| Actual | $1,000.00 | $977.30 | $6.24 | |
| Hypothetical-C | $1,000.00 | $1,018.55 | $6.37 | |
| Class T | 1.57% | |||
| Actual | $1,000.00 | $976.20 | $7.71 | |
| Hypothetical-C | $1,000.00 | $1,017.06 | $7.87 | |
| Class B | 2.06% | |||
| Actual | $1,000.00 | $973.50 | $10.11 | |
| Hypothetical-C | $1,000.00 | $1,014.62 | $10.32 | |
| Class C | 2.06% | |||
| Actual | $1,000.00 | $973.40 | $10.11 | |
| Hypothetical-C | $1,000.00 | $1,014.62 | $10.32 | |
| Worldwide | .96% | |||
| Actual | $1,000.00 | $979.20 | $4.72 | |
| Hypothetical-C | $1,000.00 | $1,020.09 | $4.82 | |
| Class I | 1.05% | |||
| Actual | $1,000.00 | $978.30 | $5.16 | |
| Hypothetical-C | $1,000.00 | $1,019.64 | $5.27 | |
A Annualized expense ratio reflects expenses net of applicable fee waivers.
B Expenses are equal to each Class' annualized expense ratio, multiplied by the average account value over the period, multiplied by 182/ 366 (to reflect the one-half year period).
C 5% return per year before expenses
![]()
Corporate Headquarters
Boston, MA 02210
245 Summer St.
www.fidelity.com
IBD-SANN-0616
1.703569.118
Fidelity's Targeted International Equity Funds® Fidelity® Canada Fund Fidelity® China Region Fund Fidelity® Emerging Asia Fund Fidelity® Emerging Markets Fund Fidelity® Europe Fund Fidelity® Japan Fund Fidelity® Japan Smaller Companies Fund Fidelity® Latin America Fund Fidelity® Nordic Fund Fidelity® Pacific Basin Fund Semi-Annual Report April 30, 2016 |
|
Contents
To view a fund's proxy voting guidelines and proxy voting record for the 12-month period ended June 30, visit http://www.fidelity.com/proxyvotingresults or visit the Securities and Exchange Commission's (SEC) web site at http://www.sec.gov.
You may also call 1-800-544-8544 to request a free copy of the proxy voting guidelines.
Standard & Poor's, S&P and S&P 500 are registered service marks of The McGraw-Hill Companies, Inc. and have been licensed for use by Fidelity Distributors Corporation.
Other third-party marks appearing herein are the property of their respective owners.
All other marks appearing herein are registered or unregistered trademarks or service marks of FMR LLC or an affiliated company. © 2016 FMR LLC. All rights reserved.
This report and the financial statements contained herein are submitted for the general information of the shareholders of the Funds. This report is not authorized for distribution to prospective investors in the Funds unless preceded or accompanied by an effective prospectus.
A fund files its complete schedule of portfolio holdings with the SEC for the first and third quarters of each fiscal year on Form N-Q. Forms N-Q are available on the SEC’s web site at http://www.sec.gov. A fund's Forms N-Q may be reviewed and copied at the SEC’s Public Reference Room in Washington, DC. Information regarding the operation of the SEC's Public Reference Room may be obtained by calling 1-800-SEC-0330.
For a complete list of a fund's portfolio holdings, view the most recent holdings listing, semiannual report, or annual report on Fidelity's web site at http://www.fidelity.com, http://www.advisor.fidelity.com, or http://www.401k.com, as applicable.
NOT FDIC INSURED •MAY LOSE VALUE •NO BANK GUARANTEE
Neither the Funds nor Fidelity Distributors Corporation is a bank.
Fidelity® Canada Fund
Investment Summary (Unaudited)
Geographic Diversification (% of fund's net assets)
| As of April 30, 2016 | ||
| Canada | 94.1% | |
| United States of America* | 3.0% | |
| United Kingdom | 0.9% | |
| Bailiwick of Jersey | 0.8% | |
| France | 0.4% | |
| Israel | 0.3% | |
| Ireland | 0.3% | |
| Netherlands | 0.2% | |

* Includes Short-Term investments and Net Other Assets (Liabilities).
Percentages are based on country or territory of incorporation and are adjusted for the effect of futures contracts, if applicable.
| As of October 31, 2015 | ||
| Canada | 94.4% | |
| United States of America* | 3.3% | |
| United Kingdom | 0.9% | |
| Bailiwick of Jersey | 0.7% | |
| Israel | 0.3% | |
| Sweden | 0.3% | |
| Ireland | 0.1% | |

* Includes Short-Term investments and Net Other Assets (Liabilities).
Percentages are based on country or territory of incorporation and are adjusted for the effect of futures contracts, if applicable.
Asset Allocation as of April 30, 2016
| % of fund's net assets | % of fund's net assets 6 months ago | |
| Stocks | 98.0 | 97.8 |
| Short-Term Investments and Net Other Assets (Liabilities) | 2.0 | 2.2 |
Top Ten Stocks as of April 30, 2016
| % of fund's net assets | % of fund's net assets 6 months ago | |
| Royal Bank of Canada (Banks) | 10.0 | 8.9 |
| The Toronto-Dominion Bank (Banks) | 9.2 | 8.3 |
| Canadian National Railway Co. (Road & Rail) | 5.5 | 6.1 |
| Suncor Energy, Inc. (Oil, Gas & Consumable Fuels) | 5.1 | 5.7 |
| Enbridge, Inc. (Oil, Gas & Consumable Fuels) | 3.4 | 4.4 |
| Rogers Communications, Inc. Class B (non-vtg.) (Wireless Telecommunication Services) | 3.3 | 3.8 |
| TELUS Corp. (Diversified Telecommunication Services) | 3.0 | 3.9 |
| Sun Life Financial, Inc. (Insurance) | 2.9 | 4.1 |
| Power Corp. of Canada (sub. vtg.) (Insurance) | 2.6 | 2.2 |
| Bank of Nova Scotia (Banks) | 2.3 | 1.6 |
| 47.3 |
Market Sectors as of April 30, 2016
| % of fund's net assets | % of fund's net assets 6 months ago | |
| Financials | 33.3 | 33.1 |
| Energy | 20.9 | 20.7 |
| Materials | 13.8 | 10.2 |
| Consumer Staples | 8.3 | 8.7 |
| Industrials | 7.2 | 8.2 |
| Telecommunication Services | 6.5 | 7.7 |
| Information Technology | 3.8 | 3.3 |
| Consumer Discretionary | 3.1 | 2.6 |
| Health Care | 0.7 | 3.0 |
| Utilities | 0.4 | 0.3 |
Market Sectors may include more than one industry category.
The Fund may invest up to 35% of its total assets in any industry that represents more than 20% of the Canadian market. As of April 30, 2016, the Fund did not have more than 25% of its total assets invested in any one industry.
Fidelity® Canada Fund
Investments April 30, 2016 (Unaudited)
Showing Percentage of Net Assets
| Common Stocks - 98.0% | |||
| Shares | Value | ||
| CONSUMER DISCRETIONARY - 3.1% | |||
| Auto Components - 0.5% | |||
| Magna International, Inc. Class A (sub. vtg.) | 147,200 | $6,182,705 | |
| Hotels, Restaurants & Leisure - 0.2% | |||
| Cara Operations Ltd. | 106,400 | 2,752,645 | |
| Media - 1.4% | |||
| Corus Entertainment, Inc. Class B (non-vtg.) | 501,600 | 5,001,208 | |
| DHX Media Ltd. | 773,000 | 4,713,039 | |
| Quebecor, Inc. Class B (sub. vtg.) | 331,500 | 8,866,773 | |
| 18,581,020 | |||
| Specialty Retail - 0.3% | |||
| AutoCanada, Inc. (a) | 204,700 | 3,349,399 | |
| Textiles, Apparel & Luxury Goods - 0.7% | |||
| Gildan Activewear, Inc. | 298,790 | 9,280,184 | |
| TOTAL CONSUMER DISCRETIONARY | 40,145,953 | ||
| CONSUMER STAPLES - 8.3% | |||
| Beverages - 0.5% | |||
| Molson Coors Brewing Co. Class B | 60,600 | 5,795,178 | |
| Food & Staples Retailing - 6.8% | |||
| Alimentation Couche-Tard, Inc. Class B (sub. vtg.) | 540,800 | 23,706,065 | |
| George Weston Ltd. | 333,900 | 28,975,079 | |
| Jean Coutu Group, Inc. Class A (sub. vtg.) | 496,900 | 7,556,270 | |
| Metro, Inc. Class A (sub. vtg.) | 471,795 | 15,789,170 | |
| North West Co., Inc. | 507,200 | 11,274,255 | |
| 87,300,839 | |||
| Food Products - 0.3% | |||
| AGT Food & Ingredients, Inc. | 121,700 | 3,934,129 | |
| Personal Products - 0.2% | |||
| Edgewell Personal Care Co. (b) | 38,900 | 3,192,523 | |
| Tobacco - 0.5% | |||
| Imperial Tobacco Group PLC | 109,910 | 5,971,725 | |
| TOTAL CONSUMER STAPLES | 106,194,394 | ||
| ENERGY - 20.9% | |||
| Energy Equipment & Services - 1.4% | |||
| Canadian Energy Services & Technology Corp. | 1,930,100 | 5,891,674 | |
| Pason Systems, Inc. | 390,300 | 5,673,924 | |
| ZCL Composites, Inc. | 968,300 | 6,359,123 | |
| 17,924,721 | |||
| Oil, Gas & Consumable Fuels - 19.5% | |||
| ARC Resources Ltd. (a) | 748,000 | 12,620,674 | |
| Canadian Natural Resources Ltd. | 724,198 | 21,748,450 | |
| Cenovus Energy, Inc. | 1,329,400 | 21,074,174 | |
| Enbridge, Inc. | 1,057,200 | 43,915,887 | |
| Imperial Oil Ltd. | 637,700 | 21,148,240 | |
| Keyera Corp. (a) | 239,704 | 7,720,123 | |
| Painted Pony Petroleum Ltd. (b) | 825,000 | 3,892,564 | |
| Paramount Resources Ltd. Class A (a)(b) | 385,100 | 2,802,234 | |
| Parkland Fuel Corp. | 341,700 | 6,517,001 | |
| Peyto Exploration & Development Corp. | 385,600 | 9,843,602 | |
| PrairieSky Royalty Ltd. | 601,629 | 12,668,397 | |
| Raging River Exploration, Inc. (b) | 821,400 | 6,657,877 | |
| Spartan Energy Corp. (b) | 2,605,300 | 5,959,362 | |
| Suncor Energy, Inc. | 2,250,000 | 66,045,668 | |
| Whitecap Resources, Inc. | 1,051,500 | 7,886,040 | |
| 250,500,293 | |||
| TOTAL ENERGY | 268,425,014 | ||
| FINANCIALS - 33.3% | |||
| Banks - 21.5% | |||
| Bank of Nova Scotia | 559,100 | 29,320,778 | |
| Royal Bank of Canada | 2,075,800 | 128,912,361 | |
| The Toronto-Dominion Bank | 2,643,500 | 117,669,144 | |
| 275,902,283 | |||
| Capital Markets - 1.0% | |||
| Amundi SA | 103,800 | 4,776,830 | |
| Ashmore Group PLC (a) | 1,186,200 | 5,322,707 | |
| Uranium Participation Corp. (b) | 624,800 | 2,300,611 | |
| 12,400,148 | |||
| Insurance - 9.2% | |||
| Fairfax Financial Holdings Ltd. (sub. vtg.) | 29,600 | 15,865,147 | |
| Intact Financial Corp. | 295,625 | 21,876,768 | |
| Manulife Financial Corp. | 724,500 | 10,682,434 | |
| Power Corp. of Canada (sub. vtg.) | 1,347,500 | 32,745,098 | |
| Sun Life Financial, Inc. | 1,099,400 | 37,502,447 | |
| 118,671,894 | |||
| Real Estate Investment Trusts - 1.6% | |||
| Allied Properties (REIT) | 382,300 | 10,770,945 | |
| H&R REIT/H&R Finance Trust | 604,700 | 10,564,297 | |
| 21,335,242 | |||
| TOTAL FINANCIALS | 428,309,567 | ||
| HEALTH CARE - 0.7% | |||
| Pharmaceuticals - 0.7% | |||
| Teva Pharmaceutical Industries Ltd. sponsored ADR | 82,400 | 4,486,680 | |
| Valeant Pharmaceuticals International, Inc. (Canada) (b) | 148,921 | 4,968,004 | |
| 9,454,684 | |||
| INDUSTRIALS - 7.2% | |||
| Airlines - 0.5% | |||
| WestJet Airlines Ltd. | 361,700 | 6,053,798 | |
| Professional Services - 0.6% | |||
| Stantec, Inc. | 282,200 | 7,233,245 | |
| Stantec, Inc. ADR | 52,700 | 1,342,806 | |
| 8,576,051 | |||
| Road & Rail - 6.1% | |||
| Canadian National Railway Co. | 1,146,800 | 70,615,899 | |
| TransForce, Inc. | 415,100 | 7,834,198 | |
| 78,450,097 | |||
| TOTAL INDUSTRIALS | 93,079,946 | ||
| INFORMATION TECHNOLOGY - 3.8% | |||
| Electronic Equipment & Components - 0.2% | |||
| Avigilon Corp. (a)(b) | 213,600 | 2,744,267 | |
| IT Services - 1.4% | |||
| CGI Group, Inc. Class A (sub. vtg.) (b) | 396,300 | 18,104,659 | |
| Software - 2.2% | |||
| Constellation Software, Inc. | 35,500 | 13,873,492 | |
| Open Text Corp. | 257,814 | 14,434,872 | |
| 28,308,364 | |||
| TOTAL INFORMATION TECHNOLOGY | 49,157,290 | ||
| MATERIALS - 13.8% | |||
| Chemicals - 2.2% | |||
| Agrium, Inc. | 213,900 | 18,432,189 | |
| LyondellBasell Industries NV Class A | 28,800 | 2,380,896 | |
| Monsanto Co. | 39,100 | 3,662,888 | |
| Potash Corp. of Saskatchewan, Inc. | 203,600 | 3,602,391 | |
| 28,078,364 | |||
| Construction Materials - 0.3% | |||
| CRH PLC | 139,700 | 4,065,676 | |
| Containers & Packaging - 1.2% | |||
| CCL Industries, Inc. Class B | 62,600 | 11,462,780 | |
| Winpak Ltd. | 113,500 | 3,916,008 | |
| 15,378,788 | |||
| Metals & Mining - 9.5% | |||
| Agnico Eagle Mines Ltd. (Canada) | 418,700 | 19,792,059 | |
| Continental Gold, Inc. (b) | 1,142,500 | 2,522,296 | |
| Franco-Nevada Corp. | 83,300 | 5,848,992 | |
| Goldcorp, Inc. | 1,301,500 | 26,222,938 | |
| Labrador Iron Ore Royalty Corp. (a) | 368,800 | 4,320,842 | |
| Lundin Mining Corp. (b) | 2,504,500 | 9,840,747 | |
| Randgold Resources Ltd. | 102,964 | 10,284,896 | |
| Silver Wheaton Corp. | 853,200 | 17,877,284 | |
| Tahoe Resources, Inc. | 759,900 | 10,731,990 | |
| Teck Resources Ltd. Class B (sub. vtg.) | 654,800 | 8,016,042 | |
| Torex Gold Resources, Inc. (b) | 3,556,100 | 6,320,318 | |
| 121,778,404 | |||
| Paper & Forest Products - 0.6% | |||
| Stella-Jones, Inc. | 109,300 | 4,178,785 | |
| Western Forest Products, Inc. | 1,809,500 | 3,244,899 | |
| 7,423,684 | |||
| TOTAL MATERIALS | 176,724,916 | ||
| TELECOMMUNICATION SERVICES - 6.5% | |||
| Diversified Telecommunication Services - 3.2% | |||
| Manitoba Telecom Services, Inc. | 96,500 | 2,525,751 | |
| TELUS Corp. | 1,216,300 | 38,562,536 | |
| 41,088,287 | |||
| Wireless Telecommunication Services - 3.3% | |||
| Rogers Communications, Inc. Class B (non-vtg.) | 1,099,400 | 42,759,799 | |
| TOTAL TELECOMMUNICATION SERVICES | 83,848,086 | ||
| UTILITIES - 0.4% | |||
| Electric Utilities - 0.4% | |||
| Hydro One Ltd. | 244,600 | 4,592,951 | |
| TOTAL COMMON STOCKS | |||
| (Cost $1,011,771,553) | 1,259,932,801 | ||
| Money Market Funds - 2.4% | |||
| Fidelity Cash Central Fund, 0.38% (c) | 20,320,612 | 20,320,612 | |
| Fidelity Securities Lending Cash Central Fund, 0.42% (c)(d) | 10,341,617 | 10,341,617 | |
| TOTAL MONEY MARKET FUNDS | |||
| (Cost $30,662,229) | 30,662,229 | ||
| TOTAL INVESTMENT PORTFOLIO - 100.4% | |||
| (Cost $1,042,433,782) | 1,290,595,030 | ||
| NET OTHER ASSETS (LIABILITIES) - (0.4)% | (4,985,358) | ||
| NET ASSETS - 100% | $1,285,609,672 |
Legend
(a) Security or a portion of the security is on loan at period end.
(b) Non-income producing
(c) Affiliated fund that is generally available only to investment companies and other accounts managed by Fidelity Investments. The rate quoted is the annualized seven-day yield of the fund at period end. A complete unaudited listing of the fund's holdings as of its most recent quarter end is available upon request. In addition, each Fidelity Central Fund's financial statements are available on the SEC's website or upon request.
(d) Investment made with cash collateral received from securities on loan.
Affiliated Central Funds
Information regarding fiscal year to date income earned by the Fund from investments in Fidelity Central Funds is as follows:
| Fund | Income earned |
| Fidelity Cash Central Fund | $43,503 |
| Fidelity Securities Lending Cash Central Fund | 952,909 |
| Total | $996,412 |
Investment Valuation
The following is a summary of the inputs used, as of April 30, 2016, involving the Fund's assets and liabilities carried at fair value. The inputs or methodology used for valuing securities may not be an indication of the risk associated with investing in those securities. For more information on valuation inputs, and their aggregation into the levels used below, please refer to the Investment Valuation section in the accompanying Notes to Financial Statements.
| Valuation Inputs at Reporting Date: | ||||
| Description | Total | Level 1 | Level 2 | Level 3 |
| Investments in Securities: | ||||
| Equities: | ||||
| Consumer Discretionary | $40,145,953 | $40,145,953 | $-- | $-- |
| Consumer Staples | 106,194,394 | 106,194,394 | -- | -- |
| Energy | 268,425,014 | 268,425,014 | -- | -- |
| Financials | 428,309,567 | 428,309,567 | -- | -- |
| Health Care | 9,454,684 | 9,454,684 | -- | -- |
| Industrials | 93,079,946 | 93,079,946 | -- | -- |
| Information Technology | 49,157,290 | 49,157,290 | -- | -- |
| Materials | 176,724,916 | 162,374,344 | 14,350,572 | -- |
| Telecommunication Services | 83,848,086 | 83,848,086 | -- | -- |
| Utilities | 4,592,951 | 4,592,951 | -- | -- |
| Money Market Funds | 30,662,229 | 30,662,229 | -- | -- |
| Total Investments in Securities: | $1,290,595,030 | $1,276,244,458 | $14,350,572 | $-- |
See accompanying notes which are an integral part of the financial statements.
Fidelity® Canada Fund
Financial Statements
Statement of Assets and Liabilities
| April 30, 2016 (Unaudited) | ||
| Assets | ||
| Investment in securities, at value (including securities loaned of $9,857,677) — See accompanying schedule: Unaffiliated issuers (cost $1,011,771,553) | $1,259,932,801 | |
| Fidelity Central Funds (cost $30,662,229) | 30,662,229 | |
| Total Investments (cost $1,042,433,782) | $1,290,595,030 | |
| Foreign currency held at value (cost $40,845) | 40,845 | |
| Receivable for investments sold | 14,117,371 | |
| Receivable for fund shares sold | 683,671 | |
| Dividends receivable | 2,510,752 | |
| Distributions receivable from Fidelity Central Funds | 195,666 | |
| Prepaid expenses | 1,745 | |
| Other receivables | 3,103 | |
| Total assets | 1,308,148,183 | |
| Liabilities | ||
| Payable for investments purchased | $7,933,946 | |
| Payable for fund shares redeemed | 3,028,172 | |
| Accrued management fee | 878,006 | |
| Distribution and service plan fees payable | 32,252 | |
| Other affiliated payables | 283,687 | |
| Other payables and accrued expenses | 40,831 | |
| Collateral on securities loaned, at value | 10,341,617 | |
| Total liabilities | 22,538,511 | |
| Net Assets | $1,285,609,672 | |
| Net Assets consist of: | ||
| Paid in capital | $1,082,592,424 | |
| Undistributed net investment income | 5,545,722 | |
| Accumulated undistributed net realized gain (loss) on investments and foreign currency transactions | (50,751,002) | |
| Net unrealized appreciation (depreciation) on investments and assets and liabilities in foreign currencies | 248,222,528 | |
| Net Assets | $1,285,609,672 | |
| Calculation of Maximum Offering Price | ||
| Class A: | ||
| Net Asset Value and redemption price per share ($47,435,581 ÷ 993,715 shares) | $47.74 | |
| Maximum offering price per share (100/94.25 of $47.74) | $50.65 | |
| Class T: | ||
| Net Asset Value and redemption price per share ($11,413,979 ÷ 240,120 shares) | $47.53 | |
| Maximum offering price per share (100/96.50 of $47.53) | $49.25 | |
| Class B: | ||
| Net Asset Value and offering price per share ($2,218,869 ÷ 47,287 shares)(a) | $46.92 | |
| Class C: | ||
| Net Asset Value and offering price per share ($19,909,120 ÷ 426,363 shares)(a) | $46.70 | |
| Canada: | ||
| Net Asset Value, offering price and redemption price per share ($1,195,964,152 ÷ 24,956,980 shares) | $47.92 | |
| Class I: | ||
| Net Asset Value, offering price and redemption price per share ($8,667,971 ÷ 181,174 shares) | $47.84 |
(a) Redemption price per share is equal to net asset value less any applicable contingent deferred sales charge.
See accompanying notes which are an integral part of the financial statements.
Statement of Operations
| Six months ended April 30, 2016 (Unaudited) | ||
| Investment Income | ||
| Dividends | $17,965,445 | |
| Interest | 40 | |
| Income from Fidelity Central Funds (including $952,909 from security lending) | 996,412 | |
| Income before foreign taxes withheld | 18,961,897 | |
| Less foreign taxes withheld | (2,585,887) | |
| Total income | 16,376,010 | |
| Expenses | ||
| Management fee | ||
| Basic fee | $4,221,805 | |
| Performance adjustment | 1,593,391 | |
| Transfer agent fees | 1,437,412 | |
| Distribution and service plan fees | 189,908 | |
| Accounting and security lending fees | 281,330 | |
| Custodian fees and expenses | 11,972 | |
| Independent trustees' compensation | 2,724 | |
| Registration fees | 66,487 | |
| Audit | 39,975 | |
| Legal | 2,162 | |
| Miscellaneous | 4,401 | |
| Total expenses before reductions | 7,851,567 | |
| Expense reductions | (9,373) | 7,842,194 |
| Net investment income (loss) | 8,533,816 | |
| Realized and Unrealized Gain (Loss) | ||
| Net realized gain (loss) on: | ||
| Investment securities: | ||
| Unaffiliated issuers | (38,078,868) | |
| Foreign currency transactions | (188,472) | |
| Total net realized gain (loss) | (38,267,340) | |
| Change in net unrealized appreciation (depreciation) on: Investment securities | 98,783,700 | |
| Assets and liabilities in foreign currencies | 77,536 | |
| Total change in net unrealized appreciation (depreciation) | 98,861,236 | |
| Net gain (loss) | 60,593,896 | |
| Net increase (decrease) in net assets resulting from operations | $69,127,712 |
See accompanying notes which are an integral part of the financial statements.
Statement of Changes in Net Assets
| Six months ended April 30, 2016 (Unaudited) | Year ended October 31, 2015 | |
| Increase (Decrease) in Net Assets | ||
| Operations | ||
| Net investment income (loss) | $8,533,816 | $20,629,341 |
| Net realized gain (loss) | (38,267,340) | (6,996,196) |
| Change in net unrealized appreciation (depreciation) | 98,861,236 | (283,157,405) |
| Net increase (decrease) in net assets resulting from operations | 69,127,712 | (269,524,260) |
| Distributions to shareholders from net investment income | (17,462,078) | (24,029,674) |
| Distributions to shareholders from net realized gain | (1,771,774) | (262,730,704) |
| Total distributions | (19,233,852) | (286,760,378) |
| Share transactions - net increase (decrease) | (154,046,279) | (304,156,881) |
| Redemption fees | 34,509 | 128,345 |
| Total increase (decrease) in net assets | (104,117,910) | (860,313,174) |
| Net Assets | ||
| Beginning of period | 1,389,727,582 | 2,250,040,756 |
| End of period (including undistributed net investment income of $5,545,722 and undistributed net investment income of $14,473,984, respectively) | $1,285,609,672 | $1,389,727,582 |
See accompanying notes which are an integral part of the financial statements.
Financial Highlights — Fidelity Canada Fund Class A
| Six months ended (Unaudited) April 30, | Years ended October 31, | |||||
| 2016 | 2015 | 2014 | 2013 | 2012 | 2011 | |
| Selected Per–Share Data | ||||||
| Net asset value, beginning of period | $45.25 | $60.56 | $57.31 | $53.65 | $52.20 | $53.81 |
| Income from Investment Operations | ||||||
| Net investment income (loss)A | .24 | .45 | .47 | .60 | .57 | .34 |
| Net realized and unrealized gain (loss) | 2.73 | (8.04) | 3.13 | 3.63 | 1.50 | (1.17) |
| Total from investment operations | 2.97 | (7.59) | 3.60 | 4.23 | 2.07 | (.83) |
| Distributions from net investment income | (.42) | (.50) | (.03) | (.57) | (.33) | (.35) |
| Distributions from net realized gain | (.06) | (7.22) | (.32) | – | (.29) | (.44) |
| Total distributions | (.48) | (7.72) | (.35) | (.57) | (.62) | (.79) |
| Redemption fees added to paid in capitalA | –B | –B | –B | –B | –B | .01 |
| Net asset value, end of period | $47.74 | $45.25 | $60.56 | $57.31 | $53.65 | $52.20 |
| Total ReturnC,D,E | 6.66% | (14.32)% | 6.32% | 7.98% | 4.04% | (1.64)% |
| Ratios to Average Net AssetsF,G | ||||||
| Expenses before reductions | 1.57%H | 1.43% | 1.29% | 1.19% | 1.08% | 1.12% |
| Expenses net of fee waivers, if any | 1.57%H | 1.43% | 1.29% | 1.19% | 1.08% | 1.12% |
| Expenses net of all reductions | 1.57%H | 1.43% | 1.29% | 1.18% | 1.08% | 1.12% |
| Net investment income (loss) | 1.14%H | .90% | .79% | 1.11% | 1.11% | .59% |
| Supplemental Data | ||||||
| Net assets, end of period (000 omitted) | $47,436 | $58,286 | $95,004 | $116,661 | $159,597 | $215,369 |
| Portfolio turnover rateI | 37%H | 24% | 85% | 64% | 86% | 104% |
A Calculated based on average shares outstanding during the period.
B Amount represents less than $.005 per share.
C Total returns for periods of less than one year are not annualized.
D Total returns would have been lower if certain expenses had not been reduced during the applicable periods shown.
E Total returns do not include the effect of the sales charges.
F Fees and expenses of any underlying Fidelity Central Funds are not included in the Fund's expense ratio. The Fund indirectly bears its proportionate share of the expenses of any underlying Fidelity Central Funds.
G Expense ratios reflect operating expenses of the class. Expenses before reductions do not reflect amounts reimbursed by the investment adviser or reductions from brokerage service arrangements or reductions from other expense offset arrangements and do not represent the amount paid by the class during periods when reimbursements or reductions occur. Expenses net of fee waivers reflect expenses after reimbursement by the investment adviser but prior to reductions from brokerage service arrangements or other expense offset arrangements. Expenses net of all reductions represent the net expenses paid by the class.
H Annualized
I Amount does not include the portfolio activity of any underlying Fidelity Central Funds.
See accompanying notes which are an integral part of the financial statements.
Financial Highlights — Fidelity Canada Fund Class T
| Six months ended (Unaudited) April 30, | Years ended October 31, | |||||
| 2016 | 2015 | 2014 | 2013 | 2012 | 2011 | |
| Selected Per–Share Data | ||||||
| Net asset value, beginning of period | $44.99 | $60.22 | $57.14 | $53.48 | $52.01 | $53.64 |
| Income from Investment Operations | ||||||
| Net investment income (loss)A | .18 | .29 | .29 | .45 | .43 | .17 |
| Net realized and unrealized gain (loss) | 2.71 | (8.00) | 3.11 | 3.63 | 1.49 | (1.16) |
| Total from investment operations | 2.89 | (7.71) | 3.40 | 4.08 | 1.92 | (.99) |
| Distributions from net investment income | (.29) | (.30) | – | (.42) | (.16) | (.21) |
| Distributions from net realized gain | (.06) | (7.22) | (.32) | – | (.29) | (.44) |
| Total distributions | (.35) | (7.52) | (.32) | (.42) | (.45) | (.65) |
| Redemption fees added to paid in capitalA | –B | –B | –B | –B | –B | .01 |
| Net asset value, end of period | $47.53 | $44.99 | $60.22 | $57.14 | $53.48 | $52.01 |
| Total ReturnC,D,E | 6.49% | (14.58)% | 5.99% | 7.69% | 3.74% | (1.93)% |
| Ratios to Average Net AssetsF,G | ||||||
| Expenses before reductions | 1.85%H | 1.75% | 1.59% | 1.47% | 1.36% | 1.42% |
| Expenses net of fee waivers, if any | 1.85%H | 1.75% | 1.59% | 1.47% | 1.36% | 1.42% |
| Expenses net of all reductions | 1.85%H | 1.75% | 1.59% | 1.46% | 1.36% | 1.42% |
| Net investment income (loss) | .86%H | .58% | .48% | .83% | .83% | .30% |
| Supplemental Data | ||||||
| Net assets, end of period (000 omitted) | $11,414 | $12,820 | $21,989 | $23,751 | $29,626 | $34,323 |
| Portfolio turnover rateI | 37%H | 24% | 85% | 64% | 86% | 104% |
A Calculated based on average shares outstanding during the period.
B Amount represents less than $.005 per share.
C Total returns for periods of less than one year are not annualized.
D Total returns would have been lower if certain expenses had not been reduced during the applicable periods shown.
E Total returns do not include the effect of the sales charges.
F Fees and expenses of any underlying Fidelity Central Funds are not included in the Fund's expense ratio. The Fund indirectly bears its proportionate share of the expenses of any underlying Fidelity Central Funds.
G Expense ratios reflect operating expenses of the class. Expenses before reductions do not reflect amounts reimbursed by the investment adviser or reductions from brokerage service arrangements or reductions from other expense offset arrangements and do not represent the amount paid by the class during periods when reimbursements or reductions occur. Expenses net of fee waivers reflect expenses after reimbursement by the investment adviser but prior to reductions from brokerage service arrangements or other expense offset arrangements. Expenses net of all reductions represent the net expenses paid by the class.
H Annualized
I Amount does not include the portfolio activity of any underlying Fidelity Central Funds.
See accompanying notes which are an integral part of the financial statements.
Financial Highlights — Fidelity Canada Fund Class B
| Six months ended (Unaudited) April 30, | Years ended October 31, | |||||
| 2016 | 2015 | 2014 | 2013 | 2012 | 2011 | |
| Selected Per–Share Data | ||||||
| Net asset value, beginning of period | $44.22 | $59.27 | $56.53 | $52.89 | $51.37 | $53.03 |
| Income from Investment Operations | ||||||
| Net investment income (loss)A | .08 | .05 | (.01) | .18 | .17 | (.11) |
| Net realized and unrealized gain (loss) | 2.68 | (7.88) | 3.07 | 3.60 | 1.49 | (1.14) |
| Total from investment operations | 2.76 | (7.83) | 3.06 | 3.78 | 1.66 | (1.25) |
| Distributions from net investment income | – | – | – | (.14) | – | (.01) |
| Distributions from net realized gain | (.06) | (7.22) | (.32) | – | (.14) | (.41) |
| Total distributions | (.06) | (7.22) | (.32) | (.14) | (.14) | (.42) |
| Redemption fees added to paid in capitalA | –B | –B | –B | –B | –B | .01 |
| Net asset value, end of period | $46.92 | $44.22 | $59.27 | $56.53 | $52.89 | $51.37 |
| Total ReturnC,D,E | 6.25% | (14.99)% | 5.45% | 7.17% | 3.25% | (2.41)% |
| Ratios to Average Net AssetsF,G | ||||||
| Expenses before reductions | 2.33%H | 2.22% | 2.09% | 1.96% | 1.85% | 1.91% |
| Expenses net of fee waivers, if any | 2.33%H | 2.22% | 2.09% | 1.96% | 1.85% | 1.91% |
| Expenses net of all reductions | 2.33%H | 2.22% | 2.09% | 1.95% | 1.85% | 1.91% |
| Net investment income (loss) | .38%H | .11% | (.01)% | .34% | .34% | (.20)% |
| Supplemental Data | ||||||
| Net assets, end of period (000 omitted) | $2,219 | $2,678 | $6,290 | $7,737 | $9,804 | $11,866 |
| Portfolio turnover rateI | 37%H | 24% | 85% | 64% | 86% | 104% |
A Calculated based on average shares outstanding during the period.
B Amount represents less than $.005 per share.
C Total returns for periods of less than one year are not annualized.
D Total returns would have been lower if certain expenses had not been reduced during the applicable periods shown.
E Total returns do not include the effect of the contingent deferred sales charge.
F Fees and expenses of any underlying Fidelity Central Funds are not included in the Fund's expense ratio. The Fund indirectly bears its proportionate share of the expenses of any underlying Fidelity Central Funds.
G Expense ratios reflect operating expenses of the class. Expenses before reductions do not reflect amounts reimbursed by the investment adviser or reductions from brokerage service arrangements or reductions from other expense offset arrangements and do not represent the amount paid by the class during periods when reimbursements or reductions occur. Expenses net of fee waivers reflect expenses after reimbursement by the investment adviser but prior to reductions from brokerage service arrangements or other expense offset arrangements. Expenses net of all reductions represent the net expenses paid by the class.
H Annualized
I Amount does not include the portfolio activity of any underlying Fidelity Central Funds.
See accompanying notes which are an integral part of the financial statements.
Financial Highlights — Fidelity Canada Fund Class C
| Six months ended (Unaudited) April 30, | Years ended October 31, | |||||
| 2016 | 2015 | 2014 | 2013 | 2012 | 2011 | |
| Selected Per–Share Data | ||||||
| Net asset value, beginning of period | $44.02 | $59.04 | $56.27 | $52.61 | $51.19 | $52.87 |
| Income from Investment Operations | ||||||
| Net investment income (loss)A | .09 | .07 | .02 | .20 | .19 | (.08) |
| Net realized and unrealized gain (loss) | 2.67 | (7.85) | 3.07 | 3.58 | 1.46 | (1.14) |
| Total from investment operations | 2.76 | (7.78) | 3.09 | 3.78 | 1.65 | (1.22) |
| Distributions from net investment income | (.02) | (.02) | – | (.12) | – | (.03) |
| Distributions from net realized gain | (.06) | (7.22) | (.32) | – | (.23) | (.44) |
| Total distributions | (.08) | (7.24) | (.32) | (.12) | (.23) | (.47) |
| Redemption fees added to paid in capitalA | –B | –B | –B | –B | –B | .01 |
| Net asset value, end of period | $46.70 | $44.02 | $59.04 | $56.27 | $52.61 | $51.19 |
| Total ReturnC,D,E | 6.28% | (14.96)% | 5.53% | 7.21% | 3.26% | (2.36)% |
| Ratios to Average Net AssetsF,G | ||||||
| Expenses before reductions | 2.30%H | 2.19% | 2.03% | 1.93% | 1.82% | 1.86% |
| Expenses net of fee waivers, if any | 2.30%H | 2.19% | 2.03% | 1.92% | 1.82% | 1.86% |
| Expenses net of all reductions | 2.29%H | 2.18% | 2.03% | 1.92% | 1.82% | 1.86% |
| Net investment income (loss) | .41%H | .14% | .04% | .37% | .37% | (.15)% |
| Supplemental Data | ||||||
| Net assets, end of period (000 omitted) | $19,909 | $21,610 | $38,749 | $46,040 | $66,500 | $87,990 |
| Portfolio turnover rateI | 37%H | 24% | 85% | 64% | 86% | 104% |
A Calculated based on average shares outstanding during the period.
B Amount represents less than $.005 per share.
C Total returns for periods of less than one year are not annualized.
D Total returns would have been lower if certain expenses had not been reduced during the applicable periods shown.
E Total returns do not include the effect of the contingent deferred sales charge.
F Fees and expenses of any underlying Fidelity Central Funds are not included in the Fund's expense ratio. The Fund indirectly bears its proportionate share of the expenses of any underlying Fidelity Central Funds.
G Expense ratios reflect operating expenses of the class. Expenses before reductions do not reflect amounts reimbursed by the investment adviser or reductions from brokerage service arrangements or reductions from other expense offset arrangements and do not represent the amount paid by the class during periods when reimbursements or reductions occur. Expenses net of fee waivers reflect expenses after reimbursement by the investment adviser but prior to reductions from brokerage service arrangements or other expense offset arrangements. Expenses net of all reductions represent the net expenses paid by the class.
H Annualized
I Amount does not include the portfolio activity of any underlying Fidelity Central Funds.
See accompanying notes which are an integral part of the financial statements.
Financial Highlights — Fidelity Canada Fund
| Six months ended (Unaudited) April 30, | Years ended October 31, | |||||
| 2016 | 2015 | 2014 | 2013 | 2012 | 2011 | |
| Selected Per–Share Data | ||||||
| Net asset value, beginning of period | $45.55 | $60.95 | $57.72 | $54.05 | $52.59 | $54.14 |
| Income from Investment Operations | ||||||
| Net investment income (loss)A | .31 | .60 | .66 | .77 | .73 | .52 |
| Net realized and unrealized gain (loss) | 2.73 | (8.09) | 3.13 | 3.66 | 1.51 | (1.18) |
| Total from investment operations | 3.04 | (7.49) | 3.79 | 4.43 | 2.24 | (.66) |
| Distributions from net investment income | (.61) | (.69) | (.24) | (.76) | (.49) | (.46) |
| Distributions from net realized gain | (.06) | (7.22) | (.32) | – | (.29) | (.44) |
| Total distributions | (.67) | (7.91) | (.56) | (.76) | (.78) | (.90) |
| Redemption fees added to paid in capitalA | –B | –B | –B | –B | –B | .01 |
| Net asset value, end of period | $47.92 | $45.55 | $60.95 | $57.72 | $54.05 | $52.59 |
| Total ReturnC,D | 6.83% | (14.08)% | 6.64% | 8.32% | 4.36% | (1.33)% |
| Ratios to Average Net AssetsE,F | ||||||
| Expenses before reductions | 1.26%G | 1.15% | .98% | .87% | .77% | .82% |
| Expenses net of fee waivers, if any | 1.26%G | 1.15% | .98% | .87% | .77% | .82% |
| Expenses net of all reductions | 1.26%G | 1.14% | .98% | .86% | .77% | .82% |
| Net investment income (loss) | 1.45%G | 1.18% | 1.09% | 1.42% | 1.42% | .90% |
| Supplemental Data | ||||||
| Net assets, end of period (000 omitted) | $1,195,964 | $1,279,488 | $2,057,843 | $2,262,380 | $2,992,597 | $3,778,765 |
| Portfolio turnover rateH | 37%G | 24% | 85% | 64% | 86% | 104% |
A Calculated based on average shares outstanding during the period.
B Amount represents less than $.005 per share.
C Total returns for periods of less than one year are not annualized.
D Total returns would have been lower if certain expenses had not been reduced during the applicable periods shown.
E Fees and expenses of any underlying Fidelity Central Funds are not included in the Fund's expense ratio. The Fund indirectly bears its proportionate share of the expenses of any underlying Fidelity Central Funds.
F Expense ratios reflect operating expenses of the class. Expenses before reductions do not reflect amounts reimbursed by the investment adviser or reductions from brokerage service arrangements or reductions from other expense offset arrangements and do not represent the amount paid by the class during periods when reimbursements or reductions occur. Expenses net of fee waivers reflect expenses after reimbursement by the investment adviser but prior to reductions from brokerage service arrangements or other expense offset arrangements. Expenses net of all reductions represent the net expenses paid by the class.
G Annualized
H Amount does not include the portfolio activity of any underlying Fidelity Central Funds.
See accompanying notes which are an integral part of the financial statements.
Financial Highlights — Fidelity Canada Fund Class I
| Six months ended (Unaudited) April 30, | Years ended October 31, | |||||
| 2016 | 2015 | 2014 | 2013 | 2012 | 2011 | |
| Selected Per–Share Data | ||||||
| Net asset value, beginning of period | $45.44 | $60.80 | $57.57 | $53.91 | $52.44 | $54.02 |
| Income from Investment Operations | ||||||
| Net investment income (loss)A | .32 | .61 | .65 | .78 | .74 | .51 |
| Net realized and unrealized gain (loss) | 2.73 | (8.07) | 3.12 | 3.64 | 1.50 | (1.18) |
| Total from investment operations | 3.05 | (7.46) | 3.77 | 4.42 | 2.24 | (.67) |
| Distributions from net investment income | (.59) | (.68) | (.22) | (.76) | (.48) | (.48) |
| Distributions from net realized gain | (.06) | (7.22) | (.32) | – | (.29) | (.44) |
| Total distributions | (.65) | (7.90) | (.54) | (.76) | (.77) | (.92) |
| Redemption fees added to paid in capitalA | –B | –B | –B | –B | –B | .01 |
| Net asset value, end of period | $47.84 | $45.44 | $60.80 | $57.57 | $53.91 | $52.44 |
| Total ReturnC,D | 6.85% | (14.05)% | 6.62% | 8.34% | 4.38% | (1.35)% |
| Ratios to Average Net AssetsE,F | ||||||
| Expenses before reductions | 1.21%G | 1.13% | 1.00% | .86% | .76% | .82% |
| Expenses net of fee waivers, if any | 1.21%G | 1.12% | 1.00% | .86% | .76% | .82% |
| Expenses net of all reductions | 1.21%G | 1.12% | 1.00% | .85% | .76% | .82% |
| Net investment income (loss) | 1.50%G | 1.21% | 1.08% | 1.43% | 1.42% | .89% |
| Supplemental Data | ||||||
| Net assets, end of period (000 omitted) | $8,668 | $14,846 | $30,165 | $30,831 | $59,245 | $68,112 |
| Portfolio turnover rateH | 37%G | 24% | 85% | 64% | 86% | 104% |
A Calculated based on average shares outstanding during the period.
B Amount represents less than $.005 per share.
C Total returns for periods of less than one year are not annualized.
D Total returns would have been lower if certain expenses had not been reduced during the applicable periods shown.
E Fees and expenses of any underlying Fidelity Central Funds are not included in the Fund's expense ratio. The Fund indirectly bears its proportionate share of the expenses of any underlying Fidelity Central Funds.
F Expense ratios reflect operating expenses of the class. Expenses before reductions do not reflect amounts reimbursed by the investment adviser or reductions from brokerage service arrangements or reductions from other expense offset arrangements and do not represent the amount paid by the class during periods when reimbursements or reductions occur. Expenses net of fee waivers reflect expenses after reimbursement by the investment adviser but prior to reductions from brokerage service arrangements or other expense offset arrangements. Expenses net of all reductions represent the net expenses paid by the class.
G Annualized
H Amount does not include the portfolio activity of any underlying Fidelity Central Funds.
See accompanying notes which are an integral part of the financial statements.
Notes to Financial Statements (Unaudited)
For the period ended April 30, 2016
1. Organization.
Fidelity Canada Fund (the Fund) is a fund of Fidelity Investment Trust (the Trust) and is authorized to issue an unlimited number of shares. The Trust is registered under the Investment Company Act of 1940, as amended (the 1940 Act), as an open-end management investment company organized as a Massachusetts business trust. The Fund offers Class A, Class T, Class C, Canada and Class I shares, each of which, along with Class B shares, has equal rights as to assets and voting privileges. Class B shares are closed to new accounts and additional purchases, except for exchanges and reinvestments. Each class has exclusive voting rights with respect to matters that affect that class. Class B shares will automatically convert to Class A shares after a maximum holding period of seven years from the initial date of purchase.
During the period, the Board of Trustees approved the conversion of all existing Class B shares into Class A shares, effective on or about July 1, 2016, regardless of the length of times shares have been held.
2. Investments in Fidelity Central Funds.
The Fund invests in Fidelity Central Funds, which are open-end investment companies generally available only to other investment companies and accounts managed by the investment adviser and its affiliates. The Fund's Schedule of Investments lists each of the Fidelity Central Funds held as of period end, if any, as an investment of the Fund, but does not include the underlying holdings of each Fidelity Central Fund. As an Investing Fund, the Fund indirectly bears its proportionate share of the expenses of the underlying Fidelity Central Funds.
The Money Market Central Funds seek preservation of capital and current income and are managed by Fidelity Investments Money Management, Inc. (FIMM), an affiliate of the investment adviser. Annualized expenses of the Money Market Central Funds as of their most recent shareholder report date are less than .005%.
A complete unaudited list of holdings for each Fidelity Central Fund is available upon request or at the Securities and Exchange Commission (the SEC) website at www.sec.gov. In addition, the financial statements of the Fidelity Central Funds are available on the SEC website or upon request.
3. Significant Accounting Policies.
The financial statements have been prepared in conformity with accounting principles generally accepted in the United States of America (GAAP), which require management to make certain estimates and assumptions at the date of the financial statements. Actual results could differ from those estimates. Subsequent events, if any, through the date that the financial statements were issued have been evaluated in the preparation of the financial statements. The following summarizes the significant accounting policies of the Fund:
Investment Valuation. Investments are valued as of 4:00 p.m. Eastern time on the last calendar day of the period. The Board of Trustees (the Board) has delegated the day to day responsibility for the valuation of the Fund's investments to the Fidelity Management & Research Company (FMR) Fair Value Committee (the Committee). In accordance with valuation policies and procedures approved by the Board, the Fund attempts to obtain prices from one or more third party pricing vendors or brokers to value its investments. When current market prices, quotations or currency exchange rates are not readily available or reliable, investments will be fair valued in good faith by the Committee, in accordance with procedures adopted by the Board. Factors used in determining fair value vary by investment type and may include market or investment specific events. The frequency with which these procedures are used cannot be predicted and they may be utilized to a significant extent. The Committee oversees the Fund's valuation policies and procedures and reports to the Board on the Committee's activities and fair value determinations. The Board monitors the appropriateness of the procedures used in valuing the Fund's investments and ratifies the fair value determinations of the Committee.
The Fund categorizes the inputs to valuation techniques used to value its investments into a disclosure hierarchy consisting of three levels as shown below:
- Level 1 – quoted prices in active markets for identical investments
- Level 2 – other significant observable inputs (including quoted prices for similar investments, interest rates, prepayment speeds, etc.)
- Level 3 – unobservable inputs (including the Fund's own assumptions based on the best information available)
Valuation techniques used to value the Fund's investments by major category are as follows:
Equity securities, including restricted securities, for which market quotations are readily available, are valued at the last reported sale price or official closing price as reported by a third party pricing vendor on the primary market or exchange on which they are traded and are categorized as Level 1 in the hierarchy. In the event there were no sales during the day or closing prices are not available, securities are valued at the last quoted bid price or may be valued using the last available price and are generally categorized as Level 2 in the hierarchy. For foreign equity securities, when market or security specific events arise, comparisons to the valuation of American Depositary Receipts (ADRs), futures contracts, Exchange-Traded Funds (ETFs) and certain indexes as well as quoted prices for similar securities may be used and would be categorized as Level 2 in the hierarchy. Utilizing these techniques may result in transfers between Level 1 and Level 2. For equity securities, including restricted securities, where observable inputs are limited, assumptions about market activity and risk are used and these securities may be categorized as Level 3 in the hierarchy.
Investments in open-end mutual funds, including the Fidelity Central Funds, are valued at their closing net asset value (NAV) each business day and are categorized as Level 1 in the hierarchy.
Changes in valuation techniques may result in transfers in or out of an assigned level within the disclosure hierarchy. The aggregate value of investments by input level as of April 30, 2016 is included at the end of the Fund's Schedule of Investments.
Foreign Currency. The Fund may use foreign currency contracts to facilitate transactions in foreign-denominated securities. Gains and losses from these transactions may arise from changes in the value of the foreign currency or if the counterparties do not perform under the contracts' terms.
Foreign-denominated assets, including investment securities, and liabilities are translated into U.S. dollars at the exchange rates at period end. Purchases and sales of investment securities, income and dividends received and expenses denominated in foreign currencies are translated into U.S. dollars at the exchange rate in effect on the transaction date.
The effects of exchange rate fluctuations on investments are included with the net realized and unrealized gain (loss) on investment securities. Other foreign currency transactions resulting in realized and unrealized gain (loss) are disclosed separately.
Investment Transactions and Income. For financial reporting purposes, the Fund's investment holdings and NAV include trades executed through the end of the last business day of the period. The NAV per share for processing shareholder transactions is calculated as of the close of business of the New York Stock Exchange (NYSE), normally 4:00 p.m. Eastern time and includes trades executed through the end of the prior business day. Gains and losses on securities sold are determined on the basis of identified cost and may include proceeds received from litigation. Dividend income is recorded on the ex-dividend date, except for certain dividends from foreign securities where the ex-dividend date may have passed, which are recorded as soon as the Fund is informed of the ex-dividend date. Non-cash dividends included in dividend income, if any, are recorded at the fair market value of the securities received. Income and capital gain distributions from Fidelity Central Funds, if any, are recorded on the ex-dividend date. Distributions received on securities that represent a return of capital or capital gain are recorded as a reduction of cost of investments and/or as a realized gain. Subsequent to ex-dividend date the Fund determines the components of these distributions, based upon receipt of tax filings or other correspondence relating to the underlying investment. Interest income is accrued as earned and includes coupon interest and amortization of premium and accretion of discount on debt securities as applicable. Investment income is recorded net of foreign taxes withheld where recovery of such taxes is uncertain.
Class Allocations and Expenses. Investment income, realized and unrealized capital gains and losses, common expenses of the Fund, and certain fund-level expense reductions, if any, are allocated daily on a pro-rata basis to each class based on the relative net assets of each class to the total net assets of the Fund. Each class differs with respect to transfer agent and distribution and service plan fees incurred. Certain expense reductions may also differ by class. For the reporting period, the allocated portion of income and expenses to each class as a percent of its average net assets may vary due to the timing of recording these transactions in relation to fluctuating net assets of the classes. Expenses directly attributable to a fund are charged to that fund. Expenses attributable to more than one fund are allocated among the respective funds on the basis of relative net assets or other appropriate methods. Expense estimates are accrued in the period to which they relate and adjustments are made when actual amounts are known.
Income Tax Information and Distributions to Shareholders. Each year, the Fund intends to qualify as a regulated investment company under Subchapter M of the Internal Revenue Code, including distributing substantially all of its taxable income and realized gains. As a result, no provision for U.S. Federal income taxes is required. The Fund files a U.S. federal tax return, in addition to state and local tax returns as required. The Fund's federal income tax returns are subject to examination by the Internal Revenue Service (IRS) for a period of three fiscal years after they are filed. State and local tax returns may be subject to examination for an additional fiscal year depending on the jurisdiction. Foreign taxes are provided for based on the Fund's understanding of the tax rules and rates that exist in the foreign markets in which it invests.
Distributions are declared and recorded on the ex-dividend date. Income dividends and capital gain distributions are declared separately for each class. Income and capital gain distributions are determined in accordance with income tax regulations, which may differ from GAAP.
Capital accounts within the financial statements are adjusted for permanent book-tax differences. These adjustments have no impact on net assets or the results of operations. Capital accounts are not adjusted for temporary book-tax differences which will reverse in a subsequent period.
Book-tax differences are primarily due to foreign currency transactions, passive foreign investment companies (PFIC), deferred trustees compensation and losses deferred due to wash sales.
The federal tax cost of investment securities and unrealized appreciation (depreciation) as of period end were as follows:
| Gross unrealized appreciation | $314,151,043 |
| Gross unrealized depreciation | (74,008,231) |
| Net unrealized appreciation (depreciation) on securities | $240,142,812 |
| Tax cost | $1,050,452,218 |
Short-Term Trading (Redemption) Fees. Shares held by investors in the Fund less than 90 days may have been subject to a redemption fee equal to 1.50% of the NAV of shares redeemed. All redemption fees, which reduce the proceeds of the shareholder redemption, are retained by the Fund and accounted for as an addition to paid in capital.
4. Purchases and Sales of Investments.
Purchases and sales of securities, other than short-term securities, aggregated $222,288,695 and $383,011,745, respectively.
5. Fees and Other Transactions with Affiliates.
Management Fee. Fidelity Management & Research Company (the investment adviser) and its affiliates provide the Fund with investment management related services for which the Fund pays a monthly management fee. The management fee is the sum of an individual fund fee rate that is based on an annual rate of .45% of the Fund's average net assets and an annualized group fee rate that averaged .25% during the period. The group fee rate is based upon the average net assets of all the mutual funds advised by the investment adviser, including any mutual funds previously advised by the investment adviser that are currently advised by Fidelity SelectCo, LLC, an affiliate of the investment adviser. The group fee rate decreases as assets under management increase and increases as assets under management decrease. In addition, the management fee is subject to a performance adjustment (up to a maximum of +/- .20% of the Fund's average net assets over a 36 month performance period). The upward or downward adjustment to the management fee is based on the relative investment performance of Canada as compared to its benchmark index, the S&P/TSX Composite Index, over the same 36 month performance period. For the reporting period, the total annualized management fee rate, including the performance adjustment, was .96% of the Fund's average net assets. The performance adjustment included in the management fee rate may be higher or lower than the maximum performance adjustment rate due to the difference between the average net assets for the reporting and performance periods.
Distribution and Service Plan Fees. In accordance with Rule 12b-1 of the 1940 Act, the Fund has adopted separate Distribution and Service Plans for each class of shares. Certain classes pay Fidelity Distributors Corporation (FDC), an affiliate of the investment adviser, separate Distribution and Service Fees, each of which is based on an annual percentage of each class' average net assets. In addition, FDC may pay financial intermediaries for selling shares of the Fund and providing shareholder support services. For the period, the Distribution and Service Fee rates, total fees and amounts retained by FDC were as follows:
| Distribution Fee | Service Fee | Total Fees | Retained by FDC | |
| Class A | -% | .25% | $58,105 | $– |
| Class T | .25% | .25% | 27,541 | – |
| Class B | .75% | .25% | 11,113 | 8,335 |
| Class C | .75% | .25% | 93,149 | 2,665 |
| $189,908 | $11,000 |
Sales Load. FDC may receive a front-end sales charge of up to 5.75% for selling Class A shares and 3.50% for selling Class T shares, some of which is paid to financial intermediaries for selling shares of the Fund. Depending on the holding period, FDC may receive contingent deferred sales charges levied on Class A, Class T, Class B, and Class C redemptions. The deferred sales charges range from 5.00% to 1.00% for Class B shares, 1.00% for Class C shares, 1.00% for certain purchases of Class A shares and .25% for certain purchases of Class T shares.
For the period, sales charge amounts retained by FDC were as follows:
| Retained by FDC | |
| Class A | $2,637 |
| Class T | 1,094 |
| Class B(a) | 1,397 |
| Class C(a) | 597 |
| $5,725 |
(a) When Class B and Class C shares are initially sold, FDC pays commissions from its own resources to financial intermediaries through which the sales are made.
Transfer Agent Fees. Fidelity Investments Institutional Operations Company, Inc., (FIIOC), an affiliate of the investment adviser, is the transfer, dividend disbursing and shareholder servicing agent for each class of the Fund. FIIOC receives account fees and asset-based fees that vary according to the account size and type of account of the shareholders of the respective classes of the Fund. FIIOC pays for typesetting, printing and mailing of shareholder reports, except proxy statements.
For the period, transfer agent fees for each class were as follows:
| Amount | % of Class-Level Average Net Assets(a) | |
| Class A | $67,198 | .29 |
| Class T | 17,829 | .32 |
| Class B | 3,332 | .30 |
| Class C | 25,128 | .27 |
| Canada | 1,314,704 | .23 |
| Class I | 9,221 | .18 |
| $1,437,412 |
(a) Annualized
Accounting and Security Lending Fees. Fidelity Service Company, Inc. (FSC), an affiliate of the investment adviser, maintains the Fund's accounting records. The accounting fee is based on the level of average net assets for each month. Under a separate contract, FSC administers the security lending program. The security lending fee is based on the number and duration of lending transactions.
Brokerage Commissions. The Fund placed a portion of its portfolio transactions with brokerage firms which are affiliates of the investment adviser. Brokerage commissions are included in net realized gain (loss) and change in net unrealized appreciation (depreciation) in the Statement of Operations. The commissions paid to these affiliated firms were $294 for the period.
Interfund Trades. The Fund may purchase from or sell securities to other Fidelity Funds under procedures adopted by the Board. The procedures have been designed to ensure these interfund trades are executed in accordance with Rule 17a-7 of the 1940 Act. Interfund trades are included within the respective purchases and sales amounts shown in the Purchases and Sales of Investments note.
6. Committed Line of Credit.
The Fund participates with other funds managed by the investment adviser or an affiliate in a $4.25 billion credit facility (the "line of credit") to be utilized for temporary or emergency purposes to fund shareholder redemptions or for other short-term liquidity purposes. The Fund has agreed to pay commitment fees on its pro-rata portion of the line of credit, which amounted to $1,071 and is reflected in Miscellaneous expenses on the Statement of Operations. During the period, the Fund did not borrow on this line of credit.
7. Security Lending.
The Fund lends portfolio securities through a lending agent from time to time in order to earn additional income. For equity securities, a lending agent is used and may loan securities to certain qualified borrowers, including Fidelity Capital Markets (FCM), a broker-dealer affiliated with the Fund. On the settlement date of the loan, the Fund receives collateral (in the form of U.S. Treasury obligations, letters of credit and/or cash) against the loaned securities and maintains collateral in an amount not less than 100% of the market value of the loaned securities during the period of the loan. The market value of the loaned securities is determined at the close of business of the Fund and any additional required collateral is delivered to the Fund on the next business day. The Fund or borrower may terminate the loan at any time, and if the borrower defaults on its obligation to return the securities loaned because of insolvency or other reasons, the Fund may apply collateral received from the borrower against the obligation. The Fund may experience delays and costs in recovering the securities loaned. Any cash collateral received is invested in the Fidelity Securities Lending Cash Central Fund. The value of loaned securities and cash collateral at period end are disclosed on the Fund's Statement of Assets and Liabilities. Security lending income represents the income earned on investing cash collateral, less rebates paid to borrowers and any lending agent fees associated with the loan, plus any premium payments received for lending certain types of securities. Security lending income is presented in the Statement of Operations as a component of income from Fidelity Central Funds, and includes $2,028 from securities loaned to FCM.
8. Expense Reductions.
Commissions paid to certain brokers with whom the investment adviser, or its affiliates, places trades on behalf of the Fund include an amount in addition to trade execution, which may be rebated back to the Fund to offset certain expenses. This amount totaled $4,918 for the period. In addition, through arrangements with the Fund's custodian, credits realized as a result of certain uninvested cash balances were used to reduce the Fund's expenses. During the period, these credits reduced the Fund's custody expenses by $21.
In addition, during the period the investment adviser reimbursed and/or waived a portion of fund-level operating expenses in the amount of $4,434.
9. Distributions to Shareholders.
Distributions to shareholders of each class were as follows:
| Six months ended April 30, 2016 | Year ended October 31, 2015 | |
| From net investment income | ||
| Class A | $482,934 | $783,478 |
| Class T | 79,315 | 106,245 |
| Class C | 8,502 | 12,920 |
| Canada | 16,735,044 | 22,800,214 |
| Class I | 156,283 | 326,817 |
| Total | $17,462,078 | $24,029,674 |
| From net realized gain | ||
| Class A | $69,321 | $11,358,847 |
| Class T | 16,639 | 2,548,483 |
| Class B | 3,460 | 742,098 |
| Class C | 28,339 | 4,664,328 |
| Canada | 1,638,014 | 239,967,215 |
| Class I | 16,001 | 3,449,733 |
| Total | $1,771,774 | $262,730,704 |
10. Share Transactions.
Share transactions for each class were as follows and may contain automatic conversions between classes or exchanges between affiliated funds:
| Shares | Shares | Dollars | Dollars | |
| Six months ended April 30, 2016 | Year ended October 31, 2015 | Six months ended April 30, 2016 | Year ended October 31, 2015 | |
| Class A | ||||
| Shares sold | 36,639 | 153,407 | $1,582,358 | $8,099,168 |
| Reinvestment of distributions | 11,425 | 200,582 | 496,287 | 10,552,616 |
| Shares redeemed | (342,515) | (634,705) | (14,730,138) | (31,737,294) |
| Net increase (decrease) | (294,451) | (280,716) | $(12,651,493) | $(13,085,510) |
| Class T | ||||
| Shares sold | 9,827 | 21,812 | $408,970 | $1,102,045 |
| Reinvestment of distributions | 2,169 | 49,518 | 93,951 | 2,597,730 |
| Shares redeemed | (56,853) | (151,491) | (2,357,721) | (7,597,599) |
| Net increase (decrease) | (44,857) | (80,161) | $(1,854,800) | $(3,897,824) |
| Class B | ||||
| Shares sold | 499 | 1,663 | $21,790 | $85,823 |
| Reinvestment of distributions | 68 | 12,380 | 2,895 | 641,184 |
| Shares redeemed | (13,828) | (59,611) | (579,039) | (2,906,257) |
| Net increase (decrease) | (13,261) | (45,568) | $(554,354) | $(2,179,250) |
| Class C | ||||
| Shares sold | 24,743 | 42,631 | $1,052,682 | $2,146,853 |
| Reinvestment of distributions | 731 | 75,003 | 31,141 | 3,864,885 |
| Shares redeemed | (90,006) | (283,087) | (3,720,124) | (13,692,762) |
| Net increase (decrease) | (64,532) | (165,453) | $(2,636,301) | $(7,681,024) |
| Canada | ||||
| Shares sold | 779,017 | 1,250,697 | $33,585,544 | $63,450,179 |
| Reinvestment of distributions | 388,588 | 4,716,591 | 16,926,879 | 249,177,482 |
| Shares redeemed | (4,297,518) | (11,643,757) | (180,976,780) | (581,614,067) |
| Net increase (decrease) | (3,129,913) | (5,676,469) | $(130,464,357) | $(268,986,406) |
| Class I | ||||
| Shares sold | 70,963 | 66,679 | $2,977,708 | $3,430,310 |
| Reinvestment of distributions | 2,849 | 49,883 | 123,890 | 2,628,352 |
| Shares redeemed | (219,360) | (285,976) | (8,986,572) | (14,385,529) |
| Net increase (decrease) | (145,548) | (169,414) | $(5,884,974) | $(8,326,867) |
11. Other.
The Fund's organizational documents provide former and current trustees and officers with a limited indemnification against liabilities arising in connection with the performance of their duties to the Fund. In the normal course of business, the Fund may also enter into contracts that provide general indemnifications. The Fund's maximum exposure under these arrangements is unknown as this would be dependent on future claims that may be made against the Fund. The risk of material loss from such claims is considered remote.
Fidelity® China Region Fund
Investment Summary (Unaudited)
Geographic Diversification (% of fund's net assets)
| As of April 30, 2016 | ||
| China | 37.1% | |
| Cayman Islands | 26.7% | |
| Taiwan | 18.9% | |
| Hong Kong | 6.2% | |
| United Kingdom | 3.5% | |
| Bermuda | 3.3% | |
| Netherlands | 2.8% | |
| British Virgin Islands | 1.1% | |
| United States of America* | 0.4% | |

* Includes Short-Term investments and Net Other Assets (Liabilities).
Percentages are based on country or territory of incorporation and are adjusted for the effect of futures contracts, if applicable.
| As of October 31, 2015 | ||
| China | 49.0% | |
| Cayman Islands | 25.8% | |
| Hong Kong | 8.7% | |
| Bermuda | 5.0% | |
| Taiwan | 3.7% | |
| Netherlands | 3.0% | |
| United Kingdom | 1.7% | |
| Bailiwick of Jersey | 1.7% | |
| United States of America* | 1.4% | |

* Includes Short-Term investments and Net Other Assets (Liabilities).
Percentages are based on country or territory of incorporation and are adjusted for the effect of futures contracts, if applicable.
Asset Allocation as of April 30, 2016
| % of fund's net assets | % of fund's net assets 6 months ago | |
| Stocks | 99.6 | 98.6 |
| Short-Term Investments and Net Other Assets (Liabilities) | 0.4 | 1.4 |
Top Ten Stocks as of April 30, 2016
| % of fund's net assets | % of fund's net assets 6 months ago | |
| Tencent Holdings Ltd. (Internet Software & Services) | 7.9 | 6.0 |
| Taiwan Semiconductor Manufacturing Co. Ltd. (Semiconductors & Semiconductor Equipment) | 7.6 | 0.0 |
| Alibaba Group Holding Ltd. sponsored ADR (Internet Software & Services) | 2.7 | 0.6 |
| Ping An Insurance (Group) Co. of China Ltd. (H Shares) (Insurance) | 2.7 | 2.8 |
| China Construction Bank Corp. (H Shares) (Banks) | 2.6 | 4.9 |
| Kweichow Moutai Co. Ltd. (Beverages) | 2.4 | 1.4 |
| Industrial & Commercial Bank of China Ltd. (H Shares) (Banks) | 2.3 | 2.3 |
| Chongqing Changan Automobile Co. Ltd. (B Shares) (Automobiles) | 2.2 | 2.2 |
| BBMG Corp. (H Shares) (Construction Materials) | 2.1 | 1.8 |
| China Pacific Insurance (Group) Co. Ltd. (H Shares) (Insurance) | 2.0 | 2.3 |
| 34.5 |
Market Sectors as of April 30, 2016
| % of fund's net assets | % of fund's net assets 6 months ago | |
| Information Technology | 27.8 | 14.0 |
| Financials | 22.1 | 37.8 |
| Consumer Discretionary | 19.8 | 14.4 |
| Industrials | 9.8 | 12.9 |
| Materials | 5.6 | 6.7 |
| Telecommunication Services | 4.1 | 2.4 |
| Consumer Staples | 4.1 | 2.0 |
| Health Care | 3.3 | 5.5 |
| Utilities | 2.9 | 1.3 |
| Energy | 0.1 | 1.6 |
Market Sectors may include more than one industry category.
The Fund may invest up to 35% of its total assets in any industry that represents more than 20% of the Hong Kong, Taiwanese and Chinese markets. As of April 30, 2016, the Fund did not have more than 25% of its total assets invested in any one industry.
Percentages shown as 0.0% may reflect amounts less than 0.05%.
Fidelity® China Region Fund
Investments April 30, 2016 (Unaudited)
Showing Percentage of Net Assets
| Common Stocks - 98.9% | |||
| Shares | Value | ||
| CONSUMER DISCRETIONARY - 19.1% | |||
| Auto Components - 0.8% | |||
| Weifu High-Technology Co. Ltd. (B Shares) | 4,257,836 | $9,002,116 | |
| Automobiles - 2.2% | |||
| Chongqing Changan Automobile Co. Ltd. (B Shares) | 13,112,941 | 22,686,340 | |
| Diversified Consumer Services - 1.4% | |||
| New Oriental Education & Technology Group, Inc. sponsored ADR | 297,200 | 11,638,352 | |
| TAL Education Group ADR (a) | 51,000 | 2,950,860 | |
| 14,589,212 | |||
| Hotels, Restaurants & Leisure - 3.2% | |||
| China CYTS Tours Holding Co. Ltd. | 887,536 | 2,725,375 | |
| China International Travel Service Corp. Ltd. (A Shares) | 753,281 | 5,121,899 | |
| Huangshan Tourism Development Co. Ltd. | 5,899,876 | 12,377,940 | |
| Shanghai Jin Jiang International Hotel Co. Ltd. (H Shares) | 13,520,000 | 5,550,538 | |
| Tuniu Corp. Class A sponsored ADR (a)(b) | 742,800 | 7,895,964 | |
| 33,671,716 | |||
| Household Durables - 4.2% | |||
| Haier Electronics Group Co. Ltd. | 5,492,000 | 9,223,978 | |
| Nien Made Enterprise Co. Ltd. | 800,000 | 6,290,437 | |
| Qingdao Haier Co. Ltd. | 3,099,822 | 3,988,464 | |
| Sundart Holdings Ltd. | 20,000,000 | 11,680,502 | |
| Techtronic Industries Co. Ltd. | 3,582,500 | 13,429,610 | |
| 44,612,991 | |||
| Internet & Catalog Retail - 2.3% | |||
| Ctrip.com International Ltd. ADR (a) | 286,000 | 12,472,460 | |
| Qunar Cayman Islands Ltd. sponsored ADR (a)(b) | 285,000 | 11,630,850 | |
| 24,103,310 | |||
| Media - 0.3% | |||
| Poly Culture Group Corp. Ltd. (H Shares) | 1,148,800 | 2,704,631 | |
| Multiline Retail - 0.0% | |||
| Lifestyle International Holdings Ltd. | 339,000 | 561,562 | |
| Specialty Retail - 1.7% | |||
| Chow Tai Fook Jewellery Group Ltd. | 16,335,200 | 11,354,113 | |
| Luk Fook Holdings International Ltd. | 2,830,000 | 6,445,257 | |
| 17,799,370 | |||
| Textiles, Apparel & Luxury Goods - 3.0% | |||
| Anta Sports Products Ltd. | 1,169,000 | 2,977,711 | |
| ECLAT Textile Co. Ltd. | 390,000 | 4,448,968 | |
| Lao Feng Xiang Co. Ltd. (B Shares) | 2,499,988 | 9,502,454 | |
| Pacific Textile Holdings Ltd. | 4,000,000 | 5,150,096 | |
| Shenzhou International Group Holdings Ltd. | 522,000 | 2,698,493 | |
| Toung Loong Textile Manufacturing Co. Ltd. | 2,375,000 | 6,315,590 | |
| 31,093,312 | |||
| TOTAL CONSUMER DISCRETIONARY | 200,824,560 | ||
| CONSUMER STAPLES - 4.1% | |||
| Beverages - 2.4% | |||
| Kweichow Moutai Co. Ltd. | 656,346 | 25,466,920 | |
| Food Products - 1.7% | |||
| China Modern Dairy Holdings Ltd. (b) | 34,000,000 | 6,240,081 | |
| Unified-President Enterprises Corp. | 6,240,000 | 11,242,547 | |
| 17,482,628 | |||
| TOTAL CONSUMER STAPLES | 42,949,548 | ||
| ENERGY - 0.1% | |||
| Energy Equipment & Services - 0.1% | |||
| China Oilfield Services Ltd. (H Shares) | 1,192,000 | 1,034,064 | |
| FINANCIALS - 22.1% | |||
| Banks - 7.7% | |||
| China Construction Bank Corp. (H Shares) | 43,894,000 | 27,878,267 | |
| Hangzhou Hikvision Digital Technology Co. Ltd. ELS (BNP Paribas Warrant Program) warrants 11/27/17 (a)(c) | 2,810,800 | 13,228,980 | |
| Industrial & Commercial Bank of China Ltd. (H Shares) | 44,543,000 | 23,848,363 | |
| Midea Group Co. Ltd. ELS (BNP Paribas Arbitrage Warrant Program) warrants 2/10/17 (a)(c) | 3,090,600 | 15,323,987 | |
| 80,279,597 | |||
| Capital Markets - 3.5% | |||
| Hangzhou Robam Appliances Co. Ltd. ELS (UBS Warrant Programme) warrants 1/15/18 (a)(c) | 512,858 | 4,075,740 | |
| Shanghai Bestway Marine Engineering Design Co. Ltd. ELS warrants 3/5/17 (a)(c) | 2,798,094 | 12,274,522 | |
| Shenzhen Airport Co. Ltd. ELS (UBS Warrant Programme) (A Shares) warrants 2/17/17 (a)(c) | 8,765,531 | 10,614,957 | |
| Wuliangye Yibin Co. Ltd. ELS (UBS Warrant Programme) warrants 3/7/19 (a)(c) | 1,071,282 | 4,699,440 | |
| Yunnan Baiyao Group Co. Ltd. ELS (UBS Warrant Programme) (A Shares) warrants 2/17/17 (a)(c) | 559,455 | 5,223,786 | |
| 36,888,445 | |||
| Insurance - 7.2% | |||
| AIA Group Ltd. | 3,432,400 | 20,541,562 | |
| China Pacific Insurance (Group) Co. Ltd. (H Shares) | 6,041,400 | 21,183,844 | |
| PICC Property & Casualty Co. Ltd. (H Shares) | 3,164,000 | 5,755,562 | |
| Ping An Insurance (Group) Co. of China Ltd. (H Shares) | 6,024,500 | 28,273,483 | |
| 75,754,451 | |||
| Real Estate Management & Development - 3.7% | |||
| Beijing Capital Land Ltd. (H Shares) | 35,170,000 | 13,865,732 | |
| Cheung Kong Property Holdings Ltd. | 2,848,000 | 19,450,390 | |
| Sun Hung Kai Properties Ltd. | 456,000 | 5,747,024 | |
| 39,063,146 | |||
| TOTAL FINANCIALS | 231,985,639 | ||
| HEALTH CARE - 3.3% | |||
| Health Care Providers & Services - 0.0% | |||
| China National Accord Medicines Corp. Ltd. | 24,173 | 132,319 | |
| Life Sciences Tools & Services - 1.0% | |||
| JHL Biotech, Inc. (a) | 3,976,696 | 10,753,317 | |
| Pharmaceuticals - 2.3% | |||
| Jiangsu Hengrui Medicine Co. Ltd. | 735,988 | 5,306,712 | |
| Lee's Pharmaceutical Holdings Ltd. | 8,273,500 | 6,694,421 | |
| Livzon Pharmaceutical Group, Inc. | 2,485,700 | 11,484,017 | |
| 23,485,150 | |||
| TOTAL HEALTH CARE | 34,370,786 | ||
| INDUSTRIALS - 9.8% | |||
| Air Freight & Logistics - 0.4% | |||
| Sinotrans Air Transportation Development Co. Ltd. (A Shares) | 1,599,830 | 4,541,960 | |
| Airlines - 3.0% | |||
| Air China Ltd. (H Shares) | 6,648,000 | 5,033,096 | |
| China Eastern Airlines Corp. Ltd. (H Shares) (a) | 26,446,000 | 14,458,119 | |
| China Southern Airlines Ltd. (H Shares) | 20,194,000 | 12,662,503 | |
| 32,153,718 | |||
| Construction & Engineering - 1.6% | |||
| Beijing Urban Consolidated & Development Group Ltd. (H Shares) | 20,963,000 | 12,108,422 | |
| China Energy Engineering Corp. Ltd. | 27,132,000 | 4,735,774 | |
| 16,844,196 | |||
| Electrical Equipment - 1.3% | |||
| Harbin Electric Machinery Co. Ltd.(H Shares) (b) | 21,974,000 | 8,993,794 | |
| Jiangnan Group Ltd. | 25,552,000 | 4,304,437 | |
| 13,298,231 | |||
| Machinery - 0.8% | |||
| Lonking Holdings Ltd. | 28,600,000 | 4,774,187 | |
| Sinotruk Hong Kong Ltd. | 8,000,000 | 4,028,249 | |
| 8,802,436 | |||
| Marine - 1.5% | |||
| China Shipping Development Co. Ltd. (H Shares) | 18,762,000 | 13,322,169 | |
| Sinotrans Shipping Ltd. (b) | 12,186,000 | 2,143,439 | |
| 15,465,608 | |||
| Trading Companies & Distributors - 1.0% | |||
| Summit Ascent Holdings Ltd. (a)(b) | 48,136,000 | 10,321,526 | |
| Transportation Infrastructure - 0.2% | |||
| Shanghai International Airport Co. Ltd. | 472,000 | 1,983,784 | |
| TOTAL INDUSTRIALS | 103,411,459 | ||
| INFORMATION TECHNOLOGY - 27.8% | |||
| Electronic Equipment & Components - 4.1% | |||
| Hon Hai Precision Industry Co. Ltd. (Foxconn) | 4,464,000 | 10,654,565 | |
| Largan Precision Co. Ltd. | 156,000 | 10,962,449 | |
| Sunny Optical Technology Group Co. Ltd. (b) | 2,700,000 | 8,327,490 | |
| Tongda Group Holdings Ltd. | 65,800,000 | 13,516,242 | |
| 43,460,746 | |||
| Internet Software & Services - 11.3% | |||
| 58.com, Inc. ADR (a) | 141,178 | 7,715,378 | |
| Alibaba Group Holding Ltd. sponsored ADR (a) | 370,900 | 28,537,046 | |
| Tencent Holdings Ltd. | 4,060,800 | 82,630,438 | |
| 118,882,862 | |||
| Semiconductors & Semiconductor Equipment - 10.1% | |||
| Advanced Semiconductor Engineering, Inc. | 13,995,000 | 13,445,636 | |
| Taiwan Semiconductor Manufacturing Co. Ltd. | 17,294,000 | 79,332,048 | |
| Vanguard International Semiconductor Corp. | 8,434,000 | 12,910,915 | |
| 105,688,599 | |||
| Software - 0.8% | |||
| China City Railway Transportation Technology Holdings Co. Ltd. (a) | 48,540,000 | 8,406,447 | |
| Technology Hardware, Storage & Peripherals - 1.5% | |||
| ADLINK Technology, Inc. | 3,682,844 | 7,593,023 | |
| Axiomtek Co. Ltd. | 2,000,000 | 4,272,049 | |
| HTC Corp. | 1,410,000 | 3,596,694 | |
| 15,461,766 | |||
| TOTAL INFORMATION TECHNOLOGY | 291,900,420 | ||
| MATERIALS - 5.6% | |||
| Construction Materials - 3.3% | |||
| BBMG Corp. (H Shares) | 30,808,000 | 22,515,344 | |
| China Shanshui Cement Group Ltd. (a)(b) | 20,656,000 | 9,200,458 | |
| TCC International Holdings Ltd. | 15,608,000 | 3,128,099 | |
| 34,843,901 | |||
| Metals & Mining - 2.3% | |||
| Fushan International Energy Group Ltd. | 2,778,000 | 417,665 | |
| Jiangxi Copper Co. Ltd. (H Shares) | 4,214,000 | 5,144,924 | |
| Zhaojin Mining Industry Co. Ltd. (H Shares) | 9,357,000 | 8,085,303 | |
| Zijin Mining Group Co. Ltd. (H Shares) | 31,580,000 | 10,535,752 | |
| 24,183,644 | |||
| TOTAL MATERIALS | 59,027,545 | ||
| TELECOMMUNICATION SERVICES - 4.1% | |||
| Diversified Telecommunication Services - 4.1% | |||
| China Telecom Corp. Ltd. (H Shares) | 13,024,000 | 6,447,744 | |
| China Unicom Ltd. | 13,784,000 | 16,131,254 | |
| Chunghwa Telecom Co. Ltd. | 4,980,000 | 16,804,012 | |
| CITIC 1616 Holdings Ltd. | 9,294,000 | 3,858,505 | |
| 43,241,515 | |||
| UTILITIES - 2.9% | |||
| Independent Power and Renewable Electricity Producers - 2.1% | |||
| Beijing Jingneng Clean Energy Co. Ltd. (H Shares) | 42,174,000 | 13,306,264 | |
| Huaneng Renewables Corp. Ltd. (H Shares) | 31,944,000 | 9,426,176 | |
| 22,732,440 | |||
| Water Utilities - 0.8% | |||
| Beijing Enterprises Water Group Ltd. | 13,838,000 | 8,253,479 | |
| TOTAL UTILITIES | 30,985,919 | ||
| TOTAL COMMON STOCKS | |||
| (Cost $1,082,335,076) | 1,039,731,455 | ||
| Nonconvertible Preferred Stocks - 0.7% | |||
| CONSUMER DISCRETIONARY - 0.7% | |||
| Internet & Catalog Retail - 0.7% | |||
| China Internet Plus Holdings Ltd. Series A-11 (d) | |||
| (Cost $6,268,244) | 1,983,088 | 7,656,108 | |
| Money Market Funds - 3.5% | |||
| Fidelity Cash Central Fund, 0.38% (e) | 5,975,098 | 5,975,098 | |
| Fidelity Securities Lending Cash Central Fund, 0.42% (e)(f) | 31,037,646 | 31,037,646 | |
| TOTAL MONEY MARKET FUNDS | |||
| (Cost $37,012,744) | 37,012,744 | ||
| TOTAL INVESTMENT PORTFOLIO - 103.1% | |||
| (Cost $1,125,616,064) | 1,084,400,307 | ||
| NET OTHER ASSETS (LIABILITIES) - (3.1)% | (32,970,981) | ||
| NET ASSETS - 100% | $1,051,429,326 |
Security Type Abbreviations
ELS – Equity-Linked Security
Legend
(a) Non-income producing
(b) Security or a portion of the security is on loan at period end.
(c) Security exempt from registration under Rule 144A of the Securities Act of 1933. These securities may be resold in transactions exempt from registration, normally to qualified institutional buyers. At the end of the period, the value of these securities amounted to $65,441,412 or 6.2% of net assets.
(d) Restricted securities - Investment in securities not registered under the Securities Act of 1933 (excluding 144A issues). At the end of the period, the value of restricted securities (excluding 144A issues) amounted to $7,656,108 or 0.7% of net assets.
(e) Affiliated fund that is generally available only to investment companies and other accounts managed by Fidelity Investments. The rate quoted is the annualized seven-day yield of the fund at period end. A complete unaudited listing of the fund's holdings as of its most recent quarter end is available upon request. In addition, each Fidelity Central Fund's financial statements are available on the SEC's website or upon request.
(f) Investment made with cash collateral received from securities on loan.
Additional information on each restricted holding is as follows:
| Security | Acquisition Date | Acquisition Cost |
| China Internet Plus Holdings Ltd. Series A-11 | 1/26/15 | $6,268,244 |
Affiliated Central Funds
Information regarding fiscal year to date income earned by the Fund from investments in Fidelity Central Funds is as follows:
| Fund | Income earned |
| Fidelity Cash Central Fund | $46,081 |
| Fidelity Securities Lending Cash Central Fund | 787,517 |
| Total | $833,598 |
Investment Valuation
The following is a summary of the inputs used, as of April 30, 2016, involving the Fund's assets and liabilities carried at fair value. The inputs or methodology used for valuing securities may not be an indication of the risk associated with investing in those securities. For more information on valuation inputs, and their aggregation into the levels used below, please refer to the Investment Valuation section in the accompanying Notes to Financial Statements.
| Valuation Inputs at Reporting Date: | ||||
| Description | Total | Level 1 | Level 2 | Level 3 |
| Investments in Securities: | ||||
| Equities: | ||||
| Consumer Discretionary | $208,480,668 | $129,048,069 | $71,776,491 | $7,656,108 |
| Consumer Staples | 42,949,548 | 36,709,467 | 6,240,081 | -- |
| Energy | 1,034,064 | -- | 1,034,064 | -- |
| Financials | 231,985,639 | -- | 231,985,639 | -- |
| Health Care | 34,370,786 | 16,192,348 | 18,178,438 | -- |
| Industrials | 103,411,459 | 6,525,744 | 96,885,715 | -- |
| Information Technology | 291,900,420 | 86,242,119 | 205,658,301 | -- |
| Materials | 59,027,545 | -- | 49,827,087 | 9,200,458 |
| Telecommunication Services | 43,241,515 | 16,804,012 | 26,437,503 | -- |
| Utilities | 30,985,919 | -- | 30,985,919 | -- |
| Money Market Funds | 37,012,744 | 37,012,744 | -- | -- |
| Total Investments in Securities: | $1,084,400,307 | $328,534,503 | $739,009,238 | $16,856,566 |
The following is a summary of transfers between Level 1 and Level 2 for the period ended April 30, 2016. Transfers are assumed to have occurred at the beginning of the period, and are primarily attributable to the valuation techniques used for foreign equity securities, as discussed in the accompanying Notes to Financial Statements:
| Transfers | Total |
| Level 1 to Level 2 | $0 |
| Level 2 to Level 1 | $86,068,185 |
The following is a reconciliation of Investments in Securities and Derivative Instruments for which Level 3 inputs were used in determining value:
| Investments in Securities: | |
| Equities - Consumer Discretionary | |
| Beginning Balance | $12,373,756 |
| Net Realized Gain (Loss) on Investment Securities | -- |
| Net Unrealized Gain (Loss) on Investment Securities | 1,388 |
| Cost of Purchases | -- |
| Proceeds of Sales | -- |
| Amortization/Accretion | -- |
| Transfers into Level 3 | -- |
| Transfers out of Level 3 | (4,719,036) |
| Ending Balance | $7,656,108 |
| The change in unrealized gain (loss) for the period attributable to Level 3 securities held at April 30, 2016 | $1,388 |
| Equities - Health Care | |
| Beginning Balance | $14,369,442 |
| Net Realized Gain (Loss) on Investment Securities | -- |
| Net Unrealized Gain (Loss) on Investment Securities | -- |
| Cost of Purchases | -- |
| Proceeds of Sales | -- |
| Amortization/Accretion | -- |
| Transfers into Level 3 | -- |
| Transfers out of Level 3 | (14,369,442) |
| Ending Balance | $-- |
| The change in unrealized gain (loss) for the period attributable to Level 3 securities held at April 30, 2016 | $-- |
| Equities - Industrials | |
| Beginning Balance | $15,897,809 |
| Net Realized Gain (Loss) on Investment Securities | -- |
| Net Unrealized Gain (Loss) on Investment Securities | -- |
| Cost of Purchases | -- |
| Proceeds of Sales | -- |
| Amortization/Accretion | -- |
| Transfers into Level 3 | -- |
| Transfers out of Level 3 | (15,897,809) |
| Ending Balance | $-- |
| The change in unrealized gain (loss) for the period attributable to Level 3 securities held at April 30, 2016 | $-- |
| Equities - Materials | |
| Beginning Balance | $14,440,021 |
| Net Realized Gain (Loss) on Investment Securities | -- |
| Net Unrealized Gain (Loss) on Investment Securities | (5,239,563) |
| Cost of Purchases | -- |
| Proceeds of Sales | -- |
| Amortization/Accretion | -- |
| Transfers into Level 3 | -- |
| Transfers out of Level 3 | -- |
| Ending Balance | $9,200,458 |
| The change in unrealized gain (loss) for the period attributable to Level 3 securities held at April 30, 2016 | $(5,239,563) |
The information used in the above reconciliations represents fiscal year to date activity for any Investments in Securities identified as using Level 3 inputs at either the beginning or the end of the current fiscal period. Transfers into Level 3 were attributable to a lack of observable market data resulting from decreases in market activity, decreases in liquidity, security restructurings or corporate actions. Transfers out of Level 3 were attributable to observable market data becoming available for those securities. Transfers in or out of Level 3 represent the beginning value of any Security or Instrument where a change in the pricing level occurred from the beginning to the end of the period. The cost of purchases and the proceeds of sales may include securities received or delivered through corporate actions or exchanges. Realized and unrealized gains (losses) disclosed in the reconciliations are included in Net Gain (Loss) on the Fund's Statement of Operations.
See accompanying notes which are an integral part of the financial statements.
Fidelity® China Region Fund
Financial Statements
Statement of Assets and Liabilities
| April 30, 2016 (Unaudited) | ||
| Assets | ||
| Investment in securities, at value (including securities loaned of $29,468,457) — See accompanying schedule: Unaffiliated issuers (cost $1,088,603,320) | $1,047,387,563 | |
| Fidelity Central Funds (cost $37,012,744) | 37,012,744 | |
| Total Investments (cost $1,125,616,064) | $1,084,400,307 | |
| Receivable for investments sold | 2,260,855 | |
| Receivable for fund shares sold | 629,803 | |
| Dividends receivable | 8,617 | |
| Distributions receivable from Fidelity Central Funds | 130,378 | |
| Prepaid expenses | 1,007 | |
| Other receivables | 31,340 | |
| Total assets | 1,087,462,307 | |
| Liabilities | ||
| Payable for investments purchased | $25,401 | |
| Payable for fund shares redeemed | 3,982,214 | |
| Accrued management fee | 631,699 | |
| Distribution and service plan fees payable | 17,253 | |
| Other affiliated payables | 241,879 | |
| Other payables and accrued expenses | 96,889 | |
| Collateral on securities loaned, at value | 31,037,646 | |
| Total liabilities | 36,032,981 | |
| Net Assets | $1,051,429,326 | |
| Net Assets consist of: | ||
| Paid in capital | $1,281,182,139 | |
| Accumulated net investment loss | (4,948,592) | |
| Accumulated undistributed net realized gain (loss) on investments and foreign currency transactions | (183,588,248) | |
| Net unrealized appreciation (depreciation) on investments and assets and liabilities in foreign currencies | (41,215,973) | |
| Net Assets | $1,051,429,326 | |
| Calculation of Maximum Offering Price | ||
| Class A: | ||
| Net Asset Value and redemption price per share ($22,818,837 ÷ 1,000,986 shares) | $22.80 | |
| Maximum offering price per share (100/94.25 of $22.80) | $24.19 | |
| Class T: | ||
| Net Asset Value and redemption price per share ($5,221,259 ÷ 229,672 shares) | $22.73 | |
| Maximum offering price per share (100/96.50 of $22.73) | $23.55 | |
| Class B: | ||
| Net Asset Value and offering price per share ($535,037 ÷ 23,668 shares)(a) | $22.61 | |
| Class C: | ||
| Net Asset Value and offering price per share ($11,435,356 ÷ 512,571 shares)(a) | $22.31 | |
| China Region: | ||
| Net Asset Value, offering price and redemption price per share ($995,658,703 ÷ 43,200,582 shares) | $23.05 | |
| Class I: | ||
| Net Asset Value, offering price and redemption price per share ($15,760,134 ÷ 687,981 shares) | $22.91 |
(a) Redemption price per share is equal to net asset value less any applicable contingent deferred sales charge.
See accompanying notes which are an integral part of the financial statements.
Statement of Operations
| Six months ended April 30, 2016 (Unaudited) | ||
| Investment Income | ||
| Dividends | $289,863 | |
| Income from Fidelity Central Funds (including $787,517 from security lending) | 833,598 | |
| Total income | 1,123,461 | |
| Expenses | ||
| Management fee | $3,992,712 | |
| Transfer agent fees | 1,273,934 | |
| Distribution and service plan fees | 110,852 | |
| Accounting and security lending fees | 269,796 | |
| Custodian fees and expenses | 188,324 | |
| Independent trustees' compensation | 2,600 | |
| Registration fees | 81,227 | |
| Audit | 57,221 | |
| Legal | 1,907 | |
| Interest | 133 | |
| Miscellaneous | 4,958 | |
| Total expenses before reductions | 5,983,664 | |
| Expense reductions | (5,348) | 5,978,316 |
| Net investment income (loss) | (4,854,855) | |
| Realized and Unrealized Gain (Loss) | ||
| Net realized gain (loss) on: | ||
| Investment securities: | ||
| Unaffiliated issuers | (180,006,367) | |
| Foreign currency transactions | 268,756 | |
| Total net realized gain (loss) | (179,737,611) | |
| Change in net unrealized appreciation (depreciation) on: Investment securities | 46,758,426 | |
| Assets and liabilities in foreign currencies | (118) | |
| Total change in net unrealized appreciation (depreciation) | 46,758,308 | |
| Net gain (loss) | (132,979,303) | |
| Net increase (decrease) in net assets resulting from operations | $(137,834,158) |
See accompanying notes which are an integral part of the financial statements.
Statement of Changes in Net Assets
| Six months ended April 30, 2016 (Unaudited) | Year ended October 31, 2015 | |
| Increase (Decrease) in Net Assets | ||
| Operations | ||
| Net investment income (loss) | $(4,854,855) | $23,670,929 |
| Net realized gain (loss) | (179,737,611) | 235,474,014 |
| Change in net unrealized appreciation (depreciation) | 46,758,308 | (344,541,210) |
| Net increase (decrease) in net assets resulting from operations | (137,834,158) | (85,396,267) |
| Distributions to shareholders from net investment income | (15,103,497) | (13,114,934) |
| Distributions to shareholders from net realized gain | (159,831,115) | (172,413,722) |
| Total distributions | (174,934,612) | (185,528,656) |
| Share transactions - net increase (decrease) | 20,511,269 | 200,238,928 |
| Redemption fees | 123,475 | 2,391,591 |
| Total increase (decrease) in net assets | (292,134,026) | (68,294,404)�� |
| Net Assets | ||
| Beginning of period | 1,343,563,352 | 1,411,857,756 |
| End of period (including accumulated net investment loss of $4,948,592 and undistributed net investment income of $15,009,760, respectively) | $1,051,429,326 | $1,343,563,352 |
See accompanying notes which are an integral part of the financial statements.
Financial Highlights — Fidelity China Region Fund Class A
| Six months ended (Unaudited) April 30, | Years ended October 31, | |||||
| 2016 | 2015 | 2014 | 2013 | 2012 | 2011 | |
| Selected Per–Share Data | ||||||
| Net asset value, beginning of period | $29.34 | $34.18 | $35.56 | $28.53 | $27.28 | $31.61 |
| Income from Investment Operations | ||||||
| Net investment income (loss)A | (.14) | .40B | .21 | .30 | .36 | .33 |
| Net realized and unrealized gain (loss) | (2.54) | (.83) | 2.01C | 7.06 | 1.42 | (4.33) |
| Total from investment operations | (2.68) | (.43) | 2.22 | 7.36 | 1.78 | (4.00) |
| Distributions from net investment income | (.27) | (.22) | (.30) | (.34) | (.19) | (.31) |
| Distributions from net realized gain | (3.59) | (4.24) | (3.31) | – | (.34) | (.03) |
| Total distributions | (3.86) | (4.46) | (3.61) | (.34) | (.53) | (.34) |
| Redemption fees added to paid in capitalA | –D | .05 | .01 | .01 | –D | .01 |
| Net asset value, end of period | $22.80 | $29.34 | $34.18 | $35.56 | $28.53 | $27.28 |
| Total ReturnE,F,G | (10.57)% | (1.45)% | 6.45%C | 26.07% | 6.70% | (12.79)% |
| Ratios to Average Net AssetsH,I | ||||||
| Expenses before reductions | 1.33%J | 1.28% | 1.35% | 1.35% | 1.36% | 1.37% |
| Expenses net of fee waivers, if any | 1.32%J | 1.28% | 1.35% | 1.35% | 1.36% | 1.37% |
| Expenses net of all reductions | 1.32%J | 1.26% | 1.35% | 1.31% | 1.29% | 1.31% |
| Net investment income (loss) | (1.13)%J | 1.26%B | .64% | .94% | 1.35% | 1.07% |
| Supplemental Data | ||||||
| Net assets, end of period (000 omitted) | $22,819 | $32,761 | $21,728 | $20,623 | $13,539 | $14,808 |
| Portfolio turnover rateK | 80%J | 151% | 87% | 92% | 107% | 87% |
A Calculated based on average shares outstanding during the period.
B Net Investment income per share reflects a large, non-recurring dividend which amounted to $.13 per share. Excluding this non-recurring dividend, the ratio of net investment income (loss) to average net assets would have been .85%.
C Amount includes a reimbursement from the adviser for an operations error which amounted to $.01 per share. Excluding this reimbursement, the total return would have been 6.42%.
D Amount represents less than $.005 per share.
E Total returns for periods of less than one year are not annualized.
F Total returns would have been lower if certain expenses had not been reduced during the applicable periods shown.
G Total returns do not include the effect of the sales charges.
H Fees and expenses of any underlying Fidelity Central Funds are not included in the Fund's expense ratio. The Fund indirectly bears its proportionate share of the expenses of any underlying Fidelity Central Funds.
I Expense ratios reflect operating expenses of the class. Expenses before reductions do not reflect amounts reimbursed by the investment adviser or reductions from brokerage service arrangements or reductions from other expense offset arrangements and do not represent the amount paid by the class during periods when reimbursements or reductions occur. Expenses net of fee waivers reflect expenses after reimbursement by the investment adviser but prior to reductions from brokerage service arrangements or other expense offset arrangements. Expenses net of all reductions represent the net expenses paid by the class.
J Annualized
K Amount does not include the portfolio activity of any underlying Fidelity Central Funds.
See accompanying notes which are an integral part of the financial statements.
Financial Highlights — Fidelity China Region Fund Class T
| Six months ended (Unaudited) April 30, | Years ended October 31, | |||||
| 2016 | 2015 | 2014 | 2013 | 2012 | 2011 | |
| Selected Per–Share Data | ||||||
| Net asset value, beginning of period | $29.18 | $34.02 | $35.40 | $28.40 | $27.13 | $31.48 |
| Income from Investment Operations | ||||||
| Net investment income (loss)A | (.18) | .30B | .12 | .21 | .29 | .25 |
| Net realized and unrealized gain (loss) | (2.55) | (.83) | 1.99C | 7.04 | 1.40 | (4.32) |
| Total from investment operations | (2.73) | (.53) | 2.11 | 7.25 | 1.69 | (4.07) |
| Distributions from net investment income | (.13) | (.12) | (.19) | (.26) | (.08) | (.27) |
| Distributions from net realized gain | (3.59) | (4.24) | (3.31) | – | (.34) | (.03) |
| Total distributions | (3.72) | (4.36) | (3.50) | (.26) | (.42) | (.29)D |
| Redemption fees added to paid in capitalA | –E | .05 | .01 | .01 | –E | .01 |
| Net asset value, end of period | $22.73 | $29.18 | $34.02 | $35.40 | $28.40 | $27.13 |
| Total ReturnF,G,H | (10.75)% | (1.79)% | 6.15%C | 25.74% | 6.38% | (13.04)% |
| Ratios to Average Net AssetsI,J | ||||||
| Expenses before reductions | 1.68%K | 1.62% | 1.65% | 1.64% | 1.64% | 1.63% |
| Expenses net of fee waivers, if any | 1.68%K | 1.62% | 1.65% | 1.64% | 1.64% | 1.63% |
| Expenses net of all reductions | 1.68%K | 1.60% | 1.65% | 1.60% | 1.57% | 1.57% |
| Net investment income (loss) | (1.48)%K | .92%B | .35% | .65% | 1.06% | .81% |
| Supplemental Data | ||||||
| Net assets, end of period (000 omitted) | $5,221 | $6,409 | $6,305 | $5,965 | $4,349 | $5,281 |
| Portfolio turnover rateL | 80%K | 151% | 87% | 92% | 107% | 87% |
A Calculated based on average shares outstanding during the period.
B Net Investment income per share reflects a large, non-recurring dividend which amounted to $.13 per share. Excluding this non-recurring dividend, the ratio of net investment income (loss) to average net assets would have been .51%.
C Amount includes a reimbursement from the adviser for an operations error which amounted to $.01 per share. Excluding this reimbursement, the total return would have been 6.12%.
D Total distributions of $.29 per share is comprised of distributions from net investment income of $.268 and distributions from net realized gain of $.025 per share.
E Amount represents less than $.005 per share.
F Total returns for periods of less than one year are not annualized.
G Total returns would have been lower if certain expenses had not been reduced during the applicable periods shown.
H Total returns do not include the effect of the sales charges.
I Fees and expenses of any underlying Fidelity Central Funds are not included in the Fund's expense ratio. The Fund indirectly bears its proportionate share of the expenses of any underlying Fidelity Central Funds.
J Expense ratios reflect operating expenses of the class. Expenses before reductions do not reflect amounts reimbursed by the investment adviser or reductions from brokerage service arrangements or reductions from other expense offset arrangements and do not represent the amount paid by the class during periods when reimbursements or reductions occur. Expenses net of fee waivers reflect expenses after reimbursement by the investment adviser but prior to reductions from brokerage service arrangements or other expense offset arrangements. Expenses net of all reductions represent the net expenses paid by the class.
K Annualized
L Amount does not include the portfolio activity of any underlying Fidelity Central Funds.
See accompanying notes which are an integral part of the financial statements.
Financial Highlights — Fidelity China Region Fund Class B
| Six months ended (Unaudited) April 30, | Years ended October 31, | |||||
| 2016 | 2015 | 2014 | 2013 | 2012 | 2011 | |
| Selected Per–Share Data | ||||||
| Net asset value, beginning of period | $28.97 | $33.79 | $35.12 | $28.16 | $26.94 | $31.23 |
| Income from Investment Operations | ||||||
| Net investment income (loss)A | (.23) | .14B | (.04) | .06 | .16 | .10 |
| Net realized and unrealized gain (loss) | (2.54) | (.80) | 1.99C | 6.99 | 1.40 | (4.29) |
| Total from investment operations | (2.77) | (.66) | 1.95 | 7.05 | 1.56 | (4.19) |
| Distributions from net investment income | – | – | – | (.10) | – | (.08) |
| Distributions from net realized gain | (3.59) | (4.21) | (3.29) | – | (.34) | (.03) |
| Total distributions | (3.59) | (4.21) | (3.29) | (.10) | (.34) | (.11) |
| Redemption fees added to paid in capitalA | –D | .05 | .01 | .01 | –D | .01 |
| Net asset value, end of period | $22.61 | $28.97 | $33.79 | $35.12 | $28.16 | $26.94 |
| Total ReturnE,F,G | (10.95)% | (2.23)% | 5.68%C | 25.12% | 5.90% | (13.45)% |
| Ratios to Average Net AssetsH,I | ||||||
| Expenses before reductions | 2.11%J | 2.10% | 2.11% | 2.10% | 2.11% | 2.12% |
| Expenses net of fee waivers, if any | 2.11%J | 2.10% | 2.11% | 2.10% | 2.11% | 2.12% |
| Expenses net of all reductions | 2.11%J | 2.07% | 2.11% | 2.07% | 2.04% | 2.06% |
| Net investment income (loss) | (1.91)%J | .44%B | (.12)% | .19% | .59% | .32% |
| Supplemental Data | ||||||
| Net assets, end of period (000 omitted) | $535 | $803 | $1,215 | $1,494 | $1,533 | $1,801 |
| Portfolio turnover rateK | 80%J | 151% | 87% | 92% | 107% | 87% |
A Calculated based on average shares outstanding during the period.
B Net Investment income per share reflects a large, non-recurring dividend which amounted to $.13 per share. Excluding this non-recurring dividend, the ratio of net investment income (loss) to average net assets would have been .04%.
C Amount includes a reimbursement from the adviser for an operations error which amounted to $.01 per share. Excluding this reimbursement, the total return would have been 5.65%.
D Amount represents less than $.005 per share.
E Total returns for periods of less than one year are not annualized.
F Total returns would have been lower if certain expenses had not been reduced during the applicable periods shown.
G Total returns do not include the effect of the contingent deferred sales charge.
H Fees and expenses of any underlying Fidelity Central Funds are not included in the Fund's expense ratio. The Fund indirectly bears its proportionate share of the expenses of any underlying Fidelity Central Funds.
I Expense ratios reflect operating expenses of the class. Expenses before reductions do not reflect amounts reimbursed by the investment adviser or reductions from brokerage service arrangements or reductions from other expense offset arrangements and do not represent the amount paid by the class during periods when reimbursements or reductions occur. Expenses net of fee waivers reflect expenses after reimbursement by the investment adviser but prior to reductions from brokerage service arrangements or other expense offset arrangements. Expenses net of all reductions represent the net expenses paid by the class.
J Annualized
K Amount does not include the portfolio activity of any underlying Fidelity Central Funds.
See accompanying notes which are an integral part of the financial statements.
Financial Highlights — Fidelity China Region Fund Class C
| Six months ended (Unaudited) April 30, | Years ended October 31, | |||||
| 2016 | 2015 | 2014 | 2013 | 2012 | 2011 | |
| Selected Per–Share Data | ||||||
| Net asset value, beginning of period | $28.68 | $33.56 | $34.99 | $28.07 | $26.86 | $31.19 |
| Income from Investment Operations | ||||||
| Net investment income (loss)A | (.22) | .15B | (.02) | .06 | .16 | .10 |
| Net realized and unrealized gain (loss) | (2.50) | (.80) | 1.97C | 6.97 | 1.39 | (4.28) |
| Total from investment operations | (2.72) | (.65) | 1.95 | 7.03 | 1.55 | (4.18) |
| Distributions from net investment income | (.06) | (.04) | (.08) | (.12) | – | (.13) |
| Distributions from net realized gain | (3.59) | (4.24) | (3.31) | – | (.34) | (.03) |
| Total distributions | (3.65) | (4.28) | (3.39) | (.12) | (.34) | (.16) |
| Redemption fees added to paid in capitalA | –D | .05 | .01 | .01 | –D | .01 |
| Net asset value, end of period | $22.31 | $28.68 | $33.56 | $34.99 | $28.07 | $26.86 |
| Total ReturnE,F,G | (10.90)% | (2.21)% | 5.71%C | 25.14% | 5.88% | (13.46)% |
| Ratios to Average Net AssetsH,I | ||||||
| Expenses before reductions | 2.08%J | 2.05% | 2.07% | 2.10% | 2.11% | 2.12% |
| Expenses net of fee waivers, if any | 2.08%J | 2.05% | 2.07% | 2.10% | 2.11% | 2.12% |
| Expenses net of all reductions | 2.08%J | 2.02% | 2.07% | 2.07% | 2.04% | 2.06% |
| Net investment income (loss) | (1.88)%J | .49%B | (.07)% | .19% | .59% | .32% |
| Supplemental Data | ||||||
| Net assets, end of period (000 omitted) | $11,435 | $14,355 | $10,445 | $6,957 | $4,515 | $5,230 |
| Portfolio turnover rateK | 80%J | 151% | 87% | 92% | 107% | 87% |
A Calculated based on average shares outstanding during the period.
B Net Investment income per share reflects a large, non-recurring dividend which amounted to $.13 per share. Excluding this non-recurring dividend, the ratio of net investment income (loss) to average net assets would have been .09%.
C Amount includes a reimbursement from the adviser for an operations error which amounted to $.01 per share. Excluding this reimbursement, the total return would have been 5.68%.
D Amount represents less than $.005 per share.
E Total returns for periods of less than one year are not annualized.
F Total returns would have been lower if certain expenses had not been reduced during the applicable periods shown.
G Total returns do not include the effect of the contingent deferred sales charge.
H Fees and expenses of any underlying Fidelity Central Funds are not included in the Fund's expense ratio. The Fund indirectly bears its proportionate share of the expenses of any underlying Fidelity Central Funds.
I Expense ratios reflect operating expenses of the class. Expenses before reductions do not reflect amounts reimbursed by the investment adviser or reductions from brokerage service arrangements or reductions from other expense offset arrangements and do not represent the amount paid by the class during periods when reimbursements or reductions occur. Expenses net of fee waivers reflect expenses after reimbursement by the investment adviser but prior to reductions from brokerage service arrangements or other expense offset arrangements. Expenses net of all reductions represent the net expenses paid by the class.
J Annualized
K Amount does not include the portfolio activity of any underlying Fidelity Central Funds.
See accompanying notes which are an integral part of the financial statements.
Financial Highlights — Fidelity China Region Fund
| Six months ended (Unaudited) April 30, | Years ended October 31, | |||||
| 2016 | 2015 | 2014 | 2013 | 2012 | 2011 | |
| Selected Per–Share Data | ||||||
| Net asset value, beginning of period | $29.66 | $34.51 | $35.83 | $28.73 | $27.49 | $31.81 |
| Income from Investment Operations | ||||||
| Net investment income (loss)A | (.10) | .51B | .33 | .41 | .45 | .44 |
| Net realized and unrealized gain (loss) | (2.58) | (.84) | 2.03C | 7.11 | 1.42 | (4.37) |
| Total from investment operations | (2.68) | (.33) | 2.36 | 7.52 | 1.87 | (3.93) |
| Distributions from net investment income | (.35) | (.33) | (.38) | (.43) | (.29) | (.38) |
| Distributions from net realized gain | (3.59) | (4.24) | (3.31) | – | (.34) | (.03) |
| Total distributions | (3.93)D | (4.57) | (3.69) | (.43) | (.63) | (.40)E |
| Redemption fees added to paid in capitalA | –F | .05 | .01 | .01 | –F | .01 |
| Net asset value, end of period | $23.05 | $29.66 | $34.51 | $35.83 | $28.73 | $27.49 |
| Total ReturnG,H | (10.45)% | (1.14)% | 6.83%C | 26.51% | 7.01% | (12.52)% |
| Ratios to Average Net AssetsI,J | ||||||
| Expenses before reductions | 1.03%K | .99% | 1.01% | 1.02% | 1.04% | 1.04% |
| Expenses net of fee waivers, if any | 1.03%K | .98% | 1.01% | 1.02% | 1.04% | 1.04% |
| Expenses net of all reductions | 1.02%K | .96% | 1.01% | .98% | .98% | .98% |
| Net investment income (loss) | (.83)%K | 1.55%B | .99% | 1.27% | 1.66% | 1.40% |
| Supplemental Data | ||||||
| Net assets, end of period (000 omitted) | $995,659 | $1,262,274 | $1,352,761 | $1,425,828 | $1,265,488 | $1,515,084 |
| Portfolio turnover rateL | 80%K | 151% | 87% | 92% | 107% | 87% |
A Calculated based on average shares outstanding during the period.
B Net Investment income per share reflects a large, non-recurring dividend which amounted to $.13 per share. Excluding this non-recurring dividend, the ratio of net investment income (loss) to average net assets would have been 1.15%.
C Amount includes a reimbursement from the adviser for an operations error which amounted to $.01 per share. Excluding this reimbursement, the total return would have been 6.80%.
D Total distributions of $3.93 per share is comprised of distributions from net investment income of $.345 and distributions from net realized gain of $3.588 per share.
E Total distributions of $.40 per share is comprised of distributions from net investment income of $.376 and distributions from net realized gain of $.025 per share.
F Amount represents less than $.005 per share.
G Total returns for periods of less than one year are not annualized.
H Total returns would have been lower if certain expenses had not been reduced during the applicable periods shown.
I Fees and expenses of any underlying Fidelity Central Funds are not included in the Fund's expense ratio. The Fund indirectly bears its proportionate share of the expenses of any underlying Fidelity Central Funds.
J Expense ratios reflect operating expenses of the class. Expenses before reductions do not reflect amounts reimbursed by the investment adviser or reductions from brokerage service arrangements or reductions from other expense offset arrangements and do not represent the amount paid by the class during periods when reimbursements or reductions occur. Expenses net of fee waivers reflect expenses after reimbursement by the investment adviser but prior to reductions from brokerage service arrangements or other expense offset arrangements. Expenses net of all reductions represent the net expenses paid by the class.
K Annualized
L Amount does not include the portfolio activity of any underlying Fidelity Central Funds.
See accompanying notes which are an integral part of the financial statements.
Financial Highlights — Fidelity China Region Fund Class I
| Six months ended (Unaudited) April 30, | Years ended October 31, | |||||
| 2016 | 2015 | 2014 | 2013 | 2012 | 2011 | |
| Selected Per–Share Data | ||||||
| Net asset value, beginning of period | $29.51 | $34.39 | $35.75 | $28.68 | $27.46 | $31.79 |
| Income from Investment Operations | ||||||
| Net investment income (loss)A | (.10) | .51B | .34 | .42 | .45 | .43 |
| Net realized and unrealized gain (loss) | (2.55) | (.84) | 2.02C | 7.10 | 1.42 | (4.37) |
| Total from investment operations | (2.65) | (.33) | 2.36 | 7.52 | 1.87 | (3.94) |
| Distributions from net investment income | (.36) | (.36) | (.43) | (.46) | (.31) | (.37) |
| Distributions from net realized gain | (3.59) | (4.24) | (3.31) | – | (.34) | (.03) |
| Total distributions | (3.95) | (4.60) | (3.73)D | (.46) | (.65) | (.40) |
| Redemption fees added to paid in capitalA | –E | .05 | .01 | .01 | –E | .01 |
| Net asset value, end of period | $22.91 | $29.51 | $34.39 | $35.75 | $28.68 | $27.46 |
| Total ReturnF,G | (10.43)% | (1.14)% | 6.87%C | 26.58% | 7.02% | (12.56)% |
| Ratios to Average Net AssetsH,I | ||||||
| Expenses before reductions | 1.00%J | .97% | .98% | .97% | 1.04% | 1.06% |
| Expenses net of fee waivers, if any | 1.00%J | .97% | .98% | .97% | 1.04% | 1.06% |
| Expenses net of all reductions | 1.00%J | .95% | .98% | .93% | .98% | 1.01% |
| Net investment income (loss) | (.80)%J | 1.57%B | 1.01% | 1.32% | 1.66% | 1.38% |
| Supplemental Data | ||||||
| Net assets, end of period (000 omitted) | $15,760 | $26,961 | $19,404 | $10,206 | $1,958 | $2,034 |
| Portfolio turnover rateK | 80%J | 151% | 87% | 92% | 107% | 87% |
A Calculated based on average shares outstanding during the period.
B Net Investment income per share reflects a large, non-recurring dividend which amounted to $.13 per share. Excluding this non-recurring dividend, the ratio of net investment income (loss) to average net assets would have been 1.16%.
C Amount includes a reimbursement from the adviser for an operations error which amounted to $.01 per share. Excluding this reimbursement, the total return would have been 6.84%.
D Total distributions of $3.73 per share is comprised of distributions from net investment income of $.425 and distributions from net realized gain of $3.306 per share.
E Amount represents less than $.005 per share.
F Total returns for periods of less than one year are not annualized.
G Total returns would have been lower if certain expenses had not been reduced during the applicable periods shown.
H Fees and expenses of any underlying Fidelity Central Funds are not included in the Fund's expense ratio. The Fund indirectly bears its proportionate share of the expenses of any underlying Fidelity Central Funds.
I Expense ratios reflect operating expenses of the class. Expenses before reductions do not reflect amounts reimbursed by the investment adviser or reductions from brokerage service arrangements or reductions from other expense offset arrangements and do not represent the amount paid by the class during periods when reimbursements or reductions occur. Expenses net of fee waivers reflect expenses after reimbursement by the investment adviser but prior to reductions from brokerage service arrangements or other expense offset arrangements. Expenses net of all reductions represent the net expenses paid by the class.
J Annualized
K Amount does not include the portfolio activity of any underlying Fidelity Central Funds.
See accompanying notes which are an integral part of the financial statements.
Notes to Financial Statements (Unaudited)
For the period ended April 30, 2016
1. Organization.
Fidelity China Region Fund (the Fund) is a fund of Fidelity Investment Trust (the Trust) and is authorized to issue an unlimited number of shares. The Trust is registered under the Investment Company Act of 1940, as amended (the 1940 Act), as an open-end management investment company organized as a Massachusetts business trust. The Fund offers Class A, Class T, Class C, China Region and Class I shares, each of which, along with Class B shares, has equal rights as to assets and voting privileges. Class B shares are closed to new accounts and additional purchases, except for exchanges and reinvestments. Each class has exclusive voting rights with respect to matters that affect that class. Class B shares will automatically convert to Class A shares after a maximum holding period of seven years from the initial date of purchase. The Fund's investments in emerging markets can be subject to social, economic, regulatory, and political uncertainties and can be extremely volatile.
During the period, the Board of Trustees approved the conversion of all existing Class B shares into Class A shares, effective on or about July 1, 2016, regardless of the length of times shares have been held.
2. Investments in Fidelity Central Funds.
The Fund invests in Fidelity Central Funds, which are open-end investment companies generally available only to other investment companies and accounts managed by the investment adviser and its affiliates. The Fund's Schedule of Investments lists each of the Fidelity Central Funds held as of period end, if any, as an investment of the Fund, but does not include the underlying holdings of each Fidelity Central Fund. As an Investing Fund, the Fund indirectly bears its proportionate share of the expenses of the underlying Fidelity Central Funds.
The Money Market Central Funds seek preservation of capital and current income and are managed by Fidelity Investments Money Management, Inc. (FIMM), an affiliate of the investment adviser. Annualized expenses of the Money Market Central Funds as of their most recent shareholder report date are less than .005%.
A complete unaudited list of holdings for each Fidelity Central Fund is available upon request or at the Securities and Exchange Commission (the SEC) website at www.sec.gov. In addition, the financial statements of the Fidelity Central Funds are available on the SEC website or upon request.
3. Significant Accounting Policies.
The financial statements have been prepared in conformity with accounting principles generally accepted in the United States of America (GAAP), which require management to make certain estimates and assumptions at the date of the financial statements. Actual results could differ from those estimates. Subsequent events, if any, through the date that the financial statements were issued have been evaluated in the preparation of the financial statements. The following summarizes the significant accounting policies of the Fund:
Investment Valuation. Investments are valued as of 4:00 p.m. Eastern time on the last calendar day of the period. The Board of Trustees (the Board) has delegated the day to day responsibility for the valuation of the Fund's investments to the Fidelity Management & Research Company (FMR) Fair Value Committee (the Committee). In accordance with valuation policies and procedures approved by the Board, the Fund attempts to obtain prices from one or more third party pricing vendors or brokers to value its investments. When current market prices, quotations or currency exchange rates are not readily available or reliable, investments will be fair valued in good faith by the Committee, in accordance with procedures adopted by the Board. Factors used in determining fair value vary by investment type and may include market or investment specific events. The frequency with which these procedures are used cannot be predicted and they may be utilized to a significant extent. The Committee oversees the Fund's valuation policies and procedures and reports to the Board on the Committee's activities and fair value determinations. The Board monitors the appropriateness of the procedures used in valuing the Fund's investments and ratifies the fair value determinations of the Committee.
The Fund categorizes the inputs to valuation techniques used to value its investments into a disclosure hierarchy consisting of three levels as shown below:
- Level 1 – quoted prices in active markets for identical investments
- Level 2 – other significant observable inputs (including quoted prices for similar investments, interest rates, prepayment speeds, etc.)
- Level 3 – unobservable inputs (including the Fund's own assumptions based on the best information available)
Valuation techniques used to value the Fund's investments by major category are as follows:
Equity securities, including restricted securities, for which market quotations are readily available, are valued at the last reported sale price or official closing price as reported by a third party pricing vendor on the primary market or exchange on which they are traded and are categorized as Level 1 in the hierarchy. In the event there were no sales during the day or closing prices are not available, securities are valued at the last quoted bid price or may be valued using the last available price and are generally categorized as Level 2 in the hierarchy. For foreign equity securities, when market or security specific events arise, comparisons to the valuation of American Depositary Receipts (ADRs), futures contracts, Exchange-Traded Funds (ETFs) and certain indexes as well as quoted prices for similar securities may be used and would be categorized as Level 2 in the hierarchy. Utilizing these techniques may result in transfers between Level 1 and Level 2. For equity securities, including restricted securities, where observable inputs are limited, assumptions about market activity and risk are used and these securities may be categorized as Level 3 in the hierarchy. Equity securities, including restricted securities, for which observable inputs are not available are valued using alternative valuation approaches, including the market approach and the income approach and are categorized as level 3 in the hierarchy. The market approach generally consists of using comparable market transactions while the income approach generally consists of using the net present value of estimated future cash flows, adjusted as appropriate for liquidity, credit, market and/or other risk factors.
Investments in open-end mutual funds, including the Fidelity Central Funds, are valued at their closing net asset value (NAV) each business day and are categorized as Level 1 in the hierarchy.
The following provides information on Level 3 securities held by the Fund that were valued at period end based on unobservable inputs. These amounts exclude valuations provided by a broker.
| Asset Type | Fair Value at 04/30/16 | Valuation Technique (s) | Unobservable Input | Amount or Range / Weighted Average | Impact to Valuation from an Increase in Input* |
| Equities | $16,856,566 | Adjusted transaction price | Proxy movement | 45.0% | Increase |
| Last transaction price | Transaction price | $3.86 | Increase |
* Represents the expected directional change in the fair value of the Level 3 investments that would result from an increase in the corresponding input. A decrease to the unobservable input would have the opposite effect. Significant changes in these inputs could result in significantly higher or lower fair value measurements.
Changes in valuation techniques may result in transfers in or out of an assigned level within the disclosure hierarchy. The aggregate value of investments by input level as of April 30, 2016, including information on transfers between Levels 1 and 2, as well as a roll forward of Level 3 investments, is included at the end of the Fund's Schedule of Investments.
Foreign Currency. The Fund may use foreign currency contracts to facilitate transactions in foreign-denominated securities. Gains and losses from these transactions may arise from changes in the value of the foreign currency or if the counterparties do not perform under the contracts' terms.
Foreign-denominated assets, including investment securities, and liabilities are translated into U.S. dollars at the exchange rates at period end. Purchases and sales of investment securities, income and dividends received and expenses denominated in foreign currencies are translated into U.S. dollars at the exchange rate in effect on the transaction date.
The effects of exchange rate fluctuations on investments are included with the net realized and unrealized gain (loss) on investment securities. Other foreign currency transactions resulting in realized and unrealized gain (loss) are disclosed separately.
Investment Transactions and Income. For financial reporting purposes, the Fund's investment holdings and NAV include trades executed through the end of the last business day of the period. The NAV per share for processing shareholder transactions is calculated as of the close of business of the New York Stock Exchange (NYSE), normally 4:00 p.m. Eastern time and includes trades executed through the end of the prior business day. Gains and losses on securities sold are determined on the basis of identified cost and may include proceeds received from litigation. Dividend income is recorded on the ex-dividend date, except for certain dividends from foreign securities where the ex-dividend date may have passed, which are recorded as soon as the Fund is informed of the ex-dividend date. Non-cash dividends included in dividend income, if any, are recorded at the fair market value of the securities received. Income and capital gain distributions from Fidelity Central Funds, if any, are recorded on the ex-dividend date. Investment income is recorded net of foreign taxes withheld where recovery of such taxes is uncertain.
Class Allocations and Expenses. Investment income, realized and unrealized capital gains and losses, common expenses of the Fund, and certain fund-level expense reductions, if any, are allocated daily on a pro-rata basis to each class based on the relative net assets of each class to the total net assets of the Fund. Each class differs with respect to transfer agent and distribution and service plan fees incurred. Certain expense reductions may also differ by class. For the reporting period, the allocated portion of income and expenses to each class as a percent of its average net assets may vary due to the timing of recording these transactions in relation to fluctuating net assets of the classes. Expenses directly attributable to a fund are charged to that fund. Expenses attributable to more than one fund are allocated among the respective funds on the basis of relative net assets or other appropriate methods. Expense estimates are accrued in the period to which they relate and adjustments are made when actual amounts are known.
Income Tax Information and Distributions to Shareholders. Each year, the Fund intends to qualify as a regulated investment company under Subchapter M of the Internal Revenue Code, including distributing substantially all of its taxable income and realized gains. As a result, no provision for U.S. Federal income taxes is required. The Fund files a U.S. federal tax return, in addition to state and local tax returns as required. The Fund's federal income tax returns are subject to examination by the Internal Revenue Service (IRS) for a period of three fiscal years after they are filed. State and local tax returns may be subject to examination for an additional fiscal year depending on the jurisdiction. Foreign taxes are provided for based on the Fund's understanding of the tax rules and rates that exist in the foreign markets in which it invests. The Fund is subject to a tax imposed on capital gains by certain countries in which it invests.
Distributions are declared and recorded on the ex-dividend date. Income dividends and capital gain distributions are declared separately for each class. Income and capital gain distributions are determined in accordance with income tax regulations, which may differ from GAAP.
Capital accounts within the financial statements are adjusted for permanent book-tax differences. These adjustments have no impact on net assets or the results of operations. Capital accounts are not adjusted for temporary book-tax differences which will reverse in a subsequent period.
Book-tax differences are primarily due to foreign currency transactions, certain foreign taxes, passive foreign investment companies (PFIC), deferred trustees compensation and losses deferred due to wash sales.
The federal tax cost of investment securities and unrealized appreciation (depreciation) as of period end were as follows:
| Gross unrealized appreciation | $83,242,428 |
| Gross unrealized depreciation | (128,294,828) |
| Net unrealized appreciation (depreciation) on securities | $(45,052,400) |
| Tax cost | $1,129,452,707 |
Short-Term Trading (Redemption) Fees. Shares held by investors in the Fund less than 90 days may have been subject to a redemption fee equal to 1.50% of the NAV of shares redeemed. All redemption fees, which reduce the proceeds of the shareholder redemption, are retained by the Fund and accounted for as an addition to paid in capital.
Restricted Securities. The Fund may invest in securities that are subject to legal or contractual restrictions on resale. These securities generally may be resold in transactions exempt from registration or to the public if the securities are registered. Disposal of these securities may involve time-consuming negotiations and expense, and prompt sale at an acceptable price may be difficult. Information regarding restricted securities is included at the end of the Fund's Schedule of Investments.
4. Purchases and Sales of Investments.
Purchases and sales of securities, other than short-term securities, aggregated $452,226,068 and $594,988,343, respectively.
5. Fees and Other Transactions with Affiliates.
Management Fee. Fidelity Management & Research Company (the investment adviser) and its affiliates provide the Fund with investment management related services for which the Fund pays a monthly management fee. The management fee is the sum of an individual fund fee rate that is based on an annual rate of .45% of the Fund's average net assets and an annualized group fee rate that averaged .25% during the period. The group fee rate is based upon the average net assets of all the mutual funds advised by the investment adviser, including any mutual funds previously advised by the investment adviser that are currently advised by Fidelity SelectCo, LLC, an affiliate of the investment adviser. The group fee rate decreases as assets under management increase and increases as assets under management decrease. For the reporting period, the total annualized management fee rate was .70% of the Fund's average net assets.
Distribution and Service Plan Fees. In accordance with Rule 12b-1 of the 1940 Act, the Fund has adopted separate Distribution and Service Plans for each class of shares. Certain classes pay Fidelity Distributors Corporation (FDC), an affiliate of the investment adviser, separate Distribution and Service Fees, each of which is based on an annual percentage of each class' average net assets. In addition, FDC may pay financial intermediaries for selling shares of the Fund and providing shareholder support services. For the period, the Distribution and Service Fee rates, total fees and amounts retained by FDC were as follows:
| Distribution Fee | Service Fee | Total Fees | Retained by FDC | |
| Class A | -% | .25% | $33,035 | $1,879 |
| Class T | .25% | .25% | 13,818 | 160 |
| Class B | .75% | .25% | 3,184 | 2,388 |
| Class C | .75% | .25% | 60,815 | 25,390 |
| $110,852 | $29,817 |
Sales Load. FDC may receive a front-end sales charge of up to 5.75% for selling Class A shares and 3.50% for selling Class T shares, some of which is paid to financial intermediaries for selling shares of the Fund. Depending on the holding period, FDC may receive contingent deferred sales charges levied on Class A, Class T, Class B, and Class C redemptions. The deferred sales charges range from 5.00% to 1.00% for Class B shares, 1.00% for Class C shares, 1.00% for certain purchases of Class A shares and .25% for certain purchases of Class T shares.
For the period, sales charge amounts retained by FDC were as follows:
| Retained by FDC | |
| Class A | $35,646 |
| Class T | 1,702 |
| Class B(a) | 160 |
| Class C(a) | 6,468 |
| $43,976 |
(a) When Class B and Class C shares are initially sold, FDC pays commissions from its own resources to financial intermediaries through which the sales are made.
Transfer Agent Fees. Fidelity Investments Institutional Operations Company, Inc., (FIIOC), an affiliate of the investment adviser, is the transfer, dividend disbursing and shareholder servicing agent for each class of the Fund. FIIOC receives account fees and asset-based fees that vary according to the account size and type of account of the shareholders of the respective classes of the Fund. FIIOC pays for typesetting, printing and mailing of shareholder reports, except proxy statements.
For the period, transfer agent fees for each class were as follows:
| Amount | % of Class-Level Average Net Assets(a) | |
| Class A | $35,754 | .27 |
| Class T | 10,433 | .38 |
| Class B | 973 | .31 |
| Class C | 16,540 | .27 |
| China Region | 1,190,656 | .22 |
| Class I | 19,578 | .20 |
| $1,273,934 |
(a) Annualized
Accounting and Security Lending Fees. Fidelity Service Company, Inc. (FSC), an affiliate of the investment adviser, maintains the Fund's accounting records. The accounting fee is based on the level of average net assets for each month. Under a separate contract, FSC administers the security lending program. The security lending fee is based on the number and duration of lending transactions.
Brokerage Commissions. The Fund placed a portion of its portfolio transactions with brokerage firms which are affiliates of the investment adviser. Brokerage commissions are included in net realized gain (loss) and change in net unrealized appreciation (depreciation) in the Statement of Operations. The commissions paid to these affiliated firms were $1,217 for the period.
Interfund Lending Program. Pursuant to an Exemptive Order issued by the SEC, the Fund, along with other registered investment companies having management contracts with FMR or other affiliated entities of FMR, may participate in an interfund lending program. This program provides an alternative credit facility allowing the funds to borrow from, or lend money to, other participating affiliated funds. At period end, there were no interfund loans outstanding. The Fund's activity in this program during the period for which loans were outstanding was as follows:
| Borrower or Lender | Average Loan Balance | Weighted Average Interest Rate | Interest Expense |
| Borrower | $7,322,000 | .65% | $133 |
Interfund Trades. The Fund may purchase from or sell securities to other Fidelity Funds under procedures adopted by the Board. The procedures have been designed to ensure these interfund trades are executed in accordance with Rule 17a-7 of the 1940 Act. Interfund trades are included within the respective purchases and sales amounts shown in the Purchases and Sales of Investments note.
6. Committed Line of Credit.
The Fund participates with other funds managed by the investment adviser or an affiliate in a $4.25 billion credit facility (the "line of credit") to be utilized for temporary or emergency purposes to fund shareholder redemptions or for other short-term liquidity purposes. The Fund has agreed to pay commitment fees on its pro-rata portion of the line of credit, which amounted to $1,030 and is reflected in Miscellaneous expenses on the Statement of Operations. During the period, the Fund did not borrow on this line of credit.
7. Security Lending.
The Fund lends portfolio securities through a lending agent from time to time in order to earn additional income. For equity securities, a lending agent is used and may loan securities to certain qualified borrowers, including Fidelity Capital Markets (FCM), a broker-dealer affiliated with the Fund. On the settlement date of the loan, the Fund receives collateral (in the form of U.S. Treasury obligations, letters of credit and/or cash) against the loaned securities and maintains collateral in an amount not less than 100% of the market value of the loaned securities during the period of the loan. The market value of the loaned securities is determined at the close of business of the Fund and any additional required collateral is delivered to the Fund on the next business day. The Fund or borrower may terminate the loan at any time, and if the borrower defaults on its obligation to return the securities loaned because of insolvency or other reasons, the Fund may apply collateral received from the borrower against the obligation. The Fund may experience delays and costs in recovering the securities loaned. Any cash collateral received is invested in the Fidelity Securities Lending Cash Central Fund. The value of loaned securities and cash collateral at period end are disclosed on the Fund's Statement of Assets and Liabilities. Security lending income represents the income earned on investing cash collateral, less rebates paid to borrowers and any lending agent fees associated with the loan, plus any premium payments received for lending certain types of securities. Security lending income is presented in the Statement of Operations as a component of income from Fidelity Central Funds, and includes $9,957 from securities loaned to FCM.
8. Expense Reductions.
Commissions paid to certain brokers with whom the investment adviser, or its affiliates, places trades on behalf of the Fund include an amount in addition to trade execution, which may be rebated back to the Fund to offset certain expenses. This amount totaled $781 for the period.
In addition, during the period the investment adviser reimbursed and/or waived a portion of fund-level operating expenses in the amount of $4,567.
9. Distributions to Shareholders.
Distributions to shareholders of each class were as follows:
| Six months ended April 30, 2016 | Year ended October 31, 2015 | |
| From net investment income | ||
| Class A | $297,014 | $147,088 |
| Class T | 28,522 | 22,529 |
| Class C | 29,301 | 12,652 |
| China Region | 14,431,516 | 12,728,622 |
| Class I | 317,144 | 204,043 |
| Total | $15,103,497 | $13,114,934 |
| From net realized gain | ||
| Class A | $3,946,989 | $2,783,517 |
| Class T | 763,704 | 789,251 |
| Class B | 93,006 | 149,794 |
| Class C | 1,752,229 | 1,276,956 |
| China Region | 150,087,760 | 165,004,911 |
| Class I | 3,187,427 | 2,409,293 |
| Total | $159,831,115 | $172,413,722 |
10. Share Transactions.
Share transactions for each class were as follows and may contain automatic conversions between classes or exchanges between affiliated funds:
| Shares | Shares | Dollars | Dollars | |
| Six months ended April 30, 2016 | Year ended October 31, 2015 | Six months ended April 30, 2016 | Year ended October 31, 2015 | |
| Class A | ||||
| Shares sold | 147,013 | 1,058,546 | $3,579,372 | $35,978,665 |
| Reinvestment of distributions | 162,605 | 93,297 | 4,157,811 | 2,812,898 |
| Shares redeemed | (425,054) | (671,056) | (9,695,535) | (22,101,227) |
| Net increase (decrease) | (115,436) | 480,787 | $(1,958,352) | $16,690,336 |
| Class T | ||||
| Shares sold | 25,114 | 151,664 | $590,683 | $5,390,399 |
| Reinvestment of distributions | 30,599 | 26,640 | 781,504 | 801,072 |
| Shares redeemed | (45,663) | (143,989) | (1,080,869) | (4,554,275) |
| Net increase (decrease) | 10,050 | 34,315 | $291,318 | $1,637,196 |
| Class B | ||||
| Shares sold | 28 | 2,771 | $647 | $95,500 |
| Reinvestment of distributions | 3,443 | 4,834 | 87,630 | 144,877 |
| Shares redeemed | (7,534) | (15,827) | (179,703) | (523,534) |
| Net increase (decrease) | (4,063) | (8,222) | $(91,426) | $(283,157) |
| Class C | ||||
| Shares sold | 69,272 | 412,366 | $1,686,759 | $14,420,908 |
| Reinvestment of distributions | 55,713 | 38,139 | 1,398,404 | 1,131,586 |
| Shares redeemed | (112,880) | (261,252) | (2,721,043) | (7,778,046) |
| Net increase (decrease) | 12,105 | 189,253 | $364,120 | $7,774,448 |
| China Region | ||||
| Shares sold | 2,127,375 | 18,091,274 | $51,586,381 | $635,141,274 |
| Reinvestment of distributions | 6,142,435 | 5,608,420 | 158,659,097 | 170,439,887 |
| Shares redeemed | (7,626,217) | (20,336,385) | (183,247,122) | (642,334,138) |
| Net increase (decrease) | 643,593 | 3,363,309 | $26,998,356 | $163,247,023 |
| Class I | ||||
| Shares sold | 193,468 | 1,017,162 | $5,004,992 | $33,130,120 |
| Reinvestment of distributions | 99,936 | 58,945 | 2,565,348 | 1,781,897 |
| Shares redeemed | (518,949) | (726,796) | (12,663,087) | (23,738,935) |
| Net increase (decrease) | (225,545) | 349,311 | $(5,092,747) | $11,173,082 |
11. Other.
The Fund's organizational documents provide former and current trustees and officers with a limited indemnification against liabilities arising in connection with the performance of their duties to the Fund. In the normal course of business, the Fund may also enter into contracts that provide general indemnifications. The Fund's maximum exposure under these arrangements is unknown as this would be dependent on future claims that may be made against the Fund. The risk of material loss from such claims is considered remote.
Fidelity® Emerging Asia Fund
Investment Summary (Unaudited)
Geographic Diversification (% of fund's net assets)
| As of April 30, 2016 | ||
| Korea (South) | 18.3% | |
| Cayman Islands | 15.1% | |
| China | 13.8% | |
| Taiwan | 13.6% | |
| Hong Kong | 12.4% | |
| India | 9.8% | |
| Singapore | 3.8% | |
| Bermuda | 2.8% | |
| Thailand | 2.3% | |
| Other* | 8.1% | |

* Includes Short-Term investments and Net Other Assets (Liabilities).
Percentages are based on country or territory of incorporation and are adjusted for the effect of futures contracts, if applicable.
| As of October 31, 2015 | ||
| Korea (South) | 16.5% | |
| China | 16.3% | |
| Taiwan | 12.5% | |
| Cayman Islands | 12.3% | |
| Hong Kong | 12.1% | |
| India | 9.1% | |
| United States of America* | 7.1% | |
| Singapore | 4.1% | |
| Bermuda | 2.2% | |
| Other | 7.8% | |

* Includes Short-Term investments and Net Other Assets (Liabilities).
Percentages are based on country or territory of incorporation and are adjusted for the effect of futures contracts, if applicable.
Asset Allocation as of April 30, 2016
| % of fund's net assets | % of fund's net assets 6 months ago | |
| Stocks | 99.0 | 93.6 |
| Bonds | 0.0 | 0.0 |
| Short-Term Investments and Net Other Assets (Liabilities) | 1.0 | 6.4 |
Top Ten Stocks as of April 30, 2016
| % of fund's net assets | % of fund's net assets 6 months ago | |
| Samsung Electronics Co. Ltd. (Korea (South), Technology Hardware, Storage & Peripherals) | 5.0 | 6.0 |
| Taiwan Semiconductor Manufacturing Co. Ltd. (Taiwan, Semiconductors & Semiconductor Equipment) | 4.5 | 3.9 |
| Tencent Holdings Ltd. (Cayman Islands, Internet Software & Services) | 4.1 | 3.5 |
| AIA Group Ltd. (Hong Kong, Insurance) | 2.8 | 2.7 |
| China Construction Bank Corp. (H Shares) (China, Banks) | 2.5 | 2.6 |
| Alibaba Group Holding Ltd. sponsored ADR (Cayman Islands, Internet Software & Services) | 2.0 | 0.7 |
| Hon Hai Precision Industry Co. Ltd. (Foxconn) (Taiwan, Electronic Equipment & Components) | 1.8 | 1.8 |
| Industrial & Commercial Bank of China Ltd. (H Shares) (China, Banks) | 1.7 | 1.8 |
| CNOOC Ltd. sponsored ADR (Hong Kong, Oil, Gas & Consumable Fuels) | 1.6 | 1.4 |
| China Mobile Ltd. (Hong Kong, Wireless Telecommunication Services) | 1.4 | 1.5 |
| 27.4 |
Market Sectors as of April 30, 2016
| % of fund's net assets | % of fund's net assets 6 months ago | |
| Financials | 31.7 | 33.2 |
| Information Technology | 23.0 | 20.9 |
| Consumer Discretionary | 9.1 | 8.7 |
| Telecommunication Services | 6.0 | 6.8 |
| Industrials | 5.9 | 5.2 |
| Consumer Staples | 5.5 | 3.3 |
| Utilities | 5.4 | 6.2 |
| Energy | 5.3 | 4.8 |
| Materials | 5.2 | 2.9 |
| Health Care | 1.9 | 1.6 |
Percentages shown as 0.0% may reflect amounts less than 0.05%.
Fidelity® Emerging Asia Fund
Investments April 30, 2016 (Unaudited)
Showing Percentage of Net Assets
| Common Stocks - 99.0% | |||
| Shares | Value | ||
| Australia - 0.2% | |||
| Beacon Lighting Group Ltd. | 438,521 | $606,842 | |
| Sino Gas & Energy Ltd. (a) | 4,797,856 | 324,676 | |
| Woodside Petroleum Ltd. | 47,102 | 1,014,969 | |
| TOTAL AUSTRALIA | 1,946,487 | ||
| Bermuda - 2.8% | |||
| Brilliance China Automotive Holdings Ltd. | 3,062,000 | 3,020,190 | |
| BW LPG Ltd. | 33,694 | 202,536 | |
| Cheung Kong Infrastructure Holdings Ltd. | 338,000 | 3,189,846 | |
| CSI Properties Ltd. | 31,520,000 | 957,393 | |
| Digital China Holdings Ltd. (H Shares) | 1,206,000 | 832,604 | |
| Great Eagle Holdings Ltd. | 153,000 | 619,759 | |
| Hongkong Land Holdings Ltd. | 675,600 | 4,290,060 | |
| Joy City Property Ltd. | 2,692,000 | 390,541 | |
| Kerry Logistics Network Ltd. | 1,607,000 | 2,262,271 | |
| PAX Global Technology Ltd. | 2,382,000 | 2,051,428 | |
| Shenzhen International Holdings Ltd. | 2,077,000 | 3,389,392 | |
| Skyworth Digital Holdings Ltd. | 5,505,200 | 3,582,845 | |
| Summit Ascent Holdings Ltd. (a) | 978,000 | 209,707 | |
| Tai Cheung Holdings Ltd. | 244,000 | 186,661 | |
| TOTAL BERMUDA | 25,185,233 | ||
| Cayman Islands - 15.1% | |||
| 58.com, Inc. ADR (a) | 56,000 | 3,060,400 | |
| Alibaba Group Holding Ltd. sponsored ADR (a) | 240,700 | 18,519,458 | |
| AMVIG Holdings Ltd. | 1,270,000 | 522,932 | |
| Belle International Holdings Ltd. | 2,588,000 | 1,578,308 | |
| Bitauto Holdings Ltd. ADR (a) | 42,800 | 1,068,288 | |
| Cheung Kong Property Holdings Ltd. | 1,636,000 | 11,173,047 | |
| China Modern Dairy Holdings Ltd. | 6,486,000 | 1,190,387 | |
| China Resources Cement Holdings Ltd. | 9,945,706 | 3,272,671 | |
| China State Construction International Holdings Ltd. | 2,558,000 | 3,984,609 | |
| ChinaCache International Holdings Ltd. sponsored ADR (a)(b) | 63,600 | 525,972 | |
| CK Hutchison Holdings Ltd. | 985,500 | 11,790,150 | |
| Cosmo Lady (China) Holdings Co. Ltd. | 552,000 | 428,410 | |
| Ctrip.com International Ltd. ADR (a) | 84,200 | 3,671,962 | |
| Daqo New Energy Corp. ADR (a)(b) | 24,933 | 647,011 | |
| ENN Energy Holdings Ltd. | 934,000 | 4,555,715 | |
| Greatview Aseptic Pack Co. Ltd. | 2,085,000 | 1,055,898 | |
| Haitian International Holdings Ltd. | 564,000 | 962,276 | |
| iKang Healthcare Group, Inc. sponsored ADR (a) | 20,600 | 442,488 | |
| International Housewares Retail Co. Ltd. | 6,982,000 | 1,141,138 | |
| JD.com, Inc. sponsored ADR (a) | 132,000 | 3,373,920 | |
| KWG Property Holding Ltd. | 1,350,500 | 873,776 | |
| Lee & Man Paper Manufacturing Ltd. | 4,934,000 | 3,233,863 | |
| Lee's Pharmaceutical Holdings Ltd. | 333,500 | 269,848 | |
| Longfor Properties Co. Ltd. | 3,094,000 | 4,340,621 | |
| MGM China Holdings Ltd. | 3,785,200 | 5,303,316 | |
| New Oriental Education & Technology Group, Inc. sponsored ADR | 64,500 | 2,525,820 | |
| Pico Far East Holdings Ltd. | 1,932,000 | 523,801 | |
| Samson Holding Ltd. | 4,079,000 | 467,492 | |
| SITC International Holdings Co. Ltd. | 2,863,000 | 1,547,369 | |
| Sitoy Group Holdings Ltd. | 1,108,000 | 402,300 | |
| SOHO China Ltd. | 2,636,500 | 1,325,527 | |
| Stella International Holdings Ltd. | 425,000 | 1,072,201 | |
| TAL Education Group ADR (a) | 38,600 | 2,233,396 | |
| TCC International Holdings Ltd. | 2,076,000 | 416,064 | |
| Tencent Holdings Ltd. | 1,812,800 | 36,887,427 | |
| Uni-President China Holdings Ltd. | 2,383,000 | 2,219,213 | |
| Xingda International Holdings Ltd. | 2,193,000 | 458,924 | |
| Zhen Ding Technology Holding Ltd. | 282,000 | 592,756 | |
| TOTAL CAYMAN ISLANDS | 137,658,754 | ||
| China - 13.8% | |||
| Anhui Conch Cement Co. Ltd. (H Shares) | 918,500 | 2,420,311 | |
| BBMG Corp. (H Shares) | 4,464,000 | 3,262,415 | |
| Beijing Jingneng Clean Energy Co. Ltd. (H Shares) | 3,018,000 | 952,205 | |
| Beijing Urban Consolidated & Development Group Ltd. (H Shares) | 1,574,000 | 909,157 | |
| China Construction Bank Corp. (H Shares) | 35,882,000 | 22,789,629 | |
| China Pacific Insurance (Group) Co. Ltd. (H Shares) | 2,081,200 | 7,297,616 | |
| China Petroleum & Chemical Corp. (H Shares) | 12,382,000 | 8,725,406 | |
| China Railway Construction Corp. Ltd. (H Shares) | 3,423,000 | 4,351,635 | |
| China Shipping Development Co. Ltd. (H Shares) | 1,886,000 | 1,339,175 | |
| China Telecom Corp. Ltd. (H Shares) | 17,810,000 | 8,817,131 | |
| China Vanke Co. Ltd. (H Shares) | 1,906,700 | 4,759,172 | |
| Chongqing Changan Automobile Co. Ltd. (B Shares) | 759,543 | 1,314,065 | |
| Huadian Fuxin Energy Corp. Ltd. (H Shares) | 6,500,000 | 1,415,910 | |
| Huadian Power International Corp. Ltd. (H Shares) | 3,846,000 | 1,972,105 | |
| Huaneng Renewables Corp. Ltd. (H Shares) | 13,448,000 | 3,968,295 | |
| Huangshan Tourism Development Co. Ltd. | 284,920 | 597,762 | |
| Industrial & Commercial Bank of China Ltd. (H Shares) | 29,145,000 | 15,604,260 | |
| Jiangling Motors Corp. Ltd. (B Shares) | 303,894 | 838,001 | |
| Jiangsu Hengrui Medicine Co. Ltd. | 500,926 | 3,611,839 | |
| Kweichow Moutai Co. Ltd. | 135,645 | 5,263,170 | |
| PICC Property & Casualty Co. Ltd. (H Shares) | 2,993,120 | 5,444,718 | |
| Ping An Insurance (Group) Co. of China Ltd. (H Shares) | 2,562,500 | 12,026,027 | |
| SAIC Motor Corp. Ltd. | 425,958 | 1,338,264 | |
| Shenzhen Expressway Co. (H Shares) | 3,798,000 | 3,370,746 | |
| Tong Ren Tang Technologies Co. Ltd. (H Shares) | 625,000 | 979,101 | |
| TravelSky Technology Ltd. (H Shares) | 900,000 | 1,672,496 | |
| TOTAL CHINA | 125,040,611 | ||
| Hong Kong - 12.4% | |||
| AIA Group Ltd. | 4,263,600 | 25,515,966 | |
| China Everbright Ltd. | 1,606,000 | 3,170,339 | |
| China Mobile Ltd. | 1,109,900 | 12,742,509 | |
| China Resources Beer Holdings Co. Ltd. | 1,424,000 | 3,129,113 | |
| China Resources Power Holdings Co. Ltd. | 1,696,000 | 2,856,486 | |
| CNOOC Ltd. sponsored ADR (b) | 115,800 | 14,293,194 | |
| Dah Sing Banking Group Ltd. | 566,400 | 1,007,673 | |
| Far East Horizon Ltd. | 2,722,000 | 2,160,662 | |
| Hang Lung Properties Ltd. | 2,071,000 | 4,123,722 | |
| HKT Trust/HKT Ltd. unit | 3,131,300 | 4,501,057 | |
| Hysan Development Co. Ltd. | 1,175,000 | 5,191,699 | |
| Lenovo Group Ltd. | 6,074,000 | 4,805,091 | |
| Magnificent Hotel Investment L | 6,930,000 | 171,233 | |
| PCCW Ltd. | 11,517,000 | 7,795,666 | |
| Power Assets Holdings Ltd. | 639,000 | 6,079,503 | |
| Sino Land Ltd. | 3,704,000 | 5,815,076 | |
| Techtronic Industries Co. Ltd. | 1,312,500 | 4,920,129 | |
| Wheelock and Co. Ltd. | 963,000 | 4,458,311 | |
| TOTAL HONG KONG | 112,737,429 | ||
| India - 9.8% | |||
| Adani Ports & Special Economic Zone | 383,179 | 1,374,069 | |
| Apollo Tyres Ltd. | 1,467,806 | 3,538,839 | |
| Bajaj Finserv Ltd. | 92,703 | 2,617,226 | |
| Bharat Petroleum Corp. Ltd. (a) | 214,556 | 3,158,964 | |
| Bharti Infratel Ltd. | 397,798 | 2,245,438 | |
| Cox & Kings India Ltd. (a) | 728,006 | 2,048,923 | |
| Edelweiss Financial Services Ltd. | 2,273,486 | 1,986,825 | |
| Exide Industries Ltd. (a) | 228,254 | 505,986 | |
| HCL Technologies Ltd. | 311,503 | 3,518,539 | |
| Hexaware Technologies Ltd. | 533,980 | 1,938,954 | |
| IL&FS Transportation Networks Ltd. | 335,845 | 376,922 | |
| Indian Oil Corp. Ltd. (a) | 648,071 | 4,226,942 | |
| Jain Irrigation Systems Ltd. (a) | 492,485 | 453,001 | |
| JK Tyre & Industries Ltd. (a) | 1,242,243 | 1,572,779 | |
| Just Dial Ltd. | 57,855 | 737,237 | |
| LIC Housing Finance Ltd. (a) | 151,373 | 1,053,507 | |
| Mahindra & Mahindra Ltd. (a) | 309,624 | 6,203,853 | |
| McLeod Russel India Ltd. (a) | 384,327 | 1,100,755 | |
| NTPC Ltd. | 1,872,238 | 3,926,244 | |
| Petronet LNG Ltd. | 1,055,640 | 4,188,360 | |
| Power Finance Corp. Ltd. | 808,042 | 2,181,727 | |
| Power Grid Corp. of India Ltd. | 645,755 | 1,394,062 | |
| Redington India Ltd. (a) | 533,540 | 872,292 | |
| Reliance Capital Ltd. (a) | 73,076 | 445,053 | |
| Reliance Industries Ltd. | 773,397 | 11,441,649 | |
| Shriram City Union Finance Ltd. | 42,095 | 1,043,701 | |
| Sun Pharmaceutical Industries Ltd. | 520,832 | 6,361,277 | |
| Suzlon Energy Ltd. (a) | 9,081,865 | 2,044,002 | |
| The Jammu & Kashmir Bank Ltd. | 1,080,744 | 1,117,750 | |
| Torrent Pharmaceuticals Ltd. | 125,427 | 2,700,649 | |
| UPL Ltd. | 381,746 | 3,091,300 | |
| Vakrangee Ltd. (a) | 172,201 | 511,998 | |
| VST Industries Ltd. (a) | 42,310 | 1,040,592 | |
| Yes Bank Ltd. (a) | 566,055 | 8,035,492 | |
| TOTAL INDIA | 89,054,907 | ||
| Indonesia - 1.9% | |||
| PT ACE Hardware Indonesia Tbk | 12,337,500 | 865,346 | |
| PT Bank Rakyat Indonesia Tbk | 11,143,200 | 8,745,232 | |
| PT Gudang Garam Tbk | 880,500 | 4,623,493 | |
| PT Indofood Sukses Makmur Tbk | 5,370,200 | 2,901,325 | |
| TOTAL INDONESIA | 17,135,396 | ||
| Israel - 0.1% | |||
| Sarine Technologies Ltd. | 466,400 | 572,227 | |
| Japan - 0.9% | |||
| KDDI Corp. | 169,100 | 4,871,050 | |
| NGK Insulators Ltd. | 150,000 | 3,080,484 | |
| TOTAL JAPAN | 7,951,534 | ||
| Korea (South) - 18.3% | |||
| AMOREPACIFIC Corp. | 20,779 | 7,390,789 | |
| AMOREPACIFIC Group, Inc. | 30,585 | 4,484,937 | |
| BGFretail Co. Ltd. | 5,318 | 863,376 | |
| Daelim Industrial Co. | 38,599 | 3,055,779 | |
| DGB Financial Group Co. Ltd. | 277,359 | 2,219,986 | |
| Dongbu Insurance Co. Ltd. | 99,942 | 6,115,115 | |
| Duksan Hi-Metal Co. Ltd. (a) | 69,051 | 571,369 | |
| Fila Korea Ltd. | 5,402 | 490,373 | |
| Hana Financial Group, Inc. | 117,013 | 2,619,751 | |
| Hyosung Corp. | 31,512 | 3,369,385 | |
| Hyundai Fire & Marine Insurance Co. Ltd. | 82,358 | 2,285,975 | |
| Hyundai Mobis | 34,267 | 7,791,523 | |
| Hyundai Motor Co. | 99,070 | 12,408,881 | |
| Hyundai Steel Co. | 115,721 | 6,353,330 | |
| KB Financial Group, Inc. | 227,440 | 6,920,894 | |
| Kiwoom Securities Co. Ltd. | 28,327 | 1,678,839 | |
| Korea Electric Power Corp. | 138,630 | 7,488,966 | |
| Korea Petro Chemical Industries Co. Ltd. | 26,319 | 5,410,020 | |
| Korea Zinc Co. Ltd. | 12,240 | 5,293,753 | |
| LG Chemical Ltd. | 26,642 | 6,906,561 | |
| LG Household & Health Care Ltd. | 8,095 | 7,115,164 | |
| LS Industrial Systems Ltd. | 53,956 | 2,463,088 | |
| Poongsan Corp. | 43,436 | 1,207,530 | |
| Samsung Card Co. Ltd. | 63,208 | 2,140,634 | |
| Samsung Electronics Co. Ltd. | 42,285 | 45,950,928 | |
| Shinhan Financial Group Co. Ltd. | 326,861 | 11,919,026 | |
| SK Telecom Co. Ltd. | 12,553 | 2,267,130 | |
| SL Corp. | 6,418 | 89,351 | |
| TOTAL KOREA (SOUTH) | 166,872,453 | ||
| Malaysia - 1.9% | |||
| AEON Credit Service Bhd | 165,700 | 559,049 | |
| Cahya Mata Sarawak Bhd | 723,400 | 711,086 | |
| Glomac Bhd | 1,592,200 | 332,175 | |
| Media Prima Bhd | 3,540,600 | 1,277,933 | |
| MISC Bhd | 769,800 | 1,665,125 | |
| Sunway Bhd | 1,353,500 | 1,084,463 | |
| Tenaga Nasional Bhd | 2,199,500 | 8,085,196 | |
| Top Glove Corp. Bhd | 536,800 | 681,564 | |
| YTL Power International Bhd | 8,024,300 | 3,081,134 | |
| TOTAL MALAYSIA | 17,477,725 | ||
| Netherlands - 0.2% | |||
| Gree Electric Appliances, Inc. of Zhuhai ELS (BNP Paribas Warrants Program) (A Shares)warrants 11/24/16 (a)(c) | 577,300 | 1,713,874 | |
| Hangzhou Hikvision Digital Technology Co. Ltd. ELS (BNP Paribas Warrant Program) warrants 11/27/17 (a)(c) | 103,800 | 488,533 | |
| TOTAL NETHERLANDS | 2,202,407 | ||
| Philippines - 0.9% | |||
| ABS CBN Broadcasting Corp. (depositary receipt) | 357,700 | 441,089 | |
| LT Group, Inc. | 1,319,300 | 431,960 | |
| Metro Pacific Investments Corp. | 13,203,200 | 1,628,119 | |
| Metropolitan Bank & Trust Co. | 2,388,671 | 4,126,279 | |
| Security Bank Corp. | 530,998 | 1,919,202 | |
| TOTAL PHILIPPINES | 8,546,649 | ||
| Singapore - 3.8% | |||
| Boustead Singapore Ltd. | 630,288 | 365,561 | |
| CapitaLand Ltd. | 1,603,600 | 3,708,366 | |
| Centurion Corp. Ltd. | 927,500 | 258,626 | |
| CWT Ltd. | 422,000 | 649,545 | |
| Frasers Centrepoint Ltd. | 438,000 | 543,897 | |
| Hyflux Ltd. | 1,003,300 | 462,539 | |
| Mapletree Industrial (REIT) | 2,768,751 | 3,304,343 | |
| Singapore Telecommunications Ltd. | 2,851,400 | 8,184,113 | |
| United Overseas Bank Ltd. | 798,600 | 11,045,068 | |
| UOL Group Ltd. | 602,000 | 2,748,470 | |
| Wing Tai Holdings Ltd. | 2,006,800 | 2,797,896 | |
| Yoma Strategic Holdings Ltd. (a) | 1,397,300 | 561,060 | |
| TOTAL SINGAPORE | 34,629,484 | ||
| Taiwan - 13.6% | |||
| Advanced Semiconductor Engineering, Inc. | 5,635,000 | 5,413,802 | |
| ASUSTeK Computer, Inc. | 435,000 | 3,817,679 | |
| Cathay Financial Holding Co. Ltd. | 6,795,000 | 7,625,259 | |
| China Life Insurance Co. Ltd. | 2,998,600 | 2,260,345 | |
| E.SUN Financial Holdings Co. Ltd. | 12,797,312 | 7,091,350 | |
| Fubon Financial Holding Co. Ltd. | 6,424,000 | 7,805,529 | |
| Hon Hai Precision Industry Co. Ltd. (Foxconn) | 6,819,600 | 16,276,852 | |
| Mega Financial Holding Co. Ltd. | 4,787,000 | 3,393,564 | |
| Nanya Technology Corp. | 352,000 | 410,810 | |
| Nien Made Enterprise Co. Ltd. | 65,909 | 518,246 | |
| Novatek Microelectronics Corp. | 413,000 | 1,444,727 | |
| PChome Online, Inc. | 85,053 | 901,794 | |
| Pegatron Corp. | 3,574,000 | 7,556,704 | |
| Pou Chen Corp. | 2,823,000 | 3,556,824 | |
| Powertech Technology, Inc. | 637,000 | 1,289,657 | |
| Taiwan Semiconductor Manufacturing Co. Ltd. | 8,993,192 | 41,254,096 | |
| Unified-President Enterprises Corp. | 3,365,000 | 6,062,688 | |
| Vanguard International Semiconductor Corp. | 1,506,000 | 2,305,411 | |
| Wistron NeWeb Corp. | 677,661 | 1,762,175 | |
| Yuanta Financial Holding Co. Ltd. | 7,690,560 | 2,535,506 | |
| TOTAL TAIWAN | 123,283,018 | ||
| Thailand - 2.3% | |||
| Asian Property Development PCL (For. Reg.) | 13,639,800 | 2,343,608 | |
| Bangkok Expressway and Metro PCL | 12,354,687 | 2,105,108 | |
| Intouch Holdings PCL NVDR | 1,431,200 | 2,161,964 | |
| Kasikornbank PCL (For. Reg.) | 1,767,400 | 8,452,343 | |
| Preuksa Real Estate PCL (For. Reg.) | 2,512,300 | 1,852,569 | |
| Thai Beverage PCL | 6,959,000 | 3,855,043 | |
| TOTAL THAILAND | 20,770,635 | ||
| United Kingdom - 0.3% | |||
| Standard Chartered PLC (United Kingdom) | 295,723 | 2,385,600 | |
| United States of America - 0.7% | |||
| China Biologic Products, Inc. (a) | 25,200 | 2,948,400 | |
| Cognizant Technology Solutions Corp. Class A (a) | 29,700 | 1,733,589 | |
| Las Vegas Sands Corp. | 40,100 | 1,810,515 | |
| TOTAL UNITED STATES OF AMERICA | 6,492,504 | ||
| TOTAL COMMON STOCKS | |||
| (Cost $937,548,859) | 899,943,053 | ||
| Principal Amount(d) | Value | ||
| Nonconvertible Bonds - 0.0% | |||
| India - 0.0% | |||
| NTPC Ltd. 8.49% 3/25/25 (Cost $449,651) | INR | 2,245,016 | 432,872 |
| Shares | Value | ||
| Money Market Funds - 1.8% | |||
| Fidelity Cash Central Fund, 0.38% (e) | 10,123,465 | 10,123,465 | |
| Fidelity Securities Lending Cash Central Fund, 0.42% (e)(f) | 6,648,250 | 6,648,250 | |
| TOTAL MONEY MARKET FUNDS | |||
| (Cost $16,771,715) | 16,771,715 | ||
| TOTAL INVESTMENT PORTFOLIO - 100.8% | |||
| (Cost $954,770,225) | 917,147,640 | ||
| NET OTHER ASSETS (LIABILITIES) - (0.8)% | (7,710,305) | ||
| NET ASSETS - 100% | $909,437,335 |
Currency Abbreviations
INR – Indian rupee
Categorizations in the Schedule of Investments are based on country or territory of incorporation.
Legend
(a) Non-income producing
(b) Security or a portion of the security is on loan at period end.
(c) Security exempt from registration under Rule 144A of the Securities Act of 1933. These securities may be resold in transactions exempt from registration, normally to qualified institutional buyers. At the end of the period, the value of these securities amounted to $2,202,407 or 0.2% of net assets.
(d) Amount is stated in United States dollars unless otherwise noted.
(e) Affiliated fund that is generally available only to investment companies and other accounts managed by Fidelity Investments. The rate quoted is the annualized seven-day yield of the fund at period end. A complete unaudited listing of the fund's holdings as of its most recent quarter end is available upon request. In addition, each Fidelity Central Fund's financial statements are available on the SEC's website or upon request.
(f) Investment made with cash collateral received from securities on loan.
Affiliated Central Funds
Information regarding fiscal year to date income earned by the Fund from investments in Fidelity Central Funds is as follows:
| Fund | Income earned |
| Fidelity Cash Central Fund | $34,602 |
| Fidelity Securities Lending Cash Central Fund | 21,617 |
| Total | $56,219 |
Investment Valuation
The following is a summary of the inputs used, as of April 30, 2016, involving the Fund's assets and liabilities carried at fair value. The inputs or methodology used for valuing securities may not be an indication of the risk associated with investing in those securities. For more information on valuation inputs, and their aggregation into the levels used below, please refer to the Investment Valuation section in the accompanying Notes to Financial Statements.
| Valuation Inputs at Reporting Date: | ||||
| Description | Total | Level 1 | Level 2 | Level 3 |
| Investments in Securities: | ||||
| Equities: | ||||
| Consumer Discretionary | $82,949,406 | $59,879,119 | $23,070,287 | $-- |
| Consumer Staples | 51,240,045 | 44,701,332 | 6,538,713 | -- |
| Energy | 47,942,257 | 39,216,851 | 8,725,406 | -- |
| Financials | 288,955,455 | 128,680,933 | 160,274,522 | -- |
| Health Care | 17,995,166 | 16,746,217 | 1,248,949 | -- |
| Industrials | 53,098,883 | 15,901,912 | 37,196,971 | -- |
| Information Technology | 208,931,544 | 116,014,600 | 92,916,944 | -- |
| Materials | 45,816,033 | 31,631,879 | 14,184,154 | -- |
| Telecommunication Services | 53,586,058 | 12,591,515 | 40,994,543 | -- |
| Utilities | 49,428,206 | 16,949,175 | 32,479,031 | -- |
| Corporate Bonds | 432,872 | -- | 432,872 | -- |
| Money Market Funds | 16,771,715 | 16,771,715 | -- | -- |
| Total Investments in Securities: | $917,147,640 | $499,085,248 | $418,062,392 | $-- |
The following is a summary of transfers between Level 1 and Level 2 for the period ended April 30, 2016. Transfers are assumed to have occurred at the beginning of the period, and are primarily attributable to the valuation techniques used for foreign equity securities, as discussed in the accompanying Notes to Financial Statements:
| Transfers | Total |
| Level 1 to Level 2 | $0 |
| Level 2 to Level 1 | $172,752,904 |
See accompanying notes which are an integral part of the financial statements.
Fidelity® Emerging Asia Fund
Financial Statements
Statement of Assets and Liabilities
| April 30, 2016 (Unaudited) | ||
| Assets | ||
| Investment in securities, at value (including securities loaned of $6,396,128) — See accompanying schedule: Unaffiliated issuers (cost $937,998,510) | $900,375,925 | |
| Fidelity Central Funds (cost $16,771,715) | 16,771,715 | |
| Total Investments (cost $954,770,225) | $917,147,640 | |
| Foreign currency held at value (cost $269,472) | 270,232 | |
| Receivable for investments sold | 431,082 | |
| Receivable for fund shares sold | 196,350 | |
| Dividends receivable | 810,230 | |
| Interest receivable | 291 | |
| Distributions receivable from Fidelity Central Funds | 8,940 | |
| Prepaid expenses | 793 | |
| Other receivables | 389,783 | |
| Total assets | 919,255,341 | |
| Liabilities | ||
| Payable for fund shares redeemed | $2,265,748 | |
| Accrued management fee | 614,596 | |
| Other affiliated payables | 193,227 | |
| Other payables and accrued expenses | 96,185 | |
| Collateral on securities loaned, at value | 6,648,250 | |
| Total liabilities | 9,818,006 | |
| Net Assets | $909,437,335 | |
| Net Assets consist of: | ||
| Paid in capital | $1,065,661,149 | |
| Distributions in excess of net investment income | (825,954) | |
| Accumulated undistributed net realized gain (loss) on investments and foreign currency transactions | (117,597,820) | |
| Net unrealized appreciation (depreciation) on investments and assets and liabilities in foreign currencies | (37,800,040) | |
| Net Assets, for 30,011,920 shares outstanding | $909,437,335 | |
| Net Asset Value, offering price and redemption price per share ($909,437,335 ÷ 30,011,920 shares) | $30.30 |
See accompanying notes which are an integral part of the financial statements.
Statement of Operations
| Six months ended April 30, 2016 (Unaudited) | ||
| Investment Income | ||
| Dividends | $7,243,922 | |
| Interest | 34,718 | |
| Income from Fidelity Central Funds | 56,219 | |
| Income before foreign taxes withheld | 7,334,859 | |
| Less foreign taxes withheld | (728,852) | |
| Total income | 6,606,007 | |
| Expenses | ||
| Management fee | ||
| Basic fee | $3,206,289 | |
| Performance adjustment | 567,029 | |
| Transfer agent fees | 955,360 | |
| Accounting and security lending fees | 216,839 | |
| Custodian fees and expenses | 204,847 | |
| Independent trustees' compensation | 2,056 | |
| Registration fees | 18,758 | |
| Audit | 59,110 | |
| Legal | 1,335 | |
| Miscellaneous | 3,412 | |
| Total expenses before reductions | 5,235,035 | |
| Expense reductions | (6,831) | 5,228,204 |
| Net investment income (loss) | 1,377,803 | |
| Realized and Unrealized Gain (Loss) | ||
| Net realized gain (loss) on: | ||
| Investment securities: | ||
| Unaffiliated issuers | (12,063,231) | |
| Foreign currency transactions | (76,987) | |
| Total net realized gain (loss) | (12,140,218) | |
| Change in net unrealized appreciation (depreciation) on: Investment securities (net of decrease in deferred foreign taxes of $1,899) | (16,495,739) | |
| Assets and liabilities in foreign currencies | 5,489 | |
| Total change in net unrealized appreciation (depreciation) | (16,490,250) | |
| Net gain (loss) | (28,630,468) | |
| Net increase (decrease) in net assets resulting from operations | $(27,252,665) |
See accompanying notes which are an integral part of the financial statements.
Statement of Changes in Net Assets
| Six months ended April 30, 2016 (Unaudited) | Year ended October 31, 2015 | |
| Increase (Decrease) in Net Assets | ||
| Operations | ||
| Net investment income (loss) | $1,377,803 | $14,020,781 |
| Net realized gain (loss) | (12,140,218) | 31,654,705 |
| Change in net unrealized appreciation (depreciation) | (16,490,250) | (108,963,314) |
| Net increase (decrease) in net assets resulting from operations | (27,252,665) | (63,287,828) |
| Distributions to shareholders from net investment income | (4,222,099) | (9,800,314) |
| Share transactions | ||
| Proceeds from sales of shares | 19,735,295 | 198,826,376 |
| Reinvestment of distributions | 3,878,736 | 9,282,114 |
| Cost of shares redeemed | (90,894,093) | (238,285,271) |
| Net increase (decrease) in net assets resulting from share transactions | (67,280,062) | (30,176,781) |
| Redemption fees | 13,706 | 166,559 |
| Total increase (decrease) in net assets | (98,741,120) | (103,098,364) |
| Net Assets | ||
| Beginning of period | 1,008,178,455 | 1,111,276,819 |
| End of period (including distributions in excess of net investment income of $825,954 and undistributed net investment income of $2,018,342, respectively) | $909,437,335 | $1,008,178,455 |
| Other Information | ||
| Shares | ||
| Sold | 676,488 | 5,802,749 |
| Issued in reinvestment of distributions | 126,673 | 283,510 |
| Redeemed | (3,103,312) | (7,416,166) |
| Net increase (decrease) | (2,300,151) | (1,329,907) |
See accompanying notes which are an integral part of the financial statements.
Financial Highlights — Fidelity Emerging Asia Fund
| Six months ended (Unaudited) April 30, | Years ended October 31, | |||||
| 2016 | 2015 | 2014 | 2013 | 2012 | 2011 | |
| Selected Per–Share Data | ||||||
| Net asset value, beginning of period | $31.20 | $33.03 | $30.91 | $28.57 | $27.32 | $29.70 |
| Income from Investment Operations | ||||||
| Net investment income (loss)A | .04 | .42 | .43 | .39 | .46 | .50 |
| Net realized and unrealized gain (loss) | (.81) | (1.96) | 2.08 | 2.49 | 1.30 | (2.30) |
| Total from investment operations | (.77) | (1.54) | 2.51 | 2.88 | 1.76 | (1.80) |
| Distributions from net investment income | (.13) | (.29) | (.39) | (.46) | (.51) | (.49) |
| Distributions from net realized gain | – | – | – | (.08) | – | (.11) |
| Total distributions | (.13) | (.29) | (.39) | (.54) | (.51) | (.59)B |
| Redemption fees added to paid in capitalA | –C | –C | –C | –C | –C | .01 |
| Net asset value, end of period | $30.30 | $31.20 | $33.03 | $30.91 | $28.57 | $27.32 |
| Total ReturnD,E | (2.47)% | (4.69)% | 8.21% | 10.19% | 6.60% | (6.20)% |
| Ratios to Average Net AssetsF,G | ||||||
| Expenses before reductions | 1.14%H | 1.09% | 1.04% | 1.08% | .94% | .82% |
| Expenses net of fee waivers, if any | 1.14%H | 1.09% | 1.04% | 1.08% | .94% | .82% |
| Expenses net of all reductions | 1.14%H | 1.09% | 1.04% | 1.05% | .91% | .78% |
| Net investment income (loss) | .30%H | 1.26% | 1.36% | 1.31% | 1.68% | 1.68% |
| Supplemental Data | ||||||
| Net assets, end of period (000 omitted) | $909,437 | $1,008,178 | $1,111,277 | $1,172,348 | $1,325,208 | $1,525,635 |
| Portfolio turnover rateI | 54%H | 68% | 90% | 97% | 94% | 115% |
A Calculated based on average shares outstanding during the period.
B Total distributions of $.59 per share is comprised of distributions from net investment income of $.485 and distributions from net realized gain of $.105 per share.
C Amount represents less than $.005 per share.
D Total returns for periods of less than one year are not annualized.
E Total returns would have been lower if certain expenses had not been reduced during the applicable periods shown.
F Fees and expenses of any underlying Fidelity Central Funds are not included in the Fund's expense ratio. The Fund indirectly bears its proportionate share of the expenses of any underlying Fidelity Central Funds.
G Expense ratios reflect operating expenses of the Fund. Expenses before reductions do not reflect amounts reimbursed by the investment adviser or reductions from brokerage service arrangements or reductions from other expense offset arrangements and do not represent the amount paid by the Fund during periods when reimbursements or reductions occur. Expenses net of fee waivers reflect expenses after reimbursement by the investment adviser but prior to reductions from brokerage service arrangements or other expense offset arrangements. Expenses net of all reductions represent the net expenses paid by the Fund.
H Annualized
I Amount does not include the portfolio activity of any underlying Fidelity Central Funds.
See accompanying notes which are an integral part of the financial statements.
See accompanying notes which are an integral part of the financial statements.
Notes to Financial Statements (Unaudited)
For the period ended April 30, 2016
1. Organization.
Fidelity Emerging Asia Fund (the Fund) is a fund of Fidelity Investment Trust (the Trust) and is authorized to issue an unlimited number of shares. Share transactions on the Statement of Changes in Net Assets may contain exchanges between affiliated funds. The Trust is registered under the Investment Company Act of 1940, as amended (the 1940 Act), as an open-end management investment company organized as a Massachusetts business trust. The Fund's investments in emerging markets can be subject to social, economic, regulatory, and political uncertainties and can be extremely volatile.
2. Investments in Fidelity Central Funds.
The Fund invests in Fidelity Central Funds, which are open-end investment companies generally available only to other investment companies and accounts managed by the investment adviser and its affiliates. The Fund's Schedule of Investments lists each of the Fidelity Central Funds held as of period end, if any, as an investment of the Fund, but does not include the underlying holdings of each Fidelity Central Fund. As an Investing Fund, the Fund indirectly bears its proportionate share of the expenses of the underlying Fidelity Central Funds.
The Money Market Central Funds seek preservation of capital and current income and are managed by Fidelity Investments Money Management, Inc. (FIMM), an affiliate of the investment adviser. Annualized expenses of the Money Market Central Funds as of their most recent shareholder report date are less than .005%.
A complete unaudited list of holdings for each Fidelity Central Fund is available upon request or at the Securities and Exchange Commission (the SEC) website at www.sec.gov. In addition, the financial statements of the Fidelity Central Funds are available on the SEC website or upon request.
3. Significant Accounting Policies.
The financial statements have been prepared in conformity with accounting principles generally accepted in the United States of America (GAAP), which require management to make certain estimates and assumptions at the date of the financial statements. Actual results could differ from those estimates. Subsequent events, if any, through the date that the financial statements were issued have been evaluated in the preparation of the financial statements. The following summarizes the significant accounting policies of the Fund:
Investment Valuation. Investments are valued as of 4:00 p.m. Eastern time on the last calendar day of the period. The Board of Trustees (the Board) has delegated the day to day responsibility for the valuation of the Fund's investments to the Fidelity Management & Research Company (FMR) Fair Value Committee (the Committee). In accordance with valuation policies and procedures approved by the Board, the Fund attempts to obtain prices from one or more third party pricing vendors or brokers to value its investments. When current market prices, quotations or currency exchange rates are not readily available or reliable, investments will be fair valued in good faith by the Committee, in accordance with procedures adopted by the Board. Factors used in determining fair value vary by investment type and may include market or investment specific events, changes in interest rates and credit quality. The frequency with which these procedures are used cannot be predicted and they may be utilized to a significant extent. The Committee oversees the Fund's valuation policies and procedures and reports to the Board on the Committee's activities and fair value determinations. The Board monitors the appropriateness of the procedures used in valuing the Fund's investments and ratifies the fair value determinations of the Committee.
The Fund categorizes the inputs to valuation techniques used to value its investments into a disclosure hierarchy consisting of three levels as shown below:
- Level 1 – quoted prices in active markets for identical investments
- Level 2 – other significant observable inputs (including quoted prices for similar investments, interest rates, prepayment speeds, etc.)
- Level 3 – unobservable inputs (including the Fund's own assumptions based on the best information available)
Valuation techniques used to value the Fund's investments by major category are as follows:
Equity securities, including restricted securities, for which market quotations are readily available, are valued at the last reported sale price or official closing price as reported by a third party pricing vendor on the primary market or exchange on which they are traded and are categorized as Level 1 in the hierarchy. In the event there were no sales during the day or closing prices are not available, securities are valued at the last quoted bid price or may be valued using the last available price and are generally categorized as Level 2 in the hierarchy. For foreign equity securities, when market or security specific events arise, comparisons to the valuation of American Depositary Receipts (ADRs), futures contracts, Exchange-Traded Funds (ETFs) and certain indexes as well as quoted prices for similar securities may be used and would be categorized as Level 2 in the hierarchy. Utilizing these techniques may result in transfers between Level 1 and Level 2. For equity securities, including restricted securities, where observable inputs are limited, assumptions about market activity and risk are used and these securities may be categorized as Level 3 in the hierarchy.
Debt securities, including restricted securities, are valued based on evaluated prices received from third party pricing vendors or from brokers who make markets in such securities. Corporate bonds are valued by pricing vendors who utilize matrix pricing which considers yield or price of bonds of comparable quality, coupon, maturity and type or by broker-supplied prices. When independent prices are unavailable or unreliable, debt securities may be valued utilizing pricing methodologies which consider similar factors that would be used by third party pricing vendors. Debt securities are generally categorized as Level 2 in the hierarchy but may be Level 3 depending on the circumstances.
Investments in open-end mutual funds, including the Fidelity Central Funds, are valued at their closing net asset value (NAV) each business day and are categorized as Level 1 in the hierarchy.
Changes in valuation techniques may result in transfers in or out of an assigned level within the disclosure hierarchy. The aggregate value of investments by input level as of April 30, 2016, including information on transfers between Levels 1 and 2, is included at the end of the Fund's Schedule of Investments.
Foreign Currency. The Fund may use foreign currency contracts to facilitate transactions in foreign-denominated securities. Gains and losses from these transactions may arise from changes in the value of the foreign currency or if the counterparties do not perform under the contracts' terms.
Foreign-denominated assets, including investment securities, and liabilities are translated into U.S. dollars at the exchange rates at period end. Purchases and sales of investment securities, income and dividends received and expenses denominated in foreign currencies are translated into U.S. dollars at the exchange rate in effect on the transaction date.
The effects of exchange rate fluctuations on investments are included with the net realized and unrealized gain (loss) on investment securities. Other foreign currency transactions resulting in realized and unrealized gain (loss) are disclosed separately.
Investment Transactions and Income. For financial reporting purposes, the Fund's investment holdings and NAV include trades executed through the end of the last business day of the period. The NAV per share for processing shareholder transactions is calculated as of the close of business of the New York Stock Exchange (NYSE), normally 4:00 p.m. Eastern time and includes trades executed through the end of the prior business day. Gains and losses on securities sold are determined on the basis of identified cost and may include proceeds received from litigation. Dividend income is recorded on the ex-dividend date, except for certain dividends from foreign securities where the ex-dividend date may have passed, which are recorded as soon as the Fund is informed of the ex-dividend date. Non-cash dividends included in dividend income, if any, are recorded at the fair market value of the securities received. Income and capital gain distributions from Fidelity Central Funds, if any, are recorded on the ex-dividend date. Distributions received on securities that represent a return of capital or capital gain are recorded as a reduction of cost of investments and/or as a realized gain. Subsequent to ex-dividend date the Fund determines the components of these distributions, based upon receipt of tax filings or other correspondence relating to the underlying investment. Interest income is accrued as earned and includes coupon interest and amortization of premium and accretion of discount on debt securities as applicable. Investment income is recorded net of foreign taxes withheld where recovery of such taxes is uncertain.
Expenses. Expenses directly attributable to a fund are charged to that fund. Expenses attributable to more than one fund are allocated among the respective funds on the basis of relative net assets or other appropriate methods. Expense estimates are accrued in the period to which they relate and adjustments are made when actual amounts are known.
Income Tax Information and Distributions to Shareholders. Each year, the Fund intends to qualify as a regulated investment company under Subchapter M of the Internal Revenue Code, including distributing substantially all of its taxable income and realized gains. As a result, no provision for U.S. Federal income taxes is required. The Fund files a U.S. federal tax return, in addition to state and local tax returns as required. The Fund's federal income tax returns are subject to examination by the Internal Revenue Service (IRS) for a period of three fiscal years after they are filed. State and local tax returns may be subject to examination for an additional fiscal year depending on the jurisdiction. Foreign taxes are provided for based on the Fund's understanding of the tax rules and rates that exist in the foreign markets in which it invests.
Distributions are declared and recorded on the ex-dividend date. Income and capital gain distributions are determined in accordance with income tax regulations, which may differ from GAAP.
Capital accounts within the financial statements are adjusted for permanent book-tax differences. These adjustments have no impact on net assets or the results of operations. Capital accounts are not adjusted for temporary book-tax differences which will reverse in a subsequent period.
Book-tax differences are primarily due to foreign currency transactions, certain foreign taxes, passive foreign investment companies (PFIC), deferred trustees compensation, capital loss carryforwards and losses deferred due to wash sales.
The federal tax cost of investment securities and unrealized appreciation (depreciation) as of period end were as follows:
| Gross unrealized appreciation | $88,584,114 |
| Gross unrealized depreciation | (126,491,416) |
| Net unrealized appreciation (depreciation) on securities | $(37,907,302) |
| Tax cost | $955,054,942 |
Capital loss carryforwards are only available to offset future capital gains of the Fund to the extent provided by regulations and may be limited. Under the Regulated Investment Company Modernization Act of 2010 (the Act), the Fund is permitted to carry forward capital losses incurred in taxable years beginning after December 22, 2010 for an unlimited period and such capital losses are required to be used prior to any losses that expire. The capital loss carryforward information presented below, including any applicable limitation, is estimated as of prior fiscal period end and is subject to adjustment.
| Fiscal year of expiration | |
| 2017 | $(104,856,402) |
Short-Term Trading (Redemption) Fees. Shares held by investors in the Fund less than 90 days may have been subject to a redemption fee equal to 1.50% of the NAV of shares redeemed. All redemption fees, which reduce the proceeds of the shareholder redemption, are retained by the Fund and accounted for as an addition to paid in capital.
Restricted Securities. The Fund may invest in securities that are subject to legal or contractual restrictions on resale. These securities generally may be resold in transactions exempt from registration or to the public if the securities are registered. Disposal of these securities may involve time-consuming negotiations and expense, and prompt sale at an acceptable price may be difficult. Information regarding restricted securities is included at the end of the Fund's Schedule of Investments.
4. Purchases and Sales of Investments.
Purchases and sales of securities, other than short-term securities, aggregated $241,477,090 and $255,911,268, respectively.
5. Fees and Other Transactions with Affiliates.
Management Fee. Fidelity Management & Research Company (the investment adviser) and its affiliates provide the Fund with investment management related services for which the Fund pays a monthly management fee. The management fee is the sum of an individual fund fee rate that is based on an annual rate of .45% of the Fund's average net assets and an annualized group fee rate that averaged .25% during the period. The group fee rate is based upon the average net assets of all the mutual funds advised by the investment adviser, including any mutual funds previously advised by the investment adviser that are currently advised by Fidelity SelectCo, LLC, an affiliate of the investment adviser. The group fee rate decreases as assets under management increase and increases as assets under management decrease. In addition, the management fee is subject to a performance adjustment (up to a maximum of +/- .20% of the Fund's average net assets over a 36 month performance period). The upward or downward adjustment to the management fee is based on the Fund's relative investment performance as compared to its benchmark index, the MSCI All Country Asia ex Japan Index, over the same 36 month performance period. For the reporting period, the total annualized management fee rate, including the performance adjustment, was .82% of the Fund's average net assets. The performance adjustment included in the management fee rate may be higher or lower than the maximum performance adjustment rate due to the difference between the average net assets for the reporting and performance periods.
Transfer Agent Fees. Fidelity Investments Institutional Operations Company, Inc. (FIIOC), an affiliate of the investment adviser, is the Fund's transfer, dividend disbursing and shareholder servicing agent. FIIOC receives account fees and asset-based fees that vary according to account size and type of account. FIIOC pays for typesetting, printing and mailing of shareholder reports, except proxy statements. For the period, the transfer agent fees were equivalent to an annualized rate of .21% of average net assets.
Accounting and Security Lending Fees. Fidelity Service Company, Inc. (FSC), an affiliate of the investment adviser, maintains the Fund's accounting records. The accounting fee is based on the level of average net assets for each month. Under a separate contract, FSC administers the security lending program. The security lending fee is based on the number and duration of lending transactions.
Brokerage Commissions. The Fund placed a portion of its portfolio transactions with brokerage firms which are affiliates of the investment adviser. Brokerage commissions are included in net realized gain (loss) and change in net unrealized appreciation (depreciation) in the Statement of Operations. The commissions paid to these affiliated firms were $569 for the period.
Interfund Trades. The Fund may purchase from or sell securities to other Fidelity Funds under procedures adopted by the Board. The procedures have been designed to ensure these interfund trades are executed in accordance with Rule 17a-7 of the 1940 Act. Interfund trades are included within the respective purchases and sales amounts shown in the Purchases and Sales of Investments note.
6. Committed Line of Credit.
The Fund participates with other funds managed by the investment adviser or an affiliate in a $4.25 billion credit facility (the "line of credit") to be utilized for temporary or emergency purposes to fund shareholder redemptions or for other short-term liquidity purposes. The Fund has agreed to pay commitment fees on its pro-rata portion of the line of credit, which amounted to $811 and is reflected in Miscellaneous expenses on the Statement of Operations. During the period, the Fund did not borrow on this line of credit.
7. Security Lending.
The Fund lends portfolio securities through a lending agent from time to time in order to earn additional income. For equity securities, a lending agent is used and may loan securities to certain qualified borrowers, including Fidelity Capital Markets (FCM), a broker-dealer affiliated with the Fund. On the settlement date of the loan, the Fund receives collateral (in the form of U.S. Treasury obligations, letters of credit and/or cash) against the loaned securities and maintains collateral in an amount not less than 100% of the market value of the loaned securities during the period of the loan. The market value of the loaned securities is determined at the close of business of the Fund and any additional required collateral is delivered to the Fund on the next business day. The Fund or borrower may terminate the loan at any time, and if the borrower defaults on its obligation to return the securities loaned because of insolvency or other reasons, the Fund may apply collateral received from the borrower against the obligation. The Fund may experience delays and costs in recovering the securities loaned. Any cash collateral received is invested in the Fidelity Securities Lending Cash Central Fund. The value of loaned securities and cash collateral at period end are disclosed on the Fund's Statement of Assets and Liabilities. Security lending income represents the income earned on investing cash collateral, less rebates paid to borrowers and any lending agent fees associated with the loan, plus any premium payments received for lending certain types of securities. Security lending income is presented in the Statement of Operations as a component of income from Fidelity Central Funds. Total security lending income during the period amounted to $21,617. During the period, there were no securities loaned to FCM.
8. Expense Reductions.
Commissions paid to certain brokers with whom the investment adviser, or its affiliates, places trades on behalf of the Fund include an amount in addition to trade execution, which may be rebated back to the Fund to offset certain expenses. This amount totaled $3,399 for the period
In addition, during the period the investment adviser reimbursed and/or waived a portion of operating expenses in the amount of $3,432.
9. Other.
The Fund's organizational documents provide former and current trustees and officers with a limited indemnification against liabilities arising in connection with the performance of their duties to the Fund. In the normal course of business, the Fund may also enter into contracts that provide general indemnifications. The Fund's maximum exposure under these arrangements is unknown as this would be dependent on future claims that may be made against the Fund. The risk of material loss from such claims is considered remote.
Fidelity® Emerging Markets Fund
Investment Summary (Unaudited)
Geographic Diversification (% of fund's net assets)
| As of April 30, 2016 | ||
| India | 13.5% | |
| United States of America* | 11.6% | |
| Cayman Islands | 9.4% | |
| Mexico | 8.5% | |
| Brazil | 8.3% | |
| South Africa | 6.8% | |
| Korea (South) | 5.5% | |
| Taiwan | 5.2% | |
| Philippines | 3.9% | |
| Other | 27.3% | |

* Includes Short-Term investments and Net Other Assets (Liabilities).
Percentages are based on country or territory of incorporation and are adjusted for the effect of futures contracts, if applicable.
| As of October 31, 2015 | ||
| India | 10.6% | |
| United States of America* | 9.1% | |
| Korea (South) | 8.6% | |
| China | 8.0% | |
| Cayman Islands | 7.7% | |
| South Africa | 7.4% | |
| Mexico | 6.8% | |
| Taiwan | 6.7% | |
| Brazil | 6.3% | |
| Other | 28.8% | |
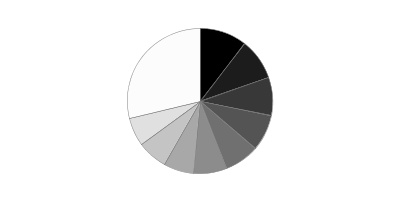
* Includes Short-Term investments and Net Other Assets (Liabilities).
Percentages are based on country or territory of incorporation and are adjusted for the effect of futures contracts, if applicable.
Asset Allocation as of April 30, 2016
| % of fund's net assets | % of fund's net assets 6 months ago | |
| Stocks | 98.7 | 99.3 |
| Short-Term Investments and Net Other Assets (Liabilities) | 1.3 | 0.7 |
Top Ten Stocks as of April 30, 2016
| % of fund's net assets | % of fund's net assets 6 months ago | |
| Taiwan Semiconductor Manufacturing Co. Ltd. (Taiwan, Semiconductors & Semiconductor Equipment) | 3.6 | 3.4 |
| Tencent Holdings Ltd. (Cayman Islands, Internet Software & Services) | 3.4 | 3.2 |
| Naspers Ltd. Class N (South Africa, Media) | 2.0 | 2.2 |
| Alibaba Group Holding Ltd. sponsored ADR (Cayman Islands, Internet Software & Services) | 1.6 | 0.7 |
| Infosys Ltd. (India, IT Services) | 1.4 | 0.0 |
| Baidu.com, Inc. sponsored ADR (Cayman Islands, Internet Software & Services) | 1.3 | 0.0 |
| Itau Unibanco Holding SA (Brazil, Banks) | 1.2 | 0.0 |
| Banco Bradesco SA (PN) (Brazil, Banks) | 1.2 | 0.0 |
| Housing Development Finance Corp. Ltd. (India, Thrifts & Mortgage Finance) | 1.2 | 1.3 |
| Ambev SA sponsored ADR (Brazil, Beverages) | 1.2 | 1.0 |
| 18.1 |
Market Sectors as of April 30, 2016
| % of fund's net assets | % of fund's net assets 6 months ago | |
| Information Technology | 21.7 | 23.1 |
| Financials | 18.4 | 19.8 |
| Consumer Discretionary | 14.2 | 18.5 |
| Consumer Staples | 13.8 | 8.5 |
| Industrials | 9.8 | 11.3 |
| Health Care | 8.3 | 8.4 |
| Materials | 5.8 | 4.7 |
| Utilities | 3.3 | 2.5 |
| Energy | 2.0 | 1.1 |
| Telecommunication Services | 1.4 | 1.4 |
Percentages shown as 0.0% may reflect amounts less than 0.05%.
Fidelity® Emerging Markets Fund
Investments April 30, 2016 (Unaudited)
Showing Percentage of Net Assets
| Common Stocks - 95.1% | |||
| Shares | Value | ||
| Argentina - 0.9% | |||
| Banco Macro SA sponsored ADR | 253,800 | $15,895,494 | |
| Grupo Financiero Galicia SA sponsored ADR | 565,400 | 16,096,938 | |
| TOTAL ARGENTINA | 31,992,432 | ||
| Australia - 1.0% | |||
| Amcor Ltd. (a) | 1,507,331 | 17,649,927 | |
| Sydney Airport unit | 3,215,206 | 16,648,284 | |
| TOTAL AUSTRALIA | 34,298,211 | ||
| Belgium - 0.5% | |||
| Anheuser-Busch InBev SA NV | 124,900 | 15,460,110 | |
| Bermuda - 2.8% | |||
| Axalta Coating Systems (a) | 542,400 | 15,442,128 | |
| China Gas Holdings Ltd. | 13,294,000 | 19,192,999 | |
| China Resource Gas Group Ltd. | 6,777,000 | 19,177,830 | |
| Credicorp Ltd. (United States) | 190,532 | 27,707,163 | |
| Markit Ltd. (a) | 378,200 | 13,195,398 | |
| TOTAL BERMUDA | 94,715,518 | ||
| Brazil - 4.7% | |||
| BB Seguridade Participacoes SA | 2,662,820 | 23,227,332 | |
| Cielo SA | 2,840,354 | 27,666,456 | |
| Kroton Educacional SA | 6,649,560 | 24,747,944 | |
| Qualicorp SA | 4,297,200 | 18,616,931 | |
| Smiles SA | 1,428,100 | 16,567,912 | |
| Ultrapar Participacoes SA | 1,214,800 | 25,579,942 | |
| Weg SA | 4,856,990 | 21,437,554 | |
| TOTAL BRAZIL | 157,844,071 | ||
| British Virgin Islands - 0.4% | |||
| Mail.Ru Group Ltd. GDR (Reg. S) (a) | 699,800 | 14,170,950 | |
| Cayman Islands - 9.4% | |||
| Alibaba Group Holding Ltd. sponsored ADR (a) | 715,800 | 55,073,652 | |
| Baidu.com, Inc. sponsored ADR (a) | 228,500 | 44,397,550 | |
| ENN Energy Holdings Ltd. | 2,956,000 | 14,418,302 | |
| Fu Shou Yuan International Group Ltd. (b) | 22,806,000 | 16,000,500 | |
| New Oriental Education & Technology Group, Inc. sponsored ADR | 481,400 | 18,851,624 | |
| Shenzhou International Group Holdings Ltd. | 3,742,000 | 19,344,370 | |
| Sino Biopharmaceutical Ltd. | 24,372,000 | 17,270,105 | |
| TAL Education Group ADR (a) | 291,200 | 16,848,832 | |
| Tencent Holdings Ltd. | 5,721,000 | 116,412,715 | |
| TOTAL CAYMAN ISLANDS | 318,617,650 | ||
| China - 2.6% | |||
| China Pacific Insurance (Group) Co. Ltd. (H Shares) | 6,272,000 | 21,992,431 | |
| Inner Mongoli Yili Industries Co. Ltd. | 6,626,208 | 15,383,246 | |
| Jiangsu Hengrui Medicine Co. Ltd. | 2,175,571 | 15,686,572 | |
| Kweichow Moutai Co. Ltd. | 493,792 | 19,159,653 | |
| Shanghai International Airport Co. Ltd. | 3,524,600 | 14,813,659 | |
| TOTAL CHINA | 87,035,561 | ||
| Denmark - 0.5% | |||
| Novo Nordisk A/S Series B sponsored ADR | 290,800 | 16,223,732 | |
| France - 0.5% | |||
| Dassault Systemes SA | 212,862 | 16,647,280 | |
| Germany - 1.0% | |||
| adidas AG | 130,300 | 16,799,922 | |
| Wirecard AG (b) | 413,963 | 17,877,224 | |
| TOTAL GERMANY | 34,677,146 | ||
| Hong Kong - 1.7% | |||
| AIA Group Ltd. | 3,067,000 | 18,354,787 | |
| Guangdong Investment Ltd. | 15,741,000 | 22,227,261 | |
| Techtronic Industries Co. Ltd. | 4,548,000 | 17,048,951 | |
| TOTAL HONG KONG | 57,630,999 | ||
| India - 13.5% | |||
| Adani Ports & Special Economic Zone | 6,242,535 | 22,385,557 | |
| Amara Raja Batteries Ltd. | 1,160,524 | 16,699,714 | |
| Asian Paints India Ltd. | 1,554,398 | 20,270,789 | |
| Bharti Infratel Ltd. | 3,098,742 | 17,491,375 | |
| Colgate-Palmolive (India) | 1,354,322 | 17,143,742 | |
| GlaxoSmithKline Consumer Healthcare Ltd. (a) | 200,035 | 17,760,144 | |
| HCL Technologies Ltd. | 1,831,903 | 20,692,006 | |
| HDFC Bank Ltd. (a) | 855,782 | 17,395,339 | |
| Hindustan Unilever Ltd. | 1,870,173 | 24,435,242 | |
| Housing Development Finance Corp. Ltd. | 2,451,311 | 40,167,247 | |
| IndusInd Bank Ltd. | 1,114,105 | 17,591,573 | |
| Infosys Ltd. | 2,637,820 | 47,917,757 | |
| ITC Ltd. | 5,606,750 | 27,427,922 | |
| LIC Housing Finance Ltd. (a) | 2,503,611 | 17,424,323 | |
| Lupin Ltd. | 753,518 | 18,232,333 | |
| Maruti Suzuki India Ltd. (a) | 385,100 | 21,999,378 | |
| Power Grid Corp. of India Ltd. | 7,639,726 | 16,492,713 | |
| Sun Pharmaceutical Industries Ltd. | 2,084,366 | 25,457,786 | |
| Tata Consultancy Services Ltd. | 901,167 | 34,398,069 | |
| Titan Co. Ltd. | 2,684,343 | 14,382,393 | |
| TOTAL INDIA | 455,765,402 | ||
| Indonesia - 3.8% | |||
| PT ACE Hardware Indonesia Tbk | 230,253,400 | 16,149,863 | |
| PT Bank Central Asia Tbk�� | 25,348,100 | 25,082,856 | |
| PT Bank Rakyat Indonesia Tbk | 27,241,900 | 21,379,562 | |
| PT Kalbe Farma Tbk | 158,104,300 | 16,484,184 | |
| PT Matahari Department Store Tbk | 13,334,600 | 19,211,207 | |
| PT Surya Citra Media Tbk | 74,367,300 | 18,044,841 | |
| PT Tower Bersama Infrastructure Tbk (a) | 30,089,100 | 13,518,192 | |
| TOTAL INDONESIA | 129,870,705 | ||
| Isle of Man - 0.4% | |||
| Playtech Ltd. | 1,074,286 | 12,628,180 | |
| Israel - 1.4% | |||
| Check Point Software Technologies Ltd. (a) | 190,200 | 15,761,874 | |
| Frutarom Industries Ltd. | 325,900 | 16,702,980 | |
| Teva Pharmaceutical Industries Ltd. sponsored ADR | 279,700 | 15,229,665 | |
| TOTAL ISRAEL | 47,694,519 | ||
| Kenya - 0.5% | |||
| Safaricom Ltd. | 98,651,000 | 16,702,298 | |
| Korea (South) - 5.5% | |||
| AMOREPACIFIC Corp. | 82,091 | 29,198,579 | |
| AMOREPACIFIC Group, Inc. | 148,868 | 21,829,772 | |
| Coway Co. Ltd. | 215,727 | 18,566,070 | |
| KT&G Corp. | 264,441 | 28,390,462 | |
| LG Chemical Ltd. | 102,407 | 26,547,563 | |
| LG Household & Health Care Ltd. | 29,661 | 26,070,768 | |
| NAVER Corp. | 58,652 | 34,658,524 | |
| TOTAL KOREA (SOUTH) | 185,261,738 | ||
| Luxembourg - 0.5% | |||
| Eurofins Scientific SA | 45,580 | 16,912,616 | |
| Mexico - 8.5% | |||
| Banregio Grupo Financiero S.A.B. de CV | 2,857,515 | 17,123,847 | |
| El Puerto de Liverpool S.A.B. de CV Class C | 1,481,500 | 16,840,619 | |
| Fomento Economico Mexicano S.A.B. de CV unit | 3,374,867 | 31,401,319 | |
| Gruma S.A.B. de CV Series B | 1,244,700 | 18,182,901 | |
| Grupo Aeroportuario del Pacifico S.A.B. de CV Series B | 2,124,857 | 20,020,129 | |
| Grupo Aeroportuario del Sureste S.A.B. de CV Series B | 1,327,960 | 20,393,342 | |
| Grupo Aeroportuario Norte S.A.B. de CV | 3,088,700 | 17,873,713 | |
| Grupo Financiero Banorte S.A.B. de CV Series O | 5,100,400 | 28,954,734 | |
| Grupo GICSA SA de CV (a) | 14,416,570 | 11,329,032 | |
| Infraestructura Energetica Nova S.A.B. de CV | 3,983,200 | 15,565,009 | |
| Kimberly-Clark de Mexico SA de CV Series A | 8,174,500 | 19,347,423 | |
| Megacable Holdings S.A.B. de CV unit | 3,931,052 | 18,153,353 | |
| Promotora y Operadora de Infraestructura S.A.B. de CV | 1,309,300 | 16,604,590 | |
| Tenedora Nemak SA de CV | 11,309,300 | 16,223,145 | |
| Wal-Mart de Mexico SA de CV Series V | 7,931,800 | 19,616,679 | |
| TOTAL MEXICO | 287,629,835 | ||
| Philippines - 3.9% | |||
| Ayala Corp. | 1,274,520 | 20,891,994 | |
| Ayala Land, Inc. | 28,090,400 | 20,693,789 | |
| D&L Industries, Inc. | 78,821,700 | 15,082,286 | |
| GT Capital Holdings, Inc. | 615,950 | 17,901,640 | |
| International Container Terminal Services, Inc. | 11,708,080 | 16,179,977 | |
| SM Investments Corp. | 973,692 | 19,542,155 | |
| SM Prime Holdings, Inc. | 41,003,500 | 19,745,493 | |
| TOTAL PHILIPPINES | 130,037,334 | ||
| Russia - 1.4% | |||
| Magnit OJSC (a) | 160,055 | 22,244,241 | |
| NOVATEK OAO GDR (Reg. S) | 254,100 | 24,393,600 | |
| TOTAL RUSSIA | 46,637,841 | ||
| South Africa - 6.8% | |||
| Aspen Pharmacare Holdings Ltd. | 1,138,890 | 26,840,050 | |
| Bidvest Group Ltd. | 951,498 | 24,148,308 | |
| Discovery Ltd. | 2,303,985 | 20,590,644 | |
| FirstRand Ltd. | 8,009,800 | 25,742,319 | |
| Mondi Ltd. | 998,966 | 19,191,600 | |
| Mr Price Group Ltd. | 1,614,588 | 20,510,068 | |
| Naspers Ltd. Class N | 492,512 | 67,577,618 | |
| Sanlam Ltd. | 5,124,900 | 24,841,018 | |
| TOTAL SOUTH AFRICA | 229,441,625 | ||
| Spain - 0.5% | |||
| Amadeus IT Holding SA Class A | 374,000 | 17,018,603 | |
| Switzerland - 0.5% | |||
| Sika AG | 3,880 | 16,514,167 | |
| Taiwan - 5.2% | |||
| Advantech Co. Ltd. | 2,284,000 | 16,120,856 | |
| ECLAT Textile Co. Ltd. | 1,660,288 | 18,939,917 | |
| Largan Precision Co. Ltd. | 283,000 | 19,887,007 | |
| Taiwan Semiconductor Manufacturing Co. Ltd. | 26,409,000 | 121,144,904 | |
| TOTAL TAIWAN | 176,092,684 | ||
| Thailand - 1.6% | |||
| Airports of Thailand PCL (For. Reg.) | 1,793,900 | 20,137,709 | |
| Bangkok Dusit Medical Services PCL (For. Reg.) | 25,512,600 | 17,388,313 | |
| Thai Beverage PCL | 29,095,600 | 16,117,948 | |
| TOTAL THAILAND | 53,643,970 | ||
| Turkey - 2.2% | |||
| Bim Birlesik Magazalar A/S JSC | 863,000 | 18,999,571 | |
| Koc Holding A/S | 3,962,000 | 20,716,247 | |
| Tofas Turk Otomobil Fabrikasi A/S | 2,131,847 | 16,868,868 | |
| Tupras Turkiye Petrol Rafinelleri A/S | 701,000 | 18,502,091 | |
| TOTAL TURKEY | 75,086,777 | ||
| United Arab Emirates - 0.5% | |||
| DP World Ltd. | 966,954 | 18,275,431 | |
| United Kingdom - 2.1% | |||
| British American Tobacco PLC (United Kingdom) | 271,100 | 16,529,533 | |
| Hikma Pharmaceuticals PLC | 620,223 | 19,973,504 | |
| NMC Health PLC | 1,068,200 | 16,341,581 | |
| Prudential PLC | 860,149 | 16,978,940 | |
| TOTAL UNITED KINGDOM | 69,823,558 | ||
| United States of America - 10.3% | |||
| A.O. Smith Corp. | 200,500 | 15,482,610 | |
| Alphabet, Inc. Class C | 19,645 | 13,614,181 | |
| Amazon.com, Inc. (a) | 27,400 | 18,072,766 | |
| Amphenol Corp. Class A | 253,700 | 14,164,071 | |
| China Biologic Products, Inc. (a) | 152,778 | 17,875,026 | |
| Danaher Corp. | 152,300 | 14,735,025 | |
| Ecolab, Inc. | 131,800 | 15,154,364 | |
| Facebook, Inc. Class A (a) | 129,400 | 15,214,852 | |
| Gartner, Inc. Class A (a) | 161,900 | 14,112,823 | |
| International Flavors & Fragrances, Inc. | 136,110 | 16,261,062 | |
| MasterCard, Inc. Class A | 159,200 | 15,440,808 | |
| McGraw Hill Financial, Inc. | 162,300 | 17,341,755 | |
| MercadoLibre, Inc. | 145,000 | 18,109,050 | |
| Mettler-Toledo International, Inc. (a) | 43,980 | 15,742,641 | |
| Moody's Corp. | 167,700 | 16,052,244 | |
| MSCI, Inc. Class A | 226,300 | 17,185,222 | |
| NIKE, Inc. Class B | 264,900 | 15,613,206 | |
| Philip Morris International, Inc. | 164,300 | 16,121,116 | |
| PPG Industries, Inc. | 138,156 | 15,251,041 | |
| The Walt Disney Co. | 143,200 | 14,786,832 | |
| TransDigm Group, Inc. (a) | 67,400 | 15,358,438 | |
| Visa, Inc. Class A | 194,800 | 15,046,352 | |
| TOTAL UNITED STATES OF AMERICA | 346,735,485 | ||
| TOTAL COMMON STOCKS | |||
| (Cost $2,853,955,571) | 3,211,086,428 | ||
| Nonconvertible Preferred Stocks - 3.6% | |||
| Brazil - 3.6% | |||
| Ambev SA sponsored ADR | 7,122,280 | 39,813,545 | |
| Banco Bradesco SA (PN) | 5,419,920 | 40,815,855 | |
| Itau Unibanco Holding SA | 4,422,300 | 42,265,320 | |
| TOTAL NONCONVERTIBLE PREFERRED STOCKS | |||
| (Cost $122,024,142) | 122,894,720 | ||
| Money Market Funds - 1.8% | |||
| Fidelity Cash Central Fund, 0.38% (c) | 40,807,246 | 40,807,246 | |
| Fidelity Securities Lending Cash Central Fund, 0.42% (c)(d) | 18,737,780 | 18,737,780 | |
| TOTAL MONEY MARKET FUNDS | |||
| (Cost $59,545,026) | 59,545,026 | ||
| TOTAL INVESTMENT PORTFOLIO - 100.5% | |||
| (Cost $3,035,524,739) | 3,393,526,174 | ||
| NET OTHER ASSETS (LIABILITIES) - (0.5)% | (17,164,414) | ||
| NET ASSETS - 100% | $3,376,361,760 |
Categorizations in the Schedule of Investments are based on country or territory of incorporation.
Legend
(a) Non-income producing
(b) Security or a portion of the security is on loan at period end.
(c) Affiliated fund that is generally available only to investment companies and other accounts managed by Fidelity Investments. The rate quoted is the annualized seven-day yield of the fund at period end. A complete unaudited listing of the fund's holdings as of its most recent quarter end is available upon request. In addition, each Fidelity Central Fund's financial statements are available on the SEC's website or upon request.
(d) Investment made with cash collateral received from securities on loan.
Affiliated Central Funds
Information regarding fiscal year to date income earned by the Fund from investments in Fidelity Central Funds is as follows:
| Fund | Income earned |
| Fidelity Cash Central Fund | $75,602 |
| Fidelity Securities Lending Cash Central Fund | 328,352 |
| Total | $403,954 |
Investment Valuation
The following is a summary of the inputs used, as of April 30, 2016, involving the Fund's assets and liabilities carried at fair value. The inputs or methodology used for valuing securities may not be an indication of the risk associated with investing in those securities. For more information on valuation inputs, and their aggregation into the levels used below, please refer to the Investment Valuation section in the accompanying Notes to Financial Statements.
| Valuation Inputs at Reporting Date: | ||||
| Description | Total | Level 1 | Level 2 | Level 3 |
| Investments in Securities: | ||||
| Equities: | ||||
| Consumer Discretionary | $478,150,199 | $425,756,378 | $52,393,821 | $-- |
| Consumer Staples | 460,633,916 | 444,104,383 | 16,529,533 | -- |
| Energy | 68,475,633 | 68,475,633 | -- | -- |
| Financials | 633,964,289 | 559,242,792 | 74,721,497 | -- |
| Health Care | 274,275,039 | 257,004,934 | 17,270,105 | -- |
| Industrials | 331,452,442 | 331,452,442 | -- | -- |
| Information Technology | 738,175,744 | 452,700,368 | 285,475,376 | -- |
| Materials | 194,067,907 | 194,067,907 | -- | -- |
| Telecommunication Services | 47,711,865 | 47,711,865 | -- | -- |
| Utilities | 107,074,114 | 32,057,722 | 75,016,392 | -- |
| Money Market Funds | 59,545,026 | 59,545,026 | -- | -- |
| Total Investments in Securities: | $3,393,526,174 | $2,872,119,450 | $521,406,724 | $-- |
The following is a summary of transfers between Level 1 and Level 2 for the period ended April 30, 2016. Transfers are assumed to have occurred at the beginning of the period, and are primarily attributable to the valuation techniques used for foreign equity securities, as discussed in the accompanying Notes to Financial Statements:
| Transfers | Total |
| Level 1 to Level 2 | $0 |
| Level 2 to Level 1 | $677,669,702 |
See accompanying notes which are an integral part of the financial statements.
Fidelity® Emerging Markets Fund
Financial Statements
Statement of Assets and Liabilities
| April 30, 2016 (Unaudited) | ||
| Assets | ||
| Investment in securities, at value (including securities loaned of $17,887,433) — See accompanying schedule: Unaffiliated issuers (cost $2,975,979,713) | $3,333,981,148 | |
| Fidelity Central Funds (cost $59,545,026) | 59,545,026 | |
| Total Investments (cost $3,035,524,739) | $3,393,526,174 | |
| Foreign currency held at value (cost $1,000) | 558 | |
| Receivable for investments sold | 413,790 | |
| Receivable for fund shares sold | 5,018,549 | |
| Dividends receivable | 4,411,251 | |
| Distributions receivable from Fidelity Central Funds | 199,878 | |
| Prepaid expenses | 2,120 | |
| Other receivables | 1,830,965 | |
| Total assets | 3,405,403,285 | |
| Liabilities | ||
| Payable for fund shares redeemed | $7,317,521 | |
| Accrued management fee | 1,954,961 | |
| Other affiliated payables | 607,598 | |
| Other payables and accrued expenses | 423,665 | |
| Collateral on securities loaned, at value | 18,737,780 | |
| Total liabilities | 29,041,525 | |
| Net Assets | $3,376,361,760 | |
| Net Assets consist of: | ||
| Paid in capital | $3,461,571,887 | |
| Undistributed net investment income | 1,559,020 | |
| Accumulated undistributed net realized gain (loss) on investments and foreign currency transactions | (444,154,246) | |
| Net unrealized appreciation (depreciation) on investments and assets and liabilities in foreign currencies | 357,385,099 | |
| Net Assets | $3,376,361,760 | |
| Emerging Markets: | ||
| Net Asset Value, offering price and redemption price per share ($2,806,595,386 ÷ 124,804,753 shares) | $22.49 | |
| Class K: | ||
| Net Asset Value, offering price and redemption price per share ($569,766,374 ÷ 25,321,147 shares) | $22.50 |
See accompanying notes which are an integral part of the financial statements.
Statement of Operations
| Six months ended April 30, 2016 (Unaudited) | ||
| Investment Income | ||
| Dividends | $21,326,584 | |
| Interest | 209 | |
| Income from Fidelity Central Funds | 403,954 | |
| Income before foreign taxes withheld | 21,730,747 | |
| Less foreign taxes withheld | (2,263,836) | |
| Total income | 19,466,911 | |
| Expenses | ||
| Management fee | $11,276,881 | |
| Transfer agent fees | 3,228,698 | |
| Accounting and security lending fees | 699,469 | |
| Custodian fees and expenses | 691,002 | |
| Independent trustees' compensation | 7,020 | |
| Registration fees | 92,118 | |
| Audit | 70,629 | |
| Legal | 4,179 | |
| Interest | 7,392 | |
| Miscellaneous | 11,028 | |
| Total expenses before reductions | 16,088,416 | |
| Expense reductions | (46,079) | 16,042,337 |
| Net investment income (loss) | 3,424,574 | |
| Realized and Unrealized Gain (Loss) | ||
| Net realized gain (loss) on: | ||
| Investment securities: | ||
| Unaffiliated issuers | (182,579,350) | |
| Foreign currency transactions | (11,086) | |
| Total net realized gain (loss) | (182,590,436) | |
| Change in net unrealized appreciation (depreciation) on: Investment securities (net of decrease in deferred foreign taxes of $363,195) | 177,537,436 | |
| Assets and liabilities in foreign currencies | 46,114 | |
| Total change in net unrealized appreciation (depreciation) | 177,583,550 | |
| Net gain (loss) | (5,006,886) | |
| Net increase (decrease) in net assets resulting from operations | $(1,582,312) |
See accompanying notes which are an integral part of the financial statements.
Statement of Changes in Net Assets
| Six months ended April 30, 2016 (Unaudited) | Year ended October 31, 2015 | |
| Increase (Decrease) in Net Assets | ||
| Operations | ||
| Net investment income (loss) | $3,424,574 | $26,242,657 |
| Net realized gain (loss) | (182,590,436) | (231,739,571) |
| Change in net unrealized appreciation (depreciation) | 177,583,550 | (191,944,680) |
| Net increase (decrease) in net assets resulting from operations | (1,582,312) | (397,441,594) |
| Distributions to shareholders from net investment income | (17,361,594) | (18,114,621) |
| Distributions to shareholders from net realized gain | – | (2,942,055) |
| Total distributions | (17,361,594) | (21,056,676) |
| Share transactions - net increase (decrease) | 100,654,003 | 716,596,433 |
| Redemption fees | 1,677,235 | 519,430 |
| Total increase (decrease) in net assets | 83,387,332 | 298,617,593 |
| Net Assets | ||
| Beginning of period | 3,292,974,428 | 2,994,356,835 |
| End of period (including undistributed net investment income of $1,559,020 and undistributed net investment income of $15,496,040, respectively) | $3,376,361,760 | $3,292,974,428 |
See accompanying notes which are an integral part of the financial statements.
Financial Highlights — Fidelity Emerging Markets Fund
| Six months ended (Unaudited) April 30, | Years ended October 31, | |||||
| 2016 | 2015 | 2014 | 2013 | 2012 | 2011 | |
| Selected Per–Share Data | ||||||
| Net asset value, beginning of period | $22.55 | $25.44 | $24.43 | $22.15 | $22.23 | $25.72 |
| Income from Investment Operations | ||||||
| Net investment income (loss)A | .02 | .19 | .17 | .20 | .33 | .35 |
| Net realized and unrealized gain (loss) | .02B | (2.91) | .86 | 2.38 | (.11) | (3.48) |
| Total from investment operations | .04 | (2.72) | 1.03 | 2.58 | .22 | (3.13) |
| Distributions from net investment income | (.11) | (.14) | (.02) | (.30) | (.30) | (.24) |
| Distributions from net realized gain | – | (.03) | – | – | – | (.13) |
| Total distributions | (.11) | (.17) | (.02) | (.30) | (.30) | (.37) |
| Redemption fees added to paid in capitalA | .01 | –C | –C | –C | –C | .01 |
| Net asset value, end of period | $22.49 | $22.55 | $25.44 | $24.43 | $22.15 | $22.23 |
| Total ReturnD,E | .23% | (10.76)% | 4.22% | 11.78% | 1.03% | (12.33)% |
| Ratios to Average Net AssetsF,G | ||||||
| Expenses before reductions | 1.03%H | 1.05% | 1.07% | 1.08% | 1.09% | 1.07% |
| Expenses net of fee waivers, if any | 1.03%H | 1.05% | 1.07% | 1.08% | 1.09% | 1.07% |
| Expenses net of all reductions | 1.02%H | 1.03% | 1.07% | 1.03% | 1.03% | 1.01% |
| Net investment income (loss) | .18%H | .78% | .71% | .85% | 1.50% | 1.38% |
| Supplemental Data | ||||||
| Net assets, end of period (000 omitted) | $2,806,595 | $2,738,934 | $2,370,927 | $2,241,338 | $2,203,756 | $2,907,884 |
| Portfolio turnover rateI | 85%H | 107% | 94% | 119% | 176% | 122% |
A Calculated based on average shares outstanding during the period.
B The amount shown for a share outstanding does not correspond with the aggregate net gain (loss) on investments for the period due to the timing of sales and repurchases of shares in relation to fluctuating market values of the investments of the Fund.
C Amount represents less than $.005 per share.
D Total returns for periods of less than one year are not annualized.
E Total returns would have been lower if certain expenses had not been reduced during the applicable periods shown.
F Fees and expenses of any underlying Fidelity Central Funds are not included in the Fund's expense ratio. The Fund indirectly bears its proportionate share of the expenses of any underlying Fidelity Central Funds.
G Expense ratios reflect operating expenses of the class. Expenses before reductions do not reflect amounts reimbursed by the investment adviser or reductions from brokerage service arrangements or reductions from other expense offset arrangements and do not represent the amount paid by the class during periods when reimbursements or reductions occur. Expenses net of fee waivers reflect expenses after reimbursement by the investment adviser but prior to reductions from brokerage service arrangements or other expense offset arrangements. Expenses net of all reductions represent the net expenses paid by the class.
H Annualized
I Amount does not include the portfolio activity of any underlying Fidelity Central Funds.
See accompanying notes which are an integral part of the financial statements.
Financial Highlights — Fidelity Emerging Markets Fund Class K
| Six months ended (Unaudited) April 30, | Years ended October 31, | |||||
| 2016 | 2015 | 2014 | 2013 | 2012 | 2011 | |
| Selected Per–Share Data | ||||||
| Net asset value, beginning of period | $22.58 | $25.48 | $24.42 | $22.15 | $22.23 | $25.75 |
| Income from Investment Operations | ||||||
| Net investment income (loss)A | .04 | .24 | .23 | .25 | .37 | .40 |
| Net realized and unrealized gain (loss) | .02B | (2.92) | .86 | 2.38 | (.10) | (3.48) |
| Total from investment operations | .06 | (2.68) | 1.09 | 2.63 | .27 | (3.08) |
| Distributions from net investment income | (.15) | (.20) | (.03) | (.36) | (.35) | (.32) |
| Distributions from net realized gain | – | (.03) | – | – | – | (.13) |
| Total distributions | (.15) | (.22)C | (.03) | (.36) | (.35) | (.45) |
| Redemption fees added to paid in capitalA | .01 | –D | –D | –D | –D | .01 |
| Net asset value, end of period | $22.50 | $22.58 | $25.48 | $24.42 | $22.15 | $22.23 |
| Total ReturnE,F | .33% | (10.60)% | 4.47% | 12.01% | 1.25% | (12.17)% |
| Ratios to Average Net AssetsG,H | ||||||
| Expenses before reductions | .84%I | .85% | .86% | .87% | .87% | .87% |
| Expenses net of fee waivers, if any | .84%I | .85% | .85% | .87% | .87% | .87% |
| Expenses net of all reductions | .84%I | .83% | .85% | .82% | .81% | .80% |
| Net investment income (loss) | .36%I | .98% | .92% | 1.07% | 1.72% | 1.58% |
| Supplemental Data | ||||||
| Net assets, end of period (000 omitted) | $569,766 | $554,041 | $623,430 | $547,369 | $607,919 | $497,821 |
| Portfolio turnover rateJ | 85%I | 107% | 94% | 119% | 176% | 122% |
A Calculated based on average shares outstanding during the period.
B The amount shown for a share outstanding does not correspond with the aggregate net gain (loss) on investments for the period due to the timing of sales and repurchases of shares in relation to fluctuating market values of the investments of the Fund.
C Total distributions of $.22 per share is comprised of distributions from net investment income of $.195 and distributions from net realized gain of $.025 per share.
D Amount represents less than $.005 per share.
E Total returns for periods of less than one year are not annualized.
F Total returns would have been lower if certain expenses had not been reduced during the applicable periods shown.
G Fees and expenses of any underlying Fidelity Central Funds are not included in the Fund's expense ratio. The Fund indirectly bears its proportionate share of the expenses of any underlying Fidelity Central Funds.
H Expense ratios reflect operating expenses of the class. Expenses before reductions do not reflect amounts reimbursed by the investment adviser or reductions from brokerage service arrangements or reductions from other expense offset arrangements and do not represent the amount paid by the class during periods when reimbursements or reductions occur. Expenses net of fee waivers reflect expenses after reimbursement by the investment adviser but prior to reductions from brokerage service arrangements or other expense offset arrangements. Expenses net of all reductions represent the net expenses paid by the class.
I Annualized
J Amount does not include the portfolio activity of any underlying Fidelity Central Funds.
See accompanying notes which are an integral part of the financial statements.
Notes to Financial Statements (Unaudited)
For the period ended April 30, 2016
1. Organization.
Fidelity Emerging Markets Fund (the Fund) is a fund of Fidelity Investment Trust (the Trust) and is authorized to issue an unlimited number of shares. The Trust is registered under the Investment Company Act of 1940, as amended (the 1940 Act), as an open-end management investment company organized as a Massachusetts business trust. The Fund offers Emerging Markets and Class K shares, each of which has equal rights as to assets and voting privileges. Each class has exclusive voting rights with respect to matters that affect that class. The Fund's investments in emerging markets can be subject to social, economic, regulatory, and political uncertainties and can be extremely volatile.
2. Investments in Fidelity Central Funds.
The Fund invests in Fidelity Central Funds, which are open-end investment companies generally available only to other investment companies and accounts managed by the investment adviser and its affiliates. The Fund's Schedule of Investments lists each of the Fidelity Central Funds held as of period end, if any, as an investment of the Fund, but does not include the underlying holdings of each Fidelity Central Fund. As an Investing Fund, the Fund indirectly bears its proportionate share of the expenses of the underlying Fidelity Central Funds.
The Money Market Central Funds seek preservation of capital and current income and are managed by Fidelity Investments Money Management, Inc. (FIMM), an affiliate of the investment adviser. Annualized expenses of the Money Market Central Funds as of their most recent shareholder report date are less than .005%.
A complete unaudited list of holdings for each Fidelity Central Fund is available upon request or at the Securities and Exchange Commission (the SEC) website at www.sec.gov. In addition, the financial statements of the Fidelity Central Funds are available on the SEC website or upon request.
3. Significant Accounting Policies.
The financial statements have been prepared in conformity with accounting principles generally accepted in the United States of America (GAAP), which require management to make certain estimates and assumptions at the date of the financial statements. Actual results could differ from those estimates. Subsequent events, if any, through the date that the financial statements were issued have been evaluated in the preparation of the financial statements. The following summarizes the significant accounting policies of the Fund:
Investment Valuation. Investments are valued as of 4:00 p.m. Eastern time on the last calendar day of the period. The Board of Trustees (the Board) has delegated the day to day responsibility for the valuation of the Fund's investments to the Fidelity Management & Research Company (FMR) Fair Value Committee (the Committee). In accordance with valuation policies and procedures approved by the Board, the Fund attempts to obtain prices from one or more third party pricing vendors or brokers to value its investments. When current market prices, quotations or currency exchange rates are not readily available or reliable, investments will be fair valued in good faith by the Committee, in accordance with procedures adopted by the Board. Factors used in determining fair value vary by investment type and may include market or investment specific events. The frequency with which these procedures are used cannot be predicted and they may be utilized to a significant extent. The Committee oversees the Fund's valuation policies and procedures and reports to the Board on the Committee's activities and fair value determinations. The Board monitors the appropriateness of the procedures used in valuing the Fund's investments and ratifies the fair value determinations of the Committee.
The Fund categorizes the inputs to valuation techniques used to value its investments into a disclosure hierarchy consisting of three levels as shown below:
- Level 1 – quoted prices in active markets for identical investments
- Level 2 – other significant observable inputs (including quoted prices for similar investments, interest rates, prepayment speeds, etc.)
- Level 3 – unobservable inputs (including the Fund's own assumptions based on the best information available)
Valuation techniques used to value the Fund's investments by major category are as follows:
Equity securities, including restricted securities, for which market quotations are readily available, are valued at the last reported sale price or official closing price as reported by a third party pricing vendor on the primary market or exchange on which they are traded and are categorized as Level 1 in the hierarchy. In the event there were no sales during the day or closing prices are not available, securities are valued at the last quoted bid price or may be valued using the last available price and are generally categorized as Level 2 in the hierarchy. For foreign equity securities, when market or security specific events arise, comparisons to the valuation of American Depositary Receipts (ADRs), futures contracts, Exchange-Traded Funds (ETFs) and certain indexes as well as quoted prices for similar securities may be used and would be categorized as Level 2 in the hierarchy. Utilizing these techniques may result in transfers between Level 1 and Level 2. For equity securities, including restricted securities, where observable inputs are limited, assumptions about market activity and risk are used and these securities may be categorized as Level 3 in the hierarchy.
Investments in open-end mutual funds, including the Fidelity Central Funds, are valued at their closing net asset value (NAV) each business day and are categorized as Level 1 in the hierarchy.
Changes in valuation techniques may result in transfers in or out of an assigned level within the disclosure hierarchy. The aggregate value of investments by input level as of April 30, 2016, including information on transfers between Levels 1 and 2, is included at the end of the Fund's Schedule of Investments.
Foreign Currency. The Fund may use foreign currency contracts to facilitate transactions in foreign-denominated securities. Gains and losses from these transactions may arise from changes in the value of the foreign currency or if the counterparties do not perform under the contracts' terms.
Foreign-denominated assets, including investment securities, and liabilities are translated into U.S. dollars at the exchange rates at period end. Purchases and sales of investment securities, income and dividends received and expenses denominated in foreign currencies are translated into U.S. dollars at the exchange rate in effect on the transaction date.
The effects of exchange rate fluctuations on investments are included with the net realized and unrealized gain (loss) on investment securities. Other foreign currency transactions resulting in realized and unrealized gain (loss) are disclosed separately.
Investment Transactions and Income. For financial reporting purposes, the Fund's investment holdings and NAV include trades executed through the end of the last business day of the period. The NAV per share for processing shareholder transactions is calculated as of the close of business of the New York Stock Exchange (NYSE), normally 4:00 p.m. Eastern time and includes trades executed through the end of the prior business day. Gains and losses on securities sold are determined on the basis of identified cost and may include proceeds received from litigation. Dividend income is recorded on the ex-dividend date, except for certain dividends from foreign securities where the ex-dividend date may have passed, which are recorded as soon as the Fund is informed of the ex-dividend date. Non-cash dividends included in dividend income, if any, are recorded at the fair market value of the securities received. Income and capital gain distributions from Fidelity Central Funds, if any, are recorded on the ex-dividend date. Interest income is accrued as earned and includes coupon interest and amortization of premium and accretion of discount on debt securities as applicable. Investment income is recorded net of foreign taxes withheld where recovery of such taxes is uncertain.
Class Allocations and Expenses. Investment income, realized and unrealized capital gains and losses, common expenses of the Fund, and certain fund-level expense reductions, if any, are allocated daily on a pro-rata basis to each class based on the relative net assets of each class to the total net assets of the Fund. Each class differs with respect to transfer agent fees incurred. Certain expense reductions may also differ by class. For the reporting period, the allocated portion of income and expenses to each class as a percent of its average net assets may vary due to the timing of recording these transactions in relation to fluctuating net assets of the classes. Expenses directly attributable to a fund are charged to that fund. Expenses attributable to more than one fund are allocated among the respective funds on the basis of relative net assets or other appropriate methods. Expense estimates are accrued in the period to which they relate and adjustments are made when actual amounts are known.
Income Tax Information and Distributions to Shareholders. Each year, the Fund intends to qualify as a regulated investment company under Subchapter M of the Internal Revenue Code, including distributing substantially all of its taxable income and realized gains. As a result, no provision for U.S. Federal income taxes is required. The Fund files a U.S. federal tax return, in addition to state and local tax returns as required. The Fund's federal income tax returns are subject to examination by the Internal Revenue Service (IRS) for a period of three fiscal years after they are filed. State and local tax returns may be subject to examination for an additional fiscal year depending on the jurisdiction. Foreign taxes are provided for based on the Fund's understanding of the tax rules and rates that exist in the foreign markets in which it invests. The Fund is subject to a tax imposed on capital gains by certain countries in which it invests.
Distributions are declared and recorded on the ex-dividend date. Income dividends and capital gain distributions are declared separately for each class. Income and capital gain distributions are determined in accordance with income tax regulations, which may differ from GAAP.
Capital accounts within the financial statements are adjusted for permanent book-tax differences. These adjustments have no impact on net assets or the results of operations. Capital accounts are not adjusted for temporary book-tax differences which will reverse in a subsequent period.
Book-tax differences are primarily due to foreign currency transactions, certain foreign taxes, passive foreign investment companies (PFIC), deferred trustees compensation, capital loss carryforwards and losses deferred due to wash sales.
The federal tax cost of investment securities and unrealized appreciation (depreciation) as of period end were as follows:
| Gross unrealized appreciation | $457,105,971 |
| Gross unrealized depreciation | (137,734,879) |
| Net unrealized appreciation (depreciation) on securities | $319,371,092 |
| Tax cost | $3,074,155,082 |
Capital loss carryforwards are only available to offset future capital gains of the Fund to the extent provided by regulations and may be limited. Under the Regulated Investment Company Modernization Act of 2010 (the Act), the Fund is permitted to carry forward capital losses incurred in taxable years beginning after December 22, 2010 for an unlimited period and such capital losses are required to be used prior to any losses that expire. The capital loss carryforward information presented below, including any applicable limitation, is estimated as of prior fiscal period end and is subject to adjustment.
| Fiscal year of expiration | |
| 2017 | $(24,838,920) |
| No expiration | |
| Short-term | (189,293,193) |
| Long-term | (24,501,874) |
| Total no expiration | (213,795,067) |
| Total capital loss carryforward | $(238,633,987) |
Short-Term Trading (Redemption) Fees. Shares held by investors in the Fund less than 90 days may have been subject to a redemption fee equal to 1.50% of the NAV of shares redeemed. All redemption fees, which reduce the proceeds of the shareholder redemption, are retained by the Fund and accounted for as an addition to paid in capital.
4. Purchases and Sales of Investments.
Purchases and sales of securities, other than short-term securities, aggregated $1,445,739,072 and $1,365,772,666, respectively.
5. Fees and Other Transactions with Affiliates.
Management Fee. Fidelity Management & Research Company (the investment adviser) and its affiliates provide the Fund with investment management related services for which the Fund pays a monthly management fee. The management fee is the sum of an individual fund fee rate that is based on an annual rate of .45% of the Fund's average net assets and an annualized group fee rate that averaged .25% during the period. The group fee rate is based upon the average net assets of all the mutual funds advised by the investment adviser, including any mutual funds previously advised by the investment adviser that are currently advised by Fidelity SelectCo, LLC, an affiliate of the investment adviser. The group fee rate decreases as assets under management increase and increases as assets under management decrease. For the reporting period, the total annualized management fee rate was .70% of the Fund's average net assets.
Transfer Agent Fees. Fidelity Investments Institutional Operations Company, Inc., (FIIOC), an affiliate of the investment adviser, is the transfer, dividend disbursing and shareholder servicing agent for each class of the Fund. FIIOC receives account fees and asset-based fees that vary according to the account size and type of account of the shareholders of Emerging Markets. FIIOC receives an asset-based fee of Class K's average net assets. FIIOC pays for typesetting, printing and mailing of shareholder reports, except proxy statements.
For the period, transfer agent fees for each class were as follows:
| Amount | % of Class-Level Average Net Assets(a) | |
| Emerging Markets | $3,103,080 | .23 |
| Class K | 125,618 | .05 |
| $3,228,698 |
(a) Annualized
Accounting and Security Lending Fees. Fidelity Service Company, Inc. (FSC), an affiliate of the investment adviser, maintains the Fund's accounting records. The accounting fee is based on the level of average net assets for each month. Under a separate contract, FSC administers the security lending program. The security lending fee is based on the number and duration of lending transactions.
Brokerage Commissions. The Fund placed a portion of its portfolio transactions with brokerage firms which are affiliates of the investment adviser. Brokerage commissions are included in net realized gain (loss) and change in net unrealized appreciation (depreciation) in the Statement of Operations. The commissions paid to these affiliated firms were $5,446 for the period.
Interfund Lending Program. Pursuant to an Exemptive Order issued by the SEC, the Fund, along with other registered investment companies having management contracts with FMR or other affiliated entities of FMR, may participate in an interfund lending program. This program provides an alternative credit facility allowing the funds to borrow from, or lend money to, other participating affiliated funds. At period end, there were no interfund loans outstanding. The Fund's activity in this program during the period for which loans were outstanding was as follows:
| Borrower or Lender | Average Loan Balance | Weighted Average Interest Rate | Interest Expense |
| Borrower | $45,190,667 | .65% | $7,392 |
Interfund Trades. The Fund may purchase from or sell securities to other Fidelity Funds under procedures adopted by the Board. The procedures have been designed to ensure these interfund trades are executed in accordance with Rule 17a-7 of the 1940 Act. Interfund trades are included within the respective purchases and sales amounts shown in the Purchases and Sales of Investments note.
6. Committed Line of Credit.
The Fund participates with other funds managed by the investment adviser or an affiliate in a $4.25 billion credit facility (the "line of credit") to be utilized for temporary or emergency purposes to fund shareholder redemptions or for other short-term liquidity purposes. The Fund has agreed to pay commitment fees on its pro-rata portion of the line of credit, which amounted to $2,841 and is reflected in Miscellaneous expenses on the Statement of Operations. During the period, the Fund did not borrow on this line of credit.
7. Security Lending.
The Fund lends portfolio securities through a lending agent from time to time in order to earn additional income. For equity securities, a lending agent is used and may loan securities to certain qualified borrowers, including Fidelity Capital Markets (FCM), a broker-dealer affiliated with the Fund. On the settlement date of the loan, the Fund receives collateral (in the form of U.S. Treasury obligations, letters of credit and/or cash) against the loaned securities and maintains collateral in an amount not less than 100% of the market value of the loaned securities during the period of the loan. The market value of the loaned securities is determined at the close of business of the Fund and any additional required collateral is delivered to the Fund on the next business day. The Fund or borrower may terminate the loan at any time, and if the borrower defaults on its obligation to return the securities loaned because of insolvency or other reasons, the Fund may apply collateral received from the borrower against the obligation. The Fund may experience delays and costs in recovering the securities loaned. Any cash collateral received is invested in the Fidelity Securities Lending Cash Central Fund. The value of loaned securities and cash collateral at period end are disclosed on the Fund's Statement of Assets and Liabilities. Security lending income represents the income earned on investing cash collateral, less rebates paid to borrowers and any lending agent fees associated with the loan, plus any premium payments received for lending certain types of securities. Security lending income is presented in the Statement of Operations as a component of income from Fidelity Central Funds. Total security lending income during the period amounted to $328,352, including $978 from securities loaned to FCM.
8. Expense Reductions.
Commissions paid to certain brokers with whom the investment adviser, or its affiliates, places trades on behalf of the Fund include an amount in addition to trade execution, which may be rebated back to the Fund to offset certain expenses. This amount totaled $32,983 for the period. In addition, through arrangements with the Fund's custodian, credits realized as a result of certain uninvested cash balances were used to reduce the Fund's expenses. During the period, these credits reduced the Fund's custody expenses by $1,328.
In addition, during the period the investment adviser reimbursed and/or waived a portion of fund-level operating expenses in the amount of $11,768.
9. Distributions to Shareholders.
Distributions to shareholders of each class were as follows:
| Six months ended April 30, 2016 | Year ended October 31, 2015 | |
| From net investment income | ||
| Emerging Markets | $13,660,209 | $13,346,829 |
| Class K | 3,701,385 | 4,767,792 |
| Total | $17,361,594 | $18,114,621 |
| From net realized gain | ||
| Emerging Markets | $– | $2,332,143 |
| Class K | – | 609,912 |
| Total | $– | $2,942,055 |
10. Share Transactions.
Share transactions for each class were as follows and may contain automatic conversions between classes or exchanges between affiliated funds:
| Shares | Shares | Dollars | Dollars | |
| Six months ended April 30, 2016 | Year ended October 31, 2015 | Six months ended April 30, 2016 | Year ended October 31, 2015 | |
| Emerging Markets | ||||
| Shares sold | 29,103,318 | 55,410,811 | $613,674,115 | $1,332,719,199 |
| Reinvestment of distributions | 572,542 | 546,115 | 12,670,348 | 13,577,228 |
| Shares redeemed | (26,341,490) | (27,685,404) | (540,823,971) | (631,200,476) |
| Net increase (decrease) | 3,334,370 | 28,271,522 | $85,520,492 | $715,095,951 |
| Class K | ||||
| Shares sold | 3,504,590 | 8,915,876 | $73,202,280 | $215,741,410 |
| Reinvestment of distributions | 167,256 | 216,324 | 3,701,385 | 5,377,704 |
| Shares redeemed | (2,884,189) | (9,064,709) | (61,770,154) | (219,618,632) |
| Net increase (decrease) | 787,657 | 67,491 | $15,133,511 | $1,500,482 |
11. Other.
The Fund's organizational documents provide former and current trustees and officers with a limited indemnification against liabilities arising in connection with the performance of their duties to the Fund. In the normal course of business, the Fund may also enter into contracts that provide general indemnifications. The Fund's maximum exposure under these arrangements is unknown as this would be dependent on future claims that may be made against the Fund. The risk of material loss from such claims is considered remote.
At the end of the period, Strategic Advisers Emerging Markets Fund was the owner of record of approximately 14% of the total outstanding shares of the Fund.
Fidelity® Europe Fund
Investment Summary (Unaudited)
Geographic Diversification (% of fund's net assets)
| As of April 30, 2016 | ||
| United Kingdom | 25.5% | |
| Sweden | 15.9% | |
| Germany | 14.5% | |
| France | 9.1% | |
| Denmark | 6.2% | |
| Bailiwick of Jersey | 5.5% | |
| Isle of Man | 3.8% | |
| Spain | 3.2% | |
| Ireland | 3.0% | |
| Other* | 13.3% | |
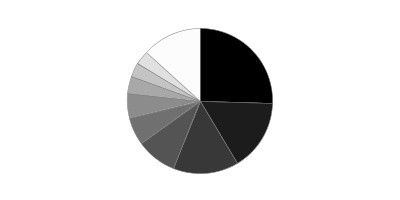
* Includes Short-Term investments and Net Other Assets (Liabilities).
Percentages are based on country or territory of incorporation and are adjusted for the effect of futures contracts, if applicable.
| As of October 31, 2015 | ||
| United Kingdom | 30.9% | |
| Sweden | 16.5% | |
| France | 10.5% | |
| Germany | 9.4% | |
| Denmark | 6.6% | |
| Bailiwick of Jersey | 5.4% | |
| Isle of Man | 3.1% | |
| Spain | 2.8% | |
| Finland | 2.7% | |
| Other* | 12.1% | |
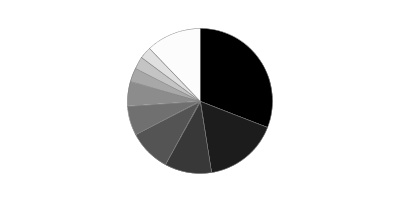
* Includes Short-Term investments and Net Other Assets (Liabilities).
Percentages are based on country or territory of incorporation and are adjusted for the effect of futures contracts, if applicable.
Asset Allocation as of April 30, 2016
| % of fund's net assets | % of fund's net assets 6 months ago | |
| Stocks | 98.3 | 99.7 |
| Short-Term Investments and Net Other Assets (Liabilities) | 1.7 | 0.3 |
Top Ten Stocks as of April 30, 2016
| % of fund's net assets | % of fund's net assets 6 months ago | |
| SAP AG (Germany, Software) | 3.5 | 0.0 |
| Getinge AB (B Shares) (Sweden, Health Care Equipment & Supplies) | 3.5 | 2.9 |
| Shire PLC (Bailiwick of Jersey, Pharmaceuticals) | 3.2 | 3.2 |
| William Hill PLC (United Kingdom, Hotels, Restaurants & Leisure) | 3.1 | 2.0 |
| Standard Chartered PLC (United Kingdom) (United Kingdom, Banks) | 3.0 | 2.9 |
| Bayer AG (Germany, Pharmaceuticals) | 2.8 | 2.4 |
| Prudential PLC (United Kingdom, Insurance) | 2.1 | 1.8 |
| LEG Immobilien AG (Germany, Real Estate Management & Development) | 2.0 | 1.5 |
| Optimal Payments PLC (Isle of Man, IT Services) | 2.0 | 1.5 |
| Svenska Cellulosa AB (SCA) (B Shares) (Sweden, Household Products) | 1.9 | 1.6 |
| 27.1 |
Market Sectors as of April 30, 2016
| % of fund's net assets | % of fund's net assets 6 months ago | |
| Financials | 24.6 | 31.6 |
| Industrials | 17.7 | 17.5 |
| Health Care | 17.3 | 19.8 |
| Consumer Discretionary | 16.7 | 16.8 |
| Information Technology | 13.4 | 5.4 |
| Consumer Staples | 3.8 | 3.0 |
| Materials | 1.9 | 4.3 |
| Energy | 1.6 | 0.0 |
| Utilities | 1.3 | 1.3 |
Percentages shown as 0.0% may reflect amounts less than 0.05%.
Fidelity® Europe Fund
Investments April 30, 2016 (Unaudited)
Showing Percentage of Net Assets
| Common Stocks - 98.3% | |||
| Shares | Value | ||
| Austria - 1.2% | |||
| Andritz AG | 277,200 | $15,524,418 | |
| Bailiwick of Jersey - 5.5% | |||
| Shire PLC | 652,600 | 40,723,546 | |
| Wolseley PLC | 265,134 | 14,850,704 | |
| WPP PLC | 620,800 | 14,503,493 | |
| TOTAL BAILIWICK OF JERSEY | 70,077,743 | ||
| Bermuda - 2.2% | |||
| Vostok Emerging Finance Ltd. (depository receipt) (a)(b)(c) | 53,380,307 | 7,179,016 | |
| Vostok New Ventures Ltd. SDR (b) | 3,662,236 | 20,841,196 | |
| TOTAL BERMUDA | 28,020,212 | ||
| Denmark - 6.2% | |||
| Carlsberg A/S Series B | 241,500 | 23,519,470 | |
| DSV de Sammensluttede Vognmaend A/S | 236,000 | 9,930,612 | |
| Novozymes A/S Series B | 343,955 | 16,484,143 | |
| Scandinavian Tobacco Group A/S | 436,427 | 6,942,867 | |
| William Demant Holding A/S (b) | 210,000 | 21,582,535 | |
| TOTAL DENMARK | 78,459,627 | ||
| Finland - 2.2% | |||
| Amer Group PLC (A Shares) | 450,500 | 13,319,119 | |
| Valmet Corp. | 1,119,700 | 14,039,132 | |
| TOTAL FINLAND | 27,358,251 | ||
| France - 9.1% | |||
| Bollore Group | 3,447,549 | 13,658,751 | |
| Capgemini SA | 198,200 | 18,503,145 | |
| Eurazeo SA | 207,255 | 14,595,016 | |
| Havas SA | 2,857,100 | 23,908,285 | |
| Publicis Groupe SA | 230,946 | 17,090,748 | |
| Wendel SA | 146,000 | 16,868,190 | |
| Zodiac Aerospace | 454,600 | 10,658,051 | |
| TOTAL FRANCE | 115,282,186 | ||
| Germany - 14.5% | |||
| adidas AG | 140,700 | 18,140,821 | |
| Bayer AG | 308,000 | 35,532,047 | |
| Brenntag AG | 338,000 | 19,819,648 | |
| CompuGroup Medical AG | 259,600 | 10,195,846 | |
| Fresenius SE & Co. KGaA | 206,797 | 15,041,085 | |
| GEA Group AG | 332,091 | 15,396,760 | |
| LEG Immobilien AG | 270,421 | 25,022,458 | |
| SAP AG | 571,242 | 44,820,245 | |
| TOTAL GERMANY | 183,968,910 | ||
| Ireland - 3.0% | |||
| DCC PLC (United Kingdom) | 149,700 | 13,255,290 | |
| Ryanair Holdings PLC sponsored ADR | 137,767 | 11,152,239 | |
| United Drug PLC (United Kingdom) | 1,554,241 | 13,898,393 | |
| TOTAL IRELAND | 38,305,922 | ||
| Isle of Man - 3.8% | |||
| Optimal Payments PLC (b) | 4,443,710 | 24,751,037 | |
| Playtech Ltd. | 1,974,395 | 23,208,918 | |
| TOTAL ISLE OF MAN | 47,959,955 | ||
| Malta - 1.0% | |||
| Kambi Group PLC (a)(b) | 752,299 | 12,974,791 | |
| Netherlands - 1.8% | |||
| CSM NV (exchangeable) | 295,400 | 7,539,543 | |
| RELX NV | 929,903 | 15,604,430 | |
| TOTAL NETHERLANDS | 23,143,973 | ||
| Norway - 1.6% | |||
| TGS Nopec Geophysical Co. ASA | 1,199,700 | 20,069,871 | |
| Spain - 3.2% | |||
| Amadeus IT Holding SA Class A | 520,000 | 23,662,229 | |
| Red Electrica Corporacion SA | 180,600 | 16,123,886 | |
| TOTAL SPAIN | 39,786,115 | ||
| Sweden - 15.9% | |||
| Elekta AB (B Shares) (a) | 2,889,502 | 21,121,328 | |
| Getinge AB (B Shares) | 2,070,400 | 43,777,611 | |
| H&M Hennes & Mauritz AB (B Shares) | 653,350 | 23,228,016 | |
| Hemfosa Fastigheter AB (a) | 1,181,300 | 12,319,842 | |
| Hemfosa Fastigheter AB rights 5/10/16 (a)(b) | 1,181,300 | 426,598 | |
| Indutrade AB | 301,100 | 16,883,902 | |
| Kungsleden AB (a) | 1,999,100 | 13,753,933 | |
| Lundbergfoeretagen AB (a) | 94,092 | 5,109,741 | |
| Pandox AB | 781,300 | 13,260,924 | |
| Sandvik AB (a) | 1,121,100 | 11,503,545 | |
| Svenska Cellulosa AB (SCA) (B Shares) | 776,700 | 24,460,327 | |
| Svenska Handelsbanken AB (A Shares) | 1,135,800 | 15,151,746 | |
| TOTAL SWEDEN | 200,997,513 | ||
| Switzerland - 1.6% | |||
| Julius Baer Group Ltd. | 484,660 | 20,770,478 | |
| United Kingdom - 25.5% | |||
| Aldermore Group PLC (b) | 412,035 | 1,131,844 | |
| Big Yellow Group PLC | 1,014,100 | 11,942,923 | |
| Bunzl PLC | 672,658 | 20,040,398 | |
| CMC Markets PLC | 2,220,400 | 8,110,844 | |
| Compass Group PLC | 1,178,117 | 20,980,366 | |
| Dechra Pharmaceuticals PLC | 982,700 | 15,880,746 | |
| Diploma PLC | 1,298,700 | 13,880,911 | |
| International Personal Finance PLC | 4,993,203 | 19,523,611 | |
| Micro Focus International PLC | 611,300 | 13,657,043 | |
| Prudential PLC | 1,315,049 | 25,958,454 | |
| Rolls-Royce Group PLC | 1,344,192 | 13,149,423 | |
| Saga PLC | 2,083,300 | 6,380,253 | |
| Schroders PLC | 216,222 | 7,942,550 | |
| Senior Engineering Group PLC | 3,385,600 | 10,764,388 | |
| Shawbrook Group PLC | 2,658,100 | 11,131,208 | |
| Softcat PLC | 2,168,878 | 10,109,289 | |
| St. James's Place Capital PLC | 577,862 | 7,320,454 | |
| Standard Chartered PLC (United Kingdom) | 4,774,215 | 38,513,636 | |
| Unite Group PLC | 1,114,687 | 10,301,685 | |
| Virgin Money Holdings Uk PLC | 1,292,548 | 6,895,302 | |
| William Hill PLC | 8,566,773 | 39,141,723 | |
| Worldpay Group PLC (b) | 2,438,800 | 9,510,855 | |
| TOTAL UNITED KINGDOM | 322,267,906 | ||
| TOTAL COMMON STOCKS | |||
| (Cost $1,212,366,663) | 1,244,967,871 | ||
| Nonconvertible Preferred Stocks - 0.0% | |||
| United Kingdom - 0.0% | |||
| Rolls-Royce Group PLC | |||
| (Cost $139,439) | 95,437,632 | 139,449 | |
| Money Market Funds - 5.5% | |||
| Fidelity Cash Central Fund, 0.38% (d) | 19,143,324 | 19,143,324 | |
| Fidelity Securities Lending Cash Central Fund, 0.42% (d)(e) | 51,164,371 | 51,164,371 | |
| TOTAL MONEY MARKET FUNDS | |||
| (Cost $70,307,695) | 70,307,695 | ||
| TOTAL INVESTMENT PORTFOLIO - 103.8% | |||
| (Cost $1,282,813,797) | 1,315,415,015 | ||
| NET OTHER ASSETS (LIABILITIES) - (3.8)% | (48,637,843) | ||
| NET ASSETS - 100% | $1,266,777,172 |
Categorizations in the Schedule of Investments are based on country or territory of incorporation.
Legend
(a) Security or a portion of the security is on loan at period end.
(b) Non-income producing
(c) Affiliated company
(d) Affiliated fund that is generally available only to investment companies and other accounts managed by Fidelity Investments. The rate quoted is the annualized seven-day yield of the fund at period end. A complete unaudited listing of the fund's holdings as of its most recent quarter end is available upon request. In addition, each Fidelity Central Fund's financial statements are available on the SEC's website or upon request.
(e) Investment made with cash collateral received from securities on loan.
Affiliated Central Funds
Information regarding fiscal year to date income earned by the Fund from investments in Fidelity Central Funds is as follows:
| Fund | Income earned |
| Fidelity Cash Central Fund | $14,049 |
| Fidelity Securities Lending Cash Central Fund | 470,655 |
| Total | $484,704 |
Other Affiliated Issuers
An affiliated company is a company in which the Fund has ownership of at least 5% of the voting securities. Fiscal year to date transactions with companies which are or were affiliates are as follows:
| Affiliate | Value, beginning of period | Purchases | Sales Proceeds | Dividend Income | Value, end of period |
| Vostok Emerging Finance Ltd. (depository receipt) | $1,697,310 | $3,320,861 | $-- | $-- | $7,179,016 |
| Total | $1,697,310 | $3,320,861 | $-- | $-- | $7,179,016 |
Investment Valuation
The following is a summary of the inputs used, as of April 30, 2016, involving the Fund's assets and liabilities carried at fair value. The inputs or methodology used for valuing securities may not be an indication of the risk associated with investing in those securities. For more information on valuation inputs, and their aggregation into the levels used below, please refer to the Investment Valuation section in the accompanying Notes to Financial Statements.
| Valuation Inputs at Reporting Date: | ||||
| Description | Total | Level 1 | Level 2 | Level 3 |
| Investments in Securities: | ||||
| Equities: | ||||
| Consumer Discretionary | $212,152,716 | $159,578,109 | $52,574,607 | $-- |
| Consumer Staples | 47,979,797 | 47,979,797 | -- | -- |
| Energy | 20,069,871 | 20,069,871 | -- | -- |
| Financials | 314,133,845 | 252,253,167 | 61,880,678 | -- |
| Health Care | 217,753,137 | 177,029,591 | 40,723,546 | -- |
| Industrials | 224,647,621 | 209,796,917 | 14,850,704 | -- |
| Information Technology | 168,222,761 | 123,402,516 | 44,820,245 | -- |
| Materials | 24,023,686 | 24,023,686 | -- | -- |
| Utilities | 16,123,886 | 16,123,886 | -- | -- |
| Money Market Funds | 70,307,695 | 70,307,695 | -- | -- |
| Total Investments in Securities: | $1,315,415,015 | $1,100,565,235 | $214,849,780 | $-- |
The following is a summary of transfers between Level 1 and Level 2 for the period ended April 30, 2016. Transfers are assumed to have occurred at the beginning of the period, and are primarily attributable to the valuation techniques used for foreign equity securities, as discussed in the accompanying Notes to Financial Statements:
| Transfers | Total |
| Level 1 to Level 2 | $14,998,864 |
| Level 2 to Level 1 | $104,687,573 |
See accompanying notes which are an integral part of the financial statements.
Fidelity® Europe Fund
Financial Statements
Statement of Assets and Liabilities
| April 30, 2016 (Unaudited) | ||
| Assets | ||
| Investment in securities, at value (including securities loaned of $47,749,257) — See accompanying schedule: Unaffiliated issuers (cost $1,205,694,084) | $1,237,928,304 | |
| Fidelity Central Funds (cost $70,307,695) | 70,307,695 | |
| Other affiliated issuers (cost $6,812,018) | 7,179,016 | |
| Total Investments (cost $1,282,813,797) | $1,315,415,015 | |
| Foreign currency held at value (cost $415,926) | 416,697 | |
| Receivable for investments sold | 16,944,779 | |
| Receivable for fund shares sold | 359,129 | |
| Dividends receivable | 6,058,099 | |
| Distributions receivable from Fidelity Central Funds | 118,618 | |
| Prepaid expenses | 1,099 | |
| Other receivables | 385,751 | |
| Total assets | 1,339,699,187 | |
| Liabilities | ||
| Payable for investments purchased | $15,172,992 | |
| Payable for fund shares redeemed | 5,402,754 | |
| Accrued management fee | 852,908 | |
| Distribution and service plan fees payable | 17,090 | |
| Other affiliated payables | 255,438 | |
| Other payables and accrued expenses | 56,462 | |
| Collateral on securities loaned, at value | 51,164,371 | |
| Total liabilities | 72,922,015 | |
| Net Assets | $1,266,777,172 | |
| Net Assets consist of: | ||
| Paid in capital | $1,471,111,712 | |
| Undistributed net investment income | 6,329,298 | |
| Accumulated undistributed net realized gain (loss) on investments and foreign currency transactions | (243,252,646) | |
| Net unrealized appreciation (depreciation) on investments and assets and liabilities in foreign currencies | 32,588,808 | |
| Net Assets | $1,266,777,172 | |
| Calculation of Maximum Offering Price | ||
| Class A: | ||
| Net Asset Value and redemption price per share ($20,856,215 ÷ 580,720 shares) | $35.91 | |
| Maximum offering price per share (100/94.25 of $35.91) | $38.10 | |
| Class T: | ||
| Net Asset Value and redemption price per share ($8,671,461 ÷ 241,352 shares) | $35.93 | |
| Maximum offering price per share (100/96.50 of $35.93) | $37.23 | |
| Class B: | ||
| Net Asset Value and offering price per share ($330,539 ÷ 9,203 shares)(a) | $35.92 | |
| Class C: | ||
| Net Asset Value and offering price per share ($10,556,892 ÷ 295,836 shares)(a) | $35.68 | |
| Europe: | ||
| Net Asset Value, offering price and redemption price per share ($1,220,777,096 ÷ 33,951,628 shares) | $35.96 | |
| Class I: | ||
| Net Asset Value, offering price and redemption price per share ($5,584,969 ÷ 155,274 shares) | $35.97 |
(a) Redemption price per share is equal to net asset value less any applicable contingent deferred sales charge.
See accompanying notes which are an integral part of the financial statements.
Statement of Operations
| Six months ended April 30, 2016 (Unaudited) | ||
| Investment Income | ||
| Dividends | $14,304,511 | |
| Income from Fidelity Central Funds | 484,704 | |
| Income before foreign taxes withheld | 14,789,215 | |
| Less foreign taxes withheld | (1,301,648) | |
| Total income | 13,487,567 | |
| Expenses | ||
| Management fee | ||
| Basic fee | $4,572,219 | |
| Performance adjustment | 720,162 | |
| Transfer agent fees | 1,275,395 | |
| Distribution and service plan fees | 103,701 | |
| Accounting and security lending fees | 300,640 | |
| Custodian fees and expenses | 58,646 | |
| Independent trustees' compensation | 2,980 | |
| Registration fees | 82,776 | |
| Audit | 51,983 | |
| Legal | 2,453 | |
| Interest | 1,158 | |
| Miscellaneous | 4,678 | |
| Total expenses before reductions | 7,176,791 | |
| Expense reductions | (17,200) | 7,159,591 |
| Net investment income (loss) | 6,327,976 | |
| Realized and Unrealized Gain (Loss) | ||
| Net realized gain (loss) on: | ||
| Investment securities: | ||
| Unaffiliated issuers | (9,336,540) | |
| Foreign currency transactions | 527,156 | |
| Total net realized gain (loss) | (8,809,384) | |
| Change in net unrealized appreciation (depreciation) on: Investment securities | (29,111,544) | |
| Assets and liabilities in foreign currencies | (229,593) | |
| Total change in net unrealized appreciation (depreciation) | (29,341,137) | |
| Net gain (loss) | (38,150,521) | |
| Net increase (decrease) in net assets resulting from operations | $(31,822,545) |
See accompanying notes which are an integral part of the financial statements.
Statement of Changes in Net Assets
| Six months ended April 30, 2016 (Unaudited) | Year ended October 31, 2015 | |
| Increase (Decrease) in Net Assets | ||
| Operations | ||
| Net investment income (loss) | $6,327,976 | $17,742,695 |
| Net realized gain (loss) | (8,809,384) | 56,856,298 |
| Change in net unrealized appreciation (depreciation) | (29,341,137) | (21,376,933) |
| Net increase (decrease) in net assets resulting from operations | (31,822,545) | 53,222,060 |
| Distributions to shareholders from net investment income | (15,981,681) | (31,603,696) |
| Distributions to shareholders from net realized gain | (5,885,187) | – |
| Total distributions | (21,866,868) | (31,603,696) |
| Share transactions - net increase (decrease) | (114,922,308) | 125,806,049 |
| Redemption fees | 7,934 | 48,244 |
| Total increase (decrease) in net assets | (168,603,787) | 147,472,657 |
| Net Assets | ||
| Beginning of period | 1,435,380,959 | 1,287,908,302 |
| End of period (including undistributed net investment income of $6,329,298 and undistributed net investment income of $15,983,003, respectively) | $1,266,777,172 | $1,435,380,959 |
See accompanying notes which are an integral part of the financial statements.
Financial Highlights — Fidelity Europe Fund Class A
| Six months ended (Unaudited) April 30, | Years ended October 31, | ||
| 2016 | 2015 | 2014 A | |
| Selected Per–Share Data | |||
| Net asset value, beginning of period | $37.06 | $36.24 | $39.45 |
| Income from Investment Operations | |||
| Net investment income (loss)B | .12 | .37 | .47 |
| Net realized and unrealized gain (loss) | (.83) | 1.29 | (3.68) |
| Total from investment operations | (.71) | 1.66 | (3.21) |
| Distributions from net investment income | (.29) | (.84) | – |
| Distributions from net realized gain | (.15) | – | – |
| Total distributions | (.44) | (.84) | – |
| Redemption fees added to paid in capitalB,C | – | – | – |
| Net asset value, end of period | $35.91 | $37.06 | $36.24 |
| Total ReturnD,E,F | (1.94)% | 4.63% | (8.14)% |
| Ratios to Average Net AssetsG,H | |||
| Expenses before reductions | 1.40%I | 1.33% | 1.35%I |
| Expenses net of fee waivers, if any | 1.39%I | 1.33% | 1.35%I |
| Expenses net of all reductions | 1.39%I | 1.31% | 1.35%I |
| Net investment income (loss) | .67%I | .98% | 1.94%I |
| Supplemental Data | |||
| Net assets, end of period (000 omitted) | $20,856 | $23,381 | $23,633 |
| Portfolio turnover rateJ | 43%I | 87% | 80%K |
A For the period March 18, 2014 (commencement of sale of shares) to October 31, 2014.
B Calculated based on average shares outstanding during the period.
C Amount represents less than $.005 per share.
D Total returns for periods of less than one year are not annualized.
E Total returns would have been lower if certain expenses had not been reduced during the applicable periods shown.
F Total returns do not include the effect of the sales charges.
G Fees and expenses of any underlying Fidelity Central Funds are not included in the Fund's expense ratio. The Fund indirectly bears its proportionate share of the expenses of any underlying Fidelity Central Funds.
H Expense ratios reflect operating expenses of the class. Expenses before reductions do not reflect amounts reimbursed by the investment adviser or reductions from brokerage service arrangements or reductions from other expense offset arrangements and do not represent the amount paid by the class during periods when reimbursements or reductions occur. Expenses net of fee waivers reflect expenses after reimbursement by the investment adviser but prior to reductions from brokerage service arrangements or other expense offset arrangements. Expenses net of all reductions represent the net expenses paid by the class.
I Annualized
J Amount does not include the portfolio activity of any underlying Fidelity Central Funds.
K The portfolio turnover rate does not include the assets acquired in the merger.
See accompanying notes which are an integral part of the financial statements.
Financial Highlights — Fidelity Europe Fund Class T
| Six months ended (Unaudited) April 30, | Years ended October 31, | ||
| 2016 | 2015 | 2014 A | |
| Selected Per–Share Data | |||
| Net asset value, beginning of period | $36.94 | $36.18 | $39.45 |
| Income from Investment Operations | |||
| Net investment income (loss)B | .06 | .26 | .40 |
| Net realized and unrealized gain (loss) | (.82) | 1.29 | (3.67) |
| Total from investment operations | (.76) | 1.55 | (3.27) |
| Distributions from net investment income | (.09) | (.79) | – |
| Distributions from net realized gain | (.15) | – | – |
| Total distributions | (.25)C | (.79) | – |
| Redemption fees added to paid in capitalB,D | – | – | – |
| Net asset value, end of period | $35.93 | $36.94 | $36.18 |
| Total ReturnE,F,G | (2.08)% | 4.33% | (8.29)% |
| Ratios to Average Net AssetsH,I | |||
| Expenses before reductions | 1.70%J | 1.61% | 1.62%J |
| Expenses net of fee waivers, if any | 1.70%J | 1.61% | 1.61%J |
| Expenses net of all reductions | 1.70%J | 1.59% | 1.61%J |
| Net investment income (loss) | .36%J | .70% | 1.68%J |
| Supplemental Data | |||
| Net assets, end of period (000 omitted) | $8,671 | $9,632 | $13,679 |
| Portfolio turnover rateK | 43%J | 87% | 80%L |
A For the period March 18, 2014 (commencement of sale of shares) to October 31, 2014.
B Calculated based on average shares outstanding during the period.
C Total distributions of $.25 per share is comprised of distributions from net investment income of $.092 and distributions from net realized gain of $.154 per share.
D Amount represents less than $.005 per share.
E Total returns for periods of less than one year are not annualized.
F Total returns would have been lower if certain expenses had not been reduced during the applicable periods shown.
G Total returns do not include the effect of the sales charges.
H Fees and expenses of any underlying Fidelity Central Funds are not included in the Fund's expense ratio. The Fund indirectly bears its proportionate share of the expenses of any underlying Fidelity Central Funds.
I Expense ratios reflect operating expenses of the class. Expenses before reductions do not reflect amounts reimbursed by the investment adviser or reductions from brokerage service arrangements or reductions from other expense offset arrangements and do not represent the amount paid by the class during periods when reimbursements or reductions occur. Expenses net of fee waivers reflect expenses after reimbursement by the investment adviser but prior to reductions from brokerage service arrangements or other expense offset arrangements. Expenses net of all reductions represent the net expenses paid by the class.
J Annualized
K Amount does not include the portfolio activity of any underlying Fidelity Central Funds.
L The portfolio turnover rate does not include the assets acquired in the merger.
See accompanying notes which are an integral part of the financial statements.
Financial Highlights — Fidelity Europe Fund Class B
| Six months ended (Unaudited) April 30, | Years ended October 31, | ||
| 2016 | 2015 | 2014 A | |
| Selected Per–Share Data | |||
| Net asset value, beginning of period | $36.77 | $36.07 | $39.45 |
| Income from Investment Operations | |||
| Net investment income (loss)B | (.02) | .06 | .28 |
| Net realized and unrealized gain (loss) | (.83) | 1.29 | (3.66) |
| Total from investment operations | (.85) | 1.35 | (3.38) |
| Distributions from net investment income | – | (.65) | – |
| Redemption fees added to paid in capitalB,C | – | – | – |
| Net asset value, end of period | $35.92 | $36.77 | $36.07 |
| Total ReturnD,E,F | (2.31)% | 3.78% | (8.57)% |
| Ratios to Average Net AssetsG,H | |||
| Expenses before reductions | 2.19%I | 2.15% | 2.11%I |
| Expenses net of fee waivers, if any | 2.19%I | 2.15% | 2.11%I |
| Expenses net of all reductions | 2.19%I | 2.13% | 2.11%I |
| Net investment income (loss) | (.12)%I | .16% | 1.19%I |
| Supplemental Data | |||
| Net assets, end of period (000 omitted) | $331 | $530 | $1,065 |
| Portfolio turnover rateJ | 43%I | 87% | 80%K |
A For the period March 18, 2014 (commencement of sale of shares) to October 31, 2014.
B Calculated based on average shares outstanding during the period.
C Amount represents less than $.005 per share.
D Total returns for periods of less than one year are not annualized.
E Total returns would have been lower if certain expenses had not been reduced during the applicable periods shown.
F Total returns do not include the effect of the contingent deferred sales charge.
G Fees and expenses of any underlying Fidelity Central Funds are not included in the Fund's expense ratio. The Fund indirectly bears its proportionate share of the expenses of any underlying Fidelity Central Funds.
H Expense ratios reflect operating expenses of the class. Expenses before reductions do not reflect amounts reimbursed by the investment adviser or reductions from brokerage service arrangements or reductions from other expense offset arrangements and do not represent the amount paid by the class during periods when reimbursements or reductions occur. Expenses net of fee waivers reflect expenses after reimbursement by the investment adviser but prior to reductions from brokerage service arrangements or other expense offset arrangements. Expenses net of all reductions represent the net expenses paid by the class.
I Annualized
J Amount does not include the portfolio activity of any underlying Fidelity Central Funds.
K The portfolio turnover rate does not include the assets acquired in the merger.
See accompanying notes which are an integral part of the financial statements.
Financial Highlights — Fidelity Europe Fund Class C
| Six months ended (Unaudited) April 30, | Years ended October 31, | ||
| 2016 | 2015 | 2014 A | |
| Selected Per–Share Data | |||
| Net asset value, beginning of period | $36.81 | $36.07 | $39.45 |
| Income from Investment Operations | |||
| Net investment income (loss)B | (.02) | .07 | .29 |
| Net realized and unrealized gain (loss) | (.83) | 1.29 | (3.67) |
| Total from investment operations | (.85) | 1.36 | (3.38) |
| Distributions from net investment income | (.12) | (.62) | – |
| Distributions from net realized gain | (.15) | – | – |
| Total distributions | (.28)C | (.62) | – |
| Redemption fees added to paid in capitalB,D | – | – | – |
| Net asset value, end of period | $35.68 | $36.81 | $36.07 |
| Total ReturnE,F,G | (2.33)% | 3.79% | (8.57)% |
| Ratios to Average Net AssetsH,I | |||
| Expenses before reductions | 2.18%J | 2.13% | 2.10%J |
| Expenses net of fee waivers, if any | 2.18%J | 2.13% | 2.10%J |
| Expenses net of all reductions | 2.18%J | 2.11% | 2.10%J |
| Net investment income (loss) | (.12)%J | .18% | 1.19%J |
| Supplemental Data | |||
| Net assets, end of period (000 omitted) | $10,557 | $11,151 | $6,818 |
| Portfolio turnover rateK | 43%J | 87% | 80%L |
A For the period March 18, 2014 (commencement of sale of shares) to October 31, 2014.
B Calculated based on average shares outstanding during the period.
C Total distributions of $.28 per share is comprised of distributions from net investment income of $.123 and distributions from net realized gain of $.154 per share.
D Amount represents less than $.005 per share.
E Total returns for periods of less than one year are not annualized.
F Total returns would have been lower if certain expenses had not been reduced during the applicable periods shown.
G Total returns do not include the effect of the contingent deferred sales charge.
H Fees and expenses of any underlying Fidelity Central Funds are not included in the Fund's expense ratio. The Fund indirectly bears its proportionate share of the expenses of any underlying Fidelity Central Funds.
I Expense ratios reflect operating expenses of the class. Expenses before reductions do not reflect amounts reimbursed by the investment adviser or reductions from brokerage service arrangements or reductions from other expense offset arrangements and do not represent the amount paid by the class during periods when reimbursements or reductions occur. Expenses net of fee waivers reflect expenses after reimbursement by the investment adviser but prior to reductions from brokerage service arrangements or other expense offset arrangements. Expenses net of all reductions represent the net expenses paid by the class.
J Annualized
K Amount does not include the portfolio activity of any underlying Fidelity Central Funds.
L The portfolio turnover rate does not include the assets acquired in the merger.
See accompanying notes which are an integral part of the financial statements.
Financial Highlights — Fidelity Europe Fund
| Six months ended (Unaudited) April 30, | Years ended October 31, | |||||
| 2016 | 2015 | 2014 | 2013 | 2012 | 2011 | |
| Selected Per–Share Data | ||||||
| Net asset value, beginning of period | $37.19 | $36.32 | $37.92 | $30.15 | $27.67 | $30.83 |
| Income from Investment Operations | ||||||
| Net investment income (loss)A | .17 | .48 | .94B | .61 | .64 | .48 |
| Net realized and unrealized gain (loss) | (.82) | 1.30 | (2.00) | 7.87 | 2.45 | (2.97) |
| Total from investment operations | (.65) | 1.78 | (1.06) | 8.48 | 3.09 | (2.49) |
| Distributions from net investment income | (.43) | (.91) | (.52) | (.70) | (.60) | (.67) |
| Distributions from net realized gain | (.15) | – | (.02) | (.01) | (.02) | – |
| Total distributions | (.58) | (.91) | (.54) | (.71) | (.61)C | (.67) |
| Redemption fees added to paid in capitalA,D | – | – | – | – | – | – |
| Net asset value, end of period | $35.96 | $37.19 | $36.32 | $37.92 | $30.15 | $27.67 |
| Total ReturnE,F | (1.78)% | 4.97% | (2.82)% | 28.71% | 11.53% | (8.32)% |
| Ratios to Average Net AssetsG,H | ||||||
| Expenses before reductions | 1.08%I | 1.03% | .97% | 1.06% | .83% | 1.10% |
| Expenses net of fee waivers, if any | 1.08%I | 1.03% | .97% | 1.05% | .83% | 1.10% |
| Expenses net of all reductions | 1.08%I | 1.01% | .96% | 1.02% | .80% | 1.06% |
| Net investment income (loss) | .99%I | 1.28% | 2.43%B | 1.82% | 2.33% | 1.56% |
| Supplemental Data | ||||||
| Net assets, end of period (000 omitted) | $1,220,777 | $1,384,134 | $1,237,047 | $957,048 | $602,520 | $621,778 |
| Portfolio turnover rateJ | 43%I | 87% | 80%K | 59% | 127% | 117% |
A Calculated based on average shares outstanding during the period.
B Net Investment income per share reflects a large, non-recurring dividend which amounted to $.19 per share. Excluding this non-recurring dividend, the ratio of net investment income (loss) to average net assets would have been 1.93%.
C Total distributions of $.61 per share is comprised of distributions from net investment income of $.595 and distributions from net realized gain of $.017 per share.
D Amount represents less than $.005 per share.
E Total returns for periods of less than one year are not annualized.
F Total returns would have been lower if certain expenses had not been reduced during the applicable periods shown.
G Fees and expenses of any underlying Fidelity Central Funds are not included in the Fund's expense ratio. The Fund indirectly bears its proportionate share of the expenses of any underlying Fidelity Central Funds.
H Expense ratios reflect operating expenses of the class. Expenses before reductions do not reflect amounts reimbursed by the investment adviser or reductions from brokerage service arrangements or reductions from other expense offset arrangements and do not represent the amount paid by the class during periods when reimbursements or reductions occur. Expenses net of fee waivers reflect expenses after reimbursement by the investment adviser but prior to reductions from brokerage service arrangements or other expense offset arrangements. Expenses net of all reductions represent the net expenses paid by the class.
I Annualized
J Amount does not include the portfolio activity of any underlying Fidelity Central Funds.
K The portfolio turnover rate does not include the assets acquired in the merger.
See accompanying notes which are an integral part of the financial statements.
Financial Highlights — Fidelity Europe Fund Class I
| Six months ended (Unaudited) April 30, | Years ended October 31, | ||
| 2016 | 2015 | 2014 A | |
| Selected Per–Share Data | |||
| Net asset value, beginning of period | $37.21 | $36.32 | $39.45 |
| Income from Investment Operations | |||
| Net investment income (loss)B | .18 | .50 | .56 |
| Net realized and unrealized gain (loss) | (.82) | 1.30 | (3.69) |
| Total from investment operations | (.64) | 1.80 | (3.13) |
| Distributions from net investment income | (.45) | (.91) | – |
| Distributions from net realized gain | (.15) | – | – |
| Total distributions | (.60) | (.91) | – |
| Redemption fees added to paid in capitalB,C | – | – | – |
| Net asset value, end of period | $35.97 | $37.21 | $36.32 |
| Total ReturnD,E | (1.75)% | 5.02% | (7.93)% |
| Ratios to Average Net AssetsF,G | |||
| Expenses before reductions | 1.02%H | .98% | .97%H |
| Expenses net of fee waivers, if any | 1.02%H | .98% | .97%H |
| Expenses net of all reductions | 1.02%H | .96% | .96%H |
| Net investment income (loss) | 1.05%H | 1.33% | 2.33%H |
| Supplemental Data | |||
| Net assets, end of period (000 omitted) | $5,585 | $6,552 | $5,666 |
| Portfolio turnover rateI | 43%H | 87% | 80%J |
A For the period March 18, 2014 (commencement of sale of shares) to October 31, 2014.
B Calculated based on average shares outstanding during the period.
C Amount represents less than $.005 per share.
D Total returns for periods of less than one year are not annualized.
E Total returns would have been lower if certain expenses had not been reduced during the applicable periods shown.
F Fees and expenses of any underlying Fidelity Central Funds are not included in the Fund's expense ratio. The Fund indirectly bears its proportionate share of the expenses of any underlying Fidelity Central Funds.
G Expense ratios reflect operating expenses of the class. Expenses before reductions do not reflect amounts reimbursed by the investment adviser or reductions from brokerage service arrangements or reductions from other expense offset arrangements and do not represent the amount paid by the class during periods when reimbursements or reductions occur. Expenses net of fee waivers reflect expenses after reimbursement by the investment adviser but prior to reductions from brokerage service arrangements or other expense offset arrangements. Expenses net of all reductions represent the net expenses paid by the class.
H Annualized
I Amount does not include the portfolio activity of any underlying Fidelity Central Funds.
J The portfolio turnover rate does not include the assets acquired in the merger.
See accompanying notes which are an integral part of the financial statements.
Notes to Financial Statements (Unaudited)
For the period ended April 30, 2016
1. Organization.
Fidelity Europe Fund (the Fund) is a fund of Fidelity Investment Trust (the Trust) and is authorized to issue an unlimited number of shares. The Trust is registered under the Investment Company Act of 1940, as amended (the 1940 Act), as an open-end management investment company organized as a Massachusetts business trust. The Fund offers Class A, Class T, Class C, Europe and Class I shares, each of which, along with Class B shares, has equal rights as to assets and voting privileges. Class B shares are closed to new accounts and additional purchases, except for exchanges and reinvestments. Each class has exclusive voting rights with respect to matters that affect that class. Class B shares will automatically convert to Class A shares after a holding period of seven years from the initial date of purchase.
During the period, the Board of Trustees approved the conversion of all existing Class B shares into Class A shares, effective on or about July 1, 2016, regardless of the length of times shares have been held.
2. Investments in Fidelity Central Funds.
The Fund invests in Fidelity Central Funds, which are open-end investment companies generally available only to other investment companies and accounts managed by the investment adviser and its affiliates. The Fund's Schedule of Investments lists each of the Fidelity Central Funds held as of period end, if any, as an investment of the Fund, but does not include the underlying holdings of each Fidelity Central Fund. As an Investing Fund, the Fund indirectly bears its proportionate share of the expenses of the underlying Fidelity Central Funds.
The Money Market Central Funds seek preservation of capital and current income and are managed by Fidelity Investments Money Management, Inc. (FIMM), an affiliate of the investment adviser. Annualized expenses of the Money Market Central Funds as of their most recent shareholder report date are less than .005%.
A complete unaudited list of holdings for each Fidelity Central Fund is available upon request or at the Securities and Exchange Commission (the SEC) website at www.sec.gov. In addition, the financial statements of the Fidelity Central Funds are available on the SEC website or upon request.
3. Significant Accounting Policies.
The financial statements have been prepared in conformity with accounting principles generally accepted in the United States of America (GAAP), which require management to make certain estimates and assumptions at the date of the financial statements. Actual results could differ from those estimates. Subsequent events, if any, through the date that the financial statements were issued have been evaluated in the preparation of the financial statements. The following summarizes the significant accounting policies of the Fund:
Investment Valuation. Investments are valued as of 4:00 p.m. Eastern time on the last calendar day of the period. The Board of Trustees (the Board) has delegated the day to day responsibility for the valuation of the Fund's investments to the Fidelity Management & Research Company (FMR) Fair Value Committee (the Committee). In accordance with valuation policies and procedures approved by the Board, the Fund attempts to obtain prices from one or more third party pricing vendors or brokers to value its investments. When current market prices, quotations or currency exchange rates are not readily available or reliable, investments will be fair valued in good faith by the Committee, in accordance with procedures adopted by the Board. Factors used in determining fair value vary by investment type and may include market or investment specific events. The frequency with which these procedures are used cannot be predicted and they may be utilized to a significant extent. The Committee oversees the Fund's valuation policies and procedures and reports to the Board on the Committee's activities and fair value determinations. The Board monitors the appropriateness of the procedures used in valuing the Fund's investments and ratifies the fair value determinations of the Committee.
The Fund categorizes the inputs to valuation techniques used to value its investments into a disclosure hierarchy consisting of three levels as shown below:
- Level 1 – quoted prices in active markets for identical investments
- Level 2 – other significant observable inputs (including quoted prices for similar investments, interest rates, prepayment speeds, etc.)
- Level 3 – unobservable inputs (including the Fund's own assumptions based on the best information available)
Valuation techniques used to value the Fund's investments by major category are as follows:
Equity securities, including restricted securities, for which market quotations are readily available, are valued at the last reported sale price or official closing price as reported by a third party pricing vendor on the primary market or exchange on which they are traded and are categorized as Level 1 in the hierarchy. In the event there were no sales during the day or closing prices are not available, securities are valued at the last quoted bid price or may be valued using the last available price and are generally categorized as Level 2 in the hierarchy. For foreign equity securities, when market or security specific events arise, comparisons to the valuation of American Depositary Receipts (ADRs), futures contracts, Exchange-Traded Funds (ETFs) and certain indexes as well as quoted prices for similar securities may be used and would be categorized as Level 2 in the hierarchy. Utilizing these techniques may result in transfers between Level 1 and Level 2. For equity securities, including restricted securities, where observable inputs are limited, assumptions about market activity and risk are used and these securities may be categorized as Level 3 in the hierarchy.
Investments in open-end mutual funds, including the Fidelity Central Funds, are valued at their closing net asset value (NAV) each business day and are categorized as Level 1 in the hierarchy.
Changes in valuation techniques may result in transfers in or out of an assigned level within the disclosure hierarchy. The aggregate value of investments by input level as of April 30, 2016, including information on transfers between Levels 1 and 2, is included at the end of the Fund's Schedule of Investments.
Foreign Currency. The Fund may use foreign currency contracts to facilitate transactions in foreign-denominated securities. Gains and losses from these transactions may arise from changes in the value of the foreign currency or if the counterparties do not perform under the contracts' terms.
Foreign-denominated assets, including investment securities, and liabilities are translated into U.S. dollars at the exchange rates at period end. Purchases and sales of investment securities, income and dividends received and expenses denominated in foreign currencies are translated into U.S. dollars at the exchange rate in effect on the transaction date.
The effects of exchange rate fluctuations on investments are included with the net realized and unrealized gain (loss) on investment securities. Other foreign currency transactions resulting in realized and unrealized gain (loss) are disclosed separately.
Investment Transactions and Income. For financial reporting purposes, the Fund's investment holdings and NAV include trades executed through the end of the last business day of the period. The NAV per share for processing shareholder transactions is calculated as of the close of business of the New York Stock Exchange (NYSE), normally 4:00 p.m. Eastern time and includes trades executed through the end of the prior business day. Gains and losses on securities sold are determined on the basis of identified cost. Dividend income is recorded on the ex-dividend date, except for certain dividends from foreign securities where the ex-dividend date may have passed, which are recorded as soon as the Fund is informed of the ex-dividend date. Non-cash dividends included in dividend income, if any, are recorded at the fair market value of the securities received. Income and capital gain distributions from Fidelity Central Funds, if any, are recorded on the ex-dividend date. Interest income is accrued as earned and includes coupon interest and amortization of premium and accretion of discount on debt securities as applicable. Investment income is recorded net of foreign taxes withheld where recovery of such taxes is uncertain.
Class Allocations and Expenses. Investment income, realized and unrealized capital gains and losses, common expenses of the Fund, and certain fund-level expense reductions, if any, are allocated daily on a pro-rata basis to each class based on the relative net assets of each class to the total net assets of the Fund. Each class differs with respect to transfer agent and distribution and service plan fees incurred. Certain expense reductions may also differ by class. For the reporting period, the allocated portion of income and expenses to each class as a percent of its average net assets may vary due to the timing of recording these transactions in relation to fluctuating net assets of the classes. Expenses directly attributable to a fund are charged to that fund. Expenses attributable to more than one fund are allocated among the respective funds on the basis of relative net assets or other appropriate methods. Expense estimates are accrued in the period to which they relate and adjustments are made when actual amounts are known.
Income Tax Information and Distributions to Shareholders. Each year, the Fund intends to qualify as a regulated investment company under Subchapter M of the Internal Revenue Code, including distributing substantially all of its taxable income and realized gains. As a result, no provision for U.S. Federal income taxes is required. The Fund files a U.S. federal tax return, in addition to state and local tax returns as required. The Fund's federal income tax returns are subject to examination by the Internal Revenue Service (IRS) for a period of three fiscal years after they are filed. State and local tax returns may be subject to examination for an additional fiscal year depending on the jurisdiction. Foreign taxes are provided for based on the Fund's understanding of the tax rules and rates that exist in the foreign markets in which it invests.
Distributions are declared and recorded on the ex-dividend date. Income dividends and capital gain distributions are declared separately for each class. Income and capital gain distributions are determined in accordance with income tax regulations, which may differ from GAAP.
Capital accounts within the financial statements are adjusted for permanent book-tax differences. These adjustments have no impact on net assets or the results of operations. Capital accounts are not adjusted for temporary book-tax differences which will reverse in a subsequent period.
Book-tax differences are primarily due to foreign currency transactions, passive foreign investment companies (PFIC), deferred trustees compensation, expiring capital loss carryforwards, capital loss carryforwards and losses deferred due to wash sales.
The federal tax cost of investment securities and unrealized appreciation (depreciation) as of period end were as follows:
| Gross unrealized appreciation | $129,342,669 |
| Gross unrealized depreciation | (101,437,512) |
| Net unrealized appreciation (depreciation) on securities | 27,905,157 |
| Tax cost | $1,287,509,858 |
Capital loss carryforwards are only available to offset future capital gains of the Fund to the extent provided by regulations and may be limited. Under the Regulated Investment Company Modernization Act of 2010 (the Act), the Fund is permitted to carry forward capital losses incurred in taxable years beginning after December 22, 2010 for an unlimited period and such capital losses are required to be used prior to any losses that expire. The capital loss carryforward information presented below, including any applicable limitation, is estimated as of prior fiscal period end and is subject to adjustment.
| Fiscal year of expiration | |
| 2016 | $(29,326,707) |
| 2017 | (199,044,876) |
| Total capital loss carryforward | $(228,371,583) |
The Fund acquired $27,783,139 of its capital loss carryforward as part of a merger in a prior period. The losses acquired that will be available to offset future capital gains of the Fund will be limited to approximately $13,187,073 per year.
In addition, due to large redemptions in a prior period, $199,044,876 of capital losses that existed in the Fund prior to the mergers will be limited to approximately $32,029,274 per year.
Short-Term Trading (Redemption) Fees. Shares held by investors in the Fund less than 30 days may have been subject to a redemption fee equal to 1.00% of the NAV of shares redeemed. All redemption fees, which reduce the proceeds of the shareholder redemption, are retained by the Fund and accounted for as an addition to paid in capital.
4. Purchases and Sales of Investments.
Purchases and sales of securities, other than short-term securities, aggregated $283,545,193 and $431,225,868, respectively.
5. Fees and Other Transactions with Affiliates.
Management Fee. Fidelity Management & Research Company (the investment adviser) and its affiliates provide the Fund with investment management related services for which the Fund pays a monthly management fee. The management fee is the sum of an individual fund fee rate that is based on an annual rate of .45% of the Fund's average net assets and an annualized group fee rate that averaged .25% during the period. The group fee rate is based upon the average net assets of all the mutual funds advised by the investment adviser, including any mutual funds previously advised by the investment adviser that are currently advised by Fidelity SelectCo, LLC, an affiliate of the investment adviser. The group fee rate decreases as assets under management increase and increases as assets under management decrease. In addition, the management fee is subject to a performance adjustment (up to a maximum of +/- .20% of the Fund's average net assets over a 36 month performance period). The upward or downward adjustment to the management fee is based on the relative investment performance of Europe as compared to its benchmark index, the MSCI Europe Index, over the same 36 month performance period. For the reporting period, the total annualized management fee rate, including the performance adjustment, was .81% of the Fund's average net assets. The performance adjustment included in the management fee rate may be higher or lower than the maximum performance adjustment rate due to the difference between the average net assets for the reporting and performance periods.
Distribution and Service Plan Fees. In accordance with Rule 12b-1 of the 1940 Act, the Fund has adopted separate Distribution and Service Plans for each class of shares. Certain classes pay Fidelity Distributors Corporation (FDC), an affiliate of the investment adviser, separate Distribution and Service Fees, each of which is based on an annual percentage of each class' average net assets. In addition, FDC may pay financial intermediaries for selling shares of the Fund and providing shareholder support services. For the period, the Distribution and Service Fee rates, total fees and amounts retained by FDC were as follows:
| Distribution Fee | Service Fee | Total Fees | Retained by FDC | |
| Class A | -% | .25% | $26,590 | $886 |
| Class T | .25% | .25% | 21,666 | – |
| Class B | .75% | .25% | 2,040 | 1,569 |
| Class C | .75% | .25% | 53,405 | 15,830 |
| $103,701 | $18,285 |
Sales Load. FDC may receive a front-end sales charge of up to 5.75% for selling Class A shares and 3.50% for selling Class T shares, some of which is paid to financial intermediaries for selling shares of the Fund. Depending on the holding period, FDC may receive contingent deferred sales charges levied on Class A, Class T, Class B, and Class C redemptions. The deferred sales charges range from 5.00% to 1.00% for Class B shares, 1.00% for Class C shares, 1.00% for certain purchases of Class A shares and .25% for certain purchases of Class T shares.
For the period, sales charge amounts retained by FDC were as follows:
| Retained by FDC | |
| Class A | $10,882 |
| Class T | 686 |
| Class B(a) | 121 |
| Class C(a) | 2,570 |
| $14,259 |
(a) When Class B and Class C shares are initially sold, FDC pays commissions from its own resources to financial intermediaries through which the sales are made.
Transfer Agent Fees. Fidelity Investments Institutional Operations Company, Inc., (FIIOC), an affiliate of the investment adviser, is the transfer, dividend disbursing and shareholder servicing agent for each class of the Fund. FIIOC receives account fees and asset-based fees that vary according to the account size and type of account of the shareholders of the respective classes of the Fund. FIIOC pays for typesetting, printing and mailing of shareholder reports, except proxy statements.
For the period, transfer agent fees for each class were as follows:
| Amount | % of Class-Level Average Net Assets(a) | |
| Class A | $27,543 | .26 |
| Class T | 13,690 | .32 |
| Class B | 615 | .30 |
| Class C | 15,934 | .30 |
| Europe | 1,213,618 | .19 |
| Class I | 3,995 | .13 |
| $1,275,395 |
(a) Annualized
Accounting and Security Lending Fees. Fidelity Service Company, Inc. (FSC), an affiliate of the investment adviser, maintains the Fund's accounting records. The accounting fee is based on the level of average net assets for each month. Under a separate contract, FSC administers the security lending program. The security lending fee is based on the number and duration of lending transactions.
Brokerage Commissions. The Fund placed a portion of its portfolio transactions with brokerage firms which are affiliates of the investment adviser. Brokerage commissions are included in net realized gain (loss) and change in net unrealized appreciation (depreciation) in the Statement of Operations. The commissions paid to these affiliated firms were $35 for the period.
Interfund Lending Program. Pursuant to an Exemptive Order issued by the SEC, the Fund, along with other registered investment companies having management contracts with FMR or other affiliated entities of FMR, may participate in an interfund lending program. This program provides an alternative credit facility allowing the funds to borrow from, or lend money to, other participating affiliated funds. At period end, there were no interfund loans outstanding. The Fund's activity in this program during the period for which loans were outstanding was as follows:
| Borrower or Lender | Average Loan Balance | Weighted Average Interest Rate | Interest Expense |
| Borrower | $6,354,364 | .60% | $1,158 |
Interfund Trades. The Fund may purchase from or sell securities to other Fidelity Funds under procedures adopted by the Board. The procedures have been designed to ensure these interfund trades are executed in accordance with Rule 17a-7 of the 1940 Act. Interfund trades are included within the respective purchases and sales amounts shown in the Purchases and Sales of Investments note.
6. Committed Line of Credit.
The Fund participates with other funds managed by the investment adviser or an affiliate in a $4.25 billion credit facility (the "line of credit") to be utilized for temporary or emergency purposes to fund shareholder redemptions or for other short-term liquidity purposes. The Fund has agreed to pay commitment fees on its pro-rata portion of the line of credit, which amounted to $1,177 and is reflected in Miscellaneous expenses on the Statement of Operations. During the period, the Fund did not borrow on this line of credit.
7. Security Lending.
The Fund lends portfolio securities through a lending agent from time to time in order to earn additional income. For equity securities, a lending agent is used and may loan securities to certain qualified borrowers, including Fidelity Capital Markets (FCM), a broker-dealer affiliated with the Fund. On the settlement date of the loan, the Fund receives collateral (in the form of U.S. Treasury obligations, letters of credit and/or cash) against the loaned securities and maintains collateral in an amount not less than 100% of the market value of the loaned securities during the period of the loan. The market value of the loaned securities is determined at the close of business of the Fund and any additional required collateral is delivered to the Fund on the next business day. The Fund or borrower may terminate the loan at any time, and if the borrower defaults on its obligation to return the securities loaned because of insolvency or other reasons, the Fund may apply collateral received from the borrower against the obligation. The Fund may experience delays and costs in recovering the securities loaned. Any cash collateral received is invested in the Fidelity Securities Lending Cash Central Fund. The value of loaned securities and cash collateral at period end are disclosed on the Fund's Statement of Assets and Liabilities. Security lending income represents the income earned on investing cash collateral, less rebates paid to borrowers and any lending agent fees associated with the loan, plus any premium payments received for lending certain types of securities. Security lending income is presented in the Statement of Operations as a component of income from Fidelity Central Funds. Total security lending income during the period amounted to $470,655. During the period, there were no securities loaned to FCM.
8. Expense Reductions.
Commissions paid to certain brokers with whom the investment adviser, or its affiliates, places trades on behalf of the Fund include an amount in addition to trade execution, which may be rebated back to the Fund to offset certain expenses. This amount totaled $12,221 for the period.
In addition, during the period the investment adviser reimbursed and/or waived a portion of fund-level operating expenses in the amount of $4,979.
9. Distributions to Shareholders.
Distributions to shareholders of each class were as follows:
| Six months ended April 30, 2016 | Year ended October 31, 2015 | |
| From net investment income | ||
| Class A | $174,443 | $549,660 |
| Class T | 23,347 | 299,142 |
| Class B | – | 18,443 |
| Class C | 38,160 | 108,670 |
| Europe | 15,664,870 | 30,497,764 |
| Class I | 80,861 | 130,017 |
| Total | $15,981,681 | $31,603,696 |
| From net realized gain | ||
| Class A | $94,260 | $– |
| Class T | 39,080 | – |
| Class C | 47,778 | – |
| Europe | 5,676,211 | – |
| Class I | 27,858 | – |
| Total | $5,885,187 | $– |
10. Share Transactions.
Share transactions for each class were as follows and may contain automatic conversions between classes or exchanges between affiliated funds:
| Shares | Shares | Dollars | Dollars | |
| Six months ended April 30, 2016 | Year ended October 31, 2015 | Six months ended April 30, 2016 | Year ended October 31, 2015 | |
| Class A | ||||
| Shares sold | 78,312 | 402,890 | $2,720,240 | $15,313,815 |
| Reinvestment of distributions | 7,044 | 14,493 | 257,822 | 527,143 |
| Shares redeemed | (135,509) | (438,670) | (4,688,764) | (16,388,542) |
| Net increase (decrease) | (50,153) | (21,287) | $(1,710,702) | $(547,584) |
| Class T | ||||
| Shares sold | 10,132 | 101,998 | $350,155 | $3,848,880 |
| Reinvestment of distributions | 1,677 | 8,153 | 61,481 | 296,280 |
| Shares redeemed | (31,208) | (227,511) | (1,080,460) | (8,571,443) |
| Net increase (decrease) | (19,399) | (117,360) | $(668,824) | $(4,426,283) |
| Class B | ||||
| Shares sold | 183 | 7,973 | $6,068 | $306,370 |
| Reinvestment of distributions | – | 481 | – | 17,468 |
| Shares redeemed | (5,404) | (23,568) | (183,746) | (877,823) |
| Net increase (decrease) | (5,221) | (15,114) | $(177,678) | $(553,985) |
| Class C | ||||
| Shares sold | 44,908 | 197,774 | $1,558,483 | $7,494,390 |
| Reinvestment of distributions | 2,232 | 2,632 | 81,438 | 95,708 |
| Shares redeemed | (54,231) | (86,511) | (1,829,878) | (3,194,278) |
| Net increase (decrease) | (7,091) | 113,895 | $(189,957) | $4,395,820 |
| Europe | ||||
| Shares sold | 1,463,207 | 10,168,406 | $50,880,628 | $387,319,779 |
| Reinvestment of distributions | 559,844 | 803,462 | 20,484,708 | 29,241,922 |
| Shares redeemed | (5,291,129) | (7,807,853) | (182,859,606) | (290,372,067) |
| Net increase (decrease) | (3,268,078) | 3,164,015 | $(111,494,270) | $126,189,634 |
| Class I | ||||
| Shares sold | 36,393 | 130,676 | $1,295,144 | $4,946,083 |
| Reinvestment of distributions | 2,803 | 2,526 | 102,586 | 91,940 |
| Shares redeemed | (59,997) | (113,122) | (2,078,607) | (4,289,576) |
| Net increase (decrease) | (20,801) | 20,080 | $(680,877) | $748,447 |
11. Other.
The Fund's organizational documents provide former and current trustees and officers with a limited indemnification against liabilities arising in connection with the performance of their duties to the Fund. In the normal course of business, the Fund may also enter into contracts that provide general indemnifications. The Fund's maximum exposure under these arrangements is unknown as this would be dependent on future claims that may be made against the Fund. The risk of material loss from such claims is considered remote.
Fidelity® Japan Fund
Investment Summary (Unaudited)
Geographic Diversification (% of fund's net assets)
| As of April 30, 2016 | ||
| Japan | 98.1% | |
| Cayman Islands | 1.0% | |
| United States of America* | 0.9% | |

* Includes Short-Term investments and Net Other Assets (Liabilities).
Percentages are based on country or territory of incorporation and are adjusted for the effect of futures contracts, if applicable.
| As of October 31, 2015 | ||
| Japan | 95.8% | |
| Korea (South) | 1.7% | |
| United States of America* | 1.4% | |
| Cayman Islands | 0.7% | |
| Singapore | 0.4% | |

* Includes Short-Term investments and Net Other Assets (Liabilities).
Percentages are based on country or territory of incorporation and are adjusted for the effect of futures contracts, if applicable.
Asset Allocation as of April 30, 2016
| % of fund's net assets | % of fund's net assets 6 months ago | |
| Stocks | 99.1 | 98.6 |
| Short-Term Investments and Net Other Assets (Liabilities) | 0.9 | 1.4 |
Top Ten Stocks as of April 30, 2016
| % of fund's net assets | % of fund's net assets 6 months ago | |
| Astellas Pharma, Inc. (Pharmaceuticals) | 5.0 | 4.9 |
| East Japan Railway Co. (Road & Rail) | 4.2 | 4.2 |
| KDDI Corp. (Wireless Telecommunication Services) | 4.1 | 3.3 |
| Hoya Corp. (Health Care Equipment & Supplies) | 3.3 | 3.3 |
| ORIX Corp. (Diversified Financial Services) | 3.3 | 3.0 |
| Mitsubishi UFJ Financial Group, Inc. (Banks) | 3.1 | 4.0 |
| SoftBank Corp. (Wireless Telecommunication Services) | 3.1 | 2.8 |
| Mitsui Fudosan Co. Ltd. (Real Estate Management & Development) | 2.9 | 2.9 |
| Sony Corp. (Household Durables) | 2.6 | 2.6 |
| Japan Tobacco, Inc. (Tobacco) | 2.5 | 1.8 |
| 34.1 |
Market Sectors as of April 30, 2016
| % of fund's net assets | % of fund's net assets 6 months ago | |
| Consumer Discretionary | 20.3 | 19.3 |
| Financials | 16.4 | 19.0 |
| Health Care | 13.5 | 13.3 |
| Information Technology | 12.7 | 13.8 |
| Industrials | 12.7 | 13.8 |
| Consumer Staples | 9.9 | 7.0 |
| Telecommunication Services | 9.1 | 7.2 |
| Materials | 4.5 | 5.2 |
Fidelity® Japan Fund
Investments April 30, 2016 (Unaudited)
Showing Percentage of Net Assets
| Common Stocks - 99.1% | |||
| Shares | Value | ||
| CONSUMER DISCRETIONARY - 20.3% | |||
| Auto Components - 3.5% | |||
| Bridgestone Corp. | 161,700 | $5,951,761 | |
| DaikyoNishikawa Corp. | 90,600 | 1,248,546 | |
| NGK Spark Plug Co. Ltd. | 215,400 | 4,295,802 | |
| Sumitomo Electric Industries Ltd. | 249,000 | 2,995,382 | |
| 14,491,491 | |||
| Automobiles - 6.3% | |||
| Fuji Heavy Industries Ltd. | 53,100 | 1,743,538 | |
| Honda Motor Co. Ltd. | 361,300 | 9,749,966 | |
| Isuzu Motors Ltd. | 282,600 | 3,023,900 | |
| Mazda Motor Corp. | 255,100 | 3,886,781 | |
| Suzuki Motor Corp. | 290,200 | 7,952,515 | |
| 26,356,700 | |||
| Hotels, Restaurants & Leisure - 0.7% | |||
| Skylark Co. Ltd. | 230,600 | 2,931,421 | |
| Household Durables - 4.4% | |||
| Casio Computer Co. Ltd. (a) | 189,200 | 3,599,894 | |
| Rinnai Corp. | 43,300 | 3,821,360 | |
| Sony Corp. | 457,600 | 11,083,814 | |
| 18,505,068 | |||
| Internet & Catalog Retail - 1.2% | |||
| Rakuten, Inc. | 317,600 | 3,452,746 | |
| Start Today Co. Ltd. | 35,000 | 1,470,440 | |
| 4,923,186 | |||
| Media - 0.9% | |||
| Dentsu, Inc. | 36,200 | 1,839,286 | |
| Proto Corp. | 160,300 | 2,102,489 | |
| 3,941,775 | |||
| Multiline Retail - 0.4% | |||
| Don Quijote Holdings Co. Ltd. | 50,700 | 1,803,695 | |
| Specialty Retail - 2.9% | |||
| Fast Retailing Co. Ltd. | 11,500 | 3,027,976 | |
| Nitori Holdings Co. Ltd. | 15,600 | 1,451,094 | |
| United Arrows Ltd. | 73,500 | 2,953,390 | |
| USS Co. Ltd. | 179,400 | 2,837,811 | |
| Xebio Holdings Co. Ltd. | 119,300 | 1,902,908 | |
| 12,173,179 | |||
| TOTAL CONSUMER DISCRETIONARY | 85,126,515 | ||
| CONSUMER STAPLES - 9.9% | |||
| Beverages - 1.4% | |||
| Asahi Group Holdings | 177,900 | 5,646,020 | |
| Food & Staples Retailing - 5.1% | |||
| Ain Holdings, Inc. | 35,100 | 1,705,088 | |
| San-A Co. Ltd. | 49,600 | 2,282,993 | |
| Seven & i Holdings Co. Ltd. | 187,900 | 7,666,778 | |
| Sundrug Co. Ltd. | 48,200 | 3,424,890 | |
| Tsuruha Holdings, Inc. | 22,800 | 2,186,877 | |
| Welcia Holdings Co. Ltd. | 77,600 | 4,099,024 | |
| 21,365,650 | |||
| Personal Products - 0.9% | |||
| Kao Corp. | 69,500 | 3,844,530 | |
| Tobacco - 2.5% | |||
| Japan Tobacco, Inc. | 254,400 | 10,394,260 | |
| TOTAL CONSUMER STAPLES | 41,250,460 | ||
| FINANCIALS - 16.4% | |||
| Banks - 5.0% | |||
| Mitsubishi UFJ Financial Group, Inc. | 2,783,300 | 12,844,416 | |
| Seven Bank Ltd. (b) | 986,900 | 4,193,543 | |
| Shinsei Bank Ltd. | 2,892,000 | 4,053,359 | |
| 21,091,318 | |||
| Capital Markets - 0.7% | |||
| Monex Group, Inc. | 1,198,700 | 3,092,308 | |
| Diversified Financial Services - 3.3% | |||
| ORIX Corp. | 961,100 | 13,594,698 | |
| Insurance - 2.4% | |||
| Sony Financial Holdings, Inc. | 214,600 | 2,653,086 | |
| Tokio Marine Holdings, Inc. (c) | 222,300 | 7,274,211 | |
| 9,927,297 | |||
| Real Estate Investment Trusts - 1.5% | |||
| Invincible Investment Corp. | 1,955 | 1,484,493 | |
| LaSalle Logiport REIT | 881 | 803,399 | |
| Nippon Prologis REIT, Inc. | 868 | 2,081,323 | |
| Sekisui House (REIT), Inc. | 1,449 | 1,696,576 | |
| 6,065,791 | |||
| Real Estate Management & Development - 3.5% | |||
| AEON MALL Co. Ltd. | 175,200 | 2,409,551 | |
| Mitsui Fudosan Co. Ltd. | 501,000 | 12,235,639 | |
| 14,645,190 | |||
| TOTAL FINANCIALS | 68,416,602 | ||
| HEALTH CARE - 13.5% | |||
| Biotechnology - 0.5% | |||
| PeptiDream, Inc. (a)(d) | 34,800 | 2,005,743 | |
| Health Care Equipment & Supplies - 5.7% | |||
| Hoya Corp. | 360,200 | 13,793,598 | |
| Olympus Corp. | 264,300 | 10,296,236 | |
| 24,089,834 | |||
| Health Care Providers & Services - 2.3% | |||
| Miraca Holdings, Inc. | 95,900 | 4,075,476 | |
| Ship Healthcare Holdings, Inc. | 225,100 | 5,555,108 | |
| 9,630,584 | |||
| Pharmaceuticals - 5.0% | |||
| Astellas Pharma, Inc. | 1,548,500 | 20,877,795 | |
| TOTAL HEALTH CARE | 56,603,956 | ||
| INDUSTRIALS - 12.7% | |||
| Building Products - 1.3% | |||
| Daikin Industries Ltd. | 67,000 | 5,318,395 | |
| Construction & Engineering - 1.0% | |||
| Toshiba Plant Systems & Services Corp. | 351,700 | 4,349,274 | |
| Electrical Equipment - 2.7% | |||
| Mitsubishi Electric Corp. | 454,000 | 4,824,848 | |
| Nidec Corp. | 91,200 | 6,682,595 | |
| 11,507,443 | |||
| Machinery - 2.4% | |||
| Kubota Corp. | 307,700 | 4,482,221 | |
| Makita Corp. | 86,100 | 5,431,482 | |
| 9,913,703 | |||
| Road & Rail - 4.2% | |||
| East Japan Railway Co. | 198,900 | 17,498,442 | |
| Trading Companies & Distributors - 1.1% | |||
| Misumi Group, Inc. | 321,800 | 4,443,986 | |
| TOTAL INDUSTRIALS | 53,031,243 | ||
| INFORMATION TECHNOLOGY - 12.7% | |||
| Electronic Equipment & Components - 6.9% | |||
| Azbil Corp. | 162,900 | 4,179,734 | |
| Hitachi Ltd. | 1,579,000 | 7,235,334 | |
| OMRON Corp. | 69,200 | 2,196,193 | |
| Shimadzu Corp. | 613,000 | 9,175,097 | |
| TDK Corp. | 55,400 | 3,241,669 | |
| Topcon Corp. | 245,900 | 3,026,938 | |
| 29,054,965 | |||
| Internet Software & Services - 3.7% | |||
| Alibaba Group Holding Ltd. sponsored ADR (d) | 53,100 | 4,085,514 | |
| DeNA Co. Ltd. | 234,300 | 3,943,154 | |
| Kakaku.com, Inc. | 418,800 | 7,543,053 | |
| 15,571,721 | |||
| Semiconductors & Semiconductor Equipment - 0.9% | |||
| Sanken Electric Co. Ltd. (a) | 381,000 | 1,263,105 | |
| Sumco Corp. | 397,300 | 2,515,961 | |
| 3,779,066 | |||
| Software - 0.6% | |||
| COLOPL, Inc. | 117,000 | 2,311,206 | |
| Technology Hardware, Storage & Peripherals - 0.6% | |||
| NEC Corp. | 961,000 | 2,338,857 | |
| TOTAL INFORMATION TECHNOLOGY | 53,055,815 | ||
| MATERIALS - 4.5% | |||
| Chemicals - 4.5% | |||
| Daicel Chemical Industries Ltd. | 208,300 | 2,602,074 | |
| Hitachi Chemical Co. Ltd. | 143,200 | 2,404,863 | |
| Kansai Paint Co. Ltd. | 246,500 | 4,311,200 | |
| Shin-Etsu Chemical Co. Ltd. | 89,600 | 5,018,387 | |
| Toray Industries, Inc. | 538,000 | 4,493,793 | |
| 18,830,317 | |||
| TELECOMMUNICATION SERVICES - 9.1% | |||
| Diversified Telecommunication Services - 1.9% | |||
| Nippon Telegraph & Telephone Corp. | 179,200 | 8,019,259 | |
| Wireless Telecommunication Services - 7.2% | |||
| KDDI Corp. | 600,100 | 17,286,321 | |
| SoftBank Corp. | 237,400 | 12,765,117 | |
| 30,051,438 | |||
| TOTAL TELECOMMUNICATION SERVICES | 38,070,697 | ||
| TOTAL COMMON STOCKS | |||
| (Cost $423,826,962) | 414,385,605 | ||
| Money Market Funds - 1.7% | |||
| Fidelity Cash Central Fund, 0.38% (e) | 1,206,235 | 1,206,235 | |
| Fidelity Securities Lending Cash Central Fund, 0.42% (e)(f) | 5,928,450 | 5,928,450 | |
| TOTAL MONEY MARKET FUNDS | |||
| (Cost $7,134,685) | 7,134,685 | ||
| TOTAL INVESTMENT PORTFOLIO - 100.8% | |||
| (Cost $430,961,647) | 421,520,290 | ||
| NET OTHER ASSETS (LIABILITIES) - (0.8)% | (3,494,368) | ||
| NET ASSETS - 100% | $418,025,922 |
Legend
(a) Security or a portion of the security is on loan at period end.
(b) A portion of the security sold on a delayed delivery basis.
(c) Security or a portion of the security purchased on a delayed delivery or when-issued basis.
(d) Non-income producing
(e) Affiliated fund that is generally available only to investment companies and other accounts managed by Fidelity Investments. The rate quoted is the annualized seven-day yield of the fund at period end. A complete unaudited listing of the fund's holdings as of its most recent quarter end is available upon request. In addition, each Fidelity Central Fund's financial statements are available on the SEC's website or upon request.
(f) Investment made with cash collateral received from securities on loan.
Affiliated Central Funds
Information regarding fiscal year to date income earned by the Fund from investments in Fidelity Central Funds is as follows:
| Fund | Income earned |
| Fidelity Cash Central Fund | $3,867 |
| Fidelity Securities Lending Cash Central Fund | 61,820 |
| Total | $65,687 |
Investment Valuation
The following is a summary of the inputs used, as of April 30, 2016, involving the Fund's assets and liabilities carried at fair value. The inputs or methodology used for valuing securities may not be an indication of the risk associated with investing in those securities. For more information on valuation inputs, and their aggregation into the levels used below, please refer to the Investment Valuation section in the accompanying Notes to Financial Statements.
| Valuation Inputs at Reporting Date: | ||||
| Description | Total | Level 1 | Level 2 | Level 3 |
| Investments in Securities: | ||||
| Equities: | ||||
| Consumer Discretionary | $85,126,515 | $-- | $85,126,515 | $-- |
| Consumer Staples | 41,250,460 | -- | 41,250,460 | -- |
| Financials | 68,416,602 | -- | 68,416,602 | -- |
| Health Care | 56,603,956 | -- | 56,603,956 | -- |
| Industrials | 53,031,243 | -- | 53,031,243 | -- |
| Information Technology | 53,055,815 | 4,085,514 | 48,970,301 | -- |
| Materials | 18,830,317 | -- | 18,830,317 | -- |
| Telecommunication Services | 38,070,697 | -- | 38,070,697 | -- |
| Money Market Funds | 7,134,685 | 7,134,685 | -- | -- |
| Total Investments in Securities: | $421,520,290 | $11,220,199 | $410,300,091 | $-- |
See accompanying notes which are an integral part of the financial statements.
Fidelity® Japan Fund
Financial Statements
Statement of Assets and Liabilities
| April 30, 2016 (Unaudited) | ||
| Assets | ||
| Investment in securities, at value (including securities loaned of $5,643,777) — See accompanying schedule: Unaffiliated issuers (cost $423,826,962) | $414,385,605 | |
| Fidelity Central Funds (cost $7,134,685) | 7,134,685 | |
| Total Investments (cost $430,961,647) | $421,520,290 | |
| Receivable for investments sold | ||
| Regular delivery | 1,610,483 | |
| Delayed delivery | 1,228,772 | |
| Receivable for fund shares sold | 204,538 | |
| Dividends receivable | 3,396,451 | |
| Distributions receivable from Fidelity Central Funds | 11,311 | |
| Prepaid expenses | 360 | |
| Other receivables | 23 | |
| Total assets | 427,972,228 | |
| Liabilities | ||
| Payable for investments purchased | ||
| Regular delivery | $1,299,334 | |
| Delayed delivery | 1,566,723 | |
| Payable for fund shares redeemed | 824,962 | |
| Accrued management fee | 166,424 | |
| Distribution and service plan fees payable | 21,502 | |
| Other affiliated payables | 91,927 | |
| Other payables and accrued expenses | 46,984 | |
| Collateral on securities loaned, at value | 5,928,450 | |
| Total liabilities | 9,946,306 | |
| Net Assets | $418,025,922 | |
| Net Assets consist of: | ||
| Paid in capital | $615,649,331 | |
| Undistributed net investment income | 1,888,227 | |
| Accumulated undistributed net realized gain (loss) on investments and foreign currency transactions | (190,260,232) | |
| Net unrealized appreciation (depreciation) on investments and assets and liabilities in foreign currencies | (9,251,404) | |
| Net Assets | $418,025,922 | |
| Calculation of Maximum Offering Price | ||
| Class A: | ||
| Net Asset Value and redemption price per share ($25,549,301 ÷ 2,254,243 shares) | $11.33 | |
| Maximum offering price per share (100/94.25 of $11.33) | $12.02 | |
| Class T: | ||
| Net Asset Value and redemption price per share ($4,456,631 ÷ 393,196 shares) | $11.33 | |
| Maximum offering price per share (100/96.50 of $11.33) | $11.74 | |
| Class B: | ||
| Net Asset Value and offering price per share ($181,410 ÷ 16,068 shares)(a) | $11.29 | |
| Class C: | ||
| Net Asset Value and offering price per share ($16,281,880 ÷ 1,447,994 shares)(a) | $11.24 | |
| Japan: | ||
| Net Asset Value, offering price and redemption price per share ($365,289,572 ÷ 32,138,461 shares) | $11.37 | |
| Class I: | ||
| Net Asset Value, offering price and redemption price per share ($6,267,128 ÷ 552,250 shares) | $11.35 |
(a) Redemption price per share is equal to net asset value less any applicable contingent deferred sales charge.
See accompanying notes which are an integral part of the financial statements.
Statement of Operations
| Six months ended April 30, 2016 (Unaudited) | ||
| Investment Income | ||
| Dividends | $4,400,064 | |
| Income from Fidelity Central Funds | 65,687 | |
| Income before foreign taxes withheld | 4,465,751 | |
| Less foreign taxes withheld | (442,374) | |
| Total income | 4,023,377 | |
| Expenses | ||
| Management fee | ||
| Basic fee | $1,739,878 | |
| Performance adjustment | (504,885) | |
| Transfer agent fees | 486,175 | |
| Distribution and service plan fees | 133,312 | |
| Accounting and security lending fees | 129,152 | |
| Custodian fees and expenses | 28,896 | |
| Independent trustees' compensation | 1,142 | |
| Registration fees | 68,374 | |
| Audit | 40,802 | |
| Legal | 686 | |
| Interest | 1,750 | |
| Miscellaneous | 1,771 | |
| Total expenses before reductions | 2,127,053 | |
| Expense reductions | (1,978) | 2,125,075 |
| Net investment income (loss) | 1,898,302 | |
| Realized and Unrealized Gain (Loss) | ||
| Net realized gain (loss) on: | ||
| Investment securities: | ||
| Unaffiliated issuers | (7,721,419) | |
| Foreign currency transactions | (50,452) | |
| Total net realized gain (loss) | (7,771,871) | |
| Change in net unrealized appreciation (depreciation) on: Investment securities | (18,729,419) | |
| Assets and liabilities in foreign currencies | 208,285 | |
| Total change in net unrealized appreciation (depreciation) | (18,521,134) | |
| Net gain (loss) | (26,293,005) | |
| Net increase (decrease) in net assets resulting from operations | $(24,394,703) |
See accompanying notes which are an integral part of the financial statements.
Statement of Changes in Net Assets
| Six months ended April 30, 2016 (Unaudited) | Year ended October 31, 2015 | |
| Increase (Decrease) in Net Assets | ||
| Operations | ||
| Net investment income (loss) | $1,898,302 | $3,112,183 |
| Net realized gain (loss) | (7,771,871) | (392,382) |
| Change in net unrealized appreciation (depreciation) | (18,521,134) | 1,937,241 |
| Net increase (decrease) in net assets resulting from operations | (24,394,703) | 4,657,042 |
| Distributions to shareholders from net investment income | (3,027,093) | (3,310,432) |
| Distributions to shareholders from net realized gain | (270,338) | – |
| Total distributions | (3,297,431) | (3,310,432) |
| Share transactions - net increase (decrease) | (101,642,831) | 70,904,089 |
| Redemption fees | 36,545 | 139,156 |
| Total increase (decrease) in net assets | (129,298,420) | 72,389,855 |
| Net Assets | ||
| Beginning of period | 547,324,342 | 474,934,487 |
| End of period (including undistributed net investment income of $1,888,227 and undistributed net investment income of $3,017,018, respectively) | $418,025,922 | $547,324,342 |
See accompanying notes which are an integral part of the financial statements.
Financial Highlights — Fidelity Japan Fund Class A
| Six months ended (Unaudited) April 30, | Years ended October 31, | |||||
| 2016 | 2015 | 2014 | 2013 | 2012 | 2011 A | |
| Selected Per–Share Data | ||||||
| Net asset value, beginning of period | $11.87 | $11.65 | $12.00 | $9.30 | $9.54 | $10.83 |
| Income from Investment Operations | ||||||
| Net investment income (loss)B | .03 | .04 | .05 | .08 | .09 | .09 |
| Net realized and unrealized gain (loss) | (.51) | .23 | (.31) | 2.80 | (.15) | (1.39) |
| Total from investment operations | (.48) | .27 | (.26) | 2.88 | (.06) | (1.30) |
| Distributions from net investment income | (.05) | (.05) | (.08) | (.11) | (.13) | – |
| Distributions from net realized gain | (.01) | – | (.01) | (.08) | (.05) | – |
| Total distributions | (.06) | (.05) | (.09) | (.19) | (.18) | – |
| Redemption fees added to paid in capitalB | –C | –C | –C | .01 | –C | .01 |
| Net asset value, end of period | $11.33 | $11.87 | $11.65 | $12.00 | $9.30 | $9.54 |
| Total ReturnD,E,F | (4.11)% | 2.31% | (2.18)% | 31.58% | (.64)% | (11.91)% |
| Ratios to Average Net AssetsG,H | ||||||
| Expenses before reductions | 1.09%I | 1.10% | 1.23% | 1.26% | 1.42% | 1.20%I |
| Expenses net of fee waivers, if any | 1.09%I | 1.10% | 1.23% | 1.26% | 1.38% | 1.20%I |
| Expenses net of all reductions | 1.09%I | 1.09% | 1.23% | 1.25% | 1.36% | 1.16%I |
| Net investment income (loss) | .53%I | .37% | .41% | .75% | .94% | 1.02%I |
| Supplemental Data | ||||||
| Net assets, end of period (000 omitted) | $25,549 | $23,918 | $21,352 | $20,520 | $9,495 | $13,208 |
| Portfolio turnover rateJ | 16%I | 35% | 112% | 68% | 52% | 134%K |
A For the period December 14, 2010 (commencement of sale of shares) to October 31, 2011.
B Calculated based on average shares outstanding during the period.
C Amount represents less than $.005 per share.
D Total returns for periods of less than one year are not annualized.
E Total returns would have been lower if certain expenses had not been reduced during the applicable periods shown.
F Total returns do not include the effect of the sales charges.
G Fees and expenses of any underlying Fidelity Central Funds are not included in the Fund's expense ratio. The Fund indirectly bears its proportionate share of the expenses of any underlying Fidelity Central Funds.
H Expense ratios reflect operating expenses of the class. Expenses before reductions do not reflect amounts reimbursed by the investment adviser or reductions from brokerage service arrangements or reductions from other expense offset arrangements and do not represent the amount paid by the class during periods when reimbursements or reductions occur. Expenses net of fee waivers reflect expenses after reimbursement by the investment adviser but prior to reductions from brokerage service arrangements or other expense offset arrangements. Expenses net of all reductions represent the net expenses paid by the class.
I Annualized
J Amount does not include the portfolio activity of any underlying Fidelity Central Funds.
K The portfolio turnover rate does not include the assets acquired in the merger.
See accompanying notes which are an integral part of the financial statements.
Financial Highlights — Fidelity Japan Fund Class T
| Six months ended (Unaudited) April 30, | Years ended October 31, | |||||
| 2016 | 2015 | 2014 | 2013 | 2012 | 2011 A | |
| Selected Per–Share Data | ||||||
| Net asset value, beginning of period | $11.85 | $11.62 | $11.96 | $9.28 | $9.51 | $10.83 |
| Income from Investment Operations | ||||||
| Net investment income (loss)B | .01 | –C | .01 | .05 | .06 | .07 |
| Net realized and unrealized gain (loss) | (.52) | .23 | (.30) | 2.78 | (.13) | (1.40) |
| Total from investment operations | (.51) | .23 | (.29) | 2.83 | (.07) | (1.33) |
| Distributions from net investment income | –C | – | (.04) | (.08) | (.11) | – |
| Distributions from net realized gain | (.01) | – | (.01) | (.08) | (.05) | – |
| Total distributions | (.01) | – | (.05) | (.16) | (.16) | – |
| Redemption fees added to paid in capitalB | –C | –C | –C | .01 | –C | .01 |
| Net asset value, end of period | $11.33 | $11.85 | $11.62 | $11.96 | $9.28 | $9.51 |
| Total ReturnD,E,F | (4.32)% | 1.98% | (2.42)% | 31.04% | (.75)% | (12.19)% |
| Ratios to Average Net AssetsG,H | ||||||
| Expenses before reductions | 1.45%I | 1.43% | 1.54% | 1.55% | 1.70% | 1.48%I |
| Expenses net of fee waivers, if any | 1.45%I | 1.43% | 1.54% | 1.55% | 1.66% | 1.48%I |
| Expenses net of all reductions | 1.45%I | 1.42% | 1.54% | 1.53% | 1.64% | 1.44%I |
| Net investment income (loss) | .17%I | .04% | .10% | .46% | .66% | .74%I |
| Supplemental Data | ||||||
| Net assets, end of period (000 omitted) | $4,457 | $4,809 | $4,104 | $5,357 | $3,934 | $4,643 |
| Portfolio turnover rateJ | 16%I | 35% | 112% | 68% | 52% | 134%K |
A For the period December 14, 2010 (commencement of sale of shares) to October 31, 2011.
B Calculated based on average shares outstanding during the period.
C Amount represents less than $.005 per share.
D Total returns for periods of less than one year are not annualized.
E Total returns would have been lower if certain expenses had not been reduced during the applicable periods shown.
F Total returns do not include the effect of the sales charges.
G Fees and expenses of any underlying Fidelity Central Funds are not included in the Fund's expense ratio. The Fund indirectly bears its proportionate share of the expenses of any underlying Fidelity Central Funds.
H Expense ratios reflect operating expenses of the class. Expenses before reductions do not reflect amounts reimbursed by the investment adviser or reductions from brokerage service arrangements or reductions from other expense offset arrangements and do not represent the amount paid by the class during periods when reimbursements or reductions occur. Expenses net of fee waivers reflect expenses after reimbursement by the investment adviser but prior to reductions from brokerage service arrangements or other expense offset arrangements. Expenses net of all reductions represent the net expenses paid by the class.
I Annualized
J Amount does not include the portfolio activity of any underlying Fidelity Central Funds.
K The portfolio turnover rate does not include the assets acquired in the merger.
See accompanying notes which are an integral part of the financial statements.
Financial Highlights — Fidelity Japan Fund Class B
| Six months ended (Unaudited) April 30, | Years ended October 31, | |||||
| 2016 | 2015 | 2014 | 2013 | 2012 | 2011 A | |
| Selected Per–Share Data | ||||||
| Net asset value, beginning of period | $11.82 | $11.65 | $12.00 | $9.26 | $9.47 | $10.83 |
| Income from Investment Operations | ||||||
| Net investment income (loss)B | (.02) | (.05) | (.04) | –C | .02 | .02 |
| Net realized and unrealized gain (loss) | (.51) | .22 | (.31) | 2.80 | (.14) | (1.39) |
| Total from investment operations | (.53) | .17 | (.35) | 2.80 | (.12) | (1.37) |
| Distributions from net investment income | – | – | – | – | (.04) | – |
| Distributions from net realized gain | – | – | – | (.07) | (.05) | – |
| Total distributions | – | – | – | (.07) | (.09) | – |
| Redemption fees added to paid in capitalB | –C | –C | –C | .01 | –C | .01 |
| Net asset value, end of period | $11.29 | $11.82 | $11.65 | $12.00 | $9.26 | $9.47 |
| Total ReturnD,E,F | (4.48)% | 1.46% | (2.92)% | 30.52% | (1.24)% | (12.56)% |
| Ratios to Average Net AssetsG,H | ||||||
| Expenses before reductions | 1.91%I | 1.91% | 2.02% | 2.02% | 2.17% | 1.95%I |
| Expenses net of fee waivers, if any | 1.91%I | 1.91% | 2.02% | 2.02% | 2.13% | 1.95%I |
| Expenses net of all reductions | 1.91%I | 1.91% | 2.02% | 2.01% | 2.11% | 1.91%I |
| Net investment income (loss) | (.29)%I | (.45)% | (.37)% | (.02)% | .19% | .27%I |
| Supplemental Data | ||||||
| Net assets, end of period (000 omitted) | $181 | $348 | $452 | $874 | $1,012 | $1,458 |
| Portfolio turnover rateJ | 16%I | 35% | 112% | 68% | 52% | 134%K |
A For the period December 14, 2010 (commencement of sale of shares) to October 31, 2011.
B Calculated based on average shares outstanding during the period.
C Amount represents less than $.005 per share.
D Total returns for periods of less than one year are not annualized.
E Total returns would have been lower if certain expenses had not been reduced during the applicable periods shown.
F Total returns do not include the effect of the contingent deferred sales charge.
G Fees and expenses of any underlying Fidelity Central Funds are not included in the Fund's expense ratio. The Fund indirectly bears its proportionate share of the expenses of any underlying Fidelity Central Funds.
H Expense ratios reflect operating expenses of the class. Expenses before reductions do not reflect amounts reimbursed by the investment adviser or reductions from brokerage service arrangements or reductions from other expense offset arrangements and do not represent the amount paid by the class during periods when reimbursements or reductions occur. Expenses net of fee waivers reflect expenses after reimbursement by the investment adviser but prior to reductions from brokerage service arrangements or other expense offset arrangements. Expenses net of all reductions represent the net expenses paid by the class.
I Annualized
J Amount does not include the portfolio activity of any underlying Fidelity Central Funds.
K The portfolio turnover rate does not include the assets acquired in the merger.
See accompanying notes which are an integral part of the financial statements.
Financial Highlights — Fidelity Japan Fund Class C
| Six months ended (Unaudited) April 30, | Years ended October 31, | |||||
| 2016 | 2015 | 2014 | 2013 | 2012 | 2011 A | |
| Selected Per–Share Data | ||||||
| Net asset value, beginning of period | $11.77 | $11.58 | $11.96 | $9.25 | $9.48 | $10.83 |
| Income from Investment Operations | ||||||
| Net investment income (loss)B | (.01) | (.04) | (.03) | –C | .02 | .03 |
| Net realized and unrealized gain (loss) | (.52) | .23 | (.32) | 2.79 | (.14) | (1.39) |
| Total from investment operations | (.53) | .19 | (.35) | 2.79 | (.12) | (1.36) |
| Distributions from net investment income | – | – | (.03) | (.01) | (.06) | – |
| Distributions from net realized gain | – | – | (.01) | (.08) | (.05) | – |
| Total distributions | – | – | (.03)D | (.09) | (.11) | – |
| Redemption fees added to paid in capitalB | –C | –C | –C | .01 | –C | .01 |
| Net asset value, end of period | $11.24 | $11.77 | $11.58 | $11.96 | $9.25 | $9.48 |
| Total ReturnE,F,G | (4.50)% | 1.64% | (2.90)% | 30.55% | (1.27)% | (12.47)% |
| Ratios to Average Net AssetsH,I | ||||||
| Expenses before reductions | 1.83%J | 1.81% | 1.93% | 1.97% | 2.15% | 1.92%J |
| Expenses net of fee waivers, if any | 1.82%J | 1.81% | 1.93% | 1.97% | 2.11% | 1.92%J |
| Expenses net of all reductions | 1.82%J | 1.80% | 1.93% | 1.95% | 2.09% | 1.88%J |
| Net investment income (loss) | (.21)%J | (.34)% | (.29)% | .04% | .21% | .30%J |
| Supplemental Data | ||||||
| Net assets, end of period (000 omitted) | $16,282 | $18,491 | $13,162 | $11,824 | $7,015 | $8,750 |
| Portfolio turnover rateK | 16%J | 35% | 112% | 68% | 52% | 134%L |
A For the period December 14, 2010 (commencement of sale of shares) to October 31, 2011.
B Calculated based on average shares outstanding during the period.
C Amount represents less than $.005 per share.
D Total distributions of $.03 per share is comprised of distributions from net investment income of $.025 and distributions from net realized gain of $.009 per share.
E Total returns for periods of less than one year are not annualized.
F Total returns would have been lower if certain expenses had not been reduced during the applicable periods shown.
G Total returns do not include the effect of the contingent deferred sales charge.
H Fees and expenses of any underlying Fidelity Central Funds are not included in the Fund's expense ratio. The Fund indirectly bears its proportionate share of the expenses of any underlying Fidelity Central Funds.
I Expense ratios reflect operating expenses of the class. Expenses before reductions do not reflect amounts reimbursed by the investment adviser or reductions from brokerage service arrangements or reductions from other expense offset arrangements and do not represent the amount paid by the class during periods when reimbursements or reductions occur. Expenses net of fee waivers reflect expenses after reimbursement by the investment adviser but prior to reductions from brokerage service arrangements or other expense offset arrangements. Expenses net of all reductions represent the net expenses paid by the class.
J Annualized
K Amount does not include the portfolio activity of any underlying Fidelity Central Funds.
L The portfolio turnover rate does not include the assets acquired in the merger.
See accompanying notes which are an integral part of the financial statements.
Financial Highlights — Fidelity Japan Fund
| Six months ended (Unaudited) April 30, | Years ended October 31, | |||||
| 2016 | 2015 | 2014 | 2013 | 2012 | 2011 | |
| Selected Per–Share Data | ||||||
| Net asset value, beginning of period | $11.91 | $11.69 | $12.03 | $9.34 | $9.57 | $10.57 |
| Income from Investment Operations | ||||||
| Net investment income (loss)A | .05 | .08 | .09 | .12 | .12 | .15 |
| Net realized and unrealized gain (loss) | (.51) | .23 | (.32) | 2.79 | (.14) | (.75) |
| Total from investment operations | (.46) | .31 | (.23) | 2.91 | (.02) | (.60) |
| Distributions from net investment income | (.07) | (.09) | (.11) | (.15) | (.16) | (.20) |
| Distributions from net realized gain | (.01) | – | (.01) | (.08) | (.05) | (.21) |
| Total distributions | (.08) | (.09) | (.11)B | (.23) | (.21) | (.41) |
| Redemption fees added to paid in capitalA | –C | –C | –C | .01 | –C | .01 |
| Net asset value, end of period | $11.37 | $11.91 | $11.69 | $12.03 | $9.34 | $9.57 |
| Total ReturnD,E | (3.93)% | 2.66% | (1.90)% | 31.92% | (.19)% | (6.00)% |
| Ratios to Average Net AssetsF,G | ||||||
| Expenses before reductions | .80%H | .80% | .90% | .93% | 1.09% | .86% |
| Expenses net of fee waivers, if any | .80%H | .80% | .90% | .93% | 1.06% | .84% |
| Expenses net of all reductions | .80%H | .79% | .90% | .91% | 1.04% | .80% |
| Net investment income (loss) | .82%H | .67% | .74% | 1.08% | 1.26% | 1.38% |
| Supplemental Data | ||||||
| Net assets, end of period (000 omitted) | $365,290 | $485,803 | $415,612 | $480,773 | $353,550 | $450,417 |
| Portfolio turnover rateI | 16%H | 35% | 112% | 68% | 52% | 134%J |
A Calculated based on average shares outstanding during the period.
B Total distributions of $.11 per share is comprised of distributions from net investment income of $.105 and distributions from net realized gain of $.009 per share.
C Amount represents less than $.005 per share.
D Total returns for periods of less than one year are not annualized.
E Total returns would have been lower if certain expenses had not been reduced during the applicable periods shown.
F Fees and expenses of any underlying Fidelity Central Funds are not included in the Fund's expense ratio. The Fund indirectly bears its proportionate share of the expenses of any underlying Fidelity Central Funds.
G Expense ratios reflect operating expenses of the class. Expenses before reductions do not reflect amounts reimbursed by the investment adviser or reductions from brokerage service arrangements or reductions from other expense offset arrangements and do not represent the amount paid by the class during periods when reimbursements or reductions occur. Expenses net of fee waivers reflect expenses after reimbursement by the investment adviser but prior to reductions from brokerage service arrangements or other expense offset arrangements. Expenses net of all reductions represent the net expenses paid by the class.
H Annualized
I Amount does not include the portfolio activity of any underlying Fidelity Central Funds.
J The portfolio turnover rate does not include the assets acquired in the merger.
See accompanying notes which are an integral part of the financial statements.
Financial Highlights — Fidelity Japan Fund Class I
| Six months ended (Unaudited) April 30, | Years ended October 31, | |||||
| 2016 | 2015 | 2014 | 2013 | 2012 | 2011 A | |
| Selected Per–Share Data | ||||||
| Net asset value, beginning of period | $11.89 | $11.67 | $12.02 | $9.33 | $9.57 | $10.83 |
| Income from Investment Operations | ||||||
| Net investment income (loss)B | .05 | .08 | .09 | .13 | .12 | .13 |
| Net realized and unrealized gain (loss) | (.52) | .23 | (.32) | 2.78 | (.14) | (1.40) |
| Total from investment operations | (.47) | .31 | (.23) | 2.91 | (.02) | (1.27) |
| Distributions from net investment income | (.07) | (.09) | (.12) | (.15) | (.17) | – |
| Distributions from net realized gain | (.01) | – | (.01) | (.08) | (.05) | – |
| Total distributions | (.07)C | (.09) | (.12)D | (.23) | (.22) | – |
| Redemption fees added to paid in capitalB | –E | –E | –E | .01 | –E | .01 |
| Net asset value, end of period | $11.35 | $11.89 | $11.67 | $12.02 | $9.33 | $9.57 |
| Total ReturnF,G | (3.97)% | 2.72% | (1.90)% | 32.04% | (.18)% | (11.63)% |
| Ratios to Average Net AssetsH,I | ||||||
| Expenses before reductions | .78%J | .80% | .89% | .90% | 1.03% | .79%J |
| Expenses net of fee waivers, if any | .78%J | .80% | .89% | .90% | 1.01% | .79%J |
| Expenses net of all reductions | .78%J | .79% | .89% | .88% | .99% | .75%J |
| Net investment income (loss) | .84%J | .67% | .76% | 1.11% | 1.31% | 1.43%J |
| Supplemental Data | ||||||
| Net assets, end of period (000 omitted) | $6,267 | $13,957 | $20,253 | $20,033 | $1,488 | $2,715 |
| Portfolio turnover rateK | 16%J | 35% | 112% | 68% | 52% | 134%L |
A For the period December 14, 2010 (commencement of sale of shares) to October 31, 2011.
B Calculated based on average shares outstanding during the period.
C Total distributions of $.07 per share is comprised of distributions from net investment income of $.065 and distributions from net realized gain of $.006 per share.
D Total distributions of $.12 per share is comprised of distributions from net investment income of $.115 and distributions from net realized gain of $.009 per share.
E Amount represents less than $.005 per share.
F Total returns for periods of less than one year are not annualized.
G Total returns would have been lower if certain expenses had not been reduced during the applicable periods shown.
H Fees and expenses of any underlying Fidelity Central Funds are not included in the Fund's expense ratio. The Fund indirectly bears its proportionate share of the expenses of any underlying Fidelity Central Funds.
I Expense ratios reflect operating expenses of the class. Expenses before reductions do not reflect amounts reimbursed by the investment adviser or reductions from brokerage service arrangements or reductions from other expense offset arrangements and do not represent the amount paid by the class during periods when reimbursements or reductions occur. Expenses net of fee waivers reflect expenses after reimbursement by the investment adviser but prior to reductions from brokerage service arrangements or other expense offset arrangements. Expenses net of all reductions represent the net expenses paid by the class.
J Annualized
K Amount does not include the portfolio activity of any underlying Fidelity Central Funds.
L The portfolio turnover rate does not include the assets acquired in the merger.
See accompanying notes which are an integral part of the financial statements.
Notes to Financial Statements (Unaudited)
For the period ended April 30, 2016
1. Organization.
Fidelity Japan Fund (the Fund) is a fund of Fidelity Investment Trust (the Trust) and is authorized to issue an unlimited number of shares. The Trust is registered under the Investment Company Act of 1940, as amended (the 1940 Act), as an open-end management investment company organized as a Massachusetts business trust. The Fund offers Class A, Class T, Class C, Japan and Class I shares, each of which, along with Class B shares, has equal rights as to assets and voting privileges. Class B shares are closed to new accounts and additional purchases, except for exchanges and reinvestments. Each class has exclusive voting rights with respect to matters that affect that class. Class B shares will automatically convert to Class A shares after a maximum holding period of seven years from the initial date of purchase.
During the period, the Board of Trustees approved the conversion of all existing Class B shares into Class A shares, effective on or about July 1, 2016, regardless of the length of times shares have been held.
2. Investments in Fidelity Central Funds.
The Fund invests in Fidelity Central Funds, which are open-end investment companies generally available only to other investment companies and accounts managed by the investment adviser and its affiliates. The Fund's Schedule of Investments lists each of the Fidelity Central Funds held as of period end, if any, as an investment of the Fund, but does not include the underlying holdings of each Fidelity Central Fund. As an Investing Fund, the Fund indirectly bears its proportionate share of the expenses of the underlying Fidelity Central Funds.
The Money Market Central Funds seek preservation of capital and current income and are managed by Fidelity Investments Money Management, Inc. (FIMM), an affiliate of the investment adviser. Annualized expenses of the Money Market Central Funds as of their most recent shareholder report date are less than .005%.
A complete unaudited list of holdings for each Fidelity Central Fund is available upon request or at the Securities and Exchange Commission (the SEC) website at www.sec.gov. In addition, the financial statements of the Fidelity Central Funds are available on the SEC website or upon request.
3. Significant Accounting Policies.
The financial statements have been prepared in conformity with accounting principles generally accepted in the United States of America (GAAP), which require management to make certain estimates and assumptions at the date of the financial statements. Actual results could differ from those estimates. Subsequent events, if any, through the date that the financial statements were issued have been evaluated in the preparation of the financial statements. The following summarizes the significant accounting policies of the Fund:
Investment Valuation. Investments are valued as of 4:00 p.m. Eastern time on the last calendar day of the period. The Board of Trustees (the Board) has delegated the day to day responsibility for the valuation of the Fund's investments to the Fidelity Management & Research Company (FMR) Fair Value Committee (the Committee). In accordance with valuation policies and procedures approved by the Board, the Fund attempts to obtain prices from one or more third party pricing vendors or brokers to value its investments. When current market prices, quotations or currency exchange rates are not readily available or reliable, investments will be fair valued in good faith by the Committee, in accordance with procedures adopted by the Board. Factors used in determining fair value vary by investment type and may include market or investment specific events. The frequency with which these procedures are used cannot be predicted and they may be utilized to a significant extent. The Committee oversees the Fund's valuation policies and procedures and reports to the Board on the Committee's activities and fair value determinations. The Board monitors the appropriateness of the procedures used in valuing the Fund's investments and ratifies the fair value determinations of the Committee.
The Fund categorizes the inputs to valuation techniques used to value its investments into a disclosure hierarchy consisting of three levels as shown below:
- Level 1 – quoted prices in active markets for identical investments
- Level 2 – other significant observable inputs (including quoted prices for similar investments, interest rates, prepayment speeds, etc.)
- Level 3 – unobservable inputs (including the Fund's own assumptions based on the best information available)
Valuation techniques used to value the Fund's investments by major category are as follows:
Equity securities, including restricted securities, for which market quotations are readily available, are valued at the last reported sale price or official closing price as reported by a third party pricing vendor on the primary market or exchange on which they are traded and are categorized as Level 1 in the hierarchy. In the event there were no sales during the day or closing prices are not available, securities are valued at the last quoted bid price or may be valued using the last available price and are generally categorized as Level 2 in the hierarchy. For foreign equity securities, when market or security specific events arise, comparisons to the valuation of American Depositary Receipts (ADRs), futures contracts, Exchange-Traded Funds (ETFs) and certain indexes as well as quoted prices for similar securities may be used and would be categorized as Level 2 in the hierarchy. Utilizing these techniques may result in transfers between Level 1 and Level 2. For equity securities, including restricted securities, where observable inputs are limited, assumptions about market activity and risk are used and these securities may be categorized as Level 3 in the hierarchy.
Investments in open-end mutual funds, including the Fidelity Central Funds, are valued at their closing net asset value (NAV) each business day and are categorized as Level 1 in the hierarchy.
Changes in valuation techniques may result in transfers in or out of an assigned level within the disclosure hierarchy. The aggregate value of investments by input level as of April 30, 2016 is included at the end of the Fund's Schedule of Investments.
Foreign Currency. The Fund may use foreign currency contracts to facilitate transactions in foreign-denominated securities. Gains and losses from these transactions may arise from changes in the value of the foreign currency or if the counterparties do not perform under the contracts' terms.
Foreign-denominated assets, including investment securities, and liabilities are translated into U.S. dollars at the exchange rates at period end. Purchases and sales of investment securities, income and dividends received and expenses denominated in foreign currencies are translated into U.S. dollars at the exchange rate in effect on the transaction date.
The effects of exchange rate fluctuations on investments are included with the net realized and unrealized gain (loss) on investment securities. Other foreign currency transactions resulting in realized and unrealized gain (loss) are disclosed separately.
Investment Transactions and Income. For financial reporting purposes, the Fund's investment holdings and NAV include trades executed through the end of the last business day of the period. The NAV per share for processing shareholder transactions is calculated as of the close of business of the New York Stock Exchange (NYSE), normally 4:00 p.m. Eastern time and includes trades executed through the end of the prior business day. Gains and losses on securities sold are determined on the basis of identified cost. Dividend income is recorded on the ex-dividend date, except for certain dividends from foreign securities where the ex-dividend date may have passed, which are recorded as soon as the Fund is informed of the ex-dividend date. Non-cash dividends included in dividend income, if any, are recorded at the fair market value of the securities received. Income and capital gain distributions from Fidelity Central Funds, if any, are recorded on the ex-dividend date. Investment income is recorded net of foreign taxes withheld where recovery of such taxes is uncertain.
Class Allocations and Expenses. Investment income, realized and unrealized capital gains and losses, common expenses of the Fund, and certain fund-level expense reductions, if any, are allocated daily on a pro-rata basis to each class based on the relative net assets of each class to the total net assets of the Fund. Each class differs with respect to transfer agent and distribution and service plan fees incurred. Certain expense reductions may also differ by class. For the reporting period, the allocated portion of income and expenses to each class as a percent of its average net assets may vary due to the timing of recording these transactions in relation to fluctuating net assets of the classes. Expenses directly attributable to a fund are charged to that fund. Expenses attributable to more than one fund are allocated among the respective funds on the basis of relative net assets or other appropriate methods. Expense estimates are accrued in the period to which they relate and adjustments are made when actual amounts are known.
Income Tax Information and Distributions to Shareholders. Each year, the Fund intends to qualify as a regulated investment company under Subchapter M of the Internal Revenue Code, including distributing substantially all of its taxable income and realized gains. As a result, no provision for U.S. Federal income taxes is required. The Fund files a U.S. federal tax return, in addition to state and local tax returns as required. The Fund's federal income tax returns are subject to examination by the Internal Revenue Service (IRS) for a period of three fiscal years after they are filed. State and local tax returns may be subject to examination for an additional fiscal year depending on the jurisdiction. Foreign taxes are provided for based on the Fund's understanding of the tax rules and rates that exist in the foreign markets in which it invests.
Distributions are declared and recorded on the ex-dividend date. Income dividends and capital gain distributions are declared separately for each class. Income and capital gain distributions are determined in accordance with income tax regulations, which may differ from GAAP.
Capital accounts within the financial statements are adjusted for permanent book-tax differences. These adjustments have no impact on net assets or the results of operations. Capital accounts are not adjusted for temporary book-tax differences which will reverse in a subsequent period.
Book-tax differences are primarily due to foreign currency transactions, passive foreign investment companies (PFIC), expiring capital loss carryforwards, deferred trustees compensation, capital loss carryforwards and losses deferred due to wash sales.
The federal tax cost of investment securities and unrealized appreciation (depreciation) as of period end were as follows:
| Gross unrealized appreciation | $39,767,246 |
| Gross unrealized depreciation | (52,790,805) |
| Net unrealized appreciation (depreciation) on securities | $(13,023,559) |
| Tax cost | $434,543,849 |
Capital loss carryforwards are only available to offset future capital gains of the Fund to the extent provided by regulations and may be limited. Under the Regulated Investment Company Modernization Act of 2010 (the Act), the Fund is permitted to carry forward capital losses incurred in taxable years beginning after December 22, 2010 for an unlimited period and such capital losses are required to be used prior to any losses that expire. The capital loss carryforward information presented below, including any applicable limitation, is estimated as of prior fiscal period end and is subject to adjustment.
| Fiscal year of expiration | |
| 2016 | $(3,870,588) |
| 2017 | (41,604,070) |
| 2018 | (26,887,863) |
| 2019 | (98,806,037) |
| Total with expiration | (171,168,558) |
| No expiration | |
| Short-term | (6,850,642) |
| Total capital loss carryforward | $(178,019,200) |
Due to large redemptions in a prior period, $141,955,883 of capital losses that will be available to offset future capital gains of the Fund will be limited to approximately $18,885,324 per year.
The Fund acquired $5,487,891 of its capital loss carryforward as part of a merger in a prior period. The losses acquired that will be available to offset future capital gains of the Fund will be limited to approximately $1,371,973 per year.
Short-Term Trading (Redemption) Fees. Shares held by investors in the Fund less than 90 days may have been subject to a redemption fee equal to 1.50% of the NAV of shares redeemed. All redemption fees, which reduce the proceeds of the shareholder redemption, are retained by the Fund and accounted for as an addition to paid in capital.
Delayed Delivery Transactions and When-Issued Securities. During the period, the Fund transacted in securities on a delayed delivery or when-issued basis. Payment and delivery may take place after the customary settlement period for that security. The price of the underlying securities and the date when the securities will be delivered and paid for are fixed at the time the transaction is negotiated. The securities purchased on a delayed delivery or when-issued basis are identified as such in the Fund's Schedule of Investments. With respect to purchase commitments, the Fund identifies securities as segregated in its records with a value at least equal to the amount of the commitment. Losses may arise due to changes in the value of the underlying securities or if the counterparty does not perform under the contract's terms, or if the issuer does not issue the securities due to political, economic, or other factors.
4. Purchases and Sales of Investments.
Purchases and sales of securities, other than short-term securities, aggregated $38,419,518 and $137,061,828, respectively.
5. Fees and Other Transactions with Affiliates.
Management Fee. Fidelity Management & Research Company (the investment adviser) and its affiliates provide the Fund with investment management related services for which the Fund pays a monthly management fee. The management fee is the sum of an individual fund fee rate that is based on an annual rate of .45% of the Fund's average net assets and an annualized group fee rate that averaged .25% during the period. The group fee rate is based upon the average net assets of all the mutual funds advised by the investment adviser, including any mutual funds previously advised by the investment adviser that are currently advised by Fidelity SelectCo, LLC, an affiliate of the investment adviser. The group fee rate decreases as assets under management increase and increases as assets under management decrease. In addition, the management fee is subject to a performance adjustment (up to a maximum of +/- .20% of the Fund's average net assets over a 36 month performance period). The upward or downward adjustment to the management fee is based on the relative investment performance of Japan as compared to its benchmark index, the TOPIX, over the same 36 month performance period. For the reporting period, the total annualized management fee rate, including the performance adjustment, was .50% of the Fund's average net assets. The performance adjustment included in the management fee rate may be higher or lower than the maximum performance adjustment rate due to the difference between the average net assets for the reporting and performance periods.
Distribution and Service Plan Fees. In accordance with Rule 12b-1 of the 1940 Act, the Fund has adopted separate Distribution and Service Plans for each class of shares. Certain classes pay Fidelity Distributors Corporation (FDC), an affiliate of the investment adviser, separate Distribution and Service Fees, each of which is based on an annual percentage of each class' average net assets. In addition, FDC may pay financial intermediaries for selling shares of the Fund and providing shareholder support services. For the period, the Distribution and Service Fee rates, total fees and amounts retained by FDC were as follows:
| Distribution Fee | Service Fee | Total Fees | Retained by FDC | |
| Class A | -% | .25% | $33,499 | $6,368 |
| Class T | .25% | .25% | 11,518 | 9 |
| Class B | .75% | .25% | 1,235 | 928 |
| Class C | .75% | .25% | 87,060 | 27,400 |
| $133,312 | $34,705 |
Sales Load. FDC may receive a front-end sales charge of up to 5.75% for selling Class A shares and 3.50% for selling Class T shares, some of which is paid to financial intermediaries for selling shares of the Fund. Depending on the holding period, FDC may receive contingent deferred sales charges levied on Class A, Class T, Class B, and Class C redemptions. The deferred sales charges range from 5.00% to 1.00% for Class B shares, 1.00% for Class C shares, 1.00% for certain purchases of Class A shares and .25% for certain purchases of Class T shares.
For the period, sales charge amounts retained by FDC were as follows:
| Retained by FDC | |
| Class A | $4,707 |
| Class T | 724 |
| Class B(a) | 48 |
| Class C(a) | 2,736 |
| $8,215 |
(a) When Class B and Class C shares are initially sold, FDC pays commissions from its own resources to financial intermediaries through which the sales are made.
Transfer Agent Fees. Fidelity Investments Institutional Operations Company, Inc., (FIIOC), an affiliate of the investment adviser, is the transfer, dividend disbursing and shareholder servicing agent for each class of the Fund. FIIOC receives account fees and asset-based fees that vary according to the account size and type of account of the shareholders of the respective classes of the Fund. FIIOC pays for typesetting, printing and mailing of shareholder reports, except proxy statements.
For the period, transfer agent fees for each class were as follows:
| Amount | % of Class-Level Average Net Assets(a) | |
| Class A | $31,613 | .24 |
| Class T | 7,877 | .34 |
| Class B | 374 | .30 |
| Class C | 19,011 | .22 |
| Japan | 419,330 | .19 |
| Class I | 7,970 | .18 |
| $486,175 |
(a) Annualized
Accounting and Security Lending Fees. Fidelity Service Company, Inc. (FSC), an affiliate of the investment adviser, maintains the Fund's accounting records. The accounting fee is based on the level of average net assets for each month. Under a separate contract, FSC administers the security lending program. The security lending fee is based on the number and duration of lending transactions.
Brokerage Commissions. The Fund placed a portion of its portfolio transactions with brokerage firms which are affiliates of the investment adviser. Brokerage commissions are included in net realized gain (loss) and change in net unrealized appreciation (depreciation) in the Statement of Operations. The commissions paid to these affiliated firms were $11 for the period.
Interfund Lending Program. Pursuant to an Exemptive Order issued by the SEC, the Fund, along with other registered investment companies having management contracts with FMR or other affiliated entities of FMR, may participate in an interfund lending program. This program provides an alternative credit facility allowing the funds to borrow from, or lend money to, other participating affiliated funds. At period end, there were no interfund loans outstanding. The Fund's activity in this program during the period for which loans were outstanding was as follows:
| Borrower or Lender | Average Loan Balance | Weighted Average Interest Rate | Interest Expense |
| Borrower | $4,817,143 | .62% | $1,750 |
Interfund Trades. The Fund may purchase from or sell securities to other Fidelity Funds under procedures adopted by the Board. The procedures have been designed to ensure these interfund trades are executed in accordance with Rule 17a-7 of the 1940 Act. Interfund trades are included within the respective purchases and sales amounts shown in the Purchases and Sales of Investments note.
6. Committed Line of Credit.
The Fund participates with other funds managed by the investment adviser or an affiliate in a $4.25 billion credit facility (the "line of credit") to be utilized for temporary or emergency purposes to fund shareholder redemptions or for other short-term liquidity purposes. The Fund has agreed to pay commitment fees on its pro-rata portion of the line of credit, which amounted to $461 and is reflected in Miscellaneous expenses on the Statement of Operations. During the period, the Fund did not borrow on this line of credit.
7. Security Lending.
The Fund lends portfolio securities through a lending agent from time to time in order to earn additional income. For equity securities, a lending agent is used and may loan securities to certain qualified borrowers, including Fidelity Capital Markets (FCM), a broker-dealer affiliated with the Fund. On the settlement date of the loan, the Fund receives collateral (in the form of U.S. Treasury obligations, letters of credit and/or cash) against the loaned securities and maintains collateral in an amount not less than 100% of the market value of the loaned securities during the period of the loan. The market value of the loaned securities is determined at the close of business of the Fund and any additional required collateral is delivered to the Fund on the next business day. The Fund or borrower may terminate the loan at any time, and if the borrower defaults on its obligation to return the securities loaned because of insolvency or other reasons, the Fund may apply collateral received from the borrower against the obligation. The Fund may experience delays and costs in recovering the securities loaned. Any cash collateral received is invested in the Fidelity Securities Lending Cash Central Fund. The value of loaned securities and cash collateral at period end are disclosed on the Fund's Statement of Assets and Liabilities. Security lending income represents the income earned on investing cash collateral, less rebates paid to borrowers and any lending agent fees associated with the loan, plus any premium payments received for lending certain types of securities. Security lending income is presented in the Statement of Operations as a component of income from Fidelity Central Funds. Total security lending income during the period amounted to $61,820. During the period, there were no securities loaned to FCM.
8. Expense Reductions.
Commissions paid to certain brokers with whom the investment adviser, or its affiliates, places trades on behalf of the Fund include an amount in addition to trade execution, which may be rebated back to the Fund to offset certain expenses. This amount totaled $14 for the period.
In addition, during the period the investment adviser reimbursed and/or waived a portion of fund-level operating expenses in the amount of $1,964.
9. Distributions to Shareholders.
Distributions to shareholders of each class were as follows:
| Six months ended April 30, 2016 | Year ended October 31, 2015 | |
| From net investment income | ||
| Class A | $121,415 | $79,823 |
| Class T | 822 | – |
| Japan | 2,828,514 | 3,066,127 |
| Class I | 76,342 | 164,482 |
| Total | $3,027,093 | $3,310,432 |
| From net realized gain | ||
| Class A | $14,867 | $– |
| Class T | 2,466 | – |
| Japan | 245,958 | – |
| Class I | 7,047 | – |
| Total | $270,338 | $– |
10. Share Transactions.
Share transactions for each class were as follows and may contain automatic conversions between classes or exchanges between affiliated funds:
| Shares | Shares | Dollars | Dollars | |
| Six months ended April 30, 2016 | Year ended October 31, 2015 | Six months ended April 30, 2016 | Year ended October 31, 2015 | |
| Class A | ||||
| Shares sold | 712,093 | 1,104,408 | $8,422,405 | $13,420,485 |
| Reinvestment of distributions | 10,746 | 6,565 | 128,096 | 74,452 |
| Shares redeemed | (483,042) | (929,216) | (5,489,451) | (10,724,499) |
| Net increase (decrease) | 239,797 | 181,757 | $3,061,050 | $2,770,438 |
| Class T | ||||
| Shares sold | 25,621 | 180,232 | $295,497 | $2,170,519 |
| Reinvestment of distributions | 269 | – | 3,216 | – |
| Shares redeemed | (38,565) | (127,640) | (437,379) | (1,490,023) |
| Net increase (decrease) | (12,675) | 52,592 | $(138,666) | $680,496 |
| Class B | ||||
| Shares sold | 1,967 | 711 | $21,929 | $8,779 |
| Shares redeemed | (15,310) | (10,106) | (175,368) | (116,253) |
| Net increase (decrease) | (13,343) | (9,395) | $(153,439) | $(107,474) |
| Class C | ||||
| Shares sold | 165,967 | 747,753 | $1,902,846 | $8,932,993 |
| Shares redeemed | (289,191) | (312,924) | (3,216,909) | (3,580,602) |
| Net increase (decrease) | (123,224) | 434,829 | $(1,314,063) | $5,352,391 |
| Japan | ||||
| Shares sold | 1,365,848 | 18,408,352 | $15,813,773 | $225,875,166 |
| Reinvestment of distributions | 251,274 | 262,630 | 3,000,214 | 2,980,854 |
| Shares redeemed | (10,270,898) | (13,426,033) | (114,820,865) | (161,325,584) |
| Net increase (decrease) | (8,653,776) | 5,244,949 | $(96,006,878) | $67,530,436 |
| Class I | ||||
| Shares sold | 153,380 | 1,688,546 | $1,788,502 | $20,578,143 |
| Reinvestment of distributions | 6,575 | 14,222 | 78,372 | 161,134 |
| Shares redeemed | (781,968) | (2,263,385) | (8,957,709) | (26,061,475) |
| Net increase (decrease) | (622,013) | (560,617) | $(7,090,835) | $(5,322,198) |
11. Other.
The Fund's organizational documents provide former and current trustees and officers with a limited indemnification against liabilities arising in connection with the performance of their duties to the Fund. In the normal course of business, the Fund may also enter into contracts that provide general indemnifications. The Fund's maximum exposure under these arrangements is unknown as this would be dependent on future claims that may be made against the Fund. The risk of material loss from such claims is considered remote.
At the end of the period, Strategic Advisers International Fund and Strategic Advisers International II Fund were the owners of record of approximately 28% and 11%, respectively, of the total outstanding shares of the Fund. Mutual Funds managed by the investment adviser of its affiliates were the owners of record, in the aggregate, of approximately 47% of the total outstanding shares of the Fund.
Fidelity® Japan Smaller Companies Fund
Investment Summary (Unaudited)
Geographic Diversification (% of fund's net assets)
| As of April 30, 2016 | ||
| Japan | 94.8% | |
| United States of America* | 5.2% | |

* Includes Short-Term investments and Net Other Assets (Liabilities).
Percentages are based on country or territory of incorporation and are adjusted for the effect of futures contracts, if applicable.
| As of October 31, 2015 | ||
| Japan | 96.2% | |
| United States of America* | 3.8% | |

* Includes Short-Term investments and Net Other Assets (Liabilities).
Percentages are based on country or territory of incorporation and are adjusted for the effect of futures contracts, if applicable.
Asset Allocation as of April 30, 2016
| % of fund's net assets | % of fund's net assets 6 months ago | |
| Stocks | 94.8 | 96.2 |
| Short-Term Investments and Net Other Assets (Liabilities) | 5.2 | 3.8 |
Top Ten Stocks as of April 30, 2016
| % of fund's net assets | % of fund's net assets 6 months ago | |
| Elecom Co. Ltd. (Technology Hardware, Storage & Peripherals) | 2.0 | 1.4 |
| Daito Trust Construction Co. Ltd. (Real Estate Management & Development) | 2.0 | 1.5 |
| Amano Corp. (Electronic Equipment & Components) | 1.9 | 1.6 |
| Asahi Co. Ltd. (Specialty Retail) | 1.8 | 1.3 |
| Kotobuki Spirits Co. Ltd. (Food Products) | 1.8 | 1.6 |
| Nitori Holdings Co. Ltd. (Specialty Retail) | 1.8 | 1.4 |
| Daiichikosho Co. Ltd. (Media) | 1.8 | 1.5 |
| SRA Holdings, Inc. (Software) | 1.7 | 1.6 |
| Kinugawa Rubber Industrial Co. Ltd. (Auto Components) | 1.7 | 1.5 |
| Kuraray Co. Ltd. (Chemicals) | 1.6 | 1.5 |
| 18.1 |
Market Sectors as of April 30, 2016
| % of fund's net assets | % of fund's net assets 6 months ago | |
| Industrials | 23.1 | 21.4 |
| Consumer Discretionary | 19.6 | 17.6 |
| Consumer Staples | 11.6 | 10.2 |
| Information Technology | 9.4 | 11.6 |
| Financials | 9.0 | 12.0 |
| Health Care | 7.8 | 7.1 |
| Materials | 7.2 | 9.2 |
| Utilities | 3.6 | 3.8 |
| Energy | 2.0 | 2.1 |
| Telecommunication Services | 1.5 | 1.2 |
Fidelity® Japan Smaller Companies Fund
Investments April 30, 2016 (Unaudited)
Showing Percentage of Net Assets
| Common Stocks - 94.8% | |||
| Shares | Value | ||
| CONSUMER DISCRETIONARY - 19.6% | |||
| Auto Components - 3.4% | |||
| Bridgestone Corp. | 180,000 | $6,625,337 | |
| Hi-Lex Corp. | 121,000 | 3,120,967 | |
| Kinugawa Rubber Industrial Co. Ltd. | 1,369,884 | 9,538,369 | |
| 19,284,673 | |||
| Distributors - 2.4% | |||
| Central Automotive Products Ltd. | 885,000 | 7,376,286 | |
| Chori Co. Ltd. | 406,100 | 5,847,603 | |
| 13,223,889 | |||
| Diversified Consumer Services - 1.4% | |||
| Asante, Inc. | 572,500 | 7,793,653 | |
| Hotels, Restaurants & Leisure - 1.8% | |||
| Koshidaka Holdings Co. Ltd. | 286,600 | 5,635,638 | |
| St. Marc Holdings Co. Ltd. | 172,400 | 4,663,702 | |
| 10,299,340 | |||
| Media - 2.7% | |||
| Daiichikosho Co. Ltd. | 237,400 | 9,952,227 | |
| Proto Corp. | 396,600 | 5,201,791 | |
| 15,154,018 | |||
| Specialty Retail - 6.7% | |||
| Arc Land Sakamoto Co. Ltd. | 611,700 | 6,351,371 | |
| Asahi Co. Ltd. | 687,600 | 10,198,667 | |
| Fuji Corp. | 292,800 | 4,609,951 | |
| Nitori Holdings Co. Ltd. | 108,100 | 10,055,335 | |
| VT Holdings Co. Ltd. | 1,307,400 | 6,605,864 | |
| 37,821,188 | |||
| Textiles, Apparel & Luxury Goods - 1.2% | |||
| Hagihara Industries, Inc. | 276,400 | 6,522,883 | |
| TOTAL CONSUMER DISCRETIONARY | 110,099,644 | ||
| CONSUMER STAPLES - 11.6% | |||
| Food & Staples Retailing - 5.4% | |||
| Kato Sangyo | 306,600 | 7,537,675 | |
| Mitsubishi Shokuhin Co. Ltd. | 314,600 | 8,119,610 | |
| San-A Co. Ltd. | 179,900 | 8,280,453 | |
| Sogo Medical Co. Ltd. | 218,700 | 6,342,187 | |
| 30,279,925 | |||
| Food Products - 5.3% | |||
| Japan Meat Co. Ltd. | 307,500 | 3,055,304 | |
| Kotobuki Spirits Co. Ltd. | 524,000 | 10,195,929 | |
| Rokko Butter Co. Ltd. | 259,500 | 4,194,317 | |
| S Foods, Inc. (a) | 276,300 | 6,577,378 | |
| Toyo Suisan Kaisha Ltd. | 154,000 | 5,438,934 | |
| 29,461,862 | |||
| Tobacco - 0.9% | |||
| Japan Tobacco, Inc. | 123,300 | 5,037,784 | |
| TOTAL CONSUMER STAPLES | 64,779,571 | ||
| ENERGY - 2.0% | |||
| Energy Equipment & Services - 1.0% | |||
| Shinko Plantech Co. Ltd. | 722,900 | 5,499,903 | |
| Oil, Gas & Consumable Fuels - 1.0% | |||
| San-Ai Oil Co. Ltd. | 808,000 | 5,662,789 | |
| TOTAL ENERGY | 11,162,692 | ||
| FINANCIALS - 9.0% | |||
| Banks - 1.8% | |||
| Fukuoka Financial Group, Inc. | 1,178,000 | 4,026,985 | |
| Shinsei Bank Ltd. | 4,382,000 | 6,141,708 | |
| 10,168,693 | |||
| Consumer Finance - 1.0% | |||
| ACOM Co. Ltd. (a)(b) | 1,084,700 | 5,658,485 | |
| Diversified Financial Services - 2.8% | |||
| Fuyo General Lease Co. Ltd. | 159,000 | 6,676,877 | |
| ORIX Corp. | 625,300 | 8,844,828 | |
| 15,521,705 | |||
| Insurance - 1.2% | |||
| Tokio Marine Holdings, Inc. | 209,300 | 6,848,818 | |
| Real Estate Management & Development - 2.2% | |||
| Century21 Real Estate Japan Ltd. (c) | 102,300 | 1,138,964 | |
| Daito Trust Construction Co. Ltd. | 77,600 | 10,975,143 | |
| 12,114,107 | |||
| TOTAL FINANCIALS | 50,311,808 | ||
| HEALTH CARE - 7.8% | |||
| Health Care Equipment & Supplies - 3.8% | |||
| Fukuda Denshi Co. Ltd. | 122,000 | 6,661,174 | |
| Medikit Co. Ltd. | 191,800 | 6,686,739 | |
| Paramount Bed Holdings Co. Ltd. | 218,900 | 8,142,826 | |
| 21,490,739 | |||
| Health Care Providers & Services - 2.9% | |||
| A/S One Corp. | 235,600 | 8,495,273 | |
| Miraca Holdings, Inc. | 177,800 | 7,555,991 | |
| 16,051,264 | |||
| Pharmaceuticals - 1.1% | |||
| Astellas Pharma, Inc. | 446,100 | 6,014,585 | |
| TOTAL HEALTH CARE | 43,556,588 | ||
| INDUSTRIALS - 23.1% | |||
| Air Freight & Logistics - 0.8% | |||
| AIT Corp. | 525,400 | 4,343,562 | |
| Building Products - 3.8% | |||
| Bunka Shutter Co. Ltd. | 695,700 | 5,863,826 | |
| Sekisui Jushi Corp. | 558,200 | 7,748,341 | |
| Sinko Industries Ltd. | 577,300 | 7,724,406 | |
| 21,336,573 | |||
| Commercial Services & Supplies - 2.7% | |||
| Aeon Delight Co. Ltd. | 260,000 | 7,178,695 | |
| ProNexus, Inc. | 820,700 | 8,299,790 | |
| 15,478,485 | |||
| Construction & Engineering - 2.4% | |||
| Hokuriku Electrical Construction Co. Ltd. | 819,900 | 5,998,879 | |
| Toshiba Plant Systems & Services Corp. | 587,900 | 7,270,226 | |
| 13,269,105 | |||
| Electrical Equipment - 1.0% | |||
| Aichi Electric Co. Ltd. | 919,000 | 2,777,209 | |
| Denyo Co. Ltd. | 254,900 | 2,734,382 | |
| 5,511,591 | |||
| Machinery - 2.2% | |||
| Daiwa Industries Ltd. | 689,500 | 5,910,347 | |
| Oiles Corp. | 404,580 | 6,560,605 | |
| 12,470,952 | |||
| Professional Services - 4.1% | |||
| Funai Soken Holdings, Inc. | 395,020 | 5,993,183 | |
| Meitec Corp. | 79,100 | 2,743,820 | |
| Weathernews, Inc. | 238,900 | 8,385,228 | |
| Yamada Consulting Group Co. Ltd. | 186,300 | 5,691,556 | |
| 22,813,787 | |||
| Trading Companies & Distributors - 4.8% | |||
| Inaba Denki Sangyo Co. Ltd. | 182,600 | 5,733,416 | |
| Maruka Machinery Co. Ltd. (d) | 123,800 | 1,461,838 | |
| Mitani Shoji Co. Ltd. | 299,900 | 8,641,676 | |
| Yamazen Co. Ltd. | 823,900 | 6,439,758 | |
| Yuasa Trading Co. Ltd. | 215,800 | 4,849,628 | |
| 27,126,316 | |||
| Transportation Infrastructure - 1.3% | |||
| Kamigumi Co. Ltd. | 823,000 | 7,378,881 | |
| TOTAL INDUSTRIALS | 129,729,252 | ||
| INFORMATION TECHNOLOGY - 9.4% | |||
| Electronic Equipment & Components - 3.0% | |||
| Amano Corp. | 663,400 | 10,852,731 | |
| Macnica Fuji Electronics Holdings, Inc. (b) | 529,100 | 5,859,071 | |
| 16,711,802 | |||
| IT Services - 1.1% | |||
| TKC Corp. | 232,800 | 6,324,846 | |
| Software - 3.3% | |||
| Broadleaf Co. Ltd. | 312,000 | 3,083,205 | |
| Oracle Corp. Japan | 102,600 | 5,526,306 | |
| SRA Holdings, Inc. | 416,500 | 9,667,529 | |
| 18,277,040 | |||
| Technology Hardware, Storage & Peripherals - 2.0% | |||
| Elecom Co. Ltd. | 677,900 | 11,372,865 | |
| TOTAL INFORMATION TECHNOLOGY | 52,686,553 | ||
| MATERIALS - 7.2% | |||
| Chemicals - 7.2% | |||
| C. Uyemura & Co. Ltd. | 128,400 | 5,437,753 | |
| Kuraray Co. Ltd. | 705,400 | 8,943,088 | |
| Lintec Corp. | 407,700 | 7,815,567 | |
| Sakata INX Corp. | 570,800 | 6,447,091 | |
| SK Kaken Co. Ltd. | 81,000 | 6,646,175 | |
| Tokyo Ohka Kogyo Co. Ltd. | 188,700 | 5,275,976 | |
| 40,565,650 | |||
| TELECOMMUNICATION SERVICES - 1.5% | |||
| Wireless Telecommunication Services - 1.5% | |||
| KDDI Corp. | 298,200 | 8,589,870 | |
| UTILITIES - 3.6% | |||
| Electric Utilities - 2.1% | |||
| Hokuriku Electric Power Co., Inc. | 375,900 | 4,923,261 | |
| The Okinawa Electric Power Co., Inc. | 261,250 | 6,676,134 | |
| 11,599,395 | |||
| Gas Utilities - 1.5% | |||
| Tokyo Gas Co. Ltd. | 1,936,000 | 8,544,876 | |
| TOTAL UTILITIES | 20,144,271 | ||
| TOTAL COMMON STOCKS | |||
| (Cost $458,360,235) | 531,625,899 | ||
| Money Market Funds - 5.6% | |||
| Fidelity Cash Central Fund, 0.38% (e) | 24,961,114 | 24,961,114 | |
| Fidelity Securities Lending Cash Central Fund, 0.42% (e)(f) | 6,664,063 | 6,664,063 | |
| TOTAL MONEY MARKET FUNDS | |||
| (Cost $31,625,177) | 31,625,177 | ||
| TOTAL INVESTMENT PORTFOLIO - 100.4% | |||
| (Cost $489,985,412) | 563,251,076 | ||
| NET OTHER ASSETS (LIABILITIES) - (0.4)% | (2,514,419) | ||
| NET ASSETS - 100% | $560,736,657 |
Legend
(a) Security or a portion of the security is on loan at period end.
(b) Non-income producing
(c) Security or a portion of the security purchased on a delayed delivery or when-issued basis.
(d) A portion of the security sold on a delayed delivery basis.
(e) Affiliated fund that is generally available only to investment companies and other accounts managed by Fidelity Investments. The rate quoted is the annualized seven-day yield of the fund at period end. A complete unaudited listing of the fund's holdings as of its most recent quarter end is available upon request. In addition, each Fidelity Central Fund's financial statements are available on the SEC's website or upon request.
(f) Investment made with cash collateral received from securities on loan.
Affiliated Central Funds
Information regarding fiscal year to date income earned by the Fund from investments in Fidelity Central Funds is as follows:
| Fund | Income earned |
| Fidelity Cash Central Fund | $41,969 |
| Fidelity Securities Lending Cash Central Fund | 21,561 |
| Total | $63,530 |
Investment Valuation
The following is a summary of the inputs used, as of April 30, 2016, involving the Fund's assets and liabilities carried at fair value. The inputs or methodology used for valuing securities may not be an indication of the risk associated with investing in those securities. For more information on valuation inputs, and their aggregation into the levels used below, please refer to the Investment Valuation section in the accompanying Notes to Financial Statements.
| Valuation Inputs at Reporting Date: | ||||
| Description | Total | Level 1 | Level 2 | Level 3 |
| Investments in Securities: | ||||
| Equities: | ||||
| Consumer Discretionary | $110,099,644 | $-- | $110,099,644 | $-- |
| Consumer Staples | 64,779,571 | -- | 64,779,571 | -- |
| Energy | 11,162,692 | -- | 11,162,692 | -- |
| Financials | 50,311,808 | -- | 50,311,808 | -- |
| Health Care | 43,556,588 | -- | 43,556,588 | -- |
| Industrials | 129,729,252 | -- | 129,729,252 | -- |
| Information Technology | 52,686,553 | -- | 52,686,553 | -- |
| Materials | 40,565,650 | -- | 40,565,650 | -- |
| Telecommunication Services | 8,589,870 | -- | 8,589,870 | -- |
| Utilities | 20,144,271 | -- | 20,144,271 | -- |
| Money Market Funds | 31,625,177 | 31,625,177 | -- | -- |
| Total Investments in Securities: | $563,251,076 | $31,625,177 | $531,625,899 | $-- |
See accompanying notes which are an integral part of the financial statements.
Fidelity® Japan Smaller Companies Fund
Financial Statements
Statement of Assets and Liabilities
| April 30, 2016 (Unaudited) | ||
| Assets | ||
| Investment in securities, at value (including securities loaned of $6,345,054) — See accompanying schedule: Unaffiliated issuers (cost $458,360,235) | $531,625,899 | |
| Fidelity Central Funds (cost $31,625,177) | 31,625,177 | |
| Total Investments (cost $489,985,412) | $563,251,076 | |
| Receivable for investments sold | ||
| Regular delivery | 116,717 | |
| Delayed delivery | 49,980 | |
| Receivable for fund shares sold | 324,380 | |
| Dividends receivable | 5,434,598 | |
| Distributions receivable from Fidelity Central Funds | 9,171 | |
| Prepaid expenses | 335 | |
| Other receivables | 1,693 | |
| Total assets | 569,187,950 | |
| Liabilities | ||
| Payable for investments purchased | ||
| Regular delivery | $5,302 | |
| Delayed delivery | 5,620 | |
| Payable for fund shares redeemed | 1,286,949 | |
| Accrued management fee | 329,766 | |
| Other affiliated payables | 109,399 | |
| Other payables and accrued expenses | 50,194 | |
| Collateral on securities loaned, at value | 6,664,063 | |
| Total liabilities | 8,451,293 | |
| Net Assets | $560,736,657 | |
| Net Assets consist of: | ||
| Paid in capital | $510,165,410 | |
| Undistributed net investment income | 3,203,195 | |
| Accumulated undistributed net realized gain (loss) on investments and foreign currency transactions | (26,196,965) | |
| Net unrealized appreciation (depreciation) on investments and assets and liabilities in foreign currencies | 73,565,017 | |
| Net Assets, for 39,785,045 shares outstanding | $560,736,657 | |
| Net Asset Value, offering price and redemption price per share ($560,736,657 ÷ 39,785,045 shares) | $14.09 |
See accompanying notes which are an integral part of the financial statements.
Statement of Operations
| Six months ended April 30, 2016 (Unaudited) | ||
| Investment Income | ||
| Dividends | $6,346,938 | |
| Income from Fidelity Central Funds | 63,530 | |
| Income before foreign taxes withheld | 6,410,468 | |
| Less foreign taxes withheld | (634,694) | |
| Total income | 5,775,774 | |
| Expenses | ||
| Management fee | $1,837,134 | |
| Transfer agent fees | 491,809 | |
| Accounting and security lending fees | 135,442 | |
| Custodian fees and expenses | 38,457 | |
| Independent trustees' compensation | 1,138 | |
| Registration fees | 16,067 | |
| Audit | 34,275 | |
| Legal | 620 | |
| Miscellaneous | 2,614 | |
| Total expenses before reductions | 2,557,556 | |
| Expense reductions | (1,854) | 2,555,702 |
| Net investment income (loss) | 3,220,072 | |
| Realized and Unrealized Gain (Loss) | ||
| Net realized gain (loss) on: | ||
| Investment securities: | ||
| Unaffiliated issuers | (5,162,106) | |
| Foreign currency transactions | (73,988) | |
| Total net realized gain (loss) | (5,236,094) | |
| Change in net unrealized appreciation (depreciation) on: Investment securities | 23,148,315 | |
| Assets and liabilities in foreign currencies | 316,741 | |
| Total change in net unrealized appreciation (depreciation) | 23,465,056 | |
| Net gain (loss) | 18,228,962 | |
| Net increase (decrease) in net assets resulting from operations | $21,449,034 |
See accompanying notes which are an integral part of the financial statements.
Statement of Changes in Net Assets
| Six months ended April 30, 2016 (Unaudited) | Year ended October 31, 2015 | |
| Increase (Decrease) in Net Assets | ||
| Operations | ||
| Net investment income (loss) | $3,220,072 | $3,406,739 |
| Net realized gain (loss) | (5,236,094) | (13,284,472) |
| Change in net unrealized appreciation (depreciation) | 23,465,056 | 34,250,021 |
| Net increase (decrease) in net assets resulting from operations | 21,449,034 | 24,372,288 |
| Distributions to shareholders from net investment income | (3,361,556) | (991,819) |
| Distributions to shareholders from net realized gain | (3,952,599) | (5,888,929) |
| Total distributions | (7,314,155) | (6,880,748) |
| Share transactions | ||
| Proceeds from sales of shares | 86,587,581 | 181,245,784 |
| Reinvestment of distributions | 6,515,367 | 6,645,506 |
| Cost of shares redeemed | (49,402,607) | (118,682,976) |
| Net increase (decrease) in net assets resulting from share transactions | 43,700,341 | 69,208,314 |
| Redemption fees | 59,723 | 90,331 |
| Total increase (decrease) in net assets | 57,894,943 | 86,790,185 |
| Net Assets | ||
| Beginning of period | 502,841,714 | 416,051,529 |
| End of period (including undistributed net investment income of $3,203,195 and undistributed net investment income of $3,344,679, respectively) | $560,736,657 | $502,841,714 |
| Other Information | ||
| Shares | ||
| Sold | 6,386,820 | 13,218,734 |
| Issued in reinvestment of distributions | 472,128 | 539,846 |
| Redeemed | (3,625,125) | (8,966,998) |
| Net increase (decrease) | 3,233,823 | 4,791,582 |
See accompanying notes which are an integral part of the financial statements.
Financial Highlights — Fidelity Japan Smaller Companies Fund
| Six months ended (Unaudited) April 30, | Years ended October 31, | |||||
| 2016 | 2015 | 2014 | 2013 | 2012 | 2011 | |
| Selected Per–Share Data | ||||||
| Net asset value, beginning of period | $13.76 | $13.10 | $13.86 | $9.12 | $8.62 | $8.23 |
| Income from Investment Operations | ||||||
| Net investment income (loss)A | .08 | .10 | .09 | .02 | .06 | .08 |
| Net realized and unrealized gain (loss) | .45 | .78 | (.53) | 4.91 | .55 | .45 |
| Total from investment operations | .53 | .88 | (.44) | 4.93 | .61 | .53 |
| Distributions from net investment income | (.09) | (.03) | (.02) | (.07) | (.08) | (.05) |
| Distributions from net realized gain | (.11) | (.19) | (.31) | (.15) | (.03) | (.10) |
| Total distributions | (.20) | (.22) | (.33) | (.22) | (.11) | (.14)B |
| Redemption fees added to paid in capitalA | –C | –C | .01 | .03 | –C | –C |
| Net asset value, end of period | $14.09 | $13.76 | $13.10 | $13.86 | $9.12 | $8.62 |
| Total ReturnD,E | 3.87% | 6.93% | (3.16)% | 55.79% | 7.13% | 6.44% |
| Ratios to Average Net AssetsF,G | ||||||
| Expenses before reductions | .97%H | .98% | 1.00% | 1.01% | 1.05% | 1.05% |
| Expenses net of fee waivers, if any | .97%H | .98% | 1.00% | 1.01% | 1.05% | 1.05% |
| Expenses net of all reductions | .97%H | .97% | 1.00% | .98% | 1.02% | 1.01% |
| Net investment income (loss) | 1.22%H | .77% | .70% | .18% | .67% | .88% |
| Supplemental Data | ||||||
| Net assets, end of period (000 omitted) | $560,737 | $502,842 | $416,052 | $661,445 | $237,893 | $303,619 |
| Portfolio turnover rateI | 17%H | 41% | 112% | 91% | 86% | 133% |
A Calculated based on average shares outstanding during the period.
B Total distributions of $.14 per share is comprised of distributions from net investment income of $.045 and distributions from net realized gain of $.095 per share.
C Amount represents less than $.005 per share.
D Total returns for periods of less than one year are not annualized.
E Total returns would have been lower if certain expenses had not been reduced during the applicable periods shown.
F Fees and expenses of any underlying Fidelity Central Funds are not included in the Fund's expense ratio. The Fund indirectly bears its proportionate share of the expenses of any underlying Fidelity Central Funds.
G Expense ratios reflect operating expenses of the Fund. Expenses before reductions do not reflect amounts reimbursed by the investment adviser or reductions from brokerage service arrangements or reductions from other expense offset arrangements and do not represent the amount paid by the Fund during periods when reimbursements or reductions occur. Expenses net of fee waivers reflect expenses after reimbursement by the investment adviser but prior to reductions from brokerage service arrangements or other expense offset arrangements. Expenses net of all reductions represent the net expenses paid by the Fund.
H Annualized
I Amount does not include the portfolio activity of any underlying Fidelity Central Funds.
See accompanying notes which are an integral part of the financial statements.
Notes to Financial Statements (Unaudited)
For the period ended April 30, 2016
1. Organization.
Fidelity Japan Smaller Companies Fund (the Fund) is a fund of Fidelity Investment Trust (the Trust) and is authorized to issue an unlimited number of shares. Share transactions on the Statement of Changes in Net Assets may contain exchanges between affiliated funds. The Trust is registered under the Investment Company Act of 1940, as amended (the 1940 Act), as an open-end management investment company organized as a Massachusetts business trust.
2. Investments in Fidelity Central Funds.
The Fund invests in Fidelity Central Funds, which are open-end investment companies generally available only to other investment companies and accounts managed by the investment adviser and its affiliates. The Fund's Schedule of Investments lists each of the Fidelity Central Funds held as of period end, if any, as an investment of the Fund, but does not include the underlying holdings of each Fidelity Central Fund. As an Investing Fund, the Fund indirectly bears its proportionate share of the expenses of the underlying Fidelity Central Funds.
The Money Market Central Funds seek preservation of capital and current income and are managed by Fidelity Investments Money Management, Inc. (FIMM), an affiliate of the investment adviser. Annualized expenses of the Money Market Central Funds as of their most recent shareholder report date are less than .005%.
A complete unaudited list of holdings for each Fidelity Central Fund is available upon request or at the Securities and Exchange Commission (the SEC) website at www.sec.gov. In addition, the financial statements of the Fidelity Central Funds are available on the SEC website or upon request.
3. Significant Accounting Policies.
The financial statements have been prepared in conformity with accounting principles generally accepted in the United States of America (GAAP), which require management to make certain estimates and assumptions at the date of the financial statements. Actual results could differ from those estimates. Subsequent events, if any, through the date that the financial statements were issued have been evaluated in the preparation of the financial statements. The following summarizes the significant accounting policies of the Fund:
Investment Valuation. Investments are valued as of 4:00 p.m. Eastern time on the last calendar day of the period. The Board of Trustees (the Board) has delegated the day to day responsibility for the valuation of the Fund's investments to the Fidelity Management & Research Company (FMR) Fair Value Committee (the Committee). In accordance with valuation policies and procedures approved by the Board, the Fund attempts to obtain prices from one or more third party pricing vendors or brokers to value its investments. When current market prices, quotations or currency exchange rates are not readily available or reliable, investments will be fair valued in good faith by the Committee, in accordance with procedures adopted by the Board. Factors used in determining fair value vary by investment type and may include market or investment specific events. The frequency with which these procedures are used cannot be predicted and they may be utilized to a significant extent. The Committee oversees the Fund's valuation policies and procedures and reports to the Board on the Committee's activities and fair value determinations. The Board monitors the appropriateness of the procedures used in valuing the Fund's investments and ratifies the fair value determinations of the Committee.
The Fund categorizes the inputs to valuation techniques used to value its investments into a disclosure hierarchy consisting of three levels as shown below:
- Level 1 – quoted prices in active markets for identical investments
- Level 2 – other significant observable inputs (including quoted prices for similar investments, interest rates, prepayment speeds, etc.)
- Level 3 – unobservable inputs (including the Fund's own assumptions based on the best information available)
Valuation techniques used to value the Fund's investments by major category are as follows:
Equity securities, including restricted securities, for which market quotations are readily available, are valued at the last reported sale price or official closing price as reported by a third party pricing vendor on the primary market or exchange on which they are traded and are categorized as Level 1 in the hierarchy. In the event there were no sales during the day or closing prices are not available, securities are valued at the last quoted bid price or may be valued using the last available price and are generally categorized as Level 2 in the hierarchy. For foreign equity securities, when market or security specific events arise, comparisons to the valuation of American Depositary Receipts (ADRs), futures contracts, Exchange-Traded Funds (ETFs) and certain indexes as well as quoted prices for similar securities may be used and would be categorized as Level 2 in the hierarchy. Utilizing these techniques may result in transfers between Level 1 and Level 2. For equity securities, including restricted securities, where observable inputs are limited, assumptions about market activity and risk are used and these securities may be categorized as Level 3 in the hierarchy.
Investments in open-end mutual funds, including the Fidelity Central Funds, are valued at their closing net asset value (NAV) each business day and are categorized as Level 1 in the hierarchy.
Changes in valuation techniques may result in transfers in or out of an assigned level within the disclosure hierarchy. The aggregate value of investments by input level as of April 30, 2016 is included at the end of the Fund's Schedule of Investments.
Foreign Currency. The Fund may use foreign currency contracts to facilitate transactions in foreign-denominated securities. Gains and losses from these transactions may arise from changes in the value of the foreign currency or if the counterparties do not perform under the contracts' terms.
Foreign-denominated assets, including investment securities, and liabilities are translated into U.S. dollars at the exchange rates at period end. Purchases and sales of investment securities, income and dividends received and expenses denominated in foreign currencies are translated into U.S. dollars at the exchange rate in effect on the transaction date.
The effects of exchange rate fluctuations on investments are included with the net realized and unrealized gain (loss) on investment securities. Other foreign currency transactions resulting in realized and unrealized gain (loss) are disclosed separately.
Investment Transactions and Income. For financial reporting purposes, the Fund's investment holdings and NAV include trades executed through the end of the last business day of the period. The NAV per share for processing shareholder transactions is calculated as of the close of business of the New York Stock Exchange (NYSE), normally 4:00 p.m. Eastern time and includes trades executed through the end of the prior business day. Gains and losses on securities sold are determined on the basis of identified cost and may include proceeds received from litigation. Dividend income is recorded on the ex-dividend date, except for certain dividends from foreign securities where the ex-dividend date may have passed, which are recorded as soon as the Fund is informed of the ex-dividend date. Non-cash dividends included in dividend income, if any, are recorded at the fair market value of the securities received. Income and capital gain distributions from Fidelity Central Funds, if any, are recorded on the ex-dividend date. Investment income is recorded net of foreign taxes withheld where recovery of such taxes is uncertain.
Expenses. Expenses directly attributable to a fund are charged to that fund. Expenses attributable to more than one fund are allocated among the respective funds on the basis of relative net assets or other appropriate methods. Expense estimates are accrued in the period to which they relate and adjustments are made when actual amounts are known.
Income Tax Information and Distributions to Shareholders. Each year, the Fund intends to qualify as a regulated investment company under Subchapter M of the Internal Revenue Code, including distributing substantially all of its taxable income and realized gains. As a result, no provision for U.S. Federal income taxes is required. The Fund files a U.S. federal tax return, in addition to state and local tax returns as required. The Fund's federal income tax returns are subject to examination by the Internal Revenue Service (IRS) for a period of three fiscal years after they are filed. State and local tax returns may be subject to examination for an additional fiscal year depending on the jurisdiction. Foreign taxes are provided for based on the Fund's understanding of the tax rules and rates that exist in the foreign markets in which it invests. The Fund is subject to a tax imposed on capital gains by certain countries in which it invests.
Distributions are declared and recorded on the ex-dividend date. Income dividends and capital gain distributions are declared separately for each class. Income and capital gain distributions are determined in accordance with income tax regulations, which may differ from GAAP.
Capital accounts within the financial statements are adjusted for permanent book-tax differences. These adjustments have no impact on net assets or the results of operations. Capital accounts are not adjusted for temporary book-tax differences which will reverse in a subsequent period
Book-tax differences are primarily due to foreign currency transactions, passive foreign investment companies (PFIC), deferred trustees compensation and capital loss carryforwards.
The federal tax cost of investment securities and unrealized appreciation (depreciation) as of period end were as follows:
| Gross unrealized appreciation | $85,357,909 |
| Gross unrealized depreciation | (19,030,743) |
| Net unrealized appreciation (depreciation) on securities | $66,327,166 |
| Tax cost | $496,923,910 |
Capital loss carryforwards are only available to offset future capital gains of the Fund to the extent provided by regulations and may be limited. Under the Regulated Investment Company Modernization Act of 2010 (the Act), the Fund is permitted to carry forward capital losses incurred in taxable years beginning after December 22, 2010 for an unlimited period and such capital losses are required to be used prior to any losses that expire. The capital loss carryforward information presented below, including any applicable limitation, is estimated as of prior fiscal period end and is subject to adjustment.
| No expiration | |
| Short-term | $(8,159,164) |
| Long-term | (5,622,544) |
| Total capital loss carryforward | $(13,781,708) |
Short-Term Trading (Redemption) Fees. Shares held by investors in the Fund less than 90 days may have been subject to a redemption fee equal to 1.50% of the NAV of shares redeemed. All redemption fees, which reduce the proceeds of the shareholder redemption, are retained by the Fund and accounted for as an addition to paid in capital.
Delayed Delivery Transactions and When-Issued Securities. During the period, the Fund transacted in securities on a delayed delivery or when-issued basis. Payment and delivery may take place after the customary settlement period for that security. The price of the underlying securities and the date when the securities will be delivered and paid for are fixed at the time the transaction is negotiated. The securities purchased on a delayed delivery or when-issued basis are identified as such in the Fund's Schedule of Investments. With respect to purchase commitments, the Fund identifies securities as segregated in its records with a value at least equal to the amount of the commitment. Losses may arise due to changes in the value of the underlying securities or if the counterparty does not perform under the contract's terms, or if the issuer does not issue the securities due to political, economic, or other factors.
4. Purchases and Sales of Investments.
Purchases and sales of securities, other than short-term securities, aggregated $72,867,017 and $43,044,104, respectively.
5. Fees and Other Transactions with Affiliates.
Management Fee. Fidelity Management & Research Company (the investment adviser) and its affiliates provide the Fund with investment management related services for which the Fund pays a monthly management fee. The management fee is the sum of an individual fund fee rate that is based on an annual rate of .45% of the Fund's average net assets and an annualized group fee rate that averaged .25% during the period. The group fee rate is based upon the average net assets of all the mutual funds advised by the investment adviser, including any mutual funds previously advised by the investment adviser that are currently advised by Fidelity SelectCo, LLC, an affiliate of the investment adviser. The group fee rate decreases as assets under management increase and increases as assets under management decrease. For the reporting period, the total annualized management fee rate was .70% of the Fund's average net assets.
Transfer Agent Fees. Fidelity Investments Institutional Operations Company, Inc. (FIIOC), an affiliate of the investment adviser, is the Fund's transfer, dividend disbursing and shareholder servicing agent. FIIOC receives account fees and asset-based fees that vary according to account size and type of account. FIIOC pays for typesetting, printing and mailing of shareholder reports, except proxy statements. For the period, the transfer agent fees were equivalent to an annualized rate of .19% of average net assets.
Accounting and Security Lending Fees. Fidelity Service Company, Inc. (FSC), an affiliate of the investment adviser, maintains the Fund's accounting records. The accounting fee is based on the level of average net assets for each month. Under a separate contract, FSC administers the security lending program. The security lending fee is based on the number and duration of lending transactions.
Interfund Trades. The Funds may purchase from or sell securities to other Fidelity Funds under procedures adopted by the Board. The procedures have been designed to ensure these interfund trades are executed in accordance with Rule 17a-7 of the 1940 Act. Interfund trades are included within the respective purchases and sales amounts shown in the Purchases and Sales of Investments note.
6. Committed Line of Credit.
The Fund participates with other funds managed by the investment adviser or an affiliate in a $4.25 billion credit facility (the "line of credit") to be utilized for temporary or emergency purposes to fund shareholder redemptions or for other short-term liquidity purposes. The Fund has agreed to pay commitment fees on its pro-rata portion of the line of credit, which amounted to $454 and is reflected in Miscellaneous expenses on the Statement of Operations. During the period, the Fund did not borrow on this line of credit.
7. Security Lending.
The Fund lends portfolio securities through a lending agent from time to time in order to earn additional income. For equity securities, a lending agent is used and may loan securities to certain qualified borrowers, including Fidelity Capital Markets (FCM), a broker-dealer affiliated with the Fund. On the settlement date of the loan, the Fund receives collateral (in the form of U.S. Treasury obligations, letters of credit and/or cash) against the loaned securities and maintains collateral in an amount not less than 100% of the market value of the loaned securities during the period of the loan. The market value of the loaned securities is determined at the close of business of the Fund and any additional required collateral is delivered to the Fund on the next business day. The Fund or borrower may terminate the loan at any time, and if the borrower defaults on its obligation to return the securities loaned because of insolvency or other reasons, the Fund may apply collateral received from the borrower against the obligation. The Fund may experience delays and costs in recovering the securities loaned. Any cash collateral received is invested in the Fidelity Securities Lending Cash Central Fund. The value of loaned securities and cash collateral at period end are disclosed on the Fund's Statement of Assets and Liabilities. Security lending income represents the income earned on investing cash collateral, less rebates paid to borrowers and any lending agent fees associated with the loan, plus any premium payments received for lending certain types of securities. Security lending income is presented in the Statement of Operations as a component of income from Fidelity Central Funds. Total security lending income during the period amounted to $21,561. During the period, there were no securities loaned to FCM.
8. Expense Reductions.
Through arrangements with the Fund's custodian, credits realized as a result of certain uninvested cash balances were used to reduce the Fund's expenses. During the period, these credits reduced the Fund's custody expenses by $14.
In addition, during the period the investment adviser reimbursed and/or waived a portion of operating expenses in the amount of $1,840.
9. Other.
The Fund's organizational documents provide former and current trustees and officers with a limited indemnification against liabilities arising in connection with the performance of their duties to the Fund. In the normal course of business, the Fund may also enter into contracts that provide general indemnifications. The Fund's maximum exposure under these arrangements is unknown as this would be dependent on future claims that may be made against the Fund. The risk of material loss from such claims is considered remote.
At the end of the period, Strategic Advisers International Fund, and Fidelity VIP Funds Manager 60% Portfolio were the owners of record of approximately 15% and 10%, respectively of the total outstanding shares of the Fund. Mutual funds managed by the investment adviser or its affiliates were the owners of record, in the aggregate, of approximately 46% of the total outstanding shares of the Fund.
Fidelity® Latin America Fund
Investment Summary (Unaudited)
Geographic Diversification (% of fund's net assets)
| As of April 30, 2016 | ||
| Brazil | 45.5% | |
| Mexico | 30.6% | |
| United States of America* | 8.4% | |
| Chile | 3.8% | |
| Bermuda | 3.7% | |
| Panama | 2.6% | |
| United Kingdom | 1.4% | |
| Spain | 1.0% | |
| Peru | 1.0% | |
| Other | 2.0% | |

* Includes Short-Term investments and Net Other Assets (Liabilities).
Percentages are based on country or territory of incorporation and are adjusted for the effect of futures contracts, if applicable.
| As of October 31, 2015 | ||
| Brazil | 39.0% | |
| Mexico | 33.2% | |
| Chile | 12.5% | |
| Colombia | 5.6% | |
| United States of America* | 3.2% | |
| Peru | 3.0% | |
| Panama | 1.6% | |
| Belgium | 0.9% | |
| Spain | 0.7% | |
| Other | 0.3% | |

* Includes Short-Term investments and Net Other Assets (Liabilities).
Percentages are based on country or territory of incorporation and are adjusted for the effect of futures contracts, if applicable.
Asset Allocation as of April 30, 2016
| % of fund's net assets | % of fund's net assets 6 months ago | |
| Stocks | 96.6 | 97.2 |
| Short-Term Investments and Net Other Assets (Liabilities) | 3.4 | 2.8 |
Top Ten Stocks as of April 30, 2016
| % of fund's net assets | % of fund's net assets 6 months ago | |
| Itau Unibanco Holding SA (Brazil, Banks) | 8.0 | 4.7 |
| Grupo Financiero Banorte S.A.B. de CV Series O (Mexico, Banks) | 5.0 | 0.0 |
| Fomento Economico Mexicano S.A.B. de CV unit (Mexico, Beverages) | 4.4 | 5.5 |
| Cielo SA (Brazil, IT Services) | 3.9 | 1.1 |
| Credicorp Ltd. (United States) (Bermuda, Banks) | 3.7 | 0.0 |
| Itausa-Investimentos Itau SA (PN) (Brazil, Banks) | 3.5 | 1.5 |
| Kroton Educacional SA (Brazil, Diversified Consumer Services) | 2.6 | 0.0 |
| BB Seguridade Participacoes SA (Brazil, Insurance) | 2.5 | 1.0 |
| Kimberly-Clark de Mexico SA de CV Series A (Mexico, Household Products) | 2.3 | 1.1 |
| Petroleo Brasileiro SA - Petrobras (PN) (non-vtg.) (Brazil, Oil, Gas & Consumable Fuels) | 2.3 | 1.8 |
| 38.2 |
Market Sectors as of April 30, 2016
| % of fund's net assets | % of fund's net assets 6 months ago | |
| Financials | 35.2 | 26.9 |
| Consumer Staples | 16.4 | 28.0 |
| Consumer Discretionary | 14.5 | 8.1 |
| Industrials | 10.2 | 5.8 |
| Health Care | 6.2 | 1.4 |
| Information Technology | 5.9 | 1.1 |
| Materials | 3.6 | 7.8 |
| Energy | 2.3 | 5.0 |
| Utilities | 1.5 | 4.6 |
| Telecommunication Services | 0.8 | 8.5 |
Market Sectors may include more than one industry category.
The Fund may invest up to 35% of its total assets in any industry that represents more than 20% of the Latin American market. As of April 30, 2016, the Fund did not have more than 25% of its total assets invested in any one industry.
Percentages shown as 0.0% may reflect amounts less than 0.05%.
Fidelity® Latin America Fund
Investments April 30, 2016 (Unaudited)
Showing Percentage of Net Assets
| Common Stocks - 81.6% | |||
| Shares | Value | ||
| Argentina - 1.0% | |||
| Grupo Financiero Galicia SA sponsored ADR | 180,473 | $5,138,066 | |
| Bermuda - 3.7% | |||
| Credicorp Ltd. (United States) | 135,801 | 19,748,181 | |
| Brazil - 30.5% | |||
| BB Seguridade Participacoes SA | 1,513,600 | 13,202,879 | |
| CCR SA | 2,130,502 | 10,022,977 | |
| Cielo SA | 2,117,948 | 20,629,863 | |
| CVC Brasil Operadora e Agencia de Viagens SA | 1,341,033 | 7,408,484 | |
| Equatorial Energia SA | 668,406 | 8,267,498 | |
| Estacio Participacoes SA | 2,243,220 | 7,742,101 | |
| Fibria Celulose SA | 982,462 | 8,678,402 | |
| FPC Par Corretora de Seguros | 1,667,889 | 5,601,255 | |
| Grendene SA | 1,074,900 | 5,310,039 | |
| Hypermarcas SA | 1,101,286 | 9,715,205 | |
| Industrias Romi SA | 549,100 | 295,365 | |
| Kroton Educacional SA | 3,718,837 | 13,840,551 | |
| Linx SA | 338,067 | 4,649,435 | |
| Mills Estruturas e Servicos de Engenharia SA | 2,521,458 | 3,086,527 | |
| Multiplus SA | 580,948 | 6,410,402 | |
| Odontoprev SA | 2,036,893 | 6,194,926 | |
| Qualicorp SA | 2,460,713 | 10,660,645 | |
| Smiles SA | 814,156 | 9,445,322 | |
| Tegma Gestao Logistica SA | 2,562,627 | 4,276,944 | |
| Valid Solucoes SA | 659,175 | 6,708,185 | |
| TOTAL BRAZIL | 162,147,005 | ||
| Chile - 3.8% | |||
| Banmedica SA | 3,100,772 | 5,256,540 | |
| CorpBanca SA | 742,999,828 | 6,762,263 | |
| Forus SA | 1,878,297 | 5,668,936 | |
| Vina San Pedro SA | 238,206,744 | 2,347,184 | |
| TOTAL CHILE | 20,034,923 | ||
| France - 1.0% | |||
| Edenred SA | 264,421 | 5,213,790 | |
| Mexico - 30.6% | |||
| Banregio Grupo Financiero S.A.B. de CV | 360,000 | 2,157,324 | |
| Compartamos S.A.B. de CV | 5,797,311 | 11,530,835 | |
| Credito Real S.A.B. de CV | 2,385,302 | 5,261,497 | |
| Embotelladoras Arca S.A.B. de CV | 1,099,169 | 7,587,327 | |
| Fomento Economico Mexicano S.A.B. de CV unit | 2,516,609 | 23,415,691 | |
| Genomma Lab Internacional SA de CV (a)(b) | 9,725,099 | 10,683,412 | |
| Gruma S.A.B. de CV Series B | 614,429 | 8,975,739 | |
| Grupo Aeroportuario Norte S.A.B. de CV | 911,563 | 5,275,040 | |
| Grupo Comercial Chedraui S.A.B. de CV | 355,158 | 1,006,560 | |
| Grupo Financiero Banorte S.A.B. de CV Series O | 4,658,402 | 26,445,532 | |
| Grupo GICSA SA de CV (b) | 5,477,756 | 4,304,607 | |
| Grupo Herdez S.A.B. de CV | 2,034,846 | 4,503,837 | |
| Kimberly-Clark de Mexico SA de CV Series A | 5,199,395 | 12,305,938 | |
| Megacable Holdings S.A.B. de CV unit | 2,210,548 | 10,208,173 | |
| Promotora y Operadora de Infraestructura S.A.B. de CV | 685,467 | 7,175,139 | |
| Qualitas Controladora S.A.B. de CV | 4,665,846 | 6,270,070 | |
| Telesites S.A.B. de C.V. (b) | 6,986,994 | 4,288,530 | |
| Tenedora Nemak SA de CV | 3,169,744 | 4,546,985 | |
| Unifin Financiera SAPI de CV | 2,278,967 | 6,718,486 | |
| TOTAL MEXICO | 162,660,722 | ||
| Panama - 2.6% | |||
| Copa Holdings SA Class A | 97,338 | 6,205,298 | |
| Intergroup Financial Services Corp. | 259,297 | 7,389,965 | |
| TOTAL PANAMA | 13,595,263 | ||
| Peru - 1.0% | |||
| Alicorp SA Class C (b) | 2,843,073 | 5,391,229 | |
| Spain - 1.0% | |||
| Prosegur Compania de Seguridad SA (Reg.) | 946,444 | 5,472,815 | |
| United Kingdom - 1.4% | |||
| British American Tobacco PLC (United Kingdom) | 125,624 | 7,659,558 | |
| United States of America - 5.0% | |||
| First Cash Financial Services, Inc. | 110,047 | 5,032,449 | |
| MercadoLibre, Inc. | 46,959 | 5,864,710 | |
| Monsanto Co. | 112,070 | 10,498,718 | |
| PriceSmart, Inc. | 60,590 | 5,243,459 | |
| TOTAL UNITED STATES OF AMERICA | 26,639,336 | ||
| TOTAL COMMON STOCKS | |||
| (Cost $370,927,690) | 433,700,888 | ||
| Nonconvertible Preferred Stocks - 15.0% | |||
| Brazil - 15.0% | |||
| Alpargatas SA (PN) | 2,325,383 | 6,254,210 | |
| Itau Unibanco Holding SA | 4,473,142 | 42,751,231 | |
| Itausa-Investimentos Itau SA (PN) | 7,391,854 | 18,612,621 | |
| Petroleo Brasileiro SA - Petrobras (PN) (non-vtg.) (b) | 4,099,671 | 12,194,413 | |
| TOTAL NONCONVERTIBLE PREFERRED STOCKS | |||
| (Cost $47,767,968) | 79,812,475 | ||
| Money Market Funds - 3.2% | |||
| Fidelity Cash Central Fund, 0.38% (c) | 15,233,830 | 15,233,830 | |
| Fidelity Securities Lending Cash Central Fund, 0.42% (c)(d) | 1,908,000 | 1,908,000 | |
| TOTAL MONEY MARKET FUNDS | |||
| (Cost $17,141,830) | 17,141,830 | ||
| TOTAL INVESTMENT PORTFOLIO - 99.8% | |||
| (Cost $435,837,488) | 530,655,193 | ||
| NET OTHER ASSETS (LIABILITIES) - 0.2% | 1,322,703 | ||
| NET ASSETS - 100% | $531,977,896 |
Categorizations in the Schedule of Investments are based on country or territory of incorporation.
Legend
(a) Security or a portion of the security is on loan at period end.
(b) Non-income producing
(c) Affiliated fund that is generally available only to investment companies and other accounts managed by Fidelity Investments. The rate quoted is the annualized seven-day yield of the fund at period end. A complete unaudited listing of the fund's holdings as of its most recent quarter end is available upon request. In addition, each Fidelity Central Fund's financial statements are available on the SEC's website or upon request.
(d) Investment made with cash collateral received from securities on loan.
Affiliated Central Funds
Information regarding fiscal year to date income earned by the Fund from investments in Fidelity Central Funds is as follows:
| Fund | Income earned |
| Fidelity Cash Central Fund | $13,871 |
| Fidelity Securities Lending Cash Central Fund | 13,739 |
| Total | $27,610 |
Investment Valuation
The following is a summary of the inputs used, as of April 30, 2016, involving the Fund's assets and liabilities carried at fair value. The inputs or methodology used for valuing securities may not be an indication of the risk associated with investing in those securities. For more information on valuation inputs, and their aggregation into the levels used below, please refer to the Investment Valuation section in the accompanying Notes to Financial Statements.
| Valuation Inputs at Reporting Date: | ||||
| Description | Total | Level 1 | Level 2 | Level 3 |
| Investments in Securities: | ||||
| Equities: | ||||
| Consumer Discretionary | $76,835,203 | $76,835,203 | $-- | $-- |
| Consumer Staples | 88,151,727 | 80,492,169 | 7,659,558 | -- |
| Energy | 12,194,413 | 12,194,413 | -- | -- |
| Financials | 186,927,261 | 186,927,261 | -- | -- |
| Health Care | 32,795,523 | 32,795,523 | -- | -- |
| Industrials | 53,732,080 | 53,732,080 | -- | -- |
| Information Technology | 31,144,008 | 31,144,008 | -- | -- |
| Materials | 19,177,120 | 19,177,120 | -- | -- |
| Telecommunication Services | 4,288,530 | 4,288,530 | -- | -- |
| Utilities | 8,267,498 | 8,267,498 | -- | -- |
| Money Market Funds | 17,141,830 | 17,141,830 | -- | -- |
| Total Investments in Securities: | $530,655,193 | $522,995,635 | $7,659,558 | $-- |
See accompanying notes which are an integral part of the financial statements.
Fidelity® Latin America Fund
Financial Statements
Statement of Assets and Liabilities
| April 30, 2016 (Unaudited) | ||
| Assets | ||
| Investment in securities, at value (including securities loaned of $1,986,076) — See accompanying schedule: Unaffiliated issuers (cost $418,695,658) | $513,513,363 | |
| Fidelity Central Funds (cost $17,141,830) | 17,141,830 | |
| Total Investments (cost $435,837,488) | $530,655,193 | |
| Foreign currency held at value (cost $848,641) | 845,098 | |
| Receivable for investments sold | 11,521,261 | |
| Receivable for fund shares sold | 886,476 | |
| Dividends receivable | 2,157,717 | |
| Distributions receivable from Fidelity Central Funds | 5,465 | |
| Prepaid expenses | 839 | |
| Other receivables | 4,697 | |
| Total assets | 546,076,746 | |
| Liabilities | ||
| Payable for investments purchased | $9,981,660 | |
| Payable for fund shares redeemed | 1,673,044 | |
| Accrued management fee | 295,020 | |
| Distribution and service plan fees payable | 10,382 | |
| Other affiliated payables | 141,288 | |
| Other payables and accrued expenses | 89,456 | |
| Collateral on securities loaned, at value | 1,908,000 | |
| Total liabilities | 14,098,850 | |
| Net Assets | $531,977,896 | |
| Net Assets consist of: | ||
| Paid in capital | $621,439,296 | |
| Undistributed net investment income | 5,280,315 | |
| Accumulated undistributed net realized gain (loss) on investments and foreign currency transactions | (189,596,126) | |
| Net unrealized appreciation (depreciation) on investments and assets and liabilities in foreign currencies | 94,854,411 | |
| Net Assets | $531,977,896 | |
| Calculation of Maximum Offering Price | ||
| Class A: | ||
| Net Asset Value and redemption price per share ($15,995,909 ÷ 829,375 shares) | $19.29 | |
| Maximum offering price per share (100/94.25 of $19.29) | $20.47 | |
| Class T: | ||
| Net Asset Value and redemption price per share ($5,751,716 ÷ 297,544 shares) | $19.33 | |
| Maximum offering price per share (100/96.50 of $19.33) | $20.03 | |
| Class B: | ||
| Net Asset Value and offering price per share ($424,337 ÷ 21,533 shares)(a) | $19.71 | |
| Class C: | ||
| Net Asset Value and offering price per share ($5,785,469 ÷ 296,693 shares)(a) | $19.50 | |
| Latin America: | ||
| Net Asset Value, offering price and redemption price per share ($500,862,877 ÷ 26,047,611 shares) | $19.23 | |
| Class I: | ||
| Net Asset Value, offering price and redemption price per share ($3,157,588 ÷ 164,416 shares) | $19.20 |
(a) Redemption price per share is equal to net asset value less any applicable contingent deferred sales charge.
See accompanying notes which are an integral part of the financial statements.
Statement of Operations
| Six months ended April 30, 2016 (Unaudited) | ||
| Investment Income | ||
| Dividends | $11,941,726 | |
| Income from Fidelity Central Funds | 27,610 | |
| Income before foreign taxes withheld | 11,969,336 | |
| Less foreign taxes withheld | (658,372) | |
| Total income | 11,310,964 | |
| Expenses | ||
| Management fee | $1,625,345 | |
| Transfer agent fees | 695,198 | |
| Distribution and service plan fees | 56,456 | |
| Accounting and security lending fees | 120,506 | |
| Custodian fees and expenses | 201,427 | |
| Independent trustees' compensation | 1,051 | |
| Registration fees | 43,549 | |
| Audit | 39,945 | |
| Legal | 713 | |
| Interest | 882 | |
| Miscellaneous | 1,577 | |
| Total expenses before reductions | 2,786,649 | |
| Expense reductions | (7,128) | 2,779,521 |
| Net investment income (loss) | 8,531,443 | |
| Realized and Unrealized Gain (Loss) | ||
| Net realized gain (loss) on: | ||
| Investment securities: | ||
| Unaffiliated issuers | (101,386,798) | |
| Foreign currency transactions | (358,721) | |
| Total net realized gain (loss) | (101,745,519) | |
| Change in net unrealized appreciation (depreciation) on: Investment securities | 133,562,288 | |
| Assets and liabilities in foreign currencies | 76,379 | |
| Total change in net unrealized appreciation (depreciation) | 133,638,667 | |
| Net gain (loss) | 31,893,148 | |
| Net increase (decrease) in net assets resulting from operations | $40,424,591 |
See accompanying notes which are an integral part of the financial statements.
Statement of Changes in Net Assets
| Six months ended April 30, 2016 (Unaudited) | Year ended October 31, 2015 | |
| Increase (Decrease) in Net Assets | ||
| Operations | ||
| Net investment income (loss) | $8,531,443 | $10,341,112 |
| Net realized gain (loss) | (101,745,519) | (87,419,393) |
| Change in net unrealized appreciation (depreciation) | 133,638,667 | (231,042,995) |
| Net increase (decrease) in net assets resulting from operations | 40,424,591 | (308,121,276) |
| Distributions to shareholders from net investment income | (10,264,003) | (12,592,762) |
| Distributions to shareholders from net realized gain | – | (66,395,306) |
| Total distributions | (10,264,003) | (78,988,068) |
| Share transactions - net increase (decrease) | (8,769,783) | (98,503,600) |
| Redemption fees | 24,821 | 127,133 |
| Total increase (decrease) in net assets | 21,415,626 | (485,485,811) |
| Net Assets | ||
| Beginning of period | 510,562,270 | 996,048,081 |
| End of period (including undistributed net investment income of $5,280,315 and undistributed net investment income of $7,012,875, respectively) | $531,977,896 | $510,562,270 |
See accompanying notes which are an integral part of the financial statements.
Financial Highlights — Fidelity Latin America Fund Class A
| Six months ended (Unaudited) April 30, | Years ended October 31, | |||||
| 2016 | 2015 | 2014 | 2013 | 2012 | 2011 | |
| Selected Per–Share Data | ||||||
| Net asset value, beginning of period | $18.09 | $30.31 | $40.71 | $48.95 | $52.38 | $57.48 |
| Income from Investment Operations | ||||||
| Net investment income (loss)A | .29 | .28 | .49 | .72 | .92 | 1.15 |
| Net realized and unrealized gain (loss) | 1.22 | (10.11) | (4.08) | (4.73) | (3.66) | (5.87) |
| Total from investment operations | 1.51 | (9.83) | (3.59) | (4.01) | (2.74) | (4.72) |
| Distributions from net investment income | (.31) | (.31) | (.57) | (.79) | (.70) | (.19) |
| Distributions from net realized gain | – | (2.08) | (6.25) | (3.45) | – | (.20) |
| Total distributions | (.31) | (2.39) | (6.82) | (4.24) | (.70) | (.39) |
| Redemption fees added to paid in capitalA | –B | –B | .01 | .01 | .01 | .01 |
| Net asset value, end of period | $19.29 | $18.09 | $30.31 | $40.71 | $48.95 | $52.38 |
| Total ReturnC,D,E | 8.51% | (34.60)% | (9.06)% | (8.93)% | (5.23)% | (8.26)% |
| Ratios to Average Net AssetsF,G | ||||||
| Expenses before reductions | 1.42%H | 1.40% | 1.38% | 1.37% | 1.35% | 1.34% |
| Expenses net of fee waivers, if any | 1.42%H | 1.40% | 1.38% | 1.37% | 1.35% | 1.34% |
| Expenses net of all reductions | 1.42%H | 1.39% | 1.38% | 1.35% | 1.35% | 1.34% |
| Net investment income (loss) | 3.43%H | 1.26% | 1.52% | 1.66% | 1.80% | 2.05% |
| Supplemental Data | ||||||
| Net assets, end of period (000 omitted) | $15,996 | $16,424 | $34,898 | $48,464 | $69,654 | $91,407 |
| Portfolio turnover rateI | 165%H | 30% | 30% | 23% | 23% | 11% |
A Calculated based on average shares outstanding during the period.
B Amount represents less than $.005 per share.
C Total returns for periods of less than one year are not annualized.
D Total returns would have been lower if certain expenses had not been reduced during the applicable periods shown.
E Total returns do not include the effect of the sales charges.
F Fees and expenses of any underlying Fidelity Central Funds are not included in the Fund's expense ratio. The Fund indirectly bears its proportionate share of the expenses of any underlying Fidelity Central Funds.
G Expense ratios reflect operating expenses of the class. Expenses before reductions do not reflect amounts reimbursed by the investment adviser or reductions from brokerage service arrangements or reductions from other expense offset arrangements and do not represent the amount paid by the class during periods when reimbursements or reductions occur. Expenses net of fee waivers reflect expenses after reimbursement by the investment adviser but prior to reductions from brokerage service arrangements or other expense offset arrangements. Expenses net of all reductions represent the net expenses paid by the class.
H Annualized
I Amount does not include the portfolio activity of any underlying Fidelity Central Funds.
See accompanying notes which are an integral part of the financial statements.
Financial Highlights — Fidelity Latin America Fund Class T
| Six months ended (Unaudited) April 30, | Years ended October 31, | |||||
| 2016 | 2015 | 2014 | 2013 | 2012 | 2011 | |
| Selected Per–Share Data | ||||||
| Net asset value, beginning of period | $18.11 | $30.33 | $40.68 | $48.88 | $52.27 | $57.47 |
| Income from Investment Operations | ||||||
| Net investment income (loss)A | .27 | .22 | .40 | .61 | .78 | .99 |
| Net realized and unrealized gain (loss) | 1.21 | (10.13) | (4.08) | (4.74) | (3.65) | (5.85) |
| Total from investment operations | 1.48 | (9.91) | (3.68) | (4.13) | (2.87) | (4.86) |
| Distributions from net investment income | (.26) | (.23) | (.43) | (.63) | (.53) | (.15) |
| Distributions from net realized gain | – | (2.08) | (6.25) | (3.45) | – | (.20) |
| Total distributions | (.26) | (2.31) | (6.68) | (4.08) | (.53) | (.35) |
| Redemption fees added to paid in capitalA | –B | –B | .01 | .01 | .01 | .01 |
| Net asset value, end of period | $19.33 | $18.11 | $30.33 | $40.68 | $48.88 | $52.27 |
| Total ReturnC,D,E | 8.33% | (34.78)% | (9.30)% | (9.17)% | (5.49)% | (8.50)% |
| Ratios to Average Net AssetsF,G | ||||||
| Expenses before reductions | 1.71%H | 1.67% | 1.65% | 1.63% | 1.61% | 1.61% |
| Expenses net of fee waivers, if any | 1.71%H | 1.67% | 1.65% | 1.63% | 1.61% | 1.61% |
| Expenses net of all reductions | 1.71%H | 1.66% | 1.65% | 1.61% | 1.61% | 1.61% |
| Net investment income (loss) | 3.14%H | .99% | 1.25% | 1.40% | 1.54% | 1.78% |
| Supplemental Data | ||||||
| Net assets, end of period (000 omitted) | $5,752 | $5,284 | $9,761 | $12,705 | $19,334 | $26,020 |
| Portfolio turnover rateI | 165%H | 30% | 30% | 23% | 23% | 11% |
A Calculated based on average shares outstanding during the period.
B Amount represents less than $.005 per share.
C Total returns for periods of less than one year are not annualized.
D Total returns would have been lower if certain expenses had not been reduced during the applicable periods shown.
E Total returns do not include the effect of the sales charges.
F Fees and expenses of any underlying Fidelity Central Funds are not included in the Fund's expense ratio. The Fund indirectly bears its proportionate share of the expenses of any underlying Fidelity Central Funds.
G Expense ratios reflect operating expenses of the class. Expenses before reductions do not reflect amounts reimbursed by the investment adviser or reductions from brokerage service arrangements or reductions from other expense offset arrangements and do not represent the amount paid by the class during periods when reimbursements or reductions occur. Expenses net of fee waivers reflect expenses after reimbursement by the investment adviser but prior to reductions from brokerage service arrangements or other expense offset arrangements. Expenses net of all reductions represent the net expenses paid by the class.
H Annualized
I Amount does not include the portfolio activity of any underlying Fidelity Central Funds.
See accompanying notes which are an integral part of the financial statements.
Financial Highlights — Fidelity Latin America Fund Class B
| Six months ended (Unaudited) April 30, | Years ended October 31, | |||||
| 2016 | 2015 | 2014 | 2013 | 2012 | 2011 | |
| Selected Per–Share Data | ||||||
| Net asset value, beginning of period | $18.27 | $30.46 | $40.63 | $48.72 | $52.06 | $57.44 |
| Income from Investment Operations | ||||||
| Net investment income (loss)A | .23 | .12 | .25 | .40 | .53 | .72 |
| Net realized and unrealized gain (loss) | 1.24 | (10.23) | (4.08) | (4.74) | (3.63) | (5.84) |
| Total from investment operations | 1.47 | (10.11) | (3.83) | (4.34) | (3.10) | (5.12) |
| Distributions from net investment income | (.03) | – | (.10) | (.31) | (.25) | (.07) |
| Distributions from net realized gain | – | (2.08) | (6.25) | (3.45) | – | (.20) |
| Total distributions | (.03) | (2.08) | (6.35) | (3.76) | (.25) | (.27) |
| Redemption fees added to paid in capitalA | –B | –B | .01 | .01 | .01 | .01 |
| Net asset value, end of period | $19.71 | $18.27 | $30.46 | $40.63 | $48.72 | $52.06 |
| Total ReturnC,D,E | 8.10% | (35.09)% | (9.73)% | (9.60)% | (5.95)% | (8.94)% |
| Ratios to Average Net AssetsF,G | ||||||
| Expenses before reductions | 2.17%H | 2.16% | 2.14% | 2.12% | 2.10% | 2.10% |
| Expenses net of fee waivers, if any | 2.17%H | 2.15% | 2.14% | 2.12% | 2.10% | 2.10% |
| Expenses net of all reductions | 2.17%H | 2.15% | 2.13% | 2.10% | 2.10% | 2.10% |
| Net investment income (loss) | 2.68%H | .50% | .76% | .91% | 1.05% | 1.29% |
| Supplemental Data | ||||||
| Net assets, end of period (000 omitted) | $424 | $628 | $2,211 | $4,764 | $9,492 | $14,114 |
| Portfolio turnover rateI | 165%H | 30% | 30% | 23% | 23% | 11% |
A Calculated based on average shares outstanding during the period.
B Amount represents less than $.005 per share.
C Total returns for periods of less than one year are not annualized.
D Total returns would have been lower if certain expenses had not been reduced during the applicable periods shown.
E Total returns do not include the effect of the contingent deferred sales charge.
F Fees and expenses of any underlying Fidelity Central Funds are not included in the Fund's expense ratio. The Fund indirectly bears its proportionate share of the expenses of any underlying Fidelity Central Funds.
G Expense ratios reflect operating expenses of the class. Expenses before reductions do not reflect amounts reimbursed by the investment adviser or reductions from brokerage service arrangements or reductions from other expense offset arrangements and do not represent the amount paid by the class during periods when reimbursements or reductions occur. Expenses net of fee waivers reflect expenses after reimbursement by the investment adviser but prior to reductions from brokerage service arrangements or other expense offset arrangements. Expenses net of all reductions represent the net expenses paid by the class.
H Annualized
I Amount does not include the portfolio activity of any underlying Fidelity Central Funds.
See accompanying notes which are an integral part of the financial statements.
Financial Highlights — Fidelity Latin America Fund Class C
| Six months ended (Unaudited) April 30, | Years ended October 31, | |||||
| 2016 | 2015 | 2014 | 2013 | 2012 | 2011 | |
| Selected Per–Share Data | ||||||
| Net asset value, beginning of period | $18.18 | $30.37 | $40.59 | $48.73 | $52.05 | $57.44 |
| Income from Investment Operations | ||||||
| Net investment income (loss)A | .23 | .11 | .25 | .40 | .54 | .73 |
| Net realized and unrealized gain (loss) | 1.22 | (10.17) | (4.07) | (4.74) | (3.64) | (5.84) |
| Total from investment operations | 1.45 | (10.06) | (3.82) | (4.34) | (3.10) | (5.11) |
| Distributions from net investment income | (.13) | (.05) | (.16) | (.36) | (.23) | (.09) |
| Distributions from net realized gain | – | (2.08) | (6.25) | (3.45) | – | (.20) |
| Total distributions | (.13) | (2.13) | (6.41) | (3.81) | (.23) | (.29) |
| Redemption fees added to paid in capitalA | –B | –B | .01 | .01 | .01 | .01 |
| Net asset value, end of period | $19.50 | $18.18 | $30.37 | $40.59 | $48.73 | $52.05 |
| Total ReturnC,D,E | 8.07% | (35.08)% | (9.74)% | (9.62)% | (5.94)% | (8.93)% |
| Ratios to Average Net AssetsF,G | ||||||
| Expenses before reductions | 2.17%H | 2.15% | 2.13% | 2.12% | 2.10% | 2.08% |
| Expenses net of fee waivers, if any | 2.17%H | 2.15% | 2.13% | 2.12% | 2.10% | 2.08% |
| Expenses net of all reductions | 2.16%H | 2.15% | 2.13% | 2.10% | 2.10% | 2.08% |
| Net investment income (loss) | 2.69%H | .51% | .77% | .91% | 1.06% | 1.31% |
| Supplemental Data | ||||||
| Net assets, end of period (000 omitted) | $5,785 | $5,394 | $11,349 | $15,185 | $27,405 | $35,203 |
| Portfolio turnover rateI | 165%H | 30% | 30% | 23% | 23% | 11% |
A Calculated based on average shares outstanding during the period.
B Amount represents less than $.005 per share.
C Total returns for periods of less than one year are not annualized.
D Total returns would have been lower if certain expenses had not been reduced during the applicable periods shown.
E Total returns do not include the effect of the contingent deferred sales charge.
F Fees and expenses of any underlying Fidelity Central Funds are not included in the Fund's expense ratio. The Fund indirectly bears its proportionate share of the expenses of any underlying Fidelity Central Funds.
G Expense ratios reflect operating expenses of the class. Expenses before reductions do not reflect amounts reimbursed by the investment adviser or reductions from brokerage service arrangements or reductions from other expense offset arrangements and do not represent the amount paid by the class during periods when reimbursements or reductions occur. Expenses net of fee waivers reflect expenses after reimbursement by the investment adviser but prior to reductions from brokerage service arrangements or other expense offset arrangements. Expenses net of all reductions represent the net expenses paid by the class.
H Annualized
I Amount does not include the portfolio activity of any underlying Fidelity Central Funds.
See accompanying notes which are an integral part of the financial statements.
Financial Highlights — Fidelity Latin America Fund
| Six months ended (Unaudited) April 30, | Years ended October 31, | |||||
| 2016 | 2015 | 2014 | 2013 | 2012 | 2011 | |
| Selected Per–Share Data | ||||||
| Net asset value, beginning of period | $18.08 | $30.34 | $40.80 | $49.09 | $52.48 | $57.50 |
| Income from Investment Operations | ||||||
| Net investment income (loss)A | .31 | .34 | .59 | .87 | 1.09 | 1.34 |
| Net realized and unrealized gain (loss) | 1.22 | (10.11) | (4.10) | (4.74) | (3.67) | (5.88) |
| Total from investment operations | 1.53 | (9.77) | (3.51) | (3.87) | (2.58) | (4.54) |
| Distributions from net investment income | (.38) | (.41) | (.71) | (.98) | (.82) | (.29) |
| Distributions from net realized gain | – | (2.08) | (6.25) | (3.45) | – | (.20) |
| Total distributions | (.38) | (2.49) | (6.96) | (4.43) | (.82) | (.49) |
| Redemption fees added to paid in capitalA | –B | –B | .01 | .01 | .01 | .01 |
| Net asset value, end of period | $19.23 | $18.08 | $30.34 | $40.80 | $49.09 | $52.48 |
| Total ReturnC,D | 8.67% | (34.45)% | (8.79)% | (8.63)% | (4.91)% | (7.96)% |
| Ratios to Average Net AssetsE,F | ||||||
| Expenses before reductions | 1.17%G | 1.13% | 1.08% | 1.04% | 1.02% | 1.00% |
| Expenses net of fee waivers, if any | 1.17%G | 1.12% | 1.08% | 1.04% | 1.02% | 1.00% |
| Expenses net of all reductions | 1.17%G | 1.12% | 1.07% | 1.03% | 1.02% | 1.00% |
| Net investment income (loss) | 3.68%G | 1.53% | 1.83% | 1.99% | 2.14% | 2.39% |
| Supplemental Data | ||||||
| Net assets, end of period (000 omitted) | $500,863 | $481,005 | $933,298 | $1,324,748 | $2,274,601 | $2,884,301 |
| Portfolio turnover rateH | 165%G | 30% | 30% | 23% | 23% | 11% |
A Calculated based on average shares outstanding during the period.
B Amount represents less than $.005 per share.
C Total returns for periods of less than one year are not annualized.
D Total returns would have been lower if certain expenses had not been reduced during the applicable periods shown.
E Fees and expenses of any underlying Fidelity Central Funds are not included in the Fund's expense ratio. The Fund indirectly bears its proportionate share of the expenses of any underlying Fidelity Central Funds.
F Expense ratios reflect operating expenses of the class. Expenses before reductions do not reflect amounts reimbursed by the investment adviser or reductions from brokerage service arrangements or reductions from other expense offset arrangements and do not represent the amount paid by the class during periods when reimbursements or reductions occur. Expenses net of fee waivers reflect expenses after reimbursement by the investment adviser but prior to reductions from brokerage service arrangements or other expense offset arrangements. Expenses net of all reductions represent the net expenses paid by the class.
G Annualized
H Amount does not include the portfolio activity of any underlying Fidelity Central Funds.
See accompanying notes which are an integral part of the financial statements.
Financial Highlights — Fidelity Latin America Fund Class I
| Six months ended (Unaudited) April 30, | Years ended October 31, | |||||
| 2016 | 2015 | 2014 | 2013 | 2012 | 2011 | |
| Selected Per–Share Data | ||||||
| Net asset value, beginning of period | $18.08 | $30.35 | $40.79 | $49.07 | $52.51 | $57.49 |
| Income from Investment Operations | ||||||
| Net investment income (loss)A | .31 | .36 | .60 | .87 | 1.08 | 1.32 |
| Net realized and unrealized gain (loss) | 1.21 | (10.13) | (4.07) | (4.74) | (3.67) | (5.88) |
| Total from investment operations | 1.52 | (9.77) | (3.47) | (3.87) | (2.59) | (4.56) |
| Distributions from net investment income | (.40) | (.42) | (.73) | (.97) | (.86) | (.23) |
| Distributions from net realized gain | – | (2.08) | (6.25) | (3.45) | – | (.20) |
| Total distributions | (.40) | (2.50) | (6.98) | (4.42) | (.86) | (.43) |
| Redemption fees added to paid in capitalA | –B | –B | .01 | .01 | .01 | .01 |
| Net asset value, end of period | $19.20 | $18.08 | $30.35 | $40.79 | $49.07 | $52.51 |
| Total ReturnC,D | 8.66% | (34.42)% | (8.69)% | (8.63)% | (4.93)% | (7.98)% |
| Ratios to Average Net AssetsE,F | ||||||
| Expenses before reductions | 1.13%G | 1.06% | 1.04% | 1.03% | 1.04% | 1.04% |
| Expenses net of fee waivers, if any | 1.13%G | 1.06% | 1.04% | 1.03% | 1.04% | 1.04% |
| Expenses net of all reductions | 1.12%G | 1.05% | 1.04% | 1.01% | 1.04% | 1.04% |
| Net investment income (loss) | 3.73%G | 1.60% | 1.86% | 2.00% | 2.12% | 2.35% |
| Supplemental Data | ||||||
| Net assets, end of period (000 omitted) | $3,158 | $1,828 | $4,531 | $5,131 | $7,928 | $9,603 |
| Portfolio turnover rateH | 165%G | 30% | 30% | 23% | 23% | 11% |
A Calculated based on average shares outstanding during the period.
B Amount represents less than $.005 per share.
C Total returns for periods of less than one year are not annualized.
D Total returns would have been lower if certain expenses had not been reduced during the applicable periods shown.
E Fees and expenses of any underlying Fidelity Central Funds are not included in the Fund's expense ratio. The Fund indirectly bears its proportionate share of the expenses of any underlying Fidelity Central Funds.
F Expense ratios reflect operating expenses of the class. Expenses before reductions do not reflect amounts reimbursed by the investment adviser or reductions from brokerage service arrangements or reductions from other expense offset arrangements and do not represent the amount paid by the class during periods when reimbursements or reductions occur. Expenses net of fee waivers reflect expenses after reimbursement by the investment adviser but prior to reductions from brokerage service arrangements or other expense offset arrangements. Expenses net of all reductions represent the net expenses paid by the class.
G Annualized
H Amount does not include the portfolio activity of any underlying Fidelity Central Funds.
See accompanying notes which are an integral part of the financial statements.
Notes to Financial Statements (Unaudited)
For the period ended April 30, 2016
1. Organization.
Fidelity Latin America Fund (the Fund) is a non-diversified fund of Fidelity Investment Trust (the Trust) and is authorized to issue an unlimited number of shares. The Trust is registered under the Investment Company Act of 1940, as amended (the 1940 Act), as an open-end management investment company organized as a Massachusetts business trust. The Fund offers Class A, Class T, Class C, Latin America and Institutional Class shares, each of which, along with Class B shares, has equal rights as to assets and voting privileges. Class B shares are closed to new accounts and additional purchases, except for exchanges and reinvestments. Each class has exclusive voting rights with respect to matters that affect that class. Class B shares will automatically convert to Class A shares after a maximum holding period of seven years from the initial date of purchase. The Fund's investments in emerging markets can be subject to social, economic, regulatory, and political uncertainties and can be extremely volatile.
During the period, the Board of Trustees approved the conversion of all existing Class B shares into Class A shares, effective on or about July 1, 2016, regardless of the length of times shares have been held.
2. Investments in Fidelity Central Funds.
The Fund invests in Fidelity Central Funds, which are open-end investment companies generally available only to other investment companies and accounts managed by the investment adviser and its affiliates. The Fund's Schedule of Investments lists each of the Fidelity Central Funds held as of period end, if any, as an investment of the Fund, but does not include the underlying holdings of each Fidelity Central Fund. As an Investing Fund, the Fund indirectly bears its proportionate share of the expenses of the underlying Fidelity Central Funds.
The Money Market Central Funds seek preservation of capital and current income and are managed by Fidelity Investments Money Management, Inc. (FIMM), an affiliate of the investment adviser. Annualized expenses of the Money Market Central Funds as of their most recent shareholder report date are less than .005%.
A complete unaudited list of holdings for each Fidelity Central Fund is available upon request or at the Securities and Exchange Commission (the SEC) website at www.sec.gov. In addition, the financial statements of the Fidelity Central Funds are available on the SEC website or upon request.
3. Significant Accounting Policies.
The financial statements have been prepared in conformity with accounting principles generally accepted in the United States of America (GAAP), which require management to make certain estimates and assumptions at the date of the financial statements. Actual results could differ from those estimates. Subsequent events, if any, through the date that the financial statements were issued have been evaluated in the preparation of the financial statements. The following summarizes the significant accounting policies of the Fund:
Investment Valuation. Investments are valued as of 4:00 p.m. Eastern time on the last calendar day of the period. The Board of Trustees (the Board) has delegated the day to day responsibility for the valuation of the Fund's investments to the Fidelity Management & Research Company (FMR) Fair Value Committee (the Committee). In accordance with valuation policies and procedures approved by the Board, the Fund attempts to obtain prices from one or more third party pricing vendors or brokers to value its investments. When current market prices, quotations or currency exchange rates are not readily available or reliable, investments will be fair valued in good faith by the Committee, in accordance with procedures adopted by the Board. Factors used in determining fair value vary by investment type and may include market or investment specific events. The frequency with which these procedures are used cannot be predicted and they may be utilized to a significant extent. The Committee oversees the Fund's valuation policies and procedures and reports to the Board on the Committee's activities and fair value determinations. The Board monitors the appropriateness of the procedures used in valuing the Fund's investments and ratifies the fair value determinations of the Committee.
The Fund categorizes the inputs to valuation techniques used to value its investments into a disclosure hierarchy consisting of three levels as shown below:
- Level 1 – quoted prices in active markets for identical investments
- Level 2 – other significant observable inputs (including quoted prices for similar investments, interest rates, prepayment speeds, etc.)
- Level 3 – unobservable inputs (including the Fund's own assumptions based on the best information available)
Valuation techniques used to value the Fund's investments by major category are as follows:
Equity securities, including restricted securities, for which market quotations are readily available, are valued at the last reported sale price or official closing price as reported by a third party pricing vendor on the primary market or exchange on which they are traded and are categorized as Level 1 in the hierarchy. In the event there were no sales during the day or closing prices are not available, securities are valued at the last quoted bid price or may be valued using the last available price and are generally categorized as Level 2 in the hierarchy. For foreign equity securities, when market or security specific events arise, comparisons to the valuation of American Depositary Receipts (ADRs), futures contracts, Exchange-Traded Funds (ETFs) and certain indexes as well as quoted prices for similar securities may be used and would be categorized as Level 2 in the hierarchy. Utilizing these techniques may result in transfers between Level 1 and Level 2. For equity securities, including restricted securities, where observable inputs are limited, assumptions about market activity and risk are used and these securities may be categorized as Level 3 in the hierarchy.
Investments in open-end mutual funds, including the Fidelity Central Funds, are valued at their closing net asset value (NAV) each business day and are categorized as Level 1 in the hierarchy.
Changes in valuation techniques may result in transfers in or out of an assigned level within the disclosure hierarchy. The aggregate value of investments by input level as of April 30, 2016 is included at the end of the Fund's Schedule of Investments.
Foreign Currency. The Fund may use foreign currency contracts to facilitate transactions in foreign-denominated securities. Gains and losses from these transactions may arise from changes in the value of the foreign currency or if the counterparties do not perform under the contracts' terms.
Foreign-denominated assets, including investment securities, and liabilities are translated into U.S. dollars at the exchange rates at period end. Purchases and sales of investment securities, income and dividends received and expenses denominated in foreign currencies are translated into U.S. dollars at the exchange rate in effect on the transaction date.
The effects of exchange rate fluctuations on investments are included with the net realized and unrealized gain (loss) on investment securities. Other foreign currency transactions resulting in realized and unrealized gain (loss) are disclosed separately.
Investment Transactions and Income. For financial reporting purposes, the Fund's investment holdings and NAV include trades executed through the end of the last business day of the period. The NAV per share for processing shareholder transactions is calculated as of the close of business of the New York Stock Exchange (NYSE), normally 4:00 p.m. Eastern time and includes trades executed through the end of the prior business day. Gains and losses on securities sold are determined on the basis of identified cost. Dividend income is recorded on the ex-dividend date, except for certain dividends from foreign securities where the ex-dividend date may have passed, which are recorded as soon as the Fund is informed of the ex-dividend date. Non-cash dividends included in dividend income, if any, are recorded at the fair market value of the securities received. Income and capital gain distributions from Fidelity Central Funds, if any, are recorded on the ex-dividend date. Distributions received on securities that represent a return of capital or capital gain are recorded as a reduction of cost of investments and/or as a realized gain. Subsequent to ex-dividend date the Fund determines the components of these distributions, based upon receipt of tax filings or other correspondence relating to the underlying investment. Interest income is accrued as earned and includes coupon interest and amortization of premium and accretion of discount on debt securities as applicable. Investment income is recorded net of foreign taxes withheld where recovery of such taxes is uncertain.
Class Allocations and Expenses. Investment income, realized and unrealized capital gains and losses, common expenses of the Fund, and certain fund-level expense reductions, if any, are allocated daily on a pro-rata basis to each class based on the relative net assets of each class to the total net assets of the Fund. Each class differs with respect to transfer agent and distribution and service plan fees incurred. Certain expense reductions may also differ by class. For the reporting period, the allocated portion of income and expenses to each class as a percent of its average net assets may vary due to the timing of recording these transactions in relation to fluctuating net assets of the classes. Expenses directly attributable to a fund are charged to that fund. Expenses attributable to more than one fund are allocated among the respective funds on the basis of relative net assets or other appropriate methods. Expense estimates are accrued in the period to which they relate and adjustments are made when actual amounts are known.
Income Tax Information and Distributions to Shareholders. Each year, the Fund intends to qualify as a regulated investment company under Subchapter M of the Internal Revenue Code, including distributing substantially all of its taxable income and realized gains. As a result, no provision for U.S. Federal income taxes is required. The Fund files a U.S. federal tax return, in addition to state and local tax returns as required. The Fund's federal income tax returns are subject to examination by the Internal Revenue Service (IRS) for a period of three fiscal years after they are filed. State and local tax returns may be subject to examination for an additional fiscal year depending on the jurisdiction. Foreign taxes are provided for based on the Fund's understanding of the tax rules and rates that exist in the foreign markets in which it invests.
Distributions are declared and recorded on the ex-dividend date. Income dividends and capital gain distributions are declared separately for each class. Income and capital gain distributions are determined in accordance with income tax regulations, which may differ from GAAP.
Capital accounts within the financial statements are adjusted for permanent book-tax differences. These adjustments have no impact on net assets or the results of operations. Capital accounts are not adjusted for temporary book-tax differences which will reverse in a subsequent period.
Book-tax differences are primarily due to foreign currency transactions, passive foreign investment companies (PFIC), capital loss carryforwards, deferred trustees compensation and losses deferred due to wash sales.
The federal tax cost of investment securities and unrealized appreciation (depreciation) as of period end were as follows:
| Gross unrealized appreciation | $108,291,244 |
| Gross unrealized depreciation | (19,001,999) |
| Net unrealized appreciation (depreciation) on securities | $89,289,245 |
| Tax cost | $441,365,948 |
Capital loss carryforwards are only available to offset future capital gains of the Fund to the extent provided by regulations and may be limited. Under the Regulated Investment Company Modernization Act of 2010 (the Act), the Fund is permitted to carry forward capital losses incurred in taxable years beginning after December 22, 2010 for an unlimited period and such capital losses are required to be used prior to any losses that expire. The capital loss carryforward information presented below, including any applicable limitation, is estimated as of prior fiscal period end and is subject to adjustment.
| No expiration | |
| Short-term | $(34,655,095) |
| Long-term | (50,107,400) |
| Total capital loss carryforward | $(84,762,495) |
Short-Term Trading (Redemption) Fees. Shares held by investors in the Fund less than 90 days may have been subject to a redemption fee equal to 1.50% of the NAV of shares redeemed. All redemption fees, which reduce the proceeds of the shareholder redemption, are retained by the Fund and accounted for as an addition to paid in capital.
4. Purchases and Sales of Investments.
Purchases and sales of securities, other than short-term securities, aggregated $384,349,836 and $399,551,878, respectively.
5. Fees and Other Transactions with Affiliates.
Management Fee. Fidelity Management & Research Company (the investment adviser) and its affiliates provide the Fund with investment management related services for which the Fund pays a monthly management fee. The management fee is the sum of an individual fund fee rate that is based on an annual rate of .45% of the Fund's average net assets and an annualized group fee rate that averaged .25% during the period. The group fee rate is based upon the average net assets of all the mutual funds advised by the investment adviser, including any mutual funds previously advised by the investment adviser that are currently advised by Fidelity SelectCo, LLC, an affiliate of the investment adviser. The group fee rate decreases as assets under management increase and increases as assets under management decrease. For the reporting period, the total annualized management fee rate was .70% of the Fund's average net assets.
Distribution and Service Plan Fees. In accordance with Rule 12b-1 of the 1940 Act, the Fund has adopted separate Distribution and Service Plans for each class of shares. Certain classes pay Fidelity Distributors Corporation (FDC), an affiliate of the investment adviser, separate Distribution and Service Fees, each of which is based on an annual percentage of each class' average net assets. In addition, FDC may pay financial intermediaries for selling shares of the Fund and providing shareholder support services. For the period, the Distribution and Service Fee rates, total fees and amounts retained by FDC were as follows:
| Distribution Fee | Service Fee | Total Fees | Retained by FDC | |
| Class A | -% | .25% | $17,807 | $– |
| Class T | .25% | .25% | 12,316 | – |
| Class B | .75% | .25% | 2,397 | 1,798 |
| Class C | .75% | .25% | 23,936 | 1,863 |
| $56,456 | $3,661 |
Sales Load. FDC may receive a front-end sales charge of up to 5.75% for selling Class A shares and 3.50% for selling Class T shares, some of which is paid to financial intermediaries for selling shares of the Fund. Depending on the holding period, FDC may receive contingent deferred sales charges levied on Class A, Class T, Class B, and Class C redemptions. The deferred sales charges range from 5.00% to 1.00% for Class B shares, 1.00% for Class C shares, 1.00% for certain purchases of Class A shares and .25% for certain purchases of Class T shares.
For the period, sales charge amounts retained by FDC were as follows:
| Retained by FDC | |
| Class A | $2,586 |
| Class T | 808 |
| Class B(a) | 36 |
| Class C(a) | 385 |
| $3,815 |
(a) When Class B and Class C shares are initially sold, FDC pays commissions from its own resources to financial intermediaries through which the sales are made.
Transfer Agent Fees. Fidelity Investments Institutional Operations Company, Inc., (FIIOC), an affiliate of the investment adviser, is the transfer, dividend disbursing and shareholder servicing agent for each class of the Fund. FIIOC receives account fees and asset-based fees that vary according to the account size and type of account of the shareholders of the respective classes of the Fund. FIIOC pays for typesetting, printing and mailing of shareholder reports, except proxy statements.
For the period, transfer agent fees for each class were as follows:
| Amount | % of Class-Level Average Net Assets(a) | |
| Class A | $21,549 | .30 |
| Class T | 8,453 | .34 |
| Class B | 721 | .30 |
| Class C | 7,142 | .30 |
| Latin America | 654,143 | .30 |
| Class I | 3,190 | .25 |
| $695,198 |
(a) Annualized
Accounting and Security Lending Fees. Fidelity Service Company, Inc. (FSC), an affiliate of the investment adviser, maintains the Fund's accounting records. The accounting fee is based on the level of average net assets for each month. Under a separate contract, FSC administers the security lending program. The security lending fee is based on the number and duration of lending transactions.
Brokerage Commissions. The Fund placed a portion of its portfolio transactions with brokerage firms which are affiliates of the investment adviser. Brokerage commissions are included in net realized gain (loss) and change in net unrealized appreciation (depreciation) in the Statement of Operations. The commissions paid to these affiliated firms were $6,916 for the period.
Interfund Lending Program. Pursuant to an Exemptive Order issued by the SEC, the Fund, along with other registered investment companies having management contracts with FMR or other affiliated entities of FMR, may participate in an interfund lending program. This program provides an alternative credit facility allowing the funds to borrow from, or lend money to, other participating affiliated funds. At period end, there were no interfund loans outstanding. The Fund's activity in this program during the period for which loans were outstanding was as follows:
| Borrower or Lender | Average Loan Balance | Weighted Average Interest Rate | Interest Expense |
| Borrower | $7,287,286 | .62% | $882 |
Interfund Trades. The Fund may purchase from or sell securities to other Fidelity Funds under procedures adopted by the Board. The procedures have been designed to ensure these interfund trades are executed in accordance with Rule 17a-7 of the 1940 Act. Interfund trades are included within the respective purchases and sales amounts shown in the Purchases and Sales of Investments note.
6. Committed Line of Credit.
The Fund participates with other funds managed by the investment adviser or an affiliate in a $4.25 billion credit facility (the "line of credit") to be utilized for temporary or emergency purposes to fund shareholder redemptions or for other short-term liquidity purposes. The Fund has agreed to pay commitment fees on its pro-rata portion of the line of credit, which amounted to $400 and is reflected in Miscellaneous expenses on the Statement of Operations. During the period, the Fund did not borrow on this line of credit.
7. Security Lending.
The Fund lends portfolio securities through a lending agent from time to time in order to earn additional income. For equity securities, a lending agent is used and may loan securities to certain qualified borrowers, including Fidelity Capital Markets (FCM), a broker-dealer affiliated with the Fund. On the settlement date of the loan, the Fund receives collateral (in the form of U.S. Treasury obligations, letters of credit and/or cash) against the loaned securities and maintains collateral in an amount not less than 100% of the market value of the loaned securities during the period of the loan. The market value of the loaned securities is determined at the close of business of the Fund and any additional required collateral is delivered to the Fund on the next business day. The Fund or borrower may terminate the loan at any time, and if the borrower defaults on its obligation to return the securities loaned because of insolvency or other reasons, the Fund may apply collateral received from the borrower against the obligation. The Fund may experience delays and costs in recovering the securities loaned. Any cash collateral received is invested in the Fidelity Securities Lending Cash Central Fund. The value of loaned securities and cash collateral at period end are disclosed on the Fund's Statement of Assets and Liabilities. At period end, there were no security loans outstanding with FCM. Security lending income represents the income earned on investing cash collateral, less rebates paid to borrowers and any lending agent fees associated with the loan, plus any premium payments received for lending certain types of securities. Security lending income is presented in the Statement of Operations as a component of income from Fidelity Central Funds. Total security lending income during the period amounted to $13,739, including $185 from securities loaned to FCM.
8. Expense Reductions.
Commissions paid to certain brokers with whom the investment adviser, or its affiliates, places trades on behalf of the Fund include an amount in addition to trade execution, which may be rebated back to the Fund to offset certain expenses. This amount totaled $5,446 for the period.
In addition, during the period the investment adviser reimbursed and/or waived a portion of fund-level operating expenses in the amount of $1,682.
9. Distributions to Shareholders.
Distributions to shareholders of each class were as follows:
| Six months ended April 30, 2016 | Year ended October 31, 2015 | |
| From net investment income | ||
| Class A | $264,922 | $341,444 |
| Class T | 74,433 | 71,167 |
| Class B | 1,059 | – |
| Class C | 37,419 | 18,114 |
| Latin America | 9,833,214 | 12,109,807 |
| Class I | 52,956 | 52,230 |
| Total | $10,264,003 | $12,592,762 |
| From net realized gain | ||
| Class A | $– | $2,330,553 |
| Class T | – | 658,521 |
| Class B | – | 144,042 |
| Class C | – | 754,025 |
| Latin America | – | 62,251,897 |
| Class I | – | 256,268 |
| Total | $– | $66,395,306 |
10. Share Transactions.
Share transactions for each class were as follows and may contain automatic conversions between classes or exchanges between affiliated funds:
| Shares | Shares | Dollars | Dollars | |
| Six months ended April 30, 2016 | Year ended October 31, 2015 | Six months ended April 30, 2016 | Year ended October 31, 2015 | |
| Class A | ||||
| Shares sold | 66,880 | 218,330 | $1,163,572 | $4,910,163 |
| Reinvestment of distributions | 14,810 | 103,775 | 256,538 | 2,587,573 |
| Shares redeemed | (160,323) | (565,352) | (2,718,955) | (12,518,797) |
| Net increase (decrease) | (78,633) | (243,247) | $(1,298,845) | $(5,021,061) |
| Class T | ||||
| Shares sold | 31,261 | 29,946 | $528,543 | $658,518 |
| Reinvestment of distributions | 4,243 | 28,508 | 73,689 | 713,357 |
| Shares redeemed | (29,741) | (88,493) | (509,091) | (1,990,592) |
| Net increase (decrease) | 5,763 | (30,039) | $93,141 | $(618,717) |
| Class B | ||||
| Shares sold | 1 | 116 | $10 | $2,989 |
| Reinvestment of distributions | 59 | 5,261 | 1,009 | 133,376 |
| Shares redeemed | (12,894) | (43,584) | (221,180) | (982,322) |
| Net increase (decrease) | (12,834) | (38,207) | $(220,161) | $(845,957) |
| Class C | ||||
| Shares sold | 46,774 | 48,350 | $817,698 | $1,099,271 |
| Reinvestment of distributions | 1,720 | 25,875 | 30,044 | 652,617 |
| Shares redeemed | (48,571) | (151,109) | (821,023) | (3,411,105) |
| Net increase (decrease) | (77) | (76,884) | $26,719 | $(1,659,217) |
| Latin America | ||||
| Shares sold | 2,247,110 | 2,736,036 | $38,271,000 | $60,647,605 |
| Reinvestment of distributions | 545,601 | 2,862,287 | 9,420,593 | 71,197,829 |
| Shares redeemed | (3,343,417) | (9,758,242) | (56,149,551) | (221,025,945) |
| Net increase (decrease) | (550,706) | (4,159,919) | $(8,457,958) | $(89,180,511) |
| Class I | ||||
| Shares sold | 98,480 | 41,136 | $1,665,317 | $906,993 |
| Reinvestment of distributions | 2,787 | 11,139 | 48,070 | 276,862 |
| Shares redeemed | (37,940) | (100,491) | (626,066) | (2,361,992) |
| Net increase (decrease) | 63,327 | (48,216) | $1,087,321 | $(1,178,137) |
11. Other.
The Fund's organizational documents provide former and current trustees and officers with a limited indemnification against liabilities arising in connection with the performance of their duties to the Fund. In the normal course of business, the Fund may also enter into contracts that provide general indemnifications. The Fund's maximum exposure under these arrangements is unknown as this would be dependent on future claims that may be made against the Fund. The risk of material loss from such claims is considered remote.
Fidelity® Nordic Fund
Investment Summary (Unaudited)
Geographic Diversification (% of fund's net assets)
| As of April 30, 2016 | ||
| Sweden | 48.1% | |
| Denmark | 22.6% | |
| Finland | 11.8% | |
| Malta | 8.4% | |
| Norway | 4.1% | |
| United States of America* | 3.7% | |
| Bermuda | 1.3% | |

* Includes Short-Term investments and Net Other Assets (Liabilities).
Percentages are based on country or territory of incorporation and are adjusted for the effect of futures contracts, if applicable.
| As of October 31, 2015 | ||
| Sweden | 50.1% | |
| Denmark | 22.6% | |
| Finland | 15.2% | |
| Malta | 6.9% | |
| Norway | 2.7% | |
| Bermuda | 1.4% | |
| United States of America* | 1.1% | |

* Includes Short-Term investments and Net Other Assets (Liabilities).
Percentages are based on country or territory of incorporation and are adjusted for the effect of futures contracts, if applicable.
Asset Allocation as of April 30, 2016
| % of fund's net assets | % of fund's net assets 6 months ago | |
| Stocks | 96.3 | 98.9 |
| Short-Term Investments and Net Other Assets (Liabilities) | 3.7 | 1.1 |
Top Ten Stocks as of April 30, 2016
| % of fund's net assets | % of fund's net assets 6 months ago | |
| H&M Hennes & Mauritz AB (B Shares) (Sweden, Specialty Retail) | 6.3 | 4.1 |
| Novo Nordisk A/S Series B (Denmark, Pharmaceuticals) | 6.0 | 6.5 |
| Carlsberg A/S Series B (Denmark, Beverages) | 5.2 | 4.9 |
| Svenska Cellulosa AB (SCA) (B Shares) (Sweden, Household Products) | 5.1 | 5.6 |
| Kambi Group PLC (Malta, Hotels, Restaurants & Leisure) | 4.9 | 2.3 |
| Eltel AB (Sweden, Construction & Engineering) | 4.0 | 3.5 |
| Unibet Group PLC unit (Malta, Hotels, Restaurants & Leisure) | 3.5 | 4.6 |
| Getinge AB (B Shares) (Sweden, Health Care Equipment & Supplies) | 3.4 | 4.2 |
| Bravida AB (Sweden, Commercial Services & Supplies) | 3.2 | 2.5 |
| Svenska Handelsbanken AB (A Shares) (Sweden, Banks) | 3.1 | 2.9 |
| 44.7 |
Market Sectors as of April 30, 2016
| % of fund's net assets | % of fund's net assets 6 months ago | |
| Consumer Discretionary | 22.9 | 19.8 |
| Industrials | 22.0 | 25.0 |
| Financials | 15.4 | 17.0 |
| Health Care | 15.3 | 17.4 |
| Consumer Staples | 13.4 | 13.8 |
| Information Technology | 4.8 | 1.7 |
| Materials | 1.7 | 4.2 |
| Energy | 0.8 | 0.0 |
Market Sectors may include more than one industry category.
The Fund may invest up to 35% of its total assets in any industry that represents more than 20% of the Nordic market. As of April 30, 2016, the Fund did not have more than 25% of its total assets invested in any one industry.
Percentages shown as 0.0% may reflect amounts less than 0.05%.
Fidelity® Nordic Fund
Investments April 30, 2016 (Unaudited)
Showing Percentage of Net Assets
| Common Stocks - 96.3% | |||
| Shares | Value | ||
| Bermuda - 1.3% | |||
| Vostok Emerging Finance Ltd. (depository receipt) (a) | 9,489,995 | $1,276,291 | |
| Vostok New Ventures Ltd. SDR (a) | 919,054 | 5,230,189 | |
| TOTAL BERMUDA | 6,506,480 | ||
| Denmark - 22.6% | |||
| Alm. Brand A/S | 1,265,654 | 9,405,217 | |
| Carlsberg A/S Series B | 254,900 | 24,824,484 | |
| DSV de Sammensluttede Vognmaend A/S | 312,400 | 13,145,437 | |
| Jyske Bank A/S (Reg.) | 49,100 | 2,010,171 | |
| NNIT A/S | 138,748 | 3,778,389 | |
| Novo Nordisk A/S Series B | 513,005 | 28,643,324 | |
| Novozymes A/S Series B | 175,700 | 8,420,473 | |
| Scandinavian Tobacco Group A/S | 445,507 | 7,087,315 | |
| William Demant Holding A/S (a) | 106,400 | 10,935,151 | |
| TOTAL DENMARK | 108,249,961 | ||
| Finland - 11.8% | |||
| Amer Group PLC (A Shares) | 345,900 | 10,226,600 | |
| Cramo Oyj (B Shares) | 455,600 | 9,113,833 | |
| Olvi PLC (A Shares) | 309,546 | 8,598,851 | |
| Raisio Group PLC (V Shares) | 1,303,500 | 6,418,063 | |
| Vaisala Oyj | 331,500 | 9,436,460 | |
| Valmet Corp. | 1,023,285 | 12,830,252 | |
| TOTAL FINLAND | 56,624,059 | ||
| Malta - 8.4% | |||
| Kambi Group PLC (a)(b) | 1,373,411 | 23,687,019 | |
| Unibet Group PLC unit | 1,470,698 | 16,592,500 | |
| TOTAL MALTA | 40,279,519 | ||
| Norway - 4.1% | |||
| Schibsted ASA (B Shares) | 291,854 | 8,296,898 | |
| TGS Nopec Geophysical Co. ASA | 229,498 | 3,839,289 | |
| Zalaris ASA (A Shares) (c) | 1,912,400 | 7,600,340 | |
| TOTAL NORWAY | 19,736,527 | ||
| Sweden - 48.1% | |||
| Addlife AB (a)(b) | 212,912 | 2,691,078 | |
| AddTech AB (B Shares) | 667,000 | 8,388,945 | |
| Bravida AB | 2,264,900 | 15,300,615 | |
| Coor Service Management Holding AB | 711,900 | 3,368,703 | |
| Dustin Group AB (b) | 837,188 | 6,124,787 | |
| East Capital Explorer AB | 1,420,992 | 10,793,979 | |
| Elekta AB (B Shares) (b) | 1,438,185 | 10,512,669 | |
| Eltel AB | 1,620,600 | 19,423,911 | |
| Getinge AB (B Shares) | 768,300 | 16,245,334 | |
| H&M Hennes & Mauritz AB (B Shares) | 848,651 | 30,171,394 | |
| Hemfosa Fastigheter AB (b) | 1,366,258 | 14,248,779 | |
| Hemfosa Fastigheter AB rights 5/10/16 (a)(b) | 1,293,658 | 467,173 | |
| Kungsleden AB | 767,100 | 5,277,696 | |
| Mekonomen AB (b) | 392,000 | 9,958,097 | |
| Nordea Bank AB | 306,935 | 2,979,358 | |
| Pandox AB | 271,300 | 4,604,747 | |
| Sandvik AB (b) | 1,030,500 | 10,573,903 | |
| Svenska Cellulosa AB (SCA) (B Shares) | 780,700 | 24,586,297 | |
| Svenska Handelsbanken AB (A Shares) | 1,125,700 | 15,017,010 | |
| Systemair AB (b) | 482,379 | 6,157,046 | |
| Telefonaktiebolaget LM Ericsson (B Shares) | 1,684,300 | 13,646,892 | |
| TOTAL SWEDEN | 230,538,413 | ||
| TOTAL COMMON STOCKS | |||
| (Cost $413,872,258) | 461,934,959 | ||
| Money Market Funds - 9.9% | |||
| Fidelity Cash Central Fund, 0.38% (d) | 18,873,165 | 18,873,165 | |
| Fidelity Securities Lending Cash Central Fund, 0.42% (d)(e) | 28,418,850 | 28,418,850 | |
| TOTAL MONEY MARKET FUNDS | |||
| (Cost $47,292,015) | 47,292,015 | ||
| TOTAL INVESTMENT PORTFOLIO - 106.2% | |||
| (Cost $461,164,273) | 509,226,974 | ||
| NET OTHER ASSETS (LIABILITIES) - (6.2)% | (29,689,287) | ||
| NET ASSETS - 100% | $479,537,687 |
Categorizations in the Schedule of Investments are based on country or territory of incorporation.
Legend
(a) Non-income producing
(b) Security or a portion of the security is on loan at period end.
(c) Affiliated company
(d) Affiliated fund that is generally available only to investment companies and other accounts managed by Fidelity Investments. The rate quoted is the annualized seven-day yield of the fund at period end. A complete unaudited listing of the fund's holdings as of its most recent quarter end is available upon request. In addition, each Fidelity Central Fund's financial statements are available on the SEC's website or upon request.
(e) Investment made with cash collateral received from securities on loan.
Affiliated Central Funds
Information regarding fiscal year to date income earned by the Fund from investments in Fidelity Central Funds is as follows:
| Fund | Income earned |
| Fidelity Cash Central Fund | $20,490 |
| Fidelity Securities Lending Cash Central Fund | 394,995 |
| Total | $415,485 |
Other Affiliated Issuers
An affiliated company is a company in which the Fund has ownership of at least 5% of the voting securities. Fiscal year to date transactions with companies which are or were affiliates are as follows:
| Affiliate | Value, beginning of period | Purchases | Sales Proceeds | Dividend Income | Value, end of period |
| Zalaris ASA (A Shares) | $7,941,931 | $347,140 | $-- | $-- | $7,600,340 |
| Total | $7,941,931 | $347,140 | $-- | $-- | $7,600,340 |
Investment Valuation
The following is a summary of the inputs used, as of April 30, 2016, involving the Fund's assets and liabilities carried at fair value. The inputs or methodology used for valuing securities may not be an indication of the risk associated with investing in those securities. For more information on valuation inputs, and their aggregation into the levels used below, please refer to the Investment Valuation section in the accompanying Notes to Financial Statements.
| Valuation Inputs at Reporting Date: | ||||
| Description | Total | Level 1 | Level 2 | Level 3 |
| Investments in Securities: | ||||
| Equities: | ||||
| Consumer Discretionary | $109,662,042 | $109,662,042 | $-- | $-- |
| Consumer Staples | 64,427,695 | 64,427,695 | -- | -- |
| Energy | 3,839,289 | 3,839,289 | -- | -- |
| Financials | 73,793,178 | 58,776,168 | 15,017,010 | -- |
| Health Care | 72,805,945 | 44,162,621 | 28,643,324 | -- |
| Industrials | 105,902,985 | 105,902,985 | -- | -- |
| Information Technology | 23,083,352 | 9,436,460 | 13,646,892 | -- |
| Materials | 8,420,473 | 8,420,473 | -- | -- |
| Money Market Funds | 47,292,015 | 47,292,015 | -- | -- |
| Total Investments in Securities: | $509,226,974 | $451,919,748 | $57,307,226 | $-- |
The following is a summary of transfers between Level 1 and Level 2 for the period ended April 30, 2016. Transfers are assumed to have occurred at the beginning of the period, and are primarily attributable to the valuation techniques used for foreign equity securities, as discussed in the accompanying Notes to Financial Statements:
| Transfers | Total |
| Level 1 to Level 2 | $0 |
| Level 2 to Level 1 | $22,585,312 |
See accompanying notes which are an integral part of the financial statements.
Fidelity® Nordic Fund
Financial Statements
Statement of Assets and Liabilities
| April 30, 2016 (Unaudited) | ||
| Assets | ||
| Investment in securities, at value (including securities loaned of $26,525,562) — See accompanying schedule: Unaffiliated issuers (cost $406,504,753) | $454,334,619 | |
| Fidelity Central Funds (cost $47,292,015) | 47,292,015 | |
| Other affiliated issuers (cost $7,367,505) | 7,600,340 | |
| Total Investments (cost $461,164,273) | $509,226,974 | |
| Cash | 249,873 | |
| Receivable for fund shares sold | 417,091 | |
| Dividends receivable | 758,658 | |
| Distributions receivable from Fidelity Central Funds | 145,625 | |
| Prepaid expenses | 451 | |
| Other receivables | 3,668 | |
| Total assets | 510,802,340 | |
| Liabilities | ||
| Payable for investments purchased | $672,132 | |
| Payable for fund shares redeemed | 1,764,532 | |
| Accrued management fee | 275,286 | |
| Other affiliated payables | 93,795 | |
| Other payables and accrued expenses | 40,058 | |
| Collateral on securities loaned, at value | 28,418,850 | |
| Total liabilities | 31,264,653 | |
| Net Assets | $479,537,687 | |
| Net Assets consist of: | ||
| Paid in capital | $451,224,244 | |
| Undistributed net investment income | 4,410,827 | |
| Accumulated undistributed net realized gain (loss) on investments and foreign currency transactions | (24,163,382) | |
| Net unrealized appreciation (depreciation) on investments and assets and liabilities in foreign currencies | 48,065,998 | |
| Net Assets, for 9,834,825 shares outstanding | $479,537,687 | |
| Net Asset Value, offering price and redemption price per share ($479,537,687 ÷ 9,834,825 shares) | $48.76 |
See accompanying notes which are an integral part of the financial statements.
Statement of Operations
| Six months ended April 30, 2016 (Unaudited) | ||
| Investment Income | ||
| Dividends | $7,206,373 | |
| Income from Fidelity Central Funds (including $394,995 from security lending) | 415,485 | |
| Income before foreign taxes withheld | 7,621,858 | |
| Less foreign taxes withheld | (1,084,011) | |
| Total income | 6,537,847 | |
| Expenses | ||
| Management fee | $1,492,823 | |
| Transfer agent fees | 423,106 | |
| Accounting and security lending fees | 112,596 | |
| Custodian fees and expenses | 24,733 | |
| Independent trustees' compensation | 905 | |
| Registration fees | 13,150 | |
| Audit | 58,071 | |
| Legal | 525 | |
| Miscellaneous | 1,234 | |
| Total expenses before reductions | 2,127,143 | |
| Expense reductions | (8,333) | 2,118,810 |
| Net investment income (loss) | 4,419,037 | |
| Realized and Unrealized Gain (Loss) | ||
| Net realized gain (loss) on: | ||
| Investment securities: | ||
| Unaffiliated issuers | 3,422,610 | |
| Foreign currency transactions | (19,355) | |
| Total net realized gain (loss) | 3,403,255 | |
| Change in net unrealized appreciation (depreciation) on: Investment securities | 33,457,589 | |
| Assets and liabilities in foreign currencies | 6,766 | |
| Total change in net unrealized appreciation (depreciation) | 33,464,355 | |
| Net gain (loss) | 36,867,610 | |
| Net increase (decrease) in net assets resulting from operations | $41,286,647 |
See accompanying notes which are an integral part of the financial statements.
Statement of Changes in Net Assets
| Six months ended April 30, 2016 (Unaudited) | Year ended October 31, 2015 | |
| Increase (Decrease) in Net Assets | ||
| Operations | ||
| Net investment income (loss) | $4,419,037 | $5,506,157 |
| Net realized gain (loss) | 3,403,255 | 120,453 |
| Change in net unrealized appreciation (depreciation) | 33,464,355 | 10,093,903 |
| Net increase (decrease) in net assets resulting from operations | 41,286,647 | 15,720,513 |
| Distributions to shareholders from net investment income | (5,087,442) | – |
| Distributions to shareholders from net realized gain | (468,224) | – |
| Total distributions | (5,555,666) | – |
| Share transactions | ||
| Proceeds from sales of shares | 67,711,802 | 67,283,706 |
| Reinvestment of distributions | 5,260,046 | – |
| Cost of shares redeemed | (34,905,787) | (164,909,842) |
| Net increase (decrease) in net assets resulting from share transactions | 38,066,061 | (97,626,136) |
| Redemption fees | 14,170 | 50,450 |
| Total increase (decrease) in net assets | 73,811,212 | (81,855,173) |
| Net Assets | ||
| Beginning of period | 405,726,475 | 487,581,648 |
| End of period (including undistributed net investment income of $4,410,827 and undistributed net investment income of $5,079,232, respectively) | $479,537,687 | $405,726,475 |
| Other Information | ||
| Shares | ||
| Sold | 1,462,871 | 1,529,284 |
| Issued in reinvestment of distributions | 111,940 | – |
| Redeemed | (758,154) | (3,755,142) |
| Net increase (decrease) | 816,657 | (2,225,858) |
See accompanying notes which are an integral part of the financial statements.
Financial Highlights — Fidelity Nordic Fund
| Six months ended (Unaudited) April 30, | Years ended October 31, | |||||
| 2016 | 2015 | 2014 | 2013 | 2012 | 2011 | |
| Selected Per–Share Data | ||||||
| Net asset value, beginning of period | $44.99 | $43.36 | $43.91 | $30.60 | $29.60 | $32.27 |
| Income from Investment Operations | ||||||
| Net investment income (loss)A | .47 | .56 | .71 | .90 | .70B | .47 |
| Net realized and unrealized gain (loss) | 3.92 | 1.06 | 1.35 | 13.04 | .91 | (2.86) |
| Total from investment operations | 4.39 | 1.62 | 2.06 | 13.94 | 1.61 | (2.39) |
| Distributions from net investment income | (.57) | – | (.83) | (.63) | (.61) | (.29) |
| Distributions from net realized gain | (.05) | – | (1.80) | – | – | – |
| Total distributions | (.62) | – | (2.63) | (.63) | (.61) | (.29) |
| Redemption fees added to paid in capitalA | –C | .01 | .02 | –C | –C | .01 |
| Net asset value, end of period | $48.76 | $44.99 | $43.36 | $43.91 | $30.60 | $29.60 |
| Total ReturnD,E | 9.80% | 3.76% | 4.88% | 46.42% | 5.69% | (7.49)% |
| Ratios to Average Net AssetsF,G | ||||||
| Expenses before reductions | .99%H | 1.00% | .99% | 1.04% | 1.08% | 1.05% |
| Expenses net of fee waivers, if any | .99%H | 1.00% | .99% | 1.04% | 1.08% | 1.05% |
| Expenses net of all reductions | .99%H | .99% | .98% | 1.02% | 1.04% | .99% |
| Net investment income (loss) | 2.07%H | 1.26% | 1.56% | 2.50% | 2.40%B | 1.40% |
| Supplemental Data | ||||||
| Net assets, end of period (000 omitted) | $479,538 | $405,726 | $487,582 | $439,147 | $296,951 | $360,900 |
| Portfolio turnover rateI | 30%H | 80% | 103% | 61% | 193% | 265% |
A Calculated based on average shares outstanding during the period.
B Net Investment income per share reflects a large, non-recurring dividend which amounted to $.17 per share. Excluding this non-recurring dividend, the ratio of net investment income (loss) to average net assets would have been 1.83%.
C Amount represents less than $.005 per share.
D Total returns for periods of less than one year are not annualized.
E Total returns would have been lower if certain expenses had not been reduced during the applicable periods shown.
F Fees and expenses of any underlying Fidelity Central Funds are not included in the Fund's expense ratio. The Fund indirectly bears its proportionate share of the expenses of any underlying Fidelity Central Funds.
G Expense ratios reflect operating expenses of the Fund. Expenses before reductions do not reflect amounts reimbursed by the investment adviser or reductions from brokerage service arrangements or reductions from other expense offset arrangements and do not represent the amount paid by the Fund during periods when reimbursements or reductions occur. Expenses net of fee waivers reflect expenses after reimbursement by the investment adviser but prior to reductions from brokerage service arrangements or other expense offset arrangements. Expenses net of all reductions represent the net expenses paid by the Fund.
H Annualized
I Amount does not include the portfolio activity of any underlying Fidelity Central Funds.
See accompanying notes which are an integral part of the financial statements.
Notes to Financial Statements (Unaudited)
For the period ended April 30, 2016
1. Organization.
Fidelity Nordic Fund (the Fund) is a fund of Fidelity Investment Trust (the Trust) and is authorized to issue an unlimited number of shares. Share transactions on the Statement of Changes in Net Assets may contain exchanges between affiliated funds. The Trust is registered under the Investment Company Act of 1940, as amended (the 1940 Act), as an open-end management investment company organized as a Massachusetts business trust.
2. Investments in Fidelity Central Funds.
The Fund invests in Fidelity Central Funds, which are open-end investment companies generally available only to other investment companies and accounts managed by the investment adviser and its affiliates. The Fund's Schedule of Investments lists each of the Fidelity Central Funds held as of period end, if any, as an investment of the Fund, but does not include the underlying holdings of each Fidelity Central Fund. As an Investing Fund, the Fund indirectly bears its proportionate share of the expenses of the underlying Fidelity Central Funds.
The Money Market Central Funds seek preservation of capital and current income and are managed by Fidelity Investments Money Management, Inc. (FIMM), an affiliate of the investment adviser. Annualized expenses of the Money Market Central Funds as of their most recent shareholder report date are less than .005%.
A complete unaudited list of holdings for each Fidelity Central Fund is available upon request or at the Securities and Exchange Commission (the SEC) website at www.sec.gov. In addition, the financial statements of the Fidelity Central Funds are available on the SEC website or upon request.
3. Significant Accounting Policies.
The financial statements have been prepared in conformity with accounting principles generally accepted in the United States of America (GAAP), which require management to make certain estimates and assumptions at the date of the financial statements. Actual results could differ from those estimates. Subsequent events, if any, through the date that the financial statements were issued have been evaluated in the preparation of the financial statements. The following summarizes the significant accounting policies of the Fund:
Investment Valuation. Investments are valued as of 4:00 p.m. Eastern time on the last calendar day of the period. The Board of Trustees (the Board) has delegated the day to day responsibility for the valuation of the Fund's investments to the Fidelity Management & Research Company (FMR) Fair Value Committee (the Committee). In accordance with valuation policies and procedures approved by the Board, the Fund attempts to obtain prices from one or more third party pricing vendors or brokers to value its investments. When current market prices, quotations or currency exchange rates are not readily available or reliable, investments will be fair valued in good faith by the Committee, in accordance with procedures adopted by the Board. Factors used in determining fair value vary by investment type and may include market or investment specific events. The frequency with which these procedures are used cannot be predicted and they may be utilized to a significant extent. The Committee oversees the Fund's valuation policies and procedures and reports to the Board on the Committee's activities and fair value determinations. The Board monitors the appropriateness of the procedures used in valuing the Fund's investments and ratifies the fair value determinations of the Committee.
The Fund categorizes the inputs to valuation techniques used to value its investments into a disclosure hierarchy consisting of three levels as shown below:
- Level 1 – quoted prices in active markets for identical investments
- Level 2 – other significant observable inputs (including quoted prices for similar investments, interest rates, prepayment speeds, etc.)
- Level 3 – unobservable inputs (including the Fund's own assumptions based on the best information available)
Valuation techniques used to value the Fund's investments by major category are as follows:
Equity securities, including restricted securities, for which market quotations are readily available, are valued at the last reported sale price or official closing price as reported by a third party pricing vendor on the primary market or exchange on which they are traded and are categorized as Level 1 in the hierarchy. In the event there were no sales during the day or closing prices are not available, securities are valued at the last quoted bid price or may be valued using the last available price and are generally categorized as Level 2 in the hierarchy. For foreign equity securities, when market or security specific events arise, comparisons to the valuation of American Depositary Receipts (ADRs), futures contracts, Exchange-Traded Funds (ETFs) and certain indexes as well as quoted prices for similar securities may be used and would be categorized as Level 2 in the hierarchy. Utilizing these techniques may result in transfers between Level 1 and Level 2. For equity securities, including restricted securities, where observable inputs are limited, assumptions about market activity and risk are used and these securities may be categorized as Level 3 in the hierarchy.
Investments in open-end mutual funds, including the Fidelity Central Funds, are valued at their closing net asset value (NAV) each business day and are categorized as Level 1 in the hierarchy.
Changes in valuation techniques may result in transfers in or out of an assigned level within the disclosure hierarchy. The aggregate value of investments by input level as of April 30, 2016, including information on transfers between Levels 1 and 2, is included at the end of the Fund's Schedule of Investments.
Foreign Currency. The Fund may use foreign currency contracts to facilitate transactions in foreign-denominated securities. Gains and losses from these transactions may arise from changes in the value of the foreign currency or if the counterparties do not perform under the contracts' terms.
Foreign-denominated assets, including investment securities, and liabilities are translated into U.S. dollars at the exchange rates at period end. Purchases and sales of investment securities, income and dividends received and expenses denominated in foreign currencies are translated into U.S. dollars at the exchange rate in effect on the transaction date.
The effects of exchange rate fluctuations on investments are included with the net realized and unrealized gain (loss) on investment securities. Other foreign currency transactions resulting in realized and unrealized gain (loss) are disclosed separately.
Investment Transactions and Income. For financial reporting purposes, the Fund's investment holdings and NAV include trades executed through the end of the last business day of the period. The NAV per share for processing shareholder transactions is calculated as of the close of business of the New York Stock Exchange (NYSE), normally 4:00 p.m. Eastern time and includes trades executed through the end of the prior business day. Gains and losses on securities sold are determined on the basis of identified cost. Dividend income is recorded on the ex-dividend date, except for certain dividends from foreign securities where the ex-dividend date may have passed, which are recorded as soon as the Fund is informed of the ex-dividend date. Non-cash dividends included in dividend income, if any, are recorded at the fair market value of the securities received. Income and capital gain distributions from Fidelity Central Funds, if any, are recorded on the ex-dividend date. Interest income is accrued as earned and includes coupon interest and amortization of premium and accretion of discount on debt securities as applicable. Investment income is recorded net of foreign taxes withheld where recovery of such taxes is uncertain.
Expenses. Expenses directly attributable to a fund are charged to that fund. Expenses attributable to more than one fund are allocated among the respective funds on the basis of relative net assets or other appropriate methods. Expense estimates are accrued in the period to which they relate and adjustments are made when actual amounts are known.
Income Tax Information and Distributions to Shareholders. Each year, the Fund intends to qualify as a regulated investment company under Subchapter M of the Internal Revenue Code, including distributing substantially all of its taxable income and realized gains. As a result, no provision for U.S. Federal income taxes is required. The Fund files a U.S. federal tax return, in addition to state and local tax returns as required. The Fund's federal income tax returns are subject to examination by the Internal Revenue Service (IRS) for a period of three fiscal years after they are filed. State and local tax returns may be subject to examination for an additional fiscal year depending on the jurisdiction. Foreign taxes are provided for based on the Fund's understanding of the tax rules and rates that exist in the foreign markets in which it invests.
Distributions are declared and recorded on the ex-dividend date. Income and capital gain distributions are determined in accordance with income tax regulations, which may differ from GAAP.
Capital accounts within the financial statements are adjusted for permanent book-tax differences. These adjustments have no impact on net assets or the results of operations. Capital accounts are not adjusted for temporary book-tax differences which will reverse in a subsequent period.
Book-tax differences are primarily due to foreign currency transactions, passive foreign investment companies (PFIC), deferred trustees compensation, capital loss carryforwards and losses deferred due to wash sales.
The federal tax cost of investment securities and unrealized appreciation (depreciation) as of period end were as follows:
| Gross unrealized appreciation | $67,317,159 |
| Gross unrealized depreciation | (22,095,947) |
| Net unrealized appreciation (depreciation) on securities | $45,221,212 |
| Tax cost | $464,005,762 |
Capital loss carryforwards are only available to offset future capital gains of the Fund to the extent provided by regulations and may be limited. Under the Regulated Investment Company Modernization Act of 2010 (the Act), the Fund is permitted to carry forward capital losses incurred in taxable years beginning after December 22, 2010 for an unlimited period and such capital losses are required to be used prior to any losses that expire. The capital loss carryforward information presented below, including any applicable limitation, is estimated as of prior fiscal period end and is subject to adjustment.
| Fiscal year of expiration | |
| 2017 | $(24,086,581) |
| No expiration | |
| Short-term | (287,934) |
| Total capital loss carryforward | $(24,374,515) |
Short-Term Trading (Redemption) Fees. Shares held by investors in the Fund less than 90 days may have been subject to a redemption fee equal to 1.50% of the NAV of shares redeemed. All redemption fees, which reduce the proceeds of the shareholder redemption, are retained by the Fund and accounted for as an addition to paid in capital.
4. Purchases and Sales of Investments.
Purchases and sales of securities, other than short-term securities, aggregated $86,267,876 and $62,517,835, respectively.
5. Fees and Other Transactions with Affiliates.
Management Fee. Fidelity Management & Research Company (the investment adviser) and its affiliates provide the Fund with investment management related services for which the Fund pays a monthly management fee. The management fee is the sum of an individual fund fee rate that is based on an annual rate of .45% of the Fund's average net assets and an annualized group fee rate that averaged .25% during the period. The group fee rate is based upon the average net assets of all the mutual funds advised by the investment adviser, including any mutual funds previously advised by the investment adviser that are currently advised by Fidelity SelectCo, LLC, an affiliate of the investment adviser. The group fee rate decreases as assets under management increase and increases as assets under management decrease. For the reporting period, the total annualized management fee rate was .70% of the Fund's average net assets.
Transfer Agent Fees. Fidelity Investments Institutional Operations Company, Inc. (FIIOC), an affiliate of the investment adviser, is the Fund's transfer, dividend disbursing and shareholder servicing agent. FIIOC receives account fees and asset-based fees that vary according to account size and type of account. FIIOC pays for typesetting, printing and mailing of shareholder reports, except proxy statements. For the period, the transfer agent fees were equivalent to an annualized rate of .20% of average net assets.
Accounting and Security Lending Fees. Fidelity Service Company, Inc. (FSC), an affiliate of the investment adviser, maintains the Fund's accounting records. The accounting fee is based on the level of average net assets for each month. Under a separate contract, FSC administers the security lending program. The security lending fee is based on the number and duration of lending transactions.
Interfund Trades. The Fund may purchase from or sell securities to other Fidelity Funds under procedures adopted by the Board. The procedures have been designed to ensure these interfund trades are executed in accordance with Rule 17a-7 of the 1940 Act. Interfund trades are included within the respective purchases and sales amounts shown in the Purchases and Sales of Investments note.
6. Committed Line of Credit.
The Fund participates with other funds managed by the investment adviser or an affiliate in a $4.25 billion credit facility (the "line of credit") to be utilized for temporary or emergency purposes to fund shareholder redemptions or for other short-term liquidity purposes. The Fund has agreed to pay commitment fees on its pro-rata portion of the line of credit, which amounted to $366 and is reflected in Miscellaneous expenses on the Statement of Operations. During the period, the Fund did not borrow on this line of credit.
7. Security Lending.
The Fund lends portfolio securities through a lending agent from time to time in order to earn additional income. For equity securities, a lending agent is used and may loan securities to certain qualified borrowers, including Fidelity Capital Markets (FCM), a broker-dealer affiliated with the Fund. On the settlement date of the loan, the Fund receives collateral (in the form of U.S. Treasury obligations, letters of credit and/or cash) against the loaned securities and maintains collateral in an amount not less than 100% of the market value of the loaned securities during the period of the loan. The market value of the loaned securities is determined at the close of business of the Fund and any additional required collateral is delivered to the Fund on the next business day. The Fund or borrower may terminate the loan at any time, and if the borrower defaults on its obligation to return the securities loaned because of insolvency or other reasons, the Fund may apply collateral received from the borrower against the obligation. The Fund may experience delays and costs in recovering the securities loaned. Any cash collateral received is invested in the Fidelity Securities Lending Cash Central Fund. The value of loaned securities and cash collateral at period end are disclosed on the Fund's Statement of Assets and Liabilities. Security lending income represents the income earned on investing cash collateral, less rebates paid to borrowers and any lending agent fees associated with the loan, plus any premium payments received for lending certain types of securities. Security lending income is presented in the Statement of Operations as a component of income from Fidelity Central Funds, and includes $1 from securities loaned to FCM.
8. Expense Reductions.
Commissions paid to certain brokers with whom the investment adviser, or its affiliates, places trades on behalf of the Fund include an amount in addition to trade execution, which may be rebated back to the Fund to offset certain expenses. This amount totaled $6,792 for the period. In addition, through arrangements with the Fund's custodian, credits realized as a result of certain uninvested cash balances were used to reduce the Fund's expenses. During the period, these credits reduced the Fund's custody expenses by $27.
In addition, during the period the investment adviser reimbursed and/or waived a portion of operating expenses in the amount of $1,514.
9. Other.
The Fund's organizational documents provide former and current trustees and officers with a limited indemnification against liabilities arising in connection with the performance of their duties to the Fund. In the normal course of business, the Fund may also enter into contracts that provide general indemnifications. The Fund's maximum exposure under these arrangements is unknown as this would be dependent on future claims that may be made against the Fund. The risk of material loss from such claims is considered remote.
Fidelity® Pacific Basin Fund
Investment Summary (Unaudited)
Geographic Diversification (% of fund's net assets)
| As of April 30, 2016 | ||
| Japan | 36.6% | |
| Australia | 13.9% | |
| Taiwan | 7.7% | |
| Hong Kong | 6.0% | |
| India | 5.8% | |
| Bermuda | 4.8% | |
| China | 4.3% | |
| United States of America* | 3.7% | |
| Indonesia | 3.2% | |
| Other | 14.0% | |

* Includes Short-Term investments and Net Other Assets (Liabilities).
Percentages are based on country or territory of incorporation and are adjusted for the effect of futures contracts, if applicable.
| As of October 31, 2015 | ||
| Japan | 39.6% | |
| Australia | 12.3% | |
| India | 6.6% | |
| Taiwan | 5.6% | |
| Hong Kong | 4.7% | |
| China | 4.4% | |
| Bermuda | 4.3% | |
| Cayman Islands | 3.9% | |
| United States of America* | 3.6% | |
| Other | 15.0% | |

* Includes Short-Term investments and Net Other Assets (Liabilities).
Percentages are based on country or territory of incorporation and are adjusted for the effect of futures contracts, if applicable.
Asset Allocation as of April 30, 2016
| % of fund's net assets | % of fund's net assets 6 months ago | |
| Stocks | 98.8 | 98.8 |
| Short-Term Investments and Net Other Assets (Liabilities) | 1.2 | 1.2 |
Top Ten Stocks as of April 30, 2016
| % of fund's net assets | % of fund's net assets 6 months ago | |
| Taiwan Semiconductor Manufacturing Co. Ltd. (Taiwan, Semiconductors & Semiconductor Equipment) | 2.9 | 2.6 |
| Naspers Ltd. Class N (South Africa, Media) | 2.2 | 2.2 |
| AIA Group Ltd. (Hong Kong, Insurance) | 2.2 | 2.1 |
| Commonwealth Bank of Australia (Australia, Banks) | 2.1 | 2.0 |
| Astellas Pharma, Inc. (Japan, Pharmaceuticals) | 1.8 | 1.9 |
| Cheung Kong Infrastructure Holdings Ltd. (Bermuda, Electric Utilities) | 1.8 | 1.7 |
| KDDI Corp. (Japan, Wireless Telecommunication Services) | 1.8 | 1.4 |
| Kweichow Moutai Co. Ltd. (China, Beverages) | 1.6 | 1.4 |
| Ryman Healthcare Group Ltd. (New Zealand, Health Care Providers & Services) | 1.6 | 1.4 |
| SoftBank Corp. (Japan, Wireless Telecommunication Services) | 1.5 | 1.6 |
| 19.5 |
Market Sectors as of April 30, 2016
| % of fund's net assets | % of fund's net assets 6 months ago | |
| Financials | 22.2 | 22.9 |
| Consumer Discretionary | 16.5 | 17.5 |
| Health Care | 15.5 | 15.7 |
| Consumer Staples | 11.7 | 11.7 |
| Information Technology | 10.0 | 9.0 |
| Industrials | 9.8 | 9.4 |
| Telecommunication Services | 4.8 | 4.3 |
| Materials | 3.7 | 3.9 |
| Utilities | 2.4 | 2.4 |
| Energy | 2.2 | 2.0 |
Fidelity® Pacific Basin Fund
Investments April 30, 2016 (Unaudited)
Showing Percentage of Net Assets
| Common Stocks - 98.8% | |||
| Shares | Value | ||
| Australia - 13.9% | |||
| 1-Page Ltd. (a)(b) | 872,167 | $639,942 | |
| Aconex Ltd. (b) | 1,274,474 | 6,482,920 | |
| Amcor Ltd. (b) | 597,546 | 6,996,899 | |
| Ansell Ltd. (b) | 303,164 | 4,594,079 | |
| ARB Corp. Ltd. (a) | 243,082 | 2,979,418 | |
| Arena (REIT) unit | 2,192,142 | 3,225,249 | |
| Asaleo Care Ltd. | 3,476,847 | 5,207,933 | |
| Australia & New Zealand Banking Group Ltd. | 517,822 | 9,491,644 | |
| Commonwealth Bank of Australia | 240,378 | 13,504,980 | |
| CSL Ltd. | 106,723 | 8,535,024 | |
| Magellan Financial Group Ltd. | 251,802 | 4,116,339 | |
| NIB Holdings Ltd. | 1,403,041 | 4,864,618 | |
| realestate.com.au Ltd. | 123,597 | 4,785,308 | |
| Sydney Airport unit | 1,171,376 | 6,065,366 | |
| Woodside Petroleum Ltd. | 344,166 | 7,416,199 | |
| TOTAL AUSTRALIA | 88,905,918 | ||
| Bermuda - 4.8% | |||
| Brilliance China Automotive Holdings Ltd. | 2,248,000 | 2,217,305 | |
| Cheung Kong Infrastructure Holdings Ltd. | 1,211,000 | 11,428,708 | |
| Dairy Farm International Holdings Ltd. | 970,900 | 6,699,210 | |
| Hongkong Land Holdings Ltd. | 982,000 | 6,235,700 | |
| PAX Global Technology Ltd. | 4,667,000 | 4,019,317 | |
| TOTAL BERMUDA | 30,600,240 | ||
| Cayman Islands - 2.2% | |||
| Alibaba Group Holding Ltd. sponsored ADR (b) | 99,700 | 7,670,918 | |
| China High Precision Automation Group Ltd. (b) | 1,875,000 | 2 | |
| China Metal Recycling (Holdings) Ltd. (b) | 2,572,200 | 3 | |
| ENN Energy Holdings Ltd. | 778,000 | 3,794,803 | |
| International Housewares Retail Co. Ltd. | 17,378,000 | 2,840,259 | |
| TOTAL CAYMAN ISLANDS | 14,305,985 | ||
| China - 4.3% | |||
| Industrial & Commercial Bank of China Ltd. (H Shares) | 13,110,000 | 7,019,106 | |
| Jiangsu Hengrui Medicine Co. Ltd. | 1,021,496 | 7,365,317 | |
| Kweichow Moutai Co. Ltd. | 261,750 | 10,156,177 | |
| Weifu High-Technology Co. Ltd. (B Shares) | 1,382,213 | 2,922,339 | |
| TOTAL CHINA | 27,462,939 | ||
| Hong Kong - 6.0% | |||
| AIA Group Ltd. | 2,311,200 | 13,831,621 | |
| China Resources Beer Holdings Co. Ltd. | 1,538,000 | 3,379,617 | |
| Hang Seng Bank Ltd. | 394,400 | 7,150,691 | |
| Lenovo Group Ltd. | 3,310,000 | 2,618,514 | |
| Magnificent Hotel Investment L | 90,048,000 | 2,224,996 | |
| Techtronic Industries Co. Ltd. | 2,367,000 | 8,873,102 | |
| TOTAL HONG KONG | 38,078,541 | ||
| India - 5.8% | |||
| Asian Paints India Ltd. | 433,057 | 5,647,464 | |
| Bharti Infratel Ltd. | 1,673,826 | 9,448,195 | |
| Housing Development Finance Corp. Ltd. | 261,834 | 4,290,419 | |
| Page Industries Ltd. | 21,955 | 4,152,678 | |
| Petronet LNG Ltd. | 1,712,799 | 6,795,706 | |
| Sun Pharmaceutical Industries Ltd. | 569,005 | 6,949,647 | |
| TOTAL INDIA | 37,284,109 | ||
| Indonesia - 3.2% | |||
| PT Bank Central Asia Tbk | 8,610,900 | 8,520,795 | |
| PT Bank Rakyat Indonesia Tbk | 8,236,100 | 6,463,727 | |
| PT Gudang Garam Tbk | 1,017,700 | 5,343,928 | |
| TOTAL INDONESIA | 20,328,450 | ||
| Israel - 1.0% | |||
| Sarine Technologies Ltd. | 4,978,000 | 6,107,521 | |
| Japan - 36.6% | |||
| Arcland Service Co. Ltd. | 219,700 | 6,154,505 | |
| Asahi Group Holdings | 186,400 | 5,915,785 | |
| Astellas Pharma, Inc. | 876,300 | 11,814,797 | |
| Broadleaf Co. Ltd. | 146,951 | 1,452,179 | |
| Century Tokyo Leasing Corp. | 91,500 | 3,111,276 | |
| Create SD Holdings Co. Ltd. | 211,800 | 5,078,781 | |
| Daito Trust Construction Co. Ltd. | 57,400 | 8,118,212 | |
| Dentsu, Inc. | 91,900 | 4,669,348 | |
| East Japan Railway Co. | 78,300 | 6,888,527 | |
| Fuji Heavy Industries Ltd. (c) | 215,500 | 7,075,942 | |
| Harmonic Drive Systems, Inc. (a) | 115,100 | 2,578,194 | |
| Hoya Corp. | 209,400 | 8,018,821 | |
| Japan Tobacco, Inc. | 233,400 | 9,536,243 | |
| KDDI Corp. | 392,100 | 11,294,728 | |
| Keyence Corp. | 12,300 | 7,372,534 | |
| Misumi Group, Inc. | 300,900 | 4,155,362 | |
| Mitsubishi Pencil Co. Ltd. | 131,500 | 6,263,677 | |
| Mitsui Fudosan Co. Ltd. | 196,000 | 4,786,797 | |
| Nakanishi, Inc. | 138,400 | 4,535,971 | |
| NGK Spark Plug Co. Ltd. | 240,700 | 4,800,369 | |
| Nidec Corp. | 87,100 | 6,382,171 | |
| Nihon M&A Center, Inc. | 67,000 | 3,858,529 | |
| Nihon Parkerizing Co. Ltd. | 426,800 | 3,764,547 | |
| Nitori Holdings Co. Ltd. | 93,300 | 8,678,656 | |
| Open House Co. Ltd. (c) | 253,900 | 5,397,054 | |
| ORIX Corp. | 456,200 | 6,452,920 | |
| Pigeon Corp. | 123,500 | 3,243,809 | |
| ProNexus, Inc. | 276,400 | 2,795,250 | |
| Rakuten, Inc. | 432,400 | 4,700,778 | |
| Seven Bank Ltd. (c) | 1,743,900 | 7,410,194 | |
| SHIMANO, Inc. | 27,800 | 3,988,506 | |
| Shionogi & Co. Ltd. | 141,900 | 7,242,883 | |
| SK Kaken Co. Ltd. | 40,000 | 3,282,062 | |
| SoftBank Corp. | 181,300 | 9,748,592 | |
| Sosei Group Corp. (a) | 27,300 | 5,610,741 | |
| Start Today Co. Ltd. | 108,600 | 4,562,565 | |
| Sysmex Corp. | 99,000 | 6,191,392 | |
| The Suruga Bank Ltd. | 223,500 | 4,345,727 | |
| Toshiba Plant Systems & Services Corp. | 423,100 | 5,232,238 | |
| VT Holdings Co. Ltd. | 572,200 | 2,891,139 | |
| Welcia Holdings Co. Ltd. | 83,200 | 4,394,830 | |
| TOTAL JAPAN | 233,796,631 | ||
| Korea (South) - 2.9% | |||
| BGFretail Co. Ltd. | 30,209 | 4,904,422 | |
| KEPCO Plant Service & Engineering Co. Ltd. | 88,695 | 5,845,002 | |
| LG Household & Health Care Ltd. | 4,637 | 4,075,727 | |
| Medy-Tox, Inc. | 10,750 | 3,969,058 | |
| TOTAL KOREA (SOUTH) | 18,794,209 | ||
| Malaysia - 0.4% | |||
| Bursa Malaysia Bhd | 1,145,100 | 2,465,197 | |
| Netherlands - 0.4% | |||
| Hangzhou Hikvision Digital Technology Co. Ltd. ELS (BNP Paribas Warrant Program) warrants 11/27/17 (b)(d) | 600,000 | 2,823,889 | |
| New Zealand - 2.6% | |||
| EBOS Group Ltd. | 580,263 | 6,466,491 | |
| Ryman Healthcare Group Ltd. | 1,574,341 | 9,816,603 | |
| TOTAL NEW ZEALAND | 16,283,094 | ||
| Philippines - 1.3% | |||
| Bank of the Philippine Islands (BPI) | 2,286,080 | 4,398,644 | |
| D&L Industries, Inc. | 20,046,200 | 3,835,778 | |
| TOTAL PHILIPPINES | 8,234,422 | ||
| South Africa - 2.2% | |||
| Naspers Ltd. Class N | 101,400 | 13,913,104 | |
| Taiwan - 7.7% | |||
| Advantech Co. Ltd. | 743,000 | 5,244,219 | |
| CTCI Corp. | 3,183,000 | 4,143,428 | |
| ECLAT Textile Co. Ltd. | 418,000 | 4,768,381 | |
| eMemory Technology, Inc. | 205,000 | 2,246,541 | |
| King Slide Works Co. Ltd. | 511,000 | 6,050,754 | |
| Lung Yen Life Service Co. Ltd. | 951,000 | 1,604,479 | |
| Merida Industry Co. Ltd. | 674,750 | 2,767,680 | |
| Nien Made Enterprise Co. Ltd. | 517,000 | 4,065,195 | |
| Taiwan Semiconductor Manufacturing Co. Ltd. | 4,007,000 | 18,381,145 | |
| TOTAL TAIWAN | 49,271,822 | ||
| Thailand - 1.0% | |||
| Thai Beverage PCL | 11,431,700 | 6,332,763 | |
| United States of America - 2.5% | |||
| China Biologic Products, Inc. (b) | 34,400 | 4,024,800 | |
| Cognizant Technology Solutions Corp. Class A (b) | 130,200 | 7,599,774 | |
| GI Dynamics, Inc. CDI (b) | 5,561,290 | 67,656 | |
| ResMed, Inc. CDI | 776,185 | 4,402,685 | |
| TOTAL UNITED STATES OF AMERICA | 16,094,915 | ||
| TOTAL COMMON STOCKS | |||
| (Cost $557,599,382) | 631,083,749 | ||
| Money Market Funds - 1.6% | |||
| Fidelity Cash Central Fund, 0.38% (e) | 1,886,867 | 1,886,867 | |
| Fidelity Securities Lending Cash Central Fund, 0.42% (e)(f) | 8,037,345 | 8,037,345 | |
| TOTAL MONEY MARKET FUNDS | |||
| (Cost $9,924,212) | 9,924,212 | ||
| TOTAL INVESTMENT PORTFOLIO - 100.4% | |||
| (Cost $567,523,594) | 641,007,961 | ||
| NET OTHER ASSETS (LIABILITIES) - (0.4)% | (2,590,741) | ||
| NET ASSETS - 100% | $638,417,220 |
Security Type Abbreviations
ELS – Equity-Linked Security
Categorizations in the Schedule of Investments are based on country or territory of incorporation.
Legend
(a) Security or a portion of the security is on loan at period end.
(b) Non-income producing
(c) A portion of the security sold on a delayed delivery basis.
(d) Security exempt from registration under Rule 144A of the Securities Act of 1933. These securities may be resold in transactions exempt from registration, normally to qualified institutional buyers. At the end of the period, the value of these securities amounted to $2,823,889 or 0.4% of net assets.
(e) Affiliated fund that is generally available only to investment companies and other accounts managed by Fidelity Investments. The rate quoted is the annualized seven-day yield of the fund at period end. A complete unaudited listing of the fund's holdings as of its most recent quarter end is available upon request. In addition, each Fidelity Central Fund's financial statements are available on the SEC's website or upon request.
(f) Investment made with cash collateral received from securities on loan.
Affiliated Central Funds
Information regarding fiscal year to date income earned by the Fund from investments in Fidelity Central Funds is as follows:
| Fund | Income earned |
| Fidelity Cash Central Fund | $13,261 |
| Fidelity Securities Lending Cash Central Fund | 223,289 |
| Total | $236,550 |
Investment Valuation
The following is a summary of the inputs used, as of April 30, 2016, involving the Fund's assets and liabilities carried at fair value. The inputs or methodology used for valuing securities may not be an indication of the risk associated with investing in those securities. For more information on valuation inputs, and their aggregation into the levels used below, please refer to the Investment Valuation section in the accompanying Notes to Financial Statements.
| Valuation Inputs at Reporting Date: | ||||
| Description | Total | Level 1 | Level 2 | Level 3 |
| Investments in Securities: | ||||
| Equities: | ||||
| Consumer Discretionary | $105,636,052 | $41,958,582 | $63,677,470 | $-- |
| Consumer Staples | 74,269,225 | 42,720,160 | 31,549,065 | -- |
| Energy | 14,211,905 | 14,211,905 | -- | -- |
| Financials | 141,883,328 | 58,085,668 | 83,797,660 | -- |
| Health Care | 99,605,965 | 56,191,360 | 43,414,605 | -- |
| Industrials | 62,507,490 | 28,212,071 | 34,295,419 | -- |
| Information Technology | 63,728,005 | 29,884,314 | 33,843,689 | 2 |
| Materials | 23,526,753 | 16,480,141 | 7,046,609 | 3 |
| Telecommunication Services | 30,491,515 | 9,448,195 | 21,043,320 | -- |
| Utilities | 15,223,511 | -- | 15,223,511 | -- |
| Money Market Funds | 9,924,212 | 9,924,212 | -- | -- |
| Total Investments in Securities: | $641,007,961 | $307,116,608 | $333,891,348 | $5 |
The following is a summary of transfers between Level 1 and Level 2 for the period ended April 30, 2016. Transfers are assumed to have occurred at the beginning of the period, and are primarily attributable to the valuation techniques used for foreign equity securities, as discussed in the accompanying Notes to Financial Statements:
| Transfers | Total |
| Level 1 to Level 2 | $0 |
| Level 2 to Level 1 | $156,819,925 |
See accompanying notes which are an integral part of the financial statements.
Fidelity® Pacific Basin Fund
Financial Statements
Statement of Assets and Liabilities
| April 30, 2016 (Unaudited) | ||
| Assets | ||
| Investment in securities, at value (including securities loaned of $7,532,375) — See accompanying schedule: Unaffiliated issuers (cost $557,599,382) | $631,083,749 | |
| Fidelity Central Funds (cost $9,924,212) | 9,924,212 | |
| Total Investments (cost $567,523,594) | $641,007,961 | |
| Foreign currency held at value (cost $72) | 72 | |
| Receivable for investments sold | ||
| Regular delivery | 6,698,077 | |
| Delayed delivery | 1,227,129 | |
| Receivable for fund shares sold | 318,394 | |
| Dividends receivable | 1,931,630 | |
| Distributions receivable from Fidelity Central Funds | 33,232 | |
| Prepaid expenses | 520 | |
| Other receivables | 33,046 | |
| Total assets | 651,250,061 | |
| Liabilities | ||
| Payable for fund shares redeemed | $4,089,685 | |
| Accrued management fee | 490,771 | |
| Other affiliated payables | 126,615 | |
| Other payables and accrued expenses | 88,425 | |
| Collateral on securities loaned, at value | 8,037,345 | |
| Total liabilities | 12,832,841 | |
| Net Assets | $638,417,220 | |
| Net Assets consist of: | ||
| Paid in capital | $564,619,236 | |
| Undistributed net investment income | 98,134 | |
| Accumulated undistributed net realized gain (loss) on investments and foreign currency transactions | 165,942 | |
| Net unrealized appreciation (depreciation) on investments and assets and liabilities in foreign currencies | 73,533,908 | |
| Net Assets, for 24,021,343 shares outstanding | $638,417,220 | |
| Net Asset Value, offering price and redemption price per share ($638,417,220 ÷ 24,021,343 shares) | $26.58 |
See accompanying notes which are an integral part of the financial statements.
Statement of Operations
| Six months ended April 30, 2016 (Unaudited) | ||
| Investment Income | ||
| Dividends | $2,877,080 | |
| Special dividends | 2,425,068 | |
| Income from Fidelity Central Funds | 236,550 | |
| Income before foreign taxes withheld | 5,538,698 | |
| Less foreign taxes withheld | (354,574) | |
| Total income | 5,184,124 | |
| Expenses | ||
| Management fee | ||
| Basic fee | $2,212,386 | |
| Performance adjustment | 689,160 | |
| Transfer agent fees | 601,778 | |
| Accounting and security lending fees | 158,241 | |
| Custodian fees and expenses | 76,723 | |
| Independent trustees' compensation | 1,444 | |
| Registration fees | 19,011 | |
| Audit | 46,175 | |
| Legal | 1,183 | |
| Miscellaneous | 2,257 | |
| Total expenses before reductions | 3,808,358 | |
| Expense reductions | (7,534) | 3,800,824 |
| Net investment income (loss) | 1,383,300 | |
| Realized and Unrealized Gain (Loss) | ||
| Net realized gain (loss) on: | ||
| Investment securities: | ||
| Unaffiliated issuers | 6,558,415 | |
| Foreign currency transactions | 67,700 | |
| Total net realized gain (loss) | 6,626,115 | |
| Change in net unrealized appreciation (depreciation) on: Investment securities (net of decrease in deferred foreign taxes of $56,311) | 12,147,423 | |
| Assets and liabilities in foreign currencies | 50,621 | |
| Total change in net unrealized appreciation (depreciation) | 12,198,044 | |
| Net gain (loss) | 18,824,159 | |
| Net increase (decrease) in net assets resulting from operations | $20,207,459 |
See accompanying notes which are an integral part of the financial statements.
Statement of Changes in Net Assets
| Six months ended April 30, 2016 (Unaudited) | Year ended October 31, 2015 | |
| Increase (Decrease) in Net Assets | ||
| Operations | ||
| Net investment income (loss) | $1,383,300 | $9,343,644 |
| Net realized gain (loss) | 6,626,115 | 28,035,513 |
| Change in net unrealized appreciation (depreciation) | 12,198,044 | (45,966,498) |
| Net increase (decrease) in net assets resulting from operations | 20,207,459 | (8,587,341) |
| Distributions to shareholders from net investment income | (8,723,132) | (4,307,962) |
| Distributions to shareholders from net realized gain | (22,916,295) | (38,224,213) |
| Total distributions | (31,639,427) | (42,532,175) |
| Share transactions | ||
| Proceeds from sales of shares | 28,407,239 | 132,445,887 |
| Reinvestment of distributions | 30,030,140 | 40,866,947 |
| Cost of shares redeemed | (62,639,440) | (165,448,385) |
| Net increase (decrease) in net assets resulting from share transactions | (4,202,061) | 7,864,449 |
| Redemption fees | 18,989 | 85,778 |
| Total increase (decrease) in net assets | (15,615,040) | (43,169,289) |
| Net Assets | ||
| Beginning of period | 654,032,260 | 697,201,549 |
| End of period (including undistributed net investment income of $98,134 and undistributed net investment income of $7,437,966, respectively) | $638,417,220 | $654,032,260 |
| Other Information | ||
| Shares | ||
| Sold | 1,096,528 | 4,689,033 |
| Issued in reinvestment of distributions | 1,147,503 | 1,545,649 |
| Redeemed | (2,438,149) | (6,127,983) |
| Net increase (decrease) | (194,118) | 106,699 |
See accompanying notes which are an integral part of the financial statements.
Financial Highlights — Fidelity Pacific Basin Fund
| Six months ended (Unaudited) April 30, | Years ended October 31, | |||||
| 2016 | 2015 | 2014 | 2013 | 2012 | 2011 | |
| Selected Per–Share Data | ||||||
| Net asset value, beginning of period | $27.01 | $28.92 | $31.47 | $24.85 | $22.96 | $25.11 |
| Income from Investment Operations | ||||||
| Net investment income (loss)A | .06B | .37C | .31 | .12 | .30 | .21 |
| Net realized and unrealized gain (loss) | .82 | (.49) | 1.25 | 7.26 | 1.79 | (1.51) |
| Total from investment operations | .88 | (.12) | 1.56 | 7.38 | 2.09 | (1.30) |
| Distributions from net investment income | (.36) | (.18) | (.18) | (.29) | (.12) | (.20) |
| Distributions from net realized gain | (.95) | (1.61) | (3.93) | (.47) | (.08) | (.66) |
| Total distributions | (1.31) | (1.79) | (4.11) | (.76) | (.20) | (.86) |
| Redemption fees added to paid in capitalA | –D | –D | –D | –D | –D | .01 |
| Net asset value, end of period | $26.58 | $27.01 | $28.92 | $31.47 | $24.85 | $22.96 |
| Total ReturnE,F | 3.35% | (.29)% | 5.68% | 30.58% | 9.22% | (5.44)% |
| Ratios to Average Net AssetsG,H | ||||||
| Expenses before reductions | 1.20%I | 1.17% | 1.18% | 1.23% | 1.28% | 1.14% |
| Expenses net of fee waivers, if any | 1.20%I | 1.17% | 1.18% | 1.22% | 1.28% | 1.13% |
| Expenses net of all reductions | 1.20%I | 1.17% | 1.18% | 1.21% | 1.26% | 1.10% |
| Net investment income (loss) | .44%B,I | 1.34%C | 1.09% | .42% | 1.29% | .81% |
| Supplemental Data | ||||||
| Net assets, end of period (000 omitted) | $638,417 | $654,032 | $697,202 | $719,675 | $581,254 | $722,453 |
| Portfolio turnover rateJ | 30%I | 36% | 30% | 82% | 26% | 59% |
A Calculated based on average shares outstanding during the period.
B Net Investment income per share reflects a large, non-recurring dividend which amounted to $.10 per share. Excluding this non-recurring dividend, the ratio of net investment income (loss) to average net assets would have been (.33) %.
C Net Investment income per share reflects a large, non-recurring dividend which amounted to $.10 per share. Excluding this non-recurring dividend, the ratio of net investment income (loss) to average net assets would have been .99%.
D Amount represents less than $.005 per share.
E Total returns for periods of less than one year are not annualized.
F Total returns would have been lower if certain expenses had not been reduced during the applicable periods shown.
G Fees and expenses of any underlying Fidelity Central Funds are not included in the Fund's expense ratio. The Fund indirectly bears its proportionate share of the expenses of any underlying Fidelity Central Funds.
H Expense ratios reflect operating expenses of the Fund. Expenses before reductions do not reflect amounts reimbursed by the investment adviser or reductions from brokerage service arrangements or reductions from other expense offset arrangements and do not represent the amount paid by the Fund during periods when reimbursements or reductions occur. Expenses net of fee waivers reflect expenses after reimbursement by the investment adviser but prior to reductions from brokerage service arrangements or other expense offset arrangements. Expenses net of all reductions represent the net expenses paid by the Fund.
I Annualized
J Amount does not include the portfolio activity of any underlying Fidelity Central Funds.
See accompanying notes which are an integral part of the financial statements.
Notes to Financial Statements (Unaudited)
For the period ended April 30, 2016
1. Organization.
Fidelity Pacific Basin Fund (the Fund) is a fund of Fidelity Investment Trust (the Trust) and is authorized to issue an unlimited number of shares. Share transactions on the Statement of Changes in Net Assets may contain exchanges between affiliated funds. The Trust is registered under the Investment Company Act of 1940, as amended (the 1940 Act), as an open-end management investment company organized as a Massachusetts business trust. The Fund's investments in emerging markets can be subject to social, economic, regulatory, and political uncertainties and can be extremely volatile.
2. Investments in Fidelity Central Funds.
The Fund invests in Fidelity Central Funds, which are open-end investment companies generally available only to other investment companies and accounts managed by the investment adviser and its affiliates. The Fund's Schedule of Investments lists each of the Fidelity Central Funds held as of period end, if any, as an investment of the Fund, but does not include the underlying holdings of each Fidelity Central Fund. As an Investing Fund, the Fund indirectly bears its proportionate share of the expenses of the underlying Fidelity Central Funds.
The Money Market Central Funds seek preservation of capital and current income and are managed by Fidelity Investments Money Management, Inc. (FIMM), an affiliate of the investment adviser. Annualized expenses of the Money Market Central Funds as of their most recent shareholder report date are less than .005%.
A complete unaudited list of holdings for each Fidelity Central Fund is available upon request or at the Securities and Exchange Commission (the SEC) website at www.sec.gov. In addition, the financial statements of the Fidelity Central Funds are available on the SEC website or upon request.
3. Significant Accounting Policies.
The financial statements have been prepared in conformity with accounting principles generally accepted in the United States of America (GAAP), which require management to make certain estimates and assumptions at the date of the financial statements. Actual results could differ from those estimates. Subsequent events, if any, through the date that the financial statements were issued have been evaluated in the preparation of the financial statements. The following summarizes the significant accounting policies of the Fund:
Investment Valuation. Investments are valued as of 4:00 p.m. Eastern time on the last calendar day of the period. The Board of Trustees (the Board) has delegated the day to day responsibility for the valuation of the Fund's investments to the Fidelity Management & Research Company (FMR) Fair Value Committee (the Committee). In accordance with valuation policies and procedures approved by the Board, the Fund attempts to obtain prices from one or more third party pricing vendors or brokers to value its investments. When current market prices, quotations or currency exchange rates are not readily available or reliable, investments will be fair valued in good faith by the Committee, in accordance with procedures adopted by the Board. Factors used in determining fair value vary by investment type and may include market or investment specific events. The frequency with which these procedures are used cannot be predicted and they may be utilized to a significant extent. The Committee oversees the Fund's valuation policies and procedures and reports to the Board on the Committee's activities and fair value determinations. The Board monitors the appropriateness of the procedures used in valuing the Fund's investments and ratifies the fair value determinations of the Committee.
The Fund categorizes the inputs to valuation techniques used to value its investments into a disclosure hierarchy consisting of three levels as shown below:
- Level 1 – quoted prices in active markets for identical investments
- Level 2 – other significant observable inputs (including quoted prices for similar investments, interest rates, prepayment speeds, etc.)
- Level 3 – unobservable inputs (including the Fund's own assumptions based on the best information available)
Valuation techniques used to value the Fund's investments by major category are as follows:
Equity securities, including restricted securities, for which market quotations are readily available, are valued at the last reported sale price or official closing price as reported by a third party pricing vendor on the primary market or exchange on which they are traded and are categorized as Level 1 in the hierarchy. In the event there were no sales during the day or closing prices are not available, securities are valued at the last quoted bid price or may be valued using the last available price and are generally categorized as Level 2 in the hierarchy. For foreign equity securities, when market or security specific events arise, comparisons to the valuation of American Depositary Receipts (ADRs), futures contracts, Exchange-Traded Funds (ETFs) and certain indexes as well as quoted prices for similar securities may be used and would be categorized as Level 2 in the hierarchy. Utilizing these techniques may result in transfers between Level 1 and Level 2. For equity securities, including restricted securities, where observable inputs are limited, assumptions about market activity and risk are used and these securities may be categorized as Level 3 in the hierarchy.
Investments in open-end mutual funds, including the Fidelity Central Funds, are valued at their closing net asset value (NAV) each business day and are categorized as Level 1 in the hierarchy.
Changes in valuation techniques may result in transfers in or out of an assigned level within the disclosure hierarchy. The aggregate value of investments by input level as of April 30, 2016, including information on transfers between Levels 1 and 2, is included at the end of the Fund's Schedule of Investments.
Foreign Currency. The Fund may use foreign currency contracts to facilitate transactions in foreign-denominated securities. Gains and losses from these transactions may arise from changes in the value of the foreign currency or if the counterparties do not perform under the contracts' terms.
Foreign-denominated assets, including investment securities, and liabilities are translated into U.S. dollars at the exchange rates at period end. Purchases and sales of investment securities, income and dividends received and expenses denominated in foreign currencies are translated into U.S. dollars at the exchange rate in effect on the transaction date.
The effects of exchange rate fluctuations on investments are included with the net realized and unrealized gain (loss) on investment securities. Other foreign currency transactions resulting in realized and unrealized gain (loss) are disclosed separately.
Investment Transactions and Income. For financial reporting purposes, the Fund's investment holdings and NAV include trades executed through the end of the last business day of the period. The NAV per share for processing shareholder transactions is calculated as of the close of business of the New York Stock Exchange (NYSE), normally 4:00 p.m. Eastern time and includes trades executed through the end of the prior business day. Gains and losses on securities sold are determined on the basis of identified cost and may include proceeds received from litigation. Dividend income is recorded on the ex-dividend date, except for certain dividends from foreign securities where the ex-dividend date may have passed, which are recorded as soon as the Fund is informed of the ex-dividend date. Non-cash dividends included in dividend income, if any, are recorded at the fair market value of the securities received. Income and capital gain distributions from Fidelity Central Funds, if any, are recorded on the ex-dividend date. Large, non-recurring dividends recognized by the Fund are presented separately on the Statement of Operations as "Special Dividends" and the impact of these dividends is presented in the Financial Highlights. Investment income is recorded net of foreign taxes withheld where recovery of such taxes is uncertain.
Expenses. Expenses directly attributable to a fund are charged to that fund. Expenses attributable to more than one fund are allocated among the respective funds on the basis of relative net assets or other appropriate methods. Expense estimates are accrued in the period to which they relate and adjustments are made when actual amounts are known.
Income Tax Information and Distributions to Shareholders. Each year, the Fund intends to qualify as a regulated investment company under Subchapter M of the Internal Revenue Code, including distributing substantially all of its taxable income and realized gains. As a result, no provision for U.S. Federal income taxes is required. The Fund files a U.S. federal tax return, in addition to state and local tax returns as required. The Fund's federal income tax returns are subject to examination by the Internal Revenue Service (IRS) for a period of three fiscal years after they are filed. State and local tax returns may be subject to examination for an additional fiscal year depending on the jurisdiction. Foreign taxes are provided for based on the Fund's understanding of the tax rules and rates that exist in the foreign markets in which it invests. The Fund is subject to a tax imposed on capital gains by certain countries in which it invests. An estimated deferred tax liability for net unrealized appreciation on the applicable securities is included in Other payables and accrued expenses on the Statement of Assets & Liabilities.
Distributions are declared and recorded on the ex-dividend date. Income and capital gain distributions are determined in accordance with income tax regulations, which may differ from GAAP.
Capital accounts within the financial statements are adjusted for permanent book-tax differences. These adjustments have no impact on net assets or the results of operations. Capital accounts are not adjusted for temporary book-tax differences which will reverse in a subsequent period.
Book-tax differences are primarily due to foreign currency transactions, passive foreign investment companies (PFIC), deferred trustees compensation and losses deferred due to wash sales.
The federal tax cost of investment securities and unrealized appreciation (depreciation) as of period end were as follows:
| Gross unrealized appreciation | $121,555,219 |
| Gross unrealized depreciation | (53,706,208) |
| Net unrealized appreciation (depreciation) on securities | $67,849,011 |
| Tax cost | $573,158,950 |
Short-Term Trading (Redemption) Fees. Shares held by investors in the Fund less than 90 days may have been subject to a redemption fee equal to 1.50% of the NAV of shares redeemed. All redemption fees, which reduce the proceeds of the shareholder redemption, are retained by the Fund and accounted for as an addition to paid in capital.
Delayed Delivery Transactions and When-Issued Securities. During the period, the Fund transacted in securities on a delayed delivery or when-issued basis. Payment and delivery may take place after the customary settlement period for that security. The price of the underlying securities and the date when the securities will be delivered and paid for are fixed at the time the transaction is negotiated. With respect to purchase commitments, the Fund identifies securities as segregated in its records with a value at least equal to the amount of the commitment. Losses may arise due to changes in the value of the underlying securities or if the counterparty does not perform under the contract's terms, or if the issuer does not issue the securities due to political, economic, or other factors.
Restricted Securities. The Fund may invest in securities that are subject to legal or contractual restrictions on resale. These securities generally may be resold in transactions exempt from registration or to the public if the securities are registered. Disposal of these securities may involve time-consuming negotiations and expense, and prompt sale at an acceptable price may be difficult. Information regarding restricted securities is included at the end of the Fund's Schedule of Investments.
4. Purchases and Sales of Investments.
Purchases and sales of securities, other than short-term securities, aggregated $95,513,066 and $129,110,419, respectively.
5. Fees and Other Transactions with Affiliates.
Management Fee. Fidelity Management & Research Company (the investment adviser) and its affiliates provide the Fund with investment management related services for which the Fund pays a monthly management fee. The management fee is the sum of an individual fund fee rate that is based on an annual rate of .45% of the Fund's average net assets and an annualized group fee rate that averaged .25% during the period. The group fee rate is based upon the average net assets of all the mutual funds advised by the investment adviser, including any mutual funds previously advised by the investment adviser that are currently advised by Fidelity SelectCo, LLC, an affiliate of the investment adviser. The group fee rate decreases as assets under management increase and increases as assets under management decrease. In addition, the management fee is subject to a performance adjustment (up to a maximum of +/- .20% of the Fund's average net assets over a 36 month performance period). The upward or downward adjustment to the management fee is based on the Fund's relative investment performance as compared to its benchmark index, the MSCI All Country Pacific Index, over the same 36 month performance period. For the reporting period, the total annualized management fee rate, including the performance adjustment, was .92% of the Fund's average net assets. The performance adjustment included in the management fee rate may be higher or lower than the maximum performance adjustment rate due to the difference between the average net assets for the reporting and performance periods.
Transfer Agent Fees. Fidelity Investments Institutional Operations Company, Inc. (FIIOC), an affiliate of the investment adviser, is the Fund's transfer, dividend disbursing and shareholder servicing agent. FIIOC receives account fees and asset-based fees that vary according to account size and type of account. FIIOC pays for typesetting, printing and mailing of shareholder reports, except proxy statements. For the period, the transfer agent fees were equivalent to an annualized rate of .19% of average net assets.
Accounting and Security Lending Fees. Fidelity Service Company, Inc. (FSC), an affiliate of the investment adviser, maintains the Fund's accounting records. The accounting fee is based on the level of average net assets for each month. Under a separate contract, FSC administers the security lending program. The security lending fee is based on the number and duration of lending transactions.
Brokerage Commissions. The Fund placed a portion of its portfolio transactions with brokerage firms which are affiliates of the investment adviser. Brokerage commissions are included in net realized gain (loss) and change in net unrealized appreciation (depreciation) in the Statement of Operations. The commissions paid to these affiliated firms were $32 for the period.
Interfund Trades. The Fund may purchase from or sell securities to other Fidelity Funds under procedures adopted by the Board. The procedures have been designed to ensure these interfund trades are executed in accordance with Rule 17a-7 of the 1940 Act. Interfund trades are included within the respective purchases and sales amounts shown in the Purchases and Sales of Investments note.
6. Committed Line of Credit.
The Fund participates with other funds managed by the investment adviser or an affiliate in a $4.25 billion credit facility (the "line of credit") to be utilized for temporary or emergency purposes to fund shareholder redemptions or for other short-term liquidity purposes. The Fund has agreed to pay commitment fees on its pro-rata portion of the line of credit, which amounted to $560 and is reflected in Miscellaneous expenses on the Statement of Operations. During the period, the Fund did not borrow on this line of credit.
7. Security Lending.
The Fund lends portfolio securities through a lending agent from time to time in order to earn additional income. For equity securities, a lending agent is used and may loan securities to certain qualified borrowers, including Fidelity Capital Markets (FCM), a broker-dealer affiliated with the Fund. On the settlement date of the loan, the Fund receives collateral (in the form of U.S. Treasury obligations, letters of credit and/or cash) against the loaned securities and maintains collateral in an amount not less than 100% of the market value of the loaned securities during the period of the loan. The market value of the loaned securities is determined at the close of business of the Fund and any additional required collateral is delivered to the Fund on the next business day. The Fund or borrower may terminate the loan at any time, and if the borrower defaults on its obligation to return the securities loaned because of insolvency or other reasons, the Fund may apply collateral received from the borrower against the obligation. The Fund may experience delays and costs in recovering the securities loaned. Any cash collateral received is invested in the Fidelity Securities Lending Cash Central Fund. The value of loaned securities and cash collateral at period end are disclosed on the Fund's Statement of Assets and Liabilities. The value of securities loaned to FCM at period end was $60,345. Security lending income represents the income earned on investing cash collateral, less rebates paid to borrowers and any lending agent fees associated with the loan, plus any premium payments received for lending certain types of securities. Security lending income is presented in the Statement of Operations as a component of income from Fidelity Central Funds. Total security lending income during the period amounted to $223,289, including $3,990 from securities loaned to FCM.
8. Expense Reductions.
Commissions paid to certain brokers with whom the investment adviser, or its affiliates, places trades on behalf of the Fund include an amount in addition to trade execution, which may be rebated back to the Fund to offset certain expenses. This amount totaled $5,202 for the period.
In addition, during the period the investment adviser reimbursed and/or waived a portion of operating expenses in the amount of $2,332.
9. Other.
The Fund's organizational documents provide former and current trustees and officers with a limited indemnification against liabilities arising in connection with the performance of their duties to the Fund. In the normal course of business, the Fund may also enter into contracts that provide general indemnifications. The Fund's maximum exposure under these arrangements is unknown as this would be dependent on future claims that may be made against the Fund. The risk of material loss from such claims is considered remote.
Shareholder Expense Example
As a shareholder of the Fund, you incur two types of costs: (1) transaction costs, including redemption fees and (2) ongoing costs, including management fees and other Fund expenses. This Example is intended to help you understand your ongoing costs (in dollars) of investing in the Fund and to compare these costs with the ongoing costs of investing in other mutual funds.
The Example is based on an investment of $1,000 invested at the beginning of the period and held for the entire period (November 1, 2015 to April 30, 2016).
Actual Expenses
The first line of the accompanying table for each class of the Fund provides information about actual account values and actual expenses. You may use the information in this line, together with the amount you invested, to estimate the expenses that you paid over the period. Simply divide your account value by $1,000.00 (for example, an $8,600 account value divided by $1,000.00 = 8.6), then multiply the result by the number in the first line for a class of the Fund under the heading entitled "Expenses Paid During Period" to estimate the expenses you paid on your account during this period. A small balance maintenance fee of $12.00 that is charged once a year may apply for certain accounts with a value of less than $2,000. This fee is not included in the table below. If it was, the estimate of expenses you paid during the period would be higher, and your ending account value lower, by this amount. In addition, the Fund, as a shareholder in the underlying Fidelity Central Funds, will indirectly bear its pro-rata share of the fees and expenses incurred by the underlying Fidelity Central Funds. These fees and expenses are not included in the Fund's annualized expense ratio used to calculate the expense estimate in the table below.
Hypothetical Example for Comparison Purposes
The second line of the accompanying table provides information about hypothetical account values and hypothetical expenses based on the Fund's actual expense ratio and an assumed rate of return of 5% per year before expenses, which is not the Fund's actual return. The hypothetical account values and expenses may not be used to estimate the actual ending account balance or expenses you paid for the period. You may use this information to compare the ongoing costs of investing in the Fund and other funds. To do so, compare this 5% hypothetical example with the 5% hypothetical examples that appear in the shareholder reports of the other funds. A small balance maintenance fee of $12.00 that is charged once a year may apply for certain accounts with a value of less than $2,000. This fee is not included in the table below. If it was, the estimate of expenses you paid during the period would be higher, and your ending account value lower, by this amount. In addition, the Fund, as a shareholder in the underlying Fidelity Central Funds, will indirectly bear its pro-rata share of the fees and expenses incurred by the underlying Fidelity Central Funds. These fees and expenses are not included in the Fund's annualized expense ratio used to calculate the expense estimate in the table below.
Please note that the expenses shown in the table are meant to highlight your ongoing costs only and do not reflect any transaction costs. Therefore, the second line of the table is useful in comparing ongoing costs only, and will not help you determine the relative total costs of owning different funds. In addition, if these transactional costs were included, your costs would have been higher.
| Annualized Expense Ratio-A | Beginning Account Value November 1, 2015 | Ending Account Value April 30, 2016 | Expenses Paid During Period-B November 1, 2015 to April 30, 2016 | |
| Fidelity Canada Fund | ||||
| Class A | 1.57% | |||
| Actual | $1,000.00 | $1,066.60 | $8.07 | |
| Hypothetical-C | $1,000.00 | $1,017.06 | $7.87 | |
| Class T | 1.85% | |||
| Actual | $1,000.00 | $1,064.90 | $9.50 | |
| Hypothetical-C | $1,000.00 | $1,015.66 | $9.27 | |
| Class B | 2.33% | |||
| Actual | $1,000.00 | $1,062.50 | $11.95 | |
| Hypothetical-C | $1,000.00 | $1,013.28 | $11.66 | |
| Class C | 2.30% | |||
| Actual | $1,000.00 | $1,062.80 | $11.80 | |
| Hypothetical-C | $1,000.00 | $1,013.43 | $11.51 | |
| Canada | 1.26% | |||
| Actual | $1,000.00 | $1,068.30 | $6.48 | |
| Hypothetical-C | $1,000.00 | $1,018.60 | $6.32 | |
| Class I | 1.21% | |||
| Actual | $1,000.00 | $1,068.50 | $6.22 | |
| Hypothetical-C | $1,000.00 | $1,018.85 | $6.07 | |
| Fidelity China Region Fund | ||||
| Class A | 1.32% | |||
| Actual | $1,000.00 | $894.30 | $6.22 | |
| Hypothetical-C | $1,000.00 | $1,018.30 | $6.62 | |
| Class T | 1.68% | |||
| Actual | $1,000.00 | $892.50 | $7.91 | |
| Hypothetical-C | $1,000.00 | $1,016.51 | $8.42 | |
| Class B | 2.11% | |||
| Actual | $1,000.00 | $890.50 | $9.92 | |
| Hypothetical-C | $1,000.00 | $1,014.37 | $10.57 | |
| Class C | 2.08% | |||
| Actual | $1,000.00 | $891.00 | $9.78 | |
| Hypothetical-C | $1,000.00 | $1,014.52 | $10.42 | |
| China Region | 1.03% | |||
| Actual | $1,000.00 | $895.50 | $4.85 | |
| Hypothetical-C | $1,000.00 | $1,019.74 | $5.17 | |
| Class I | 1.00% | |||
| Actual | $1,000.00 | $895.70 | $4.71 | |
| Hypothetical-C | $1,000.00 | $1,019.89 | $5.02 | |
| Fidelity Emerging Asia Fund | 1.14% | |||
| Actual | $1,000.00 | $975.30 | $5.60 | |
| Hypothetical-C | $1,000.00 | $1,019.19 | $5.72 | |
| Fidelity Emerging Markets Fund | ||||
| Emerging Markets | 1.03% | |||
| Actual | $1,000.00 | $1,002.30 | $5.13 | |
| Hypothetical-C | $1,000.00 | $1,019.74 | $5.17 | |
| Class K | .84% | |||
| Actual | $1,000.00 | $1,003.30 | $4.18 | |
| Hypothetical-C | $1,000.00 | $1,020.69 | $4.22 | |
| Fidelity Europe Fund | ||||
| Class A | 1.39% | |||
| Actual | $1,000.00 | $980.60 | $6.84 | |
| Hypothetical-C | $1,000.00 | $1,017.95 | $6.97 | |
| Class T | 1.70% | |||
| Actual | $1,000.00 | $979.20 | $8.37 | |
| Hypothetical-C | $1,000.00 | $1,016.41 | $8.52 | |
| Class B | 2.19% | |||
| Actual | $1,000.00 | $976.90 | $10.76 | |
| Hypothetical-C | $1,000.00 | $1,013.97 | $10.97 | |
| Class C | 2.18% | |||
| Actual | $1,000.00 | $976.70 | $10.71 | |
| Hypothetical-C | $1,000.00 | $1,014.02 | $10.92 | |
| Europe | 1.08% | |||
| Actual | $1,000.00 | $982.20 | $5.32 | |
| Hypothetical-C | $1,000.00 | $1,019.49 | $5.42 | |
| Class I | 1.02% | |||
| Actual | $1,000.00 | $982.50 | $5.03 | |
| Hypothetical-C | $1,000.00 | $1,019.79 | $5.12 | |
| Fidelity Japan Fund | ||||
| Class A | 1.09% | |||
| Actual | $1,000.00 | $958.90 | $5.31 | |
| Hypothetical-C | $1,000.00 | $1,019.44 | $5.47 | |
| Class T | 1.45% | |||
| Actual | $1,000.00 | $956.80 | $7.05 | |
| Hypothetical-C | $1,000.00 | $1,017.65 | $7.27 | |
| Class B | 1.91% | |||
| Actual | $1,000.00 | $955.20 | $9.29 | |
| Hypothetical-C | $1,000.00 | $1,015.37 | $9.57 | |
| Class C | 1.82% | |||
| Actual | $1,000.00 | $955.00 | $8.85 | |
| Hypothetical-C | $1,000.00 | $1,015.81 | $9.12 | |
| Japan | .80% | |||
| Actual | $1,000.00 | $960.70 | $3.90 | |
| Hypothetical-C | $1,000.00 | $1,020.89 | $4.02 | |
| Class I | .78% | |||
| Actual | $1,000.00 | $960.30 | $3.80 | |
| Hypothetical-C | $1,000.00 | $1,020.98 | $3.92 | |
| Fidelity Japan Smaller Companies Fund | .97% | |||
| Actual | $1,000.00 | $1,038.70 | $4.92 | |
| Hypothetical-C | $1,000.00 | $1,020.04 | $4.87 | |
| Fidelity Latin America Fund | ||||
| Class A | 1.42% | |||
| Actual | $1,000.00 | $1,085.10 | $7.36 | |
| Hypothetical-C | $1,000.00 | $1,017.80 | $7.12 | |
| Class T | 1.71% | |||
| Actual | $1,000.00 | $1,083.30 | $8.86 | |
| Hypothetical-C | $1,000.00 | $1,016.36 | $8.57 | |
| Class B | 2.17% | |||
| Actual | $1,000.00 | $1,081.00 | $11.23 | |
| Hypothetical-C | $1,000.00 | $1,014.07 | $10.87 | |
| Class C | 2.17% | |||
| Actual | $1,000.00 | $1,080.70 | $11.23 | |
| Hypothetical-C | $1,000.00 | $1,014.07 | $10.87 | |
| Latin America | 1.17% | |||
| Actual | $1,000.00 | $1,086.70 | $6.07 | |
| Hypothetical-C | $1,000.00 | $1,019.05 | $5.87 | |
| Class I | 1.13% | |||
| Actual | $1,000.00 | $1,086.60 | $5.86 | |
| Hypothetical-C | $1,000.00 | $1,019.24 | $5.67 | |
| Fidelity Nordic Fund | .99% | |||
| Actual | $1,000.00 | $1,098.00 | $5.16 | |
| Hypothetical-C | $1,000.00 | $1,019.94 | $4.97 | |
| Fidelity Pacific Basin Fund | 1.20% | |||
| Actual | $1,000.00 | $1,033.50 | $6.07 | |
| Hypothetical-C | $1,000.00 | $1,018.90 | $6.02 |
A Annualized expense ratio reflects expenses net of applicable fee waivers.
B Expenses are equal to each Class' annualized expense ratio, multiplied by the average account value over the period, multiplied by 182/ 366 (to reflect the one-half year period).
C 5% return per year before expenses
![]()
Boston, MA 02210
245 Summer St.
www.fidelity.com
Corporate Headquarters
TIF-SANN-0616
1.703611.118
Fidelity® Total International Equity Fund Semi-Annual Report April 30, 2016 |
|
Contents
To view a fund's proxy voting guidelines and proxy voting record for the 12-month period ended June 30, visit http://www.fidelity.com/proxyvotingresults or visit the Securities and Exchange Commission's (SEC) web site at http://www.sec.gov.
You may also call 1-800-544-8544 to request a free copy of the proxy voting guidelines.
Standard & Poor's, S&P and S&P 500 are registered service marks of The McGraw-Hill Companies, Inc. and have been licensed for use by Fidelity Distributors Corporation.
Other third-party marks appearing herein are the property of their respective owners.
All other marks appearing herein are registered or unregistered trademarks or service marks of FMR LLC or an affiliated company. © 2016 FMR LLC. All rights reserved.
This report and the financial statements contained herein are submitted for the general information of the shareholders of the Fund. This report is not authorized for distribution to prospective investors in the Fund unless preceded or accompanied by an effective prospectus.
A fund files its complete schedule of portfolio holdings with the SEC for the first and third quarters of each fiscal year on Form N-Q. Forms N-Q are available on the SEC’s web site at http://www.sec.gov. A fund's Forms N-Q may be reviewed and copied at the SEC’s Public Reference Room in Washington, DC. Information regarding the operation of the SEC's Public Reference Room may be obtained by calling 1-800-SEC-0330.
For a complete list of a fund's portfolio holdings, view the most recent holdings listing, semiannual report, or annual report on Fidelity's web site at http://www.fidelity.com, http://www.advisor.fidelity.com, or http://www.401k.com, as applicable.
NOT FDIC INSURED •MAY LOSE VALUE •NO BANK GUARANTEE
Neither the Fund nor Fidelity Distributors Corporation is a bank.
Investment Summary (Unaudited)
Geographic Diversification (% of fund's net assets)
| As of April 30, 2016 | ||
| Japan | 13.7% | |
| United Kingdom | 13.5% | |
| United States of America* | 12.7% | |
| Switzerland | 7.7% | |
| France | 7.0% | |
| Germany | 3.8% | |
| India | 3.3% | |
| Australia | 3.2% | |
| Spain | 2.8% | |
| Other | 32.3% | |

* Includes Short-Term investments and Net Other Assets (Liabilities).
Percentages are based on country or territory of incorporation and are adjusted for the effect of futures contracts, if applicable.
| As of October 31, 2015 | ||
| United Kingdom | 15.7% | |
| Japan | 14.0% | |
| United States of America* | 10.2% | |
| Switzerland | 8.4% | |
| France | 6.6% | |
| Germany | 3.8% | |
| Sweden | 2.9% | |
| Australia | 2.7% | |
| India | 2.6% | |
| Other | 33.1% | |

* Includes Short-Term investments and Net Other Assets (Liabilities).
Percentages are based on country or territory of incorporation and are adjusted for the effect of futures contracts, if applicable.
Asset Allocation as of April 30, 2016
| % of fund's net assets | % of fund's net assets 6 months ago | |
| Stocks | 98.5 | 99.0 |
| Short-Term Investments and Net Other Assets (Liabilities) | 1.5 | 1.0 |
Top Ten Stocks as of April 30, 2016
| % of fund's net assets | % of fund's net assets 6 months ago | |
| Nestle SA (Switzerland, Food Products) | 2.6 | 2.1 |
| Novartis AG (Switzerland, Pharmaceuticals) | 1.8 | 2.3 |
| Anheuser-Busch InBev SA NV (Belgium, Beverages) | 1.5 | 1.2 |
| Roche Holding AG (participation certificate) (Switzerland, Pharmaceuticals) | 1.3 | 1.3 |
| Total SA (France, Oil, Gas & Consumable Fuels) | 1.2 | 1.2 |
| Taiwan Semiconductor Manufacturing Co. Ltd. (Taiwan, Semiconductors & Semiconductor Equipment) | 1.2 | 1.1 |
| Reckitt Benckiser Group PLC (United Kingdom, Household Products) | 1.1 | 1.0 |
| CSL Ltd. (Australia, Biotechnology) | 1.1 | 0.8 |
| Novo Nordisk A/S Series B sponsored ADR (Denmark, Pharmaceuticals) | 1.1 | 1.0 |
| Astellas Pharma, Inc. (Japan, Pharmaceuticals) | 1.1 | 1.1 |
| 14.0 |
Market Sectors as of April 30, 2016
| % of fund's net assets | % of fund's net assets 6 months ago | |
| Financials | 19.3 | 22.0 |
| Health Care | 14.1 | 14.7 |
| Consumer Discretionary | 13.8 | 16.1 |
| Consumer Staples | 13.7 | 11.4 |
| Information Technology | 12.4 | 11.3 |
| Industrials | 11.3 | 11.1 |
| Materials | 5.2 | 4.9 |
| Energy | 3.6 | 2.9 |
| Telecommunication Services | 2.9 | 2.7 |
| Utilities | 2.2 | 1.9 |
Investments April 30, 2016 (Unaudited)
Showing Percentage of Net Assets
| Common Stocks - 97.4% | |||
| Shares | Value | ||
| Argentina - 0.2% | |||
| Banco Macro SA sponsored ADR | 5,400 | $338,202 | |
| Grupo Financiero Galicia SA sponsored ADR | 11,900 | 338,793 | |
| TOTAL ARGENTINA | 676,995 | ||
| Australia - 3.2% | |||
| Amcor Ltd. (a) | 31,664 | 370,766 | |
| Ansell Ltd. (a) | 33,670 | 510,228 | |
| Beacon Lighting Group Ltd. | 28,000 | 38,747 | |
| CSL Ltd. | 42,420 | 3,392,481 | |
| DuluxGroup Ltd. | 22,765 | 110,780 | |
| Imdex Ltd. (a) | 134,227 | 20,922 | |
| Macquarie Group Ltd. | 9,698 | 468,241 | |
| RCG Corp. Ltd. | 97,518 | 101,583 | |
| Sydney Airport unit | 140,091 | 725,389 | |
| TFS Corp. Ltd. | 64,586 | 76,608 | |
| Transurban Group unit | 173,855 | 1,530,768 | |
| Westpac Banking Corp. | 108,726 | 2,552,187 | |
| TOTAL AUSTRALIA | 9,898,700 | ||
| Austria - 0.5% | |||
| Andritz AG | 25,972 | 1,454,546 | |
| Zumtobel AG | 4,500 | 58,586 | |
| TOTAL AUSTRIA | 1,513,132 | ||
| Bailiwick of Jersey - 0.3% | |||
| Integrated Diagnostics Holdings PLC | 14,600 | 67,890 | |
| Wolseley PLC | 15,116 | 846,678 | |
| TOTAL BAILIWICK OF JERSEY | 914,568 | ||
| Belgium - 1.9% | |||
| Anheuser-Busch InBev SA NV | 38,071 | 4,712,425 | |
| Gimv NV | 819 | 45,483 | |
| KBC Ancora | 4,281 | 151,127 | |
| KBC Groep NV | 21,007 | 1,179,371 | |
| TOTAL BELGIUM | 6,088,406 | ||
| Bermuda - 0.7% | |||
| Axalta Coating Systems (a) | 11,500 | 327,405 | |
| China Gas Holdings Ltd. | 278,000 | 401,358 | |
| China Resource Gas Group Ltd. | 142,000 | 401,837 | |
| Credicorp Ltd. (United States) | 4,200 | 610,764 | |
| Markit Ltd. (a) | 8,000 | 279,120 | |
| Vostok New Ventures Ltd. SDR (a) | 13,260 | 75,461 | |
| TOTAL BERMUDA | 2,095,945 | ||
| Brazil - 1.1% | |||
| BB Seguridade Participacoes SA | 55,700 | 485,862 | |
| Cielo SA | 60,036 | 584,780 | |
| Kroton Educacional SA | 140,300 | 522,160 | |
| Qualicorp SA | 90,800 | 393,376 | |
| Smiles SA | 30,300 | 351,521 | |
| Ultrapar Participacoes SA | 25,600 | 539,057 | |
| Weg SA | 102,500 | 452,410 | |
| TOTAL BRAZIL | 3,329,166 | ||
| British Virgin Islands - 0.1% | |||
| Mail.Ru Group Ltd. GDR (Reg. S) (a) | 14,800 | 299,700 | |
| Canada - 0.7% | |||
| Cara Operations Ltd. | 4,100 | 106,070 | |
| Constellation Software, Inc. | 100 | 39,080 | |
| Imperial Oil Ltd. | 24,900 | 825,766 | |
| McCoy Global, Inc. | 15,800 | 25,815 | |
| New Look Vision Group, Inc. | 3,000 | 74,241 | |
| Pason Systems, Inc. | 43,100 | 626,559 | |
| Potash Corp. of Saskatchewan, Inc. | 21,900 | 387,487 | |
| ShawCor Ltd. Class A | 1,900 | 51,335 | |
| Tesco Corp. | 5,500 | 52,030 | |
| TOTAL CANADA | 2,188,383 | ||
| Cayman Islands - 2.5% | |||
| 58.com, Inc. ADR (a) | 9,700 | 530,105 | |
| Alibaba Group Holding Ltd. sponsored ADR (a) | 21,800 | 1,677,292 | |
| Baidu.com, Inc. sponsored ADR (a) | 5,000 | 971,500 | |
| ENN Energy Holdings Ltd. | 62,000 | 302,414 | |
| Fu Shou Yuan International Group Ltd. | 482,000 | 338,167 | |
| International Housewares Retail Co. Ltd. | 300,000 | 49,032 | |
| New Oriental Education & Technology Group, Inc. sponsored ADR | 9,900 | 387,684 | |
| Shenzhou International Group Holdings Ltd. | 79,000 | 408,393 | |
| Sino Biopharmaceutical Ltd. | 516,000 | 365,640 | |
| TAL Education Group ADR (a) | 6,200 | 358,732 | |
| Tencent Holdings Ltd. | 122,900 | 2,500,808 | |
| Value Partners Group Ltd. | 55,000 | 52,500 | |
| TOTAL CAYMAN ISLANDS | 7,942,267 | ||
| China - 0.6% | |||
| China Pacific Insurance (Group) Co. Ltd. (H Shares) | 132,200 | 463,552 | |
| Inner Mongoli Yili Industries Co. Ltd. | 139,000 | 322,699 | |
| Jiangsu Hengrui Medicine Co. Ltd. | 45,830 | 330,449 | |
| Kweichow Moutai Co. Ltd. | 10,340 | 401,203 | |
| Shanghai International Airport Co. Ltd. | 72,800 | 305,974 | |
| TOTAL CHINA | 1,823,877 | ||
| Denmark - 1.3% | |||
| Jyske Bank A/S (Reg.) | 15,654 | 640,880 | |
| Novo Nordisk A/S Series B sponsored ADR | 60,760 | 3,389,800 | |
| Scandinavian Tobacco Group A/S | 3,000 | 47,725 | |
| Spar Nord Bank A/S | 11,631 | 94,842 | |
| TOTAL DENMARK | 4,173,247 | ||
| Finland - 0.5% | |||
| Sampo Oyj (A Shares) | 27,653 | 1,207,351 | |
| Tikkurila Oyj | 26,280 | 460,707 | |
| TOTAL FINLAND | 1,668,058 | ||
| France - 7.0% | |||
| Atos Origin SA | 16,004 | 1,424,463 | |
| AXA SA | 75,806 | 1,914,071 | |
| Bouygues SA (b) | 12,277 | 409,363 | |
| Capgemini SA | 15,802 | 1,475,210 | |
| Dassault Systemes SA | 4,500 | 351,931 | |
| Elis SA | 5,500 | 100,985 | |
| Essilor International SA | 9,145 | 1,183,801 | |
| Havas SA | 80,986 | 677,693 | |
| Laurent-Perrier Group SA | 759 | 64,530 | |
| Orange SA | 59,500 | 988,529 | |
| Renault SA | 9,911 | 956,459 | |
| Sanofi SA | 29,328 | 2,417,406 | |
| Societe Generale Series A | 31,200 | 1,227,632 | |
| SR Teleperformance SA | 5,700 | 511,700 | |
| Total SA | 77,133 | 3,898,362 | |
| Unibail-Rodamco | 5,000 | 1,339,709 | |
| Vetoquinol SA | 1,700 | 70,466 | |
| VINCI SA | 24,100 | 1,800,344 | |
| Virbac SA | 730 | 133,157 | |
| Vivendi SA (b) | 57,152 | 1,097,908 | |
| TOTAL FRANCE | 22,043,719 | ||
| Germany - 3.6% | |||
| adidas AG | 2,800 | 361,011 | |
| alstria office REIT-AG | 6,200 | 86,967 | |
| Axel Springer Verlag AG | 9,300 | 519,244 | |
| BASF AG | 23,970 | 1,980,290 | |
| Bayer AG | 16,012 | 1,847,205 | |
| CompuGroup Medical AG | 7,646 | 300,298 | |
| Continental AG | 2,383 | 523,356 | |
| CTS Eventim AG | 7,980 | 279,516 | |
| Fielmann AG | 2,458 | 181,228 | |
| Fresenius SE & Co. KGaA | 18,300 | 1,331,024 | |
| GEA Group AG | 11,615 | 538,507 | |
| Nexus AG | 4,000 | 70,077 | |
| SAP AG | 37,730 | 2,960,335 | |
| Wirecard AG (b) | 8,800 | 380,033 | |
| TOTAL GERMANY | 11,359,091 | ||
| Greece - 0.0% | |||
| Titan Cement Co. SA (Reg.) | 1,844 | 42,065 | |
| Hong Kong - 1.4% | |||
| AIA Group Ltd. | 429,800 | 2,572,184 | |
| Guangdong Investment Ltd. | 334,000 | 471,629 | |
| Power Assets Holdings Ltd. | 87,500 | 832,483 | |
| Techtronic Industries Co. Ltd. | 96,500 | 361,747 | |
| TOTAL HONG KONG | 4,238,043 | ||
| India - 3.3% | |||
| Adani Ports & Special Economic Zone | 130,670 | 468,579 | |
| Amara Raja Batteries Ltd. | 25,033 | 360,220 | |
| Asian Paints India Ltd. | 32,877 | 428,747 | |
| Bharti Infratel Ltd. | 65,320 | 368,710 | |
| Colgate-Palmolive (India) | 28,645 | 362,604 | |
| GlaxoSmithKline Consumer Healthcare Ltd. (a) | 4,231 | 375,650 | |
| HCL Technologies Ltd. | 38,811 | 438,384 | |
| HDFC Bank Ltd. (a) | 19,066 | 387,551 | |
| Hindustan Unilever Ltd. | 39,555 | 516,816 | |
| Housing Development Finance Corp. Ltd. | 87,831 | 1,439,201 | |
| IndusInd Bank Ltd. | 23,402 | 369,515 | |
| Infosys Ltd. | 54,376 | 987,776 | |
| ITC Ltd. | 117,362 | 574,129 | |
| Jyothy Laboratories Ltd. | 16,417 | 75,232 | |
| LIC Housing Finance Ltd. (a) | 52,804 | 367,499 | |
| Lupin Ltd. | 15,964 | 386,269 | |
| Maruti Suzuki India Ltd. (a) | 8,151 | 465,637 | |
| Power Grid Corp. of India Ltd. | 160,535 | 346,564 | |
| Sun Pharmaceutical Industries Ltd. | 44,169 | 539,466 | |
| Tata Consultancy Services Ltd. | 18,951 | 723,371 | |
| Titan Co. Ltd. | 55,471 | 297,207 | |
| TOTAL INDIA | 10,279,127 | ||
| Indonesia - 0.9% | |||
| PT ACE Hardware Indonesia Tbk | 4,792,900 | 336,172 | |
| PT Bank Central Asia Tbk | 537,100 | 531,480 | |
| PT Bank Rakyat Indonesia Tbk | 575,000 | 451,263 | |
| PT Kalbe Farma Tbk | 3,267,100 | 340,633 | |
| PT Matahari Department Store Tbk | 279,100 | 402,100 | |
| PT Surya Citra Media Tbk | 1,553,000 | 376,827 | |
| PT Tower Bersama Infrastructure Tbk (a) | 621,800 | 279,357 | |
| TOTAL INDONESIA | 2,717,832 | ||
| Ireland - 1.6% | |||
| Allergan PLC (a) | 2,200 | 476,432 | |
| CRH PLC sponsored ADR | 59,929 | 1,744,533 | |
| FBD Holdings PLC | 5,372 | 39,368 | |
| James Hardie Industries PLC: | |||
| CDI | 23,978 | 337,833 | |
| sponsored ADR | 112,225 | 1,573,395 | |
| Medtronic PLC | 10,600 | 838,990 | |
| TOTAL IRELAND | 5,010,551 | ||
| Isle of Man - 0.3% | |||
| Playtech Ltd. | 76,677 | 901,334 | |
| Israel - 1.1% | |||
| Azrieli Group | 11,796 | 468,500 | |
| Check Point Software Technologies Ltd. (a) | 4,000 | 331,480 | |
| Frutarom Industries Ltd. | 6,900 | 353,638 | |
| Ituran Location & Control Ltd. | 5,661 | 117,749 | |
| Strauss Group Ltd. | 6,859 | 108,692 | |
| Teva Pharmaceutical Industries Ltd. sponsored ADR | 35,509 | 1,933,465 | |
| TOTAL ISRAEL | 3,313,524 | ||
| Italy - 1.6% | |||
| Azimut Holding SpA | 22,914 | 576,704 | |
| Banco di Desio e della Brianza SpA | 19,000 | 53,563 | |
| Beni Stabili SpA SIIQ | 190,326 | 141,003 | |
| Eni SpA | 94,900 | 1,550,375 | |
| Interpump Group SpA | 49,391 | 710,898 | |
| Intesa Sanpaolo SpA | 297,500 | 826,991 | |
| Mediaset SpA | 121,000 | 544,506 | |
| Telecom Italia SpA (a) | 638,800 | 623,771 | |
| TOTAL ITALY | 5,027,811 | ||
| Japan - 13.7% | |||
| Aoki Super Co. Ltd. | 6,000 | 70,898 | |
| Artnature, Inc. | 12,300 | 101,984 | |
| Asahi Co. Ltd. | 6,600 | 97,893 | |
| Astellas Pharma, Inc. | 245,800 | 3,314,022 | |
| Autobacs Seven Co. Ltd. | 5,800 | 100,069 | |
| Azbil Corp. | 8,200 | 210,398 | |
| Broadleaf Co. Ltd. | 2,700 | 26,682 | |
| Central Automotive Products Ltd. | 8,000 | 66,678 | |
| Century21 Real Estate Japan Ltd. (c) | 2,500 | 27,834 | |
| Coca-Cola Central Japan Co. Ltd. | 18,700 | 342,601 | |
| Daiichikosho Co. Ltd. | 3,300 | 138,342 | |
| Daikokutenbussan Co. Ltd. | 5,000 | 224,719 | |
| DENSO Corp. | 48,600 | 1,847,343 | |
| Dentsu, Inc. | 21,800 | 1,107,636 | |
| East Japan Railway Co. | 20,600 | 1,812,307 | |
| Funai Soken Holdings, Inc. | 3,000 | 45,516 | |
| GCA Savvian Group Corp. | 6,800 | 62,834 | |
| Glory Ltd. | 3,900 | 127,730 | |
| Goldcrest Co. Ltd. | 7,960 | 113,977 | |
| Hokuriku Electrical Construction Co. Ltd. | 5,000 | 36,583 | |
| Hoya Corp. | 50,700 | 1,941,520 | |
| Hub Co. Ltd. | 2,500 | 40,088 | |
| Itochu Corp. | 85,300 | 1,084,044 | |
| Iwatsuka Confectionary Co. Ltd. | 800 | 36,244 | |
| Japan Digital Laboratory Co. | 6,100 | 82,516 | |
| Japan Tobacco, Inc. | 70,800 | 2,892,742 | |
| KDDI Corp. | 49,800 | 1,434,526 | |
| Keyence Corp. | 2,621 | 1,571,009 | |
| Kobayashi Pharmaceutical Co. Ltd. | 2,000 | 159,305 | |
| Koshidaka Holdings Co. Ltd. | 4,000 | 78,655 | |
| Lasertec Corp. | 6,300 | 81,908 | |
| Makita Corp. | 12,700 | 801,159 | |
| Medikit Co. Ltd. | 2,200 | 76,699 | |
| Meiko Network Japan Co. Ltd. | 2,700 | 29,778 | |
| Mitsubishi UFJ Financial Group, Inc. | 357,000 | 1,647,489 | |
| Mitsui Fudosan Co. Ltd. | 54,000 | 1,318,811 | |
| Nagaileben Co. Ltd. | 8,600 | 175,497 | |
| Nakano Refrigerators Co. Ltd. | 2,000 | 47,850 | |
| ND Software Co. Ltd. | 6,000 | 49,390 | |
| Nihon Parkerizing Co. Ltd. | 20,200 | 178,172 | |
| Nintendo Co. Ltd. | 4,400 | 595,765 | |
| Nippon Prologis REIT, Inc. (c) | 241 | 577,879 | |
| Nippon Telegraph & Telephone Corp. | 41,900 | 1,875,039 | |
| NS Tool Co. Ltd. | 3,800 | 63,002 | |
| OBIC Co. Ltd. | 17,800 | 935,585 | |
| Olympus Corp. | 43,600 | 1,698,509 | |
| ORIX Corp. | 71,100 | 1,005,705 | |
| OSG Corp. | 33,500 | 622,551 | |
| Paramount Bed Holdings Co. Ltd. | 3,400 | 126,476 | |
| ProNexus, Inc. | 8,000 | 80,904 | |
| San-Ai Oil Co. Ltd. | 11,000 | 77,092 | |
| Seven & i Holdings Co. Ltd. | 23,200 | 946,617 | |
| Seven Bank Ltd. | 398,800 | 1,694,584 | |
| Shinsei Bank Ltd. | 334,000 | 468,127 | |
| SHO-BOND Holdings Co. Ltd. | 22,100 | 956,249 | |
| Shoei Co. Ltd. | 5,800 | 87,794 | |
| SK Kaken Co. Ltd. | 1,100 | 90,257 | |
| Software Service, Inc. | 1,600 | 61,799 | |
| Sony Corp. | 31,300 | 758,137 | |
| Sony Financial Holdings, Inc. | 44,000 | 543,969 | |
| Sumitomo Mitsui Financial Group, Inc. | 42,600 | 1,281,907 | |
| Techno Medica Co. Ltd. | 1,800 | 37,734 | |
| The Monogatari Corp. | 1,500 | 70,800 | |
| The Nippon Synthetic Chemical Industry Co. Ltd. | 6,000 | 36,206 | |
| TKC Corp. | 3,300 | 89,656 | |
| Tocalo Co. Ltd. | 2,800 | 50,368 | |
| Toyota Motor Corp. | 50,000 | 2,534,487 | |
| Tsutsumi Jewelry Co. Ltd. | 2,200 | 45,954 | |
| USS Co. Ltd. | 110,600 | 1,749,509 | |
| Workman Co. Ltd. | 3,800 | 119,455 | |
| Yamada Consulting Group Co. Ltd. | 2,000 | 61,101 | |
| Yamato Kogyo Co. Ltd. | 1,700 | 39,907 | |
| TOTAL JAPAN | 42,986,572 | ||
| Kenya - 0.2% | |||
| Safaricom Ltd. | 4,376,100 | 740,904 | |
| Korea (South) - 1.6% | |||
| AMOREPACIFIC Corp. | 1,718 | 611,068 | |
| AMOREPACIFIC Group, Inc. | 3,162 | 463,671 | |
| BGFretail Co. Ltd. | 4,710 | 764,667 | |
| Coway Co. Ltd. | 4,513 | 388,401 | |
| KT&G Corp. | 5,617 | 603,043 | |
| Leeno Industrial, Inc. | 959 | 35,868 | |
| LG Chemical Ltd. | 2,168 | 562,023 | |
| LG Household & Health Care Ltd. | 620 | 544,954 | |
| NAVER Corp. | 1,801 | 1,064,243 | |
| TOTAL KOREA (SOUTH) | 5,037,938 | ||
| Luxembourg - 0.3% | |||
| Eurofins Scientific SA | 1,000 | 371,053 | |
| RTL Group SA | 6,427 | 534,133 | |
| TOTAL LUXEMBOURG | 905,186 | ||
| Mexico - 2.2% | |||
| Banregio Grupo Financiero S.A.B. de CV | 64,200 | 384,723 | |
| Consorcio ARA S.A.B. de CV | 254,355 | 99,793 | |
| El Puerto de Liverpool S.A.B. de CV Class C | 31,300 | 355,796 | |
| Fomento Economico Mexicano S.A.B. de CV: | |||
| unit | 71,500 | 665,269 | |
| sponsored ADR | 7,333 | 683,509 | |
| Gruma S.A.B. de CV Series B | 26,400 | 385,658 | |
| Grupo Aeroportuario del Pacifico S.A.B. de CV Series B | 45,000 | 423,984 | |
| Grupo Aeroportuario del Sureste S.A.B. de CV Series B | 28,135 | 432,066 | |
| Grupo Aeroportuario Norte S.A.B. de CV | 65,200 | 377,300 | |
| Grupo Financiero Banorte S.A.B. de CV Series O | 106,900 | 606,866 | |
| Grupo GICSA SA de CV (a) | 272,500 | 214,140 | |
| Infraestructura Energetica Nova S.A.B. de CV | 84,400 | 329,807 | |
| Kimberly-Clark de Mexico SA de CV Series A | 173,200 | 409,930 | |
| Megacable Holdings S.A.B. de CV unit | 81,200 | 374,977 | |
| Promotora y Operadora de Infraestructura S.A.B. de CV | 27,700 | 351,292 | |
| Tenedora Nemak SA de CV | 233,700 | 335,242 | |
| Wal-Mart de Mexico SA de CV Series V | 167,600 | 414,503 | |
| TOTAL MEXICO | 6,844,855 | ||
| Netherlands - 1.6% | |||
| Aalberts Industries NV | 6,100 | 208,985 | |
| Heijmans NV (Certificaten Van Aandelen) (a) | 4,481 | 42,228 | |
| ING Groep NV (Certificaten Van Aandelen) | 113,576 | 1,390,887 | |
| Koninklijke KPN NV | 150,029 | 589,562 | |
| Mylan N.V. | 9,800 | 408,758 | |
| PostNL NV (a) | 74,300 | 324,995 | |
| RELX NV | 100,780 | 1,691,160 | |
| VastNed Retail NV | 5,035 | 221,677 | |
| TOTAL NETHERLANDS | 4,878,252 | ||
| Norway - 0.0% | |||
| Kongsberg Gruppen ASA | 4,500 | 75,449 | |
| Philippines - 0.9% | |||
| Ayala Corp. | 26,950 | 441,766 | |
| Ayala Land, Inc. | 590,400 | 434,939 | |
| D&L Industries, Inc. | 1,653,900 | 316,469 | |
| GT Capital Holdings, Inc. | 12,985 | 377,389 | |
| International Container Terminal Services, Inc. | 241,940 | 334,349 | |
| Jollibee Food Corp. | 16,980 | 82,887 | |
| SM Investments Corp. | 20,420 | 409,833 | |
| SM Prime Holdings, Inc. | 859,600 | 413,946 | |
| TOTAL PHILIPPINES | 2,811,578 | ||
| Russia - 0.3% | |||
| Magnit OJSC (a) | 3,350 | 465,579 | |
| NOVATEK OAO GDR (Reg. S) | 5,300 | 508,800 | |
| TOTAL RUSSIA | 974,379 | ||
| South Africa - 2.0% | |||
| Aspen Pharmacare Holdings Ltd. | 23,800 | 560,891 | |
| Bidvest Group Ltd. | 20,132 | 510,935 | |
| Clicks Group Ltd. | 60,693 | 443,283 | |
| Discovery Ltd. | 48,767 | 435,829 | |
| FirstRand Ltd. | 169,400 | 544,427 | |
| Mondi Ltd. | 21,100 | 405,362 | |
| Mr Price Group Ltd. | 33,900 | 430,631 | |
| Naspers Ltd. Class N | 17,300 | 2,373,735 | |
| Sanlam Ltd. | 107,700 | 522,035 | |
| TOTAL SOUTH AFRICA | 6,227,128 | ||
| Spain - 2.8% | |||
| Amadeus IT Holding SA Class A | 42,900 | 1,952,134 | |
| Hispania Activos Inmobiliarios SA (a) | 38,400 | 562,815 | |
| Iberdrola SA | 254,372 | 1,810,808 | |
| Inditex SA | 91,236 | 2,928,810 | |
| Mediaset Espana Comunicacion SA | 49,300 | 640,154 | |
| Merlin Properties Socimi SA | 36,100 | 419,564 | |
| Prosegur Compania de Seguridad SA (Reg.) | 106,676 | 616,854 | |
| TOTAL SPAIN | 8,931,139 | ||
| Sweden - 2.4% | |||
| ASSA ABLOY AB (B Shares) | 136,700 | 2,866,624 | |
| Fagerhult AB | 49,855 | 1,160,942 | |
| Intrum Justitia AB | 11,563 | 414,978 | |
| Nordea Bank AB | 138,267 | 1,342,131 | |
| Saab AB (B Shares) | 3,000 | 102,622 | |
| Sandvik AB (b) | 48,200 | 494,578 | |
| Svenska Handelsbanken AB (A Shares) (b) | 87,445 | 1,166,530 | |
| TOTAL SWEDEN | 7,548,405 | ||
| Switzerland - 7.7% | |||
| Credit Suisse Group AG | 48,674 | 740,743 | |
| Lafargeholcim Ltd. (Reg.) | 13,560 | 686,552 | |
| Nestle SA | 107,904 | 8,053,917 | |
| Novartis AG | 72,031 | 5,481,722 | |
| Roche Holding AG (participation certificate) | 15,701 | 3,972,498 | |
| Schindler Holding AG: | |||
| (participation certificate) | 7,634 | 1,390,243 | |
| (Reg.) | 2,251 | 413,688 | |
| Sika AG | 90 | 383,061 | |
| Syngenta AG (Switzerland) | 3,219 | 1,288,540 | |
| Tecan Group AG | 600 | 83,311 | |
| UBS Group AG | 22,589 | 390,112 | |
| Zurich Insurance Group AG | 5,646 | 1,266,874 | |
| TOTAL SWITZERLAND | 24,151,261 | ||
| Taiwan - 1.6% | |||
| Addcn Technology Co. Ltd. | 8,500 | 65,257 | |
| Advantech Co. Ltd. | 48,000 | 338,792 | |
| ECLAT Textile Co. Ltd. | 34,643 | 395,194 | |
| Largan Precision Co. Ltd. | 5,870 | 412,497 | |
| Taiwan Semiconductor Manufacturing Co. Ltd. | 835,035 | 3,830,521 | |
| TOTAL TAIWAN | 5,042,261 | ||
| Thailand - 0.4% | |||
| Airports of Thailand PCL (For. Reg.) | 37,800 | 424,330 | |
| Bangkok Dusit Medical Services PCL (For. Reg.) | 527,200 | 359,317 | |
| Thai Beverage PCL | 612,400 | 339,248 | |
| TOTAL THAILAND | 1,122,895 | ||
| Turkey - 0.5% | |||
| Bim Birlesik Magazalar A/S JSC | 19,000 | 418,299 | |
| Koc Holding A/S | 83,000 | 433,985 | |
| Tofas Turk Otomobil Fabrikasi A/S | 44,054 | 348,590 | |
| Tupras Turkiye Petrol Rafinelleri A/S | 15,000 | 395,908 | |
| TOTAL TURKEY | 1,596,782 | ||
| United Arab Emirates - 0.1% | |||
| DP World Ltd. | 20,486 | 387,185 | |
| United Kingdom - 13.5% | |||
| AA PLC | 21,973 | 89,447 | |
| Alliance Pharma PLC | 64,414 | 42,353 | |
| Associated British Foods PLC | 28,900 | 1,293,842 | |
| AstraZeneca PLC (United Kingdom) | 31,527 | 1,808,786 | |
| Aviva PLC | 160,179 | 1,014,812 | |
| Babcock International Group PLC | 28,323 | 392,115 | |
| BAE Systems PLC | 249,621 | 1,741,520 | |
| Barclays PLC | 406,095 | 1,019,607 | |
| Bellway PLC | 6,328 | 226,253 | |
| Berendsen PLC | 67,555 | 1,164,754 | |
| British American Tobacco PLC (United Kingdom) | 5,700 | 347,541 | |
| Britvic PLC | 8,417 | 86,581 | |
| Bunzl PLC | 42,632 | 1,270,129 | |
| Compass Group PLC | 72,807 | 1,296,575 | |
| Dechra Pharmaceuticals PLC | 9,600 | 155,139 | |
| DP Poland PLC (a) | 200,000 | 75,980 | |
| Elementis PLC | 47,708 | 150,501 | |
| Great Portland Estates PLC | 13,972 | 154,747 | |
| Hikma Pharmaceuticals PLC | 13,118 | 422,449 | |
| Hilton Food Group PLC | 5,400 | 44,422 | |
| Howden Joinery Group PLC | 67,400 | 486,499 | |
| HSBC Holdings PLC sponsored ADR | 53,617 | 1,787,055 | |
| Imperial Tobacco Group PLC | 38,114 | 2,070,843 | |
| Informa PLC | 223,214 | 2,134,646 | |
| InterContinental Hotel Group PLC ADR | 69,496 | 2,789,569 | |
| ITE Group PLC | 41,200 | 93,460 | |
| ITV PLC | 374,619 | 1,232,687 | |
| JUST EAT Ltd. (a) | 12,540 | 70,268 | |
| Lloyds Banking Group PLC | 2,277,100 | 2,234,999 | |
| Micro Focus International PLC | 36,100 | 806,510 | |
| National Grid PLC | 115,665 | 1,650,378 | |
| NMC Health PLC | 22,600 | 345,740 | |
| Prudential PLC | 122,580 | 2,419,672 | |
| Reckitt Benckiser Group PLC | 36,651 | 3,570,500 | |
| Rightmove PLC | 7,800 | 439,695 | |
| Rio Tinto PLC | 69,603 | 2,334,923 | |
| Royal Dutch Shell PLC Class B (United Kingdom) | 39,530 | 1,037,855 | |
| Shaftesbury PLC | 41,837 | 556,284 | |
| Spectris PLC | 7,970 | 212,062 | |
| Spirax-Sarco Engineering PLC | 5,699 | 284,370 | |
| Taylor Wimpey PLC | 29,400 | 79,171 | |
| Ted Baker PLC | 3,375 | 117,613 | |
| Topps Tiles PLC | 33,400 | 66,371 | |
| Ultra Electronics Holdings PLC | 5,901 | 152,269 | |
| Unite Group PLC | 66,977 | 618,986 | |
| Vodafone Group PLC sponsored ADR | 63,826 | 2,089,663 | |
| TOTAL UNITED KINGDOM | 42,479,641 | ||
| United States of America - 11.2% | |||
| A.O. Smith Corp. | 4,200 | 324,324 | |
| Alphabet, Inc.: | |||
| Class A | 2,030 | 1,436,996 | |
| Class C | 406 | 281,362 | |
| Altria Group, Inc. | 11,100 | 696,081 | |
| Amazon.com, Inc. (a) | 600 | 395,754 | |
| Amphenol Corp. Class A | 5,400 | 301,482 | |
| ANSYS, Inc. (a) | 500 | 45,385 | |
| Autoliv, Inc. | 13,654 | 1,672,205 | |
| Berkshire Hathaway, Inc. Class B (a) | 9,016 | 1,311,648 | |
| Broadridge Financial Solutions, Inc. | 1,340 | 80,186 | |
| Chevron Corp. | 9,000 | 919,620 | |
| China Biologic Products, Inc. (a) | 10,200 | 1,193,400 | |
| ConocoPhillips Co. | 22,200 | 1,060,938 | |
| Constellation Brands, Inc. Class A (sub. vtg.) | 8,300 | 1,295,298 | |
| Danaher Corp. | 3,200 | 309,600 | |
| Domino's Pizza, Inc. | 6,800 | 821,984 | |
| Ecolab, Inc. | 2,800 | 321,944 | |
| Edgewell Personal Care Co. (a) | 5,400 | 443,178 | |
| Energizer Holdings, Inc. | 1,000 | 43,490 | |
| Facebook, Inc. Class A (a) | 2,800 | 329,224 | |
| Gartner, Inc. Class A (a) | 3,400 | 296,378 | |
| International Flavors & Fragrances, Inc. | 3,100 | 370,357 | |
| Kennedy-Wilson Holdings, Inc. | 7,773 | 167,975 | |
| Martin Marietta Materials, Inc. | 4,970 | 841,073 | |
| MasterCard, Inc. Class A | 26,000 | 2,521,740 | |
| McGraw Hill Financial, Inc. | 19,800 | 2,115,630 | |
| MercadoLibre, Inc. | 3,100 | 387,159 | |
| Mettler-Toledo International, Inc. (a) | 1,000 | 357,950 | |
| Mohawk Industries, Inc. (a) | 8,665 | 1,669,139 | |
| Molson Coors Brewing Co. Class B | 14,800 | 1,415,324 | |
| Moody's Corp. | 9,900 | 947,628 | |
| MSCI, Inc. Class A | 12,200 | 926,468 | |
| NIKE, Inc. Class B | 5,600 | 330,064 | |
| Philip Morris International, Inc. | 18,500 | 1,815,220 | |
| PPG Industries, Inc. | 2,900 | 320,131 | |
| PriceSmart, Inc. | 8,885 | 768,908 | |
| ResMed, Inc. | 12,720 | 709,776 | |
| Reynolds American, Inc. | 24,900 | 1,235,040 | |
| Sherwin-Williams Co. | 2,300 | 660,813 | |
| SS&C Technologies Holdings, Inc. | 14,054 | 859,402 | |
| The Walt Disney Co. | 3,000 | 309,780 | |
| TransDigm Group, Inc. (a) | 1,500 | 341,805 | |
| Visa, Inc. Class A | 32,877 | 2,539,419 | |
| TOTAL UNITED STATES OF AMERICA | 35,191,278 | ||
| TOTAL COMMON STOCKS | |||
| (Cost $262,015,051) | 305,478,629 | ||
| Nonconvertible Preferred Stocks - 1.1% | |||
| Brazil - 0.9% | |||
| Ambev SA sponsored ADR | 152,100 | 850,239 | |
| Banco Bradesco SA (PN) | 113,850 | 857,372 | |
| Itau Unibanco Holding SA | 94,300 | 901,255 | |
| TOTAL BRAZIL | 2,608,866 | ||
| Germany - 0.2% | |||
| Sartorius AG (non-vtg.) | 900 | 222,031 | |
| Volkswagen AG | 2,990 | 432,927 | |
| TOTAL GERMANY | 654,958 | ||
| TOTAL NONCONVERTIBLE PREFERRED STOCKS | |||
| (Cost $3,142,197) | 3,263,824 | ||
| Money Market Funds - 2.2% | |||
| Fidelity Cash Central Fund, 0.38% (d) | 3,860,982 | 3,860,982 | |
| Fidelity Securities Lending Cash Central Fund, 0.42% (d)(e) | 3,158,800 | 3,158,800 | |
| TOTAL MONEY MARKET FUNDS | |||
| (Cost $7,019,782) | 7,019,782 | ||
| TOTAL INVESTMENT PORTFOLIO - 100.7% | |||
| (Cost $272,177,030) | 315,762,235 | ||
| NET OTHER ASSETS (LIABILITIES) - (0.7)% | (2,185,787) | ||
| NET ASSETS - 100% | $313,576,448 |
Categorizations in the Schedule of Investments are based on country or territory of incorporation.
Legend
(a) Non-income producing
(b) Security or a portion of the security is on loan at period end.
(c) Security or a portion of the security purchased on a delayed delivery or when-issued basis.
(d) Affiliated fund that is generally available only to investment companies and other accounts managed by Fidelity Investments. The rate quoted is the annualized seven-day yield of the fund at period end. A complete unaudited listing of the fund's holdings as of its most recent quarter end is available upon request. In addition, each Fidelity Central Fund's financial statements are available on the SEC's website or upon request.
(e) Investment made with cash collateral received from securities on loan.
Affiliated Central Funds
Information regarding fiscal year to date income earned by the Fund from investments in Fidelity Central Funds is as follows:
| Fund | Income earned |
| Fidelity Cash Central Fund | $6,565 |
| Fidelity Securities Lending Cash Central Fund | 41,244 |
| Total | $47,809 |
Investment Valuation
The following is a summary of the inputs used, as of April 30, 2016, involving the Fund's assets and liabilities carried at fair value. The inputs or methodology used for valuing securities may not be an indication of the risk associated with investing in those securities. For more information on valuation inputs, and their aggregation into the levels used below, please refer to the Investment Valuation section in the accompanying Notes to Financial Statements.
| Valuation Inputs at Reporting Date: | ||||
| Description | Total | Level 1 | Level 2 | Level 3 |
| Investments in Securities: | ||||
| Equities: | ||||
| Consumer Discretionary | $44,289,186 | $31,864,746 | $12,424,440 | $-- |
| Consumer Staples | 43,532,195 | 26,785,127 | 16,747,068 | -- |
| Energy | 11,569,512 | 5,005,828 | 6,563,684 | -- |
| Financials | 59,479,309 | 30,876,288 | 28,603,021 | -- |
| Health Care | 44,295,373 | 22,767,675 | 21,527,698 | -- |
| Industrials | 34,242,642 | 25,865,080 | 8,377,562 | -- |
| Information Technology | 38,595,430 | 23,298,008 | 15,297,422 | -- |
| Materials | 17,201,467 | 14,479,937 | 2,721,530 | -- |
| Telecommunication Services | 8,990,061 | 3,478,634 | 5,511,427 | -- |
| Utilities | 6,547,278 | 676,371 | 5,870,907 | -- |
| Money Market Funds | 7,019,782 | 7,019,782 | -- | -- |
| Total Investments in Securities: | $315,762,235 | $192,117,476 | $123,644,759 | $-- |
The following is a summary of transfers between Level 1 and Level 2 for the period ended April 30, 2016. Transfers are assumed to have occurred at the beginning of the period, and are primarily attributable to the valuation techniques used for foreign equity securities, as discussed in the accompanying Notes to Financial Statements:
| Transfers | Total |
| Level 1 to Level 2 | $4,099,814 |
| Level 2 to Level 1 | $34,866,774 |
See accompanying notes which are an integral part of the financial statements.
Financial Statements
Statement of Assets and Liabilities
| April 30, 2016 (Unaudited) | ||
| Assets | ||
| Investment in securities, at value (including securities loaned of $2,961,201) — See accompanying schedule: Unaffiliated issuers (cost $265,157,248) | $308,742,453 | |
| Fidelity Central Funds (cost $7,019,782) | 7,019,782 | |
| Total Investments (cost $272,177,030) | $315,762,235 | |
| Foreign currency held at value (cost $18,143) | 17,488 | |
| Receivable for investments sold | 433,383 | |
| Receivable for fund shares sold | 52,780 | |
| Dividends receivable | 1,829,196 | |
| Distributions receivable from Fidelity Central Funds | 23,163 | |
| Prepaid expenses | 265 | |
| Receivable from investment adviser for expense reductions | 56 | |
| Other receivables | 24,958 | |
| Total assets | 318,143,524 | |
| Liabilities | ||
| Payable to custodian bank | $71,380 | |
| Payable for investments purchased | ||
| Regular delivery | 521,035 | |
| Delayed delivery | 44,749 | |
| Payable for fund shares redeemed | 436,104 | |
| Accrued management fee | 199,146 | |
| Distribution and service plan fees payable | 10,041 | |
| Other affiliated payables | 47,252 | |
| Other payables and accrued expenses | 78,569 | |
| Collateral on securities loaned, at value | 3,158,800 | |
| Total liabilities | 4,567,076 | |
| Net Assets | $313,576,448 | |
| Net Assets consist of: | ||
| Paid in capital | $303,103,887 | |
| Undistributed net investment income | 1,912,194 | |
| Accumulated undistributed net realized gain (loss) on investments and foreign currency transactions | (35,054,648) | |
| Net unrealized appreciation (depreciation) on investments and assets and liabilities in foreign currencies | 43,615,015 | |
| Net Assets | $313,576,448 | |
| Calculation of Maximum Offering Price | ||
| Class A: | ||
| Net Asset Value and redemption price per share ($8,818,273 ÷ 1,166,002 shares) | $7.56 | |
| Maximum offering price per share (100/94.25 of $7.56) | $8.02 | |
| Class T: | ||
| Net Asset Value and redemption price per share ($13,627,834 ÷ 1,793,896 shares) | $7.60 | |
| Maximum offering price per share (100/96.50 of $7.60) | $7.88 | |
| Class B: | ||
| Net Asset Value and offering price per share ($93,240 ÷ 12,203 shares)(a) | $7.64 | |
| Class C: | ||
| Net Asset Value and offering price per share ($3,077,150 ÷ 406,220 shares)(a) | $7.58 | |
| Total International Equity: | ||
| Net Asset Value, offering price and redemption price per share ($284,995,679 ÷ 37,639,906 shares) | $7.57 | |
| Class I: | ||
| Net Asset Value, offering price and redemption price per share ($2,964,272 ÷ 393,120 shares) | $7.54 |
(a) Redemption price per share is equal to net asset value less any applicable contingent deferred sales charge.
See accompanying notes which are an integral part of the financial statements.
Statement of Operations
| Six months ended April 30, 2016 (Unaudited) | ||
| Investment Income | ||
| Dividends | $4,405,366 | |
| Income from Fidelity Central Funds | 47,809 | |
| Income before foreign taxes withheld | 4,453,175 | |
| Less foreign taxes withheld | (400,599) | |
| Total income | 4,052,576 | |
| Expenses | ||
| Management fee | ||
| Basic fee | $1,101,234 | |
| Performance adjustment | 185,483 | |
| Transfer agent fees | 204,427 | |
| Distribution and service plan fees | 59,906 | |
| Accounting and security lending fees | 81,700 | |
| Custodian fees and expenses | 112,889 | |
| Independent trustees' compensation | 693 | |
| Registration fees | 33,115 | |
| Audit | 63,656 | |
| Legal | 868 | |
| Miscellaneous | 1,090 | |
| Total expenses before reductions | 1,845,061 | |
| Expense reductions | (13,581) | 1,831,480 |
| Net investment income (loss) | 2,221,096 | |
| Realized and Unrealized Gain (Loss) | ||
| Net realized gain (loss) on: | ||
| Investment securities: | ||
| Unaffiliated issuers | (5,285,836) | |
| Foreign currency transactions | 74,152 | |
| Total net realized gain (loss) | (5,211,684) | |
| Change in net unrealized appreciation (depreciation) on: Investment securities (net of decrease in deferred foreign taxes of $30,538) | (4,718,985) | |
| Assets and liabilities in foreign currencies | 3,044 | |
| Total change in net unrealized appreciation (depreciation) | (4,715,941) | |
| Net gain (loss) | (9,927,625) | |
| Net increase (decrease) in net assets resulting from operations | $(7,706,529) |
See accompanying notes which are an integral part of the financial statements.
Statement of Changes in Net Assets
| Six months ended April 30, 2016 (Unaudited) | Year ended October 31, 2015 | |
| Increase (Decrease) in Net Assets | ||
| Operations | ||
| Net investment income (loss) | $2,221,096 | $4,170,618 |
| Net realized gain (loss) | (5,211,684) | (5,852,740) |
| Change in net unrealized appreciation (depreciation) | (4,715,941) | (558,579) |
| Net increase (decrease) in net assets resulting from operations | (7,706,529) | (2,240,701) |
| Distributions to shareholders from net investment income | (3,869,339) | (5,482,469) |
| Distributions to shareholders from net realized gain | – | (1,726,810) |
| Total distributions | (3,869,339) | (7,209,279) |
| Share transactions - net increase (decrease) | (11,041,483) | (4,678,824) |
| Redemption fees | 426 | 1,289 |
| Total increase (decrease) in net assets | (22,616,925) | (14,127,515) |
| Net Assets | ||
| Beginning of period | 336,193,373 | 350,320,888 |
| End of period (including undistributed net investment income of $1,912,194 and undistributed net investment income of $3,560,437, respectively) | $313,576,448 | $336,193,373 |
See accompanying notes which are an integral part of the financial statements.
Financial Highlights — Fidelity Total International Equity Fund Class A
| Six months ended (Unaudited) April 30, | Years ended October 31, | |||||
| 2016 | 2015 | 2014 | 2013 | 2012 | 2011 | |
| Selected Per–Share Data | ||||||
| Net asset value, beginning of period | $7.79 | $8.00 | $8.27 | $7.31 | $6.67 | $7.36 |
| Income from Investment Operations | ||||||
| Net investment income (loss)A | .04 | .07 | .13 | .09 | .13 | .11 |
| Net realized and unrealized gain (loss) | (.21) | (.14) | (.12) | 1.24 | .59 | (.69) |
| Total from investment operations | (.17) | (.07) | .01 | 1.33 | .72 | (.58) |
| Distributions from net investment income | (.06) | (.10) | (.10) | (.13) | (.08) | (.09) |
| Distributions from net realized gain | – | (.04) | (.18) | (.25) | – | (.02) |
| Total distributions | (.06) | (.14) | (.28) | (.37)B | (.08) | (.11) |
| Redemption fees added to paid in capitalA,C | – | – | – | – | – | – |
| Net asset value, end of period | $7.56 | $7.79 | $8.00 | $8.27 | $7.31 | $6.67 |
| Total ReturnD,E,F | (2.18)% | (.89)% | .19% | 19.00% | 10.88% | (8.03)% |
| Ratios to Average Net AssetsG,H | ||||||
| Expenses before reductions | 1.53%I | 1.48% | 1.44% | 1.50% | 1.57% | 1.73% |
| Expenses net of fee waivers, if any | 1.45%I | 1.45% | 1.44% | 1.45% | 1.45% | 1.45% |
| Expenses net of all reductions | 1.45%I | 1.44% | 1.44% | 1.43% | 1.42% | 1.42% |
| Net investment income (loss) | 1.12%I | .86% | 1.63% | 1.21% | 1.88% | 1.44% |
| Supplemental Data | ||||||
| Net assets, end of period (000 omitted) | $8,818 | $9,163 | $9,164 | $9,034 | $5,767 | $4,307 |
| Portfolio turnover rateJ | 43%I | 53% | 85% | 89% | 110% | 75% |
A Calculated based on average shares outstanding during the period.
B Total distributions of $.37 per share is comprised of distributions from net investment income of $.126 and distributions from net realized gain of $.245 per share.
C Amount represents less than $.005 per share.
D Total returns for periods of less than one year are not annualized.
E Total returns would have been lower if certain expenses had not been reduced during the applicable periods shown.
F Total returns do not include the effect of the sales charges.
G Fees and expenses of any underlying Fidelity Central Funds are not included in the Fund's expense ratio. The Fund indirectly bears its proportionate share of the expenses of any underlying Fidelity Central Funds.
H Expense ratios reflect operating expenses of the class. Expenses before reductions do not reflect amounts reimbursed by the investment adviser or reductions from brokerage service arrangements or reductions from other expense offset arrangements and do not represent the amount paid by the class during periods when reimbursements or reductions occur. Expenses net of fee waivers reflect expenses after reimbursement by the investment adviser but prior to reductions from brokerage service arrangements or other expense offset arrangements. Expenses net of all reductions represent the net expenses paid by the class.
I Annualized
J Amount does not include the portfolio activity of any underlying Fidelity Central Funds.
See accompanying notes which are an integral part of the financial statements.
Financial Highlights — Fidelity Total International Equity Fund Class T
| Six months ended (Unaudited) April 30, | Years ended October 31, | |||||
| 2016 | 2015 | 2014 | 2013 | 2012 | 2011 | |
| Selected Per–Share Data | ||||||
| Net asset value, beginning of period | $7.81 | $8.04 | $8.32 | $7.37 | $6.73 | $7.41 |
| Income from Investment Operations | ||||||
| Net investment income (loss)A | .03 | .05 | .11 | .07 | .11 | .09 |
| Net realized and unrealized gain (loss) | (.20) | (.15) | (.12) | 1.25 | .59 | (.68) |
| Total from investment operations | (.17) | (.10) | (.01) | 1.32 | .70 | (.59) |
| Distributions from net investment income | (.04) | (.09) | (.09) | (.13) | (.06) | (.07) |
| Distributions from net realized gain | – | (.04) | (.18) | (.25) | – | (.02) |
| Total distributions | (.04) | (.13) | (.27) | (.37)B | (.06) | (.09) |
| Redemption fees added to paid in capitalA,C | – | – | – | – | – | – |
| Net asset value, end of period | $7.60 | $7.81 | $8.04 | $8.32 | $7.37 | $6.73 |
| Total ReturnD,E,F | (2.15)% | (1.26)% | (.06)% | 18.73% | 10.52% | (8.08)% |
| Ratios to Average Net AssetsG,H | ||||||
| Expenses before reductions | 1.75%I | 1.70% | 1.68% | 1.75% | 1.84% | 2.02% |
| Expenses net of fee waivers, if any | 1.70%I | 1.70% | 1.68% | 1.70% | 1.70% | 1.70% |
| Expenses net of all reductions | 1.70%I | 1.69% | 1.68% | 1.67% | 1.67% | 1.67% |
| Net investment income (loss) | .87%I | .61% | 1.38% | .96% | 1.63% | 1.19% |
| Supplemental Data | ||||||
| Net assets, end of period (000 omitted) | $13,628 | $13,962 | $10,282 | $7,909 | $2,348 | $997 |
| Portfolio turnover rateJ | 43%I | 53% | 85% | 89% | 110% | 75% |
A Calculated based on average shares outstanding during the period.
B Total distributions of $.37 per share is comprised of distributions from net investment income of $.128 and distributions from net realized gain of $.245 per share.
C Amount represents less than $.005 per share.
D Total returns for periods of less than one year are not annualized.
E Total returns would have been lower if certain expenses had not been reduced during the applicable periods shown.
F Total returns do not include the effect of the sales charges.
G Fees and expenses of any underlying Fidelity Central Funds are not included in the Fund's expense ratio. The Fund indirectly bears its proportionate share of the expenses of any underlying Fidelity Central Funds.
H Expense ratios reflect operating expenses of the class. Expenses before reductions do not reflect amounts reimbursed by the investment adviser or reductions from brokerage service arrangements or reductions from other expense offset arrangements and do not represent the amount paid by the class during periods when reimbursements or reductions occur. Expenses net of fee waivers reflect expenses after reimbursement by the investment adviser but prior to reductions from brokerage service arrangements or other expense offset arrangements. Expenses net of all reductions represent the net expenses paid by the class.
I Annualized
J Amount does not include the portfolio activity of any underlying Fidelity Central Funds.
See accompanying notes which are an integral part of the financial statements.
Financial Highlights — Fidelity Total International Equity Fund Class B
| Six months ended (Unaudited) April 30, | Years ended October 31, | |||||
| 2016 | 2015 | 2014 | 2013 | 2012 | 2011 | |
| Selected Per–Share Data | ||||||
| Net asset value, beginning of period | $7.84 | $8.05 | $8.31 | $7.33 | $6.68 | $7.37 |
| Income from Investment Operations | ||||||
| Net investment income (loss)A | .01 | .01 | .07 | .04 | .08 | .05 |
| Net realized and unrealized gain (loss) | (.21) | (.14) | (.12) | 1.24 | .59 | (.68) |
| Total from investment operations | (.20) | (.13) | (.05) | 1.28 | .67 | (.63) |
| Distributions from net investment income | – | (.04) | (.03) | (.05) | (.02) | (.04) |
| Distributions from net realized gain | – | (.04) | (.18) | (.25) | – | (.02) |
| Total distributions | – | (.08) | (.21) | (.30) | (.02) | (.06) |
| Redemption fees added to paid in capitalA,B | – | – | – | – | – | – |
| Net asset value, end of period | $7.64 | $7.84 | $8.05 | $8.31 | $7.33 | $6.68 |
| Total ReturnC,D,E | (2.55)% | (1.62)% | (.56)% | 18.05% | 10.05% | (8.66)% |
| Ratios to Average Net AssetsF,G | ||||||
| Expenses before reductions | 2.30%H | 2.26% | 2.22% | 2.26% | 2.34% | 2.51% |
| Expenses net of fee waivers, if any | 2.20%H | 2.20% | 2.20% | 2.20% | 2.20% | 2.20% |
| Expenses net of all reductions | 2.20%H | 2.19% | 2.20% | 2.18% | 2.17% | 2.17% |
| Net investment income (loss) | .37%H | .11% | .87% | .46% | 1.13% | .69% |
| Supplemental Data | ||||||
| Net assets, end of period (000 omitted) | $93 | $120 | $168 | $192 | $220 | $254 |
| Portfolio turnover rateI | 43%H | 53% | 85% | 89% | 110% | 75% |
A Calculated based on average shares outstanding during the period.
B Amount represents less than $.005 per share.
C Total returns for periods of less than one year are not annualized.
D Total returns would have been lower if certain expenses had not been reduced during the applicable periods shown.
E Total returns do not include the effect of the contingent deferred sales charge.
F Fees and expenses of any underlying Fidelity Central Funds are not included in the Fund's expense ratio. The Fund indirectly bears its proportionate share of the expenses of any underlying Fidelity Central Funds.
G Expense ratios reflect operating expenses of the class. Expenses before reductions do not reflect amounts reimbursed by the investment adviser or reductions from brokerage service arrangements or reductions from other expense offset arrangements and do not represent the amount paid by the class during periods when reimbursements or reductions occur. Expenses net of fee waivers reflect expenses after reimbursement by the investment adviser but prior to reductions from brokerage service arrangements or other expense offset arrangements. Expenses net of all reductions represent the net expenses paid by the class.
H Annualized
I Amount does not include the portfolio activity of any underlying Fidelity Central Funds.
See accompanying notes which are an integral part of the financial statements.
Financial Highlights — Fidelity Total International Equity Fund Class C
| Six months ended (Unaudited) April 30, | Years ended October 31, | |||||
| 2016 | 2015 | 2014 | 2013 | 2012 | 2011 | |
| Selected Per–Share Data | ||||||
| Net asset value, beginning of period | $7.77 | $8.00 | $8.28 | $7.31 | $6.67 | $7.36 |
| Income from Investment Operations | ||||||
| Net investment income (loss)A | .01 | .01 | .07 | .04 | .08 | .05 |
| Net realized and unrealized gain (loss) | (.20) | (.15) | (.12) | 1.25 | .58 | (.69) |
| Total from investment operations | (.19) | (.14) | (.05) | 1.29 | .66 | (.64) |
| Distributions from net investment income | – | (.05) | (.05) | (.08) | (.02) | (.03) |
| Distributions from net realized gain | – | (.04) | (.18) | (.25) | – | (.02) |
| Total distributions | – | (.09) | (.23) | (.32)B | (.02) | (.05) |
| Redemption fees added to paid in capitalA,C | – | – | – | – | – | – |
| Net asset value, end of period | $7.58 | $7.77 | $8.00 | $8.28 | $7.31 | $6.67 |
| Total ReturnD,E,F | (2.45)% | (1.73)% | (.57)% | 18.30% | 9.98% | (8.72)% |
| Ratios to Average Net AssetsG,H | ||||||
| Expenses before reductions | 2.31%I | 2.26% | 2.22% | 2.26% | 2.31% | 2.51% |
| Expenses net of fee waivers, if any | 2.20%I | 2.20% | 2.20% | 2.20% | 2.20% | 2.20% |
| Expenses net of all reductions | 2.20%I | 2.19% | 2.20% | 2.18% | 2.17% | 2.17% |
| Net investment income (loss) | .37%I | .11% | .87% | .46% | 1.13% | .69% |
| Supplemental Data | ||||||
| Net assets, end of period (000 omitted) | $3,077 | $3,311 | $4,028 | $3,584 | $2,737 | $1,396 |
| Portfolio turnover rateJ | 43%I | 53% | 85% | 89% | 110% | 75% |
A Calculated based on average shares outstanding during the period.
B Total distributions of $.32 per share is comprised of distributions from net investment income of $.075 and distributions from net realized gain of $.245 per share.
C Amount represents less than $.005 per share.
D Total returns for periods of less than one year are not annualized.
E Total returns would have been lower if certain expenses had not been reduced during the applicable periods shown.
F Total returns do not include the effect of the contingent deferred sales charge.
G Fees and expenses of any underlying Fidelity Central Funds are not included in the Fund's expense ratio. The Fund indirectly bears its proportionate share of the expenses of any underlying Fidelity Central Funds.
H Expense ratios reflect operating expenses of the class. Expenses before reductions do not reflect amounts reimbursed by the investment adviser or reductions from brokerage service arrangements or reductions from other expense offset arrangements and do not represent the amount paid by the class during periods when reimbursements or reductions occur. Expenses net of fee waivers reflect expenses after reimbursement by the investment adviser but prior to reductions from brokerage service arrangements or other expense offset arrangements. Expenses net of all reductions represent the net expenses paid by the class.
I Annualized
J Amount does not include the portfolio activity of any underlying Fidelity Central Funds.
See accompanying notes which are an integral part of the financial statements.
Financial Highlights — Fidelity Total International Equity Fund
| Six months ended (Unaudited) April 30, | Years ended October 31, | |||||
| 2016 | 2015 | 2014 | 2013 | 2012 | 2011 | |
| Selected Per–Share Data | ||||||
| Net asset value, beginning of period | $7.82 | $8.03 | $8.29 | $7.32 | $6.69 | $7.37 |
| Income from Investment Operations | ||||||
| Net investment income (loss)A | .05 | .10 | .16 | .12 | .15 | .12 |
| Net realized and unrealized gain (loss) | (.20) | (.14) | (.12) | 1.24 | .58 | (.68) |
| Total from investment operations | (.15) | (.04) | .04 | 1.36 | .73 | (.56) |
| Distributions from net investment income | (.10) | (.13) | (.12) | (.15) | (.10) | (.10) |
| Distributions from net realized gain | – | (.04) | (.18) | (.25) | – | (.02) |
| Total distributions | (.10) | (.17) | (.30) | (.39)B | (.10) | (.12) |
| Redemption fees added to paid in capitalA,C | – | – | – | – | – | – |
| Net asset value, end of period | $7.57 | $7.82 | $8.03 | $8.29 | $7.32 | $6.69 |
| Total ReturnD,E | (2.00)% | (.51)% | .55% | 19.48% | 11.03% | (7.70)% |
| Ratios to Average Net AssetsF,G | ||||||
| Expenses before reductions | 1.12%H | 1.07% | 1.04% | 1.09% | 1.16% | 1.42% |
| Expenses net of fee waivers, if any | 1.12%H | 1.07% | 1.04% | 1.09% | 1.16% | 1.20% |
| Expenses net of all reductions | 1.12%H | 1.06% | 1.04% | 1.07% | 1.13% | 1.17% |
| Net investment income (loss) | 1.46%H | 1.24% | 2.03% | 1.57% | 2.16% | 1.69% |
| Supplemental Data | ||||||
| Net assets, end of period (000 omitted) | $284,996 | $307,035 | $324,438 | $324,395 | $281,979 | $131,338 |
| Portfolio turnover rateI | 43%H | 53% | 85% | 89% | 110% | 75% |
A Calculated based on average shares outstanding during the period.
B Total distributions of $.39 per share is comprised of distributions from net investment income of $.148 and distributions from net realized gain of $.245 per share.
C Amount represents less than $.005 per share.
D Total returns for periods of less than one year are not annualized.
E Total returns would have been lower if certain expenses had not been reduced during the applicable periods shown.
F Fees and expenses of any underlying Fidelity Central Funds are not included in the Fund's expense ratio. The Fund indirectly bears its proportionate share of the expenses of any underlying Fidelity Central Funds.
G Expense ratios reflect operating expenses of the class. Expenses before reductions do not reflect amounts reimbursed by the investment adviser or reductions from brokerage service arrangements or reductions from other expense offset arrangements and do not represent the amount paid by the class during periods when reimbursements or reductions occur. Expenses net of fee waivers reflect expenses after reimbursement by the investment adviser but prior to reductions from brokerage service arrangements or other expense offset arrangements. Expenses net of all reductions represent the net expenses paid by the class.
H Annualized
I Amount does not include the portfolio activity of any underlying Fidelity Central Funds.
See accompanying notes which are an integral part of the financial statements.
Financial Highlights — Fidelity Total International Equity Fund Class I
| Six months ended (Unaudited) April 30, | Years ended October 31, | |||||
| 2016 | 2015 | 2014 | 2013 | 2012 | 2011 | |
| Selected Per–Share Data | ||||||
| Net asset value, beginning of period | $7.78 | $7.99 | $8.26 | $7.30 | $6.67 | $7.35 |
| Income from Investment Operations | ||||||
| Net investment income (loss)A | .05 | .09 | .15 | .11 | .14 | .12 |
| Net realized and unrealized gain (loss) | (.20) | (.14) | (.12) | 1.24 | .59 | (.68) |
| Total from investment operations | (.15) | (.05) | .03 | 1.35 | .73 | (.56) |
| Distributions from net investment income | (.09) | (.12) | (.12) | (.15) | (.10) | (.10) |
| Distributions from net realized gain | – | (.04) | (.18) | (.25) | – | (.02) |
| Total distributions | (.09) | (.16) | (.30) | (.39)B | (.10) | (.12) |
| Redemption fees added to paid in capitalA,C | – | – | – | – | – | – |
| Net asset value, end of period | $7.54 | $7.78 | $7.99 | $8.26 | $7.30 | $6.67 |
| Total ReturnD,E | (1.99)% | (.64)% | .37% | 19.40% | 11.06% | (7.72)% |
| Ratios to Average Net AssetsF,G | ||||||
| Expenses before reductions | 1.24%H | 1.17% | 1.15% | 1.21% | 1.27% | 1.48% |
| Expenses net of fee waivers, if any | 1.20%H | 1.17% | 1.15% | 1.20% | 1.20% | 1.20% |
| Expenses net of all reductions | 1.20%H | 1.16% | 1.15% | 1.18% | 1.17% | 1.17% |
| Net investment income (loss) | 1.37%H | 1.14% | 1.91% | 1.46% | 2.13% | 1.69% |
| Supplemental Data | ||||||
| Net assets, end of period (000 omitted) | $2,964 | $2,602 | $2,240 | $2,372 | $1,514 | $197 |
| Portfolio turnover rateI | 43%H | 53% | 85% | 89% | 110% | 75% |
A Calculated based on average shares outstanding during the period.
B Total distributions of $.39 per share is comprised of distributions from net investment income of $.148 and distributions from net realized gain of $.245 per share.
C Amount represents less than $.005 per share.
D Total returns for periods of less than one year are not annualized.
E Total returns would have been lower if certain expenses had not been reduced during the applicable periods shown.
F Fees and expenses of any underlying Fidelity Central Funds are not included in the Fund's expense ratio. The Fund indirectly bears its proportionate share of the expenses of any underlying Fidelity Central Funds.
G Expense ratios reflect operating expenses of the class. Expenses before reductions do not reflect amounts reimbursed by the investment adviser or reductions from brokerage service arrangements or reductions from other expense offset arrangements and do not represent the amount paid by the class during periods when reimbursements or reductions occur. Expenses net of fee waivers reflect expenses after reimbursement by the investment adviser but prior to reductions from brokerage service arrangements or other expense offset arrangements. Expenses net of all reductions represent the net expenses paid by the class.
H Annualized
I Amount does not include the portfolio activity of any underlying Fidelity Central Funds.
See accompanying notes which are an integral part of the financial statements.
Notes to Financial Statements (Unaudited)
For the period ended April 30, 2016
1. Organization.
Fidelity Total International Equity Fund (the Fund) is a fund of Fidelity Investment Trust (the Trust) and is authorized to issue an unlimited number of shares. The Trust is registered under the Investment Company Act of 1940, as amended (the 1940 Act), as an open-end management investment company organized as a Massachusetts business trust. The Fund offers Class A, Class T, Class C, Total International Equity and Class I shares, each of which, along with Class B shares, has equal rights as to assets and voting privileges. Class B shares are closed to new accounts and additional purchases, except for exchanges and reinvestments. Each class has exclusive voting rights with respect to matters that affect that class. Class B shares will automatically convert to Class A shares after a maximum holding period of seven years from the initial date of purchase. The Fund's investments in emerging markets can be subject to social, economic, regulatory, and political uncertainties and can be extremely volatile.
During the period, the Board of Trustees approved the conversion of all existing Class B shares into Class A shares, effective on or about July 1, 2016, regardless of the length of times shares have been held.
2. Investments in Fidelity Central Funds.
The Fund invests in Fidelity Central Funds, which are open-end investment companies generally available only to other investment companies and accounts managed by the investment adviser and its affiliates. The Fund's Schedule of Investments lists each of the Fidelity Central Funds held as of period end, if any, as an investment of the Fund, but does not include the underlying holdings of each Fidelity Central Fund. As an Investing Fund, the Fund indirectly bears its proportionate share of the expenses of the underlying Fidelity Central Funds.
The Money Market Central Funds seek preservation of capital and current income and are managed by Fidelity Investments Money Management, Inc. (FIMM), an affiliate of the investment adviser. Annualized expenses of the Money Market Central Funds as of their most recent shareholder report date are less than .005%.
A complete unaudited list of holdings for each Fidelity Central Fund is available upon request or at the Securities and Exchange Commission (the SEC) website at www.sec.gov. In addition, the financial statements of the Fidelity Central Funds are available on the SEC website or upon request.
3. Significant Accounting Policies.
The financial statements have been prepared in conformity with accounting principles generally accepted in the United States of America (GAAP), which require management to make certain estimates and assumptions at the date of the financial statements. Actual results could differ from those estimates. Subsequent events, if any, through the date that the financial statements were issued have been evaluated in the preparation of the financial statements. The following summarizes the significant accounting policies of the Fund:
Investment Valuation. Investments are valued as of 4:00 p.m. Eastern time on the last calendar day of the period. The Board of Trustees (the Board) has delegated the day to day responsibility for the valuation of the Fund's investments to the Fidelity Management & Research Company (FMR) Fair Value Committee (the Committee). In accordance with valuation policies and procedures approved by the Board, the Fund attempts to obtain prices from one or more third party pricing vendors or brokers to value its investments. When current market prices, quotations or currency exchange rates are not readily available or reliable, investments will be fair valued in good faith by the Committee, in accordance with procedures adopted by the Board. Factors used in determining fair value vary by investment type and may include market or investment specific events. The frequency with which these procedures are used cannot be predicted and they may be utilized to a significant extent. The Committee oversees the Fund's valuation policies and procedures and reports to the Board on the Committee's activities and fair value determinations. The Board monitors the appropriateness of the procedures used in valuing the Fund's investments and ratifies the fair value determinations of the Committee.
The Fund categorizes the inputs to valuation techniques used to value its investments into a disclosure hierarchy consisting of three levels as shown below:
- Level 1 – quoted prices in active markets for identical investments
- Level 2 – other significant observable inputs (including quoted prices for similar investments, interest rates, prepayment speeds, etc.)
- Level 3 – unobservable inputs (including the Fund's own assumptions based on the best information available)
Valuation techniques used to value the Fund's investments by major category are as follows:
Equity securities, including restricted securities, for which market quotations are readily available, are valued at the last reported sale price or official closing price as reported by a third party pricing vendor on the primary market or exchange on which they are traded and are categorized as Level 1 in the hierarchy. In the event there were no sales during the day or closing prices are not available, securities are valued at the last quoted bid price or may be valued using the last available price and are generally categorized as Level 2 in the hierarchy. For foreign equity securities, when market or security specific events arise, comparisons to the valuation of American Depositary Receipts (ADRs), futures contracts, Exchange-Traded Funds (ETFs) and certain indexes as well as quoted prices for similar securities may be used and would be categorized as Level 2 in the hierarchy. Utilizing these techniques may result in transfers between Level 1 and Level 2. For equity securities, including restricted securities, where observable inputs are limited, assumptions about market activity and risk are used and these securities may be categorized as Level 3 in the hierarchy.
Investments in open-end mutual funds, including the Fidelity Central Funds, are valued at their closing net asset value (NAV) each business day and are categorized as Level 1 in the hierarchy.
Changes in valuation techniques may result in transfers in or out of an assigned level within the disclosure hierarchy. The aggregate value of investments by input level as of April 30, 2016, including information on transfers between Levels 1 and 2 is included at the end of the Fund's Schedule of Investments.
Foreign Currency. The Fund may use foreign currency contracts to facilitate transactions in foreign-denominated securities. Gains and losses from these transactions may arise from changes in the value of the foreign currency or if the counterparties do not perform under the contracts' terms.
Foreign-denominated assets, including investment securities, and liabilities are translated into U.S. dollars at the exchange rates at period end. Purchases and sales of investment securities, income and dividends received and expenses denominated in foreign currencies are translated into U.S. dollars at the exchange rate in effect on the transaction date.
The effects of exchange rate fluctuations on investments are included with the net realized and unrealized gain (loss) on investment securities. Other foreign currency transactions resulting in realized and unrealized gain (loss) are disclosed separately.
Investment Transactions and Income. For financial reporting purposes, the Fund's investment holdings and NAV include trades executed through the end of the last business day of the period. The NAV per share for processing shareholder transactions is calculated as of the close of business of the New York Stock Exchange (NYSE), normally 4:00 p.m. Eastern time and includes trades executed through the end of the prior business day. Gains and losses on securities sold are determined on the basis of identified cost. Dividend income is recorded on the ex-dividend date, except for certain dividends from foreign securities where the ex-dividend date may have passed, which are recorded as soon as the Fund is informed of the ex-dividend date. Non-cash dividends included in dividend income, if any, are recorded at the fair market value of the securities received. Income and capital gain distributions from Fidelity Central Funds, if any, are recorded on the ex-dividend date. Distributions received on securities that represent a return of capital or capital gain are recorded as a reduction of cost of investments and/or as a realized gain. Subsequent to ex-dividend date the Fund determines the components of these distributions, based upon receipt of tax filings or other correspondence relating to the underlying investment. Interest income is accrued as earned and includes coupon interest and amortization of premium and accretion of discount on debt securities as applicable. Investment income is recorded net of foreign taxes withheld where recovery of such taxes is uncertain.
Class Allocations and Expenses. Investment income, realized and unrealized capital gains and losses, common expenses of the Fund, and certain fund-level expense reductions, if any, are allocated daily on a pro-rata basis to each class based on the relative net assets of each class to the total net assets of the Fund. Each class differs with respect to transfer agent and distribution and service plan fees incurred. Certain expense reductions may also differ by class. For the reporting period, the allocated portion of income and expenses to each class as a percent of its average net assets may vary due to the timing of recording these transactions in relation to fluctuating net assets of the classes. Expenses directly attributable to a fund are charged to that fund. Expenses attributable to more than one fund are allocated among the respective funds on the basis of relative net assets or other appropriate methods. Expense estimates are accrued in the period to which they relate and adjustments are made when actual amounts are known.
Income Tax Information and Distributions to Shareholders. Each year, the Fund intends to qualify as a regulated investment company under Subchapter M of the Internal Revenue Code, including distributing substantially all of its taxable income and realized gains. As a result, no provision for U.S. Federal income taxes is required. The Fund files a U.S. federal tax return, in addition to state and local tax returns as required. The Fund's federal income tax returns are subject to examination by the Internal Revenue Service (IRS) for a period of three fiscal years after they are filed. State and local tax returns may be subject to examination for an additional fiscal year depending on the jurisdiction. Foreign taxes are provided for based on the Fund's understanding of the tax rules and rates that exist in the foreign markets in which it invests. The Fund is subject to a tax imposed on capital gains by certain countries in which it invests.
Distributions are declared and recorded on the ex-dividend date. Income dividends and capital gain distributions are declared separately for each class. Income and capital gain distributions are determined in accordance with income tax regulations, which may differ from GAAP.
Capital accounts within the financial statements are adjusted for permanent book-tax differences. These adjustments have no impact on net assets or the results of operations. Capital accounts are not adjusted for temporary book-tax differences which will reverse in a subsequent period.
Book-tax differences are primarily due to foreign currency transactions, partnerships, certain foreign taxes, passive foreign investment companies (PFIC), capital loss carryforwards and losses deferred due to wash sales.
The federal tax cost of investment securities and unrealized appreciation (depreciation) as of period end were as follows:
| Gross unrealized appreciation | $ 56,805,584 |
| Gross unrealized depreciation | (15,433,463) |
| Net unrealized appreciation (depreciation) on securities | $41,372,121 |
| Tax cost | $274,390,114 |
Capital loss carryforwards are only available to offset future capital gains of the Fund to the extent provided by regulations and may be limited. Under the Regulated Investment Company Modernization Act of 2010 (the Act), the Fund is permitted to carry forward capital losses incurred in taxable years beginning after December 22, 2010 for an unlimited period and such capital losses are required to be used prior to any losses that expire. The capital loss carryforward information presented below, including any applicable limitation, is estimated as of prior fiscal period end and is subject to adjustment.
| Fiscal year of expiration | |
| 2017 | $(13,607,298) |
| 2019 | (8,855,997) |
| Total with expiration | $(22,463,295) |
| No expiration | |
| Short-term | (5,613,592) |
| Total capital loss carryforward | $(28,076,887) |
Due to large subscriptions in a prior period, $22,463,295 of capital losses that will be available to offset future capital gains of the Fund will be limited to approximately $4,535,766 per year.
Short-Term Trading (Redemption) Fees. Shares held by investors in the Fund less than 30 days may have been subject to a redemption fee equal to 1.00% of the NAV of shares redeemed. All redemption fees, which reduce the proceeds of the shareholder redemption, are retained by the Fund and accounted for as an addition to paid in capital.
Delayed Delivery Transactions and When-Issued Securities. During the period, the Fund transacted in securities on a delayed delivery or when-issued basis. Payment and delivery may take place after the customary settlement period for that security. The price of the underlying securities and the date when the securities will be delivered and paid for are fixed at the time the transaction is negotiated. The securities purchased on a delayed delivery or when-issued basis are identified as such in the Fund's Schedule of Investments. With respect to purchase commitments, the Fund identifies securities as segregated in its records with a value at least equal to the amount of the commitment. Losses may arise due to changes in the value of the underlying securities or if the counterparty does not perform under the contract's terms, or if the issuer does not issue the securities due to political, economic, or other factors.
4. Purchases and Sales of Investments.
Purchases and sales of securities, other than short-term securities, aggregated $67,742,727 and $81,527,820, respectively.
5. Fees and Other Transactions with Affiliates.
Management Fee. Fidelity Management & Research Company (the investment adviser) and its affiliates provide the Fund with investment management related services for which the Fund pays a monthly management fee. The management fee is the sum of an individual fund fee rate that is based on an annual rate of .45% of the Fund's average net assets and an annualized group fee rate that averaged .25% during the period. The group fee rate is based upon the average net assets of all the mutual funds advised by the investment adviser, including any mutual funds previously advised by the investment adviser that are currently advised by Fidelity SelectCo, LLC, an affiliate of the investment adviser. The group fee rate decreases as assets under management increase and increases as assets under management decrease. In addition, the management fee is subject to a performance adjustment (up to a maximum of +/- .20% of the Fund's average net assets over a 36 month performance period). The upward or downward adjustment to the management fee is based on the relative investment performance of Total International Equity as compared to its benchmark index, the MSCI All Country World ex USA Index, over the same 36 month performance period. For the reporting period, the total annualized management fee rate, including the performance adjustment, was .82% of the Fund's average net assets. The performance adjustment included in the management fee rate may be higher or lower than the maximum performance adjustment rate due to the difference between the average net assets for the reporting and performance periods.
Distribution and Service Plan Fees. In accordance with Rule 12b-1 of the 1940 Act, the Fund has adopted separate Distribution and Service Plans for each class of shares. Certain classes pay Fidelity Distributors Corporation (FDC), an affiliate of the investment adviser, separate Distribution and Service Fees, each of which is based on an annual percentage of each class' average net assets. In addition, FDC may pay financial intermediaries for selling shares of the Fund and providing shareholder support services. For the period, the Distribution and Service Fee rates, total fees and amounts retained by FDC were as follows:
| Distribution Fee | Service Fee | Total Fees | Retained by FDC | |
| Class A | -% | .25% | $10,969 | $810 |
| Class T | .25% | .25% | 32,951 | 57 |
| Class B | .75% | .25% | 515 | 386 |
| Class C | .75% | .25% | 15,471 | 2,767 |
| $59,906 | $4,020 |
Sales Load. FDC may receive a front-end sales charge of up to 5.75% for selling Class A shares and 3.50% for selling Class T shares, some of which is paid to financial intermediaries for selling shares of the Fund. Depending on the holding period, FDC may receive contingent deferred sales charges levied on Class A, Class T, Class B, and Class C redemptions. The deferred sales charges range from 5.00% to 1.00% for Class B shares, 1.00% for Class C shares, 1.00% for certain purchases of Class A shares and .25% for certain purchases of Class T shares.
For the period, sales charge amounts retained by FDC were as follows:
| Retained by FDC | |
| Class A | $1,356 |
| Class T | 488 |
| Class B(a) | – |
| Class C(a) | 295 |
| $2,139 |
(a) When Class B and Class C shares are initially sold, FDC pays commissions from its own resources to financial intermediaries through which the sales are made.
Transfer Agent Fees. Fidelity Investments Institutional Operations Company, Inc., (FIIOC), an affiliate of the investment adviser, is the transfer, dividend disbursing and shareholder servicing agent for each class of the Fund. FIIOC receives account fees and asset-based fees that vary according to the account size and type of account of the shareholders of the respective classes of the Fund. FIIOC pays for typesetting, printing and mailing of shareholder reports, except proxy statements.
For the period, transfer agent fees for each class were as follows:
| Amount | % of Class-Level Average Net Assets(a) | |
| Class A | $12,141 | .28 |
| Class T | 16,142 | .24 |
| Class B | 152 | .30 |
| Class C | 4,828 | .31 |
| Total International Equity | 168,031 | .12 |
| Class I | 3,133 | .24 |
| $204,427 |
(a) Annualized
Accounting and Security Lending Fees. Fidelity Service Company, Inc. (FSC), an affiliate of the investment adviser, maintains the Fund's accounting records. The accounting fee is based on the level of average net assets for each month. Under a separate contract, FSC administers the security lending program. The security lending fee is based on the number and duration of lending transactions.
Brokerage Commissions. The Fund placed a portion of its portfolio transactions with brokerage firms which are affiliates of the investment adviser. Brokerage commissions are included in net realized gain (loss) and change in net unrealized appreciation (depreciation) in the Statement of Operations. The commissions paid to these affiliated firms were $330 for the period.
Interfund Trades. The Fund may purchase from or sell securities to other Fidelity Funds under procedures adopted by the Board. The procedures have been designed to ensure these interfund trades are executed in accordance with Rule 17a-7 of the 1940 Act. Interfund trades are included within the respective purchases and sales amounts shown in the Purchases and Sales of Investments note.
6. Committed Line of Credit.
The Fund participates with other funds managed by the investment adviser or an affiliate in a $4.25 billion credit facility (the "line of credit") to be utilized for temporary or emergency purposes to fund shareholder redemptions or for other short-term liquidity purposes. The Fund has agreed to pay commitment fees on its pro-rata portion of the line of credit, which amounted to $282 and is reflected in Miscellaneous expenses on the Statement of Operations. During the period, the Fund did not borrow on this line of credit.
7. Security Lending.
The Fund lends portfolio securities through a lending agent from time to time in order to earn additional income. For equity securities, a lending agent is used and may loan securities to certain qualified borrowers, including Fidelity Capital Markets (FCM), a broker-dealer affiliated with the Fund. On the settlement date of the loan, the Fund receives collateral (in the form of U.S. Treasury obligations, letters of credit and/or cash) against the loaned securities and maintains collateral in an amount not less than 100% of the market value of the loaned securities during the period of the loan. The market value of the loaned securities is determined at the close of business of the Fund and any additional required collateral is delivered to the Fund on the next business day. The Fund or borrower may terminate the loan at any time, and if the borrower defaults on its obligation to return the securities loaned because of insolvency or other reasons, the Fund may apply collateral received from the borrower against the obligation. The Fund may experience delays and costs in recovering the securities loaned. Any cash collateral received is invested in the Fidelity Securities Lending Cash Central Fund. The value of loaned securities and cash collateral at period end are disclosed on the Fund's Statement of Assets and Liabilities. Security lending income represents the income earned on investing cash collateral, less rebates paid to borrowers and any lending agent fees associated with the loan, plus any premium payments received for lending certain types of securities. Security lending income is presented in the Statement of Operations as a component of income from Fidelity Central Funds. Total security lending income during the period amounted to $41,244. During the period, there were no securities loaned to FCM.
8. Expense Reductions.
The investment adviser contractually agreed to reimburse each class to the extent annual operating expenses exceeded certain levels of average net assets as noted in the table below. This reimbursement will remain in place through December 31, 2016. Some expenses, for example interest expense, including commitment fees, are excluded from this reimbursement.
The following classes were in reimbursement during the period:
| Expense Limitations | Reimbursement | |
| Class A | 1.45% | $3,471 |
| Class T | 1.70% | 3,118 |
| Class B | 2.20% | 49 |
| Class C | 2.20% | 1,763 |
| Class I | 1.20% | 563 |
| $8,964 |
Commissions paid to certain brokers with whom the investment adviser, or its affiliates, places trades on behalf of the Fund include an amount in addition to trade execution, which may be rebated back to the Fund to offset certain expenses. This amount totaled $3,442 for the period.
In addition, during the period the investment adviser reimbursed and/or waived a portion of fund-level operating expenses in the amount of $1,175.
9. Distributions to Shareholders.
Distributions to shareholders of each class were as follows:
| Six months ended April 30, 2016 | Year ended October 31, 2015 | |
| From net investment income | ||
| Class A | $72,361 | $113,499 |
| Class T | 77,358 | 118,041 |
| Class B | – | 852 |
| Class C | – | 26,493 |
| Total International Equity | 3,691,251 | 5,189,901 |
| Class I | 28,369 | 33,683 |
| Total | $3,869,339 | $5,482,469 |
| From net realized gain | ||
| Class A | $– | $45,400 |
| Class T | – | 52,463 |
| Class B | – | 832 |
| Class C | – | 19,994 |
| Total International Equity | – | 1,596,893 |
| Class I | – | 11,228 |
| Total | $– | $1,726,810 |
10. Share Transactions.
Share transactions for each class were as follows and may contain automatic conversions between classes or exchanges between affiliated funds:
| Shares | Shares | Dollars | Dollars | |
| Six months ended April 30, 2016 | Year ended October 31, 2015 | Six months ended April 30, 2016 | Year ended October 31, 2015 | |
| Class A | ||||
| Shares sold | 125,145 | 302,437 | $923,609 | $2,413,258 |
| Reinvestment of distributions | 9,322 | 20,115 | 71,782 | 158,306 |
| Shares redeemed | (145,056) | (290,995) | (1,062,034) | (2,277,557) |
| Net increase (decrease) | (10,589) | 31,557 | $(66,643) | $294,007 |
| Class T | ||||
| Shares sold | 242,570 | 824,018 | $1,805,986 | $6,637,966 |
| Reinvestment of distributions | 9,988 | 21,537 | 77,308 | 170,355 |
| Shares redeemed | (245,478) | (337,655) | (1,795,924) | (2,691,540) |
| Net increase (decrease) | 7,080 | 507,900 | $87,370 | $4,116,781 |
| Class B | ||||
| Shares sold | 1,079 | 2,293 | $7,667 | $19,363 |
| Reinvestment of distributions | – | 210 | – | 1,675 |
| Shares redeemed | (4,239) | (7,999) | (31,696) | (62,934) |
| Net increase (decrease) | (3,160) | (5,496) | $(24,029) | $(41,896) |
| Class C | ||||
| Shares sold | 40,022 | 142,460 | $294,781 | $1,136,553 |
| Reinvestment of distributions | – | 4,767 | – | 37,661 |
| Shares redeemed | (60,109) | (224,769) | (446,353) | (1,823,746) |
| Net increase (decrease) | (20,087) | (77,542) | $(151,572) | $(649,532) |
| Total International Equity | ||||
| Shares sold | 2,536,155 | 6,834,390 | $18,902,576 | $54,586,662 |
| Reinvestment of distributions | 471,692 | 851,193 | 3,632,026 | 6,698,889 |
| Shares redeemed | (4,642,011) | (8,793,992) | (33,862,381) | (70,164,751) |
| Net increase (decrease) | (1,634,164) | (1,108,409) | $(11,327,779) | $(8,879,200) |
| Class I | ||||
| Shares sold | 102,309 | 149,022 | $761,726 | $1,222,878 |
| Reinvestment of distributions | 3,671 | 5,728 | 28,160 | 44,910 |
| Shares redeemed | (47,313) | (100,501) | (348,716) | (786,772) |
| Net increase (decrease) | 58,667 | 54,249 | $441,170 | $481,016 |
11. Other.
The Fund's organizational documents provide former and current trustees and officers with a limited indemnification against liabilities arising in connection with the performance of their duties to the Fund. In the normal course of business, the Fund may also enter into contracts that provide general indemnifications. The Fund's maximum exposure under these arrangements is unknown as this would be dependent on future claims that may be made against the Fund. The risk of material loss from such claims is considered remote.
At the end of the period, a shareholder of record owned approximately 71% of the total outstanding shares of the Fund.
Shareholder Expense Example
As a shareholder of the Fund, you incur two types of costs: (1) transaction costs, including sales charges (loads) on purchase payments or redemption proceeds, redemption fees and (2) ongoing costs, including management fees, distribution and/or service (12b-1) fees and other Fund expenses. This Example is intended to help you understand your ongoing costs (in dollars) of investing in the Fund and to compare these costs with the ongoing costs of investing in other mutual funds.
The Example is based on an investment of $1,000 invested at the beginning of the period and held for the entire period (November 1, 2015 to April 30, 2016).
Actual Expenses
The first line of the accompanying table for each class of the Fund provides information about actual account values and actual expenses. You may use the information in this line, together with the amount you invested, to estimate the expenses that you paid over the period. Simply divide your account value by $1,000.00 (for example, an $8,600 account value divided by $1,000.00 = 8.6), then multiply the result by the number in the first line for a class of the Fund under the heading entitled "Expenses Paid During Period" to estimate the expenses you paid on your account during this period. A small balance maintenance fee of $12.00 that is charged once a year may apply for certain accounts with a value of less than $2,000. This fee is not included in the table below. If it was, the estimate of expenses you paid during the period would be higher, and your ending account value lower, by this amount. In addition, the Fund, as a shareholder in the underlying Fidelity Central Funds, will indirectly bear its pro-rata share of the fees and expenses incurred by the underlying Fidelity Central Funds. These fees and expenses are not included in the Fund's annualized expense ratio used to calculate the expense estimate in the table below.
Hypothetical Example for Comparison Purposes
The second line of the accompanying table for each class of the Fund provides information about hypothetical account values and hypothetical expenses based on a Class' actual expense ratio and an assumed rate of return of 5% per year before expenses, which is not the Class' actual return. The hypothetical account values and expenses may not be used to estimate the actual ending account balance or expenses you paid for the period. You may use this information to compare the ongoing costs of investing in the Fund and other funds. To do so, compare this 5% hypothetical example with the 5% hypothetical examples that appear in the shareholder reports of the other funds. A small balance maintenance fee of $12.00 that is charged once a year may apply for certain accounts with a value of less than $2,000. This fee is not included in the table below. If it was, the estimate of expenses you paid during the period would be higher, and your ending account value lower, by this amount. In addition, the Fund, as a shareholder in the underlying Fidelity Central Funds, will indirectly bear its pro-rata share of the fees and expenses incurred by the underlying Fidelity Central Funds. These fees and expenses are not included in the Fund's annualized expense ratio used to calculate the expense estimate in the table below.
Please note that the expenses shown in the table are meant to highlight your ongoing costs only and do not reflect any transaction costs. Therefore, the second line of the table is useful in comparing ongoing costs only, and will not help you determine the relative total costs of owning different funds. In addition, if these transactional costs were included, your costs would have been higher.
| Annualized Expense Ratio-A | Beginning Account Value November 1, 2015 | Ending Account Value April 30, 2016 | Expenses Paid During Period-B November 1, 2015 to April 30, 2016 | |
| Class A | 1.45% | |||
| Actual | $1,000.00 | $978.20 | $7.13 | |
| Hypothetical-C | $1,000.00 | $1,017.65 | $7.27 | |
| Class T | 1.70% | |||
| Actual | $1,000.00 | $978.50 | $8.36 | |
| Hypothetical-C | $1,000.00 | $1,016.41 | $8.52 | |
| Class B | 2.20% | |||
| Actual | $1,000.00 | $974.50 | $10.80 | |
| Hypothetical-C | $1,000.00 | $1,013.92 | $11.02 | |
| Class C | 2.20% | |||
| Actual | $1,000.00 | $975.50 | $10.81 | |
| Hypothetical-C | $1,000.00 | $1,013.92 | $11.02 | |
| Total International Equity | 1.12% | |||
| Actual | $1,000.00 | $980.00 | $5.51 | |
| Hypothetical-C | $1,000.00 | $1,019.29 | $5.62 | |
| Class I | 1.20% | |||
| Actual | $1,000.00 | $980.10 | $5.91 | |
| Hypothetical-C | $1,000.00 | $1,018.90 | $6.02 |
A Annualized expense ratio reflects expenses net of applicable fee waivers.
B Expenses are equal to each Class' annualized expense ratio, multiplied by the average account value over the period, multiplied by 182/366 (to reflect the one-half year period).
C 5% return per year before expenses
![]()
Corporate Headquarters
245 Summer St.
Boston, MA 02210
www.fidelity.com
TIE-SANN-0616
1.912361.106
Fidelity Advisor® Total Emerging Markets Fund - Semi-Annual Report April 30, 2016 Class I is a class of Fidelity® Total Emerging Markets Fund |
|
Contents
To view a fund's proxy voting guidelines and proxy voting record for the 12-month period ended June 30, visit http://www.fidelity.com/proxyvotingresults or visit the Securities and Exchange Commission's (SEC) web site at http://www.sec.gov.
You may also call 1-877-208-0098 to request a free copy of the proxy voting guidelines.
Standard & Poor's, S&P and S&P 500 are registered service marks of The McGraw-Hill Companies, Inc. and have been licensed for use by Fidelity Distributors Corporation.
Other third-party marks appearing herein are the property of their respective owners.
All other marks appearing herein are registered or unregistered trademarks or service marks of FMR LLC or an affiliated company. © 2016 FMR LLC. All rights reserved.
This report and the financial statements contained herein are submitted for the general information of the shareholders of the Fund. This report is not authorized for distribution to prospective investors in the Fund unless preceded or accompanied by an effective prospectus.
A fund files its complete schedule of portfolio holdings with the SEC for the first and third quarters of each fiscal year on Form N-Q. Forms N-Q are available on the SEC’s web site at http://www.sec.gov. A fund's Forms N-Q may be reviewed and copied at the SEC’s Public Reference Room in Washington, DC. Information regarding the operation of the SEC's Public Reference Room may be obtained by calling 1-800-SEC-0330.
For a complete list of a fund's portfolio holdings, view the most recent holdings listing, semiannual report, or annual report on Fidelity's web site at http://www.fidelity.com, http://www.advisor.fidelity.com, or http://www.401k.com, as applicable.
NOT FDIC INSURED •MAY LOSE VALUE •NO BANK GUARANTEE
Neither the Fund nor Fidelity Distributors Corporation is a bank.
Investment Summary (Unaudited)
Top Five Stocks as of April 30, 2016
| % of fund's net assets | % of fund's net assets 6 months ago | |
| Taiwan Semiconductor Manufacturing Co. Ltd. (Taiwan, Semiconductors & Semiconductor Equipment) | 2.1 | 2.0 |
| Naspers Ltd. Class N (South Africa, Media) | 2.0 | 1.2 |
| Tencent Holdings Ltd. (Cayman Islands, Internet Software & Services) | 1.5 | 1.7 |
| Alibaba Group Holding Ltd. sponsored ADR (Cayman Islands, Internet Software & Services) | 1.4 | 0.6 |
| China Mobile Ltd. (Hong Kong, Wireless Telecommuncation Services) | 1.2 | 1.1 |
| 8.2 |
Top Five Market Sectors as of April 30, 2016
| % of fund's net assets | % of fund's net assets 6 months ago | |
| Financials | 18.8 | 17.5 |
| Energy | 16.8 | 14.9 |
| Information Technology | 13.0 | 10.9 |
| Consumer Discretionary | 7.4 | 5.7 |
| Consumer Staples | 5.8 | 5.7 |
Top Five Countries as of April 30, 2016
| (excluding cash equivalents) | % of fund's net assets | % of fund's net assets 6 months ago |
| Korea (South) | 8.7 | 9.3 |
| Cayman Islands | 6.9 | 7.0 |
| Brazil | 6.1 | 5.2 |
| Mexico | 6.0 | 6.2 |
| India | 5.5 | 5.3 |
Percentages are adjusted for the effect of futures contracts, if applicable.
Asset Allocation (% of fund's net assets)
| As of April 30, 2016 | ||
| Stocks and Equity Futures | 67.5% | |
| Bonds | 28.8% | |
| Other Investments | 0.3% | |
| Short-Term Investments and Net Other Assets (Liabilities) | 3.4% | |

| As of October 31, 2015 | ||
| Stocks and Equity Futures | 55.3% | |
| Bonds | 40.8% | |
| Other Investments | 0.6% | |
| Short-Term Investments and Net Other Assets (Liabilities) | 3.3% | |

Investments April 30, 2016 (Unaudited)
Showing Percentage of Net Assets
| Common Stocks - 60.3% | |||
| Shares | Value | ||
| Argentina - 0.3% | |||
| Telecom Argentina SA Class B sponsored ADR | 4,334 | $81,132 | |
| YPF SA Class D sponsored ADR | 6,200 | 124,930 | |
| TOTAL ARGENTINA | 206,062 | ||
| Austria - 0.3% | |||
| Erste Group Bank AG | 7,805 | 224,500 | |
| Bermuda - 1.0% | |||
| AGTech Holdings Ltd. (a) | 112,000 | 25,952 | |
| Credicorp Ltd. (United States) | 1,290 | 187,592 | |
| GP Investments Ltd. Class A (depositary receipt) (a) | 22,922 | 51,253 | |
| PAX Global Technology Ltd. | 115,460 | 99,437 | |
| Shangri-La Asia Ltd. | 262,000 | 320,071 | |
| TOTAL BERMUDA | 684,305 | ||
| Brazil - 2.6% | |||
| B2W Companhia Global do Varejo (a) | 32,040 | 127,629 | |
| BB Seguridade Participacoes SA | 36,310 | 316,726 | |
| BR Properties SA | 6,700 | 20,007 | |
| CCR SA | 32,700 | 153,838 | |
| Cielo SA | 25,436 | 247,759 | |
| Companhia de Saneamento de Minas Gerais | 15,706 | 98,184 | |
| Cosan SA Industria e Comercio | 12,521 | 115,917 | |
| Direcional Engenharia SA | 42,000 | 75,104 | |
| Fibria Celulose SA | 6,700 | 59,183 | |
| FPC Par Corretora de Seguros | 33,600 | 112,839 | |
| Minerva SA (a) | 47,700 | 146,599 | |
| Smiles SA | 29,700 | 344,561 | |
| TOTAL BRAZIL | 1,818,346 | ||
| British Virgin Islands - 0.1% | |||
| Mail.Ru Group Ltd. GDR (Reg. S) (a) | 5,080 | 102,870 | |
| Canada - 0.6% | |||
| Goldcorp, Inc. | 3,600 | 72,534 | |
| Pan American Silver Corp. | 17,700 | 277,359 | |
| Torex Gold Resources, Inc. (a) | 44,300 | 78,735 | |
| TOTAL CANADA | 428,628 | ||
| Cayman Islands - 6.7% | |||
| 51job, Inc. sponsored ADR (a) | 3,100 | 92,380 | |
| 58.com, Inc. ADR (a) | 10,050 | 549,233 | |
| AAC Technology Holdings, Inc. | 11,000 | 76,351 | |
| Alibaba Group Holding Ltd. sponsored ADR (a) | 12,700 | 977,138 | |
| Autohome, Inc. ADR Class A (a) | 2,000 | 59,120 | |
| Bitauto Holdings Ltd. ADR (a) | 6,700 | 167,232 | |
| BizLink Holding, Inc. | 5,000 | 28,480 | |
| China State Construction International Holdings Ltd. | 84,000 | 130,847 | |
| CK Hutchison Holdings Ltd. | 8,770 | 104,921 | |
| Ctrip.com International Ltd. ADR (a) | 1,400 | 61,054 | |
| Haitian International Holdings Ltd. | 34,000 | 58,010 | |
| Himax Technologies, Inc. sponsored ADR | 4,100 | 42,599 | |
| JD.com, Inc. sponsored ADR (a) | 13,600 | 347,616 | |
| New Oriental Education & Technology Group, Inc. sponsored ADR | 3,100 | 121,396 | |
| Sino Biopharmaceutical Ltd. | 248,000 | 175,734 | |
| SouFun Holdings Ltd. ADR | 19,000 | 108,110 | |
| Sunny Optical Technology Group Co. Ltd. | 25,000 | 77,106 | |
| Tencent Holdings Ltd. | 51,750 | 1,053,025 | |
| Uni-President China Holdings Ltd. | 404,600 | 376,791 | |
| Vipshop Holdings Ltd. ADR (a) | 12,600 | 171,864 | |
| TOTAL CAYMAN ISLANDS | 4,779,007 | ||
| Chile - 1.0% | |||
| Compania Cervecerias Unidas SA sponsored ADR | 7,700 | 172,634 | |
| CorpBanca SA | 11,730,819 | 106,766 | |
| Empresas CMPC SA | 25,201 | 56,988 | |
| Enersis Chile SA | 316,233 | 38,579 | |
| Enersis SA | 352,800 | 60,833 | |
| Inversiones La Construccion SA | 9,283 | 109,456 | |
| Vina Concha y Toro SA | 93,580 | 156,841 | |
| TOTAL CHILE | 702,097 | ||
| China - 5.4% | |||
| Anhui Conch Cement Co. Ltd. (H Shares) | 78,000 | 205,535 | |
| BBMG Corp. (H Shares) | 224,500 | 164,071 | |
| China Life Insurance Co. Ltd. (H Shares) | 127,034 | 292,630 | |
| China Longyuan Power Grid Corp. Ltd. (H Shares) | 155,860 | 107,832 | |
| China Pacific Insurance (Group) Co. Ltd. (H Shares) | 138,106 | 484,261 | |
| China Petroleum & Chemical Corp. (H Shares) | 204,000 | 143,756 | |
| China Suntien Green Energy Corp. Ltd. (H Shares) | 328,690 | 37,395 | |
| China Telecom Corp. Ltd. (H Shares) | 334,449 | 165,574 | |
| Industrial & Commercial Bank of China Ltd. (H Shares) | 1,540,660 | 824,871 | |
| Inner Mongoli Yili Industries Co. Ltd. | 67,371 | 156,407 | |
| Kweichow Moutai Co. Ltd. | 8,040 | 311,961 | |
| Maanshan Iron & Steel Ltd. (H Shares) (a) | 296,000 | 68,021 | |
| PetroChina Co. Ltd. (H Shares) | 152,000 | 111,208 | |
| PICC Property & Casualty Co. Ltd. (H Shares) | 117,800 | 214,287 | |
| Qingdao Haier Co. Ltd. | 185,774 | 239,031 | |
| Shanghai International Airport Co. Ltd. | 19,900 | 83,638 | |
| Zhengzhou Yutong Bus Co. Ltd. | 37,500 | 118,801 | |
| Zhuzhou CSR Times Electric Co. Ltd. (H Shares) | 20,000 | 113,795 | |
| TOTAL CHINA | 3,843,074 | ||
| Colombia - 0.2% | |||
| Bancolombia SA sponsored ADR | 4,155 | 160,757 | |
| Egypt - 0.1% | |||
| Citadel Capital Corp. (a) | 141,500 | 23,583 | |
| Global Telecom Holding GDR (a) | 17,460 | 28,809 | |
| TOTAL EGYPT | 52,392 | ||
| Greece - 0.3% | |||
| Titan Cement Co. SA (Reg.) | 9,700 | 221,273 | |
| Hong Kong - 3.7% | |||
| AIA Group Ltd. | 34,320 | 205,392 | |
| China Mobile Ltd. | 16,610 | 190,696 | |
| China Mobile Ltd. sponsored ADR | 12,112 | 696,682 | |
| China Resources Beer Holdings Co. Ltd. | 104,000 | 228,531 | |
| China Resources Power Holdings Co. Ltd. | 64,189 | 108,110 | |
| CNOOC Ltd. | 441,000 | 544,777 | |
| CNOOC Ltd. sponsored ADR | 44 | 5,431 | |
| Far East Horizon Ltd. | 438,980 | 348,452 | |
| Sinotruk Hong Kong Ltd. | 154,000 | 77,544 | |
| Techtronic Industries Co. Ltd. | 55,000 | 206,177 | |
| TOTAL HONG KONG | 2,611,792 | ||
| India - 5.5% | |||
| Adani Ports & Special Economic Zone | 46,861 | 168,042 | |
| Axis Bank Ltd. (a) | 21,528 | 153,101 | |
| Bharti Infratel Ltd. | 36,476 | 205,895 | |
| Coal India Ltd. | 60,713 | 263,278 | |
| Edelweiss Financial Services Ltd. | 75,572 | 66,043 | |
| Eicher Motors Ltd. (a) | 468 | 141,156 | |
| Grasim Industries Ltd. | 3,510 | 226,465 | |
| Housing Development Finance Corp. Ltd. | 2,631 | 43,112 | |
| ITC Ltd. | 40,866 | 199,914 | |
| JK Cement Ltd. | 12,525 | 111,862 | |
| Just Dial Ltd. | 4,157 | 52,972 | |
| Larsen & Toubro Ltd. (a) | 7,910 | 149,399 | |
| LIC Housing Finance Ltd. (a) | 18,430 | 128,267 | |
| Lupin Ltd. | 14,104 | 341,264 | |
| Oil & Natural Gas Corp. Ltd. | 46,067 | 150,666 | |
| Petronet LNG Ltd. | 25,887 | 102,709 | |
| Phoenix Mills Ltd. | 23,725 | 114,686 | |
| Power Grid Corp. of India Ltd. | 140,906 | 304,189 | |
| SREI Infrastructure Finance Ltd. (a) | 116,223 | 104,018 | |
| State Bank of India (a) | 54,040 | 153,760 | |
| Sun Pharmaceutical Industries Ltd. | 31,005 | 378,685 | |
| Tata Consultancy Services Ltd. | 10,234 | 390,638 | |
| TOTAL INDIA | 3,950,121 | ||
| Indonesia - 0.5% | |||
| Link Net Tbk PT | 86,000 | 27,486 | |
| PT Bank Mandiri (Persero) Tbk | 176,150 | 128,048 | |
| PT Bank Rakyat Indonesia Tbk | 207,300 | 162,690 | |
| PT Kalbe Farma Tbk | 555,300 | 57,896 | |
| TOTAL INDONESIA | 376,120 | ||
| Israel - 0.4% | |||
| Bezeq The Israel Telecommunication Corp. Ltd. | 119,655 | 255,229 | |
| Japan - 0.2% | |||
| Rakuten, Inc. | 10,832 | 117,759 | |
| Korea (South) - 7.8% | |||
| AMOREPACIFIC Group, Inc. | 2,000 | 293,277 | |
| Daou Technology, Inc. | 5,064 | 103,430 | |
| Duk San Neolux Co. Ltd. (a) | 1,826 | 43,352 | |
| E-Mart Co. Ltd. | 1,187 | 190,119 | |
| EO Technics Co. Ltd. | 442 | 43,750 | |
| Fila Korea Ltd. | 2,435 | 221,040 | |
| Hanon Systems | 11,898 | 106,967 | |
| Hyundai Glovis Co. Ltd. | 2,043 | 338,813 | |
| Hyundai Industrial Development & Construction Co. | 3,241 | 142,859 | |
| Hyundai Mobis | 1,845 | 419,510 | |
| InterPark INT Corp. | 4,011 | 68,444 | |
| Kakao Corp. | 742 | 65,089 | |
| KB Financial Group, Inc. | 9,312 | 283,360 | |
| KEPCO Plant Service & Engineering Co. Ltd. | 1,426 | 93,973 | |
| Korea Electric Power Corp. | 3,805 | 205,551 | |
| Korean Reinsurance Co. | 21,509 | 249,695 | |
| KT Corp. | 2,253 | 60,021 | |
| KT Corp. sponsored ADR | 3,052 | 41,538 | |
| LG Chemical Ltd. | 1,202 | 311,601 | |
| NAVER Corp. | 171 | 101,047 | |
| NCSOFT Corp. | 726 | 145,114 | |
| Samsung Electronics Co. Ltd. | 648 | 704,179 | |
| Samsung Fire & Marine Insurance Co. Ltd. | 568 | 146,007 | |
| Samsung SDI Co. Ltd. | 1,310 | 130,351 | |
| Shinhan Financial Group Co. Ltd. | 14,142 | 515,690 | |
| SK Hynix, Inc. | 16,437 | 403,868 | |
| SK Telecom Co. Ltd. sponsored ADR | 4,250 | 85,000 | |
| Viatron Technologies, Inc. | 2,018 | 50,552 | |
| TOTAL KOREA (SOUTH) | 5,564,197 | ||
| Malaysia - 0.3% | |||
| Tenaga Nasional Bhd | 53,179 | 195,482 | |
| Mauritius - 0.1% | |||
| MakeMyTrip Ltd. (a) | 3,100 | 56,916 | |
| Mexico - 3.8% | |||
| America Movil S.A.B. de CV Series L sponsored ADR | 17,863 | 252,940 | |
| Banregio Grupo Financiero S.A.B. de CV | 9,480 | 56,810 | |
| CEMEX S.A.B. de CV sponsored ADR | 15,288 | 113,896 | |
| El Puerto de Liverpool S.A.B. de CV Class C | 19,700 | 223,935 | |
| Fibra Uno Administracion SA de CV | 119,360 | 284,167 | |
| Grupo Aeroportuario del Pacifico S.A.B. de CV Series B | 17,100 | 161,114 | |
| Grupo Comercial Chedraui S.A.B. de CV | 44,076 | 124,917 | |
| Grupo Financiero Banorte S.A.B. de CV Series O | 117,969 | 669,705 | |
| Infraestructura Energetica Nova S.A.B. de CV | 14,000 | 54,707 | |
| Macquarie Mexican (REIT) | 252,670 | 347,768 | |
| Promotora y Operadora de Infraestructura S.A.B. de CV | 6,200 | 78,629 | |
| Tenedora Nemak SA de CV | 64,900 | 93,099 | |
| Wal-Mart de Mexico SA de CV Series V | 94,100 | 232,725 | |
| TOTAL MEXICO | 2,694,412 | ||
| Netherlands - 0.7% | |||
| Cnova NV (a) | 5,550 | 19,425 | |
| Hangzhou Hikvision Digital Technology Co. Ltd. ELS (BNP Paribas Arbitrage Warrant Program) warrants 10/21/16 (a)(b) | 15,500 | 72,950 | |
| Yandex NV (a) | 19,517 | 399,513 | |
| TOTAL NETHERLANDS | 491,888 | ||
| Nigeria - 0.2% | |||
| Guaranty Trust Bank PLC GDR (Reg. S) | 11,980 | 41,930 | |
| Transnational Corp. of Nigeria PLC | 3,901,713 | 19,412 | |
| Zenith Bank PLC | 1,851,312 | 118,155 | |
| TOTAL NIGERIA | 179,497 | ||
| Pakistan - 0.2% | |||
| Habib Bank Ltd. | 96,700 | 174,336 | |
| Panama - 0.2% | |||
| Copa Holdings SA Class A | 2,200 | 140,250 | |
| Philippines - 0.9% | |||
| Alliance Global Group, Inc. | 547,150 | 168,676 | |
| Metro Pacific Investments Corp. | 459,100 | 56,613 | |
| Metropolitan Bank & Trust Co. | 124,721 | 215,448 | |
| Robinsons Land Corp. | 363,980 | 209,713 | |
| TOTAL PHILIPPINES | 650,450 | ||
| Romania - 0.1% | |||
| Banca Transilvania SA | 89,698 | 61,556 | |
| Russia - 3.4% | |||
| E.ON Russia JSC (a) | 1,584,700 | 64,565 | |
| Lukoil PJSC sponsored ADR | 13,700 | 580,675 | |
| Magnit OJSC GDR (Reg. S) | 5,500 | 190,300 | |
| MMC Norilsk Nickel PJSC sponsored ADR | 19,900 | 293,525 | |
| Mobile TeleSystems OJSC (a) | 33,812 | 132,204 | |
| Mobile TeleSystems OJSC sponsored ADR | 1,940 | 17,964 | |
| NOVATEK OAO GDR (Reg. S) | 3,000 | 288,000 | |
| Rosneft Oil Co. OJSC (a) | 55,500 | 300,753 | |
| Sberbank of Russia (a) | 67,580 | 129,019 | |
| Sberbank of Russia sponsored ADR | 39,884 | 319,710 | |
| Sistema JSFC (a) | 240,200 | 72,128 | |
| Sistema JSFC sponsored GDR | 2,860 | 21,021 | |
| TOTAL RUSSIA | 2,409,864 | ||
| Singapore - 0.7% | |||
| Ascendas Real Estate Investment Trust | 135,310 | 247,509 | |
| CapitaMall Trust | 54,800 | 84,348 | |
| First Resources Ltd. | 103,200 | 146,184 | |
| TOTAL SINGAPORE | 478,041 | ||
| South Africa - 4.2% | |||
| Alexander Forbes Group Holdings Ltd. (c) | 126,689 | 63,900 | |
| Aspen Pharmacare Holdings Ltd. | 7,141 | 168,291 | |
| Barclays Africa Group Ltd. (d) | 25,640 | 259,908 | |
| Bidvest Group Ltd. | 8,056 | 204,455 | |
| Imperial Holdings Ltd. | 18,800 | 196,819 | |
| JSE Ltd. | 6,910 | 80,098 | |
| Life Healthcare Group Holdings Ltd. | 53,600 | 140,785 | |
| Naspers Ltd. Class N | 10,554 | 1,448,115 | |
| Nedbank Group Ltd. | 8,080 | 103,361 | |
| Sasol Ltd. | 4,000 | 130,841 | |
| Shoprite Holdings Ltd. (c) | 9,551 | 114,885 | |
| Telkom SA Ltd. | 23,762 | 94,612 | |
| TOTAL SOUTH AFRICA | 3,006,070 | ||
| Spain - 0.2% | |||
| Banco Bilbao Vizcaya Argentaria SA | 25,681 | 176,475 | |
| Taiwan - 4.4% | |||
| Advanced Semiconductor Engineering, Inc. | 98,000 | 94,153 | |
| Advantech Co. Ltd. | 25,000 | 176,454 | |
| Boardtek Electronics Corp. | 36,000 | 51,710 | |
| Catcher Technology Co. Ltd. | 13,000 | 91,354 | |
| E.SUN Financial Holdings Co. Ltd. | 252,546 | 139,943 | |
| Hermes Microvision, Inc. | 1,000 | 30,802 | |
| Hon Hai Precision Industry Co. Ltd. (Foxconn) | 29,555 | 70,541 | |
| HTC Corp. | 22,000 | 56,119 | |
| Inotera Memories, Inc. (a) | 29,000 | 26,304 | |
| King's Town Bank | 96,600 | 67,285 | |
| Kingpak Technology, Inc. (a) | 5,000 | 48,757 | |
| Largan Precision Co. Ltd. | 1,833 | 128,809 | |
| MediaTek, Inc. | 5,000 | 35,600 | |
| Siliconware Precision Industries Co. Ltd. | 25,000 | 36,958 | |
| Taiwan Cement Corp. | 270,000 | 274,990 | |
| Taiwan Fertilizer Co. Ltd. | 44,000 | 59,728 | |
| Taiwan Semiconductor Manufacturing Co. Ltd. | 324,000 | 1,486,264 | |
| Taiwan Semiconductor Manufacturing Co. Ltd. sponsored ADR | 1,642 | 38,735 | |
| Universal Cement Corp. | 66,654 | 42,609 | |
| Vanguard International Semiconductor Corp. | 38,000 | 58,171 | |
| Wistron NeWeb Corp. | 19,000 | 49,407 | |
| Yuanta Financial Holding Co. Ltd. | 247,231 | 81,510 | |
| TOTAL TAIWAN | 3,146,203 | ||
| Thailand - 1.8% | |||
| Advanced Info Service PCL (For. Reg.) | 12,640 | 56,467 | |
| Airports of Thailand PCL (For. Reg.) | 14,500 | 162,772 | |
| Intouch Holdings PCL NVDR | 30,250 | 45,696 | |
| Jasmine Broadband Internet Infrastructure Fund | 223,390 | 60,134 | |
| Kasikornbank PCL (For. Reg.) | 74,080 | 354,277 | |
| PTT Global Chemical PCL (For. Reg.) | 50,600 | 90,564 | |
| PTT PCL (For. Reg.) | 25,700 | 223,734 | |
| Star Petroleum Refining PCL | 253,300 | 79,791 | |
| Thai Union Frozen Products PCL (For. Reg.) | 321,800 | 190,758 | |
| TOTAL THAILAND | 1,264,193 | ||
| Turkey - 0.9% | |||
| Aselsan A/S | 14,000 | 99,871 | |
| Enka Insaat ve Sanayi A/S | 46,000 | 79,900 | |
| Tupras Turkiye Petrol Rafinelleri A/S | 7,900 | 208,511 | |
| Turkiye Garanti Bankasi A/S | 53,674 | 165,220 | |
| Turkiye Halk Bankasi A/S | 25,980 | 99,816 | |
| TOTAL TURKEY | 653,318 | ||
| United Arab Emirates - 0.7% | |||
| DP World Ltd. | 7,270 | 137,403 | |
| Emaar Properties PJSC | 95,651 | 177,088 | |
| First Gulf Bank PJSC | 53,346 | 188,089 | |
| TOTAL UNITED ARAB EMIRATES | 502,580 | ||
| United Kingdom - 0.3% | |||
| Fresnillo PLC | 10,600 | 172,384 | |
| HSBC Holdings PLC (Hong Kong) | 10,995 | 73,189 | |
| TOTAL UNITED KINGDOM | 245,573 | ||
| United States of America - 0.5% | |||
| Cognizant Technology Solutions Corp. Class A (a) | 2,420 | 141,255 | |
| First Cash Financial Services, Inc. | 2,549 | 116,566 | |
| Micron Technology, Inc. (a) | 8,700 | 93,525 | |
| TOTAL UNITED STATES OF AMERICA | 351,346 | ||
| TOTAL COMMON STOCKS | |||
| (Cost $40,006,021) | 42,976,979 | ||
| Nonconvertible Preferred Stocks - 4.0% | |||
| Brazil - 3.1% | |||
| Ambev SA sponsored ADR | 100,500 | 561,795 | |
| Banco do Estado Rio Grande do Sul SA | 25,820 | 63,888 | |
| Companhia Paranaense de Energia-Copel: | |||
| (PN-B) | 615 | 5,062 | |
| (PN-B) sponsored ADR | 13,122 | 108,519 | |
| Itau Unibanco Holding SA sponsored ADR | 67,638 | 644,590 | |
| Metalurgica Gerdau SA (PN) | 100,570 | 85,094 | |
| Petroleo Brasileiro SA - Petrobras (PN) sponsored (non-vtg.) (a) | 44,106 | 260,225 | |
| Telefonica Brasil SA | 9,537 | 117,464 | |
| Vale SA (PN-A) sponsored ADR | 74,300 | 337,322 | |
| TOTAL BRAZIL | 2,183,959 | ||
| Korea (South) - 0.9% | |||
| Hyundai Motor Co. Series 2 | 3,119 | 271,969 | |
| Samsung Electronics Co. Ltd. | 295 | 268,562 | |
| Samsung Fire & Marine Insurance Co. Ltd. | 717 | 117,343 | |
| TOTAL KOREA (SOUTH) | 657,874 | ||
| TOTAL NONCONVERTIBLE PREFERRED STOCKS | |||
| (Cost $2,875,342) | 2,841,833 | ||
| Principal Amount | Value | ||
| Nonconvertible Bonds - 14.6% | |||
| Azerbaijan - 1.3% | |||
| International Bank of Azerbaijan OJSC 5.625% 6/11/19 (Reg. S) | 200,000 | 188,600 | |
| Southern Gas Corridor CJSC 6.875% 3/24/26 (b) | 200,000 | 205,550 | |
| State Oil Co. of Azerbaijan Republic: | |||
| 4.75% 3/13/23 (Reg. S) | 325,000 | 292,050 | |
| 6.95% 3/18/30 (Reg. S) | 275,000 | 261,938 | |
| TOTAL AZERBAIJAN | 948,138 | ||
| Canada - 0.0% | |||
| Pacific Rubiales Energy Corp. 5.125% 3/28/23 (b)(e) | 100,000 | 14,750 | |
| Colombia - 0.1% | |||
| Ecopetrol SA 7.375% 9/18/43 | 100,000 | 92,813 | |
| Georgia - 0.7% | |||
| Georgian Oil & Gas Corp.: | |||
| 6.75% 4/26/21 (b) | 250,000 | 251,300 | |
| 6.875% 5/16/17 (b) | 250,000 | 251,855 | |
| TOTAL GEORGIA | 503,155 | ||
| Indonesia - 2.2% | |||
| PT Pertamina Persero: | |||
| 4.875% 5/3/22 (b) | 275,000 | 283,452 | |
| 5.25% 5/23/21 (b) | 200,000 | 210,232 | |
| 5.625% 5/20/43 (b) | 200,000 | 184,581 | |
| 6% 5/3/42 (b) | 400,000 | 383,910 | |
| 6.5% 5/27/41 (b) | 475,000 | 484,377 | |
| TOTAL INDONESIA | 1,546,552 | ||
| Ireland - 0.2% | |||
| Vnesheconombank Via VEB Finance PLC 6.8% 11/22/25 (b) | 100,000 | 104,625 | |
| Kazakhstan - 0.9% | |||
| Kazagro National Management Holding JSC 4.625% 5/24/23 (b) | 400,000 | 334,024 | |
| KazMunaiGaz Finance Sub BV 9.125% 7/2/18 (b) | 300,000 | 328,500 | |
| TOTAL KAZAKHSTAN | 662,524 | ||
| Luxembourg - 2.0% | |||
| Petrobras International Finance Co. Ltd.: | |||
| 3.5% 2/6/17 | 200,000 | 198,030 | |
| 5.375% 1/27/21 | 530,000 | 471,038 | |
| 8.375% 12/10/18 | 300,000 | 309,000 | |
| RSHB Capital SA 5.1% 7/25/18 (b) | 400,000 | 411,280 | |
| TOTAL LUXEMBOURG | 1,389,348 | ||
| Mexico - 2.2% | |||
| Pemex Project Funding Master Trust 6.625% 6/15/35 | 350,000 | 355,250 | |
| Petroleos Mexicanos: | |||
| 6.5% 6/2/41 | 425,000 | 424,150 | |
| 6.625% (b)(f) | 850,000 | 809,625 | |
| TOTAL MEXICO | 1,589,025 | ||
| Netherlands - 0.7% | |||
| Petrobras Global Finance BV: | |||
| 6.85% 6/5/2115 | 215,000 | 159,100 | |
| 7.25% 3/17/44 | 400,000 | 324,000 | |
| TOTAL NETHERLANDS | 483,100 | ||
| South Africa - 0.4% | |||
| Eskom Holdings SOC Ltd. 6.75% 8/6/23 (b) | 300,000 | 282,375 | |
| Trinidad & Tobago - 0.8% | |||
| Petroleum Co. of Trinidad & Tobago Ltd.: | |||
| 6% 5/8/22 (b) | 262,708 | 246,158 | |
| 9.75% 8/14/19 (b) | 300,000 | 312,900 | |
| TOTAL TRINIDAD & TOBAGO | 559,058 | ||
| Turkey - 0.3% | |||
| Turk Sise ve Cam Fabrikalari A/S 4.25% 5/9/20 (Reg. S) | 200,000 | 199,498 | |
| United Arab Emirates - 0.1% | |||
| DP World Ltd. 6.85% 7/2/37 (Reg. S) | 100,000 | 103,686 | |
| United Kingdom - 0.8% | |||
| Biz Finance PLC 9.625% 4/27/22 (b) | 600,000 | 555,120 | |
| Venezuela - 1.9% | |||
| Petroleos de Venezuela SA: | |||
| 5.25% 4/12/17 | 300,000 | 164,250 | |
| 5.5% 4/12/37 | 500,000 | 176,200 | |
| 6% 11/15/26 (Reg. S) | 1,200,000 | 410,280 | |
| 8.5% 11/2/17 (b) | 166,667 | 97,500 | |
| 9% 11/17/21 (Reg. S) | 550,000 | 216,425 | |
| 12.75% 2/17/22 (b) | 600,000 | 279,000 | |
| TOTAL VENEZUELA | 1,343,655 | ||
| TOTAL NONCONVERTIBLE BONDS | |||
| (Cost $11,036,167) | 10,377,422 | ||
| Government Obligations - 14.6% | |||
| Angola - 0.3% | |||
| Angola Republic 9.5% 11/12/25 (b) | 200,000 | 195,260 | |
| Argentina - 1.4% | |||
| Argentine Republic: | |||
| 6.25% 4/22/19 (b) | 150,000 | 155,550 | |
| 6.875% 4/22/21 (b) | 170,000 | 175,100 | |
| 7.5% 4/22/26 (b) | 185,000 | 187,775 | |
| 7.625% 4/22/46 (b) | 150,000 | 147,525 | |
| 8.28% 12/31/33 | 315,459 | 330,443 | |
| TOTAL ARGENTINA | 996,393 | ||
| Armenia - 0.5% | |||
| Republic of Armenia 6% 9/30/20 (b) | 325,000 | 324,220 | |
| Barbados - 0.3% | |||
| Barbados Government 7% 8/4/22 (b) | 250,000 | 245,750 | |
| Brazil - 0.4% | |||
| Brazilian Federative Republic: | |||
| 5% 1/27/45 | 200,000 | 161,500 | |
| 12.25% 3/6/30 | 100,000 | 155,500 | |
| TOTAL BRAZIL | 317,000 | ||
| Cameroon - 0.3% | |||
| Cameroon Republic 9.5% 11/19/25 (b) | 200,000 | 195,760 | |
| Colombia - 0.6% | |||
| Colombian Republic: | |||
| 6.125% 1/18/41 | 100,000 | 107,250 | |
| 7.375% 9/18/37 | 250,000 | 301,875 | |
| TOTAL COLOMBIA | 409,125 | ||
| Congo - 0.3% | |||
| Congo Republic 4% 6/30/29 (g) | 292,600 | 209,958 | |
| Costa Rica - 0.5% | |||
| Costa Rican Republic: | |||
| 4.375% 4/30/25 (b) | 225,000 | 200,250 | |
| 7.158% 3/12/45 (b) | 200,000 | 186,500 | |
| TOTAL COSTA RICA | 386,750 | ||
| Croatia - 0.7% | |||
| Croatia Republic 6% 1/26/24 (b) | 450,000 | 492,188 | |
| Dominican Republic - 0.6% | |||
| Dominican Republic 6.6% 1/28/24 (b) | 375,000 | 401,250 | |
| Ecuador - 0.2% | |||
| Ecuador Republic 7.95% 6/20/24 (b) | 200,000 | 173,500 | |
| El Salvador - 0.2% | |||
| El Salvador Republic 7.625% 2/1/41 (b) | 150,000 | 131,625 | |
| Ethiopia - 0.3% | |||
| Federal Democratic Republic of Ethiopia 6.625% 12/11/24 (b) | 200,000 | 181,500 | |
| Gabon - 0.2% | |||
| Gabonese Republic 6.375% 12/12/24 (b) | 200,000 | 174,724 | |
| Ghana - 0.5% | |||
| Ghana Republic: | |||
| 7.875% 8/7/23 (Reg.S) | 200,000 | 159,540 | |
| 10.75% 10/14/30 (b) | 200,000 | 196,760 | |
| TOTAL GHANA | 356,300 | ||
| Iraq - 0.2% | |||
| Republic of Iraq 5.8% 1/15/28 (Reg. S) | 250,000 | 177,525 | |
| Ivory Coast - 0.3% | |||
| Ivory Coast 5.375% 7/23/24 (b) | 200,000 | 184,500 | |
| Jamaica - 0.2% | |||
| Jamaican Government 8% 6/24/19 | 150,000 | 163,313 | |
| Jordan - 0.3% | |||
| Jordanian Kingdom 6.125% 1/29/26 (b) | 200,000 | 211,250 | |
| Kenya - 0.3% | |||
| Republic of Kenya 6.875% 6/24/24 (b) | 200,000 | 188,020 | |
| Lebanon - 0.2% | |||
| Lebanese Republic 6.1% 10/4/22 | 150,000 | 148,782 | |
| Mongolia - 0.2% | |||
| Mongolian People's Republic 5.125% 12/5/22 (Reg. S) | 200,000 | 157,796 | |
| Mozambique - 0.2% | |||
| Mozambique Republic 10.5% 1/18/23 (b) | 200,000 | 163,000 | |
| Pakistan - 0.3% | |||
| Islamic Republic of Pakistan 7.25% 4/15/19 (b) | 200,000 | 209,715 | |
| Russia - 1.7% | |||
| Russian Federation: | |||
| 5% 4/29/20 (b) | 225,000 | 237,915 | |
| 5.625% 4/4/42 (b) | 200,000 | 210,354 | |
| 12.75% 6/24/28 (Reg. S) | 425,000 | 730,159 | |
| TOTAL RUSSIA | 1,178,428 | ||
| Senegal - 0.3% | |||
| Republic of Senegal 8.75% 5/13/21 (b) | 200,000 | 217,040 | |
| Tanzania - 0.2% | |||
| United Republic of Tanzania 6.8921% 3/9/20 (h) | 177,778 | 180,445 | |
| Turkey - 1.0% | |||
| Turkish Republic: | |||
| 6.875% 3/17/36 | 100,000 | 119,125 | |
| 7% 6/5/20 | 250,000 | 284,243 | |
| 11.875% 1/15/30 | 165,000 | 284,460 | |
| TOTAL TURKEY | 687,828 | ||
| Ukraine - 0.2% | |||
| Ukraine Government 0% 5/31/40 (b)(h) | 430,000 | 134,285 | |
| United States of America - 0.4% | |||
| U.S. Treasury Bills, yield at date of purchase 0.29% to 0.32% 5/19/16 to 6/23/16 (i) | 280,000 | 279,951 | |
| Venezuela - 1.1% | |||
| Venezuelan Republic: | |||
| 7% 3/31/38 | 650,000 | 232,375 | |
| 9% 5/7/23 (Reg. S) | 300,000 | 114,375 | |
| 9.25% 9/15/27 | 650,000 | 277,063 | |
| 12.75% 8/23/22 | 325,000 | 150,719 | |
| TOTAL VENEZUELA | 774,532 | ||
| Zambia - 0.2% | |||
| Republic of Zambia 8.97% 7/30/27 (b) | 200,000 | 165,000 | |
| TOTAL GOVERNMENT OBLIGATIONS | |||
| (Cost $10,810,800) | 10,412,713 | ||
| Preferred Securities - 0.3% | |||
| Cayman Islands - 0.2% | |||
| Banco Do Brasil SA 9% (b)(f)(h) | 200,000 | 150,139 | |
| Colombia - 0.1% | |||
| Colombia Telecomunicacines SA 8.5% (b)(f)(h) | 100,000 | 89,739 | |
| TOTAL PREFERRED SECURITIES | |||
| (Cost $228,131) | 239,878 | ||
| Shares | Value | ||
| Money Market Funds - 6.0% | |||
| Fidelity Cash Central Fund, 0.38% (j) | |||
| (Cost $4,255,911) | 4,255,911 | 4,255,911 | |
| TOTAL INVESTMENT PORTFOLIO - 99.8% | |||
| (Cost $69,212,372) | 71,104,736 | ||
| NET OTHER ASSETS (LIABILITIES) - 0.2% | 139,079 | ||
| NET ASSETS - 100% | $71,243,815 |
| Futures Contracts | |||
| Expiration Date | Underlying Face Amount at Value | Unrealized Appreciation/(Depreciation) | |
| Purchased | |||
| Equity Index Contracts | |||
| 54 ICE E-mini MSCI Emerging Markets Index Contracts (United States) | June 2016 | 2,263,680 | $(20,655) |
The face value of futures purchased as a percentage of Net Assets is 3.2%
For the period, the average monthly underlying face amount at value for futures contracts in the aggregate was $1,146,512.
Security Type Abbreviations
ELS – Equity-Linked Security
Categorizations in the Schedule of Investments are based on country or territory of incorporation.
Legend
(a) Non-income producing
(b) Security exempt from registration under Rule 144A of the Securities Act of 1933. These securities may be resold in transactions exempt from registration, normally to qualified institutional buyers. At the end of the period, the value of these securities amounted to $12,030,258 or 16.9% of net assets.
(c) Security or a portion of the security purchased on a delayed delivery or when-issued basis.
(d) A portion of the security sold on a delayed delivery basis.
(e) Non-income producing - Security is in default.
(f) Security is perpetual in nature with no stated maturity date.
(g) Security initially issued at one coupon which converts to a higher coupon at a specified date. The rate shown is the rate at period end.
(h) Coupon rates for floating and adjustable rate securities reflect the rates in effect at period end.
(i) Security or a portion of the security was pledged to cover margin requirements for futures contracts. At period end, the value of securities pledged amounted to $129,976.
(j) Affiliated fund that is generally available only to investment companies and other accounts managed by Fidelity Investments. The rate quoted is the annualized seven-day yield of the fund at period end. A complete unaudited listing of the fund's holdings as of its most recent quarter end is available upon request. In addition, each Fidelity Central Fund's financial statements are available on the SEC's website or upon request.
Affiliated Central Funds
Information regarding fiscal year to date income earned by the Fund from investments in Fidelity Central Funds is as follows:
| Fund | Income earned |
| Fidelity Cash Central Fund | $3,649 |
| Total | $3,649 |
Investment Valuation
The following is a summary of the inputs used, as of April 30, 2016, involving the Fund's assets and liabilities carried at fair value. The inputs or methodology used for valuing securities may not be an indication of the risk associated with investing in those securities. For more information on valuation inputs, and their aggregation into the levels used below, please refer to the Investment Valuation section in the accompanying Notes to Financial Statements.
| Valuation Inputs at Reporting Date: | ||||
| Description | Total | Level 1 | Level 2 | Level 3 |
| Investments in Securities: | ||||
| Equities: | ||||
| Consumer Discretionary | $5,258,501 | $4,614,494 | $644,007 | $-- |
| Consumer Staples | 3,794,638 | 3,189,316 | 605,322 | -- |
| Energy | 3,672,597 | 2,704,620 | 967,977 | -- |
| Financials | 12,054,266 | 8,140,422 | 3,913,844 | -- |
| Health Care | 1,262,655 | 1,086,921 | 175,734 | -- |
| Industrials | 3,229,566 | 2,744,449 | 485,117 | -- |
| Information Technology | 9,198,494 | 6,249,248 | 2,949,246 | -- |
| Materials | 3,367,091 | 2,481,726 | 885,365 | -- |
| Telecommunication Services | 2,648,558 | 2,100,063 | 548,495 | -- |
| Utilities | 1,332,446 | 910,953 | 421,493 | -- |
| Corporate Bonds | 10,377,422 | -- | 10,377,422 | -- |
| Government Obligations | 10,412,713 | -- | 10,412,713 | -- |
| Preferred Securities | 239,878 | -- | 239,878 | -- |
| Money Market Funds | 4,255,911 | 4,255,911 | -- | -- |
| Total Investments in Securities: | $71,104,736 | $38,478,123 | $32,626,613 | $-- |
| Derivative Instruments: | ||||
| Liabilities | ||||
| Futures Contracts | $(20,655) | $(20,655) | $-- | $-- |
| Total Liabilities | $(20,655) | $(20,655) | $-- | $-- |
| Total Derivative Instruments: | $(20,655) | $(20,655) | $-- | $-- |
The following is a summary of transfers between Level 1 and Level 2 for the period ended April 30, 2016. Transfers are assumed to have occurred at the beginning of the period, and are primarily attributable to the valuation techniques used for foreign equity securities, as discussed in the accompanying Notes to Financial Statements:
| Transfers | Total |
| Level 1 to Level 2 | $162,341 |
| Level 2 to Level 1 | $5,630,433 |
Value of Derivative Instruments
The following table is a summary of the Fund's value of derivative instruments by primary risk exposure as of April 30, 2016. For additional information on derivative instruments, please refer to the Derivative Instruments section in the accompanying Notes to Financial Statements.
| Primary Risk Exposure / Derivative Type | Value | |
| Asset | Liability | |
| Equity Risk | ||
| Futures Contracts(a) | $0 | $(20,655) |
| Total Equity Risk | 0 | (20,655) |
| Total Value of Derivatives | $0 | $(20,655) |
(a) Reflects gross cumulative appreciation (depreciation) on futures contracts as presented in the Schedule of Investments. In the Statement of Assets and Liabilities, the period end daily variation margin is included in receivable or payable for daily variation margin for derivative instruments, and the net cumulative appreciation (depreciation) is included in net unrealized appreciation (depreciation).
Other Information
The composition of credit quality ratings as a percentage of Total Net Assets is as follows (Unaudited):
| BBB | 6.6% |
| BB | 8.2% |
| B | 8.4% |
| CCC,CC,C | 3.8% |
| Not Rated | 2.1% |
| Equities | 64.3% |
| Short-Term Investments and Net Other Assets | 6.6% |
| 100.0% |
We have used ratings from Moody's Investors Service, Inc. Where Moody's® ratings are not available, we have used S&P® ratings. All ratings are as of the date indicated and do not reflect subsequent changes.
See accompanying notes which are an integral part of the financial statements.
Financial Statements
Statement of Assets and Liabilities
| April 30, 2016 (Unaudited) | ||
| Assets | ||
| Investment in securities, at value — See accompanying schedule: Unaffiliated issuers (cost $64,956,461) | $66,848,825 | |
| Fidelity Central Funds (cost $4,255,911) | 4,255,911 | |
| Total Investments (cost $69,212,372) | $71,104,736 | |
| Cash | 96,849 | |
| Foreign currency held at value (cost $84,060) | 84,095 | |
| Receivable for investments sold | ||
| Regular delivery | 196,038 | |
| Delayed delivery | 5,021 | |
| Receivable for fund shares sold | 584,193 | |
| Dividends receivable | 41,415 | |
| Interest receivable | 448,185 | |
| Distributions receivable from Fidelity Central Funds | 735 | |
| Prepaid expenses | 57 | |
| Receivable from investment adviser for expense reductions | 24,578 | |
| Other receivables | 85,356 | |
| Total assets | 72,671,258 | |
| Liabilities | ||
| Payable for investments purchased | ||
| Regular delivery | $1,039,039 | |
| Delayed delivery | 31,664 | |
| Payable for fund shares redeemed | 182,047 | |
| Accrued management fee | 44,979 | |
| Distribution and service plan fees payable | 9,024 | |
| Payable for daily variation margin for derivative instruments | 12,354 | |
| Other affiliated payables | 17,432 | |
| Other payables and accrued expenses | 90,904 | |
| Total liabilities | 1,427,443 | |
| Net Assets | $71,243,815 | |
| Net Assets consist of: | ||
| Paid in capital | $72,223,458 | |
| Undistributed net investment income | 796,595 | |
| Accumulated undistributed net realized gain (loss) on investments and foreign currency transactions | (3,645,165) | |
| Net unrealized appreciation (depreciation) on investments and assets and liabilities in foreign currencies | 1,868,927 | |
| Net Assets | $71,243,815 | |
| Calculation of Maximum Offering Price | ||
| Class A: | ||
| Net Asset Value and redemption price per share ($9,739,977 ÷ 946,836 shares) | $10.29 | |
| Maximum offering price per share (100/94.25 of $10.29) | $10.92 | |
| Class T: | ||
| Net Asset Value and redemption price per share ($2,602,344 ÷ 252,697 shares) | $10.30 | |
| Maximum offering price per share (100/96.50 of $10.30) | $10.67 | |
| Class C: | ||
| Net Asset Value and offering price per share ($7,363,066 ÷ 717,907 shares)(a) | $10.26 | |
| Total Emerging Markets: | ||
| Net Asset Value, offering price and redemption price per share ($47,144,250 ÷ 4,583,390 shares) | $10.29 | |
| Class I: | ||
| Net Asset Value, offering price and redemption price per share ($4,394,178 ÷ 427,606 shares) | $10.28 |
(a) Redemption price per share is equal to net asset value less any applicable contingent deferred sales charge.
See accompanying notes which are an integral part of the financial statements.
Statement of Operations
| Six months ended April 30, 2016 (Unaudited) | ||
| Investment Income | ||
| Dividends | $389,416 | |
| Interest | 1,118,515 | |
| Income from Fidelity Central Funds | 3,649 | |
| Income before foreign taxes withheld | 1,511,580 | |
| Less foreign taxes withheld | (41,195) | |
| Total income | 1,470,385 | |
| Expenses | ||
| Management fee | $257,316 | |
| Transfer agent fees | 89,622 | |
| Distribution and service plan fees | 53,784 | |
| Accounting fees and expenses | 16,678 | |
| Custodian fees and expenses | 115,562 | |
| Independent trustees' compensation | 139 | |
| Registration fees | 30,565 | |
| Audit | 58,674 | |
| Legal | 74 | |
| Miscellaneous | 1,246 | |
| Total expenses before reductions | 623,660 | |
| Expense reductions | (119,256) | 504,404 |
| Net investment income (loss) | 965,981 | |
| Realized and Unrealized Gain (Loss) | ||
| Net realized gain (loss) on: | ||
| Investment securities: | ||
| Unaffiliated issuers | (1,705,939) | |
| Foreign currency transactions | 27,019 | |
| Futures contracts | (199,083) | |
| Total net realized gain (loss) | (1,878,003) | |
| Change in net unrealized appreciation (depreciation) on: Investment securities (net of decrease in deferred foreign taxes of $2,203) | 2,049,760 | |
| Assets and liabilities in foreign currencies | 175 | |
| Futures contracts | (42,773) | |
| Total change in net unrealized appreciation (depreciation) | 2,007,162 | |
| Net gain (loss) | 129,159 | |
| Net increase (decrease) in net assets resulting from operations | $1,095,140 |
See accompanying notes which are an integral part of the financial statements.
Statement of Changes in Net Assets
| Six months ended April 30, 2016 (Unaudited) | Year ended October 31, 2015 | |
| Increase (Decrease) in Net Assets | ||
| Operations | ||
| Net investment income (loss) | $965,981 | $1,845,806 |
| Net realized gain (loss) | (1,878,003) | (1,339,969) |
| Change in net unrealized appreciation (depreciation) | 2,007,162 | (7,213,595) |
| Net increase (decrease) in net assets resulting from operations | 1,095,140 | (6,707,758) |
| Distributions to shareholders from net investment income | (1,715,467) | (1,198,750) |
| Distributions to shareholders from net realized gain | – | (136,019) |
| Total distributions | (1,715,467) | (1,334,769) |
| Share transactions - net increase (decrease) | 6,358,083 | (6,024,786) |
| Redemption fees | 13,218 | 16,471 |
| Total increase (decrease) in net assets | 5,750,974 | (14,050,842) |
| Net Assets | ||
| Beginning of period | 65,492,841 | 79,543,683 |
| End of period (including undistributed net investment income of $796,595 and undistributed net investment income of $1,546,081, respectively) | $71,243,815 | $65,492,841 |
See accompanying notes which are an integral part of the financial statements.
Financial Highlights — Fidelity Total Emerging Markets Fund Class A
| Six months ended (Unaudited) April 30, | Years ended October 31, | ||||
| 2016 | 2015 | 2014 | 2013 | 2012 A | |
| Selected Per–Share Data | |||||
| Net asset value, beginning of period | $10.35 | $11.56 | $11.37 | $10.86 | $10.00 |
| Income from Investment Operations | |||||
| Net investment income (loss)B | .14 | .28 | .18 | .18 | .20 |
| Net realized and unrealized gain (loss) | .04 | (1.30) | .19 | .48 | .68 |
| Total from investment operations | .18 | (1.02) | .37 | .66 | .88 |
| Distributions from net investment income | (.24) | (.17) | (.18) | (.15) | (.02) |
| Distributions from net realized gain | – | (.02) | – | (.01) | – |
| Total distributions | (.24) | (.19) | (.18) | (.16) | (.02) |
| Redemption fees added to paid in capitalB | –C | –C | –C | .01 | –C |
| Net asset value, end of period | $10.29 | $10.35 | $11.56 | $11.37 | $10.86 |
| Total ReturnD,E,F | 1.84% | (8.92)% | 3.30% | 6.23% | 8.80% |
| Ratios to Average Net AssetsG,H | |||||
| Expenses before reductions | 2.00%I | 1.93% | 1.98% | 1.89% | 1.87% |
| Expenses net of fee waivers, if any | 1.65%I | 1.65% | 1.65% | 1.65% | 1.65% |
| Expenses net of all reductions | 1.65%I | 1.64% | 1.65% | 1.62% | 1.62% |
| Net investment income (loss) | 2.91%I | 2.58% | 1.61% | 1.61% | 1.92% |
| Supplemental Data | |||||
| Net assets, end of period (000 omitted) | $9,740 | $10,164 | $13,627 | $18,837 | $7,675 |
| Portfolio turnover rateJ | 93%I | 80% | 102% | 120% | 70% |
A For the period November 1, 2011 (commencement of operations) to October 31, 2012.
B Calculated based on average shares outstanding during the period.
C Amount represents less than $.005 per share.
D Total returns for periods of less than one year are not annualized.
E Total returns would have been lower if certain expenses had not been reduced during the applicable periods shown.
F Total returns do not include the effect of the sales charges.
G Fees and expenses of any underlying Fidelity Central Funds are not included in the Fund's expense ratio. The Fund indirectly bears its proportionate share of the expenses of any underlying Fidelity Central Funds.
H Expense ratios reflect operating expenses of the class. Expenses before reductions do not reflect amounts reimbursed by the investment adviser or reductions from brokerage service arrangements or reductions from other expense offset arrangements and do not represent the amount paid by the class during periods when reimbursements or reductions occur. Expense ratios before reductions for start-up periods may not be representative of longer-term operating periods. Expenses net of fee waivers reflect expenses after reimbursement by the investment adviser but prior to reductions from brokerage service arrangements or other expense offset arrangements. Expenses net of all reductions represent the net expenses paid by the class.
I Annualized
J Amount does not include the portfolio activity of any underlying Fidelity Central Funds.
See accompanying notes which are an integral part of the financial statements.
Financial Highlights — Fidelity Total Emerging Markets Fund Class T
| Six months ended (Unaudited) April 30, | Years ended October 31, | ||||
| 2016 | 2015 | 2014 | 2013 | 2012 A | |
| Selected Per–Share Data | |||||
| Net asset value, beginning of period | $10.33 | $11.54 | $11.34 | $10.84 | $10.00 |
| Income from Investment Operations | |||||
| Net investment income (loss)B | .13 | .25 | .15 | .15 | .17 |
| Net realized and unrealized gain (loss) | .04 | (1.30) | .19 | .48 | .68 |
| Total from investment operations | .17 | (1.05) | .34 | .63 | .85 |
| Distributions from net investment income | (.20) | (.14) | (.14) | (.12) | (.01) |
| Distributions from net realized gain | – | (.02) | – | (.01) | – |
| Total distributions | (.20) | (.16) | (.14) | (.14)C | (.01) |
| Redemption fees added to paid in capitalB | –D | –D | –D | .01 | –D |
| Net asset value, end of period | $10.30 | $10.33 | $11.54 | $11.34 | $10.84 |
| Total ReturnE,F,G | 1.74% | (9.18)% | 3.04% | 5.93% | 8.56% |
| Ratios to Average Net AssetsH,I | |||||
| Expenses before reductions | 2.33%J | 2.27% | 2.32% | 2.13% | 2.10% |
| Expenses net of fee waivers, if any | 1.90%J | 1.90% | 1.90% | 1.90% | 1.90% |
| Expenses net of all reductions | 1.90%J | 1.89% | 1.90% | 1.88% | 1.87% |
| Net investment income (loss) | 2.66%J | 2.33% | 1.36% | 1.36% | 1.67% |
| Supplemental Data | |||||
| Net assets, end of period (000 omitted) | $2,602 | $3,331 | $5,277 | $5,967 | $5,823 |
| Portfolio turnover rateK | 93%J | 80% | 102% | 120% | 70% |
A For the period November 1, 2011 (commencement of operations) to October 31, 2012.
B Calculated based on average shares outstanding during the period.
C Total distributions of $.14 per share is comprised of distributions from net investment income of $.124 and distributions from net realized gain of $.014 per share.
D Amount represents less than $.005 per share.
E Total returns for periods of less than one year are not annualized.
F Total returns would have been lower if certain expenses had not been reduced during the applicable periods shown.
G Total returns do not include the effect of the sales charges.
H Fees and expenses of any underlying Fidelity Central Funds are not included in the Fund's expense ratio. The Fund indirectly bears its proportionate share of the expenses of any underlying Fidelity Central Funds.
I Expense ratios reflect operating expenses of the class. Expenses before reductions do not reflect amounts reimbursed by the investment adviser or reductions from brokerage service arrangements or reductions from other expense offset arrangements and do not represent the amount paid by the class during periods when reimbursements or reductions occur. Expense ratios before reductions for start-up periods may not be representative of longer-term operating periods. Expenses net of fee waivers reflect expenses after reimbursement by the investment adviser but prior to reductions from brokerage service arrangements or other expense offset arrangements. Expenses net of all reductions represent the net expenses paid by the class.
J Annualized
K Amount does not include the portfolio activity of any underlying Fidelity Central Funds.
See accompanying notes which are an integral part of the financial statements.
Financial Highlights — Fidelity Total Emerging Markets Fund Class C
| Six months ended (Unaudited) April 30, | Years ended October 31, | ||||
| 2016 | 2015 | 2014 | 2013 | 2012 A | |
| Selected Per–Share Data | |||||
| Net asset value, beginning of period | $10.25 | $11.47 | $11.29 | $10.80 | $10.00 |
| Income from Investment Operations | |||||
| Net investment income (loss)B | .11 | .20 | .10 | .09 | .12 |
| Net realized and unrealized gain (loss) | .05 | (1.30) | .19 | .47 | .69 |
| Total from investment operations | .16 | (1.10) | .29 | .56 | .81 |
| Distributions from net investment income | (.15) | (.10) | (.11) | (.07) | (.01) |
| Distributions from net realized gain | – | (.02) | – | (.01) | – |
| Total distributions | (.15) | (.12) | (.11) | (.08) | (.01) |
| Redemption fees added to paid in capitalB | –C | –C | –C | .01 | –C |
| Net asset value, end of period | $10.26 | $10.25 | $11.47 | $11.29 | $10.80 |
| Total ReturnD,E,F | 1.56% | (9.68)% | 2.56% | 5.31% | 8.07% |
| Ratios to Average Net AssetsG,H | |||||
| Expenses before reductions | 2.74%I | 2.68% | 2.72% | 2.65% | 2.63% |
| Expenses net of fee waivers, if any | 2.40%I | 2.40% | 2.40% | 2.40% | 2.40% |
| Expenses net of all reductions | 2.40%I | 2.39% | 2.40% | 2.37% | 2.37% |
| Net investment income (loss) | 2.16%I | 1.83% | .86% | .86% | 1.17% |
| Supplemental Data | |||||
| Net assets, end of period (000 omitted) | $7,363 | $7,736 | $10,104 | $7,436 | $5,824 |
| Portfolio turnover rateJ | 93%I | 80% | 102% | 120% | 70% |
A For the period November 1, 2011 (commencement of operations) to October 31, 2012.
B Calculated based on average shares outstanding during the period.
C Amount represents less than $.005 per share.
D Total returns for periods of less than one year are not annualized.
E Total returns would have been lower if certain expenses had not been reduced during the applicable periods shown.
F Total returns do not include the effect of the contingent deferred sales charge.
G Fees and expenses of any underlying Fidelity Central Funds are not included in the Fund's expense ratio. The Fund indirectly bears its proportionate share of the expenses of any underlying Fidelity Central Funds.
H Expense ratios reflect operating expenses of the class. Expenses before reductions do not reflect amounts reimbursed by the investment adviser or reductions from brokerage service arrangements or reductions from other expense offset arrangements and do not represent the amount paid by the class during periods when reimbursements or reductions occur. Expense ratios before reductions for start-up periods may not be representative of longer-term operating periods. Expenses net of fee waivers reflect expenses after reimbursement by the investment adviser but prior to reductions from brokerage service arrangements or other expense offset arrangements. Expenses net of all reductions represent the net expenses paid by the class.
I Annualized
J Amount does not include the portfolio activity of any underlying Fidelity Central Funds.
See accompanying notes which are an integral part of the financial statements.
Financial Highlights — Fidelity Total Emerging Markets Fund
| Six months ended (Unaudited) April 30, | Years ended October 31, | ||||
| 2016 | 2015 | 2014 | 2013 | 2012 A | |
| Selected Per–Share Data | |||||
| Net asset value, beginning of period | $10.38 | $11.60 | $11.40 | $10.89 | $10.00 |
| Income from Investment Operations | |||||
| Net investment income (loss)B | .15 | .31 | .21 | .21 | .22 |
| Net realized and unrealized gain (loss) | .05 | (1.31) | .19 | .47 | .69 |
| Total from investment operations | .20 | (1.00) | .40 | .68 | .91 |
| Distributions from net investment income | (.29) | (.20) | (.20) | (.17) | (.02) |
| Distributions from net realized gain | – | (.02) | – | (.01) | – |
| Total distributions | (.29) | (.22) | (.20) | (.18) | (.02) |
| Redemption fees added to paid in capitalB | –C | –C | –C | .01 | –C |
| Net asset value, end of period | $10.29 | $10.38 | $11.60 | $11.40 | $10.89 |
| Total ReturnD,E | 2.03% | (8.74)% | 3.56% | 6.44% | 9.15% |
| Ratios to Average Net AssetsF,G | |||||
| Expenses before reductions | 1.78%H | 1.72% | 1.73% | 1.56% | 1.60% |
| Expenses net of fee waivers, if any | 1.40%H | 1.40% | 1.40% | 1.40% | 1.40% |
| Expenses net of all reductions | 1.40%H | 1.39% | 1.40% | 1.38% | 1.38% |
| Net investment income (loss) | 3.16%H | 2.83% | 1.86% | 1.85% | 2.16% |
| Supplemental Data | |||||
| Net assets, end of period (000 omitted) | $47,144 | $37,918 | $45,763 | $49,959 | $81,416 |
| Portfolio turnover rateI | 93%H | 80% | 102% | 120% | 70% |
A For the period November 1, 2011 (commencement of operations) to October 31, 2012.
B Calculated based on average shares outstanding during the period.
C Amount represents less than $.005 per share.
D Total returns for periods of less than one year are not annualized.
E Total returns would have been lower if certain expenses had not been reduced during the applicable periods shown.
F Fees and expenses of any underlying Fidelity Central Funds are not included in the Fund's expense ratio. The Fund indirectly bears its proportionate share of the expenses of any underlying Fidelity Central Funds.
G Expense ratios reflect operating expenses of the class. Expenses before reductions do not reflect amounts reimbursed by the investment adviser or reductions from brokerage service arrangements or reductions from other expense offset arrangements and do not represent the amount paid by the class during periods when reimbursements or reductions occur. Expense ratios before reductions for start-up periods may not be representative of longer-term operating periods. Expenses net of fee waivers reflect expenses after reimbursement by the investment adviser but prior to reductions from brokerage service arrangements or other expense offset arrangements. Expenses net of all reductions represent the net expenses paid by the class.
H Annualized
I Amount does not include the portfolio activity of any underlying Fidelity Central Funds.
See accompanying notes which are an integral part of the financial statements.
Financial Highlights — Fidelity Total Emerging Markets Fund Class I
| Six months ended (Unaudited) April 30, | Years ended October 31, | ||||
| 2016 | 2015 | 2014 | 2013 | 2012 A | |
| Selected Per–Share Data | |||||
| Net asset value, beginning of period | $10.37 | $11.59 | $11.40 | $10.89 | $10.00 |
| Income from Investment Operations | |||||
| Net investment income (loss)B | .15 | .31 | .21 | .20 | .22 |
| Net realized and unrealized gain (loss) | .05 | (1.31) | .18 | .48 | .69 |
| Total from investment operations | .20 | (1.00) | .39 | .68 | .91 |
| Distributions from net investment income | (.29) | (.20) | (.20) | (.17) | (.02) |
| Distributions from net realized gain | – | (.02) | – | (.01) | – |
| Total distributions | (.29) | (.22) | (.20) | (.18) | (.02) |
| Redemption fees added to paid in capitalB | –C | –C | –C | .01 | –C |
| Net asset value, end of period | $10.28 | $10.37 | $11.59 | $11.40 | $10.89 |
| Total ReturnD,E | 2.06% | (8.74)% | 3.51% | 6.44% | 9.15% |
| Ratios to Average Net AssetsF,G | |||||
| Expenses before reductions | 1.66%H | 1.58% | 1.71% | 1.63% | 1.62% |
| Expenses net of fee waivers, if any | 1.40%H | 1.40% | 1.40% | 1.40% | 1.40% |
| Expenses net of all reductions | 1.40%H | 1.39% | 1.40% | 1.37% | 1.37% |
| Net investment income (loss) | 3.16%H | 2.83% | 1.86% | 1.86% | 2.17% |
| Supplemental Data | |||||
| Net assets, end of period (000 omitted) | $4,394 | $6,343 | $4,773 | $5,354 | $2,287 |
| Portfolio turnover rateI | 93%H | 80% | 102% | 120% | 70% |
A For the period November 1, 2011 (commencement of operations) to October 31, 2012.
B Calculated based on average shares outstanding during the period.
C Amount represents less than $.005 per share.
D Total returns for periods of less than one year are not annualized.
E Total returns would have been lower if certain expenses had not been reduced during the applicable periods shown.
F Fees and expenses of any underlying Fidelity Central Funds are not included in the Fund's expense ratio. The Fund indirectly bears its proportionate share of the expenses of any underlying Fidelity Central Funds.
G Expense ratios reflect operating expenses of the class. Expenses before reductions do not reflect amounts reimbursed by the investment adviser or reductions from brokerage service arrangements or reductions from other expense offset arrangements and do not represent the amount paid by the class during periods when reimbursements or reductions occur. Expense ratios before reductions for start-up periods may not be representative of longer-term operating periods. Expenses net of fee waivers reflect expenses after reimbursement by the investment adviser but prior to reductions from brokerage service arrangements or other expense offset arrangements. Expenses net of all reductions represent the net expenses paid by the class.
H Annualized
I Amount does not include the portfolio activity of any underlying Fidelity Central Funds.
See accompanying notes which are an integral part of the financial statements.
Notes to Financial Statements (Unaudited)
For the period ended April 30, 2016
1. Organization.
Fidelity Total Emerging Markets Fund (the Fund) is a fund of Fidelity Investment Trust (the Trust) and is authorized to issue an unlimited number of shares. The Trust is registered under the Investment Company Act of 1940, as amended (the 1940 Act), as an open-end management investment company organized as a Massachusetts business trust. The Fund offers Class A, Class T, Class C, Total Emerging Markets and Class I shares, each of which has equal rights as to assets and voting privileges. Each class has exclusive voting rights with respect to matters that affect that class. The Fund's investments in emerging markets can be subject to social, economic, regulatory, and political uncertainties and can be extremely volatile.
2. Investments in Fidelity Central Funds.
The Fund invests in Fidelity Central Funds, which are open-end investment companies generally available only to other investment companies and accounts managed by the investment adviser and its affiliates. The Fund's Schedule of Investments lists each of the Fidelity Central Funds held as of period end, if any, as an investment of the Fund, but does not include the underlying holdings of each Fidelity Central Fund. As an Investing Fund, the Fund indirectly bears its proportionate share of the expenses of the underlying Fidelity Central Funds.
The Money Market Central Funds seek preservation of capital and current income and are managed by Fidelity Investments Money Management, Inc. (FIMM), an affiliate of the investment adviser. Annualized expenses of the Money Market Central Funds as of their most recent shareholder report date are less than .005%.
A complete unaudited list of holdings for each Fidelity Central Fund is available upon request or at the Securities and Exchange Commission (the SEC) website at www.sec.gov. In addition, the financial statements of the Fidelity Central Funds are available on the SEC website or upon request.
3. Significant Accounting Policies.
The financial statements have been prepared in conformity with accounting principles generally accepted in the United States of America (GAAP), which require management to make certain estimates and assumptions at the date of the financial statements. Actual results could differ from those estimates. Subsequent events, if any, through the date that the financial statements were issued have been evaluated in the preparation of the financial statements. The following summarizes the significant accounting policies of the Fund:
Investment Valuation. Investments are valued as of 4:00 p.m. Eastern time on the last calendar day of the period. The Board of Trustees (the Board) has delegated the day to day responsibility for the valuation of the Fund's investments to the Fidelity Management & Research Company (FMR) Fair Value Committee (the Committee). In accordance with valuation policies and procedures approved by the Board, the Fund attempts to obtain prices from one or more third party pricing vendors or brokers to value its investments. When current market prices, quotations or currency exchange rates are not readily available or reliable, investments will be fair valued in good faith by the Committee, in accordance with procedures adopted by the Board. Factors used in determining fair value vary by investment type and may include market or investment specific events, changes in interest rates and credit quality. The frequency with which these procedures are used cannot be predicted and they may be utilized to a significant extent. The Committee oversees the Fund's valuation policies and procedures and reports to the Board on the Committee's activities and fair value determinations. The Board monitors the appropriateness of the procedures used in valuing the Fund's investments and ratifies the fair value determinations of the Committee.
The Fund categorizes the inputs to valuation techniques used to value its investments into a disclosure hierarchy consisting of three levels as shown below:
- Level 1 – quoted prices in active markets for identical investments
- Level 2 – other significant observable inputs (including quoted prices for similar investments, interest rates, prepayment speeds, etc.)
- Level 3 – unobservable inputs (including the Fund's own assumptions based on the best information available)
Valuation techniques used to value the Fund's investments by major category are as follows:
Equity securities, including restricted securities, for which market quotations are readily available, are valued at the last reported sale price or official closing price as reported by a third party pricing vendor on the primary market or exchange on which they are traded and are categorized as Level 1 in the hierarchy. In the event there were no sales during the day or closing prices are not available, securities are valued at the last quoted bid price or may be valued using the last available price and are generally categorized as Level 2 in the hierarchy. For foreign equity securities, when market or security specific events arise, comparisons to the valuation of American Depositary Receipts (ADRs), futures contracts, Exchange-Traded Funds (ETFs) and certain indexes as well as quoted prices for similar securities may be used and would be categorized as Level 2 in the hierarchy. Utilizing these techniques may result in transfers between Level 1 and Level 2. For equity securities, including restricted securities, where observable inputs are limited, assumptions about market activity and risk are used and these securities may be categorized as Level 3 in the hierarchy.
Debt securities, including restricted securities, are valued based on evaluated prices received from third party pricing vendors or from brokers who make markets in such securities. Corporate bonds, foreign government and government agency obligations, preferred securities and U.S. government and government agency obligations are valued by pricing vendors who utilize matrix pricing which considers yield or price of bonds of comparable quality, coupon, maturity and type or by broker-supplied prices. When independent prices are unavailable or unreliable, debt securities may be valued utilizing pricing methodologies which consider similar factors that would be used by third party pricing vendors. Debt securities are generally categorized as Level 2 in the hierarchy but may be Level 3 depending on the circumstances.
Futures contracts are valued at the settlement price established each day by the board of trade or exchange on which they are traded and are categorized as Level 1 in the hierarchy. Investments in open-end mutual funds, including the Fidelity Central Funds, are valued at their closing net asset value (NAV) each business day and are categorized as Level 1 in the hierarchy.
Changes in valuation techniques may result in transfers in or out of an assigned level within the disclosure hierarchy. The aggregate value of investments by input level as of April 30, 2016, including information on transfers between Levels 1 and 2, is included at the end of the Fund's Schedule of Investments.
Foreign Currency. The Fund may use foreign currency contracts to facilitate transactions in foreign-denominated securities. Gains and losses from these transactions may arise from changes in the value of the foreign currency or if the counterparties do not perform under the contracts' terms.
Foreign-denominated assets, including investment securities, and liabilities are translated into U.S. dollars at the exchange rates at period end. Purchases and sales of investment securities, income and dividends received and expenses denominated in foreign currencies are translated into U.S. dollars at the exchange rate in effect on the transaction date.
The effects of exchange rate fluctuations on investments are included with the net realized and unrealized gain (loss) on investment securities. Other foreign currency transactions resulting in realized and unrealized gain (loss) are disclosed separately.
Investment Transactions and Income. For financial reporting purposes, the Fund's investment holdings and NAV include trades executed through the end of the last business day of the period. The NAV per share for processing shareholder transactions is calculated as of the close of business of the New York Stock Exchange (NYSE), normally 4:00 p.m. Eastern time and includes trades executed through the end of the prior business day. Gains and losses on securities sold are determined on the basis of identified cost. Dividend income is recorded on the ex-dividend date, except for certain dividends from foreign securities where the ex-dividend date may have passed, which are recorded as soon as the Fund is informed of the ex-dividend date. Non-cash dividends included in dividend income, if any, are recorded at the fair market value of the securities received. Income and capital gain distributions from Fidelity Central Funds, if any, are recorded on the ex-dividend date. Distributions received on securities that represent a return of capital or capital gain are recorded as a reduction of cost of investments and/or as a realized gain. Subsequent to ex-dividend date the Fund determines the components of these distributions, based upon receipt of tax filings or other correspondence relating to the underlying investment. Interest income is accrued as earned and includes coupon interest and amortization of premium and accretion of discount on debt securities as applicable. Investment income is recorded net of foreign taxes withheld where recovery of such taxes is uncertain. Debt obligations may be placed on non-accrual status and related interest income may be reduced by ceasing current accruals and writing off interest receivables when the collection of all or a portion of interest has become doubtful based on consistently applied procedures. A debt obligation is removed from non-accrual status when the issuer resumes interest payments or when collectability of interest is reasonably assured.
Class Allocations and Expenses. Investment income, realized and unrealized capital gains and losses, common expenses of the Fund, and certain fund-level expense reductions, if any, are allocated daily on a pro-rata basis to each class based on the relative net assets of each class to the total net assets of the Fund. Each class differs with respect to transfer agent and distribution and service plan fees incurred. Certain expense reductions may also differ by class. For the reporting period, the allocated portion of income and expenses to each class as a percent of its average net assets may vary due to the timing of recording these transactions in relation to fluctuating net assets of the classes. Expenses directly attributable to a fund are charged to that fund. Expenses attributable to more than one fund are allocated among the respective funds on the basis of relative net assets or other appropriate methods. Expense estimates are accrued in the period to which they relate and adjustments are made when actual amounts are known.
Income Tax Information and Distributions to Shareholders. Each year, the Fund intends to qualify as a regulated investment company under Subchapter M of the Internal Revenue Code, including distributing substantially all of its taxable income and realized gains. As a result, no provision for U.S. Federal income taxes is required. The Fund files a U.S. federal tax return, in addition to state and local tax returns as required. The Fund's federal income tax returns are subject to examination by the Internal Revenue Service (IRS) for a period of three fiscal years after they are filed. State and local tax returns may be subject to examination for an additional fiscal year depending on the jurisdiction. Foreign taxes are provided for based on the Fund's understanding of the tax rules and rates that exist in the foreign markets in which it invests. The Fund is subject to a tax imposed on capital gains by certain countries in which it invests. An estimated deferred tax liability for net unrealized appreciation on the applicable securities is included in Other payables and accrued expenses on the Statement of Assets & Liabilities.
Distributions are declared and recorded on the ex-dividend date. Income dividends and capital gain distributions are declared separately for each class. Income and capital gain distributions are determined in accordance with income tax regulations, which may differ from GAAP.
Capital accounts within the financial statements are adjusted for permanent book-tax differences. These adjustments have no impact on net assets or the results of operations. Capital accounts are not adjusted for temporary book-tax differences which will reverse in a subsequent period.
Book-tax differences are primarily due to foreign currency transactions, futures contracts, certain foreign taxes, market discount, passive foreign investment companies (PFIC), capital loss carryforward and losses deferred due to wash sales.
The federal tax cost of investment securities and unrealized appreciation (depreciation) as of period end were as follows:
| Gross unrealized appreciation | $6,261,932 |
| Gross unrealized depreciation | (4,885,266) |
| Net unrealized appreciation (depreciation) on securities | $1,376,666 |
| Tax cost | $69,728,070 |
Capital loss carryforwards are only available to offset future capital gains of the Fund to the extent provided by regulations and may be limited. Under the Regulated Investment Company Modernization Act of 2010 (the Act), the Fund is permitted to carry forward capital losses incurred in taxable years beginning after December 22, 2010 for an unlimited period and such capital losses are required to be used prior to any losses that expire. The capital loss carryforward information presented below, including any applicable limitation, is estimated as of prior fiscal period end and is subject to adjustment.
| No expiration | |
| Short-term | $(1,367,584) |
Short-Term Trading (Redemption) Fees. Shares held by investors in the Fund less than 90 days may have been subject to a redemption fee equal to 1.50% of the NAV of shares redeemed. All redemption fees, which reduce the proceeds of the shareholder redemption, are retained by the Fund and accounted for as an addition to paid in capital.
Delayed Delivery Transactions and When-Issued Securities. During the period, the Fund transacted in securities on a delayed delivery or when-issued basis. Payment and delivery may take place after the customary settlement period for that security. The price of the underlying securities and the date when the securities will be delivered and paid for are fixed at the time the transaction is negotiated. The securities purchased on a delayed delivery or when-issued basis are identified as such in the Fund's Schedule of Investments. The Fund may receive compensation for interest forgone in the purchase of a delayed delivery or when-issued security. With respect to purchase commitments, the Fund identifies securities as segregated in its records with a value at least equal to the amount of the commitment. Losses may arise due to changes in the value of the underlying securities or if the counterparty does not perform under the contract's terms, or if the issuer does not issue the securities due to political, economic, or other factors.
Restricted Securities. The Fund may invest in securities that are subject to legal or contractual restrictions on resale. These securities generally may be resold in transactions exempt from registration or to the public if the securities are registered. Disposal of these securities may involve time-consuming negotiations and expense, and prompt sale at an acceptable price may be difficult. Information regarding restricted securities is included at the end of the Fund's Schedule of Investments.
4. Derivative Instruments.
Risk Exposures and the Use of Derivative Instruments. The Fund's investment objective allows the Fund to enter into various types of derivative contracts, including futures contracts. Derivatives are investments whose value is primarily derived from underlying assets, indices or reference rates and may be transacted on an exchange or over-the-counter (OTC). Derivatives may involve a future commitment to buy or sell a specified asset based on specified terms, to exchange future cash flows at periodic intervals based on a notional principal amount, or for one party to make one or more payments upon the occurrence of specified events in exchange for periodic payments from the other party.
The Fund used derivatives to increase returns and to manage exposure to certain risks as defined below. The success of any strategy involving derivatives depends on analysis of numerous economic factors, and if the strategies for investment do not work as intended, the Fund may not achieve its objectives.
The Fund's use of derivatives increased or decreased its exposure to the following risk:
| Equity Risk | Equity risk relates to the fluctuations in the value of financial instruments as a result of changes in market prices (other than those arising from interest rate risk or foreign exchange risk), whether caused by factors specific to an individual investment, its issuer, or all factors affecting all instruments traded in a market or market segment. |
The Fund is also exposed to additional risks from investing in derivatives, such as liquidity risk and counterparty credit risk. Liquidity risk is the risk that the Fund will be unable to close out the derivative in the open market in a timely manner. Counterparty credit risk is the risk that the counterparty will not be able to fulfill its obligation to the Fund. Counterparty credit risk related to exchange-traded futures contracts may be mitigated by the protection provided by the exchange on which they trade.
Investing in derivatives may involve greater risks than investing in the underlying assets directly and, to varying degrees, may involve risk of loss in excess of any initial investment and collateral received and amounts recognized in the Statement of Assets and Liabilities. In addition, there may be the risk that the change in value of the derivative contract does not correspond to the change in value of the underlying instrument.
Futures Contracts. A futures contract is an agreement between two parties to buy or sell a specified underlying instrument for a fixed price at a specified future date. The Fund used futures contracts to manage its exposure to the stock market.
Upon entering into a futures contract, a fund is required to deposit either cash or securities (initial margin) with a clearing broker in an amount equal to a certain percentage of the face value of the contract. Futures contracts are marked-to-market daily and subsequent daily payments (variation margin) are made or received by a fund depending on the daily fluctuations in the value of the futures contracts and are recorded as unrealized appreciation or (depreciation). This receivable and/or payable, if any, is included in daily variation margin for derivative instruments in the Statement of Assets and Liabilities. Realized gain or (loss) is recorded upon the expiration or closing of a futures contract. The net realized gain (loss) and change in net unrealized appreciation (depreciation) on futures contracts during the period is included in the Statement of Operations.
Any open futures contracts at period end are presented in the Schedule of Investments under the caption "Futures Contracts". The underlying face amount at value reflects each contract's exposure to the underlying instrument or index at period end. Securities deposited to meet initial margin requirements are identified in the Schedule of Investments.
During the period the Fund recognized net realized gain (loss) of $(199,083) and a change in net unrealized appreciation (depreciation) of $(42,773) related to its investment in futures contracts. These amounts are included in the Statement of Operations.
5. Purchases and Sales of Investments.
Purchases and sales of securities, other than short-term securities, aggregated $32,470,293 and $28,900,560, respectively.
6. Fees and Other Transactions with Affiliates.
Management Fee. Fidelity Management & Research Company (the investment adviser) and its affiliates provide the Fund with investment management related services for which the Fund pays a monthly management fee. The management fee is the sum of an individual fund fee rate that is based on an annual rate of .55% of the Fund's average net assets and an annualized group fee rate that averaged .25% during the period. The group fee rate is based upon the average net assets of all the mutual funds advised by the investment adviser, including any mutual funds previously advised by the investment adviser that are currently advised by Fidelity SelectCo, LLC, an affiliate of the investment adviser. The group fee rate decreases as assets under management increase and increases as assets under management decrease. For the reporting period, the total annualized management fee rate was .80% of the Fund's average net assets.
Distribution and Service Plan Fees. In accordance with Rule 12b-1 of the 1940 Act, the Fund has adopted separate Distribution and Service Plans for each class of shares. Certain classes pay Fidelity Distributors Corporation (FDC), an affiliate of the investment adviser, separate Distribution and Service Fees, each of which is based on an annual percentage of each class' average net assets. In addition, FDC may pay financial intermediaries for selling shares of the Fund and providing shareholder support services. For the period, the Distribution and Service Fee rates, total fees and amounts retained by FDC were as follows:
| Distribution Fee | Service Fee | Total Fees | Retained by FDC | |
| Class A | -% | .25% | $10,947 | $913 |
| Class T | .25% | .25% | 7,126 | 878 |
| Class C | .75% | .25% | 35,711 | 9,487 |
| $53,784 | $11,278 |
Sales Load. FDC may receive a front-end sales charge of up to 5.75% for selling Class A shares and 3.50% for selling Class T shares, some of which is paid to financial intermediaries for selling shares of the Fund. Depending on the holding period, FDC may receive contingent deferred sales charges levied on Class A, Class T, and Class C redemptions. The deferred sales charges are 1.00% for Class C shares, 1.00% for certain purchases of Class A shares and .25% for certain purchases of Class T shares.
For the period, sales charge amounts retained by FDC were as follows:
| Retained by FDC | |
| Class A | $3,031 |
| Class T | 1,228 |
| Class C(a) | 182 |
| $4,441 |
(a) When Class C shares are initially sold, FDC pays commissions from its own resources to financial intermediaries through which the sales are made.
Transfer Agent Fees. Fidelity Investments Institutional Operations Company, Inc., (FIIOC), an affiliate of the investment adviser, is the transfer, dividend disbursing and shareholder servicing agent for each class of the Fund. FIIOC receives account fees and asset-based fees that vary according to the account size and type of account of the shareholders of the respective classes of the Fund. FIIOC pays for typesetting, printing and mailing of shareholder reports, except proxy statements.
For the period, transfer agent fees for each class were as follows:
| Amount | % of Class-Level Average Net Assets(a) | |
| Class A | $11,430 | .26 |
| Class T | 4,831 | .34 |
| Class C | 9,178 | .26 |
| Total Emerging Markets | 59,330 | .29 |
| Class I | 4,853 | .18 |
| $89,622 |
(a) Annualized
Accounting Fees. Fidelity Service Company, Inc. (FSC), an affiliate of the investment adviser, maintains the Fund's accounting records. The fee is based on the level of average net assets for each month.
Brokerage Commissions. The Fund placed a portion of its portfolio transactions with brokerage firms which are affiliates of the investment adviser. Brokerage commissions are included in net realized gain (loss) and change in net unrealized appreciation (depreciation) in the Statement of Operations. The commissions paid to these affiliated firms were $230 for the period.
Interfund Trades. The Fund may purchase from or sell securities to other Fidelity Funds under procedures adopted by the Board. The procedures have been designed to ensure these interfund trades are executed in accordance with Rule 17a-7 of the 1940 Act. Interfund trades are included within the respective purchases and sales amounts shown in the Purchases and Sales of Investments note.
7. Committed Line of Credit.
The Fund participates with other funds managed by the investment adviser or an affiliate in a $4.25 billion credit facility (the "line of credit") to be utilized for temporary or emergency purposes to fund shareholder redemptions or for other short-term liquidity purposes. The Fund has agreed to pay commitment fees on its pro-rata portion of the line of credit, which amounted to $57 and is reflected in Miscellaneous expenses on the Statement of Operations. During the period, the Fund did not borrow on this line of credit.
8. Expense Reductions.
The investment adviser contractually agreed to reimburse each class to the extent annual operating expenses exceeded certain levels of average net assets as noted in the table below. This reimbursement will remain in place through December 31, 2016. Some expenses, for example interest expense, including commitment fees, are excluded from this reimbursement.
The following classes were in reimbursement during the period:
| Expense Limitations | Reimbursement | |
| Class A | 1.65% | $15,535 |
| Class T | 1.90% | 6,044 |
| Class C | 2.40% | 12,340 |
| Total Emerging Markets | 1.40% | 77,877 |
| Class I | 1.40% | 7,037 |
| $118,833 |
In addition, through arrangements with the Fund's custodian, credits realized as a result of certain uninvested cash balances were used to reduce the Fund's expenses. During the period, these credits reduced the Fund's custody expenses by $190.
In addition, during the period the investment adviser reimbursed and/or waived a portion of fund-level operating expenses in the amount of $233.
9. Distributions to Shareholders.
Distributions to shareholders of each class were as follows:
| Six months ended April 30, 2016 | Year ended October 31, 2015 | |
| From net investment income | ||
| Class A | $214,855 | $211,944 |
| Class T | 63,597 | 63,689 |
| Class C | 107,081 | 88,937 |
| Total Emerging Markets | 1,155,874 | 751,293 |
| Class I | 174,060 | 82,887 |
| Total | $1,715,467 | $1,198,750 |
| From net realized gain | ||
| Class A | $– | $24,934 |
| Class T | – | 9,098 |
| Class C | – | 18,150 |
| Total Emerging Markets | – | 75,507 |
| Class I | – | 8,330 |
| Total | $– | $136,019 |
10. Share Transactions.
Share transactions for each class were as follows and may contain automatic conversions between classes or exchanges between affiliated funds:
| Shares | Shares | Dollars | Dollars | |
| Six months ended April 30, 2016 | Year ended October 31, 2015 | Six months ended April 30, 2016 | Year ended October 31, 2015 | |
| Class A | ||||
| Shares sold | 231,549 | 251,231 | $2,286,170 | $2,772,246 |
| Reinvestment of distributions | 21,375 | 21,174 | 212,465 | 232,918 |
| Shares redeemed | (288,585) | (469,131) | (2,888,428) | (4,963,727) |
| Net increase (decrease) | (35,661) | (196,726) | $(389,793) | $(1,958,563) |
| Class T | ||||
| Shares sold | 39,364 | 45,171 | $384,188 | $491,646 |
| Reinvestment of distributions | 6,356 | 6,566 | 63,302 | 72,226 |
| Shares redeemed | (115,507) | (186,633) | (1,138,165) | (1,964,687) |
| Net increase (decrease) | (69,787) | (134,896) | $(690,675) | $(1,400,815) |
| Class C | ||||
| Shares sold | 117,585 | 198,104 | $1,158,004 | $2,115,228 |
| Reinvestment of distributions | 10,753 | 9,691 | 106,882 | 106,316 |
| Shares redeemed | (164,784) | (334,580) | (1,599,463) | (3,520,139) |
| Net increase (decrease) | (36,446) | (126,785) | $(334,577) | $(1,298,595) |
| Total Emerging Markets | ||||
| Shares sold | 1,869,299 | 1,772,167 | $18,595,164 | $18,534,579 |
| Reinvestment of distributions | 112,410 | 70,595 | 1,116,229 | 777,256 |
| Shares redeemed | (1,051,095) | (2,136,425) | (10,173,118) | (22,904,245) |
| Net increase (decrease) | 930,614 | (293,663) | $9,538,275 | $(3,592,410) |
| Class I | ||||
| Shares sold | 163,149 | 421,240 | $1,629,549 | $4,563,340 |
| Reinvestment of distributions | 14,612 | 8,237 | 144,954 | 90,609 |
| Shares redeemed | (361,612) | (229,844) | (3,539,650) | (2,428,352) |
| Net increase (decrease) | (183,851) | 199,633 | $(1,765,147) | $2,225,597 |
11. Other.
The Fund's organizational documents provide former and current trustees and officers with a limited indemnification against liabilities arising in connection with the performance of their duties to the Fund. In the normal course of business, the Fund may also enter into contracts that provide general indemnifications. The Fund's maximum exposure under these arrangements is unknown as this would be dependent on future claims that may be made against the Fund. The risk of material loss from such claims is considered remote.
Shareholder Expense Example
As a shareholder of the Fund, you incur two types of costs: (1) transaction costs, including sales charges (loads) on purchase payments or redemption proceeds, redemption fees and (2) ongoing costs, including management fees, distribution and/or service (12b-1) fees and other Fund expenses. This Example is intended to help you understand your ongoing costs (in dollars) of investing in the Fund and to compare these costs with the ongoing costs of investing in other mutual funds.
The Example is based on an investment of $1,000 invested at the beginning of the period and held for the entire period (November 1, 2015 to April 30, 2016).
Actual Expenses
The first line of the accompanying table for each class of the Fund provides information about actual account values and actual expenses. You may use the information in this line, together with the amount you invested, to estimate the expenses that you paid over the period. Simply divide your account value by $1,000.00 (for example, an $8,600 account value divided by $1,000.00 = 8.6), then multiply the result by the number in the first line for a class of the Fund under the heading entitled "Expenses Paid During Period" to estimate the expenses you paid on your account during this period. A small balance maintenance fee of $12.00 that is charged once a year may apply for certain accounts with a value of less than $2,000. This fee is not included in the table below. If it was, the estimate of expenses you paid during the period would be higher, and your ending account value lower, by this amount. In addition, the Fund, as a shareholder in the underlying Fidelity Central Funds, will indirectly bear its pro-rata share of the fees and expenses incurred by the underlying Fidelity Central Funds. These fees and expenses are not included in the Fund's annualized expense ratio used to calculate the expense estimate in the table below.
Hypothetical Example for Comparison Purposes
The second line of the accompanying table for each class of the Fund provides information about hypothetical account values and hypothetical expenses based on a Class' actual expense ratio and an assumed rate of return of 5% per year before expenses, which is not the Class' actual return. The hypothetical account values and expenses may not be used to estimate the actual ending account balance or expenses you paid for the period. You may use this information to compare the ongoing costs of investing in the Fund and other funds. To do so, compare this 5% hypothetical example with the 5% hypothetical examples that appear in the shareholder reports of the other funds. A small balance maintenance fee of $12.00 that is charged once a year may apply for certain accounts with a value of less than $2,000. This fee is not included in the table below. If it was, the estimate of expenses you paid during the period would be higher, and your ending account value lower, by this amount. In addition, the Fund, as a shareholder in the underlying Fidelity Central Funds, will indirectly bear its pro-rata share of the fees and expenses incurred by the underlying Fidelity Central Funds. These fees and expenses are not included in the Fund's annualized expense ratio used to calculate the expense estimate in the table below.
Please note that the expenses shown in the table are meant to highlight your ongoing costs only and do not reflect any transaction costs. Therefore, the second line of the table is useful in comparing ongoing costs only, and will not help you determine the relative total costs of owning different funds. In addition, if these transactional costs were included, your costs would have been higher.
| Annualized Expense Ratio-A | Beginning Account Value November 1, 2015 | Ending Account Value April 30, 2016 | Expenses Paid During Period-B November 1, 2015 to April 30, 2016 | |
| Class A | 1.65% | |||
| Actual | $1,000.00 | $1,018.40 | $8.28 | |
| Hypothetical-C | $1,000.00 | $1,016.66 | $8.27 | |
| Class T | 1.90% | |||
| Actual | $1,000.00 | $1,017.40 | $9.53 | |
| Hypothetical-C | $1,000.00 | $1,015.42 | $9.52 | |
| Class C | 2.40% | |||
| Actual | $1,000.00 | $1,015.60 | $12.03 | |
| Hypothetical-C | $1,000.00 | $1,012.93 | $12.01 | |
| Total Emerging Markets | 1.40% | |||
| Actual | $1,000.00 | $1,020.30 | $7.03 | |
| Hypothetical-C | $1,000.00 | $1,017.90 | $7.02 | |
| Class I | 1.40% | |||
| Actual | $1,000.00 | $1,020.60 | $7.03 | |
| Hypothetical-C | $1,000.00 | $1,017.90 | $7.02 |
A Annualized expense ratio reflects expenses net of applicable fee waivers.
B Expenses are equal to each Class' annualized expense ratio, multiplied by the average account value over the period, multiplied by 182/366 (to reflect the one-half year period).
C 5% return per year before expenses
![]()
ATEKI-SANN-0616
1.931264.104
Fidelity Advisor® Global Commodity Stock Fund - Semi-Annual Report April 30, 2016 Class A, Class T, Class B and Class C are classes of Fidelity® Global Commodity Stock Fund |
|
Contents
To view a fund's proxy voting guidelines and proxy voting record for the 12-month period ended June 30, visit http://www.fidelity.com/proxyvotingresults or visit the Securities and Exchange Commission's (SEC) web site at http://www.sec.gov.
You may also call 1-877-208-0098 to request a free copy of the proxy voting guidelines.
Standard & Poor's, S&P and S&P 500 are registered service marks of The McGraw-Hill Companies, Inc. and have been licensed for use by Fidelity Distributors Corporation.
Other third-party marks appearing herein are the property of their respective owners.
All other marks appearing herein are registered or unregistered trademarks or service marks of FMR LLC or an affiliated company. © 2016 FMR LLC. All rights reserved.
This report and the financial statements contained herein are submitted for the general information of the shareholders of the Fund. This report is not authorized for distribution to prospective investors in the Fund unless preceded or accompanied by an effective prospectus.
A fund files its complete schedule of portfolio holdings with the SEC for the first and third quarters of each fiscal year on Form N-Q. Forms N-Q are available on the SEC’s web site at http://www.sec.gov. A fund's Forms N-Q may be reviewed and copied at the SEC’s Public Reference Room in Washington, DC. Information regarding the operation of the SEC's Public Reference Room may be obtained by calling 1-800-SEC-0330.
For a complete list of a fund's portfolio holdings, view the most recent holdings listing, semiannual report, or annual report on Fidelity's web site at http://www.fidelity.com, http://www.advisor.fidelity.com, or http://www.401k.com, as applicable.
NOT FDIC INSURED •MAY LOSE VALUE •NO BANK GUARANTEE
Neither the Fund nor Fidelity Distributors Corporation is a bank.
Investment Summary (Unaudited)
Top Ten Stocks as of April 30, 2016
| % of fund's net assets | % of fund's net assets 6 months ago | |
| Monsanto Co. | 5.5 | 6.9 |
| Syngenta AG (Switzerland) | 4.5 | 3.7 |
| Chevron Corp. | 4.0 | 3.8 |
| Rio Tinto PLC | 3.6 | 4.3 |
| BHP Billiton PLC | 3.3 | 4.7 |
| Potash Corp. of Saskatchewan, Inc. | 3.0 | 4.9 |
| Agrium, Inc. | 3.0 | 3.8 |
| CF Industries Holdings, Inc. | 2.8 | 2.5 |
| The Mosaic Co. | 2.6 | 3.9 |
| Total SA | 2.3 | 2.2 |
| 34.6 |
Top Sectors (% of fund's net assets)
| As of April 30, 2016 | ||
| Agriculture | 34.2% | |
| Energy | 32.2% | |
| Metals | 26.0% | |
| Other | 5.5% | |
| Short-Term Investment and Net Other Assets | 2.1% | |
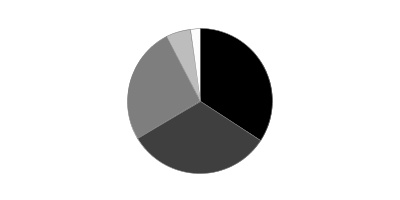
| As of October 31, 2015 | ||
| Agriculture | 37.7% | |
| Energy | 29.6% | |
| Metals | 26.5% | |
| Other | 6.1% | |
| Short-Term Investment and Net Other Assets | 0.1% | |

Investments April 30, 2016 (Unaudited)
Showing Percentage of Net Assets
| Common Stocks - 96.9% | |||
| Shares | Value | ||
| Aerospace & Defense - 0.4% | |||
| Aerospace & Defense - 0.4% | |||
| Rolls-Royce Group PLC | 120,320 | $1,177,018 | |
| Chemicals - 27.0% | |||
| Commodity Chemicals - 0.6% | |||
| LyondellBasell Industries NV Class A | 19,400 | 1,603,798 | |
| Diversified Chemicals - 0.8% | |||
| E.I. du Pont de Nemours & Co. | 24,000 | 1,581,840 | |
| Eastman Chemical Co. | 6,700 | 511,746 | |
| 2,093,586 | |||
| Fertilizers & Agricultural Chemicals - 25.2% | |||
| Agrium, Inc. | 92,100 | 7,936,441 | |
| CF Industries Holdings, Inc. | 229,460 | 7,588,242 | |
| FMC Corp. | 25,100 | 1,085,826 | |
| Israel Chemicals Ltd. | 152,200 | 755,206 | |
| Monsanto Co. | 158,500 | 14,848,283 | |
| OCI NV (a)(b) | 67,400 | 1,332,450 | |
| Potash Corp. of Saskatchewan, Inc. | 455,000 | 8,050,530 | |
| Sociedad Quimica y Minera de Chile SA (PN-B) sponsored ADR | 185,800 | 3,870,214 | |
| Syngenta AG (Switzerland) | 30,463 | 12,194,092 | |
| The Mosaic Co. | 245,861 | 6,881,649 | |
| Yara International ASA | 83,000 | 3,323,360 | |
| 67,866,293 | |||
| Specialty Chemicals - 0.4% | |||
| Albemarle Corp. U.S. | 8,300 | 549,128 | |
| W.R. Grace & Co. | 6,700 | 513,756 | |
| 1,062,884 | |||
| TOTAL CHEMICALS | 72,626,561 | ||
| Containers & Packaging - 1.1% | |||
| Metal & Glass Containers - 0.4% | |||
| Ball Corp. | 14,800 | 1,056,424 | |
| Paper Packaging - 0.7% | |||
| Graphic Packaging Holding Co. | 35,700 | 474,096 | |
| Smurfit Kappa Group PLC | 20,000 | 530,158 | |
| WestRock Co. | 19,659 | 822,729 | |
| 1,826,983 | |||
| TOTAL CONTAINERS & PACKAGING | 2,883,407 | ||
| Electrical Equipment - 0.5% | |||
| Electrical Components & Equipment - 0.5% | |||
| Regal Beloit Corp. | 9,100 | 586,222 | |
| SolarCity Corp. (a) | 20,500 | 621,560 | |
| 1,207,782 | |||
| Energy Equipment & Services - 0.5% | |||
| Oil & Gas Equipment & Services - 0.5% | |||
| Baker Hughes, Inc. | 17,300 | 836,628 | |
| Dril-Quip, Inc. (a) | 1,800 | 116,676 | |
| SBM Offshore NV | 37,500 | 502,176 | |
| 1,455,480 | |||
| Food Products - 3.4% | |||
| Agricultural Products - 3.2% | |||
| Archer Daniels Midland Co. | 48,600 | 1,941,084 | |
| Bunge Ltd. | 11,500 | 718,750 | |
| Darling International, Inc. (a) | 164,100 | 2,377,809 | |
| First Resources Ltd. | 1,033,700 | 1,464,251 | |
| Golden Agri-Resources Ltd. | 2,237,800 | 665,591 | |
| SLC Agricola SA | 294,200 | 1,327,610 | |
| 8,495,095 | |||
| Packaged Foods & Meats - 0.2% | |||
| Adecoagro SA (a) | 61,200 | 652,392 | |
| TOTAL FOOD PRODUCTS | 9,147,487 | ||
| Household Products - 0.3% | |||
| Household Products - 0.3% | |||
| Svenska Cellulosa AB (SCA) (B Shares) | 21,200 | 667,644 | |
| Independent Power and Renewable Electricity Producers - 1.4% | |||
| Independent Power Producers & Energy Traders - 0.3% | |||
| China Resources Power Holdings Co. Ltd. | 396,000 | 666,962 | |
| Renewable Electricity - 1.1% | |||
| Huaneng Renewables Corp. Ltd. (H Shares) | 3,010,000 | 888,204 | |
| NextEra Energy Partners LP | 71,600 | 2,068,524 | |
| 2,956,728 | |||
| TOTAL INDEPENDENT POWER AND RENEWABLE ELECTRICITY PRODUCERS | 3,623,690 | ||
| Machinery - 1.3% | |||
| Agricultural & Farm Machinery - 1.2% | |||
| AGCO Corp. | 27,100 | 1,449,037 | |
| Deere & Co. | 12,500 | 1,051,375 | |
| Jain Irrigation Systems Ltd. (a) | 954,603 | 878,070 | |
| 3,378,482 | |||
| Construction Machinery & Heavy Trucks - 0.1% | |||
| Caterpillar, Inc. | 3,000 | 233,160 | |
| TOTAL MACHINERY | 3,611,642 | ||
| Metals & Mining - 25.2% | |||
| Aluminum - 0.4% | |||
| Alcoa, Inc. | 93,600 | 1,045,512 | |
| Diversified Metals & Mining - 10.6% | |||
| Anglo American PLC (United Kingdom) | 62,851 | 701,066 | |
| BHP Billiton PLC | 644,273 | 8,803,665 | |
| Boliden AB (b) | 31,200 | 543,930 | |
| First Quantum Minerals Ltd. | 115,724 | 985,964 | |
| Freeport-McMoRan, Inc. (b) | 48,100 | 673,400 | |
| Glencore Xstrata PLC | 1,335,538 | 3,178,865 | |
| Grupo Mexico SA de CV Series B | 568,211 | 1,445,244 | |
| Ivanhoe Mines Ltd. (a) | 906,400 | 751,300 | |
| MMC Norilsk Nickel PJSC sponsored ADR | 66,400 | 979,400 | |
| Rio Tinto PLC | 292,187 | 9,801,792 | |
| South32 Ltd. (a) | 443,636 | 559,949 | |
| Turquoise Hill Resources Ltd. (a) | 53,000 | 158,404 | |
| 28,582,979 | |||
| Gold - 8.2% | |||
| Agnico Eagle Mines Ltd. (Canada) | 35,800 | 1,692,275 | |
| AngloGold Ashanti Ltd. sponsored ADR (a) | 35,600 | 585,620 | |
| Argonaut Gold, Inc. (a) | 319,700 | 749,118 | |
| B2Gold Corp. (a) | 965,680 | 2,147,324 | |
| Barrick Gold Corp. | 150,400 | 2,911,625 | |
| Compania de Minas Buenaventura SA sponsored ADR (a)(b) | 60,500 | 614,075 | |
| Continental Gold, Inc. (a) | 479,200 | 1,057,929 | |
| Franco-Nevada Corp. | 21,700 | 1,523,687 | |
| Goldcorp, Inc. | 137,910 | 2,778,644 | |
| Newcrest Mining Ltd. (a) | 58,573 | 844,848 | |
| Newmont Mining Corp. | 87,500 | 3,059,875 | |
| Premier Gold Mines Ltd. (a) | 200,500 | 599,247 | |
| Randgold Resources Ltd. sponsored ADR | 16,600 | 1,668,300 | |
| SEMAFO, Inc. (a) | 139,900 | 623,289 | |
| Sibanye Gold Ltd. ADR (b) | 41,400 | 637,560 | |
| Torex Gold Resources, Inc. (a) | 351,200 | 624,194 | |
| 22,117,610 | |||
| Precious Metals & Minerals - 0.5% | |||
| Impala Platinum Holdings Ltd. (a) | 60,500 | 250,751 | |
| Industrias Penoles SA de CV | 35,035 | 547,681 | |
| Tahoe Resources, Inc. | 40,600 | 573,390 | |
| 1,371,822 | |||
| Silver - 0.6% | |||
| Silver Wheaton Corp. | 76,500 | 1,602,921 | |
| Steel - 4.9% | |||
| ArcelorMittal SA Class A unit (b) | 193,710 | 1,090,587 | |
| Fortescue Metals Group Ltd. | 100,000 | 259,279 | |
| Hitachi Metals Ltd. (c) | 63,700 | 646,820 | |
| Hyundai Steel Co. | 17,664 | 969,791 | |
| JFE Holdings, Inc. | 34,100 | 478,537 | |
| Kobe Steel Ltd. | 498,000 | 478,189 | |
| Nippon Steel & Sumitomo Metal Corp. | 111,200 | 2,313,824 | |
| Nucor Corp. | 40,700 | 2,026,046 | |
| POSCO | 9,750 | 2,031,585 | |
| Steel Dynamics, Inc. | 20,600 | 519,326 | |
| Thyssenkrupp AG | 66,200 | 1,539,545 | |
| Voestalpine AG | 19,200 | 692,087 | |
| 13,045,616 | |||
| TOTAL METALS & MINING | 67,766,460 | ||
| Oil, Gas & Consumable Fuels - 30.3% | |||
| Coal & Consumable Fuels - 0.4% | |||
| Cameco Corp. | 70,800 | 885,917 | |
| Coal India Ltd. | 55,487 | 240,616 | |
| 1,126,533 | |||
| Integrated Oil & Gas - 16.5% | |||
| BP PLC | 478,800 | 2,637,892 | |
| Cenovus Energy, Inc. | 171,300 | 2,715,515 | |
| Chevron Corp. | 104,800 | 10,708,464 | |
| China Petroleum & Chemical Corp. (H Shares) | 1,290,000 | 909,043 | |
| Eni SpA | 58,000 | 947,542 | |
| Exxon Mobil Corp. | 50,700 | 4,481,880 | |
| Imperial Oil Ltd. | 58,700 | 1,946,686 | |
| InterOil Corp. (a) | 19,100 | 639,277 | |
| Lukoil PJSC sponsored ADR | 40,300 | 1,708,116 | |
| Occidental Petroleum Corp. | 9,400 | 720,510 | |
| Royal Dutch Shell PLC: | |||
| Class A (United Kingdom) | 150,000 | 3,928,980 | |
| Class B (United Kingdom) | 39,863 | 1,046,598 | |
| Statoil ASA | 115,800 | 2,038,230 | |
| Suncor Energy, Inc. | 109,032 | 3,200,485 | |
| Total SA | 122,600 | 6,196,300 | |
| YPF SA Class D sponsored ADR | 33,300 | 670,995 | |
| 44,496,513 | |||
| Oil & Gas Exploration & Production - 12.9% | |||
| Anadarko Petroleum Corp. | 106,600 | 5,624,216 | |
| Apache Corp. | 19,300 | 1,049,920 | |
| Cabot Oil & Gas Corp. | 50,700 | 1,186,380 | |
| Carrizo Oil & Gas, Inc. (a) | 15,500 | 548,235 | |
| Cimarex Energy Co. | 4,600 | 500,848 | |
| CNOOC Ltd. sponsored ADR (b) | 16,700 | 2,061,281 | |
| Cobalt International Energy, Inc. (a) | 284,500 | 918,935 | |
| ConocoPhillips Co. | 67,900 | 3,244,941 | |
| Continental Resources, Inc. (a) | 13,900 | 517,914 | |
| Devon Energy Corp. | 30,200 | 1,047,336 | |
| EOG Resources, Inc. | 29,300 | 2,420,766 | |
| EQT Corp. | 26,601 | 1,864,730 | |
| Hess Corp. | 13,700 | 816,794 | |
| Marathon Oil Corp. | 58,900 | 829,901 | |
| Newfield Exploration Co. (a) | 14,100 | 511,125 | |
| Noble Energy, Inc. | 60,900 | 2,199,099 | |
| NOVATEK OAO GDR (Reg. S) | 11,200 | 1,075,200 | |
| PDC Energy, Inc. (a) | 12,800 | 803,712 | |
| Pioneer Natural Resources Co. | 3,410 | 566,401 | |
| PrairieSky Royalty Ltd. | 91,000 | 1,916,171 | |
| QEP Resources, Inc. | 20,700 | 371,151 | |
| SM Energy Co. | 55,300 | 1,723,148 | |
| Southwestern Energy Co. (a)(b) | 42,100 | 565,403 | |
| Tullow Oil PLC (a) | 148,500 | 606,895 | |
| Whiting Petroleum Corp. (a)(b) | 76,700 | 920,400 | |
| Woodside Petroleum Ltd. | 35,573 | 766,538 | |
| 34,657,440 | |||
| Oil & Gas Storage & Transport - 0.5% | |||
| Teekay LNG Partners LP | 5,400 | 74,196 | |
| Williams Partners LP | 37,900 | 1,145,717 | |
| 1,219,913 | |||
| TOTAL OIL, GAS & CONSUMABLE FUELS | 81,500,399 | ||
| Paper & Forest Products - 4.5% | |||
| Forest Products - 0.6% | |||
| TFS Corp. Ltd. | 632,575 | 750,326 | |
| West Fraser Timber Co. Ltd. | 26,900 | 886,304 | |
| 1,636,630 | |||
| Paper Products - 3.9% | |||
| Empresas CMPC SA | 534,203 | 1,208,006 | |
| Fibria Celulose SA | 198,300 | 1,751,648 | |
| Mondi PLC | 172,100 | 3,289,148 | |
| Oji Holdings Corp. | 174,000 | 714,538 | |
| Stora Enso Oyj (R Shares) (b) | 176,500 | 1,540,012 | |
| UPM-Kymmene Corp. (b) | 103,500 | 1,976,791 | |
| 10,480,143 | |||
| TOTAL PAPER & FOREST PRODUCTS | 12,116,773 | ||
| Real Estate Investment Trusts - 0.7% | |||
| Specialized REITs - 0.7% | |||
| Potlatch Corp. | 52,400 | 1,845,528 | |
| Semiconductors & Semiconductor Equipment - 0.3% | |||
| Semiconductor Equipment - 0.3% | |||
| SolarEdge Technologies, Inc. (a) | 27,400 | 734,046 | |
| TOTAL COMMON STOCKS | |||
| (Cost $331,791,961) | 260,363,917 | ||
| Nonconvertible Preferred Stocks - 1.0% | |||
| Aerospace & Defense - 0.0% | |||
| Aerospace & Defense - 0.0% | |||
| Rolls-Royce Group PLC | 8,542,720 | 12,482 | |
| Metals & Mining - 0.7% | |||
| Steel - 0.7% | |||
| Vale SA (PN-A) sponsored ADR | 449,300 | 2,039,822 | |
| Oil, Gas & Consumable Fuels - 0.3% | |||
| Integrated Oil & Gas - 0.3% | |||
| Petroleo Brasileiro SA - Petrobras (PN) sponsored (non-vtg.) (a) | 123,600 | 729,240 | |
| TOTAL NONCONVERTIBLE PREFERRED STOCKS | |||
| (Cost $5,284,416) | 2,781,544 | ||
| Money Market Funds - 5.3% | |||
| Fidelity Cash Central Fund, 0.38% (d) | 6,967,597 | 6,967,597 | |
| Fidelity Securities Lending Cash Central Fund, 0.42% (d)(e) | 7,338,155 | 7,338,155 | |
| TOTAL MONEY MARKET FUNDS | |||
| (Cost $14,305,752) | 14,305,752 | ||
| TOTAL INVESTMENT PORTFOLIO - 103.2% | |||
| (Cost $351,382,129) | 277,451,213 | ||
| NET OTHER ASSETS (LIABILITIES) - (3.2)% | (8,591,938) | ||
| NET ASSETS - 100% | $268,859,275 |
Legend
(a) Non-income producing
(b) Security or a portion of the security is on loan at period end.
(c) Security or a portion of the security purchased on a delayed delivery or when-issued basis.
(d) Affiliated fund that is generally available only to investment companies and other accounts managed by Fidelity Investments. The rate quoted is the annualized seven-day yield of the fund at period end. A complete unaudited listing of the fund's holdings as of its most recent quarter end is available upon request. In addition, each Fidelity Central Fund's financial statements are available on the SEC's website or upon request.
(e) Investment made with cash collateral received from securities on loan.
Affiliated Central Funds
Information regarding fiscal year to date income earned by the Fund from investments in Fidelity Central Funds is as follows:
| Fund | Income earned |
| Fidelity Cash Central Fund | $4,891 |
| Fidelity Securities Lending Cash Central Fund | 106,267 |
| Total | $111,158 |
Investment Valuation
The following is a summary of the inputs used, as of April 30, 2016, involving the Fund's assets and liabilities carried at fair value. The inputs or methodology used for valuing securities may not be an indication of the risk associated with investing in those securities. For more information on valuation inputs, and their aggregation into the levels used below, please refer to the Investment Valuation section in the accompanying Notes to Financial Statements.
| Valuation Inputs at Reporting Date: | ||||
| Description | Total | Level 1 | Level 2 | Level 3 |
| Investments in Securities: | ||||
| Common Stocks | $260,363,917 | $215,835,216 | $44,528,701 | $-- |
| Nonconvertible Preferred Stocks | 2,781,544 | 2,781,544 | -- | -- |
| Money Market Funds | 14,305,752 | 14,305,752 | -- | -- |
| Total Investments in Securities: | $277,451,213 | $232,922,512 | $44,528,701 | $-- |
The following is a summary of transfers between Level 1 and Level 2 for the period ended April 30, 2016. Transfers are assumed to have occurred at the beginning of the period, and are primarily attributable to the valuation techniques used for foreign equity securities, as discussed in the accompanying Notes to Financial Statements:
| Transfers | Total |
| Level 1 to Level 2 | $0 |
| Level 2 to Level 1 | $14,804,712 |
Other Information
Distribution of investments by country or territory of incorporation, as a percentage of Total Net Assets, is as follows (Unaudited):
| United States of America | 40.3% |
| Canada | 17.3% |
| United Kingdom | 11.9% |
| Switzerland | 4.5% |
| France | 2.3% |
| Brazil | 2.2% |
| Norway | 2.0% |
| Chile | 1.8% |
| Bailiwick of Jersey | 1.8% |
| Japan | 1.8% |
| Russia | 1.4% |
| Finland | 1.3% |
| Netherlands | 1.3% |
| Australia | 1.2% |
| Korea (South) | 1.1% |
| Hong Kong | 1.1% |
| Others (Individually Less Than 1%) | 6.7% |
| 100.0% |
See accompanying notes which are an integral part of the financial statements.
Financial Statements
Statement of Assets and Liabilities
| April 30, 2016 (Unaudited) | ||
| Assets | ||
| Investment in securities, at value (including securities loaned of $7,031,911) — See accompanying schedule: Unaffiliated issuers (cost $337,076,377) | $263,145,461 | |
| Fidelity Central Funds (cost $14,305,752) | 14,305,752 | |
| Total Investments (cost $351,382,129) | $277,451,213 | |
| Foreign currency held at value (cost $26,141) | 26,141 | |
| Receivable for investments sold | 1,128,703 | |
| Receivable for fund shares sold | 1,257,584 | |
| Dividends receivable | 1,107,997 | |
| Distributions receivable from Fidelity Central Funds | 21,225 | |
| Prepaid expenses | 281 | |
| Other receivables | 6,912 | |
| Total assets | 281,000,056 | |
| Liabilities | ||
| Payable to custodian bank | $324 | |
| Payable for investments purchased | ||
| Regular delivery | 3,410,510 | |
| Delayed delivery | 76,258 | |
| Payable for fund shares redeemed | 1,052,362 | |
| Accrued management fee | 142,776 | |
| Distribution and service plan fees payable | 18,314 | |
| Other affiliated payables | 65,802 | |
| Other payables and accrued expenses | 36,280 | |
| Collateral on securities loaned, at value | 7,338,155 | |
| Total liabilities | 12,140,781 | |
| Net Assets | $268,859,275 | |
| Net Assets consist of: | ||
| Paid in capital | $443,643,861 | |
| Undistributed net investment income | 1,567,386 | |
| Accumulated undistributed net realized gain (loss) on investments and foreign currency transactions | (102,409,631) | |
| Net unrealized appreciation (depreciation) on investments and assets and liabilities in foreign currencies | (73,942,341) | |
| Net Assets | $268,859,275 | |
| Calculation of Maximum Offering Price | ||
| Class A: | ||
| Net Asset Value and redemption price per share ($32,034,388 ÷ 3,073,781 shares) | $10.42 | |
| Maximum offering price per share (100/94.25 of $10.42) | $11.06 | |
| Class T: | ||
| Net Asset Value and redemption price per share ($6,177,528 ÷ 592,800 shares) | $10.42 | |
| Maximum offering price per share (100/96.50 of $10.42) | $10.80 | |
| Class B: | ||
| Net Asset Value and offering price per share ($805,040 ÷ 77,326 shares)(a) | $10.41 | |
| Class C: | ||
| Net Asset Value and offering price per share ($11,528,539 ÷ 1,114,551 shares)(a) | $10.34 | |
| Global Commodity Stock: | ||
| Net Asset Value, offering price and redemption price per share ($187,023,903 ÷ 17,915,595 shares) | $10.44 | |
| Class I: | ||
| Net Asset Value, offering price and redemption price per share ($31,289,877 ÷ 2,999,773 shares) | $10.43 |
(a) Redemption price per share is equal to net asset value less any applicable contingent deferred sales charge.
See accompanying notes which are an integral part of the financial statements.
Statement of Operations
| Six months ended April 30, 2016 (Unaudited) | ||
| Investment Income | ||
| Dividends | $3,551,835 | |
| Income from Fidelity Central Funds | 111,158 | |
| Income before foreign taxes withheld | 3,662,993 | |
| Less foreign taxes withheld | (261,962) | |
| Total income | 3,401,031 | |
| Expenses | ||
| Management fee | $741,086 | |
| Transfer agent fees | 311,622 | |
| Distribution and service plan fees | 101,260 | |
| Accounting and security lending fees | 55,708 | |
| Custodian fees and expenses | 29,898 | |
| Independent trustees' compensation | 460 | |
| Registration fees | 75,498 | |
| Audit | 31,910 | |
| Legal | 915 | |
| Miscellaneous | 719 | |
| Total expenses before reductions | 1,349,076 | |
| Expense reductions | (5,501) | 1,343,575 |
| Net investment income (loss) | 2,057,456 | |
| Realized and Unrealized Gain (Loss) | ||
| Net realized gain (loss) on: | ||
| Investment securities: | ||
| Unaffiliated issuers | (32,971,910) | |
| Foreign currency transactions | (34,212) | |
| Total net realized gain (loss) | (33,006,122) | |
| Change in net unrealized appreciation (depreciation) on: Investment securities | 47,992,729 | |
| Assets and liabilities in foreign currencies | 14,367 | |
| Total change in net unrealized appreciation (depreciation) | 48,007,096 | |
| Net gain (loss) | 15,000,974 | |
| Net increase (decrease) in net assets resulting from operations | $17,058,430 |
See accompanying notes which are an integral part of the financial statements.
Statement of Changes in Net Assets
| Six months ended April 30, 2016 (Unaudited) | Year ended October 31, 2015 | |
| Increase (Decrease) in Net Assets | ||
| Operations | ||
| Net investment income (loss) | $2,057,456 | $5,601,197 |
| Net realized gain (loss) | (33,006,122) | (22,741,457) |
| Change in net unrealized appreciation (depreciation) | 48,007,096 | (54,129,193) |
| Net increase (decrease) in net assets resulting from operations | 17,058,430 | (71,269,453) |
| Distributions to shareholders from net investment income | (5,140,876) | (3,898,874) |
| Distributions to shareholders from net realized gain | (224,075) | (629,272) |
| Total distributions | (5,364,951) | (4,528,146) |
| Share transactions - net increase (decrease) | 26,135,446 | (20,805,112) |
| Redemption fees | 5,198 | 7,987 |
| Total increase (decrease) in net assets | 37,834,123 | (96,594,724) |
| Net Assets | ||
| Beginning of period | 231,025,152 | 327,619,876 |
| End of period (including undistributed net investment income of $1,567,386 and undistributed net investment income of $4,650,806, respectively) | $268,859,275 | $231,025,152 |
See accompanying notes which are an integral part of the financial statements.
Financial Highlights — Fidelity Global Commodity Stock Fund Class A
| Six months ended (Unaudited) April 30, | Years ended October 31, | |||||
| 2016 | 2015 | 2014 | 2013 | 2012 | 2011 | |
| Selected Per–Share Data | ||||||
| Net asset value, beginning of period | $10.05 | $13.25 | $14.17 | $14.59 | $15.14 | $15.60 |
| Income from Investment Operations | ||||||
| Net investment income (loss)A | .08 | .22 | .15 | .16 | .11 | .12 |
| Net realized and unrealized gain (loss) | .51 | (3.25) | (.91) | (.45) | (.59) | (.38) |
| Total from investment operations | .59 | (3.03) | (.76) | (.29) | (.48) | (.26) |
| Distributions from net investment income | (.21) | (.14) | (.15) | (.13) | (.05) | (.13) |
| Distributions from net realized gain | (.01) | (.03) | (.01) | – | (.01) | (.06) |
| Total distributions | (.22) | (.17) | (.16) | (.13) | (.07)B | (.20)C |
| Redemption fees added to paid in capitalA,D | – | – | – | – | – | – |
| Net asset value, end of period | $10.42 | $10.05 | $13.25 | $14.17 | $14.59 | $15.14 |
| Total ReturnE,F,G | 6.14% | (23.16)% | (5.41)% | (2.00)% | (3.19)% | (1.80)% |
| Ratios to Average Net AssetsH,I | ||||||
| Expenses before reductions | 1.43%J | 1.34% | 1.35% | 1.36% | 1.34% | 1.32% |
| Expenses net of fee waivers, if any | 1.43%J | 1.34% | 1.35% | 1.35% | 1.34% | 1.32% |
| Expenses net of all reductions | 1.42%J | 1.34% | 1.35% | 1.34% | 1.33% | 1.31% |
| Net investment income (loss) | 1.77%J | 1.85% | 1.05% | 1.12% | .80% | .71% |
| Supplemental Data | ||||||
| Net assets, end of period (000 omitted) | $32,034 | $31,391 | $51,586 | $71,293 | $99,694 | $127,979 |
| Portfolio turnover rateK | 99%J | 77% | 75% | 65% | 91% | 71% |
A Calculated based on average shares outstanding during the period.
B Total distributions of $.07 per share is comprised of distributions from net investment income of $.052 and distributions from net realized gain of $.014 per share.
C Total distributions of $.20 per share is comprised of distributions from net investment income of $.133 and distributions from net realized gain of $.062 per share.
D Amount represents less than $.005 per share.
E Total returns for periods of less than one year are not annualized.
F Total returns would have been lower if certain expenses had not been reduced during the applicable periods shown.
G Total returns do not include the effect of the sales charges.
H Fees and expenses of any underlying Fidelity Central Funds are not included in the Fund's expense ratio. The Fund indirectly bears its proportionate share of the expenses of any underlying Fidelity Central Funds.
I Expense ratios reflect operating expenses of the class. Expenses before reductions do not reflect amounts reimbursed by the investment adviser or reductions from brokerage service arrangements or reductions from other expense offset arrangements and do not represent the amount paid by the class during periods when reimbursements or reductions occur. Expenses net of fee waivers reflect expenses after reimbursement by the investment adviser but prior to reductions from brokerage service arrangements or other expense offset arrangements. Expenses net of all reductions represent the net expenses paid by the class.
J Annualized
K Amount does not include the portfolio activity of any underlying Fidelity Central Funds.
See accompanying notes which are an integral part of the financial statements.
Financial Highlights — Fidelity Global Commodity Stock Fund Class T
| Six months ended (Unaudited) April 30, | Years ended October 31, | |||||
| 2016 | 2015 | 2014 | 2013 | 2012 | 2011 | |
| Selected Per–Share Data | ||||||
| Net asset value, beginning of period | $10.02 | $13.21 | $14.13 | $14.54 | $15.08 | $15.55 |
| Income from Investment Operations | ||||||
| Net investment income (loss)A | .07 | .19 | .11 | .12 | .08 | .07 |
| Net realized and unrealized gain (loss) | .51 | (3.25) | (.90) | (.45) | (.60) | (.38) |
| Total from investment operations | .58 | (3.06) | (.79) | (.33) | (.52) | (.31) |
| Distributions from net investment income | (.17) | (.10) | (.11) | (.08) | (.01) | (.10) |
| Distributions from net realized gain | (.01) | (.03) | (.01) | – | (.01) | (.06) |
| Total distributions | (.18) | (.13) | (.13)B | (.08) | (.02) | (.16) |
| Redemption fees added to paid in capitalA,C | – | – | – | – | – | – |
| Net asset value, end of period | $10.42 | $10.02 | $13.21 | $14.13 | $14.54 | $15.08 |
| Total ReturnD,E,F | 6.03% | (23.40)% | (5.65)% | (2.26)% | (3.43)% | (2.09)% |
| Ratios to Average Net AssetsG,H | ||||||
| Expenses before reductions | 1.70%I | 1.63% | 1.62% | 1.62% | 1.61% | 1.60% |
| Expenses net of fee waivers, if any | 1.70%I | 1.63% | 1.62% | 1.61% | 1.61% | 1.60% |
| Expenses net of all reductions | 1.70%I | 1.62% | 1.62% | 1.60% | 1.60% | 1.59% |
| Net investment income (loss) | 1.50%I | 1.57% | .78% | .86% | .53% | .43% |
| Supplemental Data | ||||||
| Net assets, end of period (000 omitted) | $6,178 | $6,335 | $9,867 | $12,551 | $16,692 | $20,831 |
| Portfolio turnover rateJ | 99%I | 77% | 75% | 65% | 91% | 71% |
A Calculated based on average shares outstanding during the period.
B Total distributions of $.13 per share is comprised of distributions from net investment income of $.113 and distributions from net realized gain of $.013 per share.
C Amount represents less than $.005 per share.
D Total returns for periods of less than one year are not annualized.
E Total returns would have been lower if certain expenses had not been reduced during the applicable periods shown.
F Total returns do not include the effect of the sales charges.
G Fees and expenses of any underlying Fidelity Central Funds are not included in the Fund's expense ratio. The Fund indirectly bears its proportionate share of the expenses of any underlying Fidelity Central Funds.
H Expense ratios reflect operating expenses of the class. Expenses before reductions do not reflect amounts reimbursed by the investment adviser or reductions from brokerage service arrangements or reductions from other expense offset arrangements and do not represent the amount paid by the class during periods when reimbursements or reductions occur. Expenses net of fee waivers reflect expenses after reimbursement by the investment adviser but prior to reductions from brokerage service arrangements or other expense offset arrangements. Expenses net of all reductions represent the net expenses paid by the class.
I Annualized
J Amount does not include the portfolio activity of any underlying Fidelity Central Funds.
See accompanying notes which are an integral part of the financial statements.
Financial Highlights — Fidelity Global Commodity Stock Fund Class B
| Six months ended (Unaudited) April 30, | Years ended October 31, | |||||
| 2016 | 2015 | 2014 | 2013 | 2012 | 2011 | |
| Selected Per–Share Data | ||||||
| Net asset value, beginning of period | $9.97 | $13.12 | $14.01 | $14.41 | $15.00 | $15.46 |
| Income from Investment Operations | ||||||
| Net investment income (loss)A | .05 | .13 | .04 | .05 | –B | (.01) |
| Net realized and unrealized gain (loss) | .51 | (3.24) | (.89) | (.45) | (.59) | (.39) |
| Total from investment operations | .56 | (3.11) | (.85) | (.40) | (.59) | (.40) |
| Distributions from net investment income | (.11) | (.02) | (.03) | –B | – | – |
| Distributions from net realized gain | (.01) | (.03) | (.01) | – | – | (.06) |
| Total distributions | (.12) | (.04)C | (.04) | –B | – | (.06) |
| Redemption fees added to paid in capitalA,B | – | – | – | – | – | – |
| Net asset value, end of period | $10.41 | $9.97 | $13.12 | $14.01 | $14.41 | $15.00 |
| Total ReturnD,E,F | 5.72% | (23.76)% | (6.06)% | (2.75)% | (3.93)% | (2.62)% |
| Ratios to Average Net AssetsG,H | ||||||
| Expenses before reductions | 2.18%I | 2.13% | 2.11% | 2.11% | 2.10% | 2.11% |
| Expenses net of fee waivers, if any | 2.18%I | 2.12% | 2.11% | 2.11% | 2.10% | 2.11% |
| Expenses net of all reductions | 2.17%I | 2.12% | 2.11% | 2.10% | 2.10% | 2.10% |
| Net investment income (loss) | 1.03%I | 1.07% | .29% | .36% | .03% | (.09)% |
| Supplemental Data | ||||||
| Net assets, end of period (000 omitted) | $805 | $864 | $1,584 | $2,303 | $3,097 | $4,324 |
| Portfolio turnover rateJ | 99%I | 77% | 75% | 65% | 91% | 71% |
A Calculated based on average shares outstanding during the period.
B Amount represents less than $.005 per share.
C Total distributions of $.04 per share is comprised of distributions from net investment income of $.016 and distributions from net realized gain of $.026 per share.
D Total returns for periods of less than one year are not annualized.
E Total returns would have been lower if certain expenses had not been reduced during the applicable periods shown.
F Total returns do not include the effect of the contingent deferred sales charge.
G Fees and expenses of any underlying Fidelity Central Funds are not included in the Fund's expense ratio. The Fund indirectly bears its proportionate share of the expenses of any underlying Fidelity Central Funds.
H Expense ratios reflect operating expenses of the class. Expenses before reductions do not reflect amounts reimbursed by the investment adviser or reductions from brokerage service arrangements or reductions from other expense offset arrangements and do not represent the amount paid by the class during periods when reimbursements or reductions occur. Expenses net of fee waivers reflect expenses after reimbursement by the investment adviser but prior to reductions from brokerage service arrangements or other expense offset arrangements. Expenses net of all reductions represent the net expenses paid by the class.
I Annualized
J Amount does not include the portfolio activity of any underlying Fidelity Central Funds.
See accompanying notes which are an integral part of the financial statements.
Financial Highlights — Fidelity Global Commodity Stock Fund Class C
| Six months ended (Unaudited) April 30, | Years ended October 31, | |||||
| 2016 | 2015 | 2014 | 2013 | 2012 | 2011 | |
| Selected Per–Share Data | ||||||
| Net asset value, beginning of period | $9.92 | $13.06 | $13.96 | $14.37 | $14.95 | $15.45 |
| Income from Investment Operations | ||||||
| Net investment income (loss)A | .05 | .13 | .04 | .05 | .01 | (.01) |
| Net realized and unrealized gain (loss) | .50 | (3.22) | (.89) | (.44) | (.59) | (.38) |
| Total from investment operations | .55 | (3.09) | (.85) | (.39) | (.58) | (.39) |
| Distributions from net investment income | (.12) | (.03) | (.03) | (.02) | – | (.05) |
| Distributions from net realized gain | (.01) | (.03) | (.01) | – | – | (.06) |
| Total distributions | (.13) | (.05)B | (.05)C | (.02) | – | (.11) |
| Redemption fees added to paid in capitalA,D | – | – | – | – | – | – |
| Net asset value, end of period | $10.34 | $9.92 | $13.06 | $13.96 | $14.37 | $14.95 |
| Total ReturnE,F,G | 5.70% | (23.74)% | (6.13)% | (2.75)% | (3.88)% | (2.58)% |
| Ratios to Average Net AssetsH,I | ||||||
| Expenses before reductions | 2.18%J | 2.12% | 2.11% | 2.11% | 2.10% | 2.09% |
| Expenses net of fee waivers, if any | 2.18%J | 2.12% | 2.11% | 2.11% | 2.10% | 2.09% |
| Expenses net of all reductions | 2.17%J | 2.11% | 2.11% | 2.10% | 2.09% | 2.08% |
| Net investment income (loss) | 1.02%J | 1.08% | .29% | .36% | .03% | (.07)% |
| Supplemental Data | ||||||
| Net assets, end of period (000 omitted) | $11,529 | $11,274 | $17,659 | $23,830 | $31,865 | $37,185 |
| Portfolio turnover rateK | 99%J | 77% | 75% | 65% | 91% | 71% |
A Calculated based on average shares outstanding during the period.
B Total distributions of $.05 per share is comprised of distributions from net investment income of $.025 and distributions from net realized gain of $.026 per share.
C Total distributions of $.05 per share is comprised of distributions from net investment income of $.033 and distributions from net realized gain of $.013 per share.
D Amount represents less than $.005 per share.
E Total returns for periods of less than one year are not annualized.
F Total returns would have been lower if certain expenses had not been reduced during the applicable periods shown.
G Total returns do not include the effect of the contingent deferred sales charge.
H Fees and expenses of any underlying Fidelity Central Funds are not included in the Fund's expense ratio. The Fund indirectly bears its proportionate share of the expenses of any underlying Fidelity Central Funds.
I Expense ratios reflect operating expenses of the class. Expenses before reductions do not reflect amounts reimbursed by the investment adviser or reductions from brokerage service arrangements or reductions from other expense offset arrangements and do not represent the amount paid by the class during periods when reimbursements or reductions occur. Expenses net of fee waivers reflect expenses after reimbursement by the investment adviser but prior to reductions from brokerage service arrangements or other expense offset arrangements. Expenses net of all reductions represent the net expenses paid by the class.
J Annualized
K Amount does not include the portfolio activity of any underlying Fidelity Central Funds.
See accompanying notes which are an integral part of the financial statements.
Financial Highlights — Fidelity Global Commodity Stock Fund
| Six months ended (Unaudited) April 30, | Years ended October 31, | |||||
| 2016 | 2015 | 2014 | 2013 | 2012 | 2011 | |
| Selected Per–Share Data | ||||||
| Net asset value, beginning of period | $10.09 | $13.31 | $14.24 | $14.66 | $15.21 | $15.66 |
| Income from Investment Operations | ||||||
| Net investment income (loss)A | .09 | .25 | .19 | .19 | .15 | .16 |
| Net realized and unrealized gain (loss) | .51 | (3.27) | (.92) | (.45) | (.60) | (.39) |
| Total from investment operations | .60 | (3.02) | (.73) | (.26) | (.45) | (.23) |
| Distributions from net investment income | (.24) | (.18) | (.19) | (.16) | (.08) | (.16) |
| Distributions from net realized gain | (.01) | (.03) | (.01) | – | (.01) | (.06) |
| Total distributions | (.25) | (.20)B | (.20) | (.16) | (.10)C | (.22) |
| Redemption fees added to paid in capitalA,D | – | – | – | – | – | – |
| Net asset value, end of period | $10.44 | $10.09 | $13.31 | $14.24 | $14.66 | $15.21 |
| Total ReturnE,F | 6.26% | (22.97)% | (5.16)% | (1.75)% | (2.96)% | (1.59)% |
| Ratios to Average Net AssetsG,H | ||||||
| Expenses before reductions | 1.18%I | 1.12% | 1.11% | 1.11% | 1.10% | 1.08% |
| Expenses net of fee waivers, if any | 1.18%I | 1.12% | 1.11% | 1.11% | 1.10% | 1.08% |
| Expenses net of all reductions | 1.17%I | 1.11% | 1.11% | 1.09% | 1.09% | 1.07% |
| Net investment income (loss) | 2.03%I | 2.08% | 1.29% | 1.37% | 1.04% | .95% |
| Supplemental Data | ||||||
| Net assets, end of period (000 omitted) | $187,024 | $156,320 | $223,084 | $273,476 | $387,242 | $531,224 |
| Portfolio turnover rateJ | 99%I | 77% | 75% | 65% | 91% | 71% |
A Calculated based on average shares outstanding during the period.
B Total distributions of $.20 per share is comprised of distributions from net investment income of $.178 and distributions from net realized gain of $.026 per share.
C Total distributions of $.10 per share is comprised of distributions from net investment income of $.084 and distributions from net realized gain of $.014 per share.
D Amount represents less than $.005 per share.
E Total returns for periods of less than one year are not annualized.
F Total returns would have been lower if certain expenses had not been reduced during the applicable periods shown.
G Fees and expenses of any underlying Fidelity Central Funds are not included in the Fund's expense ratio. The Fund indirectly bears its proportionate share of the expenses of any underlying Fidelity Central Funds.
H Expense ratios reflect operating expenses of the class. Expenses before reductions do not reflect amounts reimbursed by the investment adviser or reductions from brokerage service arrangements or reductions from other expense offset arrangements and do not represent the amount paid by the class during periods when reimbursements or reductions occur. Expenses net of fee waivers reflect expenses after reimbursement by the investment adviser but prior to reductions from brokerage service arrangements or other expense offset arrangements. Expenses net of all reductions represent the net expenses paid by the class.
I Annualized
J Amount does not include the portfolio activity of any underlying Fidelity Central Funds.
See accompanying notes which are an integral part of the financial statements.
Financial Highlights — Fidelity Global Commodity Stock Fund Class I
| Six months ended (Unaudited) April 30, | Years ended October 31, | |||||
| 2016 | 2015 | 2014 | 2013 | 2012 | 2011 | |
| Selected Per–Share Data | ||||||
| Net asset value, beginning of period | $10.09 | $13.31 | $14.24 | $14.67 | $15.22 | $15.66 |
| Income from Investment Operations | ||||||
| Net investment income (loss)A | .09 | .25 | .19 | .20 | .16 | .16 |
| Net realized and unrealized gain (loss) | .51 | (3.26) | (.92) | (.45) | (.60) | (.38) |
| Total from investment operations | .60 | (3.01) | (.73) | (.25) | (.44) | (.22) |
| Distributions from net investment income | (.25) | (.19) | (.19) | (.18) | (.09) | (.16) |
| Distributions from net realized gain | (.01) | (.03) | (.01) | – | (.01) | (.06) |
| Total distributions | (.26) | (.21)B | (.20) | (.18) | (.11)C | (.22) |
| Redemption fees added to paid in capitalA,D | – | – | – | – | – | – |
| Net asset value, end of period | $10.43 | $10.09 | $13.31 | $14.24 | $14.67 | $15.22 |
| Total ReturnE,F | 6.27% | (22.93)% | (5.16)% | (1.71)% | (2.90)% | (1.50)% |
| Ratios to Average Net AssetsG,H | ||||||
| Expenses before reductions | 1.14%I | 1.09% | 1.06% | 1.04% | 1.04% | 1.03% |
| Expenses net of fee waivers, if any | 1.14%I | 1.08% | 1.06% | 1.04% | 1.04% | 1.03% |
| Expenses net of all reductions | 1.13%I | 1.08% | 1.06% | 1.03% | 1.03% | 1.03% |
| Net investment income (loss) | 2.07%I | 2.11% | 1.34% | 1.43% | 1.10% | .99% |
| Supplemental Data | ||||||
| Net assets, end of period (000 omitted) | $31,290 | $24,841 | $23,840 | $31,613 | $50,540 | $58,925 |
| Portfolio turnover rateJ | 99%I | 77% | 75% | 65% | 91% | 71% |
A Calculated based on average shares outstanding during the period.
B Total distributions of $.21 per share is comprised of distributions from net investment income of $.186 and distributions from net realized gain of $.026 per share.
C Total distributions of $.11 per share is comprised of distributions from net investment income of $.093 and distributions from net realized gain of $.014 per share.
D Amount represents less than $.005 per share.
E Total returns for periods of less than one year are not annualized.
F Total returns would have been lower if certain expenses had not been reduced during the applicable periods shown.
G Fees and expenses of any underlying Fidelity Central Funds are not included in the Fund's expense ratio. The Fund indirectly bears its proportionate share of the expenses of any underlying Fidelity Central Funds.
H Expense ratios reflect operating expenses of the class. Expenses before reductions do not reflect amounts reimbursed by the investment adviser or reductions from brokerage service arrangements or reductions from other expense offset arrangements and do not represent the amount paid by the class during periods when reimbursements or reductions occur. Expenses net of fee waivers reflect expenses after reimbursement by the investment adviser but prior to reductions from brokerage service arrangements or other expense offset arrangements. Expenses net of all reductions represent the net expenses paid by the class.
I Annualized
J Amount does not include the portfolio activity of any underlying Fidelity Central Funds.
See accompanying notes which are an integral part of the financial statements.
Notes to Financial Statements (Unaudited)
For the period ended April 30, 2016
1. Organization.
Fidelity Global Commodity Stock Fund (the Fund) is a non-diversified fund of Fidelity Investment Trust (the Trust) and is authorized to issue an unlimited number of shares. The Trust is registered under the Investment Company Act of 1940, as amended (the 1940 Act), as an open-end management investment company organized as a Massachusetts business trust. The Fund offers Class A, Class T, Class C, Global Commodity Stock and Class I shares, each of which, along with Class B shares, has equal rights as to assets and voting privileges. Class B shares are closed to new accounts and additional purchases, except for exchanges and reinvestments. Each class has exclusive voting rights with respect to matters that affect that class. Class B shares will automatically convert to Class A shares after a maximum holding period of seven years from the initial date of purchase. The Fund's investments in emerging markets can be subject to social, economic, regulatory, and political uncertainties and can be extremely volatile.
During the period, the Board of Trustees approved the conversion of all existing Class B shares into Class A shares, effective on or about July 1, 2016, regardless of the length of times shares have been held.
2. Investments in Fidelity Central Funds.
The Fund invests in Fidelity Central Funds, which are open-end investment companies generally available only to other investment companies and accounts managed by the investment adviser and its affiliates. The Fund's Schedule of Investments lists each of the Fidelity Central Funds held as of period end, if any, as an investment of the Fund, but does not include the underlying holdings of each Fidelity Central Fund. As an Investing Fund, the Fund indirectly bears its proportionate share of the expenses of the underlying Fidelity Central Funds.
The Money Market Central Funds seek preservation of capital and current income and are managed by Fidelity Investments Money Management, Inc. (FIMM), an affiliate of the investment adviser. Annualized expenses of the Money Market Central Funds as of their most recent shareholder report date are less than .005%.
A complete unaudited list of holdings for each Fidelity Central Fund is available upon request or at the Securities and Exchange Commission (the SEC) website at www.sec.gov. In addition, the financial statements of the Fidelity Central Funds are available on the SEC website or upon request.
3. Significant Accounting Policies.
The financial statements have been prepared in conformity with accounting principles generally accepted in the United States of America (GAAP), which require management to make certain estimates and assumptions at the date of the financial statements. Actual results could differ from those estimates. Subsequent events, if any, through the date that the financial statements were issued have been evaluated in the preparation of the financial statements. The following summarizes the significant accounting policies of the Fund:
Investment Valuation. Investments are valued as of 4:00 p.m. Eastern time on the last calendar day of the period. The Board of Trustees (the Board) has delegated the day to day responsibility for the valuation of the Fund's investments to the Fidelity Management & Research Company (FMR) Fair Value Committee (the Committee). In accordance with valuation policies and procedures approved by the Board, the Fund attempts to obtain prices from one or more third party pricing vendors or brokers to value its investments. When current market prices, quotations or currency exchange rates are not readily available or reliable, investments will be fair valued in good faith by the Committee, in accordance with procedures adopted by the Board. Factors used in determining fair value vary by investment type and may include market or investment specific events. The frequency with which these procedures are used cannot be predicted and they may be utilized to a significant extent. The Committee oversees the Fund's valuation policies and procedures and reports to the Board on the Committee's activities and fair value determinations. The Board monitors the appropriateness of the procedures used in valuing the Fund's investments and ratifies the fair value determinations of the Committee.
The Fund categorizes the inputs to valuation techniques used to value its investments into a disclosure hierarchy consisting of three levels as shown below:
- Level 1 – quoted prices in active markets for identical investments
- Level 2 – other significant observable inputs (including quoted prices for similar investments, interest rates, prepayment speeds, etc.)
- Level 3 – unobservable inputs (including the Fund's own assumptions based on the best information available)
Valuation techniques used to value the Fund's investments by major category are as follows:
Equity securities, including restricted securities, for which market quotations are readily available, are valued at the last reported sale price or official closing price as reported by a third party pricing vendor on the primary market or exchange on which they are traded and are categorized as Level 1 in the hierarchy. In the event there were no sales during the day or closing prices are not available, securities are valued at the last quoted bid price or may be valued using the last available price and are generally categorized as Level 2 in the hierarchy. For foreign equity securities, when market or security specific events arise, comparisons to the valuation of American Depositary Receipts (ADRs), futures contracts, Exchange-Traded Funds (ETFs) and certain indexes as well as quoted prices for similar securities may be used and would be categorized as Level 2 in the hierarchy. Utilizing these techniques may result in transfers between Level 1 and Level 2. For equity securities, including restricted securities, where observable inputs are limited, assumptions about market activity and risk are used and these securities may be categorized as Level 3 in the hierarchy.
Investments in open-end mutual funds, including the Fidelity Central Funds, are valued at their closing net asset value (NAV) each business day and are categorized as Level 1 in the hierarchy.
Changes in valuation techniques may result in transfers in or out of an assigned level within the disclosure hierarchy. The aggregate value of investments by input level as of April 30, 2016, including information on transfers between Levels 1 and 2, is included at the end of the Fund's Schedule of Investments.
Foreign Currency. The Fund may use foreign currency contracts to facilitate transactions in foreign-denominated securities. Gains and losses from these transactions may arise from changes in the value of the foreign currency or if the counterparties do not perform under the contracts' terms.
Foreign-denominated assets, including investment securities, and liabilities are translated into U.S. dollars at the exchange rates at period end. Purchases and sales of investment securities, income and dividends received and expenses denominated in foreign currencies are translated into U.S. dollars at the exchange rate in effect on the transaction date.
The effects of exchange rate fluctuations on investments are included with the net realized and unrealized gain (loss) on investment securities. Other foreign currency transactions resulting in realized and unrealized gain (loss) are disclosed separately.
Investment Transactions and Income. For financial reporting purposes, the Fund's investment holdings and NAV include trades executed through the end of the last business day of the period. The NAV per share for processing shareholder transactions is calculated as of the close of business of the New York Stock Exchange (NYSE), normally 4:00 p.m. Eastern time and includes trades executed through the end of the prior business day. Gains and losses on securities sold are determined on the basis of identified cost and may include proceeds received from litigation. Dividend income is recorded on the ex-dividend date, except for certain dividends from foreign securities where the ex-dividend date may have passed, which are recorded as soon as the Fund is informed of the ex-dividend date. Non-cash dividends included in dividend income, if any, are recorded at the fair market value of the securities received. Income and capital gain distributions from Fidelity Central Funds, if any, are recorded on the ex-dividend date. Distributions received on securities that represent a return of capital or capital gain are recorded as a reduction of cost of investments and/or as a realized gain. Subsequent to ex-dividend date the Fund determines the components of these distributions, based upon receipt of tax filings or other correspondence relating to the underlying investment. Investment income is recorded net of foreign taxes withheld where recovery of such taxes is uncertain.
Class Allocations and Expenses. Investment income, realized and unrealized capital gains and losses, common expenses of the Fund, and certain fund-level expense reductions, if any, are allocated daily on a pro-rata basis to each class based on the relative net assets of each class to the total net assets of the Fund. Each class differs with respect to transfer agent and distribution and service plan fees incurred. Certain expense reductions may also differ by class. For the reporting period, the allocated portion of income and expenses to each class as a percent of its average net assets may vary due to the timing of recording these transactions in relation to fluctuating net assets of the classes. Expenses directly attributable to a fund are charged to that fund. Expenses attributable to more than one fund are allocated among the respective funds on the basis of relative net assets or other appropriate methods. Expense estimates are accrued in the period to which they relate and adjustments are made when actual amounts are known.
Income Tax Information and Distributions to Shareholders. Each year, the Fund intends to qualify as a regulated investment company under Subchapter M of the Internal Revenue Code, including distributing substantially all of its taxable income and realized gains. As a result, no provision for U.S. Federal income taxes is required. The Fund files a U.S. federal tax return, in addition to state and local tax returns as required. The Fund's federal income tax returns are subject to examination by the Internal Revenue Service (IRS) for a period of three fiscal years after they are filed. State and local tax returns may be subject to examination for an additional fiscal year depending on the jurisdiction. Foreign taxes are provided for based on the Fund's understanding of the tax rules and rates that exist in the foreign markets in which it invests.
Distributions are declared and recorded on the ex-dividend date. Income dividends and capital gain distributions are declared separately for each class. Income and capital gain distributions are determined in accordance with income tax regulations, which may differ from GAAP.
Capital accounts within the financial statements are adjusted for permanent book-tax differences. These adjustments have no impact on net assets or the results of operations. Capital accounts are not adjusted for temporary book-tax differences which will reverse in a subsequent period.
Book-tax differences are primarily due to foreign currency transactions, passive foreign investment companies (PFIC), partnerships, capital loss carryforwards and losses deferred due to wash sales.
The federal tax cost of investment securities and unrealized appreciation (depreciation) as of period end were as follows:
| Gross unrealized appreciation | $14,424,349 |
| Gross unrealized depreciation | (93,694,823) |
| Net unrealized appreciation (depreciation) on securities | $(79,270,474) |
| Tax cost | $356,721,687 |
Capital loss carryforwards are only available to offset future capital gains of the Fund to the extent provided by regulations and may be limited. Under the Regulated Investment Company Modernization Act of 2010 (the Act), the Fund is permitted to carry forward capital losses incurred in taxable years beginning after December 22, 2010 for an unlimited period and such capital losses are required to be used prior to any losses that expire. The capital loss carryforward information presented below, including any applicable limitation, is estimated as of prior fiscal period end and is subject to adjustment.
| Fiscal year of expiration | |
| 2019 | $(6,952,413) |
| No expiration | |
| Short-term | (17,522,131) |
| Long-term | (40,298,374) |
| Total no expiration | (57,820,505) |
| Total capital loss carryforward | $(64,772,918) |
Short-Term Trading (Redemption) Fees. Shares held by investors in the Fund less than 30 days may have been subject to a redemption fee equal to 1.00% of the NAV of shares redeemed. All redemption fees, which reduce the proceeds of the shareholder redemption, are retained by the Fund and accounted for as an addition to paid in capital.
Delayed Delivery Transactions and When-Issued Securities. During the period, the Fund transacted in securities on a delayed delivery or when-issued basis. Payment and delivery may take place after the customary settlement period for that security. The price of the underlying securities and the date when the securities will be delivered and paid for are fixed at the time the transaction is negotiated. The securities purchased on a delayed delivery or when-issued basis are identified as such in the Fund's Schedule of Investments. With respect to purchase commitments, the Fund identifies securities as segregated in its records with a value at least equal to the amount of the commitment. Losses may arise due to changes in the value of the underlying securities or if the counterparty does not perform under the contract's terms, or if the issuer does not issue the securities due to political, economic, or other factors.
4. Purchases and Sales of Investments.
Purchases and sales of securities, other than short-term securities, aggregated $124,970,983 and $107,482,256, respectively.
5. Fees and Other Transactions with Affiliates.
Management Fee. Fidelity Management & Research Company (the investment adviser) and its affiliates provide the Fund with investment management related services for which the Fund pays a monthly management fee. The management fee is the sum of an individual fund fee rate that is based on an annual rate of .45% of the Fund's average net assets and an annualized group fee rate that averaged .25% during the period. The group fee rate is based upon the average net assets of all the mutual funds advised by the investment adviser, including any mutual funds previously advised by the investment adviser that are currently advised by Fidelity SelectCo, LLC, an affiliate of the investment adviser. The group fee rate decreases as assets under management increase and increases as assets under management decrease. For the reporting period, the total annualized management fee rate was .70% of the Fund's average net assets.
Distribution and Service Plan Fees. In accordance with Rule 12b-1 of the 1940 Act, the Fund has adopted separate Distribution and Service Plans for each class of shares. Certain classes pay Fidelity Distributors Corporation (FDC), an affiliate of the investment adviser, separate Distribution and Service Fees, each of which is based on an annual percentage of each class' average net assets. In addition, FDC may pay financial intermediaries for selling shares of the Fund and providing shareholder support services. For the period, the Distribution and Service Fee rates, total fees and amounts retained by FDC were as follows:
| Distribution Fee | Service Fee | Total Fees | Retained by FDC | |
| Class A | -% | .25% | $34,521 | $– |
| Class T | .25% | .25% | 13,584 | – |
| Class B | .75% | .25% | 3,615 | 2,711 |
| Class C | .75% | .25% | 49,540 | 6,624 |
| $101,260 | $9,335 |
Sales Load. FDC may receive a front-end sales charge of up to 5.75% for selling Class A shares and 3.50% for selling Class T shares, some of which is paid to financial intermediaries for selling shares of the Fund. Depending on the holding period, FDC may receive contingent deferred sales charges levied on Class A, Class T, Class B, and Class C redemptions. The deferred sales charges range from 5.00% to 1.00% for Class B shares, 1.00% for Class C shares, 1.00% for certain purchases of Class A shares and .25% for certain purchases of Class T shares.
For the period, sales charge amounts retained by FDC were as follows:
| Retained by FDC | |
| Class A | $10,807 |
| Class T | 1,023 |
| Class B(a) | 350 |
| Class C(a) | 334 |
| $12,514 |
(a) When Class B and Class C shares are initially sold, FDC pays commissions from its own resources to financial intermediaries through which the sales are made.
Transfer Agent Fees. Fidelity Investments Institutional Operations Company, Inc., (FIIOC), an affiliate of the investment adviser, is the transfer, dividend disbursing and shareholder servicing agent for each class of the Fund. FIIOC receives account fees and asset-based fees that vary according to the account size and type of account of the shareholders of the respective classes of the Fund. FIIOC pays for typesetting, printing and mailing of shareholder reports, except proxy statements.
For the period, transfer agent fees for each class were as follows:
| Amount | % of Class-Level Average Net Assets(a) | |
| Class A | $41,634 | .30 |
| Class T | 8,788 | .32 |
| Class B | 1,083 | .30 |
| Class C | 14,985 | .30 |
| Global Commodity Stock | 214,868 | .30 |
| Class I | 30,264 | .26 |
| $ 311,622 |
(a) Annualized
Accounting and Security Lending Fees. Fidelity Service Company, Inc. (FSC), an affiliate of the investment adviser, maintains the Fund's accounting records. The accounting fee is based on the level of average net assets for each month. Under a separate contract, FSC administers the security lending program. The security lending fee is based on the number and duration of lending transactions.
Brokerage Commissions. The Fund placed a portion of its portfolio transactions with brokerage firms which are affiliates of the investment adviser. Brokerage commissions are included in net realized gain (loss) and change in net unrealized appreciation (depreciation) in the Statement of Operations. The commissions paid to these affiliated firms were $4,386 for the period.
Interfund Trades. The Fund may purchase from or sell securities to other Fidelity Funds under procedures adopted by the Board. The procedures have been designed to ensure these interfund trades are executed in accordance with Rule 17a-7 of the 1940 Act. Interfund trades are included within the respective purchases and sales amounts shown in the Purchases and Sales of Investments note.
6. Committed Line of Credit.
The Fund participates with other funds managed by the investment adviser or an affiliate in a $4.25 billion credit facility (the "line of credit") to be utilized for temporary or emergency purposes to fund shareholder redemptions or for other short-term liquidity purposes. The Fund has agreed to pay commitment fees on its pro-rata portion of the line of credit, which amounted to $180 and is reflected in Miscellaneous expenses on the Statement of Operations. During the period, the Fund did not borrow on this line of credit.
7. Security Lending.
The Fund lends portfolio securities through a lending agent from time to time in order to earn additional income. For equity securities, a lending agent is used and may loan securities to certain qualified borrowers, including Fidelity Capital Markets (FCM), a broker-dealer affiliated with the Fund. On the settlement date of the loan, the Fund receives collateral (in the form of U.S. Treasury obligations, letters of credit and/or cash) against the loaned securities and maintains collateral in an amount not less than 100% of the market value of the loaned securities during the period of the loan. The market value of the loaned securities is determined at the close of business of the Fund and any additional required collateral is delivered to the Fund on the next business day. The Fund or borrower may terminate the loan at any time, and if the borrower defaults on its obligation to return the securities loaned because of insolvency or other reasons, the Fund may apply collateral received from the borrower against the obligation. The Fund may experience delays and costs in recovering the securities loaned. Any cash collateral received is invested in the Fidelity Securities Lending Cash Central Fund. The value of loaned securities and cash collateral at period end are disclosed on the Fund's Statement of Assets and Liabilities. Security lending income represents the income earned on investing cash collateral, less rebates paid to borrowers and any lending agent fees associated with the loan, plus any premium payments received for lending certain types of securities. Security lending income is presented in the Statement of Operations as a component of income from Fidelity Central Funds. Total security lending income during the period amounted to $106,267. During the period, there were no securities loaned to FCM.
8. Expense Reductions.
Commissions paid to certain brokers with whom the investment adviser, or its affiliates, places trades on behalf of the Fund include an amount in addition to trade execution, which may be rebated back to the Fund to offset certain expenses. This amount totaled $4,774 for the period.
In addition, during the period the investment adviser reimbursed and/or waived a portion of fund-level operating expenses in the amount of $727.
9. Distributions to Shareholders.
Distributions to shareholders of each class were as follows:
| Six months ended April 30, 2016 | Year ended October 31, 2015 | |
| From net investment income | ||
| Class A | $638,599 | $520,699 |
| Class T | 103,956 | 72,766 |
| Class B | 8,861 | 1,871 |
| Class C | 133,173 | 32,755 |
| Global Commodity Stock | 3,642,366 | 2,937,401 |
| Class I | 613,921 | 333,382 |
| Total | $5,140,876 | $3,898,874 |
| From net realized gain | ||
| Class A | $30,410 | $97,397 |
| Class T | 6,044 | 19,110 |
| Class B | 836 | 3,040 |
| Class C | 11,098 | 34,065 |
| Global Commodity Stock | 151,130 | 429,058 |
| Class I | 24,557 | 46,602 |
| Total | $224,075 | $629,272 |
10. Share Transactions.
Share transactions for each class were as follows and may contain automatic conversions between classes or exchanges between affiliated funds:
| Shares | Shares | Dollars | Dollars | |
| Six months ended April 30, 2016 | Year ended October 31, 2015 | Six months ended April 30, 2016 | Year ended October 31, 2015 | |
| Class A | ||||
| Shares sold | 429,562 | 526,290 | $3,833,800 | $6,210,169 |
| Reinvestment of distributions | 70,559 | 46,881 | 655,495 | 594,452 |
| Shares redeemed | (549,813) | (1,342,823) | (4,931,070) | (16,036,860) |
| Net increase (decrease) | (49,692) | (769,652) | $(441,775) | $(9,232,239) |
| Class T | ||||
| Shares sold | 60,531 | 79,898 | $540,227 | $963,935 |
| Reinvestment of distributions | 11,521 | 7,092 | 107,030 | 89,851 |
| Shares redeemed | (111,329) | (201,781) | (1,011,230) | (2,371,414) |
| Net increase (decrease) | (39,277) | (114,791) | $(363,973) | $(1,317,628) |
| Class B | ||||
| Shares sold | 2,904 | 580 | $29,575 | $7,071 |
| Reinvestment of distributions | 982 | 371 | 9,133 | 4,698 |
| Shares redeemed | (13,281) | (35,007) | (118,751) | (422,886) |
| Net increase (decrease) | (9,395) | (34,056) | $(80,043) | $(411,117) |
| Class C | ||||
| Shares sold | 147,205 | 206,447 | $1,336,468 | $2,471,711 |
| Reinvestment of distributions | 14,787 | 4,962 | 136,635 | 62,526 |
| Shares redeemed | (184,114) | (426,784) | (1,670,395) | (5,161,590) |
| Net increase (decrease) | (22,122) | (215,375) | $(197,292) | $(2,627,353) |
| Global Commodity Stock | ||||
| Shares sold | 4,803,019 | 4,004,137 | $43,836,205 | $47,467,615 |
| Reinvestment of distributions | 376,092 | 238,065 | 3,493,876 | 3,023,431 |
| Shares redeemed | (2,761,293) | (5,506,523) | (25,223,516) | (65,599,040) |
| Net increase (decrease) | 2,417,818 | (1,264,321) | $22,106,565 | $(15,107,994) |
| Class I | ||||
| Shares sold | 1,846,997 | 1,576,324 | $16,610,772 | $18,219,363 |
| Reinvestment of distributions | 60,388 | 24,972 | 560,405 | 316,895 |
| Shares redeemed | (1,370,427) | (929,289) | (12,059,213) | (10,645,039) |
| Net increase (decrease) | 536,958 | 672,007 | $5,111,964 | $7,891,219 |
11. Other.
The Fund's organizational documents provide former and current trustees and officers with a limited indemnification against liabilities arising in connection with the performance of their duties to the Fund. In the normal course of business, the Fund may also enter into contracts that provide general indemnifications. The Fund's maximum exposure under these arrangements is unknown as this would be dependent on future claims that may be made against the Fund. The risk of material loss from such claims is considered remote.
At the end of the period, the investment adviser or its affiliates were the owner of record of 20% of the outstanding shares of the Fund.
Shareholder Expense Example
As a shareholder of the Fund, you incur two types of costs: (1) transaction costs, including sales charges (loads) on purchase payments or redemption proceeds, redemption fees and (2) ongoing costs, including management fees, distribution and/or service (12b-1) fees and other Fund expenses. This Example is intended to help you understand your ongoing costs (in dollars) of investing in the Fund and to compare these costs with the ongoing costs of investing in other mutual funds.
The Example is based on an investment of $1,000 invested at the beginning of the period and held for the entire period (November 1, 2015 to April 30, 2016).
Actual Expenses
The first line of the accompanying table for each class of the Fund provides information about actual account values and actual expenses. You may use the information in this line, together with the amount you invested, to estimate the expenses that you paid over the period. Simply divide your account value by $1,000.00 (for example, an $8,600 account value divided by $1,000.00 = 8.6), then multiply the result by the number in the first line for a class of the Fund under the heading entitled "Expenses Paid During Period" to estimate the expenses you paid on your account during this period. A small balance maintenance fee of $12.00 that is charged once a year may apply for certain accounts with a value of less than $2,000. This fee is not included in the table below. If it was, the estimate of expenses you paid during the period would be higher, and your ending account value lower, by this amount. In addition, the Fund, as a shareholder in the underlying Fidelity Central Funds, will indirectly bear its pro-rata share of the fees and expenses incurred by the underlying Fidelity Central Funds. These fees and expenses are not included in the Fund's annualized expense ratio used to calculate the expense estimate in the table below.
Hypothetical Example for Comparison Purposes
The second line of the accompanying table for each class of the Fund provides information about hypothetical account values and hypothetical expenses based on a Class' actual expense ratio and an assumed rate of return of 5% per year before expenses, which is not the Class' actual return. The hypothetical account values and expenses may not be used to estimate the actual ending account balance or expenses you paid for the period. You may use this information to compare the ongoing costs of investing in the Fund and other funds. To do so, compare this 5% hypothetical example with the 5% hypothetical examples that appear in the shareholder reports of the other funds. A small balance maintenance fee of $12.00 that is charged once a year may apply for certain accounts with a value of less than $2,000. This fee is not included in the table below. If it was, the estimate of expenses you paid during the period would be higher, and your ending account value lower, by this amount. In addition, the Fund, as a shareholder in the underlying Fidelity Central Funds, will indirectly bear its pro-rata share of the fees and expenses incurred by the underlying Fidelity Central Funds. These fees and expenses are not included in the Fund's annualized expense ratio used to calculate the expense estimate in the table below.
Please note that the expenses shown in the table are meant to highlight your ongoing costs only and do not reflect any transaction costs. Therefore, the second line of the table is useful in comparing ongoing costs only, and will not help you determine the relative total costs of owning different funds. In addition, if these transactional costs were included, your costs would have been higher.
| Annualized Expense Ratio-A | Beginning Account Value November 1, 2015 | Ending Account Value April 30, 2016 | Expenses Paid During Period-B November 1, 2015 to April 30, 2016 | |
| Class A | 1.43% | |||
| Actual | $1,000.00 | $1,061.40 | $7.33 | |
| Hypothetical-C | $1,000.00 | $1,017.75 | $7.17 | |
| Class T | 1.70% | |||
| Actual | $1,000.00 | $1,060.30 | $8.71 | |
| Hypothetical-C | $1,000.00 | $1,016.41 | $8.52 | |
| Class B | 2.18% | |||
| Actual | $1,000.00 | $1,057.20 | $11.15 | |
| Hypothetical-C | $1,000.00 | $1,014.02 | $10.92 | |
| Class C | 2.18% | |||
| Actual | $1,000.00 | $1,057.00 | $11.15 | |
| Hypothetical-C | $1,000.00 | $1,014.02 | $10.92 | |
| Global Commodity Stock | 1.18% | |||
| Actual | $1,000.00 | $1,062.60 | $6.05 | |
| Hypothetical-C | $1,000.00 | $1,019.00 | $5.92 | |
| Class I | 1.14% | |||
| Actual | $1,000.00 | $1,062.70 | $5.85 | |
| Hypothetical-C | $1,000.00 | $1,019.19 | $5.72 |
A Annualized expense ratio reflects expenses net of applicable fee waivers.
B Expenses are equal to each Class' annualized expense ratio, multiplied by the average account value over the period, multiplied by 182/366 (to reflect the one-half year period).
C 5% return per year before expenses
![]()
AGCS-SANN-0616
1.879399.107
Fidelity® Emerging Markets Discovery Fund Fidelity® Total Emerging Markets Fund Semi-Annual Report April 30, 2016 |
|
Contents
Fidelity® Emerging Markets Discovery Fund | |
Fidelity® Total Emerging Markets Fund | |
To view a fund's proxy voting guidelines and proxy voting record for the 12-month period ended June 30, visit http://www.fidelity.com/proxyvotingresults or visit the Securities and Exchange Commission's (SEC) web site at http://www.sec.gov.
You may also call 1-800-544-8544 to request a free copy of the proxy voting guidelines.
Standard & Poor's, S&P and S&P 500 are registered service marks of The McGraw-Hill Companies, Inc. and have been licensed for use by Fidelity Distributors Corporation.
Other third-party marks appearing herein are the property of their respective owners.
All other marks appearing herein are registered or unregistered trademarks or service marks of FMR LLC or an affiliated company. © 2016 FMR LLC. All rights reserved.
This report and the financial statements contained herein are submitted for the general information of the shareholders of the Funds. This report is not authorized for distribution to prospective investors in the Funds unless preceded or accompanied by an effective prospectus.
A fund files its complete schedule of portfolio holdings with the SEC for the first and third quarters of each fiscal year on Form N-Q. Forms N-Q are available on the SEC’s web site at http://www.sec.gov. A fund's Forms N-Q may be reviewed and copied at the SEC’s Public Reference Room in Washington, DC. Information regarding the operation of the SEC's Public Reference Room may be obtained by calling 1-800-SEC-0330.
For a complete list of a fund's portfolio holdings, view the most recent holdings listing, semiannual report, or annual report on Fidelity's web site at http://www.fidelity.com, http://www.advisor.fidelity.com, or http://www.401k.com, as applicable.
NOT FDIC INSURED •MAY LOSE VALUE •NO BANK GUARANTEE
Neither the Funds nor Fidelity Distributors Corporation is a bank.
Fidelity® Emerging Markets Discovery Fund
Investment Summary (Unaudited)
Top Five Stocks as of April 30, 2016
| % of fund's net assets | % of fund's net assets 6 months ago | |
| Hyundai Glovis Co. Ltd. (Korea (South), Air Freight & Logistics) | 1.5 | 1.0 |
| 58.com, Inc. ADR (Cayman Islands, Internet Software & Services) | 1.4 | 1.1 |
| Techtronic Industries Co. Ltd. (Hong Kong, Household Durables) | 1.3 | 2.4 |
| Yandex NV (Netherlands, Internet Software & Services) | 1.3 | 0.0 |
| Advantech Co. Ltd. (Taiwan, Technology Hardware, Storage & Peripherals) | 1.3 | 1.4 |
| 6.8 |
Top Five Market Sectors as of April 30, 2016
| % of fund's net assets | % of fund's net assets 6 months ago | |
| Financials | 18.0 | 18.1 |
| Information Technology | 17.5 | 15.4 |
| Consumer Discretionary | 15.5 | 14.6 |
| Industrials | 14.2 | 17.0 |
| Materials | 9.9 | 10.2 |
Top Five Countries as of April 30, 2016
| (excluding cash equivalents) | % of fund's net assets | % of fund's net assets 6 months ago |
| India | 13.2 | 13.0 |
| Korea (South) | 12.0 | 13.3 |
| Cayman Islands | 10.1 | 11.4 |
| Taiwan | 9.8 | 9.6 |
| Brazil | 7.4 | 4.1 |
Percentages are adjusted for the effect of futures contracts, if applicable.
Asset Allocation (% of fund's net assets)
| As of April 30, 2016 | ||
| Stocks | 97.5% | |
| Short-Term Investments and Net Other Assets (Liabilities) | 2.5% | |

| As of October 31, 2015 | ||
| Stocks | 97.7% | |
| Short-Term Investments and Net Other Assets (Liabilities) | 2.3% | |

Percentages shown as 0.0% may reflect amounts less than 0.05%.
Fidelity® Emerging Markets Discovery Fund
Investments April 30, 2016 (Unaudited)
Showing Percentage of Net Assets
| Common Stocks - 95.2% | |||
| Shares | Value | ||
| Argentina - 0.5% | |||
| Inversiones y Representaciones SA ADR (a) | 22,300 | $330,709 | |
| Bangladesh - 0.4% | |||
| BRAC Bank Ltd. | 449,466 | 237,421 | |
| Bermuda - 1.9% | |||
| Digital China Holdings Ltd. (H Shares) | 154,000 | 106,319 | |
| PAX Global Technology Ltd. | 390,000 | 335,876 | |
| Shangri-La Asia Ltd. | 676,000 | 825,832 | |
| TOTAL BERMUDA | 1,268,027 | ||
| Brazil - 5.7% | |||
| AES Tiete Energia SA unit | 53,700 | 220,468 | |
| BR Properties SA | 81,400 | 243,070 | |
| Cosan SA Industria e Comercio | 32,760 | 303,287 | |
| Direcional Engenharia SA | 219,000 | 391,612 | |
| Fibria Celulose SA | 33,700 | 297,683 | |
| FPC Par Corretora de Seguros | 132,000 | 443,294 | |
| Mills Estruturas e Servicos de Engenharia SA | 26,400 | 32,316 | |
| Minerva SA (b) | 127,100 | 390,622 | |
| QGEP Participacoes SA | 298,500 | 354,112 | |
| Smiles SA | 56,000 | 649,677 | |
| Tegma Gestao Logistica SA | 269,600 | 449,954 | |
| TOTAL BRAZIL | 3,776,095 | ||
| British Virgin Islands - 0.3% | |||
| Dolphin Capital Investors Ltd. (b) | 1,423,300 | 168,972 | |
| Canada - 1.5% | |||
| Pan American Silver Corp. | 30,600 | 479,502 | |
| Torex Gold Resources, Inc. (b) | 306,500 | 544,748 | |
| TOTAL CANADA | 1,024,250 | ||
| Cayman Islands - 10.1% | |||
| 51job, Inc. sponsored ADR (b) | 12,100 | 360,580 | |
| 58.com, Inc. ADR (b) | 16,400 | 896,260 | |
| Casetek Holdings | 48,000 | 216,203 | |
| China State Construction International Holdings Ltd. | 334,000 | 520,273 | |
| GCL-Poly Energy Holdings Ltd. | 1,040,000 | 154,985 | |
| Goodbaby International Holdings Ltd. (b) | 506,000 | 283,408 | |
| Haitian International Holdings Ltd. | 313,000 | 534,029 | |
| Ju Teng International Holdings Ltd. | 416,000 | 186,736 | |
| Kingboard Laminates Holdings Ltd. | 578,500 | 295,747 | |
| Kingsoft Corp. Ltd. | 77,000 | 176,792 | |
| Lee's Pharmaceutical Holdings Ltd. | 366,000 | 296,145 | |
| Pico Far East Holdings Ltd. | 2,320,000 | 628,995 | |
| Semiconductor Manufacturing International Corp. (b) | 2,077,000 | 170,746 | |
| SITC International Holdings Co. Ltd. | 928,000 | 501,557 | |
| Sunny Optical Technology Group Co. Ltd. | 109,000 | 336,184 | |
| TPK Holding Co. Ltd. | 30,000 | 62,966 | |
| Uni-President China Holdings Ltd. | 871,000 | 811,135 | |
| Yirendai Ltd. sponsored ADR (a) | 21,100 | 260,374 | |
| TOTAL CAYMAN ISLANDS | 6,693,115 | ||
| Chile - 4.1% | |||
| Compania Cervecerias Unidas SA sponsored ADR (a) | 22,800 | 511,176 | |
| CorpBanca SA | 40,999,981 | 373,153 | |
| Empresas CMPC SA | 219,687 | 496,783 | |
| Inversiones La Construccion SA | 34,117 | 402,273 | |
| Quinenco SA | 143,799 | 282,951 | |
| Vina Concha y Toro SA | 372,483 | 624,286 | |
| TOTAL CHILE | 2,690,622 | ||
| China - 5.5% | |||
| BBMG Corp. (H Shares) | 775,000 | 566,392 | |
| China Longyuan Power Grid Corp. Ltd. (H Shares) | 331,200 | 229,140 | |
| Huangshan Tourism Development Co. Ltd. | 343,100 | 719,824 | |
| Qingdao Haier Co. Ltd. | 547,886 | 704,951 | |
| Tong Ren Tang Technologies Co. Ltd. (H Shares) | 448,000 | 701,820 | |
| Zhengzhou Yutong Bus Co. Ltd. | 127,619 | 404,301 | |
| Zhuzhou CSR Times Electric Co. Ltd. (H Shares) | 57,000 | 324,315 | |
| TOTAL CHINA | 3,650,743 | ||
| Colombia - 0.3% | |||
| Organizacion Terpel SA | 59,128 | 205,486 | |
| Cyprus - 0.7% | |||
| Global Ports Investment PLC GDR (Reg. S) (b) | 136,700 | 452,477 | |
| Egypt - 0.3% | |||
| Citadel Capital Corp. (b) | 1,032,100 | 172,018 | |
| Georgia - 0.1% | |||
| TBC Bank JSC unit | 8,575 | 90,038 | |
| Greece - 0.7% | |||
| Titan Cement Co. SA (Reg.) | 18,800 | 428,859 | |
| Hong Kong - 2.8% | |||
| BYD Electronic International Co. Ltd. (b) | 146,000 | 83,613 | |
| China Resources Beer Holdings Co. Ltd. | 226,000 | 496,615 | |
| Far East Horizon Ltd. | 532,584 | 422,753 | |
| Techtronic Industries Co. Ltd. | 231,500 | 867,817 | |
| TOTAL HONG KONG | 1,870,798 | ||
| India - 13.2% | |||
| Adani Ports & Special Economic Zone | 133,403 | 478,379 | |
| Alembic Pharmaceuticals Ltd. (b) | 77,612 | 703,965 | |
| Arvind Mills Ltd. (b) | 78,092 | 326,062 | |
| Dr Lal Pathlabs Ltd. | 21,735 | 322,333 | |
| Edelweiss Financial Services Ltd. | 431,938 | 377,476 | |
| Exide Industries Ltd. (b) | 166,764 | 369,677 | |
| Grasim Industries Ltd. | 10,589 | 683,203 | |
| IDFC Ltd. | 317,213 | 232,070 | |
| Iifl Holdings Ltd. (b) | 115,270 | 378,215 | |
| Indraprastha Gas Ltd. (b) | 50,968 | 439,891 | |
| JK Cement Ltd. | 33,493 | 299,128 | |
| LIC Housing Finance Ltd. (b) | 47,601 | 331,288 | |
| Mahindra Lifespace Developers Ltd. (b) | 43,426 | 283,599 | |
| Manappuram General Finance & Leasing Ltd. | 732,000 | 441,346 | |
| Marksans Pharma Ltd. | 462,523 | 319,255 | |
| Mphasis BFL Ltd. | 49,287 | 363,018 | |
| Power Grid Corp. of India Ltd. | 368,175 | 794,820 | |
| Redington India Ltd. (b) | 97,326 | 159,120 | |
| Solar Industries India Ltd. (b) | 5,528 | 282,390 | |
| The Jammu & Kashmir Bank Ltd. | 200,767 | 207,642 | |
| Torrent Pharmaceuticals Ltd. | 30,108 | 648,275 | |
| VST Industries Ltd. (b) | 12,492 | 307,234 | |
| TOTAL INDIA | 8,748,386 | ||
| Indonesia - 1.8% | |||
| Link Net Tbk PT | 1,434,800 | 458,575 | |
| PT Bank Danamon Indonesia Tbk Series A | 820,800 | 204,764 | |
| PT Media Nusantara Citra Tbk | 442,100 | 78,779 | |
| PT Panin Life Tbk (b) | 30,841,700 | 423,290 | |
| TOTAL INDONESIA | 1,165,408 | ||
| Israel - 0.5% | |||
| Bezeq The Israel Telecommunication Corp. Ltd. | 155,760 | 332,242 | |
| Korea (South) - 11.4% | |||
| AMOREPACIFIC Group, Inc. | 2,952 | 432,877 | |
| Binggrea Co. Ltd. | 3,310 | 197,038 | |
| BS Financial Group, Inc. | 40,160 | 325,648 | |
| Com2uS Corp. | 2,269 | 256,276 | |
| Daou Technology, Inc. | 10,330 | 210,987 | |
| Devsisters Co. Ltd. (b) | 6,881 | 145,647 | |
| DGB Financial Group Co. Ltd. | 38,521 | 308,323 | |
| E-Mart Co. Ltd. | 2,431 | 389,367 | |
| Fila Korea Ltd. | 7,708 | 699,703 | |
| Hanon Systems | 47,137 | 423,777 | |
| Hyundai Glovis Co. Ltd. | 5,806 | 962,872 | |
| Hyundai HCN | 81,610 | 263,563 | |
| Hyundai Industrial Development & Construction Co. | 7,283 | 321,026 | |
| Hyundai Wia Corp. | 4,509 | 380,186 | |
| Koh Young Technology, Inc. | 5,832 | 213,799 | |
| Korea Express Co. Ltd. (b) | 2,438 | 413,897 | |
| Korean Reinsurance Co. | 22,174 | 257,415 | |
| Medy-Tox, Inc. | 1,829 | 675,294 | |
| NCSOFT Corp. | 1,959 | 391,569 | |
| Nice Information & Telecom, Inc. | 2,998 | 89,102 | |
| Silicon Works Co. Ltd. | 7,345 | 204,513 | |
| TOTAL KOREA (SOUTH) | 7,562,879 | ||
| Malaysia - 1.3% | |||
| Inari Amertron Bhd | 266,000 | 185,890 | |
| Top Glove Corp. Bhd | 532,500 | 676,104 | |
| TOTAL MALAYSIA | 861,994 | ||
| Mexico - 6.7% | |||
| Fibra Uno Administracion SA de CV | 223,100 | 531,146 | |
| Grupo Aeroportuario del Pacifico S.A.B. de CV Series B | 45,300 | 426,811 | |
| Grupo Comercial Chedraui S.A.B. de CV (a) | 171,700 | 486,618 | |
| Grupo GICSA SA de CV (b) | 256,832 | 201,827 | |
| Industrias Penoles SA de CV | 36,820 | 575,585 | |
| Macquarie Mexican (REIT) | 522,872 | 719,666 | |
| Megacable Holdings S.A.B. de CV unit | 74,500 | 344,036 | |
| Qualitas Controladora S.A.B. de CV | 293,900 | 394,950 | |
| Tenedora Nemak SA de CV | 200,800 | 288,047 | |
| Terrafina (a) | 260,200 | 480,635 | |
| TOTAL MEXICO | 4,449,321 | ||
| Netherlands - 1.3% | |||
| Yandex NV (b) | 41,700 | 853,599 | |
| Pakistan - 0.5% | |||
| Habib Bank Ltd. | 172,400 | 310,812 | |
| Panama - 0.8% | |||
| Copa Holdings SA Class A | 7,800 | 497,250 | |
| Philippines - 0.6% | |||
| Alliance Global Group, Inc. | 1,264,500 | 389,821 | |
| Poland - 1.6% | |||
| Asseco Poland SA | 20,300 | 307,934 | |
| Inter Cars SA | 8,764 | 546,236 | |
| Prime Car Management SA | 19,300 | 195,177 | |
| TOTAL POLAND | 1,049,347 | ||
| Romania - 0.3% | |||
| Banca Transilvania SA | 331,743 | 227,663 | |
| Russia - 0.9% | |||
| Inter Rao Ues JSC (b) | 13,451,004 | 373,278 | |
| Sistema JSFC sponsored GDR | 34,060 | 250,341 | |
| TOTAL RUSSIA | 623,619 | ||
| Singapore - 0.7% | |||
| First (REIT) | 271,800 | 252,630 | |
| First Resources Ltd. | 154,300 | 218,568 | |
| TOTAL SINGAPORE | 471,198 | ||
| South Africa - 2.4% | |||
| Alexander Forbes Group Holdings Ltd. | 491,636 | 247,972 | |
| Imperial Holdings Ltd. | 40,800 | 427,139 | |
| Northam Platinum Ltd. (b)(c) | 122,600 | 417,789 | |
| Reunert Ltd. | 97,700 | 490,997 | |
| TOTAL SOUTH AFRICA | 1,583,897 | ||
| Sri Lanka - 0.6% | |||
| Hatton National Bank PLC | 278,137 | 393,671 | |
| Taiwan - 9.8% | |||
| ADLINK Technology, Inc. | 96,087 | 198,105 | |
| Advantech Co. Ltd. | 120,000 | 846,980 | |
| Chipbond Technology Corp. | 118,000 | 157,075 | |
| Cleanaway Co. Ltd. | 68,000 | 368,387 | |
| CTCI Corp. | 335,000 | 436,082 | |
| Cub Elecparts, Inc. | 44,892 | 543,379 | |
| Elite Semiconductor Memory Technology, Inc. | 137,000 | 111,329 | |
| eMemory Technology, Inc. | 22,000 | 241,092 | |
| Everlight Electronics Co. Ltd. | 152,000 | 212,921 | |
| FLEXium Interconnect, Inc. | 79,442 | 182,970 | |
| Forhouse Corp. | 462,000 | 173,055 | |
| Hermes Microvision, Inc. | 4,000 | 123,208 | |
| Inventec Corp. | 418,000 | 276,268 | |
| Lite-On Technology Corp. | 318,640 | 387,659 | |
| Powertech Technology, Inc. | 175,000 | 354,301 | |
| Radiant Opto-Electronics Corp. | 84,000 | 121,048 | |
| Sirtec International Co. Ltd. | 168,000 | 202,309 | |
| St.Shine Optical Co. Ltd. | 27,000 | 504,845 | |
| Synnex Technology International Corp. | 264,000 | 261,932 | |
| Tong Hsing Electronics Industries Ltd. | 103,000 | 295,579 | |
| Universal Cement Corp. | 281,840 | 180,169 | |
| Vanguard International Semiconductor Corp. | 190,000 | 290,855 | |
| TOTAL TAIWAN | 6,469,548 | ||
| Thailand - 2.4% | |||
| Delta Electronics PCL (For. Reg.) | 110,600 | 228,041 | |
| PTT Global Chemical PCL (For. Reg.) | 240,400 | 430,269 | |
| Star Petroleum Refining PCL | 1,082,800 | 341,088 | |
| Thai Union Frozen Products PCL (For. Reg.) | 1,043,200 | 618,392 | |
| TOTAL THAILAND | 1,617,790 | ||
| Turkey - 1.9% | |||
| Aksa Akrilik Kimya Sanayii | 77,000 | 268,317 | |
| Aselsan A/S | 74,000 | 527,891 | |
| Tupras Turkiye Petrol Rafinelleri A/S | 16,576 | 437,505 | |
| TOTAL TURKEY | 1,233,713 | ||
| United Arab Emirates - 0.4% | |||
| National Bank of Ras Al-Khaimah PSC (b) | 196,514 | 284,105 | |
| United Kingdom - 0.7% | |||
| Bgeo Group PLC | 14,540 | 486,513 | |
| Vietnam - 0.5% | |||
| FTP Corp. | 142,600 | 310,946 | |
| TOTAL COMMON STOCKS | |||
| (Cost $66,186,963) | 62,983,352 | ||
| Nonconvertible Preferred Stocks - 2.3% | |||
| Brazil - 1.7% | |||
| Banco ABC Brasil SA | 72,600 | 250,145 | |
| Banco do Estado Rio Grande do Sul SA | 152,500 | 377,342 | |
| Metalurgica Gerdau SA (PN) | 635,900 | 538,044 | |
| TOTAL BRAZIL | 1,165,531 | ||
| Korea (South) - 0.6% | |||
| LG Chemical Ltd. | 2,215 | 381,838 | |
| TOTAL NONCONVERTIBLE PREFERRED STOCKS | |||
| (Cost $1,424,609) | 1,547,369 | ||
| Principal Amount | Value | ||
| Government Obligations - 0.1% | |||
| United States of America - 0.1% | |||
| U.S. Treasury Bills, yield at date of purchase 0.21% to 0.3% 5/19/16 to 7/14/16 (Cost $79,972) | 80,000 | 79,983 | |
| Shares | Value | ||
| Money Market Funds - 4.7% | |||
| Fidelity Cash Central Fund, 0.38% (d) | 2,015,766 | 2,015,766 | |
| Fidelity Securities Lending Cash Central Fund, 0.42% (d)(e) | 1,092,150 | 1,092,150 | |
| TOTAL MONEY MARKET FUNDS | |||
| (Cost $3,107,916) | 3,107,916 | ||
| TOTAL INVESTMENT PORTFOLIO - 102.3% | |||
| (Cost $70,799,460) | 67,718,620 | ||
| NET OTHER ASSETS (LIABILITIES) - (2.3)% | (1,542,085) | ||
| NET ASSETS - 100% | $66,176,535 |
Categorizations in the Schedule of Investments are based on country or territory of incorporation.
Legend
(a) Security or a portion of the security is on loan at period end.
(b) Non-income producing
(c) Security or a portion of the security purchased on a delayed delivery or when-issued basis.
(d) Affiliated fund that is generally available only to investment companies and other accounts managed by Fidelity Investments. The rate quoted is the annualized seven-day yield of the fund at period end. A complete unaudited listing of the fund's holdings as of its most recent quarter end is available upon request. In addition, each Fidelity Central Fund's financial statements are available on the SEC's website or upon request.
(e) Investment made with cash collateral received from securities on loan.
Affiliated Central Funds
Information regarding fiscal year to date income earned by the Fund from investments in Fidelity Central Funds is as follows:
| Fund | Income earned |
| Fidelity Cash Central Fund | $3,946 |
| Fidelity Securities Lending Cash Central Fund | 5,223 |
| Total | $9,169 |
Investment Valuation
The following is a summary of the inputs used, as of April 30, 2016, involving the Fund's assets and liabilities carried at fair value. The inputs or methodology used for valuing securities may not be an indication of the risk associated with investing in those securities. For more information on valuation inputs, and their aggregation into the levels used below, please refer to the Investment Valuation section in the accompanying Notes to Financial Statements.
| Valuation Inputs at Reporting Date: | ||||
| Description | Total | Level 1 | Level 2 | Level 3 |
| Investments in Securities: | ||||
| Equities: | ||||
| Consumer Discretionary | $10,236,503 | $7,630,451 | $2,606,052 | $-- |
| Consumer Staples | 5,483,928 | 4,176,178 | 1,307,750 | -- |
| Energy | 1,435,992 | 1,435,992 | -- | -- |
| Financials | 11,813,854 | 11,159,031 | 654,823 | -- |
| Health Care | 4,848,036 | 3,850,071 | 997,965 | -- |
| Industrials | 9,371,343 | 7,491,169 | 1,880,174 | -- |
| Information Technology | 11,639,928 | 9,792,930 | 1,846,998 | -- |
| Materials | 6,602,382 | 4,923,928 | 1,678,454 | -- |
| Telecommunication Services | 1,041,158 | 1,041,158 | -- | -- |
| Utilities | 2,057,597 | 1,828,457 | 229,140 | -- |
| Government Obligations | 79,983 | -- | 79,983 | -- |
| Money Market Funds | 3,107,916 | 3,107,916 | -- | -- |
| Total Investments in Securities: | $67,718,620 | $56,437,281 | $11,281,339 | $-- |
The following is a summary of transfers between Level 1 and Level 2 for the period ended April 30, 2016. Transfers are assumed to have occurred at the beginning of the period, and are primarily attributable to the valuation techniques used for foreign equity securities, as discussed in the accompanying Notes to Financial Statements:
| Transfers | Total |
| Level 1 to Level 2 | $513,350 |
| Level 2 to Level 1 | $11,800,840 |
The following is a reconciliation of Investments in Securities and Derivative Instruments for which Level 3 inputs were used in determining value:
| Investments in Securities: | |
| Beginning Balance | $792,670 |
| Net Realized Gain (Loss) on Investment Securities | -- |
| Net Unrealized Gain (Loss) on Investment Securities | -- |
| Cost of Purchases | -- |
| Proceeds of Sales | -- |
| Amortization/Accretion | -- |
| Transfers into Level 3 | -- |
| Transfers out of Level 3 | (792,670) |
| Ending Balance | $-- |
| The change in unrealized gain (loss) for the period attributable to Level 3 securities held at April 30, 2016 | $-- |
The information used in the above reconciliation represents fiscal year to date activity for any Investments in Securities identified as using Level 3 inputs at either the beginning or the end of the current fiscal period. Transfers into Level 3 were attributable to a lack of observable market data resulting from decreases in market activity, decreases in liquidity, security restructuring or corporate actions. Transfers in or out of Level 3 represent the beginning value of any Security or Instrument where a change in the pricing level occurred from the beginning to the end of the period. The cost of purchases and the proceeds of sales may include securities received or delivered through corporate actions or exchanges. Realized and unrealized gains (losses) disclosed in the reconciliation are included in Net Gain (Loss) on the Fund's Statement of Operations.
See accompanying notes which are an integral part of the financial statements.
Fidelity® Emerging Markets Discovery Fund
Financial Statements
Statement of Assets and Liabilities
| April 30, 2016 (Unaudited) | ||
| Assets | ||
| Investment in securities, at value (including securities loaned of $1,056,713) — See accompanying schedule: Unaffiliated issuers (cost $67,691,544) | $64,610,704 | |
| Fidelity Central Funds (cost $3,107,916) | 3,107,916 | |
| Total Investments (cost $70,799,460) | $67,718,620 | |
| Foreign currency held at value (cost $67,248) | 67,236 | |
| Receivable for investments sold | 2,293,237 | |
| Receivable for fund shares sold | 90,727 | |
| Dividends receivable | 92,213 | |
| Distributions receivable from Fidelity Central Funds | 1,961 | |
| Prepaid expenses | 66 | |
| Other receivables | 16,941 | |
| Total assets | 70,281,001 | |
| Liabilities | ||
| Payable to custodian bank | $1,802,368 | |
| Payable for investments purchased | ||
| Regular delivery | 756,311 | |
| Delayed delivery | 35,139 | |
| Payable for fund shares redeemed | 265,965 | |
| Accrued management fee | 58,418 | |
| Distribution and service plan fees payable | 3,166 | |
| Other affiliated payables | 15,898 | |
| Other payables and accrued expenses | 75,051 | |
| Collateral on securities loaned, at value | 1,092,150 | |
| Total liabilities | 4,104,466 | |
| Net Assets | $66,176,535 | |
| Net Assets consist of: | ||
| Paid in capital | $74,137,370 | |
| Undistributed net investment income | 115,022 | |
| Accumulated undistributed net realized gain (loss) on investments and foreign currency transactions | (4,977,675) | |
| Net unrealized appreciation (depreciation) on investments and assets and liabilities in foreign currencies | (3,098,182) | |
| Net Assets | $66,176,535 | |
| Calculation of Maximum Offering Price | ||
| Class A: | ||
| Net Asset Value and redemption price per share ($4,358,567 ÷ 394,003 shares) | $11.06 | |
| Maximum offering price per share (100/94.25 of $11.06) | $11.73 | |
| Class T: | ||
| Net Asset Value and redemption price per share ($2,107,239 ÷ 191,242 shares) | $11.02 | |
| Maximum offering price per share (100/96.50 of $11.02) | $11.42 | |
| Class C: | ||
| Net Asset Value and offering price per share ($1,721,722 ÷ 158,821 shares)(a) | $10.84 | |
| Emerging Markets Discovery: | ||
| Net Asset Value, offering price and redemption price per share ($56,615,815 ÷ 5,096,251 shares) | $11.11 | |
| Class I: | ||
| Net Asset Value, offering price and redemption price per share ($1,373,192 ÷ 123,266 shares) | $11.14 |
(a) Redemption price per share is equal to net asset value less any applicable contingent deferred sales charge.
See accompanying notes which are an integral part of the financial statements.
Statement of Operations
| Six months ended April 30, 2016 (Unaudited) | ||
| Investment Income | ||
| Dividends | $711,619 | |
| Interest | 57 | |
| Income from Fidelity Central Funds | 9,169 | |
| Income before foreign taxes withheld | 720,845 | |
| Less foreign taxes withheld | (45,068) | |
| Total income | 675,777 | |
| Expenses | ||
| Management fee | $273,908 | |
| Transfer agent fees | 79,317 | |
| Distribution and service plan fees | 18,188 | |
| Accounting and security lending fees | 16,831 | |
| Custodian fees and expenses | 80,413 | |
| Independent trustees' compensation | 143 | |
| Registration fees | 29,054 | |
| Audit | 53,294 | |
| Legal | 94 | |
| Miscellaneous | 236 | |
| Total expenses before reductions | 551,478 | |
| Expense reductions | (67,843) | 483,635 |
| Net investment income (loss) | 192,142 | |
| Realized and Unrealized Gain (Loss) | ||
| Net realized gain (loss) on: | ||
| Investment securities: | ||
| Unaffiliated issuers | (2,937,454) | |
| Foreign currency transactions | 260 | |
| Futures contracts | 172,417 | |
| Total net realized gain (loss) | (2,764,777) | |
| Change in net unrealized appreciation (depreciation) on: Investment securities (net of increase in deferred foreign taxes of $8,025) | 3,777,452 | |
| Assets and liabilities in foreign currencies | 10,070 | |
| Total change in net unrealized appreciation (depreciation) | 3,787,522 | |
| Net gain (loss) | 1,022,745 | |
| Net increase (decrease) in net assets resulting from operations | $1,214,887 |
See accompanying notes which are an integral part of the financial statements.
Statement of Changes in Net Assets
| Six months ended April 30, 2016 (Unaudited) | Year ended October 31, 2015 | |
| Increase (Decrease) in Net Assets | ||
| Operations | ||
| Net investment income (loss) | $192,142 | $749,160 |
| Net realized gain (loss) | (2,764,777) | (1,932,100) |
| Change in net unrealized appreciation (depreciation) | 3,787,522 | (8,002,533) |
| Net increase (decrease) in net assets resulting from operations | 1,214,887 | (9,185,473) |
| Distributions to shareholders from net investment income | (490,717) | – |
| Share transactions - net increase (decrease) | (5,938,352) | (6,487,831) |
| Redemption fees | 30,593 | 32,392 |
| Total increase (decrease) in net assets | (5,183,589) | (15,640,912) |
| Net Assets | ||
| Beginning of period | 71,360,124 | 87,001,036 |
| End of period (including undistributed net investment income of $115,022 and undistributed net investment income of $413,597, respectively) | $66,176,535 | $71,360,124 |
See accompanying notes which are an integral part of the financial statements.
Financial Highlights — Fidelity Emerging Markets Discovery Fund Class A
| Six months ended (Unaudited) April 30, | Years ended October 31, | ||||
| 2016 | 2015 | 2014 | 2013 | 2012 A | |
| Selected Per–Share Data | |||||
| Net asset value, beginning of period | $10.92 | $12.17 | $12.49 | $11.89 | $10.00 |
| Income from Investment Operations | |||||
| Net investment income (loss)B | .02 | .09C | .04 | .08 | .12 |
| Net realized and unrealized gain (loss) | .17 | (1.34) | (.01) | .75 | 1.76 |
| Total from investment operations | .19 | (1.25) | .03 | .83 | 1.88 |
| Distributions from net investment income | (.05) | – | (.06) | (.04) | (.01) |
| Distributions from net realized gain | – | – | (.30) | (.20) | – |
| Total distributions | (.05) | – | (.36) | (.25)D | (.01) |
| Redemption fees added to paid in capitalB | –E | –E | .01 | .02 | .02 |
| Net asset value, end of period | $11.06 | $10.92 | $12.17 | $12.49 | $11.89 |
| Total ReturnF,G,H | 1.79% | (10.27)% | .31% | 7.20% | 19.00% |
| Ratios to Average Net AssetsI,J | |||||
| Expenses before reductions | 1.97%K | 1.88% | 1.82% | 1.87% | 3.49% |
| Expenses net of fee waivers, if any | 1.70%K | 1.70% | 1.70% | 1.70% | 1.70% |
| Expenses net of all reductions | 1.69%K | 1.69% | 1.70% | 1.64% | 1.64% |
| Net investment income (loss) | .40%K | .76%C | .29% | .62% | 1.16% |
| Supplemental Data | |||||
| Net assets, end of period (000 omitted) | $4,359 | $4,660 | $4,362 | $5,065 | $1,671 |
| Portfolio turnover rateL | 63%K | 103% | 148% | 179% | 83% |
A For the period November 1, 2011 (commencement of operations) to October 31, 2012.
B Calculated based on average shares outstanding during the period.
C Net Investment income per share reflects a large, non-recurring dividend which amounted to $.06 per share. Excluding this non-recurring dividend, the ratio of net investment income (loss) to average net assets would have been .22%.
D Total distributions of $.25 per share is comprised of distributions from net investment income of $.044 and distributions from net realized gain of $.203 per share.
E Amount represents less than $.005 per share.
F Total returns for periods of less than one year are not annualized.
G Total returns would have been lower if certain expenses had not been reduced during the applicable periods shown.
H Total returns do not include the effect of the sales charges.
I Fees and expenses of any underlying Fidelity Central Funds are not included in the Fund's expense ratio. The Fund indirectly bears its proportionate share of the expenses of any underlying Fidelity Central Funds.
J Expense ratios reflect operating expenses of the class. Expenses before reductions do not reflect amounts reimbursed by the investment adviser or reductions from brokerage service arrangements or reductions from other expense offset arrangements and do not represent the amount paid by the class during periods when reimbursements or reductions occur. Expense ratios before reductions for start-up periods may not be representative of longer-term operating periods. Expenses net of fee waivers reflect expenses after reimbursement by the investment adviser but prior to reductions from brokerage service arrangements or other expense offset arrangements. Expenses net of all reductions represent the net expenses paid by the class.
K Annualized
L Amount does not include the portfolio activity of any underlying Fidelity Central Funds.
See accompanying notes which are an integral part of the financial statements.
Financial Highlights — Fidelity Emerging Markets Discovery Fund Class T
| Six months ended (Unaudited) April 30, | Years ended October 31, | ||||
| 2016 | 2015 | 2014 | 2013 | 2012 A | |
| Selected Per–Share Data | |||||
| Net asset value, beginning of period | $10.86 | $12.13 | $12.44 | $11.87 | $10.00 |
| Income from Investment Operations | |||||
| Net investment income (loss)B | .01 | .06C | –D | .05 | .10 |
| Net realized and unrealized gain (loss) | .17 | (1.33) | –D | .74 | 1.75 |
| Total from investment operations | .18 | (1.27) | –D | .79 | 1.85 |
| Distributions from net investment income | (.02) | – | (.02) | (.03) | –D |
| Distributions from net realized gain | – | – | (.30) | (.20) | – |
| Total distributions | (.02) | – | (.32) | (.24)E | –D |
| Redemption fees added to paid in capitalB | –D | –D | .01 | .02 | .02 |
| Net asset value, end of period | $11.02 | $10.86 | $12.13 | $12.44 | $11.87 |
| Total ReturnF,G,H | 1.69% | (10.47)% | .05% | 6.87% | 18.75% |
| Ratios to Average Net AssetsI,J | |||||
| Expenses before reductions | 2.26%K | 2.16% | 2.10% | 2.19% | 3.77% |
| Expenses net of fee waivers, if any | 1.95%K | 1.95% | 1.95% | 1.95% | 1.95% |
| Expenses net of all reductions | 1.94%K | 1.94% | 1.95% | 1.89% | 1.89% |
| Net investment income (loss) | .15%K | .51%C | .04% | .37% | .91% |
| Supplemental Data | |||||
| Net assets, end of period (000 omitted) | $2,107 | $2,015 | $2,031 | $1,914 | $1,700 |
| Portfolio turnover rateL | 63%K | 103% | 148% | 179% | 83% |
A For the period November 1, 2011 (commencement of operations) to October 31, 2012.
B Calculated based on average shares outstanding during the period.
C Net Investment income per share reflects a large, non-recurring dividend which amounted to $.06 per share. Excluding this non-recurring dividend, the ratio of net investment income (loss) to average net assets would have been (.03) %.
D Amount represents less than $.005 per share.
E Total distributions of $.24 per share is comprised of distributions from net investment income of $.034 and distributions from net realized gain of $.203 per share.
F Total returns for periods of less than one year are not annualized.
G Total returns would have been lower if certain expenses had not been reduced during the applicable periods shown.
H Total returns do not include the effect of the sales charges.
I Fees and expenses of any underlying Fidelity Central Funds are not included in the Fund's expense ratio. The Fund indirectly bears its proportionate share of the expenses of any underlying Fidelity Central Funds.
J Expense ratios reflect operating expenses of the class. Expenses before reductions do not reflect amounts reimbursed by the investment adviser or reductions from brokerage service arrangements or reductions from other expense offset arrangements and do not represent the amount paid by the class during periods when reimbursements or reductions occur. Expense ratios before reductions for start-up periods may not be representative of longer-term operating periods. Expenses net of fee waivers reflect expenses after reimbursement by the investment adviser but prior to reductions from brokerage service arrangements or other expense offset arrangements. Expenses net of all reductions represent the net expenses paid by the class.
K Annualized
L Amount does not include the portfolio activity of any underlying Fidelity Central Funds.
See accompanying notes which are an integral part of the financial statements.
Financial Highlights — Fidelity Emerging Markets Discovery Fund Class C
| Six months ended (Unaudited) April 30, | Years ended October 31, | ||||
| 2016 | 2015 | 2014 | 2013 | 2012 A | |
| Selected Per–Share Data | |||||
| Net asset value, beginning of period | $10.69 | $12.00 | $12.35 | $11.82 | $10.00 |
| Income from Investment Operations | |||||
| Net investment income (loss)B | (.02) | –C,D | (.06) | (.02) | .04 |
| Net realized and unrealized gain (loss) | .17 | (1.31) | –D | .74�� | 1.76 |
| Total from investment operations | .15 | (1.31) | (.06) | .72 | 1.80 |
| Distributions from net investment income | – | – | – | (.01) | – |
| Distributions from net realized gain | – | – | (.30) | (.20) | – |
| Total distributions | – | – | (.30) | (.21) | – |
| Redemption fees added to paid in capitalB | –D | –D | .01 | .02 | .02 |
| Net asset value, end of period | $10.84 | $10.69 | $12.00 | $12.35 | $11.82 |
| Total ReturnE,F,G | 1.40% | (10.92)% | (.42)% | 6.32% | 18.20% |
| Ratios to Average Net AssetsH,I | |||||
| Expenses before reductions | 2.72%J | 2.64% | 2.58% | 2.70% | 4.32% |
| Expenses net of fee waivers, if any | 2.45%J | 2.45% | 2.45% | 2.45% | 2.45% |
| Expenses net of all reductions | 2.44%J | 2.44% | 2.45% | 2.39% | 2.39% |
| Net investment income (loss) | (.35)%J | .01%C | (.46)% | (.13)% | .41% |
| Supplemental Data | |||||
| Net assets, end of period (000 omitted) | $1,722 | $1,675 | $1,750 | $2,082 | $1,474 |
| Portfolio turnover rateK | 63%J | 103% | 148% | 179% | 83% |
A For the period November 1, 2011 (commencement of operations) to October 31, 2012.
B Calculated based on average shares outstanding during the period.
C Net Investment income per share reflects a large, non-recurring dividend which amounted to $.06 per share. Excluding this non-recurring dividend, the ratio of net investment income (loss) to average net assets would have been (.52) %.
D Amount represents less than $.005 per share.
E Total returns for periods of less than one year are not annualized.
F Total returns would have been lower if certain expenses had not been reduced during the applicable periods shown.
G Total returns do not include the effect of the contingent deferred sales charge.
H Fees and expenses of any underlying Fidelity Central Funds are not included in the Fund's expense ratio. The Fund indirectly bears its proportionate share of the expenses of any underlying Fidelity Central Funds.
I Expense ratios reflect operating expenses of the class. Expenses before reductions do not reflect amounts reimbursed by the investment adviser or reductions from brokerage service arrangements or reductions from other expense offset arrangements and do not represent the amount paid by the class during periods when reimbursements or reductions occur. Expense ratios before reductions for start-up periods may not be representative of longer-term operating periods. Expenses net of fee waivers reflect expenses after reimbursement by the investment adviser but prior to reductions from brokerage service arrangements or other expense offset arrangements. Expenses net of all reductions represent the net expenses paid by the class.
J Annualized
K Amount does not include the portfolio activity of any underlying Fidelity Central Funds.
See accompanying notes which are an integral part of the financial statements.
Financial Highlights — Fidelity Emerging Markets Discovery Fund
| Six months ended (Unaudited) April 30, | Years ended October 31, | ||||
| 2016 | 2015 | 2014 | 2013 | 2012 A | |
| Selected Per–Share Data | |||||
| Net asset value, beginning of period | $10.98 | $12.21 | $12.52 | $11.92 | $10.00 |
| Income from Investment Operations | |||||
| Net investment income (loss)B | .03 | .12C | .07 | .11 | .15 |
| Net realized and unrealized gain (loss) | .19 | (1.35) | –D | .74 | 1.76 |
| Total from investment operations | .22 | (1.23) | .07 | .85 | 1.91 |
| Distributions from net investment income | (.09) | – | (.09) | (.07) | (.01) |
| Distributions from net realized gain | – | – | (.30) | (.20) | – |
| Total distributions | (.09) | – | (.39) | (.27) | (.01) |
| Redemption fees added to paid in capitalB | –D | –D | .01 | .02 | .02 |
| Net asset value, end of period | $11.11 | $10.98 | $12.21 | $12.52 | $11.92 |
| Total ReturnE,F | 1.99% | (10.07)% | .61% | 7.37% | 19.35% |
| Ratios to Average Net AssetsG,H | |||||
| Expenses before reductions | 1.64%I | 1.56% | 1.48% | 1.57% | 3.02% |
| Expenses net of fee waivers, if any | 1.45%I | 1.45% | 1.45% | 1.45% | 1.45% |
| Expenses net of all reductions | 1.44%I | 1.44% | 1.45% | 1.39% | 1.39% |
| Net investment income (loss) | .65%I | 1.01%C | .54% | .87% | 1.41% |
| Supplemental Data | |||||
| Net assets, end of period (000 omitted) | $56,616 | $61,601 | $78,377 | $96,731 | $39,135 |
| Portfolio turnover rateJ | 63%I | 103% | 148% | 179% | 83% |
A For the period November 1, 2011 (commencement of operations) to October 31, 2012.
B Calculated based on average shares outstanding during the period.
C Net Investment income per share reflects a large, non-recurring dividend which amounted to $.06 per share. Excluding this non-recurring dividend, the ratio of net investment income (loss) to average net assets would have been .48%.
D Amount represents less than $.005 per share.
E Total returns for periods of less than one year are not annualized.
F Total returns would have been lower if certain expenses had not been reduced during the applicable periods shown.
G Fees and expenses of any underlying Fidelity Central Funds are not included in the Fund's expense ratio. The Fund indirectly bears its proportionate share of the expenses of any underlying Fidelity Central Funds.
H Expense ratios reflect operating expenses of the class. Expenses before reductions do not reflect amounts reimbursed by the investment adviser or reductions from brokerage service arrangements or reductions from other expense offset arrangements and do not represent the amount paid by the class during periods when reimbursements or reductions occur. Expense ratios before reductions for start-up periods may not be representative of longer-term operating periods. Expenses net of fee waivers reflect expenses after reimbursement by the investment adviser but prior to reductions from brokerage service arrangements or other expense offset arrangements. Expenses net of all reductions represent the net expenses paid by the class.
I Annualized
J Amount does not include the portfolio activity of any underlying Fidelity Central Funds.
See accompanying notes which are an integral part of the financial statements.
Financial Highlights — Fidelity Emerging Markets Discovery Fund Class I
| Six months ended (Unaudited) April 30, | Years ended October 31, | ||||
| 2016 | 2015 | 2014 | 2013 | 2012 A | |
| Selected Per–Share Data | |||||
| Net asset value, beginning of period | $11.02 | $12.25 | $12.53 | $11.92 | $10.00 |
| Income from Investment Operations | |||||
| Net investment income (loss)B | .03 | .12C | .07 | .11 | .15 |
| Net realized and unrealized gain (loss) | .18 | (1.35) | –D | .75 | 1.76 |
| Total from investment operations | .21 | (1.23) | .07 | .86 | 1.91 |
| Distributions from net investment income | (.09) | – | (.06) | (.07) | (.01) |
| Distributions from net realized gain | – | – | (.30) | (.20) | – |
| Total distributions | (.09) | – | (.36) | (.27) | (.01) |
| Redemption fees added to paid in capitalB | –D | –D | .01 | .02 | .02 |
| Net asset value, end of period | $11.14 | $11.02 | $12.25 | $12.53 | $11.92 |
| Total ReturnE,F | 1.91% | (10.04)% | .61% | 7.45% | 19.35% |
| Ratios to Average Net AssetsG,H | |||||
| Expenses before reductions | 1.61%I | 1.54% | 1.56% | 1.60% | 3.21% |
| Expenses net of fee waivers, if any | 1.45%I | 1.45% | 1.45% | 1.45%�� | 1.45% |
| Expenses net of all reductions | 1.44%I | 1.43% | 1.45% | 1.39% | 1.39% |
| Net investment income (loss) | .65%I | 1.01%C | .54% | .87% | 1.41% |
| Supplemental Data | |||||
| Net assets, end of period (000 omitted) | $1,373 | $1,410 | $481 | $1,076 | $1,825 |
| Portfolio turnover rateJ | 63%I | 103% | 148% | 179% | 83% |
A For the period November 1, 2011 (commencement of operations) to October 31, 2012.
B Calculated based on average shares outstanding during the period.
C Net Investment income per share reflects a large, non-recurring dividend which amounted to $.06 per share. Excluding this non-recurring dividend, the ratio of net investment income (loss) to average net assets would have been .48%.
D Amount represents less than $.005 per share.
E Total returns for periods of less than one year are not annualized.
F Total returns would have been lower if certain expenses had not been reduced during the applicable periods shown.
G Fees and expenses of any underlying Fidelity Central Funds are not included in the Fund's expense ratio. The Fund indirectly bears its proportionate share of the expenses of any underlying Fidelity Central Funds.
H Expense ratios reflect operating expenses of the class. Expenses before reductions do not reflect amounts reimbursed by the investment adviser or reductions from brokerage service arrangements or reductions from other expense offset arrangements and do not represent the amount paid by the class during periods when reimbursements or reductions occur. Expense ratios before reductions for start-up periods may not be representative of longer-term operating periods. Expenses net of fee waivers reflect expenses after reimbursement by the investment adviser but prior to reductions from brokerage service arrangements or other expense offset arrangements. Expenses net of all reductions represent the net expenses paid by the class.
I Annualized
J Amount does not include the portfolio activity of any underlying Fidelity Central Funds.
See accompanying notes which are an integral part of the financial statements.
Notes to Financial Statements (Unaudited)
For the period ended April 30, 2016
1. Organization.
Fidelity Emerging Markets Discovery Fund (the Fund) is a fund of Fidelity Investment Trust (the Trust) and is authorized to issue an unlimited number of shares. The Trust is registered under the Investment Company Act of 1940, as amended (the 1940 Act), as an open-end management investment company organized as a Massachusetts business trust. The Fund offers Class A, Class T, Class C, Emerging Markets Discovery and Class I shares, each of which has equal rights as to assets and voting privileges. Each class has exclusive voting rights with respect to matters that affect that class. The Fund's investments in emerging markets can be subject to social, economic, regulatory, and political uncertainties and can be extremely volatile.
2. Investments in Fidelity Central Funds.
The Fund invests in Fidelity Central Funds, which are open-end investment companies generally available only to other investment companies and accounts managed by the investment adviser and its affiliates. The Fund's Schedule of Investments lists each of the Fidelity Central Funds held as of period end, if any, as an investment of the Fund, but does not include the underlying holdings of each Fidelity Central Fund. As an Investing Fund, the Fund indirectly bears its proportionate share of the expenses of the underlying Fidelity Central Funds.
The Money Market Central Funds seek preservation of capital and current income and are managed by Fidelity Investments Money Management, Inc. (FIMM), an affiliate of the investment adviser. Annualized expenses of the Money Market Central Funds as of their most recent shareholder report date are less than .005%.
A complete unaudited list of holdings for each Fidelity Central Fund is available upon request or at the Securities and Exchange Commission (the SEC) website at www.sec.gov. In addition, the financial statements of the Fidelity Central Funds are available on the SEC website or upon request.
3. Significant Accounting Policies.
The financial statements have been prepared in conformity with accounting principles generally accepted in the United States of America (GAAP), which require management to make certain estimates and assumptions at the date of the financial statements. Actual results could differ from those estimates. Subsequent events, if any, through the date that the financial statements were issued have been evaluated in the preparation of the financial statements. The following summarizes the significant accounting policies of the Fund:
Investment Valuation. Investments are valued as of 4:00 p.m. Eastern time on the last calendar day of the period. The Board of Trustees (the Board) has delegated the day to day responsibility for the valuation of the Fund's investments to the Fidelity Management & Research Company (FMR) Fair Value Committee (the Committee). In accordance with valuation policies and procedures approved by the Board, the Fund attempts to obtain prices from one or more third party pricing vendors or brokers to value its investments. When current market prices, quotations or currency exchange rates are not readily available or reliable, investments will be fair valued in good faith by the Committee, in accordance with procedures adopted by the Board. Factors used in determining fair value vary by investment type and may include market or investment specific events, changes in interest rates and credit quality. The frequency with which these procedures are used cannot be predicted and they may be utilized to a significant extent. The Committee oversees the Fund's valuation policies and procedures and reports to the Board on the Committee's activities and fair value determinations. The Board monitors the appropriateness of the procedures used in valuing the Fund's investments and ratifies the fair value determinations of the Committee.
The Fund categorizes the inputs to valuation techniques used to value its investments into a disclosure hierarchy consisting of three levels as shown below:
- Level 1 – quoted prices in active markets for identical investments
- Level 2 – other significant observable inputs (including quoted prices for similar investments, interest rates, prepayment speeds, etc.)
- Level 3 – unobservable inputs (including the Fund's own assumptions based on the best information available)
Valuation techniques used to value the Fund's investments by major category are as follows:
Equity securities, including restricted securities, for which market quotations are readily available, are valued at the last reported sale price or official closing price as reported by a third party pricing vendor on the primary market or exchange on which they are traded and are categorized as Level 1 in the hierarchy. In the event there were no sales during the day or closing prices are not available, securities are valued at the last quoted bid price or may be valued using the last available price and are generally categorized as Level 2 in the hierarchy. For foreign equity securities, when market or security specific events arise, comparisons to the valuation of American Depositary Receipts (ADRs), futures contracts, Exchange-Traded Funds (ETFs) and certain indexes as well as quoted prices for similar securities may be used and would be categorized as Level 2 in the hierarchy. Utilizing these techniques may result in transfers between Level 1 and Level 2. For equity securities, including restricted securities, where observable inputs are limited, assumptions about market activity and risk are used and these securities may be categorized as Level 3 in the hierarchy.
Debt securities, including restricted securities, are valued based on evaluated prices received from third party pricing vendors or from brokers who make markets in such securities. U.S. government and government agency obligations are valued by pricing vendors who utilize matrix pricing which considers yield or price of bonds of comparable quality, coupon, maturity and type or by broker-supplied prices. When independent prices are unavailable or unreliable, debt securities may be valued utilizing pricing methodologies which consider similar factors that would be used by third party pricing vendors. Debt securities are generally categorized as Level 2 in the hierarchy but may be Level 3 depending on the circumstances.
Investments in open-end mutual funds, including the Fidelity Central Funds, are valued at their closing net asset value (NAV) each business day and are categorized as Level 1 in the hierarchy.
Changes in valuation techniques may result in transfers in or out of an assigned level within the disclosure hierarchy. The aggregate value of investments by input level as of April 30, 2016, including information on transfers between Levels 1 and 2, as well as a roll forward of Level 3 investments, is included at the end of the Fund's Schedule of Investments.
Foreign Currency. The Fund may use foreign currency contracts to facilitate transactions in foreign-denominated securities. Gains and losses from these transactions may arise from changes in the value of the foreign currency or if the counterparties do not perform under the contracts' terms.
Foreign-denominated assets, including investment securities, and liabilities are translated into U.S. dollars at the exchange rates at period end. Purchases and sales of investment securities, income and dividends received and expenses denominated in foreign currencies are translated into U.S. dollars at the exchange rate in effect on the transaction date.
The effects of exchange rate fluctuations on investments are included with the net realized and unrealized gain (loss) on investment securities. Other foreign currency transactions resulting in realized and unrealized gain (loss) are disclosed separately.
Investment Transactions and Income. For financial reporting purposes, the Fund's investment holdings and NAV include trades executed through the end of the last business day of the period. The NAV per share for processing shareholder transactions is calculated as of the close of business of the New York Stock Exchange (NYSE), normally 4:00 p.m. Eastern time and includes trades executed through the end of the prior business day. Gains and losses on securities sold are determined on the basis of identified cost. Dividend income is recorded on the ex-dividend date, except for certain dividends from foreign securities where the ex-dividend date may have passed, which are recorded as soon as the Fund is informed of the ex-dividend date. Non-cash dividends included in dividend income, if any, are recorded at the fair market value of the securities received. Income and capital gain distributions from Fidelity Central Funds, if any, are recorded on the ex-dividend date. Interest income is accrued as earned and includes coupon interest and amortization of premium and accretion of discount on debt securities as applicable. Investment income is recorded net of foreign taxes withheld where recovery of such taxes is uncertain.
Class Allocations and Expenses. Investment income, realized and unrealized capital gains and losses, common expenses of the Fund, and certain fund-level expense reductions, if any, are allocated daily on a pro-rata basis to each class based on the relative net assets of each class to the total net assets of the Fund. Each class differs with respect to transfer agent and distribution and service plan fees incurred. Certain expense reductions may also differ by class. For the reporting period, the allocated portion of income and expenses to each class as a percent of its average net assets may vary due to the timing of recording these transactions in relation to fluctuating net assets of the classes. Expenses directly attributable to a fund are charged to that fund. Expenses attributable to more than one fund are allocated among the respective funds on the basis of relative net assets or other appropriate methods. Expense estimates are accrued in the period to which they relate and adjustments are made when actual amounts are known.
Income Tax Information and Distributions to Shareholders. Each year, the Fund intends to qualify as a regulated investment company under Subchapter M of the Internal Revenue Code, including distributing substantially all of its taxable income and realized gains. As a result, no provision for U.S. Federal income taxes is required. The Fund files a U.S. federal tax return, in addition to state and local tax returns as required. The Fund's federal income tax returns are subject to examination by the Internal Revenue Service (IRS) for a period of three fiscal years after they are filed. State and local tax returns may be subject to examination for an additional fiscal year depending on the jurisdiction. Foreign taxes are provided for based on the Fund's understanding of the tax rules and rates that exist in the foreign markets in which it invests. The Fund is subject to a tax imposed on capital gains by certain countries in which it invests. An estimated deferred tax liability for net unrealized appreciation on the applicable securities is included in Other payables and accrued expenses on the Statement of Assets & Liabilities.
Distributions are declared and recorded on the ex-dividend date. Income dividends and capital gain distributions are declared separately for each class. Income and capital gain distributions are determined in accordance with income tax regulations, which may differ from GAAP.
Capital accounts within the financial statements are adjusted for permanent book-tax differences. These adjustments have no impact on net assets or the results of operations. Capital accounts are not adjusted for temporary book-tax differences which will reverse in a subsequent period.
Book-tax differences are primarily due to foreign currency transactions, futures transactions, certain foreign taxes, passive foreign investment companies (PFIC), capital loss carryforwards and losses deferred due to wash sales.
The federal tax cost of investment securities and unrealized appreciation (depreciation) as of period end were as follows:
| Gross unrealized appreciation | $5,799,157 |
| Gross unrealized depreciation | (9,248,368) |
| Net unrealized appreciation (depreciation) on securities | $(3,449,211) |
| Tax cost | $71,167,831 |
Capital loss carryforwards are only available to offset future capital gains of the Fund to the extent provided by regulations and may be limited. Under the Regulated Investment Company Modernization Act of 2010 (the Act), the Fund is permitted to carry forward capital losses incurred in taxable years beginning after December 22, 2010 for an unlimited period and such capital losses are required to be used prior to any losses that expire. The capital loss carryforward information presented below, including any applicable limitation, is estimated as of prior fiscal period end and is subject to adjustment.
| No expiration | |
| Short-term | $(1,731,575) |
Short-Term Trading (Redemption) Fees. Shares held by investors in the Fund less than 90 days may have been subject to a redemption fee equal to 2.00% of the NAV of shares redeemed. All redemption fees, which reduce the proceeds of the shareholder redemption, are retained by the Fund and accounted for as an addition to paid in capital.
Delayed Delivery Transactions and When-Issued Securities. During the period, the Fund transacted in securities on a delayed delivery or when-issued basis. Payment and delivery may take place after the customary settlement period for that security. The price of the underlying securities and the date when the securities will be delivered and paid for are fixed at the time the transaction is negotiated. The securities purchased on a delayed delivery or when-issued basis are identified as such in the Fund's Schedule of Investments. The Fund may receive compensation for interest forgone in the purchase of a delayed delivery or when-issued security. With respect to purchase commitments, the Fund identifies securities as segregated in its records with a value at least equal to the amount of the commitment. Losses may arise due to changes in the value of the underlying securities or if the counterparty does not perform under the contract's terms, or if the issuer does not issue the securities due to political, economic, or other factors.
4. Derivative Instruments.
Risk Exposures and the Use of Derivative Instruments. The Fund's investment objective allows the Fund to enter into various types of derivative contracts, including futures contracts. Derivatives are investments whose value is primarily derived from underlying assets, indices or reference rates and may be transacted on an exchange or over-the-counter (OTC). Derivatives may involve a future commitment to buy or sell a specified asset based on specified terms, to exchange future cash flows at periodic intervals based on a notional principal amount, or for one party to make one or more payments upon the occurrence of specified events in exchange for periodic payments from the other party.
The Fund used derivatives to increase returns and to manage exposure to certain risks as defined below. The success of any strategy involving derivatives depends on analysis of numerous economic factors, and if the strategies for investment do not work as intended, the Fund may not achieve its objectives.
The Fund's use of derivatives increased or decreased its exposure to the following risk:
| Equity Risk | Equity risk relates to the fluctuations in the value of financial instruments as a result of changes in market prices (other than those arising from interest rate risk or foreign exchange risk), whether caused by factors specific to an individual investment, its issuer, or all factors affecting all instruments traded in a market or market segment. |
The Fund is also exposed to additional risks from investing in derivatives, such as liquidity risk and counterparty credit risk. Liquidity risk is the risk that the Fund will be unable to close out the derivative in the open market in a timely manner. Counterparty credit risk is the risk that the counterparty will not be able to fulfill its obligation to the Fund. Counterparty credit risk related to exchange-traded futures contracts may be mitigated by the protection provided by the exchange on which they trade.
Investing in derivatives may involve greater risks than investing in the underlying assets directly and, to varying degrees, may involve risk of loss in excess of any initial investment and collateral received and amounts recognized in the Statement of Assets and Liabilities. In addition, there may be the risk that the change in value of the derivative contract does not correspond to the change in value of the underlying instrument.
Futures Contracts. A futures contract is an agreement between two parties to buy or sell a specified underlying instrument for a fixed price at a specified future date. The Fund used futures contracts to manage its exposure to the stock market.
Upon entering into a futures contract, a fund is required to deposit either cash or securities (initial margin) with a clearing broker in an amount equal to a certain percentage of the face value of the contract. Futures contracts are marked-to-market daily and subsequent daily payments (variation margin) are made or received by a fund depending on the daily fluctuations in the value of the futures contracts and are recorded as unrealized appreciation or (depreciation). This receivable and/or payable, if any, is included in daily variation margin for derivative instruments in the Statement of Assets and Liabilities. Realized gain or (loss) is recorded upon the expiration or closing of a futures contract. The net realized gain (loss) and change in net unrealized appreciation (depreciation) on futures contracts during the period is included in the Statement of Operations.
Any open futures contracts at period end are presented in the Schedule of Investments under the caption "Futures Contracts". The underlying face amount at value reflects each contract's exposure to the underlying instrument or index at period end.
During the period the Fund recognized net realized gain (loss) of $172,417 related to its investment in futures contracts. This amount is included in the Statement of Operations.
5. Purchases and Sales of Investments.
Purchases and sales of securities, other than short-term securities, aggregated $19,964,528 and $25,414,601, respectively.
6. Fees and Other Transactions with Affiliates.
Management Fee. Fidelity Management & Research Company (the investment adviser) and its affiliates provide the Fund with investment management related services for which the Fund pays a monthly management fee. The management fee is the sum of an individual fund fee rate that is based on an annual rate of .60% of the Fund's average net assets and an annualized group fee rate that averaged .25% during the period. The group fee rate is based upon the average net assets of all the mutual funds advised by the investment adviser, including any mutual funds previously advised by the investment adviser that are currently advised by Fidelity SelectCo, LLC, an affiliate of the investment adviser. The group fee rate decreases as assets under management increase and increases as assets under management decrease. For the reporting period, the total annualized management fee rate was .85% of the Fund's average net assets.
Distribution and Service Plan Fees. In accordance with Rule 12b-1 of the 1940 Act, the Fund has adopted separate Distribution and Service Plans for each class of shares. Certain classes pay Fidelity Distributors Corporation (FDC), an affiliate of the investment adviser, separate Distribution and Service Fees, each of which is based on an annual percentage of each class' average net assets. In addition, FDC may pay financial intermediaries for selling shares of the Fund and providing shareholder support services. For the period, the Distribution and Service Fee rates, total fees and amounts retained by FDC were as follows:
| Distribution Fee | Service Fee | Total Fees | Retained by FDC | |
| Class A | -% | .25% | $5,319 | $166 |
| Class T | .25% | .25% | 4,870 | 17 |
| Class C | .75% | .25% | 7,999 | 2,824 |
| $18,188 | $3,007 |
Sales Load. FDC may receive a front-end sales charge of up to 5.75% for selling Class A shares and 3.50% for selling Class T shares, some of which is paid to financial intermediaries for selling shares of the Fund. Depending on the holding period, FDC may receive contingent deferred sales charges levied on Class A, Class T, and Class C redemptions. The deferred sales charges are 1.00% for Class C shares, 1.00% for certain purchases of Class A shares and .25% for certain purchases of Class T shares.
For the period, sales charge amounts retained by FDC were as follows:
| Retained by FDC | |
| Class A | $1,176 |
| Class T | 567 |
| Class C(a) | 89 |
| $1,832 |
(a) When Class C shares are initially sold, FDC pays commissions from its own resources to financial intermediaries through which the sales are made.
Transfer Agent Fees. Fidelity Investments Institutional Operations Company, Inc., (FIIOC), an affiliate of the investment adviser, is the transfer, dividend disbursing and shareholder servicing agent for each class of the Fund. FIIOC receives account fees and asset-based fees that vary according to the account size and type of account of the shareholders of the respective classes of the Fund. FIIOC pays for typesetting, printing and mailing of shareholder reports, except proxy statements.
For the period, transfer agent fees for each class were as follows:
| Amount | % of Class-Level Average Net Assets(a) | |
| Class A | $6,692 | .31 |
| Class T | 3,430 | .35 |
| Class C | 2,516 | .31 |
| Emerging Markets Discovery | 65,442 | .24 |
| Class I | 1,237 | .20 |
| $79,317 |
(a) Annualized
Accounting and Security Lending Fees. Fidelity Service Company, Inc. (FSC), an affiliate of the investment adviser, maintains the Fund's accounting records. The accounting fee is based on the level of average net assets for each month. Under a separate contract, FSC administers the security lending program. The security lending fee is based on the number and duration of lending transactions.
Brokerage Commissions. The Fund placed a portion of its portfolio transactions with brokerage firms which are affiliates of the investment adviser. Brokerage commissions are included in net realized gain (loss) and change in net unrealized appreciation (depreciation) in the Statement of Operations. The commissions paid to these affiliated firms were $201 for the period.
Interfund Trades. The Fund may purchase from or sell securities to other Fidelity Funds under procedures adopted by the Board. The procedures have been designed to ensure these interfund trades are executed in accordance with Rule 17a-7 of the 1940 Act. Interfund trades are included within the respective purchases and sales amounts shown in the Purchases and Sales of Investments note.
7. Committed Line of Credit.
The Fund participates with other funds managed by the investment adviser or an affiliate in a $4.25 billion credit facility (the "line of credit") to be utilized for temporary or emergency purposes to fund shareholder redemptions or for other short-term liquidity purposes. The Fund has agreed to pay commitment fees on its pro-rata portion of the line of credit, which amounted to $57 and is reflected in Miscellaneous expenses on the Statement of Operations. During the period, the Fund did not borrow on this line of credit.
8. Security Lending.
The Fund lends portfolio securities through a lending agent from time to time in order to earn additional income. For equity securities, a lending agent is used and may loan securities to certain qualified borrowers, including Fidelity Capital Markets (FCM), a broker-dealer affiliated with the Fund. On the settlement date of the loan, the Fund receives collateral (in the form of U.S. Treasury obligations, letters of credit and/or cash) against the loaned securities and maintains collateral in an amount not less than 100% of the market value of the loaned securities during the period of the loan. The market value of the loaned securities is determined at the close of business of the Fund and any additional required collateral is delivered to the Fund on the next business day. The Fund or borrower may terminate the loan at any time, and if the borrower defaults on its obligation to return the securities loaned because of insolvency or other reasons, the Fund may apply collateral received from the borrower against the obligation. The Fund may experience delays and costs in recovering the securities loaned. Any cash collateral received is invested in the Fidelity Securities Lending Cash Central Fund. The value of loaned securities and cash collateral at period end are disclosed on the Fund's Statement of Assets and Liabilities. Security lending income represents the income earned on investing cash collateral, less rebates paid to borrowers and any lending agent fees associated with the loan, plus any premium payments received for lending certain types of securities. Security lending income is presented in the Statement of Operations as a component of income from Fidelity Central Funds. Total security lending income during the period amounted to $5,223. During the period, there were no securities loaned to FCM.
9. Expense Reductions.
The investment adviser contractually agreed to reimburse each class to the extent annual operating expenses exceeded certain levels of average net assets as noted in the table below. This reimbursement will remain in place through December 31, 2016. Some expenses, for example interest expense, including commitment fees, are excluded from this reimbursement.
The following classes were in reimbursement during the period:
| Expense Limitations | Reimbursement | |
| Class A | 1.70% | $5,845 |
| Class T | 1.95% | 2,989 |
| Class C | 2.45% | 2,170 |
| Emerging Markets Discovery | 1.45% | 53,138 |
| Class I | 1.45% | 1,004 |
| $65,146 |
Commissions paid to certain brokers with whom the investment adviser, or its affiliates, places trades on behalf of the Fund include an amount in addition to trade execution, which may be rebated back to the Fund to offset certain expenses. This amount totaled $2,463 for the period.
In addition, during the period the investment adviser reimbursed and/or waived a portion of fund-level operating expenses in the amount of $234.
10. Distributions to Shareholders.
Distributions to shareholders of each class were as follows:
| Six months ended April 30, 2016 | Year ended October 31, 2015 | |
| From net investment income | ||
| Class A | $22,428 | $– |
| Class T | 4,316 | – |
| Emerging Markets Discovery | 453,104 | – |
| Class I | 10,869 | – |
| Total | $490,717 | $– |
11. Share Transactions.
Share transactions for each class were as follows and may contain automatic conversions between classes or exchanges between affiliated funds:
| Shares | Shares | Dollars | Dollars | |
| Six months ended April 30, 2016 | Year ended October 31, 2015 | Six months ended April 30, 2016 | Year ended October 31, 2015 | |
| Class A | ||||
| Shares sold | 55,629 | 161,641 | $577,534 | $1,908,467 |
| Reinvestment of distributions | 1,944 | – | 20,757 | – |
| Shares redeemed | (90,322) | (93,262) | (940,546) | (1,088,220) |
| Net increase (decrease) | (32,749) | 68,379 | $(342,255) | $820,247 |
| Class T | ||||
| Shares sold | 18,358 | 59,344 | $188,721 | $694,558 |
| Reinvestment of distributions | 389 | – | 4,146 | – |
| Shares redeemed | (13,066) | (41,200) | (133,700) | (472,328) |
| Net increase (decrease) | 5,681 | 18,144 | $59,167 | $222,230 |
| Class C | ||||
| Shares sold | 17,201 | 68,780 | $175,833 | $796,943 |
| Shares redeemed | (15,073) | (57,921) | (149,534) | (667,642) |
| Net increase (decrease) | 2,128 | 10,859 | $26,299 | $129,301 |
| Emerging Markets Discovery | ||||
| Shares sold | 828,955 | 2,311,392 | $8,559,244 | $27,313,497 |
| Reinvestment of distributions | 39,922 | – | 427,569 | – |
| Shares redeemed | (1,380,942) | (3,121,418) | (14,622,762) | (36,074,220) |
| Net increase (decrease) | (512,065) | (810,026) | $(5,635,949) | $(8,760,723) |
| Class I | ||||
| Shares sold | 56,585 | 209,924 | $587,375 | $2,474,235 |
| Reinvestment of distributions | 981 | – | 10,531 | – |
| Shares redeemed | (62,265) | (121,211) | (643,520) | (1,373,121) |
| Net increase (decrease) | (4,699) | 88,713 | $(45,614) | $1,101,114 |
12. Other.
The Fund's organizational documents provide former and current trustees and officers with a limited indemnification against liabilities arising in connection with the performance of their duties to the Fund. In the normal course of business, the Fund may also enter into contracts that provide general indemnifications. The Fund's maximum exposure under these arrangements is unknown as this would be dependent on future claims that may be made against the Fund. The risk of material loss from such claims is considered remote.
At the end of the period, the investment adviser or its affiliates were the owners of record of 12% of the total outstanding shares of the Fund.
Fidelity® Total Emerging Markets Fund
Investment Summary (Unaudited)
Top Five Stocks as of April 30, 2016
| % of fund's net assets | % of fund's net assets 6 months ago | |
| Taiwan Semiconductor Manufacturing Co. Ltd. (Taiwan, Semiconductors & Semiconductor Equipment) | 2.1 | 2.0 |
| Naspers Ltd. Class N (South Africa, Media) | 2.0 | 1.2 |
| Tencent Holdings Ltd. (Cayman Islands, Internet Software & Services) | 1.5 | 1.7 |
| Alibaba Group Holding Ltd. sponsored ADR (Cayman Islands, Internet Software & Services) | 1.4 | 0.6 |
| China Mobile Ltd. (Hong Kong, Wireless Telecommuncation Services) | 1.2 | 1.1 |
| 8.2 |
Top Five Market Sectors as of April 30, 2016
| % of fund's net assets | % of fund's net assets 6 months ago | |
| Financials | 18.8 | 17.5 |
| Energy | 16.8 | 14.9 |
| Information Technology | 13.0 | 10.9 |
| Consumer Discretionary | 7.4 | 5.7 |
| Consumer Staples | 5.8 | 5.7 |
Top Five Countries as of April 30, 2016
| (excluding cash equivalents) | % of fund's net assets | % of fund's net assets 6 months ago |
| Korea (South) | 8.7 | 9.3 |
| Cayman Islands | 6.9 | 7.0 |
| Brazil | 6.1 | 5.2 |
| Mexico | 6.0 | 6.2 |
| India | 5.5 | 5.3 |
Percentages are adjusted for the effect of futures contracts, if applicable.
Asset Allocation (% of fund's net assets)
| As of April 30, 2016 | ||
| Stocks and Equity Futures | 67.5% | |
| Bonds | 28.8% | |
| Other Investments | 0.3% | |
| Short-Term Investments and Net Other Assets (Liabilities) | 3.4% | |

| As of October 31, 2015 | ||
| Stocks and Equity Futures | 55.3% | |
| Bonds | 40.8% | |
| Other Investments | 0.6% | |
| Short-Term Investments and Net Other Assets (Liabilities) | 3.3% | |

Fidelity® Total Emerging Markets Fund
Investments April 30, 2016 (Unaudited)
Showing Percentage of Net Assets
| Common Stocks - 60.3% | |||
| Shares | Value | ||
| Argentina - 0.3% | |||
| Telecom Argentina SA Class B sponsored ADR | 4,334 | $81,132 | |
| YPF SA Class D sponsored ADR | 6,200 | 124,930 | |
| TOTAL ARGENTINA | 206,062 | ||
| Austria - 0.3% | |||
| Erste Group Bank AG | 7,805 | 224,500 | |
| Bermuda - 1.0% | |||
| AGTech Holdings Ltd. (a) | 112,000 | 25,952 | |
| Credicorp Ltd. (United States) | 1,290 | 187,592 | |
| GP Investments Ltd. Class A (depositary receipt) (a) | 22,922 | 51,253 | |
| PAX Global Technology Ltd. | 115,460 | 99,437 | |
| Shangri-La Asia Ltd. | 262,000 | 320,071 | |
| TOTAL BERMUDA | 684,305 | ||
| Brazil - 2.6% | |||
| B2W Companhia Global do Varejo (a) | 32,040 | 127,629 | |
| BB Seguridade Participacoes SA | 36,310 | 316,726 | |
| BR Properties SA | 6,700 | 20,007 | |
| CCR SA | 32,700 | 153,838 | |
| Cielo SA | 25,436 | 247,759 | |
| Companhia de Saneamento de Minas Gerais | 15,706 | 98,184 | |
| Cosan SA Industria e Comercio | 12,521 | 115,917 | |
| Direcional Engenharia SA | 42,000 | 75,104 | |
| Fibria Celulose SA | 6,700 | 59,183 | |
| FPC Par Corretora de Seguros | 33,600 | 112,839 | |
| Minerva SA (a) | 47,700 | 146,599 | |
| Smiles SA | 29,700 | 344,561 | |
| TOTAL BRAZIL | 1,818,346 | ||
| British Virgin Islands - 0.1% | |||
| Mail.Ru Group Ltd. GDR (Reg. S) (a) | 5,080 | 102,870 | |
| Canada - 0.6% | |||
| Goldcorp, Inc. | 3,600 | 72,534 | |
| Pan American Silver Corp. | 17,700 | 277,359 | |
| Torex Gold Resources, Inc. (a) | 44,300 | 78,735 | |
| TOTAL CANADA | 428,628 | ||
| Cayman Islands - 6.7% | |||
| 51job, Inc. sponsored ADR (a) | 3,100 | 92,380 | |
| 58.com, Inc. ADR (a) | 10,050 | 549,233 | |
| AAC Technology Holdings, Inc. | 11,000 | 76,351 | |
| Alibaba Group Holding Ltd. sponsored ADR (a) | 12,700 | 977,138 | |
| Autohome, Inc. ADR Class A (a) | 2,000 | 59,120 | |
| Bitauto Holdings Ltd. ADR (a) | 6,700 | 167,232 | |
| BizLink Holding, Inc. | 5,000 | 28,480 | |
| China State Construction International Holdings Ltd. | 84,000 | 130,847 | |
| CK Hutchison Holdings Ltd. | 8,770 | 104,921 | |
| Ctrip.com International Ltd. ADR (a) | 1,400 | 61,054 | |
| Haitian International Holdings Ltd. | 34,000 | 58,010 | |
| Himax Technologies, Inc. sponsored ADR | 4,100 | 42,599 | |
| JD.com, Inc. sponsored ADR (a) | 13,600 | 347,616 | |
| New Oriental Education & Technology Group, Inc. sponsored ADR | 3,100 | 121,396 | |
| Sino Biopharmaceutical Ltd. | 248,000 | 175,734 | |
| SouFun Holdings Ltd. ADR | 19,000 | 108,110 | |
| Sunny Optical Technology Group Co. Ltd. | 25,000 | 77,106 | |
| Tencent Holdings Ltd. | 51,750 | 1,053,025 | |
| Uni-President China Holdings Ltd. | 404,600 | 376,791 | |
| Vipshop Holdings Ltd. ADR (a) | 12,600 | 171,864 | |
| TOTAL CAYMAN ISLANDS | 4,779,007 | ||
| Chile - 1.0% | |||
| Compania Cervecerias Unidas SA sponsored ADR | 7,700 | 172,634 | |
| CorpBanca SA | 11,730,819 | 106,766 | |
| Empresas CMPC SA | 25,201 | 56,988 | |
| Enersis Chile SA | 316,233 | 38,579 | |
| Enersis SA | 352,800 | 60,833 | |
| Inversiones La Construccion SA | 9,283 | 109,456 | |
| Vina Concha y Toro SA | 93,580 | 156,841 | |
| TOTAL CHILE | 702,097 | ||
| China - 5.4% | |||
| Anhui Conch Cement Co. Ltd. (H Shares) | 78,000 | 205,535 | |
| BBMG Corp. (H Shares) | 224,500 | 164,071 | |
| China Life Insurance Co. Ltd. (H Shares) | 127,034 | 292,630 | |
| China Longyuan Power Grid Corp. Ltd. (H Shares) | 155,860 | 107,832 | |
| China Pacific Insurance (Group) Co. Ltd. (H Shares) | 138,106 | 484,261 | |
| China Petroleum & Chemical Corp. (H Shares) | 204,000 | 143,756 | |
| China Suntien Green Energy Corp. Ltd. (H Shares) | 328,690 | 37,395 | |
| China Telecom Corp. Ltd. (H Shares) | 334,449 | 165,574 | |
| Industrial & Commercial Bank of China Ltd. (H Shares) | 1,540,660 | 824,871 | |
| Inner Mongoli Yili Industries Co. Ltd. | 67,371 | 156,407 | |
| Kweichow Moutai Co. Ltd. | 8,040 | 311,961 | |
| Maanshan Iron & Steel Ltd. (H Shares) (a) | 296,000 | 68,021 | |
| PetroChina Co. Ltd. (H Shares) | 152,000 | 111,208 | |
| PICC Property & Casualty Co. Ltd. (H Shares) | 117,800 | 214,287 | |
| Qingdao Haier Co. Ltd. | 185,774 | 239,031 | |
| Shanghai International Airport Co. Ltd. | 19,900 | 83,638 | |
| Zhengzhou Yutong Bus Co. Ltd. | 37,500 | 118,801 | |
| Zhuzhou CSR Times Electric Co. Ltd. (H Shares) | 20,000 | 113,795 | |
| TOTAL CHINA | 3,843,074 | ||
| Colombia - 0.2% | |||
| Bancolombia SA sponsored ADR | 4,155 | 160,757 | |
| Egypt - 0.1% | |||
| Citadel Capital Corp. (a) | 141,500 | 23,583 | |
| Global Telecom Holding GDR (a) | 17,460 | 28,809 | |
| TOTAL EGYPT | 52,392 | ||
| Greece - 0.3% | |||
| Titan Cement Co. SA (Reg.) | 9,700 | 221,273 | |
| Hong Kong - 3.7% | |||
| AIA Group Ltd. | 34,320 | 205,392 | |
| China Mobile Ltd. | 16,610 | 190,696 | |
| China Mobile Ltd. sponsored ADR | 12,112 | 696,682 | |
| China Resources Beer Holdings Co. Ltd. | 104,000 | 228,531 | |
| China Resources Power Holdings Co. Ltd. | 64,189 | 108,110 | |
| CNOOC Ltd. | 441,000 | 544,777 | |
| CNOOC Ltd. sponsored ADR | 44 | 5,431 | |
| Far East Horizon Ltd. | 438,980 | 348,452 | |
| Sinotruk Hong Kong Ltd. | 154,000 | 77,544 | |
| Techtronic Industries Co. Ltd. | 55,000 | 206,177 | |
| TOTAL HONG KONG | 2,611,792 | ||
| India - 5.5% | |||
| Adani Ports & Special Economic Zone | 46,861 | 168,042 | |
| Axis Bank Ltd. (a) | 21,528 | 153,101 | |
| Bharti Infratel Ltd. | 36,476 | 205,895 | |
| Coal India Ltd. | 60,713 | 263,278 | |
| Edelweiss Financial Services Ltd. | 75,572 | 66,043 | |
| Eicher Motors Ltd. (a) | 468 | 141,156 | |
| Grasim Industries Ltd. | 3,510 | 226,465 | |
| Housing Development Finance Corp. Ltd. | 2,631 | 43,112 | |
| ITC Ltd. | 40,866 | 199,914 | |
| JK Cement Ltd. | 12,525 | 111,862 | |
| Just Dial Ltd. | 4,157 | 52,972 | |
| Larsen & Toubro Ltd. (a) | 7,910 | 149,399 | |
| LIC Housing Finance Ltd. (a) | 18,430 | 128,267 | |
| Lupin Ltd. | 14,104 | 341,264 | |
| Oil & Natural Gas Corp. Ltd. | 46,067 | 150,666 | |
| Petronet LNG Ltd. | 25,887 | 102,709 | |
| Phoenix Mills Ltd. | 23,725 | 114,686 | |
| Power Grid Corp. of India Ltd. | 140,906 | 304,189 | |
| SREI Infrastructure Finance Ltd. (a) | 116,223 | 104,018 | |
| State Bank of India (a) | 54,040 | 153,760 | |
| Sun Pharmaceutical Industries Ltd. | 31,005 | 378,685 | |
| Tata Consultancy Services Ltd. | 10,234 | 390,638 | |
| TOTAL INDIA | 3,950,121 | ||
| Indonesia - 0.5% | |||
| Link Net Tbk PT | 86,000 | 27,486 | |
| PT Bank Mandiri (Persero) Tbk | 176,150 | 128,048 | |
| PT Bank Rakyat Indonesia Tbk | 207,300 | 162,690 | |
| PT Kalbe Farma Tbk | 555,300 | 57,896 | |
| TOTAL INDONESIA | 376,120 | ||
| Israel - 0.4% | |||
| Bezeq The Israel Telecommunication Corp. Ltd. | 119,655 | 255,229 | |
| Japan - 0.2% | |||
| Rakuten, Inc. | 10,832 | 117,759 | |
| Korea (South) - 7.8% | |||
| AMOREPACIFIC Group, Inc. | 2,000 | 293,277 | |
| Daou Technology, Inc. | 5,064 | 103,430 | |
| Duk San Neolux Co. Ltd. (a) | 1,826 | 43,352 | |
| E-Mart Co. Ltd. | 1,187 | 190,119 | |
| EO Technics Co. Ltd. | 442 | 43,750 | |
| Fila Korea Ltd. | 2,435 | 221,040 | |
| Hanon Systems | 11,898 | 106,967 | |
| Hyundai Glovis Co. Ltd. | 2,043 | 338,813 | |
| Hyundai Industrial Development & Construction Co. | 3,241 | 142,859 | |
| Hyundai Mobis | 1,845 | 419,510 | |
| InterPark INT Corp. | 4,011 | 68,444 | |
| Kakao Corp. | 742 | 65,089 | |
| KB Financial Group, Inc. | 9,312 | 283,360 | |
| KEPCO Plant Service & Engineering Co. Ltd. | 1,426 | 93,973 | |
| Korea Electric Power Corp. | 3,805 | 205,551 | |
| Korean Reinsurance Co. | 21,509 | 249,695 | |
| KT Corp. | 2,253 | 60,021 | |
| KT Corp. sponsored ADR | 3,052 | 41,538 | |
| LG Chemical Ltd. | 1,202 | 311,601 | |
| NAVER Corp. | 171 | 101,047 | |
| NCSOFT Corp. | 726 | 145,114 | |
| Samsung Electronics Co. Ltd. | 648 | 704,179 | |
| Samsung Fire & Marine Insurance Co. Ltd. | 568 | 146,007 | |
| Samsung SDI Co. Ltd. | 1,310 | 130,351 | |
| Shinhan Financial Group Co. Ltd. | 14,142 | 515,690 | |
| SK Hynix, Inc. | 16,437 | 403,868 | |
| SK Telecom Co. Ltd. sponsored ADR | 4,250 | 85,000 | |
| Viatron Technologies, Inc. | 2,018 | 50,552 | |
| TOTAL KOREA (SOUTH) | 5,564,197 | ||
| Malaysia - 0.3% | |||
| Tenaga Nasional Bhd | 53,179 | 195,482 | |
| Mauritius - 0.1% | |||
| MakeMyTrip Ltd. (a) | 3,100 | 56,916 | |
| Mexico - 3.8% | |||
| America Movil S.A.B. de CV Series L sponsored ADR | 17,863 | 252,940 | |
| Banregio Grupo Financiero S.A.B. de CV | 9,480 | 56,810 | |
| CEMEX S.A.B. de CV sponsored ADR | 15,288 | 113,896 | |
| El Puerto de Liverpool S.A.B. de CV Class C | 19,700 | 223,935 | |
| Fibra Uno Administracion SA de CV | 119,360 | 284,167 | |
| Grupo Aeroportuario del Pacifico S.A.B. de CV Series B | 17,100 | 161,114 | |
| Grupo Comercial Chedraui S.A.B. de CV | 44,076 | 124,917 | |
| Grupo Financiero Banorte S.A.B. de CV Series O | 117,969 | 669,705 | |
| Infraestructura Energetica Nova S.A.B. de CV | 14,000 | 54,707 | |
| Macquarie Mexican (REIT) | 252,670 | 347,768 | |
| Promotora y Operadora de Infraestructura S.A.B. de CV | 6,200 | 78,629 | |
| Tenedora Nemak SA de CV | 64,900 | 93,099 | |
| Wal-Mart de Mexico SA de CV Series V | 94,100 | 232,725 | |
| TOTAL MEXICO | 2,694,412 | ||
| Netherlands - 0.7% | |||
| Cnova NV (a) | 5,550 | 19,425 | |
| Hangzhou Hikvision Digital Technology Co. Ltd. ELS (BNP Paribas Arbitrage Warrant Program) warrants 10/21/16 (a)(b) | 15,500 | 72,950 | |
| Yandex NV (a) | 19,517 | 399,513 | |
| TOTAL NETHERLANDS | 491,888 | ||
| Nigeria - 0.2% | |||
| Guaranty Trust Bank PLC GDR (Reg. S) | 11,980 | 41,930 | |
| Transnational Corp. of Nigeria PLC | 3,901,713 | 19,412 | |
| Zenith Bank PLC | 1,851,312 | 118,155 | |
| TOTAL NIGERIA | 179,497 | ||
| Pakistan - 0.2% | |||
| Habib Bank Ltd. | 96,700 | 174,336 | |
| Panama - 0.2% | |||
| Copa Holdings SA Class A | 2,200 | 140,250 | |
| Philippines - 0.9% | |||
| Alliance Global Group, Inc. | 547,150 | 168,676 | |
| Metro Pacific Investments Corp. | 459,100 | 56,613 | |
| Metropolitan Bank & Trust Co. | 124,721 | 215,448 | |
| Robinsons Land Corp. | 363,980 | 209,713 | |
| TOTAL PHILIPPINES | 650,450 | ||
| Romania - 0.1% | |||
| Banca Transilvania SA | 89,698 | 61,556 | |
| Russia - 3.4% | |||
| E.ON Russia JSC (a) | 1,584,700 | 64,565 | |
| Lukoil PJSC sponsored ADR | 13,700 | 580,675 | |
| Magnit OJSC GDR (Reg. S) | 5,500 | 190,300 | |
| MMC Norilsk Nickel PJSC sponsored ADR | 19,900 | 293,525 | |
| Mobile TeleSystems OJSC (a) | 33,812 | 132,204 | |
| Mobile TeleSystems OJSC sponsored ADR | 1,940 | 17,964 | |
| NOVATEK OAO GDR (Reg. S) | 3,000 | 288,000 | |
| Rosneft Oil Co. OJSC (a) | 55,500 | 300,753 | |
| Sberbank of Russia (a) | 67,580 | 129,019 | |
| Sberbank of Russia sponsored ADR | 39,884 | 319,710 | |
| Sistema JSFC (a) | 240,200 | 72,128 | |
| Sistema JSFC sponsored GDR | 2,860 | 21,021 | |
| TOTAL RUSSIA | 2,409,864 | ||
| Singapore - 0.7% | |||
| Ascendas Real Estate Investment Trust | 135,310 | 247,509 | |
| CapitaMall Trust | 54,800 | 84,348 | |
| First Resources Ltd. | 103,200 | 146,184 | |
| TOTAL SINGAPORE | 478,041 | ||
| South Africa - 4.2% | |||
| Alexander Forbes Group Holdings Ltd. (c) | 126,689 | 63,900 | |
| Aspen Pharmacare Holdings Ltd. | 7,141 | 168,291 | |
| Barclays Africa Group Ltd. (d) | 25,640 | 259,908 | |
| Bidvest Group Ltd. | 8,056 | 204,455 | |
| Imperial Holdings Ltd. | 18,800 | 196,819 | |
| JSE Ltd. | 6,910 | 80,098 | |
| Life Healthcare Group Holdings Ltd. | 53,600 | 140,785 | |
| Naspers Ltd. Class N | 10,554 | 1,448,115 | |
| Nedbank Group Ltd. | 8,080 | 103,361 | |
| Sasol Ltd. | 4,000 | 130,841 | |
| Shoprite Holdings Ltd. (c) | 9,551 | 114,885 | |
| Telkom SA Ltd. | 23,762 | 94,612 | |
| TOTAL SOUTH AFRICA | 3,006,070 | ||
| Spain - 0.2% | |||
| Banco Bilbao Vizcaya Argentaria SA | 25,681 | 176,475 | |
| Taiwan - 4.4% | |||
| Advanced Semiconductor Engineering, Inc. | 98,000 | 94,153 | |
| Advantech Co. Ltd. | 25,000 | 176,454 | |
| Boardtek Electronics Corp. | 36,000 | 51,710 | |
| Catcher Technology Co. Ltd. | 13,000 | 91,354 | |
| E.SUN Financial Holdings Co. Ltd. | 252,546 | 139,943 | |
| Hermes Microvision, Inc. | 1,000 | 30,802 | |
| Hon Hai Precision Industry Co. Ltd. (Foxconn) | 29,555 | 70,541 | |
| HTC Corp. | 22,000 | 56,119 | |
| Inotera Memories, Inc. (a) | 29,000 | 26,304 | |
| King's Town Bank | 96,600 | 67,285 | |
| Kingpak Technology, Inc. (a) | 5,000 | 48,757 | |
| Largan Precision Co. Ltd. | 1,833 | 128,809 | |
| MediaTek, Inc. | 5,000 | 35,600 | |
| Siliconware Precision Industries Co. Ltd. | 25,000 | 36,958 | |
| Taiwan Cement Corp. | 270,000 | 274,990 | |
| Taiwan Fertilizer Co. Ltd. | 44,000 | 59,728 | |
| Taiwan Semiconductor Manufacturing Co. Ltd. | 324,000 | 1,486,264 | |
| Taiwan Semiconductor Manufacturing Co. Ltd. sponsored ADR | 1,642 | 38,735 | |
| Universal Cement Corp. | 66,654 | 42,609 | |
| Vanguard International Semiconductor Corp. | 38,000 | 58,171 | |
| Wistron NeWeb Corp. | 19,000 | 49,407 | |
| Yuanta Financial Holding Co. Ltd. | 247,231 | 81,510 | |
| TOTAL TAIWAN | 3,146,203 | ||
| Thailand - 1.8% | |||
| Advanced Info Service PCL (For. Reg.) | 12,640 | 56,467 | |
| Airports of Thailand PCL (For. Reg.) | 14,500 | 162,772 | |
| Intouch Holdings PCL NVDR | 30,250 | 45,696 | |
| Jasmine Broadband Internet Infrastructure Fund | 223,390 | 60,134 | |
| Kasikornbank PCL (For. Reg.) | 74,080 | 354,277 | |
| PTT Global Chemical PCL (For. Reg.) | 50,600 | 90,564 | |
| PTT PCL (For. Reg.) | 25,700 | 223,734 | |
| Star Petroleum Refining PCL | 253,300 | 79,791 | |
| Thai Union Frozen Products PCL (For. Reg.) | 321,800 | 190,758 | |
| TOTAL THAILAND | 1,264,193 | ||
| Turkey - 0.9% | |||
| Aselsan A/S | 14,000 | 99,871 | |
| Enka Insaat ve Sanayi A/S | 46,000 | 79,900 | |
| Tupras Turkiye Petrol Rafinelleri A/S | 7,900 | 208,511 | |
| Turkiye Garanti Bankasi A/S | 53,674 | 165,220 | |
| Turkiye Halk Bankasi A/S | 25,980 | 99,816 | |
| TOTAL TURKEY | 653,318 | ||
| United Arab Emirates - 0.7% | |||
| DP World Ltd. | 7,270 | 137,403 | |
| Emaar Properties PJSC | 95,651 | 177,088 | |
| First Gulf Bank PJSC | 53,346 | 188,089 | |
| TOTAL UNITED ARAB EMIRATES | 502,580 | ||
| United Kingdom - 0.3% | |||
| Fresnillo PLC | 10,600 | 172,384 | |
| HSBC Holdings PLC (Hong Kong) | 10,995 | 73,189 | |
| TOTAL UNITED KINGDOM | 245,573 | ||
| United States of America - 0.5% | |||
| Cognizant Technology Solutions Corp. Class A (a) | 2,420 | 141,255 | |
| First Cash Financial Services, Inc. | 2,549 | 116,566 | |
| Micron Technology, Inc. (a) | 8,700 | 93,525 | |
| TOTAL UNITED STATES OF AMERICA | 351,346 | ||
| TOTAL COMMON STOCKS | |||
| (Cost $40,006,021) | 42,976,979 | ||
| Nonconvertible Preferred Stocks - 4.0% | |||
| Brazil - 3.1% | |||
| Ambev SA sponsored ADR | 100,500 | 561,795 | |
| Banco do Estado Rio Grande do Sul SA | 25,820 | 63,888 | |
| Companhia Paranaense de Energia-Copel: | |||
| (PN-B) | 615 | 5,062 | |
| (PN-B) sponsored ADR | 13,122 | 108,519 | |
| Itau Unibanco Holding SA sponsored ADR | 67,638 | 644,590 | |
| Metalurgica Gerdau SA (PN) | 100,570 | 85,094 | |
| Petroleo Brasileiro SA - Petrobras (PN) sponsored (non-vtg.) (a) | 44,106 | 260,225 | |
| Telefonica Brasil SA | 9,537 | 117,464 | |
| Vale SA (PN-A) sponsored ADR | 74,300 | 337,322 | |
| TOTAL BRAZIL | 2,183,959 | ||
| Korea (South) - 0.9% | |||
| Hyundai Motor Co. Series 2 | 3,119 | 271,969 | |
| Samsung Electronics Co. Ltd. | 295 | 268,562 | |
| Samsung Fire & Marine Insurance Co. Ltd. | 717 | 117,343 | |
| TOTAL KOREA (SOUTH) | 657,874 | ||
| TOTAL NONCONVERTIBLE PREFERRED STOCKS | |||
| (Cost $2,875,342) | 2,841,833 | ||
| Principal Amount | Value | ||
| Nonconvertible Bonds - 14.6% | |||
| Azerbaijan - 1.3% | |||
| International Bank of Azerbaijan OJSC 5.625% 6/11/19 (Reg. S) | 200,000 | 188,600 | |
| Southern Gas Corridor CJSC 6.875% 3/24/26 (b) | 200,000 | 205,550 | |
| State Oil Co. of Azerbaijan Republic: | |||
| 4.75% 3/13/23 (Reg. S) | 325,000 | 292,050 | |
| 6.95% 3/18/30 (Reg. S) | 275,000 | 261,938 | |
| TOTAL AZERBAIJAN | 948,138 | ||
| Canada - 0.0% | |||
| Pacific Rubiales Energy Corp. 5.125% 3/28/23 (b)(e) | 100,000 | 14,750 | |
| Colombia - 0.1% | |||
| Ecopetrol SA 7.375% 9/18/43 | 100,000 | 92,813 | |
| Georgia - 0.7% | |||
| Georgian Oil & Gas Corp.: | |||
| 6.75% 4/26/21 (b) | 250,000 | 251,300 | |
| 6.875% 5/16/17 (b) | 250,000 | 251,855 | |
| TOTAL GEORGIA | 503,155 | ||
| Indonesia - 2.2% | |||
| PT Pertamina Persero: | |||
| 4.875% 5/3/22 (b) | 275,000 | 283,452 | |
| 5.25% 5/23/21 (b) | 200,000 | 210,232 | |
| 5.625% 5/20/43 (b) | 200,000 | 184,581 | |
| 6% 5/3/42 (b) | 400,000 | 383,910 | |
| 6.5% 5/27/41 (b) | 475,000 | 484,377 | |
| TOTAL INDONESIA | 1,546,552 | ||
| Ireland - 0.2% | |||
| Vnesheconombank Via VEB Finance PLC 6.8% 11/22/25 (b) | 100,000 | 104,625 | |
| Kazakhstan - 0.9% | |||
| Kazagro National Management Holding JSC 4.625% 5/24/23 (b) | 400,000 | 334,024 | |
| KazMunaiGaz Finance Sub BV 9.125% 7/2/18 (b) | 300,000 | 328,500 | |
| TOTAL KAZAKHSTAN | 662,524 | ||
| Luxembourg - 2.0% | |||
| Petrobras International Finance Co. Ltd.: | |||
| 3.5% 2/6/17 | 200,000 | 198,030 | |
| 5.375% 1/27/21 | 530,000 | 471,038 | |
| 8.375% 12/10/18 | 300,000 | 309,000 | |
| RSHB Capital SA 5.1% 7/25/18 (b) | 400,000 | 411,280 | |
| TOTAL LUXEMBOURG | 1,389,348 | ||
| Mexico - 2.2% | |||
| Pemex Project Funding Master Trust 6.625% 6/15/35 | 350,000 | 355,250 | |
| Petroleos Mexicanos: | |||
| 6.5% 6/2/41 | 425,000 | 424,150 | |
| 6.625% (b)(f) | 850,000 | 809,625 | |
| TOTAL MEXICO | 1,589,025 | ||
| Netherlands - 0.7% | |||
| Petrobras Global Finance BV: | |||
| 6.85% 6/5/2115 | 215,000 | 159,100 | |
| 7.25% 3/17/44 | 400,000 | 324,000 | |
| TOTAL NETHERLANDS | 483,100 | ||
| South Africa - 0.4% | |||
| Eskom Holdings SOC Ltd. 6.75% 8/6/23 (b) | 300,000 | 282,375 | |
| Trinidad & Tobago - 0.8% | |||
| Petroleum Co. of Trinidad & Tobago Ltd.: | |||
| 6% 5/8/22 (b) | 262,708 | 246,158 | |
| 9.75% 8/14/19 (b) | 300,000 | 312,900 | |
| TOTAL TRINIDAD & TOBAGO | 559,058 | ||
| Turkey - 0.3% | |||
| Turk Sise ve Cam Fabrikalari A/S 4.25% 5/9/20 (Reg. S) | 200,000 | 199,498 | |
| United Arab Emirates - 0.1% | |||
| DP World Ltd. 6.85% 7/2/37 (Reg. S) | 100,000 | 103,686 | |
| United Kingdom - 0.8% | |||
| Biz Finance PLC 9.625% 4/27/22 (b) | 600,000 | 555,120 | |
| Venezuela - 1.9% | |||
| Petroleos de Venezuela SA: | |||
| 5.25% 4/12/17 | 300,000 | 164,250 | |
| 5.5% 4/12/37 | 500,000 | 176,200 | |
| 6% 11/15/26 (Reg. S) | 1,200,000 | 410,280 | |
| 8.5% 11/2/17 (b) | 166,667 | 97,500 | |
| 9% 11/17/21 (Reg. S) | 550,000 | 216,425 | |
| 12.75% 2/17/22 (b) | 600,000 | 279,000 | |
| TOTAL VENEZUELA | 1,343,655 | ||
| TOTAL NONCONVERTIBLE BONDS | |||
| (Cost $11,036,167) | 10,377,422 | ||
| Government Obligations - 14.6% | |||
| Angola - 0.3% | |||
| Angola Republic 9.5% 11/12/25 (b) | 200,000 | 195,260 | |
| Argentina - 1.4% | |||
| Argentine Republic: | |||
| 6.25% 4/22/19 (b) | 150,000 | 155,550 | |
| 6.875% 4/22/21 (b) | 170,000 | 175,100 | |
| 7.5% 4/22/26 (b) | 185,000 | 187,775 | |
| 7.625% 4/22/46 (b) | 150,000 | 147,525 | |
| 8.28% 12/31/33 | 315,459 | 330,443 | |
| TOTAL ARGENTINA | 996,393 | ||
| Armenia - 0.5% | |||
| Republic of Armenia 6% 9/30/20 (b) | 325,000 | 324,220 | |
| Barbados - 0.3% | |||
| Barbados Government 7% 8/4/22 (b) | 250,000 | 245,750 | |
| Brazil - 0.4% | |||
| Brazilian Federative Republic: | |||
| 5% 1/27/45 | 200,000 | 161,500 | |
| 12.25% 3/6/30 | 100,000 | 155,500 | |
| TOTAL BRAZIL | 317,000 | ||
| Cameroon - 0.3% | |||
| Cameroon Republic 9.5% 11/19/25 (b) | 200,000 | 195,760 | |
| Colombia - 0.6% | |||
| Colombian Republic: | |||
| 6.125% 1/18/41 | 100,000 | 107,250 | |
| 7.375% 9/18/37 | 250,000 | 301,875 | |
| TOTAL COLOMBIA | 409,125 | ||
| Congo - 0.3% | |||
| Congo Republic 4% 6/30/29 (g) | 292,600 | 209,958 | |
| Costa Rica - 0.5% | |||
| Costa Rican Republic: | |||
| 4.375% 4/30/25 (b) | 225,000 | 200,250 | |
| 7.158% 3/12/45 (b) | 200,000 | 186,500 | |
| TOTAL COSTA RICA | 386,750 | ||
| Croatia - 0.7% | |||
| Croatia Republic 6% 1/26/24 (b) | 450,000 | 492,188 | |
| Dominican Republic - 0.6% | |||
| Dominican Republic 6.6% 1/28/24 (b) | 375,000 | 401,250 | |
| Ecuador - 0.2% | |||
| Ecuador Republic 7.95% 6/20/24 (b) | 200,000 | 173,500 | |
| El Salvador - 0.2% | |||
| El Salvador Republic 7.625% 2/1/41 (b) | 150,000 | 131,625 | |
| Ethiopia - 0.3% | |||
| Federal Democratic Republic of Ethiopia 6.625% 12/11/24 (b) | 200,000 | 181,500 | |
| Gabon - 0.2% | |||
| Gabonese Republic 6.375% 12/12/24 (b) | 200,000 | 174,724 | |
| Ghana - 0.5% | |||
| Ghana Republic: | |||
| 7.875% 8/7/23 (Reg.S) | 200,000 | 159,540 | |
| 10.75% 10/14/30 (b) | 200,000 | 196,760 | |
| TOTAL GHANA | 356,300 | ||
| Iraq - 0.2% | |||
| Republic of Iraq 5.8% 1/15/28 (Reg. S) | 250,000 | 177,525 | |
| Ivory Coast - 0.3% | |||
| Ivory Coast 5.375% 7/23/24 (b) | 200,000 | 184,500 | |
| Jamaica - 0.2% | |||
| Jamaican Government 8% 6/24/19 | 150,000 | 163,313 | |
| Jordan - 0.3% | |||
| Jordanian Kingdom 6.125% 1/29/26 (b) | 200,000 | 211,250 | |
| Kenya - 0.3% | |||
| Republic of Kenya 6.875% 6/24/24 (b) | 200,000 | 188,020 | |
| Lebanon - 0.2% | |||
| Lebanese Republic 6.1% 10/4/22 | 150,000 | 148,782 | |
| Mongolia - 0.2% | |||
| Mongolian People's Republic 5.125% 12/5/22 (Reg. S) | 200,000 | 157,796 | |
| Mozambique - 0.2% | |||
| Mozambique Republic 10.5% 1/18/23 (b) | 200,000 | 163,000 | |
| Pakistan - 0.3% | |||
| Islamic Republic of Pakistan 7.25% 4/15/19 (b) | 200,000 | 209,715 | |
| Russia - 1.7% | |||
| Russian Federation: | |||
| 5% 4/29/20 (b) | 225,000 | 237,915 | |
| 5.625% 4/4/42 (b) | 200,000 | 210,354 | |
| 12.75% 6/24/28 (Reg. S) | 425,000 | 730,159 | |
| TOTAL RUSSIA | 1,178,428 | ||
| Senegal - 0.3% | |||
| Republic of Senegal 8.75% 5/13/21 (b) | 200,000 | 217,040 | |
| Tanzania - 0.2% | |||
| United Republic of Tanzania 6.8921% 3/9/20 (h) | 177,778 | 180,445 | |
| Turkey - 1.0% | |||
| Turkish Republic: | |||
| 6.875% 3/17/36 | 100,000 | 119,125 | |
| 7% 6/5/20 | 250,000 | 284,243 | |
| 11.875% 1/15/30 | 165,000 | 284,460 | |
| TOTAL TURKEY | 687,828 | ||
| Ukraine - 0.2% | |||
| Ukraine Government 0% 5/31/40 (b)(h) | 430,000 | 134,285 | |
| United States of America - 0.4% | |||
| U.S. Treasury Bills, yield at date of purchase 0.29% to 0.32% 5/19/16 to 6/23/16 (i) | 280,000 | 279,951 | |
| Venezuela - 1.1% | |||
| Venezuelan Republic: | |||
| 7% 3/31/38 | 650,000 | 232,375 | |
| 9% 5/7/23 (Reg. S) | 300,000 | 114,375 | |
| 9.25% 9/15/27 | 650,000 | 277,063 | |
| 12.75% 8/23/22 | 325,000 | 150,719 | |
| TOTAL VENEZUELA | 774,532 | ||
| Zambia - 0.2% | |||
| Republic of Zambia 8.97% 7/30/27 (b) | 200,000 | 165,000 | |
| TOTAL GOVERNMENT OBLIGATIONS | |||
| (Cost $10,810,800) | 10,412,713 | ||
| Preferred Securities - 0.3% | |||
| Cayman Islands - 0.2% | |||
| Banco Do Brasil SA 9% (b)(f)(h) | 200,000 | 150,139 | |
| Colombia - 0.1% | |||
| Colombia Telecomunicacines SA 8.5% (b)(f)(h) | 100,000 | 89,739 | |
| TOTAL PREFERRED SECURITIES | |||
| (Cost $228,131) | 239,878 | ||
| Shares | Value | ||
| Money Market Funds - 6.0% | |||
| Fidelity Cash Central Fund, 0.38% (j) | |||
| (Cost $4,255,911) | 4,255,911 | 4,255,911 | |
| TOTAL INVESTMENT PORTFOLIO - 99.8% | |||
| (Cost $69,212,372) | 71,104,736 | ||
| NET OTHER ASSETS (LIABILITIES) - 0.2% | 139,079 | ||
| NET ASSETS - 100% | $71,243,815 |
| Futures Contracts | |||
| Expiration Date | Underlying Face Amount at Value | Unrealized Appreciation/(Depreciation) | |
| Purchased | |||
| Equity Index Contracts | |||
| 54 ICE E-mini MSCI Emerging Markets Index Contracts (United States) | June 2016 | 2,263,680 | $(20,655) |
The face value of futures purchased as a percentage of Net Assets is 3.2%
For the period, the average monthly underlying face amount at value for futures contracts in the aggregate was $1,146,512.
Security Type Abbreviations
ELS – Equity-Linked Security
Categorizations in the Schedule of Investments are based on country or territory of incorporation.
Legend
(a) Non-income producing
(b) Security exempt from registration under Rule 144A of the Securities Act of 1933. These securities may be resold in transactions exempt from registration, normally to qualified institutional buyers. At the end of the period, the value of these securities amounted to $12,030,258 or 16.9% of net assets.
(c) Security or a portion of the security purchased on a delayed delivery or when-issued basis.
(d) A portion of the security sold on a delayed delivery basis.
(e) Non-income producing - Security is in default.
(f) Security is perpetual in nature with no stated maturity date.
(g) Security initially issued at one coupon which converts to a higher coupon at a specified date. The rate shown is the rate at period end.
(h) Coupon rates for floating and adjustable rate securities reflect the rates in effect at period end.
(i) Security or a portion of the security was pledged to cover margin requirements for futures contracts. At period end, the value of securities pledged amounted to $129,976.
(j) Affiliated fund that is generally available only to investment companies and other accounts managed by Fidelity Investments. The rate quoted is the annualized seven-day yield of the fund at period end. A complete unaudited listing of the fund's holdings as of its most recent quarter end is available upon request. In addition, each Fidelity Central Fund's financial statements are available on the SEC's website or upon request.
Affiliated Central Funds
Information regarding fiscal year to date income earned by the Fund from investments in Fidelity Central Funds is as follows:
| Fund | Income earned |
| Fidelity Cash Central Fund | $3,649 |
| Total | $3,649 |
Investment Valuation
The following is a summary of the inputs used, as of April 30, 2016, involving the Fund's assets and liabilities carried at fair value. The inputs or methodology used for valuing securities may not be an indication of the risk associated with investing in those securities. For more information on valuation inputs, and their aggregation into the levels used below, please refer to the Investment Valuation section in the accompanying Notes to Financial Statements.
| Valuation Inputs at Reporting Date: | ||||
| Description | Total | Level 1 | Level 2 | Level 3 |
| Investments in Securities: | ||||
| Equities: | ||||
| Consumer Discretionary | $5,258,501 | $4,614,494 | $644,007 | $-- |
| Consumer Staples | 3,794,638 | 3,189,316 | 605,322 | -- |
| Energy | 3,672,597 | 2,704,620 | 967,977 | -- |
| Financials | 12,054,266 | 8,140,422 | 3,913,844 | -- |
| Health Care | 1,262,655 | 1,086,921 | 175,734 | -- |
| Industrials | 3,229,566 | 2,744,449 | 485,117 | -- |
| Information Technology | 9,198,494 | 6,249,248 | 2,949,246 | -- |
| Materials | 3,367,091 | 2,481,726 | 885,365 | -- |
| Telecommunication Services | 2,648,558 | 2,100,063 | 548,495 | -- |
| Utilities | 1,332,446 | 910,953 | 421,493 | -- |
| Corporate Bonds | 10,377,422 | -- | 10,377,422 | -- |
| Government Obligations | 10,412,713 | -- | 10,412,713 | -- |
| Preferred Securities | 239,878 | -- | 239,878 | -- |
| Money Market Funds | 4,255,911 | 4,255,911 | -- | -- |
| Total Investments in Securities: | $71,104,736 | $38,478,123 | $32,626,613 | $-- |
| Derivative Instruments: | ||||
| Liabilities | ||||
| Futures Contracts | $(20,655) | $(20,655) | $-- | $-- |
| Total Liabilities | $(20,655) | $(20,655) | $-- | $-- |
| Total Derivative Instruments: | $(20,655) | $(20,655) | $-- | $-- |
The following is a summary of transfers between Level 1 and Level 2 for the period ended April 30, 2016. Transfers are assumed to have occurred at the beginning of the period, and are primarily attributable to the valuation techniques used for foreign equity securities, as discussed in the accompanying Notes to Financial Statements:
| Transfers | Total |
| Level 1 to Level 2 | $162,341 |
| Level 2 to Level 1 | $5,630,433 |
Value of Derivative Instruments
The following table is a summary of the Fund's value of derivative instruments by primary risk exposure as of April 30, 2016. For additional information on derivative instruments, please refer to the Derivative Instruments section in the accompanying Notes to Financial Statements.
| Primary Risk Exposure / Derivative Type | Value | |
| Asset | Liability | |
| Equity Risk | ||
| Futures Contracts(a) | $0 | $(20,655) |
| Total Equity Risk | 0 | (20,655) |
| Total Value of Derivatives | $0 | $(20,655) |
(a) Reflects gross cumulative appreciation (depreciation) on futures contracts as presented in the Schedule of Investments. In the Statement of Assets and Liabilities, the period end daily variation margin is included in receivable or payable for daily variation margin for derivative instruments, and the net cumulative appreciation (depreciation) is included in net unrealized appreciation (depreciation).
Other Information
The composition of credit quality ratings as a percentage of Total Net Assets is as follows (Unaudited):
| BBB | 6.6% |
| BB | 8.2% |
| B | 8.4% |
| CCC,CC,C | 3.8% |
| Not Rated | 2.1% |
| Equities | 64.3% |
| Short-Term Investments and Net Other Assets | 6.6% |
| 100.0% |
We have used ratings from Moody's Investors Service, Inc. Where Moody's® ratings are not available, we have used S&P® ratings. All ratings are as of the date indicated and do not reflect subsequent changes.
See accompanying notes which are an integral part of the financial statements.
Fidelity® Total Emerging Markets Fund
Financial Statements
Statement of Assets and Liabilities
| April 30, 2016 (Unaudited) | ||
| Assets | ||
| Investment in securities, at value — See accompanying schedule: Unaffiliated issuers (cost $64,956,461) | $66,848,825 | |
| Fidelity Central Funds (cost $4,255,911) | 4,255,911 | |
| Total Investments (cost $69,212,372) | $71,104,736 | |
| Cash | 96,849 | |
| Foreign currency held at value (cost $84,060) | 84,095 | |
| Receivable for investments sold | ||
| Regular delivery | 196,038 | |
| Delayed delivery | 5,021 | |
| Receivable for fund shares sold | 584,193 | |
| Dividends receivable | 41,415 | |
| Interest receivable | 448,185 | |
| Distributions receivable from Fidelity Central Funds | 735 | |
| Prepaid expenses | 57 | |
| Receivable from investment adviser for expense reductions | 24,578 | |
| Other receivables | 85,356 | |
| Total assets | 72,671,258 | |
| Liabilities | ||
| Payable for investments purchased | ||
| Regular delivery | $1,039,039 | |
| Delayed delivery | 31,664 | |
| Payable for fund shares redeemed | 182,047 | |
| Accrued management fee | 44,979 | |
| Distribution and service plan fees payable | 9,024 | |
| Payable for daily variation margin for derivative instruments | 12,354 | |
| Other affiliated payables | 17,432 | |
| Other payables and accrued expenses | 90,904 | |
| Total liabilities | 1,427,443 | |
| Net Assets | $71,243,815 | |
| Net Assets consist of: | ||
| Paid in capital | $72,223,458 | |
| Undistributed net investment income | 796,595 | |
| Accumulated undistributed net realized gain (loss) on investments and foreign currency transactions | (3,645,165) | |
| Net unrealized appreciation (depreciation) on investments and assets and liabilities in foreign currencies | 1,868,927 | |
| Net Assets | $71,243,815 | |
| Calculation of Maximum Offering Price | ||
| Class A: | ||
| Net Asset Value and redemption price per share ($9,739,977 ÷ 946,836 shares) | $10.29 | |
| Maximum offering price per share (100/94.25 of $10.29) | $10.92 | |
| Class T: | ||
| Net Asset Value and redemption price per share ($2,602,344 ÷ 252,697 shares) | $10.30 | |
| Maximum offering price per share (100/96.50 of $10.30) | $10.67 | |
| Class C: | ||
| Net Asset Value and offering price per share ($7,363,066 ÷ 717,907 shares)(a) | $10.26 | |
| Total Emerging Markets: | ||
| Net Asset Value, offering price and redemption price per share ($47,144,250 ÷ 4,583,390 shares) | $10.29 | |
| Class I: | ||
| Net Asset Value, offering price and redemption price per share ($4,394,178 ÷ 427,606 shares) | $10.28 |
(a) Redemption price per share is equal to net asset value less any applicable contingent deferred sales charge.
See accompanying notes which are an integral part of the financial statements.
Statement of Operations
| Six months ended April 30, 2016 (Unaudited) | ||
| Investment Income | ||
| Dividends | $389,416 | |
| Interest | 1,118,515 | |
| Income from Fidelity Central Funds | 3,649 | |
| Income before foreign taxes withheld | 1,511,580 | |
| Less foreign taxes withheld | (41,195) | |
| Total income | 1,470,385 | |
| Expenses | ||
| Management fee | $257,316 | |
| Transfer agent fees | 89,622 | |
| Distribution and service plan fees | 53,784 | |
| Accounting fees and expenses | 16,678 | |
| Custodian fees and expenses | 115,562 | |
| Independent trustees' compensation | 139 | |
| Registration fees | 30,565 | |
| Audit | 58,674 | |
| Legal | 74 | |
| Miscellaneous | 1,246 | |
| Total expenses before reductions | 623,660 | |
| Expense reductions | (119,256) | 504,404 |
| Net investment income (loss) | 965,981 | |
| Realized and Unrealized Gain (Loss) | ||
| Net realized gain (loss) on: | ||
| Investment securities: | ||
| Unaffiliated issuers | (1,705,939) | |
| Foreign currency transactions | 27,019 | |
| Futures contracts | (199,083) | |
| Total net realized gain (loss) | (1,878,003) | |
| Change in net unrealized appreciation (depreciation) on: Investment securities (net of decrease in deferred foreign taxes of $2,203) | 2,049,760 | |
| Assets and liabilities in foreign currencies | 175 | |
| Futures contracts | (42,773) | |
| Total change in net unrealized appreciation (depreciation) | 2,007,162 | |
| Net gain (loss) | 129,159 | |
| Net increase (decrease) in net assets resulting from operations | $1,095,140 |
See accompanying notes which are an integral part of the financial statements.
Statement of Changes in Net Assets
| Six months ended April 30, 2016 (Unaudited) | Year ended October 31, 2015 | |
| Increase (Decrease) in Net Assets | ||
| Operations | ||
| Net investment income (loss) | $965,981 | $1,845,806 |
| Net realized gain (loss) | (1,878,003) | (1,339,969) |
| Change in net unrealized appreciation (depreciation) | 2,007,162 | (7,213,595) |
| Net increase (decrease) in net assets resulting from operations | 1,095,140 | (6,707,758) |
| Distributions to shareholders from net investment income | (1,715,467) | (1,198,750) |
| Distributions to shareholders from net realized gain | – | (136,019) |
| Total distributions | (1,715,467) | (1,334,769) |
| Share transactions - net increase (decrease) | 6,358,083 | (6,024,786) |
| Redemption fees | 13,218 | 16,471 |
| Total increase (decrease) in net assets | 5,750,974 | (14,050,842) |
| Net Assets | ||
| Beginning of period | 65,492,841 | 79,543,683 |
| End of period (including undistributed net investment income of $796,595 and undistributed net investment income of $1,546,081, respectively) | $71,243,815 | $65,492,841 |
See accompanying notes which are an integral part of the financial statements.
Financial Highlights — Fidelity Total Emerging Markets Fund Class A
| Six months ended (Unaudited) April 30, | Years ended October 31, | ||||
| 2016 | 2015 | 2014 | 2013 | 2012 A | |
| Selected Per–Share Data | |||||
| Net asset value, beginning of period | $10.35 | $11.56 | $11.37 | $10.86 | $10.00 |
| Income from Investment Operations | |||||
| Net investment income (loss)B | .14 | .28 | .18 | .18 | .20 |
| Net realized and unrealized gain (loss) | .04 | (1.30) | .19 | .48 | .68 |
| Total from investment operations | .18 | (1.02) | .37 | .66 | .88 |
| Distributions from net investment income | (.24) | (.17) | (.18) | (.15) | (.02) |
| Distributions from net realized gain | – | (.02) | – | (.01) | – |
| Total distributions | (.24) | (.19) | (.18) | (.16) | (.02) |
| Redemption fees added to paid in capitalB | –C | –C | –C | .01 | –C |
| Net asset value, end of period | $10.29 | $10.35 | $11.56 | $11.37 | $10.86 |
| Total ReturnD,E,F | 1.84% | (8.92)% | 3.30% | 6.23% | 8.80% |
| Ratios to Average Net AssetsG,H | |||||
| Expenses before reductions | 2.00%I | 1.93% | 1.98% | 1.89% | 1.87% |
| Expenses net of fee waivers, if any | 1.65%I | 1.65% | 1.65% | 1.65% | 1.65% |
| Expenses net of all reductions | 1.65%I | 1.64% | 1.65% | 1.62% | 1.62% |
| Net investment income (loss) | 2.91%I | 2.58% | 1.61% | 1.61% | 1.92% |
| Supplemental Data | |||||
| Net assets, end of period (000 omitted) | $9,740 | $10,164 | $13,627 | $18,837 | $7,675 |
| Portfolio turnover rateJ | 93%I | 80% | 102% | 120% | 70% |
A For the period November 1, 2011 (commencement of operations) to October 31, 2012.
B Calculated based on average shares outstanding during the period.
C Amount represents less than $.005 per share.
D Total returns for periods of less than one year are not annualized.
E Total returns would have been lower if certain expenses had not been reduced during the applicable periods shown.
F Total returns do not include the effect of the sales charges.
G Fees and expenses of any underlying Fidelity Central Funds are not included in the Fund's expense ratio. The Fund indirectly bears its proportionate share of the expenses of any underlying Fidelity Central Funds.
H Expense ratios reflect operating expenses of the class. Expenses before reductions do not reflect amounts reimbursed by the investment adviser or reductions from brokerage service arrangements or reductions from other expense offset arrangements and do not represent the amount paid by the class during periods when reimbursements or reductions occur. Expense ratios before reductions for start-up periods may not be representative of longer-term operating periods. Expenses net of fee waivers reflect expenses after reimbursement by the investment adviser but prior to reductions from brokerage service arrangements or other expense offset arrangements. Expenses net of all reductions represent the net expenses paid by the class.
I Annualized
J Amount does not include the portfolio activity of any underlying Fidelity Central Funds.
See accompanying notes which are an integral part of the financial statements.
Financial Highlights — Fidelity Total Emerging Markets Fund Class T
| Six months ended (Unaudited) April 30, | Years ended October 31, | ||||
| 2016 | 2015 | 2014 | 2013 | 2012 A | |
| Selected Per–Share Data | |||||
| Net asset value, beginning of period | $10.33 | $11.54 | $11.34 | $10.84 | $10.00 |
| Income from Investment Operations | |||||
| Net investment income (loss)B | .13 | .25 | .15 | .15 | .17 |
| Net realized and unrealized gain (loss) | .04 | (1.30) | .19 | .48 | .68 |
| Total from investment operations | .17 | (1.05) | .34 | .63 | .85 |
| Distributions from net investment income | (.20) | (.14) | (.14) | (.12) | (.01) |
| Distributions from net realized gain | – | (.02) | – | (.01) | – |
| Total distributions | (.20) | (.16) | (.14) | (.14)C | (.01) |
| Redemption fees added to paid in capitalB | –D | –D | –D | .01 | –D |
| Net asset value, end of period | $10.30 | $10.33 | $11.54 | $11.34 | $10.84 |
| Total ReturnE,F,G | 1.74% | (9.18)% | 3.04% | 5.93% | 8.56% |
| Ratios to Average Net AssetsH,I | |||||
| Expenses before reductions | 2.33%J | 2.27% | 2.32% | 2.13% | 2.10% |
| Expenses net of fee waivers, if any | 1.90%J | 1.90% | 1.90% | 1.90% | 1.90% |
| Expenses net of all reductions | 1.90%J | 1.89% | 1.90% | 1.88% | 1.87% |
| Net investment income (loss) | 2.66%J | 2.33% | 1.36% | 1.36% | 1.67% |
| Supplemental Data | |||||
| Net assets, end of period (000 omitted) | $2,602 | $3,331 | $5,277 | $5,967 | $5,823 |
| Portfolio turnover rateK | 93%J | 80% | 102% | 120% | 70% |
A For the period November 1, 2011 (commencement of operations) to October 31, 2012.
B Calculated based on average shares outstanding during the period.
C Total distributions of $.14 per share is comprised of distributions from net investment income of $.124 and distributions from net realized gain of $.014 per share.
D Amount represents less than $.005 per share.
E Total returns for periods of less than one year are not annualized.
F Total returns would have been lower if certain expenses had not been reduced during the applicable periods shown.
G Total returns do not include the effect of the sales charges.
H Fees and expenses of any underlying Fidelity Central Funds are not included in the Fund's expense ratio. The Fund indirectly bears its proportionate share of the expenses of any underlying Fidelity Central Funds.
I Expense ratios reflect operating expenses of the class. Expenses before reductions do not reflect amounts reimbursed by the investment adviser or reductions from brokerage service arrangements or reductions from other expense offset arrangements and do not represent the amount paid by the class during periods when reimbursements or reductions occur. Expense ratios before reductions for start-up periods may not be representative of longer-term operating periods. Expenses net of fee waivers reflect expenses after reimbursement by the investment adviser but prior to reductions from brokerage service arrangements or other expense offset arrangements. Expenses net of all reductions represent the net expenses paid by the class.
J Annualized
K Amount does not include the portfolio activity of any underlying Fidelity Central Funds.
See accompanying notes which are an integral part of the financial statements.
Financial Highlights — Fidelity Total Emerging Markets Fund Class C
| Six months ended (Unaudited) April 30, | Years ended October 31, | ||||
| 2016 | 2015 | 2014 | 2013 | 2012 A | |
| Selected Per–Share Data | |||||
| Net asset value, beginning of period | $10.25 | $11.47 | $11.29 | $10.80 | $10.00 |
| Income from Investment Operations | |||||
| Net investment income (loss)B | .11 | .20 | .10 | .09 | .12 |
| Net realized and unrealized gain (loss) | .05 | (1.30) | .19 | .47 | .69 |
| Total from investment operations | .16 | (1.10) | .29 | .56 | .81 |
| Distributions from net investment income | (.15) | (.10) | (.11) | (.07) | (.01) |
| Distributions from net realized gain | – | (.02) | – | (.01) | – |
| Total distributions | (.15) | (.12) | (.11) | (.08) | (.01) |
| Redemption fees added to paid in capitalB | –C | –C | –C | .01 | –C |
| Net asset value, end of period | $10.26 | $10.25 | $11.47 | $11.29 | $10.80 |
| Total ReturnD,E,F | 1.56% | (9.68)% | 2.56% | 5.31% | 8.07% |
| Ratios to Average Net AssetsG,H | |||||
| Expenses before reductions | 2.74%I | 2.68% | 2.72% | 2.65% | 2.63% |
| Expenses net of fee waivers, if any | 2.40%I | 2.40% | 2.40% | 2.40% | 2.40% |
| Expenses net of all reductions | 2.40%I | 2.39% | 2.40% | 2.37% | 2.37% |
| Net investment income (loss) | 2.16%I | 1.83% | .86% | .86% | 1.17% |
| Supplemental Data | |||||
| Net assets, end of period (000 omitted) | $7,363 | $7,736 | $10,104 | $7,436 | $5,824 |
| Portfolio turnover rateJ | 93%I | 80% | 102% | 120% | 70% |
A For the period November 1, 2011 (commencement of operations) to October 31, 2012.
B Calculated based on average shares outstanding during the period.
C Amount represents less than $.005 per share.
D Total returns for periods of less than one year are not annualized.
E Total returns would have been lower if certain expenses had not been reduced during the applicable periods shown.
F Total returns do not include the effect of the contingent deferred sales charge.
G Fees and expenses of any underlying Fidelity Central Funds are not included in the Fund's expense ratio. The Fund indirectly bears its proportionate share of the expenses of any underlying Fidelity Central Funds.
H Expense ratios reflect operating expenses of the class. Expenses before reductions do not reflect amounts reimbursed by the investment adviser or reductions from brokerage service arrangements or reductions from other expense offset arrangements and do not represent the amount paid by the class during periods when reimbursements or reductions occur. Expense ratios before reductions for start-up periods may not be representative of longer-term operating periods. Expenses net of fee waivers reflect expenses after reimbursement by the investment adviser but prior to reductions from brokerage service arrangements or other expense offset arrangements. Expenses net of all reductions represent the net expenses paid by the class.
I Annualized
J Amount does not include the portfolio activity of any underlying Fidelity Central Funds.
See accompanying notes which are an integral part of the financial statements.
Financial Highlights — Fidelity Total Emerging Markets Fund
| Six months ended (Unaudited) April 30, | Years ended October 31, | ||||
| 2016 | 2015 | 2014 | 2013 | 2012 A | |
| Selected Per–Share Data | |||||
| Net asset value, beginning of period | $10.38 | $11.60 | $11.40 | $10.89 | $10.00 |
| Income from Investment Operations | |||||
| Net investment income (loss)B | .15 | .31 | .21 | .21 | .22 |
| Net realized and unrealized gain (loss) | .05 | (1.31) | .19 | .47 | .69 |
| Total from investment operations | .20 | (1.00) | .40 | .68 | .91 |
| Distributions from net investment income | (.29) | (.20) | (.20) | (.17) | (.02) |
| Distributions from net realized gain | – | (.02) | – | (.01) | – |
| Total distributions | (.29) | (.22) | (.20) | (.18) | (.02) |
| Redemption fees added to paid in capitalB | –C | –C | –C | .01 | –C |
| Net asset value, end of period | $10.29 | $10.38 | $11.60 | $11.40 | $10.89 |
| Total ReturnD,E | 2.03% | (8.74)% | 3.56% | 6.44% | 9.15% |
| Ratios to Average Net AssetsF,G | |||||
| Expenses before reductions | 1.78%H | 1.72% | 1.73% | 1.56% | 1.60% |
| Expenses net of fee waivers, if any | 1.40%H | 1.40% | 1.40% | 1.40% | 1.40% |
| Expenses net of all reductions | 1.40%H | 1.39% | 1.40% | 1.38% | 1.38% |
| Net investment income (loss) | 3.16%H | 2.83% | 1.86% | 1.85% | 2.16% |
| Supplemental Data | |||||
| Net assets, end of period (000 omitted) | $47,144 | $37,918 | $45,763 | $49,959 | $81,416 |
| Portfolio turnover rateI | 93%H | 80% | 102% | 120% | 70% |
A For the period November 1, 2011 (commencement of operations) to October 31, 2012.
B Calculated based on average shares outstanding during the period.
C Amount represents less than $.005 per share.
D Total returns for periods of less than one year are not annualized.
E Total returns would have been lower if certain expenses had not been reduced during the applicable periods shown.
F Fees and expenses of any underlying Fidelity Central Funds are not included in the Fund's expense ratio. The Fund indirectly bears its proportionate share of the expenses of any underlying Fidelity Central Funds.
G Expense ratios reflect operating expenses of the class. Expenses before reductions do not reflect amounts reimbursed by the investment adviser or reductions from brokerage service arrangements or reductions from other expense offset arrangements and do not represent the amount paid by the class during periods when reimbursements or reductions occur. Expense ratios before reductions for start-up periods may not be representative of longer-term operating periods. Expenses net of fee waivers reflect expenses after reimbursement by the investment adviser but prior to reductions from brokerage service arrangements or other expense offset arrangements. Expenses net of all reductions represent the net expenses paid by the class.
H Annualized
I Amount does not include the portfolio activity of any underlying Fidelity Central Funds.
See accompanying notes which are an integral part of the financial statements.
Financial Highlights — Fidelity Total Emerging Markets Fund Class I
| Six months ended (Unaudited) April 30, | Years ended October 31, | ||||
| 2016 | 2015 | 2014 | 2013 | 2012 A | |
| Selected Per–Share Data | |||||
| Net asset value, beginning of period | $10.37 | $11.59 | $11.40 | $10.89 | $10.00 |
| Income from Investment Operations | |||||
| Net investment income (loss)B | .15 | .31 | .21 | .20 | .22 |
| Net realized and unrealized gain (loss) | .05 | (1.31) | .18 | .48 | .69 |
| Total from investment operations | .20 | (1.00) | .39 | .68 | .91 |
| Distributions from net investment income | (.29) | (.20) | (.20) | (.17) | (.02) |
| Distributions from net realized gain | – | (.02) | – | (.01) | – |
| Total distributions | (.29) | (.22) | (.20) | (.18) | (.02) |
| Redemption fees added to paid in capitalB | –C | –C | –C | .01 | –C |
| Net asset value, end of period | $10.28 | $10.37 | $11.59 | $11.40 | $10.89 |
| Total ReturnD,E | 2.06% | (8.74)% | 3.51% | 6.44% | 9.15% |
| Ratios to Average Net AssetsF,G | |||||
| Expenses before reductions | 1.66%H | 1.58% | 1.71% | 1.63% | 1.62% |
| Expenses net of fee waivers, if any | 1.40%H | 1.40% | 1.40% | 1.40% | 1.40% |
| Expenses net of all reductions | 1.40%H | 1.39% | 1.40% | 1.37% | 1.37% |
| Net investment income (loss) | 3.16%H | 2.83% | 1.86% | 1.86% | 2.17% |
| Supplemental Data | |||||
| Net assets, end of period (000 omitted) | $4,394 | $6,343 | $4,773 | $5,354 | $2,287 |
| Portfolio turnover rateI | 93%H | 80% | 102% | 120% | 70% |
A For the period November 1, 2011 (commencement of operations) to October 31, 2012.
B Calculated based on average shares outstanding during the period.
C Amount represents less than $.005 per share.
D Total returns for periods of less than one year are not annualized.
E Total returns would have been lower if certain expenses had not been reduced during the applicable periods shown.
F Fees and expenses of any underlying Fidelity Central Funds are not included in the Fund's expense ratio. The Fund indirectly bears its proportionate share of the expenses of any underlying Fidelity Central Funds.
G Expense ratios reflect operating expenses of the class. Expenses before reductions do not reflect amounts reimbursed by the investment adviser or reductions from brokerage service arrangements or reductions from other expense offset arrangements and do not represent the amount paid by the class during periods when reimbursements or reductions occur. Expense ratios before reductions for start-up periods may not be representative of longer-term operating periods. Expenses net of fee waivers reflect expenses after reimbursement by the investment adviser but prior to reductions from brokerage service arrangements or other expense offset arrangements. Expenses net of all reductions represent the net expenses paid by the class.
H Annualized
I Amount does not include the portfolio activity of any underlying Fidelity Central Funds.
See accompanying notes which are an integral part of the financial statements.
Notes to Financial Statements (Unaudited)
For the period ended April 30, 2016
1. Organization.
Fidelity Total Emerging Markets Fund (the Fund) is a fund of Fidelity Investment Trust (the Trust) and is authorized to issue an unlimited number of shares. The Trust is registered under the Investment Company Act of 1940, as amended (the 1940 Act), as an open-end management investment company organized as a Massachusetts business trust. The Fund offers Class A, Class T, Class C, Total Emerging Markets and Class I shares, each of which has equal rights as to assets and voting privileges. Each class has exclusive voting rights with respect to matters that affect that class. The Fund's investments in emerging markets can be subject to social, economic, regulatory, and political uncertainties and can be extremely volatile.
2. Investments in Fidelity Central Funds.
The Fund invests in Fidelity Central Funds, which are open-end investment companies generally available only to other investment companies and accounts managed by the investment adviser and its affiliates. The Fund's Schedule of Investments lists each of the Fidelity Central Funds held as of period end, if any, as an investment of the Fund, but does not include the underlying holdings of each Fidelity Central Fund. As an Investing Fund, the Fund indirectly bears its proportionate share of the expenses of the underlying Fidelity Central Funds.
The Money Market Central Funds seek preservation of capital and current income and are managed by Fidelity Investments Money Management, Inc. (FIMM), an affiliate of the investment adviser. Annualized expenses of the Money Market Central Funds as of their most recent shareholder report date are less than .005%.
A complete unaudited list of holdings for each Fidelity Central Fund is available upon request or at the Securities and Exchange Commission (the SEC) website at www.sec.gov. In addition, the financial statements of the Fidelity Central Funds are available on the SEC website or upon request.
3. Significant Accounting Policies.
The financial statements have been prepared in conformity with accounting principles generally accepted in the United States of America (GAAP), which require management to make certain estimates and assumptions at the date of the financial statements. Actual results could differ from those estimates. Subsequent events, if any, through the date that the financial statements were issued have been evaluated in the preparation of the financial statements. The following summarizes the significant accounting policies of the Fund:
Investment Valuation. Investments are valued as of 4:00 p.m. Eastern time on the last calendar day of the period. The Board of Trustees (the Board) has delegated the day to day responsibility for the valuation of the Fund's investments to the Fidelity Management & Research Company (FMR) Fair Value Committee (the Committee). In accordance with valuation policies and procedures approved by the Board, the Fund attempts to obtain prices from one or more third party pricing vendors or brokers to value its investments. When current market prices, quotations or currency exchange rates are not readily available or reliable, investments will be fair valued in good faith by the Committee, in accordance with procedures adopted by the Board. Factors used in determining fair value vary by investment type and may include market or investment specific events, changes in interest rates and credit quality. The frequency with which these procedures are used cannot be predicted and they may be utilized to a significant extent. The Committee oversees the Fund's valuation policies and procedures and reports to the Board on the Committee's activities and fair value determinations. The Board monitors the appropriateness of the procedures used in valuing the Fund's investments and ratifies the fair value determinations of the Committee.
The Fund categorizes the inputs to valuation techniques used to value its investments into a disclosure hierarchy consisting of three levels as shown below:
- Level 1 – quoted prices in active markets for identical investments
- Level 2 – other significant observable inputs (including quoted prices for similar investments, interest rates, prepayment speeds, etc.)
- Level 3 – unobservable inputs (including the Fund's own assumptions based on the best information available)
Valuation techniques used to value the Fund's investments by major category are as follows:
Equity securities, including restricted securities, for which market quotations are readily available, are valued at the last reported sale price or official closing price as reported by a third party pricing vendor on the primary market or exchange on which they are traded and are categorized as Level 1 in the hierarchy. In the event there were no sales during the day or closing prices are not available, securities are valued at the last quoted bid price or may be valued using the last available price and are generally categorized as Level 2 in the hierarchy. For foreign equity securities, when market or security specific events arise, comparisons to the valuation of American Depositary Receipts (ADRs), futures contracts, Exchange-Traded Funds (ETFs) and certain indexes as well as quoted prices for similar securities may be used and would be categorized as Level 2 in the hierarchy. Utilizing these techniques may result in transfers between Level 1 and Level 2. For equity securities, including restricted securities, where observable inputs are limited, assumptions about market activity and risk are used and these securities may be categorized as Level 3 in the hierarchy.
Debt securities, including restricted securities, are valued based on evaluated prices received from third party pricing vendors or from brokers who make markets in such securities. Corporate bonds, foreign government and government agency obligations, preferred securities and U.S. government and government agency obligations are valued by pricing vendors who utilize matrix pricing which considers yield or price of bonds of comparable quality, coupon, maturity and type or by broker-supplied prices. When independent prices are unavailable or unreliable, debt securities may be valued utilizing pricing methodologies which consider similar factors that would be used by third party pricing vendors. Debt securities are generally categorized as Level 2 in the hierarchy but may be Level 3 depending on the circumstances.
Futures contracts are valued at the settlement price established each day by the board of trade or exchange on which they are traded and are categorized as Level 1 in the hierarchy. Investments in open-end mutual funds, including the Fidelity Central Funds, are valued at their closing net asset value (NAV) each business day and are categorized as Level 1 in the hierarchy.
Changes in valuation techniques may result in transfers in or out of an assigned level within the disclosure hierarchy. The aggregate value of investments by input level as of April 30, 2016, including information on transfers between Levels 1 and 2, is included at the end of the Fund's Schedule of Investments.
Foreign Currency. The Fund may use foreign currency contracts to facilitate transactions in foreign-denominated securities. Gains and losses from these transactions may arise from changes in the value of the foreign currency or if the counterparties do not perform under the contracts' terms.
Foreign-denominated assets, including investment securities, and liabilities are translated into U.S. dollars at the exchange rates at period end. Purchases and sales of investment securities, income and dividends received and expenses denominated in foreign currencies are translated into U.S. dollars at the exchange rate in effect on the transaction date.
The effects of exchange rate fluctuations on investments are included with the net realized and unrealized gain (loss) on investment securities. Other foreign currency transactions resulting in realized and unrealized gain (loss) are disclosed separately.
Investment Transactions and Income. For financial reporting purposes, the Fund's investment holdings and NAV include trades executed through the end of the last business day of the period. The NAV per share for processing shareholder transactions is calculated as of the close of business of the New York Stock Exchange (NYSE), normally 4:00 p.m. Eastern time and includes trades executed through the end of the prior business day. Gains and losses on securities sold are determined on the basis of identified cost. Dividend income is recorded on the ex-dividend date, except for certain dividends from foreign securities where the ex-dividend date may have passed, which are recorded as soon as the Fund is informed of the ex-dividend date. Non-cash dividends included in dividend income, if any, are recorded at the fair market value of the securities received. Income and capital gain distributions from Fidelity Central Funds, if any, are recorded on the ex-dividend date. Distributions received on securities that represent a return of capital or capital gain are recorded as a reduction of cost of investments and/or as a realized gain. Subsequent to ex-dividend date the Fund determines the components of these distributions, based upon receipt of tax filings or other correspondence relating to the underlying investment. Interest income is accrued as earned and includes coupon interest and amortization of premium and accretion of discount on debt securities as applicable. Investment income is recorded net of foreign taxes withheld where recovery of such taxes is uncertain. Debt obligations may be placed on non-accrual status and related interest income may be reduced by ceasing current accruals and writing off interest receivables when the collection of all or a portion of interest has become doubtful based on consistently applied procedures. A debt obligation is removed from non-accrual status when the issuer resumes interest payments or when collectability of interest is reasonably assured.
Class Allocations and Expenses. Investment income, realized and unrealized capital gains and losses, common expenses of the Fund, and certain fund-level expense reductions, if any, are allocated daily on a pro-rata basis to each class based on the relative net assets of each class to the total net assets of the Fund. Each class differs with respect to transfer agent and distribution and service plan fees incurred. Certain expense reductions may also differ by class. For the reporting period, the allocated portion of income and expenses to each class as a percent of its average net assets may vary due to the timing of recording these transactions in relation to fluctuating net assets of the classes. Expenses directly attributable to a fund are charged to that fund. Expenses attributable to more than one fund are allocated among the respective funds on the basis of relative net assets or other appropriate methods. Expense estimates are accrued in the period to which they relate and adjustments are made when actual amounts are known.
Income Tax Information and Distributions to Shareholders. Each year, the Fund intends to qualify as a regulated investment company under Subchapter M of the Internal Revenue Code, including distributing substantially all of its taxable income and realized gains. As a result, no provision for U.S. Federal income taxes is required. The Fund files a U.S. federal tax return, in addition to state and local tax returns as required. The Fund's federal income tax returns are subject to examination by the Internal Revenue Service (IRS) for a period of three fiscal years after they are filed. State and local tax returns may be subject to examination for an additional fiscal year depending on the jurisdiction. Foreign taxes are provided for based on the Fund's understanding of the tax rules and rates that exist in the foreign markets in which it invests. The Fund is subject to a tax imposed on capital gains by certain countries in which it invests. An estimated deferred tax liability for net unrealized appreciation on the applicable securities is included in Other payables and accrued expenses on the Statement of Assets & Liabilities.
Distributions are declared and recorded on the ex-dividend date. Income dividends and capital gain distributions are declared separately for each class. Income and capital gain distributions are determined in accordance with income tax regulations, which may differ from GAAP.
Capital accounts within the financial statements are adjusted for permanent book-tax differences. These adjustments have no impact on net assets or the results of operations. Capital accounts are not adjusted for temporary book-tax differences which will reverse in a subsequent period.
Book-tax differences are primarily due to foreign currency transactions, futures contracts, certain foreign taxes, market discount, passive foreign investment companies (PFIC), capital loss carryforward and losses deferred due to wash sales.
The federal tax cost of investment securities and unrealized appreciation (depreciation) as of period end were as follows:
| Gross unrealized appreciation | $6,261,932 |
| Gross unrealized depreciation | (4,885,266) |
| Net unrealized appreciation (depreciation) on securities | $1,376,666 |
| Tax cost | $69,728,070 |
Capital loss carryforwards are only available to offset future capital gains of the Fund to the extent provided by regulations and may be limited. Under the Regulated Investment Company Modernization Act of 2010 (the Act), the Fund is permitted to carry forward capital losses incurred in taxable years beginning after December 22, 2010 for an unlimited period and such capital losses are required to be used prior to any losses that expire. The capital loss carryforward information presented below, including any applicable limitation, is estimated as of prior fiscal period end and is subject to adjustment.
| No expiration | |
| Short-term | $(1,367,584) |
Short-Term Trading (Redemption) Fees. Shares held by investors in the Fund less than 90 days may have been subject to a redemption fee equal to 1.50% of the NAV of shares redeemed. All redemption fees, which reduce the proceeds of the shareholder redemption, are retained by the Fund and accounted for as an addition to paid in capital.
Delayed Delivery Transactions and When-Issued Securities. During the period, the Fund transacted in securities on a delayed delivery or when-issued basis. Payment and delivery may take place after the customary settlement period for that security. The price of the underlying securities and the date when the securities will be delivered and paid for are fixed at the time the transaction is negotiated. The securities purchased on a delayed delivery or when-issued basis are identified as such in the Fund's Schedule of Investments. The Fund may receive compensation for interest forgone in the purchase of a delayed delivery or when-issued security. With respect to purchase commitments, the Fund identifies securities as segregated in its records with a value at least equal to the amount of the commitment. Losses may arise due to changes in the value of the underlying securities or if the counterparty does not perform under the contract's terms, or if the issuer does not issue the securities due to political, economic, or other factors.
Restricted Securities. The Fund may invest in securities that are subject to legal or contractual restrictions on resale. These securities generally may be resold in transactions exempt from registration or to the public if the securities are registered. Disposal of these securities may involve time-consuming negotiations and expense, and prompt sale at an acceptable price may be difficult. Information regarding restricted securities is included at the end of the Fund's Schedule of Investments.
4. Derivative Instruments.
Risk Exposures and the Use of Derivative Instruments. The Fund's investment objective allows the Fund to enter into various types of derivative contracts, including futures contracts. Derivatives are investments whose value is primarily derived from underlying assets, indices or reference rates and may be transacted on an exchange or over-the-counter (OTC). Derivatives may involve a future commitment to buy or sell a specified asset based on specified terms, to exchange future cash flows at periodic intervals based on a notional principal amount, or for one party to make one or more payments upon the occurrence of specified events in exchange for periodic payments from the other party.
The Fund used derivatives to increase returns and to manage exposure to certain risks as defined below. The success of any strategy involving derivatives depends on analysis of numerous economic factors, and if the strategies for investment do not work as intended, the Fund may not achieve its objectives.
The Fund's use of derivatives increased or decreased its exposure to the following risk:
| Equity Risk | Equity risk relates to the fluctuations in the value of financial instruments as a result of changes in market prices (other than those arising from interest rate risk or foreign exchange risk), whether caused by factors specific to an individual investment, its issuer, or all factors affecting all instruments traded in a market or market segment. |
The Fund is also exposed to additional risks from investing in derivatives, such as liquidity risk and counterparty credit risk. Liquidity risk is the risk that the Fund will be unable to close out the derivative in the open market in a timely manner. Counterparty credit risk is the risk that the counterparty will not be able to fulfill its obligation to the Fund. Counterparty credit risk related to exchange-traded futures contracts may be mitigated by the protection provided by the exchange on which they trade.
Investing in derivatives may involve greater risks than investing in the underlying assets directly and, to varying degrees, may involve risk of loss in excess of any initial investment and collateral received and amounts recognized in the Statement of Assets and Liabilities. In addition, there may be the risk that the change in value of the derivative contract does not correspond to the change in value of the underlying instrument.
Futures Contracts. A futures contract is an agreement between two parties to buy or sell a specified underlying instrument for a fixed price at a specified future date. The Fund used futures contracts to manage its exposure to the stock market.
Upon entering into a futures contract, a fund is required to deposit either cash or securities (initial margin) with a clearing broker in an amount equal to a certain percentage of the face value of the contract. Futures contracts are marked-to-market daily and subsequent daily payments (variation margin) are made or received by a fund depending on the daily fluctuations in the value of the futures contracts and are recorded as unrealized appreciation or (depreciation). This receivable and/or payable, if any, is included in daily variation margin for derivative instruments in the Statement of Assets and Liabilities. Realized gain or (loss) is recorded upon the expiration or closing of a futures contract. The net realized gain (loss) and change in net unrealized appreciation (depreciation) on futures contracts during the period is included in the Statement of Operations.
Any open futures contracts at period end are presented in the Schedule of Investments under the caption "Futures Contracts". The underlying face amount at value reflects each contract's exposure to the underlying instrument or index at period end. Securities deposited to meet initial margin requirements are identified in the Schedule of Investments.
During the period the Fund recognized net realized gain (loss) of $(199,083) and a change in net unrealized appreciation (depreciation) of $(42,773) related to its investment in futures contracts. These amounts are included in the Statement of Operations.
5. Purchases and Sales of Investments.
Purchases and sales of securities, other than short-term securities, aggregated $32,470,293 and $28,900,560, respectively.
6. Fees and Other Transactions with Affiliates.
Management Fee. Fidelity Management & Research Company (the investment adviser) and its affiliates provide the Fund with investment management related services for which the Fund pays a monthly management fee. The management fee is the sum of an individual fund fee rate that is based on an annual rate of .55% of the Fund's average net assets and an annualized group fee rate that averaged .25% during the period. The group fee rate is based upon the average net assets of all the mutual funds advised by the investment adviser, including any mutual funds previously advised by the investment adviser that are currently advised by Fidelity SelectCo, LLC, an affiliate of the investment adviser. The group fee rate decreases as assets under management increase and increases as assets under management decrease. For the reporting period, the total annualized management fee rate was .80% of the Fund's average net assets.
Distribution and Service Plan Fees. In accordance with Rule 12b-1 of the 1940 Act, the Fund has adopted separate Distribution and Service Plans for each class of shares. Certain classes pay Fidelity Distributors Corporation (FDC), an affiliate of the investment adviser, separate Distribution and Service Fees, each of which is based on an annual percentage of each class' average net assets. In addition, FDC may pay financial intermediaries for selling shares of the Fund and providing shareholder support services. For the period, the Distribution and Service Fee rates, total fees and amounts retained by FDC were as follows:
| Distribution Fee | Service Fee | Total Fees | Retained by FDC | |
| Class A | -% | .25% | $10,947 | $913 |
| Class T | .25% | .25% | 7,126 | 878 |
| Class C | .75% | .25% | 35,711 | 9,487 |
| $53,784 | $11,278 |
Sales Load. FDC may receive a front-end sales charge of up to 5.75% for selling Class A shares and 3.50% for selling Class T shares, some of which is paid to financial intermediaries for selling shares of the Fund. Depending on the holding period, FDC may receive contingent deferred sales charges levied on Class A, Class T, and Class C redemptions. The deferred sales charges are 1.00% for Class C shares, 1.00% for certain purchases of Class A shares and .25% for certain purchases of Class T shares.
For the period, sales charge amounts retained by FDC were as follows:
| Retained by FDC | |
| Class A | $3,031 |
| Class T | 1,228 |
| Class C(a) | 182 |
| $4,441 |
(a) When Class C shares are initially sold, FDC pays commissions from its own resources to financial intermediaries through which the sales are made.
Transfer Agent Fees. Fidelity Investments Institutional Operations Company, Inc., (FIIOC), an affiliate of the investment adviser, is the transfer, dividend disbursing and shareholder servicing agent for each class of the Fund. FIIOC receives account fees and asset-based fees that vary according to the account size and type of account of the shareholders of the respective classes of the Fund. FIIOC pays for typesetting, printing and mailing of shareholder reports, except proxy statements.
For the period, transfer agent fees for each class were as follows:
| Amount | % of Class-Level Average Net Assets(a) | |
| Class A | $11,430 | .26 |
| Class T | 4,831 | .34 |
| Class C | 9,178 | .26 |
| Total Emerging Markets | 59,330 | .29 |
| Class I | 4,853 | .18 |
| $89,622 |
(a) Annualized
Accounting Fees. Fidelity Service Company, Inc. (FSC), an affiliate of the investment adviser, maintains the Fund's accounting records. The fee is based on the level of average net assets for each month.
Brokerage Commissions. The Fund placed a portion of its portfolio transactions with brokerage firms which are affiliates of the investment adviser. Brokerage commissions are included in net realized gain (loss) and change in net unrealized appreciation (depreciation) in the Statement of Operations. The commissions paid to these affiliated firms were $230 for the period.
Interfund Trades. The Fund may purchase from or sell securities to other Fidelity Funds under procedures adopted by the Board. The procedures have been designed to ensure these interfund trades are executed in accordance with Rule 17a-7 of the 1940 Act. Interfund trades are included within the respective purchases and sales amounts shown in the Purchases and Sales of Investments note.
7. Committed Line of Credit.
The Fund participates with other funds managed by the investment adviser or an affiliate in a $4.25 billion credit facility (the "line of credit") to be utilized for temporary or emergency purposes to fund shareholder redemptions or for other short-term liquidity purposes. The Fund has agreed to pay commitment fees on its pro-rata portion of the line of credit, which amounted to $57 and is reflected in Miscellaneous expenses on the Statement of Operations. During the period, the Fund did not borrow on this line of credit.
8. Expense Reductions.
The investment adviser contractually agreed to reimburse each class to the extent annual operating expenses exceeded certain levels of average net assets as noted in the table below. This reimbursement will remain in place through December 31, 2016. Some expenses, for example interest expense, including commitment fees, are excluded from this reimbursement.
The following classes were in reimbursement during the period:
| Expense Limitations | Reimbursement | |
| Class A | 1.65% | $15,535 |
| Class T | 1.90% | 6,044 |
| Class C | 2.40% | 12,340 |
| Total Emerging Markets | 1.40% | 77,877 |
| Class I | 1.40% | 7,037 |
| $118,833 |
In addition, through arrangements with the Fund's custodian, credits realized as a result of certain uninvested cash balances were used to reduce the Fund's expenses. During the period, these credits reduced the Fund's custody expenses by $190.
In addition, during the period the investment adviser reimbursed and/or waived a portion of fund-level operating expenses in the amount of $233.
9. Distributions to Shareholders.
Distributions to shareholders of each class were as follows:
| Six months ended April 30, 2016 | Year ended October 31, 2015 | |
| From net investment income | ||
| Class A | $214,855 | $211,944 |
| Class T | 63,597 | 63,689 |
| Class C | 107,081 | 88,937 |
| Total Emerging Markets | 1,155,874 | 751,293 |
| Class I | 174,060 | 82,887 |
| Total | $1,715,467 | $1,198,750 |
| From net realized gain | ||
| Class A | $– | $24,934 |
| Class T | – | 9,098 |
| Class C | – | 18,150 |
| Total Emerging Markets | – | 75,507 |
| Class I | – | 8,330 |
| Total | $– | $136,019 |
10. Share Transactions.
Share transactions for each class were as follows and may contain automatic conversions between classes or exchanges between affiliated funds:
| Shares | Shares | Dollars | Dollars | |
| Six months ended April 30, 2016 | Year ended October 31, 2015 | Six months ended April 30, 2016 | Year ended October 31, 2015 | |
| Class A | ||||
| Shares sold | 231,549 | 251,231 | $2,286,170 | $2,772,246 |
| Reinvestment of distributions | 21,375 | 21,174 | 212,465 | 232,918 |
| Shares redeemed | (288,585) | (469,131) | (2,888,428) | (4,963,727) |
| Net increase (decrease) | (35,661) | (196,726) | $(389,793) | $(1,958,563) |
| Class T | ||||
| Shares sold | 39,364 | 45,171 | $384,188 | $491,646 |
| Reinvestment of distributions | 6,356 | 6,566 | 63,302 | 72,226 |
| Shares redeemed | (115,507) | (186,633) | (1,138,165) | (1,964,687) |
| Net increase (decrease) | (69,787) | (134,896) | $(690,675) | $(1,400,815) |
| Class C | ||||
| Shares sold | 117,585 | 198,104 | $1,158,004 | $2,115,228 |
| Reinvestment of distributions | 10,753 | 9,691 | 106,882 | 106,316 |
| Shares redeemed | (164,784) | (334,580) | (1,599,463) | (3,520,139) |
| Net increase (decrease) | (36,446) | (126,785) | $(334,577) | $(1,298,595) |
| Total Emerging Markets | ||||
| Shares sold | 1,869,299 | 1,772,167 | $18,595,164 | $18,534,579 |
| Reinvestment of distributions | 112,410 | 70,595 | 1,116,229 | 777,256 |
| Shares redeemed | (1,051,095) | (2,136,425) | (10,173,118) | (22,904,245) |
| Net increase (decrease) | 930,614 | (293,663) | $9,538,275 | $(3,592,410) |
| Class I | ||||
| Shares sold | 163,149 | 421,240 | $1,629,549 | $4,563,340 |
| Reinvestment of distributions | 14,612 | 8,237 | 144,954 | 90,609 |
| Shares redeemed | (361,612) | (229,844) | (3,539,650) | (2,428,352) |
| Net increase (decrease) | (183,851) | 199,633 | $(1,765,147) | $2,225,597 |
11. Other.
The Fund's organizational documents provide former and current trustees and officers with a limited indemnification against liabilities arising in connection with the performance of their duties to the Fund. In the normal course of business, the Fund may also enter into contracts that provide general indemnifications. The Fund's maximum exposure under these arrangements is unknown as this would be dependent on future claims that may be made against the Fund. The risk of material loss from such claims is considered remote.
Shareholder Expense Example
As a shareholder of the Fund, you incur two types of costs: (1) transaction costs, including sales charges (loads) on purchase payments or redemption proceeds, redemption fees and (2) ongoing costs, including management fees, distribution and/or service (12b-1) fees and other Fund expenses. This Example is intended to help you understand your ongoing costs (in dollars) of investing in the Fund and to compare these costs with the ongoing costs of investing in other mutual funds.
The Example is based on an investment of $1,000 invested at the beginning of the period and held for the entire period (November 1, 2015 to April 30, 2016).
Actual Expenses
The first line of the accompanying table for each class of the Fund provides information about actual account values and actual expenses. You may use the information in this line, together with the amount you invested, to estimate the expenses that you paid over the period. Simply divide your account value by $1,000.00 (for example, an $8,600 account value divided by $1,000.00 = 8.6), then multiply the result by the number in the first line for a class of the Fund under the heading entitled "Expenses Paid During Period" to estimate the expenses you paid on your account during this period. A small balance maintenance fee of $12.00 that is charged once a year may apply for certain accounts with a value of less than $2,000. This fee is not included in the table below. If it was, the estimate of expenses you paid during the period would be higher, and your ending account value lower, by this amount. In addition, the Fund, as a shareholder in the underlying Fidelity Central Funds, will indirectly bear its pro-rata share of the fees and expenses incurred by the underlying Fidelity Central Funds. These fees and expenses are not included in the Fund's annualized expense ratio used to calculate the expense estimate in the table below.
Hypothetical Example for Comparison Purposes
The second line of the accompanying table for each class of the Fund provides information about hypothetical account values and hypothetical expenses based on a Class' actual expense ratio and an assumed rate of return of 5% per year before expenses, which is not the Class' actual return. The hypothetical account values and expenses may not be used to estimate the actual ending account balance or expenses you paid for the period. You may use this information to compare the ongoing costs of investing in the Fund and other funds. To do so, compare this 5% hypothetical example with the 5% hypothetical examples that appear in the shareholder reports of the other funds. A small balance maintenance fee of $12.00 that is charged once a year may apply for certain accounts with a value of less than $2,000. This fee is not included in the table below. If it was, the estimate of expenses you paid during the period would be higher, and your ending account value lower, by this amount. In addition, the Fund, as a shareholder in the underlying Fidelity Central Funds, will indirectly bear its pro-rata share of the fees and expenses incurred by the underlying Fidelity Central Funds. These fees and expenses are not included in the Fund's annualized expense ratio used to calculate the expense estimate in the table below.
Please note that the expenses shown in the table are meant to highlight your ongoing costs only and do not reflect any transaction costs. Therefore, the second line of the table is useful in comparing ongoing costs only, and will not help you determine the relative total costs of owning different funds. In addition, if these transactional costs were included, your costs would have been higher.
| Annualized Expense RatioA | Beginning Account Value November 1, 2015 | Ending Account Value April 30, 2016 | Expenses Paid During Period-B November 1, 2015 to April 30, 2016 | |
| Fidelity Emerging Markets Discovery Fund | ||||
| Class A | 1.70% | |||
| Actual | $1,000.00 | $1,017.90 | $8.53 | |
| Hypothetical-C | $1,000.00 | $1,016.41 | $8.52 | |
| Class T | 1.95% | |||
| Actual | $1,000.00 | $1,016.90 | $9.78 | |
| Hypothetical-C | $1,000.00 | $1,015.17 | $9.77 | |
| Class C | 2.45% | |||
| Actual | $1,000.00 | $1,014.00 | $12.27 | |
| Hypothetical-C | $1,000.00 | $1,012.68 | $12.26 | |
| Emerging Markets Discovery | 1.45% | |||
| Actual | $1,000.00 | $1,019.90 | $7.28 | |
| Hypothetical-C | $1,000.00 | $1,017.65 | $7.27 | |
| Class I | 1.45% | |||
| Actual | $1,000.00 | $1,019.10 | $7.28 | |
| Hypothetical-C | $1,000.00 | $1,017.65 | $7.27 | |
| Fidelity Total Emerging Markets Fund | ||||
| Class A | 1.65% | |||
| Actual | $1,000.00 | $1,018.40 | $8.28 | |
| Hypothetical-C | $1,000.00 | $1,016.66 | $8.27 | |
| Class T | 1.90% | |||
| Actual | $1,000.00 | $1,017.40 | $9.53 | |
| Hypothetical-C | $1,000.00 | $1,015.42 | $9.52 | |
| Class C | 2.40% | |||
| Actual | $1,000.00 | $1,015.60 | $12.03 | |
| Hypothetical-C | $1,000.00 | $1,012.93 | $12.01 | |
| Total Emerging Markets | 1.40% | |||
| Actual | $1,000.00 | $1,020.30 | $7.03 | |
| Hypothetical-C | $1,000.00 | $1,017.90 | $7.02 | |
| Class I | 1.40% | |||
| Actual | $1,000.00 | $1,020.60 | $7.03 | |
| Hypothetical-C | $1,000.00 | $1,017.90 | $7.02 | |
A Annualized expense ratio reflects expenses net of applicable fee waivers.
B Expenses are equal to each Class' annualized expense ratio, multiplied by the average account value over the period, multiplied by 182/ 366 (to reflect the one-half year period).
C 5% return per year before expenses
![]()
Corporate Headquarters
245 Summer St.
Boston, MA 02210
www.fidelity.com
EMD-TEK-SANN-0616
1.931240.104
Fidelity Advisor® International Small Cap Fund - Semi-Annual Report April 30, 2016 Class I is a class of Fidelity® International Small Cap Fund |
|
Contents
To view a fund's proxy voting guidelines and proxy voting record for the 12-month period ended June 30, visit http://www.fidelity.com/proxyvotingresults or visit the Securities and Exchange Commission's (SEC) web site at http://www.sec.gov.
You may also call 1-877-208-0098 to request a free copy of the proxy voting guidelines.
Standard & Poor's, S&P and S&P 500 are registered service marks of The McGraw-Hill Companies, Inc. and have been licensed for use by Fidelity Distributors Corporation.
Other third-party marks appearing herein are the property of their respective owners.
All other marks appearing herein are registered or unregistered trademarks or service marks of FMR LLC or an affiliated company. © 2016 FMR LLC. All rights reserved.
This report and the financial statements contained herein are submitted for the general information of the shareholders of the Fund. This report is not authorized for distribution to prospective investors in the Fund unless preceded or accompanied by an effective prospectus.
A fund files its complete schedule of portfolio holdings with the SEC for the first and third quarters of each fiscal year on Form N-Q. Forms N-Q are available on the SEC’s web site at http://www.sec.gov. A fund's Forms N-Q may be reviewed and copied at the SEC’s Public Reference Room in Washington, DC. Information regarding the operation of the SEC's Public Reference Room may be obtained by calling 1-800-SEC-0330.
For a complete list of a fund's portfolio holdings, view the most recent holdings listing, semiannual report, or annual report on Fidelity's web site at http://www.fidelity.com, http://www.advisor.fidelity.com, or http://www.401k.com, as applicable.
NOT FDIC INSURED •MAY LOSE VALUE •NO BANK GUARANTEE
Neither the Fund nor Fidelity Distributors Corporation is a bank.
Investment Summary (Unaudited)
Geographic Diversification (% of fund's net assets)
| As of April 30, 2016 | ||
| Japan | 22.2% | |
| United Kingdom | 14.8% | |
| United States of America* | 5.9% | |
| Canada | 4.1% | |
| France | 4.0% | |
| Cayman Islands | 3.9% | |
| Australia | 3.6% | |
| Switzerland | 3.3% | |
| Ireland | 2.5% | |
| Other | 35.7% | |

* Includes Short-Term investments and Net Other Assets (Liabilities).
Percentages are based on country or territory of incorporation and are adjusted for the effect of futures contracts, if applicable.
| As of October 31, 2015 | ||
| Japan | 21.6% | |
| United Kingdom | 14.5% | |
| United States of America* | 6.6% | |
| Canada | 4.0% | |
| Switzerland | 3.9% | |
| Cayman Islands | 3.7% | |
| Germany | 3.4% | |
| France | 3.3% | |
| Australia | 2.9% | |
| Other | 36.1% | |

* Includes Short-Term investments and Net Other Assets (Liabilities).
Percentages are based on country or territory of incorporation and are adjusted for the effect of futures contracts, if applicable.
Asset Allocation as of April 30, 2016
| % of fund's net assets | % of fund's net assets 6 months ago | |
| Stocks | 95.0 | 94.6 |
| Short-Term Investments and Net Other Assets (Liabilities) | 5.0 | 5.4 |
Top Ten Stocks as of April 30, 2016
| % of fund's net assets | % of fund's net assets 6 months ago | |
| Micro Focus International PLC (United Kingdom, Software) | 1.3 | 1.1 |
| EBOS Group Ltd. (New Zealand, Health Care Providers & Services) | 1.2 | 1.1 |
| United Drug PLC (United Kingdom) (Ireland, Health Care Providers & Services) | 1.1 | 1.0 |
| Tsuruha Holdings, Inc. (Japan, Food & Staples Retailing) | 1.1 | 0.9 |
| Nuplex Industries Ltd. (New Zealand, Chemicals) | 1.0 | 0.9 |
| Nitori Holdings Co. Ltd. (Japan, Specialty Retail) | 1.0 | 0.9 |
| Frutarom Industries Ltd. (Israel, Chemicals) | 1.0 | 1.1 |
| Allied World Assurance Co. Holdings AG (Switzerland, Insurance) | 1.0 | 0.9 |
| JSR Corp. (Japan, Chemicals) | 0.9 | 1.0 |
| GUD Holdings Ltd. (Australia, Household Durables) | 0.9 | 0.5 |
| 10.5 |
Market Sectors as of April 30, 2016
| % of fund's net assets | % of fund's net assets 6 months ago | |
| Financials | 20.9 | 22.6 |
| Industrials | 19.4 | 18.9 |
| Consumer Discretionary | 15.2 | 16.3 |
| Information Technology | 9.4 | 10.0 |
| Consumer Staples | 8.9 | 7.5 |
| Health Care | 8.9 | 8.5 |
| Materials | 7.8 | 6.9 |
| Energy | 4.1 | 3.5 |
| Utilities | 0.4 | 0.4 |
Investments April 30, 2016 (Unaudited)
Showing Percentage of Net Assets
| Common Stocks - 94.6% | |||
| Shares | Value | ||
| Australia - 3.6% | |||
| Aub Group Ltd. | 470,441 | $3,111,988 | |
| Austal Ltd. | 919,229 | 1,090,340 | |
| Challenger Ltd. | 769,974 | 5,245,630 | |
| GUD Holdings Ltd. (a) | 1,286,901 | 8,356,349 | |
| Imdex Ltd. (b)(c) | 13,086,370 | 2,039,795 | |
| Life Healthcare Group Ltd. | 2,075,053 | 2,145,763 | |
| Nanosonics Ltd. (b) | 1,719,782 | 2,902,952 | |
| Programmed Maintenance Services Ltd. | 1,870,070 | 2,083,095 | |
| SAI Global Ltd. | 1,348,285 | 3,741,865 | |
| SomnoMed Ltd. (a)(b) | 672,977 | 1,453,222 | |
| TOTAL AUSTRALIA | 32,170,999 | ||
| Austria - 1.8% | |||
| Andritz AG | 118,732 | 6,649,514 | |
| IMMOFINANZ Immobilien Anlagen AG (a)(b) | 1,934,143 | 4,560,048 | |
| RHI AG | 218,140 | 4,690,891 | |
| TOTAL AUSTRIA | 15,900,453 | ||
| Bailiwick of Jersey - 0.6% | |||
| Regus PLC | 1,332,800 | 5,694,258 | |
| Belgium - 1.0% | |||
| Barco NV | 67,583 | 4,719,767 | |
| Econocom Group SA | 362,620 | 3,907,202 | |
| TOTAL BELGIUM | 8,626,969 | ||
| Bermuda - 1.6% | |||
| BW Offshore Ltd. | 5,305,227 | 1,159,634 | |
| Hiscox Ltd. | 389,355 | 5,122,999 | |
| Petra Diamonds Ltd. | 3,093,474 | 5,333,635 | |
| Travelport Worldwide Ltd. | 228,600 | 3,188,970 | |
| TOTAL BERMUDA | 14,805,238 | ||
| Brazil - 0.3% | |||
| MAHLE Metal Leve SA | 362,500 | 2,385,222 | |
| British Virgin Islands - 0.3% | |||
| Gem Diamonds Ltd. | 1,174,862 | 2,326,060 | |
| Canada - 4.1% | |||
| AutoCanada, Inc. (a) | 254,084 | 4,157,444 | |
| Dorel Industries, Inc. Class B (sub. vtg.) | 122,003 | 2,714,851 | |
| Genesis Land Development Corp. | 1,051,822 | 2,221,510 | |
| Jean Coutu Group, Inc. Class A (sub. vtg.) | 244,913 | 3,724,348 | |
| Lassonde Industries, Inc. Class A (sub. vtg.) | 37,869 | 5,281,499 | |
| McCoy Global, Inc. | 1,341,870 | 2,192,423 | |
| Open Text Corp. | 136,048 | 7,617,257 | |
| ShawCor Ltd. Class A | 117,885 | 3,185,065 | |
| Whitecap Resources, Inc. (a) | 696,153 | 5,221,009 | |
| TOTAL CANADA | 36,315,406 | ||
| Cayman Islands - 3.9% | |||
| AMVIG Holdings Ltd. | 16,168,000 | 6,657,294 | |
| Best Pacific International Holdings Ltd. | 1,678,000 | 995,768 | |
| China High Precision Automation Group Ltd. (b) | 712,000 | 1 | |
| China Metal Recycling (Holdings) Ltd. (b) | 436,800 | 1 | |
| Greatview Aseptic Pack Co. Ltd. | 5,597,000 | 2,834,467 | |
| Haitian International Holdings Ltd. | 2,600,000 | 4,436,023 | |
| Lifestyle International Holdings Ltd. | 3,347,000 | 5,544,385 | |
| Pico Far East Holdings Ltd. | 18,482,000 | 5,010,814 | |
| SITC International Holdings Co. Ltd. | 12,181,000 | 6,583,480 | |
| Value Partners Group Ltd. | 3,286,000 | 3,136,655 | |
| TOTAL CAYMAN ISLANDS | 35,198,888 | ||
| Chile - 0.9% | |||
| Quinenco SA | 2,409,395 | 4,740,929 | |
| Vina San Pedro SA | 352,175,653 | 3,470,184 | |
| TOTAL CHILE | 8,211,113 | ||
| Denmark - 0.7% | |||
| Jyske Bank A/S (Reg.) | 153,703 | 6,292,655 | |
| Finland - 2.4% | |||
| Amer Group PLC (A Shares) | 201,445 | 5,955,760 | |
| Asiakastieto Group Oyj | 192,023 | 3,518,015 | |
| Cramo Oyj (B Shares) | 186,710 | 3,734,951 | |
| Olvi PLC (A Shares) | 126,157 | 3,504,504 | |
| Tikkurila Oyj | 269,946 | 4,732,347 | |
| TOTAL FINLAND | 21,445,577 | ||
| France - 4.0% | |||
| ALTEN | 105,219 | 6,505,975 | |
| Coface SA | 358,202 | 2,891,212 | |
| Rexel SA | 300,300 | 4,549,248 | |
| Saft Groupe SA | 116,100 | 3,608,000 | |
| The Lisi Group | 143,009 | 4,092,174 | |
| The Vicat Group | 88,556 | 6,165,184 | |
| Thermador Groupe SA | 27,557 | 2,519,914 | |
| Wendel SA | 47,235 | 5,457,321 | |
| TOTAL FRANCE | 35,789,028 | ||
| Germany - 2.0% | |||
| AURELIUS AG | 86,435 | 5,168,339 | |
| CompuGroup Medical AG | 178,949 | 7,028,260 | |
| mutares AG | 144,900 | 2,405,807 | |
| SHW Group | 102,339 | 2,953,018 | |
| TOTAL GERMANY | 17,555,424 | ||
| Greece - 0.4% | |||
| Metka SA | 435,516 | 3,332,417 | |
| Hong Kong - 1.9% | |||
| Dah Sing Banking Group Ltd. | 3,157,200 | 5,616,923 | |
| Far East Horizon Ltd. | 4,274,000 | 3,392,604 | |
| Magnificent Hotel Investment L | 113,522,000 | 2,805,015 | |
| Shun Ho Technology Holdings Ltd. | 1,650,033 | 552,810 | |
| Techtronic Industries Co. Ltd. | 1,142,000 | 4,280,981 | |
| TOTAL HONG KONG | 16,648,333 | ||
| India - 0.6% | |||
| Edelweiss Financial Services Ltd. | 3,634,440 | 3,176,178 | |
| Torrent Pharmaceuticals Ltd. | 100,431 | 2,162,444 | |
| TOTAL INDIA | 5,338,622 | ||
| Indonesia - 0.7% | |||
| PT ACE Hardware Indonesia Tbk | 43,202,200 | 3,030,182 | |
| PT Media Nusantara Citra Tbk | 17,060,400 | 3,040,032 | |
| TOTAL INDONESIA | 6,070,214 | ||
| Ireland - 2.5% | |||
| C&C Group PLC | 885,778 | 3,978,942 | |
| Mincon Group PLC | 5,015,823 | 4,284,553 | |
| Origin Enterprises PLC | 588,700 | 4,147,007 | |
| United Drug PLC (United Kingdom) | 1,079,749 | 9,655,373 | |
| TOTAL IRELAND | 22,065,875 | ||
| Isle of Man - 0.6% | |||
| Optimal Payments PLC (b) | 1,050,400 | 5,850,627 | |
| Israel - 1.0% | |||
| Frutarom Industries Ltd. | 167,089 | 8,563,621 | |
| Italy - 1.1% | |||
| Banco di Desio e della Brianza SpA | 669,139 | 1,886,379 | |
| Danieli & C. Officine Meccaniche SpA | 98,967 | 2,170,119 | |
| Recordati SpA | 232,561 | 5,909,063 | |
| TOTAL ITALY | 9,965,561 | ||
| Japan - 22.2% | |||
| A/S One Corp. | 142,500 | 5,138,270 | |
| Aeon Delight Co. Ltd. | 192,900 | 5,326,040 | |
| Ain Holdings, Inc. | 61,100 | 2,968,116 | |
| Arc Land Sakamoto Co. Ltd. | 432,300 | 4,488,634 | |
| Broadleaf Co. Ltd. | 383,300 | 3,787,796 | |
| Central Automotive Products Ltd. (d) | 316,000 | 2,633,793 | |
| Daiwa Industries Ltd. | 495,600 | 4,248,249 | |
| Dexerials Corp. | 303,900 | 2,459,684 | |
| Fuji Corp. | 149,100 | 2,347,486 | |
| Fukuda Denshi Co. Ltd. | 129,800 | 7,087,053 | |
| Funai Soken Holdings, Inc. | 190,320 | 2,887,506 | |
| GMO Internet, Inc. | 404,200 | 4,745,925 | |
| Iida Group Holdings Co. Ltd. | 223,551 | 4,175,060 | |
| Japan Meat Co. Ltd. | 195,300 | 1,940,491 | |
| JSR Corp. | 621,100 | 8,514,147 | |
| KAWAI Musical Instruments Manufacturing Co. Ltd. | 165,700 | 3,016,977 | |
| Kinugawa Rubber Industrial Co. Ltd. | 733,000 | 5,103,808 | |
| Konica Minolta, Inc. | 286,800 | 2,475,534 | |
| Kotobuki Spirits Co. Ltd. | 165,900 | 3,228,062 | |
| Leopalace21 Corp. (b) | 966,500 | 5,799,511 | |
| Meitec Corp. | 145,700 | 5,054,040 | |
| Minebea Mitsumi, Inc. | 382,000 | 3,128,958 | |
| Miraca Holdings, Inc. | 131,500 | 5,588,374 | |
| Mitani Shoji Co. Ltd. | 247,700 | 7,137,523 | |
| Monex Group, Inc. | 699,100 | 1,803,481 | |
| Nihon House Holdings Co. Ltd. (a) | 795,600 | 2,681,573 | |
| Nihon Parkerizing Co. Ltd. (d) | 366,900 | 3,236,205 | |
| Nitori Holdings Co. Ltd. | 95,300 | 8,864,694 | |
| Paramount Bed Holdings Co. Ltd. | 205,600 | 7,648,082 | |
| Ricoh Leasing Co. Ltd. | 243,600 | 7,037,993 | |
| S Foods, Inc. (a) | 337,600 | 8,036,637 | |
| San-Ai Oil Co. Ltd. | 589,000 | 4,127,949 | |
| Shinsei Bank Ltd. | 3,781,000 | 5,299,360 | |
| Ship Healthcare Holdings, Inc. | 161,700 | 3,990,497 | |
| TKC Corp. | 239,700 | 6,512,310 | |
| Toshiba Plant Systems & Services Corp. | 582,700 | 7,205,920 | |
| Toyo Suisan Kaisha Ltd. | 103,400 | 3,651,856 | |
| Tsuruha Holdings, Inc. | 100,000 | 9,591,564 | |
| VT Holdings Co. Ltd. | 1,114,800 | 5,632,719 | |
| Welcia Holdings Co. Ltd. | 77,700 | 4,104,307 | |
| Yamada Consulting Group Co. Ltd. | 174,600 | 5,334,116 | |
| TOTAL JAPAN | 198,040,300 | ||
| Korea (South) - 1.3% | |||
| BGFretail Co. Ltd. | 17,709 | 2,875,051 | |
| Fila Korea Ltd. | 43,834 | 3,979,083 | |
| Hy-Lok Corp. | 125,792 | 3,123,733 | |
| NS Shopping Co. Ltd. (b) | 12,780 | 1,673,249 | |
| TOTAL KOREA (SOUTH) | 11,651,116 | ||
| Luxembourg - 0.5% | |||
| Grand City Properties SA | 189,517 | 4,186,054 | |
| Mexico - 0.0% | |||
| Genomma Lab Internacional SA de CV (b) | 66,889 | 73,480 | |
| Netherlands - 2.1% | |||
| Amsterdam Commodities NV | 196,055 | 5,296,907 | |
| Arcadis NV | 199,900 | 3,423,132 | |
| BinckBank NV | 737,859 | 4,343,556 | |
| IMCD Group BV | 142,000 | 5,733,174 | |
| TOTAL NETHERLANDS | 18,796,769 | ||
| New Zealand - 2.2% | |||
| EBOS Group Ltd. | 929,004 | 10,352,886 | |
| Nuplex Industries Ltd. | 2,454,889 | 9,033,445 | |
| TOTAL NEW ZEALAND | 19,386,331 | ||
| Norway - 2.0% | |||
| ABG Sundal Collier ASA (a) | 6,615,910 | 4,617,748 | |
| Ekornes A/S | 331,597 | 3,871,175 | |
| Kongsberg Gruppen ASA | 337,433 | 5,657,514 | |
| Spectrum ASA | 1,183,572 | 3,895,336 | |
| TOTAL NORWAY | 18,041,773 | ||
| Philippines - 0.2% | |||
| Century Pacific Food, Inc. | 4,939,000 | 1,984,631 | |
| Portugal - 0.5% | |||
| NOS SGPS SA | 670,400 | 4,809,274 | |
| Romania - 0.4% | |||
| Banca Transilvania SA | 5,501,626 | 3,775,557 | |
| Singapore - 2.2% | |||
| Boustead Projects Pte Ltd. (b) | 618,906 | 296,832 | |
| Boustead Singapore Ltd. | 2,267,369 | 1,315,052 | |
| Hour Glass Ltd. | 8,087,500 | 4,510,261 | |
| Mapletree Industrial (REIT) | 3,150,494 | 3,759,931 | |
| OSIM International Ltd. | 3,765,300 | 3,891,711 | |
| Wing Tai Holdings Ltd. | 4,110,600 | 5,731,029 | |
| TOTAL SINGAPORE | 19,504,816 | ||
| South Africa - 0.8% | |||
| Clicks Group Ltd. | 992,132 | 7,246,235 | |
| Spain - 0.5% | |||
| Hispania Activos Inmobiliarios SA (b) | 315,800 | 4,628,567 | |
| Sweden - 1.1% | |||
| Addlife AB (b) | 59,554 | 752,726 | |
| AddTech AB (B Shares) | 211,219 | 2,656,528 | |
| Coor Service Management Holding AB | 474,600 | 2,245,802 | |
| Ratos AB (B Shares) (a) | 711,500 | 4,162,440 | |
| TOTAL SWEDEN | 9,817,496 | ||
| Switzerland - 3.3% | |||
| Allied World Assurance Co. Holdings AG | 239,504 | 8,521,552 | |
| Daetwyler Holdings AG | 18,222 | 2,708,701 | |
| Pargesa Holding SA | 27,516 | 1,911,750 | |
| Vontobel Holdings AG | 189,326 | 8,190,377 | |
| VZ Holding AG | 24,982 | 7,773,509 | |
| TOTAL SWITZERLAND | 29,105,889 | ||
| Taiwan - 2.2% | |||
| King's Town Bank | 4,364,000 | 3,039,656 | |
| Sunspring Metal Corp. | 3,075,000 | 3,864,811 | |
| Tripod Technology Corp. | 2,830,000 | 5,177,631 | |
| Vanguard International Semiconductor Corp. | 3,124,000 | 4,782,274 | |
| Yung Chi Paint & Varnish Manufacturing Co. Ltd. | 1,182,000 | 2,630,895 | |
| TOTAL TAIWAN | 19,495,267 | ||
| Thailand - 1.0% | |||
| Delta Electronics PCL (For. Reg.) | 2,525,300 | 5,206,804 | |
| TISCO Financial Group PCL | 2,773,700 | 3,455,210 | |
| TOTAL THAILAND | 8,662,014 | ||
| Turkey - 0.4% | |||
| Aygaz A/S | 864,000 | 3,560,372 | |
| United Kingdom - 14.8% | |||
| Aberdeen Asset Management PLC | 799,849 | 3,490,905 | |
| AEW UK REIT PLC | 2,828,268 | 4,132,524 | |
| Alliance Pharma PLC | 3,728,897 | 2,451,815 | |
| Amec Foster Wheeler PLC | 556,552 | 4,016,424 | |
| Ashmore Group PLC (a) | 1,036,507 | 4,651,006 | |
| BBA Aviation PLC | 2,510,798 | 7,344,642 | |
| Bond International Software PLC | 899,666 | 1,156,801 | |
| Brammer PLC (a) | 1,014,728 | 2,587,259 | |
| Brewin Dolphin Holding PLC | 808,175 | 3,235,570 | |
| Cineworld Group PLC | 431,676 | 3,267,251 | |
| Close Brothers Group PLC | 269,680 | 4,775,800 | |
| Countrywide PLC | 1,161,507 | 6,031,621 | |
| Diploma PLC | 363,251 | 3,882,540 | |
| Elementis PLC | 1,178,900 | 3,718,985 | |
| Empiric Student Property PLC | 1,836,872 | 3,012,729 | |
| Exova Group Ltd. PLC | 1,002,769 | 2,344,313 | |
| Informa PLC | 560,320 | 5,358,467 | |
| ITE Group PLC | 1,873,654 | 4,250,263 | |
| James Fisher and Sons PLC | 204,800 | 4,234,296 | |
| Jardine Lloyd Thompson Group PLC | 270,900 | 3,431,807 | |
| John Wood Group PLC | 542,500 | 4,950,248 | |
| Luxfer Holdings PLC sponsored ADR | 491,254 | 6,312,614 | |
| McColl's Retail Group PLC | 1,844,974 | 4,313,254 | |
| Mears Group PLC | 1,047,710 | 6,100,483 | |
| Melrose Industries PLC | 142,773 | 778,751 | |
| Micro Focus International PLC | 507,044 | 11,327,864 | |
| PayPoint PLC | 243,111 | 2,994,518 | |
| Sinclair Pharma PLC (b) | 6,297,432 | 3,312,537 | |
| Spectris PLC | 200,847 | 5,344,045 | |
| The Restaurant Group PLC | 676,100 | 2,717,668 | |
| Ultra Electronics Holdings PLC | 259,525 | 6,696,759 | |
| TOTAL UNITED KINGDOM | 132,223,759 | ||
| United States of America - 0.9% | |||
| Dillard's, Inc. Class A | 93,994 | 6,621,877 | |
| Hornbeck Offshore Services, Inc. (a)(b) | 152,170 | 1,786,476 | |
| YOU On Demand Holdings, Inc. warrants 8/30/17 (b)(e) | 27,500 | 615 | |
| TOTAL UNITED STATES OF AMERICA | 8,408,968 | ||
| TOTAL COMMON STOCKS | |||
| (Cost $827,590,703) | 843,951,228 | ||
| Nonconvertible Preferred Stocks - 0.4% | |||
| Brazil - 0.4% | |||
| Banco ABC Brasil SA | |||
| (Cost $3,961,678) | 1,117,476 | 3,850,284 | |
| Money Market Funds - 6.0% | |||
| Fidelity Cash Central Fund, 0.38% (f) | 39,282,539 | 39,282,539 | |
| Fidelity Securities Lending Cash Central Fund, 0.42% (f)(g) | 13,711,375 | 13,711,375 | |
| TOTAL MONEY MARKET FUNDS | |||
| (Cost $52,993,914) | 52,993,914 | ||
| TOTAL INVESTMENT PORTFOLIO - 101.0% | |||
| (Cost $884,546,295) | 900,795,426 | ||
| NET OTHER ASSETS (LIABILITIES) - (1.0)% | (8,908,552) | ||
| NET ASSETS - 100% | $891,886,874 |
Categorizations in the Schedule of Investments are based on country or territory of incorporation.
Legend
(a) Security or a portion of the security is on loan at period end.
(b) Non-income producing
(c) Affiliated company
(d) Security or a portion of the security purchased on a delayed delivery or when-issued basis.
(e) Restricted securities - Investment in securities not registered under the Securities Act of 1933 (excluding 144A issues). At the end of the period, the value of restricted securities (excluding 144A issues) amounted to $615 or 0.0% of net assets.
(f) Affiliated fund that is generally available only to investment companies and other accounts managed by Fidelity Investments. The rate quoted is the annualized seven-day yield of the fund at period end. A complete unaudited listing of the fund's holdings as of its most recent quarter end is available upon request. In addition, each Fidelity Central Fund's financial statements are available on the SEC's website or upon request.
(g) Investment made with cash collateral received from securities on loan.
Additional information on each restricted holding is as follows:
| Security | Acquisition Date | Acquisition Cost |
| YOU On Demand Holdings, Inc. warrants 8/30/17 | 9/14/12 | $0 |
Affiliated Central Funds
Information regarding fiscal year to date income earned by the Fund from investments in Fidelity Central Funds is as follows:
| Fund | Income earned |
| Fidelity Cash Central Fund | $61,241 |
| Fidelity Securities Lending Cash Central Fund | 178,311 |
| Total | $239,552 |
Other Affiliated Issuers
An affiliated company is a company in which the Fund has ownership of at least 5% of the voting securities. Fiscal year to date transactions with companies which are or were affiliates are as follows:
| Affiliate | Value, beginning of period | Purchases | Sales Proceeds | Dividend Income | Value, end of period |
| Imdex Ltd. | $1,246,756 | $769,515 | $-- | $-- | $2,039,795 |
| Total | $1,246,756 | $769,515 | $-- | $-- | $2,039,795 |
Investment Valuation
The following is a summary of the inputs used, as of April 30, 2016, involving the Fund's assets and liabilities carried at fair value. The inputs or methodology used for valuing securities may not be an indication of the risk associated with investing in those securities. For more information on valuation inputs, and their aggregation into the levels used below, please refer to the Investment Valuation section in the accompanying Notes to Financial Statements.
| Valuation Inputs at Reporting Date: | ||||
| Description | Total | Level 1 | Level 2 | Level 3 |
| Investments in Securities: | ||||
| Equities: | ||||
| Consumer Discretionary | $135,678,269 | $77,543,137 | $58,135,132 | $-- |
| Consumer Staples | 79,343,595 | 45,822,562 | 33,521,033 | -- |
| Energy | 36,083,912 | 31,955,963 | 4,127,949 | -- |
| Financials | 184,335,775 | 152,249,248 | 32,086,527 | -- |
| Health Care | 77,652,797 | 48,200,521 | 29,452,276 | -- |
| Industrials | 175,903,353 | 121,229,081 | 54,674,272 | -- |
| Information Technology | 84,766,467 | 64,785,217 | 19,981,249 | 1 |
| Materials | 70,476,972 | 49,234,858 | 21,242,113 | 1 |
| Utilities | 3,560,372 | 3,560,372 | -- | -- |
| Money Market Funds | 52,993,914 | 52,993,914 | -- | -- |
| Total Investments in Securities: | $900,795,426 | $647,574,873 | $253,220,551 | $2 |
The following is a summary of transfers between Level 1 and Level 2 for the period ended April 30, 2016. Transfers are assumed to have occurred at the beginning of the period, and are primarily attributable to the valuation techniques used for foreign equity securities, as discussed in the accompanying Notes to Financial Statements:
| Transfers | Total |
| Level 1 to Level 2 | $3,784,452 |
| Level 2 to Level 1 | $53,766,744 |
See accompanying notes which are an integral part of the financial statements.
Financial Statements
Statement of Assets and Liabilities
| April 30, 2016 (Unaudited) | ||
| Assets | ||
| Investment in securities, at value (including securities loaned of $13,024,078) — See accompanying schedule: Unaffiliated issuers (cost $826,178,703) | $845,761,717 | |
| Fidelity Central Funds (cost $52,993,914) | 52,993,914 | |
| Other affiliated issuers (cost $5,373,678) | 2,039,795 | |
| Total Investments (cost $884,546,295) | $900,795,426 | |
| Foreign currency held at value (cost $3,435,438) | 3,443,129 | |
| Receivable for investments sold | 1,018,282 | |
| Receivable for fund shares sold | 680,172 | |
| Dividends receivable | 5,489,031 | |
| Distributions receivable from Fidelity Central Funds | 53,923 | |
| Prepaid expenses | 773 | |
| Other receivables | 13,513 | |
| Total assets | 911,494,249 | |
| Liabilities | ||
| Payable for investments purchased | ||
| Regular delivery | $2,507,860 | |
| Delayed delivery | 73,580 | |
| Payable for fund shares redeemed | 2,257,365 | |
| Accrued management fee | 696,108 | |
| Distribution and service plan fees payable | 20,488 | |
| Other affiliated payables | 220,069 | |
| Other payables and accrued expenses | 120,530 | |
| Collateral on securities loaned, at value | 13,711,375 | |
| Total liabilities | 19,607,375 | |
| Net Assets | $891,886,874 | |
| Net Assets consist of: | ||
| Paid in capital | $875,247,184 | |
| Undistributed net investment income | 8,805,214 | |
| Accumulated undistributed net realized gain (loss) on investments and foreign currency transactions | (8,523,197) | |
| Net unrealized appreciation (depreciation) on investments and assets and liabilities in foreign currencies | 16,357,673 | |
| Net Assets | $891,886,874 | |
| Calculation of Maximum Offering Price | ||
| Class A: | ||
| Net Asset Value and redemption price per share ($31,897,656 ÷ 1,419,288 shares) | $22.47 | |
| Maximum offering price per share (100/94.25 of $22.47) | $23.84 | |
| Class T: | ||
| Net Asset Value and redemption price per share ($13,016,808 ÷ 582,355 shares) | $22.35 | |
| Maximum offering price per share (100/96.50 of $22.35) | $23.16 | |
| Class B: | ||
| Net Asset Value and offering price per share ($276,630 ÷ 12,519 shares)(a) | $22.10 | |
| Class C: | ||
| Net Asset Value and offering price per share ($9,910,610 ÷ 455,303 shares)(a) | $21.77 | |
| International Small Cap: | ||
| Net Asset Value, offering price and redemption price per share ($828,798,591 ÷ 36,296,748 shares) | $22.83 | |
| Class I: | ||
| Net Asset Value, offering price and redemption price per share ($7,986,579 ÷ 347,003 shares) | $23.02 |
(a) Redemption price per share is equal to net asset value less any applicable contingent deferred sales charge.
See accompanying notes which are an integral part of the financial statements.
Statement of Operations
| Six months ended April 30, 2016 (Unaudited) | ||
| Investment Income | ||
| Dividends | $15,653,620 | |
| Income from Fidelity Central Funds | 239,552 | |
| Income before foreign taxes withheld | 15,893,172 | |
| Less foreign taxes withheld | (1,109,413) | |
| Total income | 14,783,759 | |
| Expenses | ||
| Management fee | ||
| Basic fee | $3,548,462 | |
| Performance adjustment | 764,573 | |
| Transfer agent fees | 1,114,365 | |
| Distribution and service plan fees | 119,772 | |
| Accounting and security lending fees | 200,536 | |
| Custodian fees and expenses | 146,102 | |
| Independent trustees' compensation | 1,816 | |
| Registration fees | 47,264 | |
| Audit | 52,823 | |
| Legal | 1,099 | |
| Miscellaneous | 2,661 | |
| Total expenses before reductions | 5,999,473 | |
| Expense reductions | (7,275) | 5,992,198 |
| Net investment income (loss) | 8,791,561 | |
| Realized and Unrealized Gain (Loss) | ||
| Net realized gain (loss) on: | ||
| Investment securities: | ||
| Unaffiliated issuers | (883,158) | |
| Foreign currency transactions | (42,970) | |
| Total net realized gain (loss) | (926,128) | |
| Change in net unrealized appreciation (depreciation) on: Investment securities | 17,069,850 | |
| Assets and liabilities in foreign currencies | 179,334 | |
| Total change in net unrealized appreciation (depreciation) | 17,249,184 | |
| Net gain (loss) | 16,323,056 | |
| Net increase (decrease) in net assets resulting from operations | $25,114,617 |
See accompanying notes which are an integral part of the financial statements.
Statement of Changes in Net Assets
| Six months ended April 30, 2016 (Unaudited) | Year ended October 31, 2015 | |
| Increase (Decrease) in Net Assets | ||
| Operations | ||
| Net investment income (loss) | $8,791,561 | $11,998,423 |
| Net realized gain (loss) | (926,128) | 25,838,406 |
| Change in net unrealized appreciation (depreciation) | 17,249,184 | 6,824,724 |
| Net increase (decrease) in net assets resulting from operations | 25,114,617 | 44,661,553 |
| Distributions to shareholders from net investment income | (10,933,091) | (7,662,528) |
| Distributions to shareholders from net realized gain | (23,540,154) | (116,906,834) |
| Total distributions | (34,473,245) | (124,569,362) |
| Share transactions - net increase (decrease) | 27,183,054 | 53,722,708 |
| Redemption fees | 70,645 | 103,111 |
| Total increase (decrease) in net assets | 17,895,071 | (26,081,990) |
| Net Assets | ||
| Beginning of period | 873,991,803 | 900,073,793 |
| End of period (including undistributed net investment income of $8,805,214 and undistributed net investment income of $10,946,744, respectively) | $891,886,874 | $873,991,803 |
See accompanying notes which are an integral part of the financial statements.
Financial Highlights — Fidelity International Small Cap Fund Class A
| Six months ended (Unaudited) April 30, | Years ended October 31, | |||||
| 2016 | 2015 | 2014 | 2013 | 2012 | 2011 | |
| Selected Per–Share Data | ||||||
| Net asset value, beginning of period | $22.69 | $24.98 | $26.34 | $19.74 | $18.97 | $20.42 |
| Income from Investment Operations | ||||||
| Net investment income (loss)A | .20 | .27 | .17 | .06 | .06 | .10 |
| Net realized and unrealized gain (loss) | .45 | 1.05 | (.89) | 6.94 | 1.09 | (.88) |
| Total from investment operations | .65 | 1.32 | (.72) | 7.00 | 1.15 | (.78) |
| Distributions from net investment income | (.25) | (.16) | (.05) | (.07) | (.11) | (.02) |
| Distributions from net realized gain | (.62) | (3.45) | (.60) | (.33) | (.27) | (.66) |
| Total distributions | (.87) | (3.61) | (.65) | (.40) | (.38) | (.68) |
| Redemption fees added to paid in capitalA | –B | –B | .01 | –B | –B | .01 |
| Net asset value, end of period | $22.47 | $22.69 | $24.98 | $26.34 | $19.74 | $18.97 |
| Total ReturnC,D,E | 2.97% | 6.21% | (2.79)% | 36.18% | 6.28% | (4.00)% |
| Ratios to Average Net AssetsF,G | ||||||
| Expenses before reductions | 1.66%H | 1.59% | 1.50% | 1.61% | 1.63% | 1.56% |
| Expenses net of fee waivers, if any | 1.66%H | 1.58% | 1.50% | 1.61% | 1.63% | 1.55% |
| Expenses net of all reductions | 1.66%H | 1.58% | 1.50% | 1.60% | 1.60% | 1.54% |
| Net investment income (loss) | 1.88%H | 1.18% | .65% | .25% | .32% | .49% |
| Supplemental Data | ||||||
| Net assets, end of period (000 omitted) | $31,898 | $28,238 | $24,572 | $24,020 | $14,125 | $17,185 |
| Portfolio turnover rateI | 25%H | 36% | 102% | 54% | 68% | 47% |
A Calculated based on average shares outstanding during the period.
B Amount represents less than $.005 per share.
C Total returns for periods of less than one year are not annualized.
D Total returns would have been lower if certain expenses had not been reduced during the applicable periods shown.
E Total returns do not include the effect of the sales charges.
F Fees and expenses of any underlying Fidelity Central Funds are not included in the Fund's expense ratio. The Fund indirectly bears its proportionate share of the expenses of any underlying Fidelity Central Funds.
G Expense ratios reflect operating expenses of the class. Expenses before reductions do not reflect amounts reimbursed by the investment adviser or reductions from brokerage service arrangements or reductions from other expense offset arrangements and do not represent the amount paid by the class during periods when reimbursements or reductions occur. Expenses net of fee waivers reflect expenses after reimbursement by the investment adviser but prior to reductions from brokerage service arrangements or other expense offset arrangements. Expenses net of all reductions represent the net expenses paid by the class.
H Annualized
I Amount does not include the portfolio activity of any underlying Fidelity Central Funds.
See accompanying notes which are an integral part of the financial statements.
Financial Highlights — Fidelity International Small Cap Fund Class T
| Six months ended (Unaudited) April 30, | Years ended October 31, | |||||
| 2016 | 2015 | 2014 | 2013 | 2012 | 2011 | |
| Selected Per–Share Data | ||||||
| Net asset value, beginning of period | $22.55 | $24.81 | $26.17 | $19.59 | $18.80 | $20.23 |
| Income from Investment Operations | ||||||
| Net investment income (loss)A | .17 | .21 | .10 | –B | .01 | .05 |
| Net realized and unrealized gain (loss) | .44 | 1.04 | (.87) | 6.90 | 1.08 | (.86) |
| Total from investment operations | .61 | 1.25 | (.77) | 6.90 | 1.09 | (.81) |
| Distributions from net investment income | (.19) | (.06) | – | – | (.03) | – |
| Distributions from net realized gain | (.62) | (3.45) | (.60) | (.32) | (.27) | (.63) |
| Total distributions | (.81) | (3.51) | (.60) | (.32) | (.30) | (.63) |
| Redemption fees added to paid in capitalA | –B | –B | .01 | –B | –B | .01 |
| Net asset value, end of period | $22.35 | $22.55 | $24.81 | $26.17 | $19.59 | $18.80 |
| Total ReturnC,D,E | 2.81% | 5.90% | (3.00)% | 35.80% | 5.97% | (4.18)% |
| Ratios to Average Net AssetsF,G | ||||||
| Expenses before reductions | 1.95%H | 1.87% | 1.77% | 1.87% | 1.88% | 1.82% |
| Expenses net of fee waivers, if any | 1.95%H | 1.86% | 1.77% | 1.87% | 1.88% | 1.81% |
| Expenses net of all reductions | 1.95%H | 1.86% | 1.76% | 1.85% | 1.85% | 1.79% |
| Net investment income (loss) | 1.58%H | .90% | .38% | (.01)% | .07% | .24% |
| Supplemental Data | ||||||
| Net assets, end of period (000 omitted) | $13,017 | $12,400 | $12,296 | $13,530 | $9,262 | $13,744 |
| Portfolio turnover rateI | 25%H | 36% | 102% | 54% | 68% | 47% |
A Calculated based on average shares outstanding during the period.
B Amount represents less than $.005 per share.
C Total returns for periods of less than one year are not annualized.
D Total returns would have been lower if certain expenses had not been reduced during the applicable periods shown.
E Total returns do not include the effect of the sales charges.
F Fees and expenses of any underlying Fidelity Central Funds are not included in the Fund's expense ratio. The Fund indirectly bears its proportionate share of the expenses of any underlying Fidelity Central Funds.
G Expense ratios reflect operating expenses of the class. Expenses before reductions do not reflect amounts reimbursed by the investment adviser or reductions from brokerage service arrangements or reductions from other expense offset arrangements and do not represent the amount paid by the class during periods when reimbursements or reductions occur. Expenses net of fee waivers reflect expenses after reimbursement by the investment adviser but prior to reductions from brokerage service arrangements or other expense offset arrangements. Expenses net of all reductions represent the net expenses paid by the class.
H Annualized
I Amount does not include the portfolio activity of any underlying Fidelity Central Funds.
See accompanying notes which are an integral part of the financial statements.
Financial Highlights — Fidelity International Small Cap Fund Class B
| Six months ended (Unaudited) April 30, | Years ended October 31, | |||||
| 2016 | 2015 | 2014 | 2013 | 2012 | 2011 | |
| Selected Per–Share Data | ||||||
| Net asset value, beginning of period | $22.22 | $24.51 | $25.87 | $19.22 | $18.38 | $19.79 |
| Income from Investment Operations | ||||||
| Net investment income (loss)A | .12 | .09 | (.03) | (.11) | (.08) | (.05) |
| Net realized and unrealized gain (loss) | .44 | 1.04 | (.87) | 6.84 | 1.07 | (.85) |
| Total from investment operations | .56 | 1.13 | (.90) | 6.73 | .99 | (.90) |
| Distributions from net investment income | (.06) | – | – | – | – | – |
| Distributions from net realized gain | (.62) | (3.42) | (.47) | (.08) | (.15) | (.52) |
| Total distributions | (.68) | (3.42) | (.47) | (.08) | (.15) | (.52) |
| Redemption fees added to paid in capitalA | –B | –B | .01 | –B | –B | .01 |
| Net asset value, end of period | $22.10 | $22.22 | $24.51 | $25.87 | $19.22 | $18.38 |
| Total ReturnC,D,E | 2.59% | 5.40% | (3.52)% | 35.14% | 5.45% | (4.68)% |
| Ratios to Average Net AssetsF,G | ||||||
| Expenses before reductions | 2.44%H | 2.36% | 2.28% | 2.37% | 2.38% | 2.32% |
| Expenses net of fee waivers, if any | 2.44%H | 2.36% | 2.28% | 2.36% | 2.38% | 2.30% |
| Expenses net of all reductions | 2.44%H | 2.36% | 2.27% | 2.35% | 2.35% | 2.29% |
| Net investment income (loss) | 1.09%H | .41% | (.13)% | (.51)% | (.43)% | (.26)% |
| Supplemental Data | ||||||
| Net assets, end of period (000 omitted) | $277 | $390 | $507 | $795 | $790 | $2,067 |
| Portfolio turnover rateI | 25%H | 36% | 102% | 54% | 68% | 47% |
A Calculated based on average shares outstanding during the period.
B Amount represents less than $.005 per share.
C Total returns for periods of less than one year are not annualized.
D Total returns would have been lower if certain expenses had not been reduced during the applicable periods shown.
E Total returns do not include the effect of the contingent deferred sales charge.
F Fees and expenses of any underlying Fidelity Central Funds are not included in the Fund's expense ratio. The Fund indirectly bears its proportionate share of the expenses of any underlying Fidelity Central Funds.
G Expense ratios reflect operating expenses of the class. Expenses before reductions do not reflect amounts reimbursed by the investment adviser or reductions from brokerage service arrangements or reductions from other expense offset arrangements and do not represent the amount paid by the class during periods when reimbursements or reductions occur. Expenses net of fee waivers reflect expenses after reimbursement by the investment adviser but prior to reductions from brokerage service arrangements or other expense offset arrangements. Expenses net of all reductions represent the net expenses paid by the class.
H Annualized
I Amount does not include the portfolio activity of any underlying Fidelity Central Funds.
See accompanying notes which are an integral part of the financial statements.
Financial Highlights — Fidelity International Small Cap Fund Class C
| Six months ended (Unaudited) April 30, | Years ended October 31, | |||||
| 2016 | 2015 | 2014 | 2013 | 2012 | 2011 | |
| Selected Per–Share Data | ||||||
| Net asset value, beginning of period | $21.96 | $24.27 | $25.68 | $19.18 | $18.38 | $19.85 |
| Income from Investment Operations | ||||||
| Net investment income (loss)A | .11 | .09 | (.02) | (.11) | (.08) | (.04) |
| Net realized and unrealized gain (loss) | .45 | 1.02 | (.85) | 6.79 | 1.07 | (.85) |
| Total from investment operations | .56 | 1.11 | (.87) | 6.68 | .99 | (.89) |
| Distributions from net investment income | (.13) | – | – | – | – | – |
| Distributions from net realized gain | (.62) | (3.42) | (.55) | (.18) | (.19) | (.59) |
| Total distributions | (.75) | (3.42) | (.55) | (.18) | (.19) | (.59) |
| Redemption fees added to paid in capitalA | –B | –B | .01 | –B | –B | .01 |
| Net asset value, end of period | $21.77 | $21.96 | $24.27 | $25.68 | $19.18 | $18.38 |
| Total ReturnC,D,E | 2.61% | 5.37% | (3.43)% | 35.15% | 5.46% | (4.64)% |
| Ratios to Average Net AssetsF,G | ||||||
| Expenses before reductions | 2.44%H | 2.36% | 2.23% | 2.33% | 2.38% | 2.27% |
| Expenses net of fee waivers, if any | 2.44%H | 2.35% | 2.22% | 2.33% | 2.38% | 2.26% |
| Expenses net of all reductions | 2.44%H | 2.35% | 2.22% | 2.32% | 2.35% | 2.24% |
| Net investment income (loss) | 1.09%H | .41% | (.07)% | (.47)% | (.43)% | (.21)% |
| Supplemental Data | ||||||
| Net assets, end of period (000 omitted) | $9,911 | $11,359 | $12,576 | $13,426 | $6,799 | $9,545 |
| Portfolio turnover rateI | 25%H | 36% | 102% | 54% | 68% | 47% |
A Calculated based on average shares outstanding during the period.
B Amount represents less than $.005 per share.
C Total returns for periods of less than one year are not annualized.
D Total returns would have been lower if certain expenses had not been reduced during the applicable periods shown.
E Total returns do not include the effect of the contingent deferred sales charge.
F Fees and expenses of any underlying Fidelity Central Funds are not included in the Fund's expense ratio. The Fund indirectly bears its proportionate share of the expenses of any underlying Fidelity Central Funds.
G Expense ratios reflect operating expenses of the class. Expenses before reductions do not reflect amounts reimbursed by the investment adviser or reductions from brokerage service arrangements or reductions from other expense offset arrangements and do not represent the amount paid by the class during periods when reimbursements or reductions occur. Expenses net of fee waivers reflect expenses after reimbursement by the investment adviser but prior to reductions from brokerage service arrangements or other expense offset arrangements. Expenses net of all reductions represent the net expenses paid by the class.
H Annualized
I Amount does not include the portfolio activity of any underlying Fidelity Central Funds.
See accompanying notes which are an integral part of the financial statements.
Financial Highlights — Fidelity International Small Cap Fund
| Six months ended (Unaudited) April 30, | Years ended October 31, | |||||
| 2016 | 2015 | 2014 | 2013 | 2012 | 2011 | |
| Selected Per–Share Data | ||||||
| Net asset value, beginning of period | $23.06 | $25.34 | $26.67 | $19.99 | $19.23 | $20.66 |
| Income from Investment Operations | ||||||
| Net investment income (loss)A | .23 | .34 | .25 | .12 | .11 | .17 |
| Net realized and unrealized gain (loss) | .45 | 1.07 | (.90) | 7.02 | 1.10 | (.89) |
| Total from investment operations | .68 | 1.41 | (.65) | 7.14 | 1.21 | (.72) |
| Distributions from net investment income | (.29) | (.24) | (.09) | (.14) | (.18) | (.06) |
| Distributions from net realized gain | (.62) | (3.45) | (.60) | (.33) | (.27) | (.66) |
| Total distributions | (.91) | (3.69) | (.69) | (.46)B | (.45) | (.72) |
| Redemption fees added to paid in capitalA | –C | –C | .01 | –C | –C | .01 |
| Net asset value, end of period | $22.83 | $23.06 | $25.34 | $26.67 | $19.99 | $19.23 |
| Total ReturnD,E | 3.07% | 6.53% | (2.48)% | 36.56% | 6.55% | (3.65)% |
| Ratios to Average Net AssetsF,G | ||||||
| Expenses before reductions | 1.40%H | 1.31% | 1.21% | 1.33% | 1.35% | 1.26% |
| Expenses net of fee waivers, if any | 1.40%H | 1.31% | 1.20% | 1.32% | 1.35% | 1.25% |
| Expenses net of all reductions | 1.40%H | 1.31% | 1.20% | 1.31% | 1.33% | 1.23% |
| Net investment income (loss) | 2.13%H | 1.45% | .95% | .53% | .59% | .80% |
| Supplemental Data | ||||||
| Net assets, end of period (000 omitted) | $828,799 | $811,534 | $842,031 | $1,029,629 | $692,769 | $856,692 |
| Portfolio turnover rateI | 25%H | 36% | 102% | 54% | 68% | 47% |
A Calculated based on average shares outstanding during the period.
B Total distributions of $.46 per share is comprised of distributions from net investment income of $.136 and distributions from net realized gain of $.327 per share.
C Amount represents less than $.005 per share.
D Total returns for periods of less than one year are not annualized.
E Total returns would have been lower if certain expenses had not been reduced during the applicable periods shown.
F Fees and expenses of any underlying Fidelity Central Funds are not included in the Fund's expense ratio. The Fund indirectly bears its proportionate share of the expenses of any underlying Fidelity Central Funds.
G Expense ratios reflect operating expenses of the class. Expenses before reductions do not reflect amounts reimbursed by the investment adviser or reductions from brokerage service arrangements or reductions from other expense offset arrangements and do not represent the amount paid by the class during periods when reimbursements or reductions occur. Expenses net of fee waivers reflect expenses after reimbursement by the investment adviser but prior to reductions from brokerage service arrangements or other expense offset arrangements. Expenses net of all reductions represent the net expenses paid by the class.
H Annualized
I Amount does not include the portfolio activity of any underlying Fidelity Central Funds.
See accompanying notes which are an integral part of the financial statements.
Financial Highlights — Fidelity International Small Cap Fund Class I
| Six months ended (Unaudited) April 30, | Years ended October 31, | |||||
| 2016 | 2015 | 2014 | 2013 | 2012 | 2011 | |
| Selected Per–Share Data | ||||||
| Net asset value, beginning of period | $23.24 | $25.34 | $26.67 | $20.00 | $19.24 | $20.66 |
| Income from Investment Operations | ||||||
| Net investment income (loss)A | .24 | .36 | .29 | .16 | .13 | .18 |
| Net realized and unrealized gain (loss) | .47 | 1.07 | (.90) | 7.00 | 1.10 | (.89) |
| Total from investment operations | .71 | 1.43 | (.61) | 7.16 | 1.23 | (.71) |
| Distributions from net investment income | (.31) | (.08) | (.13) | (.16) | (.20) | (.06) |
| Distributions from net realized gain | (.62) | (3.45) | (.60) | (.33) | (.27) | (.66) |
| Total distributions | (.93) | (3.53) | (.73) | (.49) | (.47) | (.72) |
| Redemption fees added to paid in capitalA | –B | –B | .01 | –B | –B | .01 |
| Net asset value, end of period | $23.02 | $23.24 | $25.34 | $26.67 | $20.00 | $19.24 |
| Total ReturnC,D | 3.16% | 6.60% | (2.35)% | 36.68% | 6.65% | (3.62)% |
| Ratios to Average Net AssetsE,F | ||||||
| Expenses before reductions | 1.34%G | 1.24% | 1.08% | 1.20% | 1.25% | 1.22% |
| Expenses net of fee waivers, if any | 1.34%G | 1.23% | 1.08% | 1.20% | 1.25% | 1.21% |
| Expenses net of all reductions | 1.34%G | 1.23% | 1.08% | 1.18% | 1.22% | 1.19% |
| Net investment income (loss) | 2.20%G | 1.53% | 1.07% | .66% | .70% | .84% |
| Supplemental Data | ||||||
| Net assets, end of period (000 omitted) | $7,987 | $10,070 | $8,092 | $67,038 | $9,503 | $15,752 |
| Portfolio turnover rateH | 25%G | 36% | 102% | 54% | 68% | 47% |
A Calculated based on average shares outstanding during the period.
B Amount represents less than $.005 per share.
C Total returns for periods of less than one year are not annualized.
D Total returns would have been lower if certain expenses had not been reduced during the applicable periods shown.
E Fees and expenses of any underlying Fidelity Central Funds are not included in the Fund's expense ratio. The Fund indirectly bears its proportionate share of the expenses of any underlying Fidelity Central Funds.
F Expense ratios reflect operating expenses of the class. Expenses before reductions do not reflect amounts reimbursed by the investment adviser or reductions from brokerage service arrangements or reductions from other expense offset arrangements and do not represent the amount paid by the class during periods when reimbursements or reductions occur. Expenses net of fee waivers reflect expenses after reimbursement by the investment adviser but prior to reductions from brokerage service arrangements or other expense offset arrangements. Expenses net of all reductions represent the net expenses paid by the class.
G Annualized
H Amount does not include the portfolio activity of any underlying Fidelity Central Funds.
See accompanying notes which are an integral part of the financial statements.
Notes to Financial Statements (Unaudited)
For the period ended April 30, 2016
1. Organization.
Fidelity International Small Cap Fund (the Fund) is a fund of Fidelity Investment Trust (the Trust) and is authorized to issue an unlimited number of shares. The Trust is registered under the Investment Company Act of 1940, as amended (the 1940 Act), as an open-end management investment company organized as a Massachusetts business trust. The Fund offers Class A, Class T, Class C, International Small Cap and Class I shares, each of which, along with Class B shares, has equal rights as to assets and voting privileges. Class B shares are closed to new accounts and additional purchases, except for exchanges and reinvestments. Each class has exclusive voting rights with respect to matters that affect that class. Class B shares will automatically convert to Class A shares after a maximum holding period of seven years from the initial date of purchase. The Fund's investments in emerging markets can be subject to social, economic, regulatory, and political uncertainties and can be extremely volatile.
During the period, the Board of Trustees approved the conversion of all existing Class B shares into Class A shares, effective on or about July 1, 2016, regardless of the length of times shares have been held.
2. Investments in Fidelity Central Funds.
The Fund invests in Fidelity Central Funds, which are open-end investment companies generally available only to other investment companies and accounts managed by the investment adviser and its affiliates. The Fund's Schedule of Investments lists each of the Fidelity Central Funds held as of period end, if any, as an investment of the Fund, but does not include the underlying holdings of each Fidelity Central Fund. As an Investing Fund, the Fund indirectly bears its proportionate share of the expenses of the underlying Fidelity Central Funds.
The Money Market Central Funds seek preservation of capital and current income and are managed by Fidelity Investments Money Management, Inc. (FIMM), an affiliate of the investment adviser. Annualized expenses of the Money Market Central Funds as of their most recent shareholder report date are less than .005%.
A complete unaudited list of holdings for each Fidelity Central Fund is available upon request or at the Securities and Exchange Commission (the SEC) website at www.sec.gov. In addition, the financial statements of the Fidelity Central Funds are available on the SEC website or upon request.
3. Significant Accounting Policies.
The financial statements have been prepared in conformity with accounting principles generally accepted in the United States of America (GAAP), which require management to make certain estimates and assumptions at the date of the financial statements. Actual results could differ from those estimates. Subsequent events, if any, through the date that the financial statements were issued have been evaluated in the preparation of the financial statements. The following summarizes the significant accounting policies of the Fund:
Investment Valuation. Investments are valued as of 4:00 p.m. Eastern time on the last calendar day of the period. The Board of Trustees (the Board) has delegated the day to day responsibility for the valuation of the Fund's investments to the Fidelity Management & Research Company (FMR) Fair Value Committee (the Committee). In accordance with valuation policies and procedures approved by the Board, the Fund attempts to obtain prices from one or more third party pricing vendors or brokers to value its investments. When current market prices, quotations or currency exchange rates are not readily available or reliable, investments will be fair valued in good faith by the Committee, in accordance with procedures adopted by the Board. Factors used in determining fair value vary by investment type and may include market or investment specific events. The frequency with which these procedures are used cannot be predicted and they may be utilized to a significant extent. The Committee oversees the Fund's valuation policies and procedures and reports to the Board on the Committee's activities and fair value determinations. The Board monitors the appropriateness of the procedures used in valuing the Fund's investments and ratifies the fair value determinations of the Committee.
The Fund categorizes the inputs to valuation techniques used to value its investments into a disclosure hierarchy consisting of three levels as shown below:
- Level 1 – quoted prices in active markets for identical investments
- Level 2 – other significant observable inputs (including quoted prices for similar investments, interest rates, prepayment speeds, etc.)
- Level 3 – unobservable inputs (including the Fund's own assumptions based on the best information available)
Valuation techniques used to value the Fund's investments by major category are as follows:
Equity securities, including restricted securities, for which market quotations are readily available, are valued at the last reported sale price or official closing price as reported by a third party pricing vendor on the primary market or exchange on which they are traded and are categorized as Level 1 in the hierarchy. In the event there were no sales during the day or closing prices are not available, securities are valued at the last quoted bid price or may be valued using the last available price and are generally categorized as Level 2 in the hierarchy. For foreign equity securities, when market or security specific events arise, comparisons to the valuation of American Depositary Receipts (ADRs), futures contracts, Exchange-Traded Funds (ETFs) and certain indexes as well as quoted prices for similar securities may be used and would be categorized as Level 2 in the hierarchy. Utilizing these techniques may result in transfers between Level 1 and Level 2. For equity securities, including restricted securities, where observable inputs are limited, assumptions about market activity and risk are used and these securities may be categorized as Level 3 in the hierarchy.
Investments in open-end mutual funds, including the Fidelity Central Funds, are valued at their closing net asset value (NAV) each business day and are categorized as Level 1 in the hierarchy.
Changes in valuation techniques may result in transfers in or out of an assigned level within the disclosure hierarchy. The aggregate value of investments by input level as of April 30, 2016, including information on transfers between Levels 1 and 2, is included at the end of the Fund's Schedule of Investments.
Foreign Currency. The Fund may use foreign currency contracts to facilitate transactions in foreign-denominated securities. Gains and losses from these transactions may arise from changes in the value of the foreign currency or if the counterparties do not perform under the contracts' terms.
Foreign-denominated assets, including investment securities, and liabilities are translated into U.S. dollars at the exchange rates at period end. Purchases and sales of investment securities, income and dividends received and expenses denominated in foreign currencies are translated into U.S. dollars at the exchange rate in effect on the transaction date.
The effects of exchange rate fluctuations on investments are included with the net realized and unrealized gain (loss) on investment securities. Other foreign currency transactions resulting in realized and unrealized gain (loss) are disclosed separately.
Investment Transactions and Income. For financial reporting purposes, the Fund's investment holdings and NAV include trades executed through the end of the last business day of the period. The NAV per share for processing shareholder transactions is calculated as of the close of business of the New York Stock Exchange (NYSE), normally 4:00 p.m. Eastern time and includes trades executed through the end of the prior business day. Gains and losses on securities sold are determined on the basis of identified cost and may include proceeds received from litigation. Dividend income is recorded on the ex-dividend date, except for certain dividends from foreign securities where the ex-dividend date may have passed, which are recorded as soon as the Fund is informed of the ex-dividend date. Non-cash dividends included in dividend income, if any, are recorded at the fair market value of the securities received. Income and capital gain distributions from Fidelity Central Funds, if any, are recorded on the ex-dividend date. Distributions received on securities that represent a return of capital or capital gain are recorded as a reduction of cost of investments and/or as a realized gain. Subsequent to ex-dividend date the Fund determines the components of these distributions, based upon receipt of tax filings or other correspondence relating to the underlying investment.
Class Allocations and Expenses. Investment income, realized and unrealized capital gains and losses, common expenses of the Fund, and certain fund-level expense reductions, if any, are allocated daily on a pro-rata basis to each class based on the relative net assets of each class to the total net assets of the Fund. Each class differs with respect to transfer agent and distribution and service plan fees incurred. Certain expense reductions may also differ by class. For the reporting period, the allocated portion of income and expenses to each class as a percent of its average net assets may vary due to the timing of recording these transactions in relation to fluctuating net assets of the classes. Expenses directly attributable to a fund are charged to that fund. Expenses attributable to more than one fund are allocated among the respective funds on the basis of relative net assets or other appropriate methods. Expense estimates are accrued in the period to which they relate and adjustments are made when actual amounts are known.
Income Tax Information and Distributions to Shareholders. Each year, the Fund intends to qualify as a regulated investment company under Subchapter M of the Internal Revenue Code, including distributing substantially all of its taxable income and realized gains. As a result, no provision for U.S. Federal income taxes is required. The Fund files a U.S. federal tax return, in addition to state and local tax returns as required. The Fund's federal income tax returns are subject to examination by the Internal Revenue Service (IRS) for a period of three fiscal years after they are filed. State and local tax returns may be subject to examination for an additional fiscal year depending on the jurisdiction. Foreign taxes are provided for based on the Fund's understanding of the tax rules and rates that exist in the foreign markets in which it invests.
Distributions are declared and recorded on the ex-dividend date. Income dividends and capital gain distributions are declared separately for each class. Income and capital gain distributions are determined in accordance with income tax regulations, which may differ from GAAP.
Capital accounts within the financial statements are adjusted for permanent book-tax differences. These adjustments have no impact on net assets or the results of operations. Capital accounts are not adjusted for temporary book-tax differences which will reverse in a subsequent period.
Book-tax differences are primarily due to foreign currency transactions, certain foreign taxes, passive foreign investment companies (PFIC) and losses deferred due to wash sales.
The federal tax cost of investment securities and unrealized appreciation (depreciation) as of period end were as follows:
| Gross unrealized appreciation | $118,739,691 |
| Gross unrealized depreciation | (109,342,665) |
| Net unrealized appreciation (depreciation) on securities | $9,397,026 |
| Tax cost | $891,398,400 |
Short-Term Trading (Redemption) Fees. Shares held by investors in the Fund less than 90 days may have been subject to a redemption fee equal to 2.00% of the NAV of shares redeemed. All redemption fees, which reduce the proceeds of the shareholder redemption, are retained by the Fund and accounted for as an addition to paid in capital.
Delayed Delivery Transactions and When-Issued Securities. During the period, the Fund transacted in securities on a delayed delivery or when-issued basis. Payment and delivery may take place after the customary settlement period for that security. The price of the underlying securities and the date when the securities will be delivered and paid for are fixed at the time the transaction is negotiated. The securities purchased on a delayed delivery or when-issued basis are identified as such in the Fund's Schedule of Investments. With respect to purchase commitments, the Fund identifies securities as segregated in its records with a value at least equal to the amount of the commitment. Losses may arise due to changes in the value of the underlying securities or if the counterparty does not perform under the contract's terms, or if the issuer does not issue the securities due to political, economic, or other factors.
Restricted Securities. The Fund may invest in securities that are subject to legal or contractual restrictions on resale. These securities generally may be resold in transactions exempt from registration or to the public if the securities are registered. Disposal of these securities may involve time-consuming negotiations and expense, and prompt sale at an acceptable price may be difficult. Information regarding restricted securities is included at the end of the Fund's Schedule of Investments.
4. Purchases and Sales of Investments.
Purchases and sales of securities, other than short-term securities, aggregated $105,149,143 and $100,546,287, respectively.
5. Fees and Other Transactions with Affiliates.
Management Fee. Fidelity Management & Research Company (the investment adviser) and its affiliates provide the Fund with investment management related services for which the Fund pays a monthly management fee. The management fee is the sum of an individual fund fee rate that is based on an annual rate of .60% of the Fund's average net assets and an annualized group fee rate that averaged .25% during the period. The group fee rate is based upon the average net assets of all the mutual funds advised by the investment adviser, including any mutual funds previously advised by the investment adviser that are currently advised by Fidelity SelectCo, LLC, an affiliate of the investment adviser. The group fee rate decreases as assets under management increase and increases as assets under management decrease. In addition, the management fee is subject to a performance adjustment (up to a maximum of +/- .20% of the Fund's average net assets over a 36 month performance period). The upward or downward adjustment to the management fee is based on the relative investment performance of International Small Cap as compared to its benchmark index, the MSCI ACWI (All Country World Index) ex USA Small Cap Index effective April 1, 2014 (the MSCI EAFE Small Cap Index prior to April 1, 2014), over the same 36 month performance period. For the reporting period, the total annualized management fee rate, including the performance adjustment, was 1.03% of the Fund's average net assets. The performance adjustment included in the management fee rate may be higher or lower than the maximum performance adjustment rate due to the difference between the average net assets for the reporting and performance periods.
Distribution and Service Plan Fees. In accordance with Rule 12b-1 of the 1940 Act, the Fund has adopted separate Distribution and Service Plans for each class of shares. Certain classes pay Fidelity Distributors Corporation (FDC), an affiliate of the investment adviser, separate Distribution and Service Fees, each of which is based on an annual percentage of each class' average net assets. In addition, FDC may pay financial intermediaries for selling shares of the Fund and providing shareholder support services. For the period, the Distribution and Service Fee rates, total fees and amounts retained by FDC were as follows:
| Distribution Fee | Service Fee | Total Fees | Retained by FDC | |
| Class A | -% | .25% | $36,761 | $– |
| Class T | .25% | .25% | 30,678 | – |
| Class B | .75% | .25% | 1,596 | 1,197 |
| Class C | .75% | .25% | 50,737 | 8,321 |
| $119,772 | $9,518 |
Sales Load. FDC may receive a front-end sales charge of up to 5.75% for selling Class A shares and 3.50% for selling Class T shares, some of which is paid to financial intermediaries for selling shares of the Fund. Depending on the holding period, FDC may receive contingent deferred sales charges levied on Class A, Class T, Class B, and Class C redemptions. The deferred sales charges range from 5.00% to 1.00% for Class B shares, 1.00% for Class C shares, 1.00% for certain purchases of Class A shares and .25% for certain purchases of Class T shares.
For the period, sales charge amounts retained by FDC were as follows:
| Retained by FDC | |
| Class A | $8,966 |
| Class T | 1,548 |
| Class B(a) | 8 |
| Class C(a) | 1,861 |
| $12,383 |
(a) When Class B and Class C shares are initially sold, FDC pays commissions from its own resources to financial intermediaries through which the sales are made.
Transfer Agent Fees. Fidelity Investments Institutional Operations Company, Inc., (FIIOC), an affiliate of the investment adviser, is the transfer, dividend disbursing and shareholder servicing agent for each class of the Fund. FIIOC receives account fees and asset-based fees that vary according to the account size and type of account of the shareholders of the respective classes of the Fund. FIIOC pays for typesetting, printing and mailing of shareholder reports, except proxy statements.
For the period, transfer agent fees for each class were as follows:
| Amount | % of Class-Level Average Net Assets(a) | |
| Class A | $39,714 | .27 |
| Class T | 19,256 | .31 |
| Class B | 483 | .30 |
| Class C | 15,549 | .31 |
| International Small Cap | 1,030,543 | .27 |
| Class I | 8,820 | .20 |
| $1,114,365 |
(a) Annualized
Accounting and Security Lending Fees. Fidelity Service Company, Inc. (FSC), an affiliate of the investment adviser, maintains the Fund's accounting records. The accounting fee is based on the level of average net assets for each month. Under a separate contract, FSC administers the security lending program. The security lending fee is based on the number and duration of lending transactions.
Brokerage Commissions. The Fund placed a portion of its portfolio transactions with brokerage firms which are affiliates of the investment adviser. Brokerage commissions are included in net realized gain (loss) and change in net unrealized appreciation (depreciation) in the Statement of Operations. The commissions paid to these affiliated firms were $6 for the period.
Interfund Trades. The Fund may purchase from or sell securities to other Fidelity Funds under procedures adopted by the Board. The procedures have been designed to ensure these interfund trades are executed in accordance with Rule 17a-7 of the 1940 Act. Interfund trades are included within the respective purchases and sales amounts shown in the Purchases and Sales of Investments note.
6. Committed Line of Credit.
The Fund participates with other funds managed by the investment adviser or an affiliate in a $4.25 billion credit facility (the "line of credit") to be utilized for temporary or emergency purposes to fund shareholder redemptions or for other short-term liquidity purposes. The Fund has agreed to pay commitment fees on its pro-rata portion of the line of credit, which amounted to $731 and is reflected in Miscellaneous expenses on the Statement of Operations. During the period, the Fund did not borrow on this line of credit.
7. Security Lending.
The Fund lends portfolio securities through a lending agent from time to time in order to earn additional income. For equity securities, a lending agent is used and may loan securities to certain qualified borrowers, including Fidelity Capital Markets (FCM), a broker-dealer affiliated with the Fund. On the settlement date of the loan, the Fund receives collateral (in the form of U.S. Treasury obligations, letters of credit and/or cash) against the loaned securities and maintains collateral in an amount not less than 100% of the market value of the loaned securities during the period of the loan. The market value of the loaned securities is determined at the close of business of the Fund and any additional required collateral is delivered to the Fund on the next business day. The Fund or borrower may terminate the loan at any time, and if the borrower defaults on its obligation to return the securities loaned because of insolvency or other reasons, the Fund may apply collateral received from the borrower against the obligation. The Fund may experience delays and costs in recovering the securities loaned. Any cash collateral received is invested in the Fidelity Securities Lending Cash Central Fund. The value of loaned securities and cash collateral at period end are disclosed on the Fund's Statement of Assets and Liabilities. At period end, there were no security loans outstanding with FCM. Security lending income represents the income earned on investing cash collateral, less rebates paid to borrowers and any lending agent fees associated with the loan, plus any premium payments received for lending certain types of securities. Security lending income is presented in the Statement of Operations as a component of income from Fidelity Central Funds. Total security lending income during the period amounted to $178,311, including $844 from securities loaned to FCM.
8. Expense Reductions.
Commissions paid to certain brokers with whom the investment adviser, or its affiliates, places trades on behalf of the Fund include an amount in addition to trade execution, which may be rebated back to the Fund to offset certain expenses. This amount totaled $4,199 for the period. In addition, through arrangements with the Fund's custodian, credits realized as a result of certain uninvested cash balances were used to reduce the Fund's expenses. During the period, these credits reduced the Fund's custody expenses by $15.
In addition, during the period the investment adviser reimbursed and/or waived a portion of fund-level operating expenses in the amount of $3,061.
9. Distributions to Shareholders.
Distributions to shareholders of each class were as follows:
| Six months ended April 30, 2016 | Year ended October 31, 2015 | |
| From net investment income | ||
| Class A | $319,347 | $155,785 |
| Class T | 106,306 | 27,108 |
| Class B | 996 | – |
| Class C | 64,383 | – |
| International Small Cap | 10,307,620 | 7,454,709 |
| Class I | 134,439 | 24,926 |
| Total | $10,933,091 | $7,662,528 |
| From net realized gain | ||
| Class A | $788,825 | $3,382,206 |
| Class T | 339,739 | 1,671,017 |
| Class B | 10,287 | 66,002 |
| Class C | 319,340 | 1,697,539 |
| International Small Cap | 21,811,338 | 109,040,767 |
| Class I | 270,625 | 1,049,303 |
| Total | $23,540,154 | $116,906,834 |
10. Share Transactions.
Share transactions for each class were as follows and may contain automatic conversions between classes or exchanges between affiliated funds:
| Shares | Shares | Dollars | Dollars | |
| Six months ended April 30, 2016 | Year ended October 31, 2015 | Six months ended April 30, 2016 | Year ended October 31, 2015 | |
| Class A | ||||
| Shares sold | 325,140 | 432,152 | $6,861,060 | $9,990,970 |
| Reinvestment of distributions | 49,226 | 159,613 | 1,077,561 | 3,404,539 |
| Shares redeemed | (199,361) | (331,016) | (4,291,584) | (7,450,558) |
| Net increase (decrease) | 175,005 | 260,749 | $3,647,037 | $5,944,951 |
| Class T | ||||
| Shares sold | 98,594 | 124,085 | $2,040,918 | $2,869,552 |
| Reinvestment of distributions | 20,220 | 77,005 | 440,798 | 1,636,354 |
| Shares redeemed | (86,353) | (146,828) | (1,830,831) | (3,289,706) |
| Net increase (decrease) | 32,461 | 54,262 | $650,885 | $1,216,200 |
| Class B | ||||
| Shares sold | 2,210 | 4,667 | $44,407 | $108,058 |
| Reinvestment of distributions | 493 | 2,954 | 10,648 | 62,128 |
| Shares redeemed | (7,751) | (10,732) | (163,958) | (240,945) |
| Net increase (decrease) | (5,048) | (3,111) | $(108,903) | $(70,759) |
| Class C | ||||
| Shares sold | 60,963 | 196,292 | $1,285,274 | $4,379,607 |
| Reinvestment of distributions | 16,869 | 71,584 | 358,801 | 1,488,229 |
| Shares redeemed | (139,670) | (268,981) | (2,822,873) | (5,818,752) |
| Net increase (decrease) | (61,838) | (1,105) | $(1,178,798) | $49,084 |
| International Small Cap | ||||
| Shares sold | 4,597,133 | 7,876,402 | $99,766,157 | $184,799,928 |
| Reinvestment of distributions | 1,408,054 | 5,231,399 | 31,286,953 | 113,102,853 |
| Shares redeemed | (4,905,938) | (11,138,439) | (105,124,693) | (253,855,534) |
| Net increase (decrease) | 1,099,249 | 1,969,362 | $25,928,417 | $44,047,247 |
| Class I | ||||
| Shares sold | 181,821 | 256,693 | $3,999,752 | $5,987,647 |
| Reinvestment of distributions | 16,670 | 46,102 | 373,252 | 1,003,648 |
| Shares redeemed | (284,792) | (188,812) | (6,128,588) | (4,455,310) |
| Net increase (decrease) | (86,301) | 113,983 | $(1,755,584) | $2,535,985 |
11. Other.
The Fund's organizational documents provide former and current trustees and officers with a limited indemnification against liabilities arising in connection with the performance of their duties to the Fund. In the normal course of business, the Fund may also enter into contracts that provide general indemnifications. The Fund's maximum exposure under these arrangements is unknown as this would be dependent on future claims that may be made against the Fund. The risk of material loss from such claims is considered remote.
At the end of the period, the investment adviser or its affiliates were the owner of record of 14% of the total outstanding shares of the Fund.
Shareholder Expense Example
As a shareholder of the Fund, you incur two types of costs: (1) transaction costs, including sales charges (loads) on purchase payments or redemption proceeds, redemption fees and (2) ongoing costs, including management fees, distribution and/or service (12b-1) fees and other Fund expenses. This Example is intended to help you understand your ongoing costs (in dollars) of investing in the Fund and to compare these costs with the ongoing costs of investing in other mutual funds.
The Example is based on an investment of $1,000 invested at the beginning of the period and held for the entire period (November 1, 2015 to April 30, 2016).
Actual Expenses
The first line of the accompanying table for each class of the Fund provides information about actual account values and actual expenses. You may use the information in this line, together with the amount you invested, to estimate the expenses that you paid over the period. Simply divide your account value by $1,000.00 (for example, an $8,600 account value divided by $1,000.00 = 8.6), then multiply the result by the number in the first line for a class of the Fund under the heading entitled "Expenses Paid During Period" to estimate the expenses you paid on your account during this period. A small balance maintenance fee of $12.00 that is charged once a year may apply for certain accounts with a value of less than $2,000. This fee is not included in the table below. If it was, the estimate of expenses you paid during the period would be higher, and your ending account value lower, by this amount. In addition, the Fund, as a shareholder in the underlying Fidelity Central Funds, will indirectly bear its pro-rata share of the fees and expenses incurred by the underlying Fidelity Central Funds. These fees and expenses are not included in the Fund's annualized expense ratio used to calculate the expense estimate in the table below.
Hypothetical Example for Comparison Purposes
The second line of the accompanying table for each class of the Fund provides information about hypothetical account values and hypothetical expenses based on a Class' actual expense ratio and an assumed rate of return of 5% per year before expenses, which is not the Class' actual return. The hypothetical account values and expenses may not be used to estimate the actual ending account balance or expenses you paid for the period. You may use this information to compare the ongoing costs of investing in the Fund and other funds. To do so, compare this 5% hypothetical example with the 5% hypothetical examples that appear in the shareholder reports of the other funds. A small balance maintenance fee of $12.00 that is charged once a year may apply for certain accounts with a value of less than $2,000. This fee is not included in the table below. If it was, the estimate of expenses you paid during the period would be higher, and your ending account value lower, by this amount. In addition, the Fund, as a shareholder in the underlying Fidelity Central Funds, will indirectly bear its pro-rata share of the fees and expenses incurred by the underlying Fidelity Central Funds. These fees and expenses are not included in the Fund's annualized expense ratio used to calculate the expense estimate in the table below.
Please note that the expenses shown in the table are meant to highlight your ongoing costs only and do not reflect any transaction costs. Therefore, the second line of the table is useful in comparing ongoing costs only, and will not help you determine the relative total costs of owning different funds. In addition, if these transactional costs were included, your costs would have been higher.
| Annualized Expense Ratio-A | Beginning Account Value November 1, 2015 | Ending Account Value April 30, 2016 | Expenses Paid During Period-B November 1, 2015 to April 30, 2016 | |
| Class A | 1.66% | |||
| Actual | $1,000.00 | $1,029.70 | $8.38 | |
| Hypothetical-C | $1,000.00 | $1,016.61 | $8.32 | |
| Class T | 1.95% | |||
| Actual | $1,000.00 | $1,028.10 | $9.83 | |
| Hypothetical-C | $1,000.00 | $1,015.17 | $9.77 | |
| Class B | 2.44% | |||
| Actual | $1,000.00 | $1,025.90 | $12.29 | |
| Hypothetical-C | $1,000.00 | $1,012.73 | $12.21 | |
| Class C | 2.44% | |||
| Actual | $1,000.00 | $1,026.10 | $12.29 | |
| Hypothetical-C | $1,000.00 | $1,012.73 | $12.21 | |
| International Small Cap | 1.40% | |||
| Actual | $1,000.00 | $1,030.70 | $7.07 | |
| Hypothetical-C | $1,000.00 | $1,017.90 | $7.02 | |
| Class I | 1.34% | |||
| Actual | $1,000.00 | $1,031.60 | $6.77 | |
| Hypothetical-C | $1,000.00 | $1,018.20 | $6.72 |
A Annualized expense ratio reflects expenses net of applicable fee waivers.
B Expenses are equal to each Class' annualized expense ratio, multiplied by the average account value over the period, multiplied by 182/366 (to reflect the one-half year period).
C 5% return per year before expenses
![]()
AISCI-SANN-0616
1.800647.112
Fidelity Advisor® Latin America Fund - Semi-Annual Report April 30, 2016 Class I is a class of Fidelity® Latin America Fund |
|
Contents
To view a fund's proxy voting guidelines and proxy voting record for the 12-month period ended June 30, visit http://www.fidelity.com/proxyvotingresults or visit the Securities and Exchange Commission's (SEC) web site at http://www.sec.gov.
You may also call 1-877-208-0098 to request a free copy of the proxy voting guidelines.
Standard & Poor's, S&P and S&P 500 are registered service marks of The McGraw-Hill Companies, Inc. and have been licensed for use by Fidelity Distributors Corporation.
Other third-party marks appearing herein are the property of their respective owners.
All other marks appearing herein are registered or unregistered trademarks or service marks of FMR LLC or an affiliated company. © 2016 FMR LLC. All rights reserved.
This report and the financial statements contained herein are submitted for the general information of the shareholders of the Fund. This report is not authorized for distribution to prospective investors in the Fund unless preceded or accompanied by an effective prospectus.
A fund files its complete schedule of portfolio holdings with the SEC for the first and third quarters of each fiscal year on Form N-Q. Forms N-Q are available on the SEC’s web site at http://www.sec.gov. A fund's Forms N-Q may be reviewed and copied at the SEC’s Public Reference Room in Washington, DC. Information regarding the operation of the SEC's Public Reference Room may be obtained by calling 1-800-SEC-0330.
For a complete list of a fund's portfolio holdings, view the most recent holdings listing, semiannual report, or annual report on Fidelity's web site at http://www.fidelity.com, http://www.advisor.fidelity.com, or http://www.401k.com, as applicable.
NOT FDIC INSURED •MAY LOSE VALUE •NO BANK GUARANTEE
Neither the Fund nor Fidelity Distributors Corporation is a bank.
Investment Summary (Unaudited)
Geographic Diversification (% of fund's net assets)
| As of April 30, 2016 | ||
| Brazil | 45.5% | |
| Mexico | 30.6% | |
| United States of America* | 8.4% | |
| Chile | 3.8% | |
| Bermuda | 3.7% | |
| Panama | 2.6% | |
| United Kingdom | 1.4% | |
| Spain | 1.0% | |
| Peru | 1.0% | |
| Other | 2.0% | |

* Includes Short-Term investments and Net Other Assets (Liabilities).
Percentages are based on country or territory of incorporation and are adjusted for the effect of futures contracts, if applicable.
| As of October 31, 2015 | ||
| Brazil | 39.0% | |
| Mexico | 33.2% | |
| Chile | 12.5% | |
| Colombia | 5.6% | |
| United States of America* | 3.2% | |
| Peru | 3.0% | |
| Panama | 1.6% | |
| Belgium | 0.9% | |
| Spain | 0.7% | |
| Other | 0.3% | |

* Includes Short-Term investments and Net Other Assets (Liabilities).
Percentages are based on country or territory of incorporation and are adjusted for the effect of futures contracts, if applicable.
Asset Allocation as of April 30, 2016
| % of fund's net assets | % of fund's net assets 6 months ago | |
| Stocks | 96.6 | 97.2 |
| Short-Term Investments and Net Other Assets (Liabilities) | 3.4 | 2.8 |
Top Ten Stocks as of April 30, 2016
| % of fund's net assets | % of fund's net assets 6 months ago | |
| Itau Unibanco Holding SA (Brazil, Banks) | 8.0 | 4.7 |
| Grupo Financiero Banorte S.A.B. de CV Series O (Mexico, Banks) | 5.0 | 0.0 |
| Fomento Economico Mexicano S.A.B. de CV unit (Mexico, Beverages) | 4.4 | 5.5 |
| Cielo SA (Brazil, IT Services) | 3.9 | 1.1 |
| Credicorp Ltd. (United States) (Bermuda, Banks) | 3.7 | 0.0 |
| Itausa-Investimentos Itau SA (PN) (Brazil, Banks) | 3.5 | 1.5 |
| Kroton Educacional SA (Brazil, Diversified Consumer Services) | 2.6 | 0.0 |
| BB Seguridade Participacoes SA (Brazil, Insurance) | 2.5 | 1.0 |
| Kimberly-Clark de Mexico SA de CV Series A (Mexico, Household Products) | 2.3 | 1.1 |
| Petroleo Brasileiro SA - Petrobras (PN) (non-vtg.) (Brazil, Oil, Gas & Consumable Fuels) | 2.3 | 1.8 |
| 38.2 |
Market Sectors as of April 30, 2016
| % of fund's net assets | % of fund's net assets 6 months ago | |
| Financials | 35.2 | 26.9 |
| Consumer Staples | 16.4 | 28.0 |
| Consumer Discretionary | 14.5 | 8.1 |
| Industrials | 10.2 | 5.8 |
| Health Care | 6.2 | 1.4 |
| Information Technology | 5.9 | 1.1 |
| Materials | 3.6 | 7.8 |
| Energy | 2.3 | 5.0 |
| Utilities | 1.5 | 4.6 |
| Telecommunication Services | 0.8 | 8.5 |
Market Sectors may include more than one industry category.
The Fund may invest up to 35% of its total assets in any industry that represents more than 20% of the Latin American market. As of April 30, 2016, the Fund did not have more than 25% of its total assets invested in any one industry.
Percentages shown as 0.0% may reflect amounts less than 0.05%.
Investments April 30, 2016 (Unaudited)
Showing Percentage of Net Assets
| Common Stocks - 81.6% | |||
| Shares | Value | ||
| Argentina - 1.0% | |||
| Grupo Financiero Galicia SA sponsored ADR | 180,473 | $5,138,066 | |
| Bermuda - 3.7% | |||
| Credicorp Ltd. (United States) | 135,801 | 19,748,181 | |
| Brazil - 30.5% | |||
| BB Seguridade Participacoes SA | 1,513,600 | 13,202,879 | |
| CCR SA | 2,130,502 | 10,022,977 | |
| Cielo SA | 2,117,948 | 20,629,863 | |
| CVC Brasil Operadora e Agencia de Viagens SA | 1,341,033 | 7,408,484 | |
| Equatorial Energia SA | 668,406 | 8,267,498 | |
| Estacio Participacoes SA | 2,243,220 | 7,742,101 | |
| Fibria Celulose SA | 982,462 | 8,678,402 | |
| FPC Par Corretora de Seguros | 1,667,889 | 5,601,255 | |
| Grendene SA | 1,074,900 | 5,310,039 | |
| Hypermarcas SA | 1,101,286 | 9,715,205 | |
| Industrias Romi SA | 549,100 | 295,365 | |
| Kroton Educacional SA | 3,718,837 | 13,840,551 | |
| Linx SA | 338,067 | 4,649,435 | |
| Mills Estruturas e Servicos de Engenharia SA | 2,521,458 | 3,086,527 | |
| Multiplus SA | 580,948 | 6,410,402 | |
| Odontoprev SA | 2,036,893 | 6,194,926 | |
| Qualicorp SA | 2,460,713 | 10,660,645 | |
| Smiles SA | 814,156 | 9,445,322 | |
| Tegma Gestao Logistica SA | 2,562,627 | 4,276,944 | |
| Valid Solucoes SA | 659,175 | 6,708,185 | |
| TOTAL BRAZIL | 162,147,005 | ||
| Chile - 3.8% | |||
| Banmedica SA | 3,100,772 | 5,256,540 | |
| CorpBanca SA | 742,999,828 | 6,762,263 | |
| Forus SA | 1,878,297 | 5,668,936 | |
| Vina San Pedro SA | 238,206,744 | 2,347,184 | |
| TOTAL CHILE | 20,034,923 | ||
| France - 1.0% | |||
| Edenred SA | 264,421 | 5,213,790 | |
| Mexico - 30.6% | |||
| Banregio Grupo Financiero S.A.B. de CV | 360,000 | 2,157,324 | |
| Compartamos S.A.B. de CV | 5,797,311 | 11,530,835 | |
| Credito Real S.A.B. de CV | 2,385,302 | 5,261,497 | |
| Embotelladoras Arca S.A.B. de CV | 1,099,169 | 7,587,327 | |
| Fomento Economico Mexicano S.A.B. de CV unit | 2,516,609 | 23,415,691 | |
| Genomma Lab Internacional SA de CV (a)(b) | 9,725,099 | 10,683,412 | |
| Gruma S.A.B. de CV Series B | 614,429 | 8,975,739 | |
| Grupo Aeroportuario Norte S.A.B. de CV | 911,563 | 5,275,040 | |
| Grupo Comercial Chedraui S.A.B. de CV | 355,158 | 1,006,560 | |
| Grupo Financiero Banorte S.A.B. de CV Series O | 4,658,402 | 26,445,532 | |
| Grupo GICSA SA de CV (a) | 5,477,756 | 4,304,607 | |
| Grupo Herdez S.A.B. de CV | 2,034,846 | 4,503,837 | |
| Kimberly-Clark de Mexico SA de CV Series A | 5,199,395 | 12,305,938 | |
| Megacable Holdings S.A.B. de CV unit | 2,210,548 | 10,208,173 | |
| Promotora y Operadora de Infraestructura S.A.B. de CV | 685,467 | 7,175,139 | |
| Qualitas Controladora S.A.B. de CV | 4,665,846 | 6,270,070 | |
| Telesites S.A.B. de C.V. (a) | 6,986,994 | 4,288,530 | |
| Tenedora Nemak SA de CV | 3,169,744 | 4,546,985 | |
| Unifin Financiera SAPI de CV | 2,278,967 | 6,718,486 | |
| TOTAL MEXICO | 162,660,722 | ||
| Panama - 2.6% | |||
| Copa Holdings SA Class A | 97,338 | 6,205,298 | |
| Intergroup Financial Services Corp. | 259,297 | 7,389,965 | |
| TOTAL PANAMA | 13,595,263 | ||
| Peru - 1.0% | |||
| Alicorp SA Class C (a) | 2,843,073 | 5,391,229 | |
| Spain - 1.0% | |||
| Prosegur Compania de Seguridad SA (Reg.) | 946,444 | 5,472,815 | |
| United Kingdom - 1.4% | |||
| British American Tobacco PLC (United Kingdom) | 125,624 | 7,659,558 | |
| United States of America - 5.0% | |||
| First Cash Financial Services, Inc. | 110,047 | 5,032,449 | |
| MercadoLibre, Inc. | 46,959 | 5,864,710 | |
| Monsanto Co. | 112,070 | 10,498,718 | |
| PriceSmart, Inc. | 60,590 | 5,243,459 | |
| TOTAL UNITED STATES OF AMERICA | 26,639,336 | ||
| TOTAL COMMON STOCKS | |||
| (Cost $370,927,690) | 433,700,888 | ||
| Nonconvertible Preferred Stocks - 15.0% | |||
| Brazil - 15.0% | |||
| Alpargatas SA (PN) | 2,325,383 | 6,254,210 | |
| Itau Unibanco Holding SA | 4,473,142 | 42,751,231 | |
| Itausa-Investimentos Itau SA (PN) | 7,391,854 | 18,612,621 | |
| Petroleo Brasileiro SA - Petrobras (PN) (non-vtg.) (a) | 4,099,671 | 12,194,413 | |
| TOTAL NONCONVERTIBLE PREFERRED STOCKS | |||
| (Cost $47,767,968) | 79,812,475 | ||
| Money Market Funds - 3.2% | |||
| Fidelity Cash Central Fund, 0.38% (c) | 15,233,830 | 15,233,830 | |
| Fidelity Securities Lending Cash Central Fund, 0.42% (c)(d) | 1,908,000 | 1,908,000 | |
| TOTAL MONEY MARKET FUNDS | |||
| (Cost $17,141,830) | 17,141,830 | ||
| TOTAL INVESTMENT PORTFOLIO - 99.8% | |||
| (Cost $435,837,488) | 530,655,193 | ||
| NET OTHER ASSETS (LIABILITIES) - 0.2% | 1,322,703 | ||
| NET ASSETS - 100% | $531,977,896 |
Categorizations in the Schedule of Investments are based on country or territory of incorporation.
Legend
(a) Non-income producing
(b) Security or a portion of the security is on loan at period end.
(c) Affiliated fund that is generally available only to investment companies and other accounts managed by Fidelity Investments. The rate quoted is the annualized seven-day yield of the fund at period end. A complete unaudited listing of the fund's holdings as of its most recent quarter end is available upon request. In addition, each Fidelity Central Fund's financial statements are available on the SEC's website or upon request.
(d) Investment made with cash collateral received from securities on loan.
Affiliated Central Funds
Information regarding fiscal year to date income earned by the Fund from investments in Fidelity Central Funds is as follows:
| Fund | Income earned |
| Fidelity Cash Central Fund | $13,871 |
| Fidelity Securities Lending Cash Central Fund | 13,739 |
| Total | $27,610 |
Investment Valuation
The following is a summary of the inputs used, as of April 30, 2016, involving the Fund's assets and liabilities carried at fair value. The inputs or methodology used for valuing securities may not be an indication of the risk associated with investing in those securities. For more information on valuation inputs, and their aggregation into the levels used below, please refer to the Investment Valuation section in the accompanying Notes to Financial Statements.
| Valuation Inputs at Reporting Date: | ||||
| Description | Total | Level 1 | Level 2 | Level 3 |
| Investments in Securities: | ||||
| Equities: | ||||
| Consumer Discretionary | $76,835,203 | $76,835,203 | $-- | $-- |
| Consumer Staples | 88,151,727 | 80,492,169 | 7,659,558 | -- |
| Energy | 12,194,413 | 12,194,413 | -- | -- |
| Financials | 186,927,261 | 186,927,261 | -- | -- |
| Health Care | 32,795,523 | 32,795,523 | -- | -- |
| Industrials | 53,732,080 | 53,732,080 | -- | -- |
| Information Technology | 31,144,008 | 31,144,008 | -- | -- |
| Materials | 19,177,120 | 19,177,120 | -- | -- |
| Telecommunication Services | 4,288,530 | 4,288,530 | -- | -- |
| Utilities | 8,267,498 | 8,267,498 | -- | -- |
| Money Market Funds | 17,141,830 | 17,141,830 | -- | -- |
| Total Investments in Securities: | $530,655,193 | $522,995,635 | $7,659,558 | $-- |
See accompanying notes which are an integral part of the financial statements.
Financial Statements
Statement of Assets and Liabilities
| April 30, 2016 (Unaudited) | ||
| Assets | ||
| Investment in securities, at value (including securities loaned of $1,986,076) — See accompanying schedule: Unaffiliated issuers (cost $418,695,658) | $513,513,363 | |
| Fidelity Central Funds (cost $17,141,830) | 17,141,830 | |
| Total Investments (cost $435,837,488) | $530,655,193 | |
| Foreign currency held at value (cost $848,641) | 845,098 | |
| Receivable for investments sold | 11,521,261 | |
| Receivable for fund shares sold | 886,476 | |
| Dividends receivable | 2,157,717 | |
| Distributions receivable from Fidelity Central Funds | 5,465 | |
| Prepaid expenses | 839 | |
| Other receivables | 4,697 | |
| Total assets | 546,076,746 | |
| Liabilities | ||
| Payable for investments purchased | $9,981,660 | |
| Payable for fund shares redeemed | 1,673,044 | |
| Accrued management fee | 295,020 | |
| Distribution and service plan fees payable | 10,382 | |
| Other affiliated payables | 141,288 | |
| Other payables and accrued expenses | 89,456 | |
| Collateral on securities loaned, at value | 1,908,000 | |
| Total liabilities | 14,098,850 | |
| Net Assets | $531,977,896 | |
| Net Assets consist of: | ||
| Paid in capital | $621,439,296 | |
| Undistributed net investment income | 5,280,315 | |
| Accumulated undistributed net realized gain (loss) on investments and foreign currency transactions | (189,596,126) | |
| Net unrealized appreciation (depreciation) on investments and assets and liabilities in foreign currencies | 94,854,411 | |
| Net Assets | $531,977,896 | |
| Calculation of Maximum Offering Price | ||
| Class A: | ||
| Net Asset Value and redemption price per share ($15,995,909 ÷ 829,375 shares) | $19.29 | |
| Maximum offering price per share (100/94.25 of $19.29) | $20.47 | |
| Class T: | ||
| Net Asset Value and redemption price per share ($5,751,716 ÷ 297,544 shares) | $19.33 | |
| Maximum offering price per share (100/96.50 of $19.33) | $20.03 | |
| Class B: | ||
| Net Asset Value and offering price per share ($424,337 ÷ 21,533 shares)(a) | $19.71 | |
| Class C: | ||
| Net Asset Value and offering price per share ($5,785,469 ÷ 296,693 shares)(a) | $19.50 | |
| Latin America: | ||
| Net Asset Value, offering price and redemption price per share ($500,862,877 ÷ 26,047,611 shares) | $19.23 | |
| Class I: | ||
| Net Asset Value, offering price and redemption price per share ($3,157,588 ÷ 164,416 shares) | $19.20 |
(a) Redemption price per share is equal to net asset value less any applicable contingent deferred sales charge.
See accompanying notes which are an integral part of the financial statements.
Statement of Operations
| Six months ended April 30, 2016 (Unaudited) | ||
| Investment Income | ||
| Dividends | $11,941,726 | |
| Income from Fidelity Central Funds | 27,610 | |
| Income before foreign taxes withheld | 11,969,336 | |
| Less foreign taxes withheld | (658,372) | |
| Total income | 11,310,964 | |
| Expenses | ||
| Management fee | $1,625,345 | |
| Transfer agent fees | 695,198 | |
| Distribution and service plan fees | 56,456 | |
| Accounting and security lending fees | 120,506 | |
| Custodian fees and expenses | 201,427 | |
| Independent trustees' compensation | 1,051 | |
| Registration fees | 43,549 | |
| Audit | 39,945 | |
| Legal | 713 | |
| Interest | 882 | |
| Miscellaneous | 1,577 | |
| Total expenses before reductions | 2,786,649 | |
| Expense reductions | (7,128) | 2,779,521 |
| Net investment income (loss) | 8,531,443 | |
| Realized and Unrealized Gain (Loss) | ||
| Net realized gain (loss) on: | ||
| Investment securities: | ||
| Unaffiliated issuers | (101,386,798) | |
| Foreign currency transactions | (358,721) | |
| Total net realized gain (loss) | (101,745,519) | |
| Change in net unrealized appreciation (depreciation) on: Investment securities | 133,562,288 | |
| Assets and liabilities in foreign currencies | 76,379 | |
| Total change in net unrealized appreciation (depreciation) | 133,638,667 | |
| Net gain (loss) | 31,893,148 | |
| Net increase (decrease) in net assets resulting from operations | $40,424,591 |
See accompanying notes which are an integral part of the financial statements.
Statement of Changes in Net Assets
| Six months ended April 30, 2016 (Unaudited) | Year ended October 31, 2015 | |
| Increase (Decrease) in Net Assets | ||
| Operations | ||
| Net investment income (loss) | $8,531,443 | $10,341,112 |
| Net realized gain (loss) | (101,745,519) | (87,419,393) |
| Change in net unrealized appreciation (depreciation) | 133,638,667 | (231,042,995) |
| Net increase (decrease) in net assets resulting from operations | 40,424,591 | (308,121,276) |
| Distributions to shareholders from net investment income | (10,264,003) | (12,592,762) |
| Distributions to shareholders from net realized gain | – | (66,395,306) |
| Total distributions | (10,264,003) | (78,988,068) |
| Share transactions - net increase (decrease) | (8,769,783) | (98,503,600) |
| Redemption fees | 24,821 | 127,133 |
| Total increase (decrease) in net assets | 21,415,626 | (485,485,811) |
| Net Assets | ||
| Beginning of period | 510,562,270 | 996,048,081 |
| End of period (including undistributed net investment income of $5,280,315 and undistributed net investment income of $7,012,875, respectively) | $531,977,896 | $510,562,270 |
See accompanying notes which are an integral part of the financial statements.
Financial Highlights — Fidelity Latin America Fund Class A
| Six months ended (Unaudited) April 30, | Years ended October 31, | |||||
| 2016 | 2015 | 2014 | 2013 | 2012 | 2011 | |
| Selected Per–Share Data | ||||||
| Net asset value, beginning of period | $18.09 | $30.31 | $40.71 | $48.95 | $52.38 | $57.48 |
| Income from Investment Operations | ||||||
| Net investment income (loss)A | .29 | .28 | .49 | .72 | .92 | 1.15 |
| Net realized and unrealized gain (loss) | 1.22 | (10.11) | (4.08) | (4.73) | (3.66) | (5.87) |
| Total from investment operations | 1.51 | (9.83) | (3.59) | (4.01) | (2.74) | (4.72) |
| Distributions from net investment income | (.31) | (.31) | (.57) | (.79) | (.70) | (.19) |
| Distributions from net realized gain | – | (2.08) | (6.25) | (3.45) | – | (.20) |
| Total distributions | (.31) | (2.39) | (6.82) | (4.24) | (.70) | (.39) |
| Redemption fees added to paid in capitalA | –B | –B | .01 | .01 | .01 | .01 |
| Net asset value, end of period | $19.29 | $18.09 | $30.31 | $40.71 | $48.95 | $52.38 |
| Total ReturnC,D,E | 8.51% | (34.60)% | (9.06)% | (8.93)% | (5.23)% | (8.26)% |
| Ratios to Average Net AssetsF,G | ||||||
| Expenses before reductions | 1.42%H | 1.40% | 1.38% | 1.37% | 1.35% | 1.34% |
| Expenses net of fee waivers, if any | 1.42%H | 1.40% | 1.38% | 1.37% | 1.35% | 1.34% |
| Expenses net of all reductions | 1.42%H | 1.39% | 1.38% | 1.35% | 1.35% | 1.34% |
| Net investment income (loss) | 3.43%H | 1.26% | 1.52% | 1.66% | 1.80% | 2.05% |
| Supplemental Data | ||||||
| Net assets, end of period (000 omitted) | $15,996 | $16,424 | $34,898 | $48,464 | $69,654 | $91,407 |
| Portfolio turnover rateI | 165%H | 30% | 30% | 23% | 23% | 11% |
A Calculated based on average shares outstanding during the period.
B Amount represents less than $.005 per share.
C Total returns for periods of less than one year are not annualized.
D Total returns would have been lower if certain expenses had not been reduced during the applicable periods shown.
E Total returns do not include the effect of the sales charges.
F Fees and expenses of any underlying Fidelity Central Funds are not included in the Fund's expense ratio. The Fund indirectly bears its proportionate share of the expenses of any underlying Fidelity Central Funds.
G Expense ratios reflect operating expenses of the class. Expenses before reductions do not reflect amounts reimbursed by the investment adviser or reductions from brokerage service arrangements or reductions from other expense offset arrangements and do not represent the amount paid by the class during periods when reimbursements or reductions occur. Expenses net of fee waivers reflect expenses after reimbursement by the investment adviser but prior to reductions from brokerage service arrangements or other expense offset arrangements. Expenses net of all reductions represent the net expenses paid by the class.
H Annualized
I Amount does not include the portfolio activity of any underlying Fidelity Central Funds.
See accompanying notes which are an integral part of the financial statements.
Financial Highlights — Fidelity Latin America Fund Class T
| Six months ended (Unaudited) April 30, | Years ended October 31, | |||||
| 2016 | 2015 | 2014 | 2013 | 2012 | 2011 | |
| Selected Per–Share Data | ||||||
| Net asset value, beginning of period | $18.11 | $30.33 | $40.68 | $48.88 | $52.27 | $57.47 |
| Income from Investment Operations | ||||||
| Net investment income (loss)A | .27 | .22 | .40 | .61 | .78 | .99 |
| Net realized and unrealized gain (loss) | 1.21 | (10.13) | (4.08) | (4.74) | (3.65) | (5.85) |
| Total from investment operations | 1.48 | (9.91) | (3.68) | (4.13) | (2.87) | (4.86) |
| Distributions from net investment income | (.26) | (.23) | (.43) | (.63) | (.53) | (.15) |
| Distributions from net realized gain | – | (2.08) | (6.25) | (3.45) | – | (.20) |
| Total distributions | (.26) | (2.31) | (6.68) | (4.08) | (.53) | (.35) |
| Redemption fees added to paid in capitalA | –B | –B | .01 | .01 | .01 | .01 |
| Net asset value, end of period | $19.33 | $18.11 | $30.33 | $40.68 | $48.88 | $52.27 |
| Total ReturnC,D,E | 8.33% | (34.78)% | (9.30)% | (9.17)% | (5.49)% | (8.50)% |
| Ratios to Average Net AssetsF,G | ||||||
| Expenses before reductions | 1.71%H | 1.67% | 1.65% | 1.63% | 1.61% | 1.61% |
| Expenses net of fee waivers, if any | 1.71%H | 1.67% | 1.65% | 1.63% | 1.61% | 1.61% |
| Expenses net of all reductions | 1.71%H | 1.66% | 1.65% | 1.61% | 1.61% | 1.61% |
| Net investment income (loss) | 3.14%H | .99% | 1.25% | 1.40% | 1.54% | 1.78% |
| Supplemental Data | ||||||
| Net assets, end of period (000 omitted) | $5,752 | $5,284 | $9,761 | $12,705 | $19,334 | $26,020 |
| Portfolio turnover rateI | 165%H | 30% | 30% | 23% | 23% | 11% |
A Calculated based on average shares outstanding during the period.
B Amount represents less than $.005 per share.
C Total returns for periods of less than one year are not annualized.
D Total returns would have been lower if certain expenses had not been reduced during the applicable periods shown.
E Total returns do not include the effect of the sales charges.
F Fees and expenses of any underlying Fidelity Central Funds are not included in the Fund's expense ratio. The Fund indirectly bears its proportionate share of the expenses of any underlying Fidelity Central Funds.
G Expense ratios reflect operating expenses of the class. Expenses before reductions do not reflect amounts reimbursed by the investment adviser or reductions from brokerage service arrangements or reductions from other expense offset arrangements and do not represent the amount paid by the class during periods when reimbursements or reductions occur. Expenses net of fee waivers reflect expenses after reimbursement by the investment adviser but prior to reductions from brokerage service arrangements or other expense offset arrangements. Expenses net of all reductions represent the net expenses paid by the class.
H Annualized
I Amount does not include the portfolio activity of any underlying Fidelity Central Funds.
See accompanying notes which are an integral part of the financial statements.
Financial Highlights — Fidelity Latin America Fund Class B
| Six months ended (Unaudited) April 30, | Years ended October 31, | |||||
| 2016 | 2015 | 2014 | 2013 | 2012 | 2011 | |
| Selected Per–Share Data | ||||||
| Net asset value, beginning of period | $18.27 | $30.46 | $40.63 | $48.72 | $52.06 | $57.44 |
| Income from Investment Operations | ||||||
| Net investment income (loss)A | .23 | .12 | .25 | .40 | .53 | .72 |
| Net realized and unrealized gain (loss) | 1.24 | (10.23) | (4.08) | (4.74) | (3.63) | (5.84) |
| Total from investment operations | 1.47 | (10.11) | (3.83) | (4.34) | (3.10) | (5.12) |
| Distributions from net investment income | (.03) | – | (.10) | (.31) | (.25) | (.07) |
| Distributions from net realized gain | – | (2.08) | (6.25) | (3.45) | – | (.20) |
| Total distributions | (.03) | (2.08) | (6.35) | (3.76) | (.25) | (.27) |
| Redemption fees added to paid in capitalA | –B | –B | .01 | .01 | .01 | .01 |
| Net asset value, end of period | $19.71 | $18.27 | $30.46 | $40.63 | $48.72 | $52.06 |
| Total ReturnC,D,E | 8.10% | (35.09)% | (9.73)% | (9.60)% | (5.95)% | (8.94)% |
| Ratios to Average Net AssetsF,G | ||||||
| Expenses before reductions | 2.17%H | 2.16% | 2.14% | 2.12% | 2.10% | 2.10% |
| Expenses net of fee waivers, if any | 2.17%H | 2.15% | 2.14% | 2.12% | 2.10% | 2.10% |
| Expenses net of all reductions | 2.17%H | 2.15% | 2.13% | 2.10% | 2.10% | 2.10% |
| Net investment income (loss) | 2.68%H | .50% | .76% | .91% | 1.05% | 1.29% |
| Supplemental Data | ||||||
| Net assets, end of period (000 omitted) | $424 | $628 | $2,211 | $4,764 | $9,492 | $14,114 |
| Portfolio turnover rateI | 165%H | 30% | 30% | 23% | 23% | 11% |
A Calculated based on average shares outstanding during the period.
B Amount represents less than $.005 per share.
C Total returns for periods of less than one year are not annualized.
D Total returns would have been lower if certain expenses had not been reduced during the applicable periods shown.
E Total returns do not include the effect of the contingent deferred sales charge.
F Fees and expenses of any underlying Fidelity Central Funds are not included in the Fund's expense ratio. The Fund indirectly bears its proportionate share of the expenses of any underlying Fidelity Central Funds.
G Expense ratios reflect operating expenses of the class. Expenses before reductions do not reflect amounts reimbursed by the investment adviser or reductions from brokerage service arrangements or reductions from other expense offset arrangements and do not represent the amount paid by the class during periods when reimbursements or reductions occur. Expenses net of fee waivers reflect expenses after reimbursement by the investment adviser but prior to reductions from brokerage service arrangements or other expense offset arrangements. Expenses net of all reductions represent the net expenses paid by the class.
H Annualized
I Amount does not include the portfolio activity of any underlying Fidelity Central Funds.
See accompanying notes which are an integral part of the financial statements.
Financial Highlights — Fidelity Latin America Fund Class C
| Six months ended (Unaudited) April 30, | Years ended October 31, | |||||
| 2016 | 2015 | 2014 | 2013 | 2012 | 2011 | |
| Selected Per–Share Data | ||||||
| Net asset value, beginning of period | $18.18 | $30.37 | $40.59 | $48.73 | $52.05 | $57.44 |
| Income from Investment Operations | ||||||
| Net investment income (loss)A | .23 | .11 | .25 | .40 | .54 | .73 |
| Net realized and unrealized gain (loss) | 1.22 | (10.17) | (4.07) | (4.74) | (3.64) | (5.84) |
| Total from investment operations | 1.45 | (10.06) | (3.82) | (4.34) | (3.10) | (5.11) |
| Distributions from net investment income | (.13) | (.05) | (.16) | (.36) | (.23) | (.09) |
| Distributions from net realized gain | – | (2.08) | (6.25) | (3.45) | – | (.20) |
| Total distributions | (.13) | (2.13) | (6.41) | (3.81) | (.23) | (.29) |
| Redemption fees added to paid in capitalA | –B | –B | .01 | .01 | .01 | .01 |
| Net asset value, end of period | $19.50 | $18.18 | $30.37 | $40.59 | $48.73 | $52.05 |
| Total ReturnC,D,E | 8.07% | (35.08)% | (9.74)% | (9.62)% | (5.94)% | (8.93)% |
| Ratios to Average Net AssetsF,G | ||||||
| Expenses before reductions | 2.17%H | 2.15% | 2.13% | 2.12% | 2.10% | 2.08% |
| Expenses net of fee waivers, if any | 2.17%H | 2.15% | 2.13% | 2.12% | 2.10% | 2.08% |
| Expenses net of all reductions | 2.16%H | 2.15% | 2.13% | 2.10% | 2.10% | 2.08% |
| Net investment income (loss) | 2.69%H | .51% | .77% | .91% | 1.06% | 1.31% |
| Supplemental Data | ||||||
| Net assets, end of period (000 omitted) | $5,785 | $5,394 | $11,349 | $15,185 | $27,405 | $35,203 |
| Portfolio turnover rateI | 165%H | 30% | 30% | 23% | 23% | 11% |
A Calculated based on average shares outstanding during the period.
B Amount represents less than $.005 per share.
C Total returns for periods of less than one year are not annualized.
D Total returns would have been lower if certain expenses had not been reduced during the applicable periods shown.
E Total returns do not include the effect of the contingent deferred sales charge.
F Fees and expenses of any underlying Fidelity Central Funds are not included in the Fund's expense ratio. The Fund indirectly bears its proportionate share of the expenses of any underlying Fidelity Central Funds.
G Expense ratios reflect operating expenses of the class. Expenses before reductions do not reflect amounts reimbursed by the investment adviser or reductions from brokerage service arrangements or reductions from other expense offset arrangements and do not represent the amount paid by the class during periods when reimbursements or reductions occur. Expenses net of fee waivers reflect expenses after reimbursement by the investment adviser but prior to reductions from brokerage service arrangements or other expense offset arrangements. Expenses net of all reductions represent the net expenses paid by the class.
H Annualized
I Amount does not include the portfolio activity of any underlying Fidelity Central Funds.
See accompanying notes which are an integral part of the financial statements.
Financial Highlights — Fidelity Latin America Fund
| Six months ended (Unaudited) April 30, | Years ended October 31, | |||||
| 2016 | 2015 | 2014 | 2013 | 2012 | 2011 | |
| Selected Per–Share Data | ||||||
| Net asset value, beginning of period | $18.08 | $30.34 | $40.80 | $49.09 | $52.48 | $57.50 |
| Income from Investment Operations | ||||||
| Net investment income (loss)A | .31 | .34 | .59 | .87 | 1.09 | 1.34 |
| Net realized and unrealized gain (loss) | 1.22 | (10.11) | (4.10) | (4.74) | (3.67) | (5.88) |
| Total from investment operations | 1.53 | (9.77) | (3.51) | (3.87) | (2.58) | (4.54) |
| Distributions from net investment income | (.38) | (.41) | (.71) | (.98) | (.82) | (.29) |
| Distributions from net realized gain | – | (2.08) | (6.25) | (3.45) | – | (.20) |
| Total distributions | (.38) | (2.49) | (6.96) | (4.43) | (.82) | (.49) |
| Redemption fees added to paid in capitalA | –B | –B | .01 | .01 | .01 | .01 |
| Net asset value, end of period | $19.23 | $18.08 | $30.34 | $40.80 | $49.09 | $52.48 |
| Total ReturnC,D | 8.67% | (34.45)% | (8.79)% | (8.63)% | (4.91)% | (7.96)% |
| Ratios to Average Net AssetsE,F | ||||||
| Expenses before reductions | 1.17%G | 1.13% | 1.08% | 1.04% | 1.02% | 1.00% |
| Expenses net of fee waivers, if any | 1.17%G | 1.12% | 1.08% | 1.04% | 1.02% | 1.00% |
| Expenses net of all reductions | 1.17%G | 1.12% | 1.07% | 1.03% | 1.02% | 1.00% |
| Net investment income (loss) | 3.68%G | 1.53% | 1.83% | 1.99% | 2.14% | 2.39% |
| Supplemental Data | ||||||
| Net assets, end of period (000 omitted) | $500,863 | $481,005 | $933,298 | $1,324,748 | $2,274,601 | $2,884,301 |
| Portfolio turnover rateH | 165%G | 30% | 30% | 23% | 23% | 11% |
A Calculated based on average shares outstanding during the period.
B Amount represents less than $.005 per share.
C Total returns for periods of less than one year are not annualized.
D Total returns would have been lower if certain expenses had not been reduced during the applicable periods shown.
E Fees and expenses of any underlying Fidelity Central Funds are not included in the Fund's expense ratio. The Fund indirectly bears its proportionate share of the expenses of any underlying Fidelity Central Funds.
F Expense ratios reflect operating expenses of the class. Expenses before reductions do not reflect amounts reimbursed by the investment adviser or reductions from brokerage service arrangements or reductions from other expense offset arrangements and do not represent the amount paid by the class during periods when reimbursements or reductions occur. Expenses net of fee waivers reflect expenses after reimbursement by the investment adviser but prior to reductions from brokerage service arrangements or other expense offset arrangements. Expenses net of all reductions represent the net expenses paid by the class.
G Annualized
H Amount does not include the portfolio activity of any underlying Fidelity Central Funds.
See accompanying notes which are an integral part of the financial statements.
Financial Highlights — Fidelity Latin America Fund Class I
| Six months ended (Unaudited) April 30, | Years ended October 31, | |||||
| 2016 | 2015 | 2014 | 2013 | 2012 | 2011 | |
| Selected Per–Share Data | ||||||
| Net asset value, beginning of period | $18.08 | $30.35 | $40.79 | $49.07 | $52.51 | $57.49 |
| Income from Investment Operations | ||||||
| Net investment income (loss)A | .31 | .36 | .60 | .87 | 1.08 | 1.32 |
| Net realized and unrealized gain (loss) | 1.21 | (10.13) | (4.07) | (4.74) | (3.67) | (5.88) |
| Total from investment operations | 1.52 | (9.77) | (3.47) | (3.87) | (2.59) | (4.56) |
| Distributions from net investment income | (.40) | (.42) | (.73) | (.97) | (.86) | (.23) |
| Distributions from net realized gain | – | (2.08) | (6.25) | (3.45) | – | (.20) |
| Total distributions | (.40) | (2.50) | (6.98) | (4.42) | (.86) | (.43) |
| Redemption fees added to paid in capitalA | –B | –B | .01 | .01 | .01 | .01 |
| Net asset value, end of period | $19.20 | $18.08 | $30.35 | $40.79 | $49.07 | $52.51 |
| Total ReturnC,D | 8.66% | (34.42)% | (8.69)% | (8.63)% | (4.93)% | (7.98)% |
| Ratios to Average Net AssetsE,F | ||||||
| Expenses before reductions | 1.13%G | 1.06% | 1.04% | 1.03% | 1.04% | 1.04% |
| Expenses net of fee waivers, if any | 1.13%G | 1.06% | 1.04% | 1.03% | 1.04% | 1.04% |
| Expenses net of all reductions | 1.12%G | 1.05% | 1.04% | 1.01% | 1.04% | 1.04% |
| Net investment income (loss) | 3.73%G | 1.60% | 1.86% | 2.00% | 2.12% | 2.35% |
| Supplemental Data | ||||||
| Net assets, end of period (000 omitted) | $3,158 | $1,828 | $4,531 | $5,131 | $7,928 | $9,603 |
| Portfolio turnover rateH | 165%G | 30% | 30% | 23% | 23% | 11% |
A Calculated based on average shares outstanding during the period.
B Amount represents less than $.005 per share.
C Total returns for periods of less than one year are not annualized.
D Total returns would have been lower if certain expenses had not been reduced during the applicable periods shown.
E Fees and expenses of any underlying Fidelity Central Funds are not included in the Fund's expense ratio. The Fund indirectly bears its proportionate share of the expenses of any underlying Fidelity Central Funds.
F Expense ratios reflect operating expenses of the class. Expenses before reductions do not reflect amounts reimbursed by the investment adviser or reductions from brokerage service arrangements or reductions from other expense offset arrangements and do not represent the amount paid by the class during periods when reimbursements or reductions occur. Expenses net of fee waivers reflect expenses after reimbursement by the investment adviser but prior to reductions from brokerage service arrangements or other expense offset arrangements. Expenses net of all reductions represent the net expenses paid by the class.
G Annualized
H Amount does not include the portfolio activity of any underlying Fidelity Central Funds.
See accompanying notes which are an integral part of the financial statements.
Notes to Financial Statements (Unaudited)
For the period ended April 30, 2016
1. Organization.
Fidelity Latin America Fund (the Fund) is a non-diversified fund of Fidelity Investment Trust (the Trust) and is authorized to issue an unlimited number of shares. The Trust is registered under the Investment Company Act of 1940, as amended (the 1940 Act), as an open-end management investment company organized as a Massachusetts business trust. The Fund offers Class A, Class T, Class C, Latin America and Institutional Class shares, each of which, along with Class B shares, has equal rights as to assets and voting privileges. Class B shares are closed to new accounts and additional purchases, except for exchanges and reinvestments. Each class has exclusive voting rights with respect to matters that affect that class. Class B shares will automatically convert to Class A shares after a maximum holding period of seven years from the initial date of purchase. The Fund's investments in emerging markets can be subject to social, economic, regulatory, and political uncertainties and can be extremely volatile.
During the period, the Board of Trustees approved the conversion of all existing Class B shares into Class A shares, effective on or about July 1, 2016, regardless of the length of times shares have been held.
2. Investments in Fidelity Central Funds.
The Fund invests in Fidelity Central Funds, which are open-end investment companies generally available only to other investment companies and accounts managed by the investment adviser and its affiliates. The Fund's Schedule of Investments lists each of the Fidelity Central Funds held as of period end, if any, as an investment of the Fund, but does not include the underlying holdings of each Fidelity Central Fund. As an Investing Fund, the Fund indirectly bears its proportionate share of the expenses of the underlying Fidelity Central Funds.
The Money Market Central Funds seek preservation of capital and current income and are managed by Fidelity Investments Money Management, Inc. (FIMM), an affiliate of the investment adviser. Annualized expenses of the Money Market Central Funds as of their most recent shareholder report date are less than .005%.
A complete unaudited list of holdings for each Fidelity Central Fund is available upon request or at the Securities and Exchange Commission (the SEC) website at www.sec.gov. In addition, the financial statements of the Fidelity Central Funds are available on the SEC website or upon request.
3. Significant Accounting Policies.
The financial statements have been prepared in conformity with accounting principles generally accepted in the United States of America (GAAP), which require management to make certain estimates and assumptions at the date of the financial statements. Actual results could differ from those estimates. Subsequent events, if any, through the date that the financial statements were issued have been evaluated in the preparation of the financial statements. The following summarizes the significant accounting policies of the Fund:
Investment Valuation. Investments are valued as of 4:00 p.m. Eastern time on the last calendar day of the period. The Board of Trustees (the Board) has delegated the day to day responsibility for the valuation of the Fund's investments to the Fidelity Management & Research Company (FMR) Fair Value Committee (the Committee). In accordance with valuation policies and procedures approved by the Board, the Fund attempts to obtain prices from one or more third party pricing vendors or brokers to value its investments. When current market prices, quotations or currency exchange rates are not readily available or reliable, investments will be fair valued in good faith by the Committee, in accordance with procedures adopted by the Board. Factors used in determining fair value vary by investment type and may include market or investment specific events. The frequency with which these procedures are used cannot be predicted and they may be utilized to a significant extent. The Committee oversees the Fund's valuation policies and procedures and reports to the Board on the Committee's activities and fair value determinations. The Board monitors the appropriateness of the procedures used in valuing the Fund's investments and ratifies the fair value determinations of the Committee.
The Fund categorizes the inputs to valuation techniques used to value its investments into a disclosure hierarchy consisting of three levels as shown below:
- Level 1 – quoted prices in active markets for identical investments
- Level 2 – other significant observable inputs (including quoted prices for similar investments, interest rates, prepayment speeds, etc.)
- Level 3 – unobservable inputs (including the Fund's own assumptions based on the best information available)
Valuation techniques used to value the Fund's investments by major category are as follows:
Equity securities, including restricted securities, for which market quotations are readily available, are valued at the last reported sale price or official closing price as reported by a third party pricing vendor on the primary market or exchange on which they are traded and are categorized as Level 1 in the hierarchy. In the event there were no sales during the day or closing prices are not available, securities are valued at the last quoted bid price or may be valued using the last available price and are generally categorized as Level 2 in the hierarchy. For foreign equity securities, when market or security specific events arise, comparisons to the valuation of American Depositary Receipts (ADRs), futures contracts, Exchange-Traded Funds (ETFs) and certain indexes as well as quoted prices for similar securities may be used and would be categorized as Level 2 in the hierarchy. Utilizing these techniques may result in transfers between Level 1 and Level 2. For equity securities, including restricted securities, where observable inputs are limited, assumptions about market activity and risk are used and these securities may be categorized as Level 3 in the hierarchy.
Investments in open-end mutual funds, including the Fidelity Central Funds, are valued at their closing net asset value (NAV) each business day and are categorized as Level 1 in the hierarchy.
Changes in valuation techniques may result in transfers in or out of an assigned level within the disclosure hierarchy. The aggregate value of investments by input level as of April 30, 2016 is included at the end of the Fund's Schedule of Investments.
Foreign Currency. The Fund may use foreign currency contracts to facilitate transactions in foreign-denominated securities. Gains and losses from these transactions may arise from changes in the value of the foreign currency or if the counterparties do not perform under the contracts' terms.
Foreign-denominated assets, including investment securities, and liabilities are translated into U.S. dollars at the exchange rates at period end. Purchases and sales of investment securities, income and dividends received and expenses denominated in foreign currencies are translated into U.S. dollars at the exchange rate in effect on the transaction date.
The effects of exchange rate fluctuations on investments are included with the net realized and unrealized gain (loss) on investment securities. Other foreign currency transactions resulting in realized and unrealized gain (loss) are disclosed separately.
Investment Transactions and Income. For financial reporting purposes, the Fund's investment holdings and NAV include trades executed through the end of the last business day of the period. The NAV per share for processing shareholder transactions is calculated as of the close of business of the New York Stock Exchange (NYSE), normally 4:00 p.m. Eastern time and includes trades executed through the end of the prior business day. Gains and losses on securities sold are determined on the basis of identified cost. Dividend income is recorded on the ex-dividend date, except for certain dividends from foreign securities where the ex-dividend date may have passed, which are recorded as soon as the Fund is informed of the ex-dividend date. Non-cash dividends included in dividend income, if any, are recorded at the fair market value of the securities received. Income and capital gain distributions from Fidelity Central Funds, if any, are recorded on the ex-dividend date. Distributions received on securities that represent a return of capital or capital gain are recorded as a reduction of cost of investments and/or as a realized gain. Subsequent to ex-dividend date the Fund determines the components of these distributions, based upon receipt of tax filings or other correspondence relating to the underlying investment. Interest income is accrued as earned and includes coupon interest and amortization of premium and accretion of discount on debt securities as applicable. Investment income is recorded net of foreign taxes withheld where recovery of such taxes is uncertain.
Class Allocations and Expenses. Investment income, realized and unrealized capital gains and losses, common expenses of the Fund, and certain fund-level expense reductions, if any, are allocated daily on a pro-rata basis to each class based on the relative net assets of each class to the total net assets of the Fund. Each class differs with respect to transfer agent and distribution and service plan fees incurred. Certain expense reductions may also differ by class. For the reporting period, the allocated portion of income and expenses to each class as a percent of its average net assets may vary due to the timing of recording these transactions in relation to fluctuating net assets of the classes. Expenses directly attributable to a fund are charged to that fund. Expenses attributable to more than one fund are allocated among the respective funds on the basis of relative net assets or other appropriate methods. Expense estimates are accrued in the period to which they relate and adjustments are made when actual amounts are known.
Income Tax Information and Distributions to Shareholders. Each year, the Fund intends to qualify as a regulated investment company under Subchapter M of the Internal Revenue Code, including distributing substantially all of its taxable income and realized gains. As a result, no provision for U.S. Federal income taxes is required. The Fund files a U.S. federal tax return, in addition to state and local tax returns as required. The Fund's federal income tax returns are subject to examination by the Internal Revenue Service (IRS) for a period of three fiscal years after they are filed. State and local tax returns may be subject to examination for an additional fiscal year depending on the jurisdiction. Foreign taxes are provided for based on the Fund's understanding of the tax rules and rates that exist in the foreign markets in which it invests.
Distributions are declared and recorded on the ex-dividend date. Income dividends and capital gain distributions are declared separately for each class. Income and capital gain distributions are determined in accordance with income tax regulations, which may differ from GAAP.
Capital accounts within the financial statements are adjusted for permanent book-tax differences. These adjustments have no impact on net assets or the results of operations. Capital accounts are not adjusted for temporary book-tax differences which will reverse in a subsequent period.
Book-tax differences are primarily due to foreign currency transactions, passive foreign investment companies (PFIC), capital loss carryforwards, deferred trustees compensation and losses deferred due to wash sales.
The federal tax cost of investment securities and unrealized appreciation (depreciation) as of period end were as follows:
| Gross unrealized appreciation | $108,291,244 |
| Gross unrealized depreciation | (19,001,999) |
| Net unrealized appreciation (depreciation) on securities | $89,289,245 |
| Tax cost | $441,365,948 |
Capital loss carryforwards are only available to offset future capital gains of the Fund to the extent provided by regulations and may be limited. Under the Regulated Investment Company Modernization Act of 2010 (the Act), the Fund is permitted to carry forward capital losses incurred in taxable years beginning after December 22, 2010 for an unlimited period and such capital losses are required to be used prior to any losses that expire. The capital loss carryforward information presented below, including any applicable limitation, is estimated as of prior fiscal period end and is subject to adjustment.
| No expiration | |
| Short-term | $(34,655,095) |
| Long-term | (50,107,400) |
| Total capital loss carryforward | $(84,762,495) |
Short-Term Trading (Redemption) Fees. Shares held by investors in the Fund less than 90 days may have been subject to a redemption fee equal to 1.50% of the NAV of shares redeemed. All redemption fees, which reduce the proceeds of the shareholder redemption, are retained by the Fund and accounted for as an addition to paid in capital.
4. Purchases and Sales of Investments.
Purchases and sales of securities, other than short-term securities, aggregated $384,349,836 and $399,551,878, respectively.
5. Fees and Other Transactions with Affiliates.
Management Fee. Fidelity Management & Research Company (the investment adviser) and its affiliates provide the Fund with investment management related services for which the Fund pays a monthly management fee. The management fee is the sum of an individual fund fee rate that is based on an annual rate of .45% of the Fund's average net assets and an annualized group fee rate that averaged .25% during the period. The group fee rate is based upon the average net assets of all the mutual funds advised by the investment adviser, including any mutual funds previously advised by the investment adviser that are currently advised by Fidelity SelectCo, LLC, an affiliate of the investment adviser. The group fee rate decreases as assets under management increase and increases as assets under management decrease. For the reporting period, the total annualized management fee rate was .70% of the Fund's average net assets.
Distribution and Service Plan Fees. In accordance with Rule 12b-1 of the 1940 Act, the Fund has adopted separate Distribution and Service Plans for each class of shares. Certain classes pay Fidelity Distributors Corporation (FDC), an affiliate of the investment adviser, separate Distribution and Service Fees, each of which is based on an annual percentage of each class' average net assets. In addition, FDC may pay financial intermediaries for selling shares of the Fund and providing shareholder support services. For the period, the Distribution and Service Fee rates, total fees and amounts retained by FDC were as follows:
| Distribution Fee | Service Fee | Total Fees | Retained by FDC | |
| Class A | -% | .25% | $17,807 | $– |
| Class T | .25% | .25% | 12,316 | – |
| Class B | .75% | .25% | 2,397 | 1,798 |
| Class C | .75% | .25% | 23,936 | 1,863 |
| $56,456 | $3,661 |
Sales Load. FDC may receive a front-end sales charge of up to 5.75% for selling Class A shares and 3.50% for selling Class T shares, some of which is paid to financial intermediaries for selling shares of the Fund. Depending on the holding period, FDC may receive contingent deferred sales charges levied on Class A, Class T, Class B, and Class C redemptions. The deferred sales charges range from 5.00% to 1.00% for Class B shares, 1.00% for Class C shares, 1.00% for certain purchases of Class A shares and .25% for certain purchases of Class T shares.
For the period, sales charge amounts retained by FDC were as follows:
| Retained by FDC | |
| Class A | $2,586 |
| Class T | 808 |
| Class B(a) | 36 |
| Class C(a) | 385 |
| $3,815 |
(a) When Class B and Class C shares are initially sold, FDC pays commissions from its own resources to financial intermediaries through which the sales are made.
Transfer Agent Fees. Fidelity Investments Institutional Operations Company, Inc., (FIIOC), an affiliate of the investment adviser, is the transfer, dividend disbursing and shareholder servicing agent for each class of the Fund. FIIOC receives account fees and asset-based fees that vary according to the account size and type of account of the shareholders of the respective classes of the Fund. FIIOC pays for typesetting, printing and mailing of shareholder reports, except proxy statements.
For the period, transfer agent fees for each class were as follows:
| Amount | % of Class-Level Average Net Assets(a) | |
| Class A | $21,549 | .30 |
| Class T | 8,453 | .34 |
| Class B | 721 | .30 |
| Class C | 7,142 | .30 |
| Latin America | 654,143 | .30 |
| Class I | 3,190 | .25 |
| $695,198 |
(a) Annualized
Accounting and Security Lending Fees. Fidelity Service Company, Inc. (FSC), an affiliate of the investment adviser, maintains the Fund's accounting records. The accounting fee is based on the level of average net assets for each month. Under a separate contract, FSC administers the security lending program. The security lending fee is based on the number and duration of lending transactions.
Brokerage Commissions. The Fund placed a portion of its portfolio transactions with brokerage firms which are affiliates of the investment adviser. Brokerage commissions are included in net realized gain (loss) and change in net unrealized appreciation (depreciation) in the Statement of Operations. The commissions paid to these affiliated firms were $6,916 for the period.
Interfund Lending Program. Pursuant to an Exemptive Order issued by the SEC, the Fund, along with other registered investment companies having management contracts with FMR or other affiliated entities of FMR, may participate in an interfund lending program. This program provides an alternative credit facility allowing the funds to borrow from, or lend money to, other participating affiliated funds. At period end, there were no interfund loans outstanding. The Fund's activity in this program during the period for which loans were outstanding was as follows:
| Borrower or Lender | Average Loan Balance | Weighted Average Interest Rate | Interest Expense |
| Borrower | $7,287,286 | .62% | $882 |
Interfund Trades. The Fund may purchase from or sell securities to other Fidelity Funds under procedures adopted by the Board. The procedures have been designed to ensure these interfund trades are executed in accordance with Rule 17a-7 of the 1940 Act. Interfund trades are included within the respective purchases and sales amounts shown in the Purchases and Sales of Investments note.
6. Committed Line of Credit.
The Fund participates with other funds managed by the investment adviser or an affiliate in a $4.25 billion credit facility (the "line of credit") to be utilized for temporary or emergency purposes to fund shareholder redemptions or for other short-term liquidity purposes. The Fund has agreed to pay commitment fees on its pro-rata portion of the line of credit, which amounted to $400 and is reflected in Miscellaneous expenses on the Statement of Operations. During the period, the Fund did not borrow on this line of credit.
7. Security Lending.
The Fund lends portfolio securities through a lending agent from time to time in order to earn additional income. For equity securities, a lending agent is used and may loan securities to certain qualified borrowers, including Fidelity Capital Markets (FCM), a broker-dealer affiliated with the Fund. On the settlement date of the loan, the Fund receives collateral (in the form of U.S. Treasury obligations, letters of credit and/or cash) against the loaned securities and maintains collateral in an amount not less than 100% of the market value of the loaned securities during the period of the loan. The market value of the loaned securities is determined at the close of business of the Fund and any additional required collateral is delivered to the Fund on the next business day. The Fund or borrower may terminate the loan at any time, and if the borrower defaults on its obligation to return the securities loaned because of insolvency or other reasons, the Fund may apply collateral received from the borrower against the obligation. The Fund may experience delays and costs in recovering the securities loaned. Any cash collateral received is invested in the Fidelity Securities Lending Cash Central Fund. The value of loaned securities and cash collateral at period end are disclosed on the Fund's Statement of Assets and Liabilities. At period end, there were no security loans outstanding with FCM. Security lending income represents the income earned on investing cash collateral, less rebates paid to borrowers and any lending agent fees associated with the loan, plus any premium payments received for lending certain types of securities. Security lending income is presented in the Statement of Operations as a component of income from Fidelity Central Funds. Total security lending income during the period amounted to $13,739, including $185 from securities loaned to FCM.
8. Expense Reductions.
Commissions paid to certain brokers with whom the investment adviser, or its affiliates, places trades on behalf of the Fund include an amount in addition to trade execution, which may be rebated back to the Fund to offset certain expenses. This amount totaled $5,446 for the period.
In addition, during the period the investment adviser reimbursed and/or waived a portion of fund-level operating expenses in the amount of $1,682.
9. Distributions to Shareholders.
Distributions to shareholders of each class were as follows:
| Six months ended April 30, 2016 | Year ended October 31, 2015 | |
| From net investment income | ||
| Class A | $264,922 | $341,444 |
| Class T | 74,433 | 71,167 |
| Class B | 1,059 | – |
| Class C | 37,419 | 18,114 |
| Latin America | 9,833,214 | 12,109,807 |
| Class I | 52,956 | 52,230 |
| Total | $10,264,003 | $12,592,762 |
| From net realized gain | ||
| Class A | $– | $2,330,553 |
| Class T | – | 658,521 |
| Class B | – | 144,042 |
| Class C | – | 754,025 |
| Latin America | – | 62,251,897 |
| Class I | – | 256,268 |
| Total | $– | $66,395,306 |
10. Share Transactions.
Share transactions for each class were as follows and may contain automatic conversions between classes or exchanges between affiliated funds:
| Shares | Shares | Dollars | Dollars | |
| Six months ended April 30, 2016 | Year ended October 31, 2015 | Six months ended April 30, 2016 | Year ended October 31, 2015 | |
| Class A | ||||
| Shares sold | 66,880 | 218,330 | $1,163,572 | $4,910,163 |
| Reinvestment of distributions | 14,810 | 103,775 | 256,538 | 2,587,573 |
| Shares redeemed | (160,323) | (565,352) | (2,718,955) | (12,518,797) |
| Net increase (decrease) | (78,633) | (243,247) | $(1,298,845) | $(5,021,061) |
| Class T | ||||
| Shares sold | 31,261 | 29,946 | $528,543 | $658,518 |
| Reinvestment of distributions | 4,243 | 28,508 | 73,689 | 713,357 |
| Shares redeemed | (29,741) | (88,493) | (509,091) | (1,990,592) |
| Net increase (decrease) | 5,763 | (30,039) | $93,141 | $(618,717) |
| Class B | ||||
| Shares sold | 1 | 116 | $10 | $2,989 |
| Reinvestment of distributions | 59 | 5,261 | 1,009 | 133,376 |
| Shares redeemed | (12,894) | (43,584) | (221,180) | (982,322) |
| Net increase (decrease) | (12,834) | (38,207) | $(220,161) | $(845,957) |
| Class C | ||||
| Shares sold | 46,774 | 48,350 | $817,698 | $1,099,271 |
| Reinvestment of distributions | 1,720 | 25,875 | 30,044 | 652,617 |
| Shares redeemed | (48,571) | (151,109) | (821,023) | (3,411,105) |
| Net increase (decrease) | (77) | (76,884) | $26,719 | $(1,659,217) |
| Latin America | ||||
| Shares sold | 2,247,110 | 2,736,036 | $38,271,000 | $60,647,605 |
| Reinvestment of distributions | 545,601 | 2,862,287 | 9,420,593 | 71,197,829 |
| Shares redeemed | (3,343,417) | (9,758,242) | (56,149,551) | (221,025,945) |
| Net increase (decrease) | (550,706) | (4,159,919) | $(8,457,958) | $(89,180,511) |
| Class I | ||||
| Shares sold | 98,480 | 41,136 | $1,665,317 | $906,993 |
| Reinvestment of distributions | 2,787 | 11,139 | 48,070 | 276,862 |
| Shares redeemed | (37,940) | (100,491) | (626,066) | (2,361,992) |
| Net increase (decrease) | 63,327 | (48,216) | $1,087,321 | $(1,178,137) |
11. Other.
The Fund's organizational documents provide former and current trustees and officers with a limited indemnification against liabilities arising in connection with the performance of their duties to the Fund. In the normal course of business, the Fund may also enter into contracts that provide general indemnifications. The Fund's maximum exposure under these arrangements is unknown as this would be dependent on future claims that may be made against the Fund. The risk of material loss from such claims is considered remote.
Shareholder Expense Example
As a shareholder of the Fund, you incur two types of costs: (1) transaction costs, including sales charges (loads) on purchase payments or redemption proceeds, redemption fees and (2) ongoing costs, including management fees, distribution and/or service (12b-1) fees and other Fund expenses. This Example is intended to help you understand your ongoing costs (in dollars) of investing in the Fund and to compare these costs with the ongoing costs of investing in other mutual funds.
The Example is based on an investment of $1,000 invested at the beginning of the period and held for the entire period (November 1, 2015 to April 30, 2016).
Actual Expenses
The first line of the accompanying table for each class of the Fund provides information about actual account values and actual expenses. You may use the information in this line, together with the amount you invested, to estimate the expenses that you paid over the period. Simply divide your account value by $1,000.00 (for example, an $8,600 account value divided by $1,000.00 = 8.6), then multiply the result by the number in the first line for a class of the Fund under the heading entitled "Expenses Paid During Period" to estimate the expenses you paid on your account during this period. A small balance maintenance fee of $12.00 that is charged once a year may apply for certain accounts with a value of less than $2,000. This fee is not included in the table below. If it was, the estimate of expenses you paid during the period would be higher, and your ending account value lower, by this amount. In addition, the Fund, as a shareholder in the underlying Fidelity Central Funds, will indirectly bear its pro-rata share of the fees and expenses incurred by the underlying Fidelity Central Funds. These fees and expenses are not included in the Fund's annualized expense ratio used to calculate the expense estimate in the table below.
Hypothetical Example for Comparison Purposes
The second line of the accompanying table for each class of the Fund provides information about hypothetical account values and hypothetical expenses based on a Class' actual expense ratio and an assumed rate of return of 5% per year before expenses, which is not the Class' actual return. The hypothetical account values and expenses may not be used to estimate the actual ending account balance or expenses you paid for the period. You may use this information to compare the ongoing costs of investing in the Fund and other funds. To do so, compare this 5% hypothetical example with the 5% hypothetical examples that appear in the shareholder reports of the other funds. A small balance maintenance fee of $12.00 that is charged once a year may apply for certain accounts with a value of less than $2,000. This fee is not included in the table below. If it was, the estimate of expenses you paid during the period would be higher, and your ending account value lower, by this amount. In addition, the Fund, as a shareholder in the underlying Fidelity Central Funds, will indirectly bear its pro-rata share of the fees and expenses incurred by the underlying Fidelity Central Funds. These fees and expenses are not included in the Fund's annualized expense ratio used to calculate the expense estimate in the table below.
Please note that the expenses shown in the table are meant to highlight your ongoing costs only and do not reflect any transaction costs. Therefore, the second line of the table is useful in comparing ongoing costs only, and will not help you determine the relative total costs of owning different funds. In addition, if these transactional costs were included, your costs would have been higher.
| Annualized Expense Ratio-A | Beginning Account Value November 1, 2015 | Ending Account Value April 30, 2016 | Expenses Paid During Period-B November 1, 2015 to April 30, 2016 | |
| Class A | 1.42% | |||
| Actual | $1,000.00 | $1,085.10 | $7.36 | |
| Hypothetical-C | $1,000.00 | $1,017.80 | $7.12 | |
| Class T | 1.71% | |||
| Actual | $1,000.00 | $1,083.30 | $8.86 | |
| Hypothetical-C | $1,000.00 | $1,016.36 | $8.57 | |
| Class B | 2.17% | |||
| Actual | $1,000.00 | $1,081.00 | $11.23 | |
| Hypothetical-C | $1,000.00 | $1,014.07 | $10.87 | |
| Class C | 2.17% | |||
| Actual | $1,000.00 | $1,080.70 | $11.23 | |
| Hypothetical-C | $1,000.00 | $1,014.07 | $10.87 | |
| Latin America | 1.17% | |||
| Actual | $1,000.00 | $1,086.70 | $6.07 | |
| Hypothetical-C | $1,000.00 | $1,019.05 | $5.87 | |
| Class I | 1.13% | |||
| Actual | $1,000.00 | 1,086.60 | $5.86 | |
| Hypothetical-C | $1,000.00 | $1,019.24 | $5.67 |
A Annualized expense ratio reflects expenses net of applicable fee waivers.
B Expenses are equal to each Class' annualized expense ratio, multiplied by the average account value over the period, multiplied by 182/366 (to reflect the one-half year period).
C 5% return per year before expenses
![]()
FALAI-SANN-0616
1.917412.105
Fidelity Advisor® International Discovery Fund - Semi-Annual Report April 30, 2016 Class Z is a class of Fidelity® International Discovery Fund |
|
Contents
To view a fund's proxy voting guidelines and proxy voting record for the 12-month period ended June 30, visit http://www.fidelity.com/proxyvotingresults or visit the Securities and Exchange Commission's (SEC) web site at http://www.sec.gov.
You may also call 1-877-208-0098 to request a free copy of the proxy voting guidelines.
Standard & Poor's, S&P and S&P 500 are registered service marks of The McGraw-Hill Companies, Inc. and have been licensed for use by Fidelity Distributors Corporation.
Other third-party marks appearing herein are the property of their respective owners.
All other marks appearing herein are registered or unregistered trademarks or service marks of FMR LLC or an affiliated company. © 2016 FMR LLC. All rights reserved.
This report and the financial statements contained herein are submitted for the general information of the shareholders of the Fund. This report is not authorized for distribution to prospective investors in the Fund unless preceded or accompanied by an effective prospectus.
A fund files its complete schedule of portfolio holdings with the SEC for the first and third quarters of each fiscal year on Form N-Q. Forms N-Q are available on the SEC’s web site at http://www.sec.gov. A fund's Forms N-Q may be reviewed and copied at the SEC’s Public Reference Room in Washington, DC. Information regarding the operation of the SEC's Public Reference Room may be obtained by calling 1-800-SEC-0330.
For a complete list of a fund's portfolio holdings, view the most recent holdings listing, semiannual report, or annual report on Fidelity's web site at http://www.fidelity.com, http://www.advisor.fidelity.com, or http://www.401k.com, as applicable.
NOT FDIC INSURED •MAY LOSE VALUE •NO BANK GUARANTEE
Neither the Fund nor Fidelity Distributors Corporation is a bank.
Investment Summary (Unaudited)
Geographic Diversification (% of fund's net assets)
| As of April 30, 2016 | ||
| Japan | 17.3% | |
| United Kingdom | 14.5% | |
| France | 9.6% | |
| Germany | 8.0% | |
| United States of America* | 5.8% | |
| Switzerland | 4.3% | |
| Sweden | 4.1% | |
| Hong Kong | 3.3% | |
| Netherlands | 3.3% | |
| Other | 29.8% | |

* Includes Short-Term investments and Net Other Assets (Liabilities).
Percentages are based on country or territory of incorporation and are adjusted for the effect of futures contracts, if applicable.
| As of October 31, 2015 | ||
| United Kingdom | 19.1% | |
| Japan | 15.9% | |
| France | 9.6% | |
| United States of America* | 7.3% | |
| Germany | 5.5% | |
| Switzerland | 5.1% | |
| Netherlands | 4.0% | |
| Sweden | 3.1% | |
| Hong Kong | 3.0% | |
| Other | 27.4% | |

* Includes Short-Term investments and Net Other Assets (Liabilities).
Percentages are based on country or territory of incorporation and are adjusted for the effect of futures contracts, if applicable.
Asset Allocation as of April 30, 2016
| % of fund's net assets | % of fund's net assets 6 months ago | |
| Stocks and Equity Futures | 99.1 | 97.5 |
| Other Investments | 0.0 | 0.1 |
| Short-Term Investments and Net Other Assets (Liabilities) | 0.9 | 2.4 |
Top Ten Stocks as of April 30, 2016
| % of fund's net assets | % of fund's net assets 6 months ago | |
| Total SA (France, Oil, Gas & Consumable Fuels) | 2.2 | 2.0 |
| Unilever NV (Certificaten Van Aandelen) (Bearer) (Netherlands, Personal Products) | 1.7 | 1.6 |
| Statoil ASA (Norway, Oil, Gas & Consumable Fuels) | 1.6 | 0.0 |
| Anheuser-Busch InBev SA NV (Belgium, Beverages) | 1.5 | 1.4 |
| AIA Group Ltd. (Hong Kong, Insurance) | 1.5 | 1.3 |
| ORIX Corp. (Japan, Diversified Financial Services) | 1.4 | 0.9 |
| Techtronic Industries Co. Ltd. (Hong Kong, Household Durables) | 1.4 | 1.3 |
| VINCI SA (France, Construction & Engineering) | 1.4 | 0.9 |
| KDDI Corp. (Japan, Wireless Telecommunication Services) | 1.4 | 1.1 |
| Novo Nordisk A/S Series B (Denmark, Pharmaceuticals) | 1.3 | 1.2 |
| 15.4 |
Market Sectors as of April 30, 2016
| % of fund's net assets | % of fund's net assets 6 months ago | |
| Financials | 21.6 | 24.2 |
| Consumer Discretionary | 15.3 | 17.4 |
| Consumer Staples | 13.2 | 11.9 |
| Health Care | 12.5 | 12.8 |
| Industrials | 10.7 | 10.5 |
| Information Technology | 10.0 | 7.5 |
| Energy | 5.0 | 4.3 |
| Telecommunication Services | 4.8 | 4.9 |
| Materials | 3.6 | 2.3 |
| Utilities | 0.6 | 0.0 |
Percentages shown as 0.0% may reflect amounts less than 0.05%.
Investments April 30, 2016 (Unaudited)
Showing Percentage of Net Assets
| Common Stocks - 97.1% | |||
| Shares | Value (000s) | ||
| Australia - 2.5% | |||
| 1-Page Ltd. (a)(b) | 2,531,460 | $1,857 | |
| Ansell Ltd. (a) | 1,588,251 | 24,068 | |
| Australia & New Zealand Banking Group Ltd. | 2,945,060 | 53,983 | |
| Burson Group Ltd. | 7,454,296 | 28,226 | |
| Magellan Financial Group Ltd. | 1,204,177 | 19,685 | |
| Mantra Group Ltd. | 7,793,893 | 21,927 | |
| Ramsay Health Care Ltd. | 1,164,235 | 57,495 | |
| Spark Infrastructure Group unit | 31,636,214 | 49,793 | |
| TOTAL AUSTRALIA | 257,034 | ||
| Austria - 0.5% | |||
| Andritz AG | 444,500 | 24,894 | |
| Erste Group Bank AG | 995,900 | 28,646 | |
| TOTAL AUSTRIA | 53,540 | ||
| Bailiwick of Jersey - 1.2% | |||
| Integrated Diagnostics Holdings PLC | 4,932,400 | 22,936 | |
| Randgold Resources Ltd. sponsored ADR | 241,314 | 24,252 | |
| Regus PLC | 11,055,488 | 47,233 | |
| Wolseley PLC | 514,260 | 28,805 | |
| TOTAL BAILIWICK OF JERSEY | 123,226 | ||
| Belgium - 2.0% | |||
| Anheuser-Busch InBev SA NV | 1,203,427 | 148,960 | |
| KBC Groep NV | 857,319 | 48,131 | |
| TOTAL BELGIUM | 197,091 | ||
| Bermuda - 0.3% | |||
| PAX Global Technology Ltd. | 29,071,000 | 25,037 | |
| Canada - 2.2% | |||
| Alimentation Couche-Tard, Inc. Class B (sub. vtg.) | 781,500 | 34,257 | |
| Cenovus Energy, Inc. | 2,806,100 | 44,483 | |
| Constellation Software, Inc. | 156,500 | 61,161 | |
| Franco-Nevada Corp. | 297,300 | 20,859 | |
| PrairieSky Royalty Ltd. (b) | 1,734,473 | 36,522 | |
| Suncor Energy, Inc. | 676,200 | 19,849 | |
| TOTAL CANADA | 217,131 | ||
| Cayman Islands - 0.9% | |||
| Alibaba Group Holding Ltd. sponsored ADR (a) | 453,700 | 34,908 | |
| Ctrip.com International Ltd. ADR (a) | 294,500 | 12,843 | |
| Lee's Pharmaceutical Holdings Ltd. | 6,734,664 | 5,449 | |
| New Oriental Education & Technology Group, Inc. sponsored ADR | 830,000 | 32,503 | |
| TOTAL CAYMAN ISLANDS | 85,703 | ||
| China - 0.6% | |||
| Jiangsu Hengrui Medicine Co. Ltd. | 4,183,623 | 30,165 | |
| Kweichow Moutai Co. Ltd. | 663,582 | 25,748 | |
| TOTAL CHINA | 55,913 | ||
| Cyprus - 0.0% | |||
| SPDI Secure Property Development & Investment PLC (a) | 517,230 | 129 | |
| Denmark - 1.3% | |||
| Novo Nordisk A/S Series B | 2,371,645 | 132,419 | |
| Finland - 0.7% | |||
| Sampo Oyj (A Shares) | 1,653,500 | 72,193 | |
| France - 9.6% | |||
| Accor SA (b) | 1,684,918 | 74,636 | |
| ALTEN | 608,659 | 37,635 | |
| Altran Technologies SA | 2,384,000 | 35,365 | |
| Amundi SA | 516,400 | 23,765 | |
| Atos Origin SA | 444,123 | 39,530 | |
| AXA SA (b) | 4,402,300 | 111,156 | |
| Capgemini SA | 855,800 | 79,894 | |
| Cegedim SA (a) | 536,390 | 14,728 | |
| Havas SA | 4,815,644 | 40,297 | |
| Sanofi SA | 467,356 | 38,523 | |
| Sodexo SA | 431,200 | 43,543 | |
| SR Teleperformance SA | 290,100 | 26,043 | |
| Total SA | 4,385,111 | 221,630 | |
| Unibail-Rodamco | 156,500 | 41,933 | |
| VINCI SA (b) | 1,924,900 | 143,796 | |
| TOTAL FRANCE | 972,474 | ||
| Germany - 8.0% | |||
| Axel Springer Verlag AG | 625,002 | 34,896 | |
| Bayer AG | 345,100 | 39,812 | |
| Beiersdorf AG | 242,900 | 21,794 | |
| Continental AG | 297,600 | 65,359 | |
| Deutsche Boerse AG | 526,494 | 43,219 | |
| Deutsche Telekom AG | 3,241,500 | 56,899 | |
| Fresenius SE & Co. KGaA | 468,700 | 34,090 | |
| GEA Group AG | 878,941 | 40,750 | |
| KION Group AG | 1,369,149 | 74,593 | |
| LEG Immobilien AG | 314,266 | 29,080 | |
| Nexus AG | 614,500 | 10,766 | |
| ProSiebenSat.1 Media AG | 1,170,000 | 59,644 | |
| Rational AG | 104,405 | 53,002 | |
| SAP AG | 1,390,594 | 109,107 | |
| Siemens AG | 685,498 | 71,736 | |
| Symrise AG | 637,700 | 42,249 | |
| United Internet AG | 430,714 | 21,027 | |
| TOTAL GERMANY | 808,023 | ||
| Hong Kong - 3.3% | |||
| AIA Group Ltd. | 24,704,000 | 147,844 | |
| China Resources Beer Holdings Co. Ltd. | 16,944,000 | 37,233 | |
| Techtronic Industries Co. Ltd. | 38,444,000 | 144,114 | |
| TOTAL HONG KONG | 329,191 | ||
| India - 2.6% | |||
| Bharti Infratel Ltd. | 12,647,734 | 71,392 | |
| Dr Lal Pathlabs Ltd. | 798,016 | 11,835 | |
| HDFC Bank Ltd. sponsored ADR | 1,290,984 | 81,164 | |
| Housing Development Finance Corp. Ltd. | 6,148,295 | 100,746 | |
| TOTAL INDIA | 265,137 | ||
| Ireland - 2.7% | |||
| Cairn Homes PLC (a) | 17,549,270 | 22,506 | |
| CRH PLC | 1,051,000 | 30,587 | |
| Dalata Hotel Group PLC (a) | 5,686,103 | 28,706 | |
| Green REIT PLC | 9,492,200 | 15,673 | |
| Irish Continental Group PLC unit | 101,800 | 600 | |
| James Hardie Industries PLC CDI | 1,482,921 | 20,893 | |
| Kerry Group PLC Class A | 983,700 | 87,712 | |
| Ryanair Holdings PLC sponsored ADR | 809,300 | 65,513 | |
| TOTAL IRELAND | 272,190 | ||
| Isle of Man - 0.8% | |||
| Optimal Payments PLC (a) | 11,752,725 | 65,462 | |
| Playtech Ltd. | 1,386,935 | 16,303 | |
| TOTAL ISLE OF MAN | 81,765 | ||
| Israel - 1.9% | |||
| Frutarom Industries Ltd. | 1,032,000 | 52,892 | |
| Partner Communications Co. Ltd. (a) | 2,268,862 | 11,804 | |
| Teva Pharmaceutical Industries Ltd. sponsored ADR | 2,291,300 | 124,761 | |
| TOTAL ISRAEL | 189,457 | ||
| Italy - 1.6% | |||
| De Longhi SpA | 1,669,626 | 38,446 | |
| Intesa Sanpaolo SpA | 30,697,900 | 85,334 | |
| Mediaset SpA | 3,440,200 | 15,481 | |
| Telecom Italia SpA (a) | 25,339,200 | 24,743 | |
| TOTAL ITALY | 164,004 | ||
| Japan - 17.3% | |||
| ACOM Co. Ltd. (a) | 3,246,300 | 16,935 | |
| Aozora Bank Ltd. | 9,464,000 | 33,578 | |
| Asahi Group Holdings | 1,066,900 | 33,860 | |
| Astellas Pharma, Inc. | 6,953,700 | 93,754 | |
| Casio Computer Co. Ltd. (b) | 2,015,200 | 38,343 | |
| Daito Trust Construction Co. Ltd. | 209,500 | 29,630 | |
| Dentsu, Inc. | 1,274,300 | 64,746 | |
| Don Quijote Holdings Co. Ltd. | 1,338,100 | 47,604 | |
| Hoya Corp. | 1,793,800 | 68,692 | |
| Japan Exchange Group, Inc. | 1,920,700 | 28,605 | |
| Japan Tobacco, Inc. | 2,318,600 | 94,733 | |
| KDDI Corp. | 4,728,900 | 136,219 | |
| Keyence Corp. | 95,360 | 57,158 | |
| Misumi Group, Inc. | 3,181,300 | 43,933 | |
| Mitsubishi UFJ Financial Group, Inc. | 11,142,500 | 51,421 | |
| Monex Group, Inc. | 12,207,949 | 31,493 | |
| NEC Corp. | 8,879,000 | 21,609 | |
| Nidec Corp. | 324,300 | 23,763 | |
| Nintendo Co. Ltd. | 274,100 | 37,113 | |
| Nippon Telegraph & Telephone Corp. | 904,500 | 40,477 | |
| Olympus Corp. | 3,148,400 | 122,651 | |
| ORIX Corp. | 10,231,600 | 144,725 | |
| Seven & i Holdings Co. Ltd. | 1,034,700 | 42,218 | |
| Seven Bank Ltd. | 12,039,600 | 51,159 | |
| Shinsei Bank Ltd. | 14,227,000 | 19,940 | |
| Shionogi & Co. Ltd. | 856,200 | 43,702 | |
| Sony Corp. | 3,594,500 | 87,065 | |
| Sundrug Co. Ltd. | 622,500 | 44,232 | |
| Tsuruha Holdings, Inc. | 834,000 | 79,994 | |
| United Arrows Ltd. | 991,300 | 39,833 | |
| VT Holdings Co. Ltd. | 3,872,500 | 19,566 | |
| Welcia Holdings Co. Ltd. | 1,150,800 | 60,788 | |
| TOTAL JAPAN | 1,749,539 | ||
| Luxembourg - 0.9% | |||
| Eurofins Scientific SA | 120,139 | 44,578 | |
| Grand City Properties SA | 1,528,397 | 33,759 | |
| Senvion SA | 708,900 | 12,460 | |
| TOTAL LUXEMBOURG | 90,797 | ||
| Marshall Islands - 0.1% | |||
| Hoegh LNG Partners LP (c) | 715,655 | 12,896 | |
| Netherlands - 3.3% | |||
| AerCap Holdings NV (a) | 562,900 | 22,522 | |
| IMCD Group BV | 1,926,800 | 77,794 | |
| ING Groep NV (Certificaten Van Aandelen) | 4,956,300 | 60,696 | |
| Unilever NV (Certificaten Van Aandelen) (Bearer) | 3,814,100 | 167,553 | |
| TOTAL NETHERLANDS | 328,565 | ||
| New Zealand - 0.8% | |||
| EBOS Group Ltd. | 3,154,998 | 35,160 | |
| Ryman Healthcare Group Ltd. | 7,137,434 | 44,505 | |
| TOTAL NEW ZEALAND | 79,665 | ||
| Norway - 1.6% | |||
| Statoil ASA (b) | 9,044,100 | 159,188 | |
| Philippines - 0.3% | |||
| SM Investments Corp. | 1,641,730 | 32,950 | |
| Romania - 0.2% | |||
| Banca Transilvania SA | 31,143,575 | 21,373 | |
| South Africa - 1.3% | |||
| EOH Holdings Ltd. | 2,855,067 | 27,788 | |
| Naspers Ltd. Class N | 720,500 | 98,860 | |
| TOTAL SOUTH AFRICA | 126,648 | ||
| Spain - 2.5% | |||
| Amadeus IT Holding SA Class A | 1,717,100 | 78,135 | |
| Atresmedia Corporacion de Medios de Comunicacion SA | 1,719,200 | 22,383 | |
| Hispania Activos Inmobiliarios SA (a) | 1,085,200 | 15,905 | |
| Inditex SA | 2,288,877 | 73,476 | |
| Mediaset Espana Comunicacion SA | 2,931,000 | 38,059 | |
| Merlin Properties Socimi SA | 2,483,100 | 28,859 | |
| TOTAL SPAIN | 256,817 | ||
| Sweden - 4.1% | |||
| ASSA ABLOY AB (B Shares) | 3,682,800 | 77,229 | |
| Getinge AB (B Shares) | 2,461,330 | 52,044 | |
| HEXPOL AB (B Shares) (b) | 2,967,500 | 30,671 | |
| Indutrade AB (b) | 201,100 | 11,276 | |
| Nordea Bank AB | 5,749,200 | 55,806 | |
| Saab AB (B Shares) | 980,200 | 33,530 | |
| Sandvik AB (b) | 2,242,600 | 23,011 | |
| Svenska Cellulosa AB (SCA) (B Shares) | 3,034,500 | 95,564 | |
| Svenska Handelsbanken AB (A Shares) (b) | 2,567,100 | 34,246 | |
| TOTAL SWEDEN | 413,377 | ||
| Switzerland - 4.3% | |||
| GAM Holding Ltd. | 1,405,187 | 18,310 | |
| Julius Baer Group Ltd. | 949,640 | 40,698 | |
| Novartis AG | 1,375,538 | 104,682 | |
| Partners Group Holding AG | 247,326 | 101,839 | |
| Schindler Holding AG (participation certificate) | 181,273 | 33,012 | |
| Syngenta AG (Switzerland) | 175,928 | 70,423 | |
| UBS Group AG | 3,690,490 | 63,861 | |
| TOTAL SWITZERLAND | 432,825 | ||
| Taiwan - 0.1% | |||
| JHL Biotech, Inc. (a) | 4,953,560 | 13,395 | |
| United Kingdom - 14.5% | |||
| AA PLC | 3,830,868 | 15,595 | |
| Associated British Foods PLC | 772,200 | 34,571 | |
| B&M European Value Retail S.A. | 9,180,129 | 37,209 | |
| BAE Systems PLC | 4,147,100 | 28,933 | |
| BCA Marketplace PLC | 7,762,300 | 18,913 | |
| BHP Billiton PLC | 2,881,014 | 39,368 | |
| BT Group PLC | 6,133,600 | 39,758 | |
| Bunzl PLC | 2,075,300 | 61,829 | |
| Cineworld Group PLC | 2,055,200 | 15,555 | |
| CMC Markets PLC | 8,647,600 | 31,589 | |
| Compass Group PLC | 2,013,000 | 35,848 | |
| Countryside Properties PLC (a) | 3,408,200 | 11,578 | |
| Diploma PLC | 2,312,600 | 24,718 | |
| GlaxoSmithKline PLC | 3,812,600 | 81,485 | |
| Howden Joinery Group PLC | 10,913,100 | 78,772 | |
| Imperial Tobacco Group PLC | 1,848,336 | 100,425 | |
| ITV PLC | 9,444,600 | 31,078 | |
| Lloyds Banking Group PLC | 69,181,900 | 67,903 | |
| London Stock Exchange Group PLC | 473,136 | 18,756 | |
| McCarthy & Stone PLC | 4,009,500 | 13,592 | |
| Melrose Industries PLC | 1,586,476 | 8,653 | |
| Micro Focus International PLC | 3,609,242 | 80,634 | |
| Moneysupermarket.com Group PLC | 5,210,600 | 23,899 | |
| Persimmon PLC | 1,469,800 | 42,673 | |
| Reckitt Benckiser Group PLC | 900,800 | 87,755 | |
| Rex Bionics PLC (a)(c) | 1,297,286 | 692 | |
| Rio Tinto PLC | 1,185,200 | 39,759 | |
| SABMiller PLC | 719,300 | 43,985 | |
| Shawbrook Group PLC | 8,951,700 | 37,487 | |
| Softcat PLC | 1,526,900 | 7,117 | |
| Spirax-Sarco Engineering PLC | 539,500 | 26,920 | |
| St. James's Place Capital PLC | 5,394,300 | 68,336 | |
| Standard Chartered PLC (United Kingdom) | 5,296,810 | 42,729 | |
| Taylor Wimpey PLC | 11,716,900 | 31,552 | |
| Virgin Money Holdings Uk PLC | 5,874,500 | 31,338 | |
| Vodafone Group PLC | 30,823,796 | 99,309 | |
| Workspace Group PLC | 649,000 | 7,918 | |
| TOTAL UNITED KINGDOM | 1,468,231 | ||
| United States of America - 3.1% | |||
| Constellation Brands, Inc. Class A (sub. vtg.) | 520,000 | 81,151 | |
| Global Payments, Inc. | 465,000 | 33,564 | |
| McGraw Hill Financial, Inc. | 462,400 | 49,407 | |
| Molson Coors Brewing Co. Class B | 121,600 | 11,629 | |
| MSCI, Inc. Class A | 586,700 | 44,554 | |
| Visa, Inc. Class A | 1,147,700 | 88,648 | |
| TOTAL UNITED STATES OF AMERICA | 308,953 | ||
| TOTAL COMMON STOCKS | |||
| (Cost $8,697,817) | 9,796,876 | ||
| Nonconvertible Preferred Stocks - 0.2% | |||
| Cayman Islands - 0.2% | |||
| China Internet Plus Holdings Ltd. Series A-11 (d) | |||
| (Cost $18,833) | 5,958,244 | 23,003 | |
| Principal Amount (000s) | Value (000s) | ||
| Government Obligations - 0.1% | |||
| United States of America - 0.1% | |||
| U.S. Treasury Bills, yield at date of purchase 0.2% to 0.33% 5/5/16 to 7/28/16 (e) | |||
| (Cost $11,655) | 11,660 | 11,657 | |
| Shares | Value (000s) | ||
| Money Market Funds - 5.1% | |||
| Fidelity Cash Central Fund, 0.38% (f) | 199,763,053 | 199,763 | |
| Fidelity Securities Lending Cash Central Fund, 0.42% (f)(g) | 311,707,412 | 311,707 | |
| TOTAL MONEY MARKET FUNDS | |||
| (Cost $511,470) | 511,470 | ||
| TOTAL INVESTMENT PORTFOLIO - 102.5% | |||
| (Cost $9,239,775) | 10,343,006 | ||
| NET OTHER ASSETS (LIABILITIES) - (2.5)% | (248,078) | ||
| NET ASSETS - 100% | $10,094,928 |
| Futures Contracts | |||
| Expiration Date | Underlying Face Amount at Value (000s) | Unrealized Appreciation/(Depreciation) (000s) | |
| Purchased | |||
| Equity Index Contracts | |||
| 2,402 CME Nikkei 225 Contracts (Japan) | June 2016 | 179,021 | $(11,598) |
The face value of futures purchased as a percentage of Net Assets is 1.8%
Categorizations in the Schedule of Investments are based on country or territory of incorporation.
Legend
(a) Non-income producing
(b) Security or a portion of the security is on loan at period end.
(c) Affiliated company
(d) Restricted securities - Investment in securities not registered under the Securities Act of 1933 (excluding 144A issues). At the end of the period, the value of restricted securities (excluding 144A issues) amounted to $23,003,000 or 0.2% of net assets.
(e) Security or a portion of the security was pledged to cover margin requirements for futures contracts. At period end, the value of securities pledged amounted to $11,657,000.
(f) Affiliated fund that is generally available only to investment companies and other accounts managed by Fidelity Investments. The rate quoted is the annualized seven-day yield of the fund at period end. A complete unaudited listing of the fund's holdings as of its most recent quarter end is available upon request. In addition, each Fidelity Central Fund's financial statements are available on the SEC's website or upon request.
(g) Investment made with cash collateral received from securities on loan.
Additional information on each restricted holding is as follows:
| Security | Acquisition Date | Acquisition Cost (000s) |
| China Internet Plus Holdings Ltd. Series A-11 | 1/26/15 | $18,833 |
Affiliated Central Funds
Information regarding fiscal year to date income earned by the Fund from investments in Fidelity Central Funds is as follows:
| Fund | Income earned |
| (Amounts in thousands) | |
| Fidelity Cash Central Fund | $545 |
| Fidelity Securities Lending Cash Central Fund | 2,593 |
| Total | $3,138 |
Other Affiliated Issuers
An affiliated company is a company in which the Fund has ownership of at least 5% of the voting securities. Fiscal year to date transactions with companies which are or were affiliates are as follows:
| Affiliate (Amounts in thousands) | Value, beginning of period | Purchases | Sales Proceeds* | Dividend Income | Value, end of period |
| Hoegh LNG Partners LP | $11,465 | $-- | $-- | $832 | $12,896 |
| Rex Bionics PLC | 976 | -- | 4 | -- | 692 |
| Total | $12,441 | $-- | $4 | $832 | $13,588 |
* Includes the value of securities delivered through in-kind transactions, if applicable.
Investment Valuation
The following is a summary of the inputs used, as of April 30, 2016, involving the Fund's assets and liabilities carried at fair value. The inputs or methodology used for valuing securities may not be an indication of the risk associated with investing in those securities. For more information on valuation inputs, and their aggregation into the levels used below, please refer to the Investment Valuation section in the accompanying Notes to Financial Statements.
| Valuation Inputs at Reporting Date: | ||||
| Description | Total | Level 1 | Level 2 | Level 3 |
| (Amounts in thousands) | ||||
| Investments in Securities: | ||||
| Equities: | ||||
| Consumer Discretionary | $1,534,838 | $1,034,716 | $477,119 | $23,003 |
| Consumer Staples | 1,334,162 | 853,349 | 480,813 | -- |
| Energy | 494,568 | 113,750 | 380,818 | -- |
| Financials | 2,185,536 | 1,236,886 | 948,650 | -- |
| Health Care | 1,265,979 | 574,622 | 691,357 | -- |
| Industrials | 1,107,038 | 909,868 | 197,170 | -- |
| Information Technology | 982,951 | 693,397 | 289,554 | -- |
| Materials | 371,953 | 262,239 | 109,714 | -- |
| Telecommunication Services | 480,601 | 83,196 | 397,405 | -- |
| Utilities | 62,253 | 62,253 | -- | -- |
| Government Obligations | 11,657 | -- | 11,657 | -- |
| Money Market Funds | 511,470 | 511,470 | -- | -- |
| Total Investments in Securities: | $10,343,006 | $6,335,746 | $3,984,257 | $23,003 |
| Derivative Instruments: | ||||
| Liabilities | ||||
| Futures Contracts | $(11,598) | $(11,598) | $-- | $-- |
| Total Liabilities | $(11,598) | $(11,598) | $-- | $-- |
| Total Derivative Instruments: | $(11,598) | $(11,598) | $-- | $-- |
The following is a summary of transfers between Level 1 and Level 2 for the period ended April 30, 2016. Transfers are assumed to have occurred at the beginning of the period, and are primarily attributable to the valuation techniques used for foreign equity securities, as discussed in the accompanying Notes to Financial Statements:
| Transfers | Total (000s) |
| Level 1 to Level 2 | $123,459 |
| Level 2 to Level 1 | $733,107 |
Value of Derivative Instruments
The following table is a summary of the Fund's value of derivative instruments by primary risk exposure as of April 30, 2016. For additional information on derivative instruments, please refer to the Derivative Instruments section in the accompanying Notes to Financial Statements.
| Primary Risk Exposure / Derivative Type | Value (000s) | |
| Asset | Liability | |
| Equity Risk | ||
| Futures Contracts(a) | $0 | $(11,598) |
| Total Equity Risk | 0 | (11,598) |
| Total Value of Derivatives | $0 | $(11,598) |
(a) Reflects gross cumulative appreciation (depreciation) on futures contracts as presented in the Schedule of Investments. In the Statement of Assets and Liabilities, the period end daily variation margin is included in receivable or payable for daily variation margin for derivative instruments, and the net cumulative appreciation (depreciation) is included in net unrealized appreciation (depreciation).
See accompanying notes which are an integral part of the financial statements.
Financial Statements
Statement of Assets and Liabilities
| Amounts in thousands (except per-share amounts) | April 30, 2016 (Unaudited) | |
| Assets | ||
| Investment in securities, at value (including securities loaned of $292,726) — See accompanying schedule: Unaffiliated issuers (cost $8,709,825) | $9,817,948 | |
| Fidelity Central Funds (cost $511,470) | 511,470 | |
| Other affiliated issuers (cost $18,480) | 13,588 | |
| Total Investments (cost $9,239,775) | $10,343,006 | |
| Foreign currency held at value (cost $3,534) | 3,534 | |
| Receivable for investments sold | 83,114 | |
| Receivable for fund shares sold | 9,626 | |
| Dividends receivable | 48,955 | |
| Distributions receivable from Fidelity Central Funds | 957 | |
| Prepaid expenses | 9 | |
| Other receivables | 4,089 | |
| Total assets | 10,493,290 | |
| Liabilities | ||
| Payable to custodian bank | $705 | |
| Payable for investments purchased | 56,857 | |
| Payable for fund shares redeemed | 16,003 | |
| Accrued management fee | 6,281 | |
| Distribution and service plan fees payable | 100 | |
| Payable for daily variation margin for derivative instruments | 4,684 | |
| Other affiliated payables | 1,444 | |
| Other payables and accrued expenses | 581 | |
| Collateral on securities loaned, at value | 311,707 | |
| Total liabilities | 398,362 | |
| Net Assets | $10,094,928 | |
| Net Assets consist of: | ||
| Paid in capital | $9,352,158 | |
| Undistributed net investment income | 88,416 | |
| Accumulated undistributed net realized gain (loss) on investments and foreign currency transactions | (436,449) | |
| Net unrealized appreciation (depreciation) on investments and assets and liabilities in foreign currencies | 1,090,803 | |
| Net Assets | $10,094,928 | |
| Calculation of Maximum Offering Price | ||
| Class A: | ||
| Net Asset Value and redemption price per share ($260,942.4 ÷ 6,913.487 shares) | $37.74 | |
| Maximum offering price per share (100/94.25 of $37.74) | $40.04 | |
| Class T: | ||
| Net Asset Value and redemption price per share ($38,584.3 ÷ 1,028.093 shares) | $37.53 | |
| Maximum offering price per share (100/96.50 of $37.53) | $38.89 | |
| Class B: | ||
| Net Asset Value and offering price per share ($1,398.6 ÷ 37.492 shares)(a) | $37.30 | |
| Class C: | ||
| Net Asset Value and offering price per share ($32,708.8 ÷ 878.178 shares)(a) | $37.25 | |
| International Discovery: | ||
| Net Asset Value, offering price and redemption price per share ($6,797,488.8 ÷ 178,912.550 shares) | $37.99 | |
| Class K: | ||
| Net Asset Value, offering price and redemption price per share ($2,151,531.2 ÷ 56,751.079 shares) | $37.91 | |
| Class I: | ||
| Net Asset Value, offering price and redemption price per share ($781,184.7 ÷ 20,610.933 shares) | $37.90 | |
| Class Z: | ||
| Net Asset Value, offering price and redemption price per share ($31,088.8 ÷ 820.463 shares) | $37.89 |
(a) Redemption price per share is equal to net asset value less any applicable contingent deferred sales charge.
See accompanying notes which are an integral part of the financial statements.
Statement of Operations
| Amounts in thousands | Six months ended April 30, 2016 (Unaudited) | |
| Investment Income | ||
| Dividends (including $832 earned from other affiliated issuers) | $115,061 | |
| Special dividends | 37,704 | |
| Interest | 30 | |
| Income from Fidelity Central Funds | 3,138 | |
| Income before foreign taxes withheld | 155,933 | |
| Less foreign taxes withheld | (11,075) | |
| Total income | 144,858 | |
| Expenses | ||
| Management fee | ||
| Basic fee | $34,526 | |
| Performance adjustment | 6,890 | |
| Transfer agent fees | 8,001 | |
| Distribution and service plan fees | 600 | |
| Accounting and security lending fees | 905 | |
| Custodian fees and expenses | 660 | |
| Independent trustees' compensation | 23 | |
| Registration fees | 158 | |
| Audit | 78 | |
| Legal | 14 | |
| Miscellaneous | 35 | |
| Total expenses before reductions | 51,890 | |
| Expense reductions | (113) | 51,777 |
| Net investment income (loss) | 93,081 | |
| Realized and Unrealized Gain (Loss) | ||
| Net realized gain (loss) on: | ||
| Investment securities: | ||
| Unaffiliated issuers | (355,764) | |
| Other affiliated issuers | (19) | |
| Foreign currency transactions | 4,399 | |
| Futures contracts | (10,549) | |
| Total net realized gain (loss) | (361,933) | |
| Change in net unrealized appreciation (depreciation) on: Investment securities | (204,729) | |
| Assets and liabilities in foreign currencies | (1,103) | |
| Futures contracts | (20,801) | |
| Total change in net unrealized appreciation (depreciation) | (226,633) | |
| Net gain (loss) | (588,566) | |
| Net increase (decrease) in net assets resulting from operations | $(495,485) |
See accompanying notes which are an integral part of the financial statements.
Statement of Changes in Net Assets
| Amounts in thousands | Six months ended April 30, 2016 (Unaudited) | Year ended October 31, 2015 |
| Increase (Decrease) in Net Assets | ||
| Operations | ||
| Net investment income (loss) | $93,081 | $149,838 |
| Net realized gain (loss) | (361,933) | 245,770 |
| Change in net unrealized appreciation (depreciation) | (226,633) | 655 |
| Net increase (decrease) in net assets resulting from operations | (495,485) | 396,263 |
| Distributions to shareholders from net investment income | (113,434) | (74,589) |
| Distributions to shareholders from net realized gain | (1,362) | – |
| Total distributions | (114,796) | (74,589) |
| Share transactions - net increase (decrease) | (262,006) | (353,147) |
| Redemption fees | 42 | 95 |
| Total increase (decrease) in net assets | (872,245) | (31,378) |
| Net Assets | ||
| Beginning of period | 10,967,173 | 10,998,551 |
| End of period (including undistributed net investment income of $88,416 and undistributed net investment income of $108,769, respectively) | $10,094,928 | $10,967,173 |
See accompanying notes which are an integral part of the financial statements.
Financial Highlights — Fidelity International Discovery Fund Class A
| Six months ended (Unaudited) April 30, | Years ended October 31, | |||||
| 2016 | 2015 | 2014 | 2013 | 2012 | 2011 | |
| Selected Per–Share Data | ||||||
| Net asset value, beginning of period | $39.78 | $38.70 | $39.49 | $31.66 | $29.43 | $32.07 |
| Income from Investment Operations | ||||||
| Net investment income (loss)A | .27B | .40C | .53D | .34 | .41 | .42 |
| Net realized and unrealized gain (loss) | (2.04) | .79 | (.67) | 7.97 | 2.11 | (2.52) |
| Total from investment operations | (1.77) | 1.19 | (.14) | 8.31 | 2.52 | (2.10) |
| Distributions from net investment income | (.27) | (.11) | (.33) | (.45) | (.29) | (.38) |
| Distributions from net realized gain | (.01) | – | (.31) | (.03) | – | (.16) |
| Total distributions | (.27)E | (.11) | (.65)F | (.48) | (.29) | (.54) |
| Redemption fees added to paid in capitalA,G | – | – | – | – | – | – |
| Net asset value, end of period | $37.74 | $39.78 | $38.70 | $39.49 | $31.66 | $29.43 |
| Total ReturnH,I,J | (4.47)% | 3.09% | (.36)% | 26.59% | 8.70% | (6.71)% |
| Ratios to Average Net AssetsK,L | ||||||
| Expenses before reductions | 1.37%M | 1.33% | 1.28% | 1.35% | 1.34% | 1.30% |
| Expenses net of fee waivers, if any | 1.37%M | 1.33% | 1.28% | 1.35% | 1.34% | 1.29% |
| Expenses net of all reductions | 1.37%M | 1.32% | 1.28% | 1.33% | 1.31% | 1.25% |
| Net investment income (loss) | 1.45%B,M | 1.00%C | 1.35%D | .97% | 1.41% | 1.31% |
| Supplemental Data | ||||||
| Net assets, end of period (in millions) | $261 | $283 | $297 | $347 | $299 | $320 |
| Portfolio turnover rateN | 49%M,O | 60%O | 57% | 65% | 68% | 75% |
A Calculated based on average shares outstanding during the period.
B Net Investment income per share reflects a large, non-recurring dividend which amounted to $.14 per share. Excluding this non-recurring dividend, the ratio of net investment income (loss) to average net assets would have been .72%.
C Net Investment income per share reflects a large, non-recurring dividend which amounted to $.12 per share. Excluding this non-recurring dividend, the ratio of net investment income (loss) to average net assets would have been .69%.
D Net Investment income per share reflects a large, non-recurring dividend which amounted to $.22 per share. Excluding this non-recurring dividend, the ratio of net investment income (loss) to average net assets would have been .80%.
E Total distributions of $.27 per share is comprised of distributions from net investment income of $.269 and distributions from net realized gain of $.005 per share.
F Total distributions of $.65 per share is comprised of distributions from net investment income of $.334 and distributions from net realized gain of $.311 per share.
G Amount represents less than $.005 per share.
H Total returns for periods of less than one year are not annualized.
I Total returns would have been lower if certain expenses had not been reduced during the applicable periods shown.
J Total returns do not include the effect of the sales charges.
K Fees and expenses of any underlying Fidelity Central Funds are not included in the Fund's expense ratio. The Fund indirectly bears its proportionate share of the expenses of any underlying Fidelity Central Funds.
L Expense ratios reflect operating expenses of the class. Expenses before reductions do not reflect amounts reimbursed by the investment adviser or reductions from brokerage service arrangements or reductions from other expense offset arrangements and do not represent the amount paid by the class during periods when reimbursements or reductions occur. Expenses net of fee waivers reflect expenses after reimbursement by the investment adviser but prior to reductions from brokerage service arrangements or other expense offset arrangements. Expenses net of all reductions represent the net expenses paid by the class.
M Annualized
N Amount does not include the portfolio activity of any underlying Fidelity Central Funds.
O Portfolio turnover rate excludes securities received or delivered in-kind.
See accompanying notes which are an integral part of the financial statements.
Financial Highlights — Fidelity International Discovery Fund Class T
| Six months ended (Unaudited) April 30, | Years ended October 31, | |||||
| 2016 | 2015 | 2014 | 2013 | 2012 | 2011 | |
| Selected Per–Share Data | ||||||
| Net asset value, beginning of period | $39.51 | $38.43 | $39.23 | $31.42 | $29.18 | $31.81 |
| Income from Investment Operations | ||||||
| Net investment income (loss)A | .23B | .30C | .44D | .26 | .34 | .34 |
| Net realized and unrealized gain (loss) | (2.03) | .80 | (.68) | 7.92 | 2.09 | (2.51) |
| Total from investment operations | (1.80) | 1.10 | (.24) | 8.18 | 2.43 | (2.17) |
| Distributions from net investment income | (.17) | (.02) | (.25) | (.34) | (.19) | (.30) |
| Distributions from net realized gain | (.01) | – | (.31) | (.03) | – | (.16) |
| Total distributions | (.18) | (.02) | (.56) | (.37) | (.19) | (.46) |
| Redemption fees added to paid in capitalA,E | – | – | – | – | – | – |
| Net asset value, end of period | $37.53 | $39.51 | $38.43 | $39.23 | $31.42 | $29.18 |
| Total ReturnF,G,H | (4.59)% | 2.86% | (.60)% | 26.31% | 8.41% | (6.96)% |
| Ratios to Average Net AssetsI,J | ||||||
| Expenses before reductions | 1.61%K | 1.57% | 1.51% | 1.59% | 1.59% | 1.56% |
| Expenses net of fee waivers, if any | 1.61%K | 1.57% | 1.51% | 1.59% | 1.59% | 1.55% |
| Expenses net of all reductions | 1.61%K | 1.56% | 1.51% | 1.57% | 1.56% | 1.51% |
| Net investment income (loss) | 1.21%B,K | .76%C | 1.11%D | .73% | 1.16% | 1.05% |
| Supplemental Data | ||||||
| Net assets, end of period (in millions) | $39 | $43 | $49 | $53 | $46 | $61 |
| Portfolio turnover rateL | 49%K,M | 60%M | 57% | 65% | 68% | 75% |
A Calculated based on average shares outstanding during the period.
B Net Investment income per share reflects a large, non-recurring dividend which amounted to $.14 per share. Excluding this non-recurring dividend, the ratio of net investment income (loss) to average net assets would have been .48%.
C Net Investment income per share reflects a large, non-recurring dividend which amounted to $.12 per share. Excluding this non-recurring dividend, the ratio of net investment income (loss) to average net assets would have been .45%.
D Net Investment income per share reflects a large, non-recurring dividend which amounted to $.21 per share. Excluding this non-recurring dividend, the ratio of net investment income (loss) to average net assets would have been .56%.
E Amount represents less than $.005 per share.
F Total returns for periods of less than one year are not annualized.
G Total returns would have been lower if certain expenses had not been reduced during the applicable periods shown.
H Total returns do not include the effect of the sales charges.
I Fees and expenses of any underlying Fidelity Central Funds are not included in the Fund's expense ratio. The Fund indirectly bears its proportionate share of the expenses of any underlying Fidelity Central Funds.
J Expense ratios reflect operating expenses of the class. Expenses before reductions do not reflect amounts reimbursed by the investment adviser or reductions from brokerage service arrangements or reductions from other expense offset arrangements and do not represent the amount paid by the class during periods when reimbursements or reductions occur. Expenses net of fee waivers reflect expenses after reimbursement by the investment adviser but prior to reductions from brokerage service arrangements or other expense offset arrangements. Expenses net of all reductions represent the net expenses paid by the class.
K Annualized
L Amount does not include the portfolio activity of any underlying Fidelity Central Funds.
M Portfolio turnover rate excludes securities received or delivered in-kind.
See accompanying notes which are an integral part of the financial statements.
Financial Highlights — Fidelity International Discovery Fund Class B
| Six months ended (Unaudited) April 30, | Years ended October 31, | |||||
| 2016 | 2015 | 2014 | 2013 | 2012 | 2011 | |
| Selected Per–Share Data | ||||||
| Net asset value, beginning of period | $39.20 | $38.32 | $39.08 | $31.28 | $29.02 | $31.60 |
| Income from Investment Operations | ||||||
| Net investment income (loss)A | .13B | .08C | .22D | .08 | .19 | .17 |
| Net realized and unrealized gain (loss) | (2.03) | .80 | (.66) | 7.90 | 2.09 | (2.48) |
| Total from investment operations | (1.90) | .88 | (.44) | 7.98 | 2.28 | (2.31) |
| Distributions from net investment income | – | – | (.01) | (.15) | (.02) | (.12) |
| Distributions from net realized gain | – | – | (.31) | (.03) | – | (.16) |
| Total distributions | – | – | (.32) | (.18) | (.02) | (.27)E |
| Redemption fees added to paid in capitalA,F | – | – | – | – | – | – |
| Net asset value, end of period | $37.30 | $39.20 | $38.32 | $39.08 | $31.28 | $29.02 |
| Total ReturnG,H,I | (4.85)% | 2.30% | (1.12)% | 25.64% | 7.85% | (7.39)% |
| Ratios to Average Net AssetsJ,K | ||||||
| Expenses before reductions | 2.14%L | 2.12% | 2.06% | 2.10% | 2.09% | 2.06% |
| Expenses net of fee waivers, if any | 2.14%L | 2.12% | 2.06% | 2.10% | 2.09% | 2.06% |
| Expenses net of all reductions | 2.14%L | 2.11% | 2.05% | 2.08% | 2.06% | 2.02% |
| Net investment income (loss) | .68%B,L | .21%C | .57%D | .22% | .66% | .54% |
| Supplemental Data | ||||||
| Net assets, end of period (in millions) | $1 | $2 | $5 | $7 | $8 | $10 |
| Portfolio turnover rateM | 49%L,N | 60%N | 57% | 65% | 68% | 75% |
A Calculated based on average shares outstanding during the period.
B Net Investment income per share reflects a large, non-recurring dividend which amounted to $.14 per share. Excluding this non-recurring dividend, the ratio of net investment income (loss) to average net assets would have been (.05) %.
C Net Investment income per share reflects a large, non-recurring dividend which amounted to $.12 per share. Excluding this non-recurring dividend, the ratio of net investment income (loss) to average net assets would have been (.10) %.
D Net Investment income per share reflects a large, non-recurring dividend which amounted to $.21 per share. Excluding this non-recurring dividend, the ratio of net investment income (loss) to average net assets would have been .02%.
E Total distributions of $.27 per share is comprised of distributions from net investment income of $.115 and distributions from net realized gain of $.155 per share.
F Amount represents less than $.005 per share.
G Total returns for periods of less than one year are not annualized.
H Total returns would have been lower if certain expenses had not been reduced during the applicable periods shown.
I Total returns do not include the effect of the contingent deferred sales charge.
J Fees and expenses of any underlying Fidelity Central Funds are not included in the Fund's expense ratio. The Fund indirectly bears its proportionate share of the expenses of any underlying Fidelity Central Funds.
K Expense ratios reflect operating expenses of the class. Expenses before reductions do not reflect amounts reimbursed by the investment adviser or reductions from brokerage service arrangements or reductions from other expense offset arrangements and do not represent the amount paid by the class during periods when reimbursements or reductions occur. Expenses net of fee waivers reflect expenses after reimbursement by the investment adviser but prior to reductions from brokerage service arrangements or other expense offset arrangements. Expenses net of all reductions represent the net expenses paid by the class.
L Annualized
M Amount does not include the portfolio activity of any underlying Fidelity Central Funds.
N Portfolio turnover rate excludes securities received or delivered in-kind.
See accompanying notes which are an integral part of the financial statements.
Financial Highlights — Fidelity International Discovery Fund Class C
| Six months ended (Unaudited) April 30, | Years ended October 31, | |||||
| 2016 | 2015 | 2014 | 2013 | 2012 | 2011 | |
| Selected Per–Share Data | ||||||
| Net asset value, beginning of period | $39.14 | $38.25 | $39.07 | $31.32 | $29.08 | $31.68 |
| Income from Investment Operations | ||||||
| Net investment income (loss)A | .13B | .10C | .23D | .08 | .19 | .18 |
| Net realized and unrealized gain (loss) | (2.02) | .79 | (.66) | 7.90 | 2.09 | (2.49) |
| Total from investment operations | (1.89) | .89 | (.43) | 7.98 | 2.28 | (2.31) |
| Distributions from net investment income | – | – | (.08) | (.20) | (.04) | (.14) |
| Distributions from net realized gain | – | – | (.31) | (.03) | – | (.16) |
| Total distributions | – | – | (.39) | (.23) | (.04) | (.29)E |
| Redemption fees added to paid in capitalA,F | – | – | – | – | – | – |
| Net asset value, end of period | $37.25 | $39.14 | $38.25 | $39.07 | $31.32 | $29.08 |
| Total ReturnG,H,I | (4.83)% | 2.33% | (1.10)% | 25.65% | 7.86% | (7.37)% |
| Ratios to Average Net AssetsJ,K | ||||||
| Expenses before reductions | 2.12%L | 2.09% | 2.03% | 2.10% | 2.09% | 2.05% |
| Expenses net of fee waivers, if any | 2.12%L | 2.09% | 2.03% | 2.09% | 2.09% | 2.04% |
| Expenses net of all reductions | 2.12%L | 2.08% | 2.02% | 2.07% | 2.06% | 2.00% |
| Net investment income (loss) | .70%B,L | .24%C | .60%D | .23% | .66% | .56% |
| Supplemental Data | ||||||
| Net assets, end of period (in millions) | $33 | $32 | $35 | $36 | $30 | $33 |
| Portfolio turnover rateM | 49%L,N | 60%N | 57% | 65% | 68% | 75% |
A Calculated based on average shares outstanding during the period.
B Net Investment income per share reflects a large, non-recurring dividend which amounted to $.14 per share. Excluding this non-recurring dividend, the ratio of net investment income (loss) to average net assets would have been (.03) %.
C Net Investment income per share reflects a large, non-recurring dividend which amounted to $.12 per share. Excluding this non-recurring dividend, the ratio of net investment income (loss) to average net assets would have been (.06) %.
D Net Investment income per share reflects a large, non-recurring dividend which amounted to $.21 per share. Excluding this non-recurring dividend, the ratio of net investment income (loss) to average net assets would have been .05%.
E Total distributions of $.29 per share is comprised of distributions from net investment income of $.137 and distributions from net realized gain of $.155 per share.
F Amount represents less than $.005 per share.
G Total returns for periods of less than one year are not annualized.
H Total returns would have been lower if certain expenses had not been reduced during the applicable periods shown.
I Total returns do not include the effect of the contingent deferred sales charge.
J Fees and expenses of any underlying Fidelity Central Funds are not included in the Fund's expense ratio. The Fund indirectly bears its proportionate share of the expenses of any underlying Fidelity Central Funds.
K Expense ratios reflect operating expenses of the class. Expenses before reductions do not reflect amounts reimbursed by the investment adviser or reductions from brokerage service arrangements or reductions from other expense offset arrangements and do not represent the amount paid by the class during periods when reimbursements or reductions occur. Expenses net of fee waivers reflect expenses after reimbursement by the investment adviser but prior to reductions from brokerage service arrangements or other expense offset arrangements. Expenses net of all reductions represent the net expenses paid by the class.
L Annualized
M Amount does not include the portfolio activity of any underlying Fidelity Central Funds.
N Portfolio turnover rate excludes securities received or delivered in-kind.
See accompanying notes which are an integral part of the financial statements.
Financial Highlights — Fidelity International Discovery Fund
| Six months ended (Unaudited) April 30, | Years ended October 31, | |||||
| 2016 | 2015 | 2014 | 2013 | 2012 | 2011 | |
| Selected Per–Share Data | ||||||
| Net asset value, beginning of period | $40.12 | $39.03 | $39.82 | $31.91 | $29.69 | $32.34 |
| Income from Investment Operations | ||||||
| Net investment income (loss)A | .34B | .54C | .67D | .47 | .51 | .53 |
| Net realized and unrealized gain (loss) | (2.06) | .81 | (.68) | 8.02 | 2.12 | (2.54) |
| Total from investment operations | (1.72) | 1.35 | (.01) | 8.49 | 2.63 | (2.01) |
| Distributions from net investment income | (.41) | (.26) | (.47) | (.55) | (.41) | (.48) |
| Distributions from net realized gain | (.01) | – | (.31) | (.03) | – | (.16) |
| Total distributions | (.41)E | (.26) | (.78) | (.58) | (.41) | (.64) |
| Redemption fees added to paid in capitalA,F | – | – | – | – | – | – |
| Net asset value, end of period | $37.99 | $40.12 | $39.03 | $39.82 | $31.91 | $29.69 |
| Total ReturnG,H | (4.33)% | 3.47% | (.01)% | 27.03% | 9.03% | (6.39)% |
| Ratios to Average Net AssetsI,J | ||||||
| Expenses before reductions | 1.02%K | .99% | .93% | 1.00% | 1.01% | .97% |
| Expenses net of fee waivers, if any | 1.02%K | .99% | .93% | 1.00% | 1.01% | .96% |
| Expenses net of all reductions | 1.02%K | .98% | .93% | .98% | .98% | .92% |
| Net investment income (loss) | 1.80%B,K | 1.34%C | 1.69%D | 1.32% | 1.73% | 1.64% |
| Supplemental Data | ||||||
| Net assets, end of period (in millions) | $6,797 | $7,209 | $7,464 | $7,800 | $5,965 | $6,806 |
| Portfolio turnover rateL | 49%K,M | 60%M | 57% | 65% | 68% | 75% |
A Calculated based on average shares outstanding during the period.
B Net Investment income per share reflects a large, non-recurring dividend which amounted to $.14 per share. Excluding this non-recurring dividend, the ratio of net investment income (loss) to average net assets would have been 1.07%.
C Net Investment income per share reflects a large, non-recurring dividend which amounted to $.12 per share. Excluding this non-recurring dividend, the ratio of net investment income (loss) to average net assets would have been 1.03%.
D Net Investment income per share reflects a large, non-recurring dividend which amounted to $.22 per share. Excluding this non-recurring dividend, the ratio of net investment income (loss) to average net assets would have been 1.15%.
E Total distributions of $.41 per share is comprised of distributions from net investment income of $.409 and distributions from net realized gain of $.005 per share.
F Amount represents less than $.005 per share.
G Total returns for periods of less than one year are not annualized.
H Total returns would have been lower if certain expenses had not been reduced during the applicable periods shown.
I Fees and expenses of any underlying Fidelity Central Funds are not included in the Fund's expense ratio. The Fund indirectly bears its proportionate share of the expenses of any underlying Fidelity Central Funds.
J Expense ratios reflect operating expenses of the class. Expenses before reductions do not reflect amounts reimbursed by the investment adviser or reductions from brokerage service arrangements or reductions from other expense offset arrangements and do not represent the amount paid by the class during periods when reimbursements or reductions occur. Expenses net of fee waivers reflect expenses after reimbursement by the investment adviser but prior to reductions from brokerage service arrangements or other expense offset arrangements. Expenses net of all reductions represent the net expenses paid by the class.
K Annualized
L Amount does not include the portfolio activity of any underlying Fidelity Central Funds.
M Portfolio turnover rate excludes securities received or delivered in-kind.
See accompanying notes which are an integral part of the financial statements.
Financial Highlights — Fidelity International Discovery Fund Class K
| Six months ended (Unaudited) April 30, | Years ended October 31, | |||||
| 2016 | 2015 | 2014 | 2013 | 2012 | 2011 | |
| Selected Per–Share Data | ||||||
| Net asset value, beginning of period | $40.06 | $38.97 | $39.76 | $31.87 | $29.66 | $32.32 |
| Income from Investment Operations | ||||||
| Net investment income (loss)A | .36B | .59C | .72D | .52 | .57 | .58 |
| Net realized and unrealized gain (loss) | (2.04) | .81 | (.67) | 8.01 | 2.11 | (2.54) |
| Total from investment operations | (1.68) | 1.40 | .05 | 8.53 | 2.68 | (1.96) |
| Distributions from net investment income | (.46) | (.31) | (.53) | (.61) | (.47) | (.55) |
| Distributions from net realized gain | (.01) | – | (.31) | (.03) | – | (.16) |
| Total distributions | (.47) | (.31) | (.84) | (.64) | (.47) | (.70)E |
| Redemption fees added to paid in capitalA,F | – | – | – | – | – | – |
| Net asset value, end of period | $37.91 | $40.06 | $38.97 | $39.76 | $31.87 | $29.66 |
| Total ReturnG,H | (4.25)% | 3.61% | .13% | 27.23% | 9.24% | (6.24)% |
| Ratios to Average Net AssetsI,J | ||||||
| Expenses before reductions | .89%K | .86% | .80% | .85% | .83% | .80% |
| Expenses net of fee waivers, if any | .89%K | .86% | .80% | .85% | .83% | .79% |
| Expenses net of all reductions | .89%K | .85% | .79% | .83% | .80% | .75% |
| Net investment income (loss) | 1.94%B,K | 1.47%C | 1.83%D | 1.47% | 1.91% | 1.81% |
| Supplemental Data | ||||||
| Net assets, end of period (in millions) | $2,152 | $2,308 | $2,464 | $2,576 | $1,776 | $1,245 |
| Portfolio turnover rateL | 49%K,M | 60%M | 57% | 65% | 68% | 75% |
A Calculated based on average shares outstanding during the period.
B Net Investment income per share reflects a large, non-recurring dividend which amounted to $.14 per share. Excluding this non-recurring dividend, the ratio of net investment income (loss) to average net assets would have been 1.20%.
C Net Investment income per share reflects a large, non-recurring dividend which amounted to $.12 per share. Excluding this non-recurring dividend, the ratio of net investment income (loss) to average net assets would have been 1.16%.
D Net Investment income per share reflects a large, non-recurring dividend which amounted to $.22 per share. Excluding this non-recurring dividend, the ratio of net investment income (loss) to average net assets would have been 1.28%.
E Total distributions of $.70 per share is comprised of distributions from net investment income of $.548 and distributions from net realized gain of $.155 per share.
F Amount represents less than $.005 per share.
G Total returns for periods of less than one year are not annualized.
H Total returns would have been lower if certain expenses had not been reduced during the applicable periods shown.
I Fees and expenses of any underlying Fidelity Central Funds are not included in the Fund's expense ratio. The Fund indirectly bears its proportionate share of the expenses of any underlying Fidelity Central Funds.
J Expense ratios reflect operating expenses of the class. Expenses before reductions do not reflect amounts reimbursed by the investment adviser or reductions from brokerage service arrangements or reductions from other expense offset arrangements and do not represent the amount paid by the class during periods when reimbursements or reductions occur. Expenses net of fee waivers reflect expenses after reimbursement by the investment adviser but prior to reductions from brokerage service arrangements or other expense offset arrangements. Expenses net of all reductions represent the net expenses paid by the class.
K Annualized
L Amount does not include the portfolio activity of any underlying Fidelity Central Funds.
M Portfolio turnover rate excludes securities received or delivered in-kind.
See accompanying notes which are an integral part of the financial statements.
Financial Highlights — Fidelity International Discovery Fund Class I
| Six months ended (Unaudited) April 30, | Years ended October 31, | |||||
| 2016 | 2015 | 2014 | 2013 | 2012 | 2011 | |
| Selected Per–Share Data | ||||||
| Net asset value, beginning of period | $40.03 | $38.96 | $39.76 | $31.87 | $29.65 | $32.31 |
| Income from Investment Operations | ||||||
| Net investment income (loss)A | .34B | .53C | .67D | .47 | .52 | .54 |
| Net realized and unrealized gain (loss) | (2.05) | .80 | (.68) | 8.01 | 2.11 | (2.55) |
| Total from investment operations | (1.71) | 1.33 | (.01) | 8.48 | 2.63 | (2.01) |
| Distributions from net investment income | (.42) | (.26) | (.48) | (.56) | (.41) | (.50) |
| Distributions from net realized gain | (.01) | – | (.31) | (.03) | – | (.16) |
| Total distributions | (.42)E | (.26) | (.79) | (.59) | (.41) | (.65)F |
| Redemption fees added to paid in capitalA,G | – | – | – | – | – | – |
| Net asset value, end of period | $37.90 | $40.03 | $38.96 | $39.76 | $31.87 | $29.65 |
| Total ReturnH,I | (4.31)% | 3.44% | (.01)% | 27.03% | 9.07% | (6.39)% |
| Ratios to Average Net AssetsJ,K | ||||||
| Expenses before reductions | 1.03%L | 1.00% | .93% | 1.00% | 1.00% | .95% |
| Expenses net of fee waivers, if any | 1.03%L | .99% | .93% | 1.00% | 1.00% | .94% |
| Expenses net of all reductions | 1.03%L | .98% | .93% | .97% | .97% | .90% |
| Net investment income (loss) | 1.80%B,L | 1.33%C | 1.69%D | 1.33% | 1.75% | 1.66% |
| Supplemental Data | ||||||
| Net assets, end of period (in millions) | $781 | $1,061 | $650 | $476 | $294 | $278 |
| Portfolio turnover rateM | 49%L,N | 60%N | 57% | 65% | 68% | 75% |
A Calculated based on average shares outstanding during the period.
B Net Investment income per share reflects a large, non-recurring dividend which amounted to $.14 per share. Excluding this non-recurring dividend, the ratio of net investment income (loss) to average net assets would have been 1.06%.
C Net Investment income per share reflects a large, non-recurring dividend which amounted to $.12 per share. Excluding this non-recurring dividend, the ratio of net investment income (loss) to average net assets would have been 1.03%.
D Net Investment income per share reflects a large, non-recurring dividend which amounted to $.22 per share. Excluding this non-recurring dividend, the ratio of net investment income (loss) to average net assets would have been 1.14%.
E Total distributions of $.42 per share is comprised of distributions from net investment income of $.418 and distributions from net realized gain of $.005 per share.
F Total distributions of $.65 per share is comprised of distributions from net investment income of $.497 and distributions from net realized gain of $.155 per share.
G Amount represents less than $.005 per share.
H Total returns for periods of less than one year are not annualized.
I Total returns would have been lower if certain expenses had not been reduced during the applicable periods shown.
J Fees and expenses of any underlying Fidelity Central Funds are not included in the Fund's expense ratio. The Fund indirectly bears its proportionate share of the expenses of any underlying Fidelity Central Funds.
K Expense ratios reflect operating expenses of the class. Expenses before reductions do not reflect amounts reimbursed by the investment adviser or reductions from brokerage service arrangements or reductions from other expense offset arrangements and do not represent the amount paid by the class during periods when reimbursements or reductions occur. Expenses net of fee waivers reflect expenses after reimbursement by the investment adviser but prior to reductions from brokerage service arrangements or other expense offset arrangements. Expenses net of all reductions represent the net expenses paid by the class.
L Annualized
M Amount does not include the portfolio activity of any underlying Fidelity Central Funds.
N Portfolio turnover rate excludes securities received or delivered in-kind.
See accompanying notes which are an integral part of the financial statements.
Financial Highlights — Fidelity International Discovery Fund Class Z
| Six months ended (Unaudited) April 30, | Years ended October 31, | |||
| 2016 | 2015 | 2014 | 2013 A | |
| Selected Per–Share Data | ||||
| Net asset value, beginning of period | $40.03 | $38.96 | $39.77 | $37.22 |
| Income from Investment Operations | ||||
| Net investment income (loss)B | .36C | .59D | .72E | .07 |
| Net realized and unrealized gain (loss) | (2.03) | .80 | (.68) | 2.48 |
| Total from investment operations | (1.67) | 1.39 | .04 | 2.55 |
| Distributions from net investment income | (.46) | (.32) | (.54) | – |
| Distributions from net realized gain | (.01) | – | (.31) | – |
| Total distributions | (.47) | (.32) | (.85) | – |
| Redemption fees added to paid in capitalB,F | – | – | – | – |
| Net asset value, end of period | $37.89 | $40.03 | $38.96 | $39.77 |
| Total ReturnG,H | (4.24)% | 3.58% | .12% | 6.85% |
| Ratios to Average Net AssetsI,J | ||||
| Expenses before reductions | .89%K | .86% | .80% | .85%K |
| Expenses net of fee waivers, if any | .89%K | .86% | .80% | .85%K |
| Expenses net of all reductions | .89%K | .85% | .79% | .83%K |
| Net investment income (loss) | 1.94%C,K | 1.47%D | 1.83%E | .76%K |
| Supplemental Data | ||||
| Net assets, end of period (000 omitted) | $31,089 | $30,093 | $35,125 | $107 |
| Portfolio turnover rateL | 49%K,M | 60%M | 57% | 65% |
A For the period August 13, 2013 (commencement of sale of shares) to October 31, 2013.
B Calculated based on average shares outstanding during the period.
C Net Investment income per share reflects a large, non-recurring dividend which amounted to $.14 per share. Excluding this non-recurring dividend, the ratio of net investment income (loss) to average net assets would have been 1.20%.
D Net Investment income per share reflects a large, non-recurring dividend which amounted to $.12 per share. Excluding this non-recurring dividend, the ratio of net investment income (loss) to average net assets would have been 1.16%.
E Net Investment income per share reflects a large, non-recurring dividend which amounted to $.21 per share. Excluding this non-recurring dividend, the ratio of net investment income (loss) to average net assets would have been 1.28%.
F Amount represents less than $.005 per share.
G Total returns for periods of less than one year are not annualized.
H Total returns would have been lower if certain expenses had not been reduced during the applicable periods shown.
I Fees and expenses of any underlying Fidelity Central Funds are not included in the Fund's expense ratio. The Fund indirectly bears its proportionate share of the expenses of any underlying Fidelity Central Funds.
J Expense ratios reflect operating expenses of the class. Expenses before reductions do not reflect amounts reimbursed by the investment adviser or reductions from brokerage service arrangements or reductions from other expense offset arrangements and do not represent the amount paid by the class during periods when reimbursements or reductions occur. Expense ratios before reductions for start-up periods may not be representative of longer-term operating periods. Expenses net of fee waivers reflect expenses after reimbursement by the investment adviser but prior to reductions from brokerage service arrangements or other expense offset arrangements. Expenses net of all reductions represent the net expenses paid by the class.
K Annualized
L Amount does not include the portfolio activity of any underlying Fidelity Central Funds.
M Portfolio turnover rate excludes securities received or delivered in-kind.
See accompanying notes which are an integral part of the financial statements.
Notes to Financial Statements (Unaudited)
For the period ended April 30, 2016
(Amounts in thousands except percentages)
1. Organization.
Fidelity International Discovery Fund (the Fund) is a fund of Fidelity Investment Trust (the Trust) and is authorized to issue an unlimited number of shares. The Trust is registered under the Investment Company Act of 1940, as amended (the 1940 Act), as an open-end management investment company organized as a Massachusetts business trust. The Fund offers Class A, Class T, Class C, International Discovery, Class K, Class I and Class Z shares, each of which, along with Class B shares, has equal rights as to assets and voting privileges. Class B shares are closed to new accounts and additional purchases, except for exchanges and reinvestments. Each class has exclusive voting rights with respect to matters that affect that class. Class B shares will automatically convert to Class A shares after a maximum holding period of seven years from the initial date of purchase.
During the period, the Board of Trustees approved the conversion of all existing Class B shares into Class A shares, effective on or about July 1, 2016, regardless of the length of times shares have been held.
2. Investments in Fidelity Central Funds.
The Fund invests in Fidelity Central Funds, which are open-end investment companies generally available only to other investment companies and accounts managed by the investment adviser and its affiliates. The Fund's Schedule of Investments lists each of the Fidelity Central Funds held as of period end, if any, as an investment of the Fund, but does not include the underlying holdings of each Fidelity Central Fund. As an Investing Fund, the Fund indirectly bears its proportionate share of the expenses of the underlying Fidelity Central Funds.
The Money Market Central Funds seek preservation of capital and current income and are managed by Fidelity Investments Money Management, Inc. (FIMM), an affiliate of the investment adviser. Annualized expenses of the Money Market Central Funds as of their most recent shareholder report date are less than .005%.
A complete unaudited list of holdings for each Fidelity Central Fund is available upon request or at the Securities and Exchange Commission (the SEC) website at www.sec.gov. In addition, the financial statements of the Fidelity Central Funds are available on the SEC website or upon request.
3. Significant Accounting Policies.
The financial statements have been prepared in conformity with accounting principles generally accepted in the United States of America (GAAP), which require management to make certain estimates and assumptions at the date of the financial statements. Actual results could differ from those estimates. Subsequent events, if any, through the date that the financial statements were issued have been evaluated in the preparation of the financial statements. The following summarizes the significant accounting policies of the Fund:
Investment Valuation. Investments are valued as of 4:00 p.m. Eastern time on the last calendar day of the period. The Board of Trustees (the Board) has delegated the day to day responsibility for the valuation of the Fund's investments to the Fidelity Management & Research Company (FMR) Fair Value Committee (the Committee). In accordance with valuation policies and procedures approved by the Board, the Fund attempts to obtain prices from one or more third party pricing vendors or brokers to value its investments. When current market prices, quotations or currency exchange rates are not readily available or reliable, investments will be fair valued in good faith by the Committee, in accordance with procedures adopted by the Board. Factors used in determining fair value vary by investment type and may include market or investment specific events, changes in interest rates and credit quality. The frequency with which these procedures are used cannot be predicted and they may be utilized to a significant extent. The Committee oversees the Fund's valuation policies and procedures and reports to the Board on the Committee's activities and fair value determinations. The Board monitors the appropriateness of the procedures used in valuing the Fund's investments and ratifies the fair value determinations of the Committee.
The Fund categorizes the inputs to valuation techniques used to value its investments into a disclosure hierarchy consisting of three levels as shown below:
- Level 1 – quoted prices in active markets for identical investments
- Level 2 – other significant observable inputs (including quoted prices for similar investments, interest rates, prepayment speeds, etc.)
- Level 3 – unobservable inputs (including the Fund's own assumptions based on the best information available)
Valuation techniques used to value the Fund's investments by major category are as follows:
Equity securities, including restricted securities, for which market quotations are readily available, are valued at the last reported sale price or official closing price as reported by a third party pricing vendor on the primary market or exchange on which they are traded and are categorized as Level 1 in the hierarchy. In the event there were no sales during the day or closing prices are not available, securities are valued at the last quoted bid price or may be valued using the last available price and are generally categorized as Level 2 in the hierarchy. For foreign equity securities, when market or security specific events arise, comparisons to the valuation of American Depositary Receipts (ADRs), futures contracts, Exchange-Traded Funds (ETFs) and certain indexes as well as quoted prices for similar securities may be used and would be categorized as Level 2 in the hierarchy. Utilizing these techniques may result in transfers between Level 1 and Level 2. For equity securities, including restricted securities, where observable inputs are limited, assumptions about market activity and risk are used and these securities may be categorized as Level 3 in the hierarchy.
Debt securities, including restricted securities, are valued based on evaluated prices received from third party pricing vendors or from brokers who make markets in such securities. U.S. government and government agency obligations are valued by pricing vendors who utilize matrix pricing which considers yield or price of bonds of comparable quality, coupon, maturity and type or by broker-supplied prices. When independent prices are unavailable or unreliable, debt securities may be valued utilizing pricing methodologies which consider similar factors that would be used by third party pricing vendors. Debt securities are generally categorized as Level 2 in the hierarchy but may be Level 3 depending on the circumstances.
Futures contracts are valued at the settlement price established each day by the board of trade or exchange on which they are traded and are categorized as Level 1 in the hierarchy. Investments in open-end mutual funds, including the Fidelity Central Funds, are valued at their closing net asset value (NAV) each business day and are categorized as Level 1 in the hierarchy.
Changes in valuation techniques may result in transfers in or out of an assigned level within the disclosure hierarchy. The aggregate value of investments by input level as of April 30, 2016, including information on transfers between Levels 1 and 2, is included at the end of the Fund's Schedule of Investments.
Foreign Currency. The Fund may use foreign currency contracts to facilitate transactions in foreign-denominated securities. Gains and losses from these transactions may arise from changes in the value of the foreign currency or if the counterparties do not perform under the contracts' terms.
Foreign-denominated assets, including investment securities, and liabilities are translated into U.S. dollars at the exchange rates at period end. Purchases and sales of investment securities, income and dividends received and expenses denominated in foreign currencies are translated into U.S. dollars at the exchange rate in effect on the transaction date.
The effects of exchange rate fluctuations on investments are included with the net realized and unrealized gain (loss) on investment securities. Other foreign currency transactions resulting in realized and unrealized gain (loss) are disclosed separately.
Investment Transactions and Income. For financial reporting purposes, the Fund's investment holdings and NAV include trades executed through the end of the last business day of the period. The NAV per share for processing shareholder transactions is calculated as of the close of business of the New York Stock Exchange (NYSE), normally 4:00 p.m. Eastern time and includes trades executed through the end of the prior business day. Gains and losses on securities sold are determined on the basis of identified cost. Dividend income is recorded on the ex-dividend date, except for certain dividends from foreign securities where the ex-dividend date may have passed, which are recorded as soon as the Fund is informed of the ex-dividend date. Non-cash dividends included in dividend income, if any, are recorded at the fair market value of the securities received. Income and capital gain distributions from Fidelity Central Funds, if any, are recorded on the ex-dividend date. Distributions received on securities that represent a return of capital or capital gain are recorded as a reduction of cost of investments and/or as a realized gain. Subsequent to ex-dividend date the Fund determines the components of these distributions, based upon receipt of tax filings or other correspondence relating to the underlying investment. Large, non-recurring dividends recognized by the Fund are presented separately on the Statement of Operations as "Special Dividends" and the impact of these dividends is presented in the Financial Highlights. Interest income is accrued as earned and includes coupon interest and amortization of premium and accretion of discount on debt securities as applicable. Investment income is recorded net of foreign taxes withheld where recovery of such taxes is uncertain.
Class Allocations and Expenses. Investment income, realized and unrealized capital gains and losses, common expenses of the Fund, and certain fund-level expense reductions, if any, are allocated daily on a pro-rata basis to each class based on the relative net assets of each class to the total net assets of the Fund. Each class differs with respect to transfer agent and distribution and service plan fees incurred. Certain expense reductions may also differ by class. For the reporting period, the allocated portion of income and expenses to each class as a percent of its average net assets may vary due to the timing of recording these transactions in relation to fluctuating net assets of the classes. Expenses directly attributable to a fund are charged to that fund. Expenses attributable to more than one fund are allocated among the respective funds on the basis of relative net assets or other appropriate methods. Expense estimates are accrued in the period to which they relate and adjustments are made when actual amounts are known.
Deferred Trustee Compensation. Under a Deferred Compensation Plan (the Plan), independent Trustees may elect to defer receipt of a portion of their annual compensation. Deferred amounts are invested in a cross-section of Fidelity funds, are marked-to-market and remain in the Fund until distributed in accordance with the Plan. The investment of deferred amounts and the offsetting payable to the Trustees are included in the accompanying Statement of Assets and Liabilities.
Income Tax Information and Distributions to Shareholders. Each year, the Fund intends to qualify as a regulated investment company under Subchapter M of the Internal Revenue Code, including distributing substantially all of its taxable income and realized gains. As a result, no provision for U.S. Federal income taxes is required. The Fund files a U.S. federal tax return, in addition to state and local tax returns as required. The Fund's federal income tax returns are subject to examination by the Internal Revenue Service (IRS) for a period of three fiscal years after they are filed. State and local tax returns may be subject to examination for an additional fiscal year depending on the jurisdiction. Foreign taxes are provided for based on the Fund's understanding of the tax rules and rates that exist in the foreign markets in which it invests.
Distributions are declared and recorded on the ex-dividend date. Income dividends and capital gain distributions are declared separately for each class. Income and capital gain distributions are determined in accordance with income tax regulations, which may differ from GAAP.
Capital accounts within the financial statements are adjusted for permanent book-tax differences. These adjustments have no impact on net assets or the results of operations. Capital accounts are not adjusted for temporary book-tax differences which will reverse in a subsequent period.
Book-tax differences are primarily due to futures contracts, foreign currency transactions, passive foreign investment companies (PFIC), market discount, certain foreign taxes, redemptions in-kind, deferred trustees compensation, capital loss carryforwards and losses deferred due to wash sales.
The federal tax cost of investment securities and unrealized appreciation (depreciation) as of period end were as follows:
| Gross unrealized appreciation | $1,550,136 |
| Gross unrealized depreciation | (447,894) |
| Net unrealized appreciation (depreciation) on securities | $1,102,242 |
| Tax cost | $9,240,764 |
Capital loss carryforwards are only available to offset future capital gains of the Fund to the extent provided by regulations and may be limited. Under the Regulated Investment Company Modernization Act of 2010 (the Act), the Fund is permitted to carry forward capital losses incurred in taxable years beginning after December 22, 2010 for an unlimited period and such capital losses are required to be used prior to any losses that expire. The capital loss carryforward information presented below, including any applicable limitation, is estimated as of prior fiscal period end and is subject to adjustment.
| Fiscal year of expiration | |
| 2017 | $(49,248) |
Short-Term Trading (Redemption) Fees. Shares held by investors in the Fund less than 30 days may have been subject to a redemption fee equal to 1.00% of the NAV of shares redeemed. All redemption fees, which reduce the proceeds of the shareholder redemption, are retained by the Fund and accounted for as an addition to paid in capital.
Restricted Securities. The Fund may invest in securities that are subject to legal or contractual restrictions on resale. These securities generally may be resold in transactions exempt from registration or to the public if the securities are registered. Disposal of these securities may involve time-consuming negotiations and expense, and prompt sale at an acceptable price may be difficult. Information regarding restricted securities is included at the end of the Fund's Schedule of Investments.
4. Derivative Instruments.
Risk Exposures and the Use of Derivative Instruments. The Fund's investment objective allows the Fund to enter into various types of derivative contracts, including futures contracts. Derivatives are investments whose value is primarily derived from underlying assets, indices or reference rates and may be transacted on an exchange or over-the-counter (OTC). Derivatives may involve a future commitment to buy or sell a specified asset based on specified terms, to exchange future cash flows at periodic intervals based on a notional principal amount, or for one party to make one or more payments upon the occurrence of specified events in exchange for periodic payments from the other party.
The Fund used derivatives to increase returns and to manage exposure to certain risks as defined below. The success of any strategy involving derivatives depends on analysis of numerous economic factors, and if the strategies for investment do not work as intended, the Fund may not achieve its objectives.
The Fund's use of derivatives increased or decreased its exposure to the following risk:
| Equity Risk | Equity risk relates to the fluctuations in the value of financial instruments as a result of changes in market prices (other than those arising from interest rate risk or foreign exchange risk), whether caused by factors specific to an individual investment, its issuer, or all factors affecting all instruments traded in a market or market segment. |
The Fund is also exposed to additional risks from investing in derivatives, such as liquidity risk and counterparty credit risk. Liquidity risk is the risk that the Fund will be unable to close out the derivative in the open market in a timely manner. Counterparty credit risk is the risk that the counterparty will not be able to fulfill its obligation to the Fund. Counterparty credit risk related to exchange-traded futures contracts may be mitigated by the protection provided by the exchange on which they trade.
Investing in derivatives may involve greater risks than investing in the underlying assets directly and, to varying degrees, may involve risk of loss in excess of any initial investment and collateral received and amounts recognized in the Statement of Assets and Liabilities. In addition, there may be the risk that the change in value of the derivative contract does not correspond to the change in value of the underlying instrument.
Futures Contracts. A futures contract is an agreement between two parties to buy or sell a specified underlying instrument for a fixed price at a specified future date. The Fund used futures contracts to manage its exposure to the stock market.
Upon entering into a futures contract, a fund is required to deposit either cash or securities (initial margin) with a clearing broker in an amount equal to a certain percentage of the face value of the contract. Futures contracts are marked-to-market daily and subsequent daily payments (variation margin) are made or received by a fund depending on the daily fluctuations in the value of the futures contracts and are recorded as unrealized appreciation or (depreciation). This receivable and/or payable, if any, is included in daily variation margin for derivative instruments in the Statement of Assets and Liabilities. Realized gain or (loss) is recorded upon the expiration or closing of a futures contract.
Any open futures contracts at period end are presented in the Schedule of Investments under the caption "Futures Contracts". The underlying face amount at value reflects each contract's exposure to the underlying instrument or index at period end and is representative of volume of activity during the period. Securities deposited to meet initial margin requirements are identified in the Schedule of Investments.
During the period the Fund recognized net realized gain (loss) of $(10,549) and a change in net unrealized appreciation (depreciation) of $(20,801) related to its investment in futures contracts. These amounts are included in the Statement of Operations.
5. Purchases and Sales of Investments.
Purchases and sales of securities, other than short-term securities and in-kind transactions, aggregated $2,445,746 and $2,483,783, respectively.
Redemptions In-Kind. During the period, 1,487 shares of the Fund held by an unaffiliated entity were redeemed in-kind for cash and investments with a value of $55,670. The net realized gain of $10,064 on investments delivered through the in-kind redemption is included in the accompanying Statement of Operations. The amount of in-kind redemptions is included in share transactions in the accompanying Statement of Changes in Net Assets as well as Note 11: Share Transactions. The Fund recognized no gain or loss for federal income tax purposes.
6. Fees and Other Transactions with Affiliates.
Management Fee. Fidelity Management & Research Company (the investment adviser) and its affiliates provide the Fund with investment management related services for which the Fund pays a monthly management fee. The management fee is the sum of an individual fund fee rate that is based on an annual rate of .424% of the Fund's average net assets and an annualized group fee rate that averaged .25% during the period. The group fee rate is based upon the average net assets of all the mutual funds advised by the investment adviser, including any mutual funds previously advised by the investment adviser that are currently advised by Fidelity SelectCo, LLC, an affiliate of the investment adviser. The group fee rate decreases as assets under management increase and increases as assets under management decrease. In addition, the management fee is subject to a performance adjustment (up to a maximum of +/- .20% of the Fund's average net assets over a 36 month performance period). The upward or downward adjustment to the management fee is based on the relative investment performance of International Discovery as compared to its benchmark index, the MSCI EAFE Index, over the same 36 month performance period. For the reporting period, the total annualized management fee rate, including the performance adjustment, was .81% of the Fund's average net assets. The performance adjustment included in the management fee rate may be higher or lower than the maximum performance adjustment rate due to the difference between the average net assets for the reporting and performance periods.
Distribution and Service Plan Fees. In accordance with Rule 12b-1 of the 1940 Act, the Fund has adopted separate Distribution and Service Plans for each class of shares. Certain classes pay Fidelity Distributors Corporation (FDC), an affiliate of the investment adviser, separate Distribution and Service Fees, each of which is based on an annual percentage of each class' average net assets. In addition, FDC may pay financial intermediaries for selling shares of the Fund and providing shareholder support services. For the period, the Distribution and Service Fee rates, total fees and amounts retained by FDC were as follows:
| Distribution Fee | Service Fee | Total Fees | Retained by FDC | |
| Class A | -% | .25% | $331 | $– |
| Class T | .25% | .25% | 99 | – |
| Class B | .75% | .25% | 9 | 7 |
| Class C | .75% | .25% | 161 | 15 |
| $600 | $22 |
Sales Load. FDC may receive a front-end sales charge of up to 5.75% for selling Class A shares and 3.50% for selling Class T shares, some of which is paid to financial intermediaries for selling shares of the Fund. Depending on the holding period, FDC may receive contingent deferred sales charges levied on Class A, Class T, Class B, and Class C redemptions. The deferred sales charges range from 5.00% to 1.00% for Class B shares, 1.00% for Class C shares, 1.00% for certain purchases of Class A shares and .25% for certain purchases of Class T shares.
For the period, sales charge amounts retained by FDC were as follows:
| Retained by FDC | |
| Class A | $32 |
| Class T | 3 |
| Class B(a) | –(b) |
| Class C(a) | 1 |
| $36 |
(a) When Class B and Class C shares are initially sold, FDC pays commissions from its own resources to financial intermediaries through which the sales are made.
(b) In the amount of less than five hundred dollars.
Transfer Agent Fees. Fidelity Investments Institutional Operations Company, Inc., (FIIOC), an affiliate of the investment adviser, is the transfer, dividend disbursing and shareholder servicing agent for each class of the Fund. FIIOC receives account fees and asset-based fees that vary according to the account size and type of account of the shareholders of the respective classes of the Fund, except for Class K and Class Z. FIIOC receives an asset-based fee of Class K's and Class Z's average net assets. FIIOC pays for typesetting, printing and mailing of shareholder reports, except proxy statements.
For the period, transfer agent fees for each class were as follows:
| Amount | % of Class-Level Average Net Assets(a) | |
| Class A | $369 | .28 |
| Class T | 53 | .27 |
| Class B | 3 | .30 |
| Class C | 45 | .28 |
| International Discovery | 6,165 | .18 |
| Class K | 508 | .05 |
| Class I | 851 | .19 |
| Class Z | 7 | .05 |
| $8,001 |
(a) Annualized
Accounting and Security Lending Fees. Fidelity Service Company, Inc. (FSC), an affiliate of the investment adviser, maintains the Fund's accounting records. The accounting fee is based on the level of average net assets for each month. Under a separate contract, FSC administers the security lending program. The security lending fee is based on the number and duration of lending transactions.
Brokerage Commissions. The Fund placed a portion of its portfolio transactions with brokerage firms which are affiliates of the investment adviser. Brokerage commissions are included in net realized gain (loss) and change in net unrealized appreciation (depreciation) in the Statement of Operations. The commissions paid to these affiliated firms were $6 for the period.
Interfund Trades. The Fund may purchase from or sell securities to other Fidelity Funds under procedures adopted by the Board. The procedures have been designed to ensure these interfund trades are executed in accordance with Rule 17a-7 of the 1940 Act. Interfund trades are included within the respective purchases and sales amounts shown in the Purchases and Sales of Investments note.
7. Committed Line of Credit.
The Fund participates with other funds managed by the investment adviser or an affiliate in a $4.25 billion credit facility (the "line of credit") to be utilized for temporary or emergency purposes to fund shareholder redemptions or for other short-term liquidity purposes. The Fund has agreed to pay commitment fees on its pro-rata portion of the line of credit, which amounted to $9 and is reflected in Miscellaneous expenses on the Statement of Operations. During the period, the Fund did not borrow on this line of credit.
8. Security Lending.
The Fund lends portfolio securities through a lending agent from time to time in order to earn additional income. For equity securities, a lending agent is used and may loan securities to certain qualified borrowers, including Fidelity Capital Markets (FCM), a broker-dealer affiliated with the Fund. On the settlement date of the loan, the Fund receives collateral (in the form of U.S. Treasury obligations, letters of credit and/or cash) against the loaned securities and maintains collateral in an amount not less than 100% of the market value of the loaned securities during the period of the loan. The market value of the loaned securities is determined at the close of business of the Fund and any additional required collateral is delivered to the Fund on the next business day. The Fund or borrower may terminate the loan at any time, and if the borrower defaults on its obligation to return the securities loaned because of insolvency or other reasons, the Fund may apply collateral received from the borrower against the obligation. The Fund may experience delays and costs in recovering the securities loaned. Any cash collateral received is invested in the Fidelity Securities Lending Cash Central Fund. The value of loaned securities and cash collateral at period end are disclosed on the Fund's Statement of Assets and Liabilities. The value of securities loaned to FCM at period end was $75. Security lending income represents the income earned on investing cash collateral, less rebates paid to borrowers and any lending agent fees associated with the loan, plus any premium payments received for lending certain types of securities. Security lending income is presented in the Statement of Operations as a component of income from Fidelity Central Funds. Total security lending income during the period amounted to $2,593, including $5 from securities loaned to FCM.
9. Expense Reductions.
Commissions paid to certain brokers with whom the investment adviser, or its affiliates, places trades on behalf of the Fund include an amount in addition to trade execution, which may be rebated back to the Fund to offset certain expenses. This amount totaled $74 for the period.
In addition, during the period the investment adviser reimbursed and/or waived a portion of fund-level operating expenses in the amount of $39.
10. Distributions to Shareholders.
Distributions to shareholders of each class were as follows:
| Six months ended April 30, 2016 | Year ended October 31, 2015 | |
| From net investment income | ||
| Class A | $1,912 | $864 |
| Class T | 184 | 23 |
| International Discovery | 73,519 | 49,040 |
| Class K | 26,239 | 19,835 |
| Class I | 11,205 | 4,544 |
| Class Z | 375 | 283 |
| Total | $113,434 | $74,589 |
| From net realized gain | ||
| Class A | $36 | $– |
| Class T | 5 | – |
| International Discovery | 899 | – |
| Class K | 284 | – |
| Class I | 134 | – |
| Class Z | 4 | – |
| Total | $1,362 | $– |
11. Share Transactions.
Share transactions for each class were as follows and may contain automatic conversions between classes or exchanges between affiliated funds:
| Shares | Shares | Dollars | Dollars | |
| Six months ended April 30, 2016 | Year ended October 31, 2015 | Six months ended April 30, 2016 | Year ended October 31, 2015 | |
| Class A | ||||
| Shares sold | 543 | 1,331 | $20,433 | $53,289 |
| Reinvestment of distributions | 48 | 22 | 1,922 | 843 |
| Shares redeemed | (784) | (1,915) | (29,432) | (76,178) |
| Net increase (decrease) | (193) | (562) | $(7,077) | $(22,046) |
| Class T | ||||
| Shares sold | 76 | 178 | $2,881 | $7,105 |
| Reinvestment of distributions | 5 | 1 | 183 | 23 |
| Shares redeemed | (140) | (355) | (5,252) | (13,954) |
| Net increase (decrease) | (59) | (176) | $(2,188) | $(6,826) |
| Class B | ||||
| Shares sold | – | 1 | $15 | $53 |
| Shares redeemed | (20) | (64) | (758) | (2,536) |
| Net increase (decrease) | (20) | (63) | $(743) | $(2,483) |
| Class C | ||||
| Shares sold | 159 | 201 | $5,952 | $7,918 |
| Shares redeemed | (92) | (314) | (3,380) | (12,486) |
| Net increase (decrease) | 67 | (113) | $2,572 | $(4,568) |
| International Discovery | ||||
| Shares sold | 9,886 | 20,827 | $372,799 | $832,233 |
| Reinvestment of distributions | 1,781 | 1,199 | 70,961 | 46,913 |
| Shares redeemed | (12,452) | (33,573) | (467,188) | (1,345,593) |
| Net increase (decrease) | (785) | (11,547) | $(23,428) | $(466,447) |
| Class K | ||||
| Shares sold | 7,943 | 15,372 | $296,942 | $613,737 |
| Reinvestment of distributions | 667 | 508 | 26,523 | 19,835 |
| Shares redeemed | (9,474)(a) | (21,494)(b) | (358,588)(a) | (860,632)(b) |
| Net increase (decrease) | (864) | (5,614) | $(35,123) | $(227,060) |
| Class I | ||||
| Shares sold | 6,739 | 15,392 | $253,947 | $602,134 |
| Reinvestment of distributions | 52 | 33 | 2,069 | 1,286 |
| Shares redeemed | (12,681) | (5,606) | (454,709) | (221,504) |
| Net increase (decrease) | (5,890) | 9,819 | $(198,693) | $381,916 |
| Class Z | ||||
| Shares sold | 202 | 402 | $7,794 | $16,312 |
| Reinvestment of distributions | 10 | 7 | 379 | 283 |
| Shares redeemed | (144) | (559) | (5,499) | (22,228) |
| Net increase (decrease) | 68 | (150) | $2,674 | $(5,633) |
(a) Amount includes in-kind redemptions (see Note 5: Redemptions In-Kind).
(b) Amount includes in-kind redemptions.
12. Other.
The Fund's organizational documents provide former and current trustees and officers with a limited indemnification against liabilities arising in connection with the performance of their duties to the Fund. In the normal course of business, the Fund may also enter into contracts that provide general indemnifications. The Fund's maximum exposure under these arrangements is unknown as this would be dependent on future claims that may be made against the Fund. The risk of material loss from such claims is considered remote.
At the end of the period, Strategic Advisers International Fund was the owner of record of approximately 13% of the total outstanding shares of the Fund. Mutual funds managed by the investment adviser or its affiliates were the owners of record, in the aggregate, of approximately 20% of the total outstanding shares of the Fund.
Shareholder Expense Example
As a shareholder of the Fund, you incur two types of costs: (1) transaction costs, including sales charges (loads) on purchase payments or redemption proceeds, redemption fees and (2) ongoing costs, including management fees, distribution and/or service (12b-1) fees and other Fund expenses. This Example is intended to help you understand your ongoing costs (in dollars) of investing in the Fund and to compare these costs with the ongoing costs of investing in other mutual funds.
The Example is based on an investment of $1,000 invested at the beginning of the period and held for the entire period (November 1, 2015 to April 30, 2016).
Actual Expenses
The first line of the accompanying table for each class of the Fund provides information about actual account values and actual expenses. You may use the information in this line, together with the amount you invested, to estimate the expenses that you paid over the period. Simply divide your account value by $1,000.00 (for example, an $8,600 account value divided by $1,000.00 = 8.6), then multiply the result by the number in the first line for a class of the Fund under the heading entitled "Expenses Paid During Period" to estimate the expenses you paid on your account during this period. A small balance maintenance fee of $12.00 that is charged once a year may apply for certain accounts with a value of less than $2,000. This fee is not included in the table below. If it was, the estimate of expenses you paid during the period would be higher, and your ending account value lower, by this amount. In addition, the Fund, as a shareholder in the underlying Fidelity Central Funds, will indirectly bear its pro-rata share of the fees and expenses incurred by the underlying Fidelity Central Funds. These fees and expenses are not included in the Fund's annualized expense ratio used to calculate the expense estimate in the table below.
Hypothetical Example for Comparison Purposes
The second line of the accompanying table for each class of the Fund provides information about hypothetical account values and hypothetical expenses based on a Class' actual expense ratio and an assumed rate of return of 5% per year before expenses, which is not the Class' actual return. The hypothetical account values and expenses may not be used to estimate the actual ending account balance or expenses you paid for the period. You may use this information to compare the ongoing costs of investing in the Fund and other funds. To do so, compare this 5% hypothetical example with the 5% hypothetical examples that appear in the shareholder reports of the other funds. A small balance maintenance fee of $12.00 that is charged once a year may apply for certain accounts with a value of less than $2,000. This fee is not included in the table below. If it was, the estimate of expenses you paid during the period would be higher, and your ending account value lower, by this amount. In addition, the Fund, as a shareholder in the underlying Fidelity Central Funds, will indirectly bear its pro-rata share of the fees and expenses incurred by the underlying Fidelity Central Funds. These fees and expenses are not included in the Fund's annualized expense ratio used to calculate the expense estimate in the table below.
Please note that the expenses shown in the table are meant to highlight your ongoing costs only and do not reflect any transaction costs. Therefore, the second line of the table is useful in comparing ongoing costs only, and will not help you determine the relative total costs of owning different funds. In addition, if these transactional costs were included, your costs would have been higher.
| Annualized Expense Ratio-A | Beginning Account Value November 1, 2015 | Ending Account Value April 30, 2016 | Expenses Paid During Period-B November 1, 2015 to April 30, 2016 | |
| Class A | 1.37% | |||
| Actual | $1,000.00 | $955.30 | $6.66 | |
| Hypothetical-C | $1,000.00 | $1,018.05 | $6.87 | |
| Class T | 1.61% | |||
| Actual | $1,000.00 | $954.10 | $7.82 | |
| Hypothetical-C | $1,000.00 | $1,016.86 | $8.07 | |
| Class B | 2.14% | |||
| Actual | $1,000.00 | $951.50 | $10.38 | |
| Hypothetical-C | $1,000.00 | $1,014.22 | $10.72 | |
| Class C | 2.12% | |||
| Actual | $1,000.00 | $951.70 | $10.29 | |
| Hypothetical-C | $1,000.00 | $1,014.32 | $10.62 | |
| International Discovery | 1.02% | |||
| Actual | $1,000.00 | $956.70 | $4.96 | |
| Hypothetical-C | $1,000.00 | $1,019.79 | $5.12 | |
| Class K | .89% | |||
| Actual | $1,000.00 | $957.50 | $4.33 | |
| Hypothetical-C | $1,000.00 | $1,020.44 | $4.47 | |
| Class I | 1.03% | |||
| Actual | $1,000.00 | $956.90 | $5.01 | |
| Hypothetical-C | $1,000.00 | $1,019.74 | $5.17 | |
| Class Z | .89% | |||
| Actual | $1,000.00 | $957.60 | $4.33 | |
| Hypothetical-C | $1,000.00 | $1,020.44 | $4.47 |
A Annualized expense ratio reflects expenses net of applicable fee waivers.
B Expenses are equal to each Class' annualized expense ratio, multiplied by the average account value over the period, multiplied by 182/366 (to reflect the one-half year period).
C 5% return per year before expenses
![]()
AIDZ-SANN-0616
1.9585034.102
Fidelity Advisor® International Small Cap Fund - Semi-Annual Report April 30, 2016 Class A, Class T, Class B and Class C are classes of Fidelity® International Small Cap Fund |
|
Contents
To view a fund's proxy voting guidelines and proxy voting record for the 12-month period ended June 30, visit http://www.fidelity.com/proxyvotingresults or visit the Securities and Exchange Commission's (SEC) web site at http://www.sec.gov.
You may also call 1-877-208-0098 to request a free copy of the proxy voting guidelines.
Standard & Poor's, S&P and S&P 500 are registered service marks of The McGraw-Hill Companies, Inc. and have been licensed for use by Fidelity Distributors Corporation.
Other third-party marks appearing herein are the property of their respective owners.
All other marks appearing herein are registered or unregistered trademarks or service marks of FMR LLC or an affiliated company. © 2016 FMR LLC. All rights reserved.
This report and the financial statements contained herein are submitted for the general information of the shareholders of the Fund. This report is not authorized for distribution to prospective investors in the Fund unless preceded or accompanied by an effective prospectus.
A fund files its complete schedule of portfolio holdings with the SEC for the first and third quarters of each fiscal year on Form N-Q. Forms N-Q are available on the SEC’s web site at http://www.sec.gov. A fund's Forms N-Q may be reviewed and copied at the SEC’s Public Reference Room in Washington, DC. Information regarding the operation of the SEC's Public Reference Room may be obtained by calling 1-800-SEC-0330.
For a complete list of a fund's portfolio holdings, view the most recent holdings listing, semiannual report, or annual report on Fidelity's web site at http://www.fidelity.com, http://www.advisor.fidelity.com, or http://www.401k.com, as applicable.
NOT FDIC INSURED •MAY LOSE VALUE •NO BANK GUARANTEE
Neither the Fund nor Fidelity Distributors Corporation is a bank.
Investment Summary (Unaudited)
Geographic Diversification (% of fund's net assets)
| As of April 30, 2016 | ||
| Japan | 22.2% | |
| United Kingdom | 14.8% | |
| United States of America* | 5.9% | |
| Canada | 4.1% | |
| France | 4.0% | |
| Cayman Islands | 3.9% | |
| Australia | 3.6% | |
| Switzerland | 3.3% | |
| Ireland | 2.5% | |
| Other | 35.7% | |
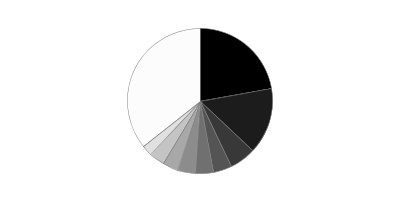
* Includes Short-Term investments and Net Other Assets (Liabilities).
Percentages are based on country or territory of incorporation and are adjusted for the effect of futures contracts, if applicable.
| As of October 31, 2015 | ||
| Japan | 21.6% | |
| United Kingdom | 14.5% | |
| United States of America* | 6.6% | |
| Canada | 4.0% | |
| Switzerland | 3.9% | |
| Cayman Islands | 3.7% | |
| Germany | 3.4% | |
| France | 3.3% | |
| Australia | 2.9% | |
| Other | 36.1% | |

* Includes Short-Term investments and Net Other Assets (Liabilities).
Percentages are based on country or territory of incorporation and are adjusted for the effect of futures contracts, if applicable.
Asset Allocation as of April 30, 2016
| % of fund's net assets | % of fund's net assets 6 months ago | |
| Stocks | 95.0 | 94.6 |
| Short-Term Investments and Net Other Assets (Liabilities) | 5.0 | 5.4 |
Top Ten Stocks as of April 30, 2016
| % of fund's net assets | % of fund's net assets 6 months ago | |
| Micro Focus International PLC (United Kingdom, Software) | 1.3 | 1.1 |
| EBOS Group Ltd. (New Zealand, Health Care Providers & Services) | 1.2 | 1.1 |
| United Drug PLC (United Kingdom) (Ireland, Health Care Providers & Services) | 1.1 | 1.0 |
| Tsuruha Holdings, Inc. (Japan, Food & Staples Retailing) | 1.1 | 0.9 |
| Nuplex Industries Ltd. (New Zealand, Chemicals) | 1.0 | 0.9 |
| Nitori Holdings Co. Ltd. (Japan, Specialty Retail) | 1.0 | 0.9 |
| Frutarom Industries Ltd. (Israel, Chemicals) | 1.0 | 1.1 |
| Allied World Assurance Co. Holdings AG (Switzerland, Insurance) | 1.0 | 0.9 |
| JSR Corp. (Japan, Chemicals) | 0.9 | 1.0 |
| GUD Holdings Ltd. (Australia, Household Durables) | 0.9 | 0.5 |
| 10.5 |
Market Sectors as of April 30, 2016
| % of fund's net assets | % of fund's net assets 6 months ago | |
| Financials | 20.9 | 22.6 |
| Industrials | 19.4 | 18.9 |
| Consumer Discretionary | 15.2 | 16.3 |
| Information Technology | 9.4 | 10.0 |
| Consumer Staples | 8.9 | 7.5 |
| Health Care | 8.9 | 8.5 |
| Materials | 7.8 | 6.9 |
| Energy | 4.1 | 3.5 |
| Utilities | 0.4 | 0.4 |
Investments April 30, 2016 (Unaudited)
Showing Percentage of Net Assets
| Common Stocks - 94.6% | |||
| Shares | Value | ||
| Australia - 3.6% | |||
| Aub Group Ltd. | 470,441 | $3,111,988 | |
| Austal Ltd. | 919,229 | 1,090,340 | |
| Challenger Ltd. | 769,974 | 5,245,630 | |
| GUD Holdings Ltd. (a) | 1,286,901 | 8,356,349 | |
| Imdex Ltd. (b)(c) | 13,086,370 | 2,039,795 | |
| Life Healthcare Group Ltd. | 2,075,053 | 2,145,763 | |
| Nanosonics Ltd. (b) | 1,719,782 | 2,902,952 | |
| Programmed Maintenance Services Ltd. | 1,870,070 | 2,083,095 | |
| SAI Global Ltd. | 1,348,285 | 3,741,865 | |
| SomnoMed Ltd. (a)(b) | 672,977 | 1,453,222 | |
| TOTAL AUSTRALIA | 32,170,999 | ||
| Austria - 1.8% | |||
| Andritz AG | 118,732 | 6,649,514 | |
| IMMOFINANZ Immobilien Anlagen AG (a)(b) | 1,934,143 | 4,560,048 | |
| RHI AG | 218,140 | 4,690,891 | |
| TOTAL AUSTRIA | 15,900,453 | ||
| Bailiwick of Jersey - 0.6% | |||
| Regus PLC | 1,332,800 | 5,694,258 | |
| Belgium - 1.0% | |||
| Barco NV | 67,583 | 4,719,767 | |
| Econocom Group SA | 362,620 | 3,907,202 | |
| TOTAL BELGIUM | 8,626,969 | ||
| Bermuda - 1.6% | |||
| BW Offshore Ltd. | 5,305,227 | 1,159,634 | |
| Hiscox Ltd. | 389,355 | 5,122,999 | |
| Petra Diamonds Ltd. | 3,093,474 | 5,333,635 | |
| Travelport Worldwide Ltd. | 228,600 | 3,188,970 | |
| TOTAL BERMUDA | 14,805,238 | ||
| Brazil - 0.3% | |||
| MAHLE Metal Leve SA | 362,500 | 2,385,222 | |
| British Virgin Islands - 0.3% | |||
| Gem Diamonds Ltd. | 1,174,862 | 2,326,060 | |
| Canada - 4.1% | |||
| AutoCanada, Inc. (a) | 254,084 | 4,157,444 | |
| Dorel Industries, Inc. Class B (sub. vtg.) | 122,003 | 2,714,851 | |
| Genesis Land Development Corp. | 1,051,822 | 2,221,510 | |
| Jean Coutu Group, Inc. Class A (sub. vtg.) | 244,913 | 3,724,348 | |
| Lassonde Industries, Inc. Class A (sub. vtg.) | 37,869 | 5,281,499 | |
| McCoy Global, Inc. | 1,341,870 | 2,192,423 | |
| Open Text Corp. | 136,048 | 7,617,257 | |
| ShawCor Ltd. Class A | 117,885 | 3,185,065 | |
| Whitecap Resources, Inc. (a) | 696,153 | 5,221,009 | |
| TOTAL CANADA | 36,315,406 | ||
| Cayman Islands - 3.9% | |||
| AMVIG Holdings Ltd. | 16,168,000 | 6,657,294 | |
| Best Pacific International Holdings Ltd. | 1,678,000 | 995,768 | |
| China High Precision Automation Group Ltd. (b) | 712,000 | 1 | |
| China Metal Recycling (Holdings) Ltd. (b) | 436,800 | 1 | |
| Greatview Aseptic Pack Co. Ltd. | 5,597,000 | 2,834,467 | |
| Haitian International Holdings Ltd. | 2,600,000 | 4,436,023 | |
| Lifestyle International Holdings Ltd. | 3,347,000 | 5,544,385 | |
| Pico Far East Holdings Ltd. | 18,482,000 | 5,010,814 | |
| SITC International Holdings Co. Ltd. | 12,181,000 | 6,583,480 | |
| Value Partners Group Ltd. | 3,286,000 | 3,136,655 | |
| TOTAL CAYMAN ISLANDS | 35,198,888 | ||
| Chile - 0.9% | |||
| Quinenco SA | 2,409,395 | 4,740,929 | |
| Vina San Pedro SA | 352,175,653 | 3,470,184 | |
| TOTAL CHILE | 8,211,113 | ||
| Denmark - 0.7% | |||
| Jyske Bank A/S (Reg.) | 153,703 | 6,292,655 | |
| Finland - 2.4% | |||
| Amer Group PLC (A Shares) | 201,445 | 5,955,760 | |
| Asiakastieto Group Oyj | 192,023 | 3,518,015 | |
| Cramo Oyj (B Shares) | 186,710 | 3,734,951 | |
| Olvi PLC (A Shares) | 126,157 | 3,504,504 | |
| Tikkurila Oyj | 269,946 | 4,732,347 | |
| TOTAL FINLAND | 21,445,577 | ||
| France - 4.0% | |||
| ALTEN | 105,219 | 6,505,975 | |
| Coface SA | 358,202 | 2,891,212 | |
| Rexel SA | 300,300 | 4,549,248 | |
| Saft Groupe SA | 116,100 | 3,608,000 | |
| The Lisi Group | 143,009 | 4,092,174 | |
| The Vicat Group | 88,556 | 6,165,184 | |
| Thermador Groupe SA | 27,557 | 2,519,914 | |
| Wendel SA | 47,235 | 5,457,321 | |
| TOTAL FRANCE | 35,789,028 | ||
| Germany - 2.0% | |||
| AURELIUS AG | 86,435 | 5,168,339 | |
| CompuGroup Medical AG | 178,949 | 7,028,260 | |
| mutares AG | 144,900 | 2,405,807 | |
| SHW Group | 102,339 | 2,953,018 | |
| TOTAL GERMANY | 17,555,424 | ||
| Greece - 0.4% | |||
| Metka SA | 435,516 | 3,332,417 | |
| Hong Kong - 1.9% | |||
| Dah Sing Banking Group Ltd. | 3,157,200 | 5,616,923 | |
| Far East Horizon Ltd. | 4,274,000 | 3,392,604 | |
| Magnificent Hotel Investment L | 113,522,000 | 2,805,015 | |
| Shun Ho Technology Holdings Ltd. | 1,650,033 | 552,810 | |
| Techtronic Industries Co. Ltd. | 1,142,000 | 4,280,981 | |
| TOTAL HONG KONG | 16,648,333 | ||
| India - 0.6% | |||
| Edelweiss Financial Services Ltd. | 3,634,440 | 3,176,178 | |
| Torrent Pharmaceuticals Ltd. | 100,431 | 2,162,444 | |
| TOTAL INDIA | 5,338,622 | ||
| Indonesia - 0.7% | |||
| PT ACE Hardware Indonesia Tbk | 43,202,200 | 3,030,182 | |
| PT Media Nusantara Citra Tbk | 17,060,400 | 3,040,032 | |
| TOTAL INDONESIA | 6,070,214 | ||
| Ireland - 2.5% | |||
| C&C Group PLC | 885,778 | 3,978,942 | |
| Mincon Group PLC | 5,015,823 | 4,284,553 | |
| Origin Enterprises PLC | 588,700 | 4,147,007 | |
| United Drug PLC (United Kingdom) | 1,079,749 | 9,655,373 | |
| TOTAL IRELAND | 22,065,875 | ||
| Isle of Man - 0.6% | |||
| Optimal Payments PLC (b) | 1,050,400 | 5,850,627 | |
| Israel - 1.0% | |||
| Frutarom Industries Ltd. | 167,089 | 8,563,621 | |
| Italy - 1.1% | |||
| Banco di Desio e della Brianza SpA | 669,139 | 1,886,379 | |
| Danieli & C. Officine Meccaniche SpA | 98,967 | 2,170,119 | |
| Recordati SpA | 232,561 | 5,909,063 | |
| TOTAL ITALY | 9,965,561 | ||
| Japan - 22.2% | |||
| A/S One Corp. | 142,500 | 5,138,270 | |
| Aeon Delight Co. Ltd. | 192,900 | 5,326,040 | |
| Ain Holdings, Inc. | 61,100 | 2,968,116 | |
| Arc Land Sakamoto Co. Ltd. | 432,300 | 4,488,634 | |
| Broadleaf Co. Ltd. | 383,300 | 3,787,796 | |
| Central Automotive Products Ltd. (d) | 316,000 | 2,633,793 | |
| Daiwa Industries Ltd. | 495,600 | 4,248,249 | |
| Dexerials Corp. | 303,900 | 2,459,684 | |
| Fuji Corp. | 149,100 | 2,347,486 | |
| Fukuda Denshi Co. Ltd. | 129,800 | 7,087,053 | |
| Funai Soken Holdings, Inc. | 190,320 | 2,887,506 | |
| GMO Internet, Inc. | 404,200 | 4,745,925 | |
| Iida Group Holdings Co. Ltd. | 223,551 | 4,175,060 | |
| Japan Meat Co. Ltd. | 195,300 | 1,940,491 | |
| JSR Corp. | 621,100 | 8,514,147 | |
| KAWAI Musical Instruments Manufacturing Co. Ltd. | 165,700 | 3,016,977 | |
| Kinugawa Rubber Industrial Co. Ltd. | 733,000 | 5,103,808 | |
| Konica Minolta, Inc. | 286,800 | 2,475,534 | |
| Kotobuki Spirits Co. Ltd. | 165,900 | 3,228,062 | |
| Leopalace21 Corp. (b) | 966,500 | 5,799,511 | |
| Meitec Corp. | 145,700 | 5,054,040 | |
| Minebea Mitsumi, Inc. | 382,000 | 3,128,958 | |
| Miraca Holdings, Inc. | 131,500 | 5,588,374 | |
| Mitani Shoji Co. Ltd. | 247,700 | 7,137,523 | |
| Monex Group, Inc. | 699,100 | 1,803,481 | |
| Nihon House Holdings Co. Ltd. (a) | 795,600 | 2,681,573 | |
| Nihon Parkerizing Co. Ltd. (d) | 366,900 | 3,236,205 | |
| Nitori Holdings Co. Ltd. | 95,300 | 8,864,694 | |
| Paramount Bed Holdings Co. Ltd. | 205,600 | 7,648,082 | |
| Ricoh Leasing Co. Ltd. | 243,600 | 7,037,993 | |
| S Foods, Inc. (a) | 337,600 | 8,036,637 | |
| San-Ai Oil Co. Ltd. | 589,000 | 4,127,949 | |
| Shinsei Bank Ltd. | 3,781,000 | 5,299,360 | |
| Ship Healthcare Holdings, Inc. | 161,700 | 3,990,497 | |
| TKC Corp. | 239,700 | 6,512,310 | |
| Toshiba Plant Systems & Services Corp. | 582,700 | 7,205,920 | |
| Toyo Suisan Kaisha Ltd. | 103,400 | 3,651,856 | |
| Tsuruha Holdings, Inc. | 100,000 | 9,591,564 | |
| VT Holdings Co. Ltd. | 1,114,800 | 5,632,719 | |
| Welcia Holdings Co. Ltd. | 77,700 | 4,104,307 | |
| Yamada Consulting Group Co. Ltd. | 174,600 | 5,334,116 | |
| TOTAL JAPAN | 198,040,300 | ||
| Korea (South) - 1.3% | |||
| BGFretail Co. Ltd. | 17,709 | 2,875,051 | |
| Fila Korea Ltd. | 43,834 | 3,979,083 | |
| Hy-Lok Corp. | 125,792 | 3,123,733 | |
| NS Shopping Co. Ltd. (b) | 12,780 | 1,673,249 | |
| TOTAL KOREA (SOUTH) | 11,651,116 | ||
| Luxembourg - 0.5% | |||
| Grand City Properties SA | 189,517 | 4,186,054 | |
| Mexico - 0.0% | |||
| Genomma Lab Internacional SA de CV (b) | 66,889 | 73,480 | |
| Netherlands - 2.1% | |||
| Amsterdam Commodities NV | 196,055 | 5,296,907 | |
| Arcadis NV | 199,900 | 3,423,132 | |
| BinckBank NV | 737,859 | 4,343,556 | |
| IMCD Group BV | 142,000 | 5,733,174 | |
| TOTAL NETHERLANDS | 18,796,769 | ||
| New Zealand - 2.2% | |||
| EBOS Group Ltd. | 929,004 | 10,352,886 | |
| Nuplex Industries Ltd. | 2,454,889 | 9,033,445 | |
| TOTAL NEW ZEALAND | 19,386,331 | ||
| Norway - 2.0% | |||
| ABG Sundal Collier ASA (a) | 6,615,910 | 4,617,748 | |
| Ekornes A/S | 331,597 | 3,871,175 | |
| Kongsberg Gruppen ASA | 337,433 | 5,657,514 | |
| Spectrum ASA | 1,183,572 | 3,895,336 | |
| TOTAL NORWAY | 18,041,773 | ||
| Philippines - 0.2% | |||
| Century Pacific Food, Inc. | 4,939,000 | 1,984,631 | |
| Portugal - 0.5% | |||
| NOS SGPS SA | 670,400 | 4,809,274 | |
| Romania - 0.4% | |||
| Banca Transilvania SA | 5,501,626 | 3,775,557 | |
| Singapore - 2.2% | |||
| Boustead Projects Pte Ltd. (b) | 618,906 | 296,832 | |
| Boustead Singapore Ltd. | 2,267,369 | 1,315,052 | |
| Hour Glass Ltd. | 8,087,500 | 4,510,261 | |
| Mapletree Industrial (REIT) | 3,150,494 | 3,759,931 | |
| OSIM International Ltd. | 3,765,300 | 3,891,711 | |
| Wing Tai Holdings Ltd. | 4,110,600 | 5,731,029 | |
| TOTAL SINGAPORE | 19,504,816 | ||
| South Africa - 0.8% | |||
| Clicks Group Ltd. | 992,132 | 7,246,235 | |
| Spain - 0.5% | |||
| Hispania Activos Inmobiliarios SA (b) | 315,800 | 4,628,567 | |
| Sweden - 1.1% | |||
| Addlife AB (b) | 59,554 | 752,726 | |
| AddTech AB (B Shares) | 211,219 | 2,656,528 | |
| Coor Service Management Holding AB | 474,600 | 2,245,802 | |
| Ratos AB (B Shares) (a) | 711,500 | 4,162,440 | |
| TOTAL SWEDEN | 9,817,496 | ||
| Switzerland - 3.3% | |||
| Allied World Assurance Co. Holdings AG | 239,504 | 8,521,552 | |
| Daetwyler Holdings AG | 18,222 | 2,708,701 | |
| Pargesa Holding SA | 27,516 | 1,911,750 | |
| Vontobel Holdings AG | 189,326 | 8,190,377 | |
| VZ Holding AG | 24,982 | 7,773,509 | |
| TOTAL SWITZERLAND | 29,105,889 | ||
| Taiwan - 2.2% | |||
| King's Town Bank | 4,364,000 | 3,039,656 | |
| Sunspring Metal Corp. | 3,075,000 | 3,864,811 | |
| Tripod Technology Corp. | 2,830,000 | 5,177,631 | |
| Vanguard International Semiconductor Corp. | 3,124,000 | 4,782,274 | |
| Yung Chi Paint & Varnish Manufacturing Co. Ltd. | 1,182,000 | 2,630,895 | |
| TOTAL TAIWAN | 19,495,267 | ||
| Thailand - 1.0% | |||
| Delta Electronics PCL (For. Reg.) | 2,525,300 | 5,206,804 | |
| TISCO Financial Group PCL | 2,773,700 | 3,455,210 | |
| TOTAL THAILAND | 8,662,014 | ||
| Turkey - 0.4% | |||
| Aygaz A/S | 864,000 | 3,560,372 | |
| United Kingdom - 14.8% | |||
| Aberdeen Asset Management PLC | 799,849 | 3,490,905 | |
| AEW UK REIT PLC | 2,828,268 | 4,132,524 | |
| Alliance Pharma PLC | 3,728,897 | 2,451,815 | |
| Amec Foster Wheeler PLC | 556,552 | 4,016,424 | |
| Ashmore Group PLC (a) | 1,036,507 | 4,651,006 | |
| BBA Aviation PLC | 2,510,798 | 7,344,642 | |
| Bond International Software PLC | 899,666 | 1,156,801 | |
| Brammer PLC (a) | 1,014,728 | 2,587,259 | |
| Brewin Dolphin Holding PLC | 808,175 | 3,235,570 | |
| Cineworld Group PLC | 431,676 | 3,267,251 | |
| Close Brothers Group PLC | 269,680 | 4,775,800 | |
| Countrywide PLC | 1,161,507 | 6,031,621 | |
| Diploma PLC | 363,251 | 3,882,540 | |
| Elementis PLC | 1,178,900 | 3,718,985 | |
| Empiric Student Property PLC | 1,836,872 | 3,012,729 | |
| Exova Group Ltd. PLC | 1,002,769 | 2,344,313 | |
| Informa PLC | 560,320 | 5,358,467 | |
| ITE Group PLC | 1,873,654 | 4,250,263 | |
| James Fisher and Sons PLC | 204,800 | 4,234,296 | |
| Jardine Lloyd Thompson Group PLC | 270,900 | 3,431,807 | |
| John Wood Group PLC | 542,500 | 4,950,248 | |
| Luxfer Holdings PLC sponsored ADR | 491,254 | 6,312,614 | |
| McColl's Retail Group PLC | 1,844,974 | 4,313,254 | |
| Mears Group PLC | 1,047,710 | 6,100,483 | |
| Melrose Industries PLC | 142,773 | 778,751 | |
| Micro Focus International PLC | 507,044 | 11,327,864 | |
| PayPoint PLC | 243,111 | 2,994,518 | |
| Sinclair Pharma PLC (b) | 6,297,432 | 3,312,537 | |
| Spectris PLC | 200,847 | 5,344,045 | |
| The Restaurant Group PLC | 676,100 | 2,717,668 | |
| Ultra Electronics Holdings PLC | 259,525 | 6,696,759 | |
| TOTAL UNITED KINGDOM | 132,223,759 | ||
| United States of America - 0.9% | |||
| Dillard's, Inc. Class A | 93,994 | 6,621,877 | |
| Hornbeck Offshore Services, Inc. (a)(b) | 152,170 | 1,786,476 | |
| YOU On Demand Holdings, Inc. warrants 8/30/17 (b)(e) | 27,500 | 615 | |
| TOTAL UNITED STATES OF AMERICA | 8,408,968 | ||
| TOTAL COMMON STOCKS | |||
| (Cost $827,590,703) | 843,951,228 | ||
| Nonconvertible Preferred Stocks - 0.4% | |||
| Brazil - 0.4% | |||
| Banco ABC Brasil SA | |||
| (Cost $3,961,678) | 1,117,476 | 3,850,284 | |
| Money Market Funds - 6.0% | |||
| Fidelity Cash Central Fund, 0.38% (f) | 39,282,539 | 39,282,539 | |
| Fidelity Securities Lending Cash Central Fund, 0.42% (f)(g) | 13,711,375 | 13,711,375 | |
| TOTAL MONEY MARKET FUNDS | |||
| (Cost $52,993,914) | 52,993,914 | ||
| TOTAL INVESTMENT PORTFOLIO - 101.0% | |||
| (Cost $884,546,295) | 900,795,426 | ||
| NET OTHER ASSETS (LIABILITIES) - (1.0)% | (8,908,552) | ||
| NET ASSETS - 100% | $891,886,874 |
Categorizations in the Schedule of Investments are based on country or territory of incorporation.
Legend
(a) Security or a portion of the security is on loan at period end.
(b) Non-income producing
(c) Affiliated company
(d) Security or a portion of the security purchased on a delayed delivery or when-issued basis.
(e) Restricted securities - Investment in securities not registered under the Securities Act of 1933 (excluding 144A issues). At the end of the period, the value of restricted securities (excluding 144A issues) amounted to $615 or 0.0% of net assets.
(f) Affiliated fund that is generally available only to investment companies and other accounts managed by Fidelity Investments. The rate quoted is the annualized seven-day yield of the fund at period end. A complete unaudited listing of the fund's holdings as of its most recent quarter end is available upon request. In addition, each Fidelity Central Fund's financial statements are available on the SEC's website or upon request.
(g) Investment made with cash collateral received from securities on loan.
Additional information on each restricted holding is as follows:
| Security | Acquisition Date | Acquisition Cost |
| YOU On Demand Holdings, Inc. warrants 8/30/17 | 9/14/12 | $0 |
Affiliated Central Funds
Information regarding fiscal year to date income earned by the Fund from investments in Fidelity Central Funds is as follows:
| Fund | Income earned |
| Fidelity Cash Central Fund | $61,241 |
| Fidelity Securities Lending Cash Central Fund | 178,311 |
| Total | $239,552 |
Other Affiliated Issuers
An affiliated company is a company in which the Fund has ownership of at least 5% of the voting securities. Fiscal year to date transactions with companies which are or were affiliates are as follows:
| Affiliate | Value, beginning of period | Purchases | Sales Proceeds | Dividend Income | Value, end of period |
| Imdex Ltd. | $1,246,756 | $769,515 | $-- | $-- | $2,039,795 |
| Total | $1,246,756 | $769,515 | $-- | $-- | $2,039,795 |
Investment Valuation
The following is a summary of the inputs used, as of April 30, 2016, involving the Fund's assets and liabilities carried at fair value. The inputs or methodology used for valuing securities may not be an indication of the risk associated with investing in those securities. For more information on valuation inputs, and their aggregation into the levels used below, please refer to the Investment Valuation section in the accompanying Notes to Financial Statements.
| Valuation Inputs at Reporting Date: | ||||
| Description | Total | Level 1 | Level 2 | Level 3 |
| Investments in Securities: | ||||
| Equities: | ||||
| Consumer Discretionary | $135,678,269 | $77,543,137 | $58,135,132 | $-- |
| Consumer Staples | 79,343,595 | 45,822,562 | 33,521,033 | -- |
| Energy | 36,083,912 | 31,955,963 | 4,127,949 | -- |
| Financials | 184,335,775 | 152,249,248 | 32,086,527 | -- |
| Health Care | 77,652,797 | 48,200,521 | 29,452,276 | -- |
| Industrials | 175,903,353 | 121,229,081 | 54,674,272 | -- |
| Information Technology | 84,766,467 | 64,785,217 | 19,981,249 | 1 |
| Materials | 70,476,972 | 49,234,858 | 21,242,113 | 1 |
| Utilities | 3,560,372 | 3,560,372 | -- | -- |
| Money Market Funds | 52,993,914 | 52,993,914 | -- | -- |
| Total Investments in Securities: | $900,795,426 | $647,574,873 | $253,220,551 | $2 |
The following is a summary of transfers between Level 1 and Level 2 for the period ended April 30, 2016. Transfers are assumed to have occurred at the beginning of the period, and are primarily attributable to the valuation techniques used for foreign equity securities, as discussed in the accompanying Notes to Financial Statements:
| Transfers | Total |
| Level 1 to Level 2 | $3,784,452 |
| Level 2 to Level 1 | $53,766,744 |
See accompanying notes which are an integral part of the financial statements.
Financial Statements
Statement of Assets and Liabilities
| April 30, 2016 (Unaudited) | ||
| Assets | ||
| Investment in securities, at value (including securities loaned of $13,024,078) — See accompanying schedule: Unaffiliated issuers (cost $826,178,703) | $845,761,717 | |
| Fidelity Central Funds (cost $52,993,914) | 52,993,914 | |
| Other affiliated issuers (cost $5,373,678) | 2,039,795 | |
| Total Investments (cost $884,546,295) | $900,795,426 | |
| Foreign currency held at value (cost $3,435,438) | 3,443,129 | |
| Receivable for investments sold | 1,018,282 | |
| Receivable for fund shares sold | 680,172 | |
| Dividends receivable | 5,489,031 | |
| Distributions receivable from Fidelity Central Funds | 53,923 | |
| Prepaid expenses | 773 | |
| Other receivables | 13,513 | |
| Total assets | 911,494,249 | |
| Liabilities | ||
| Payable for investments purchased | ||
| Regular delivery | $2,507,860 | |
| Delayed delivery | 73,580 | |
| Payable for fund shares redeemed | 2,257,365 | |
| Accrued management fee | 696,108 | |
| Distribution and service plan fees payable | 20,488 | |
| Other affiliated payables | 220,069 | |
| Other payables and accrued expenses | 120,530 | |
| Collateral on securities loaned, at value | 13,711,375 | |
| Total liabilities | 19,607,375 | |
| Net Assets | $891,886,874 | |
| Net Assets consist of: | ||
| Paid in capital | $875,247,184 | |
| Undistributed net investment income | 8,805,214 | |
| Accumulated undistributed net realized gain (loss) on investments and foreign currency transactions | (8,523,197) | |
| Net unrealized appreciation (depreciation) on investments and assets and liabilities in foreign currencies | 16,357,673 | |
| Net Assets | $891,886,874 | |
| Calculation of Maximum Offering Price | ||
| Class A: | ||
| Net Asset Value and redemption price per share ($31,897,656 ÷ 1,419,288 shares) | $22.47 | |
| Maximum offering price per share (100/94.25 of $22.47) | $23.84 | |
| Class T: | ||
| Net Asset Value and redemption price per share ($13,016,808 ÷ 582,355 shares) | $22.35 | |
| Maximum offering price per share (100/96.50 of $22.35) | $23.16 | |
| Class B: | ||
| Net Asset Value and offering price per share ($276,630 ÷ 12,519 shares)(a) | $22.10 | |
| Class C: | ||
| Net Asset Value and offering price per share ($9,910,610 ÷ 455,303 shares)(a) | $21.77 | |
| International Small Cap: | ||
| Net Asset Value, offering price and redemption price per share ($828,798,591 ÷ 36,296,748 shares) | $22.83 | |
| Class I: | ||
| Net Asset Value, offering price and redemption price per share ($7,986,579 ÷ 347,003 shares) | $23.02 |
(a) Redemption price per share is equal to net asset value less any applicable contingent deferred sales charge.
See accompanying notes which are an integral part of the financial statements.
Statement of Operations
| Six months ended April 30, 2016 (Unaudited) | ||
| Investment Income | ||
| Dividends | $15,653,620 | |
| Income from Fidelity Central Funds | 239,552 | |
| Income before foreign taxes withheld | 15,893,172 | |
| Less foreign taxes withheld | (1,109,413) | |
| Total income | 14,783,759 | |
| Expenses | ||
| Management fee | ||
| Basic fee | $3,548,462 | |
| Performance adjustment | 764,573 | |
| Transfer agent fees | 1,114,365 | |
| Distribution and service plan fees | 119,772 | |
| Accounting and security lending fees | 200,536 | |
| Custodian fees and expenses | 146,102 | |
| Independent trustees' compensation | 1,816 | |
| Registration fees | 47,264 | |
| Audit | 52,823 | |
| Legal | 1,099 | |
| Miscellaneous | 2,661 | |
| Total expenses before reductions | 5,999,473 | |
| Expense reductions | (7,275) | 5,992,198 |
| Net investment income (loss) | 8,791,561 | |
| Realized and Unrealized Gain (Loss) | ||
| Net realized gain (loss) on: | ||
| Investment securities: | ||
| Unaffiliated issuers | (883,158) | |
| Foreign currency transactions | (42,970) | |
| Total net realized gain (loss) | (926,128) | |
| Change in net unrealized appreciation (depreciation) on: Investment securities | 17,069,850 | |
| Assets and liabilities in foreign currencies | 179,334 | |
| Total change in net unrealized appreciation (depreciation) | 17,249,184 | |
| Net gain (loss) | 16,323,056 | |
| Net increase (decrease) in net assets resulting from operations | $25,114,617 |
See accompanying notes which are an integral part of the financial statements.
Statement of Changes in Net Assets
| Six months ended April 30, 2016 (Unaudited) | Year ended October 31, 2015 | |
| Increase (Decrease) in Net Assets | ||
| Operations | ||
| Net investment income (loss) | $8,791,561 | $11,998,423 |
| Net realized gain (loss) | (926,128) | 25,838,406 |
| Change in net unrealized appreciation (depreciation) | 17,249,184 | 6,824,724 |
| Net increase (decrease) in net assets resulting from operations | 25,114,617 | 44,661,553 |
| Distributions to shareholders from net investment income | (10,933,091) | (7,662,528) |
| Distributions to shareholders from net realized gain | (23,540,154) | (116,906,834) |
| Total distributions | (34,473,245) | (124,569,362) |
| Share transactions - net increase (decrease) | 27,183,054 | 53,722,708 |
| Redemption fees | 70,645 | 103,111 |
| Total increase (decrease) in net assets | 17,895,071 | (26,081,990) |
| Net Assets | ||
| Beginning of period | 873,991,803 | 900,073,793 |
| End of period (including undistributed net investment income of $8,805,214 and undistributed net investment income of $10,946,744, respectively) | $891,886,874 | $873,991,803 |
See accompanying notes which are an integral part of the financial statements.
Financial Highlights — Fidelity International Small Cap Fund Class A
| Six months ended (Unaudited) April 30, | Years ended October 31, | |||||
| 2016 | 2015 | 2014 | 2013 | 2012 | 2011 | |
| Selected Per–Share Data | ||||||
| Net asset value, beginning of period | $22.69 | $24.98 | $26.34 | $19.74 | $18.97 | $20.42 |
| Income from Investment Operations | ||||||
| Net investment income (loss)A | .20 | .27 | .17 | .06 | .06 | .10 |
| Net realized and unrealized gain (loss) | .45 | 1.05 | (.89) | 6.94 | 1.09 | (.88) |
| Total from investment operations | .65 | 1.32 | (.72) | 7.00 | 1.15 | (.78) |
| Distributions from net investment income | (.25) | (.16) | (.05) | (.07) | (.11) | (.02) |
| Distributions from net realized gain | (.62) | (3.45) | (.60) | (.33) | (.27) | (.66) |
| Total distributions | (.87) | (3.61) | (.65) | (.40) | (.38) | (.68) |
| Redemption fees added to paid in capitalA | –B | –B | .01 | –B | –B | .01 |
| Net asset value, end of period | $22.47 | $22.69 | $24.98 | $26.34 | $19.74 | $18.97 |
| Total ReturnC,D,E | 2.97% | 6.21% | (2.79)% | 36.18% | 6.28% | (4.00)% |
| Ratios to Average Net AssetsF,G | ||||||
| Expenses before reductions | 1.66%H | 1.59% | 1.50% | 1.61% | 1.63% | 1.56% |
| Expenses net of fee waivers, if any | 1.66%H | 1.58% | 1.50% | 1.61% | 1.63% | 1.55% |
| Expenses net of all reductions | 1.66%H | 1.58% | 1.50% | 1.60% | 1.60% | 1.54% |
| Net investment income (loss) | 1.88%H | 1.18% | .65% | .25% | .32% | .49% |
| Supplemental Data | ||||||
| Net assets, end of period (000 omitted) | $31,898 | $28,238 | $24,572 | $24,020 | $14,125 | $17,185 |
| Portfolio turnover rateI | 25%H | 36% | 102% | 54% | 68% | 47% |
A Calculated based on average shares outstanding during the period.
B Amount represents less than $.005 per share.
C Total returns for periods of less than one year are not annualized.
D Total returns would have been lower if certain expenses had not been reduced during the applicable periods shown.
E Total returns do not include the effect of the sales charges.
F Fees and expenses of any underlying Fidelity Central Funds are not included in the Fund's expense ratio. The Fund indirectly bears its proportionate share of the expenses of any underlying Fidelity Central Funds.
G Expense ratios reflect operating expenses of the class. Expenses before reductions do not reflect amounts reimbursed by the investment adviser or reductions from brokerage service arrangements or reductions from other expense offset arrangements and do not represent the amount paid by the class during periods when reimbursements or reductions occur. Expenses net of fee waivers reflect expenses after reimbursement by the investment adviser but prior to reductions from brokerage service arrangements or other expense offset arrangements. Expenses net of all reductions represent the net expenses paid by the class.
H Annualized
I Amount does not include the portfolio activity of any underlying Fidelity Central Funds.
See accompanying notes which are an integral part of the financial statements.
Financial Highlights — Fidelity International Small Cap Fund Class T
| Six months ended (Unaudited) April 30, | Years ended October 31, | |||||
| 2016 | 2015 | 2014 | 2013 | 2012 | 2011 | |
| Selected Per–Share Data | ||||||
| Net asset value, beginning of period | $22.55 | $24.81 | $26.17 | $19.59 | $18.80 | $20.23 |
| Income from Investment Operations | ||||||
| Net investment income (loss)A | .17 | .21 | .10 | –B | .01 | .05 |
| Net realized and unrealized gain (loss) | .44 | 1.04 | (.87) | 6.90 | 1.08 | (.86) |
| Total from investment operations | .61 | 1.25 | (.77) | 6.90 | 1.09 | (.81) |
| Distributions from net investment income | (.19) | (.06) | – | – | (.03) | – |
| Distributions from net realized gain | (.62) | (3.45) | (.60) | (.32) | (.27) | (.63) |
| Total distributions | (.81) | (3.51) | (.60) | (.32) | (.30) | (.63) |
| Redemption fees added to paid in capitalA | –B | –B | .01 | –B | –B | .01 |
| Net asset value, end of period | $22.35 | $22.55 | $24.81 | $26.17 | $19.59 | $18.80 |
| Total ReturnC,D,E | 2.81% | 5.90% | (3.00)% | 35.80% | 5.97% | (4.18)% |
| Ratios to Average Net AssetsF,G | ||||||
| Expenses before reductions | 1.95%H | 1.87% | 1.77% | 1.87% | 1.88% | 1.82% |
| Expenses net of fee waivers, if any | 1.95%H | 1.86% | 1.77% | 1.87% | 1.88% | 1.81% |
| Expenses net of all reductions | 1.95%H | 1.86% | 1.76% | 1.85% | 1.85% | 1.79% |
| Net investment income (loss) | 1.58%H | .90% | .38% | (.01)% | .07% | .24% |
| Supplemental Data | ||||||
| Net assets, end of period (000 omitted) | $13,017 | $12,400 | $12,296 | $13,530 | $9,262 | $13,744 |
| Portfolio turnover rateI | 25%H | 36% | 102% | 54% | 68% | 47% |
A Calculated based on average shares outstanding during the period.
B Amount represents less than $.005 per share.
C Total returns for periods of less than one year are not annualized.
D Total returns would have been lower if certain expenses had not been reduced during the applicable periods shown.
E Total returns do not include the effect of the sales charges.
F Fees and expenses of any underlying Fidelity Central Funds are not included in the Fund's expense ratio. The Fund indirectly bears its proportionate share of the expenses of any underlying Fidelity Central Funds.
G Expense ratios reflect operating expenses of the class. Expenses before reductions do not reflect amounts reimbursed by the investment adviser or reductions from brokerage service arrangements or reductions from other expense offset arrangements and do not represent the amount paid by the class during periods when reimbursements or reductions occur. Expenses net of fee waivers reflect expenses after reimbursement by the investment adviser but prior to reductions from brokerage service arrangements or other expense offset arrangements. Expenses net of all reductions represent the net expenses paid by the class.
H Annualized
I Amount does not include the portfolio activity of any underlying Fidelity Central Funds.
See accompanying notes which are an integral part of the financial statements.
Financial Highlights — Fidelity International Small Cap Fund Class B
| Six months ended (Unaudited) April 30, | Years ended October 31, | |||||
| 2016 | 2015 | 2014 | 2013 | 2012 | 2011 | |
| Selected Per–Share Data | ||||||
| Net asset value, beginning of period | $22.22 | $24.51 | $25.87 | $19.22 | $18.38 | $19.79 |
| Income from Investment Operations | ||||||
| Net investment income (loss)A | .12 | .09 | (.03) | (.11) | (.08) | (.05) |
| Net realized and unrealized gain (loss) | .44 | 1.04 | (.87) | 6.84 | 1.07 | (.85) |
| Total from investment operations | .56 | 1.13 | (.90) | 6.73 | .99 | (.90) |
| Distributions from net investment income | (.06) | – | – | – | – | – |
| Distributions from net realized gain | (.62) | (3.42) | (.47) | (.08) | (.15) | (.52) |
| Total distributions | (.68) | (3.42) | (.47) | (.08) | (.15) | (.52) |
| Redemption fees added to paid in capitalA | –B | –B | .01 | –B | –B | .01 |
| Net asset value, end of period | $22.10 | $22.22 | $24.51 | $25.87 | $19.22 | $18.38 |
| Total ReturnC,D,E | 2.59% | 5.40% | (3.52)% | 35.14% | 5.45% | (4.68)% |
| Ratios to Average Net AssetsF,G | ||||||
| Expenses before reductions | 2.44%H | 2.36% | 2.28% | 2.37% | 2.38% | 2.32% |
| Expenses net of fee waivers, if any | 2.44%H | 2.36% | 2.28% | 2.36% | 2.38% | 2.30% |
| Expenses net of all reductions | 2.44%H | 2.36% | 2.27% | 2.35% | 2.35% | 2.29% |
| Net investment income (loss) | 1.09%H | .41% | (.13)% | (.51)% | (.43)% | (.26)% |
| Supplemental Data | ||||||
| Net assets, end of period (000 omitted) | $277 | $390 | $507 | $795 | $790 | $2,067 |
| Portfolio turnover rateI | 25%H | 36% | 102% | 54% | 68% | 47% |
A Calculated based on average shares outstanding during the period.
B Amount represents less than $.005 per share.
C Total returns for periods of less than one year are not annualized.
D Total returns would have been lower if certain expenses had not been reduced during the applicable periods shown.
E Total returns do not include the effect of the contingent deferred sales charge.
F Fees and expenses of any underlying Fidelity Central Funds are not included in the Fund's expense ratio. The Fund indirectly bears its proportionate share of the expenses of any underlying Fidelity Central Funds.
G Expense ratios reflect operating expenses of the class. Expenses before reductions do not reflect amounts reimbursed by the investment adviser or reductions from brokerage service arrangements or reductions from other expense offset arrangements and do not represent the amount paid by the class during periods when reimbursements or reductions occur. Expenses net of fee waivers reflect expenses after reimbursement by the investment adviser but prior to reductions from brokerage service arrangements or other expense offset arrangements. Expenses net of all reductions represent the net expenses paid by the class.
H Annualized
I Amount does not include the portfolio activity of any underlying Fidelity Central Funds.
See accompanying notes which are an integral part of the financial statements.
Financial Highlights — Fidelity International Small Cap Fund Class C
| Six months ended (Unaudited) April 30, | Years ended October 31, | |||||
| 2016 | 2015 | 2014 | 2013 | 2012 | 2011 | |
| Selected Per–Share Data | ||||||
| Net asset value, beginning of period | $21.96 | $24.27 | $25.68 | $19.18 | $18.38 | $19.85 |
| Income from Investment Operations | ||||||
| Net investment income (loss)A | .11 | .09 | (.02) | (.11) | (.08) | (.04) |
| Net realized and unrealized gain (loss) | .45 | 1.02 | (.85) | 6.79 | 1.07 | (.85) |
| Total from investment operations | .56 | 1.11 | (.87) | 6.68 | .99 | (.89) |
| Distributions from net investment income | (.13) | – | – | – | – | – |
| Distributions from net realized gain | (.62) | (3.42) | (.55) | (.18) | (.19) | (.59) |
| Total distributions | (.75) | (3.42) | (.55) | (.18) | (.19) | (.59) |
| Redemption fees added to paid in capitalA | –B | –B | .01 | –B | –B | .01 |
| Net asset value, end of period | $21.77 | $21.96 | $24.27 | $25.68 | $19.18 | $18.38 |
| Total ReturnC,D,E | 2.61% | 5.37% | (3.43)% | 35.15% | 5.46% | (4.64)% |
| Ratios to Average Net AssetsF,G | ||||||
| Expenses before reductions | 2.44%H | 2.36% | 2.23% | 2.33% | 2.38% | 2.27% |
| Expenses net of fee waivers, if any | 2.44%H | 2.35% | 2.22% | 2.33% | 2.38% | 2.26% |
| Expenses net of all reductions | 2.44%H | 2.35% | 2.22% | 2.32% | 2.35% | 2.24% |
| Net investment income (loss) | 1.09%H | .41% | (.07)% | (.47)% | (.43)% | (.21)% |
| Supplemental Data | ||||||
| Net assets, end of period (000 omitted) | $9,911 | $11,359 | $12,576 | $13,426 | $6,799 | $9,545 |
| Portfolio turnover rateI | 25%H | 36% | 102% | 54% | 68% | 47% |
A Calculated based on average shares outstanding during the period.
B Amount represents less than $.005 per share.
C Total returns for periods of less than one year are not annualized.
D Total returns would have been lower if certain expenses had not been reduced during the applicable periods shown.
E Total returns do not include the effect of the contingent deferred sales charge.
F Fees and expenses of any underlying Fidelity Central Funds are not included in the Fund's expense ratio. The Fund indirectly bears its proportionate share of the expenses of any underlying Fidelity Central Funds.
G Expense ratios reflect operating expenses of the class. Expenses before reductions do not reflect amounts reimbursed by the investment adviser or reductions from brokerage service arrangements or reductions from other expense offset arrangements and do not represent the amount paid by the class during periods when reimbursements or reductions occur. Expenses net of fee waivers reflect expenses after reimbursement by the investment adviser but prior to reductions from brokerage service arrangements or other expense offset arrangements. Expenses net of all reductions represent the net expenses paid by the class.
H Annualized
I Amount does not include the portfolio activity of any underlying Fidelity Central Funds.
See accompanying notes which are an integral part of the financial statements.
Financial Highlights — Fidelity International Small Cap Fund
| Six months ended (Unaudited) April 30, | Years ended October 31, | |||||
| 2016 | 2015 | 2014 | 2013 | 2012 | 2011 | |
| Selected Per–Share Data | ||||||
| Net asset value, beginning of period | $23.06 | $25.34 | $26.67 | $19.99 | $19.23 | $20.66 |
| Income from Investment Operations | ||||||
| Net investment income (loss)A | .23 | .34 | .25 | .12 | .11 | .17 |
| Net realized and unrealized gain (loss) | .45 | 1.07 | (.90) | 7.02 | 1.10 | (.89) |
| Total from investment operations | .68 | 1.41 | (.65) | 7.14 | 1.21 | (.72) |
| Distributions from net investment income | (.29) | (.24) | (.09) | (.14) | (.18) | (.06) |
| Distributions from net realized gain | (.62) | (3.45) | (.60) | (.33) | (.27) | (.66) |
| Total distributions | (.91) | (3.69) | (.69) | (.46)B | (.45) | (.72) |
| Redemption fees added to paid in capitalA | –C | –C | .01 | –C | –C | .01 |
| Net asset value, end of period | $22.83 | $23.06 | $25.34 | $26.67 | $19.99 | $19.23 |
| Total ReturnD,E | 3.07% | 6.53% | (2.48)% | 36.56% | 6.55% | (3.65)% |
| Ratios to Average Net AssetsF,G | ||||||
| Expenses before reductions | 1.40%H | 1.31% | 1.21% | 1.33% | 1.35% | 1.26% |
| Expenses net of fee waivers, if any | 1.40%H | 1.31% | 1.20% | 1.32% | 1.35% | 1.25% |
| Expenses net of all reductions | 1.40%H | 1.31% | 1.20% | 1.31% | 1.33% | 1.23% |
| Net investment income (loss) | 2.13%H | 1.45% | .95% | .53% | .59% | .80% |
| Supplemental Data | ||||||
| Net assets, end of period (000 omitted) | $828,799 | $811,534 | $842,031 | $1,029,629 | $692,769 | $856,692 |
| Portfolio turnover rateI | 25%H | 36% | 102% | 54% | 68% | 47% |
A Calculated based on average shares outstanding during the period.
B Total distributions of $.46 per share is comprised of distributions from net investment income of $.136 and distributions from net realized gain of $.327 per share.
C Amount represents less than $.005 per share.
D Total returns for periods of less than one year are not annualized.
E Total returns would have been lower if certain expenses had not been reduced during the applicable periods shown.
F Fees and expenses of any underlying Fidelity Central Funds are not included in the Fund's expense ratio. The Fund indirectly bears its proportionate share of the expenses of any underlying Fidelity Central Funds.
G Expense ratios reflect operating expenses of the class. Expenses before reductions do not reflect amounts reimbursed by the investment adviser or reductions from brokerage service arrangements or reductions from other expense offset arrangements and do not represent the amount paid by the class during periods when reimbursements or reductions occur. Expenses net of fee waivers reflect expenses after reimbursement by the investment adviser but prior to reductions from brokerage service arrangements or other expense offset arrangements. Expenses net of all reductions represent the net expenses paid by the class.
H Annualized
I Amount does not include the portfolio activity of any underlying Fidelity Central Funds.
See accompanying notes which are an integral part of the financial statements.
Financial Highlights — Fidelity International Small Cap Fund Class I
| Six months ended (Unaudited) April 30, | Years ended October 31, | |||||
| 2016 | 2015 | 2014 | 2013 | 2012 | 2011 | |
| Selected Per–Share Data | ||||||
| Net asset value, beginning of period | $23.24 | $25.34 | $26.67 | $20.00 | $19.24 | $20.66 |
| Income from Investment Operations | ||||||
| Net investment income (loss)A | .24 | .36 | .29 | .16 | .13 | .18 |
| Net realized and unrealized gain (loss) | .47 | 1.07 | (.90) | 7.00 | 1.10 | (.89) |
| Total from investment operations | .71 | 1.43 | (.61) | 7.16 | 1.23 | (.71) |
| Distributions from net investment income | (.31) | (.08) | (.13) | (.16) | (.20) | (.06) |
| Distributions from net realized gain | (.62) | (3.45) | (.60) | (.33) | (.27) | (.66) |
| Total distributions | (.93) | (3.53) | (.73) | (.49) | (.47) | (.72) |
| Redemption fees added to paid in capitalA | –B | –B | .01 | –B | –B | .01 |
| Net asset value, end of period | $23.02 | $23.24 | $25.34 | $26.67 | $20.00 | $19.24 |
| Total ReturnC,D | 3.16% | 6.60% | (2.35)% | 36.68% | 6.65% | (3.62)% |
| Ratios to Average Net AssetsE,F | ||||||
| Expenses before reductions | 1.34%G | 1.24% | 1.08% | 1.20% | 1.25% | 1.22% |
| Expenses net of fee waivers, if any | 1.34%G | 1.23% | 1.08% | 1.20% | 1.25% | 1.21% |
| Expenses net of all reductions | 1.34%G | 1.23% | 1.08% | 1.18% | 1.22% | 1.19% |
| Net investment income (loss) | 2.20%G | 1.53% | 1.07% | .66% | .70% | .84% |
| Supplemental Data | ||||||
| Net assets, end of period (000 omitted) | $7,987 | $10,070 | $8,092 | $67,038 | $9,503 | $15,752 |
| Portfolio turnover rateH | 25%G | 36% | 102% | 54% | 68% | 47% |
A Calculated based on average shares outstanding during the period.
B Amount represents less than $.005 per share.
C Total returns for periods of less than one year are not annualized.
D Total returns would have been lower if certain expenses had not been reduced during the applicable periods shown.
E Fees and expenses of any underlying Fidelity Central Funds are not included in the Fund's expense ratio. The Fund indirectly bears its proportionate share of the expenses of any underlying Fidelity Central Funds.
F Expense ratios reflect operating expenses of the class. Expenses before reductions do not reflect amounts reimbursed by the investment adviser or reductions from brokerage service arrangements or reductions from other expense offset arrangements and do not represent the amount paid by the class during periods when reimbursements or reductions occur. Expenses net of fee waivers reflect expenses after reimbursement by the investment adviser but prior to reductions from brokerage service arrangements or other expense offset arrangements. Expenses net of all reductions represent the net expenses paid by the class.
G Annualized
H Amount does not include the portfolio activity of any underlying Fidelity Central Funds.
See accompanying notes which are an integral part of the financial statements.
Notes to Financial Statements (Unaudited)
For the period ended April 30, 2016
1. Organization.
Fidelity International Small Cap Fund (the Fund) is a fund of Fidelity Investment Trust (the Trust) and is authorized to issue an unlimited number of shares. The Trust is registered under the Investment Company Act of 1940, as amended (the 1940 Act), as an open-end management investment company organized as a Massachusetts business trust. The Fund offers Class A, Class T, Class C, International Small Cap and Class I shares, each of which, along with Class B shares, has equal rights as to assets and voting privileges. Class B shares are closed to new accounts and additional purchases, except for exchanges and reinvestments. Each class has exclusive voting rights with respect to matters that affect that class. Class B shares will automatically convert to Class A shares after a maximum holding period of seven years from the initial date of purchase. The Fund's investments in emerging markets can be subject to social, economic, regulatory, and political uncertainties and can be extremely volatile.
During the period, the Board of Trustees approved the conversion of all existing Class B shares into Class A shares, effective on or about July 1, 2016, regardless of the length of times shares have been held.
2. Investments in Fidelity Central Funds.
The Fund invests in Fidelity Central Funds, which are open-end investment companies generally available only to other investment companies and accounts managed by the investment adviser and its affiliates. The Fund's Schedule of Investments lists each of the Fidelity Central Funds held as of period end, if any, as an investment of the Fund, but does not include the underlying holdings of each Fidelity Central Fund. As an Investing Fund, the Fund indirectly bears its proportionate share of the expenses of the underlying Fidelity Central Funds.
The Money Market Central Funds seek preservation of capital and current income and are managed by Fidelity Investments Money Management, Inc. (FIMM), an affiliate of the investment adviser. Annualized expenses of the Money Market Central Funds as of their most recent shareholder report date are less than .005%.
A complete unaudited list of holdings for each Fidelity Central Fund is available upon request or at the Securities and Exchange Commission (the SEC) website at www.sec.gov. In addition, the financial statements of the Fidelity Central Funds are available on the SEC website or upon request.
3. Significant Accounting Policies.
The financial statements have been prepared in conformity with accounting principles generally accepted in the United States of America (GAAP), which require management to make certain estimates and assumptions at the date of the financial statements. Actual results could differ from those estimates. Subsequent events, if any, through the date that the financial statements were issued have been evaluated in the preparation of the financial statements. The following summarizes the significant accounting policies of the Fund:
Investment Valuation. Investments are valued as of 4:00 p.m. Eastern time on the last calendar day of the period. The Board of Trustees (the Board) has delegated the day to day responsibility for the valuation of the Fund's investments to the Fidelity Management & Research Company (FMR) Fair Value Committee (the Committee). In accordance with valuation policies and procedures approved by the Board, the Fund attempts to obtain prices from one or more third party pricing vendors or brokers to value its investments. When current market prices, quotations or currency exchange rates are not readily available or reliable, investments will be fair valued in good faith by the Committee, in accordance with procedures adopted by the Board. Factors used in determining fair value vary by investment type and may include market or investment specific events. The frequency with which these procedures are used cannot be predicted and they may be utilized to a significant extent. The Committee oversees the Fund's valuation policies and procedures and reports to the Board on the Committee's activities and fair value determinations. The Board monitors the appropriateness of the procedures used in valuing the Fund's investments and ratifies the fair value determinations of the Committee.
The Fund categorizes the inputs to valuation techniques used to value its investments into a disclosure hierarchy consisting of three levels as shown below:
- Level 1 – quoted prices in active markets for identical investments
- Level 2 – other significant observable inputs (including quoted prices for similar investments, interest rates, prepayment speeds, etc.)
- Level 3 – unobservable inputs (including the Fund's own assumptions based on the best information available)
Valuation techniques used to value the Fund's investments by major category are as follows:
Equity securities, including restricted securities, for which market quotations are readily available, are valued at the last reported sale price or official closing price as reported by a third party pricing vendor on the primary market or exchange on which they are traded and are categorized as Level 1 in the hierarchy. In the event there were no sales during the day or closing prices are not available, securities are valued at the last quoted bid price or may be valued using the last available price and are generally categorized as Level 2 in the hierarchy. For foreign equity securities, when market or security specific events arise, comparisons to the valuation of American Depositary Receipts (ADRs), futures contracts, Exchange-Traded Funds (ETFs) and certain indexes as well as quoted prices for similar securities may be used and would be categorized as Level 2 in the hierarchy. Utilizing these techniques may result in transfers between Level 1 and Level 2. For equity securities, including restricted securities, where observable inputs are limited, assumptions about market activity and risk are used and these securities may be categorized as Level 3 in the hierarchy.
Investments in open-end mutual funds, including the Fidelity Central Funds, are valued at their closing net asset value (NAV) each business day and are categorized as Level 1 in the hierarchy.
Changes in valuation techniques may result in transfers in or out of an assigned level within the disclosure hierarchy. The aggregate value of investments by input level as of April 30, 2016, including information on transfers between Levels 1 and 2, is included at the end of the Fund's Schedule of Investments.
Foreign Currency. The Fund may use foreign currency contracts to facilitate transactions in foreign-denominated securities. Gains and losses from these transactions may arise from changes in the value of the foreign currency or if the counterparties do not perform under the contracts' terms.
Foreign-denominated assets, including investment securities, and liabilities are translated into U.S. dollars at the exchange rates at period end. Purchases and sales of investment securities, income and dividends received and expenses denominated in foreign currencies are translated into U.S. dollars at the exchange rate in effect on the transaction date.
The effects of exchange rate fluctuations on investments are included with the net realized and unrealized gain (loss) on investment securities. Other foreign currency transactions resulting in realized and unrealized gain (loss) are disclosed separately.
Investment Transactions and Income. For financial reporting purposes, the Fund's investment holdings and NAV include trades executed through the end of the last business day of the period. The NAV per share for processing shareholder transactions is calculated as of the close of business of the New York Stock Exchange (NYSE), normally 4:00 p.m. Eastern time and includes trades executed through the end of the prior business day. Gains and losses on securities sold are determined on the basis of identified cost and may include proceeds received from litigation. Dividend income is recorded on the ex-dividend date, except for certain dividends from foreign securities where the ex-dividend date may have passed, which are recorded as soon as the Fund is informed of the ex-dividend date. Non-cash dividends included in dividend income, if any, are recorded at the fair market value of the securities received. Income and capital gain distributions from Fidelity Central Funds, if any, are recorded on the ex-dividend date. Distributions received on securities that represent a return of capital or capital gain are recorded as a reduction of cost of investments and/or as a realized gain. Subsequent to ex-dividend date the Fund determines the components of these distributions, based upon receipt of tax filings or other correspondence relating to the underlying investment.
Class Allocations and Expenses. Investment income, realized and unrealized capital gains and losses, common expenses of the Fund, and certain fund-level expense reductions, if any, are allocated daily on a pro-rata basis to each class based on the relative net assets of each class to the total net assets of the Fund. Each class differs with respect to transfer agent and distribution and service plan fees incurred. Certain expense reductions may also differ by class. For the reporting period, the allocated portion of income and expenses to each class as a percent of its average net assets may vary due to the timing of recording these transactions in relation to fluctuating net assets of the classes. Expenses directly attributable to a fund are charged to that fund. Expenses attributable to more than one fund are allocated among the respective funds on the basis of relative net assets or other appropriate methods. Expense estimates are accrued in the period to which they relate and adjustments are made when actual amounts are known.
Income Tax Information and Distributions to Shareholders. Each year, the Fund intends to qualify as a regulated investment company under Subchapter M of the Internal Revenue Code, including distributing substantially all of its taxable income and realized gains. As a result, no provision for U.S. Federal income taxes is required. The Fund files a U.S. federal tax return, in addition to state and local tax returns as required. The Fund's federal income tax returns are subject to examination by the Internal Revenue Service (IRS) for a period of three fiscal years after they are filed. State and local tax returns may be subject to examination for an additional fiscal year depending on the jurisdiction. Foreign taxes are provided for based on the Fund's understanding of the tax rules and rates that exist in the foreign markets in which it invests.
Distributions are declared and recorded on the ex-dividend date. Income dividends and capital gain distributions are declared separately for each class. Income and capital gain distributions are determined in accordance with income tax regulations, which may differ from GAAP.
Capital accounts within the financial statements are adjusted for permanent book-tax differences. These adjustments have no impact on net assets or the results of operations. Capital accounts are not adjusted for temporary book-tax differences which will reverse in a subsequent period.
Book-tax differences are primarily due to foreign currency transactions, certain foreign taxes, passive foreign investment companies (PFIC) and losses deferred due to wash sales.
The federal tax cost of investment securities and unrealized appreciation (depreciation) as of period end were as follows:
| Gross unrealized appreciation | $118,739,691 |
| Gross unrealized depreciation | (109,342,665) |
| Net unrealized appreciation (depreciation) on securities | $9,397,026 |
| Tax cost | $891,398,400 |
Short-Term Trading (Redemption) Fees. Shares held by investors in the Fund less than 90 days may have been subject to a redemption fee equal to 2.00% of the NAV of shares redeemed. All redemption fees, which reduce the proceeds of the shareholder redemption, are retained by the Fund and accounted for as an addition to paid in capital.
Delayed Delivery Transactions and When-Issued Securities. During the period, the Fund transacted in securities on a delayed delivery or when-issued basis. Payment and delivery may take place after the customary settlement period for that security. The price of the underlying securities and the date when the securities will be delivered and paid for are fixed at the time the transaction is negotiated. The securities purchased on a delayed delivery or when-issued basis are identified as such in the Fund's Schedule of Investments. With respect to purchase commitments, the Fund identifies securities as segregated in its records with a value at least equal to the amount of the commitment. Losses may arise due to changes in the value of the underlying securities or if the counterparty does not perform under the contract's terms, or if the issuer does not issue the securities due to political, economic, or other factors.
Restricted Securities. The Fund may invest in securities that are subject to legal or contractual restrictions on resale. These securities generally may be resold in transactions exempt from registration or to the public if the securities are registered. Disposal of these securities may involve time-consuming negotiations and expense, and prompt sale at an acceptable price may be difficult. Information regarding restricted securities is included at the end of the Fund's Schedule of Investments.
4. Purchases and Sales of Investments.
Purchases and sales of securities, other than short-term securities, aggregated $105,149,143 and $100,546,287, respectively.
5. Fees and Other Transactions with Affiliates.
Management Fee. Fidelity Management & Research Company (the investment adviser) and its affiliates provide the Fund with investment management related services for which the Fund pays a monthly management fee. The management fee is the sum of an individual fund fee rate that is based on an annual rate of .60% of the Fund's average net assets and an annualized group fee rate that averaged .25% during the period. The group fee rate is based upon the average net assets of all the mutual funds advised by the investment adviser, including any mutual funds previously advised by the investment adviser that are currently advised by Fidelity SelectCo, LLC, an affiliate of the investment adviser. The group fee rate decreases as assets under management increase and increases as assets under management decrease. In addition, the management fee is subject to a performance adjustment (up to a maximum of +/- .20% of the Fund's average net assets over a 36 month performance period). The upward or downward adjustment to the management fee is based on the relative investment performance of International Small Cap as compared to its benchmark index, the MSCI ACWI (All Country World Index) ex USA Small Cap Index effective April 1, 2014 (the MSCI EAFE Small Cap Index prior to April 1, 2014), over the same 36 month performance period. For the reporting period, the total annualized management fee rate, including the performance adjustment, was 1.03% of the Fund's average net assets. The performance adjustment included in the management fee rate may be higher or lower than the maximum performance adjustment rate due to the difference between the average net assets for the reporting and performance periods.
Distribution and Service Plan Fees. In accordance with Rule 12b-1 of the 1940 Act, the Fund has adopted separate Distribution and Service Plans for each class of shares. Certain classes pay Fidelity Distributors Corporation (FDC), an affiliate of the investment adviser, separate Distribution and Service Fees, each of which is based on an annual percentage of each class' average net assets. In addition, FDC may pay financial intermediaries for selling shares of the Fund and providing shareholder support services. For the period, the Distribution and Service Fee rates, total fees and amounts retained by FDC were as follows:
| Distribution Fee | Service Fee | Total Fees | Retained by FDC | |
| Class A | -% | .25% | $36,761 | $– |
| Class T | .25% | .25% | 30,678 | – |
| Class B | .75% | .25% | 1,596 | 1,197 |
| Class C | .75% | .25% | 50,737 | 8,321 |
| $119,772 | $9,518 |
Sales Load. FDC may receive a front-end sales charge of up to 5.75% for selling Class A shares and 3.50% for selling Class T shares, some of which is paid to financial intermediaries for selling shares of the Fund. Depending on the holding period, FDC may receive contingent deferred sales charges levied on Class A, Class T, Class B, and Class C redemptions. The deferred sales charges range from 5.00% to 1.00% for Class B shares, 1.00% for Class C shares, 1.00% for certain purchases of Class A shares and .25% for certain purchases of Class T shares.
For the period, sales charge amounts retained by FDC were as follows:
| Retained by FDC | |
| Class A | $8,966 |
| Class T | 1,548 |
| Class B(a) | 8 |
| Class C(a) | 1,861 |
| $12,383 |
(a) When Class B and Class C shares are initially sold, FDC pays commissions from its own resources to financial intermediaries through which the sales are made.
Transfer Agent Fees. Fidelity Investments Institutional Operations Company, Inc., (FIIOC), an affiliate of the investment adviser, is the transfer, dividend disbursing and shareholder servicing agent for each class of the Fund. FIIOC receives account fees and asset-based fees that vary according to the account size and type of account of the shareholders of the respective classes of the Fund. FIIOC pays for typesetting, printing and mailing of shareholder reports, except proxy statements.
For the period, transfer agent fees for each class were as follows:
| Amount | % of Class-Level Average Net Assets(a) | |
| Class A | $39,714 | .27 |
| Class T | 19,256 | .31 |
| Class B | 483 | .30 |
| Class C | 15,549 | .31 |
| International Small Cap | 1,030,543 | .27 |
| Class I | 8,820 | .20 |
| $1,114,365 |
(a) Annualized
Accounting and Security Lending Fees. Fidelity Service Company, Inc. (FSC), an affiliate of the investment adviser, maintains the Fund's accounting records. The accounting fee is based on the level of average net assets for each month. Under a separate contract, FSC administers the security lending program. The security lending fee is based on the number and duration of lending transactions.
Brokerage Commissions. The Fund placed a portion of its portfolio transactions with brokerage firms which are affiliates of the investment adviser. Brokerage commissions are included in net realized gain (loss) and change in net unrealized appreciation (depreciation) in the Statement of Operations. The commissions paid to these affiliated firms were $6 for the period.
Interfund Trades. The Fund may purchase from or sell securities to other Fidelity Funds under procedures adopted by the Board. The procedures have been designed to ensure these interfund trades are executed in accordance with Rule 17a-7 of the 1940 Act. Interfund trades are included within the respective purchases and sales amounts shown in the Purchases and Sales of Investments note.
6. Committed Line of Credit.
The Fund participates with other funds managed by the investment adviser or an affiliate in a $4.25 billion credit facility (the "line of credit") to be utilized for temporary or emergency purposes to fund shareholder redemptions or for other short-term liquidity purposes. The Fund has agreed to pay commitment fees on its pro-rata portion of the line of credit, which amounted to $731 and is reflected in Miscellaneous expenses on the Statement of Operations. During the period, the Fund did not borrow on this line of credit.
7. Security Lending.
The Fund lends portfolio securities through a lending agent from time to time in order to earn additional income. For equity securities, a lending agent is used and may loan securities to certain qualified borrowers, including Fidelity Capital Markets (FCM), a broker-dealer affiliated with the Fund. On the settlement date of the loan, the Fund receives collateral (in the form of U.S. Treasury obligations, letters of credit and/or cash) against the loaned securities and maintains collateral in an amount not less than 100% of the market value of the loaned securities during the period of the loan. The market value of the loaned securities is determined at the close of business of the Fund and any additional required collateral is delivered to the Fund on the next business day. The Fund or borrower may terminate the loan at any time, and if the borrower defaults on its obligation to return the securities loaned because of insolvency or other reasons, the Fund may apply collateral received from the borrower against the obligation. The Fund may experience delays and costs in recovering the securities loaned. Any cash collateral received is invested in the Fidelity Securities Lending Cash Central Fund. The value of loaned securities and cash collateral at period end are disclosed on the Fund's Statement of Assets and Liabilities. At period end, there were no security loans outstanding with FCM. Security lending income represents the income earned on investing cash collateral, less rebates paid to borrowers and any lending agent fees associated with the loan, plus any premium payments received for lending certain types of securities. Security lending income is presented in the Statement of Operations as a component of income from Fidelity Central Funds. Total security lending income during the period amounted to $178,311, including $844 from securities loaned to FCM.
8. Expense Reductions.
Commissions paid to certain brokers with whom the investment adviser, or its affiliates, places trades on behalf of the Fund include an amount in addition to trade execution, which may be rebated back to the Fund to offset certain expenses. This amount totaled $4,199 for the period. In addition, through arrangements with the Fund's custodian, credits realized as a result of certain uninvested cash balances were used to reduce the Fund's expenses. During the period, these credits reduced the Fund's custody expenses by $15.
In addition, during the period the investment adviser reimbursed and/or waived a portion of fund-level operating expenses in the amount of $3,061.
9. Distributions to Shareholders.
Distributions to shareholders of each class were as follows:
| Six months ended April 30, 2016 | Year ended October 31, 2015 | |
| From net investment income | ||
| Class A | $319,347 | $155,785 |
| Class T | 106,306 | 27,108 |
| Class B | 996 | – |
| Class C | 64,383 | – |
| International Small Cap | 10,307,620 | 7,454,709 |
| Class I | 134,439 | 24,926 |
| Total | $10,933,091 | $7,662,528 |
| From net realized gain | ||
| Class A | $788,825 | $3,382,206 |
| Class T | 339,739 | 1,671,017 |
| Class B | 10,287 | 66,002 |
| Class C | 319,340 | 1,697,539 |
| International Small Cap | 21,811,338 | 109,040,767 |
| Class I | 270,625 | 1,049,303 |
| Total | $23,540,154 | $116,906,834 |
10. Share Transactions.
Share transactions for each class were as follows and may contain automatic conversions between classes or exchanges between affiliated funds:
| Shares | Shares | Dollars | Dollars | |
| Six months ended April 30, 2016 | Year ended October 31, 2015 | Six months ended April 30, 2016 | Year ended October 31, 2015 | |
| Class A | ||||
| Shares sold | 325,140 | 432,152 | $6,861,060 | $9,990,970 |
| Reinvestment of distributions | 49,226 | 159,613 | 1,077,561 | 3,404,539 |
| Shares redeemed | (199,361) | (331,016) | (4,291,584) | (7,450,558) |
| Net increase (decrease) | 175,005 | 260,749 | $3,647,037 | $5,944,951 |
| Class T | ||||
| Shares sold | 98,594 | 124,085 | $2,040,918 | $2,869,552 |
| Reinvestment of distributions | 20,220 | 77,005 | 440,798 | 1,636,354 |
| Shares redeemed | (86,353) | (146,828) | (1,830,831) | (3,289,706) |
| Net increase (decrease) | 32,461 | 54,262 | $650,885 | $1,216,200 |
| Class B | ||||
| Shares sold | 2,210 | 4,667 | $44,407 | $108,058 |
| Reinvestment of distributions | 493 | 2,954 | 10,648 | 62,128 |
| Shares redeemed | (7,751) | (10,732) | (163,958) | (240,945) |
| Net increase (decrease) | (5,048) | (3,111) | $(108,903) | $(70,759) |
| Class C | ||||
| Shares sold | 60,963 | 196,292 | $1,285,274 | $4,379,607 |
| Reinvestment of distributions | 16,869 | 71,584 | 358,801 | 1,488,229 |
| Shares redeemed | (139,670) | (268,981) | (2,822,873) | (5,818,752) |
| Net increase (decrease) | (61,838) | (1,105) | $(1,178,798) | $49,084 |
| International Small Cap | ||||
| Shares sold | 4,597,133 | 7,876,402 | $99,766,157 | $184,799,928 |
| Reinvestment of distributions | 1,408,054 | 5,231,399 | 31,286,953 | 113,102,853 |
| Shares redeemed | (4,905,938) | (11,138,439) | (105,124,693) | (253,855,534) |
| Net increase (decrease) | 1,099,249 | 1,969,362 | $25,928,417 | $44,047,247 |
| Class I | ||||
| Shares sold | 181,821 | 256,693 | $3,999,752 | $5,987,647 |
| Reinvestment of distributions | 16,670 | 46,102 | 373,252 | 1,003,648 |
| Shares redeemed | (284,792) | (188,812) | (6,128,588) | (4,455,310) |
| Net increase (decrease) | (86,301) | 113,983 | $(1,755,584) | $2,535,985 |
11. Other.
The Fund's organizational documents provide former and current trustees and officers with a limited indemnification against liabilities arising in connection with the performance of their duties to the Fund. In the normal course of business, the Fund may also enter into contracts that provide general indemnifications. The Fund's maximum exposure under these arrangements is unknown as this would be dependent on future claims that may be made against the Fund. The risk of material loss from such claims is considered remote.
At the end of the period, the investment adviser or its affiliates were the owner of record of 14% of the total outstanding shares of the Fund.
Shareholder Expense Example
As a shareholder of the Fund, you incur two types of costs: (1) transaction costs, including sales charges (loads) on purchase payments or redemption proceeds, redemption fees and (2) ongoing costs, including management fees, distribution and/or service (12b-1) fees and other Fund expenses. This Example is intended to help you understand your ongoing costs (in dollars) of investing in the Fund and to compare these costs with the ongoing costs of investing in other mutual funds.
The Example is based on an investment of $1,000 invested at the beginning of the period and held for the entire period (November 1, 2015 to April 30, 2016).
Actual Expenses
The first line of the accompanying table for each class of the Fund provides information about actual account values and actual expenses. You may use the information in this line, together with the amount you invested, to estimate the expenses that you paid over the period. Simply divide your account value by $1,000.00 (for example, an $8,600 account value divided by $1,000.00 = 8.6), then multiply the result by the number in the first line for a class of the Fund under the heading entitled "Expenses Paid During Period" to estimate the expenses you paid on your account during this period. A small balance maintenance fee of $12.00 that is charged once a year may apply for certain accounts with a value of less than $2,000. This fee is not included in the table below. If it was, the estimate of expenses you paid during the period would be higher, and your ending account value lower, by this amount. In addition, the Fund, as a shareholder in the underlying Fidelity Central Funds, will indirectly bear its pro-rata share of the fees and expenses incurred by the underlying Fidelity Central Funds. These fees and expenses are not included in the Fund's annualized expense ratio used to calculate the expense estimate in the table below.
Hypothetical Example for Comparison Purposes
The second line of the accompanying table for each class of the Fund provides information about hypothetical account values and hypothetical expenses based on a Class' actual expense ratio and an assumed rate of return of 5% per year before expenses, which is not the Class' actual return. The hypothetical account values and expenses may not be used to estimate the actual ending account balance or expenses you paid for the period. You may use this information to compare the ongoing costs of investing in the Fund and other funds. To do so, compare this 5% hypothetical example with the 5% hypothetical examples that appear in the shareholder reports of the other funds. A small balance maintenance fee of $12.00 that is charged once a year may apply for certain accounts with a value of less than $2,000. This fee is not included in the table below. If it was, the estimate of expenses you paid during the period would be higher, and your ending account value lower, by this amount. In addition, the Fund, as a shareholder in the underlying Fidelity Central Funds, will indirectly bear its pro-rata share of the fees and expenses incurred by the underlying Fidelity Central Funds. These fees and expenses are not included in the Fund's annualized expense ratio used to calculate the expense estimate in the table below.
Please note that the expenses shown in the table are meant to highlight your ongoing costs only and do not reflect any transaction costs. Therefore, the second line of the table is useful in comparing ongoing costs only, and will not help you determine the relative total costs of owning different funds. In addition, if these transactional costs were included, your costs would have been higher.
| Annualized Expense Ratio-A | Beginning Account Value November 1, 2015 | Ending Account Value April 30, 2016 | Expenses Paid During Period-B November 1, 2015 to April 30, 2016 | |
| Class A | 1.66% | |||
| Actual | $1,000.00 | $1,029.70 | $8.38 | |
| Hypothetical-C | $1,000.00 | $1,016.61 | $8.32 | |
| Class T | 1.95% | |||
| Actual | $1,000.00 | $1,028.10 | $9.83 | |
| Hypothetical-C | $1,000.00 | $1,015.17 | $9.77 | |
| Class B | 2.44% | |||
| Actual | $1,000.00 | $1,025.90 | $12.29 | |
| Hypothetical-C | $1,000.00 | $1,012.73 | $12.21 | |
| Class C | 2.44% | |||
| Actual | $1,000.00 | $1,026.10 | $12.29 | |
| Hypothetical-C | $1,000.00 | $1,012.73 | $12.21 | |
| International Small Cap | 1.40% | |||
| Actual | $1,000.00 | $1,030.70 | $7.07 | |
| Hypothetical-C | $1,000.00 | $1,017.90 | $7.02 | |
| Class I | 1.34% | |||
| Actual | $1,000.00 | $1,031.60 | $6.77 | |
| Hypothetical-C | $1,000.00 | $1,018.20 | $6.72 |
A Annualized expense ratio reflects expenses net of applicable fee waivers.
B Expenses are equal to each Class' annualized expense ratio, multiplied by the average account value over the period, multiplied by 182/366 (to reflect the one-half year period).
C 5% return per year before expenses
![]()
AISC-SANN-0616
1.800644.112
Fidelity Advisor® Global Commodity Stock Fund - Semi-Annual Report April 30, 2016 Class I is a class of Fidelity® Global Commodity Stock Fund |
|
Contents
To view a fund's proxy voting guidelines and proxy voting record for the 12-month period ended June 30, visit http://www.fidelity.com/proxyvotingresults or visit the Securities and Exchange Commission's (SEC) web site at http://www.sec.gov.
You may also call 1-877-208-0098 to request a free copy of the proxy voting guidelines.
Standard & Poor's, S&P and S&P 500 are registered service marks of The McGraw-Hill Companies, Inc. and have been licensed for use by Fidelity Distributors Corporation.
Other third-party marks appearing herein are the property of their respective owners.
All other marks appearing herein are registered or unregistered trademarks or service marks of FMR LLC or an affiliated company. © 2016 FMR LLC. All rights reserved.
This report and the financial statements contained herein are submitted for the general information of the shareholders of the Fund. This report is not authorized for distribution to prospective investors in the Fund unless preceded or accompanied by an effective prospectus.
A fund files its complete schedule of portfolio holdings with the SEC for the first and third quarters of each fiscal year on Form N-Q. Forms N-Q are available on the SEC’s web site at http://www.sec.gov. A fund's Forms N-Q may be reviewed and copied at the SEC’s Public Reference Room in Washington, DC. Information regarding the operation of the SEC's Public Reference Room may be obtained by calling 1-800-SEC-0330.
For a complete list of a fund's portfolio holdings, view the most recent holdings listing, semiannual report, or annual report on Fidelity's web site at http://www.fidelity.com, http://www.advisor.fidelity.com, or http://www.401k.com, as applicable.
NOT FDIC INSURED •MAY LOSE VALUE •NO BANK GUARANTEE
Neither the Fund nor Fidelity Distributors Corporation is a bank.
Investment Summary (Unaudited)
Top Ten Stocks as of April 30, 2016
| % of fund's net assets | % of fund's net assets 6 months ago | |
| Monsanto Co. | 5.5 | 6.9 |
| Syngenta AG (Switzerland) | 4.5 | 3.7 |
| Chevron Corp. | 4.0 | 3.8 |
| Rio Tinto PLC | 3.6 | 4.3 |
| BHP Billiton PLC | 3.3 | 4.7 |
| Potash Corp. of Saskatchewan, Inc. | 3.0 | 4.9 |
| Agrium, Inc. | 3.0 | 3.8 |
| CF Industries Holdings, Inc. | 2.8 | 2.5 |
| The Mosaic Co. | 2.6 | 3.9 |
| Total SA | 2.3 | 2.2 |
| 34.6 |
Top Sectors (% of fund's net assets)
| As of April 30, 2016 | ||
| Agriculture | 34.2% | |
| Energy | 32.2% | |
| Metals | 26.0% | |
| Other | 5.5% | |
| Short-Term Investment and Net Other Assets | 2.1% | |

| As of October 31, 2015 | ||
| Agriculture | 37.7% | |
| Energy | 29.6% | |
| Metals | 26.5% | |
| Other | 6.1% | |
| Short-Term Investment and Net Other Assets | 0.1% | |
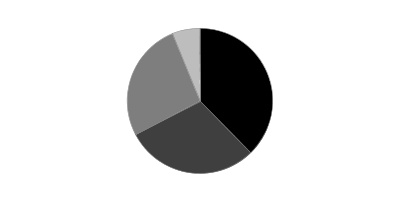
Investments April 30, 2016 (Unaudited)
Showing Percentage of Net Assets
| Common Stocks - 96.9% | |||
| Shares | Value | ||
| Aerospace & Defense - 0.4% | |||
| Aerospace & Defense - 0.4% | |||
| Rolls-Royce Group PLC | 120,320 | $1,177,018 | |
| Chemicals - 27.0% | |||
| Commodity Chemicals - 0.6% | |||
| LyondellBasell Industries NV Class A | 19,400 | 1,603,798 | |
| Diversified Chemicals - 0.8% | |||
| E.I. du Pont de Nemours & Co. | 24,000 | 1,581,840 | |
| Eastman Chemical Co. | 6,700 | 511,746 | |
| 2,093,586 | |||
| Fertilizers & Agricultural Chemicals - 25.2% | |||
| Agrium, Inc. | 92,100 | 7,936,441 | |
| CF Industries Holdings, Inc. | 229,460 | 7,588,242 | |
| FMC Corp. | 25,100 | 1,085,826 | |
| Israel Chemicals Ltd. | 152,200 | 755,206 | |
| Monsanto Co. | 158,500 | 14,848,283 | |
| OCI NV (a)(b) | 67,400 | 1,332,450 | |
| Potash Corp. of Saskatchewan, Inc. | 455,000 | 8,050,530 | |
| Sociedad Quimica y Minera de Chile SA (PN-B) sponsored ADR | 185,800 | 3,870,214 | |
| Syngenta AG (Switzerland) | 30,463 | 12,194,092 | |
| The Mosaic Co. | 245,861 | 6,881,649 | |
| Yara International ASA | 83,000 | 3,323,360 | |
| 67,866,293 | |||
| Specialty Chemicals - 0.4% | |||
| Albemarle Corp. U.S. | 8,300 | 549,128 | |
| W.R. Grace & Co. | 6,700 | 513,756 | |
| 1,062,884 | |||
| TOTAL CHEMICALS | 72,626,561 | ||
| Containers & Packaging - 1.1% | |||
| Metal & Glass Containers - 0.4% | |||
| Ball Corp. | 14,800 | 1,056,424 | |
| Paper Packaging - 0.7% | |||
| Graphic Packaging Holding Co. | 35,700 | 474,096 | |
| Smurfit Kappa Group PLC | 20,000 | 530,158 | |
| WestRock Co. | 19,659 | 822,729 | |
| 1,826,983 | |||
| TOTAL CONTAINERS & PACKAGING | 2,883,407 | ||
| Electrical Equipment - 0.5% | |||
| Electrical Components & Equipment - 0.5% | |||
| Regal Beloit Corp. | 9,100 | 586,222 | |
| SolarCity Corp. (a) | 20,500 | 621,560 | |
| 1,207,782 | |||
| Energy Equipment & Services - 0.5% | |||
| Oil & Gas Equipment & Services - 0.5% | |||
| Baker Hughes, Inc. | 17,300 | 836,628 | |
| Dril-Quip, Inc. (a) | 1,800 | 116,676 | |
| SBM Offshore NV | 37,500 | 502,176 | |
| 1,455,480 | |||
| Food Products - 3.4% | |||
| Agricultural Products - 3.2% | |||
| Archer Daniels Midland Co. | 48,600 | 1,941,084 | |
| Bunge Ltd. | 11,500 | 718,750 | |
| Darling International, Inc. (a) | 164,100 | 2,377,809 | |
| First Resources Ltd. | 1,033,700 | 1,464,251 | |
| Golden Agri-Resources Ltd. | 2,237,800 | 665,591 | |
| SLC Agricola SA | 294,200 | 1,327,610 | |
| 8,495,095 | |||
| Packaged Foods & Meats - 0.2% | |||
| Adecoagro SA (a) | 61,200 | 652,392 | |
| TOTAL FOOD PRODUCTS | 9,147,487 | ||
| Household Products - 0.3% | |||
| Household Products - 0.3% | |||
| Svenska Cellulosa AB (SCA) (B Shares) | 21,200 | 667,644 | |
| Independent Power and Renewable Electricity Producers - 1.4% | |||
| Independent Power Producers & Energy Traders - 0.3% | |||
| China Resources Power Holdings Co. Ltd. | 396,000 | 666,962 | |
| Renewable Electricity - 1.1% | |||
| Huaneng Renewables Corp. Ltd. (H Shares) | 3,010,000 | 888,204 | |
| NextEra Energy Partners LP | 71,600 | 2,068,524 | |
| 2,956,728 | |||
| TOTAL INDEPENDENT POWER AND RENEWABLE ELECTRICITY PRODUCERS | 3,623,690 | ||
| Machinery - 1.3% | |||
| Agricultural & Farm Machinery - 1.2% | |||
| AGCO Corp. | 27,100 | 1,449,037 | |
| Deere & Co. | 12,500 | 1,051,375 | |
| Jain Irrigation Systems Ltd. (a) | 954,603 | 878,070 | |
| 3,378,482 | |||
| Construction Machinery & Heavy Trucks - 0.1% | |||
| Caterpillar, Inc. | 3,000 | 233,160 | |
| TOTAL MACHINERY | 3,611,642 | ||
| Metals & Mining - 25.2% | |||
| Aluminum - 0.4% | |||
| Alcoa, Inc. | 93,600 | 1,045,512 | |
| Diversified Metals & Mining - 10.6% | |||
| Anglo American PLC (United Kingdom) | 62,851 | 701,066 | |
| BHP Billiton PLC | 644,273 | 8,803,665 | |
| Boliden AB (b) | 31,200 | 543,930 | |
| First Quantum Minerals Ltd. | 115,724 | 985,964 | |
| Freeport-McMoRan, Inc. (b) | 48,100 | 673,400 | |
| Glencore Xstrata PLC | 1,335,538 | 3,178,865 | |
| Grupo Mexico SA de CV Series B | 568,211 | 1,445,244 | |
| Ivanhoe Mines Ltd. (a) | 906,400 | 751,300 | |
| MMC Norilsk Nickel PJSC sponsored ADR | 66,400 | 979,400 | |
| Rio Tinto PLC | 292,187 | 9,801,792 | |
| South32 Ltd. (a) | 443,636 | 559,949 | |
| Turquoise Hill Resources Ltd. (a) | 53,000 | 158,404 | |
| 28,582,979 | |||
| Gold - 8.2% | |||
| Agnico Eagle Mines Ltd. (Canada) | 35,800 | 1,692,275 | |
| AngloGold Ashanti Ltd. sponsored ADR (a) | 35,600 | 585,620 | |
| Argonaut Gold, Inc. (a) | 319,700 | 749,118 | |
| B2Gold Corp. (a) | 965,680 | 2,147,324 | |
| Barrick Gold Corp. | 150,400 | 2,911,625 | |
| Compania de Minas Buenaventura SA sponsored ADR (a)(b) | 60,500 | 614,075 | |
| Continental Gold, Inc. (a) | 479,200 | 1,057,929 | |
| Franco-Nevada Corp. | 21,700 | 1,523,687 | |
| Goldcorp, Inc. | 137,910 | 2,778,644 | |
| Newcrest Mining Ltd. (a) | 58,573 | 844,848 | |
| Newmont Mining Corp. | 87,500 | 3,059,875 | |
| Premier Gold Mines Ltd. (a) | 200,500 | 599,247 | |
| Randgold Resources Ltd. sponsored ADR | 16,600 | 1,668,300 | |
| SEMAFO, Inc. (a) | 139,900 | 623,289 | |
| Sibanye Gold Ltd. ADR (b) | 41,400 | 637,560 | |
| Torex Gold Resources, Inc. (a) | 351,200 | 624,194 | |
| 22,117,610 | |||
| Precious Metals & Minerals - 0.5% | |||
| Impala Platinum Holdings Ltd. (a) | 60,500 | 250,751 | |
| Industrias Penoles SA de CV | 35,035 | 547,681 | |
| Tahoe Resources, Inc. | 40,600 | 573,390 | |
| 1,371,822 | |||
| Silver - 0.6% | |||
| Silver Wheaton Corp. | 76,500 | 1,602,921 | |
| Steel - 4.9% | |||
| ArcelorMittal SA Class A unit (b) | 193,710 | 1,090,587 | |
| Fortescue Metals Group Ltd. | 100,000 | 259,279 | |
| Hitachi Metals Ltd. (c) | 63,700 | 646,820 | |
| Hyundai Steel Co. | 17,664 | 969,791 | |
| JFE Holdings, Inc. | 34,100 | 478,537 | |
| Kobe Steel Ltd. | 498,000 | 478,189 | |
| Nippon Steel & Sumitomo Metal Corp. | 111,200 | 2,313,824 | |
| Nucor Corp. | 40,700 | 2,026,046 | |
| POSCO | 9,750 | 2,031,585 | |
| Steel Dynamics, Inc. | 20,600 | 519,326 | |
| Thyssenkrupp AG | 66,200 | 1,539,545 | |
| Voestalpine AG | 19,200 | 692,087 | |
| 13,045,616 | |||
| TOTAL METALS & MINING | 67,766,460 | ||
| Oil, Gas & Consumable Fuels - 30.3% | |||
| Coal & Consumable Fuels - 0.4% | |||
| Cameco Corp. | 70,800 | 885,917 | |
| Coal India Ltd. | 55,487 | 240,616 | |
| 1,126,533 | |||
| Integrated Oil & Gas - 16.5% | |||
| BP PLC | 478,800 | 2,637,892 | |
| Cenovus Energy, Inc. | 171,300 | 2,715,515 | |
| Chevron Corp. | 104,800 | 10,708,464 | |
| China Petroleum & Chemical Corp. (H Shares) | 1,290,000 | 909,043 | |
| Eni SpA | 58,000 | 947,542 | |
| Exxon Mobil Corp. | 50,700 | 4,481,880 | |
| Imperial Oil Ltd. | 58,700 | 1,946,686 | |
| InterOil Corp. (a) | 19,100 | 639,277 | |
| Lukoil PJSC sponsored ADR | 40,300 | 1,708,116 | |
| Occidental Petroleum Corp. | 9,400 | 720,510 | |
| Royal Dutch Shell PLC: | |||
| Class A (United Kingdom) | 150,000 | 3,928,980 | |
| Class B (United Kingdom) | 39,863 | 1,046,598 | |
| Statoil ASA | 115,800 | 2,038,230 | |
| Suncor Energy, Inc. | 109,032 | 3,200,485 | |
| Total SA | 122,600 | 6,196,300 | |
| YPF SA Class D sponsored ADR | 33,300 | 670,995 | |
| 44,496,513 | |||
| Oil & Gas Exploration & Production - 12.9% | |||
| Anadarko Petroleum Corp. | 106,600 | 5,624,216 | |
| Apache Corp. | 19,300 | 1,049,920 | |
| Cabot Oil & Gas Corp. | 50,700 | 1,186,380 | |
| Carrizo Oil & Gas, Inc. (a) | 15,500 | 548,235 | |
| Cimarex Energy Co. | 4,600 | 500,848 | |
| CNOOC Ltd. sponsored ADR (b) | 16,700 | 2,061,281 | |
| Cobalt International Energy, Inc. (a) | 284,500 | 918,935 | |
| ConocoPhillips Co. | 67,900 | 3,244,941 | |
| Continental Resources, Inc. (a) | 13,900 | 517,914 | |
| Devon Energy Corp. | 30,200 | 1,047,336 | |
| EOG Resources, Inc. | 29,300 | 2,420,766 | |
| EQT Corp. | 26,601 | 1,864,730 | |
| Hess Corp. | 13,700 | 816,794 | |
| Marathon Oil Corp. | 58,900 | 829,901 | |
| Newfield Exploration Co. (a) | 14,100 | 511,125 | |
| Noble Energy, Inc. | 60,900 | 2,199,099 | |
| NOVATEK OAO GDR (Reg. S) | 11,200 | 1,075,200 | |
| PDC Energy, Inc. (a) | 12,800 | 803,712 | |
| Pioneer Natural Resources Co. | 3,410 | 566,401 | |
| PrairieSky Royalty Ltd. | 91,000 | 1,916,171 | |
| QEP Resources, Inc. | 20,700 | 371,151 | |
| SM Energy Co. | 55,300 | 1,723,148 | |
| Southwestern Energy Co. (a)(b) | 42,100 | 565,403 | |
| Tullow Oil PLC (a) | 148,500 | 606,895 | |
| Whiting Petroleum Corp. (a)(b) | 76,700 | 920,400 | |
| Woodside Petroleum Ltd. | 35,573 | 766,538 | |
| 34,657,440 | |||
| Oil & Gas Storage & Transport - 0.5% | |||
| Teekay LNG Partners LP | 5,400 | 74,196 | |
| Williams Partners LP | 37,900 | 1,145,717 | |
| 1,219,913 | |||
| TOTAL OIL, GAS & CONSUMABLE FUELS | 81,500,399 | ||
| Paper & Forest Products - 4.5% | |||
| Forest Products - 0.6% | |||
| TFS Corp. Ltd. | 632,575 | 750,326 | |
| West Fraser Timber Co. Ltd. | 26,900 | 886,304 | |
| 1,636,630 | |||
| Paper Products - 3.9% | |||
| Empresas CMPC SA | 534,203 | 1,208,006 | |
| Fibria Celulose SA | 198,300 | 1,751,648 | |
| Mondi PLC | 172,100 | 3,289,148 | |
| Oji Holdings Corp. | 174,000 | 714,538 | |
| Stora Enso Oyj (R Shares) (b) | 176,500 | 1,540,012 | |
| UPM-Kymmene Corp. (b) | 103,500 | 1,976,791 | |
| 10,480,143 | |||
| TOTAL PAPER & FOREST PRODUCTS | 12,116,773 | ||
| Real Estate Investment Trusts - 0.7% | |||
| Specialized REITs - 0.7% | |||
| Potlatch Corp. | 52,400 | 1,845,528 | |
| Semiconductors & Semiconductor Equipment - 0.3% | |||
| Semiconductor Equipment - 0.3% | |||
| SolarEdge Technologies, Inc. (a) | 27,400 | 734,046 | |
| TOTAL COMMON STOCKS | |||
| (Cost $331,791,961) | 260,363,917 | ||
| Nonconvertible Preferred Stocks - 1.0% | |||
| Aerospace & Defense - 0.0% | |||
| Aerospace & Defense - 0.0% | |||
| Rolls-Royce Group PLC | 8,542,720 | 12,482 | |
| Metals & Mining - 0.7% | |||
| Steel - 0.7% | |||
| Vale SA (PN-A) sponsored ADR | 449,300 | 2,039,822 | |
| Oil, Gas & Consumable Fuels - 0.3% | |||
| Integrated Oil & Gas - 0.3% | |||
| Petroleo Brasileiro SA - Petrobras (PN) sponsored (non-vtg.) (a) | 123,600 | 729,240 | |
| TOTAL NONCONVERTIBLE PREFERRED STOCKS | |||
| (Cost $5,284,416) | 2,781,544 | ||
| Money Market Funds - 5.3% | |||
| Fidelity Cash Central Fund, 0.38% (d) | 6,967,597 | 6,967,597 | |
| Fidelity Securities Lending Cash Central Fund, 0.42% (d)(e) | 7,338,155 | 7,338,155 | |
| TOTAL MONEY MARKET FUNDS | |||
| (Cost $14,305,752) | 14,305,752 | ||
| TOTAL INVESTMENT PORTFOLIO - 103.2% | |||
| (Cost $351,382,129) | 277,451,213 | ||
| NET OTHER ASSETS (LIABILITIES) - (3.2)% | (8,591,938) | ||
| NET ASSETS - 100% | $268,859,275 |
Legend
(a) Non-income producing
(b) Security or a portion of the security is on loan at period end.
(c) Security or a portion of the security purchased on a delayed delivery or when-issued basis.
(d) Affiliated fund that is generally available only to investment companies and other accounts managed by Fidelity Investments. The rate quoted is the annualized seven-day yield of the fund at period end. A complete unaudited listing of the fund's holdings as of its most recent quarter end is available upon request. In addition, each Fidelity Central Fund's financial statements are available on the SEC's website or upon request.
(e) Investment made with cash collateral received from securities on loan.
Affiliated Central Funds
Information regarding fiscal year to date income earned by the Fund from investments in Fidelity Central Funds is as follows:
| Fund | Income earned |
| Fidelity Cash Central Fund | $4,891 |
| Fidelity Securities Lending Cash Central Fund | 106,267 |
| Total | $111,158 |
Investment Valuation
The following is a summary of the inputs used, as of April 30, 2016, involving the Fund's assets and liabilities carried at fair value. The inputs or methodology used for valuing securities may not be an indication of the risk associated with investing in those securities. For more information on valuation inputs, and their aggregation into the levels used below, please refer to the Investment Valuation section in the accompanying Notes to Financial Statements.
| Valuation Inputs at Reporting Date: | ||||
| Description | Total | Level 1 | Level 2 | Level 3 |
| Investments in Securities: | ||||
| Common Stocks | $260,363,917 | $215,835,216 | $44,528,701 | $-- |
| Nonconvertible Preferred Stocks | 2,781,544 | 2,781,544 | -- | -- |
| Money Market Funds | 14,305,752 | 14,305,752 | -- | -- |
| Total Investments in Securities: | $277,451,213 | $232,922,512 | $44,528,701 | $-- |
The following is a summary of transfers between Level 1 and Level 2 for the period ended April 30, 2016. Transfers are assumed to have occurred at the beginning of the period, and are primarily attributable to the valuation techniques used for foreign equity securities, as discussed in the accompanying Notes to Financial Statements:
| Transfers | Total |
| Level 1 to Level 2 | $0 |
| Level 2 to Level 1 | $14,804,712 |
Other Information
Distribution of investments by country or territory of incorporation, as a percentage of Total Net Assets, is as follows (Unaudited):
| United States of America | 40.3% |
| Canada | 17.3% |
| United Kingdom | 11.9% |
| Switzerland | 4.5% |
| France | 2.3% |
| Brazil | 2.2% |
| Norway | 2.0% |
| Chile | 1.8% |
| Bailiwick of Jersey | 1.8% |
| Japan | 1.8% |
| Russia | 1.4% |
| Finland | 1.3% |
| Netherlands | 1.3% |
| Australia | 1.2% |
| Korea (South) | 1.1% |
| Hong Kong | 1.1% |
| Others (Individually Less Than 1%) | 6.7% |
| 100.0% |
See accompanying notes which are an integral part of the financial statements.
Financial Statements
Statement of Assets and Liabilities
| April 30, 2016 (Unaudited) | ||
| Assets | ||
| Investment in securities, at value (including securities loaned of $7,031,911) — See accompanying schedule: Unaffiliated issuers (cost $337,076,377) | $263,145,461 | |
| Fidelity Central Funds (cost $14,305,752) | 14,305,752 | |
| Total Investments (cost $351,382,129) | $277,451,213 | |
| Foreign currency held at value (cost $26,141) | 26,141 | |
| Receivable for investments sold | 1,128,703 | |
| Receivable for fund shares sold | 1,257,584 | |
| Dividends receivable | 1,107,997 | |
| Distributions receivable from Fidelity Central Funds | 21,225 | |
| Prepaid expenses | 281 | |
| Other receivables | 6,912 | |
| Total assets | 281,000,056 | |
| Liabilities | ||
| Payable to custodian bank | $324 | |
| Payable for investments purchased | ||
| Regular delivery | 3,410,510 | |
| Delayed delivery | 76,258 | |
| Payable for fund shares redeemed | 1,052,362 | |
| Accrued management fee | 142,776 | |
| Distribution and service plan fees payable | 18,314 | |
| Other affiliated payables | 65,802 | |
| Other payables and accrued expenses | 36,280 | |
| Collateral on securities loaned, at value | 7,338,155 | |
| Total liabilities | 12,140,781 | |
| Net Assets | $268,859,275 | |
| Net Assets consist of: | ||
| Paid in capital | $443,643,861 | |
| Undistributed net investment income | 1,567,386 | |
| Accumulated undistributed net realized gain (loss) on investments and foreign currency transactions | (102,409,631) | |
| Net unrealized appreciation (depreciation) on investments and assets and liabilities in foreign currencies | (73,942,341) | |
| Net Assets | $268,859,275 | |
| Calculation of Maximum Offering Price | ||
| Class A: | ||
| Net Asset Value and redemption price per share ($32,034,388 ÷ 3,073,781 shares) | $10.42 | |
| Maximum offering price per share (100/94.25 of $10.42) | $11.06 | |
| Class T: | ||
| Net Asset Value and redemption price per share ($6,177,528 ÷ 592,800 shares) | $10.42 | |
| Maximum offering price per share (100/96.50 of $10.42) | $10.80 | |
| Class B: | ||
| Net Asset Value and offering price per share ($805,040 ÷ 77,326 shares)(a) | $10.41 | |
| Class C: | ||
| Net Asset Value and offering price per share ($11,528,539 ÷ 1,114,551 shares)(a) | $10.34 | |
| Global Commodity Stock: | ||
| Net Asset Value, offering price and redemption price per share ($187,023,903 ÷ 17,915,595 shares) | $10.44 | |
| Class I: | ||
| Net Asset Value, offering price and redemption price per share ($31,289,877 ÷ 2,999,773 shares) | $10.43 |
(a) Redemption price per share is equal to net asset value less any applicable contingent deferred sales charge.
See accompanying notes which are an integral part of the financial statements.
Statement of Operations
| Six months ended April 30, 2016 (Unaudited) | ||
| Investment Income | ||
| Dividends | $3,551,835 | |
| Income from Fidelity Central Funds | 111,158 | |
| Income before foreign taxes withheld | 3,662,993 | |
| Less foreign taxes withheld | (261,962) | |
| Total income | 3,401,031 | |
| Expenses | ||
| Management fee | $741,086 | |
| Transfer agent fees | 311,622 | |
| Distribution and service plan fees | 101,260 | |
| Accounting and security lending fees | 55,708 | |
| Custodian fees and expenses | 29,898 | |
| Independent trustees' compensation | 460 | |
| Registration fees | 75,498 | |
| Audit | 31,910 | |
| Legal | 915 | |
| Miscellaneous | 719 | |
| Total expenses before reductions | 1,349,076 | |
| Expense reductions | (5,501) | 1,343,575 |
| Net investment income (loss) | 2,057,456 | |
| Realized and Unrealized Gain (Loss) | ||
| Net realized gain (loss) on: | ||
| Investment securities: | ||
| Unaffiliated issuers | (32,971,910) | |
| Foreign currency transactions | (34,212) | |
| Total net realized gain (loss) | (33,006,122) | |
| Change in net unrealized appreciation (depreciation) on: Investment securities | 47,992,729 | |
| Assets and liabilities in foreign currencies | 14,367 | |
| Total change in net unrealized appreciation (depreciation) | 48,007,096 | |
| Net gain (loss) | 15,000,974 | |
| Net increase (decrease) in net assets resulting from operations | $17,058,430 |
See accompanying notes which are an integral part of the financial statements.
Statement of Changes in Net Assets
| Six months ended April 30, 2016 (Unaudited) | Year ended October 31, 2015 | |
| Increase (Decrease) in Net Assets | ||
| Operations | ||
| Net investment income (loss) | $2,057,456 | $5,601,197 |
| Net realized gain (loss) | (33,006,122) | (22,741,457) |
| Change in net unrealized appreciation (depreciation) | 48,007,096 | (54,129,193) |
| Net increase (decrease) in net assets resulting from operations | 17,058,430 | (71,269,453) |
| Distributions to shareholders from net investment income | (5,140,876) | (3,898,874) |
| Distributions to shareholders from net realized gain | (224,075) | (629,272) |
| Total distributions | (5,364,951) | (4,528,146) |
| Share transactions - net increase (decrease) | 26,135,446 | (20,805,112) |
| Redemption fees | 5,198 | 7,987 |
| Total increase (decrease) in net assets | 37,834,123 | (96,594,724) |
| Net Assets | ||
| Beginning of period | 231,025,152 | 327,619,876 |
| End of period (including undistributed net investment income of $1,567,386 and undistributed net investment income of $4,650,806, respectively) | $268,859,275 | $231,025,152 |
See accompanying notes which are an integral part of the financial statements.
Financial Highlights — Fidelity Global Commodity Stock Fund Class A
| Six months ended (Unaudited) April 30, | Years ended October 31, | |||||
| 2016 | 2015 | 2014 | 2013 | 2012 | 2011 | |
| Selected Per–Share Data | ||||||
| Net asset value, beginning of period | $10.05 | $13.25 | $14.17 | $14.59 | $15.14 | $15.60 |
| Income from Investment Operations | ||||||
| Net investment income (loss)A | .08 | .22 | .15 | .16 | .11 | .12 |
| Net realized and unrealized gain (loss) | .51 | (3.25) | (.91) | (.45) | (.59) | (.38) |
| Total from investment operations | .59 | (3.03) | (.76) | (.29) | (.48) | (.26) |
| Distributions from net investment income | (.21) | (.14) | (.15) | (.13) | (.05) | (.13) |
| Distributions from net realized gain | (.01) | (.03) | (.01) | – | (.01) | (.06) |
| Total distributions | (.22) | (.17) | (.16) | (.13) | (.07)B | (.20)C |
| Redemption fees added to paid in capitalA,D | – | – | – | – | – | – |
| Net asset value, end of period | $10.42 | $10.05 | $13.25 | $14.17 | $14.59 | $15.14 |
| Total ReturnE,F,G | 6.14% | (23.16)% | (5.41)% | (2.00)% | (3.19)% | (1.80)% |
| Ratios to Average Net AssetsH,I | ||||||
| Expenses before reductions | 1.43%J | 1.34% | 1.35% | 1.36% | 1.34% | 1.32% |
| Expenses net of fee waivers, if any | 1.43%J | 1.34% | 1.35% | 1.35% | 1.34% | 1.32% |
| Expenses net of all reductions | 1.42%J | 1.34% | 1.35% | 1.34% | 1.33% | 1.31% |
| Net investment income (loss) | 1.77%J | 1.85% | 1.05% | 1.12% | .80% | .71% |
| Supplemental Data | ||||||
| Net assets, end of period (000 omitted) | $32,034 | $31,391 | $51,586 | $71,293 | $99,694 | $127,979 |
| Portfolio turnover rateK | 99%J | 77% | 75% | 65% | 91% | 71% |
A Calculated based on average shares outstanding during the period.
B Total distributions of $.07 per share is comprised of distributions from net investment income of $.052 and distributions from net realized gain of $.014 per share.
C Total distributions of $.20 per share is comprised of distributions from net investment income of $.133 and distributions from net realized gain of $.062 per share.
D Amount represents less than $.005 per share.
E Total returns for periods of less than one year are not annualized.
F Total returns would have been lower if certain expenses had not been reduced during the applicable periods shown.
G Total returns do not include the effect of the sales charges.
H Fees and expenses of any underlying Fidelity Central Funds are not included in the Fund's expense ratio. The Fund indirectly bears its proportionate share of the expenses of any underlying Fidelity Central Funds.
I Expense ratios reflect operating expenses of the class. Expenses before reductions do not reflect amounts reimbursed by the investment adviser or reductions from brokerage service arrangements or reductions from other expense offset arrangements and do not represent the amount paid by the class during periods when reimbursements or reductions occur. Expenses net of fee waivers reflect expenses after reimbursement by the investment adviser but prior to reductions from brokerage service arrangements or other expense offset arrangements. Expenses net of all reductions represent the net expenses paid by the class.
J Annualized
K Amount does not include the portfolio activity of any underlying Fidelity Central Funds.
See accompanying notes which are an integral part of the financial statements.
Financial Highlights — Fidelity Global Commodity Stock Fund Class T
| Six months ended (Unaudited) April 30, | Years ended October 31, | |||||
| 2016 | 2015 | 2014 | 2013 | 2012 | 2011 | |
| Selected Per–Share Data | ||||||
| Net asset value, beginning of period | $10.02 | $13.21 | $14.13 | $14.54 | $15.08 | $15.55 |
| Income from Investment Operations | ||||||
| Net investment income (loss)A | .07 | .19 | .11 | .12 | .08 | .07 |
| Net realized and unrealized gain (loss) | .51 | (3.25) | (.90) | (.45) | (.60) | (.38) |
| Total from investment operations | .58 | (3.06) | (.79) | (.33) | (.52) | (.31) |
| Distributions from net investment income | (.17) | (.10) | (.11) | (.08) | (.01) | (.10) |
| Distributions from net realized gain | (.01) | (.03) | (.01) | – | (.01) | (.06) |
| Total distributions | (.18) | (.13) | (.13)B | (.08) | (.02) | (.16) |
| Redemption fees added to paid in capitalA,C | – | – | – | – | – | – |
| Net asset value, end of period | $10.42 | $10.02 | $13.21 | $14.13 | $14.54 | $15.08 |
| Total ReturnD,E,F | 6.03% | (23.40)% | (5.65)% | (2.26)% | (3.43)% | (2.09)% |
| Ratios to Average Net AssetsG,H | ||||||
| Expenses before reductions | 1.70%I | 1.63% | 1.62% | 1.62% | 1.61% | 1.60% |
| Expenses net of fee waivers, if any | 1.70%I | 1.63% | 1.62% | 1.61% | 1.61% | 1.60% |
| Expenses net of all reductions | 1.70%I | 1.62% | 1.62% | 1.60% | 1.60% | 1.59% |
| Net investment income (loss) | 1.50%I | 1.57% | .78% | .86% | .53% | .43% |
| Supplemental Data | ||||||
| Net assets, end of period (000 omitted) | $6,178 | $6,335 | $9,867 | $12,551 | $16,692 | $20,831 |
| Portfolio turnover rateJ | 99%I | 77% | 75% | 65% | 91% | 71% |
A Calculated based on average shares outstanding during the period.
B Total distributions of $.13 per share is comprised of distributions from net investment income of $.113 and distributions from net realized gain of $.013 per share.
C Amount represents less than $.005 per share.
D Total returns for periods of less than one year are not annualized.
E Total returns would have been lower if certain expenses had not been reduced during the applicable periods shown.
F Total returns do not include the effect of the sales charges.
G Fees and expenses of any underlying Fidelity Central Funds are not included in the Fund's expense ratio. The Fund indirectly bears its proportionate share of the expenses of any underlying Fidelity Central Funds.
H Expense ratios reflect operating expenses of the class. Expenses before reductions do not reflect amounts reimbursed by the investment adviser or reductions from brokerage service arrangements or reductions from other expense offset arrangements and do not represent the amount paid by the class during periods when reimbursements or reductions occur. Expenses net of fee waivers reflect expenses after reimbursement by the investment adviser but prior to reductions from brokerage service arrangements or other expense offset arrangements. Expenses net of all reductions represent the net expenses paid by the class.
I Annualized
J Amount does not include the portfolio activity of any underlying Fidelity Central Funds.
See accompanying notes which are an integral part of the financial statements.
Financial Highlights — Fidelity Global Commodity Stock Fund Class B
| Six months ended (Unaudited) April 30, | Years ended October 31, | |||||
| 2016 | 2015 | 2014 | 2013 | 2012 | 2011 | |
| Selected Per–Share Data | ||||||
| Net asset value, beginning of period | $9.97 | $13.12 | $14.01 | $14.41 | $15.00 | $15.46 |
| Income from Investment Operations | ||||||
| Net investment income (loss)A | .05 | .13 | .04 | .05 | –B | (.01) |
| Net realized and unrealized gain (loss) | .51 | (3.24) | (.89) | (.45) | (.59) | (.39) |
| Total from investment operations | .56 | (3.11) | (.85) | (.40) | (.59) | (.40) |
| Distributions from net investment income | (.11) | (.02) | (.03) | –B | – | – |
| Distributions from net realized gain | (.01) | (.03) | (.01) | – | – | (.06) |
| Total distributions | (.12) | (.04)C | (.04) | –B | – | (.06) |
| Redemption fees added to paid in capitalA,B | – | – | – | – | – | – |
| Net asset value, end of period | $10.41 | $9.97 | $13.12 | $14.01 | $14.41 | $15.00 |
| Total ReturnD,E,F | 5.72% | (23.76)% | (6.06)% | (2.75)% | (3.93)% | (2.62)% |
| Ratios to Average Net AssetsG,H | ||||||
| Expenses before reductions | 2.18%I | 2.13% | 2.11% | 2.11% | 2.10% | 2.11% |
| Expenses net of fee waivers, if any | 2.18%I | 2.12% | 2.11% | 2.11% | 2.10% | 2.11% |
| Expenses net of all reductions | 2.17%I | 2.12% | 2.11% | 2.10% | 2.10% | 2.10% |
| Net investment income (loss) | 1.03%I | 1.07% | .29% | .36% | .03% | (.09)% |
| Supplemental Data | ||||||
| Net assets, end of period (000 omitted) | $805 | $864 | $1,584 | $2,303 | $3,097 | $4,324 |
| Portfolio turnover rateJ | 99%I | 77% | 75% | 65% | 91% | 71% |
A Calculated based on average shares outstanding during the period.
B Amount represents less than $.005 per share.
C Total distributions of $.04 per share is comprised of distributions from net investment income of $.016 and distributions from net realized gain of $.026 per share.
D Total returns for periods of less than one year are not annualized.
E Total returns would have been lower if certain expenses had not been reduced during the applicable periods shown.
F Total returns do not include the effect of the contingent deferred sales charge.
G Fees and expenses of any underlying Fidelity Central Funds are not included in the Fund's expense ratio. The Fund indirectly bears its proportionate share of the expenses of any underlying Fidelity Central Funds.
H Expense ratios reflect operating expenses of the class. Expenses before reductions do not reflect amounts reimbursed by the investment adviser or reductions from brokerage service arrangements or reductions from other expense offset arrangements and do not represent the amount paid by the class during periods when reimbursements or reductions occur. Expenses net of fee waivers reflect expenses after reimbursement by the investment adviser but prior to reductions from brokerage service arrangements or other expense offset arrangements. Expenses net of all reductions represent the net expenses paid by the class.
I Annualized
J Amount does not include the portfolio activity of any underlying Fidelity Central Funds.
See accompanying notes which are an integral part of the financial statements.
Financial Highlights — Fidelity Global Commodity Stock Fund Class C
| Six months ended (Unaudited) April 30, | Years ended October 31, | |||||
| 2016 | 2015 | 2014 | 2013 | 2012 | 2011 | |
| Selected Per–Share Data | ||||||
| Net asset value, beginning of period | $9.92 | $13.06 | $13.96 | $14.37 | $14.95 | $15.45 |
| Income from Investment Operations | ||||||
| Net investment income (loss)A | .05 | .13 | .04 | .05 | .01 | (.01) |
| Net realized and unrealized gain (loss) | .50 | (3.22) | (.89) | (.44) | (.59) | (.38) |
| Total from investment operations | .55 | (3.09) | (.85) | (.39) | (.58) | (.39) |
| Distributions from net investment income | (.12) | (.03) | (.03) | (.02) | – | (.05) |
| Distributions from net realized gain | (.01) | (.03) | (.01) | – | – | (.06) |
| Total distributions | (.13) | (.05)B | (.05)C | (.02) | – | (.11) |
| Redemption fees added to paid in capitalA,D | – | – | – | – | – | – |
| Net asset value, end of period | $10.34 | $9.92 | $13.06 | $13.96 | $14.37 | $14.95 |
| Total ReturnE,F,G | 5.70% | (23.74)% | (6.13)% | (2.75)% | (3.88)% | (2.58)% |
| Ratios to Average Net AssetsH,I | ||||||
| Expenses before reductions | 2.18%J | 2.12% | 2.11% | 2.11% | 2.10% | 2.09% |
| Expenses net of fee waivers, if any | 2.18%J | 2.12% | 2.11% | 2.11% | 2.10% | 2.09% |
| Expenses net of all reductions | 2.17%J | 2.11% | 2.11% | 2.10% | 2.09% | 2.08% |
| Net investment income (loss) | 1.02%J | 1.08% | .29% | .36% | .03% | (.07)% |
| Supplemental Data | ||||||
| Net assets, end of period (000 omitted) | $11,529 | $11,274 | $17,659 | $23,830 | $31,865 | $37,185 |
| Portfolio turnover rateK | 99%J | 77% | 75% | 65% | 91% | 71% |
A Calculated based on average shares outstanding during the period.
B Total distributions of $.05 per share is comprised of distributions from net investment income of $.025 and distributions from net realized gain of $.026 per share.
C Total distributions of $.05 per share is comprised of distributions from net investment income of $.033 and distributions from net realized gain of $.013 per share.
D Amount represents less than $.005 per share.
E Total returns for periods of less than one year are not annualized.
F Total returns would have been lower if certain expenses had not been reduced during the applicable periods shown.
G Total returns do not include the effect of the contingent deferred sales charge.
H Fees and expenses of any underlying Fidelity Central Funds are not included in the Fund's expense ratio. The Fund indirectly bears its proportionate share of the expenses of any underlying Fidelity Central Funds.
I Expense ratios reflect operating expenses of the class. Expenses before reductions do not reflect amounts reimbursed by the investment adviser or reductions from brokerage service arrangements or reductions from other expense offset arrangements and do not represent the amount paid by the class during periods when reimbursements or reductions occur. Expenses net of fee waivers reflect expenses after reimbursement by the investment adviser but prior to reductions from brokerage service arrangements or other expense offset arrangements. Expenses net of all reductions represent the net expenses paid by the class.
J Annualized
K Amount does not include the portfolio activity of any underlying Fidelity Central Funds.
See accompanying notes which are an integral part of the financial statements.
Financial Highlights — Fidelity Global Commodity Stock Fund
| Six months ended (Unaudited) April 30, | Years ended October 31, | |||||
| 2016 | 2015 | 2014 | 2013 | 2012 | 2011 | |
| Selected Per–Share Data | ||||||
| Net asset value, beginning of period | $10.09 | $13.31 | $14.24 | $14.66 | $15.21 | $15.66 |
| Income from Investment Operations | ||||||
| Net investment income (loss)A | .09 | .25 | .19 | .19 | .15 | .16 |
| Net realized and unrealized gain (loss) | .51 | (3.27) | (.92) | (.45) | (.60) | (.39) |
| Total from investment operations | .60 | (3.02) | (.73) | (.26) | (.45) | (.23) |
| Distributions from net investment income | (.24) | (.18) | (.19) | (.16) | (.08) | (.16) |
| Distributions from net realized gain | (.01) | (.03) | (.01) | – | (.01) | (.06) |
| Total distributions | (.25) | (.20)B | (.20) | (.16) | (.10)C | (.22) |
| Redemption fees added to paid in capitalA,D | – | – | – | – | – | – |
| Net asset value, end of period | $10.44 | $10.09 | $13.31 | $14.24 | $14.66 | $15.21 |
| Total ReturnE,F | 6.26% | (22.97)% | (5.16)% | (1.75)% | (2.96)% | (1.59)% |
| Ratios to Average Net AssetsG,H | ||||||
| Expenses before reductions | 1.18%I | 1.12% | 1.11% | 1.11% | 1.10% | 1.08% |
| Expenses net of fee waivers, if any | 1.18%I | 1.12% | 1.11% | 1.11% | 1.10% | 1.08% |
| Expenses net of all reductions | 1.17%I | 1.11% | 1.11% | 1.09% | 1.09% | 1.07% |
| Net investment income (loss) | 2.03%I | 2.08% | 1.29% | 1.37% | 1.04% | .95% |
| Supplemental Data | ||||||
| Net assets, end of period (000 omitted) | $187,024 | $156,320 | $223,084 | $273,476 | $387,242 | $531,224 |
| Portfolio turnover rateJ | 99%I | 77% | 75% | 65% | 91% | 71% |
A Calculated based on average shares outstanding during the period.
B Total distributions of $.20 per share is comprised of distributions from net investment income of $.178 and distributions from net realized gain of $.026 per share.
C Total distributions of $.10 per share is comprised of distributions from net investment income of $.084 and distributions from net realized gain of $.014 per share.
D Amount represents less than $.005 per share.
E Total returns for periods of less than one year are not annualized.
F Total returns would have been lower if certain expenses had not been reduced during the applicable periods shown.
G Fees and expenses of any underlying Fidelity Central Funds are not included in the Fund's expense ratio. The Fund indirectly bears its proportionate share of the expenses of any underlying Fidelity Central Funds.
H Expense ratios reflect operating expenses of the class. Expenses before reductions do not reflect amounts reimbursed by the investment adviser or reductions from brokerage service arrangements or reductions from other expense offset arrangements and do not represent the amount paid by the class during periods when reimbursements or reductions occur. Expenses net of fee waivers reflect expenses after reimbursement by the investment adviser but prior to reductions from brokerage service arrangements or other expense offset arrangements. Expenses net of all reductions represent the net expenses paid by the class.
I Annualized
J Amount does not include the portfolio activity of any underlying Fidelity Central Funds.
See accompanying notes which are an integral part of the financial statements.
Financial Highlights — Fidelity Global Commodity Stock Fund Class I
| Six months ended (Unaudited) April 30, | Years ended October 31, | |||||
| 2016 | 2015 | 2014 | 2013 | 2012 | 2011 | |
| Selected Per–Share Data | ||||||
| Net asset value, beginning of period | $10.09 | $13.31 | $14.24 | $14.67 | $15.22 | $15.66 |
| Income from Investment Operations | ||||||
| Net investment income (loss)A | .09 | .25 | .19 | .20 | .16 | .16 |
| Net realized and unrealized gain (loss) | .51 | (3.26) | (.92) | (.45) | (.60) | (.38) |
| Total from investment operations | .60 | (3.01) | (.73) | (.25) | (.44) | (.22) |
| Distributions from net investment income | (.25) | (.19) | (.19) | (.18) | (.09) | (.16) |
| Distributions from net realized gain | (.01) | (.03) | (.01) | – | (.01) | (.06) |
| Total distributions | (.26) | (.21)B | (.20) | (.18) | (.11)C | (.22) |
| Redemption fees added to paid in capitalA,D | – | – | – | – | – | – |
| Net asset value, end of period | $10.43 | $10.09 | $13.31 | $14.24 | $14.67 | $15.22 |
| Total ReturnE,F | 6.27% | (22.93)% | (5.16)% | (1.71)% | (2.90)% | (1.50)% |
| Ratios to Average Net AssetsG,H | ||||||
| Expenses before reductions | 1.14%I | 1.09% | 1.06% | 1.04% | 1.04% | 1.03% |
| Expenses net of fee waivers, if any | 1.14%I | 1.08% | 1.06% | 1.04% | 1.04% | 1.03% |
| Expenses net of all reductions | 1.13%I | 1.08% | 1.06% | 1.03% | 1.03% | 1.03% |
| Net investment income (loss) | 2.07%I | 2.11% | 1.34% | 1.43% | 1.10% | .99% |
| Supplemental Data | ||||||
| Net assets, end of period (000 omitted) | $31,290 | $24,841 | $23,840 | $31,613 | $50,540 | $58,925 |
| Portfolio turnover rateJ | 99%I | 77% | 75% | 65% | 91% | 71% |
A Calculated based on average shares outstanding during the period.
B Total distributions of $.21 per share is comprised of distributions from net investment income of $.186 and distributions from net realized gain of $.026 per share.
C Total distributions of $.11 per share is comprised of distributions from net investment income of $.093 and distributions from net realized gain of $.014 per share.
D Amount represents less than $.005 per share.
E Total returns for periods of less than one year are not annualized.
F Total returns would have been lower if certain expenses had not been reduced during the applicable periods shown.
G Fees and expenses of any underlying Fidelity Central Funds are not included in the Fund's expense ratio. The Fund indirectly bears its proportionate share of the expenses of any underlying Fidelity Central Funds.
H Expense ratios reflect operating expenses of the class. Expenses before reductions do not reflect amounts reimbursed by the investment adviser or reductions from brokerage service arrangements or reductions from other expense offset arrangements and do not represent the amount paid by the class during periods when reimbursements or reductions occur. Expenses net of fee waivers reflect expenses after reimbursement by the investment adviser but prior to reductions from brokerage service arrangements or other expense offset arrangements. Expenses net of all reductions represent the net expenses paid by the class.
I Annualized
J Amount does not include the portfolio activity of any underlying Fidelity Central Funds.
See accompanying notes which are an integral part of the financial statements.
Notes to Financial Statements (Unaudited)
For the period ended April 30, 2016
1. Organization.
Fidelity Global Commodity Stock Fund (the Fund) is a non-diversified fund of Fidelity Investment Trust (the Trust) and is authorized to issue an unlimited number of shares. The Trust is registered under the Investment Company Act of 1940, as amended (the 1940 Act), as an open-end management investment company organized as a Massachusetts business trust. The Fund offers Class A, Class T, Class C, Global Commodity Stock and Class I shares, each of which, along with Class B shares, has equal rights as to assets and voting privileges. Class B shares are closed to new accounts and additional purchases, except for exchanges and reinvestments. Each class has exclusive voting rights with respect to matters that affect that class. Class B shares will automatically convert to Class A shares after a maximum holding period of seven years from the initial date of purchase. The Fund's investments in emerging markets can be subject to social, economic, regulatory, and political uncertainties and can be extremely volatile.
During the period, the Board of Trustees approved the conversion of all existing Class B shares into Class A shares, effective on or about July 1, 2016, regardless of the length of times shares have been held.
2. Investments in Fidelity Central Funds.
The Fund invests in Fidelity Central Funds, which are open-end investment companies generally available only to other investment companies and accounts managed by the investment adviser and its affiliates. The Fund's Schedule of Investments lists each of the Fidelity Central Funds held as of period end, if any, as an investment of the Fund, but does not include the underlying holdings of each Fidelity Central Fund. As an Investing Fund, the Fund indirectly bears its proportionate share of the expenses of the underlying Fidelity Central Funds.
The Money Market Central Funds seek preservation of capital and current income and are managed by Fidelity Investments Money Management, Inc. (FIMM), an affiliate of the investment adviser. Annualized expenses of the Money Market Central Funds as of their most recent shareholder report date are less than .005%.
A complete unaudited list of holdings for each Fidelity Central Fund is available upon request or at the Securities and Exchange Commission (the SEC) website at www.sec.gov. In addition, the financial statements of the Fidelity Central Funds are available on the SEC website or upon request.
3. Significant Accounting Policies.
The financial statements have been prepared in conformity with accounting principles generally accepted in the United States of America (GAAP), which require management to make certain estimates and assumptions at the date of the financial statements. Actual results could differ from those estimates. Subsequent events, if any, through the date that the financial statements were issued have been evaluated in the preparation of the financial statements. The following summarizes the significant accounting policies of the Fund:
Investment Valuation. Investments are valued as of 4:00 p.m. Eastern time on the last calendar day of the period. The Board of Trustees (the Board) has delegated the day to day responsibility for the valuation of the Fund's investments to the Fidelity Management & Research Company (FMR) Fair Value Committee (the Committee). In accordance with valuation policies and procedures approved by the Board, the Fund attempts to obtain prices from one or more third party pricing vendors or brokers to value its investments. When current market prices, quotations or currency exchange rates are not readily available or reliable, investments will be fair valued in good faith by the Committee, in accordance with procedures adopted by the Board. Factors used in determining fair value vary by investment type and may include market or investment specific events. The frequency with which these procedures are used cannot be predicted and they may be utilized to a significant extent. The Committee oversees the Fund's valuation policies and procedures and reports to the Board on the Committee's activities and fair value determinations. The Board monitors the appropriateness of the procedures used in valuing the Fund's investments and ratifies the fair value determinations of the Committee.
The Fund categorizes the inputs to valuation techniques used to value its investments into a disclosure hierarchy consisting of three levels as shown below:
- Level 1 – quoted prices in active markets for identical investments
- Level 2 – other significant observable inputs (including quoted prices for similar investments, interest rates, prepayment speeds, etc.)
- Level 3 – unobservable inputs (including the Fund's own assumptions based on the best information available)
Valuation techniques used to value the Fund's investments by major category are as follows:
Equity securities, including restricted securities, for which market quotations are readily available, are valued at the last reported sale price or official closing price as reported by a third party pricing vendor on the primary market or exchange on which they are traded and are categorized as Level 1 in the hierarchy. In the event there were no sales during the day or closing prices are not available, securities are valued at the last quoted bid price or may be valued using the last available price and are generally categorized as Level 2 in the hierarchy. For foreign equity securities, when market or security specific events arise, comparisons to the valuation of American Depositary Receipts (ADRs), futures contracts, Exchange-Traded Funds (ETFs) and certain indexes as well as quoted prices for similar securities may be used and would be categorized as Level 2 in the hierarchy. Utilizing these techniques may result in transfers between Level 1 and Level 2. For equity securities, including restricted securities, where observable inputs are limited, assumptions about market activity and risk are used and these securities may be categorized as Level 3 in the hierarchy.
Investments in open-end mutual funds, including the Fidelity Central Funds, are valued at their closing net asset value (NAV) each business day and are categorized as Level 1 in the hierarchy.
Changes in valuation techniques may result in transfers in or out of an assigned level within the disclosure hierarchy. The aggregate value of investments by input level as of April 30, 2016, including information on transfers between Levels 1 and 2, is included at the end of the Fund's Schedule of Investments.
Foreign Currency. The Fund may use foreign currency contracts to facilitate transactions in foreign-denominated securities. Gains and losses from these transactions may arise from changes in the value of the foreign currency or if the counterparties do not perform under the contracts' terms.
Foreign-denominated assets, including investment securities, and liabilities are translated into U.S. dollars at the exchange rates at period end. Purchases and sales of investment securities, income and dividends received and expenses denominated in foreign currencies are translated into U.S. dollars at the exchange rate in effect on the transaction date.
The effects of exchange rate fluctuations on investments are included with the net realized and unrealized gain (loss) on investment securities. Other foreign currency transactions resulting in realized and unrealized gain (loss) are disclosed separately.
Investment Transactions and Income. For financial reporting purposes, the Fund's investment holdings and NAV include trades executed through the end of the last business day of the period. The NAV per share for processing shareholder transactions is calculated as of the close of business of the New York Stock Exchange (NYSE), normally 4:00 p.m. Eastern time and includes trades executed through the end of the prior business day. Gains and losses on securities sold are determined on the basis of identified cost and may include proceeds received from litigation. Dividend income is recorded on the ex-dividend date, except for certain dividends from foreign securities where the ex-dividend date may have passed, which are recorded as soon as the Fund is informed of the ex-dividend date. Non-cash dividends included in dividend income, if any, are recorded at the fair market value of the securities received. Income and capital gain distributions from Fidelity Central Funds, if any, are recorded on the ex-dividend date. Distributions received on securities that represent a return of capital or capital gain are recorded as a reduction of cost of investments and/or as a realized gain. Subsequent to ex-dividend date the Fund determines the components of these distributions, based upon receipt of tax filings or other correspondence relating to the underlying investment. Investment income is recorded net of foreign taxes withheld where recovery of such taxes is uncertain.
Class Allocations and Expenses. Investment income, realized and unrealized capital gains and losses, common expenses of the Fund, and certain fund-level expense reductions, if any, are allocated daily on a pro-rata basis to each class based on the relative net assets of each class to the total net assets of the Fund. Each class differs with respect to transfer agent and distribution and service plan fees incurred. Certain expense reductions may also differ by class. For the reporting period, the allocated portion of income and expenses to each class as a percent of its average net assets may vary due to the timing of recording these transactions in relation to fluctuating net assets of the classes. Expenses directly attributable to a fund are charged to that fund. Expenses attributable to more than one fund are allocated among the respective funds on the basis of relative net assets or other appropriate methods. Expense estimates are accrued in the period to which they relate and adjustments are made when actual amounts are known.
Income Tax Information and Distributions to Shareholders. Each year, the Fund intends to qualify as a regulated investment company under Subchapter M of the Internal Revenue Code, including distributing substantially all of its taxable income and realized gains. As a result, no provision for U.S. Federal income taxes is required. The Fund files a U.S. federal tax return, in addition to state and local tax returns as required. The Fund's federal income tax returns are subject to examination by the Internal Revenue Service (IRS) for a period of three fiscal years after they are filed. State and local tax returns may be subject to examination for an additional fiscal year depending on the jurisdiction. Foreign taxes are provided for based on the Fund's understanding of the tax rules and rates that exist in the foreign markets in which it invests.
Distributions are declared and recorded on the ex-dividend date. Income dividends and capital gain distributions are declared separately for each class. Income and capital gain distributions are determined in accordance with income tax regulations, which may differ from GAAP.
Capital accounts within the financial statements are adjusted for permanent book-tax differences. These adjustments have no impact on net assets or the results of operations. Capital accounts are not adjusted for temporary book-tax differences which will reverse in a subsequent period.
Book-tax differences are primarily due to foreign currency transactions, passive foreign investment companies (PFIC), partnerships, capital loss carryforwards and losses deferred due to wash sales.
The federal tax cost of investment securities and unrealized appreciation (depreciation) as of period end were as follows:
| Gross unrealized appreciation | $14,424,349 |
| Gross unrealized depreciation | (93,694,823) |
| Net unrealized appreciation (depreciation) on securities | $(79,270,474) |
| Tax cost | $356,721,687 |
Capital loss carryforwards are only available to offset future capital gains of the Fund to the extent provided by regulations and may be limited. Under the Regulated Investment Company Modernization Act of 2010 (the Act), the Fund is permitted to carry forward capital losses incurred in taxable years beginning after December 22, 2010 for an unlimited period and such capital losses are required to be used prior to any losses that expire. The capital loss carryforward information presented below, including any applicable limitation, is estimated as of prior fiscal period end and is subject to adjustment.
| Fiscal year of expiration | |
| 2019 | $(6,952,413) |
| No expiration | |
| Short-term | (17,522,131) |
| Long-term | (40,298,374) |
| Total no expiration | (57,820,505) |
| Total capital loss carryforward | $(64,772,918) |
Short-Term Trading (Redemption) Fees. Shares held by investors in the Fund less than 30 days may have been subject to a redemption fee equal to 1.00% of the NAV of shares redeemed. All redemption fees, which reduce the proceeds of the shareholder redemption, are retained by the Fund and accounted for as an addition to paid in capital.
Delayed Delivery Transactions and When-Issued Securities. During the period, the Fund transacted in securities on a delayed delivery or when-issued basis. Payment and delivery may take place after the customary settlement period for that security. The price of the underlying securities and the date when the securities will be delivered and paid for are fixed at the time the transaction is negotiated. The securities purchased on a delayed delivery or when-issued basis are identified as such in the Fund's Schedule of Investments. With respect to purchase commitments, the Fund identifies securities as segregated in its records with a value at least equal to the amount of the commitment. Losses may arise due to changes in the value of the underlying securities or if the counterparty does not perform under the contract's terms, or if the issuer does not issue the securities due to political, economic, or other factors.
4. Purchases and Sales of Investments.
Purchases and sales of securities, other than short-term securities, aggregated $124,970,983 and $107,482,256, respectively.
5. Fees and Other Transactions with Affiliates.
Management Fee. Fidelity Management & Research Company (the investment adviser) and its affiliates provide the Fund with investment management related services for which the Fund pays a monthly management fee. The management fee is the sum of an individual fund fee rate that is based on an annual rate of .45% of the Fund's average net assets and an annualized group fee rate that averaged .25% during the period. The group fee rate is based upon the average net assets of all the mutual funds advised by the investment adviser, including any mutual funds previously advised by the investment adviser that are currently advised by Fidelity SelectCo, LLC, an affiliate of the investment adviser. The group fee rate decreases as assets under management increase and increases as assets under management decrease. For the reporting period, the total annualized management fee rate was .70% of the Fund's average net assets.
Distribution and Service Plan Fees. In accordance with Rule 12b-1 of the 1940 Act, the Fund has adopted separate Distribution and Service Plans for each class of shares. Certain classes pay Fidelity Distributors Corporation (FDC), an affiliate of the investment adviser, separate Distribution and Service Fees, each of which is based on an annual percentage of each class' average net assets. In addition, FDC may pay financial intermediaries for selling shares of the Fund and providing shareholder support services. For the period, the Distribution and Service Fee rates, total fees and amounts retained by FDC were as follows:
| Distribution Fee | Service Fee | Total Fees | Retained by FDC | |
| Class A | -% | .25% | $34,521 | $– |
| Class T | .25% | .25% | 13,584 | – |
| Class B | .75% | .25% | 3,615 | 2,711 |
| Class C | .75% | .25% | 49,540 | 6,624 |
| $101,260 | $9,335 |
Sales Load. FDC may receive a front-end sales charge of up to 5.75% for selling Class A shares and 3.50% for selling Class T shares, some of which is paid to financial intermediaries for selling shares of the Fund. Depending on the holding period, FDC may receive contingent deferred sales charges levied on Class A, Class T, Class B, and Class C redemptions. The deferred sales charges range from 5.00% to 1.00% for Class B shares, 1.00% for Class C shares, 1.00% for certain purchases of Class A shares and .25% for certain purchases of Class T shares.
For the period, sales charge amounts retained by FDC were as follows:
| Retained by FDC | |
| Class A | $10,807 |
| Class T | 1,023 |
| Class B(a) | 350 |
| Class C(a) | 334 |
| $12,514 |
(a) When Class B and Class C shares are initially sold, FDC pays commissions from its own resources to financial intermediaries through which the sales are made.
Transfer Agent Fees. Fidelity Investments Institutional Operations Company, Inc., (FIIOC), an affiliate of the investment adviser, is the transfer, dividend disbursing and shareholder servicing agent for each class of the Fund. FIIOC receives account fees and asset-based fees that vary according to the account size and type of account of the shareholders of the respective classes of the Fund. FIIOC pays for typesetting, printing and mailing of shareholder reports, except proxy statements.
For the period, transfer agent fees for each class were as follows:
| Amount | % of Class-Level Average Net Assets(a) | |
| Class A | $41,634 | .30 |
| Class T | 8,788 | .32 |
| Class B | 1,083 | .30 |
| Class C | 14,985 | .30 |
| Global Commodity Stock | 214,868 | .30 |
| Class I | 30,264 | .26 |
| $ 311,622 |
(a) Annualized
Accounting and Security Lending Fees. Fidelity Service Company, Inc. (FSC), an affiliate of the investment adviser, maintains the Fund's accounting records. The accounting fee is based on the level of average net assets for each month. Under a separate contract, FSC administers the security lending program. The security lending fee is based on the number and duration of lending transactions.
Brokerage Commissions. The Fund placed a portion of its portfolio transactions with brokerage firms which are affiliates of the investment adviser. Brokerage commissions are included in net realized gain (loss) and change in net unrealized appreciation (depreciation) in the Statement of Operations. The commissions paid to these affiliated firms were $4,386 for the period.
Interfund Trades. The Fund may purchase from or sell securities to other Fidelity Funds under procedures adopted by the Board. The procedures have been designed to ensure these interfund trades are executed in accordance with Rule 17a-7 of the 1940 Act. Interfund trades are included within the respective purchases and sales amounts shown in the Purchases and Sales of Investments note.
6. Committed Line of Credit.
The Fund participates with other funds managed by the investment adviser or an affiliate in a $4.25 billion credit facility (the "line of credit") to be utilized for temporary or emergency purposes to fund shareholder redemptions or for other short-term liquidity purposes. The Fund has agreed to pay commitment fees on its pro-rata portion of the line of credit, which amounted to $180 and is reflected in Miscellaneous expenses on the Statement of Operations. During the period, the Fund did not borrow on this line of credit.
7. Security Lending.
The Fund lends portfolio securities through a lending agent from time to time in order to earn additional income. For equity securities, a lending agent is used and may loan securities to certain qualified borrowers, including Fidelity Capital Markets (FCM), a broker-dealer affiliated with the Fund. On the settlement date of the loan, the Fund receives collateral (in the form of U.S. Treasury obligations, letters of credit and/or cash) against the loaned securities and maintains collateral in an amount not less than 100% of the market value of the loaned securities during the period of the loan. The market value of the loaned securities is determined at the close of business of the Fund and any additional required collateral is delivered to the Fund on the next business day. The Fund or borrower may terminate the loan at any time, and if the borrower defaults on its obligation to return the securities loaned because of insolvency or other reasons, the Fund may apply collateral received from the borrower against the obligation. The Fund may experience delays and costs in recovering the securities loaned. Any cash collateral received is invested in the Fidelity Securities Lending Cash Central Fund. The value of loaned securities and cash collateral at period end are disclosed on the Fund's Statement of Assets and Liabilities. Security lending income represents the income earned on investing cash collateral, less rebates paid to borrowers and any lending agent fees associated with the loan, plus any premium payments received for lending certain types of securities. Security lending income is presented in the Statement of Operations as a component of income from Fidelity Central Funds. Total security lending income during the period amounted to $106,267. During the period, there were no securities loaned to FCM.
8. Expense Reductions.
Commissions paid to certain brokers with whom the investment adviser, or its affiliates, places trades on behalf of the Fund include an amount in addition to trade execution, which may be rebated back to the Fund to offset certain expenses. This amount totaled $4,774 for the period.
In addition, during the period the investment adviser reimbursed and/or waived a portion of fund-level operating expenses in the amount of $727.
9. Distributions to Shareholders.
Distributions to shareholders of each class were as follows:
| Six months ended April 30, 2016 | Year ended October 31, 2015 | |
| From net investment income | ||
| Class A | $638,599 | $520,699 |
| Class T | 103,956 | 72,766 |
| Class B | 8,861 | 1,871 |
| Class C | 133,173 | 32,755 |
| Global Commodity Stock | 3,642,366 | 2,937,401 |
| Class I | 613,921 | 333,382 |
| Total | $5,140,876 | $3,898,874 |
| From net realized gain | ||
| Class A | $30,410 | $97,397 |
| Class T | 6,044 | 19,110 |
| Class B | 836 | 3,040 |
| Class C | 11,098 | 34,065 |
| Global Commodity Stock | 151,130 | 429,058 |
| Class I | 24,557 | 46,602 |
| Total | $224,075 | $629,272 |
10. Share Transactions.
Share transactions for each class were as follows and may contain automatic conversions between classes or exchanges between affiliated funds:
| Shares | Shares | Dollars | Dollars | |
| Six months ended April 30, 2016 | Year ended October 31, 2015 | Six months ended April 30, 2016 | Year ended October 31, 2015 | |
| Class A | ||||
| Shares sold | 429,562 | 526,290 | $3,833,800 | $6,210,169 |
| Reinvestment of distributions | 70,559 | 46,881 | 655,495 | 594,452 |
| Shares redeemed | (549,813) | (1,342,823) | (4,931,070) | (16,036,860) |
| Net increase (decrease) | (49,692) | (769,652) | $(441,775) | $(9,232,239) |
| Class T | ||||
| Shares sold | 60,531 | 79,898 | $540,227 | $963,935 |
| Reinvestment of distributions | 11,521 | 7,092 | 107,030 | 89,851 |
| Shares redeemed | (111,329) | (201,781) | (1,011,230) | (2,371,414) |
| Net increase (decrease) | (39,277) | (114,791) | $(363,973) | $(1,317,628) |
| Class B | ||||
| Shares sold | 2,904 | 580 | $29,575 | $7,071 |
| Reinvestment of distributions | 982 | 371 | 9,133 | 4,698 |
| Shares redeemed | (13,281) | (35,007) | (118,751) | (422,886) |
| Net increase (decrease) | (9,395) | (34,056) | $(80,043) | $(411,117) |
| Class C | ||||
| Shares sold | 147,205 | 206,447 | $1,336,468 | $2,471,711 |
| Reinvestment of distributions | 14,787 | 4,962 | 136,635 | 62,526 |
| Shares redeemed | (184,114) | (426,784) | (1,670,395) | (5,161,590) |
| Net increase (decrease) | (22,122) | (215,375) | $(197,292) | $(2,627,353) |
| Global Commodity Stock | ||||
| Shares sold | 4,803,019 | 4,004,137 | $43,836,205 | $47,467,615 |
| Reinvestment of distributions | 376,092 | 238,065 | 3,493,876 | 3,023,431 |
| Shares redeemed | (2,761,293) | (5,506,523) | (25,223,516) | (65,599,040) |
| Net increase (decrease) | 2,417,818 | (1,264,321) | $22,106,565 | $(15,107,994) |
| Class I | ||||
| Shares sold | 1,846,997 | 1,576,324 | $16,610,772 | $18,219,363 |
| Reinvestment of distributions | 60,388 | 24,972 | 560,405 | 316,895 |
| Shares redeemed | (1,370,427) | (929,289) | (12,059,213) | (10,645,039) |
| Net increase (decrease) | 536,958 | 672,007 | $5,111,964 | $7,891,219 |
11. Other.
The Fund's organizational documents provide former and current trustees and officers with a limited indemnification against liabilities arising in connection with the performance of their duties to the Fund. In the normal course of business, the Fund may also enter into contracts that provide general indemnifications. The Fund's maximum exposure under these arrangements is unknown as this would be dependent on future claims that may be made against the Fund. The risk of material loss from such claims is considered remote.
At the end of the period, the investment adviser or its affiliates were the owner of record of 20% of the outstanding shares of the Fund.
Shareholder Expense Example
As a shareholder of the Fund, you incur two types of costs: (1) transaction costs, including sales charges (loads) on purchase payments or redemption proceeds, redemption fees and (2) ongoing costs, including management fees, distribution and/or service (12b-1) fees and other Fund expenses. This Example is intended to help you understand your ongoing costs (in dollars) of investing in the Fund and to compare these costs with the ongoing costs of investing in other mutual funds.
The Example is based on an investment of $1,000 invested at the beginning of the period and held for the entire period (November 1, 2015 to April 30, 2016).
Actual Expenses
The first line of the accompanying table for each class of the Fund provides information about actual account values and actual expenses. You may use the information in this line, together with the amount you invested, to estimate the expenses that you paid over the period. Simply divide your account value by $1,000.00 (for example, an $8,600 account value divided by $1,000.00 = 8.6), then multiply the result by the number in the first line for a class of the Fund under the heading entitled "Expenses Paid During Period" to estimate the expenses you paid on your account during this period. A small balance maintenance fee of $12.00 that is charged once a year may apply for certain accounts with a value of less than $2,000. This fee is not included in the table below. If it was, the estimate of expenses you paid during the period would be higher, and your ending account value lower, by this amount. In addition, the Fund, as a shareholder in the underlying Fidelity Central Funds, will indirectly bear its pro-rata share of the fees and expenses incurred by the underlying Fidelity Central Funds. These fees and expenses are not included in the Fund's annualized expense ratio used to calculate the expense estimate in the table below.
Hypothetical Example for Comparison Purposes
The second line of the accompanying table for each class of the Fund provides information about hypothetical account values and hypothetical expenses based on a Class' actual expense ratio and an assumed rate of return of 5% per year before expenses, which is not the Class' actual return. The hypothetical account values and expenses may not be used to estimate the actual ending account balance or expenses you paid for the period. You may use this information to compare the ongoing costs of investing in the Fund and other funds. To do so, compare this 5% hypothetical example with the 5% hypothetical examples that appear in the shareholder reports of the other funds. A small balance maintenance fee of $12.00 that is charged once a year may apply for certain accounts with a value of less than $2,000. This fee is not included in the table below. If it was, the estimate of expenses you paid during the period would be higher, and your ending account value lower, by this amount. In addition, the Fund, as a shareholder in the underlying Fidelity Central Funds, will indirectly bear its pro-rata share of the fees and expenses incurred by the underlying Fidelity Central Funds. These fees and expenses are not included in the Fund's annualized expense ratio used to calculate the expense estimate in the table below.
Please note that the expenses shown in the table are meant to highlight your ongoing costs only and do not reflect any transaction costs. Therefore, the second line of the table is useful in comparing ongoing costs only, and will not help you determine the relative total costs of owning different funds. In addition, if these transactional costs were included, your costs would have been higher.
| Annualized Expense Ratio-A | Beginning Account Value November 1, 2015 | Ending Account Value April 30, 2016 | Expenses Paid During Period-B November 1, 2015 to April 30, 2016 | |
| Class A | 1.43% | |||
| Actual | $1,000.00 | $1,061.40 | $7.33 | |
| Hypothetical-C | $1,000.00 | $1,017.75 | $7.17 | |
| Class T | 1.70% | |||
| Actual | $1,000.00 | $1,060.30 | $8.71 | |
| Hypothetical-C | $1,000.00 | $1,016.41 | $8.52 | |
| Class B | 2.18% | |||
| Actual | $1,000.00 | $1,057.20 | $11.15 | |
| Hypothetical-C | $1,000.00 | $1,014.02 | $10.92 | |
| Class C | 2.18% | |||
| Actual | $1,000.00 | $1,057.00 | $11.15 | |
| Hypothetical-C | $1,000.00 | $1,014.02 | $10.92 | |
| Global Commodity Stock | 1.18% | |||
| Actual | $1,000.00 | $1,062.60 | $6.05 | |
| Hypothetical-C | $1,000.00 | $1,019.00 | $5.92 | |
| Class I | 1.14% | |||
| Actual | $1,000.00 | $1,062.70 | $5.85 | |
| Hypothetical-C | $1,000.00 | $1,019.19 | $5.72 |
A Annualized expense ratio reflects expenses net of applicable fee waivers.
B Expenses are equal to each Class' annualized expense ratio, multiplied by the average account value over the period, multiplied by 182/366 (to reflect the one-half year period).
C 5% return per year before expenses
![]()
AGCSI-SANN-0616
1.879392.107
Fidelity® International Growth Fund Semi-Annual Report April 30, 2016 |
|
Contents
To view a fund's proxy voting guidelines and proxy voting record for the 12-month period ended June 30, visit http://www.fidelity.com/proxyvotingresults or visit the Securities and Exchange Commission's (SEC) web site at http://www.sec.gov.
You may also call 1-800-544-8544 to request a free copy of the proxy voting guidelines.
Standard & Poor's, S&P and S&P 500 are registered service marks of The McGraw-Hill Companies, Inc. and have been licensed for use by Fidelity Distributors Corporation.
Other third-party marks appearing herein are the property of their respective owners.
All other marks appearing herein are registered or unregistered trademarks or service marks of FMR LLC or an affiliated company. © 2016 FMR LLC. All rights reserved.
This report and the financial statements contained herein are submitted for the general information of the shareholders of the Fund. This report is not authorized for distribution to prospective investors in the Fund unless preceded or accompanied by an effective prospectus.
A fund files its complete schedule of portfolio holdings with the SEC for the first and third quarters of each fiscal year on Form N-Q. Forms N-Q are available on the SEC’s web site at http://www.sec.gov. A fund's Forms N-Q may be reviewed and copied at the SEC’s Public Reference Room in Washington, DC. Information regarding the operation of the SEC's Public Reference Room may be obtained by calling 1-800-SEC-0330.
For a complete list of a fund's portfolio holdings, view the most recent holdings listing, semiannual report, or annual report on Fidelity's web site at http://www.fidelity.com, http://www.advisor.fidelity.com, or http://www.401k.com, as applicable.
NOT FDIC INSURED •MAY LOSE VALUE •NO BANK GUARANTEE
Neither the Fund nor Fidelity Distributors Corporation is a bank.
Investment Summary (Unaudited)
Geographic Diversification (% of fund's net assets)
| As of April 30, 2016 | ||
| United States of America* | 20.8% | |
| Japan | 14.1% | |
| United Kingdom | 13.2% | |
| Switzerland | 12.7% | |
| Spain | 4.9% | |
| Belgium | 4.5% | |
| Sweden | 4.4% | |
| Australia | 4.0% | |
| Denmark | 3.3% | |
| Other | 18.1% | |

* Includes Short-Term investments and Net Other Assets (Liabilities).
Percentages are based on country or territory of incorporation and are adjusted for the effect of futures contracts, if applicable.
| As of October 31, 2015 | ||
| United States of America* | 17.7% | |
| United Kingdom | 14.4% | |
| Japan | 14.0% | |
| Switzerland | 13.6% | |
| Sweden | 6.1% | |
| Spain | 4.5% | |
| Belgium | 4.2% | |
| Australia | 3.4% | |
| Denmark | 3.3% | |
| Other | 18.8% | |

* Includes Short-Term investments and Net Other Assets (Liabilities).
Percentages are based on country or territory of incorporation and are adjusted for the effect of futures contracts, if applicable.
Asset Allocation as of April 30, 2016
| % of fund's net assets | % of fund's net assets 6 months ago | |
| Stocks | 97.3 | 97.7 |
| Short-Term Investments and Net Other Assets (Liabilities) | 2.7 | 2.3 |
Top Ten Stocks as of April 30, 2016
| % of fund's net assets | % of fund's net assets 6 months ago | |
| Nestle SA (Switzerland, Food Products) | 4.9 | 3.0 |
| Roche Holding AG (participation certificate) (Switzerland, Pharmaceuticals) | 3.5 | 3.6 |
| Anheuser-Busch InBev SA NV (Belgium, Beverages) | 3.5 | 2.6 |
| Reckitt Benckiser Group PLC (United Kingdom, Household Products) | 3.2 | 2.8 |
| CSL Ltd. (Australia, Biotechnology) | 2.9 | 2.2 |
| Novartis AG (Switzerland, Pharmaceuticals) | 2.9 | 3.7 |
| Novo Nordisk A/S Series B sponsored ADR (Denmark, Pharmaceuticals) | 2.8 | 2.5 |
| Inditex SA (Spain, Specialty Retail) | 2.6 | 2.8 |
| ASSA ABLOY AB (B Shares) (Sweden, Building Products) | 2.6 | 2.2 |
| InterContinental Hotel Group PLC ADR (United Kingdom, Hotels, Restaurants & Leisure) | 2.3 | 2.0 |
| 31.2 |
Market Sectors as of April 30, 2016
| % of fund's net assets | % of fund's net assets 6 months ago | |
| Consumer Staples | 20.4 | 15.3 |
| Health Care | 19.0 | 18.5 |
| Information Technology | 14.2 | 11.7 |
| Financials | 13.5 | 18.1 |
| Consumer Discretionary | 13.3 | 15.1 |
| Industrials | 11.5 | 12.5 |
| Materials | 4.7 | 6.0 |
| Energy | 0.4 | 0.3 |
| Telecommunication Services | 0.3 | 0.2 |
Investments April 30, 2016 (Unaudited)
Showing Percentage of Net Assets
| Common Stocks - 97.3% | |||
| Shares | Value | ||
| Australia - 4.0% | |||
| CSL Ltd. | 609,912 | $48,776,866 | |
| Sydney Airport unit | 1,123,380 | 5,816,843 | |
| Transurban Group unit | 1,422,746 | 12,527,069 | |
| TOTAL AUSTRALIA | 67,120,778 | ||
| Austria - 1.2% | |||
| Andritz AG | 351,321 | 19,675,520 | |
| Belgium - 4.5% | |||
| Anheuser-Busch InBev SA NV | 469,291 | 58,088,795 | |
| KBC Groep NV | 302,468 | 16,981,098 | |
| TOTAL BELGIUM | 75,069,893 | ||
| Canada - 0.4% | |||
| Pason Systems, Inc. | 495,200 | 7,198,891 | |
| Cayman Islands - 0.9% | |||
| 58.com, Inc. ADR (a) | 128,870 | 7,042,746 | |
| Alibaba Group Holding Ltd. sponsored ADR (a) | 99,200 | 7,632,448 | |
| TOTAL CAYMAN ISLANDS | 14,675,194 | ||
| Denmark - 3.3% | |||
| Jyske Bank A/S (Reg.) | 202,800 | 8,302,703 | |
| Novo Nordisk A/S Series B sponsored ADR (b) | 826,700 | 46,121,593 | |
| TOTAL DENMARK | 54,424,296 | ||
| Finland - 0.3% | |||
| Tikkurila Oyj | 283,000 | 4,961,192 | |
| France - 1.1% | |||
| Essilor International SA | 135,658 | 17,560,644 | |
| Germany - 3.0% | |||
| Bayer AG | 155,100 | 17,892,923 | |
| SAP AG | 399,516 | 31,346,444 | |
| TOTAL GERMANY | 49,239,367 | ||
| Hong Kong - 1.9% | |||
| AIA Group Ltd. | 5,289,400 | 31,654,975 | |
| India - 0.5% | |||
| Housing Development Finance Corp. Ltd. | 562,904 | 9,223,760 | |
| Ireland - 3.1% | |||
| CRH PLC sponsored ADR | 909,066 | 26,462,911 | |
| James Hardie Industries PLC: | |||
| CDI | 1,130,041 | 15,921,470 | |
| sponsored ADR | 601,500 | 8,433,030 | |
| TOTAL IRELAND | 50,817,411 | ||
| Isle of Man - 0.5% | |||
| Playtech Ltd. | 654,346 | 7,691,806 | |
| Israel - 0.3% | |||
| Azrieli Group | 118,800 | 4,718,361 | |
| Italy - 0.7% | |||
| Azimut Holding SpA | 204,600 | 5,149,414 | |
| Interpump Group SpA | 511,426 | 7,361,097 | |
| TOTAL ITALY | 12,510,511 | ||
| Japan - 14.1% | |||
| Astellas Pharma, Inc. | 2,477,400 | 33,401,778 | |
| Coca-Cola Central Japan Co. Ltd. | 190,700 | 3,493,796 | |
| DENSO Corp. | 727,400 | 27,649,326 | |
| East Japan Railway Co. | 184,100 | 16,196,396 | |
| Hoya Corp. | 336,900 | 12,901,342 | |
| Japan Tobacco, Inc. | 589,000 | 24,065,326 | |
| Keyence Corp. | 40,062 | 24,012,883 | |
| Mitsui Fudosan Co. Ltd. | 836,000 | 20,417,154 | |
| Nintendo Co. Ltd. | 61,000 | 8,259,462 | |
| Olympus Corp. | 281,300 | 10,958,499 | |
| OSG Corp. | 344,800 | 6,407,632 | |
| Seven Bank Ltd. | 2,658,200 | 11,295,245 | |
| Shinsei Bank Ltd. | 5,146,000 | 7,212,512 | |
| SHO-BOND Holdings Co. Ltd. | 182,600 | 7,900,949 | |
| USS Co. Ltd. | 1,301,100 | 20,581,249 | |
| TOTAL JAPAN | 234,753,549 | ||
| Kenya - 0.3% | |||
| Safaricom Ltd. | 30,975,500 | 5,244,367 | |
| Korea (South) - 0.9% | |||
| BGFretail Co. Ltd. | 54,496 | 8,847,410 | |
| NAVER Corp. | 9,215 | 5,445,310 | |
| TOTAL KOREA (SOUTH) | 14,292,720 | ||
| Mexico - 0.6% | |||
| Fomento Economico Mexicano S.A.B. de CV sponsored ADR | 106,355 | 9,913,350 | |
| South Africa - 1.3% | |||
| Clicks Group Ltd. | 755,618 | 5,518,807 | |
| Naspers Ltd. Class N | 112,300 | 15,408,694 | |
| TOTAL SOUTH AFRICA | 20,927,501 | ||
| Spain - 4.9% | |||
| Amadeus IT Holding SA Class A | 514,500 | 23,411,956 | |
| Hispania Activos Inmobiliarios SA (a) | 215,259 | 3,154,974 | |
| Inditex SA | 1,361,301 | 43,699,772 | |
| Merlin Properties Socimi SA | 378,500 | 4,399,024 | |
| Prosegur Compania de Seguridad SA (Reg.) | 1,127,849 | 6,521,790 | |
| TOTAL SPAIN | 81,187,516 | ||
| Sweden - 4.4% | |||
| ASSA ABLOY AB (B Shares) (b) | 2,033,083 | 42,634,121 | |
| Fagerhult AB | 409,153 | 9,527,687 | |
| Intrum Justitia AB (b) | 112,700 | 4,044,623 | |
| Svenska Handelsbanken AB (A Shares) (b) | 1,313,920 | 17,527,894 | |
| TOTAL SWEDEN | 73,734,325 | ||
| Switzerland - 12.7% | |||
| Nestle SA | 1,091,098 | 81,439,212 | |
| Novartis AG | 625,183 | 47,577,841 | |
| Roche Holding AG (participation certificate) | 232,368 | 58,791,248 | |
| Schindler Holding AG: | |||
| (participation certificate) | 107,226 | 19,527,137 | |
| (Reg.) | 18,350 | 3,372,360 | |
| TOTAL SWITZERLAND | 210,707,798 | ||
| Taiwan - 1.1% | |||
| Taiwan Semiconductor Manufacturing Co. Ltd. | 3,934,000 | 18,046,275 | |
| United Kingdom - 13.2% | |||
| Associated British Foods PLC | 413,100 | 18,494,337 | |
| Babcock International Group PLC | 400,384 | 5,543,075 | |
| BAE Systems PLC | 1,722,200 | 12,015,201 | |
| Berendsen PLC | 707,573 | 12,199,669 | |
| Howden Joinery Group PLC | 626,100 | 4,519,241 | |
| Informa PLC | 1,396,912 | 13,358,986 | |
| InterContinental Hotel Group PLC ADR (b) | 968,696 | 38,883,457 | |
| Lloyds Banking Group PLC | 7,613,300 | 7,472,538 | |
| Prudential PLC | 1,155,443 | 22,807,906 | |
| Reckitt Benckiser Group PLC | 542,845 | 52,883,360 | |
| Rightmove PLC | 77,900 | 4,391,314 | |
| SABMiller PLC | 292,366 | 17,877,926 | |
| Shaftesbury PLC | 319,433 | 4,247,330 | |
| Unite Group PLC | 476,676 | 4,405,332 | |
| TOTAL UNITED KINGDOM | 219,099,672 | ||
| United States of America - 18.1% | |||
| Alphabet, Inc. Class A | 29,136 | 20,624,792 | |
| Autoliv, Inc. (b) | 198,769 | 24,343,239 | |
| Berkshire Hathaway, Inc. Class B (a) | 129,184 | 18,793,688 | |
| China Biologic Products, Inc. (a) | 87,966 | 10,292,022 | |
| Domino's Pizza, Inc. | 82,990 | 10,031,831 | |
| Martin Marietta Materials, Inc. | 66,400 | 11,236,872 | |
| MasterCard, Inc. Class A | 351,000 | 34,043,490 | |
| McGraw Hill Financial, Inc. | 117,100 | 12,512,135 | |
| Mohawk Industries, Inc. (a) | 117,400 | 22,614,762 | |
| Molson Coors Brewing Co. Class B | 108,600 | 10,385,418 | |
| Moody's Corp. | 94,100 | 9,007,252 | |
| MSCI, Inc. Class A | 103,200 | 7,837,008 | |
| Philip Morris International, Inc. | 210,708 | 20,674,669 | |
| PriceSmart, Inc. | 95,700 | 8,281,878 | |
| ResMed, Inc. | 170,700 | 9,525,060 | |
| Reynolds American, Inc. | 363,200 | 18,014,720 | |
| Sherwin-Williams Co. | 32,600 | 9,366,306 | |
| SS&C Technologies Holdings, Inc. | 178,400 | 10,909,160 | |
| Visa, Inc. Class A | 424,260 | 32,769,842 | |
| TOTAL UNITED STATES OF AMERICA | 301,264,144 | ||
| TOTAL COMMON STOCKS | |||
| (Cost $1,493,495,241) | 1,615,713,816 | ||
| Money Market Funds - 8.3% | |||
| Fidelity Cash Central Fund, 0.38% (c) | 31,871,334 | 31,871,334 | |
| Fidelity Securities Lending Cash Central Fund, 0.42% (c)(d) | 106,690,874 | 106,690,874 | |
| TOTAL MONEY MARKET FUNDS | |||
| (Cost $138,562,208) | 138,562,208 | ||
| TOTAL INVESTMENT PORTFOLIO - 105.6% | |||
| (Cost $1,632,057,449) | 1,754,276,024 | ||
| NET OTHER ASSETS (LIABILITIES) - (5.6)% | (93,656,005) | ||
| NET ASSETS - 100% | $1,660,620,019 |
Categorizations in the Schedule of Investments are based on country or territory of incorporation.
Legend
(a) Non-income producing
(b) Security or a portion of the security is on loan at period end.
(c) Affiliated fund that is generally available only to investment companies and other accounts managed by Fidelity Investments. The rate quoted is the annualized seven-day yield of the fund at period end. A complete unaudited listing of the fund's holdings as of its most recent quarter end is available upon request. In addition, each Fidelity Central Fund's financial statements are available on the SEC's website or upon request.
(d) Investment made with cash collateral received from securities on loan.
Affiliated Central Funds
Information regarding fiscal year to date income earned by the Fund from investments in Fidelity Central Funds is as follows:
| Fund | Income earned |
| Fidelity Cash Central Fund | $72,393 |
| Fidelity Securities Lending Cash Central Fund | 330,325 |
| Total | $402,718 |
Investment Valuation
The following is a summary of the inputs used, as of April 30, 2016, involving the Fund's assets and liabilities carried at fair value. The inputs or methodology used for valuing securities may not be an indication of the risk associated with investing in those securities. For more information on valuation inputs, and their aggregation into the levels used below, please refer to the Investment Valuation section in the accompanying Notes to Financial Statements.
| Valuation Inputs at Reporting Date: | ||||
| Description | Total | Level 1 | Level 2 | Level 3 |
| Investments in Securities: | ||||
| Equities: | ||||
| Consumer Discretionary | $221,090,557 | $172,859,982 | $48,230,575 | $-- |
| Consumer Staples | 337,979,004 | 176,097,310 | 161,881,694 | -- |
| Energy | 7,198,891 | 7,198,891 | -- | -- |
| Financials | 227,120,303 | 108,732,079 | 118,388,224 | -- |
| Health Care | 313,799,816 | 150,169,108 | 163,630,708 | -- |
| Industrials | 191,271,169 | 148,750,991 | 42,520,178 | -- |
| Information Technology | 235,627,928 | 153,962,864 | 81,665,064 | -- |
| Materials | 76,381,781 | 76,381,781 | -- | -- |
| Telecommunication Services | 5,244,367 | 5,244,367 | -- | -- |
| Money Market Funds | 138,562,208 | 138,562,208 | -- | -- |
| Total Investments in Securities: | $1,754,276,024 | $1,137,959,581 | $616,316,443 | $-- |
The following is a summary of transfers between Level 1 and Level 2 for the period ended April 30, 2016. Transfers are assumed to have occurred at the beginning of the period, and are primarily attributable to the valuation techniques used for foreign equity securities, as discussed in the accompanying Notes to Financial Statements:
| Transfers | Total |
| Level 1 to Level 2 | $0 |
| Level 2 to Level 1 | $144,428,405 |
See accompanying notes which are an integral part of the financial statements.
Financial Statements
Statement of Assets and Liabilities
| April 30, 2016 (Unaudited) | ||
| Assets | ||
| Investment in securities, at value (including securities loaned of $103,770,133) — See accompanying schedule: Unaffiliated issuers (cost $1,493,495,241) | $1,615,713,816 | |
| Fidelity Central Funds (cost $138,562,208) | 138,562,208 | |
| Total Investments (cost $1,632,057,449) | $1,754,276,024 | |
| Foreign currency held at value (cost $11,880) | 11,898 | |
| Receivable for investments sold | 3,654,551 | |
| Receivable for fund shares sold | 4,651,062 | |
| Dividends receivable | 9,823,503 | |
| Distributions receivable from Fidelity Central Funds | 94,556 | |
| Prepaid expenses | 599 | |
| Other receivables | 7,870 | |
| Total assets | 1,772,520,063 | |
| Liabilities | ||
| Payable for investments purchased | $1,891,035 | |
| Payable for fund shares redeemed | 1,836,507 | |
| Accrued management fee | 985,763 | |
| Distribution and service plan fees payable | 103,976 | |
| Other affiliated payables | 304,114 | |
| Other payables and accrued expenses | 87,775 | |
| Collateral on securities loaned, at value | 106,690,874 | |
| Total liabilities | 111,900,044 | |
| Net Assets | $1,660,620,019 | |
| Net Assets consist of: | ||
| Paid in capital | $1,599,467,631 | |
| Undistributed net investment income | 11,086,000 | |
| Accumulated undistributed net realized gain (loss) on investments and foreign currency transactions | (72,316,667) | |
| Net unrealized appreciation (depreciation) on investments and assets and liabilities in foreign currencies | 122,383,055 | |
| Net Assets | $1,660,620,019 | |
| Calculation of Maximum Offering Price | ||
| Class A: | ||
| Net Asset Value and redemption price per share ($227,299,900 ÷ 20,745,349 shares) | $10.96 | |
| Maximum offering price per share (100/94.25 of $10.96) | $11.63 | |
| Class T: | ||
| Net Asset Value and redemption price per share ($28,247,384 ÷ 2,581,799 shares) | $10.94 | |
| Maximum offering price per share (100/96.50 of $10.94) | $11.34 | |
| Class B: | ||
| Net Asset Value and offering price per share ($543,488 ÷ 50,206 shares)(a) | $10.83 | |
| Class C: | ||
| Net Asset Value and offering price per share ($54,803,250 ÷ 5,077,799 shares)(a) | $10.79 | |
| International Growth: | ||
| Net Asset Value, offering price and redemption price per share ($989,531,658 ÷ 89,694,739 shares) | $11.03 | |
| Class I: | ||
| Net Asset Value, offering price and redemption price per share ($344,685,048 ÷ 31,300,215 shares) | $11.01 | |
| Class Z: | ||
| Net Asset Value, offering price and redemption price per share ($15,509,291 ÷ 1,406,850 shares) | $11.02 |
(a) Redemption price per share is equal to net asset value less any applicable contingent deferred sales charge.
See accompanying notes which are an integral part of the financial statements.
Statement of Operations
| Six months ended April 30, 2016 (Unaudited) | ||
| Investment Income | ||
| Dividends | $21,128,805 | |
| Income from Fidelity Central Funds | 402,718 | |
| Income before foreign taxes withheld | 21,531,523 | |
| Less foreign taxes withheld | (2,212,929) | |
| Total income | 19,318,594 | |
| Expenses | ||
| Management fee | ||
| Basic fee | $5,303,523 | |
| Performance adjustment | 109,270 | |
| Transfer agent fees | 1,418,766 | |
| Distribution and service plan fees | 585,143 | |
| Accounting and security lending fees | 345,576 | |
| Custodian fees and expenses | 79,671 | |
| Independent trustees' compensation | 3,216 | |
| Registration fees | 88,683 | |
| Audit | 42,540 | |
| Legal | 2,186 | |
| Miscellaneous | 4,732 | |
| Total expenses before reductions | 7,983,306 | |
| Expense reductions | (16,973) | 7,966,333 |
| Net investment income (loss) | 11,352,261 | |
| Realized and Unrealized Gain (Loss) | ||
| Net realized gain (loss) on: | ||
| Investment securities: | ||
| Unaffiliated issuers | (34,889,540) | |
| Foreign currency transactions | 296,655 | |
| Total net realized gain (loss) | (34,592,885) | |
| Change in net unrealized appreciation (depreciation) on: Investment securities (net of decrease in deferred foreign taxes of $4,737) | (7,895,661) | |
| Assets and liabilities in foreign currencies | 94,033 | |
| Total change in net unrealized appreciation (depreciation) | (7,801,628) | |
| Net gain (loss) | (42,394,513) | |
| Net increase (decrease) in net assets resulting from operations | $(31,042,252) |
See accompanying notes which are an integral part of the financial statements.
Statement of Changes in Net Assets
| Six months ended April 30, 2016 (Unaudited) | Year ended October 31, 2015 | |
| Increase (Decrease) in Net Assets | ||
| Operations | ||
| Net investment income (loss) | $11,352,261 | $10,205,219 |
| Net realized gain (loss) | (34,592,885) | (27,463,177) |
| Change in net unrealized appreciation (depreciation) | (7,801,628) | 41,450,250 |
| Net increase (decrease) in net assets resulting from operations | (31,042,252) | 24,192,292 |
| Distributions to shareholders from net investment income | (9,313,522) | (7,019,924) |
| Distributions to shareholders from net realized gain | (1,062,119) | – |
| Total distributions | (10,375,641) | (7,019,924) |
| Share transactions - net increase (decrease) | 228,113,558 | 519,861,476 |
| Redemption fees | 45,309 | 54,094 |
| Total increase (decrease) in net assets | 186,740,974 | 537,087,938 |
| Net Assets | ||
| Beginning of period | 1,473,879,045 | 936,791,107 |
| End of period (including undistributed net investment income of $11,086,000 and undistributed net investment income of $9,047,261, respectively) | $1,660,620,019 | $1,473,879,045 |
See accompanying notes which are an integral part of the financial statements.
Financial Highlights — Fidelity International Growth Fund Class A
| Six months ended (Unaudited) April 30, | Years ended October 31, | |||||
| 2016 | 2015 | 2014 | 2013 | 2012 | 2011 | |
| Selected Per–Share Data | ||||||
| Net asset value, beginning of period | $11.30 | $11.01 | $10.78 | $8.91 | $8.09 | $8.38 |
| Income from Investment Operations | ||||||
| Net investment income (loss)A | .07 | .07 | .09 | .08 | .08 | .08 |
| Net realized and unrealized gain (loss) | (.35) | .28 | .18 | 1.88 | .81 | (.31) |
| Total from investment operations | (.28) | .35 | .27 | 1.96 | .89 | (.23) |
| Distributions from net investment income | (.05) | (.06) | (.03) | (.08) | (.06) | (.05) |
| Distributions from net realized gain | (.01) | – | (.01) | (.01) | (.01) | (.01) |
| Total distributions | (.06) | (.06) | (.04) | (.09) | (.07) | (.06) |
| Redemption fees added to paid in capitalA,B | – | – | – | – | – | – |
| Net asset value, end of period | $10.96 | $11.30 | $11.01 | $10.78 | $8.91 | $8.09 |
| Total ReturnC,D,E | (2.51)% | 3.20% | 2.54% | 22.18% | 11.10% | (2.76)% |
| Ratios to Average Net AssetsF,G | ||||||
| Expenses before reductions | 1.26%H | 1.26% | 1.35% | 1.44% | 1.58% | 1.77% |
| Expenses net of fee waivers, if any | 1.26%H | 1.26% | 1.35% | 1.43% | 1.45% | 1.45% |
| Expenses net of all reductions | 1.26%H | 1.25% | 1.34% | 1.42% | 1.44% | 1.43% |
| Net investment income (loss) | 1.29%H | .66% | .84% | .80% | .99% | .92% |
| Supplemental Data | ||||||
| Net assets, end of period (000 omitted) | $227,300 | $184,878 | $119,017 | $74,595 | $21,874 | $6,352 |
| Portfolio turnover rateI | 35%H | 26% | 27% | 32% | 32% | 68% |
A Calculated based on average shares outstanding during the period.
B Amount represents less than $.005 per share.
C Total returns for periods of less than one year are not annualized.
D Total returns would have been lower if certain expenses had not been reduced during the applicable periods shown.
E Total returns do not include the effect of the sales charges.
F Fees and expenses of any underlying Fidelity Central Funds are not included in the Fund's expense ratio. The Fund indirectly bears its proportionate share of the expenses of any underlying Fidelity Central Funds.
G Expense ratios reflect operating expenses of the class. Expenses before reductions do not reflect amounts reimbursed by the investment adviser or reductions from brokerage service arrangements or reductions from other expense offset arrangements and do not represent the amount paid by the class during periods when reimbursements or reductions occur. Expenses net of fee waivers reflect expenses after reimbursement by the investment adviser but prior to reductions from brokerage service arrangements or other expense offset arrangements. Expenses net of all reductions represent the net expenses paid by the class.
H Annualized
I Amount does not include the portfolio activity of any underlying Fidelity Central Funds.
See accompanying notes which are an integral part of the financial statements.
Financial Highlights — Fidelity International Growth Fund Class T
| Six months ended (Unaudited) April 30, | Years ended October 31, | |||||
| 2016 | 2015 | 2014 | 2013 | 2012 | 2011 | |
| Selected Per–Share Data | ||||||
| Net asset value, beginning of period | $11.26 | $10.96 | $10.75 | $8.89 | $8.08 | $8.38 |
| Income from Investment Operations | ||||||
| Net investment income (loss)A | .05 | .04 | .06 | .05 | .06 | .06 |
| Net realized and unrealized gain (loss) | (.35) | .27 | .18 | 1.88 | .81 | (.31) |
| Total from investment operations | (.30) | .31 | .24 | 1.93 | .87 | (.25) |
| Distributions from net investment income | (.01) | (.01) | (.02) | (.07) | (.05) | (.04) |
| Distributions from net realized gain | (.01) | – | (.01) | (.01) | (.01) | (.01) |
| Total distributions | (.02) | (.01) | (.03) | (.07)B | (.06) | (.05) |
| Redemption fees added to paid in capitalA,C | – | – | – | – | – | – |
| Net asset value, end of period | $10.94 | $11.26 | $10.96 | $10.75 | $8.89 | $8.08 |
| Total ReturnD,E,F | (2.69)% | 2.85% | 2.21% | 21.91% | 10.82% | (3.03)% |
| Ratios to Average Net AssetsG,H | ||||||
| Expenses before reductions | 1.60%I | 1.58% | 1.65% | 1.69% | 1.85% | 2.03% |
| Expenses net of fee waivers, if any | 1.60%I | 1.58% | 1.65% | 1.69% | 1.70% | 1.70% |
| Expenses net of all reductions | 1.60%I | 1.58% | 1.65% | 1.68% | 1.69% | 1.68% |
| Net investment income (loss) | .95%I | .33% | .53% | .54% | .74% | .67% |
| Supplemental Data | ||||||
| Net assets, end of period (000 omitted) | $28,247 | $28,833 | $26,369 | $23,118 | $10,690 | $2,917 |
| Portfolio turnover rateJ | 35%I | 26% | 27% | 32% | 32% | 68% |
A Calculated based on average shares outstanding during the period.
B Total distributions of $0.07 per share is comprised of distributions from net investment income of $0.69 and distributions from net realized gain of $0.005 per share.
C Amount represents less than $.005 per share.
D Total returns for periods of less than one year are not annualized.
E Total returns would have been lower if certain expenses had not been reduced during the applicable periods shown.
F Total returns do not include the effect of the sales charges.
G Fees and expenses of any underlying Fidelity Central Funds are not included in the Fund's expense ratio. The Fund indirectly bears its proportionate share of the expenses of any underlying Fidelity Central Funds.
H Expense ratios reflect operating expenses of the class. Expenses before reductions do not reflect amounts reimbursed by the investment adviser or reductions from brokerage service arrangements or reductions from other expense offset arrangements and do not represent the amount paid by the class during periods when reimbursements or reductions occur. Expenses net of fee waivers reflect expenses after reimbursement by the investment adviser but prior to reductions from brokerage service arrangements or other expense offset arrangements. Expenses net of all reductions represent the net expenses paid by the class.
I Annualized
J Amount does not include the portfolio activity of any underlying Fidelity Central Funds.
See accompanying notes which are an integral part of the financial statements.
Financial Highlights — Fidelity International Growth Fund Class B
| Six months ended (Unaudited) April 30, | Years ended October 31, | |||||
| 2016 | 2015 | 2014 | 2013 | 2012 | 2011 | |
| Selected Per–Share Data | ||||||
| Net asset value, beginning of period | $11.16 | $10.91 | $10.73 | $8.88 | $8.06 | $8.36 |
| Income from Investment Operations | ||||||
| Net investment income (loss)A | .02 | (.02) | –B | –B | .02 | .01 |
| Net realized and unrealized gain (loss) | (.34) | .27 | .19 | 1.89 | .80 | (.30) |
| Total from investment operations | (.32) | .25 | .19 | 1.89 | .82 | (.29) |
| Distributions from net investment income | – | – | – | (.03) | – | (.01) |
| Distributions from net realized gain | (.01) | – | (.01) | (.01) | – | –B |
| Total distributions | (.01) | – | (.01) | (.04) | – | (.01) |
| Redemption fees added to paid in capitalA,B | – | – | – | – | – | – |
| Net asset value, end of period | $10.83 | $11.16 | $10.91 | $10.73 | $8.88 | $8.06 |
| Total ReturnC,D,E | (2.89)% | 2.29% | 1.76% | 21.35% | 10.17% | (3.47)% |
| Ratios to Average Net AssetsF,G | ||||||
| Expenses before reductions | 2.09%H | 2.07% | 2.14% | 2.19% | 2.35% | 2.55% |
| Expenses net of fee waivers, if any | 2.09%H | 2.07% | 2.14% | 2.18% | 2.20% | 2.20% |
| Expenses net of all reductions | 2.09%H | 2.06% | 2.14% | 2.17% | 2.19% | 2.18% |
| Net investment income (loss) | .45%H | (.15)% | .04% | .05% | .24% | .17% |
| Supplemental Data | ||||||
| Net assets, end of period (000 omitted) | $543 | $800 | $1,404 | $1,579 | $1,116 | $473 |
| Portfolio turnover rateI | 35%H | 26% | 27% | 32% | 32% | 68% |
A Calculated based on average shares outstanding during the period.
B Amount represents less than $.005 per share.
C Total returns for periods of less than one year are not annualized.
D Total returns would have been lower if certain expenses had not been reduced during the applicable periods shown.
E Total returns do not include the effect of the contingent deferred sales charge.
F Fees and expenses of any underlying Fidelity Central Funds are not included in the Fund's expense ratio. The Fund indirectly bears its proportionate share of the expenses of any underlying Fidelity Central Funds.
G Expense ratios reflect operating expenses of the class. Expenses before reductions do not reflect amounts reimbursed by the investment adviser or reductions from brokerage service arrangements or reductions from other expense offset arrangements and do not represent the amount paid by the class during periods when reimbursements or reductions occur. Expenses net of fee waivers reflect expenses after reimbursement by the investment adviser but prior to reductions from brokerage service arrangements or other expense offset arrangements. Expenses net of all reductions represent the net expenses paid by the class.
H Annualized
I Amount does not include the portfolio activity of any underlying Fidelity Central Funds.
See accompanying notes which are an integral part of the financial statements.
Financial Highlights — Fidelity International Growth Fund Class C
| Six months ended (Unaudited) April 30, | Years ended October 31, | |||||
| 2016 | 2015 | 2014 | 2013 | 2012 | 2011 | |
| Selected Per–Share Data | ||||||
| Net asset value, beginning of period | $11.12 | $10.87 | $10.69 | $8.84 | $8.03 | $8.34 |
| Income from Investment Operations | ||||||
| Net investment income (loss)A | .03 | (.02) | .01 | .01 | .02 | .01 |
| Net realized and unrealized gain (loss) | (.35) | .27 | .18 | 1.87 | .80 | (.31) |
| Total from investment operations | (.32) | .25 | .19 | 1.88 | .82 | (.30) |
| Distributions from net investment income | – | – | – | (.02) | (.01) | (.01) |
| Distributions from net realized gain | (.01) | – | (.01) | (.01) | (.01) | (.01) |
| Total distributions | (.01) | – | (.01) | (.03) | (.01)B | (.01)C |
| Redemption fees added to paid in capitalA,D | – | – | – | – | – | – |
| Net asset value, end of period | $10.79 | $11.12 | $10.87 | $10.69 | $8.84 | $8.03 |
| Total ReturnE,F,G | (2.90)% | 2.30% | 1.77% | 21.29% | 10.27% | (3.57)% |
| Ratios to Average Net AssetsH,I | ||||||
| Expenses before reductions | 2.05%J | 2.06% | 2.12% | 2.19% | 2.33% | 2.52% |
| Expenses net of fee waivers, if any | 2.05%J | 2.06% | 2.12% | 2.18% | 2.20% | 2.20% |
| Expenses net of all reductions | 2.05%J | 2.05% | 2.12% | 2.17% | 2.19% | 2.18% |
| Net investment income (loss) | .49%J | (.15)% | .06% | .05% | .24% | .17% |
| Supplemental Data | ||||||
| Net assets, end of period (000 omitted) | $54,803 | $52,378 | $32,737 | $17,196 | $5,648 | $2,767 |
| Portfolio turnover rateK | 35%J | 26% | 27% | 32% | 32% | 68% |
A Calculated based on average shares outstanding during the period.
B Total distributions of $.01 per share is comprised of distributions from net investment income of $.007 and distributions from net realized gain of $.006 per share.
C Total distributions of $.01 per share is comprised of distributions from net investment income of $.008 and distributions from net realized gain of $.005 per share.
D Amount represents less than $.005 per share.
E Total returns for periods of less than one year are not annualized.
F Total returns would have been lower if certain expenses had not been reduced during the applicable periods shown.
G Total returns do not include the effect of the contingent deferred sales charge.
H Fees and expenses of any underlying Fidelity Central Funds are not included in the Fund's expense ratio. The Fund indirectly bears its proportionate share of the expenses of any underlying Fidelity Central Funds.
I Expense ratios reflect operating expenses of the class. Expenses before reductions do not reflect amounts reimbursed by the investment adviser or reductions from brokerage service arrangements or reductions from other expense offset arrangements and do not represent the amount paid by the class during periods when reimbursements or reductions occur. Expenses net of fee waivers reflect expenses after reimbursement by the investment adviser but prior to reductions from brokerage service arrangements or other expense offset arrangements. Expenses net of all reductions represent the net expenses paid by the class.
J Annualized
K Amount does not include the portfolio activity of any underlying Fidelity Central Funds.
See accompanying notes which are an integral part of the financial statements.
Financial Highlights — Fidelity International Growth Fund
| Six months ended (Unaudited) April 30, | Years ended October 31, | |||||
| 2016 | 2015 | 2014 | 2013 | 2012 | 2011 | |
| Selected Per–Share Data | ||||||
| Net asset value, beginning of period | $11.38 | $11.10 | $10.84 | $8.95 | $8.12 | $8.40 |
| Income from Investment Operations | ||||||
| Net investment income (loss)A | .09 | .11 | .13 | .11 | .11 | .10 |
| Net realized and unrealized gain (loss) | (.35) | .26 | .19 | 1.88 | .81 | (.30) |
| Total from investment operations | (.26) | .37 | .32 | 1.99 | .92 | (.20) |
| Distributions from net investment income | (.08) | (.09) | (.05) | (.10) | (.08) | (.07) |
| Distributions from net realized gain | (.01) | – | (.01) | (.01) | (.01) | (.01) |
| Total distributions | (.09) | (.09) | (.06) | (.10)B | (.09) | (.08) |
| Redemption fees added to paid in capitalA,C | – | – | – | – | – | – |
| Net asset value, end of period | $11.03 | $11.38 | $11.10 | $10.84 | $8.95 | $8.12 |
| Total ReturnD,E | (2.34)% | 3.36% | 2.96% | 22.48% | 11.41% | (2.47)% |
| Ratios to Average Net AssetsF,G | ||||||
| Expenses before reductions | .96%H | .97% | 1.04% | 1.13% | 1.28% | 1.52% |
| Expenses net of fee waivers, if any | .96%H | .97% | 1.04% | 1.13% | 1.20% | 1.20% |
| Expenses net of all reductions | .96%H | .96% | 1.04% | 1.11% | 1.19% | 1.18% |
| Net investment income (loss) | 1.58%H | .94% | 1.14% | 1.11% | 1.24% | 1.17% |
| Supplemental Data | ||||||
| Net assets, end of period (000 omitted) | $989,532 | $938,348 | $635,607 | $430,914 | $149,526 | $53,437 |
| Portfolio turnover rateI | 35%H | 26% | 27% | 32% | 32% | 68% |
A Calculated based on average shares outstanding during the period.
B Total distributions of $.10 per share is comprised of distributions from net investment income of $.097 and distributions from net realized gain of $.005 per share.
C Amount represents less than $.005 per share.
D Total returns for periods of less than one year are not annualized.
E Total returns would have been lower if certain expenses had not been reduced during the applicable periods shown.
F Fees and expenses of any underlying Fidelity Central Funds are not included in the Fund's expense ratio. The Fund indirectly bears its proportionate share of the expenses of any underlying Fidelity Central Funds.
G Expense ratios reflect operating expenses of the class. Expenses before reductions do not reflect amounts reimbursed by the investment adviser or reductions from brokerage service arrangements or reductions from other expense offset arrangements and do not represent the amount paid by the class during periods when reimbursements or reductions occur. Expenses net of fee waivers reflect expenses after reimbursement by the investment adviser but prior to reductions from brokerage service arrangements or other expense offset arrangements. Expenses net of all reductions represent the net expenses paid by the class.
H Annualized
I Amount does not include the portfolio activity of any underlying Fidelity Central Funds.
See accompanying notes which are an integral part of the financial statements.
Financial Highlights — Fidelity International Growth Fund Class I
| Six months ended (Unaudited) April 30, | Years ended October 31, | |||||
| 2016 | 2015 | 2014 | 2013 | 2012 | 2011 | |
| Selected Per–Share Data | ||||||
| Net asset value, beginning of period | $11.36 | $11.08 | $10.84 | $8.94 | $8.12 | $8.40 |
| Income from Investment Operations | ||||||
| Net investment income (loss)A | .08 | .11 | .13 | .11 | .10 | .10 |
| Net realized and unrealized gain (loss) | (.34) | .27 | .18 | 1.90 | .81 | (.30) |
| Total from investment operations | (.26) | .38 | .31 | 2.01 | .91 | (.20) |
| Distributions from net investment income | (.08) | (.10) | (.06) | (.10) | (.08) | (.07) |
| Distributions from net realized gain | (.01) | – | (.01) | (.01) | (.01) | (.01) |
| Total distributions | (.09) | (.10) | (.07) | (.11) | (.09) | (.08) |
| Redemption fees added to paid in capitalA,B | – | – | – | – | – | – |
| Net asset value, end of period | $11.01 | $11.36 | $11.08 | $10.84 | $8.94 | $8.12 |
| Total ReturnC,D | (2.34)% | 3.41% | 2.84% | 22.66% | 11.28% | (2.47)% |
| Ratios to Average Net AssetsE,F | ||||||
| Expenses before reductions | .97%G | .98% | 1.04% | 1.11% | 1.27% | 1.50% |
| Expenses net of fee waivers, if any | .97%G | .98% | 1.04% | 1.11% | 1.20% | 1.20% |
| Expenses net of all reductions | .96%G | .97% | 1.04% | 1.09% | 1.19% | 1.18% |
| Net investment income (loss) | 1.58%G | .94% | 1.14% | 1.13% | 1.24% | 1.17% |
| Supplemental Data | ||||||
| Net assets, end of period (000 omitted) | $344,685 | $267,745 | $121,554 | $38,771 | $3,992 | $493 |
| Portfolio turnover rateH | 35%G | 26% | 27% | 32% | 32% | 68% |
A Calculated based on average shares outstanding during the period.
B Amount represents less than $.005 per share.
C Total returns for periods of less than one year are not annualized.
D Total returns would have been lower if certain expenses had not been reduced during the applicable periods shown.
E Fees and expenses of any underlying Fidelity Central Funds are not included in the Fund's expense ratio. The Fund indirectly bears its proportionate share of the expenses of any underlying Fidelity Central Funds.
F Expense ratios reflect operating expenses of the class. Expenses before reductions do not reflect amounts reimbursed by the investment adviser or reductions from brokerage service arrangements or reductions from other expense offset arrangements and do not represent the amount paid by the class during periods when reimbursements or reductions occur. Expenses net of fee waivers reflect expenses after reimbursement by the investment adviser but prior to reductions from brokerage service arrangements or other expense offset arrangements. Expenses net of all reductions represent the net expenses paid by the class.
G Annualized
H Amount does not include the portfolio activity of any underlying Fidelity Central Funds.
See accompanying notes which are an integral part of the financial statements.
Financial Highlights — Fidelity International Growth Fund Class Z
| Six months ended (Unaudited) April 30, | Years ended October 31, | |||
| April 30, | 2016 | 2015 | 2014 | 2013 A |
| Selected Per–Share Data | ||||
| Net asset value, beginning of period | $11.38 | $11.10 | $10.84 | $10.26 |
| Income from Investment Operations | ||||
| Net investment income (loss)B | .09 | .12 | .14 | .02 |
| Net realized and unrealized gain (loss) | (.35) | .27 | .19 | .56 |
| Total from investment operations | (.26) | .39 | .33 | .58 |
| Distributions from net investment income | (.09) | (.11) | (.06) | – |
| Distributions from net realized gain | (.01) | – | (.01) | – |
| Total distributions | (.10) | (.11) | (.07) | – |
| Redemption fees added to paid in capitalB,C | – | – | – | – |
| Net asset value, end of period | $11.02 | $11.38 | $11.10 | $10.84 |
| Total ReturnD,E | (2.29)% | 3.52% | 3.07% | 5.65% |
| Ratios to Average Net AssetsF,G | ||||
| Expenses before reductions | .83%H | .84% | .88% | .94%H |
| Expenses net of fee waivers, if any | .83%H | .84% | .88% | .94%H |
| Expenses net of all reductions | .83%H | .83% | .88% | .93%H |
| Net investment income (loss) | 1.71%H | 1.07% | 1.30% | .65%H |
| Supplemental Data | ||||
| Net assets, end of period (000 omitted) | $15,509 | $897 | $104 | $106 |
| Portfolio turnover rateI | 35%H | 26% | 27% | 32% |
A For the period August 13, 2013 (commencement of sale of shares) to October 31, 2013.
B Calculated based on average shares outstanding during the period.
C Amount represents less than $.005 per share.
D Total returns for periods of less than one year are not annualized.
E Total returns would have been lower if certain expenses had not been reduced during the applicable periods shown.
F Fees and expenses of any underlying Fidelity Central Funds are not included in the Fund's expense ratio. The Fund indirectly bears its proportionate share of the expenses of any underlying Fidelity Central Funds.
G Expense ratios reflect operating expenses of the class. Expenses before reductions do not reflect amounts reimbursed by the investment adviser or reductions from brokerage service arrangements or reductions from other expense offset arrangements and do not represent the amount paid by the class during periods when reimbursements or reductions occur. Expense ratios before reductions for start-up periods may not be representative of longer-term operating periods. Expenses net of fee waivers reflect expenses after reimbursement by the investment adviser but prior to reductions from brokerage service arrangements or other expense offset arrangements. Expenses net of all reductions represent the net expenses paid by the class.
H Annualized
I Amount does not include the portfolio activity of any underlying Fidelity Central Funds.
See accompanying notes which are an integral part of the financial statements.
Notes to Financial Statements (Unaudited)
For the period ended April 30, 2016
1. Organization.
Fidelity International Growth Fund (the Fund) is a fund of Fidelity Investment Trust (the Trust) and is authorized to issue an unlimited number of shares. The Trust is registered under the Investment Company Act of 1940, as amended (the 1940 Act), as an open-end management investment company organized as a Massachusetts business trust. The Fund offers Class A, Class T, Class C, International Growth, Class I and Class Z shares, each of which, along with Class B shares, has equal rights as to assets and voting privileges. Class B shares are closed to new accounts and additional purchases, except for exchanges and reinvestments. Each class has exclusive voting rights with respect to matters that affect that class. Class B shares will automatically convert to Class A shares after a maximum holding period of seven years from the initial date of purchase.
During the period, the Board of Trustees approved the conversion of all existing Class B shares into Class A shares, effective on or about July 1, 2016, regardless of the length of times shares have been held.
2. Investments in Fidelity Central Funds.
The Fund invests in Fidelity Central Funds, which are open-end investment companies generally available only to other investment companies and accounts managed by the investment adviser and its affiliates. The Fund's Schedule of Investments lists each of the Fidelity Central Funds held as of period end, if any, as an investment of the Fund, but does not include the underlying holdings of each Fidelity Central Fund. As an Investing Fund, the Fund indirectly bears its proportionate share of the expenses of the underlying Fidelity Central Funds.
The Money Market Central Funds seek preservation of capital and current income and are managed by Fidelity Investments Money Management, Inc. (FIMM), an affiliate of the investment adviser. Annualized expenses of the Money Market Central Funds as of their most recent shareholder report date are less than .005%.
A complete unaudited list of holdings for each Fidelity Central Fund is available upon request or at the Securities and Exchange Commission (the SEC) website at www.sec.gov. In addition, the financial statements of the Fidelity Central Funds are available on the SEC website or upon request.
3. Significant Accounting Policies.
The financial statements have been prepared in conformity with accounting principles generally accepted in the United States of America (GAAP), which require management to make certain estimates and assumptions at the date of the financial statements. Actual results could differ from those estimates. Subsequent events, if any, through the date that the financial statements were issued have been evaluated in the preparation of the financial statements. The following summarizes the significant accounting policies of the Fund:
Investment Valuation. Investments are valued as of 4:00 p.m. Eastern time on the last calendar day of the period. The Board of Trustees (the Board) has delegated the day to day responsibility for the valuation of the Fund's investments to the Fidelity Management & Research Company (FMR) Fair Value Committee (the Committee). In accordance with valuation policies and procedures approved by the Board, the Fund attempts to obtain prices from one or more third party pricing vendors or brokers to value its investments. When current market prices, quotations or currency exchange rates are not readily available or reliable, investments will be fair valued in good faith by the Committee, in accordance with procedures adopted by the Board. Factors used in determining fair value vary by investment type and may include market or investment specific events. The frequency with which these procedures are used cannot be predicted and they may be utilized to a significant extent. The Committee oversees the Fund's valuation policies and procedures and reports to the Board on the Committee's activities and fair value determinations. The Board monitors the appropriateness of the procedures used in valuing the Fund's investments and ratifies the fair value determinations of the Committee.
The Fund categorizes the inputs to valuation techniques used to value its investments into a disclosure hierarchy consisting of three levels as shown below:
- Level 1 – quoted prices in active markets for identical investments
- Level 2 – other significant observable inputs (including quoted prices for similar investments, interest rates, prepayment speeds, etc.)
- Level 3 – unobservable inputs (including the Fund's own assumptions based on the best information available)
Valuation techniques used to value the Fund's investments by major category are as follows:
Equity securities, including restricted securities, for which market quotations are readily available, are valued at the last reported sale price or official closing price as reported by a third party pricing vendor on the primary market or exchange on which they are traded and are categorized as Level 1 in the hierarchy. In the event there were no sales during the day or closing prices are not available, securities are valued at the last quoted bid price or may be valued using the last available price and are generally categorized as Level 2 in the hierarchy. For foreign equity securities, when market or security specific events arise, comparisons to the valuation of American Depositary Receipts (ADRs), futures contracts, Exchange-Traded Funds (ETFs) and certain indexes as well as quoted prices for similar securities may be used and would be categorized as Level 2 in the hierarchy. Utilizing these techniques may result in transfers between Level 1 and Level 2. For equity securities, including restricted securities, where observable inputs are limited, assumptions about market activity and risk are used and these securities may be categorized as Level 3 in the hierarchy.
Investments in open-end mutual funds, including the Fidelity Central Funds, are valued at their closing net asset value (NAV) each business day and are categorized as Level 1 in the hierarchy.
Changes in valuation techniques may result in transfers in or out of an assigned level within the disclosure hierarchy. The aggregate value of investments by input level as of April 30, 2016, including information on transfers between Levels 1 and 2, is included at the end of the Fund's Schedule of Investments.
Foreign Currency. The Fund may use foreign currency contracts to facilitate transactions in foreign-denominated securities. Gains and losses from these transactions may arise from changes in the value of the foreign currency or if the counterparties do not perform under the contracts' terms.
Foreign-denominated assets, including investment securities, and liabilities are translated into U.S. dollars at the exchange rates at period end. Purchases and sales of investment securities, income and dividends received and expenses denominated in foreign currencies are translated into U.S. dollars at the exchange rate in effect on the transaction date.
The effects of exchange rate fluctuations on investments are included with the net realized and unrealized gain (loss) on investment securities. Other foreign currency transactions resulting in realized and unrealized gain (loss) are disclosed separately.
Investment Transactions and Income. For financial reporting purposes, the Fund's investment holdings and NAV include trades executed through the end of the last business day of the period. The NAV per share for processing shareholder transactions is calculated as of the close of business of the New York Stock Exchange (NYSE), normally 4:00 p.m. Eastern time and includes trades executed through the end of the prior business day. Gains and losses on securities sold are determined on the basis of identified cost. Dividend income is recorded on the ex-dividend date, except for certain dividends from foreign securities where the ex-dividend date may have passed, which are recorded as soon as the Fund is informed of the ex-dividend date. Non-cash dividends included in dividend income, if any, are recorded at the fair market value of the securities received. Income and capital gain distributions from Fidelity Central Funds, if any, are recorded on the ex-dividend date. Distributions received on securities that represent a return of capital or capital gain are recorded as a reduction of cost of investments and/or as a realized gain. Subsequent to ex-dividend date the Fund determines the components of these distributions, based upon receipt of tax filings or other correspondence relating to the underlying investment. Investment income is recorded net of foreign taxes withheld where recovery of such taxes is uncertain.
Class Allocations and Expenses. Investment income, realized and unrealized capital gains and losses, common expenses of the Fund, and certain fund-level expense reductions, if any, are allocated daily on a pro-rata basis to each class based on the relative net assets of each class to the total net assets of the Fund. Each class differs with respect to transfer agent and distribution and service plan fees incurred. Certain expense reductions may also differ by class. For the reporting period, the allocated portion of income and expenses to each class as a percent of its average net assets may vary due to the timing of recording these transactions in relation to fluctuating net assets of the classes. Expenses directly attributable to a fund are charged to that fund. Expenses attributable to more than one fund are allocated among the respective funds on the basis of relative net assets or other appropriate methods. Expense estimates are accrued in the period to which they relate and adjustments are made when actual amounts are known.
Income Tax Information and Distributions to Shareholders. Each year, the Fund intends to qualify as a regulated investment company under Subchapter M of the Internal Revenue Code, including distributing substantially all of its taxable income and realized gains. As a result, no provision for U.S. Federal income taxes is required. The Fund files a U.S. federal tax return, in addition to state and local tax returns as required. The Fund's federal income tax returns are subject to examination by the Internal Revenue Service (IRS) for a period of three fiscal years after they are filed. State and local tax returns may be subject to examination for an additional fiscal year depending on the jurisdiction. Foreign taxes are provided for based on the Fund's understanding of the tax rules and rates that exist in the foreign markets in which it invests.
Distributions are declared and recorded on the ex-dividend date. Income dividends and capital gain distributions are declared separately for each class. Income and capital gain distributions are determined in accordance with income tax regulations, which may differ from GAAP.
Capital accounts within the financial statements are adjusted for permanent book-tax differences. These adjustments have no impact on net assets or the results of operations. Capital accounts are not adjusted for temporary book-tax differences which will reverse in a subsequent period.
Book-tax differences are primarily due to foreign currency transactions, certain foreign taxes, passive foreign investment companies (PFIC), partnerships, capital loss carryforwards and losses deferred due to wash sales.
The federal tax cost of investment securities and unrealized appreciation (depreciation) as of period end were as follows:
| Gross unrealized appreciation | $176,397,956 |
| Gross unrealized depreciation | (59,559,141) |
| Net unrealized appreciation (depreciation) on securities | $116,838,815 |
| Tax cost | $1,637,437,209 |
Capital loss carryforwards are only available to offset future capital gains of the Fund to the extent provided by regulations and may be limited. Under the Regulated Investment Company Modernization Act of 2010 (the Act), the Fund is permitted to carry forward capital losses incurred in taxable years beginning after December 22, 2010 for an unlimited period and such capital losses are required to be used prior to any losses that expire. The capital loss carryforward information presented below, including any applicable limitation, is estimated as of prior fiscal period end and is subject to adjustment.
| No expiration | |
| Short-term | $(26,434,969) |
| Long-term | (7,319,866) |
| Total no expiration | $(33,754,835) |
Short-Term Trading (Redemption) Fees. Shares held by investors in the Fund less than 30 days may have been subject to a redemption fee equal to 1.00% of the NAV of shares redeemed. All redemption fees, which reduce the proceeds of the shareholder redemption, are retained by the Fund and accounted for as an addition to paid in capital.
4. Purchases and Sales of Investments.
Purchases and sales of securities, other than short-term securities, aggregated $479,246,265 and $260,718,084, respectively.
5. Fees and Other Transactions with Affiliates.
Management Fee. Fidelity Management & Research Company (the investment adviser) and its affiliates provide the Fund with investment management related services for which the Fund pays a monthly management fee. The management fee is the sum of an individual fund fee rate that is based on an annual rate of .45% of the Fund's average net assets and an annualized group fee rate that averaged .25% during the period. The group fee rate is based upon the average net assets of all the mutual funds advised by the investment adviser, including any mutual funds previously advised by the investment adviser that are currently advised by Fidelity SelectCo, LLC, an affiliate of the investment adviser. The group fee rate decreases as assets under management increase and increases as assets under management decrease. In addition, the management fee is subject to a performance adjustment (up to a maximum of +/- .20% of the Fund's average net assets over a 36 month performance period). The upward or downward adjustment to the management fee is based on the relative investment performance of International Growth as compared to its benchmark index, the MSCI EAFE Growth Index, over the same 36 month performance period. For the reporting period, the total annualized management fee rate, including the performance adjustment, was .71% of the Fund's average net assets. The performance adjustment included in the management fee rate may be higher or lower than the maximum performance adjustment rate due to the difference between the average net assets for the reporting and performance periods.
Distribution and Service Plan Fees. In accordance with Rule 12b-1 of the 1940 Act, the Fund has adopted separate Distribution and Service Plans for each class of shares. Certain classes pay Fidelity Distributors Corporation (FDC), an affiliate of the investment adviser, separate Distribution and Service Fees, each of which is based on an annual percentage of each class' average net assets. In addition, FDC may pay financial intermediaries for selling shares of the Fund and providing shareholder support services. For the period, the Distribution and Service Fee rates, total fees and amounts retained by FDC were as follows:
| Distribution Fee | Service Fee | Total Fees | Retained by FDC | |
| Class A | -% | .25% | $249,157 | $357 |
| Class T | .25% | .25% | 69,243 | – |
| Class B | .75% | .25% | 3,364 | 2,523 |
| Class C | .75% | .25% | 263,379 | 98,751 |
| $585,143 | $101,631 |
Sales Load. FDC may receive a front-end sales charge of up to 5.75% for selling Class A shares and 3.50% for selling Class T shares, some of which is paid to financial intermediaries for selling shares of the Fund. Depending on the holding period, FDC may receive contingent deferred sales charges levied on Class A, Class T, Class B and Class C redemptions. The deferred sales charges range from 5.00% to 1.00% for Class B shares, 1.00% for Class C shares, 1.00% for certain purchases of Class A shares and .25% for certain purchases of Class T shares.
For the period, sales charge amounts retained by FDC were as follows:
| Retained by FDC | |
| Class A | $44,378 |
| Class T | 6,336 |
| Class B(a) | 6 |
| Class C(a) | 4,765 |
| $55,485 |
(a) When Class B and Class C shares are initially sold, FDC pays commissions from its own resources to financial intermediaries through which the sales are made.
Transfer Agent Fees. Fidelity Investments Institutional Operations Company, Inc., (FIIOC), an affiliate of the investment adviser, is the transfer, dividend disbursing and shareholder servicing agent for each class of the Fund. FIIOC receives account fees and asset-based fees that vary according to the account size and type of account of the shareholders of the respective classes of the Fund, except for Class Z. FIIOC receives an asset-based fee of Class Z's average net assets. FIIOC pays for typesetting, printing and mailing of shareholder reports, except proxy statements.
For the period, transfer agent fees for each class were as follows:
| Amount | % of Class-Level Average Net Assets(a) | |
| Class A | $220,276 | .22 |
| Class T | 43,164 | .31 |
| Class B | 1,028 | .31 |
| Class C | 69,895 | .27 |
| International Growth | 819,000 | .18 |
| Class I | 263,135 | .18 |
| Class Z | 2,268 | .05 |
| $1,418,766 |
(a) Annualized
Accounting and Security Lending Fees. Fidelity Service Company, Inc. (FSC), an affiliate of the investment adviser, maintains the Fund's accounting records. The accounting fee is based on the level of average net assets for each month. Under a separate contract, FSC administers the security lending program. The security lending fee is based on the number and duration of lending transactions.
Brokerage Commissions. The Fund placed a portion of its portfolio transactions with brokerage firms which are affiliates of the investment adviser. Brokerage commissions are included in net realized gain (loss) and change in net unrealized appreciation (depreciation) in the Statement of Operations. The commissions paid to these affiliated firms were $799 for the period.
Interfund Trades. The Fund may purchase from or sell securities to other Fidelity Funds under procedures adopted by the Board. The procedures have been designed to ensure these interfund trades are executed in accordance with Rule 17a-7 of the 1940 Act. Interfund trades are included within the respective purchases and sales amounts shown in the Purchases and Sales of Investments note.
6. Committed Line of Credit.
The Fund participates with other funds managed by the investment adviser or an affiliate in a $4.25 billion credit facility (the "line of credit") to be utilized for temporary or emergency purposes to fund shareholder redemptions or for other short-term liquidity purposes. The Fund has agreed to pay commitment fees on its pro-rata portion of the line of credit, which amounted to $1,311 and is reflected in Miscellaneous expenses on the Statement of Operations. During the period, the Fund did not borrow on this line of credit.
7. Security Lending.
The Fund lends portfolio securities through a lending agent from time to time in order to earn additional income. For equity securities, a lending agent is used and may loan securities to certain qualified borrowers, including Fidelity Capital Markets (FCM), a broker-dealer affiliated with the Fund. On the settlement date of the loan, the Fund receives collateral (in the form of U.S. Treasury obligations, letters of credit and/or cash) against the loaned securities and maintains collateral in an amount not less than 100% of the market value of the loaned securities during the period of the loan. The market value of the loaned securities is determined at the close of business of the Fund and any additional required collateral is delivered to the Fund on the next business day. The Fund or borrower may terminate the loan at any time, and if the borrower defaults on its obligation to return the securities loaned because of insolvency or other reasons, the Fund may apply collateral received from the borrower against the obligation. The Fund may experience delays and costs in recovering the securities loaned. Any cash collateral received is invested in the Fidelity Securities Lending Cash Central Fund. The value of loaned securities and cash collateral at period end are disclosed on the Fund's Statement of Assets and Liabilities. The value of securities loaned to FCM at period end was $10,140,516. Security lending income represents the income earned on investing cash collateral, less rebates paid to borrowers and any lending agent fees associated with the loan, plus any premium payments received for lending certain types of securities. Security lending income is presented in the Statement of Operations as a component of income from Fidelity Central Funds. Total security lending income during the period amounted to $330,325, including $34,892 from securities loaned to FCM.
8. Expense Reductions.
Commissions paid to certain brokers with whom the investment adviser, or its affiliates, places trades on behalf of the Fund include an amount in addition to trade execution, which may be rebated back to the Fund to offset certain expenses. This amount totaled $11,575 for the period. In addition, through arrangements with the Fund's custodian, credits realized as a result of certain uninvested cash balances were used to reduce the Fund's expenses. During the period, these credits reduced the Fund's custody expenses by $35.
In addition, during the period the investment adviser reimbursed and/or waived a portion of fund-level operating expenses in the amount of $5,363.
9. Distributions to Shareholders.
Distributions to shareholders of each class were as follows:
| Six months ended April 30, 2016 | Year ended October 31, 2015 | |
| From net investment income | ||
| Class A | $857,306 | $684,914 |
| Class T | 25,900 | 29,128 |
| International Growth | 6,508,406 | 5,239,951 |
| Class I | 1,913,593 | 1,064,923 |
| Class Z | 8,317 | 1,008 |
| Total | $9,313,522 | $7,019,924 |
| From net realized gain | ||
| Class A | $137,169 | $– |
| Class T | 20,720 | – |
| Class B | 561 | – |
| Class C | 39,156 | – |
| International Growth | 667,539 | – |
| Class I | 196,266 | – |
| Class Z | 708 | – |
| Total | $1,062,119 | $– |
10. Share Transactions.
Share transactions for each class were as follows and may contain automatic conversions between classes or exchanges between affiliated funds:
| Shares | Shares | Dollars | Dollars | |
| Six months ended April 30, 2016 | Year ended October 31, 2015 | Six months ended April 30, 2016 | Year ended October 31, 2015 | |
| Class A | ||||
| Shares sold | 6,246,540 | 9,298,452 | $67,129,589 | $105,707,223 |
| Reinvestment of distributions | 86,341 | 60,570 | 970,468 | 669,298 |
| Shares redeemed | (1,954,972) | (3,798,128) | (20,859,132) | (42,982,992) |
| Net increase (decrease) | 4,377,909 | 5,560,894 | $47,240,925 | $63,393,529 |
| Class T | ||||
| Shares sold | 366,792 | 1,158,910 | $3,936,696 | $13,286,739 |
| Reinvestment of distributions | 4,067 | 2,593 | 45,714 | 28,654 |
| Shares redeemed | (350,025) | (1,005,399) | (3,686,315) | (11,627,373) |
| Net increase (decrease) | 20,834 | 156,104 | $296,095 | $1,688,020 |
| Class B | ||||
| Shares sold | 1,881 | 30,282 | $19,678 | $347,009 |
| Reinvestment of distributions | 50 | – | 556 | – |
| Shares redeemed | (23,393) | (87,349) | (246,379) | (994,341) |
| Net increase (decrease) | (21,462) | (57,067) | $(226,145) | $(647,332) |
| Class C | ||||
| Shares sold | 819,268 | 2,689,800 | $8,736,707 | $30,433,427 |
| Reinvestment of distributions | 3,485 | – | 38,678 | – |
| Shares redeemed | (454,625) | (991,400) | (4,741,050) | (10,978,888) |
| Net increase (decrease) | 368,128 | 1,698,400 | $4,034,335 | $19,454,539 |
| International Growth | ||||
| Shares sold | 17,140,428 | 39,705,804 | $183,584,698 | $456,131,993 |
| Reinvestment of distributions | 515,203 | 387,169 | 5,821,794 | 4,301,448 |
| Shares redeemed | (10,385,791) | (14,942,156) | (110,850,155) | (169,380,325) |
| Net increase (decrease) | 7,269,840 | 25,150,817 | $78,556,337 | $291,053,116 |
| Class I | ||||
| Shares sold | 13,087,526 | 17,728,493 | $140,430,050 | $201,877,753 |
| Reinvestment of distributions | 177,277 | 92,582 | 1,999,688 | 1,026,733 |
| Shares redeemed | (5,525,257) | (5,227,430) | (58,460,124) | (58,733,231) |
| Net increase (decrease) | 7,739,546 | 12,593,645 | $83,969,614 | $144,171,255 |
| Class Z | ||||
| Shares sold | 1,378,158 | 88,007 | $14,776,889 | $956,120 |
| Reinvestment of distributions | 799 | 91 | 9,025 | 1,008 |
| Shares redeemed | (50,920) | (18,621) | (543,517) | (208,779) |
| Net increase (decrease) | 1,328,037 | 69,477 | $14,242,397 | $748,349 |
11. Other.
The Fund's organizational documents provide former and current trustees and officers with a limited indemnification against liabilities arising in connection with the performance of their duties to the Fund. In the normal course of business, the Fund may also enter into contracts that provide general indemnifications. The Fund's maximum exposure under these arrangements is unknown as this would be dependent on future claims that may be made against the Fund. The risk of material loss from such claims is considered remote.
Shareholder Expense Example
As a shareholder of the Fund, you incur two types of costs: (1) transaction costs, including sales charges (loads) on purchase payments or redemption proceeds, redemption fees and (2) ongoing costs, including management fees, distribution and/or service (12b-1) fees and other Fund expenses. This Example is intended to help you understand your ongoing costs (in dollars) of investing in the Fund and to compare these costs with the ongoing costs of investing in other mutual funds.
The Example is based on an investment of $1,000 invested at the beginning of the period and held for the entire period (November 1, 2015 to April 30, 2016).
Actual Expenses
The first line of the accompanying table for each class of the Fund provides information about actual account values and actual expenses. You may use the information in this line, together with the amount you invested, to estimate the expenses that you paid over the period. Simply divide your account value by $1,000.00 (for example, an $8,600 account value divided by $1,000.00 = 8.6), then multiply the result by the number in the first line for a class of the Fund under the heading entitled "Expenses Paid During Period" to estimate the expenses you paid on your account during this period. A small balance maintenance fee of $12.00 that is charged once a year may apply for certain accounts with a value of less than $2,000. This fee is not included in the table below. If it was, the estimate of expenses you paid during the period would be higher, and your ending account value lower, by this amount. In addition, the Fund, as a shareholder in the underlying Fidelity Central Funds, will indirectly bear its pro-rata share of the fees and expenses incurred by the underlying Fidelity Central Funds. These fees and expenses are not included in the Fund's annualized expense ratio used to calculate the expense estimate in the table below.
Hypothetical Example for Comparison Purposes
The second line of the accompanying table for each class of the Fund provides information about hypothetical account values and hypothetical expenses based on a Class' actual expense ratio and an assumed rate of return of 5% per year before expenses, which is not the Class' actual return. The hypothetical account values and expenses may not be used to estimate the actual ending account balance or expenses you paid for the period. You may use this information to compare the ongoing costs of investing in the Fund and other funds. To do so, compare this 5% hypothetical example with the 5% hypothetical examples that appear in the shareholder reports of the other funds. A small balance maintenance fee of $12.00 that is charged once a year may apply for certain accounts with a value of less than $2,000. This fee is not included in the table below. If it was, the estimate of expenses you paid during the period would be higher, and your ending account value lower, by this amount. In addition, the Fund, as a shareholder in the underlying Fidelity Central Funds, will indirectly bear its pro-rata share of the fees and expenses incurred by the underlying Fidelity Central Funds. These fees and expenses are not included in the Fund's annualized expense ratio used to calculate the expense estimate in the table below.
Please note that the expenses shown in the table are meant to highlight your ongoing costs only and do not reflect any transaction costs. Therefore, the second line of the table is useful in comparing ongoing costs only, and will not help you determine the relative total costs of owning different funds. In addition, if these transactional costs were included, your costs would have been higher.
| Annualized Expense Ratio-A | Beginning Account Value November 1, 2015 | Ending Account Value April 30, 2016 | Expenses Paid During Period-B November 1, 2015 to April 30, 2016 | |
| Class A | 1.26% | |||
| Actual | $1,000.00 | $974.90 | $6.19 | |
| Hypothetical-C | $1,000.00 | $1,018.60 | $6.32 | |
| Class T | 1.60% | |||
| Actual | $1,000.00 | $973.10 | $7.85 | |
| Hypothetical-C | $1,000.00 | $1,016.91 | $8.02 | |
| Class B | 2.09% | |||
| Actual | $1,000.00 | $971.10 | $10.24 | |
| Hypothetical-C | $1,000.00 | $1,014.47 | $10.47 | |
| Class C | 2.05% | |||
| Actual | $1,000.00 | $971.00 | $10.05 | |
| Hypothetical-C | $1,000.00 | $1,014.67 | $10.27 | |
| International Growth | .96% | |||
| Actual | $1,000.00 | $976.60 | $4.72 | |
| Hypothetical-C | $1,000.00 | $1,020.09 | $4.82 | |
| Class I | .97% | |||
| Actual | $1,000.00 | $976.60 | $4.77 | |
| Hypothetical-C | $1,000.00 | $1,020.04 | $4.87 | |
| Class Z | .83% | |||
| Actual | $1,000.00 | $977.10 | $4.08 | |
| Hypothetical-C | $1,000.00 | $1,020.74 | $4.17 |
A Annualized expense ratio reflects expenses net of applicable fee waivers.
B Expenses are equal to each Class' annualized expense ratio, multiplied by the average account value over the period, multiplied by 182/366 (to reflect the one-half year period).
C 5% return per year before expenses
![]()
Corporate Headquarters
245 Summer St.
Boston, MA 02210
www.fidelity.com
IGF-SANN-0616
1.912353.106
Fidelity Advisor® Japan Fund - Semi-Annual Report April 30, 2016 Class A, Class T, Class B and Class C are classes of Fidelity® Japan Fund |
|
Contents
To view a fund's proxy voting guidelines and proxy voting record for the 12-month period ended June 30, visit http://www.fidelity.com/proxyvotingresults or visit the Securities and Exchange Commission's (SEC) web site at http://www.sec.gov.
You may also call 1-877-208-0098 to request a free copy of the proxy voting guidelines.
Standard & Poor's, S&P and S&P 500 are registered service marks of The McGraw-Hill Companies, Inc. and have been licensed for use by Fidelity Distributors Corporation.
Other third-party marks appearing herein are the property of their respective owners.
All other marks appearing herein are registered or unregistered trademarks or service marks of FMR LLC or an affiliated company. © 2016 FMR LLC. All rights reserved.
This report and the financial statements contained herein are submitted for the general information of the shareholders of the Fund. This report is not authorized for distribution to prospective investors in the Fund unless preceded or accompanied by an effective prospectus.
A fund files its complete schedule of portfolio holdings with the SEC for the first and third quarters of each fiscal year on Form N-Q. Forms N-Q are available on the SEC’s web site at http://www.sec.gov. A fund's Forms N-Q may be reviewed and copied at the SEC’s Public Reference Room in Washington, DC. Information regarding the operation of the SEC's Public Reference Room may be obtained by calling 1-800-SEC-0330.
For a complete list of a fund's portfolio holdings, view the most recent holdings listing, semiannual report, or annual report on Fidelity's web site at http://www.fidelity.com, http://www.advisor.fidelity.com, or http://www.401k.com, as applicable.
NOT FDIC INSURED •MAY LOSE VALUE •NO BANK GUARANTEE
Neither the Fund nor Fidelity Distributors Corporation is a bank.
Investment Summary (Unaudited)
Geographic Diversification (% of fund's net assets)
| As of April 30, 2016 | ||
| Japan | 98.1% | |
| Cayman Islands | 1.0% | |
| United States of America* | 0.9% | |

* Includes Short-Term investments and Net Other Assets (Liabilities).
Percentages are based on country or territory of incorporation and are adjusted for the effect of futures contracts, if applicable.
| As of October 31, 2015 | ||
| Japan | 95.8% | |
| Korea (South) | 1.7% | |
| United States of America* | 1.4% | |
| Cayman Islands | 0.7% | |
| Singapore | 0.4% | |

* Includes Short-Term investments and Net Other Assets (Liabilities).
Percentages are based on country or territory of incorporation and are adjusted for the effect of futures contracts, if applicable.
Asset Allocation as of April 30, 2016
| % of fund's net assets | % of fund's net assets 6 months ago | |
| Stocks | 99.1 | 98.6 |
| Short-Term Investments and Net Other Assets (Liabilities) | 0.9 | 1.4 |
Top Ten Stocks as of April 30, 2016
| % of fund's net assets | % of fund's net assets 6 months ago | |
| Astellas Pharma, Inc. (Pharmaceuticals) | 5.0 | 4.9 |
| East Japan Railway Co. (Road & Rail) | 4.2 | 4.2 |
| KDDI Corp. (Wireless Telecommunication Services) | 4.1 | 3.3 |
| Hoya Corp. (Health Care Equipment & Supplies) | 3.3 | 3.3 |
| ORIX Corp. (Diversified Financial Services) | 3.3 | 3.0 |
| Mitsubishi UFJ Financial Group, Inc. (Banks) | 3.1 | 4.0 |
| SoftBank Corp. (Wireless Telecommunication Services) | 3.1 | 2.8 |
| Mitsui Fudosan Co. Ltd. (Real Estate Management & Development) | 2.9 | 2.9 |
| Sony Corp. (Household Durables) | 2.6 | 2.6 |
| Japan Tobacco, Inc. (Tobacco) | 2.5 | 1.8 |
| 34.1 |
Market Sectors as of April 30, 2016
| % of fund's net assets | % of fund's net assets 6 months ago | |
| Consumer Discretionary | 20.3 | 19.3 |
| Financials | 16.4 | 19.0 |
| Health Care | 13.5 | 13.3 |
| Information Technology | 12.7 | 13.8 |
| Industrials | 12.7 | 13.8 |
| Consumer Staples | 9.9 | 7.0 |
| Telecommunication Services | 9.1 | 7.2 |
| Materials | 4.5 | 5.2 |
Investments April 30, 2016 (Unaudited)
Showing Percentage of Net Assets
| Common Stocks - 99.1% | |||
| Shares | Value | ||
| CONSUMER DISCRETIONARY - 20.3% | |||
| Auto Components - 3.5% | |||
| Bridgestone Corp. | 161,700 | $5,951,761 | |
| DaikyoNishikawa Corp. | 90,600 | 1,248,546 | |
| NGK Spark Plug Co. Ltd. | 215,400 | 4,295,802 | |
| Sumitomo Electric Industries Ltd. | 249,000 | 2,995,382 | |
| 14,491,491 | |||
| Automobiles - 6.3% | |||
| Fuji Heavy Industries Ltd. | 53,100 | 1,743,538 | |
| Honda Motor Co. Ltd. | 361,300 | 9,749,966 | |
| Isuzu Motors Ltd. | 282,600 | 3,023,900 | |
| Mazda Motor Corp. | 255,100 | 3,886,781 | |
| Suzuki Motor Corp. | 290,200 | 7,952,515 | |
| 26,356,700 | |||
| Hotels, Restaurants & Leisure - 0.7% | |||
| Skylark Co. Ltd. | 230,600 | 2,931,421 | |
| Household Durables - 4.4% | |||
| Casio Computer Co. Ltd. (a) | 189,200 | 3,599,894 | |
| Rinnai Corp. | 43,300 | 3,821,360 | |
| Sony Corp. | 457,600 | 11,083,814 | |
| 18,505,068 | |||
| Internet & Catalog Retail - 1.2% | |||
| Rakuten, Inc. | 317,600 | 3,452,746 | |
| Start Today Co. Ltd. | 35,000 | 1,470,440 | |
| 4,923,186 | |||
| Media - 0.9% | |||
| Dentsu, Inc. | 36,200 | 1,839,286 | |
| Proto Corp. | 160,300 | 2,102,489 | |
| 3,941,775 | |||
| Multiline Retail - 0.4% | |||
| Don Quijote Holdings Co. Ltd. | 50,700 | 1,803,695 | |
| Specialty Retail - 2.9% | |||
| Fast Retailing Co. Ltd. | 11,500 | 3,027,976 | |
| Nitori Holdings Co. Ltd. | 15,600 | 1,451,094 | |
| United Arrows Ltd. | 73,500 | 2,953,390 | |
| USS Co. Ltd. | 179,400 | 2,837,811 | |
| Xebio Holdings Co. Ltd. | 119,300 | 1,902,908 | |
| 12,173,179 | |||
| TOTAL CONSUMER DISCRETIONARY | 85,126,515 | ||
| CONSUMER STAPLES - 9.9% | |||
| Beverages - 1.4% | |||
| Asahi Group Holdings | 177,900 | 5,646,020 | |
| Food & Staples Retailing - 5.1% | |||
| Ain Holdings, Inc. | 35,100 | 1,705,088 | |
| San-A Co. Ltd. | 49,600 | 2,282,993 | |
| Seven & i Holdings Co. Ltd. | 187,900 | 7,666,778 | |
| Sundrug Co. Ltd. | 48,200 | 3,424,890 | |
| Tsuruha Holdings, Inc. | 22,800 | 2,186,877 | |
| Welcia Holdings Co. Ltd. | 77,600 | 4,099,024 | |
| 21,365,650 | |||
| Personal Products - 0.9% | |||
| Kao Corp. | 69,500 | 3,844,530 | |
| Tobacco - 2.5% | |||
| Japan Tobacco, Inc. | 254,400 | 10,394,260 | |
| TOTAL CONSUMER STAPLES | 41,250,460 | ||
| FINANCIALS - 16.4% | |||
| Banks - 5.0% | |||
| Mitsubishi UFJ Financial Group, Inc. | 2,783,300 | 12,844,416 | |
| Seven Bank Ltd. (b) | 986,900 | 4,193,543 | |
| Shinsei Bank Ltd. | 2,892,000 | 4,053,359 | |
| 21,091,318 | |||
| Capital Markets - 0.7% | |||
| Monex Group, Inc. | 1,198,700 | 3,092,308 | |
| Diversified Financial Services - 3.3% | |||
| ORIX Corp. | 961,100 | 13,594,698 | |
| Insurance - 2.4% | |||
| Sony Financial Holdings, Inc. | 214,600 | 2,653,086 | |
| Tokio Marine Holdings, Inc. (c) | 222,300 | 7,274,211 | |
| 9,927,297 | |||
| Real Estate Investment Trusts - 1.5% | |||
| Invincible Investment Corp. | 1,955 | 1,484,493 | |
| LaSalle Logiport REIT | 881 | 803,399 | |
| Nippon Prologis REIT, Inc. | 868 | 2,081,323 | |
| Sekisui House (REIT), Inc. | 1,449 | 1,696,576 | |
| 6,065,791 | |||
| Real Estate Management & Development - 3.5% | |||
| AEON MALL Co. Ltd. | 175,200 | 2,409,551 | |
| Mitsui Fudosan Co. Ltd. | 501,000 | 12,235,639 | |
| 14,645,190 | |||
| TOTAL FINANCIALS | 68,416,602 | ||
| HEALTH CARE - 13.5% | |||
| Biotechnology - 0.5% | |||
| PeptiDream, Inc. (a)(d) | 34,800 | 2,005,743 | |
| Health Care Equipment & Supplies - 5.7% | |||
| Hoya Corp. | 360,200 | 13,793,598 | |
| Olympus Corp. | 264,300 | 10,296,236 | |
| 24,089,834 | |||
| Health Care Providers & Services - 2.3% | |||
| Miraca Holdings, Inc. | 95,900 | 4,075,476 | |
| Ship Healthcare Holdings, Inc. | 225,100 | 5,555,108 | |
| 9,630,584 | |||
| Pharmaceuticals - 5.0% | |||
| Astellas Pharma, Inc. | 1,548,500 | 20,877,795 | |
| TOTAL HEALTH CARE | 56,603,956 | ||
| INDUSTRIALS - 12.7% | |||
| Building Products - 1.3% | |||
| Daikin Industries Ltd. | 67,000 | 5,318,395 | |
| Construction & Engineering - 1.0% | |||
| Toshiba Plant Systems & Services Corp. | 351,700 | 4,349,274 | |
| Electrical Equipment - 2.7% | |||
| Mitsubishi Electric Corp. | 454,000 | 4,824,848 | |
| Nidec Corp. | 91,200 | 6,682,595 | |
| 11,507,443 | |||
| Machinery - 2.4% | |||
| Kubota Corp. | 307,700 | 4,482,221 | |
| Makita Corp. | 86,100 | 5,431,482 | |
| 9,913,703 | |||
| Road & Rail - 4.2% | |||
| East Japan Railway Co. | 198,900 | 17,498,442 | |
| Trading Companies & Distributors - 1.1% | |||
| Misumi Group, Inc. | 321,800 | 4,443,986 | |
| TOTAL INDUSTRIALS | 53,031,243 | ||
| INFORMATION TECHNOLOGY - 12.7% | |||
| Electronic Equipment & Components - 6.9% | |||
| Azbil Corp. | 162,900 | 4,179,734 | |
| Hitachi Ltd. | 1,579,000 | 7,235,334 | |
| OMRON Corp. | 69,200 | 2,196,193 | |
| Shimadzu Corp. | 613,000 | 9,175,097 | |
| TDK Corp. | 55,400 | 3,241,669 | |
| Topcon Corp. | 245,900 | 3,026,938 | |
| 29,054,965 | |||
| Internet Software & Services - 3.7% | |||
| Alibaba Group Holding Ltd. sponsored ADR (d) | 53,100 | 4,085,514 | |
| DeNA Co. Ltd. | 234,300 | 3,943,154 | |
| Kakaku.com, Inc. | 418,800 | 7,543,053 | |
| 15,571,721 | |||
| Semiconductors & Semiconductor Equipment - 0.9% | |||
| Sanken Electric Co. Ltd. (a) | 381,000 | 1,263,105 | |
| Sumco Corp. | 397,300 | 2,515,961 | |
| 3,779,066 | |||
| Software - 0.6% | |||
| COLOPL, Inc. | 117,000 | 2,311,206 | |
| Technology Hardware, Storage & Peripherals - 0.6% | |||
| NEC Corp. | 961,000 | 2,338,857 | |
| TOTAL INFORMATION TECHNOLOGY | 53,055,815 | ||
| MATERIALS - 4.5% | |||
| Chemicals - 4.5% | |||
| Daicel Chemical Industries Ltd. | 208,300 | 2,602,074 | |
| Hitachi Chemical Co. Ltd. | 143,200 | 2,404,863 | |
| Kansai Paint Co. Ltd. | 246,500 | 4,311,200 | |
| Shin-Etsu Chemical Co. Ltd. | 89,600 | 5,018,387 | |
| Toray Industries, Inc. | 538,000 | 4,493,793 | |
| 18,830,317 | |||
| TELECOMMUNICATION SERVICES - 9.1% | |||
| Diversified Telecommunication Services - 1.9% | |||
| Nippon Telegraph & Telephone Corp. | 179,200 | 8,019,259 | |
| Wireless Telecommunication Services - 7.2% | |||
| KDDI Corp. | 600,100 | 17,286,321 | |
| SoftBank Corp. | 237,400 | 12,765,117 | |
| 30,051,438 | |||
| TOTAL TELECOMMUNICATION SERVICES | 38,070,697 | ||
| TOTAL COMMON STOCKS | |||
| (Cost $423,826,962) | 414,385,605 | ||
| Money Market Funds - 1.7% | |||
| Fidelity Cash Central Fund, 0.38% (e) | 1,206,235 | 1,206,235 | |
| Fidelity Securities Lending Cash Central Fund, 0.42% (e)(f) | 5,928,450 | 5,928,450 | |
| TOTAL MONEY MARKET FUNDS | |||
| (Cost $7,134,685) | 7,134,685 | ||
| TOTAL INVESTMENT PORTFOLIO - 100.8% | |||
| (Cost $430,961,647) | 421,520,290 | ||
| NET OTHER ASSETS (LIABILITIES) - (0.8)% | (3,494,368) | ||
| NET ASSETS - 100% | $418,025,922 |
Legend
(a) Security or a portion of the security is on loan at period end.
(b) A portion of the security sold on a delayed delivery basis.
(c) Security or a portion of the security purchased on a delayed delivery or when-issued basis.
(d) Non-income producing
(e) Affiliated fund that is generally available only to investment companies and other accounts managed by Fidelity Investments. The rate quoted is the annualized seven-day yield of the fund at period end. A complete unaudited listing of the fund's holdings as of its most recent quarter end is available upon request. In addition, each Fidelity Central Fund's financial statements are available on the SEC's website or upon request.
(f) Investment made with cash collateral received from securities on loan.
Affiliated Central Funds
Information regarding fiscal year to date income earned by the Fund from investments in Fidelity Central Funds is as follows:
| Fund | Income earned |
| Fidelity Cash Central Fund | $3,867 |
| Fidelity Securities Lending Cash Central Fund | 61,820 |
| Total | $65,687 |
Investment Valuation
The following is a summary of the inputs used, as of April 30, 2016, involving the Fund's assets and liabilities carried at fair value. The inputs or methodology used for valuing securities may not be an indication of the risk associated with investing in those securities. For more information on valuation inputs, and their aggregation into the levels used below, please refer to the Investment Valuation section in the accompanying Notes to Financial Statements.
| Valuation Inputs at Reporting Date: | ||||
| Description | Total | Level 1 | Level 2 | Level 3 |
| Investments in Securities: | ||||
| Equities: | ||||
| Consumer Discretionary | $85,126,515 | $-- | $85,126,515 | $-- |
| Consumer Staples | 41,250,460 | -- | 41,250,460 | -- |
| Financials | 68,416,602 | -- | 68,416,602 | -- |
| Health Care | 56,603,956 | -- | 56,603,956 | -- |
| Industrials | 53,031,243 | -- | 53,031,243 | -- |
| Information Technology | 53,055,815 | 4,085,514 | 48,970,301 | -- |
| Materials | 18,830,317 | -- | 18,830,317 | -- |
| Telecommunication Services | 38,070,697 | -- | 38,070,697 | -- |
| Money Market Funds | 7,134,685 | 7,134,685 | -- | -- |
| Total Investments in Securities: | $421,520,290 | $11,220,199 | $410,300,091 | $-- |
See accompanying notes which are an integral part of the financial statements.
Financial Statements
Statement of Assets and Liabilities
| April 30, 2016 (Unaudited) | ||
| Assets | ||
| Investment in securities, at value (including securities loaned of $5,643,777) — See accompanying schedule: Unaffiliated issuers (cost $423,826,962) | $414,385,605 | |
| Fidelity Central Funds (cost $7,134,685) | 7,134,685 | |
| Total Investments (cost $430,961,647) | $421,520,290 | |
| Receivable for investments sold | ||
| Regular delivery | 1,610,483 | |
| Delayed delivery | 1,228,772 | |
| Receivable for fund shares sold | 204,538 | |
| Dividends receivable | 3,396,451 | |
| Distributions receivable from Fidelity Central Funds | 11,311 | |
| Prepaid expenses | 360 | |
| Other receivables | 23 | |
| Total assets | 427,972,228 | |
| Liabilities | ||
| Payable for investments purchased | ||
| Regular delivery | $1,299,334 | |
| Delayed delivery | 1,566,723 | |
| Payable for fund shares redeemed | 824,962 | |
| Accrued management fee | 166,424 | |
| Distribution and service plan fees payable | 21,502 | |
| Other affiliated payables | 91,927 | |
| Other payables and accrued expenses | 46,984 | |
| Collateral on securities loaned, at value | 5,928,450 | |
| Total liabilities | 9,946,306 | |
| Net Assets | $418,025,922 | |
| Net Assets consist of: | ||
| Paid in capital | $615,649,331 | |
| Undistributed net investment income | 1,888,227 | |
| Accumulated undistributed net realized gain (loss) on investments and foreign currency transactions | (190,260,232) | |
| Net unrealized appreciation (depreciation) on investments and assets and liabilities in foreign currencies | (9,251,404) | |
| Net Assets | $418,025,922 | |
| Calculation of Maximum Offering Price | ||
| Class A: | ||
| Net Asset Value and redemption price per share ($25,549,301 ÷ 2,254,243 shares) | $11.33 | |
| Maximum offering price per share (100/94.25 of $11.33) | $12.02 | |
| Class T: | ||
| Net Asset Value and redemption price per share ($4,456,631 ÷ 393,196 shares) | $11.33 | |
| Maximum offering price per share (100/96.50 of $11.33) | $11.74 | |
| Class B: | ||
| Net Asset Value and offering price per share ($181,410 ÷ 16,068 shares)(a) | $11.29 | |
| Class C: | ||
| Net Asset Value and offering price per share ($16,281,880 ÷ 1,447,994 shares)(a) | $11.24 | |
| Japan: | ||
| Net Asset Value, offering price and redemption price per share ($365,289,572 ÷ 32,138,461 shares) | $11.37 | |
| Class I: | ||
| Net Asset Value, offering price and redemption price per share ($6,267,128 ÷ 552,250 shares) | $11.35 |
(a) Redemption price per share is equal to net asset value less any applicable contingent deferred sales charge.
See accompanying notes which are an integral part of the financial statements.
Statement of Operations
| Six months ended April 30, 2016 (Unaudited) | ||
| Investment Income | ||
| Dividends | $4,400,064 | |
| Income from Fidelity Central Funds | 65,687 | |
| Income before foreign taxes withheld | 4,465,751 | |
| Less foreign taxes withheld | (442,374) | |
| Total income | 4,023,377 | |
| Expenses | ||
| Management fee | ||
| Basic fee | $1,739,878 | |
| Performance adjustment | (504,885) | |
| Transfer agent fees | 486,175 | |
| Distribution and service plan fees | 133,312 | |
| Accounting and security lending fees | 129,152 | |
| Custodian fees and expenses | 28,896 | |
| Independent trustees' compensation | 1,142 | |
| Registration fees | 68,374 | |
| Audit | 40,802 | |
| Legal | 686 | |
| Interest | 1,750 | |
| Miscellaneous | 1,771 | |
| Total expenses before reductions | 2,127,053 | |
| Expense reductions | (1,978) | 2,125,075 |
| Net investment income (loss) | 1,898,302 | |
| Realized and Unrealized Gain (Loss) | ||
| Net realized gain (loss) on: | ||
| Investment securities: | ||
| Unaffiliated issuers | (7,721,419) | |
| Foreign currency transactions | (50,452) | |
| Total net realized gain (loss) | (7,771,871) | |
| Change in net unrealized appreciation (depreciation) on: Investment securities | (18,729,419) | |
| Assets and liabilities in foreign currencies | 208,285 | |
| Total change in net unrealized appreciation (depreciation) | (18,521,134) | |
| Net gain (loss) | (26,293,005) | |
| Net increase (decrease) in net assets resulting from operations | $(24,394,703) |
See accompanying notes which are an integral part of the financial statements.
Statement of Changes in Net Assets
| Six months ended April 30, 2016 (Unaudited) | Year ended October 31, 2015 | |
| Increase (Decrease) in Net Assets | ||
| Operations | ||
| Net investment income (loss) | $1,898,302 | $3,112,183 |
| Net realized gain (loss) | (7,771,871) | (392,382) |
| Change in net unrealized appreciation (depreciation) | (18,521,134) | 1,937,241 |
| Net increase (decrease) in net assets resulting from operations | (24,394,703) | 4,657,042 |
| Distributions to shareholders from net investment income | (3,027,093) | (3,310,432) |
| Distributions to shareholders from net realized gain | (270,338) | – |
| Total distributions | (3,297,431) | (3,310,432) |
| Share transactions - net increase (decrease) | (101,642,831) | 70,904,089 |
| Redemption fees | 36,545 | 139,156 |
| Total increase (decrease) in net assets | (129,298,420) | 72,389,855 |
| Net Assets | ||
| Beginning of period | 547,324,342 | 474,934,487 |
| End of period (including undistributed net investment income of $1,888,227 and undistributed net investment income of $3,017,018, respectively) | $418,025,922 | $547,324,342 |
See accompanying notes which are an integral part of the financial statements.
Financial Highlights — Fidelity Japan Fund Class A
| Six months ended (Unaudited) April 30, | Years ended October 31, | |||||
| 2016 | 2015 | 2014 | 2013 | 2012 | 2011 A | |
| Selected Per–Share Data | ||||||
| Net asset value, beginning of period | $11.87 | $11.65 | $12.00 | $9.30 | $9.54 | $10.83 |
| Income from Investment Operations | ||||||
| Net investment income (loss)B | .03 | .04 | .05 | .08 | .09 | .09 |
| Net realized and unrealized gain (loss) | (.51) | .23 | (.31) | 2.80 | (.15) | (1.39) |
| Total from investment operations | (.48) | .27 | (.26) | 2.88 | (.06) | (1.30) |
| Distributions from net investment income | (.05) | (.05) | (.08) | (.11) | (.13) | – |
| Distributions from net realized gain | (.01) | – | (.01) | (.08) | (.05) | – |
| Total distributions | (.06) | (.05) | (.09) | (.19) | (.18) | – |
| Redemption fees added to paid in capitalB | –C | –C | –C | .01 | –C | .01 |
| Net asset value, end of period | $11.33 | $11.87 | $11.65 | $12.00 | $9.30 | $9.54 |
| Total ReturnD,E,F | (4.11)% | 2.31% | (2.18)% | 31.58% | (.64)% | (11.91)% |
| Ratios to Average Net AssetsG,H | ||||||
| Expenses before reductions | 1.09%I | 1.10% | 1.23% | 1.26% | 1.42% | 1.20%I |
| Expenses net of fee waivers, if any | 1.09%I | 1.10% | 1.23% | 1.26% | 1.38% | 1.20%I |
| Expenses net of all reductions | 1.09%I | 1.09% | 1.23% | 1.25% | 1.36% | 1.16%I |
| Net investment income (loss) | .53%I | .37% | .41% | .75% | .94% | 1.02%I |
| Supplemental Data | ||||||
| Net assets, end of period (000 omitted) | $25,549 | $23,918 | $21,352 | $20,520 | $9,495 | $13,208 |
| Portfolio turnover rateJ | 16%I | 35% | 112% | 68% | 52% | 134%K |
A For the period December 14, 2010 (commencement of sale of shares) to October 31, 2011.
B Calculated based on average shares outstanding during the period.
C Amount represents less than $.005 per share.
D Total returns for periods of less than one year are not annualized.
E Total returns would have been lower if certain expenses had not been reduced during the applicable periods shown.
F Total returns do not include the effect of the sales charges.
G Fees and expenses of any underlying Fidelity Central Funds are not included in the Fund's expense ratio. The Fund indirectly bears its proportionate share of the expenses of any underlying Fidelity Central Funds.
H Expense ratios reflect operating expenses of the class. Expenses before reductions do not reflect amounts reimbursed by the investment adviser or reductions from brokerage service arrangements or reductions from other expense offset arrangements and do not represent the amount paid by the class during periods when reimbursements or reductions occur. Expenses net of fee waivers reflect expenses after reimbursement by the investment adviser but prior to reductions from brokerage service arrangements or other expense offset arrangements. Expenses net of all reductions represent the net expenses paid by the class.
I Annualized
J Amount does not include the portfolio activity of any underlying Fidelity Central Funds.
K The portfolio turnover rate does not include the assets acquired in the merger.
See accompanying notes which are an integral part of the financial statements.
Financial Highlights — Fidelity Japan Fund Class T
| Six months ended (Unaudited) April 30, | Years ended October 31, | |||||
| 2016 | 2015 | 2014 | 2013 | 2012 | 2011 A | |
| Selected Per–Share Data | ||||||
| Net asset value, beginning of period | $11.85 | $11.62 | $11.96 | $9.28 | $9.51 | $10.83 |
| Income from Investment Operations | ||||||
| Net investment income (loss)B | .01 | –C | .01 | .05 | .06 | .07 |
| Net realized and unrealized gain (loss) | (.52) | .23 | (.30) | 2.78 | (.13) | (1.40) |
| Total from investment operations | (.51) | .23 | (.29) | 2.83 | (.07) | (1.33) |
| Distributions from net investment income | –C | – | (.04) | (.08) | (.11) | – |
| Distributions from net realized gain | (.01) | – | (.01) | (.08) | (.05) | – |
| Total distributions | (.01) | – | (.05) | (.16) | (.16) | – |
| Redemption fees added to paid in capitalB | –C | –C | –C | .01 | –C | .01 |
| Net asset value, end of period | $11.33 | $11.85 | $11.62 | $11.96 | $9.28 | $9.51 |
| Total ReturnD,E,F | (4.32)% | 1.98% | (2.42)% | 31.04% | (.75)% | (12.19)% |
| Ratios to Average Net AssetsG,H | ||||||
| Expenses before reductions | 1.45%I | 1.43% | 1.54% | 1.55% | 1.70% | 1.48%I |
| Expenses net of fee waivers, if any | 1.45%I | 1.43% | 1.54% | 1.55% | 1.66% | 1.48%I |
| Expenses net of all reductions | 1.45%I | 1.42% | 1.54% | 1.53% | 1.64% | 1.44%I |
| Net investment income (loss) | .17%I | .04% | .10% | .46% | .66% | .74%I |
| Supplemental Data | ||||||
| Net assets, end of period (000 omitted) | $4,457 | $4,809 | $4,104 | $5,357 | $3,934 | $4,643 |
| Portfolio turnover rateJ | 16%I | 35% | 112% | 68% | 52% | 134%K |
A For the period December 14, 2010 (commencement of sale of shares) to October 31, 2011.
B Calculated based on average shares outstanding during the period.
C Amount represents less than $.005 per share.
D Total returns for periods of less than one year are not annualized.
E Total returns would have been lower if certain expenses had not been reduced during the applicable periods shown.
F Total returns do not include the effect of the sales charges.
G Fees and expenses of any underlying Fidelity Central Funds are not included in the Fund's expense ratio. The Fund indirectly bears its proportionate share of the expenses of any underlying Fidelity Central Funds.
H Expense ratios reflect operating expenses of the class. Expenses before reductions do not reflect amounts reimbursed by the investment adviser or reductions from brokerage service arrangements or reductions from other expense offset arrangements and do not represent the amount paid by the class during periods when reimbursements or reductions occur. Expenses net of fee waivers reflect expenses after reimbursement by the investment adviser but prior to reductions from brokerage service arrangements or other expense offset arrangements. Expenses net of all reductions represent the net expenses paid by the class.
I Annualized
J Amount does not include the portfolio activity of any underlying Fidelity Central Funds.
K The portfolio turnover rate does not include the assets acquired in the merger.
See accompanying notes which are an integral part of the financial statements.
Financial Highlights — Fidelity Japan Fund Class B
| Six months ended (Unaudited) April 30, | Years ended October 31, | |||||
| 2016 | 2015 | 2014 | 2013 | 2012 | 2011 A | |
| Selected Per–Share Data | ||||||
| Net asset value, beginning of period | $11.82 | $11.65 | $12.00 | $9.26 | $9.47 | $10.83 |
| Income from Investment Operations | ||||||
| Net investment income (loss)B | (.02) | (.05) | (.04) | –C | .02 | .02 |
| Net realized and unrealized gain (loss) | (.51) | .22 | (.31) | 2.80 | (.14) | (1.39) |
| Total from investment operations | (.53) | .17 | (.35) | 2.80 | (.12) | (1.37) |
| Distributions from net investment income | – | – | – | – | (.04) | – |
| Distributions from net realized gain | – | – | – | (.07) | (.05) | – |
| Total distributions | – | – | – | (.07) | (.09) | – |
| Redemption fees added to paid in capitalB | –C | –C | –C | .01 | –C | .01 |
| Net asset value, end of period | $11.29 | $11.82 | $11.65 | $12.00 | $9.26 | $9.47 |
| Total ReturnD,E,F | (4.48)% | 1.46% | (2.92)% | 30.52% | (1.24)% | (12.56)% |
| Ratios to Average Net AssetsG,H | ||||||
| Expenses before reductions | 1.91%I | 1.91% | 2.02% | 2.02% | 2.17% | 1.95%I |
| Expenses net of fee waivers, if any | 1.91%I | 1.91% | 2.02% | 2.02% | 2.13% | 1.95%I |
| Expenses net of all reductions | 1.91%I | 1.91% | 2.02% | 2.01% | 2.11% | 1.91%I |
| Net investment income (loss) | (.29)%I | (.45)% | (.37)% | (.02)% | .19% | .27%I |
| Supplemental Data | ||||||
| Net assets, end of period (000 omitted) | $181 | $348 | $452 | $874 | $1,012 | $1,458 |
| Portfolio turnover rateJ | 16%I | 35% | 112% | 68% | 52% | 134%K |
A For the period December 14, 2010 (commencement of sale of shares) to October 31, 2011.
B Calculated based on average shares outstanding during the period.
C Amount represents less than $.005 per share.
D Total returns for periods of less than one year are not annualized.
E Total returns would have been lower if certain expenses had not been reduced during the applicable periods shown.
F Total returns do not include the effect of the contingent deferred sales charge.
G Fees and expenses of any underlying Fidelity Central Funds are not included in the Fund's expense ratio. The Fund indirectly bears its proportionate share of the expenses of any underlying Fidelity Central Funds.
H Expense ratios reflect operating expenses of the class. Expenses before reductions do not reflect amounts reimbursed by the investment adviser or reductions from brokerage service arrangements or reductions from other expense offset arrangements and do not represent the amount paid by the class during periods when reimbursements or reductions occur. Expenses net of fee waivers reflect expenses after reimbursement by the investment adviser but prior to reductions from brokerage service arrangements or other expense offset arrangements. Expenses net of all reductions represent the net expenses paid by the class.
I Annualized
J Amount does not include the portfolio activity of any underlying Fidelity Central Funds.
K The portfolio turnover rate does not include the assets acquired in the merger.
See accompanying notes which are an integral part of the financial statements.
Financial Highlights — Fidelity Japan Fund Class C
| Six months ended (Unaudited) April 30, | Years ended October 31, | |||||
| 2016 | 2015 | 2014 | 2013 | 2012 | 2011 A | |
| Selected Per–Share Data | ||||||
| Net asset value, beginning of period | $11.77 | $11.58 | $11.96 | $9.25 | $9.48 | $10.83 |
| Income from Investment Operations | ||||||
| Net investment income (loss)B | (.01) | (.04) | (.03) | –C | .02 | .03 |
| Net realized and unrealized gain (loss) | (.52) | .23 | (.32) | 2.79 | (.14) | (1.39) |
| Total from investment operations | (.53) | .19 | (.35) | 2.79 | (.12) | (1.36) |
| Distributions from net investment income | – | – | (.03) | (.01) | (.06) | – |
| Distributions from net realized gain | – | – | (.01) | (.08) | (.05) | – |
| Total distributions | – | – | (.03)D | (.09) | (.11) | – |
| Redemption fees added to paid in capitalB | –C | –C | –C | .01 | –C | .01 |
| Net asset value, end of period | $11.24 | $11.77 | $11.58 | $11.96 | $9.25 | $9.48 |
| Total ReturnE,F,G | (4.50)% | 1.64% | (2.90)% | 30.55% | (1.27)% | (12.47)% |
| Ratios to Average Net AssetsH,I | ||||||
| Expenses before reductions | 1.83%J | 1.81% | 1.93% | 1.97% | 2.15% | 1.92%J |
| Expenses net of fee waivers, if any | 1.82%J | 1.81% | 1.93% | 1.97% | 2.11% | 1.92%J |
| Expenses net of all reductions | 1.82%J | 1.80% | 1.93% | 1.95% | 2.09% | 1.88%J |
| Net investment income (loss) | (.21)%J | (.34)% | (.29)% | .04% | .21% | .30%J |
| Supplemental Data | ||||||
| Net assets, end of period (000 omitted) | $16,282 | $18,491 | $13,162 | $11,824 | $7,015 | $8,750 |
| Portfolio turnover rateK | 16%J | 35% | 112% | 68% | 52% | 134%L |
A For the period December 14, 2010 (commencement of sale of shares) to October 31, 2011.
B Calculated based on average shares outstanding during the period.
C Amount represents less than $.005 per share.
D Total distributions of $.03 per share is comprised of distributions from net investment income of $.025 and distributions from net realized gain of $.009 per share.
E Total returns for periods of less than one year are not annualized.
F Total returns would have been lower if certain expenses had not been reduced during the applicable periods shown.
G Total returns do not include the effect of the contingent deferred sales charge.
H Fees and expenses of any underlying Fidelity Central Funds are not included in the Fund's expense ratio. The Fund indirectly bears its proportionate share of the expenses of any underlying Fidelity Central Funds.
I Expense ratios reflect operating expenses of the class. Expenses before reductions do not reflect amounts reimbursed by the investment adviser or reductions from brokerage service arrangements or reductions from other expense offset arrangements and do not represent the amount paid by the class during periods when reimbursements or reductions occur. Expenses net of fee waivers reflect expenses after reimbursement by the investment adviser but prior to reductions from brokerage service arrangements or other expense offset arrangements. Expenses net of all reductions represent the net expenses paid by the class.
J Annualized
K Amount does not include the portfolio activity of any underlying Fidelity Central Funds.
L The portfolio turnover rate does not include the assets acquired in the merger.
See accompanying notes which are an integral part of the financial statements.
Financial Highlights — Fidelity Japan Fund
| Six months ended (Unaudited) April 30, | Years ended October 31, | |||||
| 2016 | 2015 | 2014 | 2013 | 2012 | 2011 | |
| Selected Per–Share Data | ||||||
| Net asset value, beginning of period | $11.91 | $11.69 | $12.03 | $9.34 | $9.57 | $10.57 |
| Income from Investment Operations | ||||||
| Net investment income (loss)A | .05 | .08 | .09 | .12 | .12 | .15 |
| Net realized and unrealized gain (loss) | (.51) | .23 | (.32) | 2.79 | (.14) | (.75) |
| Total from investment operations | (.46) | .31 | (.23) | 2.91 | (.02) | (.60) |
| Distributions from net investment income | (.07) | (.09) | (.11) | (.15) | (.16) | (.20) |
| Distributions from net realized gain | (.01) | – | (.01) | (.08) | (.05) | (.21) |
| Total distributions | (.08) | (.09) | (.11)B | (.23) | (.21) | (.41) |
| Redemption fees added to paid in capitalA | –C | –C | –C | .01 | –C | .01 |
| Net asset value, end of period | $11.37 | $11.91 | $11.69 | $12.03 | $9.34 | $9.57 |
| Total ReturnD,E | (3.93)% | 2.66% | (1.90)% | 31.92% | (.19)% | (6.00)% |
| Ratios to Average Net AssetsF,G | ||||||
| Expenses before reductions | .80%H | .80% | .90% | .93% | 1.09% | .86% |
| Expenses net of fee waivers, if any | .80%H | .80% | .90% | .93% | 1.06% | .84% |
| Expenses net of all reductions | .80%H | .79% | .90% | .91% | 1.04% | .80% |
| Net investment income (loss) | .82%H | .67% | .74% | 1.08% | 1.26% | 1.38% |
| Supplemental Data | ||||||
| Net assets, end of period (000 omitted) | $365,290 | $485,803 | $415,612 | $480,773 | $353,550 | $450,417 |
| Portfolio turnover rateI | 16%H | 35% | 112% | 68% | 52% | 134%J |
A Calculated based on average shares outstanding during the period.
B Total distributions of $.11 per share is comprised of distributions from net investment income of $.105 and distributions from net realized gain of $.009 per share.
C Amount represents less than $.005 per share.
D Total returns for periods of less than one year are not annualized.
E Total returns would have been lower if certain expenses had not been reduced during the applicable periods shown.
F Fees and expenses of any underlying Fidelity Central Funds are not included in the Fund's expense ratio. The Fund indirectly bears its proportionate share of the expenses of any underlying Fidelity Central Funds.
G Expense ratios reflect operating expenses of the class. Expenses before reductions do not reflect amounts reimbursed by the investment adviser or reductions from brokerage service arrangements or reductions from other expense offset arrangements and do not represent the amount paid by the class during periods when reimbursements or reductions occur. Expenses net of fee waivers reflect expenses after reimbursement by the investment adviser but prior to reductions from brokerage service arrangements or other expense offset arrangements. Expenses net of all reductions represent the net expenses paid by the class.
H Annualized
I Amount does not include the portfolio activity of any underlying Fidelity Central Funds.
J The portfolio turnover rate does not include the assets acquired in the merger.
See accompanying notes which are an integral part of the financial statements.
Financial Highlights — Fidelity Japan Fund Class I
| Six months ended (Unaudited) April 30, | Years ended October 31, | |||||
| 2016 | 2015 | 2014 | 2013 | 2012 | 2011 A | |
| Selected Per–Share Data | ||||||
| Net asset value, beginning of period | $11.89 | $11.67 | $12.02 | $9.33 | $9.57 | $10.83 |
| Income from Investment Operations | ||||||
| Net investment income (loss)B | .05 | .08 | .09 | .13 | .12 | .13 |
| Net realized and unrealized gain (loss) | (.52) | .23 | (.32) | 2.78 | (.14) | (1.40) |
| Total from investment operations | (.47) | .31 | (.23) | 2.91 | (.02) | (1.27) |
| Distributions from net investment income | (.07) | (.09) | (.12) | (.15) | (.17) | – |
| Distributions from net realized gain | (.01) | – | (.01) | (.08) | (.05) | – |
| Total distributions | (.07)C | (.09) | (.12)D | (.23) | (.22) | – |
| Redemption fees added to paid in capitalB | –E | –E | –E | .01 | –E | .01 |
| Net asset value, end of period | $11.35 | $11.89 | $11.67 | $12.02 | $9.33 | $9.57 |
| Total ReturnF,G | (3.97)% | 2.72% | (1.90)% | 32.04% | (.18)% | (11.63)% |
| Ratios to Average Net AssetsH,I | ||||||
| Expenses before reductions | .78%J | .80% | .89% | .90% | 1.03% | .79%J |
| Expenses net of fee waivers, if any | .78%J | .80% | .89% | .90% | 1.01% | .79%J |
| Expenses net of all reductions | .78%J | .79% | .89% | .88% | .99% | .75%J |
| Net investment income (loss) | .84%J | .67% | .76% | 1.11% | 1.31% | 1.43%J |
| Supplemental Data | ||||||
| Net assets, end of period (000 omitted) | $6,267 | $13,957 | $20,253 | $20,033 | $1,488 | $2,715 |
| Portfolio turnover rateK | 16%J | 35% | 112% | 68% | 52% | 134%L |
A For the period December 14, 2010 (commencement of sale of shares) to October 31, 2011.
B Calculated based on average shares outstanding during the period.
C Total distributions of $.07 per share is comprised of distributions from net investment income of $.065 and distributions from net realized gain of $.006 per share.
D Total distributions of $.12 per share is comprised of distributions from net investment income of $.115 and distributions from net realized gain of $.009 per share.
E Amount represents less than $.005 per share.
F Total returns for periods of less than one year are not annualized.
G Total returns would have been lower if certain expenses had not been reduced during the applicable periods shown.
H Fees and expenses of any underlying Fidelity Central Funds are not included in the Fund's expense ratio. The Fund indirectly bears its proportionate share of the expenses of any underlying Fidelity Central Funds.
I Expense ratios reflect operating expenses of the class. Expenses before reductions do not reflect amounts reimbursed by the investment adviser or reductions from brokerage service arrangements or reductions from other expense offset arrangements and do not represent the amount paid by the class during periods when reimbursements or reductions occur. Expenses net of fee waivers reflect expenses after reimbursement by the investment adviser but prior to reductions from brokerage service arrangements or other expense offset arrangements. Expenses net of all reductions represent the net expenses paid by the class.
J Annualized
K Amount does not include the portfolio activity of any underlying Fidelity Central Funds.
L The portfolio turnover rate does not include the assets acquired in the merger.
See accompanying notes which are an integral part of the financial statements.
Notes to Financial Statements (Unaudited)
For the period ended April 30, 2016
1. Organization.
Fidelity Japan Fund (the Fund) is a fund of Fidelity Investment Trust (the Trust) and is authorized to issue an unlimited number of shares. The Trust is registered under the Investment Company Act of 1940, as amended (the 1940 Act), as an open-end management investment company organized as a Massachusetts business trust. The Fund offers Class A, Class T, Class C, Japan and Class I shares, each of which, along with Class B shares, has equal rights as to assets and voting privileges. Class B shares are closed to new accounts and additional purchases, except for exchanges and reinvestments. Each class has exclusive voting rights with respect to matters that affect that class. Class B shares will automatically convert to Class A shares after a maximum holding period of seven years from the initial date of purchase.
During the period, the Board of Trustees approved the conversion of all existing Class B shares into Class A shares, effective on or about July 1, 2016, regardless of the length of times shares have been held.
2. Investments in Fidelity Central Funds.
The Fund invests in Fidelity Central Funds, which are open-end investment companies generally available only to other investment companies and accounts managed by the investment adviser and its affiliates. The Fund's Schedule of Investments lists each of the Fidelity Central Funds held as of period end, if any, as an investment of the Fund, but does not include the underlying holdings of each Fidelity Central Fund. As an Investing Fund, the Fund indirectly bears its proportionate share of the expenses of the underlying Fidelity Central Funds.
The Money Market Central Funds seek preservation of capital and current income and are managed by Fidelity Investments Money Management, Inc. (FIMM), an affiliate of the investment adviser. Annualized expenses of the Money Market Central Funds as of their most recent shareholder report date are less than .005%.
A complete unaudited list of holdings for each Fidelity Central Fund is available upon request or at the Securities and Exchange Commission (the SEC) website at www.sec.gov. In addition, the financial statements of the Fidelity Central Funds are available on the SEC website or upon request.
3. Significant Accounting Policies.
The financial statements have been prepared in conformity with accounting principles generally accepted in the United States of America (GAAP), which require management to make certain estimates and assumptions at the date of the financial statements. Actual results could differ from those estimates. Subsequent events, if any, through the date that the financial statements were issued have been evaluated in the preparation of the financial statements. The following summarizes the significant accounting policies of the Fund:
Investment Valuation. Investments are valued as of 4:00 p.m. Eastern time on the last calendar day of the period. The Board of Trustees (the Board) has delegated the day to day responsibility for the valuation of the Fund's investments to the Fidelity Management & Research Company (FMR) Fair Value Committee (the Committee). In accordance with valuation policies and procedures approved by the Board, the Fund attempts to obtain prices from one or more third party pricing vendors or brokers to value its investments. When current market prices, quotations or currency exchange rates are not readily available or reliable, investments will be fair valued in good faith by the Committee, in accordance with procedures adopted by the Board. Factors used in determining fair value vary by investment type and may include market or investment specific events. The frequency with which these procedures are used cannot be predicted and they may be utilized to a significant extent. The Committee oversees the Fund's valuation policies and procedures and reports to the Board on the Committee's activities and fair value determinations. The Board monitors the appropriateness of the procedures used in valuing the Fund's investments and ratifies the fair value determinations of the Committee.
The Fund categorizes the inputs to valuation techniques used to value its investments into a disclosure hierarchy consisting of three levels as shown below:
- Level 1 – quoted prices in active markets for identical investments
- Level 2 – other significant observable inputs (including quoted prices for similar investments, interest rates, prepayment speeds, etc.)
- Level 3 – unobservable inputs (including the Fund's own assumptions based on the best information available)
Valuation techniques used to value the Fund's investments by major category are as follows:
Equity securities, including restricted securities, for which market quotations are readily available, are valued at the last reported sale price or official closing price as reported by a third party pricing vendor on the primary market or exchange on which they are traded and are categorized as Level 1 in the hierarchy. In the event there were no sales during the day or closing prices are not available, securities are valued at the last quoted bid price or may be valued using the last available price and are generally categorized as Level 2 in the hierarchy. For foreign equity securities, when market or security specific events arise, comparisons to the valuation of American Depositary Receipts (ADRs), futures contracts, Exchange-Traded Funds (ETFs) and certain indexes as well as quoted prices for similar securities may be used and would be categorized as Level 2 in the hierarchy. Utilizing these techniques may result in transfers between Level 1 and Level 2. For equity securities, including restricted securities, where observable inputs are limited, assumptions about market activity and risk are used and these securities may be categorized as Level 3 in the hierarchy.
Investments in open-end mutual funds, including the Fidelity Central Funds, are valued at their closing net asset value (NAV) each business day and are categorized as Level 1 in the hierarchy.
Changes in valuation techniques may result in transfers in or out of an assigned level within the disclosure hierarchy. The aggregate value of investments by input level as of April 30, 2016 is included at the end of the Fund's Schedule of Investments.
Foreign Currency. The Fund may use foreign currency contracts to facilitate transactions in foreign-denominated securities. Gains and losses from these transactions may arise from changes in the value of the foreign currency or if the counterparties do not perform under the contracts' terms.
Foreign-denominated assets, including investment securities, and liabilities are translated into U.S. dollars at the exchange rates at period end. Purchases and sales of investment securities, income and dividends received and expenses denominated in foreign currencies are translated into U.S. dollars at the exchange rate in effect on the transaction date.
The effects of exchange rate fluctuations on investments are included with the net realized and unrealized gain (loss) on investment securities. Other foreign currency transactions resulting in realized and unrealized gain (loss) are disclosed separately.
Investment Transactions and Income. For financial reporting purposes, the Fund's investment holdings and NAV include trades executed through the end of the last business day of the period. The NAV per share for processing shareholder transactions is calculated as of the close of business of the New York Stock Exchange (NYSE), normally 4:00 p.m. Eastern time and includes trades executed through the end of the prior business day. Gains and losses on securities sold are determined on the basis of identified cost. Dividend income is recorded on the ex-dividend date, except for certain dividends from foreign securities where the ex-dividend date may have passed, which are recorded as soon as the Fund is informed of the ex-dividend date. Non-cash dividends included in dividend income, if any, are recorded at the fair market value of the securities received. Income and capital gain distributions from Fidelity Central Funds, if any, are recorded on the ex-dividend date. Investment income is recorded net of foreign taxes withheld where recovery of such taxes is uncertain.
Class Allocations and Expenses. Investment income, realized and unrealized capital gains and losses, common expenses of the Fund, and certain fund-level expense reductions, if any, are allocated daily on a pro-rata basis to each class based on the relative net assets of each class to the total net assets of the Fund. Each class differs with respect to transfer agent and distribution and service plan fees incurred. Certain expense reductions may also differ by class. For the reporting period, the allocated portion of income and expenses to each class as a percent of its average net assets may vary due to the timing of recording these transactions in relation to fluctuating net assets of the classes. Expenses directly attributable to a fund are charged to that fund. Expenses attributable to more than one fund are allocated among the respective funds on the basis of relative net assets or other appropriate methods. Expense estimates are accrued in the period to which they relate and adjustments are made when actual amounts are known.
Income Tax Information and Distributions to Shareholders. Each year, the Fund intends to qualify as a regulated investment company under Subchapter M of the Internal Revenue Code, including distributing substantially all of its taxable income and realized gains. As a result, no provision for U.S. Federal income taxes is required. The Fund files a U.S. federal tax return, in addition to state and local tax returns as required. The Fund's federal income tax returns are subject to examination by the Internal Revenue Service (IRS) for a period of three fiscal years after they are filed. State and local tax returns may be subject to examination for an additional fiscal year depending on the jurisdiction. Foreign taxes are provided for based on the Fund's understanding of the tax rules and rates that exist in the foreign markets in which it invests.
Distributions are declared and recorded on the ex-dividend date. Income dividends and capital gain distributions are declared separately for each class. Income and capital gain distributions are determined in accordance with income tax regulations, which may differ from GAAP.
Capital accounts within the financial statements are adjusted for permanent book-tax differences. These adjustments have no impact on net assets or the results of operations. Capital accounts are not adjusted for temporary book-tax differences which will reverse in a subsequent period.
Book-tax differences are primarily due to foreign currency transactions, passive foreign investment companies (PFIC), expiring capital loss carryforwards, deferred trustees compensation, capital loss carryforwards and losses deferred due to wash sales.
The federal tax cost of investment securities and unrealized appreciation (depreciation) as of period end were as follows:
| Gross unrealized appreciation | $39,767,246 |
| Gross unrealized depreciation | (52,790,805) |
| Net unrealized appreciation (depreciation) on securities | $(13,023,559) |
| Tax cost | $434,543,849 |
Capital loss carryforwards are only available to offset future capital gains of the Fund to the extent provided by regulations and may be limited. Under the Regulated Investment Company Modernization Act of 2010 (the Act), the Fund is permitted to carry forward capital losses incurred in taxable years beginning after December 22, 2010 for an unlimited period and such capital losses are required to be used prior to any losses that expire. The capital loss carryforward information presented below, including any applicable limitation, is estimated as of prior fiscal period end and is subject to adjustment.
| Fiscal year of expiration | |
| 2016 | $(3,870,588) |
| 2017 | (41,604,070) |
| 2018 | (26,887,863) |
| 2019 | (98,806,037) |
| Total with expiration | (171,168,558) |
| No expiration | |
| Short-term | (6,850,642) |
| Total capital loss carryforward | $(178,019,200) |
Due to large redemptions in a prior period, $141,955,883 of capital losses that will be available to offset future capital gains of the Fund will be limited to approximately $18,885,324 per year.
The Fund acquired $5,487,891 of its capital loss carryforward as part of a merger in a prior period. The losses acquired that will be available to offset future capital gains of the Fund will be limited to approximately $1,371,973 per year.
Short-Term Trading (Redemption) Fees. Shares held by investors in the Fund less than 90 days may have been subject to a redemption fee equal to 1.50% of the NAV of shares redeemed. All redemption fees, which reduce the proceeds of the shareholder redemption, are retained by the Fund and accounted for as an addition to paid in capital.
Delayed Delivery Transactions and When-Issued Securities. During the period, the Fund transacted in securities on a delayed delivery or when-issued basis. Payment and delivery may take place after the customary settlement period for that security. The price of the underlying securities and the date when the securities will be delivered and paid for are fixed at the time the transaction is negotiated. The securities purchased on a delayed delivery or when-issued basis are identified as such in the Fund's Schedule of Investments. With respect to purchase commitments, the Fund identifies securities as segregated in its records with a value at least equal to the amount of the commitment. Losses may arise due to changes in the value of the underlying securities or if the counterparty does not perform under the contract's terms, or if the issuer does not issue the securities due to political, economic, or other factors.
4. Purchases and Sales of Investments.
Purchases and sales of securities, other than short-term securities, aggregated $38,419,518 and $137,061,828, respectively.
5. Fees and Other Transactions with Affiliates.
Management Fee. Fidelity Management & Research Company (the investment adviser) and its affiliates provide the Fund with investment management related services for which the Fund pays a monthly management fee. The management fee is the sum of an individual fund fee rate that is based on an annual rate of .45% of the Fund's average net assets and an annualized group fee rate that averaged .25% during the period. The group fee rate is based upon the average net assets of all the mutual funds advised by the investment adviser, including any mutual funds previously advised by the investment adviser that are currently advised by Fidelity SelectCo, LLC, an affiliate of the investment adviser. The group fee rate decreases as assets under management increase and increases as assets under management decrease. In addition, the management fee is subject to a performance adjustment (up to a maximum of +/- .20% of the Fund's average net assets over a 36 month performance period). The upward or downward adjustment to the management fee is based on the relative investment performance of Japan as compared to its benchmark index, the TOPIX, over the same 36 month performance period. For the reporting period, the total annualized management fee rate, including the performance adjustment, was .50% of the Fund's average net assets. The performance adjustment included in the management fee rate may be higher or lower than the maximum performance adjustment rate due to the difference between the average net assets for the reporting and performance periods.
Distribution and Service Plan Fees. In accordance with Rule 12b-1 of the 1940 Act, the Fund has adopted separate Distribution and Service Plans for each class of shares. Certain classes pay Fidelity Distributors Corporation (FDC), an affiliate of the investment adviser, separate Distribution and Service Fees, each of which is based on an annual percentage of each class' average net assets. In addition, FDC may pay financial intermediaries for selling shares of the Fund and providing shareholder support services. For the period, the Distribution and Service Fee rates, total fees and amounts retained by FDC were as follows:
| Distribution Fee | Service Fee | Total Fees | Retained by FDC | |
| Class A | -% | .25% | $33,499 | $6,368 |
| Class T | .25% | .25% | 11,518 | 9 |
| Class B | .75% | .25% | 1,235 | 928 |
| Class C | .75% | .25% | 87,060 | 27,400 |
| $133,312 | $34,705 |
Sales Load. FDC may receive a front-end sales charge of up to 5.75% for selling Class A shares and 3.50% for selling Class T shares, some of which is paid to financial intermediaries for selling shares of the Fund. Depending on the holding period, FDC may receive contingent deferred sales charges levied on Class A, Class T, Class B, and Class C redemptions. The deferred sales charges range from 5.00% to 1.00% for Class B shares, 1.00% for Class C shares, 1.00% for certain purchases of Class A shares and .25% for certain purchases of Class T shares.
For the period, sales charge amounts retained by FDC were as follows:
| Retained by FDC | |
| Class A | $4,707 |
| Class T | 724 |
| Class B(a) | 48 |
| Class C(a) | 2,736 |
| $8,215 |
(a) When Class B and Class C shares are initially sold, FDC pays commissions from its own resources to financial intermediaries through which the sales are made.
Transfer Agent Fees. Fidelity Investments Institutional Operations Company, Inc., (FIIOC), an affiliate of the investment adviser, is the transfer, dividend disbursing and shareholder servicing agent for each class of the Fund. FIIOC receives account fees and asset-based fees that vary according to the account size and type of account of the shareholders of the respective classes of the Fund. FIIOC pays for typesetting, printing and mailing of shareholder reports, except proxy statements.
For the period, transfer agent fees for each class were as follows:
| Amount | % of Class-Level Average Net Assets(a) | |
| Class A | $31,613 | .24 |
| Class T | 7,877 | .34 |
| Class B | 374 | .30 |
| Class C | 19,011 | .22 |
| Japan | 419,330 | .19 |
| Class I | 7,970 | .18 |
| $486,175 |
(a) Annualized
Accounting and Security Lending Fees. Fidelity Service Company, Inc. (FSC), an affiliate of the investment adviser, maintains the Fund's accounting records. The accounting fee is based on the level of average net assets for each month. Under a separate contract, FSC administers the security lending program. The security lending fee is based on the number and duration of lending transactions.
Brokerage Commissions. The Fund placed a portion of its portfolio transactions with brokerage firms which are affiliates of the investment adviser. Brokerage commissions are included in net realized gain (loss) and change in net unrealized appreciation (depreciation) in the Statement of Operations. The commissions paid to these affiliated firms were $11 for the period.
Interfund Lending Program. Pursuant to an Exemptive Order issued by the SEC, the Fund, along with other registered investment companies having management contracts with FMR or other affiliated entities of FMR, may participate in an interfund lending program. This program provides an alternative credit facility allowing the funds to borrow from, or lend money to, other participating affiliated funds. At period end, there were no interfund loans outstanding. The Fund's activity in this program during the period for which loans were outstanding was as follows:
| Borrower or Lender | Average Loan Balance | Weighted Average Interest Rate | Interest Expense |
| Borrower | $4,817,143 | .62% | $1,750 |
Interfund Trades. The Fund may purchase from or sell securities to other Fidelity Funds under procedures adopted by the Board. The procedures have been designed to ensure these interfund trades are executed in accordance with Rule 17a-7 of the 1940 Act. Interfund trades are included within the respective purchases and sales amounts shown in the Purchases and Sales of Investments note.
6. Committed Line of Credit.
The Fund participates with other funds managed by the investment adviser or an affiliate in a $4.25 billion credit facility (the "line of credit") to be utilized for temporary or emergency purposes to fund shareholder redemptions or for other short-term liquidity purposes. The Fund has agreed to pay commitment fees on its pro-rata portion of the line of credit, which amounted to $461 and is reflected in Miscellaneous expenses on the Statement of Operations. During the period, the Fund did not borrow on this line of credit.
7. Security Lending.
The Fund lends portfolio securities through a lending agent from time to time in order to earn additional income. For equity securities, a lending agent is used and may loan securities to certain qualified borrowers, including Fidelity Capital Markets (FCM), a broker-dealer affiliated with the Fund. On the settlement date of the loan, the Fund receives collateral (in the form of U.S. Treasury obligations, letters of credit and/or cash) against the loaned securities and maintains collateral in an amount not less than 100% of the market value of the loaned securities during the period of the loan. The market value of the loaned securities is determined at the close of business of the Fund and any additional required collateral is delivered to the Fund on the next business day. The Fund or borrower may terminate the loan at any time, and if the borrower defaults on its obligation to return the securities loaned because of insolvency or other reasons, the Fund may apply collateral received from the borrower against the obligation. The Fund may experience delays and costs in recovering the securities loaned. Any cash collateral received is invested in the Fidelity Securities Lending Cash Central Fund. The value of loaned securities and cash collateral at period end are disclosed on the Fund's Statement of Assets and Liabilities. Security lending income represents the income earned on investing cash collateral, less rebates paid to borrowers and any lending agent fees associated with the loan, plus any premium payments received for lending certain types of securities. Security lending income is presented in the Statement of Operations as a component of income from Fidelity Central Funds. Total security lending income during the period amounted to $61,820. During the period, there were no securities loaned to FCM.
8. Expense Reductions.
Commissions paid to certain brokers with whom the investment adviser, or its affiliates, places trades on behalf of the Fund include an amount in addition to trade execution, which may be rebated back to the Fund to offset certain expenses. This amount totaled $14 for the period.
In addition, during the period the investment adviser reimbursed and/or waived a portion of fund-level operating expenses in the amount of $1,964.
9. Distributions to Shareholders.
Distributions to shareholders of each class were as follows:
| Six months ended April 30, 2016 | Year ended October 31, 2015 | |
| From net investment income | ||
| Class A | $121,415 | $79,823 |
| Class T | 822 | – |
| Japan | 2,828,514 | 3,066,127 |
| Class I | 76,342 | 164,482 |
| Total | $3,027,093 | $3,310,432 |
| From net realized gain | ||
| Class A | $14,867 | $– |
| Class T | 2,466 | – |
| Japan | 245,958 | – |
| Class I | 7,047 | – |
| Total | $270,338 | $– |
10. Share Transactions.
Share transactions for each class were as follows and may contain automatic conversions between classes or exchanges between affiliated funds:
| Shares | Shares | Dollars | Dollars | |
| Six months ended April 30, 2016 | Year ended October 31, 2015 | Six months ended April 30, 2016 | Year ended October 31, 2015 | |
| Class A | ||||
| Shares sold | 712,093 | 1,104,408 | $8,422,405 | $13,420,485 |
| Reinvestment of distributions | 10,746 | 6,565 | 128,096 | 74,452 |
| Shares redeemed | (483,042) | (929,216) | (5,489,451) | (10,724,499) |
| Net increase (decrease) | 239,797 | 181,757 | $3,061,050 | $2,770,438 |
| Class T | ||||
| Shares sold | 25,621 | 180,232 | $295,497 | $2,170,519 |
| Reinvestment of distributions | 269 | – | 3,216 | – |
| Shares redeemed | (38,565) | (127,640) | (437,379) | (1,490,023) |
| Net increase (decrease) | (12,675) | 52,592 | $(138,666) | $680,496 |
| Class B | ||||
| Shares sold | 1,967 | 711 | $21,929 | $8,779 |
| Shares redeemed | (15,310) | (10,106) | (175,368) | (116,253) |
| Net increase (decrease) | (13,343) | (9,395) | $(153,439) | $(107,474) |
| Class C | ||||
| Shares sold | 165,967 | 747,753 | $1,902,846 | $8,932,993 |
| Shares redeemed | (289,191) | (312,924) | (3,216,909) | (3,580,602) |
| Net increase (decrease) | (123,224) | 434,829 | $(1,314,063) | $5,352,391 |
| Japan | ||||
| Shares sold | 1,365,848 | 18,408,352 | $15,813,773 | $225,875,166 |
| Reinvestment of distributions | 251,274 | 262,630 | 3,000,214 | 2,980,854 |
| Shares redeemed | (10,270,898) | (13,426,033) | (114,820,865) | (161,325,584) |
| Net increase (decrease) | (8,653,776) | 5,244,949 | $(96,006,878) | $67,530,436 |
| Class I | ||||
| Shares sold | 153,380 | 1,688,546 | $1,788,502 | $20,578,143 |
| Reinvestment of distributions | 6,575 | 14,222 | 78,372 | 161,134 |
| Shares redeemed | (781,968) | (2,263,385) | (8,957,709) | (26,061,475) |
| Net increase (decrease) | (622,013) | (560,617) | $(7,090,835) | $(5,322,198) |
11. Other.
The Fund's organizational documents provide former and current trustees and officers with a limited indemnification against liabilities arising in connection with the performance of their duties to the Fund. In the normal course of business, the Fund may also enter into contracts that provide general indemnifications. The Fund's maximum exposure under these arrangements is unknown as this would be dependent on future claims that may be made against the Fund. The risk of material loss from such claims is considered remote.
At the end of the period, Strategic Advisers International Fund and Strategic Advisers International II Fund were the owners of record of approximately 28% and 11%, respectively, of the total outstanding shares of the Fund. Mutual Funds managed by the investment adviser of its affiliates were the owners of record, in the aggregate, of approximately 47% of the total outstanding shares of the Fund.
Shareholder Expense Example
As a shareholder of the Fund, you incur two types of costs: (1) transaction costs, including sales charges (loads) on purchase payments or redemption proceeds, redemption fees and (2) ongoing costs, including management fees, distribution and/or service (12b-1) fees and other Fund expenses. This Example is intended to help you understand your ongoing costs (in dollars) of investing in the Fund and to compare these costs with the ongoing costs of investing in other mutual funds.
The Example is based on an investment of $1,000 invested at the beginning of the period and held for the entire period (November 1, 2015 to April 30, 2016).
Actual Expenses
The first line of the accompanying table for each class of the Fund provides information about actual account values and actual expenses. You may use the information in this line, together with the amount you invested, to estimate the expenses that you paid over the period. Simply divide your account value by $1,000.00 (for example, an $8,600 account value divided by $1,000.00 = 8.6), then multiply the result by the number in the first line for a class of the Fund under the heading entitled "Expenses Paid During Period" to estimate the expenses you paid on your account during this period. A small balance maintenance fee of $12.00 that is charged once a year may apply for certain accounts with a value of less than $2,000. This fee is not included in the table below. If it was, the estimate of expenses you paid during the period would be higher, and your ending account value lower, by this amount. In addition, the Fund, as a shareholder in the underlying Fidelity Central Funds, will indirectly bear its pro-rata share of the fees and expenses incurred by the underlying Fidelity Central Funds. These fees and expenses are not included in the Fund's annualized expense ratio used to calculate the expense estimate in the table below.
Hypothetical Example for Comparison Purposes
The second line of the accompanying table for each class of the Fund provides information about hypothetical account values and hypothetical expenses based on a Class' actual expense ratio and an assumed rate of return of 5% per year before expenses, which is not the Class' actual return. The hypothetical account values and expenses may not be used to estimate the actual ending account balance or expenses you paid for the period. You may use this information to compare the ongoing costs of investing in the Fund and other funds. To do so, compare this 5% hypothetical example with the 5% hypothetical examples that appear in the shareholder reports of the other funds. A small balance maintenance fee of $12.00 that is charged once a year may apply for certain accounts with a value of less than $2,000. This fee is not included in the table below. If it was, the estimate of expenses you paid during the period would be higher, and your ending account value lower, by this amount. In addition, the Fund, as a shareholder in the underlying Fidelity Central Funds, will indirectly bear its pro-rata share of the fees and expenses incurred by the underlying Fidelity Central Funds. These fees and expenses are not included in the Fund's annualized expense ratio used to calculate the expense estimate in the table below.
Please note that the expenses shown in the table are meant to highlight your ongoing costs only and do not reflect any transaction costs. Therefore, the second line of the table is useful in comparing ongoing costs only, and will not help you determine the relative total costs of owning different funds. In addition, if these transactional costs were included, your costs would have been higher.
| Annualized Expense Ratio-A | Beginning Account Value November 1, 2015 | Ending Account Value April 30, 2016 | Expenses Paid During Period-B November 1, 2015 to April 30, 2016 | |
| Class A | 1.09% | |||
| Actual | $1,000.00 | $958.90 | $5.31 | |
| Hypothetical-C | $1,000.00 | $1,019.44 | $5.47 | |
| Class T | 1.45% | |||
| Actual | $1,000.00 | $956.80 | $7.05 | |
| Hypothetical-C | $1,000.00 | $1,017.65 | $7.27 | |
| Class B | 1.91% | |||
| Actual | $1,000.00 | $955.20 | $9.29 | |
| Hypothetical-C | $1,000.00 | $1,015.37 | $9.57 | |
| Class C | 1.82% | |||
| Actual | $1,000.00 | $955.00 | $8.85 | |
| Hypothetical-C | $1,000.00 | $1,015.81 | $9.12 | |
| Japan | .80% | |||
| Actual | $1,000.00 | $960.70 | $3.90 | |
| Hypothetical-C | $1,000.00 | $1,020.89 | $4.02 | |
| Class I | .78% | |||
| Actual | $1,000.00 | $960.30 | $3.80 | |
| Hypothetical-C | $1,000.00 | $1,020.98 | $3.92 |
A Annualized expense ratio reflects expenses net of applicable fee waivers.
B Expenses are equal to each Class' annualized expense ratio, multiplied by the average account value over the period, multiplied by 182/366 (to reflect the one-half year period).
C 5% return per year before expenses
![]()
AJPNA-SANN-0616
1.917401.105
Fidelity Advisor® Japan Fund - Semi-Annual Report April 30, 2016 Class I is a class of Fidelity® Japan Fund |
|
Contents
To view a fund's proxy voting guidelines and proxy voting record for the 12-month period ended June 30, visit http://www.fidelity.com/proxyvotingresults or visit the Securities and Exchange Commission's (SEC) web site at http://www.sec.gov.
You may also call 1-877-208-0098 to request a free copy of the proxy voting guidelines.
Standard & Poor's, S&P and S&P 500 are registered service marks of The McGraw-Hill Companies, Inc. and have been licensed for use by Fidelity Distributors Corporation.
Other third-party marks appearing herein are the property of their respective owners.
All other marks appearing herein are registered or unregistered trademarks or service marks of FMR LLC or an affiliated company. © 2016 FMR LLC. All rights reserved.
This report and the financial statements contained herein are submitted for the general information of the shareholders of the Fund. This report is not authorized for distribution to prospective investors in the Fund unless preceded or accompanied by an effective prospectus.
A fund files its complete schedule of portfolio holdings with the SEC for the first and third quarters of each fiscal year on Form N-Q. Forms N-Q are available on the SEC’s web site at http://www.sec.gov. A fund's Forms N-Q may be reviewed and copied at the SEC’s Public Reference Room in Washington, DC. Information regarding the operation of the SEC's Public Reference Room may be obtained by calling 1-800-SEC-0330.
For a complete list of a fund's portfolio holdings, view the most recent holdings listing, semiannual report, or annual report on Fidelity's web site at http://www.fidelity.com, http://www.advisor.fidelity.com, or http://www.401k.com, as applicable.
NOT FDIC INSURED •MAY LOSE VALUE •NO BANK GUARANTEE
Neither the Fund nor Fidelity Distributors Corporation is a bank.
Investment Summary (Unaudited)
Geographic Diversification (% of fund's net assets)
| As of April 30, 2016 | ||
| Japan | 98.1% | |
| Cayman Islands | 1.0% | |
| United States of America* | 0.9% | |

* Includes Short-Term investments and Net Other Assets (Liabilities).
Percentages are based on country or territory of incorporation and are adjusted for the effect of futures contracts, if applicable.
| As of October 31, 2015 | ||
| Japan | 95.8% | |
| Korea (South) | 1.7% | |
| United States of America* | 1.4% | |
| Cayman Islands | 0.7% | |
| Singapore | 0.4% | |

* Includes Short-Term investments and Net Other Assets (Liabilities).
Percentages are based on country or territory of incorporation and are adjusted for the effect of futures contracts, if applicable.
Asset Allocation as of April 30, 2016
| % of fund's net assets | % of fund's net assets 6 months ago | |
| Stocks | 99.1 | 98.6 |
| Short-Term Investments and Net Other Assets (Liabilities) | 0.9 | 1.4 |
Top Ten Stocks as of April 30, 2016
| % of fund's net assets | % of fund's net assets 6 months ago | |
| Astellas Pharma, Inc. (Pharmaceuticals) | 5.0 | 4.9 |
| East Japan Railway Co. (Road & Rail) | 4.2 | 4.2 |
| KDDI Corp. (Wireless Telecommunication Services) | 4.1 | 3.3 |
| Hoya Corp. (Health Care Equipment & Supplies) | 3.3 | 3.3 |
| ORIX Corp. (Diversified Financial Services) | 3.3 | 3.0 |
| Mitsubishi UFJ Financial Group, Inc. (Banks) | 3.1 | 4.0 |
| SoftBank Corp. (Wireless Telecommunication Services) | 3.1 | 2.8 |
| Mitsui Fudosan Co. Ltd. (Real Estate Management & Development) | 2.9 | 2.9 |
| Sony Corp. (Household Durables) | 2.6 | 2.6 |
| Japan Tobacco, Inc. (Tobacco) | 2.5 | 1.8 |
| 34.1 |
Market Sectors as of April 30, 2016
| % of fund's net assets | % of fund's net assets 6 months ago | |
| Consumer Discretionary | 20.3 | 19.3 |
| Financials | 16.4 | 19.0 |
| Health Care | 13.5 | 13.3 |
| Information Technology | 12.7 | 13.8 |
| Industrials | 12.7 | 13.8 |
| Consumer Staples | 9.9 | 7.0 |
| Telecommunication Services | 9.1 | 7.2 |
| Materials | 4.5 | 5.2 |
Investments April 30, 2016 (Unaudited)
Showing Percentage of Net Assets
| Common Stocks - 99.1% | |||
| Shares | Value | ||
| CONSUMER DISCRETIONARY - 20.3% | |||
| Auto Components - 3.5% | |||
| Bridgestone Corp. | 161,700 | $5,951,761 | |
| DaikyoNishikawa Corp. | 90,600 | 1,248,546 | |
| NGK Spark Plug Co. Ltd. | 215,400 | 4,295,802 | |
| Sumitomo Electric Industries Ltd. | 249,000 | 2,995,382 | |
| 14,491,491 | |||
| Automobiles - 6.3% | |||
| Fuji Heavy Industries Ltd. | 53,100 | 1,743,538 | |
| Honda Motor Co. Ltd. | 361,300 | 9,749,966 | |
| Isuzu Motors Ltd. | 282,600 | 3,023,900 | |
| Mazda Motor Corp. | 255,100 | 3,886,781 | |
| Suzuki Motor Corp. | 290,200 | 7,952,515 | |
| 26,356,700 | |||
| Hotels, Restaurants & Leisure - 0.7% | |||
| Skylark Co. Ltd. | 230,600 | 2,931,421 | |
| Household Durables - 4.4% | |||
| Casio Computer Co. Ltd. (a) | 189,200 | 3,599,894 | |
| Rinnai Corp. | 43,300 | 3,821,360 | |
| Sony Corp. | 457,600 | 11,083,814 | |
| 18,505,068 | |||
| Internet & Catalog Retail - 1.2% | |||
| Rakuten, Inc. | 317,600 | 3,452,746 | |
| Start Today Co. Ltd. | 35,000 | 1,470,440 | |
| 4,923,186 | |||
| Media - 0.9% | |||
| Dentsu, Inc. | 36,200 | 1,839,286 | |
| Proto Corp. | 160,300 | 2,102,489 | |
| 3,941,775 | |||
| Multiline Retail - 0.4% | |||
| Don Quijote Holdings Co. Ltd. | 50,700 | 1,803,695 | |
| Specialty Retail - 2.9% | |||
| Fast Retailing Co. Ltd. | 11,500 | 3,027,976 | |
| Nitori Holdings Co. Ltd. | 15,600 | 1,451,094 | |
| United Arrows Ltd. | 73,500 | 2,953,390 | |
| USS Co. Ltd. | 179,400 | 2,837,811 | |
| Xebio Holdings Co. Ltd. | 119,300 | 1,902,908 | |
| 12,173,179 | |||
| TOTAL CONSUMER DISCRETIONARY | 85,126,515 | ||
| CONSUMER STAPLES - 9.9% | |||
| Beverages - 1.4% | |||
| Asahi Group Holdings | 177,900 | 5,646,020 | |
| Food & Staples Retailing - 5.1% | |||
| Ain Holdings, Inc. | 35,100 | 1,705,088 | |
| San-A Co. Ltd. | 49,600 | 2,282,993 | |
| Seven & i Holdings Co. Ltd. | 187,900 | 7,666,778 | |
| Sundrug Co. Ltd. | 48,200 | 3,424,890 | |
| Tsuruha Holdings, Inc. | 22,800 | 2,186,877 | |
| Welcia Holdings Co. Ltd. | 77,600 | 4,099,024 | |
| 21,365,650 | |||
| Personal Products - 0.9% | |||
| Kao Corp. | 69,500 | 3,844,530 | |
| Tobacco - 2.5% | |||
| Japan Tobacco, Inc. | 254,400 | 10,394,260 | |
| TOTAL CONSUMER STAPLES | 41,250,460 | ||
| FINANCIALS - 16.4% | |||
| Banks - 5.0% | |||
| Mitsubishi UFJ Financial Group, Inc. | 2,783,300 | 12,844,416 | |
| Seven Bank Ltd. (b) | 986,900 | 4,193,543 | |
| Shinsei Bank Ltd. | 2,892,000 | 4,053,359 | |
| 21,091,318 | |||
| Capital Markets - 0.7% | |||
| Monex Group, Inc. | 1,198,700 | 3,092,308 | |
| Diversified Financial Services - 3.3% | |||
| ORIX Corp. | 961,100 | 13,594,698 | |
| Insurance - 2.4% | |||
| Sony Financial Holdings, Inc. | 214,600 | 2,653,086 | |
| Tokio Marine Holdings, Inc. (c) | 222,300 | 7,274,211 | |
| 9,927,297 | |||
| Real Estate Investment Trusts - 1.5% | |||
| Invincible Investment Corp. | 1,955 | 1,484,493 | |
| LaSalle Logiport REIT | 881 | 803,399 | |
| Nippon Prologis REIT, Inc. | 868 | 2,081,323 | |
| Sekisui House (REIT), Inc. | 1,449 | 1,696,576 | |
| 6,065,791 | |||
| Real Estate Management & Development - 3.5% | |||
| AEON MALL Co. Ltd. | 175,200 | 2,409,551 | |
| Mitsui Fudosan Co. Ltd. | 501,000 | 12,235,639 | |
| 14,645,190 | |||
| TOTAL FINANCIALS | 68,416,602 | ||
| HEALTH CARE - 13.5% | |||
| Biotechnology - 0.5% | |||
| PeptiDream, Inc. (a)(d) | 34,800 | 2,005,743 | |
| Health Care Equipment & Supplies - 5.7% | |||
| Hoya Corp. | 360,200 | 13,793,598 | |
| Olympus Corp. | 264,300 | 10,296,236 | |
| 24,089,834 | |||
| Health Care Providers & Services - 2.3% | |||
| Miraca Holdings, Inc. | 95,900 | 4,075,476 | |
| Ship Healthcare Holdings, Inc. | 225,100 | 5,555,108 | |
| 9,630,584 | |||
| Pharmaceuticals - 5.0% | |||
| Astellas Pharma, Inc. | 1,548,500 | 20,877,795 | |
| TOTAL HEALTH CARE | 56,603,956 | ||
| INDUSTRIALS - 12.7% | |||
| Building Products - 1.3% | |||
| Daikin Industries Ltd. | 67,000 | 5,318,395 | |
| Construction & Engineering - 1.0% | |||
| Toshiba Plant Systems & Services Corp. | 351,700 | 4,349,274 | |
| Electrical Equipment - 2.7% | |||
| Mitsubishi Electric Corp. | 454,000 | 4,824,848 | |
| Nidec Corp. | 91,200 | 6,682,595 | |
| 11,507,443 | |||
| Machinery - 2.4% | |||
| Kubota Corp. | 307,700 | 4,482,221 | |
| Makita Corp. | 86,100 | 5,431,482 | |
| 9,913,703 | |||
| Road & Rail - 4.2% | |||
| East Japan Railway Co. | 198,900 | 17,498,442 | |
| Trading Companies & Distributors - 1.1% | |||
| Misumi Group, Inc. | 321,800 | 4,443,986 | |
| TOTAL INDUSTRIALS | 53,031,243 | ||
| INFORMATION TECHNOLOGY - 12.7% | |||
| Electronic Equipment & Components - 6.9% | |||
| Azbil Corp. | 162,900 | 4,179,734 | |
| Hitachi Ltd. | 1,579,000 | 7,235,334 | |
| OMRON Corp. | 69,200 | 2,196,193 | |
| Shimadzu Corp. | 613,000 | 9,175,097 | |
| TDK Corp. | 55,400 | 3,241,669 | |
| Topcon Corp. | 245,900 | 3,026,938 | |
| 29,054,965 | |||
| Internet Software & Services - 3.7% | |||
| Alibaba Group Holding Ltd. sponsored ADR (d) | 53,100 | 4,085,514 | |
| DeNA Co. Ltd. | 234,300 | 3,943,154 | |
| Kakaku.com, Inc. | 418,800 | 7,543,053 | |
| 15,571,721 | |||
| Semiconductors & Semiconductor Equipment - 0.9% | |||
| Sanken Electric Co. Ltd. (a) | 381,000 | 1,263,105 | |
| Sumco Corp. | 397,300 | 2,515,961 | |
| 3,779,066 | |||
| Software - 0.6% | |||
| COLOPL, Inc. | 117,000 | 2,311,206 | |
| Technology Hardware, Storage & Peripherals - 0.6% | |||
| NEC Corp. | 961,000 | 2,338,857 | |
| TOTAL INFORMATION TECHNOLOGY | 53,055,815 | ||
| MATERIALS - 4.5% | |||
| Chemicals - 4.5% | |||
| Daicel Chemical Industries Ltd. | 208,300 | 2,602,074 | |
| Hitachi Chemical Co. Ltd. | 143,200 | 2,404,863 | |
| Kansai Paint Co. Ltd. | 246,500 | 4,311,200 | |
| Shin-Etsu Chemical Co. Ltd. | 89,600 | 5,018,387 | |
| Toray Industries, Inc. | 538,000 | 4,493,793 | |
| 18,830,317 | |||
| TELECOMMUNICATION SERVICES - 9.1% | |||
| Diversified Telecommunication Services - 1.9% | |||
| Nippon Telegraph & Telephone Corp. | 179,200 | 8,019,259 | |
| Wireless Telecommunication Services - 7.2% | |||
| KDDI Corp. | 600,100 | 17,286,321 | |
| SoftBank Corp. | 237,400 | 12,765,117 | |
| 30,051,438 | |||
| TOTAL TELECOMMUNICATION SERVICES | 38,070,697 | ||
| TOTAL COMMON STOCKS | |||
| (Cost $423,826,962) | 414,385,605 | ||
| Money Market Funds - 1.7% | |||
| Fidelity Cash Central Fund, 0.38% (e) | 1,206,235 | 1,206,235 | |
| Fidelity Securities Lending Cash Central Fund, 0.42% (e)(f) | 5,928,450 | 5,928,450 | |
| TOTAL MONEY MARKET FUNDS | |||
| (Cost $7,134,685) | 7,134,685 | ||
| TOTAL INVESTMENT PORTFOLIO - 100.8% | |||
| (Cost $430,961,647) | 421,520,290 | ||
| NET OTHER ASSETS (LIABILITIES) - (0.8)% | (3,494,368) | ||
| NET ASSETS - 100% | $418,025,922 |
Legend
(a) Security or a portion of the security is on loan at period end.
(b) A portion of the security sold on a delayed delivery basis.
(c) Security or a portion of the security purchased on a delayed delivery or when-issued basis.
(d) Non-income producing
(e) Affiliated fund that is generally available only to investment companies and other accounts managed by Fidelity Investments. The rate quoted is the annualized seven-day yield of the fund at period end. A complete unaudited listing of the fund's holdings as of its most recent quarter end is available upon request. In addition, each Fidelity Central Fund's financial statements are available on the SEC's website or upon request.
(f) Investment made with cash collateral received from securities on loan.
Affiliated Central Funds
Information regarding fiscal year to date income earned by the Fund from investments in Fidelity Central Funds is as follows:
| Fund | Income earned |
| Fidelity Cash Central Fund | $3,867 |
| Fidelity Securities Lending Cash Central Fund | 61,820 |
| Total | $65,687 |
Investment Valuation
The following is a summary of the inputs used, as of April 30, 2016, involving the Fund's assets and liabilities carried at fair value. The inputs or methodology used for valuing securities may not be an indication of the risk associated with investing in those securities. For more information on valuation inputs, and their aggregation into the levels used below, please refer to the Investment Valuation section in the accompanying Notes to Financial Statements.
| Valuation Inputs at Reporting Date: | ||||
| Description | Total | Level 1 | Level 2 | Level 3 |
| Investments in Securities: | ||||
| Equities: | ||||
| Consumer Discretionary | $85,126,515 | $-- | $85,126,515 | $-- |
| Consumer Staples | 41,250,460 | -- | 41,250,460 | -- |
| Financials | 68,416,602 | -- | 68,416,602 | -- |
| Health Care | 56,603,956 | -- | 56,603,956 | -- |
| Industrials | 53,031,243 | -- | 53,031,243 | -- |
| Information Technology | 53,055,815 | 4,085,514 | 48,970,301 | -- |
| Materials | 18,830,317 | -- | 18,830,317 | -- |
| Telecommunication Services | 38,070,697 | -- | 38,070,697 | -- |
| Money Market Funds | 7,134,685 | 7,134,685 | -- | -- |
| Total Investments in Securities: | $421,520,290 | $11,220,199 | $410,300,091 | $-- |
See accompanying notes which are an integral part of the financial statements.
Financial Statements
Statement of Assets and Liabilities
| April 30, 2016 (Unaudited) | ||
| Assets | ||
| Investment in securities, at value (including securities loaned of $5,643,777) — See accompanying schedule: Unaffiliated issuers (cost $423,826,962) | $414,385,605 | |
| Fidelity Central Funds (cost $7,134,685) | 7,134,685 | |
| Total Investments (cost $430,961,647) | $421,520,290 | |
| Receivable for investments sold | ||
| Regular delivery | 1,610,483 | |
| Delayed delivery | 1,228,772 | |
| Receivable for fund shares sold | 204,538 | |
| Dividends receivable | 3,396,451 | |
| Distributions receivable from Fidelity Central Funds | 11,311 | |
| Prepaid expenses | 360 | |
| Other receivables | 23 | |
| Total assets | 427,972,228 | |
| Liabilities | ||
| Payable for investments purchased | ||
| Regular delivery | $1,299,334 | |
| Delayed delivery | 1,566,723 | |
| Payable for fund shares redeemed | 824,962 | |
| Accrued management fee | 166,424 | |
| Distribution and service plan fees payable | 21,502 | |
| Other affiliated payables | 91,927 | |
| Other payables and accrued expenses | 46,984 | |
| Collateral on securities loaned, at value | 5,928,450 | |
| Total liabilities | 9,946,306 | |
| Net Assets | $418,025,922 | |
| Net Assets consist of: | ||
| Paid in capital | $615,649,331 | |
| Undistributed net investment income | 1,888,227 | |
| Accumulated undistributed net realized gain (loss) on investments and foreign currency transactions | (190,260,232) | |
| Net unrealized appreciation (depreciation) on investments and assets and liabilities in foreign currencies | (9,251,404) | |
| Net Assets | $418,025,922 | |
| Calculation of Maximum Offering Price | ||
| Class A: | ||
| Net Asset Value and redemption price per share ($25,549,301 ÷ 2,254,243 shares) | $11.33 | |
| Maximum offering price per share (100/94.25 of $11.33) | $12.02 | |
| Class T: | ||
| Net Asset Value and redemption price per share ($4,456,631 ÷ 393,196 shares) | $11.33 | |
| Maximum offering price per share (100/96.50 of $11.33) | $11.74 | |
| Class B: | ||
| Net Asset Value and offering price per share ($181,410 ÷ 16,068 shares)(a) | $11.29 | |
| Class C: | ||
| Net Asset Value and offering price per share ($16,281,880 ÷ 1,447,994 shares)(a) | $11.24 | |
| Japan: | ||
| Net Asset Value, offering price and redemption price per share ($365,289,572 ÷ 32,138,461 shares) | $11.37 | |
| Class I: | ||
| Net Asset Value, offering price and redemption price per share ($6,267,128 ÷ 552,250 shares) | $11.35 |
(a) Redemption price per share is equal to net asset value less any applicable contingent deferred sales charge.
See accompanying notes which are an integral part of the financial statements.
Statement of Operations
| Six months ended April 30, 2016 (Unaudited) | ||
| Investment Income | ||
| Dividends | $4,400,064 | |
| Income from Fidelity Central Funds | 65,687 | |
| Income before foreign taxes withheld | 4,465,751 | |
| Less foreign taxes withheld | (442,374) | |
| Total income | 4,023,377 | |
| Expenses | ||
| Management fee | ||
| Basic fee | $1,739,878 | |
| Performance adjustment | (504,885) | |
| Transfer agent fees | 486,175 | |
| Distribution and service plan fees | 133,312 | |
| Accounting and security lending fees | 129,152 | |
| Custodian fees and expenses | 28,896 | |
| Independent trustees' compensation | 1,142 | |
| Registration fees | 68,374 | |
| Audit | 40,802 | |
| Legal | 686 | |
| Interest | 1,750 | |
| Miscellaneous | 1,771 | |
| Total expenses before reductions | 2,127,053 | |
| Expense reductions | (1,978) | 2,125,075 |
| Net investment income (loss) | 1,898,302 | |
| Realized and Unrealized Gain (Loss) | ||
| Net realized gain (loss) on: | ||
| Investment securities: | ||
| Unaffiliated issuers | (7,721,419) | |
| Foreign currency transactions | (50,452) | |
| Total net realized gain (loss) | (7,771,871) | |
| Change in net unrealized appreciation (depreciation) on: Investment securities | (18,729,419) | |
| Assets and liabilities in foreign currencies | 208,285 | |
| Total change in net unrealized appreciation (depreciation) | (18,521,134) | |
| Net gain (loss) | (26,293,005) | |
| Net increase (decrease) in net assets resulting from operations | $(24,394,703) |
See accompanying notes which are an integral part of the financial statements.
Statement of Changes in Net Assets
| Six months ended April 30, 2016 (Unaudited) | Year ended October 31, 2015 | |
| Increase (Decrease) in Net Assets | ||
| Operations | ||
| Net investment income (loss) | $1,898,302 | $3,112,183 |
| Net realized gain (loss) | (7,771,871) | (392,382) |
| Change in net unrealized appreciation (depreciation) | (18,521,134) | 1,937,241 |
| Net increase (decrease) in net assets resulting from operations | (24,394,703) | 4,657,042 |
| Distributions to shareholders from net investment income | (3,027,093) | (3,310,432) |
| Distributions to shareholders from net realized gain | (270,338) | – |
| Total distributions | (3,297,431) | (3,310,432) |
| Share transactions - net increase (decrease) | (101,642,831) | 70,904,089 |
| Redemption fees | 36,545 | 139,156 |
| Total increase (decrease) in net assets | (129,298,420) | 72,389,855 |
| Net Assets | ||
| Beginning of period | 547,324,342 | 474,934,487 |
| End of period (including undistributed net investment income of $1,888,227 and undistributed net investment income of $3,017,018, respectively) | $418,025,922 | $547,324,342 |
See accompanying notes which are an integral part of the financial statements.
Financial Highlights — Fidelity Japan Fund Class A
| Six months ended (Unaudited) April 30, | Years ended October 31, | |||||
| 2016 | 2015 | 2014 | 2013 | 2012 | 2011 A | |
| Selected Per–Share Data | ||||||
| Net asset value, beginning of period | $11.87 | $11.65 | $12.00 | $9.30 | $9.54 | $10.83 |
| Income from Investment Operations | ||||||
| Net investment income (loss)B | .03 | .04 | .05 | .08 | .09 | .09 |
| Net realized and unrealized gain (loss) | (.51) | .23 | (.31) | 2.80 | (.15) | (1.39) |
| Total from investment operations | (.48) | .27 | (.26) | 2.88 | (.06) | (1.30) |
| Distributions from net investment income | (.05) | (.05) | (.08) | (.11) | (.13) | – |
| Distributions from net realized gain | (.01) | – | (.01) | (.08) | (.05) | – |
| Total distributions | (.06) | (.05) | (.09) | (.19) | (.18) | – |
| Redemption fees added to paid in capitalB | –C | –C | –C | .01 | –C | .01 |
| Net asset value, end of period | $11.33 | $11.87 | $11.65 | $12.00 | $9.30 | $9.54 |
| Total ReturnD,E,F | (4.11)% | 2.31% | (2.18)% | 31.58% | (.64)% | (11.91)% |
| Ratios to Average Net AssetsG,H | ||||||
| Expenses before reductions | 1.09%I | 1.10% | 1.23% | 1.26% | 1.42% | 1.20%I |
| Expenses net of fee waivers, if any | 1.09%I | 1.10% | 1.23% | 1.26% | 1.38% | 1.20%I |
| Expenses net of all reductions | 1.09%I | 1.09% | 1.23% | 1.25% | 1.36% | 1.16%I |
| Net investment income (loss) | .53%I | .37% | .41% | .75% | .94% | 1.02%I |
| Supplemental Data | ||||||
| Net assets, end of period (000 omitted) | $25,549 | $23,918 | $21,352 | $20,520 | $9,495 | $13,208 |
| Portfolio turnover rateJ | 16%I | 35% | 112% | 68% | 52% | 134%K |
A For the period December 14, 2010 (commencement of sale of shares) to October 31, 2011.
B Calculated based on average shares outstanding during the period.
C Amount represents less than $.005 per share.
D Total returns for periods of less than one year are not annualized.
E Total returns would have been lower if certain expenses had not been reduced during the applicable periods shown.
F Total returns do not include the effect of the sales charges.
G Fees and expenses of any underlying Fidelity Central Funds are not included in the Fund's expense ratio. The Fund indirectly bears its proportionate share of the expenses of any underlying Fidelity Central Funds.
H Expense ratios reflect operating expenses of the class. Expenses before reductions do not reflect amounts reimbursed by the investment adviser or reductions from brokerage service arrangements or reductions from other expense offset arrangements and do not represent the amount paid by the class during periods when reimbursements or reductions occur. Expenses net of fee waivers reflect expenses after reimbursement by the investment adviser but prior to reductions from brokerage service arrangements or other expense offset arrangements. Expenses net of all reductions represent the net expenses paid by the class.
I Annualized
J Amount does not include the portfolio activity of any underlying Fidelity Central Funds.
K The portfolio turnover rate does not include the assets acquired in the merger.
See accompanying notes which are an integral part of the financial statements.
Financial Highlights — Fidelity Japan Fund Class T
| Six months ended (Unaudited) April 30, | Years ended October 31, | |||||
| 2016 | 2015 | 2014 | 2013 | 2012 | 2011 A | |
| Selected Per–Share Data | ||||||
| Net asset value, beginning of period | $11.85 | $11.62 | $11.96 | $9.28 | $9.51 | $10.83 |
| Income from Investment Operations | ||||||
| Net investment income (loss)B | .01 | –C | .01 | .05 | .06 | .07 |
| Net realized and unrealized gain (loss) | (.52) | .23 | (.30) | 2.78 | (.13) | (1.40) |
| Total from investment operations | (.51) | .23 | (.29) | 2.83 | (.07) | (1.33) |
| Distributions from net investment income | –C | – | (.04) | (.08) | (.11) | – |
| Distributions from net realized gain | (.01) | – | (.01) | (.08) | (.05) | – |
| Total distributions | (.01) | – | (.05) | (.16) | (.16) | – |
| Redemption fees added to paid in capitalB | –C | –C | –C | .01 | –C | .01 |
| Net asset value, end of period | $11.33 | $11.85 | $11.62 | $11.96 | $9.28 | $9.51 |
| Total ReturnD,E,F | (4.32)% | 1.98% | (2.42)% | 31.04% | (.75)% | (12.19)% |
| Ratios to Average Net AssetsG,H | ||||||
| Expenses before reductions | 1.45%I | 1.43% | 1.54% | 1.55% | 1.70% | 1.48%I |
| Expenses net of fee waivers, if any | 1.45%I | 1.43% | 1.54% | 1.55% | 1.66% | 1.48%I |
| Expenses net of all reductions | 1.45%I | 1.42% | 1.54% | 1.53% | 1.64% | 1.44%I |
| Net investment income (loss) | .17%I | .04% | .10% | .46% | .66% | .74%I |
| Supplemental Data | ||||||
| Net assets, end of period (000 omitted) | $4,457 | $4,809 | $4,104 | $5,357 | $3,934 | $4,643 |
| Portfolio turnover rateJ | 16%I | 35% | 112% | 68% | 52% | 134%K |
A For the period December 14, 2010 (commencement of sale of shares) to October 31, 2011.
B Calculated based on average shares outstanding during the period.
C Amount represents less than $.005 per share.
D Total returns for periods of less than one year are not annualized.
E Total returns would have been lower if certain expenses had not been reduced during the applicable periods shown.
F Total returns do not include the effect of the sales charges.
G Fees and expenses of any underlying Fidelity Central Funds are not included in the Fund's expense ratio. The Fund indirectly bears its proportionate share of the expenses of any underlying Fidelity Central Funds.
H Expense ratios reflect operating expenses of the class. Expenses before reductions do not reflect amounts reimbursed by the investment adviser or reductions from brokerage service arrangements or reductions from other expense offset arrangements and do not represent the amount paid by the class during periods when reimbursements or reductions occur. Expenses net of fee waivers reflect expenses after reimbursement by the investment adviser but prior to reductions from brokerage service arrangements or other expense offset arrangements. Expenses net of all reductions represent the net expenses paid by the class.
I Annualized
J Amount does not include the portfolio activity of any underlying Fidelity Central Funds.
K The portfolio turnover rate does not include the assets acquired in the merger.
See accompanying notes which are an integral part of the financial statements.
Financial Highlights — Fidelity Japan Fund Class B
| Six months ended (Unaudited) April 30, | Years ended October 31, | |||||
| 2016 | 2015 | 2014 | 2013 | 2012 | 2011 A | |
| Selected Per–Share Data | ||||||
| Net asset value, beginning of period | $11.82 | $11.65 | $12.00 | $9.26 | $9.47 | $10.83 |
| Income from Investment Operations | ||||||
| Net investment income (loss)B | (.02) | (.05) | (.04) | –C | .02 | .02 |
| Net realized and unrealized gain (loss) | (.51) | .22 | (.31) | 2.80 | (.14) | (1.39) |
| Total from investment operations | (.53) | .17 | (.35) | 2.80 | (.12) | (1.37) |
| Distributions from net investment income | – | – | – | – | (.04) | – |
| Distributions from net realized gain | – | – | – | (.07) | (.05) | – |
| Total distributions | – | – | – | (.07) | (.09) | – |
| Redemption fees added to paid in capitalB | –C | –C | –C | .01 | –C | .01 |
| Net asset value, end of period | $11.29 | $11.82 | $11.65 | $12.00 | $9.26 | $9.47 |
| Total ReturnD,E,F | (4.48)% | 1.46% | (2.92)% | 30.52% | (1.24)% | (12.56)% |
| Ratios to Average Net AssetsG,H | ||||||
| Expenses before reductions | 1.91%I | 1.91% | 2.02% | 2.02% | 2.17% | 1.95%I |
| Expenses net of fee waivers, if any | 1.91%I | 1.91% | 2.02% | 2.02% | 2.13% | 1.95%I |
| Expenses net of all reductions | 1.91%I | 1.91% | 2.02% | 2.01% | 2.11% | 1.91%I |
| Net investment income (loss) | (.29)%I | (.45)% | (.37)% | (.02)% | .19% | .27%I |
| Supplemental Data | ||||||
| Net assets, end of period (000 omitted) | $181 | $348 | $452 | $874 | $1,012 | $1,458 |
| Portfolio turnover rateJ | 16%I | 35% | 112% | 68% | 52% | 134%K |
A For the period December 14, 2010 (commencement of sale of shares) to October 31, 2011.
B Calculated based on average shares outstanding during the period.
C Amount represents less than $.005 per share.
D Total returns for periods of less than one year are not annualized.
E Total returns would have been lower if certain expenses had not been reduced during the applicable periods shown.
F Total returns do not include the effect of the contingent deferred sales charge.
G Fees and expenses of any underlying Fidelity Central Funds are not included in the Fund's expense ratio. The Fund indirectly bears its proportionate share of the expenses of any underlying Fidelity Central Funds.
H Expense ratios reflect operating expenses of the class. Expenses before reductions do not reflect amounts reimbursed by the investment adviser or reductions from brokerage service arrangements or reductions from other expense offset arrangements and do not represent the amount paid by the class during periods when reimbursements or reductions occur. Expenses net of fee waivers reflect expenses after reimbursement by the investment adviser but prior to reductions from brokerage service arrangements or other expense offset arrangements. Expenses net of all reductions represent the net expenses paid by the class.
I Annualized
J Amount does not include the portfolio activity of any underlying Fidelity Central Funds.
K The portfolio turnover rate does not include the assets acquired in the merger.
See accompanying notes which are an integral part of the financial statements.
Financial Highlights — Fidelity Japan Fund Class C
| Six months ended (Unaudited) April 30, | Years ended October 31, | |||||
| 2016 | 2015 | 2014 | 2013 | 2012 | 2011 A | |
| Selected Per–Share Data | ||||||
| Net asset value, beginning of period | $11.77 | $11.58 | $11.96 | $9.25 | $9.48 | $10.83 |
| Income from Investment Operations | ||||||
| Net investment income (loss)B | (.01) | (.04) | (.03) | –C | .02 | .03 |
| Net realized and unrealized gain (loss) | (.52) | .23 | (.32) | 2.79 | (.14) | (1.39) |
| Total from investment operations | (.53) | .19 | (.35) | 2.79 | (.12) | (1.36) |
| Distributions from net investment income | – | – | (.03) | (.01) | (.06) | – |
| Distributions from net realized gain | – | – | (.01) | (.08) | (.05) | – |
| Total distributions | – | – | (.03)D | (.09) | (.11) | – |
| Redemption fees added to paid in capitalB | –C | –C | –C | .01 | –C | .01 |
| Net asset value, end of period | $11.24 | $11.77 | $11.58 | $11.96 | $9.25 | $9.48 |
| Total ReturnE,F,G | (4.50)% | 1.64% | (2.90)% | 30.55% | (1.27)% | (12.47)% |
| Ratios to Average Net AssetsH,I | ||||||
| Expenses before reductions | 1.83%J | 1.81% | 1.93% | 1.97% | 2.15% | 1.92%J |
| Expenses net of fee waivers, if any | 1.82%J | 1.81% | 1.93% | 1.97% | 2.11% | 1.92%J |
| Expenses net of all reductions | 1.82%J | 1.80% | 1.93% | 1.95% | 2.09% | 1.88%J |
| Net investment income (loss) | (.21)%J | (.34)% | (.29)% | .04% | .21% | .30%J |
| Supplemental Data | ||||||
| Net assets, end of period (000 omitted) | $16,282 | $18,491 | $13,162 | $11,824 | $7,015 | $8,750 |
| Portfolio turnover rateK | 16%J | 35% | 112% | 68% | 52% | 134%L |
A For the period December 14, 2010 (commencement of sale of shares) to October 31, 2011.
B Calculated based on average shares outstanding during the period.
C Amount represents less than $.005 per share.
D Total distributions of $.03 per share is comprised of distributions from net investment income of $.025 and distributions from net realized gain of $.009 per share.
E Total returns for periods of less than one year are not annualized.
F Total returns would have been lower if certain expenses had not been reduced during the applicable periods shown.
G Total returns do not include the effect of the contingent deferred sales charge.
H Fees and expenses of any underlying Fidelity Central Funds are not included in the Fund's expense ratio. The Fund indirectly bears its proportionate share of the expenses of any underlying Fidelity Central Funds.
I Expense ratios reflect operating expenses of the class. Expenses before reductions do not reflect amounts reimbursed by the investment adviser or reductions from brokerage service arrangements or reductions from other expense offset arrangements and do not represent the amount paid by the class during periods when reimbursements or reductions occur. Expenses net of fee waivers reflect expenses after reimbursement by the investment adviser but prior to reductions from brokerage service arrangements or other expense offset arrangements. Expenses net of all reductions represent the net expenses paid by the class.
J Annualized
K Amount does not include the portfolio activity of any underlying Fidelity Central Funds.
L The portfolio turnover rate does not include the assets acquired in the merger.
See accompanying notes which are an integral part of the financial statements.
Financial Highlights — Fidelity Japan Fund
| Six months ended (Unaudited) April 30, | Years ended October 31, | |||||
| 2016 | 2015 | 2014 | 2013 | 2012 | 2011 | |
| Selected Per–Share Data | ||||||
| Net asset value, beginning of period | $11.91 | $11.69 | $12.03 | $9.34 | $9.57 | $10.57 |
| Income from Investment Operations | ||||||
| Net investment income (loss)A | .05 | .08 | .09 | .12 | .12 | .15 |
| Net realized and unrealized gain (loss) | (.51) | .23 | (.32) | 2.79 | (.14) | (.75) |
| Total from investment operations | (.46) | .31 | (.23) | 2.91 | (.02) | (.60) |
| Distributions from net investment income | (.07) | (.09) | (.11) | (.15) | (.16) | (.20) |
| Distributions from net realized gain | (.01) | – | (.01) | (.08) | (.05) | (.21) |
| Total distributions | (.08) | (.09) | (.11)B | (.23) | (.21) | (.41) |
| Redemption fees added to paid in capitalA | –C | –C | –C | .01 | –C | .01 |
| Net asset value, end of period | $11.37 | $11.91 | $11.69 | $12.03 | $9.34 | $9.57 |
| Total ReturnD,E | (3.93)% | 2.66% | (1.90)% | 31.92% | (.19)% | (6.00)% |
| Ratios to Average Net AssetsF,G | ||||||
| Expenses before reductions | .80%H | .80% | .90% | .93% | 1.09% | .86% |
| Expenses net of fee waivers, if any | .80%H | .80% | .90% | .93% | 1.06% | .84% |
| Expenses net of all reductions | .80%H | .79% | .90% | .91% | 1.04% | .80% |
| Net investment income (loss) | .82%H | .67% | .74% | 1.08% | 1.26% | 1.38% |
| Supplemental Data | ||||||
| Net assets, end of period (000 omitted) | $365,290 | $485,803 | $415,612 | $480,773 | $353,550 | $450,417 |
| Portfolio turnover rateI | 16%H | 35% | 112% | 68% | 52% | 134%J |
A Calculated based on average shares outstanding during the period.
B Total distributions of $.11 per share is comprised of distributions from net investment income of $.105 and distributions from net realized gain of $.009 per share.
C Amount represents less than $.005 per share.
D Total returns for periods of less than one year are not annualized.
E Total returns would have been lower if certain expenses had not been reduced during the applicable periods shown.
F Fees and expenses of any underlying Fidelity Central Funds are not included in the Fund's expense ratio. The Fund indirectly bears its proportionate share of the expenses of any underlying Fidelity Central Funds.
G Expense ratios reflect operating expenses of the class. Expenses before reductions do not reflect amounts reimbursed by the investment adviser or reductions from brokerage service arrangements or reductions from other expense offset arrangements and do not represent the amount paid by the class during periods when reimbursements or reductions occur. Expenses net of fee waivers reflect expenses after reimbursement by the investment adviser but prior to reductions from brokerage service arrangements or other expense offset arrangements. Expenses net of all reductions represent the net expenses paid by the class.
H Annualized
I Amount does not include the portfolio activity of any underlying Fidelity Central Funds.
J The portfolio turnover rate does not include the assets acquired in the merger.
See accompanying notes which are an integral part of the financial statements.
Financial Highlights — Fidelity Japan Fund Class I
| Six months ended (Unaudited) April 30, | Years ended October 31, | |||||
| 2016 | 2015 | 2014 | 2013 | 2012 | 2011 A | |
| Selected Per–Share Data | ||||||
| Net asset value, beginning of period | $11.89 | $11.67 | $12.02 | $9.33 | $9.57 | $10.83 |
| Income from Investment Operations | ||||||
| Net investment income (loss)B | .05 | .08 | .09 | .13 | .12 | .13 |
| Net realized and unrealized gain (loss) | (.52) | .23 | (.32) | 2.78 | (.14) | (1.40) |
| Total from investment operations | (.47) | .31 | (.23) | 2.91 | (.02) | (1.27) |
| Distributions from net investment income | (.07) | (.09) | (.12) | (.15) | (.17) | – |
| Distributions from net realized gain | (.01) | – | (.01) | (.08) | (.05) | – |
| Total distributions | (.07)C | (.09) | (.12)D | (.23) | (.22) | – |
| Redemption fees added to paid in capitalB | –E | –E | –E | .01 | –E | .01 |
| Net asset value, end of period | $11.35 | $11.89 | $11.67 | $12.02 | $9.33 | $9.57 |
| Total ReturnF,G | (3.97)% | 2.72% | (1.90)% | 32.04% | (.18)% | (11.63)% |
| Ratios to Average Net AssetsH,I | ||||||
| Expenses before reductions | .78%J | .80% | .89% | .90% | 1.03% | .79%J |
| Expenses net of fee waivers, if any | .78%J | .80% | .89% | .90% | 1.01% | .79%J |
| Expenses net of all reductions | .78%J | .79% | .89% | .88% | .99% | .75%J |
| Net investment income (loss) | .84%J | .67% | .76% | 1.11% | 1.31% | 1.43%J |
| Supplemental Data | ||||||
| Net assets, end of period (000 omitted) | $6,267 | $13,957 | $20,253 | $20,033 | $1,488 | $2,715 |
| Portfolio turnover rateK | 16%J | 35% | 112% | 68% | 52% | 134%L |
A For the period December 14, 2010 (commencement of sale of shares) to October 31, 2011.
B Calculated based on average shares outstanding during the period.
C Total distributions of $.07 per share is comprised of distributions from net investment income of $.065 and distributions from net realized gain of $.006 per share.
D Total distributions of $.12 per share is comprised of distributions from net investment income of $.115 and distributions from net realized gain of $.009 per share.
E Amount represents less than $.005 per share.
F Total returns for periods of less than one year are not annualized.
G Total returns would have been lower if certain expenses had not been reduced during the applicable periods shown.
H Fees and expenses of any underlying Fidelity Central Funds are not included in the Fund's expense ratio. The Fund indirectly bears its proportionate share of the expenses of any underlying Fidelity Central Funds.
I Expense ratios reflect operating expenses of the class. Expenses before reductions do not reflect amounts reimbursed by the investment adviser or reductions from brokerage service arrangements or reductions from other expense offset arrangements and do not represent the amount paid by the class during periods when reimbursements or reductions occur. Expenses net of fee waivers reflect expenses after reimbursement by the investment adviser but prior to reductions from brokerage service arrangements or other expense offset arrangements. Expenses net of all reductions represent the net expenses paid by the class.
J Annualized
K Amount does not include the portfolio activity of any underlying Fidelity Central Funds.
L The portfolio turnover rate does not include the assets acquired in the merger.
See accompanying notes which are an integral part of the financial statements.
Notes to Financial Statements (Unaudited)
For the period ended April 30, 2016
1. Organization.
Fidelity Japan Fund (the Fund) is a fund of Fidelity Investment Trust (the Trust) and is authorized to issue an unlimited number of shares. The Trust is registered under the Investment Company Act of 1940, as amended (the 1940 Act), as an open-end management investment company organized as a Massachusetts business trust. The Fund offers Class A, Class T, Class C, Japan and Class I shares, each of which, along with Class B shares, has equal rights as to assets and voting privileges. Class B shares are closed to new accounts and additional purchases, except for exchanges and reinvestments. Each class has exclusive voting rights with respect to matters that affect that class. Class B shares will automatically convert to Class A shares after a maximum holding period of seven years from the initial date of purchase.
During the period, the Board of Trustees approved the conversion of all existing Class B shares into Class A shares, effective on or about July 1, 2016, regardless of the length of times shares have been held.
2. Investments in Fidelity Central Funds.
The Fund invests in Fidelity Central Funds, which are open-end investment companies generally available only to other investment companies and accounts managed by the investment adviser and its affiliates. The Fund's Schedule of Investments lists each of the Fidelity Central Funds held as of period end, if any, as an investment of the Fund, but does not include the underlying holdings of each Fidelity Central Fund. As an Investing Fund, the Fund indirectly bears its proportionate share of the expenses of the underlying Fidelity Central Funds.
The Money Market Central Funds seek preservation of capital and current income and are managed by Fidelity Investments Money Management, Inc. (FIMM), an affiliate of the investment adviser. Annualized expenses of the Money Market Central Funds as of their most recent shareholder report date are less than .005%.
A complete unaudited list of holdings for each Fidelity Central Fund is available upon request or at the Securities and Exchange Commission (the SEC) website at www.sec.gov. In addition, the financial statements of the Fidelity Central Funds are available on the SEC website or upon request.
3. Significant Accounting Policies.
The financial statements have been prepared in conformity with accounting principles generally accepted in the United States of America (GAAP), which require management to make certain estimates and assumptions at the date of the financial statements. Actual results could differ from those estimates. Subsequent events, if any, through the date that the financial statements were issued have been evaluated in the preparation of the financial statements. The following summarizes the significant accounting policies of the Fund:
Investment Valuation. Investments are valued as of 4:00 p.m. Eastern time on the last calendar day of the period. The Board of Trustees (the Board) has delegated the day to day responsibility for the valuation of the Fund's investments to the Fidelity Management & Research Company (FMR) Fair Value Committee (the Committee). In accordance with valuation policies and procedures approved by the Board, the Fund attempts to obtain prices from one or more third party pricing vendors or brokers to value its investments. When current market prices, quotations or currency exchange rates are not readily available or reliable, investments will be fair valued in good faith by the Committee, in accordance with procedures adopted by the Board. Factors used in determining fair value vary by investment type and may include market or investment specific events. The frequency with which these procedures are used cannot be predicted and they may be utilized to a significant extent. The Committee oversees the Fund's valuation policies and procedures and reports to the Board on the Committee's activities and fair value determinations. The Board monitors the appropriateness of the procedures used in valuing the Fund's investments and ratifies the fair value determinations of the Committee.
The Fund categorizes the inputs to valuation techniques used to value its investments into a disclosure hierarchy consisting of three levels as shown below:
- Level 1 – quoted prices in active markets for identical investments
- Level 2 – other significant observable inputs (including quoted prices for similar investments, interest rates, prepayment speeds, etc.)
- Level 3 – unobservable inputs (including the Fund's own assumptions based on the best information available)
Valuation techniques used to value the Fund's investments by major category are as follows:
Equity securities, including restricted securities, for which market quotations are readily available, are valued at the last reported sale price or official closing price as reported by a third party pricing vendor on the primary market or exchange on which they are traded and are categorized as Level 1 in the hierarchy. In the event there were no sales during the day or closing prices are not available, securities are valued at the last quoted bid price or may be valued using the last available price and are generally categorized as Level 2 in the hierarchy. For foreign equity securities, when market or security specific events arise, comparisons to the valuation of American Depositary Receipts (ADRs), futures contracts, Exchange-Traded Funds (ETFs) and certain indexes as well as quoted prices for similar securities may be used and would be categorized as Level 2 in the hierarchy. Utilizing these techniques may result in transfers between Level 1 and Level 2. For equity securities, including restricted securities, where observable inputs are limited, assumptions about market activity and risk are used and these securities may be categorized as Level 3 in the hierarchy.
Investments in open-end mutual funds, including the Fidelity Central Funds, are valued at their closing net asset value (NAV) each business day and are categorized as Level 1 in the hierarchy.
Changes in valuation techniques may result in transfers in or out of an assigned level within the disclosure hierarchy. The aggregate value of investments by input level as of April 30, 2016 is included at the end of the Fund's Schedule of Investments.
Foreign Currency. The Fund may use foreign currency contracts to facilitate transactions in foreign-denominated securities. Gains and losses from these transactions may arise from changes in the value of the foreign currency or if the counterparties do not perform under the contracts' terms.
Foreign-denominated assets, including investment securities, and liabilities are translated into U.S. dollars at the exchange rates at period end. Purchases and sales of investment securities, income and dividends received and expenses denominated in foreign currencies are translated into U.S. dollars at the exchange rate in effect on the transaction date.
The effects of exchange rate fluctuations on investments are included with the net realized and unrealized gain (loss) on investment securities. Other foreign currency transactions resulting in realized and unrealized gain (loss) are disclosed separately.
Investment Transactions and Income. For financial reporting purposes, the Fund's investment holdings and NAV include trades executed through the end of the last business day of the period. The NAV per share for processing shareholder transactions is calculated as of the close of business of the New York Stock Exchange (NYSE), normally 4:00 p.m. Eastern time and includes trades executed through the end of the prior business day. Gains and losses on securities sold are determined on the basis of identified cost. Dividend income is recorded on the ex-dividend date, except for certain dividends from foreign securities where the ex-dividend date may have passed, which are recorded as soon as the Fund is informed of the ex-dividend date. Non-cash dividends included in dividend income, if any, are recorded at the fair market value of the securities received. Income and capital gain distributions from Fidelity Central Funds, if any, are recorded on the ex-dividend date. Investment income is recorded net of foreign taxes withheld where recovery of such taxes is uncertain.
Class Allocations and Expenses. Investment income, realized and unrealized capital gains and losses, common expenses of the Fund, and certain fund-level expense reductions, if any, are allocated daily on a pro-rata basis to each class based on the relative net assets of each class to the total net assets of the Fund. Each class differs with respect to transfer agent and distribution and service plan fees incurred. Certain expense reductions may also differ by class. For the reporting period, the allocated portion of income and expenses to each class as a percent of its average net assets may vary due to the timing of recording these transactions in relation to fluctuating net assets of the classes. Expenses directly attributable to a fund are charged to that fund. Expenses attributable to more than one fund are allocated among the respective funds on the basis of relative net assets or other appropriate methods. Expense estimates are accrued in the period to which they relate and adjustments are made when actual amounts are known.
Income Tax Information and Distributions to Shareholders. Each year, the Fund intends to qualify as a regulated investment company under Subchapter M of the Internal Revenue Code, including distributing substantially all of its taxable income and realized gains. As a result, no provision for U.S. Federal income taxes is required. The Fund files a U.S. federal tax return, in addition to state and local tax returns as required. The Fund's federal income tax returns are subject to examination by the Internal Revenue Service (IRS) for a period of three fiscal years after they are filed. State and local tax returns may be subject to examination for an additional fiscal year depending on the jurisdiction. Foreign taxes are provided for based on the Fund's understanding of the tax rules and rates that exist in the foreign markets in which it invests.
Distributions are declared and recorded on the ex-dividend date. Income dividends and capital gain distributions are declared separately for each class. Income and capital gain distributions are determined in accordance with income tax regulations, which may differ from GAAP.
Capital accounts within the financial statements are adjusted for permanent book-tax differences. These adjustments have no impact on net assets or the results of operations. Capital accounts are not adjusted for temporary book-tax differences which will reverse in a subsequent period.
Book-tax differences are primarily due to foreign currency transactions, passive foreign investment companies (PFIC), expiring capital loss carryforwards, deferred trustees compensation, capital loss carryforwards and losses deferred due to wash sales.
The federal tax cost of investment securities and unrealized appreciation (depreciation) as of period end were as follows:
| Gross unrealized appreciation | $39,767,246 |
| Gross unrealized depreciation | (52,790,805) |
| Net unrealized appreciation (depreciation) on securities | $(13,023,559) |
| Tax cost | $434,543,849 |
Capital loss carryforwards are only available to offset future capital gains of the Fund to the extent provided by regulations and may be limited. Under the Regulated Investment Company Modernization Act of 2010 (the Act), the Fund is permitted to carry forward capital losses incurred in taxable years beginning after December 22, 2010 for an unlimited period and such capital losses are required to be used prior to any losses that expire. The capital loss carryforward information presented below, including any applicable limitation, is estimated as of prior fiscal period end and is subject to adjustment.
| Fiscal year of expiration | |
| 2016 | $(3,870,588) |
| 2017 | (41,604,070) |
| 2018 | (26,887,863) |
| 2019 | (98,806,037) |
| Total with expiration | (171,168,558) |
| No expiration | |
| Short-term | (6,850,642) |
| Total capital loss carryforward | $(178,019,200) |
Due to large redemptions in a prior period, $141,955,883 of capital losses that will be available to offset future capital gains of the Fund will be limited to approximately $18,885,324 per year.
The Fund acquired $5,487,891 of its capital loss carryforward as part of a merger in a prior period. The losses acquired that will be available to offset future capital gains of the Fund will be limited to approximately $1,371,973 per year.
Short-Term Trading (Redemption) Fees. Shares held by investors in the Fund less than 90 days may have been subject to a redemption fee equal to 1.50% of the NAV of shares redeemed. All redemption fees, which reduce the proceeds of the shareholder redemption, are retained by the Fund and accounted for as an addition to paid in capital.
Delayed Delivery Transactions and When-Issued Securities. During the period, the Fund transacted in securities on a delayed delivery or when-issued basis. Payment and delivery may take place after the customary settlement period for that security. The price of the underlying securities and the date when the securities will be delivered and paid for are fixed at the time the transaction is negotiated. The securities purchased on a delayed delivery or when-issued basis are identified as such in the Fund's Schedule of Investments. With respect to purchase commitments, the Fund identifies securities as segregated in its records with a value at least equal to the amount of the commitment. Losses may arise due to changes in the value of the underlying securities or if the counterparty does not perform under the contract's terms, or if the issuer does not issue the securities due to political, economic, or other factors.
4. Purchases and Sales of Investments.
Purchases and sales of securities, other than short-term securities, aggregated $38,419,518 and $137,061,828, respectively.
5. Fees and Other Transactions with Affiliates.
Management Fee. Fidelity Management & Research Company (the investment adviser) and its affiliates provide the Fund with investment management related services for which the Fund pays a monthly management fee. The management fee is the sum of an individual fund fee rate that is based on an annual rate of .45% of the Fund's average net assets and an annualized group fee rate that averaged .25% during the period. The group fee rate is based upon the average net assets of all the mutual funds advised by the investment adviser, including any mutual funds previously advised by the investment adviser that are currently advised by Fidelity SelectCo, LLC, an affiliate of the investment adviser. The group fee rate decreases as assets under management increase and increases as assets under management decrease. In addition, the management fee is subject to a performance adjustment (up to a maximum of +/- .20% of the Fund's average net assets over a 36 month performance period). The upward or downward adjustment to the management fee is based on the relative investment performance of Japan as compared to its benchmark index, the TOPIX, over the same 36 month performance period. For the reporting period, the total annualized management fee rate, including the performance adjustment, was .50% of the Fund's average net assets. The performance adjustment included in the management fee rate may be higher or lower than the maximum performance adjustment rate due to the difference between the average net assets for the reporting and performance periods.
Distribution and Service Plan Fees. In accordance with Rule 12b-1 of the 1940 Act, the Fund has adopted separate Distribution and Service Plans for each class of shares. Certain classes pay Fidelity Distributors Corporation (FDC), an affiliate of the investment adviser, separate Distribution and Service Fees, each of which is based on an annual percentage of each class' average net assets. In addition, FDC may pay financial intermediaries for selling shares of the Fund and providing shareholder support services. For the period, the Distribution and Service Fee rates, total fees and amounts retained by FDC were as follows:
| Distribution Fee | Service Fee | Total Fees | Retained by FDC | |
| Class A | -% | .25% | $33,499 | $6,368 |
| Class T | .25% | .25% | 11,518 | 9 |
| Class B | .75% | .25% | 1,235 | 928 |
| Class C | .75% | .25% | 87,060 | 27,400 |
| $133,312 | $34,705 |
Sales Load. FDC may receive a front-end sales charge of up to 5.75% for selling Class A shares and 3.50% for selling Class T shares, some of which is paid to financial intermediaries for selling shares of the Fund. Depending on the holding period, FDC may receive contingent deferred sales charges levied on Class A, Class T, Class B, and Class C redemptions. The deferred sales charges range from 5.00% to 1.00% for Class B shares, 1.00% for Class C shares, 1.00% for certain purchases of Class A shares and .25% for certain purchases of Class T shares.
For the period, sales charge amounts retained by FDC were as follows:
| Retained by FDC | |
| Class A | $4,707 |
| Class T | 724 |
| Class B(a) | 48 |
| Class C(a) | 2,736 |
| $8,215 |
(a) When Class B and Class C shares are initially sold, FDC pays commissions from its own resources to financial intermediaries through which the sales are made.
Transfer Agent Fees. Fidelity Investments Institutional Operations Company, Inc., (FIIOC), an affiliate of the investment adviser, is the transfer, dividend disbursing and shareholder servicing agent for each class of the Fund. FIIOC receives account fees and asset-based fees that vary according to the account size and type of account of the shareholders of the respective classes of the Fund. FIIOC pays for typesetting, printing and mailing of shareholder reports, except proxy statements.
For the period, transfer agent fees for each class were as follows:
| Amount | % of Class-Level Average Net Assets(a) | |
| Class A | $31,613 | .24 |
| Class T | 7,877 | .34 |
| Class B | 374 | .30 |
| Class C | 19,011 | .22 |
| Japan | 419,330 | .19 |
| Class I | 7,970 | .18 |
| $486,175 |
(a) Annualized
Accounting and Security Lending Fees. Fidelity Service Company, Inc. (FSC), an affiliate of the investment adviser, maintains the Fund's accounting records. The accounting fee is based on the level of average net assets for each month. Under a separate contract, FSC administers the security lending program. The security lending fee is based on the number and duration of lending transactions.
Brokerage Commissions. The Fund placed a portion of its portfolio transactions with brokerage firms which are affiliates of the investment adviser. Brokerage commissions are included in net realized gain (loss) and change in net unrealized appreciation (depreciation) in the Statement of Operations. The commissions paid to these affiliated firms were $11 for the period.
Interfund Lending Program. Pursuant to an Exemptive Order issued by the SEC, the Fund, along with other registered investment companies having management contracts with FMR or other affiliated entities of FMR, may participate in an interfund lending program. This program provides an alternative credit facility allowing the funds to borrow from, or lend money to, other participating affiliated funds. At period end, there were no interfund loans outstanding. The Fund's activity in this program during the period for which loans were outstanding was as follows:
| Borrower or Lender | Average Loan Balance | Weighted Average Interest Rate | Interest Expense |
| Borrower | $4,817,143 | .62% | $1,750 |
Interfund Trades. The Fund may purchase from or sell securities to other Fidelity Funds under procedures adopted by the Board. The procedures have been designed to ensure these interfund trades are executed in accordance with Rule 17a-7 of the 1940 Act. Interfund trades are included within the respective purchases and sales amounts shown in the Purchases and Sales of Investments note.
6. Committed Line of Credit.
The Fund participates with other funds managed by the investment adviser or an affiliate in a $4.25 billion credit facility (the "line of credit") to be utilized for temporary or emergency purposes to fund shareholder redemptions or for other short-term liquidity purposes. The Fund has agreed to pay commitment fees on its pro-rata portion of the line of credit, which amounted to $461 and is reflected in Miscellaneous expenses on the Statement of Operations. During the period, the Fund did not borrow on this line of credit.
7. Security Lending.
The Fund lends portfolio securities through a lending agent from time to time in order to earn additional income. For equity securities, a lending agent is used and may loan securities to certain qualified borrowers, including Fidelity Capital Markets (FCM), a broker-dealer affiliated with the Fund. On the settlement date of the loan, the Fund receives collateral (in the form of U.S. Treasury obligations, letters of credit and/or cash) against the loaned securities and maintains collateral in an amount not less than 100% of the market value of the loaned securities during the period of the loan. The market value of the loaned securities is determined at the close of business of the Fund and any additional required collateral is delivered to the Fund on the next business day. The Fund or borrower may terminate the loan at any time, and if the borrower defaults on its obligation to return the securities loaned because of insolvency or other reasons, the Fund may apply collateral received from the borrower against the obligation. The Fund may experience delays and costs in recovering the securities loaned. Any cash collateral received is invested in the Fidelity Securities Lending Cash Central Fund. The value of loaned securities and cash collateral at period end are disclosed on the Fund's Statement of Assets and Liabilities. Security lending income represents the income earned on investing cash collateral, less rebates paid to borrowers and any lending agent fees associated with the loan, plus any premium payments received for lending certain types of securities. Security lending income is presented in the Statement of Operations as a component of income from Fidelity Central Funds. Total security lending income during the period amounted to $61,820. During the period, there were no securities loaned to FCM.
8. Expense Reductions.
Commissions paid to certain brokers with whom the investment adviser, or its affiliates, places trades on behalf of the Fund include an amount in addition to trade execution, which may be rebated back to the Fund to offset certain expenses. This amount totaled $14 for the period.
In addition, during the period the investment adviser reimbursed and/or waived a portion of fund-level operating expenses in the amount of $1,964.
9. Distributions to Shareholders.
Distributions to shareholders of each class were as follows:
| Six months ended April 30, 2016 | Year ended October 31, 2015 | |
| From net investment income | ||
| Class A | $121,415 | $79,823 |
| Class T | 822 | – |
| Japan | 2,828,514 | 3,066,127 |
| Class I | 76,342 | 164,482 |
| Total | $3,027,093 | $3,310,432 |
| From net realized gain | ||
| Class A | $14,867 | $– |
| Class T | 2,466 | – |
| Japan | 245,958 | – |
| Class I | 7,047 | – |
| Total | $270,338 | $– |
10. Share Transactions.
Share transactions for each class were as follows and may contain automatic conversions between classes or exchanges between affiliated funds:
| Shares | Shares | Dollars | Dollars | |
| Six months ended April 30, 2016 | Year ended October 31, 2015 | Six months ended April 30, 2016 | Year ended October 31, 2015 | |
| Class A | ||||
| Shares sold | 712,093 | 1,104,408 | $8,422,405 | $13,420,485 |
| Reinvestment of distributions | 10,746 | 6,565 | 128,096 | 74,452 |
| Shares redeemed | (483,042) | (929,216) | (5,489,451) | (10,724,499) |
| Net increase (decrease) | 239,797 | 181,757 | $3,061,050 | $2,770,438 |
| Class T | ||||
| Shares sold | 25,621 | 180,232 | $295,497 | $2,170,519 |
| Reinvestment of distributions | 269 | – | 3,216 | – |
| Shares redeemed | (38,565) | (127,640) | (437,379) | (1,490,023) |
| Net increase (decrease) | (12,675) | 52,592 | $(138,666) | $680,496 |
| Class B | ||||
| Shares sold | 1,967 | 711 | $21,929 | $8,779 |
| Shares redeemed | (15,310) | (10,106) | (175,368) | (116,253) |
| Net increase (decrease) | (13,343) | (9,395) | $(153,439) | $(107,474) |
| Class C | ||||
| Shares sold | 165,967 | 747,753 | $1,902,846 | $8,932,993 |
| Shares redeemed | (289,191) | (312,924) | (3,216,909) | (3,580,602) |
| Net increase (decrease) | (123,224) | 434,829 | $(1,314,063) | $5,352,391 |
| Japan | ||||
| Shares sold | 1,365,848 | 18,408,352 | $15,813,773 | $225,875,166 |
| Reinvestment of distributions | 251,274 | 262,630 | 3,000,214 | 2,980,854 |
| Shares redeemed | (10,270,898) | (13,426,033) | (114,820,865) | (161,325,584) |
| Net increase (decrease) | (8,653,776) | 5,244,949 | $(96,006,878) | $67,530,436 |
| Class I | ||||
| Shares sold | 153,380 | 1,688,546 | $1,788,502 | $20,578,143 |
| Reinvestment of distributions | 6,575 | 14,222 | 78,372 | 161,134 |
| Shares redeemed | (781,968) | (2,263,385) | (8,957,709) | (26,061,475) |
| Net increase (decrease) | (622,013) | (560,617) | $(7,090,835) | $(5,322,198) |
11. Other.
The Fund's organizational documents provide former and current trustees and officers with a limited indemnification against liabilities arising in connection with the performance of their duties to the Fund. In the normal course of business, the Fund may also enter into contracts that provide general indemnifications. The Fund's maximum exposure under these arrangements is unknown as this would be dependent on future claims that may be made against the Fund. The risk of material loss from such claims is considered remote.
At the end of the period, Strategic Advisers International Fund and Strategic Advisers International II Fund were the owners of record of approximately 28% and 11%, respectively, of the total outstanding shares of the Fund. Mutual Funds managed by the investment adviser of its affiliates were the owners of record, in the aggregate, of approximately 47% of the total outstanding shares of the Fund.
Shareholder Expense Example
As a shareholder of the Fund, you incur two types of costs: (1) transaction costs, including sales charges (loads) on purchase payments or redemption proceeds, redemption fees and (2) ongoing costs, including management fees, distribution and/or service (12b-1) fees and other Fund expenses. This Example is intended to help you understand your ongoing costs (in dollars) of investing in the Fund and to compare these costs with the ongoing costs of investing in other mutual funds.
The Example is based on an investment of $1,000 invested at the beginning of the period and held for the entire period (November 1, 2015 to April 30, 2016).
Actual Expenses
The first line of the accompanying table for each class of the Fund provides information about actual account values and actual expenses. You may use the information in this line, together with the amount you invested, to estimate the expenses that you paid over the period. Simply divide your account value by $1,000.00 (for example, an $8,600 account value divided by $1,000.00 = 8.6), then multiply the result by the number in the first line for a class of the Fund under the heading entitled "Expenses Paid During Period" to estimate the expenses you paid on your account during this period. A small balance maintenance fee of $12.00 that is charged once a year may apply for certain accounts with a value of less than $2,000. This fee is not included in the table below. If it was, the estimate of expenses you paid during the period would be higher, and your ending account value lower, by this amount. In addition, the Fund, as a shareholder in the underlying Fidelity Central Funds, will indirectly bear its pro-rata share of the fees and expenses incurred by the underlying Fidelity Central Funds. These fees and expenses are not included in the Fund's annualized expense ratio used to calculate the expense estimate in the table below.
Hypothetical Example for Comparison Purposes
The second line of the accompanying table for each class of the Fund provides information about hypothetical account values and hypothetical expenses based on a Class' actual expense ratio and an assumed rate of return of 5% per year before expenses, which is not the Class' actual return. The hypothetical account values and expenses may not be used to estimate the actual ending account balance or expenses you paid for the period. You may use this information to compare the ongoing costs of investing in the Fund and other funds. To do so, compare this 5% hypothetical example with the 5% hypothetical examples that appear in the shareholder reports of the other funds. A small balance maintenance fee of $12.00 that is charged once a year may apply for certain accounts with a value of less than $2,000. This fee is not included in the table below. If it was, the estimate of expenses you paid during the period would be higher, and your ending account value lower, by this amount. In addition, the Fund, as a shareholder in the underlying Fidelity Central Funds, will indirectly bear its pro-rata share of the fees and expenses incurred by the underlying Fidelity Central Funds. These fees and expenses are not included in the Fund's annualized expense ratio used to calculate the expense estimate in the table below.
Please note that the expenses shown in the table are meant to highlight your ongoing costs only and do not reflect any transaction costs. Therefore, the second line of the table is useful in comparing ongoing costs only, and will not help you determine the relative total costs of owning different funds. In addition, if these transactional costs were included, your costs would have been higher.
| Annualized Expense Ratio-A | Beginning Account Value November 1, 2015 | Ending Account Value April 30, 2016 | Expenses Paid During Period-B November 1, 2015 to April 30, 2016 | |
| Class A | 1.09% | |||
| Actual | $1,000.00 | $958.90 | $5.31 | |
| Hypothetical-C | $1,000.00 | $1,019.44 | $5.47 | |
| Class T | 1.45% | |||
| Actual | $1,000.00 | $956.80 | $7.05 | |
| Hypothetical-C | $1,000.00 | $1,017.65 | $7.27 | |
| Class B | 1.91% | |||
| Actual | $1,000.00 | $955.20 | $9.29 | |
| Hypothetical-C | $1,000.00 | $1,015.37 | $9.57 | |
| Class C | 1.82% | |||
| Actual | $1,000.00 | $955.00 | $8.85 | |
| Hypothetical-C | $1,000.00 | $1,015.81 | $9.12 | |
| Japan | .80% | |||
| Actual | $1,000.00 | $960.70 | $3.90 | |
| Hypothetical-C | $1,000.00 | $1,020.89 | $4.02 | |
| Class I | .78% | |||
| Actual | $1,000.00 | $960.30 | $3.80 | |
| Hypothetical-C | $1,000.00 | $1,020.98 | $3.92 |
A Annualized expense ratio reflects expenses net of applicable fee waivers.
B Expenses are equal to each Class' annualized expense ratio, multiplied by the average account value over the period, multiplied by 182/366 (to reflect the one-half year period).
C 5% return per year before expenses
![]()
AJPNI-SANN-0616
1.917385.105
Fidelity Advisor® International Discovery Fund - Semi-Annual Report April 30, 2016 Class I is a class of Fidelity® International Discovery Fund |
|
Contents
To view a fund's proxy voting guidelines and proxy voting record for the 12-month period ended June 30, visit http://www.fidelity.com/proxyvotingresults or visit the Securities and Exchange Commission's (SEC) web site at http://www.sec.gov.
You may also call 1-877-208-0098 to request a free copy of the proxy voting guidelines.
Standard & Poor's, S&P and S&P 500 are registered service marks of The McGraw-Hill Companies, Inc. and have been licensed for use by Fidelity Distributors Corporation.
Other third-party marks appearing herein are the property of their respective owners.
All other marks appearing herein are registered or unregistered trademarks or service marks of FMR LLC or an affiliated company. © 2016 FMR LLC. All rights reserved.
This report and the financial statements contained herein are submitted for the general information of the shareholders of the Fund. This report is not authorized for distribution to prospective investors in the Fund unless preceded or accompanied by an effective prospectus.
A fund files its complete schedule of portfolio holdings with the SEC for the first and third quarters of each fiscal year on Form N-Q. Forms N-Q are available on the SEC’s web site at http://www.sec.gov. A fund's Forms N-Q may be reviewed and copied at the SEC’s Public Reference Room in Washington, DC. Information regarding the operation of the SEC's Public Reference Room may be obtained by calling 1-800-SEC-0330.
For a complete list of a fund's portfolio holdings, view the most recent holdings listing, semiannual report, or annual report on Fidelity's web site at http://www.fidelity.com, http://www.advisor.fidelity.com, or http://www.401k.com, as applicable.
NOT FDIC INSURED •MAY LOSE VALUE •NO BANK GUARANTEE
Neither the Fund nor Fidelity Distributors Corporation is a bank.
Investment Summary (Unaudited)
Geographic Diversification (% of fund's net assets)
| As of April 30, 2016 | ||
| Japan | 17.3% | |
| United Kingdom | 14.5% | |
| France | 9.6% | |
| Germany | 8.0% | |
| United States of America* | 5.8% | |
| Switzerland | 4.3% | |
| Sweden | 4.1% | |
| Hong Kong | 3.3% | |
| Netherlands | 3.3% | |
| Other | 29.8% | |

* Includes Short-Term investments and Net Other Assets (Liabilities).
Percentages are based on country or territory of incorporation and are adjusted for the effect of futures contracts, if applicable.
| As of October 31, 2015 | ||
| United Kingdom | 19.1% | |
| Japan | 15.9% | |
| France | 9.6% | |
| United States of America* | 7.3% | |
| Germany | 5.5% | |
| Switzerland | 5.1% | |
| Netherlands | 4.0% | |
| Sweden | 3.1% | |
| Hong Kong | 3.0% | |
| Other | 27.4% | |

* Includes Short-Term investments and Net Other Assets (Liabilities).
Percentages are based on country or territory of incorporation and are adjusted for the effect of futures contracts, if applicable.
Asset Allocation as of April 30, 2016
| % of fund's net assets | % of fund's net assets 6 months ago | |
| Stocks and Equity Futures | 99.1 | 97.5 |
| Other Investments | 0.0 | 0.1 |
| Short-Term Investments and Net Other Assets (Liabilities) | 0.9 | 2.4 |
Top Ten Stocks as of April 30, 2016
| % of fund's net assets | % of fund's net assets 6 months ago | |
| Total SA (France, Oil, Gas & Consumable Fuels) | 2.2 | 2.0 |
| Unilever NV (Certificaten Van Aandelen) (Bearer) (Netherlands, Personal Products) | 1.7 | 1.6 |
| Statoil ASA (Norway, Oil, Gas & Consumable Fuels) | 1.6 | 0.0 |
| Anheuser-Busch InBev SA NV (Belgium, Beverages) | 1.5 | 1.4 |
| AIA Group Ltd. (Hong Kong, Insurance) | 1.5 | 1.3 |
| ORIX Corp. (Japan, Diversified Financial Services) | 1.4 | 0.9 |
| Techtronic Industries Co. Ltd. (Hong Kong, Household Durables) | 1.4 | 1.3 |
| VINCI SA (France, Construction & Engineering) | 1.4 | 0.9 |
| KDDI Corp. (Japan, Wireless Telecommunication Services) | 1.4 | 1.1 |
| Novo Nordisk A/S Series B (Denmark, Pharmaceuticals) | 1.3 | 1.2 |
| 15.4 |
Market Sectors as of April 30, 2016
| % of fund's net assets | % of fund's net assets 6 months ago | |
| Financials | 21.6 | 24.2 |
| Consumer Discretionary | 15.3 | 17.4 |
| Consumer Staples | 13.2 | 11.9 |
| Health Care | 12.5 | 12.8 |
| Industrials | 10.7 | 10.5 |
| Information Technology | 10.0 | 7.5 |
| Energy | 5.0 | 4.3 |
| Telecommunication Services | 4.8 | 4.9 |
| Materials | 3.6 | 2.3 |
| Utilities | 0.6 | 0.0 |
Percentages shown as 0.0% may reflect amounts less than 0.05%.
Investments April 30, 2016 (Unaudited)
Showing Percentage of Net Assets
| Common Stocks - 97.1% | |||
| Shares | Value (000s) | ||
| Australia - 2.5% | |||
| 1-Page Ltd. (a)(b) | 2,531,460 | $1,857 | |
| Ansell Ltd. (a) | 1,588,251 | 24,068 | |
| Australia & New Zealand Banking Group Ltd. | 2,945,060 | 53,983 | |
| Burson Group Ltd. | 7,454,296 | 28,226 | |
| Magellan Financial Group Ltd. | 1,204,177 | 19,685 | |
| Mantra Group Ltd. | 7,793,893 | 21,927 | |
| Ramsay Health Care Ltd. | 1,164,235 | 57,495 | |
| Spark Infrastructure Group unit | 31,636,214 | 49,793 | |
| TOTAL AUSTRALIA | 257,034 | ||
| Austria - 0.5% | |||
| Andritz AG | 444,500 | 24,894 | |
| Erste Group Bank AG | 995,900 | 28,646 | |
| TOTAL AUSTRIA | 53,540 | ||
| Bailiwick of Jersey - 1.2% | |||
| Integrated Diagnostics Holdings PLC | 4,932,400 | 22,936 | |
| Randgold Resources Ltd. sponsored ADR | 241,314 | 24,252 | |
| Regus PLC | 11,055,488 | 47,233 | |
| Wolseley PLC | 514,260 | 28,805 | |
| TOTAL BAILIWICK OF JERSEY | 123,226 | ||
| Belgium - 2.0% | |||
| Anheuser-Busch InBev SA NV | 1,203,427 | 148,960 | |
| KBC Groep NV | 857,319 | 48,131 | |
| TOTAL BELGIUM | 197,091 | ||
| Bermuda - 0.3% | |||
| PAX Global Technology Ltd. | 29,071,000 | 25,037 | |
| Canada - 2.2% | |||
| Alimentation Couche-Tard, Inc. Class B (sub. vtg.) | 781,500 | 34,257 | |
| Cenovus Energy, Inc. | 2,806,100 | 44,483 | |
| Constellation Software, Inc. | 156,500 | 61,161 | |
| Franco-Nevada Corp. | 297,300 | 20,859 | |
| PrairieSky Royalty Ltd. (b) | 1,734,473 | 36,522 | |
| Suncor Energy, Inc. | 676,200 | 19,849 | |
| TOTAL CANADA | 217,131 | ||
| Cayman Islands - 0.9% | |||
| Alibaba Group Holding Ltd. sponsored ADR (a) | 453,700 | 34,908 | |
| Ctrip.com International Ltd. ADR (a) | 294,500 | 12,843 | |
| Lee's Pharmaceutical Holdings Ltd. | 6,734,664 | 5,449 | |
| New Oriental Education & Technology Group, Inc. sponsored ADR | 830,000 | 32,503 | |
| TOTAL CAYMAN ISLANDS | 85,703 | ||
| China - 0.6% | |||
| Jiangsu Hengrui Medicine Co. Ltd. | 4,183,623 | 30,165 | |
| Kweichow Moutai Co. Ltd. | 663,582 | 25,748 | |
| TOTAL CHINA | 55,913 | ||
| Cyprus - 0.0% | |||
| SPDI Secure Property Development & Investment PLC (a) | 517,230 | 129 | |
| Denmark - 1.3% | |||
| Novo Nordisk A/S Series B | 2,371,645 | 132,419 | |
| Finland - 0.7% | |||
| Sampo Oyj (A Shares) | 1,653,500 | 72,193 | |
| France - 9.6% | |||
| Accor SA (b) | 1,684,918 | 74,636 | |
| ALTEN | 608,659 | 37,635 | |
| Altran Technologies SA | 2,384,000 | 35,365 | |
| Amundi SA | 516,400 | 23,765 | |
| Atos Origin SA | 444,123 | 39,530 | |
| AXA SA (b) | 4,402,300 | 111,156 | |
| Capgemini SA | 855,800 | 79,894 | |
| Cegedim SA (a) | 536,390 | 14,728 | |
| Havas SA | 4,815,644 | 40,297 | |
| Sanofi SA | 467,356 | 38,523 | |
| Sodexo SA | 431,200 | 43,543 | |
| SR Teleperformance SA | 290,100 | 26,043 | |
| Total SA | 4,385,111 | 221,630 | |
| Unibail-Rodamco | 156,500 | 41,933 | |
| VINCI SA (b) | 1,924,900 | 143,796 | |
| TOTAL FRANCE | 972,474 | ||
| Germany - 8.0% | |||
| Axel Springer Verlag AG | 625,002 | 34,896 | |
| Bayer AG | 345,100 | 39,812 | |
| Beiersdorf AG | 242,900 | 21,794 | |
| Continental AG | 297,600 | 65,359 | |
| Deutsche Boerse AG | 526,494 | 43,219 | |
| Deutsche Telekom AG | 3,241,500 | 56,899 | |
| Fresenius SE & Co. KGaA | 468,700 | 34,090 | |
| GEA Group AG | 878,941 | 40,750 | |
| KION Group AG | 1,369,149 | 74,593 | |
| LEG Immobilien AG | 314,266 | 29,080 | |
| Nexus AG | 614,500 | 10,766 | |
| ProSiebenSat.1 Media AG | 1,170,000 | 59,644 | |
| Rational AG | 104,405 | 53,002 | |
| SAP AG | 1,390,594 | 109,107 | |
| Siemens AG | 685,498 | 71,736 | |
| Symrise AG | 637,700 | 42,249 | |
| United Internet AG | 430,714 | 21,027 | |
| TOTAL GERMANY | 808,023 | ||
| Hong Kong - 3.3% | |||
| AIA Group Ltd. | 24,704,000 | 147,844 | |
| China Resources Beer Holdings Co. Ltd. | 16,944,000 | 37,233 | |
| Techtronic Industries Co. Ltd. | 38,444,000 | 144,114 | |
| TOTAL HONG KONG | 329,191 | ||
| India - 2.6% | |||
| Bharti Infratel Ltd. | 12,647,734 | 71,392 | |
| Dr Lal Pathlabs Ltd. | 798,016 | 11,835 | |
| HDFC Bank Ltd. sponsored ADR | 1,290,984 | 81,164 | |
| Housing Development Finance Corp. Ltd. | 6,148,295 | 100,746 | |
| TOTAL INDIA | 265,137 | ||
| Ireland - 2.7% | |||
| Cairn Homes PLC (a) | 17,549,270 | 22,506 | |
| CRH PLC | 1,051,000 | 30,587 | |
| Dalata Hotel Group PLC (a) | 5,686,103 | 28,706 | |
| Green REIT PLC | 9,492,200 | 15,673 | |
| Irish Continental Group PLC unit | 101,800 | 600 | |
| James Hardie Industries PLC CDI | 1,482,921 | 20,893 | |
| Kerry Group PLC Class A | 983,700 | 87,712 | |
| Ryanair Holdings PLC sponsored ADR | 809,300 | 65,513 | |
| TOTAL IRELAND | 272,190 | ||
| Isle of Man - 0.8% | |||
| Optimal Payments PLC (a) | 11,752,725 | 65,462 | |
| Playtech Ltd. | 1,386,935 | 16,303 | |
| TOTAL ISLE OF MAN | 81,765 | ||
| Israel - 1.9% | |||
| Frutarom Industries Ltd. | 1,032,000 | 52,892 | |
| Partner Communications Co. Ltd. (a) | 2,268,862 | 11,804 | |
| Teva Pharmaceutical Industries Ltd. sponsored ADR | 2,291,300 | 124,761 | |
| TOTAL ISRAEL | 189,457 | ||
| Italy - 1.6% | |||
| De Longhi SpA | 1,669,626 | 38,446 | |
| Intesa Sanpaolo SpA | 30,697,900 | 85,334 | |
| Mediaset SpA | 3,440,200 | 15,481 | |
| Telecom Italia SpA (a) | 25,339,200 | 24,743 | |
| TOTAL ITALY | 164,004 | ||
| Japan - 17.3% | |||
| ACOM Co. Ltd. (a) | 3,246,300 | 16,935 | |
| Aozora Bank Ltd. | 9,464,000 | 33,578 | |
| Asahi Group Holdings | 1,066,900 | 33,860 | |
| Astellas Pharma, Inc. | 6,953,700 | 93,754 | |
| Casio Computer Co. Ltd. (b) | 2,015,200 | 38,343 | |
| Daito Trust Construction Co. Ltd. | 209,500 | 29,630 | |
| Dentsu, Inc. | 1,274,300 | 64,746 | |
| Don Quijote Holdings Co. Ltd. | 1,338,100 | 47,604 | |
| Hoya Corp. | 1,793,800 | 68,692 | |
| Japan Exchange Group, Inc. | 1,920,700 | 28,605 | |
| Japan Tobacco, Inc. | 2,318,600 | 94,733 | |
| KDDI Corp. | 4,728,900 | 136,219 | |
| Keyence Corp. | 95,360 | 57,158 | |
| Misumi Group, Inc. | 3,181,300 | 43,933 | |
| Mitsubishi UFJ Financial Group, Inc. | 11,142,500 | 51,421 | |
| Monex Group, Inc. | 12,207,949 | 31,493 | |
| NEC Corp. | 8,879,000 | 21,609 | |
| Nidec Corp. | 324,300 | 23,763 | |
| Nintendo Co. Ltd. | 274,100 | 37,113 | |
| Nippon Telegraph & Telephone Corp. | 904,500 | 40,477 | |
| Olympus Corp. | 3,148,400 | 122,651 | |
| ORIX Corp. | 10,231,600 | 144,725 | |
| Seven & i Holdings Co. Ltd. | 1,034,700 | 42,218 | |
| Seven Bank Ltd. | 12,039,600 | 51,159 | |
| Shinsei Bank Ltd. | 14,227,000 | 19,940 | |
| Shionogi & Co. Ltd. | 856,200 | 43,702 | |
| Sony Corp. | 3,594,500 | 87,065 | |
| Sundrug Co. Ltd. | 622,500 | 44,232 | |
| Tsuruha Holdings, Inc. | 834,000 | 79,994 | |
| United Arrows Ltd. | 991,300 | 39,833 | |
| VT Holdings Co. Ltd. | 3,872,500 | 19,566 | |
| Welcia Holdings Co. Ltd. | 1,150,800 | 60,788 | |
| TOTAL JAPAN | 1,749,539 | ||
| Luxembourg - 0.9% | |||
| Eurofins Scientific SA | 120,139 | 44,578 | |
| Grand City Properties SA | 1,528,397 | 33,759 | |
| Senvion SA | 708,900 | 12,460 | |
| TOTAL LUXEMBOURG | 90,797 | ||
| Marshall Islands - 0.1% | |||
| Hoegh LNG Partners LP (c) | 715,655 | 12,896 | |
| Netherlands - 3.3% | |||
| AerCap Holdings NV (a) | 562,900 | 22,522 | |
| IMCD Group BV | 1,926,800 | 77,794 | |
| ING Groep NV (Certificaten Van Aandelen) | 4,956,300 | 60,696 | |
| Unilever NV (Certificaten Van Aandelen) (Bearer) | 3,814,100 | 167,553 | |
| TOTAL NETHERLANDS | 328,565 | ||
| New Zealand - 0.8% | |||
| EBOS Group Ltd. | 3,154,998 | 35,160 | |
| Ryman Healthcare Group Ltd. | 7,137,434 | 44,505 | |
| TOTAL NEW ZEALAND | 79,665 | ||
| Norway - 1.6% | |||
| Statoil ASA (b) | 9,044,100 | 159,188 | |
| Philippines - 0.3% | |||
| SM Investments Corp. | 1,641,730 | 32,950 | |
| Romania - 0.2% | |||
| Banca Transilvania SA | 31,143,575 | 21,373 | |
| South Africa - 1.3% | |||
| EOH Holdings Ltd. | 2,855,067 | 27,788 | |
| Naspers Ltd. Class N | 720,500 | 98,860 | |
| TOTAL SOUTH AFRICA | 126,648 | ||
| Spain - 2.5% | |||
| Amadeus IT Holding SA Class A | 1,717,100 | 78,135 | |
| Atresmedia Corporacion de Medios de Comunicacion SA | 1,719,200 | 22,383 | |
| Hispania Activos Inmobiliarios SA (a) | 1,085,200 | 15,905 | |
| Inditex SA | 2,288,877 | 73,476 | |
| Mediaset Espana Comunicacion SA | 2,931,000 | 38,059 | |
| Merlin Properties Socimi SA | 2,483,100 | 28,859 | |
| TOTAL SPAIN | 256,817 | ||
| Sweden - 4.1% | |||
| ASSA ABLOY AB (B Shares) | 3,682,800 | 77,229 | |
| Getinge AB (B Shares) | 2,461,330 | 52,044 | |
| HEXPOL AB (B Shares) (b) | 2,967,500 | 30,671 | |
| Indutrade AB (b) | 201,100 | 11,276 | |
| Nordea Bank AB | 5,749,200 | 55,806 | |
| Saab AB (B Shares) | 980,200 | 33,530 | |
| Sandvik AB (b) | 2,242,600 | 23,011 | |
| Svenska Cellulosa AB (SCA) (B Shares) | 3,034,500 | 95,564 | |
| Svenska Handelsbanken AB (A Shares) (b) | 2,567,100 | 34,246 | |
| TOTAL SWEDEN | 413,377 | ||
| Switzerland - 4.3% | |||
| GAM Holding Ltd. | 1,405,187 | 18,310 | |
| Julius Baer Group Ltd. | 949,640 | 40,698 | |
| Novartis AG | 1,375,538 | 104,682 | |
| Partners Group Holding AG | 247,326 | 101,839 | |
| Schindler Holding AG (participation certificate) | 181,273 | 33,012 | |
| Syngenta AG (Switzerland) | 175,928 | 70,423 | |
| UBS Group AG | 3,690,490 | 63,861 | |
| TOTAL SWITZERLAND | 432,825 | ||
| Taiwan - 0.1% | |||
| JHL Biotech, Inc. (a) | 4,953,560 | 13,395 | |
| United Kingdom - 14.5% | |||
| AA PLC | 3,830,868 | 15,595 | |
| Associated British Foods PLC | 772,200 | 34,571 | |
| B&M European Value Retail S.A. | 9,180,129 | 37,209 | |
| BAE Systems PLC | 4,147,100 | 28,933 | |
| BCA Marketplace PLC | 7,762,300 | 18,913 | |
| BHP Billiton PLC | 2,881,014 | 39,368 | |
| BT Group PLC | 6,133,600 | 39,758 | |
| Bunzl PLC | 2,075,300 | 61,829 | |
| Cineworld Group PLC | 2,055,200 | 15,555 | |
| CMC Markets PLC | 8,647,600 | 31,589 | |
| Compass Group PLC | 2,013,000 | 35,848 | |
| Countryside Properties PLC (a) | 3,408,200 | 11,578 | |
| Diploma PLC | 2,312,600 | 24,718 | |
| GlaxoSmithKline PLC | 3,812,600 | 81,485 | |
| Howden Joinery Group PLC | 10,913,100 | 78,772 | |
| Imperial Tobacco Group PLC | 1,848,336 | 100,425 | |
| ITV PLC | 9,444,600 | 31,078 | |
| Lloyds Banking Group PLC | 69,181,900 | 67,903 | |
| London Stock Exchange Group PLC | 473,136 | 18,756 | |
| McCarthy & Stone PLC | 4,009,500 | 13,592 | |
| Melrose Industries PLC | 1,586,476 | 8,653 | |
| Micro Focus International PLC | 3,609,242 | 80,634 | |
| Moneysupermarket.com Group PLC | 5,210,600 | 23,899 | |
| Persimmon PLC | 1,469,800 | 42,673 | |
| Reckitt Benckiser Group PLC | 900,800 | 87,755 | |
| Rex Bionics PLC (a)(c) | 1,297,286 | 692 | |
| Rio Tinto PLC | 1,185,200 | 39,759 | |
| SABMiller PLC | 719,300 | 43,985 | |
| Shawbrook Group PLC | 8,951,700 | 37,487 | |
| Softcat PLC | 1,526,900 | 7,117 | |
| Spirax-Sarco Engineering PLC | 539,500 | 26,920 | |
| St. James's Place Capital PLC | 5,394,300 | 68,336 | |
| Standard Chartered PLC (United Kingdom) | 5,296,810 | 42,729 | |
| Taylor Wimpey PLC | 11,716,900 | 31,552 | |
| Virgin Money Holdings Uk PLC | 5,874,500 | 31,338 | |
| Vodafone Group PLC | 30,823,796 | 99,309 | |
| Workspace Group PLC | 649,000 | 7,918 | |
| TOTAL UNITED KINGDOM | 1,468,231 | ||
| United States of America - 3.1% | |||
| Constellation Brands, Inc. Class A (sub. vtg.) | 520,000 | 81,151 | |
| Global Payments, Inc. | 465,000 | 33,564 | |
| McGraw Hill Financial, Inc. | 462,400 | 49,407 | |
| Molson Coors Brewing Co. Class B | 121,600 | 11,629 | |
| MSCI, Inc. Class A | 586,700 | 44,554 | |
| Visa, Inc. Class A | 1,147,700 | 88,648 | |
| TOTAL UNITED STATES OF AMERICA | 308,953 | ||
| TOTAL COMMON STOCKS | |||
| (Cost $8,697,817) | 9,796,876 | ||
| Nonconvertible Preferred Stocks - 0.2% | |||
| Cayman Islands - 0.2% | |||
| China Internet Plus Holdings Ltd. Series A-11 (d) | |||
| (Cost $18,833) | 5,958,244 | 23,003 | |
| Principal Amount (000s) | Value (000s) | ||
| Government Obligations - 0.1% | |||
| United States of America - 0.1% | |||
| U.S. Treasury Bills, yield at date of purchase 0.2% to 0.33% 5/5/16 to 7/28/16 (e) | |||
| (Cost $11,655) | 11,660 | 11,657 | |
| Shares | Value (000s) | ||
| Money Market Funds - 5.1% | |||
| Fidelity Cash Central Fund, 0.38% (f) | 199,763,053 | 199,763 | |
| Fidelity Securities Lending Cash Central Fund, 0.42% (f)(g) | 311,707,412 | 311,707 | |
| TOTAL MONEY MARKET FUNDS | |||
| (Cost $511,470) | 511,470 | ||
| TOTAL INVESTMENT PORTFOLIO - 102.5% | |||
| (Cost $9,239,775) | 10,343,006 | ||
| NET OTHER ASSETS (LIABILITIES) - (2.5)% | (248,078) | ||
| NET ASSETS - 100% | $10,094,928 |
| Futures Contracts | |||
| Expiration Date | Underlying Face Amount at Value (000s) | Unrealized Appreciation/(Depreciation) (000s) | |
| Purchased | |||
| Equity Index Contracts | |||
| 2,402 CME Nikkei 225 Contracts (Japan) | June 2016 | 179,021 | $(11,598) |
The face value of futures purchased as a percentage of Net Assets is 1.8%
Categorizations in the Schedule of Investments are based on country or territory of incorporation.
Legend
(a) Non-income producing
(b) Security or a portion of the security is on loan at period end.
(c) Affiliated company
(d) Restricted securities - Investment in securities not registered under the Securities Act of 1933 (excluding 144A issues). At the end of the period, the value of restricted securities (excluding 144A issues) amounted to $23,003,000 or 0.2% of net assets.
(e) Security or a portion of the security was pledged to cover margin requirements for futures contracts. At period end, the value of securities pledged amounted to $11,657,000.
(f) Affiliated fund that is generally available only to investment companies and other accounts managed by Fidelity Investments. The rate quoted is the annualized seven-day yield of the fund at period end. A complete unaudited listing of the fund's holdings as of its most recent quarter end is available upon request. In addition, each Fidelity Central Fund's financial statements are available on the SEC's website or upon request.
(g) Investment made with cash collateral received from securities on loan.
Additional information on each restricted holding is as follows:
| Security | Acquisition Date | Acquisition Cost (000s) |
| China Internet Plus Holdings Ltd. Series A-11 | 1/26/15 | $18,833 |
Affiliated Central Funds
Information regarding fiscal year to date income earned by the Fund from investments in Fidelity Central Funds is as follows:
| Fund | Income earned |
| (Amounts in thousands) | |
| Fidelity Cash Central Fund | $545 |
| Fidelity Securities Lending Cash Central Fund | 2,593 |
| Total | $3,138 |
Other Affiliated Issuers
An affiliated company is a company in which the Fund has ownership of at least 5% of the voting securities. Fiscal year to date transactions with companies which are or were affiliates are as follows:
| Affiliate (Amounts in thousands) | Value, beginning of period | Purchases | Sales Proceeds* | Dividend Income | Value, end of period |
| Hoegh LNG Partners LP | $11,465 | $-- | $-- | $832 | $12,896 |
| Rex Bionics PLC | 976 | -- | 4 | -- | 692 |
| Total | $12,441 | $-- | $4 | $832 | $13,588 |
* Includes the value of securities delivered through in-kind transactions, if applicable.
Investment Valuation
The following is a summary of the inputs used, as of April 30, 2016, involving the Fund's assets and liabilities carried at fair value. The inputs or methodology used for valuing securities may not be an indication of the risk associated with investing in those securities. For more information on valuation inputs, and their aggregation into the levels used below, please refer to the Investment Valuation section in the accompanying Notes to Financial Statements.
| Valuation Inputs at Reporting Date: | ||||
| Description | Total | Level 1 | Level 2 | Level 3 |
| (Amounts in thousands) | ||||
| Investments in Securities: | ||||
| Equities: | ||||
| Consumer Discretionary | $1,534,838 | $1,034,716 | $477,119 | $23,003 |
| Consumer Staples | 1,334,162 | 853,349 | 480,813 | -- |
| Energy | 494,568 | 113,750 | 380,818 | -- |
| Financials | 2,185,536 | 1,236,886 | 948,650 | -- |
| Health Care | 1,265,979 | 574,622 | 691,357 | -- |
| Industrials | 1,107,038 | 909,868 | 197,170 | -- |
| Information Technology | 982,951 | 693,397 | 289,554 | -- |
| Materials | 371,953 | 262,239 | 109,714 | -- |
| Telecommunication Services | 480,601 | 83,196 | 397,405 | -- |
| Utilities | 62,253 | 62,253 | -- | -- |
| Government Obligations | 11,657 | -- | 11,657 | -- |
| Money Market Funds | 511,470 | 511,470 | -- | -- |
| Total Investments in Securities: | $10,343,006 | $6,335,746 | $3,984,257 | $23,003 |
| Derivative Instruments: | ||||
| Liabilities | ||||
| Futures Contracts | $(11,598) | $(11,598) | $-- | $-- |
| Total Liabilities | $(11,598) | $(11,598) | $-- | $-- |
| Total Derivative Instruments: | $(11,598) | $(11,598) | $-- | $-- |
The following is a summary of transfers between Level 1 and Level 2 for the period ended April 30, 2016. Transfers are assumed to have occurred at the beginning of the period, and are primarily attributable to the valuation techniques used for foreign equity securities, as discussed in the accompanying Notes to Financial Statements:
| Transfers | Total (000s) |
| Level 1 to Level 2 | $123,459 |
| Level 2 to Level 1 | $733,107 |
Value of Derivative Instruments
The following table is a summary of the Fund's value of derivative instruments by primary risk exposure as of April 30, 2016. For additional information on derivative instruments, please refer to the Derivative Instruments section in the accompanying Notes to Financial Statements.
| Primary Risk Exposure / Derivative Type | Value (000s) | |
| Asset | Liability | |
| Equity Risk | ||
| Futures Contracts(a) | $0 | $(11,598) |
| Total Equity Risk | 0 | (11,598) |
| Total Value of Derivatives | $0 | $(11,598) |
(a) Reflects gross cumulative appreciation (depreciation) on futures contracts as presented in the Schedule of Investments. In the Statement of Assets and Liabilities, the period end daily variation margin is included in receivable or payable for daily variation margin for derivative instruments, and the net cumulative appreciation (depreciation) is included in net unrealized appreciation (depreciation).
See accompanying notes which are an integral part of the financial statements.
Financial Statements
Statement of Assets and Liabilities
| Amounts in thousands (except per-share amounts) | April 30, 2016 (Unaudited) | |
| Assets | ||
| Investment in securities, at value (including securities loaned of $292,726) — See accompanying schedule: Unaffiliated issuers (cost $8,709,825) | $9,817,948 | |
| Fidelity Central Funds (cost $511,470) | 511,470 | |
| Other affiliated issuers (cost $18,480) | 13,588 | |
| Total Investments (cost $9,239,775) | $10,343,006 | |
| Foreign currency held at value (cost $3,534) | 3,534 | |
| Receivable for investments sold | 83,114 | |
| Receivable for fund shares sold | 9,626 | |
| Dividends receivable | 48,955 | |
| Distributions receivable from Fidelity Central Funds | 957 | |
| Prepaid expenses | 9 | |
| Other receivables | 4,089 | |
| Total assets | 10,493,290 | |
| Liabilities | ||
| Payable to custodian bank | $705 | |
| Payable for investments purchased | 56,857 | |
| Payable for fund shares redeemed | 16,003 | |
| Accrued management fee | 6,281 | |
| Distribution and service plan fees payable | 100 | |
| Payable for daily variation margin for derivative instruments | 4,684 | |
| Other affiliated payables | 1,444 | |
| Other payables and accrued expenses | 581 | |
| Collateral on securities loaned, at value | 311,707 | |
| Total liabilities | 398,362 | |
| Net Assets | $10,094,928 | |
| Net Assets consist of: | ||
| Paid in capital | $9,352,158 | |
| Undistributed net investment income | 88,416 | |
| Accumulated undistributed net realized gain (loss) on investments and foreign currency transactions | (436,449) | |
| Net unrealized appreciation (depreciation) on investments and assets and liabilities in foreign currencies | 1,090,803 | |
| Net Assets | $10,094,928 | |
| Calculation of Maximum Offering Price | ||
| Class A: | ||
| Net Asset Value and redemption price per share ($260,942.4 ÷ 6,913.487 shares) | $37.74 | |
| Maximum offering price per share (100/94.25 of $37.74) | $40.04 | |
| Class T: | ||
| Net Asset Value and redemption price per share ($38,584.3 ÷ 1,028.093 shares) | $37.53 | |
| Maximum offering price per share (100/96.50 of $37.53) | $38.89 | |
| Class B: | ||
| Net Asset Value and offering price per share ($1,398.6 ÷ 37.492 shares)(a) | $37.30 | |
| Class C: | ||
| Net Asset Value and offering price per share ($32,708.8 ÷ 878.178 shares)(a) | $37.25 | |
| International Discovery: | ||
| Net Asset Value, offering price and redemption price per share ($6,797,488.8 ÷ 178,912.550 shares) | $37.99 | |
| Class K: | ||
| Net Asset Value, offering price and redemption price per share ($2,151,531.2 ÷ 56,751.079 shares) | $37.91 | |
| Class I: | ||
| Net Asset Value, offering price and redemption price per share ($781,184.7 ÷ 20,610.933 shares) | $37.90 | |
| Class Z: | ||
| Net Asset Value, offering price and redemption price per share ($31,088.8 ÷ 820.463 shares) | $37.89 |
(a) Redemption price per share is equal to net asset value less any applicable contingent deferred sales charge.
See accompanying notes which are an integral part of the financial statements.
Statement of Operations
| Amounts in thousands | Six months ended April 30, 2016 (Unaudited) | |
| Investment Income | ||
| Dividends (including $832 earned from other affiliated issuers) | $115,061 | |
| Special dividends | 37,704 | |
| Interest | 30 | |
| Income from Fidelity Central Funds | 3,138 | |
| Income before foreign taxes withheld | 155,933 | |
| Less foreign taxes withheld | (11,075) | |
| Total income | 144,858 | |
| Expenses | ||
| Management fee | ||
| Basic fee | $34,526 | |
| Performance adjustment | 6,890 | |
| Transfer agent fees | 8,001 | |
| Distribution and service plan fees | 600 | |
| Accounting and security lending fees | 905 | |
| Custodian fees and expenses | 660 | |
| Independent trustees' compensation | 23 | |
| Registration fees | 158 | |
| Audit | 78 | |
| Legal | 14 | |
| Miscellaneous | 35 | |
| Total expenses before reductions | 51,890 | |
| Expense reductions | (113) | 51,777 |
| Net investment income (loss) | 93,081 | |
| Realized and Unrealized Gain (Loss) | ||
| Net realized gain (loss) on: | ||
| Investment securities: | ||
| Unaffiliated issuers | (355,764) | |
| Other affiliated issuers | (19) | |
| Foreign currency transactions | 4,399 | |
| Futures contracts | (10,549) | |
| Total net realized gain (loss) | (361,933) | |
| Change in net unrealized appreciation (depreciation) on: Investment securities | (204,729) | |
| Assets and liabilities in foreign currencies | (1,103) | |
| Futures contracts | (20,801) | |
| Total change in net unrealized appreciation (depreciation) | (226,633) | |
| Net gain (loss) | (588,566) | |
| Net increase (decrease) in net assets resulting from operations | $(495,485) |
See accompanying notes which are an integral part of the financial statements.
Statement of Changes in Net Assets
| Amounts in thousands | Six months ended April 30, 2016 (Unaudited) | Year ended October 31, 2015 |
| Increase (Decrease) in Net Assets | ||
| Operations | ||
| Net investment income (loss) | $93,081 | $149,838 |
| Net realized gain (loss) | (361,933) | 245,770 |
| Change in net unrealized appreciation (depreciation) | (226,633) | 655 |
| Net increase (decrease) in net assets resulting from operations | (495,485) | 396,263 |
| Distributions to shareholders from net investment income | (113,434) | (74,589) |
| Distributions to shareholders from net realized gain | (1,362) | – |
| Total distributions | (114,796) | (74,589) |
| Share transactions - net increase (decrease) | (262,006) | (353,147) |
| Redemption fees | 42 | 95 |
| Total increase (decrease) in net assets | (872,245) | (31,378) |
| Net Assets | ||
| Beginning of period | 10,967,173 | 10,998,551 |
| End of period (including undistributed net investment income of $88,416 and undistributed net investment income of $108,769, respectively) | $10,094,928 | $10,967,173 |
See accompanying notes which are an integral part of the financial statements.
Financial Highlights — Fidelity International Discovery Fund Class A
| Six months ended (Unaudited) April 30, | Years ended October 31, | |||||
| 2016 | 2015 | 2014 | 2013 | 2012 | 2011 | |
| Selected Per–Share Data | ||||||
| Net asset value, beginning of period | $39.78 | $38.70 | $39.49 | $31.66 | $29.43 | $32.07 |
| Income from Investment Operations | ||||||
| Net investment income (loss)A | .27B | .40C | .53D | .34 | .41 | .42 |
| Net realized and unrealized gain (loss) | (2.04) | .79 | (.67) | 7.97 | 2.11 | (2.52) |
| Total from investment operations | (1.77) | 1.19 | (.14) | 8.31 | 2.52 | (2.10) |
| Distributions from net investment income | (.27) | (.11) | (.33) | (.45) | (.29) | (.38) |
| Distributions from net realized gain | (.01) | – | (.31) | (.03) | – | (.16) |
| Total distributions | (.27)E | (.11) | (.65)F | (.48) | (.29) | (.54) |
| Redemption fees added to paid in capitalA,G | – | – | – | – | – | – |
| Net asset value, end of period | $37.74 | $39.78 | $38.70 | $39.49 | $31.66 | $29.43 |
| Total ReturnH,I,J | (4.47)% | 3.09% | (.36)% | 26.59% | 8.70% | (6.71)% |
| Ratios to Average Net AssetsK,L | ||||||
| Expenses before reductions | 1.37%M | 1.33% | 1.28% | 1.35% | 1.34% | 1.30% |
| Expenses net of fee waivers, if any | 1.37%M | 1.33% | 1.28% | 1.35% | 1.34% | 1.29% |
| Expenses net of all reductions | 1.37%M | 1.32% | 1.28% | 1.33% | 1.31% | 1.25% |
| Net investment income (loss) | 1.45%B,M | 1.00%C | 1.35%D | .97% | 1.41% | 1.31% |
| Supplemental Data | ||||||
| Net assets, end of period (in millions) | $261 | $283 | $297 | $347 | $299 | $320 |
| Portfolio turnover rateN | 49%M,O | 60%O | 57% | 65% | 68% | 75% |
A Calculated based on average shares outstanding during the period.
B Net Investment income per share reflects a large, non-recurring dividend which amounted to $.14 per share. Excluding this non-recurring dividend, the ratio of net investment income (loss) to average net assets would have been .72%.
C Net Investment income per share reflects a large, non-recurring dividend which amounted to $.12 per share. Excluding this non-recurring dividend, the ratio of net investment income (loss) to average net assets would have been .69%.
D Net Investment income per share reflects a large, non-recurring dividend which amounted to $.22 per share. Excluding this non-recurring dividend, the ratio of net investment income (loss) to average net assets would have been .80%.
E Total distributions of $.27 per share is comprised of distributions from net investment income of $.269 and distributions from net realized gain of $.005 per share.
F Total distributions of $.65 per share is comprised of distributions from net investment income of $.334 and distributions from net realized gain of $.311 per share.
G Amount represents less than $.005 per share.
H Total returns for periods of less than one year are not annualized.
I Total returns would have been lower if certain expenses had not been reduced during the applicable periods shown.
J Total returns do not include the effect of the sales charges.
K Fees and expenses of any underlying Fidelity Central Funds are not included in the Fund's expense ratio. The Fund indirectly bears its proportionate share of the expenses of any underlying Fidelity Central Funds.
L Expense ratios reflect operating expenses of the class. Expenses before reductions do not reflect amounts reimbursed by the investment adviser or reductions from brokerage service arrangements or reductions from other expense offset arrangements and do not represent the amount paid by the class during periods when reimbursements or reductions occur. Expenses net of fee waivers reflect expenses after reimbursement by the investment adviser but prior to reductions from brokerage service arrangements or other expense offset arrangements. Expenses net of all reductions represent the net expenses paid by the class.
M Annualized
N Amount does not include the portfolio activity of any underlying Fidelity Central Funds.
O Portfolio turnover rate excludes securities received or delivered in-kind.
See accompanying notes which are an integral part of the financial statements.
Financial Highlights — Fidelity International Discovery Fund Class T
| Six months ended (Unaudited) April 30, | Years ended October 31, | |||||
| 2016 | 2015 | 2014 | 2013 | 2012 | 2011 | |
| Selected Per–Share Data | ||||||
| Net asset value, beginning of period | $39.51 | $38.43 | $39.23 | $31.42 | $29.18 | $31.81 |
| Income from Investment Operations | ||||||
| Net investment income (loss)A | .23B | .30C | .44D | .26 | .34 | .34 |
| Net realized and unrealized gain (loss) | (2.03) | .80 | (.68) | 7.92 | 2.09 | (2.51) |
| Total from investment operations | (1.80) | 1.10 | (.24) | 8.18 | 2.43 | (2.17) |
| Distributions from net investment income | (.17) | (.02) | (.25) | (.34) | (.19) | (.30) |
| Distributions from net realized gain | (.01) | – | (.31) | (.03) | – | (.16) |
| Total distributions | (.18) | (.02) | (.56) | (.37) | (.19) | (.46) |
| Redemption fees added to paid in capitalA,E | – | – | – | – | – | – |
| Net asset value, end of period | $37.53 | $39.51 | $38.43 | $39.23 | $31.42 | $29.18 |
| Total ReturnF,G,H | (4.59)% | 2.86% | (.60)% | 26.31% | 8.41% | (6.96)% |
| Ratios to Average Net AssetsI,J | ||||||
| Expenses before reductions | 1.61%K | 1.57% | 1.51% | 1.59% | 1.59% | 1.56% |
| Expenses net of fee waivers, if any | 1.61%K | 1.57% | 1.51% | 1.59% | 1.59% | 1.55% |
| Expenses net of all reductions | 1.61%K | 1.56% | 1.51% | 1.57% | 1.56% | 1.51% |
| Net investment income (loss) | 1.21%B,K | .76%C | 1.11%D | .73% | 1.16% | 1.05% |
| Supplemental Data | ||||||
| Net assets, end of period (in millions) | $39 | $43 | $49 | $53 | $46 | $61 |
| Portfolio turnover rateL | 49%K,M | 60%M | 57% | 65% | 68% | 75% |
A Calculated based on average shares outstanding during the period.
B Net Investment income per share reflects a large, non-recurring dividend which amounted to $.14 per share. Excluding this non-recurring dividend, the ratio of net investment income (loss) to average net assets would have been .48%.
C Net Investment income per share reflects a large, non-recurring dividend which amounted to $.12 per share. Excluding this non-recurring dividend, the ratio of net investment income (loss) to average net assets would have been .45%.
D Net Investment income per share reflects a large, non-recurring dividend which amounted to $.21 per share. Excluding this non-recurring dividend, the ratio of net investment income (loss) to average net assets would have been .56%.
E Amount represents less than $.005 per share.
F Total returns for periods of less than one year are not annualized.
G Total returns would have been lower if certain expenses had not been reduced during the applicable periods shown.
H Total returns do not include the effect of the sales charges.
I Fees and expenses of any underlying Fidelity Central Funds are not included in the Fund's expense ratio. The Fund indirectly bears its proportionate share of the expenses of any underlying Fidelity Central Funds.
J Expense ratios reflect operating expenses of the class. Expenses before reductions do not reflect amounts reimbursed by the investment adviser or reductions from brokerage service arrangements or reductions from other expense offset arrangements and do not represent the amount paid by the class during periods when reimbursements or reductions occur. Expenses net of fee waivers reflect expenses after reimbursement by the investment adviser but prior to reductions from brokerage service arrangements or other expense offset arrangements. Expenses net of all reductions represent the net expenses paid by the class.
K Annualized
L Amount does not include the portfolio activity of any underlying Fidelity Central Funds.
M Portfolio turnover rate excludes securities received or delivered in-kind.
See accompanying notes which are an integral part of the financial statements.
Financial Highlights — Fidelity International Discovery Fund Class B
| Six months ended (Unaudited) April 30, | Years ended October 31, | |||||
| 2016 | 2015 | 2014 | 2013 | 2012 | 2011 | |
| Selected Per–Share Data | ||||||
| Net asset value, beginning of period | $39.20 | $38.32 | $39.08 | $31.28 | $29.02 | $31.60 |
| Income from Investment Operations | ||||||
| Net investment income (loss)A | .13B | .08C | .22D | .08 | .19 | .17 |
| Net realized and unrealized gain (loss) | (2.03) | .80 | (.66) | 7.90 | 2.09 | (2.48) |
| Total from investment operations | (1.90) | .88 | (.44) | 7.98 | 2.28 | (2.31) |
| Distributions from net investment income | – | – | (.01) | (.15) | (.02) | (.12) |
| Distributions from net realized gain | – | – | (.31) | (.03) | – | (.16) |
| Total distributions | – | – | (.32) | (.18) | (.02) | (.27)E |
| Redemption fees added to paid in capitalA,F | – | – | – | – | – | – |
| Net asset value, end of period | $37.30 | $39.20 | $38.32 | $39.08 | $31.28 | $29.02 |
| Total ReturnG,H,I | (4.85)% | 2.30% | (1.12)% | 25.64% | 7.85% | (7.39)% |
| Ratios to Average Net AssetsJ,K | ||||||
| Expenses before reductions | 2.14%L | 2.12% | 2.06% | 2.10% | 2.09% | 2.06% |
| Expenses net of fee waivers, if any | 2.14%L | 2.12% | 2.06% | 2.10% | 2.09% | 2.06% |
| Expenses net of all reductions | 2.14%L | 2.11% | 2.05% | 2.08% | 2.06% | 2.02% |
| Net investment income (loss) | .68%B,L | .21%C | .57%D | .22% | .66% | .54% |
| Supplemental Data | ||||||
| Net assets, end of period (in millions) | $1 | $2 | $5 | $7 | $8 | $10 |
| Portfolio turnover rateM | 49%L,N | 60%N | 57% | 65% | 68% | 75% |
A Calculated based on average shares outstanding during the period.
B Net Investment income per share reflects a large, non-recurring dividend which amounted to $.14 per share. Excluding this non-recurring dividend, the ratio of net investment income (loss) to average net assets would have been (.05) %.
C Net Investment income per share reflects a large, non-recurring dividend which amounted to $.12 per share. Excluding this non-recurring dividend, the ratio of net investment income (loss) to average net assets would have been (.10) %.
D Net Investment income per share reflects a large, non-recurring dividend which amounted to $.21 per share. Excluding this non-recurring dividend, the ratio of net investment income (loss) to average net assets would have been .02%.
E Total distributions of $.27 per share is comprised of distributions from net investment income of $.115 and distributions from net realized gain of $.155 per share.
F Amount represents less than $.005 per share.
G Total returns for periods of less than one year are not annualized.
H Total returns would have been lower if certain expenses had not been reduced during the applicable periods shown.
I Total returns do not include the effect of the contingent deferred sales charge.
J Fees and expenses of any underlying Fidelity Central Funds are not included in the Fund's expense ratio. The Fund indirectly bears its proportionate share of the expenses of any underlying Fidelity Central Funds.
K Expense ratios reflect operating expenses of the class. Expenses before reductions do not reflect amounts reimbursed by the investment adviser or reductions from brokerage service arrangements or reductions from other expense offset arrangements and do not represent the amount paid by the class during periods when reimbursements or reductions occur. Expenses net of fee waivers reflect expenses after reimbursement by the investment adviser but prior to reductions from brokerage service arrangements or other expense offset arrangements. Expenses net of all reductions represent the net expenses paid by the class.
L Annualized
M Amount does not include the portfolio activity of any underlying Fidelity Central Funds.
N Portfolio turnover rate excludes securities received or delivered in-kind.
See accompanying notes which are an integral part of the financial statements.
Financial Highlights — Fidelity International Discovery Fund Class C
| Six months ended (Unaudited) April 30, | Years ended October 31, | |||||
| 2016 | 2015 | 2014 | 2013 | 2012 | 2011 | |
| Selected Per–Share Data | ||||||
| Net asset value, beginning of period | $39.14 | $38.25 | $39.07 | $31.32 | $29.08 | $31.68 |
| Income from Investment Operations | ||||||
| Net investment income (loss)A | .13B | .10C | .23D | .08 | .19 | .18 |
| Net realized and unrealized gain (loss) | (2.02) | .79 | (.66) | 7.90 | 2.09 | (2.49) |
| Total from investment operations | (1.89) | .89 | (.43) | 7.98 | 2.28 | (2.31) |
| Distributions from net investment income | – | – | (.08) | (.20) | (.04) | (.14) |
| Distributions from net realized gain | – | – | (.31) | (.03) | – | (.16) |
| Total distributions | – | – | (.39) | (.23) | (.04) | (.29)E |
| Redemption fees added to paid in capitalA,F | – | – | – | – | – | – |
| Net asset value, end of period | $37.25 | $39.14 | $38.25 | $39.07 | $31.32 | $29.08 |
| Total ReturnG,H,I | (4.83)% | 2.33% | (1.10)% | 25.65% | 7.86% | (7.37)% |
| Ratios to Average Net AssetsJ,K | ||||||
| Expenses before reductions | 2.12%L | 2.09% | 2.03% | 2.10% | 2.09% | 2.05% |
| Expenses net of fee waivers, if any | 2.12%L | 2.09% | 2.03% | 2.09% | 2.09% | 2.04% |
| Expenses net of all reductions | 2.12%L | 2.08% | 2.02% | 2.07% | 2.06% | 2.00% |
| Net investment income (loss) | .70%B,L | .24%C | .60%D | .23% | .66% | .56% |
| Supplemental Data | ||||||
| Net assets, end of period (in millions) | $33 | $32 | $35 | $36 | $30 | $33 |
| Portfolio turnover rateM | 49%L,N | 60%N | 57% | 65% | 68% | 75% |
A Calculated based on average shares outstanding during the period.
B Net Investment income per share reflects a large, non-recurring dividend which amounted to $.14 per share. Excluding this non-recurring dividend, the ratio of net investment income (loss) to average net assets would have been (.03) %.
C Net Investment income per share reflects a large, non-recurring dividend which amounted to $.12 per share. Excluding this non-recurring dividend, the ratio of net investment income (loss) to average net assets would have been (.06) %.
D Net Investment income per share reflects a large, non-recurring dividend which amounted to $.21 per share. Excluding this non-recurring dividend, the ratio of net investment income (loss) to average net assets would have been .05%.
E Total distributions of $.29 per share is comprised of distributions from net investment income of $.137 and distributions from net realized gain of $.155 per share.
F Amount represents less than $.005 per share.
G Total returns for periods of less than one year are not annualized.
H Total returns would have been lower if certain expenses had not been reduced during the applicable periods shown.
I Total returns do not include the effect of the contingent deferred sales charge.
J Fees and expenses of any underlying Fidelity Central Funds are not included in the Fund's expense ratio. The Fund indirectly bears its proportionate share of the expenses of any underlying Fidelity Central Funds.
K Expense ratios reflect operating expenses of the class. Expenses before reductions do not reflect amounts reimbursed by the investment adviser or reductions from brokerage service arrangements or reductions from other expense offset arrangements and do not represent the amount paid by the class during periods when reimbursements or reductions occur. Expenses net of fee waivers reflect expenses after reimbursement by the investment adviser but prior to reductions from brokerage service arrangements or other expense offset arrangements. Expenses net of all reductions represent the net expenses paid by the class.
L Annualized
M Amount does not include the portfolio activity of any underlying Fidelity Central Funds.
N Portfolio turnover rate excludes securities received or delivered in-kind.
See accompanying notes which are an integral part of the financial statements.
Financial Highlights — Fidelity International Discovery Fund
| Six months ended (Unaudited) April 30, | Years ended October 31, | |||||
| 2016 | 2015 | 2014 | 2013 | 2012 | 2011 | |
| Selected Per–Share Data | ||||||
| Net asset value, beginning of period | $40.12 | $39.03 | $39.82 | $31.91 | $29.69 | $32.34 |
| Income from Investment Operations | ||||||
| Net investment income (loss)A | .34B | .54C | .67D | .47 | .51 | .53 |
| Net realized and unrealized gain (loss) | (2.06) | .81 | (.68) | 8.02 | 2.12 | (2.54) |
| Total from investment operations | (1.72) | 1.35 | (.01) | 8.49 | 2.63 | (2.01) |
| Distributions from net investment income | (.41) | (.26) | (.47) | (.55) | (.41) | (.48) |
| Distributions from net realized gain | (.01) | – | (.31) | (.03) | – | (.16) |
| Total distributions | (.41)E | (.26) | (.78) | (.58) | (.41) | (.64) |
| Redemption fees added to paid in capitalA,F | – | – | – | – | – | – |
| Net asset value, end of period | $37.99 | $40.12 | $39.03 | $39.82 | $31.91 | $29.69 |
| Total ReturnG,H | (4.33)% | 3.47% | (.01)% | 27.03% | 9.03% | (6.39)% |
| Ratios to Average Net AssetsI,J | ||||||
| Expenses before reductions | 1.02%K | .99% | .93% | 1.00% | 1.01% | .97% |
| Expenses net of fee waivers, if any | 1.02%K | .99% | .93% | 1.00% | 1.01% | .96% |
| Expenses net of all reductions | 1.02%K | .98% | .93% | .98% | .98% | .92% |
| Net investment income (loss) | 1.80%B,K | 1.34%C | 1.69%D | 1.32% | 1.73% | 1.64% |
| Supplemental Data | ||||||
| Net assets, end of period (in millions) | $6,797 | $7,209 | $7,464 | $7,800 | $5,965 | $6,806 |
| Portfolio turnover rateL | 49%K,M | 60%M | 57% | 65% | 68% | 75% |
A Calculated based on average shares outstanding during the period.
B Net Investment income per share reflects a large, non-recurring dividend which amounted to $.14 per share. Excluding this non-recurring dividend, the ratio of net investment income (loss) to average net assets would have been 1.07%.
C Net Investment income per share reflects a large, non-recurring dividend which amounted to $.12 per share. Excluding this non-recurring dividend, the ratio of net investment income (loss) to average net assets would have been 1.03%.
D Net Investment income per share reflects a large, non-recurring dividend which amounted to $.22 per share. Excluding this non-recurring dividend, the ratio of net investment income (loss) to average net assets would have been 1.15%.
E Total distributions of $.41 per share is comprised of distributions from net investment income of $.409 and distributions from net realized gain of $.005 per share.
F Amount represents less than $.005 per share.
G Total returns for periods of less than one year are not annualized.
H Total returns would have been lower if certain expenses had not been reduced during the applicable periods shown.
I Fees and expenses of any underlying Fidelity Central Funds are not included in the Fund's expense ratio. The Fund indirectly bears its proportionate share of the expenses of any underlying Fidelity Central Funds.
J Expense ratios reflect operating expenses of the class. Expenses before reductions do not reflect amounts reimbursed by the investment adviser or reductions from brokerage service arrangements or reductions from other expense offset arrangements and do not represent the amount paid by the class during periods when reimbursements or reductions occur. Expenses net of fee waivers reflect expenses after reimbursement by the investment adviser but prior to reductions from brokerage service arrangements or other expense offset arrangements. Expenses net of all reductions represent the net expenses paid by the class.
K Annualized
L Amount does not include the portfolio activity of any underlying Fidelity Central Funds.
M Portfolio turnover rate excludes securities received or delivered in-kind.
See accompanying notes which are an integral part of the financial statements.
Financial Highlights — Fidelity International Discovery Fund Class K
| Six months ended (Unaudited) April 30, | Years ended October 31, | |||||
| 2016 | 2015 | 2014 | 2013 | 2012 | 2011 | |
| Selected Per–Share Data | ||||||
| Net asset value, beginning of period | $40.06 | $38.97 | $39.76 | $31.87 | $29.66 | $32.32 |
| Income from Investment Operations | ||||||
| Net investment income (loss)A | .36B | .59C | .72D | .52 | .57 | .58 |
| Net realized and unrealized gain (loss) | (2.04) | .81 | (.67) | 8.01 | 2.11 | (2.54) |
| Total from investment operations | (1.68) | 1.40 | .05 | 8.53 | 2.68 | (1.96) |
| Distributions from net investment income | (.46) | (.31) | (.53) | (.61) | (.47) | (.55) |
| Distributions from net realized gain | (.01) | – | (.31) | (.03) | – | (.16) |
| Total distributions | (.47) | (.31) | (.84) | (.64) | (.47) | (.70)E |
| Redemption fees added to paid in capitalA,F | – | – | – | – | – | – |
| Net asset value, end of period | $37.91 | $40.06 | $38.97 | $39.76 | $31.87 | $29.66 |
| Total ReturnG,H | (4.25)% | 3.61% | .13% | 27.23% | 9.24% | (6.24)% |
| Ratios to Average Net AssetsI,J | ||||||
| Expenses before reductions | .89%K | .86% | .80% | .85% | .83% | .80% |
| Expenses net of fee waivers, if any | .89%K | .86% | .80% | .85% | .83% | .79% |
| Expenses net of all reductions | .89%K | .85% | .79% | .83% | .80% | .75% |
| Net investment income (loss) | 1.94%B,K | 1.47%C | 1.83%D | 1.47% | 1.91% | 1.81% |
| Supplemental Data | ||||||
| Net assets, end of period (in millions) | $2,152 | $2,308 | $2,464 | $2,576 | $1,776 | $1,245 |
| Portfolio turnover rateL | 49%K,M | 60%M | 57% | 65% | 68% | 75% |
A Calculated based on average shares outstanding during the period.
B Net Investment income per share reflects a large, non-recurring dividend which amounted to $.14 per share. Excluding this non-recurring dividend, the ratio of net investment income (loss) to average net assets would have been 1.20%.
C Net Investment income per share reflects a large, non-recurring dividend which amounted to $.12 per share. Excluding this non-recurring dividend, the ratio of net investment income (loss) to average net assets would have been 1.16%.
D Net Investment income per share reflects a large, non-recurring dividend which amounted to $.22 per share. Excluding this non-recurring dividend, the ratio of net investment income (loss) to average net assets would have been 1.28%.
E Total distributions of $.70 per share is comprised of distributions from net investment income of $.548 and distributions from net realized gain of $.155 per share.
F Amount represents less than $.005 per share.
G Total returns for periods of less than one year are not annualized.
H Total returns would have been lower if certain expenses had not been reduced during the applicable periods shown.
I Fees and expenses of any underlying Fidelity Central Funds are not included in the Fund's expense ratio. The Fund indirectly bears its proportionate share of the expenses of any underlying Fidelity Central Funds.
J Expense ratios reflect operating expenses of the class. Expenses before reductions do not reflect amounts reimbursed by the investment adviser or reductions from brokerage service arrangements or reductions from other expense offset arrangements and do not represent the amount paid by the class during periods when reimbursements or reductions occur. Expenses net of fee waivers reflect expenses after reimbursement by the investment adviser but prior to reductions from brokerage service arrangements or other expense offset arrangements. Expenses net of all reductions represent the net expenses paid by the class.
K Annualized
L Amount does not include the portfolio activity of any underlying Fidelity Central Funds.
M Portfolio turnover rate excludes securities received or delivered in-kind.
See accompanying notes which are an integral part of the financial statements.
Financial Highlights — Fidelity International Discovery Fund Class I
| Six months ended (Unaudited) April 30, | Years ended October 31, | |||||
| 2016 | 2015 | 2014 | 2013 | 2012 | 2011 | |
| Selected Per–Share Data | ||||||
| Net asset value, beginning of period | $40.03 | $38.96 | $39.76 | $31.87 | $29.65 | $32.31 |
| Income from Investment Operations | ||||||
| Net investment income (loss)A | .34B | .53C | .67D | .47 | .52 | .54 |
| Net realized and unrealized gain (loss) | (2.05) | .80 | (.68) | 8.01 | 2.11 | (2.55) |
| Total from investment operations | (1.71) | 1.33 | (.01) | 8.48 | 2.63 | (2.01) |
| Distributions from net investment income | (.42) | (.26) | (.48) | (.56) | (.41) | (.50) |
| Distributions from net realized gain | (.01) | – | (.31) | (.03) | – | (.16) |
| Total distributions | (.42)E | (.26) | (.79) | (.59) | (.41) | (.65)F |
| Redemption fees added to paid in capitalA,G | – | – | – | – | – | – |
| Net asset value, end of period | $37.90 | $40.03 | $38.96 | $39.76 | $31.87 | $29.65 |
| Total ReturnH,I | (4.31)% | 3.44% | (.01)% | 27.03% | 9.07% | (6.39)% |
| Ratios to Average Net AssetsJ,K | ||||||
| Expenses before reductions | 1.03%L | 1.00% | .93% | 1.00% | 1.00% | .95% |
| Expenses net of fee waivers, if any | 1.03%L | .99% | .93% | 1.00% | 1.00% | .94% |
| Expenses net of all reductions | 1.03%L | .98% | .93% | .97% | .97% | .90% |
| Net investment income (loss) | 1.80%B,L | 1.33%C | 1.69%D | 1.33% | 1.75% | 1.66% |
| Supplemental Data | ||||||
| Net assets, end of period (in millions) | $781 | $1,061 | $650 | $476 | $294 | $278 |
| Portfolio turnover rateM | 49%L,N | 60%N | 57% | 65% | 68% | 75% |
A Calculated based on average shares outstanding during the period.
B Net Investment income per share reflects a large, non-recurring dividend which amounted to $.14 per share. Excluding this non-recurring dividend, the ratio of net investment income (loss) to average net assets would have been 1.06%.
C Net Investment income per share reflects a large, non-recurring dividend which amounted to $.12 per share. Excluding this non-recurring dividend, the ratio of net investment income (loss) to average net assets would have been 1.03%.
D Net Investment income per share reflects a large, non-recurring dividend which amounted to $.22 per share. Excluding this non-recurring dividend, the ratio of net investment income (loss) to average net assets would have been 1.14%.
E Total distributions of $.42 per share is comprised of distributions from net investment income of $.418 and distributions from net realized gain of $.005 per share.
F Total distributions of $.65 per share is comprised of distributions from net investment income of $.497 and distributions from net realized gain of $.155 per share.
G Amount represents less than $.005 per share.
H Total returns for periods of less than one year are not annualized.
I Total returns would have been lower if certain expenses had not been reduced during the applicable periods shown.
J Fees and expenses of any underlying Fidelity Central Funds are not included in the Fund's expense ratio. The Fund indirectly bears its proportionate share of the expenses of any underlying Fidelity Central Funds.
K Expense ratios reflect operating expenses of the class. Expenses before reductions do not reflect amounts reimbursed by the investment adviser or reductions from brokerage service arrangements or reductions from other expense offset arrangements and do not represent the amount paid by the class during periods when reimbursements or reductions occur. Expenses net of fee waivers reflect expenses after reimbursement by the investment adviser but prior to reductions from brokerage service arrangements or other expense offset arrangements. Expenses net of all reductions represent the net expenses paid by the class.
L Annualized
M Amount does not include the portfolio activity of any underlying Fidelity Central Funds.
N Portfolio turnover rate excludes securities received or delivered in-kind.
See accompanying notes which are an integral part of the financial statements.
Financial Highlights — Fidelity International Discovery Fund Class Z
| Six months ended (Unaudited) April 30, | Years ended October 31, | |||
| 2016 | 2015 | 2014 | 2013 A | |
| Selected Per–Share Data | ||||
| Net asset value, beginning of period | $40.03 | $38.96 | $39.77 | $37.22 |
| Income from Investment Operations | ||||
| Net investment income (loss)B | .36C | .59D | .72E | .07 |
| Net realized and unrealized gain (loss) | (2.03) | .80 | (.68) | 2.48 |
| Total from investment operations | (1.67) | 1.39 | .04 | 2.55 |
| Distributions from net investment income | (.46) | (.32) | (.54) | – |
| Distributions from net realized gain | (.01) | – | (.31) | – |
| Total distributions | (.47) | (.32) | (.85) | – |
| Redemption fees added to paid in capitalB,F | – | – | – | – |
| Net asset value, end of period | $37.89 | $40.03 | $38.96 | $39.77 |
| Total ReturnG,H | (4.24)% | 3.58% | .12% | 6.85% |
| Ratios to Average Net AssetsI,J | ||||
| Expenses before reductions | .89%K | .86% | .80% | .85%K |
| Expenses net of fee waivers, if any | .89%K | .86% | .80% | .85%K |
| Expenses net of all reductions | .89%K | .85% | .79% | .83%K |
| Net investment income (loss) | 1.94%C,K | 1.47%D | 1.83%E | .76%K |
| Supplemental Data | ||||
| Net assets, end of period (000 omitted) | $31,089 | $30,093 | $35,125 | $107 |
| Portfolio turnover rateL | 49%K,M | 60%M | 57% | 65% |
A For the period August 13, 2013 (commencement of sale of shares) to October 31, 2013.
B Calculated based on average shares outstanding during the period.
C Net Investment income per share reflects a large, non-recurring dividend which amounted to $.14 per share. Excluding this non-recurring dividend, the ratio of net investment income (loss) to average net assets would have been 1.20%.
D Net Investment income per share reflects a large, non-recurring dividend which amounted to $.12 per share. Excluding this non-recurring dividend, the ratio of net investment income (loss) to average net assets would have been 1.16%.
E Net Investment income per share reflects a large, non-recurring dividend which amounted to $.21 per share. Excluding this non-recurring dividend, the ratio of net investment income (loss) to average net assets would have been 1.28%.
F Amount represents less than $.005 per share.
G Total returns for periods of less than one year are not annualized.
H Total returns would have been lower if certain expenses had not been reduced during the applicable periods shown.
I Fees and expenses of any underlying Fidelity Central Funds are not included in the Fund's expense ratio. The Fund indirectly bears its proportionate share of the expenses of any underlying Fidelity Central Funds.
J Expense ratios reflect operating expenses of the class. Expenses before reductions do not reflect amounts reimbursed by the investment adviser or reductions from brokerage service arrangements or reductions from other expense offset arrangements and do not represent the amount paid by the class during periods when reimbursements or reductions occur. Expense ratios before reductions for start-up periods may not be representative of longer-term operating periods. Expenses net of fee waivers reflect expenses after reimbursement by the investment adviser but prior to reductions from brokerage service arrangements or other expense offset arrangements. Expenses net of all reductions represent the net expenses paid by the class.
K Annualized
L Amount does not include the portfolio activity of any underlying Fidelity Central Funds.
M Portfolio turnover rate excludes securities received or delivered in-kind.
See accompanying notes which are an integral part of the financial statements.
Notes to Financial Statements (Unaudited)
For the period ended April 30, 2016
(Amounts in thousands except percentages)
1. Organization.
Fidelity International Discovery Fund (the Fund) is a fund of Fidelity Investment Trust (the Trust) and is authorized to issue an unlimited number of shares. The Trust is registered under the Investment Company Act of 1940, as amended (the 1940 Act), as an open-end management investment company organized as a Massachusetts business trust. The Fund offers Class A, Class T, Class C, International Discovery, Class K, Class I and Class Z shares, each of which, along with Class B shares, has equal rights as to assets and voting privileges. Class B shares are closed to new accounts and additional purchases, except for exchanges and reinvestments. Each class has exclusive voting rights with respect to matters that affect that class. Class B shares will automatically convert to Class A shares after a maximum holding period of seven years from the initial date of purchase.
During the period, the Board of Trustees approved the conversion of all existing Class B shares into Class A shares, effective on or about July 1, 2016, regardless of the length of times shares have been held.
2. Investments in Fidelity Central Funds.
The Fund invests in Fidelity Central Funds, which are open-end investment companies generally available only to other investment companies and accounts managed by the investment adviser and its affiliates. The Fund's Schedule of Investments lists each of the Fidelity Central Funds held as of period end, if any, as an investment of the Fund, but does not include the underlying holdings of each Fidelity Central Fund. As an Investing Fund, the Fund indirectly bears its proportionate share of the expenses of the underlying Fidelity Central Funds.
The Money Market Central Funds seek preservation of capital and current income and are managed by Fidelity Investments Money Management, Inc. (FIMM), an affiliate of the investment adviser. Annualized expenses of the Money Market Central Funds as of their most recent shareholder report date are less than .005%.
A complete unaudited list of holdings for each Fidelity Central Fund is available upon request or at the Securities and Exchange Commission (the SEC) website at www.sec.gov. In addition, the financial statements of the Fidelity Central Funds are available on the SEC website or upon request.
3. Significant Accounting Policies.
The financial statements have been prepared in conformity with accounting principles generally accepted in the United States of America (GAAP), which require management to make certain estimates and assumptions at the date of the financial statements. Actual results could differ from those estimates. Subsequent events, if any, through the date that the financial statements were issued have been evaluated in the preparation of the financial statements. The following summarizes the significant accounting policies of the Fund:
Investment Valuation. Investments are valued as of 4:00 p.m. Eastern time on the last calendar day of the period. The Board of Trustees (the Board) has delegated the day to day responsibility for the valuation of the Fund's investments to the Fidelity Management & Research Company (FMR) Fair Value Committee (the Committee). In accordance with valuation policies and procedures approved by the Board, the Fund attempts to obtain prices from one or more third party pricing vendors or brokers to value its investments. When current market prices, quotations or currency exchange rates are not readily available or reliable, investments will be fair valued in good faith by the Committee, in accordance with procedures adopted by the Board. Factors used in determining fair value vary by investment type and may include market or investment specific events, changes in interest rates and credit quality. The frequency with which these procedures are used cannot be predicted and they may be utilized to a significant extent. The Committee oversees the Fund's valuation policies and procedures and reports to the Board on the Committee's activities and fair value determinations. The Board monitors the appropriateness of the procedures used in valuing the Fund's investments and ratifies the fair value determinations of the Committee.
The Fund categorizes the inputs to valuation techniques used to value its investments into a disclosure hierarchy consisting of three levels as shown below:
- Level 1 – quoted prices in active markets for identical investments
- Level 2 – other significant observable inputs (including quoted prices for similar investments, interest rates, prepayment speeds, etc.)
- Level 3 – unobservable inputs (including the Fund's own assumptions based on the best information available)
Valuation techniques used to value the Fund's investments by major category are as follows:
Equity securities, including restricted securities, for which market quotations are readily available, are valued at the last reported sale price or official closing price as reported by a third party pricing vendor on the primary market or exchange on which they are traded and are categorized as Level 1 in the hierarchy. In the event there were no sales during the day or closing prices are not available, securities are valued at the last quoted bid price or may be valued using the last available price and are generally categorized as Level 2 in the hierarchy. For foreign equity securities, when market or security specific events arise, comparisons to the valuation of American Depositary Receipts (ADRs), futures contracts, Exchange-Traded Funds (ETFs) and certain indexes as well as quoted prices for similar securities may be used and would be categorized as Level 2 in the hierarchy. Utilizing these techniques may result in transfers between Level 1 and Level 2. For equity securities, including restricted securities, where observable inputs are limited, assumptions about market activity and risk are used and these securities may be categorized as Level 3 in the hierarchy.
Debt securities, including restricted securities, are valued based on evaluated prices received from third party pricing vendors or from brokers who make markets in such securities. U.S. government and government agency obligations are valued by pricing vendors who utilize matrix pricing which considers yield or price of bonds of comparable quality, coupon, maturity and type or by broker-supplied prices. When independent prices are unavailable or unreliable, debt securities may be valued utilizing pricing methodologies which consider similar factors that would be used by third party pricing vendors. Debt securities are generally categorized as Level 2 in the hierarchy but may be Level 3 depending on the circumstances.
Futures contracts are valued at the settlement price established each day by the board of trade or exchange on which they are traded and are categorized as Level 1 in the hierarchy. Investments in open-end mutual funds, including the Fidelity Central Funds, are valued at their closing net asset value (NAV) each business day and are categorized as Level 1 in the hierarchy.
Changes in valuation techniques may result in transfers in or out of an assigned level within the disclosure hierarchy. The aggregate value of investments by input level as of April 30, 2016, including information on transfers between Levels 1 and 2, is included at the end of the Fund's Schedule of Investments.
Foreign Currency. The Fund may use foreign currency contracts to facilitate transactions in foreign-denominated securities. Gains and losses from these transactions may arise from changes in the value of the foreign currency or if the counterparties do not perform under the contracts' terms.
Foreign-denominated assets, including investment securities, and liabilities are translated into U.S. dollars at the exchange rates at period end. Purchases and sales of investment securities, income and dividends received and expenses denominated in foreign currencies are translated into U.S. dollars at the exchange rate in effect on the transaction date.
The effects of exchange rate fluctuations on investments are included with the net realized and unrealized gain (loss) on investment securities. Other foreign currency transactions resulting in realized and unrealized gain (loss) are disclosed separately.
Investment Transactions and Income. For financial reporting purposes, the Fund's investment holdings and NAV include trades executed through the end of the last business day of the period. The NAV per share for processing shareholder transactions is calculated as of the close of business of the New York Stock Exchange (NYSE), normally 4:00 p.m. Eastern time and includes trades executed through the end of the prior business day. Gains and losses on securities sold are determined on the basis of identified cost. Dividend income is recorded on the ex-dividend date, except for certain dividends from foreign securities where the ex-dividend date may have passed, which are recorded as soon as the Fund is informed of the ex-dividend date. Non-cash dividends included in dividend income, if any, are recorded at the fair market value of the securities received. Income and capital gain distributions from Fidelity Central Funds, if any, are recorded on the ex-dividend date. Distributions received on securities that represent a return of capital or capital gain are recorded as a reduction of cost of investments and/or as a realized gain. Subsequent to ex-dividend date the Fund determines the components of these distributions, based upon receipt of tax filings or other correspondence relating to the underlying investment. Large, non-recurring dividends recognized by the Fund are presented separately on the Statement of Operations as "Special Dividends" and the impact of these dividends is presented in the Financial Highlights. Interest income is accrued as earned and includes coupon interest and amortization of premium and accretion of discount on debt securities as applicable. Investment income is recorded net of foreign taxes withheld where recovery of such taxes is uncertain.
Class Allocations and Expenses. Investment income, realized and unrealized capital gains and losses, common expenses of the Fund, and certain fund-level expense reductions, if any, are allocated daily on a pro-rata basis to each class based on the relative net assets of each class to the total net assets of the Fund. Each class differs with respect to transfer agent and distribution and service plan fees incurred. Certain expense reductions may also differ by class. For the reporting period, the allocated portion of income and expenses to each class as a percent of its average net assets may vary due to the timing of recording these transactions in relation to fluctuating net assets of the classes. Expenses directly attributable to a fund are charged to that fund. Expenses attributable to more than one fund are allocated among the respective funds on the basis of relative net assets or other appropriate methods. Expense estimates are accrued in the period to which they relate and adjustments are made when actual amounts are known.
Deferred Trustee Compensation. Under a Deferred Compensation Plan (the Plan), independent Trustees may elect to defer receipt of a portion of their annual compensation. Deferred amounts are invested in a cross-section of Fidelity funds, are marked-to-market and remain in the Fund until distributed in accordance with the Plan. The investment of deferred amounts and the offsetting payable to the Trustees are included in the accompanying Statement of Assets and Liabilities.
Income Tax Information and Distributions to Shareholders. Each year, the Fund intends to qualify as a regulated investment company under Subchapter M of the Internal Revenue Code, including distributing substantially all of its taxable income and realized gains. As a result, no provision for U.S. Federal income taxes is required. The Fund files a U.S. federal tax return, in addition to state and local tax returns as required. The Fund's federal income tax returns are subject to examination by the Internal Revenue Service (IRS) for a period of three fiscal years after they are filed. State and local tax returns may be subject to examination for an additional fiscal year depending on the jurisdiction. Foreign taxes are provided for based on the Fund's understanding of the tax rules and rates that exist in the foreign markets in which it invests.
Distributions are declared and recorded on the ex-dividend date. Income dividends and capital gain distributions are declared separately for each class. Income and capital gain distributions are determined in accordance with income tax regulations, which may differ from GAAP.
Capital accounts within the financial statements are adjusted for permanent book-tax differences. These adjustments have no impact on net assets or the results of operations. Capital accounts are not adjusted for temporary book-tax differences which will reverse in a subsequent period.
Book-tax differences are primarily due to futures contracts, foreign currency transactions, passive foreign investment companies (PFIC), market discount, certain foreign taxes, redemptions in-kind, deferred trustees compensation, capital loss carryforwards and losses deferred due to wash sales.
The federal tax cost of investment securities and unrealized appreciation (depreciation) as of period end were as follows:
| Gross unrealized appreciation | $1,550,136 |
| Gross unrealized depreciation | (447,894) |
| Net unrealized appreciation (depreciation) on securities | $1,102,242 |
| Tax cost | $9,240,764 |
Capital loss carryforwards are only available to offset future capital gains of the Fund to the extent provided by regulations and may be limited. Under the Regulated Investment Company Modernization Act of 2010 (the Act), the Fund is permitted to carry forward capital losses incurred in taxable years beginning after December 22, 2010 for an unlimited period and such capital losses are required to be used prior to any losses that expire. The capital loss carryforward information presented below, including any applicable limitation, is estimated as of prior fiscal period end and is subject to adjustment.
| Fiscal year of expiration | |
| 2017 | $(49,248) |
Short-Term Trading (Redemption) Fees. Shares held by investors in the Fund less than 30 days may have been subject to a redemption fee equal to 1.00% of the NAV of shares redeemed. All redemption fees, which reduce the proceeds of the shareholder redemption, are retained by the Fund and accounted for as an addition to paid in capital.
Restricted Securities. The Fund may invest in securities that are subject to legal or contractual restrictions on resale. These securities generally may be resold in transactions exempt from registration or to the public if the securities are registered. Disposal of these securities may involve time-consuming negotiations and expense, and prompt sale at an acceptable price may be difficult. Information regarding restricted securities is included at the end of the Fund's Schedule of Investments.
4. Derivative Instruments.
Risk Exposures and the Use of Derivative Instruments. The Fund's investment objective allows the Fund to enter into various types of derivative contracts, including futures contracts. Derivatives are investments whose value is primarily derived from underlying assets, indices or reference rates and may be transacted on an exchange or over-the-counter (OTC). Derivatives may involve a future commitment to buy or sell a specified asset based on specified terms, to exchange future cash flows at periodic intervals based on a notional principal amount, or for one party to make one or more payments upon the occurrence of specified events in exchange for periodic payments from the other party.
The Fund used derivatives to increase returns and to manage exposure to certain risks as defined below. The success of any strategy involving derivatives depends on analysis of numerous economic factors, and if the strategies for investment do not work as intended, the Fund may not achieve its objectives.
The Fund's use of derivatives increased or decreased its exposure to the following risk:
| Equity Risk | Equity risk relates to the fluctuations in the value of financial instruments as a result of changes in market prices (other than those arising from interest rate risk or foreign exchange risk), whether caused by factors specific to an individual investment, its issuer, or all factors affecting all instruments traded in a market or market segment. |
The Fund is also exposed to additional risks from investing in derivatives, such as liquidity risk and counterparty credit risk. Liquidity risk is the risk that the Fund will be unable to close out the derivative in the open market in a timely manner. Counterparty credit risk is the risk that the counterparty will not be able to fulfill its obligation to the Fund. Counterparty credit risk related to exchange-traded futures contracts may be mitigated by the protection provided by the exchange on which they trade.
Investing in derivatives may involve greater risks than investing in the underlying assets directly and, to varying degrees, may involve risk of loss in excess of any initial investment and collateral received and amounts recognized in the Statement of Assets and Liabilities. In addition, there may be the risk that the change in value of the derivative contract does not correspond to the change in value of the underlying instrument.
Futures Contracts. A futures contract is an agreement between two parties to buy or sell a specified underlying instrument for a fixed price at a specified future date. The Fund used futures contracts to manage its exposure to the stock market.
Upon entering into a futures contract, a fund is required to deposit either cash or securities (initial margin) with a clearing broker in an amount equal to a certain percentage of the face value of the contract. Futures contracts are marked-to-market daily and subsequent daily payments (variation margin) are made or received by a fund depending on the daily fluctuations in the value of the futures contracts and are recorded as unrealized appreciation or (depreciation). This receivable and/or payable, if any, is included in daily variation margin for derivative instruments in the Statement of Assets and Liabilities. Realized gain or (loss) is recorded upon the expiration or closing of a futures contract.
Any open futures contracts at period end are presented in the Schedule of Investments under the caption "Futures Contracts". The underlying face amount at value reflects each contract's exposure to the underlying instrument or index at period end and is representative of volume of activity during the period. Securities deposited to meet initial margin requirements are identified in the Schedule of Investments.
During the period the Fund recognized net realized gain (loss) of $(10,549) and a change in net unrealized appreciation (depreciation) of $(20,801) related to its investment in futures contracts. These amounts are included in the Statement of Operations.
5. Purchases and Sales of Investments.
Purchases and sales of securities, other than short-term securities and in-kind transactions, aggregated $2,445,746 and $2,483,783, respectively.
Redemptions In-Kind. During the period, 1,487 shares of the Fund held by an unaffiliated entity were redeemed in-kind for cash and investments with a value of $55,670. The net realized gain of $10,064 on investments delivered through the in-kind redemption is included in the accompanying Statement of Operations. The amount of in-kind redemptions is included in share transactions in the accompanying Statement of Changes in Net Assets as well as Note 11: Share Transactions. The Fund recognized no gain or loss for federal income tax purposes.
6. Fees and Other Transactions with Affiliates.
Management Fee. Fidelity Management & Research Company (the investment adviser) and its affiliates provide the Fund with investment management related services for which the Fund pays a monthly management fee. The management fee is the sum of an individual fund fee rate that is based on an annual rate of .424% of the Fund's average net assets and an annualized group fee rate that averaged .25% during the period. The group fee rate is based upon the average net assets of all the mutual funds advised by the investment adviser, including any mutual funds previously advised by the investment adviser that are currently advised by Fidelity SelectCo, LLC, an affiliate of the investment adviser. The group fee rate decreases as assets under management increase and increases as assets under management decrease. In addition, the management fee is subject to a performance adjustment (up to a maximum of +/- .20% of the Fund's average net assets over a 36 month performance period). The upward or downward adjustment to the management fee is based on the relative investment performance of International Discovery as compared to its benchmark index, the MSCI EAFE Index, over the same 36 month performance period. For the reporting period, the total annualized management fee rate, including the performance adjustment, was .81% of the Fund's average net assets. The performance adjustment included in the management fee rate may be higher or lower than the maximum performance adjustment rate due to the difference between the average net assets for the reporting and performance periods.
Distribution and Service Plan Fees. In accordance with Rule 12b-1 of the 1940 Act, the Fund has adopted separate Distribution and Service Plans for each class of shares. Certain classes pay Fidelity Distributors Corporation (FDC), an affiliate of the investment adviser, separate Distribution and Service Fees, each of which is based on an annual percentage of each class' average net assets. In addition, FDC may pay financial intermediaries for selling shares of the Fund and providing shareholder support services. For the period, the Distribution and Service Fee rates, total fees and amounts retained by FDC were as follows:
| Distribution Fee | Service Fee | Total Fees | Retained by FDC | |
| Class A | -% | .25% | $331 | $– |
| Class T | .25% | .25% | 99 | – |
| Class B | .75% | .25% | 9 | 7 |
| Class C | .75% | .25% | 161 | 15 |
| $600 | $22 |
Sales Load. FDC may receive a front-end sales charge of up to 5.75% for selling Class A shares and 3.50% for selling Class T shares, some of which is paid to financial intermediaries for selling shares of the Fund. Depending on the holding period, FDC may receive contingent deferred sales charges levied on Class A, Class T, Class B, and Class C redemptions. The deferred sales charges range from 5.00% to 1.00% for Class B shares, 1.00% for Class C shares, 1.00% for certain purchases of Class A shares and .25% for certain purchases of Class T shares.
For the period, sales charge amounts retained by FDC were as follows:
| Retained by FDC | |
| Class A | $32 |
| Class T | 3 |
| Class B(a) | –(b) |
| Class C(a) | 1 |
| $36 |
(a) When Class B and Class C shares are initially sold, FDC pays commissions from its own resources to financial intermediaries through which the sales are made.
(b) In the amount of less than five hundred dollars.
Transfer Agent Fees. Fidelity Investments Institutional Operations Company, Inc., (FIIOC), an affiliate of the investment adviser, is the transfer, dividend disbursing and shareholder servicing agent for each class of the Fund. FIIOC receives account fees and asset-based fees that vary according to the account size and type of account of the shareholders of the respective classes of the Fund, except for Class K and Class Z. FIIOC receives an asset-based fee of Class K's and Class Z's average net assets. FIIOC pays for typesetting, printing and mailing of shareholder reports, except proxy statements.
For the period, transfer agent fees for each class were as follows:
| Amount | % of Class-Level Average Net Assets(a) | |
| Class A | $369 | .28 |
| Class T | 53 | .27 |
| Class B | 3 | .30 |
| Class C | 45 | .28 |
| International Discovery | 6,165 | .18 |
| Class K | 508 | .05 |
| Class I | 851 | .19 |
| Class Z | 7 | .05 |
| $8,001 |
(a) Annualized
Accounting and Security Lending Fees. Fidelity Service Company, Inc. (FSC), an affiliate of the investment adviser, maintains the Fund's accounting records. The accounting fee is based on the level of average net assets for each month. Under a separate contract, FSC administers the security lending program. The security lending fee is based on the number and duration of lending transactions.
Brokerage Commissions. The Fund placed a portion of its portfolio transactions with brokerage firms which are affiliates of the investment adviser. Brokerage commissions are included in net realized gain (loss) and change in net unrealized appreciation (depreciation) in the Statement of Operations. The commissions paid to these affiliated firms were $6 for the period.
Interfund Trades. The Fund may purchase from or sell securities to other Fidelity Funds under procedures adopted by the Board. The procedures have been designed to ensure these interfund trades are executed in accordance with Rule 17a-7 of the 1940 Act. Interfund trades are included within the respective purchases and sales amounts shown in the Purchases and Sales of Investments note.
7. Committed Line of Credit.
The Fund participates with other funds managed by the investment adviser or an affiliate in a $4.25 billion credit facility (the "line of credit") to be utilized for temporary or emergency purposes to fund shareholder redemptions or for other short-term liquidity purposes. The Fund has agreed to pay commitment fees on its pro-rata portion of the line of credit, which amounted to $9 and is reflected in Miscellaneous expenses on the Statement of Operations. During the period, the Fund did not borrow on this line of credit.
8. Security Lending.
The Fund lends portfolio securities through a lending agent from time to time in order to earn additional income. For equity securities, a lending agent is used and may loan securities to certain qualified borrowers, including Fidelity Capital Markets (FCM), a broker-dealer affiliated with the Fund. On the settlement date of the loan, the Fund receives collateral (in the form of U.S. Treasury obligations, letters of credit and/or cash) against the loaned securities and maintains collateral in an amount not less than 100% of the market value of the loaned securities during the period of the loan. The market value of the loaned securities is determined at the close of business of the Fund and any additional required collateral is delivered to the Fund on the next business day. The Fund or borrower may terminate the loan at any time, and if the borrower defaults on its obligation to return the securities loaned because of insolvency or other reasons, the Fund may apply collateral received from the borrower against the obligation. The Fund may experience delays and costs in recovering the securities loaned. Any cash collateral received is invested in the Fidelity Securities Lending Cash Central Fund. The value of loaned securities and cash collateral at period end are disclosed on the Fund's Statement of Assets and Liabilities. The value of securities loaned to FCM at period end was $75. Security lending income represents the income earned on investing cash collateral, less rebates paid to borrowers and any lending agent fees associated with the loan, plus any premium payments received for lending certain types of securities. Security lending income is presented in the Statement of Operations as a component of income from Fidelity Central Funds. Total security lending income during the period amounted to $2,593, including $5 from securities loaned to FCM.
9. Expense Reductions.
Commissions paid to certain brokers with whom the investment adviser, or its affiliates, places trades on behalf of the Fund include an amount in addition to trade execution, which may be rebated back to the Fund to offset certain expenses. This amount totaled $74 for the period.
In addition, during the period the investment adviser reimbursed and/or waived a portion of fund-level operating expenses in the amount of $39.
10. Distributions to Shareholders.
Distributions to shareholders of each class were as follows:
| Six months ended April 30, 2016 | Year ended October 31, 2015 | |
| From net investment income | ||
| Class A | $1,912 | $864 |
| Class T | 184 | 23 |
| International Discovery | 73,519 | 49,040 |
| Class K | 26,239 | 19,835 |
| Class I | 11,205 | 4,544 |
| Class Z | 375 | 283 |
| Total | $113,434 | $74,589 |
| From net realized gain | ||
| Class A | $36 | $– |
| Class T | 5 | – |
| International Discovery | 899 | – |
| Class K | 284 | – |
| Class I | 134 | – |
| Class Z | 4 | – |
| Total | $1,362 | $– |
11. Share Transactions.
Share transactions for each class were as follows and may contain automatic conversions between classes or exchanges between affiliated funds:
| Shares | Shares | Dollars | Dollars | |
| Six months ended April 30, 2016 | Year ended October 31, 2015 | Six months ended April 30, 2016 | Year ended October 31, 2015 | |
| Class A | ||||
| Shares sold | 543 | 1,331 | $20,433 | $53,289 |
| Reinvestment of distributions | 48 | 22 | 1,922 | 843 |
| Shares redeemed | (784) | (1,915) | (29,432) | (76,178) |
| Net increase (decrease) | (193) | (562) | $(7,077) | $(22,046) |
| Class T | ||||
| Shares sold | 76 | 178 | $2,881 | $7,105 |
| Reinvestment of distributions | 5 | 1 | 183 | 23 |
| Shares redeemed | (140) | (355) | (5,252) | (13,954) |
| Net increase (decrease) | (59) | (176) | $(2,188) | $(6,826) |
| Class B | ||||
| Shares sold | – | 1 | $15 | $53 |
| Shares redeemed | (20) | (64) | (758) | (2,536) |
| Net increase (decrease) | (20) | (63) | $(743) | $(2,483) |
| Class C | ||||
| Shares sold | 159 | 201 | $5,952 | $7,918 |
| Shares redeemed | (92) | (314) | (3,380) | (12,486) |
| Net increase (decrease) | 67 | (113) | $2,572 | $(4,568) |
| International Discovery | ||||
| Shares sold | 9,886 | 20,827 | $372,799 | $832,233 |
| Reinvestment of distributions | 1,781 | 1,199 | 70,961 | 46,913 |
| Shares redeemed | (12,452) | (33,573) | (467,188) | (1,345,593) |
| Net increase (decrease) | (785) | (11,547) | $(23,428) | $(466,447) |
| Class K | ||||
| Shares sold | 7,943 | 15,372 | $296,942 | $613,737 |
| Reinvestment of distributions | 667 | 508 | 26,523 | 19,835 |
| Shares redeemed | (9,474)(a) | (21,494)(b) | (358,588)(a) | (860,632)(b) |
| Net increase (decrease) | (864) | (5,614) | $(35,123) | $(227,060) |
| Class I | ||||
| Shares sold | 6,739 | 15,392 | $253,947 | $602,134 |
| Reinvestment of distributions | 52 | 33 | 2,069 | 1,286 |
| Shares redeemed | (12,681) | (5,606) | (454,709) | (221,504) |
| Net increase (decrease) | (5,890) | 9,819 | $(198,693) | $381,916 |
| Class Z | ||||
| Shares sold | 202 | 402 | $7,794 | $16,312 |
| Reinvestment of distributions | 10 | 7 | 379 | 283 |
| Shares redeemed | (144) | (559) | (5,499) | (22,228) |
| Net increase (decrease) | 68 | (150) | $2,674 | $(5,633) |
(a) Amount includes in-kind redemptions (see Note 5: Redemptions In-Kind).
(b) Amount includes in-kind redemptions.
12. Other.
The Fund's organizational documents provide former and current trustees and officers with a limited indemnification against liabilities arising in connection with the performance of their duties to the Fund. In the normal course of business, the Fund may also enter into contracts that provide general indemnifications. The Fund's maximum exposure under these arrangements is unknown as this would be dependent on future claims that may be made against the Fund. The risk of material loss from such claims is considered remote.
At the end of the period, Strategic Advisers International Fund was the owner of record of approximately 13% of the total outstanding shares of the Fund. Mutual funds managed by the investment adviser or its affiliates were the owners of record, in the aggregate, of approximately 20% of the total outstanding shares of the Fund.
Shareholder Expense Example
As a shareholder of the Fund, you incur two types of costs: (1) transaction costs, including sales charges (loads) on purchase payments or redemption proceeds, redemption fees and (2) ongoing costs, including management fees, distribution and/or service (12b-1) fees and other Fund expenses. This Example is intended to help you understand your ongoing costs (in dollars) of investing in the Fund and to compare these costs with the ongoing costs of investing in other mutual funds.
The Example is based on an investment of $1,000 invested at the beginning of the period and held for the entire period (November 1, 2015 to April 30, 2016).
Actual Expenses
The first line of the accompanying table for each class of the Fund provides information about actual account values and actual expenses. You may use the information in this line, together with the amount you invested, to estimate the expenses that you paid over the period. Simply divide your account value by $1,000.00 (for example, an $8,600 account value divided by $1,000.00 = 8.6), then multiply the result by the number in the first line for a class of the Fund under the heading entitled "Expenses Paid During Period" to estimate the expenses you paid on your account during this period. A small balance maintenance fee of $12.00 that is charged once a year may apply for certain accounts with a value of less than $2,000. This fee is not included in the table below. If it was, the estimate of expenses you paid during the period would be higher, and your ending account value lower, by this amount. In addition, the Fund, as a shareholder in the underlying Fidelity Central Funds, will indirectly bear its pro-rata share of the fees and expenses incurred by the underlying Fidelity Central Funds. These fees and expenses are not included in the Fund's annualized expense ratio used to calculate the expense estimate in the table below.
Hypothetical Example for Comparison Purposes
The second line of the accompanying table for each class of the Fund provides information about hypothetical account values and hypothetical expenses based on a Class' actual expense ratio and an assumed rate of return of 5% per year before expenses, which is not the Class' actual return. The hypothetical account values and expenses may not be used to estimate the actual ending account balance or expenses you paid for the period. You may use this information to compare the ongoing costs of investing in the Fund and other funds. To do so, compare this 5% hypothetical example with the 5% hypothetical examples that appear in the shareholder reports of the other funds. A small balance maintenance fee of $12.00 that is charged once a year may apply for certain accounts with a value of less than $2,000. This fee is not included in the table below. If it was, the estimate of expenses you paid during the period would be higher, and your ending account value lower, by this amount. In addition, the Fund, as a shareholder in the underlying Fidelity Central Funds, will indirectly bear its pro-rata share of the fees and expenses incurred by the underlying Fidelity Central Funds. These fees and expenses are not included in the Fund's annualized expense ratio used to calculate the expense estimate in the table below.
Please note that the expenses shown in the table are meant to highlight your ongoing costs only and do not reflect any transaction costs. Therefore, the second line of the table is useful in comparing ongoing costs only, and will not help you determine the relative total costs of owning different funds. In addition, if these transactional costs were included, your costs would have been higher.
| Annualized Expense Ratio-A | Beginning Account Value November 1, 2015 | Ending Account Value April 30, 2016 | Expenses Paid During Period-B November 1, 2015 to April 30, 2016 | |
| Class A | 1.37% | |||
| Actual | $1,000.00 | $955.30 | $6.66 | |
| Hypothetical-C | $1,000.00 | $1,018.05 | $6.87 | |
| Class T | 1.61% | |||
| Actual | $1,000.00 | $954.10 | $7.82 | |
| Hypothetical-C | $1,000.00 | $1,016.86 | $8.07 | |
| Class B | 2.14% | |||
| Actual | $1,000.00 | $951.50 | $10.38 | |
| Hypothetical-C | $1,000.00 | $1,014.22 | $10.72 | |
| Class C | 2.12% | |||
| Actual | $1,000.00 | $951.70 | $10.29 | |
| Hypothetical-C | $1,000.00 | $1,014.32 | $10.62 | |
| International Discovery | 1.02% | |||
| Actual | $1,000.00 | $956.70 | $4.96 | |
| Hypothetical-C | $1,000.00 | $1,019.79 | $5.12 | |
| Class K | .89% | |||
| Actual | $1,000.00 | $957.50 | $4.33 | |
| Hypothetical-C | $1,000.00 | $1,020.44 | $4.47 | |
| Class I | 1.03% | |||
| Actual | $1,000.00 | $956.90 | $5.01 | |
| Hypothetical-C | $1,000.00 | $1,019.74 | $5.17 | |
| Class Z | .89% | |||
| Actual | $1,000.00 | $957.60 | $4.33 | |
| Hypothetical-C | $1,000.00 | $1,020.44 | $4.47 |
A Annualized expense ratio reflects expenses net of applicable fee waivers.
B Expenses are equal to each Class' annualized expense ratio, multiplied by the average account value over the period, multiplied by 182/366 (to reflect the one-half year period).
C 5% return per year before expenses
![]()
AIDI-SANN-0616
1.806666.111
Fidelity Advisor® International Value Fund - Semi-Annual Report April 30, 2016 Class A, Class T, Class B and Class C are classes of Fidelity® International Value Fund |
|
Contents
To view a fund's proxy voting guidelines and proxy voting record for the 12-month period ended June 30, visit http://www.fidelity.com/proxyvotingresults or visit the Securities and Exchange Commission's (SEC) web site at http://www.sec.gov.
You may also call 1-877-208-0098 to request a free copy of the proxy voting guidelines.
Standard & Poor's, S&P and S&P 500 are registered service marks of The McGraw-Hill Companies, Inc. and have been licensed for use by Fidelity Distributors Corporation.
Other third-party marks appearing herein are the property of their respective owners.
All other marks appearing herein are registered or unregistered trademarks or service marks of FMR LLC or an affiliated company. © 2016 FMR LLC. All rights reserved.
This report and the financial statements contained herein are submitted for the general information of the shareholders of the Fund. This report is not authorized for distribution to prospective investors in the Fund unless preceded or accompanied by an effective prospectus.
A fund files its complete schedule of portfolio holdings with the SEC for the first and third quarters of each fiscal year on Form N-Q. Forms N-Q are available on the SEC’s web site at http://www.sec.gov. A fund's Forms N-Q may be reviewed and copied at the SEC’s Public Reference Room in Washington, DC. Information regarding the operation of the SEC's Public Reference Room may be obtained by calling 1-800-SEC-0330.
For a complete list of a fund's portfolio holdings, view the most recent holdings listing, semiannual report, or annual report on Fidelity's web site at http://www.fidelity.com, http://www.advisor.fidelity.com, or http://www.401k.com, as applicable.
NOT FDIC INSURED •MAY LOSE VALUE •NO BANK GUARANTEE
Neither the Fund nor Fidelity Distributors Corporation is a bank.
Investment Summary (Unaudited)
Geographic Diversification (% of fund's net assets)
| As of April 30, 2016 | ||
| United Kingdom | 20.6% | |
| Japan | 19.6% | |
| France | 17.9% | |
| Switzerland | 7.9% | |
| United States of America* | 6.5% | |
| Germany | 6.0% | |
| Netherlands | 3.7% | |
| Australia | 3.7% | |
| Italy | 3.1% | |
| Other | 11.0% | |

* Includes Short-Term investments and Net Other Assets (Liabilities).
Percentages are based on country or territory of incorporation and are adjusted for the effect of futures contracts, if applicable.
| As of October 31, 2015 | ||
| United Kingdom | 23.5% | |
| Japan | 20.6% | |
| France | 16.3% | |
| Switzerland | 8.2% | |
| United States of America* | 6.0% | |
| Germany | 5.5% | |
| Netherlands | 3.7% | |
| Australia | 2.9% | |
| Spain | 2.0% | |
| Other | 11.3% | |

* Includes Short-Term investments and Net Other Assets (Liabilities).
Percentages are based on country or territory of incorporation and are adjusted for the effect of futures contracts, if applicable.
Asset Allocation as of April 30, 2016
| % of fund's net assets | % of fund's net assets 6 months ago | |
| Stocks | 98.8 | 97.6 |
| Short-Term Investments and Net Other Assets (Liabilities) | 1.2 | 2.4 |
Top Ten Stocks as of April 30, 2016
| % of fund's net assets | % of fund's net assets 6 months ago | |
| Total SA (France, Oil, Gas & Consumable Fuels) | 3.5 | 3.1 |
| Westpac Banking Corp. (Australia, Banks) | 2.2 | 1.5 |
| Toyota Motor Corp. (Japan, Automobiles) | 2.2 | 2.4 |
| Nestle SA (Switzerland, Food Products) | 2.2 | 2.7 |
| Sanofi SA (France, Pharmaceuticals) | 2.1 | 2.6 |
| Rio Tinto PLC (United Kingdom, Metals & Mining) | 2.0 | 1.6 |
| Vodafone Group PLC sponsored ADR (United Kingdom, Wireless Telecommunication Services) | 1.9 | 1.8 |
| Imperial Tobacco Group PLC (United Kingdom, Tobacco) | 1.8 | 1.8 |
| Novartis AG (Switzerland, Pharmaceuticals) | 1.8 | 2.6 |
| BASF AG (Germany, Chemicals) | 1.7 | 1.7 |
| 21.4 |
Market Sectors as of April 30, 2016
| % of fund's net assets | % of fund's net assets 6 months ago | |
| Financials | 24.3 | 26.3 |
| Consumer Discretionary | 13.8 | 14.4 |
| Health Care | 13.6 | 16.0 |
| Consumer Staples | 9.3 | 9.3 |
| Industrials | 8.8 | 8.0 |
| Energy | 8.2 | 6.7 |
| Telecommunication Services | 6.8 | 6.1 |
| Materials | 5.8 | 4.1 |
| Information Technology | 4.4 | 3.6 |
| Utilities | 3.8 | 3.1 |
Investments April 30, 2016 (Unaudited)
Showing Percentage of Net Assets
| Common Stocks - 98.4% | |||
| Shares | Value | ||
| Australia - 3.7% | |||
| Ansell Ltd. (a) | 101,524 | $1,538,472 | |
| Macquarie Group Ltd. | 27,058 | 1,306,420 | |
| Transurban Group unit | 216,635 | 1,907,439 | |
| Westpac Banking Corp. (b) | 315,896 | 7,415,205 | |
| TOTAL AUSTRALIA | 12,167,536 | ||
| Bailiwick of Jersey - 0.7% | |||
| Wolseley PLC | 43,009 | 2,409,023 | |
| Belgium - 0.5% | |||
| Anheuser-Busch InBev SA NV | 13,670 | 1,692,071 | |
| Canada - 1.1% | |||
| Imperial Oil Ltd. | 70,500 | 2,338,013 | |
| Potash Corp. of Saskatchewan, Inc. | 62,500 | 1,105,842 | |
| TOTAL CANADA | 3,443,855 | ||
| Finland - 1.1% | |||
| Sampo Oyj (A Shares) | 80,434 | 3,511,809 | |
| France - 17.9% | |||
| Atos Origin SA | 46,498 | 4,138,632 | |
| AXA SA (b) | 220,121 | 5,557,967 | |
| Bouygues SA (b) | 34,935 | 1,164,868 | |
| Capgemini SA | 45,493 | 4,247,041 | |
| Havas SA | 237,066 | 1,983,774 | |
| Orange SA | 172,900 | 2,872,549 | |
| Renault SA | 28,345 | 2,735,429 | |
| Sanofi SA | 85,210 | 7,023,567 | |
| Societe Generale Series A | 89,900 | 3,537,311 | |
| SR Teleperformance SA | 16,600 | 1,490,214 | |
| Total SA | 224,102 | 11,326,284 | |
| Unibail-Rodamco | 14,600 | 3,911,949 | |
| VINCI SA (b) | 70,100 | 5,236,685 | |
| Vivendi SA | 164,892 | 3,167,628 | |
| TOTAL FRANCE | 58,393,898 | ||
| Germany - 5.6% | |||
| Axel Springer Verlag AG | 26,500 | 1,479,565 | |
| BASF AG | 69,079 | 5,706,986 | |
| Bayer AG | 16,503 | 1,903,849 | |
| Continental AG | 6,766 | 1,485,953 | |
| Fresenius SE & Co. KGaA | 53,300 | 3,876,700 | |
| GEA Group AG | 32,955 | 1,527,895 | |
| SAP AG | 30,421 | 2,386,864 | |
| TOTAL GERMANY | 18,367,812 | ||
| Hong Kong - 0.7% | |||
| Power Assets Holdings Ltd. | 250,500 | 2,383,280 | |
| Ireland - 1.2% | |||
| Allergan PLC (a) | 6,180 | 1,338,341 | |
| Medtronic PLC | 30,700 | 2,429,905 | |
| TOTAL IRELAND | 3,768,246 | ||
| Israel - 1.4% | |||
| Teva Pharmaceutical Industries Ltd. sponsored ADR | 85,999 | 4,682,646 | |
| Italy - 3.1% | |||
| Eni SpA | 273,600 | 4,469,784 | |
| Intesa Sanpaolo SpA | 843,500 | 2,344,762 | |
| Mediaset SpA | 344,400 | 1,549,816 | |
| Telecom Italia SpA (a) | 1,809,900 | 1,767,320 | |
| TOTAL ITALY | 10,131,682 | ||
| Japan - 19.6% | |||
| Astellas Pharma, Inc. | 237,700 | 3,204,813 | |
| Dentsu, Inc. | 63,000 | 3,200,968 | |
| East Japan Railway Co. | 24,000 | 2,111,426 | |
| Hoya Corp. | 85,000 | 3,255,013 | |
| Itochu Corp. | 242,900 | 3,086,920 | |
| Japan Tobacco, Inc. | 91,900 | 3,754,845 | |
| KDDI Corp. | 143,200 | 4,124,981 | |
| Makita Corp. | 36,100 | 2,277,311 | |
| Mitsubishi UFJ Financial Group, Inc. | 1,037,200 | 4,786,487 | |
| Nippon Prologis REIT, Inc. (c) | 681 | 1,632,928 | |
| Nippon Telegraph & Telephone Corp. | 121,600 | 5,441,640 | |
| OBIC Co. Ltd. | 37,600 | 1,976,291 | |
| Olympus Corp. | 70,900 | 2,762,025 | |
| ORIX Corp. | 206,700 | 2,923,758 | |
| Seven & i Holdings Co. Ltd. | 67,400 | 2,750,084 | |
| Seven Bank Ltd. | 497,900 | 2,115,681 | |
| Sony Corp. | 88,500 | 2,143,614 | |
| Sony Financial Holdings, Inc. | 127,800 | 1,579,983 | |
| Sumitomo Mitsui Financial Group, Inc. | 123,900 | 3,728,364 | |
| Toyota Motor Corp. | 144,000 | 7,299,324 | |
| TOTAL JAPAN | 64,156,456 | ||
| Luxembourg - 0.5% | |||
| RTL Group SA | 19,239 | 1,598,910 | |
| Netherlands - 3.7% | |||
| ING Groep NV (Certificaten Van Aandelen) | 327,390 | 4,009,319 | |
| Koninklijke KPN NV | 425,668 | 1,672,729 | |
| Mylan N.V. | 28,600 | 1,192,906 | |
| PostNL NV (a) | 92,431 | 404,302 | |
| RELX NV | 292,810 | 4,913,559 | |
| TOTAL NETHERLANDS | 12,192,815 | ||
| Spain - 2.2% | |||
| Iberdrola SA | 738,976 | 5,260,579 | |
| Mediaset Espana Comunicacion SA | 146,500 | 1,902,283 | |
| TOTAL SPAIN | 7,162,862 | ||
| Sweden - 1.6% | |||
| Nordea Bank AB | 395,200 | 3,836,129 | |
| Sandvik AB (b) | 137,100 | 1,406,775 | |
| TOTAL SWEDEN | 5,242,904 | ||
| Switzerland - 7.9% | |||
| Credit Suisse Group AG | 139,828 | 2,127,967 | |
| Lafargeholcim Ltd. (Reg.) | 38,610 | 1,954,850 | |
| Nestle SA | 97,429 | 7,272,070 | |
| Novartis AG | 76,736 | 5,839,783 | |
| Syngenta AG (Switzerland) | 9,247 | 3,701,499 | |
| UBS Group AG | 64,958 | 1,121,825 | |
| Zurich Insurance Group AG | 16,404 | 3,680,801 | |
| TOTAL SWITZERLAND | 25,698,795 | ||
| United Kingdom - 20.6% | |||
| AstraZeneca PLC (United Kingdom) | 90,857 | 5,212,701 | |
| Aviva PLC | 465,420 | 2,948,663 | |
| BAE Systems PLC | 384,029 | 2,679,239 | |
| Barclays PLC | 1,179,880 | 2,962,394 | |
| Bunzl PLC | 122,364 | 3,645,572 | |
| Compass Group PLC | 209,239 | 3,726,209 | |
| HSBC Holdings PLC sponsored ADR (b) | 155,871 | 5,195,180 | |
| Imperial Tobacco Group PLC | 110,738 | 6,016,713 | |
| Informa PLC | 303,133 | 2,898,930 | |
| ITV PLC | 1,071,296 | 3,525,110 | |
| Lloyds Banking Group PLC | 5,108,500 | 5,014,049 | |
| Micro Focus International PLC | 70,200 | 1,568,337 | |
| National Grid PLC | 336,150 | 4,796,392 | |
| Prudential PLC | 73,355 | 1,447,994 | |
| Rio Tinto PLC | 198,126 | 6,646,394 | |
| Royal Dutch Shell PLC Class B (United Kingdom) | 113,561 | 2,981,529 | |
| Vodafone Group PLC sponsored ADR | 185,558 | 6,075,169 | |
| TOTAL UNITED KINGDOM | 67,340,575 | ||
| United States of America - 5.3% | |||
| Altria Group, Inc. | 31,400 | 1,969,094 | |
| Chevron Corp. | 25,900 | 2,646,462 | |
| ConocoPhillips Co. | 63,100 | 3,015,549 | |
| Constellation Brands, Inc. Class A (sub. vtg.) | 24,100 | 3,761,046 | |
| Edgewell Personal Care Co. (a) | 15,600 | 1,280,292 | |
| McGraw Hill Financial, Inc. | 24,100 | 2,575,085 | |
| Molson Coors Brewing Co. Class B | 19,900 | 1,903,037 | |
| TOTAL UNITED STATES OF AMERICA | 17,150,565 | ||
| TOTAL COMMON STOCKS | |||
| (Cost $335,758,650) | 321,495,740 | ||
| Nonconvertible Preferred Stocks - 0.4% | |||
| Germany - 0.4% | |||
| Volkswagen AG | |||
| (Cost $1,940,159) | 8,731 | 1,264,175 | |
| Money Market Funds - 5.5% | |||
| Fidelity Cash Central Fund, 0.38% (d) | 2,939,485 | 2,939,485 | |
| Fidelity Securities Lending Cash Central Fund, 0.42% (d)(e) | 15,029,266 | 15,029,266 | |
| TOTAL MONEY MARKET FUNDS | |||
| (Cost $17,968,751) | 17,968,751 | ||
| TOTAL INVESTMENT PORTFOLIO - 104.3% | |||
| (Cost $355,667,560) | 340,728,666 | ||
| NET OTHER ASSETS (LIABILITIES) - (4.3)% | (13,926,556) | ||
| NET ASSETS - 100% | $326,802,110 |
Categorizations in the Schedule of Investments are based on country or territory of incorporation.
Legend
(a) Non-income producing
(b) Security or a portion of the security is on loan at period end.
(c) Security or a portion of the security purchased on a delayed delivery or when-issued basis. Interest rate to be determined at settlement date.
(d) Affiliated fund that is generally available only to investment companies and other accounts managed by Fidelity Investments. The rate quoted is the annualized seven-day yield of the fund at period end. A complete unaudited listing of the fund's holdings as of its most recent quarter end is available upon request. In addition, each Fidelity Central Fund's financial statements are available on the SEC's website or upon request.
(e) Investment made with cash collateral received from securities on loan.
Affiliated Central Funds
Information regarding fiscal year to date income earned by the Fund from investments in Fidelity Central Funds is as follows:
| Fund | Income earned |
| Fidelity Cash Central Fund | $6,324 |
| Fidelity Securities Lending Cash Central Fund | 137,227 |
| Total | $143,551 |
Investment Valuation
The following is a summary of the inputs used, as of April 30, 2016, involving the Fund's assets and liabilities carried at fair value. The inputs or methodology used for valuing securities may not be an indication of the risk associated with investing in those securities. For more information on valuation inputs, and their aggregation into the levels used below, please refer to the Investment Valuation section in the accompanying Notes to Financial Statements.
| Valuation Inputs at Reporting Date: | ||||
| Description | Total | Level 1 | Level 2 | Level 3 |
| Investments in Securities: | ||||
| Equities: | ||||
| Consumer Discretionary | $44,875,247 | $25,337,504 | $19,537,743 | $-- |
| Consumer Staples | 30,399,252 | 16,622,253 | 13,776,999 | -- |
| Energy | 26,777,621 | 8,000,024 | 18,777,597 | -- |
| Financials | 79,272,030 | 25,467,716 | 53,804,314 | -- |
| Health Care | 44,260,721 | 16,962,819 | 27,297,902 | -- |
| Industrials | 29,347,669 | 16,783,750 | 12,563,919 | -- |
| Information Technology | 14,317,165 | 5,815,378 | 8,501,787 | -- |
| Materials | 19,115,571 | 12,469,177 | 6,646,394 | -- |
| Telecommunication Services | 21,954,388 | 6,075,169 | 15,879,219 | -- |
| Utilities | 12,440,251 | -- | 12,440,251 | -- |
| Money Market Funds | 17,968,751 | 17,968,751 | -- | -- |
| Total Investments in Securities: | $340,728,666 | $151,502,541 | $189,226,125 | $-- |
The following is a summary of transfers between Level 1 and Level 2 for the period ended April 30, 2016. Transfers are assumed to have occurred at the beginning of the period, and are primarily attributable to the valuation techniques used for foreign equity securities, as discussed in the accompanying Notes to Financial Statements:
| Transfers | Total |
| Level 1 to Level 2 | $9,505,293 |
| Level 2 to Level 1 | $16,220,609 |
See accompanying notes which are an integral part of the financial statements.
Financial Statements
Statement of Assets and Liabilities
| April 30, 2016 (Unaudited) | ||
| Assets | ||
| Investment in securities, at value (including securities loaned of $14,114,361) — See accompanying schedule: Unaffiliated issuers (cost $337,698,809) | $322,759,915 | |
| Fidelity Central Funds (cost $17,968,751) | 17,968,751 | |
| Total Investments (cost $355,667,560) | $340,728,666 | |
| Foreign currency held at value (cost $60,596) | 59,602 | |
| Receivable for investments sold | 406,523 | |
| Receivable for fund shares sold | 71,546 | |
| Dividends receivable | 2,263,594 | |
| Distributions receivable from Fidelity Central Funds | 50,580 | |
| Prepaid expenses | 155 | |
| Receivable from investment adviser for expense reductions | 525 | |
| Other receivables | 2,134 | |
| Total assets | 343,583,325 | |
| Liabilities | ||
| Payable for investments purchased | ||
| Regular delivery | $734,074 | |
| Delayed delivery | 88,039 | |
| Payable for fund shares redeemed | 628,459 | |
| Accrued management fee | 192,067 | |
| Distribution and service plan fees payable | 7,207 | |
| Other affiliated payables | 59,645 | |
| Other payables and accrued expenses | 42,458 | |
| Collateral on securities loaned, at value | 15,029,266 | |
| Total liabilities | 16,781,215 | |
| Net Assets | $326,802,110 | |
| Net Assets consist of: | ||
| Paid in capital | $445,477,213 | |
| Undistributed net investment income | 3,722,812 | |
| Accumulated undistributed net realized gain (loss) on investments and foreign currency transactions | (107,513,209) | |
| Net unrealized appreciation (depreciation) on investments and assets and liabilities in foreign currencies | (14,884,706) | |
| Net Assets | $326,802,110 | |
| Calculation of Maximum Offering Price | ||
| Class A: | ||
| Net Asset Value and redemption price per share ($8,316,805 ÷ 1,059,524 shares) | $7.85 | |
| Maximum offering price per share (100/94.25 of $7.85) | $8.33 | |
| Class T: | ||
| Net Asset Value and redemption price per share ($4,007,441 ÷ 510,734 shares) | $7.85 | |
| Maximum offering price per share (100/96.50 of $7.85) | $8.13 | |
| Class B: | ||
| Net Asset Value and offering price per share ($185,710 ÷ 23,320 shares)(a) | $7.96 | |
| Class C: | ||
| Net Asset Value and offering price per share ($4,412,832 ÷ 562,495 shares)(a) | $7.85 | |
| International Value: | ||
| Net Asset Value, offering price and redemption price per share ($307,974,481 ÷ 39,244,446 shares) | $7.85 | |
| Class I: | ||
| Net Asset Value, offering price and redemption price per share ($1,904,841 ÷ 242,277 shares) | $7.86 |
(a) Redemption price per share is equal to net asset value less any applicable contingent deferred sales charge.
See accompanying notes which are an integral part of the financial statements.
Statement of Operations
| Six months ended April 30, 2016 (Unaudited) | ||
| Investment Income | ||
| Dividends | $6,260,678 | |
| Income from Fidelity Central Funds | 143,551 | |
| Income before foreign taxes withheld | 6,404,229 | |
| Less foreign taxes withheld | (490,131) | |
| Total income | 5,914,098 | |
| Expenses | ||
| Management fee | ||
| Basic fee | $1,070,146 | |
| Performance adjustment | 83,742 | |
| Transfer agent fees | 269,737 | |
| Distribution and service plan fees | 43,317 | |
| Accounting and security lending fees | 79,749 | |
| Custodian fees and expenses | 39,497 | |
| Independent trustees' compensation | 642 | |
| Registration fees | 74,413 | |
| Audit | 33,078 | |
| Legal | 304 | |
| Miscellaneous | 750 | |
| Total expenses before reductions | 1,695,375 | |
| Expense reductions | (5,259) | 1,690,116 |
| Net investment income (loss) | 4,223,982 | |
| Realized and Unrealized Gain (Loss) | ||
| Net realized gain (loss) on: | ||
| Investment securities: | ||
| Unaffiliated issuers | (1,140,494) | |
| Foreign currency transactions | 130,172 | |
| Total net realized gain (loss) | (1,010,322) | |
| Change in net unrealized appreciation (depreciation) on: Investment securities | (14,207,322) | |
| Assets and liabilities in foreign currencies | 7,902 | |
| Total change in net unrealized appreciation (depreciation) | (14,199,420) | |
| Net gain (loss) | (15,209,742) | |
| Net increase (decrease) in net assets resulting from operations | $(10,985,760) |
See accompanying notes which are an integral part of the financial statements.
Statement of Changes in Net Assets
| Six months ended April 30, 2016 (Unaudited) | Year ended October 31, 2015 | |
| Increase (Decrease) in Net Assets | ||
| Operations | ||
| Net investment income (loss) | $4,223,982 | $4,113,357 |
| Net realized gain (loss) | (1,010,322) | (2,475,305) |
| Change in net unrealized appreciation (depreciation) | (14,199,420) | (2,310,957) |
| Net increase (decrease) in net assets resulting from operations | (10,985,760) | (672,905) |
| Distributions to shareholders from net investment income | (4,084,383) | (7,553,931) |
| Share transactions - net increase (decrease) | 54,490,310 | 87,547,372 |
| Redemption fees | 433 | 863 |
| Total increase (decrease) in net assets | 39,420,600 | 79,321,399 |
| Net Assets | ||
| Beginning of period | 287,381,510 | 208,060,111 |
| End of period (including undistributed net investment income of $3,722,812 and undistributed net investment income of $3,583,213, respectively) | $326,802,110 | $287,381,510 |
See accompanying notes which are an integral part of the financial statements.
Financial Highlights — Fidelity International Value Fund Class A
| Six months ended (Unaudited) April 30, | Years ended October 31, | |||||
| 2016 | 2015 | 2014 | 2013 | 2012 | 2011 | |
| Selected Per–Share Data | ||||||
| Net asset value, beginning of period | $8.27 | $8.62 | $8.96 | $7.39 | $7.02 | $8.22 |
| Income from Investment Operations | ||||||
| Net investment income (loss)A | .09 | .13 | .31B | .17 | .20 | .22 |
| Net realized and unrealized gain (loss) | (.42) | (.20) | (.47) | 1.64 | .39 | (1.19) |
| Total from investment operations | (.33) | (.07) | (.16) | 1.81 | .59 | (.97) |
| Distributions from net investment income | (.09) | (.28) | (.17) | (.20) | (.22) | (.19) |
| Distributions from net realized gain | – | – | (.01) | (.04) | – | (.03) |
| Total distributions | (.09) | (.28) | (.18) | (.24) | (.22) | (.23)C |
| Redemption fees added to paid in capitalA,D | – | – | – | – | – | – |
| Net asset value, end of period | $7.85 | $8.27 | $8.62 | $8.96 | $7.39 | $7.02 |
| Total ReturnE,F,G | (4.05)% | (.81)% | (1.76)% | 25.24% | 8.82% | (12.19)% |
| Ratios to Average Net AssetsH,I | ||||||
| Expenses before reductions | 1.43%J | 1.37% | 1.32% | 1.39% | 1.44% | 1.36% |
| Expenses net of fee waivers, if any | 1.43%J | 1.37% | 1.32% | 1.39% | 1.44% | 1.36% |
| Expenses net of all reductions | 1.43%J | 1.36% | 1.32% | 1.36% | 1.41% | 1.34% |
| Net investment income (loss) | 2.44%J | 1.58% | 3.44%B | 2.08% | 2.85% | 2.79% |
| Supplemental Data | ||||||
| Net assets, end of period (000 omitted) | $8,317 | $8,956 | $6,296 | $6,191 | $4,491 | $4,668 |
| Portfolio turnover rateK | 26%J | 44% | 69% | 79% | 74% | 83% |
A Calculated based on average shares outstanding during the period.
B Net Investment income per share reflects a large, non-recurring dividend which amounted to $.14 per share. Excluding this non-recurring dividend, the ratio of net investment income (loss) to average net assets would have been 1.90%.
C Total distributions of $.23 per share is comprised of distributions from net investment income of $.191 and distributions from net realized gain of $.034 per share.
D Amount represents less than $.005 per share.
E Total returns for periods of less than one year are not annualized.
F Total returns would have been lower if certain expenses had not been reduced during the applicable periods shown.
G Total returns do not include the effect of the sales charges.
H Fees and expenses of any underlying Fidelity Central Funds are not included in the Fund's expense ratio. The Fund indirectly bears its proportionate share of the expenses of any underlying Fidelity Central Funds.
I Expense ratios reflect operating expenses of the class. Expenses before reductions do not reflect amounts reimbursed by the investment adviser or reductions from brokerage service arrangements or reductions from other expense offset arrangements and do not represent the amount paid by the class during periods when reimbursements or reductions occur. Expenses net of fee waivers reflect expenses after reimbursement by the investment adviser but prior to reductions from brokerage service arrangements or other expense offset arrangements. Expenses net of all reductions represent the net expenses paid by the class.
J Annualized
K Amount does not include the portfolio activity of any underlying Fidelity Central Funds.
See accompanying notes which are an integral part of the financial statements.
Financial Highlights — Fidelity International Value Fund Class T
| Six months ended (Unaudited) April 30, | Years ended October 31, | |||||
| 2016 | 2015 | 2014 | 2013 | 2012 | 2011 | |
| Selected Per–Share Data | ||||||
| Net asset value, beginning of period | $8.25 | $8.60 | $8.94 | $7.38 | $7.00 | $8.20 |
| Income from Investment Operations | ||||||
| Net investment income (loss)A | .08 | .11 | .28B | .15 | .18 | .20 |
| Net realized and unrealized gain (loss) | (.42) | (.20) | (.46) | 1.64 | .40 | (1.19) |
| Total from investment operations | (.34) | (.09) | (.18) | 1.79 | .58 | (.99) |
| Distributions from net investment income | (.06) | (.26) | (.15) | (.19) | (.20) | (.17) |
| Distributions from net realized gain | – | – | (.01) | (.04) | – | (.03) |
| Total distributions | (.06) | (.26) | (.16) | (.23) | (.20) | (.21)C |
| Redemption fees added to paid in capitalA,D | – | – | – | – | – | – |
| Net asset value, end of period | $7.85 | $8.25 | $8.60 | $8.94 | $7.38 | $7.00 |
| Total ReturnE,F,G | (4.14)% | (1.09)% | (1.99)% | 24.86% | 8.60% | (12.42)% |
| Ratios to Average Net AssetsH,I | ||||||
| Expenses before reductions | 1.73%J | 1.66% | 1.59% | 1.66% | 1.71% | 1.63% |
| Expenses net of fee waivers, if any | 1.70%J | 1.66% | 1.59% | 1.65% | 1.70% | 1.62% |
| Expenses net of all reductions | 1.70%J | 1.65% | 1.59% | 1.63% | 1.67% | 1.60% |
| Net investment income (loss) | 2.17%J | 1.29% | 3.17%B | 1.81% | 2.58% | 2.52% |
| Supplemental Data | ||||||
| Net assets, end of period (000 omitted) | $4,007 | $4,086 | $3,604 | $3,758 | $2,693 | $2,468 |
| Portfolio turnover rateK | 26 %J | 44% | 69% | 79% | 74% | 83% |
A Calculated based on average shares outstanding during the period.
B Net Investment income per share reflects a large, non-recurring dividend which amounted to $.14 per share. Excluding this non-recurring dividends, the ratio of net investment income (loss) to average net assets would have been 1.64%.
C Total distributions of $.21 per share is comprised of distributions from net investment income of $.173 and distributions from net realized gain of $.034 per share.
D Amount represents less than $.005 per share.
E Total returns for periods of less than one year are not annualized.
F Total returns would have been lower if certain expenses had not been reduced during the applicable periods shown.
G Total returns do not include the effect of the sales charges.
H Fees and expenses of any underlying Fidelity Central Funds are not included in the Fund's expense ratio. The Fund indirectly bears its proportionate share of the expenses of any underlying Fidelity Central Funds.
I Expense ratios reflect operating expenses of the class. Expenses before reductions do not reflect amounts reimbursed by the investment adviser or reductions from brokerage service arrangements or reductions from other expense offset arrangements and do not represent the amount paid by the class during periods when reimbursements or reductions occur. Expenses net of fee waivers reflect expenses after reimbursement by the investment adviser but prior to reductions from brokerage service arrangements or other expense offset arrangements. Expenses net of all reductions represent the net expenses paid by the class.
J Annualized
K Amount does not include the portfolio activity of any underlying Fidelity Central Funds.
See accompanying notes which are an integral part of the financial statements.
Financial Highlights — Fidelity International Value Fund Class B
| Six months ended (Unaudited) April 30, | Years ended October 31, | |||||
| 2016 | 2015 | 2014 | 2013 | 2012 | 2011 | |
| Selected Per–Share Data | ||||||
| Net asset value, beginning of period | $8.34 | $8.66 | $8.98 | $7.39 | $7.00 | $8.20 |
| Income from Investment Operations | ||||||
| Net investment income (loss)A | .07 | .07 | .24B | .11 | .14 | .17 |
| Net realized and unrealized gain (loss) | (.45) | (.21) | (.45) | 1.65 | .41 | (1.20) |
| Total from investment operations | (.38) | (.14) | (.21) | 1.76 | .55 | (1.03) |
| Distributions from net investment income | –C | (.18) | (.09) | (.13) | (.16) | (.13) |
| Distributions from net realized gain | – | – | (.01) | (.04) | – | (.03) |
| Total distributions | –C | (.18) | (.11)D | (.17) | (.16) | (.17)E |
| Redemption fees added to paid in capitalA,C | – | – | – | – | – | – |
| Net asset value, end of period | $7.96 | $8.34 | $8.66 | $8.98 | $7.39 | $7.00 |
| Total ReturnF,G,H | (4.51)% | (1.64)% | (2.39)% | 24.30% | 8.07% | (12.88)% |
| Ratios to Average Net AssetsI,J | ||||||
| Expenses before reductions | 2.21%K | 2.15% | 2.08% | 2.14% | 2.19% | 2.11% |
| Expenses net of fee waivers, if any | 2.20%K | 2.15% | 2.08% | 2.14% | 2.19% | 2.11% |
| Expenses net of all reductions | 2.20%K | 2.14% | 2.08% | 2.11% | 2.16% | 2.09% |
| Net investment income (loss) | 1.66%K | .81% | 2.68%B | 1.32% | 2.09% | 2.04% |
| Supplemental Data | ||||||
| Net assets, end of period (000 omitted) | $186 | $302 | $414 | $678 | $691 | $901 |
| Portfolio turnover rateL | 26%K | 44% | 69% | 79% | 74% | 83% |
A Calculated based on average shares outstanding during the period.
B Net Investment income per share reflects a large, non-recurring dividend which amounted to $.14 per share. Excluding this non-recurring dividend, the ratio of net investment income (loss) to average net assets would have been 1.15%.
C Amount represents less than $.005 per share.
D Total distributions of $.11 per share is comprised of distributions from net investment income of $.093 and distributions from net realized gain of $.014 per share.
E Total distributions of $.17 per share is comprised of distributions from net investment income of $.131 and distributions from net realized gain of $.034 per share.
F Total returns for periods of less than one year are not annualized.
G Total returns would have been lower if certain expenses had not been reduced during the applicable periods shown.
H Total returns do not include the effect of the contingent deferred sales charge.
I Fees and expenses of any underlying Fidelity Central Funds are not included in the Fund's expense ratio. The Fund indirectly bears its proportionate share of the expenses of any underlying Fidelity Central Funds.
J Expense ratios reflect operating expenses of the class. Expenses before reductions do not reflect amounts reimbursed by the investment adviser or reductions from brokerage service arrangements or reductions from other expense offset arrangements and do not represent the amount paid by the class during periods when reimbursements or reductions occur. Expenses net of fee waivers reflect expenses after reimbursement by the investment adviser but prior to reductions from brokerage service arrangements or other expense offset arrangements. Expenses net of all reductions represent the net expenses paid by the class.
K Annualized
L Amount does not include the portfolio activity of any underlying Fidelity Central Funds.
See accompanying notes which are an integral part of the financial statements.
Financial Highlights — Fidelity International Value Fund Class C
| Six months ended (Unaudited) April 30, | Years ended October 31, | |||||
| 2016 | 2015 | 2014 | 2013 | 2012 | 2011 | |
| Selected Per–Share Data | ||||||
| Net asset value, beginning of period | $8.23 | $8.59 | $8.93 | $7.38 | $7.00 | $8.20 |
| Income from Investment Operations | ||||||
| Net investment income (loss)A | .06 | .07 | .24B | .11 | .14 | .16 |
| Net realized and unrealized gain (loss) | (.42) | (.20) | (.45) | 1.63 | .41 | (1.19) |
| Total from investment operations | (.36) | (.13) | (.21) | 1.74 | .55 | (1.03) |
| Distributions from net investment income | (.02) | (.23) | (.11) | (.15) | (.17) | (.14) |
| Distributions from net realized gain | – | – | (.01) | (.04) | – | (.03) |
| Total distributions | (.02) | (.23) | (.13)C | (.19) | (.17) | (.17) |
| Redemption fees added to paid in capitalA,D | – | – | – | – | – | – |
| Net asset value, end of period | $7.85 | $8.23 | $8.59 | $8.93 | $7.38 | $7.00 |
| Total ReturnE,F,G | (4.40)% | (1.58)% | (2.43)% | 24.17% | 8.12% | (12.84)% |
| Ratios to Average Net AssetsH,I | ||||||
| Expenses before reductions | 2.21%J | 2.15% | 2.07% | 2.14% | 2.19% | 2.12% |
| Expenses net of fee waivers, if any | 2.20%J | 2.14% | 2.07% | 2.14% | 2.19% | 2.11% |
| Expenses net of all reductions | 2.20%J | 2.14% | 2.07% | 2.11% | 2.16% | 2.09% |
| Net investment income (loss) | 1.67%J | .81% | 2.69%B | 1.33% | 2.09% | 2.04% |
| Supplemental Data | ||||||
| Net assets, end of period (000 omitted) | $4,413 | $4,502 | $3,647 | $3,231 | $2,249 | $2,108 |
| Portfolio turnover rateK | 26%J | 44% | 69% | 79% | 74% | 83% |
A Calculated based on average shares outstanding during the period.
B Net Investment income per share reflects a large, non-recurring dividend which amounted to $.14 per share. Excluding this non-recurring dividend, the ratio of net investment income (loss) to average net assets would have been 1.15%.
C Total distributions of $.13 per share is comprised of distributions from net investment income of $.111 and distributions from net realized gain of $.014 per share.
D Amount represents less than $.005 per share.
E Total returns for periods of less than one year are not annualized.
F Total returns would have been lower if certain expenses had not been reduced during the applicable periods shown.
G Total returns do not include the effect of the contingent deferred sales charge.
H Fees and expenses of any underlying Fidelity Central Funds are not included in the Fund's expense ratio. The Fund indirectly bears its proportionate share of the expenses of any underlying Fidelity Central Funds.
I Expense ratios reflect operating expenses of the class. Expenses before reductions do not reflect amounts reimbursed by the investment adviser or reductions from brokerage service arrangements or reductions from other expense offset arrangements and do not represent the amount paid by the class during periods when reimbursements or reductions occur. Expenses net of fee waivers reflect expenses after reimbursement by the investment adviser but prior to reductions from brokerage service arrangements or other expense offset arrangements. Expenses net of all reductions represent the net expenses paid by the class.
J Annualized
K Amount does not include the portfolio activity of any underlying Fidelity Central Funds.
See accompanying notes which are an integral part of the financial statements.
Financial Highlights — Fidelity International Value Fund
| Six months ended (Unaudited) April 30, | Years ended October 31, | |||||
| 2016 | 2015 | 2014 | 2013 | 2012 | 2011 | |
| Selected Per–Share Data | ||||||
| Net asset value, beginning of period | $8.29 | $8.64 | $8.97 | $7.40 | $7.03 | $8.23 |
| Income from Investment Operations | ||||||
| Net investment income (loss)A | .11 | .16 | .34B | .19 | .22 | .25 |
| Net realized and unrealized gain (loss) | (.43) | (.19) | (.46) | 1.65 | .40 | (1.20) |
| Total from investment operations | (.32) | (.03) | (.12) | 1.84 | .62 | (.95) |
| Distributions from net investment income | (.12) | (.32) | (.20) | (.22) | (.25) | (.22) |
| Distributions from net realized gain | – | – | (.01) | (.04) | – | (.03) |
| Total distributions | (.12) | (.32) | (.21) | (.27)C | (.25) | (.25) |
| Redemption fees added to paid in capitalA,D | – | – | – | – | – | – |
| Net asset value, end of period | $7.85 | $8.29 | $8.64 | $8.97 | $7.40 | $7.03 |
| Total ReturnE,F | (3.96)% | (.41)% | (1.34)% | 25.57% | 9.19% | (11.91)% |
| Ratios to Average Net AssetsG,H | ||||||
| Expenses before reductions | 1.07%I | 1.02% | .96% | 1.05% | 1.13% | 1.04% |
| Expenses net of fee waivers, if any | 1.07%I | 1.02% | .96% | 1.05% | 1.13% | 1.03% |
| Expenses net of all reductions | 1.07%I | 1.01% | .95% | 1.02% | 1.10% | 1.01% |
| Net investment income (loss) | 2.79%I | 1.93% | 3.80%B | 2.41% | 3.16% | 3.11% |
| Supplemental Data | ||||||
| Net assets, end of period (000 omitted) | $307,974 | $267,567 | $192,789 | $181,568 | $128,983 | $150,967 |
| Portfolio turnover rateJ | 26%I | 44% | 69% | 79% | 74% | 83% |
A Calculated based on average shares outstanding during the period.
B Net Investment income per share reflects a large, non-recurring dividend which amounted to $.14 per share. Excluding this non-recurring dividend, the ratio of net investment income (loss) to average net assets would have been 2.27%.
C Total distributions of $.27 per share is comprised of distributions from net investment income of $.223 and distributions from net realized gain of $.042 per share.
D Amount represents less than $.005 per share.
E Total returns for periods of less than one year are not annualized.
F Total returns would have been lower if certain expenses had not been reduced during the applicable periods shown.
G Fees and expenses of any underlying Fidelity Central Funds are not included in the Fund's expense ratio. The Fund indirectly bears its proportionate share of the expenses of any underlying Fidelity Central Funds.
H Expense ratios reflect operating expenses of the class. Expenses before reductions do not reflect amounts reimbursed by the investment adviser or reductions from brokerage service arrangements or reductions from other expense offset arrangements and do not represent the amount paid by the class during periods when reimbursements or reductions occur. Expenses net of fee waivers reflect expenses after reimbursement by the investment adviser but prior to reductions from brokerage service arrangements or other expense offset arrangements. Expenses net of all reductions represent the net expenses paid by the class.
I Annualized
J Amount does not include the portfolio activity of any underlying Fidelity Central Funds.
See accompanying notes which are an integral part of the financial statements.
Financial Highlights — Fidelity International Value Fund Class I
| Six months ended (Unaudited) April 30, | Years ended October 31, | |||||
| 2016 | 2015 | 2014 | 2013 | 2012 | 2011 | |
| Selected Per–Share Data | ||||||
| Net asset value, beginning of period | $8.29 | $8.65 | $8.98 | $7.41 | $7.04 | $8.24 |
| Income from Investment Operations | ||||||
| Net investment income (loss)A | .10 | .15 | .33B | .19 | .22 | .25 |
| Net realized and unrealized gain (loss) | (.43) | (.19) | (.45) | 1.65 | .40 | (1.19) |
| Total from investment operations | (.33) | (.04) | (.12) | 1.84 | .62 | (.94) |
| Distributions from net investment income | (.10) | (.32) | (.19) | (.23) | (.25) | (.22) |
| Distributions from net realized gain | – | – | (.01) | (.04) | – | (.03) |
| Total distributions | (.10) | (.32) | (.21)C | (.27) | (.25) | (.26)D |
| Redemption fees added to paid in capitalA,E | – | – | – | – | – | – |
| Net asset value, end of period | $7.86 | $8.29 | $8.65 | $8.98 | $7.41 | $7.04 |
| Total ReturnF,G | (4.07)% | (.53)% | (1.41)% | 25.64% | 9.22% | (11.83)% |
| Ratios to Average Net AssetsH,I | ||||||
| Expenses before reductions | 1.20%J | 1.14% | 1.05% | 1.07% | 1.10% | .98% |
| Expenses net of fee waivers, if any | 1.20%J | 1.14% | 1.05% | 1.07% | 1.10% | .98% |
| Expenses net of all reductions | 1.20%J | 1.13% | 1.04% | 1.04% | 1.07% | .96% |
| Net investment income (loss) | 2.67%J | 1.81% | 3.71%B | 2.39% | 3.18% | 3.17% |
| Supplemental Data | ||||||
| Net assets, end of period (000 omitted) | $1,905 | $1,969 | $1,310 | $239 | $372 | $473 |
| Portfolio turnover rateK | 26%J | 44% | 69% | 79% | 74% | 83% |
A Calculated based on average shares outstanding during the period.
B Net Investment income per share reflects a large, non-recurring dividend which amounted to $.14 per share. Excluding this non-recurring dividend, the ratio of net investment income (loss) to average net assets would have been 2.18%.
C Total distributions of $.21 per share is comprised of distributions from net investment income of $.191 and distributions from net realized gain of $.014 per share.
D Total distributions of $.26 per share is comprised of distributions from net investment income of $.221 and distributions from net realized gain of $.034 per share.
E Amount represents less than $.005 per share.
F Total returns for periods of less than one year are not annualized.
G Total returns would have been lower if certain expenses had not been reduced during the applicable periods shown.
H Fees and expenses of any underlying Fidelity Central Funds are not included in the Fund's expense ratio. The Fund indirectly bears its proportionate share of the expenses of any underlying Fidelity Central Funds.
I Expense ratios reflect operating expenses of the class. Expenses before reductions do not reflect amounts reimbursed by the investment adviser or reductions from brokerage service arrangements or reductions from other expense offset arrangements and do not represent the amount paid by the class during periods when reimbursements or reductions occur. Expenses net of fee waivers reflect expenses after reimbursement by the investment adviser but prior to reductions from brokerage service arrangements or other expense offset arrangements. Expenses net of all reductions represent the net expenses paid by the class.
J Annualized
K Amount does not include the portfolio activity of any underlying Fidelity Central Funds.
See accompanying notes which are an integral part of the financial statements.
Notes to Financial Statements (Unaudited)
For the period ended April 30, 2016
1. Organization.
Fidelity International Value Fund (the Fund) is a fund of Fidelity Investment Trust (the Trust) and is authorized to issue an unlimited number of shares. The Trust is registered under the Investment Company Act of 1940, as amended (the 1940 Act), as an open-end management investment company organized as a Massachusetts business trust. The Fund offers Class A, Class T, Class C, International Value and Class I shares, each of which, along with Class B shares, has equal rights as to assets and voting privileges. Class B shares are closed to new accounts and additional purchases, except for exchanges and reinvestments. Each class has exclusive voting rights with respect to matters that affect that class. Class B shares will automatically convert to Class A shares after a maximum holding period of seven four years from the initial date of purchase.
During the period, the Board of Trustees approved the conversion of all existing Class B shares into Class A shares, effective on or about July 1, 2016, regardless of the length of times shares have been held.
2. Investments in Fidelity Central Funds.
The Fund invests in Fidelity Central Funds, which are open-end investment companies generally available only to other investment companies and accounts managed by the investment adviser and its affiliates. The Fund's Schedule of Investments lists each of the Fidelity Central Funds held as of period end, if any, as an investment of the Fund, but does not include the underlying holdings of each Fidelity Central Fund. As an Investing Fund, the Fund indirectly bears its proportionate share of the expenses of the underlying Fidelity Central Funds.
The Money Market Central Funds seek preservation of capital and current income and are managed by Fidelity Investments Money Management, Inc. (FIMM), an affiliate of the investment adviser. Annualized expenses of the Money Market Central Funds as of their most recent shareholder report date are less than .005%.
A complete unaudited list of holdings for each Fidelity Central Fund is available upon request or at the Securities and Exchange Commission (the SEC) website at www.sec.gov. In addition, the financial statements of the Fidelity Central Funds are available on the SEC website or upon request.
3. Significant Accounting Policies.
The financial statements have been prepared in conformity with accounting principles generally accepted in the United States of America (GAAP), which require management to make certain estimates and assumptions at the date of the financial statements. Actual results could differ from those estimates. Subsequent events, if any, through the date that the financial statements were issued have been evaluated in the preparation of the financial statements. The following summarizes the significant accounting policies of the Fund:
Investment Valuation. Investments are valued as of 4:00 p.m. Eastern time on the last calendar day of the period. The Board of Trustees (the Board) has delegated the day to day responsibility for the valuation of the Fund's investments to the Fidelity Management & Research Company (FMR) Fair Value Committee (the Committee). In accordance with valuation policies and procedures approved by the Board, the Fund attempts to obtain prices from one or more third party pricing vendors or brokers to value its investments. When current market prices, quotations or currency exchange rates are not readily available or reliable, investments will be fair valued in good faith by the Committee, in accordance with procedures adopted by the Board. Factors used in determining fair value vary by investment type and may include market or investment specific events. The frequency with which these procedures are used cannot be predicted and they may be utilized to a significant extent. The Committee oversees the Fund's valuation policies and procedures and reports to the Board on the Committee's activities and fair value determinations. The Board monitors the appropriateness of the procedures used in valuing the Fund's investments and ratifies the fair value determinations of the Committee.
The Fund categorizes the inputs to valuation techniques used to value its investments into a disclosure hierarchy consisting of three levels as shown below:
- Level 1 – quoted prices in active markets for identical investments
- Level 2 – other significant observable inputs (including quoted prices for similar investments, interest rates, prepayment speeds, etc.)
- Level 3 – unobservable inputs (including the Fund's own assumptions based on the best information available)
Valuation techniques used to value the Fund's investments by major category are as follows:
Equity securities, including restricted securities, for which market quotations are readily available, are valued at the last reported sale price or official closing price as reported by a third party pricing vendor on the primary market or exchange on which they are traded and are categorized as Level 1 in the hierarchy. In the event there were no sales during the day or closing prices are not available, securities are valued at the last quoted bid price or may be valued using the last available price and are generally categorized as Level 2 in the hierarchy. For foreign equity securities, when market or security specific events arise, comparisons to the valuation of American Depositary Receipts (ADRs), futures contracts, Exchange-Traded Funds (ETFs) and certain indexes as well as quoted prices for similar securities may be used and would be categorized as Level 2 in the hierarchy. Utilizing these techniques may result in transfers between Level 1 and Level 2. For equity securities, including restricted securities, where observable inputs are limited, assumptions about market activity and risk are used and these securities may be categorized as Level 3 in the hierarchy.
Investments in open-end mutual funds, including the Fidelity Central Funds, are valued at their closing net asset value (NAV) each business day and are categorized as Level 1 in the hierarchy.
Changes in valuation techniques may result in transfers in or out of an assigned level within the disclosure hierarchy. The aggregate value of investments by input level as of April 30, 2016, including information on transfers between Levels 1 and 2, is included at the end of the Fund's Schedule of Investments.
Foreign Currency. The Fund may use foreign currency contracts to facilitate transactions in foreign-denominated securities. Gains and losses from these transactions may arise from changes in the value of the foreign currency or if the counterparties do not perform under the contracts' terms.
Foreign-denominated assets, including investment securities, and liabilities are translated into U.S. dollars at the exchange rates at period end. Purchases and sales of investment securities, income and dividends received and expenses denominated in foreign currencies are translated into U.S. dollars at the exchange rate in effect on the transaction date.
The effects of exchange rate fluctuations on investments are included with the net realized and unrealized gain (loss) on investment securities. Other foreign currency transactions resulting in realized and unrealized gain (loss) are disclosed separately.
Investment Transactions and Income. For financial reporting purposes, the Fund's investment holdings and NAV include trades executed through the end of the last business day of the period. The NAV per share for processing shareholder transactions is calculated as of the close of business of the New York Stock Exchange (NYSE), normally 4:00 p.m. Eastern time and includes trades executed through the end of the prior business day. Gains and losses on securities sold are determined on the basis of identified cost. Dividend income is recorded on the ex-dividend date, except for certain dividends from foreign securities where the ex-dividend date may have passed, which are recorded as soon as the Fund is informed of the ex-dividend date. Non-cash dividends included in dividend income, if any, are recorded at the fair market value of the securities received. Income and capital gain distributions from Fidelity Central Funds, if any, are recorded on the ex-dividend date. Distributions received on securities that represent a return of capital or capital gain are recorded as a reduction of cost of investments and/or as a realized gain. Subsequent to ex-dividend date the Fund determines the components of these distributions, based upon receipt of tax filings or other correspondence relating to the underlying investment. Investment income is recorded net of foreign taxes withheld where recovery of such taxes is uncertain.
Class Allocations and Expenses. Investment income, realized and unrealized capital gains and losses, common expenses of the Fund, and certain fund-level expense reductions, if any, are allocated daily on a pro-rata basis to each class based on the relative net assets of each class to the total net assets of the Fund. Each class differs with respect to transfer agent and distribution and service plan fees incurred. Certain expense reductions may also differ by class. For the reporting period, the allocated portion of income and expenses to each class as a percent of its average net assets may vary due to the timing of recording these transactions in relation to fluctuating net assets of the classes. Expenses directly attributable to a fund are charged to that fund. Expenses attributable to more than one fund are allocated among the respective funds on the basis of relative net assets or other appropriate methods. Expense estimates are accrued in the period to which they relate and adjustments are made when actual amounts are known.
Income Tax Information and Distributions to Shareholders. Each year, the Fund intends to qualify as a regulated investment company under Subchapter M of the Internal Revenue Code, including distributing substantially all of its taxable income and realized gains. As a result, no provision for U.S. Federal income taxes is required. The Fund files a U.S. federal tax return, in addition to state and local tax returns as required. The Fund's federal income tax returns are subject to examination by the Internal Revenue Service (IRS) for a period of three fiscal years after they are filed. State and local tax returns may be subject to examination for an additional fiscal year depending on the jurisdiction. Foreign taxes are provided for based on the Fund's understanding of the tax rules and rates that exist in the foreign markets in which it invests.
Distributions are declared and recorded on the ex-dividend date. Income dividends and capital gain distributions are declared separately for each class. Income and capital gain distributions are determined in accordance with income tax regulations, which may differ from GAAP.
Capital accounts within the financial statements are adjusted for permanent book-tax differences. These adjustments have no impact on net assets or the results of operations. Capital accounts are not adjusted for temporary book-tax differences which will reverse in a subsequent period.
Book-tax differences are primarily due to foreign currency transactions, passive foreign investment companies (PFIC), partnerships, capital loss carryforwards, and losses deferred due to wash sales.
The federal tax cost of investment securities and unrealized appreciation (depreciation) as of period end were as follows:
| Gross unrealized appreciation | $20,798,749 |
| Gross unrealized depreciation | (36,225,329) |
| Net unrealized appreciation (depreciation) on securities | $(15,426,580) |
| Tax cost | $356,155,246 |
Capital loss carryforwards are only available to offset future capital gains of the Fund to the extent provided by regulations and may be limited. Under the Regulated Investment Company Modernization Act of 2010 (the Act), the Fund is permitted to carry forward capital losses incurred in taxable years beginning after December 22, 2010 for an unlimited period and such capital losses are required to be used prior to any losses that expire. The capital loss carryforward information presented below, including any applicable limitation, is estimated as of prior fiscal period end and is subject to adjustment.
| Fiscal year of expiration | |
| 2016 | $(2,663,413) |
| 2017 | (65,376,972) |
| 2018 | (3,571,319) |
| 2019 | (31,368,797) |
| Total with expiration | $(102,980,501) |
| No expiration | |
| Short-term | $(3,001,927) |
| Total capital loss carryforward | $(105,982,428) |
Short-Term Trading (Redemption) Fees. Shares held by investors in the Fund less than 30 days may have been subject to a redemption fee equal to 1.00% of the NAV of shares redeemed. All redemption fees, which reduce the proceeds of the shareholder redemption, are retained by the Fund and accounted for as an addition to paid in capital.
Delayed Delivery Transactions and When-Issued Securities. During the period, the Fund transacted in securities on a delayed delivery or when-issued basis. Payment and delivery may take place after the customary settlement period for that security. The price of the underlying securities and the date when the securities will be delivered and paid for are fixed at the time the transaction is negotiated. The securities purchased on a delayed delivery or when-issued basis are identified as such in the Fund's Schedule of Investments. With respect to purchase commitments, the Fund identifies securities as segregated in its records with a value at least equal to the amount of the commitment. Losses may arise due to changes in the value of the underlying securities or if the counterparty does not perform under the contract's terms, or if the issuer does not issue the securities due to political, economic, or other factors.
4. Purchases and Sales of Investments.
Purchases and sales of securities, other than short-term securities, aggregated $96,477,809 and $39,058,065, respectively.
5. Fees and Other Transactions with Affiliates.
Management Fee. Fidelity Management & Research Company (the investment adviser) and its affiliates provide the Fund with investment management related services for which the Fund pays a monthly management fee. The management fee is the sum of an individual fund fee rate that is based on an annual rate of .45% of the Fund's average net assets and an annualized group fee rate that averaged .25% during the period. The group fee rate is based upon the average net assets of all the mutual funds advised by the investment adviser, including any mutual funds previously advised by the investment adviser that are currently advised by Fidelity SelectCo, LLC, an affiliate of the investment adviser. The group fee rate decreases as assets under management increase and increases as assets under management decrease. In addition, the management fee is subject to a performance adjustment (up to a maximum of +/- .20% of the Fund's average net assets over a 36 month performance period). The upward or downward adjustment to the management fee is based on the relative investment performance of International Value as compared to its benchmark index, the MSCI EAFE Value Index, over the same 36 month performance period. For the reporting period, the total annualized management fee rate, including the performance adjustment, was .75% of the Fund's average net assets. The performance adjustment included in the management fee rate may be higher or lower than the maximum performance adjustment rate due to the difference between the average net assets for the reporting and performance periods.
Distribution and Service Plan Fees. In accordance with Rule 12b-1 of the 1940 Act, the Fund has adopted separate Distribution and Service Plans for each class of shares. Certain classes pay Fidelity Distributors Corporation (FDC), an affiliate of the investment adviser, separate Distribution and Service Fees, each of which is based on an annual percentage of each class' average net assets. In addition, FDC may pay financial intermediaries for selling shares of the Fund and providing shareholder support services. For the period, the Distribution and Service Fee rates, total fees and amounts retained by FDC were as follows:
| Distribution Fee | Service Fee | Total Fees | Retained by FDC | |
| Class A | -% | .25% | $10,630 | $247 |
| Class T | .25% | .25% | 9,834 | – |
| Class B | .75% | .25% | 1,216 | 912 |
| Class C | .75% | .25% | 21,637 | 4,385 |
| $43,317 | $5,544 |
Sales Load. FDC may receive a front-end sales charge of up to 5.75% for selling Class A shares and 3.50% for selling Class T shares, some of which is paid to financial intermediaries for selling shares of the Fund. Depending on the holding period, FDC may receive contingent deferred sales charges levied on Class A, Class T, Class B, and Class C redemptions. The deferred sales charges 5.00% to 1.00% for Class B shares, 1.00% for Class C shares, 1.00% for certain purchases of Class A shares and .25% for certain purchases of Class T shares.
For the period, sales charge amounts retained by FDC were as follows:
| Retained by FDC | |
| Class A | $1,140 |
| Class T | 718 |
| Class B(a) | 10 |
| Class C(a) | 800 |
| $2,668 |
(a) When Class B and Class C shares are initially sold, FDC pays commissions from its own resources to financial intermediaries through which the sales are made.
Transfer Agent Fees. Fidelity Investments Institutional Operations Company, Inc., (FIIOC), an affiliate of the investment adviser, is the transfer, dividend disbursing and shareholder servicing agent for each class of the Fund. FIIOC receives account fees and asset-based fees that vary according to the account size and type of account of the shareholders of the respective classes of the Fund. FIIOC pays for typesetting, printing and mailing of shareholder reports, except proxy statements.
For the period, transfer agent fees for each class were as follows:
| Amount | % of Class-Level Average Net Assets(a) | |
| Class A | $11,787 | .28 |
| Class T | 6,443 | .33 |
| Class B | 378 | .31 |
| Class C | 6,617 | .31 |
| International Value | 241,632 | .17 |
| Class I | 2,880 | .30 |
| $269,737 |
(a) Annualized
Accounting and Security Lending Fees. Fidelity Service Company, Inc. (FSC), an affiliate of the investment adviser, maintains the Fund's accounting records. The accounting fee is based on the level of average net assets for each month. Under a separate contract, FSC administers the security lending program. The security lending fee is based on the number and duration of lending transactions.
Brokerage Commissions. The Fund placed a portion of its portfolio transactions with brokerage firms which are affiliates of the investment adviser. Brokerage commissions are included in net realized gain (loss) and change in net unrealized appreciation (depreciation) in the Statement of Operations. The commissions paid to these affiliated firms were $136 for the period.
Interfund Trades. The Funds may purchase from or sell securities to other Fidelity Funds under procedures adopted by the Board. The procedures have been designed to ensure these interfund trades are executed in accordance with Rule 17a-7 of the 1940 Act. Interfund trades are included within the respective purchases and sales amounts shown in the Purchases and Sales of Investments note.
6. Committed Line of Credit.
The Fund participates with other funds managed by the investment adviser or an affiliate in a $4.25 billion credit facility (the "line of credit") to be utilized for temporary or emergency purposes to fund shareholder redemptions or for other short-term liquidity purposes. The Fund has agreed to pay commitment fees on its pro-rata portion of the line of credit, which amounted to $266 and is reflected in Miscellaneous expenses on the Statement of Operations. During the period, the Fund did not borrow on this line of credit.
7. Security Lending.
The Fund lends portfolio securities through a lending agent from time to time in order to earn additional income. For equity securities, a lending agent is used and may loan securities to certain qualified borrowers, including Fidelity Capital Markets (FCM), a broker-dealer affiliated with the Fund. On the settlement date of the loan, the Fund receives collateral (in the form of U.S. Treasury obligations, letters of credit and/or cash) against the loaned securities and maintains collateral in an amount not less than 100% of the market value of the loaned securities during the period of the loan. The market value of the loaned securities is determined at the close of business of the Fund and any additional required collateral is delivered to the Fund on the next business day. The Fund or borrower may terminate the loan at any time, and if the borrower defaults on its obligation to return the securities loaned because of insolvency or other reasons, the Fund may apply collateral received from the borrower against the obligation. The Fund may experience delays and costs in recovering the securities loaned. Any cash collateral received is invested in the Fidelity Securities Lending Cash Central Fund. The value of loaned securities and cash collateral at period end are disclosed on the Fund's Statement of Assets and Liabilities. At period end, there were no security loans outstanding with FCM. Security lending income represents the income earned on investing cash collateral, less rebates paid to borrowers and any lending agent fees associated with the loan, plus any premium payments received for lending certain types of securities. Security lending income is presented in the Statement of Operations as a component of income from Fidelity Central Funds. Total security lending income during the period amounted to $137,227, including $139 from securities loaned to FCM.
8. Expense Reductions.
The investment adviser voluntarily agreed to reimburse each class to the extent annual operating expenses exceeded certain levels of average net assets as noted in the table below. Some expenses, for example interest expense, including commitment fees, are excluded from this reimbursement.
| Expense Limitations | Reimbursement | |
| Class T | 1.70% | $607 |
| Class B | 2.20% | 10 |
| Class C | 2.20% | 147 |
| Class I | 1.20% | 31 |
| $795 |
Commissions paid to certain brokers with whom the investment adviser, or its affiliates, places trades on behalf of the Fund include an amount in addition to trade execution, which may be rebated back to the Fund to offset certain expenses. This amount totaled $3,400 for the period.
In addition, during the period the investments adviser reimbursed and/or waived a portion of fund-level operating expenses in the amount of $1,064.
9. Distributions to Shareholders.
Distributions to shareholders of each class were as follows:
| Six months ended April 30, 2016 | Year ended October 31, 2015 | |
| From net investment income | ||
| Class A | $95,726 | $204,314 |
| Class T | 30,318 | 109,443 |
| Class B | 141 | 8,373 |
| Class C | 10,293 | 99,311 |
| International Value | 3,924,604 | 7,079,700 |
| Class I | 23,301 | 52,790 |
| Total | $4,084,383 | $7,553,931 |
10. Share Transactions.
Share transactions for each class were as follows and may contain automatic conversions between classes or exchanges between affiliated funds:
| Shares | Shares | Dollars | Dollars | |
| Six months ended April 30, 2016 | Year ended October 31, 2015 | Six months ended April 30, 2016 | Year ended October 31, 2015 | |
| Class A | ||||
| Shares sold | 145,262 | 527,583 | $1,133,082 | $4,502,640 |
| Reinvestment of distributions | 11,425 | 23,604 | 93,224 | 197,333 |
| Shares redeemed | (179,619) | (198,812) | (1,367,494) | (1,665,353) |
| Net increase (decrease) | (22,932) | 352,375 | $(141,188) | $3,034,620 |
| Class T | ||||
| Shares sold | 57,909 | 117,820 | $455,086 | $1,007,336 |
| Reinvestment of distributions | 3,669 | 12,981 | 29,980 | 108,520 |
| Shares redeemed | (45,795) | (54,747) | (348,759) | (463,119) |
| Net increase (decrease) | 15,783 | 76,054 | $136,307 | $652,737 |
| Class B | ||||
| Shares sold | 2 | 2,257 | $14 | $18,258 |
| Reinvestment of distributions | 15 | 891 | 124 | 7,565 |
| Shares redeemed | (12,943) | (14,741) | (101,798) | (124,607) |
| Net increase (decrease) | (12,926) | (11,593) | $(101,660) | $(98,784) |
| Class C | ||||
| Shares sold | 71,013 | 208,019 | $540,561 | $1,779,247 |
| Reinvestment of distributions | 1,181 | 10,999 | 9,659 | 92,173 |
| Shares redeemed | (56,610) | (96,570) | (438,654) | (802,299) |
| Net increase (decrease) | 15,584 | 122,448 | $111,566 | $1,069,121 |
| International Value | ||||
| Shares sold | 9,108,775 | 14,508,730 | $70,505,949 | $121,044,962 |
| Reinvestment of distributions | 470,177 | 823,202 | 3,831,944 | 6,873,736 |
| Shares redeemed | (2,629,480) | (5,350,163) | (19,886,444) | (45,687,658) |
| Net increase (decrease) | 6,949,472 | 9,981,769 | $54,451,449 | $82,231,040 |
| Class I | ||||
| Shares sold | 30,535 | 413,299 | $237,842 | $3,523,105 |
| Reinvestment of distributions | 2,528 | 5,275 | 20,650 | 44,098 |
| Shares redeemed | (28,411) | (332,392) | (224,656) | (2,908,565) |
| Net increase (decrease) | 4,652 | 86,182 | $33,836 | $658,638 |
11. Other.
The Fund's organizational documents provide former and current trustees and officers with a limited indemnification against liabilities arising in connection with the performance of their duties to the Fund. In the normal course of business, the Fund may also enter into contracts that provide general indemnifications. The Fund's maximum exposure under these arrangements is unknown as this would be dependent on future claims that may be made against the Fund. The risk of material loss from such claims is considered remote.
At the end of the period, Strategic Advisers International II Fund, was the owner of record of approximately 69% of the total outstanding shares of the Fund.
Shareholder Expense Example
As a shareholder of the Fund, you incur two types of costs: (1) transaction costs, including sales charges (loads) on purchase payments or redemption proceeds, redemption fees and (2) ongoing costs, including management fees, distribution and/or service (12b-1) fees and other Fund expenses. This Example is intended to help you understand your ongoing costs (in dollars) of investing in the Fund and to compare these costs with the ongoing costs of investing in other mutual funds.
The Example is based on an investment of $1,000 invested at the beginning of the period and held for the entire period (November 1, 2015 to April 30, 2016).
Actual Expenses
The first line of the accompanying table for each class of the Fund provides information about actual account values and actual expenses. You may use the information in this line, together with the amount you invested, to estimate the expenses that you paid over the period. Simply divide your account value by $1,000.00 (for example, an $8,600 account value divided by $1,000.00 = 8.6), then multiply the result by the number in the first line for a class of the Fund under the heading entitled "Expenses Paid During Period" to estimate the expenses you paid on your account during this period. A small balance maintenance fee of $12.00 that is charged once a year may apply for certain accounts with a value of less than $2,000. This fee is not included in the table below. If it was, the estimate of expenses you paid during the period would be higher, and your ending account value lower, by this amount. In addition, the Fund, as a shareholder in the underlying Fidelity Central Funds, will indirectly bear its pro-rata share of the fees and expenses incurred by the underlying Fidelity Central Funds. These fees and expenses are not included in the Fund's annualized expense ratio used to calculate the expense estimate in the table below.
Hypothetical Example for Comparison Purposes
The second line of the accompanying table for each class of the Fund provides information about hypothetical account values and hypothetical expenses based on a Class' actual expense ratio and an assumed rate of return of 5% per year before expenses, which is not the Class' actual return. The hypothetical account values and expenses may not be used to estimate the actual ending account balance or expenses you paid for the period. You may use this information to compare the ongoing costs of investing in the Fund and other funds. To do so, compare this 5% hypothetical example with the 5% hypothetical examples that appear in the shareholder reports of the other funds. A small balance maintenance fee of $12.00 that is charged once a year may apply for certain accounts with a value of less than $2,000. This fee is not included in the table below. If it was, the estimate of expenses you paid during the period would be higher, and your ending account value lower, by this amount. In addition, the Fund, as a shareholder in the underlying Fidelity Central Funds, will indirectly bear its pro-rata share of the fees and expenses incurred by the underlying Fidelity Central Funds. These fees and expenses are not included in the Fund's annualized expense ratio used to calculate the expense estimate in the table below.
Please note that the expenses shown in the table are meant to highlight your ongoing costs only and do not reflect any transaction costs. Therefore, the second line of the table is useful in comparing ongoing costs only, and will not help you determine the relative total costs of owning different funds. In addition, if these transactional costs were included, your costs would have been higher.
| Annualized Expense Ratio-A | Beginning Account Value November 1, 2015 | Ending Account Value April 30, 2016 | Expenses Paid During Period-B November 1, 2015 to April 30, 2016 | |
| Class A | 1.43% | |||
| Actual | $1,000.00 | $959.50 | $6.97 | |
| Hypothetical-C | $1,000.00 | $1,017.75 | $7.17 | |
| Class T | 1.70% | |||
| Actual | $1,000.00 | $958.60 | $8.28 | |
| Hypothetical-C | $1,000.00 | $1,016.41 | $8.52 | |
| Class B | 2.20% | |||
| Actual | $1,000.00 | $954.90 | $10.69 | |
| Hypothetical-C | $1,000.00 | $1,013.92 | $11.02 | |
| Class C | 2.20% | |||
| Actual | $1,000.00 | $956.00 | $10.70 | |
| Hypothetical-C | $1,000.00 | $1,013.92 | $11.02 | |
| International Value | 1.07% | |||
| Actual | $1,000.00 | $960.40 | $5.22 | |
| Hypothetical-C | $1,000.00 | $1,019.54 | $5.37 | |
| Class I | 1.20% | |||
| Actual | $1,000.00 | $959.30 | $5.85 | |
| Hypothetical-C | $1,000.00 | $1,018.90 | $6.02 |
A Annualized expense ratio reflects expenses net of applicable fee waivers.
B Expenses are equal to each Class' annualized expense ratio, multiplied by the average account value over the period, multiplied by 182/366 (to reflect the one-half year period).
C 5% return per year before expenses
![]()
AFIV-SANN-0616
1.827501.109
Fidelity Advisor® Europe Fund - Semi-Annual Report April 30, 2016 Class I is a class of Fidelity® Europe Fund |
|
Contents
To view a fund's proxy voting guidelines and proxy voting record for the 12-month period ended June 30, visit http://www.fidelity.com/proxyvotingresults or visit the Securities and Exchange Commission's (SEC) web site at http://www.sec.gov.
You may also call 1-877-208-0098 to request a free copy of the proxy voting guidelines.
Standard & Poor's, S&P and S&P 500 are registered service marks of The McGraw-Hill Companies, Inc. and have been licensed for use by Fidelity Distributors Corporation.
Other third-party marks appearing herein are the property of their respective owners.
All other marks appearing herein are registered or unregistered trademarks or service marks of FMR LLC or an affiliated company. © 2016 FMR LLC. All rights reserved.
This report and the financial statements contained herein are submitted for the general information of the shareholders of the Fund. This report is not authorized for distribution to prospective investors in the Fund unless preceded or accompanied by an effective prospectus.
A fund files its complete schedule of portfolio holdings with the SEC for the first and third quarters of each fiscal year on Form N-Q. Forms N-Q are available on the SEC’s web site at http://www.sec.gov. A fund's Forms N-Q may be reviewed and copied at the SEC’s Public Reference Room in Washington, DC. Information regarding the operation of the SEC's Public Reference Room may be obtained by calling 1-800-SEC-0330.
For a complete list of a fund's portfolio holdings, view the most recent holdings listing, semiannual report, or annual report on Fidelity's web site at http://www.fidelity.com, http://www.advisor.fidelity.com, or http://www.401k.com, as applicable.
NOT FDIC INSURED •MAY LOSE VALUE •NO BANK GUARANTEE
Neither the Fund nor Fidelity Distributors Corporation is a bank.
Investment Summary (Unaudited)
Geographic Diversification (% of fund's net assets)
| As of April 30, 2016 | ||
| United Kingdom | 25.5% | |
| Sweden | 15.9% | |
| Germany | 14.5% | |
| France | 9.1% | |
| Denmark | 6.2% | |
| Bailiwick of Jersey | 5.5% | |
| Isle of Man | 3.8% | |
| Spain | 3.2% | |
| Ireland | 3.0% | |
| Other* | 13.3% | |

* Includes Short-Term investments and Net Other Assets (Liabilities).
Percentages are based on country or territory of incorporation and are adjusted for the effect of futures contracts, if applicable.
| As of October 31, 2015 | ||
| United Kingdom | 30.9% | |
| Sweden | 16.5% | |
| France | 10.5% | |
| Germany | 9.4% | |
| Denmark | 6.6% | |
| Bailiwick of Jersey | 5.4% | |
| Isle of Man | 3.1% | |
| Spain | 2.8% | |
| Finland | 2.7% | |
| Other* | 12.1% | |

* Includes Short-Term investments and Net Other Assets (Liabilities).
Percentages are based on country or territory of incorporation and are adjusted for the effect of futures contracts, if applicable.
Asset Allocation as of April 30, 2016
| % of fund's net assets | % of fund's net assets 6 months ago | |
| Stocks | 98.3 | 99.7 |
| Short-Term Investments and Net Other Assets (Liabilities) | 1.7 | 0.3 |
Top Ten Stocks as of April 30, 2016
| % of fund's net assets | % of fund's net assets 6 months ago | |
| SAP AG (Germany, Software) | 3.5 | 0.0 |
| Getinge AB (B Shares) (Sweden, Health Care Equipment & Supplies) | 3.5 | 2.9 |
| Shire PLC (Bailiwick of Jersey, Pharmaceuticals) | 3.2 | 3.2 |
| William Hill PLC (United Kingdom, Hotels, Restaurants & Leisure) | 3.1 | 2.0 |
| Standard Chartered PLC (United Kingdom) (United Kingdom, Banks) | 3.0 | 2.9 |
| Bayer AG (Germany, Pharmaceuticals) | 2.8 | 2.4 |
| Prudential PLC (United Kingdom, Insurance) | 2.1 | 1.8 |
| LEG Immobilien AG (Germany, Real Estate Management & Development) | 2.0 | 1.5 |
| Optimal Payments PLC (Isle of Man, IT Services) | 2.0 | 1.5 |
| Svenska Cellulosa AB (SCA) (B Shares) (Sweden, Household Products) | 1.9 | 1.6 |
| 27.1 |
Market Sectors as of April 30, 2016
| % of fund's net assets | % of fund's net assets 6 months ago | |
| Financials | 24.6 | 31.6 |
| Industrials | 17.7 | 17.5 |
| Health Care | 17.3 | 19.8 |
| Consumer Discretionary | 16.7 | 16.8 |
| Information Technology | 13.4 | 5.4 |
| Consumer Staples | 3.8 | 3.0 |
| Materials | 1.9 | 4.3 |
| Energy | 1.6 | 0.0 |
| Utilities | 1.3 | 1.3 |
Percentages shown as 0.0% may reflect amounts less than 0.05%.
Investments April 30, 2016 (Unaudited)
Showing Percentage of Net Assets
| Common Stocks - 98.3% | |||
| Shares | Value | ||
| Austria - 1.2% | |||
| Andritz AG | 277,200 | $15,524,418 | |
| Bailiwick of Jersey - 5.5% | |||
| Shire PLC | 652,600 | 40,723,546 | |
| Wolseley PLC | 265,134 | 14,850,704 | |
| WPP PLC | 620,800 | 14,503,493 | |
| TOTAL BAILIWICK OF JERSEY | 70,077,743 | ||
| Bermuda - 2.2% | |||
| Vostok Emerging Finance Ltd. (depository receipt) (a)(b)(c) | 53,380,307 | 7,179,016 | |
| Vostok New Ventures Ltd. SDR (a) | 3,662,236 | 20,841,196 | |
| TOTAL BERMUDA | 28,020,212 | ||
| Denmark - 6.2% | |||
| Carlsberg A/S Series B | 241,500 | 23,519,470 | |
| DSV de Sammensluttede Vognmaend A/S | 236,000 | 9,930,612 | |
| Novozymes A/S Series B | 343,955 | 16,484,143 | |
| Scandinavian Tobacco Group A/S | 436,427 | 6,942,867 | |
| William Demant Holding A/S (a) | 210,000 | 21,582,535 | |
| TOTAL DENMARK | 78,459,627 | ||
| Finland - 2.2% | |||
| Amer Group PLC (A Shares) | 450,500 | 13,319,119 | |
| Valmet Corp. | 1,119,700 | 14,039,132 | |
| TOTAL FINLAND | 27,358,251 | ||
| France - 9.1% | |||
| Bollore Group | 3,447,549 | 13,658,751 | |
| Capgemini SA | 198,200 | 18,503,145 | |
| Eurazeo SA | 207,255 | 14,595,016 | |
| Havas SA | 2,857,100 | 23,908,285 | |
| Publicis Groupe SA | 230,946 | 17,090,748 | |
| Wendel SA | 146,000 | 16,868,190 | |
| Zodiac Aerospace | 454,600 | 10,658,051 | |
| TOTAL FRANCE | 115,282,186 | ||
| Germany - 14.5% | |||
| adidas AG | 140,700 | 18,140,821 | |
| Bayer AG | 308,000 | 35,532,047 | |
| Brenntag AG | 338,000 | 19,819,648 | |
| CompuGroup Medical AG | 259,600 | 10,195,846 | |
| Fresenius SE & Co. KGaA | 206,797 | 15,041,085 | |
| GEA Group AG | 332,091 | 15,396,760 | |
| LEG Immobilien AG | 270,421 | 25,022,458 | |
| SAP AG | 571,242 | 44,820,245 | |
| TOTAL GERMANY | 183,968,910 | ||
| Ireland - 3.0% | |||
| DCC PLC (United Kingdom) | 149,700 | 13,255,290 | |
| Ryanair Holdings PLC sponsored ADR | 137,767 | 11,152,239 | |
| United Drug PLC (United Kingdom) | 1,554,241 | 13,898,393 | |
| TOTAL IRELAND | 38,305,922 | ||
| Isle of Man - 3.8% | |||
| Optimal Payments PLC (a) | 4,443,710 | 24,751,037 | |
| Playtech Ltd. | 1,974,395 | 23,208,918 | |
| TOTAL ISLE OF MAN | 47,959,955 | ||
| Malta - 1.0% | |||
| Kambi Group PLC (a)(b) | 752,299 | 12,974,791 | |
| Netherlands - 1.8% | |||
| CSM NV (exchangeable) | 295,400 | 7,539,543 | |
| RELX NV | 929,903 | 15,604,430 | |
| TOTAL NETHERLANDS | 23,143,973 | ||
| Norway - 1.6% | |||
| TGS Nopec Geophysical Co. ASA | 1,199,700 | 20,069,871 | |
| Spain - 3.2% | |||
| Amadeus IT Holding SA Class A | 520,000 | 23,662,229 | |
| Red Electrica Corporacion SA | 180,600 | 16,123,886 | |
| TOTAL SPAIN | 39,786,115 | ||
| Sweden - 15.9% | |||
| Elekta AB (B Shares) (b) | 2,889,502 | 21,121,328 | |
| Getinge AB (B Shares) | 2,070,400 | 43,777,611 | |
| H&M Hennes & Mauritz AB (B Shares) | 653,350 | 23,228,016 | |
| Hemfosa Fastigheter AB (b) | 1,181,300 | 12,319,842 | |
| Hemfosa Fastigheter AB rights 5/10/16 (a)(b) | 1,181,300 | 426,598 | |
| Indutrade AB | 301,100 | 16,883,902 | |
| Kungsleden AB (b) | 1,999,100 | 13,753,933 | |
| Lundbergfoeretagen AB (b) | 94,092 | 5,109,741 | |
| Pandox AB | 781,300 | 13,260,924 | |
| Sandvik AB (b) | 1,121,100 | 11,503,545 | |
| Svenska Cellulosa AB (SCA) (B Shares) | 776,700 | 24,460,327 | |
| Svenska Handelsbanken AB (A Shares) | 1,135,800 | 15,151,746 | |
| TOTAL SWEDEN | 200,997,513 | ||
| Switzerland - 1.6% | |||
| Julius Baer Group Ltd. | 484,660 | 20,770,478 | |
| United Kingdom - 25.5% | |||
| Aldermore Group PLC (a) | 412,035 | 1,131,844 | |
| Big Yellow Group PLC | 1,014,100 | 11,942,923 | |
| Bunzl PLC | 672,658 | 20,040,398 | |
| CMC Markets PLC | 2,220,400 | 8,110,844 | |
| Compass Group PLC | 1,178,117 | 20,980,366 | |
| Dechra Pharmaceuticals PLC | 982,700 | 15,880,746 | |
| Diploma PLC | 1,298,700 | 13,880,911 | |
| International Personal Finance PLC | 4,993,203 | 19,523,611 | |
| Micro Focus International PLC | 611,300 | 13,657,043 | |
| Prudential PLC | 1,315,049 | 25,958,454 | |
| Rolls-Royce Group PLC | 1,344,192 | 13,149,423 | |
| Saga PLC | 2,083,300 | 6,380,253 | |
| Schroders PLC | 216,222 | 7,942,550 | |
| Senior Engineering Group PLC | 3,385,600 | 10,764,388 | |
| Shawbrook Group PLC | 2,658,100 | 11,131,208 | |
| Softcat PLC | 2,168,878 | 10,109,289 | |
| St. James's Place Capital PLC | 577,862 | 7,320,454 | |
| Standard Chartered PLC (United Kingdom) | 4,774,215 | 38,513,636 | |
| Unite Group PLC | 1,114,687 | 10,301,685 | |
| Virgin Money Holdings Uk PLC | 1,292,548 | 6,895,302 | |
| William Hill PLC | 8,566,773 | 39,141,723 | |
| Worldpay Group PLC (a) | 2,438,800 | 9,510,855 | |
| TOTAL UNITED KINGDOM | 322,267,906 | ||
| TOTAL COMMON STOCKS | |||
| (Cost $1,212,366,663) | 1,244,967,871 | ||
| Nonconvertible Preferred Stocks - 0.0% | |||
| United Kingdom - 0.0% | |||
| Rolls-Royce Group PLC | |||
| (Cost $139,439) | 95,437,632 | 139,449 | |
| Money Market Funds - 5.5% | |||
| Fidelity Cash Central Fund, 0.38% (d) | 19,143,324 | 19,143,324 | |
| Fidelity Securities Lending Cash Central Fund, 0.42% (d)(e) | 51,164,371 | 51,164,371 | |
| TOTAL MONEY MARKET FUNDS | |||
| (Cost $70,307,695) | 70,307,695 | ||
| TOTAL INVESTMENT PORTFOLIO - 103.8% | |||
| (Cost $1,282,813,797) | 1,315,415,015 | ||
| NET OTHER ASSETS (LIABILITIES) - (3.8)% | (48,637,843) | ||
| NET ASSETS - 100% | $1,266,777,172 |
Categorizations in the Schedule of Investments are based on country or territory of incorporation.
Legend
(a) Non-income producing
(b) Security or a portion of the security is on loan at period end.
(c) Affiliated company
(d) Affiliated fund that is generally available only to investment companies and other accounts managed by Fidelity Investments. The rate quoted is the annualized seven-day yield of the fund at period end. A complete unaudited listing of the fund's holdings as of its most recent quarter end is available upon request. In addition, each Fidelity Central Fund's financial statements are available on the SEC's website or upon request.
(e) Investment made with cash collateral received from securities on loan.
Affiliated Central Funds
Information regarding fiscal year to date income earned by the Fund from investments in Fidelity Central Funds is as follows:
| Fund | Income earned |
| Fidelity Cash Central Fund | $14,049 |
| Fidelity Securities Lending Cash Central Fund | 470,655 |
| Total | $484,704 |
Other Affiliated Issuers
An affiliated company is a company in which the Fund has ownership of at least 5% of the voting securities. Fiscal year to date transactions with companies which are or were affiliates are as follows:
| Affiliate | Value, beginning of period | Purchases | Sales Proceeds | Dividend Income | Value, end of period |
| Vostok Emerging Finance Ltd. (depository receipt) | $1,697,310 | $3,320,861 | $-- | $-- | $7,179,016 |
| Total | $1,697,310 | $3,320,861 | $-- | $-- | $7,179,016 |
Investment Valuation
The following is a summary of the inputs used, as of April 30, 2016, involving the Fund's assets and liabilities carried at fair value. The inputs or methodology used for valuing securities may not be an indication of the risk associated with investing in those securities. For more information on valuation inputs, and their aggregation into the levels used below, please refer to the Investment Valuation section in the accompanying Notes to Financial Statements.
| Valuation Inputs at Reporting Date: | ||||
| Description | Total | Level 1 | Level 2 | Level 3 |
| Investments in Securities: | ||||
| Equities: | ||||
| Consumer Discretionary | $212,152,716 | $159,578,109 | $52,574,607 | $-- |
| Consumer Staples | 47,979,797 | 47,979,797 | -- | -- |
| Energy | 20,069,871 | 20,069,871 | -- | -- |
| Financials | 314,133,845 | 252,253,167 | 61,880,678 | -- |
| Health Care | 217,753,137 | 177,029,591 | 40,723,546 | -- |
| Industrials | 224,647,621 | 209,796,917 | 14,850,704 | -- |
| Information Technology | 168,222,761 | 123,402,516 | 44,820,245 | -- |
| Materials | 24,023,686 | 24,023,686 | -- | -- |
| Utilities | 16,123,886 | 16,123,886 | -- | -- |
| Money Market Funds | 70,307,695 | 70,307,695 | -- | -- |
| Total Investments in Securities: | $1,315,415,015 | $1,100,565,235 | $214,849,780 | $-- |
The following is a summary of transfers between Level 1 and Level 2 for the period ended April 30, 2016. Transfers are assumed to have occurred at the beginning of the period, and are primarily attributable to the valuation techniques used for foreign equity securities, as discussed in the accompanying Notes to Financial Statements:
| Transfers | Total |
| Level 1 to Level 2 | $14,998,864 |
| Level 2 to Level 1 | $104,687,573 |
See accompanying notes which are an integral part of the financial statements.
Financial Statements
Statement of Assets and Liabilities
| April 30, 2016 (Unaudited) | ||
| Assets | ||
| Investment in securities, at value (including securities loaned of $47,749,257) — See accompanying schedule: Unaffiliated issuers (cost $1,205,694,084) | $1,237,928,304 | |
| Fidelity Central Funds (cost $70,307,695) | 70,307,695 | |
| Other affiliated issuers (cost $6,812,018) | 7,179,016 | |
| Total Investments (cost $1,282,813,797) | $1,315,415,015 | |
| Foreign currency held at value (cost $415,926) | 416,697 | |
| Receivable for investments sold | 16,944,779 | |
| Receivable for fund shares sold | 359,129 | |
| Dividends receivable | 6,058,099 | |
| Distributions receivable from Fidelity Central Funds | 118,618 | |
| Prepaid expenses | 1,099 | |
| Other receivables | 385,751 | |
| Total assets | 1,339,699,187 | |
| Liabilities | ||
| Payable for investments purchased | $15,172,992 | |
| Payable for fund shares redeemed | 5,402,754 | |
| Accrued management fee | 852,908 | |
| Distribution and service plan fees payable | 17,090 | |
| Other affiliated payables | 255,438 | |
| Other payables and accrued expenses | 56,462 | |
| Collateral on securities loaned, at value | 51,164,371 | |
| Total liabilities | 72,922,015 | |
| Net Assets | $1,266,777,172 | |
| Net Assets consist of: | ||
| Paid in capital | $1,471,111,712 | |
| Undistributed net investment income | 6,329,298 | |
| Accumulated undistributed net realized gain (loss) on investments and foreign currency transactions | (243,252,646) | |
| Net unrealized appreciation (depreciation) on investments and assets and liabilities in foreign currencies | 32,588,808 | |
| Net Assets | $1,266,777,172 | |
| Calculation of Maximum Offering Price | ||
| Class A: | ||
| Net Asset Value and redemption price per share ($20,856,215 ÷ 580,720 shares) | $35.91 | |
| Maximum offering price per share (100/94.25 of $35.91) | $38.10 | |
| Class T: | ||
| Net Asset Value and redemption price per share ($8,671,461 ÷ 241,352 shares) | $35.93 | |
| Maximum offering price per share (100/96.50 of $35.93) | $37.23 | |
| Class B: | ||
| Net Asset Value and offering price per share ($330,539 ÷ 9,203 shares)(a) | $35.92 | |
| Class C: | ||
| Net Asset Value and offering price per share ($10,556,892 ÷ 295,836 shares)(a) | $35.68 | |
| Europe: | ||
| Net Asset Value, offering price and redemption price per share ($1,220,777,096 ÷ 33,951,628 shares) | $35.96 | |
| Class I: | ||
| Net Asset Value, offering price and redemption price per share ($5,584,969 ÷ 155,274 shares) | $35.97 |
(a) Redemption price per share is equal to net asset value less any applicable contingent deferred sales charge.
See accompanying notes which are an integral part of the financial statements.
Statement of Operations
| Six months ended April 30, 2016 (Unaudited) | ||
| Investment Income | ||
| Dividends | $14,304,511 | |
| Income from Fidelity Central Funds | 484,704 | |
| Income before foreign taxes withheld | 14,789,215 | |
| Less foreign taxes withheld | (1,301,648) | |
| Total income | 13,487,567 | |
| Expenses | ||
| Management fee | ||
| Basic fee | $4,572,219 | |
| Performance adjustment | 720,162 | |
| Transfer agent fees | 1,275,395 | |
| Distribution and service plan fees | 103,701 | |
| Accounting and security lending fees | 300,640 | |
| Custodian fees and expenses | 58,646 | |
| Independent trustees' compensation | 2,980 | |
| Registration fees | 82,776 | |
| Audit | 51,983 | |
| Legal | 2,453 | |
| Interest | 1,158 | |
| Miscellaneous | 4,678 | |
| Total expenses before reductions | 7,176,791 | |
| Expense reductions | (17,200) | 7,159,591 |
| Net investment income (loss) | 6,327,976 | |
| Realized and Unrealized Gain (Loss) | ||
| Net realized gain (loss) on: | ||
| Investment securities: | ||
| Unaffiliated issuers | (9,336,540) | |
| Foreign currency transactions | 527,156 | |
| Total net realized gain (loss) | (8,809,384) | |
| Change in net unrealized appreciation (depreciation) on: Investment securities | (29,111,544) | |
| Assets and liabilities in foreign currencies | (229,593) | |
| Total change in net unrealized appreciation (depreciation) | (29,341,137) | |
| Net gain (loss) | (38,150,521) | |
| Net increase (decrease) in net assets resulting from operations | $(31,822,545) |
See accompanying notes which are an integral part of the financial statements.
Statement of Changes in Net Assets
| Six months ended April 30, 2016 (Unaudited) | Year ended October 31, 2015 | |
| Increase (Decrease) in Net Assets | ||
| Operations | ||
| Net investment income (loss) | $6,327,976 | $17,742,695 |
| Net realized gain (loss) | (8,809,384) | 56,856,298 |
| Change in net unrealized appreciation (depreciation) | (29,341,137) | (21,376,933) |
| Net increase (decrease) in net assets resulting from operations | (31,822,545) | 53,222,060 |
| Distributions to shareholders from net investment income | (15,981,681) | (31,603,696) |
| Distributions to shareholders from net realized gain | (5,885,187) | – |
| Total distributions | (21,866,868) | (31,603,696) |
| Share transactions - net increase (decrease) | (114,922,308) | 125,806,049 |
| Redemption fees | 7,934 | 48,244 |
| Total increase (decrease) in net assets | (168,603,787) | 147,472,657 |
| Net Assets | ||
| Beginning of period | 1,435,380,959 | 1,287,908,302 |
| End of period (including undistributed net investment income of $6,329,298 and undistributed net investment income of $15,983,003, respectively) | $1,266,777,172 | $1,435,380,959 |
See accompanying notes which are an integral part of the financial statements.
Financial Highlights — Fidelity Europe Fund Class A
| Six months ended (Unaudited) April 30, | Years ended October 31, | ||
| 2016 | 2015 | 2014 A | |
| Selected Per–Share Data | |||
| Net asset value, beginning of period | $37.06 | $36.24 | $39.45 |
| Income from Investment Operations | |||
| Net investment income (loss)B | .12 | .37 | .47 |
| Net realized and unrealized gain (loss) | (.83) | 1.29 | (3.68) |
| Total from investment operations | (.71) | 1.66 | (3.21) |
| Distributions from net investment income | (.29) | (.84) | – |
| Distributions from net realized gain | (.15) | – | – |
| Total distributions | (.44) | (.84) | – |
| Redemption fees added to paid in capitalB,C | – | – | – |
| Net asset value, end of period | $35.91 | $37.06 | $36.24 |
| Total ReturnD,E,F | (1.94)% | 4.63% | (8.14)% |
| Ratios to Average Net AssetsG,H | |||
| Expenses before reductions | 1.40%I | 1.33% | 1.35%I |
| Expenses net of fee waivers, if any | 1.39%I | 1.33% | 1.35%I |
| Expenses net of all reductions | 1.39%I | 1.31% | 1.35%I |
| Net investment income (loss) | .67%I | .98% | 1.94%I |
| Supplemental Data | |||
| Net assets, end of period (000 omitted) | $20,856 | $23,381 | $23,633 |
| Portfolio turnover rateJ | 43%I | 87% | 80%K |
A For the period March 18, 2014 (commencement of sale of shares) to October 31, 2014.
B Calculated based on average shares outstanding during the period.
C Amount represents less than $.005 per share.
D Total returns for periods of less than one year are not annualized.
E Total returns would have been lower if certain expenses had not been reduced during the applicable periods shown.
F Total returns do not include the effect of the sales charges.
G Fees and expenses of any underlying Fidelity Central Funds are not included in the Fund's expense ratio. The Fund indirectly bears its proportionate share of the expenses of any underlying Fidelity Central Funds.
H Expense ratios reflect operating expenses of the class. Expenses before reductions do not reflect amounts reimbursed by the investment adviser or reductions from brokerage service arrangements or reductions from other expense offset arrangements and do not represent the amount paid by the class during periods when reimbursements or reductions occur. Expenses net of fee waivers reflect expenses after reimbursement by the investment adviser but prior to reductions from brokerage service arrangements or other expense offset arrangements. Expenses net of all reductions represent the net expenses paid by the class.
I Annualized
J Amount does not include the portfolio activity of any underlying Fidelity Central Funds.
K The portfolio turnover rate does not include the assets acquired in the merger.
See accompanying notes which are an integral part of the financial statements.
Financial Highlights — Fidelity Europe Fund Class T
| Six months ended (Unaudited) April 30, | Years ended October 31, | ||
| 2016 | 2015 | 2014 A | |
| Selected Per–Share Data | |||
| Net asset value, beginning of period | $36.94 | $36.18 | $39.45 |
| Income from Investment Operations | |||
| Net investment income (loss)B | .06 | .26 | .40 |
| Net realized and unrealized gain (loss) | (.82) | 1.29 | (3.67) |
| Total from investment operations | (.76) | 1.55 | (3.27) |
| Distributions from net investment income | (.09) | (.79) | – |
| Distributions from net realized gain | (.15) | – | – |
| Total distributions | (.25)C | (.79) | – |
| Redemption fees added to paid in capitalB,D | – | – | – |
| Net asset value, end of period | $35.93 | $36.94 | $36.18 |
| Total ReturnE,F,G | (2.08)% | 4.33% | (8.29)% |
| Ratios to Average Net AssetsH,I | |||
| Expenses before reductions | 1.70%J | 1.61% | 1.62%J |
| Expenses net of fee waivers, if any | 1.70%J | 1.61% | 1.61%J |
| Expenses net of all reductions | 1.70%J | 1.59% | 1.61%J |
| Net investment income (loss) | .36%J | .70% | 1.68%J |
| Supplemental Data | |||
| Net assets, end of period (000 omitted) | $8,671 | $9,632 | $13,679 |
| Portfolio turnover rateK | 43%J | 87% | 80%L |
A For the period March 18, 2014 (commencement of sale of shares) to October 31, 2014.
B Calculated based on average shares outstanding during the period.
C Total distributions of $.25 per share is comprised of distributions from net investment income of $.092 and distributions from net realized gain of $.154 per share.
D Amount represents less than $.005 per share.
E Total returns for periods of less than one year are not annualized.
F Total returns would have been lower if certain expenses had not been reduced during the applicable periods shown.
G Total returns do not include the effect of the sales charges.
H Fees and expenses of any underlying Fidelity Central Funds are not included in the Fund's expense ratio. The Fund indirectly bears its proportionate share of the expenses of any underlying Fidelity Central Funds.
I Expense ratios reflect operating expenses of the class. Expenses before reductions do not reflect amounts reimbursed by the investment adviser or reductions from brokerage service arrangements or reductions from other expense offset arrangements and do not represent the amount paid by the class during periods when reimbursements or reductions occur. Expenses net of fee waivers reflect expenses after reimbursement by the investment adviser but prior to reductions from brokerage service arrangements or other expense offset arrangements. Expenses net of all reductions represent the net expenses paid by the class.
J Annualized
K Amount does not include the portfolio activity of any underlying Fidelity Central Funds.
L The portfolio turnover rate does not include the assets acquired in the merger.
See accompanying notes which are an integral part of the financial statements.
Financial Highlights — Fidelity Europe Fund Class B
| Six months ended (Unaudited) April 30, | Years ended October 31, | ||
| 2016 | 2015 | 2014 A | |
| Selected Per–Share Data | |||
| Net asset value, beginning of period | $36.77 | $36.07 | $39.45 |
| Income from Investment Operations | |||
| Net investment income (loss)B | (.02) | .06 | .28 |
| Net realized and unrealized gain (loss) | (.83) | 1.29 | (3.66) |
| Total from investment operations | (.85) | 1.35 | (3.38) |
| Distributions from net investment income | – | (.65) | – |
| Redemption fees added to paid in capitalB,C | – | – | – |
| Net asset value, end of period | $35.92 | $36.77 | $36.07 |
| Total ReturnD,E,F | (2.31)% | 3.78% | (8.57)% |
| Ratios to Average Net AssetsG,H | |||
| Expenses before reductions | 2.19%I | 2.15% | 2.11%I |
| Expenses net of fee waivers, if any | 2.19%I | 2.15% | 2.11%I |
| Expenses net of all reductions | 2.19%I | 2.13% | 2.11%I |
| Net investment income (loss) | (.12)%I | .16% | 1.19%I |
| Supplemental Data | |||
| Net assets, end of period (000 omitted) | $331 | $530 | $1,065 |
| Portfolio turnover rateJ | 43%I | 87% | 80%K |
A For the period March 18, 2014 (commencement of sale of shares) to October 31, 2014.
B Calculated based on average shares outstanding during the period.
C Amount represents less than $.005 per share.
D Total returns for periods of less than one year are not annualized.
E Total returns would have been lower if certain expenses had not been reduced during the applicable periods shown.
F Total returns do not include the effect of the contingent deferred sales charge.
G Fees and expenses of any underlying Fidelity Central Funds are not included in the Fund's expense ratio. The Fund indirectly bears its proportionate share of the expenses of any underlying Fidelity Central Funds.
H Expense ratios reflect operating expenses of the class. Expenses before reductions do not reflect amounts reimbursed by the investment adviser or reductions from brokerage service arrangements or reductions from other expense offset arrangements and do not represent the amount paid by the class during periods when reimbursements or reductions occur. Expenses net of fee waivers reflect expenses after reimbursement by the investment adviser but prior to reductions from brokerage service arrangements or other expense offset arrangements. Expenses net of all reductions represent the net expenses paid by the class.
I Annualized
J Amount does not include the portfolio activity of any underlying Fidelity Central Funds.
K The portfolio turnover rate does not include the assets acquired in the merger.
See accompanying notes which are an integral part of the financial statements.
Financial Highlights — Fidelity Europe Fund Class C
| Six months ended (Unaudited) April 30, | Years ended October 31, | ||
| 2016 | 2015 | 2014 A | |
| Selected Per–Share Data | |||
| Net asset value, beginning of period | $36.81 | $36.07 | $39.45 |
| Income from Investment Operations | |||
| Net investment income (loss)B | (.02) | .07 | .29 |
| Net realized and unrealized gain (loss) | (.83) | 1.29 | (3.67) |
| Total from investment operations | (.85) | 1.36 | (3.38) |
| Distributions from net investment income | (.12) | (.62) | – |
| Distributions from net realized gain | (.15) | – | – |
| Total distributions | (.28)C | (.62) | – |
| Redemption fees added to paid in capitalB,D | – | – | – |
| Net asset value, end of period | $35.68 | $36.81 | $36.07 |
| Total ReturnE,F,G | (2.33)% | 3.79% | (8.57)% |
| Ratios to Average Net AssetsH,I | |||
| Expenses before reductions | 2.18%J | 2.13% | 2.10%J |
| Expenses net of fee waivers, if any | 2.18%J | 2.13% | 2.10%J |
| Expenses net of all reductions | 2.18%J | 2.11% | 2.10%J |
| Net investment income (loss) | (.12)%J | .18% | 1.19%J |
| Supplemental Data | |||
| Net assets, end of period (000 omitted) | $10,557 | $11,151 | $6,818 |
| Portfolio turnover rateK | 43%J | 87% | 80%L |
A For the period March 18, 2014 (commencement of sale of shares) to October 31, 2014.
B Calculated based on average shares outstanding during the period.
C Total distributions of $.28 per share is comprised of distributions from net investment income of $.123 and distributions from net realized gain of $.154 per share.
D Amount represents less than $.005 per share.
E Total returns for periods of less than one year are not annualized.
F Total returns would have been lower if certain expenses had not been reduced during the applicable periods shown.
G Total returns do not include the effect of the contingent deferred sales charge.
H Fees and expenses of any underlying Fidelity Central Funds are not included in the Fund's expense ratio. The Fund indirectly bears its proportionate share of the expenses of any underlying Fidelity Central Funds.
I Expense ratios reflect operating expenses of the class. Expenses before reductions do not reflect amounts reimbursed by the investment adviser or reductions from brokerage service arrangements or reductions from other expense offset arrangements and do not represent the amount paid by the class during periods when reimbursements or reductions occur. Expenses net of fee waivers reflect expenses after reimbursement by the investment adviser but prior to reductions from brokerage service arrangements or other expense offset arrangements. Expenses net of all reductions represent the net expenses paid by the class.
J Annualized
K Amount does not include the portfolio activity of any underlying Fidelity Central Funds.
L The portfolio turnover rate does not include the assets acquired in the merger.
See accompanying notes which are an integral part of the financial statements.
Financial Highlights — Fidelity Europe Fund
| Six months ended (Unaudited) April 30, | Years ended October 31, | |||||
| 2016 | 2015 | 2014 | 2013 | 2012 | 2011 | |
| Selected Per–Share Data | ||||||
| Net asset value, beginning of period | $37.19 | $36.32 | $37.92 | $30.15 | $27.67 | $30.83 |
| Income from Investment Operations | ||||||
| Net investment income (loss)A | .17 | .48 | .94B | .61 | .64 | .48 |
| Net realized and unrealized gain (loss) | (.82) | 1.30 | (2.00) | 7.87 | 2.45 | (2.97) |
| Total from investment operations | (.65) | 1.78 | (1.06) | 8.48 | 3.09 | (2.49) |
| Distributions from net investment income | (.43) | (.91) | (.52) | (.70) | (.60) | (.67) |
| Distributions from net realized gain | (.15) | – | (.02) | (.01) | (.02) | – |
| Total distributions | (.58) | (.91) | (.54) | (.71) | (.61)C | (.67) |
| Redemption fees added to paid in capitalA,D | – | – | – | – | – | – |
| Net asset value, end of period | $35.96 | $37.19 | $36.32 | $37.92 | $30.15 | $27.67 |
| Total ReturnE,F | (1.78)% | 4.97% | (2.82)% | 28.71% | 11.53% | (8.32)% |
| Ratios to Average Net AssetsG,H | ||||||
| Expenses before reductions | 1.08%I | 1.03% | .97% | 1.06% | .83% | 1.10% |
| Expenses net of fee waivers, if any | 1.08%I | 1.03% | .97% | 1.05% | .83% | 1.10% |
| Expenses net of all reductions | 1.08%I | 1.01% | .96% | 1.02% | .80% | 1.06% |
| Net investment income (loss) | .99%I | 1.28% | 2.43%B | 1.82% | 2.33% | 1.56% |
| Supplemental Data | ||||||
| Net assets, end of period (000 omitted) | $1,220,777 | $1,384,134 | $1,237,047 | $957,048 | $602,520 | $621,778 |
| Portfolio turnover rateJ | 43%I | 87% | 80%K | 59% | 127% | 117% |
A Calculated based on average shares outstanding during the period.
B Net Investment income per share reflects a large, non-recurring dividend which amounted to $.19 per share. Excluding this non-recurring dividend, the ratio of net investment income (loss) to average net assets would have been 1.93%.
C Total distributions of $.61 per share is comprised of distributions from net investment income of $.595 and distributions from net realized gain of $.017 per share.
D Amount represents less than $.005 per share.
E Total returns for periods of less than one year are not annualized.
F Total returns would have been lower if certain expenses had not been reduced during the applicable periods shown.
G Fees and expenses of any underlying Fidelity Central Funds are not included in the Fund's expense ratio. The Fund indirectly bears its proportionate share of the expenses of any underlying Fidelity Central Funds.
H Expense ratios reflect operating expenses of the class. Expenses before reductions do not reflect amounts reimbursed by the investment adviser or reductions from brokerage service arrangements or reductions from other expense offset arrangements and do not represent the amount paid by the class during periods when reimbursements or reductions occur. Expenses net of fee waivers reflect expenses after reimbursement by the investment adviser but prior to reductions from brokerage service arrangements or other expense offset arrangements. Expenses net of all reductions represent the net expenses paid by the class.
I Annualized
J Amount does not include the portfolio activity of any underlying Fidelity Central Funds.
K The portfolio turnover rate does not include the assets acquired in the merger.
See accompanying notes which are an integral part of the financial statements.
Financial Highlights — Fidelity Europe Fund Class I
| Six months ended (Unaudited) April 30, | Years ended October 31, | ||
| 2016 | 2015 | 2014 A | |
| Selected Per–Share Data | |||
| Net asset value, beginning of period | $37.21 | $36.32 | $39.45 |
| Income from Investment Operations | |||
| Net investment income (loss)B | .18 | .50 | .56 |
| Net realized and unrealized gain (loss) | (.82) | 1.30 | (3.69) |
| Total from investment operations | (.64) | 1.80 | (3.13) |
| Distributions from net investment income | (.45) | (.91) | – |
| Distributions from net realized gain | (.15) | – | – |
| Total distributions | (.60) | (.91) | – |
| Redemption fees added to paid in capitalB,C | – | – | – |
| Net asset value, end of period | $35.97 | $37.21 | $36.32 |
| Total ReturnD,E | (1.75)% | 5.02% | (7.93)% |
| Ratios to Average Net AssetsF,G | |||
| Expenses before reductions | 1.02%H | .98% | .97%H |
| Expenses net of fee waivers, if any | 1.02%H | .98% | .97%H |
| Expenses net of all reductions | 1.02%H | .96% | .96%H |
| Net investment income (loss) | 1.05%H | 1.33% | 2.33%H |
| Supplemental Data | |||
| Net assets, end of period (000 omitted) | $5,585 | $6,552 | $5,666 |
| Portfolio turnover rateI | 43%H | 87% | 80%J |
A For the period March 18, 2014 (commencement of sale of shares) to October 31, 2014.
B Calculated based on average shares outstanding during the period.
C Amount represents less than $.005 per share.
D Total returns for periods of less than one year are not annualized.
E Total returns would have been lower if certain expenses had not been reduced during the applicable periods shown.
F Fees and expenses of any underlying Fidelity Central Funds are not included in the Fund's expense ratio. The Fund indirectly bears its proportionate share of the expenses of any underlying Fidelity Central Funds.
G Expense ratios reflect operating expenses of the class. Expenses before reductions do not reflect amounts reimbursed by the investment adviser or reductions from brokerage service arrangements or reductions from other expense offset arrangements and do not represent the amount paid by the class during periods when reimbursements or reductions occur. Expenses net of fee waivers reflect expenses after reimbursement by the investment adviser but prior to reductions from brokerage service arrangements or other expense offset arrangements. Expenses net of all reductions represent the net expenses paid by the class.
H Annualized
I Amount does not include the portfolio activity of any underlying Fidelity Central Funds.
J The portfolio turnover rate does not include the assets acquired in the merger.
See accompanying notes which are an integral part of the financial statements.
Notes to Financial Statements (Unaudited)
For the period ended April 30, 2016
1. Organization.
Fidelity Europe Fund (the Fund) is a fund of Fidelity Investment Trust (the Trust) and is authorized to issue an unlimited number of shares. The Trust is registered under the Investment Company Act of 1940, as amended (the 1940 Act), as an open-end management investment company organized as a Massachusetts business trust. The Fund offers Class A, Class T, Class C, Europe and Class I shares, each of which, along with Class B shares, has equal rights as to assets and voting privileges. Class B shares are closed to new accounts and additional purchases, except for exchanges and reinvestments. Each class has exclusive voting rights with respect to matters that affect that class. Class B shares will automatically convert to Class A shares after a holding period of seven years from the initial date of purchase.
During the period, the Board of Trustees approved the conversion of all existing Class B shares into Class A shares, effective on or about July 1, 2016, regardless of the length of times shares have been held.
2. Investments in Fidelity Central Funds.
The Fund invests in Fidelity Central Funds, which are open-end investment companies generally available only to other investment companies and accounts managed by the investment adviser and its affiliates. The Fund's Schedule of Investments lists each of the Fidelity Central Funds held as of period end, if any, as an investment of the Fund, but does not include the underlying holdings of each Fidelity Central Fund. As an Investing Fund, the Fund indirectly bears its proportionate share of the expenses of the underlying Fidelity Central Funds.
The Money Market Central Funds seek preservation of capital and current income and are managed by Fidelity Investments Money Management, Inc. (FIMM), an affiliate of the investment adviser. Annualized expenses of the Money Market Central Funds as of their most recent shareholder report date are less than .005%.
A complete unaudited list of holdings for each Fidelity Central Fund is available upon request or at the Securities and Exchange Commission (the SEC) website at www.sec.gov. In addition, the financial statements of the Fidelity Central Funds are available on the SEC website or upon request.
3. Significant Accounting Policies.
The financial statements have been prepared in conformity with accounting principles generally accepted in the United States of America (GAAP), which require management to make certain estimates and assumptions at the date of the financial statements. Actual results could differ from those estimates. Subsequent events, if any, through the date that the financial statements were issued have been evaluated in the preparation of the financial statements. The following summarizes the significant accounting policies of the Fund:
Investment Valuation. Investments are valued as of 4:00 p.m. Eastern time on the last calendar day of the period. The Board of Trustees (the Board) has delegated the day to day responsibility for the valuation of the Fund's investments to the Fidelity Management & Research Company (FMR) Fair Value Committee (the Committee). In accordance with valuation policies and procedures approved by the Board, the Fund attempts to obtain prices from one or more third party pricing vendors or brokers to value its investments. When current market prices, quotations or currency exchange rates are not readily available or reliable, investments will be fair valued in good faith by the Committee, in accordance with procedures adopted by the Board. Factors used in determining fair value vary by investment type and may include market or investment specific events. The frequency with which these procedures are used cannot be predicted and they may be utilized to a significant extent. The Committee oversees the Fund's valuation policies and procedures and reports to the Board on the Committee's activities and fair value determinations. The Board monitors the appropriateness of the procedures used in valuing the Fund's investments and ratifies the fair value determinations of the Committee.
The Fund categorizes the inputs to valuation techniques used to value its investments into a disclosure hierarchy consisting of three levels as shown below:
- Level 1 – quoted prices in active markets for identical investments
- Level 2 – other significant observable inputs (including quoted prices for similar investments, interest rates, prepayment speeds, etc.)
- Level 3 – unobservable inputs (including the Fund's own assumptions based on the best information available)
Valuation techniques used to value the Fund's investments by major category are as follows:
Equity securities, including restricted securities, for which market quotations are readily available, are valued at the last reported sale price or official closing price as reported by a third party pricing vendor on the primary market or exchange on which they are traded and are categorized as Level 1 in the hierarchy. In the event there were no sales during the day or closing prices are not available, securities are valued at the last quoted bid price or may be valued using the last available price and are generally categorized as Level 2 in the hierarchy. For foreign equity securities, when market or security specific events arise, comparisons to the valuation of American Depositary Receipts (ADRs), futures contracts, Exchange-Traded Funds (ETFs) and certain indexes as well as quoted prices for similar securities may be used and would be categorized as Level 2 in the hierarchy. Utilizing these techniques may result in transfers between Level 1 and Level 2. For equity securities, including restricted securities, where observable inputs are limited, assumptions about market activity and risk are used and these securities may be categorized as Level 3 in the hierarchy.
Investments in open-end mutual funds, including the Fidelity Central Funds, are valued at their closing net asset value (NAV) each business day and are categorized as Level 1 in the hierarchy.
Changes in valuation techniques may result in transfers in or out of an assigned level within the disclosure hierarchy. The aggregate value of investments by input level as of April 30, 2016, including information on transfers between Levels 1 and 2, is included at the end of the Fund's Schedule of Investments.
Foreign Currency. The Fund may use foreign currency contracts to facilitate transactions in foreign-denominated securities. Gains and losses from these transactions may arise from changes in the value of the foreign currency or if the counterparties do not perform under the contracts' terms.
Foreign-denominated assets, including investment securities, and liabilities are translated into U.S. dollars at the exchange rates at period end. Purchases and sales of investment securities, income and dividends received and expenses denominated in foreign currencies are translated into U.S. dollars at the exchange rate in effect on the transaction date.
The effects of exchange rate fluctuations on investments are included with the net realized and unrealized gain (loss) on investment securities. Other foreign currency transactions resulting in realized and unrealized gain (loss) are disclosed separately.
Investment Transactions and Income. For financial reporting purposes, the Fund's investment holdings and NAV include trades executed through the end of the last business day of the period. The NAV per share for processing shareholder transactions is calculated as of the close of business of the New York Stock Exchange (NYSE), normally 4:00 p.m. Eastern time and includes trades executed through the end of the prior business day. Gains and losses on securities sold are determined on the basis of identified cost. Dividend income is recorded on the ex-dividend date, except for certain dividends from foreign securities where the ex-dividend date may have passed, which are recorded as soon as the Fund is informed of the ex-dividend date. Non-cash dividends included in dividend income, if any, are recorded at the fair market value of the securities received. Income and capital gain distributions from Fidelity Central Funds, if any, are recorded on the ex-dividend date. Interest income is accrued as earned and includes coupon interest and amortization of premium and accretion of discount on debt securities as applicable. Investment income is recorded net of foreign taxes withheld where recovery of such taxes is uncertain.
Class Allocations and Expenses. Investment income, realized and unrealized capital gains and losses, common expenses of the Fund, and certain fund-level expense reductions, if any, are allocated daily on a pro-rata basis to each class based on the relative net assets of each class to the total net assets of the Fund. Each class differs with respect to transfer agent and distribution and service plan fees incurred. Certain expense reductions may also differ by class. For the reporting period, the allocated portion of income and expenses to each class as a percent of its average net assets may vary due to the timing of recording these transactions in relation to fluctuating net assets of the classes. Expenses directly attributable to a fund are charged to that fund. Expenses attributable to more than one fund are allocated among the respective funds on the basis of relative net assets or other appropriate methods. Expense estimates are accrued in the period to which they relate and adjustments are made when actual amounts are known.
Income Tax Information and Distributions to Shareholders. Each year, the Fund intends to qualify as a regulated investment company under Subchapter M of the Internal Revenue Code, including distributing substantially all of its taxable income and realized gains. As a result, no provision for U.S. Federal income taxes is required. The Fund files a U.S. federal tax return, in addition to state and local tax returns as required. The Fund's federal income tax returns are subject to examination by the Internal Revenue Service (IRS) for a period of three fiscal years after they are filed. State and local tax returns may be subject to examination for an additional fiscal year depending on the jurisdiction. Foreign taxes are provided for based on the Fund's understanding of the tax rules and rates that exist in the foreign markets in which it invests.
Distributions are declared and recorded on the ex-dividend date. Income dividends and capital gain distributions are declared separately for each class. Income and capital gain distributions are determined in accordance with income tax regulations, which may differ from GAAP.
Capital accounts within the financial statements are adjusted for permanent book-tax differences. These adjustments have no impact on net assets or the results of operations. Capital accounts are not adjusted for temporary book-tax differences which will reverse in a subsequent period.
Book-tax differences are primarily due to foreign currency transactions, passive foreign investment companies (PFIC), deferred trustees compensation, expiring capital loss carryforwards, capital loss carryforwards and losses deferred due to wash sales.
The federal tax cost of investment securities and unrealized appreciation (depreciation) as of period end were as follows:
| Gross unrealized appreciation | $129,342,669 |
| Gross unrealized depreciation | (101,437,512) |
| Net unrealized appreciation (depreciation) on securities | 27,905,157 |
| Tax cost | $1,287,509,858 |
Capital loss carryforwards are only available to offset future capital gains of the Fund to the extent provided by regulations and may be limited. Under the Regulated Investment Company Modernization Act of 2010 (the Act), the Fund is permitted to carry forward capital losses incurred in taxable years beginning after December 22, 2010 for an unlimited period and such capital losses are required to be used prior to any losses that expire. The capital loss carryforward information presented below, including any applicable limitation, is estimated as of prior fiscal period end and is subject to adjustment.
| Fiscal year of expiration | |
| 2016 | $(29,326,707) |
| 2017 | (199,044,876) |
| Total capital loss carryforward | $(228,371,583) |
The Fund acquired $27,783,139 of its capital loss carryforward as part of a merger in a prior period. The losses acquired that will be available to offset future capital gains of the Fund will be limited to approximately $13,187,073 per year.
In addition, due to large redemptions in a prior period, $199,044,876 of capital losses that existed in the Fund prior to the mergers will be limited to approximately $32,029,274 per year.
Short-Term Trading (Redemption) Fees. Shares held by investors in the Fund less than 30 days may have been subject to a redemption fee equal to 1.00% of the NAV of shares redeemed. All redemption fees, which reduce the proceeds of the shareholder redemption, are retained by the Fund and accounted for as an addition to paid in capital.
4. Purchases and Sales of Investments.
Purchases and sales of securities, other than short-term securities, aggregated $283,545,193 and $431,225,868, respectively.
5. Fees and Other Transactions with Affiliates.
Management Fee. Fidelity Management & Research Company (the investment adviser) and its affiliates provide the Fund with investment management related services for which the Fund pays a monthly management fee. The management fee is the sum of an individual fund fee rate that is based on an annual rate of .45% of the Fund's average net assets and an annualized group fee rate that averaged .25% during the period. The group fee rate is based upon the average net assets of all the mutual funds advised by the investment adviser, including any mutual funds previously advised by the investment adviser that are currently advised by Fidelity SelectCo, LLC, an affiliate of the investment adviser. The group fee rate decreases as assets under management increase and increases as assets under management decrease. In addition, the management fee is subject to a performance adjustment (up to a maximum of +/- .20% of the Fund's average net assets over a 36 month performance period). The upward or downward adjustment to the management fee is based on the relative investment performance of Europe as compared to its benchmark index, the MSCI Europe Index, over the same 36 month performance period. For the reporting period, the total annualized management fee rate, including the performance adjustment, was .81% of the Fund's average net assets. The performance adjustment included in the management fee rate may be higher or lower than the maximum performance adjustment rate due to the difference between the average net assets for the reporting and performance periods.
Distribution and Service Plan Fees. In accordance with Rule 12b-1 of the 1940 Act, the Fund has adopted separate Distribution and Service Plans for each class of shares. Certain classes pay Fidelity Distributors Corporation (FDC), an affiliate of the investment adviser, separate Distribution and Service Fees, each of which is based on an annual percentage of each class' average net assets. In addition, FDC may pay financial intermediaries for selling shares of the Fund and providing shareholder support services. For the period, the Distribution and Service Fee rates, total fees and amounts retained by FDC were as follows:
| Distribution Fee | Service Fee | Total Fees | Retained by FDC | |
| Class A | -% | .25% | $26,590 | $886 |
| Class T | .25% | .25% | 21,666 | – |
| Class B | .75% | .25% | 2,040 | 1,569 |
| Class C | .75% | .25% | 53,405 | 15,830 |
| $103,701 | $18,285 |
Sales Load. FDC may receive a front-end sales charge of up to 5.75% for selling Class A shares and 3.50% for selling Class T shares, some of which is paid to financial intermediaries for selling shares of the Fund. Depending on the holding period, FDC may receive contingent deferred sales charges levied on Class A, Class T, Class B, and Class C redemptions. The deferred sales charges range from 5.00% to 1.00% for Class B shares, 1.00% for Class C shares, 1.00% for certain purchases of Class A shares and .25% for certain purchases of Class T shares.
For the period, sales charge amounts retained by FDC were as follows:
| Retained by FDC | |
| Class A | $10,882 |
| Class T | 686 |
| Class B(a) | 121 |
| Class C(a) | 2,570 |
| $14,259 |
(a) When Class B and Class C shares are initially sold, FDC pays commissions from its own resources to financial intermediaries through which the sales are made.
Transfer Agent Fees. Fidelity Investments Institutional Operations Company, Inc., (FIIOC), an affiliate of the investment adviser, is the transfer, dividend disbursing and shareholder servicing agent for each class of the Fund. FIIOC receives account fees and asset-based fees that vary according to the account size and type of account of the shareholders of the respective classes of the Fund. FIIOC pays for typesetting, printing and mailing of shareholder reports, except proxy statements.
For the period, transfer agent fees for each class were as follows:
| Amount | % of Class-Level Average Net Assets(a) | |
| Class A | $27,543 | .26 |
| Class T | 13,690 | .32 |
| Class B | 615 | .30 |
| Class C | 15,934 | .30 |
| Europe | 1,213,618 | .19 |
| Class I | 3,995 | .13 |
| $1,275,395 |
(a) Annualized
Accounting and Security Lending Fees. Fidelity Service Company, Inc. (FSC), an affiliate of the investment adviser, maintains the Fund's accounting records. The accounting fee is based on the level of average net assets for each month. Under a separate contract, FSC administers the security lending program. The security lending fee is based on the number and duration of lending transactions.
Brokerage Commissions. The Fund placed a portion of its portfolio transactions with brokerage firms which are affiliates of the investment adviser. Brokerage commissions are included in net realized gain (loss) and change in net unrealized appreciation (depreciation) in the Statement of Operations. The commissions paid to these affiliated firms were $35 for the period.
Interfund Lending Program. Pursuant to an Exemptive Order issued by the SEC, the Fund, along with other registered investment companies having management contracts with FMR or other affiliated entities of FMR, may participate in an interfund lending program. This program provides an alternative credit facility allowing the funds to borrow from, or lend money to, other participating affiliated funds. At period end, there were no interfund loans outstanding. The Fund's activity in this program during the period for which loans were outstanding was as follows:
| Borrower or Lender | Average Loan Balance | Weighted Average Interest Rate | Interest Expense |
| Borrower | $6,354,364 | .60% | $1,158 |
Interfund Trades. The Fund may purchase from or sell securities to other Fidelity Funds under procedures adopted by the Board. The procedures have been designed to ensure these interfund trades are executed in accordance with Rule 17a-7 of the 1940 Act. Interfund trades are included within the respective purchases and sales amounts shown in the Purchases and Sales of Investments note.
6. Committed Line of Credit.
The Fund participates with other funds managed by the investment adviser or an affiliate in a $4.25 billion credit facility (the "line of credit") to be utilized for temporary or emergency purposes to fund shareholder redemptions or for other short-term liquidity purposes. The Fund has agreed to pay commitment fees on its pro-rata portion of the line of credit, which amounted to $1,177 and is reflected in Miscellaneous expenses on the Statement of Operations. During the period, the Fund did not borrow on this line of credit.
7. Security Lending.
The Fund lends portfolio securities through a lending agent from time to time in order to earn additional income. For equity securities, a lending agent is used and may loan securities to certain qualified borrowers, including Fidelity Capital Markets (FCM), a broker-dealer affiliated with the Fund. On the settlement date of the loan, the Fund receives collateral (in the form of U.S. Treasury obligations, letters of credit and/or cash) against the loaned securities and maintains collateral in an amount not less than 100% of the market value of the loaned securities during the period of the loan. The market value of the loaned securities is determined at the close of business of the Fund and any additional required collateral is delivered to the Fund on the next business day. The Fund or borrower may terminate the loan at any time, and if the borrower defaults on its obligation to return the securities loaned because of insolvency or other reasons, the Fund may apply collateral received from the borrower against the obligation. The Fund may experience delays and costs in recovering the securities loaned. Any cash collateral received is invested in the Fidelity Securities Lending Cash Central Fund. The value of loaned securities and cash collateral at period end are disclosed on the Fund's Statement of Assets and Liabilities. Security lending income represents the income earned on investing cash collateral, less rebates paid to borrowers and any lending agent fees associated with the loan, plus any premium payments received for lending certain types of securities. Security lending income is presented in the Statement of Operations as a component of income from Fidelity Central Funds. Total security lending income during the period amounted to $470,655. During the period, there were no securities loaned to FCM.
8. Expense Reductions.
Commissions paid to certain brokers with whom the investment adviser, or its affiliates, places trades on behalf of the Fund include an amount in addition to trade execution, which may be rebated back to the Fund to offset certain expenses. This amount totaled $12,221 for the period.
In addition, during the period the investment adviser reimbursed and/or waived a portion of fund-level operating expenses in the amount of $4,979.
9. Distributions to Shareholders.
Distributions to shareholders of each class were as follows:
| Six months ended April 30, 2016 | Year ended October 31, 2015 | |
| From net investment income | ||
| Class A | $174,443 | $549,660 |
| Class T | 23,347 | 299,142 |
| Class B | – | 18,443 |
| Class C | 38,160 | 108,670 |
| Europe | 15,664,870 | 30,497,764 |
| Class I | 80,861 | 130,017 |
| Total | $15,981,681 | $31,603,696 |
| From net realized gain | ||
| Class A | $94,260 | $– |
| Class T | 39,080 | – |
| Class C | 47,778 | – |
| Europe | 5,676,211 | – |
| Class I | 27,858 | – |
| Total | $5,885,187 | $– |
10. Share Transactions.
Share transactions for each class were as follows and may contain automatic conversions between classes or exchanges between affiliated funds:
| Shares | Shares | Dollars | Dollars | |
| Six months ended April 30, 2016 | Year ended October 31, 2015 | Six months ended April 30, 2016 | Year ended October 31, 2015 | |
| Class A | ||||
| Shares sold | 78,312 | 402,890 | $2,720,240 | $15,313,815 |
| Reinvestment of distributions | 7,044 | 14,493 | 257,822 | 527,143 |
| Shares redeemed | (135,509) | (438,670) | (4,688,764) | (16,388,542) |
| Net increase (decrease) | (50,153) | (21,287) | $(1,710,702) | $(547,584) |
| Class T | ||||
| Shares sold | 10,132 | 101,998 | $350,155 | $3,848,880 |
| Reinvestment of distributions | 1,677 | 8,153 | 61,481 | 296,280 |
| Shares redeemed | (31,208) | (227,511) | (1,080,460) | (8,571,443) |
| Net increase (decrease) | (19,399) | (117,360) | $(668,824) | $(4,426,283) |
| Class B | ||||
| Shares sold | 183 | 7,973 | $6,068 | $306,370 |
| Reinvestment of distributions | – | 481 | – | 17,468 |
| Shares redeemed | (5,404) | (23,568) | (183,746) | (877,823) |
| Net increase (decrease) | (5,221) | (15,114) | $(177,678) | $(553,985) |
| Class C | ||||
| Shares sold | 44,908 | 197,774 | $1,558,483 | $7,494,390 |
| Reinvestment of distributions | 2,232 | 2,632 | 81,438 | 95,708 |
| Shares redeemed | (54,231) | (86,511) | (1,829,878) | (3,194,278) |
| Net increase (decrease) | (7,091) | 113,895 | $(189,957) | $4,395,820 |
| Europe | ||||
| Shares sold | 1,463,207 | 10,168,406 | $50,880,628 | $387,319,779 |
| Reinvestment of distributions | 559,844 | 803,462 | 20,484,708 | 29,241,922 |
| Shares redeemed | (5,291,129) | (7,807,853) | (182,859,606) | (290,372,067) |
| Net increase (decrease) | (3,268,078) | 3,164,015 | $(111,494,270) | $126,189,634 |
| Class I | ||||
| Shares sold | 36,393 | 130,676 | $1,295,144 | $4,946,083 |
| Reinvestment of distributions | 2,803 | 2,526 | 102,586 | 91,940 |
| Shares redeemed | (59,997) | (113,122) | (2,078,607) | (4,289,576) |
| Net increase (decrease) | (20,801) | 20,080 | $(680,877) | $748,447 |
11. Other.
The Fund's organizational documents provide former and current trustees and officers with a limited indemnification against liabilities arising in connection with the performance of their duties to the Fund. In the normal course of business, the Fund may also enter into contracts that provide general indemnifications. The Fund's maximum exposure under these arrangements is unknown as this would be dependent on future claims that may be made against the Fund. The risk of material loss from such claims is considered remote.
Shareholder Expense Example
As a shareholder of the Fund, you incur two types of costs: (1) transaction costs, including sales charges (loads) on purchase payments or redemption proceeds, redemption fees and (2) ongoing costs, including management fees, distribution and/or service (12b-1) fees and other Fund expenses. This Example is intended to help you understand your ongoing costs (in dollars) of investing in the Fund and to compare these costs with the ongoing costs of investing in other mutual funds.
The Example is based on an investment of $1,000 invested at the beginning of the period and held for the entire period (November 1, 2015 to April 30, 2016).
Actual Expenses
The first line of the accompanying table for each class of the Fund provides information about actual account values and actual expenses. You may use the information in this line, together with the amount you invested, to estimate the expenses that you paid over the period. Simply divide your account value by $1,000.00 (for example, an $8,600 account value divided by $1,000.00 = 8.6), then multiply the result by the number in the first line for a class of the Fund under the heading entitled "Expenses Paid During Period" to estimate the expenses you paid on your account during this period. A small balance maintenance fee of $12.00 that is charged once a year may apply for certain accounts with a value of less than $2,000. This fee is not included in the table below. If it was, the estimate of expenses you paid during the period would be higher, and your ending account value lower, by this amount. In addition, the Fund, as a shareholder in the underlying Fidelity Central Funds, will indirectly bear its pro-rata share of the fees and expenses incurred by the underlying Fidelity Central Funds. These fees and expenses are not included in the Fund's annualized expense ratio used to calculate the expense estimate in the table below.
Hypothetical Example for Comparison Purposes
The second line of the accompanying table for each class of the Fund provides information about hypothetical account values and hypothetical expenses based on a Class' actual expense ratio and an assumed rate of return of 5% per year before expenses, which is not the Class' actual return. The hypothetical account values and expenses may not be used to estimate the actual ending account balance or expenses you paid for the period. You may use this information to compare the ongoing costs of investing in the Fund and other funds. To do so, compare this 5% hypothetical example with the 5% hypothetical examples that appear in the shareholder reports of the other funds. A small balance maintenance fee of $12.00 that is charged once a year may apply for certain accounts with a value of less than $2,000. This fee is not included in the table below. If it was, the estimate of expenses you paid during the period would be higher, and your ending account value lower, by this amount. In addition, the Fund, as a shareholder in the underlying Fidelity Central Funds, will indirectly bear its pro-rata share of the fees and expenses incurred by the underlying Fidelity Central Funds. These fees and expenses are not included in the Fund's annualized expense ratio used to calculate the expense estimate in the table below.
Please note that the expenses shown in the table are meant to highlight your ongoing costs only and do not reflect any transaction costs. Therefore, the second line of the table is useful in comparing ongoing costs only, and will not help you determine the relative total costs of owning different funds. In addition, if these transactional costs were included, your costs would have been higher.
| Annualized Expense Ratio-A | Beginning Account Value November 1, 2015 | Ending Account Value April 30, 2016 | Expenses Paid During Period-B November 1, 2015 to April 30, 2016 | |
| Class A | 1.39% | |||
| Actual | $1,000.00 | $980.60 | $6.84 | |
| Hypothetical-C | $1,000.00 | $1,017.95 | $6.97 | |
| Class T | 1.70% | |||
| Actual | $1,000.00 | $979.20 | $8.37 | |
| Hypothetical-C | $1,000.00 | $1,016.41 | $8.52 | |
| Class B | 2.19% | |||
| Actual | $1,000.00 | $976.90 | $10.76 | |
| Hypothetical-C | $1,000.00 | $1,013.97 | $10.97 | |
| Class C | 2.18% | |||
| Actual | $1,000.00 | 976.70 | 10.71 | |
| Hypothetical-C | $1,000.00 | $1,014.02 | $10.92 | |
| Europe | 1.08% | |||
| Actual | $1,000.00 | $982.20 | $5.32 | |
| Hypothetical-C | $1,000.00 | $1,019.49 | $5.42 | |
| Class I | 1.02% | |||
| Actual | $1,000.00 | $982.50 | $5.03 | |
| Hypothetical-C | $1,000.00 | $1,019.79 | $5.12 |
A Annualized expense ratio reflects expenses net of applicable fee waivers.
B Expenses are equal to each Class' annualized expense ratio, multiplied by the average account value over the period, multiplied by 182/366 (to reflect the one-half year period).
C 5% return per year before expenses
![]()
AEUFI-SANN-0616
1.9586004.102
Fidelity Advisor® International Small Cap Opportunities Fund - Semi-Annual Report April 30, 2016 Class A, Class T, Class B and Class C are classes of Fidelity® International Small Cap Opportunities Fund |
|
Contents
To view a fund's proxy voting guidelines and proxy voting record for the 12-month period ended June 30, visit http://www.fidelity.com/proxyvotingresults or visit the Securities and Exchange Commission's (SEC) web site at http://www.sec.gov.
You may also call 1-877-208-0098 to request a free copy of the proxy voting guidelines.
Standard & Poor's, S&P and S&P 500 are registered service marks of The McGraw-Hill Companies, Inc. and have been licensed for use by Fidelity Distributors Corporation.
Other third-party marks appearing herein are the property of their respective owners.
All other marks appearing herein are registered or unregistered trademarks or service marks of FMR LLC or an affiliated company. © 2016 FMR LLC. All rights reserved.
This report and the financial statements contained herein are submitted for the general information of the shareholders of the Fund. This report is not authorized for distribution to prospective investors in the Fund unless preceded or accompanied by an effective prospectus.
A fund files its complete schedule of portfolio holdings with the SEC for the first and third quarters of each fiscal year on Form N-Q. Forms N-Q are available on the SEC’s web site at http://www.sec.gov. A fund's Forms N-Q may be reviewed and copied at the SEC’s Public Reference Room in Washington, DC. Information regarding the operation of the SEC's Public Reference Room may be obtained by calling 1-800-SEC-0330.
For a complete list of a fund's portfolio holdings, view the most recent holdings listing, semiannual report, or annual report on Fidelity's web site at http://www.fidelity.com, http://www.advisor.fidelity.com, or http://www.401k.com, as applicable.
NOT FDIC INSURED •MAY LOSE VALUE •NO BANK GUARANTEE
Neither the Fund nor Fidelity Distributors Corporation is a bank.
Investment Summary (Unaudited)
Geographic Diversification (% of fund's net assets)
| As of April 30, 2016 | ||
| Japan | 25.1% | |
| United Kingdom | 20.5% | |
| United States of America* | 15.5% | |
| Germany | 6.6% | |
| Italy | 3.7% | |
| Sweden | 3.2% | |
| Netherlands | 2.5% | |
| France | 2.2% | |
| Canada | 2.0% | |
| Other | 18.7% | |

* Includes Short-Term investments and Net Other Assets (Liabilities).
Percentages are based on country or territory of incorporation and are adjusted for the effect of futures contracts, if applicable.
| As of October 31, 2015 | ||
| Japan | 26.0% | |
| United Kingdom | 21.7% | |
| United States of America* | 15.0% | |
| Germany | 5.7% | |
| Italy | 4.3% | |
| Sweden | 3.0% | |
| Netherlands | 2.8% | |
| Australia | 2.0% | |
| Canada | 1.9% | |
| Other | 17.6% | |

* Includes Short-Term investments and Net Other Assets (Liabilities).
Percentages are based on country or territory of incorporation and are adjusted for the effect of futures contracts, if applicable.
Asset Allocation as of April 30, 2016
| % of fund's net assets | % of fund's net assets 6 months ago | |
| Stocks | 92.2 | 91.8 |
| Short-Term Investments and Net Other Assets (Liabilities) | 7.8 | 8.2 |
Top Ten Stocks as of April 30, 2016
| % of fund's net assets | % of fund's net assets 6 months ago | |
| USS Co. Ltd. (Japan, Specialty Retail) | 2.0 | 2.0 |
| Spirax-Sarco Engineering PLC (United Kingdom, Machinery) | 1.8 | 1.6 |
| Berendsen PLC (United Kingdom, Commercial Services & Supplies) | 1.7 | 1.7 |
| CTS Eventim AG (Germany, Media) | 1.7 | 2.0 |
| Fagerhult AB (Sweden, Electrical Equipment) | 1.7 | 1.3 |
| Unite Group PLC (United Kingdom, Real Estate Management & Development) | 1.6 | 1.9 |
| CompuGroup Medical AG (Germany, Health Care Technology) | 1.6 | 1.0 |
| OBIC Co. Ltd. (Japan, IT Services) | 1.5 | 1.8 |
| Sartorius AG (non-vtg.) (Germany, Health Care Equipment & Supplies) | 1.4 | 1.6 |
| Azimut Holding SpA (Italy, Capital Markets) | 1.4 | 1.3 |
| 16.4 |
Market Sectors as of April 30, 2016
| % of fund's net assets | % of fund's net assets 6 months ago | |
| Consumer Discretionary | 20.6 | 20.5 |
| Industrials | 18.1 | 18.3 |
| Financials | 15.9 | 18.7 |
| Information Technology | 10.7 | 9.2 |
| Health Care | 10.3 | 8.5 |
| Consumer Staples | 8.5 | 8.5 |
| Materials | 6.7 | 6.7 |
| Energy | 1.4 | 1.4 |
Investments April 30, 2016 (Unaudited)
Showing Percentage of Net Assets
| Common Stocks - 90.8% | |||
| Shares | Value | ||
| Australia - 2.0% | |||
| Beacon Lighting Group Ltd. | 2,000,000 | $2,767,674 | |
| DuluxGroup Ltd. | 1,577,979 | 7,678,825 | |
| Imdex Ltd. (a) | 2,434,488 | 379,468 | |
| RCG Corp. Ltd. (b) | 6,779,148 | 7,061,699 | |
| TFS Corp. Ltd. (b) | 4,354,304 | 5,164,840 | |
| TOTAL AUSTRALIA | 23,052,506 | ||
| Austria - 1.1% | |||
| Andritz AG | 165,900 | 9,291,129 | |
| Zumtobel AG | 316,081 | 4,115,128 | |
| TOTAL AUSTRIA | 13,406,257 | ||
| Bailiwick of Jersey - 0.4% | |||
| Integrated Diagnostics Holdings PLC | 944,579 | 4,392,292 | |
| Belgium - 1.2% | |||
| Gimv NV | 56,688 | 3,148,164 | |
| KBC Ancora | 304,448 | 10,747,590 | |
| TOTAL BELGIUM | 13,895,754 | ||
| Bermuda - 0.3% | |||
| Vostok New Ventures Ltd. SDR (a) | 712,589 | 4,055,229 | |
| Canada - 2.0% | |||
| Cara Operations Ltd. | 282,000 | 7,295,545 | |
| McCoy Global, Inc. | 636,215 | 1,039,484 | |
| New Look Vision Group, Inc. | 197,200 | 4,880,099 | |
| Pason Systems, Inc. | 448,000 | 6,512,728 | |
| ShawCor Ltd. Class A | 135,600 | 3,663,697 | |
| Tesco Corp. | 40,447 | 382,629 | |
| TOTAL CANADA | 23,774,182 | ||
| Cayman Islands - 0.6% | |||
| 58.com, Inc. ADR (a) | 67,900 | 3,710,735 | |
| Value Partners Group Ltd. | 3,938,000 | 3,759,022 | |
| TOTAL CAYMAN ISLANDS | 7,469,757 | ||
| Denmark - 1.6% | |||
| Jyske Bank A/S (Reg.) | 213,127 | 8,725,494 | |
| Scandinavian Tobacco Group A/S | 200,000 | 3,181,685 | |
| Spar Nord Bank A/S | 796,369 | 6,493,770 | |
| TOTAL DENMARK | 18,400,949 | ||
| Finland - 0.6% | |||
| Tikkurila Oyj | 431,646 | 7,567,063 | |
| France - 2.2% | |||
| Elis SA | 380,597 | 6,988,095 | |
| Laurent-Perrier Group SA | 49,163 | 4,179,836 | |
| Vetoquinol SA | 118,184 | 4,898,823 | |
| Virbac SA (b) | 51,152 | 9,330,455 | |
| TOTAL FRANCE | 25,397,209 | ||
| Germany - 5.2% | |||
| alstria office REIT-AG | 448,700 | 6,293,853 | |
| CompuGroup Medical AG | 476,478 | 18,713,776 | |
| CTS Eventim AG | 568,280 | 19,905,189 | |
| Fielmann AG | 151,773 | 11,190,188 | |
| Nexus AG | 278,558 | 4,880,131 | |
| TOTAL GERMANY | 60,983,137 | ||
| Greece - 0.3% | |||
| Titan Cement Co. SA (Reg.) | 139,480 | 3,181,769 | |
| India - 0.5% | |||
| Jyothy Laboratories Ltd. | 1,189,354 | 5,450,307 | |
| Ireland - 1.3% | |||
| FBD Holdings PLC | 240,328 | 1,761,200 | |
| James Hardie Industries PLC: | |||
| CDI | 405,775 | 5,717,080 | |
| sponsored ADR | 564,575 | 7,915,342 | |
| TOTAL IRELAND | 15,393,622 | ||
| Isle of Man - 0.7% | |||
| Playtech Ltd. | 717,342 | 8,432,321 | |
| Israel - 2.0% | |||
| Azrieli Group | 165,005 | 6,553,478 | |
| Ituran Location & Control Ltd. | 383,208 | 7,970,726 | |
| Sarine Technologies Ltd. | 665,700 | 816,749 | |
| Strauss Group Ltd. | 484,244 | 7,673,617 | |
| TOTAL ISRAEL | 23,014,570 | ||
| Italy - 3.7% | |||
| Azimut Holding SpA | 641,097 | 16,135,257 | |
| Banco di Desio e della Brianza SpA | 1,070,000 | 3,016,451 | |
| Beni Stabili SpA SIIQ | 12,945,675 | 9,590,769 | |
| Interpump Group SpA | 1,027,943 | 14,795,470 | |
| TOTAL ITALY | 43,537,947 | ||
| Japan - 25.1% | |||
| Aoki Super Co. Ltd. | 273,000 | 3,225,856 | |
| Artnature, Inc. | 891,000 | 7,387,610 | |
| Asahi Co. Ltd. | 460,400 | 6,828,776 | |
| Autobacs Seven Co. Ltd. | 380,300 | 6,561,433 | |
| Azbil Corp. | 594,000 | 15,241,018 | |
| Broadleaf Co. Ltd. | 76,700 | 757,954 | |
| Central Automotive Products Ltd. (c) | 12,000 | 100,017 | |
| Century21 Real Estate Japan Ltd. (c) | 4,100 | 45,648 | |
| Coca-Cola Central Japan Co. Ltd. | 333,300 | 6,106,357 | |
| Daiichikosho Co. Ltd. | 221,300 | 9,277,286 | |
| Daikokutenbussan Co. Ltd. | 169,100 | 7,599,991 | |
| Funai Soken Holdings, Inc. | 210,000 | 3,186,088 | |
| GCA Savvian Group Corp. | 447,600 | 4,135,967 | |
| Glory Ltd. (d) | 277,100 | 9,075,383 | |
| Goldcrest Co. Ltd. | 522,130 | 7,476,255 | |
| Iwatsuka Confectionary Co. Ltd. | 50,400 | 2,283,383 | |
| Japan Digital Laboratory Co. | 459,100 | 6,210,344 | |
| Kobayashi Pharmaceutical Co. Ltd. | 132,000 | 10,514,151 | |
| Koshidaka Holdings Co. Ltd. | 166,900 | 3,281,884 | |
| Lasertec Corp. | 376,136 | 4,890,217 | |
| Medikit Co. Ltd. (c) | 126,700 | 4,417,152 | |
| Meiko Network Japan Co. Ltd. | 112,600 | 1,241,872 | |
| Miraial Co. Ltd. | 38,200 | 269,148 | |
| Nagaileben Co. Ltd. | 562,600 | 11,480,790 | |
| Nakano Refrigerators Co. Ltd. | 135,000 | 3,229,851 | |
| ND Software Co. Ltd. | 73,843 | 607,845 | |
| Nihon Parkerizing Co. Ltd. | 1,427,500 | 12,591,122 | |
| NS Tool Co. Ltd. (b) | 35,600 | 590,226 | |
| OBIC Co. Ltd. | 336,500 | 17,686,755 | |
| OSG Corp. | 715,000 | 13,287,288 | |
| Paramount Bed Holdings Co. Ltd. | 229,400 | 8,533,414 | |
| ProNexus, Inc. (d) | 569,600 | 5,760,400 | |
| San-Ai Oil Co. Ltd. | 630,000 | 4,415,294 | |
| Seven Bank Ltd. | 2,834,900 | 12,046,080 | |
| SHO-BOND Holdings Co. Ltd. | 263,700 | 11,410,078 | |
| Shoei Co. Ltd. | 309,426 | 4,683,769 | |
| SK Kaken Co. Ltd. | 75,000 | 6,153,866 | |
| Software Service, Inc. | 62,900 | 2,429,462 | |
| Techno Medica Co. Ltd. | 79,491 | 1,666,416 | |
| The Monogatari Corp. | 104,300 | 4,922,928 | |
| The Nippon Synthetic Chemical Industry Co. Ltd. | 391,000 | 2,359,434 | |
| TKC Corp. | 247,400 | 6,721,508 | |
| Tocalo Co. Ltd. | 117,000 | 2,104,645 | |
| Tsutsumi Jewelry Co. Ltd. | 139,000 | 2,903,454 | |
| USS Co. Ltd. | 1,498,300 | 23,700,626 | |
| Workman Co. Ltd. | 212,500 | 6,680,033 | |
| Yamada Consulting Group Co. Ltd. | 134,495 | 4,108,888 | |
| Yamato Kogyo Co. Ltd. | 99,100 | 2,326,325 | |
| TOTAL JAPAN | 292,514,287 | ||
| Korea (South) - 1.4% | |||
| BGFretail Co. Ltd. | 84,156 | 13,662,702 | |
| Leeno Industrial, Inc. | 57,500 | 2,150,588 | |
| TOTAL KOREA (SOUTH) | 15,813,290 | ||
| Mexico - 0.6% | |||
| Consorcio ARA S.A.B. de CV | 17,196,078 | 6,746,637 | |
| Netherlands - 2.5% | |||
| Aalberts Industries NV | 319,501 | 10,946,071 | |
| Heijmans NV (Certificaten Van Aandelen) (a) | 304,192 | 2,866,633 | |
| VastNed Retail NV | 337,390 | 14,854,328 | |
| TOTAL NETHERLANDS | 28,667,032 | ||
| Norway - 0.5% | |||
| Kongsberg Gruppen ASA | 320,500 | 5,373,610 | |
| Philippines - 0.4% | |||
| Jollibee Food Corp. | 1,026,090 | 5,008,829 | |
| South Africa - 0.6% | |||
| Clicks Group Ltd. | 899,913 | 6,572,695 | |
| Spain - 2.0% | |||
| Hispania Activos Inmobiliarios SA (a) | 210,543 | 3,085,853 | |
| Merlin Properties Socimi SA | 613,100 | 7,125,606 | |
| Prosegur Compania de Seguridad SA (Reg.) | 2,317,590 | 13,401,470 | |
| TOTAL SPAIN | 23,612,929 | ||
| Sweden - 3.2% | |||
| Fagerhult AB | 842,305 | 19,614,223 | |
| Intrum Justitia AB (b) | 273,334 | 9,809,520 | |
| Saab AB (B Shares) | 227,500 | 7,782,160 | |
| TOTAL SWEDEN | 37,205,903 | ||
| Switzerland - 0.3% | |||
| Tecan Group AG | 24,053 | 3,339,789 | |
| Taiwan - 0.3% | |||
| Addcn Technology Co. Ltd. | 516,900 | 3,968,399 | |
| United Kingdom - 20.5% | |||
| AA PLC | 1,441,400 | 5,867,599 | |
| Alliance Pharma PLC | 4,253,100 | 2,796,488 | |
| Bellway PLC | 439,872 | 15,727,333 | |
| Berendsen PLC | 1,173,163 | 20,227,172 | |
| Britvic PLC | 543,571 | 5,591,441 | |
| Dechra Pharmaceuticals PLC | 609,609 | 9,851,476 | |
| DP Poland PLC (a)(e) | 8,208,000 | 3,118,211 | |
| Elementis PLC | 3,262,010 | 10,290,411 | |
| Great Portland Estates PLC | 961,189 | 10,645,665 | |
| Hilton Food Group PLC | 222,288 | 1,828,602 | |
| Howden Joinery Group PLC | 1,639,800 | 11,836,209 | |
| Informa PLC | 1,613,965 | 15,434,713 | |
| InterContinental Hotel Group PLC ADR (b) | 216,931 | 8,707,610 | |
| ITE Group PLC | 2,882,634 | 6,539,069 | |
| JUST EAT Ltd. (a) | 819,470 | 4,591,909 | |
| Rightmove PLC | 166,747 | 9,399,723 | |
| Shaftesbury PLC | 1,092,673 | 14,528,688 | |
| Spectris PLC | 557,278 | 14,827,798 | |
| Spirax-Sarco Engineering PLC | 408,791 | 20,397,965 | |
| Taylor Wimpey PLC | 1,686,800 | 4,542,383 | |
| Ted Baker PLC | 233,700 | 8,144,078 | |
| Topps Tiles PLC | 2,473,300 | 4,914,853 | |
| Ultra Electronics Holdings PLC | 392,558 | 10,129,531 | |
| Unite Group PLC | 2,079,823 | 19,221,254 | |
| TOTAL UNITED KINGDOM | 239,160,181 | ||
| United States of America - 7.7% | |||
| ANSYS, Inc. (a) | 36,085 | 3,275,435 | |
| Autoliv, Inc. (b) | 65,200 | 7,985,044 | |
| Broadridge Financial Solutions, Inc. | 93,905 | 5,619,275 | |
| China Biologic Products, Inc. (a) | 110,380 | 12,914,460 | |
| Domino's Pizza, Inc. | 44,000 | 5,318,720 | |
| Energizer Holdings, Inc. | 54,409 | 2,366,247 | |
| Kennedy-Wilson Holdings, Inc. | 556,629 | 12,028,753 | |
| Martin Marietta Materials, Inc. | 34,720 | 5,875,666 | |
| Mohawk Industries, Inc. (a) | 42,600 | 8,206,038 | |
| PriceSmart, Inc. | 147,199 | 12,738,601 | |
| ResMed, Inc. | 86,095 | 4,804,101 | |
| SS&C Technologies Holdings, Inc. | 152,058 | 9,298,347 | |
| TOTAL UNITED STATES OF AMERICA | 90,430,687 | ||
| TOTAL COMMON STOCKS | |||
| (Cost $941,309,093) | 1,059,819,139 | ||
| Nonconvertible Preferred Stocks - 1.4% | |||
| Germany - 1.4% | |||
| Sartorius AG (non-vtg.) | |||
| (Cost $9,231,224) | 65,520 | 16,163,851 | |
| Money Market Funds - 8.5% | |||
| Fidelity Cash Central Fund, 0.38% (f) | 85,942,201 | 85,942,201 | |
| Fidelity Securities Lending Cash Central Fund, 0.42% (f)(g) | 13,328,610 | 13,328,610 | |
| TOTAL MONEY MARKET FUNDS | |||
| (Cost $99,270,811) | 99,270,811 | ||
| TOTAL INVESTMENT PORTFOLIO - 100.7% | |||
| (Cost $1,049,811,128) | 1,175,253,801 | ||
| NET OTHER ASSETS (LIABILITIES) - (0.7)% | (7,959,739) | ||
| NET ASSETS - 100% | $1,167,294,062 |
Categorizations in the Schedule of Investments are based on country or territory of incorporation.
Legend
(a) Non-income producing
(b) Security or a portion of the security is on loan at period end.
(c) Security or a portion of the security purchased on a delayed delivery or when-issued basis.
(d) A portion of the security sold on a delayed delivery basis.
(e) Affiliated company
(f) Affiliated fund that is generally available only to investment companies and other accounts managed by Fidelity Investments. The rate quoted is the annualized seven-day yield of the fund at period end. A complete unaudited listing of the fund's holdings as of its most recent quarter end is available upon request. In addition, each Fidelity Central Fund's financial statements are available on the SEC's website or upon request.
(g) Investment made with cash collateral received from securities on loan.
Affiliated Central Funds
Information regarding fiscal year to date income earned by the Fund from investments in Fidelity Central Funds is as follows:
| Fund | Income earned |
| Fidelity Cash Central Fund | $167,523 |
| Fidelity Securities Lending Cash Central Fund | 77,863 |
| Total | $245,386 |
Other Affiliated Issuers
An affiliated company is a company in which the Fund has ownership of at least 5% of the voting securities. Fiscal year to date transactions with companies which are or were affiliates are as follows:
| Affiliate | Value, beginning of period | Purchases | Sales Proceeds | Dividend Income | Value, end of period |
| DP Poland PLC | $2,507,081 | $321,456 | $-- | $-- | $3,118,211 |
| Total | $2,507,081 | $321,456 | $-- | $-- | $3,118,211 |
Investment Valuation
The following is a summary of the inputs used, as of April 30, 2016, involving the Fund's assets and liabilities carried at fair value. The inputs or methodology used for valuing securities may not be an indication of the risk associated with investing in those securities. For more information on valuation inputs, and their aggregation into the levels used below, please refer to the Investment Valuation section in the accompanying Notes to Financial Statements.
| Valuation Inputs at Reporting Date: | ||||
| Description | Total | Level 1 | Level 2 | Level 3 |
| Investments in Securities: | ||||
| Equities: | ||||
| Consumer Discretionary | $241,379,798 | $171,197,720 | $70,182,078 | $-- |
| Consumer Staples | 97,181,396 | 60,064,048 | 37,117,348 | -- |
| Energy | 16,013,832 | 11,598,538 | 4,415,294 | -- |
| Financials | 188,656,059 | 161,193,087 | 27,462,972 | -- |
| Health Care | 121,220,721 | 92,085,642 | 29,135,079 | -- |
| Industrials | 209,307,773 | 156,554,926 | 52,752,847 | -- |
| Information Technology | 125,022,200 | 73,245,256 | 51,776,944 | -- |
| Materials | 77,201,211 | 50,588,695 | 26,612,516 | -- |
| Money Market Funds | 99,270,811 | 99,270,811 | -- | -- |
| Total Investments in Securities: | $1,175,253,801 | $875,798,723 | $299,455,078 | $-- |
The following is a summary of transfers between Level 1 and Level 2 for the period ended April 30, 2016. Transfers are assumed to have occurred at the beginning of the period, and are primarily attributable to the valuation techniques used for foreign equity securities, as discussed in the accompanying Notes to Financial Statements:
| Transfers | Total |
| Level 1 to Level 2 | $3,963,761 |
| Level 2 to Level 1 | $28,474,370 |
See accompanying notes which are an integral part of the financial statements.
Financial Statements
Statement of Assets and Liabilities
| April 30, 2016 (Unaudited) | ||
| Assets | ||
| Investment in securities, at value (including securities loaned of $13,034,826) — See accompanying schedule: Unaffiliated issuers (cost $948,419,765) | $1,072,864,779 | |
| Fidelity Central Funds (cost $99,270,811) | 99,270,811 | |
| Other affiliated issuers (cost $2,120,552) | 3,118,211 | |
| Total Investments (cost $1,049,811,128) | $1,175,253,801 | |
| Receivable for investments sold | ||
| Regular delivery | 759,807 | |
| Delayed delivery | 139,587 | |
| Receivable for fund shares sold | 1,947,400 | |
| Dividends receivable | 5,382,395 | |
| Distributions receivable from Fidelity Central Funds | 62,435 | |
| Prepaid expenses | 498 | |
| Other receivables | 2,840 | |
| Total assets | 1,183,548,763 | |
| Liabilities | ||
| Payable to custodian bank | $27,592 | |
| Payable for investments purchased | ||
| Regular delivery | 62,835 | |
| Delayed delivery | 30,608 | |
| Payable for fund shares redeemed | 1,639,204 | |
| Accrued management fee | 826,592 | |
| Distribution and service plan fees payable | 30,380 | |
| Other affiliated payables | 242,791 | |
| Other payables and accrued expenses | 66,089 | |
| Collateral on securities loaned, at value | 13,328,610 | |
| Total liabilities | 16,254,701 | |
| Net Assets | $1,167,294,062 | |
| Net Assets consist of: | ||
| Paid in capital | $1,286,497,613 | |
| Undistributed net investment income | 3,446,654 | |
| Accumulated undistributed net realized gain (loss) on investments and foreign currency transactions | (248,244,637) | |
| Net unrealized appreciation (depreciation) on investments and assets and liabilities in foreign currencies | 125,594,432 | |
| Net Assets | $1,167,294,062 | |
| Calculation of Maximum Offering Price | ||
| Class A: | ||
| Net Asset Value and redemption price per share ($50,512,499 ÷ 3,421,332 shares) | $14.76 | |
| Maximum offering price per share (100/94.25 of $14.76) | $15.66 | |
| Class T: | ||
| Net Asset Value and redemption price per share ($13,820,005 ÷ 943,286 shares) | $14.65 | |
| Maximum offering price per share (100/96.50 of $14.65) | $15.18 | |
| Class B: | ||
| Net Asset Value and offering price per share ($354,955 ÷ 24,616 shares)(a) | $14.42 | |
| Class C: | ||
| Net Asset Value and offering price per share ($16,766,047 ÷ 1,174,289 shares)(a) | $14.28 | |
| International Small Cap Opportunities: | ||
| Net Asset Value, offering price and redemption price per share ($943,035,473 ÷ 63,201,820 shares) | $14.92 | |
| Class I: | ||
| Net Asset Value, offering price and redemption price per share ($142,805,083 ÷ 9,576,371 shares) | $14.91 |
(a) Redemption price per share is equal to net asset value less any applicable contingent deferred sales charge.
See accompanying notes which are an integral part of the financial statements.
Statement of Operations
| Six months ended April 30, 2016 (Unaudited) | ||
| Investment Income | ||
| Dividends | $10,624,721 | |
| Income from Fidelity Central Funds | 245,386 | |
| Income before foreign taxes withheld | 10,870,107 | |
| Less foreign taxes withheld | (928,950) | |
| Total income | 9,941,157 | |
| Expenses | ||
| Management fee | ||
| Basic fee | $4,515,535 | |
| Performance adjustment | 205,580 | |
| Transfer agent fees | 1,169,397 | |
| Distribution and service plan fees | 178,936 | |
| Accounting and security lending fees | 247,112 | |
| Custodian fees and expenses | 97,381 | |
| Independent trustees' compensation | 2,222 | |
| Registration fees | 58,793 | |
| Audit | 45,289 | |
| Legal | 1,350 | |
| Miscellaneous | 2,905 | |
| Total expenses before reductions | 6,524,500 | |
| Expense reductions | (4,405) | 6,520,095 |
| Net investment income (loss) | 3,421,062 | |
| Realized and Unrealized Gain (Loss) | ||
| Net realized gain (loss) on: | ||
| Investment securities: | ||
| Unaffiliated issuers | 13,404,515 | |
| Foreign currency transactions | 1,988 | |
| Total net realized gain (loss) | 13,406,503 | |
| Change in net unrealized appreciation (depreciation) on: Investment securities | (4,093,560) | |
| Assets and liabilities in foreign currencies | 188,590 | |
| Total change in net unrealized appreciation (depreciation) | (3,904,970) | |
| Net gain (loss) | 9,501,533 | |
| Net increase (decrease) in net assets resulting from operations | $12,922,595 |
See accompanying notes which are an integral part of the financial statements.
Statement of Changes in Net Assets
| Six months ended April 30, 2016 (Unaudited) | Year ended October 31, 2015 | |
| Increase (Decrease) in Net Assets | ||
| Operations | ||
| Net investment income (loss) | $3,421,062 | $4,880,273 |
| Net realized gain (loss) | 13,406,503 | 32,155,951 |
| Change in net unrealized appreciation (depreciation) | (3,904,970) | 15,708,708 |
| Net increase (decrease) in net assets resulting from operations | 12,922,595 | 52,744,932 |
| Distributions to shareholders from net investment income | (4,852,691) | (3,982,311) |
| Distributions to shareholders from net realized gain | (4,655,673) | (949,656) |
| Total distributions | (9,508,364) | (4,931,967) |
| Share transactions - net increase (decrease) | 206,876,426 | 250,623,581 |
| Redemption fees | 159,056 | 196,651 |
| Total increase (decrease) in net assets | 210,449,713 | 298,633,197 |
| Net Assets | ||
| Beginning of period | 956,844,349 | 658,211,152 |
| End of period (including undistributed net investment income of $3,446,654 and undistributed net investment income of $4,878,283, respectively) | $1,167,294,062 | $956,844,349 |
See accompanying notes which are an integral part of the financial statements.
Financial Highlights — Fidelity International Small Cap Opportunities Fund Class A
| Six months ended (Unaudited) April 30, | Years ended October 31, | |||||
| 2016 | 2015 | 2014 | 2013 | 2012 | 2011 | |
| Selected Per–Share Data | ||||||
| Net asset value, beginning of period | $14.75 | $13.65 | $13.68 | $10.78 | $9.75 | $9.82 |
| Income from Investment Operations | ||||||
| Net investment income (loss)A | .03 | .06 | .05 | .07 | .08 | .15B |
| Net realized and unrealized gain (loss) | .10 | 1.11 | .05 | 2.91 | 1.07 | (.07) |
| Total from investment operations | .13 | 1.17 | .10 | 2.98 | 1.15 | .08 |
| Distributions from net investment income | (.05) | (.05) | (.06) | (.08) | (.11) | (.11) |
| Distributions from net realized gain | (.07) | (.02) | (.08) | (.01) | (.01) | (.04) |
| Total distributions | (.12) | (.07) | (.13)C | (.08)D | (.12) | (.15) |
| Redemption fees added to paid in capitalA,E | – | – | – | – | – | – |
| Net asset value, end of period | $14.76 | $14.75 | $13.65 | $13.68 | $10.78 | $9.75 |
| Total ReturnF,G,H | .89% | 8.62% | .78% | 27.85% | 12.00% | .81% |
| Ratios to Average Net AssetsI,J | ||||||
| Expenses before reductions | 1.47%K | 1.52% | 1.63% | 1.70% | 1.75% | 1.34% |
| Expenses net of fee waivers, if any | 1.47%K | 1.52% | 1.63% | 1.65% | 1.65% | 1.33% |
| Expenses net of all reductions | 1.47%K | 1.51% | 1.63% | 1.64% | 1.64% | 1.32% |
| Net investment income (loss) | .40%K | .38% | .33% | .59% | .85% | 1.44%B |
| Supplemental Data | ||||||
| Net assets, end of period (000 omitted) | $50,512 | $42,289 | $25,041 | $22,052 | $18,194 | $18,686 |
| Portfolio turnover rateL | 19%K | 21% | 18% | 31% | 28% | 24% |
A Calculated based on average shares outstanding during the period.
B Net Investment income per share reflects a large, non-recurring dividend which amounted to $.06 per share. Excluding this non-recurring dividend, the ratio of net investment income (loss) to average net assets would have been .80%.
C Total distributions of $.13 per share is comprised of distributions from net investment income of $.055 and distributions from net realized gain of $.079 per share.
D Total distributions of $.08 per share is comprised of distributions from net investment income of $.077 and distributions from net realized gain of $.005 per share.
E Amount represents less than $.005 per share.
F Total returns for periods of less than one year are not annualized.
G Total returns would have been lower if certain expenses had not been reduced during the applicable periods shown.
H Total returns do not include the effect of the sales charges.
I Fees and expenses of any underlying Fidelity Central Funds are not included in the Fund's expense ratio. The Fund indirectly bears its proportionate share of the expenses of any underlying Fidelity Central Funds.
J Expense ratios reflect operating expenses of the class. Expenses before reductions do not reflect amounts reimbursed by the investment adviser or reductions from brokerage service arrangements or reductions from other expense offset arrangements and do not represent the amount paid by the class during periods when reimbursements or reductions occur. Expenses net of fee waivers reflect expenses after reimbursement by the investment adviser but prior to reductions from brokerage service arrangements or other expense offset arrangements. Expenses net of all reductions represent the net expenses paid by the class.
K Annualized
L Amount does not include the portfolio activity of any underlying Fidelity Central Funds.
See accompanying notes which are an integral part of the financial statements.
Financial Highlights — Fidelity International Small Cap Opportunities Fund Class T
| Six months ended (Unaudited) April 30, | Years ended October 31, | |||||
| 2016 | 2015 | 2014 | 2013 | 2012 | 2011 | |
| Selected Per–Share Data | ||||||
| Net asset value, beginning of period | $14.62 | $13.53 | $13.56 | $10.69 | $9.66 | $9.72 |
| Income from Investment Operations | ||||||
| Net investment income (loss)A | .01 | .01 | .01 | .04 | .06 | .12B |
| Net realized and unrealized gain (loss) | .10 | 1.11 | .06 | 2.89 | 1.06 | (.06) |
| Total from investment operations | .11 | 1.12 | .07 | 2.93 | 1.12 | .06 |
| Distributions from net investment income | (.01) | (.01) | (.02) | (.05) | (.08) | (.08) |
| Distributions from net realized gain | (.07) | (.02) | (.08) | (.01) | (.01) | (.04) |
| Total distributions | (.08) | (.03) | (.10) | (.06) | (.09) | (.12) |
| Redemption fees added to paid in capitalA,C | – | – | – | – | – | – |
| Net asset value, end of period | $14.65 | $14.62 | $13.53 | $13.56 | $10.69 | $9.66 |
| Total ReturnD,E,F | .75% | 8.27% | .55% | 27.53% | 11.72% | .60% |
| Ratios to Average Net AssetsG,H | ||||||
| Expenses before reductions | 1.79%I | 1.80% | 1.89% | 1.96% | 2.02% | 1.60% |
| Expenses net of fee waivers, if any | 1.78%I | 1.80% | 1.89% | 1.90% | 1.90% | 1.60% |
| Expenses net of all reductions | 1.78%I | 1.80% | 1.89% | 1.89% | 1.89% | 1.59% |
| Net investment income (loss) | .08%I | .10% | .07% | .34% | .60% | 1.17%B |
| Supplemental Data | ||||||
| Net assets, end of period (000 omitted) | $13,820 | $13,296 | $9,913 | $9,634 | $8,169 | $8,701 |
| Portfolio turnover rateJ | 19%I | 21% | 18% | 31% | 28% | 24% |
A Calculated based on average shares outstanding during the period.
B Net Investment income per share reflects a large, non-recurring dividend which amounted to $.06 per share. Excluding this non-recurring dividend, the ratio of net investment income (loss) to average net assets would have been .54%.
C Amount represents less than $.005 per share.
D Total returns for periods of less than one year are not annualized.
E Total returns would have been lower if certain expenses had not been reduced during the applicable periods shown.
F Total returns do not include the effect of the sales charges.
G Fees and expenses of any underlying Fidelity Central Funds are not included in the Fund's expense ratio. The Fund indirectly bears its proportionate share of the expenses of any underlying Fidelity Central Funds.
H Expense ratios reflect operating expenses of the class. Expenses before reductions do not reflect amounts reimbursed by the investment adviser or reductions from brokerage service arrangements or reductions from other expense offset arrangements and do not represent the amount paid by the class during periods when reimbursements or reductions occur. Expenses net of fee waivers reflect expenses after reimbursement by the investment adviser but prior to reductions from brokerage service arrangements or other expense offset arrangements. Expenses net of all reductions represent the net expenses paid by the class.
I Annualized
J Amount does not include the portfolio activity of any underlying Fidelity Central Funds.
See accompanying notes which are an integral part of the financial statements.
Financial Highlights — Fidelity International Small Cap Opportunities Fund Class B
| Six months ended (Unaudited) April 30, | Years ended October 31, | |||||
| 2016 | 2015 | 2014 | 2013 | 2012 | 2011 | |
| Selected Per–Share Data | ||||||
| Net asset value, beginning of period | $14.35 | $13.31 | $13.31 | $10.50 | $9.48 | $9.54 |
| Income from Investment Operations | ||||||
| Net investment income (loss)A | (.03) | (.06) | (.06) | (.02) | .01 | .07B |
| Net realized and unrealized gain (loss) | .10 | 1.10 | .06 | 2.84 | 1.05 | (.06) |
| Total from investment operations | .07 | 1.04 | – | 2.82 | 1.06 | .01 |
| Distributions from net investment income | – | – | – | –C | (.03) | (.06) |
| Distributions from net realized gain | – | – | – | (.01) | (.01) | (.02) |
| Total distributions | – | – | – | (.01) | (.04) | (.07)D |
| Redemption fees added to paid in capitalA,C | – | – | – | – | – | – |
| Net asset value, end of period | $14.42 | $14.35 | $13.31 | $13.31 | $10.50 | $9.48 |
| Total ReturnE,F,G | .49% | 7.81% | -% | 26.86% | 11.21% | .10% |
| Ratios to Average Net AssetsH,I | ||||||
| Expenses before reductions | 2.28%J | 2.30% | 2.38% | 2.46% | 2.50% | 2.09% |
| Expenses net of fee waivers, if any | 2.28%J | 2.30% | 2.38% | 2.40% | 2.40% | 2.09% |
| Expenses net of all reductions | 2.28%J | 2.29% | 2.38% | 2.39% | 2.39% | 2.07% |
| Net investment income (loss) | (.41)%J | (.39)% | (.43)% | (.16)% | .10% | .68%B |
| Supplemental Data | ||||||
| Net assets, end of period (000 omitted) | $355 | $604 | $744 | $1,410 | $1,966 | $2,293 |
| Portfolio turnover rateK | 19%J | 21% | 18% | 31% | 28% | 24% |
A Calculated based on average shares outstanding during the period.
B Net Investment income per share reflects a large, non-recurring dividend which amounted to $.06 per share. Excluding this non-recurring dividend, the ratio of net investment income (loss) to average net assets would have been .05%.
C Amount represents less than $.005 per share.
D Total distributions of $.07 per share is comprised of distributions from net investment income of $.058 and distributions from net realized gain of $.015 per share.
E Total returns for periods of less than one year are not annualized.
F Total returns would have been lower if certain expenses had not been reduced during the applicable periods shown.
G Total returns do not include the effect of the contingent deferred sales charge.
H Fees and expenses of any underlying Fidelity Central Funds are not included in the Fund's expense ratio. The Fund indirectly bears its proportionate share of the expenses of any underlying Fidelity Central Funds.
I Expense ratios reflect operating expenses of the class. Expenses before reductions do not reflect amounts reimbursed by the investment adviser or reductions from brokerage service arrangements or reductions from other expense offset arrangements and do not represent the amount paid by the class during periods when reimbursements or reductions occur. Expenses net of fee waivers reflect expenses after reimbursement by the investment adviser but prior to reductions from brokerage service arrangements or other expense offset arrangements. Expenses net of all reductions represent the net expenses paid by the class.
J Annualized
K Amount does not include the portfolio activity of any underlying Fidelity Central Funds.
See accompanying notes which are an integral part of the financial statements.
Financial Highlights — Fidelity International Small Cap Opportunities Fund Class C
| Six months ended (Unaudited) April 30, | Years ended October 31, | |||||
| 2016 | 2015 | 2014 | 2013 | 2012 | 2011 | |
| Selected Per–Share Data | ||||||
| Net asset value, beginning of period | $14.26 | $13.23 | $13.28 | $10.48 | $9.47 | $9.53 |
| Income from Investment Operations | ||||||
| Net investment income (loss)A | (.03) | (.05) | (.06) | (.02) | .01 | .07B |
| Net realized and unrealized gain (loss) | .10 | 1.08 | .06 | 2.84 | 1.04 | (.06) |
| Total from investment operations | .07 | 1.03 | – | 2.82 | 1.05 | .01 |
| Distributions from net investment income | – | – | – | (.01) | (.03) | (.06) |
| Distributions from net realized gain | (.05) | – | (.05) | (.01) | (.01) | (.02) |
| Total distributions | (.05) | – | (.05) | (.02) | (.04) | (.07)C |
| Redemption fees added to paid in capitalA,D | – | – | – | – | – | – |
| Net asset value, end of period | $14.28 | $14.26 | $13.23 | $13.28 | $10.48 | $9.47 |
| Total ReturnE,F,G | .51% | 7.79% | .03% | 26.91% | 11.13% | .10% |
| Ratios to Average Net AssetsH,I | ||||||
| Expenses before reductions | 2.27%J | 2.27% | 2.38% | 2.45% | 2.50% | 2.09% |
| Expenses net of fee waivers, if any | 2.27%J | 2.27% | 2.38% | 2.40% | 2.40% | 2.09% |
| Expenses net of all reductions | 2.27%J | 2.26% | 2.38% | 2.39% | 2.39% | 2.07% |
| Net investment income (loss) | (.40)%J | (.36)% | (.42)% | (.16)% | .10% | .68%B |
| Supplemental Data | ||||||
| Net assets, end of period (000 omitted) | $16,766 | $17,370 | $8,438 | $8,070 | $6,608 | $6,900 |
| Portfolio turnover rateK | 19%J | 21% | 18% | 31% | 28% | 24% |
A Calculated based on average shares outstanding during the period.
B Net Investment income per share reflects a large, non-recurring dividend which amounted to $.06 per share. Excluding this non-recurring dividend, the ratio of net investment income (loss) to average net assets would have been .05%.
C Total distributions of $.07 per share is comprised of distributions from net investment income of $.058 and distributions from net realized gain of $.015 per share.
D Amount represents less than $.005 per share.
E Total returns for periods of less than one year are not annualized.
F Total returns would have been lower if certain expenses had not been reduced during the applicable periods shown.
G Total returns do not include the effect of the contingent deferred sales charge.
H Fees and expenses of any underlying Fidelity Central Funds are not included in the Fund's expense ratio. The Fund indirectly bears its proportionate share of the expenses of any underlying Fidelity Central Funds.
I Expense ratios reflect operating expenses of the class. Expenses before reductions do not reflect amounts reimbursed by the investment adviser or reductions from brokerage service arrangements or reductions from other expense offset arrangements and do not represent the amount paid by the class during periods when reimbursements or reductions occur. Expenses net of fee waivers reflect expenses after reimbursement by the investment adviser but prior to reductions from brokerage service arrangements or other expense offset arrangements. Expenses net of all reductions represent the net expenses paid by the class.
J Annualized
K Amount does not include the portfolio activity of any underlying Fidelity Central Funds.
See accompanying notes which are an integral part of the financial statements.
Financial Highlights — Fidelity International Small Cap Opportunities Fund
| Six months ended (Unaudited) April 30, | Years ended October 31, | |||||
| 2016 | 2015 | 2014 | 2013 | 2012 | 2011 | |
| Selected Per–Share Data | ||||||
| Net asset value, beginning of period | $14.91 | $13.80 | $13.82 | $10.88 | $9.85 | $9.92 |
| Income from Investment Operations | ||||||
| Net investment income (loss)A | .05 | .10 | .09 | .10 | .11 | .17B |
| Net realized and unrealized gain (loss) | .11 | 1.12 | .06 | 2.95 | 1.07 | (.06) |
| Total from investment operations | .16 | 1.22 | .15 | 3.05 | 1.18 | .11 |
| Distributions from net investment income | (.08) | (.09) | (.09) | (.10) | (.14) | (.14) |
| Distributions from net realized gain | (.07) | (.02) | (.08) | (.01) | (.01) | (.04) |
| Total distributions | (.15) | (.11) | (.17) | (.11) | (.15) | (.18) |
| Redemption fees added to paid in capitalA,C | – | – | – | – | – | – |
| Net asset value, end of period | $14.92 | $14.91 | $13.80 | $13.82 | $10.88 | $9.85 |
| Total ReturnD,E | 1.03% | 8.92% | 1.11% | 28.24% | 12.21% | 1.10% |
| Ratios to Average Net AssetsF,G | ||||||
| Expenses before reductions | 1.19%H | 1.23% | 1.30% | 1.39% | 1.47% | 1.08% |
| Expenses net of fee waivers, if any | 1.19%H | 1.22% | 1.30% | 1.39% | 1.40% | 1.08% |
| Expenses net of all reductions | 1.19%H | 1.22% | 1.30% | 1.38% | 1.39% | 1.06% |
| Net investment income (loss) | .68%H | .68% | .65% | .85% | 1.10% | 1.69%B |
| Supplemental Data | ||||||
| Net assets, end of period (000 omitted) | $943,035 | $762,563 | $584,253 | $518,121 | $334,918 | $328,262 |
| Portfolio turnover rateI | 19%H | 21% | 18% | 31% | 28% | 24% |
A Calculated based on average shares outstanding during the period.
B Net Investment income per share reflects a large, non-recurring dividend which amounted to $.07 per share. Excluding this non-recurring dividend, the ratio of net investment income (loss) to average net assets would have been 1.06%.
C Amount represents less than $.005 per share.
D Total returns for periods of less than one year are not annualized.
E Total returns would have been lower if certain expenses had not been reduced during the applicable periods shown.
F Fees and expenses of any underlying Fidelity Central Funds are not included in the Fund's expense ratio. The Fund indirectly bears its proportionate share of the expenses of any underlying Fidelity Central Funds.
G Expense ratios reflect operating expenses of the class. Expenses before reductions do not reflect amounts reimbursed by the investment adviser or reductions from brokerage service arrangements or reductions from other expense offset arrangements and do not represent the amount paid by the class during periods when reimbursements or reductions occur. Expenses net of fee waivers reflect expenses after reimbursement by the investment adviser but prior to reductions from brokerage service arrangements or other expense offset arrangements. Expenses net of all reductions represent the net expenses paid by the class.
H Annualized
I Amount does not include the portfolio activity of any underlying Fidelity Central Funds.
See accompanying notes which are an integral part of the financial statements.
Financial Highlights — Fidelity International Small Cap Opportunities Fund Class I
| Six months ended (Unaudited) April 30, | Years ended October 31, | |||||
| 2016 | 2015 | 2014 | 2013 | 2012 | 2011 | |
| Selected Per–Share Data | ||||||
| Net asset value, beginning of period | $14.91 | $13.81 | $13.83 | $10.90 | $9.86 | $9.93 |
| Income from Investment Operations | ||||||
| Net investment income (loss)A | .05 | .10 | .08 | .11 | .11 | .18B |
| Net realized and unrealized gain (loss) | .10 | 1.13 | .07 | 2.93 | 1.08 | (.06) |
| Total from investment operations | .15 | 1.23 | .15 | 3.04 | 1.19 | .12 |
| Distributions from net investment income | (.08) | (.11) | (.09) | (.10) | (.14) | (.15) |
| Distributions from net realized gain | (.07) | (.02) | (.08) | (.01) | (.01) | (.04) |
| Total distributions | (.15) | (.13) | (.17) | (.11) | (.15) | (.19) |
| Redemption fees added to paid in capitalA,C | – | – | – | – | – | – |
| Net asset value, end of period | $14.91 | $14.91 | $13.81 | $13.83 | $10.90 | $9.86 |
| Total ReturnD,E | 1.02% | 8.98% | 1.11% | 28.11% | 12.32% | 1.13% |
| Ratios to Average Net AssetsF,G | ||||||
| Expenses before reductions | 1.17%H | 1.19% | 1.36% | 1.38% | 1.44% | 1.03% |
| Expenses net of fee waivers, if any | 1.17%H | 1.19% | 1.36% | 1.37% | 1.40% | 1.03% |
| Expenses net of all reductions | 1.17%H | 1.18% | 1.36% | 1.37% | 1.39% | 1.02% |
| Net investment income (loss) | .69%H | .71% | .60% | .87% | 1.10% | 1.74%B |
| Supplemental Data | ||||||
| Net assets, end of period (000 omitted) | $142,805 | $120,723 | $29,822 | $5,670 | $4,591 | $1,395 |
| Portfolio turnover rateI | 19%H | 21% | 18% | 31% | 28% | 24% |
A Calculated based on average shares outstanding during the period.
B Net Investment income per share reflects a large, non-recurring dividend which amounted to $.07 per share. Excluding this non-recurring dividend, the ratio of net investment income (loss) to average net assets would have been 1.11%.
C Amount represents less than $.005 per share.
D Total returns for periods of less than one year are not annualized.
E Total returns would have been lower if certain expenses had not been reduced during the applicable periods shown.
F Fees and expenses of any underlying Fidelity Central Funds are not included in the Fund's expense ratio. The Fund indirectly bears its proportionate share of the expenses of any underlying Fidelity Central Funds.
G Expense ratios reflect operating expenses of the class. Expenses before reductions do not reflect amounts reimbursed by the investment adviser or reductions from brokerage service arrangements or reductions from other expense offset arrangements and do not represent the amount paid by the class during periods when reimbursements or reductions occur. Expenses net of fee waivers reflect expenses after reimbursement by the investment adviser but prior to reductions from brokerage service arrangements or other expense offset arrangements. Expenses net of all reductions represent the net expenses paid by the class.
H Annualized
I Amount does not include the portfolio activity of any underlying Fidelity Central Funds.
See accompanying notes which are an integral part of the financial statements.
Notes to Financial Statements (Unaudited)
For the period ended April 30, 2016
1. Organization.
Fidelity International Small Cap Opportunities Fund (the Fund) is a fund of Fidelity Investment Trust (the Trust) and is authorized to issue an unlimited number of shares. The Trust is registered under the Investment Company Act of 1940, as amended (the 1940 Act), as an open-end management investment company organized as a Massachusetts business trust. The Fund offers Class A, Class T, Class C, International Small Cap Opportunities and Class I shares, each of which, along with Class B shares, has equal rights as to assets and voting privileges. Class B shares are closed to new accounts and additional purchases, except for exchanges and reinvestments. Each class has exclusive voting rights with respect to matters that affect that class. Class B shares will automatically convert to Class A shares after a maximum holding period of seven years from the initial date of purchase.
During the period, the Board of Trustees approved the conversion of all existing Class B shares into Class A shares, effective on or about July 1, 2016, regardless of the length of times shares have been held.
2. Investments in Fidelity Central Funds.
The Fund invests in Fidelity Central Funds, which are open-end investment companies generally available only to other investment companies and accounts managed by the investment adviser and its affiliates. The Fund's Schedule of Investments lists each of the Fidelity Central Funds held as of period end, if any, as an investment of the Fund, but does not include the underlying holdings of each Fidelity Central Fund. As an Investing Fund, the Fund indirectly bears its proportionate share of the expenses of the underlying Fidelity Central Funds.
The Money Market Central Funds seek preservation of capital and current income and are managed by Fidelity Investments Money Management, Inc. (FIMM), an affiliate of the investment adviser. Annualized expenses of the Money Market Central Funds as of their most recent shareholder report date are less than .005%.
A complete unaudited list of holdings for each Fidelity Central Fund is available upon request or at the Securities and Exchange Commission (the SEC) website at www.sec.gov. In addition, the financial statements of the Fidelity Central Funds are available on the SEC website or upon request.
3. Significant Accounting Policies.
The financial statements have been prepared in conformity with accounting principles generally accepted in the United States of America (GAAP), which require management to make certain estimates and assumptions at the date of the financial statements. Actual results could differ from those estimates. Subsequent events, if any, through the date that the financial statements were issued have been evaluated in the preparation of the financial statements. The following summarizes the significant accounting policies of the Fund:
Investment Valuation. Investments are valued as of 4:00 p.m. Eastern time on the last calendar day of the period. The Board of Trustees (the Board) has delegated the day to day responsibility for the valuation of the Fund's investments to the Fidelity Management & Research Company (FMR)Fair Value Committee (the Committee). In accordance with valuation policies and procedures approved by the Board, the Fund attempts to obtain prices from one or more third party pricing vendors or brokers to value its investments. When current market prices, quotations or currency exchange rates are not readily available or reliable, investments will be fair valued in good faith by the Committee, in accordance with procedures adopted by the Board. Factors used in determining fair value vary by investment type and may include market or investment specific events. The frequency with which these procedures are used cannot be predicted and they may be utilized to a significant extent. The Committee oversees the Fund's valuation policies and procedures and reports to the Board on the Committee's activities and fair value determinations. The Board monitors the appropriateness of the procedures used in valuing the Fund's investments and ratifies the fair value determinations of the Committee.
The Fund categorizes the inputs to valuation techniques used to value its investments into a disclosure hierarchy consisting of three levels as shown below:
- Level 1 – quoted prices in active markets for identical investments
- Level 2 – other significant observable inputs (including quoted prices for similar investments, interest rates, prepayment speeds, etc.)
- Level 3 – unobservable inputs (including the Fund's own assumptions based on the best information available)
Valuation techniques used to value the Fund's investments by major category are as follows:
Equity securities, including restricted securities, for which market quotations are readily available, are valued at the last reported sale price or official closing price as reported by a third party pricing vendor on the primary market or exchange on which they are traded and are categorized as Level 1 in the hierarchy. In the event there were no sales during the day or closing prices are not available, securities are valued at the last quoted bid price or may be valued using the last available price and are generally categorized as Level 2 in the hierarchy. For foreign equity securities, when market or security specific events arise, comparisons to the valuation of American Depositary Receipts (ADRs), futures contracts, Exchange-Traded Funds (ETFs) and certain indexes as well as quoted prices for similar securities may be used and would be categorized as Level 2 in the hierarchy. Utilizing these techniques may result in transfers between Level 1 and Level 2. For equity securities, including restricted securities, where observable inputs are limited, assumptions about market activity and risk are used and these securities may be categorized as Level 3 in the hierarchy.
Investments in open-end mutual funds, including the Fidelity Central Funds, are valued at their closing net asset value (NAV) each business day and are categorized as Level 1 in the hierarchy.
Changes in valuation techniques may result in transfers in or out of an assigned level within the disclosure hierarchy. The aggregate value of investments by input level as of April 30, 2016, including information on transfers between Levels 1 and 2 is included at the end of the Fund's Schedule of Investments.
Foreign Currency. The Fund may use foreign currency contracts to facilitate transactions in foreign-denominated securities. Gains and losses from these transactions may arise from changes in the value of the foreign currency or if the counterparties do not perform under the contracts' terms.
Foreign-denominated assets, including investment securities, and liabilities are translated into U.S. dollars at the exchange rates at period end. Purchases and sales of investment securities, income and dividends received and expenses denominated in foreign currencies are translated into U.S. dollars at the exchange rate in effect on the transaction date.
The effects of exchange rate fluctuations on investments are included with the net realized and unrealized gain (loss) on investment securities. Other foreign currency transactions resulting in realized and unrealized gain (loss) are disclosed separately.
Investment Transactions and Income. For financial reporting purposes, the Fund's investment holdings and NAV include trades executed through the end of the last business day of the period. The NAV per share for processing shareholder transactions is calculated as of the close of business of the New York Stock Exchange (NYSE), normally 4:00 p.m. Eastern time and includes trades executed through the end of the prior business day. Gains and losses on securities sold are determined on the basis of identified cost. Dividend income is recorded on the ex-dividend date, except for certain dividends from foreign securities where the ex-dividend date may have passed, which are recorded as soon as the Fund is informed of the ex-dividend date. Non-cash dividends included in dividend income, if any, are recorded at the fair market value of the securities received. Income and capital gain distributions from Fidelity Central Funds, if any, are recorded on the ex-dividend date. Distributions received on securities that represent a return of capital or capital gain are recorded as a reduction of cost of investments and/or as a realized gain. Subsequent to ex-dividend date the Fund determines the components of these distributions, based upon receipt of tax filings or other correspondence relating to the underlying investment. Investment income is recorded net of foreign taxes withheld where recovery of such taxes is uncertain.
Class Allocations and Expenses. Investment income, realized and unrealized capital gains and losses, common expenses of the Fund, and certain fund-level expense reductions, if any, are allocated daily on a pro-rata basis to each class based on the relative net assets of each class to the total net assets of the Fund. Each class differs with respect to transfer agent and distribution and service plan fees incurred. Certain expense reductions may also differ by class. For the reporting period, the allocated portion of income and expenses to each class as a percent of its average net assets may vary due to the timing of recording these transactions in relation to fluctuating net assets of the classes. Expenses directly attributable to a fund are charged to that fund. Expenses attributable to more than one fund are allocated among the respective funds on the basis of relative net assets or other appropriate methods. Expense estimates are accrued in the period to which they relate and adjustments are made when actual amounts are known.
Income Tax Information and Distributions to Shareholders. Each year, the Fund intends to qualify as a regulated investment company under Subchapter M of the Internal Revenue Code, including distributing substantially all of its taxable income and realized gains. As a result, no provision for U.S. Federal income taxes is required. The Fund files a U.S. federal tax return, in addition to state and local tax returns as required. The Fund's federal income tax returns are subject to examination by the Internal Revenue Service (IRS) for a period of three fiscal years after they are filed. State and local tax returns may be subject to examination for an additional fiscal year depending on the jurisdiction. Foreign taxes are provided for based on the Fund's understanding of the tax rules and rates that exist in the foreign markets in which it invests.
Distributions are declared and recorded on the ex-dividend date. Income dividends and capital gain distributions are declared separately for each class. Income and capital gain distributions are determined in accordance with income tax regulations, which may differ from GAAP.
Capital accounts within the financial statements are adjusted for permanent book-tax differences. These adjustments have no impact on net assets or the results of operations. Capital accounts are not adjusted for temporary book-tax differences which will reverse in a subsequent period.
Book-tax differences are primarily due to foreign currency transactions, partnerships, passive foreign investment companies (PFIC), capital loss carryforwards and losses deferred due to wash sales.
The federal tax cost of investment securities and unrealized appreciation (depreciation) as of period end were as follows:
| Gross unrealized appreciation | $176,851,154 |
| Gross unrealized depreciation | (57,863,025) |
| Net unrealized appreciation (depreciation) on securities | $118,988,129 |
| Tax cost | $1,056,265,672 |
Capital loss carryforwards are only available to offset future capital gains of the Fund to the extent provided by regulations and may be limited. Under the Regulated Investment Company Modernization Act of 2010 (the Act), the Fund is permitted to carry forward capital losses incurred in taxable years beginning after December 22, 2010 for an unlimited period and such capital losses are required to be used prior to any losses that expire. The capital loss carryforward information presented below, including any applicable limitation, is estimated as of prior fiscal period end and is subject to adjustment.
| Fiscal year of expiration |
| 2017 | $(252,792,060) |
Short-Term Trading (Redemption) Fees. Shares held by investors in the Fund less than 90 days may have been subject to a redemption fee equal to 2.00% of the NAV of shares redeemed. All redemption fees, which reduce the proceeds of the shareholder redemption, are retained by the Fund and accounted for as an addition to paid in capital.
4. Purchases and Sales of Investments.
Purchases and sales of securities, other than short-term securities, aggregated $281,152,699 and $93,148,449, respectively.
5. Fees and Other Transactions with Affiliates.
Management Fee. Fidelity Management & Research Company (the investment adviser) and its affiliates provide the Fund with investment management related services for which the Fund pays a monthly management fee. The management fee is the sum of an individual fund fee rate that is based on an annual rate of .60% of the Fund's average net assets and an annualized group fee rate that averaged .25% during the period. The group fee rate is based upon the average net assets of all the mutual funds advised by the investment adviser, including any mutual funds previously advised by the investment adviser that are currently advised by Fidelity SelectCo, LLC, an affiliate of the investment adviser. The group fee rate decreases as assets under management increase and increases as assets under management decrease. In addition, the management fee is subject to a performance adjustment (up to a maximum of +/- .20% of the Fund's average net assets over a 36 month performance period). The upward or downward adjustment to the management fee is based on the relative investment performance of International Small Cap Opportunities as compared to its benchmark index, the MSCI EAFE Small Cap Index, over the same 36 month performance period. For the reporting period, the total annualized management fee rate, including the performance adjustment, was .89% of the Fund's average net assets. The performance adjustment included in the management fee rate may be higher or lower than the maximum performance adjustment rate due to the difference between the average net assets for the reporting and performance periods.
Distribution and Service Plan Fees. In accordance with Rule 12b-1 of the 1940 Act, the Fund has adopted separate Distribution and Service Plans for each class of shares. Certain classes pay Fidelity Distributors Corporation (FDC), an affiliate of the investment adviser, separate Distribution and Service Fees, each of which is based on an annual percentage of each class' average net assets. In addition, FDC may pay financial intermediaries for selling shares of the Fund and providing shareholder support services. For the period, the Distribution and Service Fee rates, total fees and amounts retained by FDC were as follows:
| Distribution Fee | Service Fee | Total Fees | Retained by FDC | |
| Class A | -% | .25% | $58,445 | $2,292 |
| Class T | .25% | .25% | 33,578 | – |
| Class B | .75% | .25% | 2,413 | 1,810 |
| Class C | .75% | .25% | 84,500 | 22,481 |
| $178,936 | $26,583 |
Sales Load. FDC may receive a front-end sales charge of up to 5.75% for selling Class A shares and 3.50% for selling Class T shares, some of which is paid to financial intermediaries for selling shares of the Fund. Depending on the holding period, FDC may receive contingent deferred sales charges levied on Class A, Class T, Class B, and Class C redemptions. The deferred sales charges range from 5.00% to 1.00% for Class B shares, 1.00% for Class C shares, 1.00% for certain purchases of Class A shares and .25% for certain purchases of Class T shares.
For the period, sales charge amounts retained by FDC were as follows:
| Retained by FDC | |
| Class A | $12,019 |
| Class T | 3,054 |
| Class B(a) | 13 |
| Class C(a) | 2,125 |
| $17,211 |
(a) When Class B and Class C shares are initially sold, FDC pays commissions from its own resources to financial intermediaries through which the sales are made.
Transfer Agent Fees. Fidelity Investments Institutional Operations Company, Inc., (FIIOC), an affiliate of the investment adviser, is the transfer, dividend disbursing and shareholder servicing agent for each class of the Fund. FIIOC receives account fees and asset-based fees that vary according to the account size and type of account of the shareholders of the respective classes of the Fund. FIIOC pays for typesetting, printing and mailing of shareholder reports, except proxy statements.
For the period, transfer agent fees for each class were as follows:
| Amount | % of Class-Level Average Net Assets(a) | |
| Class A | $57,114 | .24 |
| Class T | 21,051 | .31 |
| Class B | 732 | .30 |
| Class C | 24,999 | .30 |
| International Small Cap Opportunities | 936,327 | .22 |
| Class I | 129,174 | .20 |
| $1,169,397 |
(a) Annualized
Accounting and Security Lending Fees. Fidelity Service Company, Inc. (FSC), an affiliate of the investment adviser, maintains the Fund's accounting records. The accounting fee is based on the level of average net assets for each month. Under a separate contract, FSC administers the security lending program. The security lending fee is based on the number and duration of lending transactions.
Brokerage Commissions. The Fund placed a portion of its portfolio transactions with brokerage firms which are affiliates of the investment adviser. Brokerage commissions are included in net realized gain (loss) and change in net unrealized appreciation (depreciation) in the Statement of Operations. The commissions paid to these affiliated firms were $611 for the period.
Interfund Trades. The Fund may purchase from or sell securities to other Fidelity Funds under procedures adopted by the Board. The procedures have been designed to ensure these interfund trades are executed in accordance with Rule 17a-7 of the 1940 Act. Interfund trades are included within the respective purchases and sales amounts shown in the Purchases and Sales of Investments note.
6. Committed Line of Credit.
The Fund participates with other funds managed by the investment adviser or an affiliate in a $4.25 billion credit facility (the "line of credit") to be utilized for temporary or emergency purposes to fund shareholder redemptions or for other short-term liquidity purposes. The Fund has agreed to pay commitment fees on its pro-rata portion of the line of credit, which amounted to $918 and is reflected in Miscellaneous expenses on the Statement of Operations. During the period, the Fund did not borrow on this line of credit.
7. Security Lending.
The Fund lends portfolio securities through a lending agent from time to time in order to earn additional income. For equity securities, a lending agent is used and may loan securities to certain qualified borrowers, including Fidelity Capital Markets (FCM), a broker-dealer affiliated with the Fund. On the settlement date of the loan, the Fund receives collateral (in the form of U.S. Treasury obligations, letters of credit and/or cash) against the loaned securities and maintains collateral in an amount not less than 100% of the market value of the loaned securities during the period of the loan. The market value of the loaned securities is determined at the close of business of the Fund and any additional required collateral is delivered to the Fund on the next business day. The Fund or borrower may terminate the loan at any time, and if the borrower defaults on its obligation to return the securities loaned because of insolvency or other reasons, the Fund may apply collateral received from the borrower against the obligation. The Fund may experience delays and costs in recovering the securities loaned. Any cash collateral received is invested in the Fidelity Securities Lending Cash Central Fund. The value of loaned securities and cash collateral at period end are disclosed on the Fund's Statement of Assets and Liabilities. At period end, there were no security loans outstanding with FCM. Security lending income represents the income earned on investing cash collateral, less rebates paid to borrowers and any lending agent fees associated with the loan, plus any premium payments received for lending certain types of securities. Security lending income is presented in the Statement of Operations as a component of income from Fidelity Central Funds. Total security lending income during the period amounted to $77,863, including $1,988 from securities loaned to FCM.
8. Expense Reductions.
Commissions paid to certain brokers with whom the investment adviser, or its affiliates, places trades on behalf of the Fund include an amount in addition to trade execution, which may be rebated back to the Fund to offset certain expenses. This amount totaled $705 for the period. Through arrangements with the Fund's custodian, credits realized as a result of certain uninvested cash balances were used to reduce the Fund's expenses. During the period, these credits reduced the Fund's expenses by $47.
In addition, during the period the investment adviser reimbursed and/or waived a portion of fund- level operating expenses in the amount of $3,653.
9. Distributions to Shareholders.
Distributions to shareholders of each class were as follows:
| Six months ended April 30, 2016 | Year ended October 31, 2015 | |
| From net investment income | ||
| Class A | $159,395 | $91,925 |
| Class T | 9,385 | 4,261 |
| International Small Cap Opportunities | 3,989,748 | 3,599,410 |
| Class I | 694,163 | 286,715 |
| Total | $4,852,691 | $3,982,311 |
| From net realized gain | ||
| Class A | $214,570 | $38,609 |
| Class T | 65,696 | 14,913 |
| Class C | 66,143 | – |
| International Small Cap Opportunities | 3,723,825 | 839,863 |
| Class I | 585,439 | 56,271 |
| Total | $4,655,673 | $949,656 |
10. Share Transactions.
Share transactions for each class were as follows and may contain automatic conversions between classes or exchanges between affiliated funds:
| Shares | Shares | Dollars | Dollars | |
| Six months ended April 30, 2016 | Year ended October 31, 2015 | Six months ended April 30, 2016 | Year ended October 31, 2015 | |
| Class A | ||||
| Shares sold | 950,569 | 1,605,762 | $13,701,055 | $23,674,805 |
| Reinvestment of distributions | 24,184 | 9,185 | 359,376 | 124,545 |
| Shares redeemed | (419,609) | (582,997) | (5,931,692) | (8,244,833) |
| Net increase (decrease) | 555,144 | 1,031,950 | $8,128,739 | $15,554,517 |
| Class T | ||||
| Shares sold | 160,496 | 309,765 | $2,280,756 | $4,543,322 |
| Reinvestment of distributions | 5,021 | 1,404 | 74,158 | 18,926 |
| Shares redeemed | (131,388) | (134,926) | (1,815,377) | (1,907,198) |
| Net increase (decrease) | 34,129 | 176,243 | $539,537 | $2,655,050 |
| Class B | ||||
| Shares sold | 3,601 | 9,791 | $51,565 | $136,845 |
| Shares redeemed | (21,080) | (23,615) | (295,529) | (329,326) |
| Net increase (decrease) | (17,479) | (13,824) | $(243,964) | $(192,481) |
| Class C | ||||
| Shares sold | 212,639 | 838,785 | $2,969,254 | $12,019,463 |
| Reinvestment of distributions | 4,483 | – | 64,648 | – |
| Shares redeemed | (260,791) | (258,762) | (3,487,650) | (3,578,649) |
| Net increase (decrease) | (43,669) | 580,023 | $(453,748) | $8,440,814 |
| International Small Cap Opportunities | ||||
| Shares sold | 21,099,085 | 18,903,102 | $306,137,737 | $282,906,392 |
| Reinvestment of distributions | 402,267 | 239,997 | 6,034,011 | 3,280,752 |
| Shares redeemed | (9,435,850) | (10,354,861) | (135,324,878) | (146,998,081) |
| Net increase (decrease) | 12,065,502 | 8,788,238 | $176,846,870 | $139,189,063 |
| Class I | ||||
| Shares sold | 2,990,658 | 7,108,830 | $43,408,539 | $102,023,907 |
| Reinvestment of distributions | 75,351 | 23,468 | 1,129,506 | 320,812 |
| Shares redeemed | (1,586,288) | (1,195,608) | (22,479,053) | (17,368,101) |
| Net increase (decrease) | 1,479,721 | 5,936,690 | $22,058,992 | $84,976,618 |
11. Other.
The Fund's organizational documents provide former and current trustees and officers with a limited indemnification against liabilities arising in connection with the performance of their duties to the Fund. In the normal course of business, the Fund may also enter into contracts that provide general indemnifications. The Fund's maximum exposure under these arrangements is unknown as this would be dependent on future claims that may be made against the Fund. The risk of material loss from such claims is considered remote.
Mutual funds managed by the investment adviser or its affiliates were the owners of record, in the aggregate, of approximately 22% of the total outstanding shares of the Fund.
Shareholder Expense Example
As a shareholder of the Fund, you incur two types of costs: (1) transaction costs, including sales charges (loads) on purchase payments or redemption proceeds, redemption fees and (2) ongoing costs, including management fees, distribution and/or service (12b-1) fees and other Fund expenses. This Example is intended to help you understand your ongoing costs (in dollars) of investing in the Fund and to compare these costs with the ongoing costs of investing in other mutual funds.
The Example is based on an investment of $1,000 invested at the beginning of the period and held for the entire period (November 1, 2015 to April 30, 2016).
Actual Expenses
The first line of the accompanying table for each class of the Fund provides information about actual account values and actual expenses. You may use the information in this line, together with the amount you invested, to estimate the expenses that you paid over the period. Simply divide your account value by $1,000.00 (for example, an $8,600 account value divided by $1,000.00 = 8.6), then multiply the result by the number in the first line for a class of the Fund under the heading entitled "Expenses Paid During Period" to estimate the expenses you paid on your account during this period. A small balance maintenance fee of $12.00 that is charged once a year may apply for certain accounts with a value of less than $2,000. This fee is not included in the table below. If it was, the estimate of expenses you paid during the period would be higher, and your ending account value lower, by this amount. In addition, the Fund, as a shareholder in the underlying Fidelity Central Funds, will indirectly bear its pro-rata share of the fees and expenses incurred by the underlying Fidelity Central Funds. These fees and expenses are not included in the Fund's annualized expense ratio used to calculate the expense estimate in the table below.
Hypothetical Example for Comparison Purposes
The second line of the accompanying table for each class of the Fund provides information about hypothetical account values and hypothetical expenses based on a Class' actual expense ratio and an assumed rate of return of 5% per year before expenses, which is not the Class' actual return. The hypothetical account values and expenses may not be used to estimate the actual ending account balance or expenses you paid for the period. You may use this information to compare the ongoing costs of investing in the Fund and other funds. To do so, compare this 5% hypothetical example with the 5% hypothetical examples that appear in the shareholder reports of the other funds. A small balance maintenance fee of $12.00 that is charged once a year may apply for certain accounts with a value of less than $2,000. This fee is not included in the table below. If it was, the estimate of expenses you paid during the period would be higher, and your ending account value lower, by this amount. In addition, the Fund, as a shareholder in the underlying Fidelity Central Funds, will indirectly bear its pro-rata share of the fees and expenses incurred by the underlying Fidelity Central Funds. These fees and expenses are not included in the Fund's annualized expense ratio used to calculate the expense estimate in the table below.
Please note that the expenses shown in the table are meant to highlight your ongoing costs only and do not reflect any transaction costs. Therefore, the second line of the table is useful in comparing ongoing costs only, and will not help you determine the relative total costs of owning different funds. In addition, if these transactional costs were included, your costs would have been higher.
| Annualized Expense Ratio-A | Beginning Account Value November 1, 2015 | Ending Account Value April 30, 2016 | Expenses Paid During Period-B November 1, 2015 to April 30, 2016 | |
| Class A | 1.47% | |||
| Actual | $1,000.00 | $1,008.90 | $7.34 | |
| Hypothetical-C | $1,000.00 | $1,017.55 | $7.37 | |
| Class T | 1.78% | |||
| Actual | $1,000.00 | $1,007.50 | $8.88 | |
| Hypothetical-C | $1,000.00 | $1,016.01 | $8.92 | |
| Class B | 2.28% | |||
| Actual | $1,000.00 | $1,004.90 | $11.37 | |
| Hypothetical-C | $1,000.00 | $1,013.53 | $11.41 | |
| Class C | 2.27% | |||
| Actual | $1,000.00 | $1,005.10 | $11.32 | |
| Hypothetical-C | $1,000.00 | $1,013.58 | $11.36 | |
| International Small Cap Opportunities | 1.19% | |||
| Actual | $1,000.00 | $1,010.30 | $5.95 | |
| Hypothetical-C | $1,000.00 | $1,018.95 | $5.97 | |
| Class I | 1.17% | |||
| Actual | $1,000.00 | $1,010.20 | $5.85 | |
| Hypothetical-C | $1,000.00 | $1,019.05 | $5.87 |
A Annualized expense ratio reflects expenses net of applicable fee waivers.
B Expenses are equal to each Class' annualized expense ratio, multiplied by the average account value over the period, multiplied by 182/366 (to reflect the one-half year period).
C 5% return per year before expenses
![]()
AILS-SANN-0616
1.815094.110
Fidelity Advisor® Emerging Europe, Middle East, Africa (EMEA) Fund - Semi-Annual Report April 30, 2016 Class A, Class T, Class B and Class C are classes of Fidelity® Emerging Europe, Middle East, Africa (EMEA) Fund |
|
Contents
To view a fund's proxy voting guidelines and proxy voting record for the 12-month period ended June 30, visit http://www.fidelity.com/proxyvotingresults or visit the Securities and Exchange Commission's (SEC) web site at http://www.sec.gov.
You may also call 1-877-208-0098 to request a free copy of the proxy voting guidelines.
Standard & Poor's, S&P and S&P 500 are registered service marks of The McGraw-Hill Companies, Inc. and have been licensed for use by Fidelity Distributors Corporation.
Other third-party marks appearing herein are the property of their respective owners.
All other marks appearing herein are registered or unregistered trademarks or service marks of FMR LLC or an affiliated company. © 2016 FMR LLC. All rights reserved.
This report and the financial statements contained herein are submitted for the general information of the shareholders of the Fund. This report is not authorized for distribution to prospective investors in the Fund unless preceded or accompanied by an effective prospectus.
A fund files its complete schedule of portfolio holdings with the SEC for the first and third quarters of each fiscal year on Form N-Q. Forms N-Q are available on the SEC’s web site at http://www.sec.gov. A fund's Forms N-Q may be reviewed and copied at the SEC’s Public Reference Room in Washington, DC. Information regarding the operation of the SEC's Public Reference Room may be obtained by calling 1-800-SEC-0330.
For a complete list of a fund's portfolio holdings, view the most recent holdings listing, semiannual report, or annual report on Fidelity's web site at http://www.fidelity.com, http://www.advisor.fidelity.com, or http://www.401k.com, as applicable.
NOT FDIC INSURED •MAY LOSE VALUE •NO BANK GUARANTEE
Neither the Fund nor Fidelity Distributors Corporation is a bank.
Investment Summary (Unaudited)
Geographic Diversification (% of fund's net assets)
| As of April 30, 2016 | ||
| South Africa | 41.5% | |
| Russia | 23.7% | |
| Turkey | 4.1% | |
| United Arab Emirates | 3.8% | |
| Romania | 3.4% | |
| United Kingdom | 3.2% | |
| Hungary | 2.3% | |
| Poland | 2.2% | |
| Qatar | 2.0% | |
| Other* | 13.8% | |

* Includes Short-Term Investments and Net Other Assets (Liabilities).
Percentages are based on country or territory of incorporation and are adjusted for the effect of futures contracts, if applicable.
| As of October 31, 2015 | ||
| South Africa | 39.5% | |
| Russia | 21.4% | |
| United Arab Emirates | 5.2% | |
| Romania | 4.4% | |
| Poland | 4.3% | |
| Turkey | 4.3% | |
| United Kingdom | 3.4% | |
| Qatar | 3.2% | |
| Austria | 2.6% | |
| Other* | 11.7% | |

* Includes Short-Term Investments and Net Other Assets (Liabilities).
Percentages are based on country or territory of incorporation and are adjusted for the effect of futures contracts, if applicable.
Asset Allocation as of April 30, 2016
| % of fund's net assets | % of fund's net assets 6 months ago | |
| Stocks | 98.9 | 100.0 |
| Short-Term Investments and Net Other Assets (Liabilities) | 1.1 | 0.0 |
Top Ten Stocks as of April 30, 2016
| % of fund's net assets | % of fund's net assets 6 months ago | |
| Naspers Ltd. Class N (South Africa, Media) | 6.0 | 8.0 |
| Gazprom OAO (Russia, Oil, Gas & Consumable Fuels) | 5.7 | 3.7 |
| Sberbank of Russia (Russia, Banks) | 5.1 | 4.7 |
| Lukoil PJSC sponsored ADR (Russia, Oil, Gas & Consumable Fuels) | 4.5 | 3.9 |
| Steinhoff International Holdings NV (South Africa) (South Africa, Household Durables) | 2.7 | 2.4 |
| Remgro Ltd. (South Africa, Diversified Financial Services) | 2.7 | 2.6 |
| FirstRand Ltd. (South Africa, Diversified Financial Services) | 2.5 | 2.6 |
| DRDGOLD Ltd. (South Africa, Metals & Mining) | 2.3 | 0.9 |
| OTP Bank PLC (Hungary, Banks) | 2.3 | 1.4 |
| AngloGold Ashanti Ltd. (South Africa, Metals & Mining) | 2.2 | 1.1 |
| 36.0 |
Market Sectors as of April 30, 2016
| % of fund's net assets | % of fund's net assets 6 months ago | |
| Financials | 32.9 | 39.3 |
| Energy | 18.3 | 14.9 |
| Consumer Discretionary | 14.8 | 18.0 |
| Consumer Staples | 10.9 | 11.8 |
| Materials | 10.1 | 5.2 |
| Industrials | 7.2 | 3.1 |
| Telecommunication Services | 2.5 | 4.2 |
| Health Care | 2.2 | 3.5 |
Market Sectors may include more than one industry category.
The Fund may invest up to 35% of its total assets in any industry that represents more than 20% of the emerging Europe, Middle East and Africa markets. As of April 30, 2016, the Fund did not have more than 25% of its total assets invested in any one industry.
Percentages shown as 0.0% may reflect amounts less than 0.05%.
Investments April 30, 2016 (Unaudited)
Showing Percentage of Net Assets
| Common Stocks - 95.4% | |||
| Shares | Value | ||
| Austria - 0.8% | |||
| CA Immobilien Anlagen AG | 9,600 | $183,355 | |
| Wienerberger AG | 27,700 | 547,292 | |
| TOTAL AUSTRIA | 730,647 | ||
| Bailiwick of Jersey - 0.4% | |||
| Wizz Air Holdings PLC (a) | 13,888 | 381,498 | |
| Botswana - 0.4% | |||
| First National Bank of Botswana Ltd. | 990,388 | 332,305 | |
| British Virgin Islands - 0.4% | |||
| Lenta Ltd. GDR (a) | 62,600 | 403,770 | |
| Canada - 1.1% | |||
| Detour Gold Corp. (a) | 35,200 | 754,947 | |
| Osisko Gold Royalties Ltd. | 21,000 | 281,183 | |
| TOTAL CANADA | 1,036,130 | ||
| Croatia - 0.5% | |||
| Ledo d.d. | 290 | 440,111 | |
| Czech Republic - 1.0% | |||
| Komercni Banka A/S | 4,347 | 894,279 | |
| Estonia - 0.7% | |||
| Tallinna Kaubamaja AS | 77,800 | 611,122 | |
| Germany - 0.3% | |||
| UNIWHEELS AG | 6,802 | 258,397 | |
| Greece - 1.7% | |||
| Aegean Airlines SA | 18,300 | 167,899 | |
| Jumbo SA (a) | 26,536 | 347,572 | |
| Motor Oil (HELLAS) Corinth Refineries SA | 56,500 | 645,141 | |
| Sarantis SA | 37,800 | 377,304 | |
| TOTAL GREECE | 1,537,916 | ||
| Hungary - 2.3% | |||
| OTP Bank PLC | 77,900 | 2,063,000 | |
| Israel - 0.6% | |||
| Elbit Systems Ltd. (Israel) | 5,300 | 530,220 | |
| Kazakhstan - 0.4% | |||
| KazMunaiGas Exploration & Production JSC (Reg. S) GDR | 53,700 | 360,864 | |
| Kenya - 1.2% | |||
| British American Tobacco Kenya Ltd. | 31,700 | 266,468 | |
| Kcb Group Ltd. | 1,019,000 | 418,698 | |
| Safaricom Ltd. | 2,627,844 | 444,912 | |
| TOTAL KENYA | 1,130,078 | ||
| Lithuania - 0.6% | |||
| Apranga AB (a) | 174,566 | 521,705 | |
| Malta - 0.6% | |||
| Brait SA | 52,700 | 589,260 | |
| Netherlands - 0.3% | |||
| AmRest Holdings NV (a) | 4,600 | 269,351 | |
| Nigeria - 0.5% | |||
| Zenith Bank PLC | 6,802,168 | 434,130 | |
| Pakistan - 0.8% | |||
| Millat Tractors Ltd. | 77,000 | 382,410 | |
| United Bank Ltd. | 246,500 | 385,622 | |
| TOTAL PAKISTAN | 768,032 | ||
| Poland - 2.2% | |||
| Bank Polska Kasa Opieki SA | 21,700 | 882,622 | |
| Kruk SA | 8,900 | 444,190 | |
| NG2 SA | 7,600 | 338,490 | |
| Orbis SA | 24,200 | 385,481 | |
| TOTAL POLAND | 2,050,783 | ||
| Qatar - 2.0% | |||
| Al Meera Consumer Goods Co. (a) | 6,671 | 379,744 | |
| Qatar National Bank SAQ | 36,695 | 1,451,710 | |
| TOTAL QATAR | 1,831,454 | ||
| Romania - 3.4% | |||
| Banca Transilvania SA | 2,204,397 | 1,512,794 | |
| BRD-Groupe Societe Generale | 504,371 | 1,189,864 | |
| Fondul Propietatea SA GDR | 40,900 | 396,730 | |
| TOTAL ROMANIA | 3,099,388 | ||
| Russia - 20.2% | |||
| Gazprom OAO (a) | 2,001,228 | 5,213,998 | |
| Lukoil PJSC (a) | 14,000 | 594,820 | |
| Lukoil PJSC sponsored ADR | 84,095 | 3,564,367 | |
| Magnit OJSC (a) | 8,679 | 1,206,196 | |
| Megafon OJSC GDR | 68,800 | 791,200 | |
| Moscow Exchange MICEX-RTS OAO (a) | 718,000 | 1,132,328 | |
| NOVATEK OAO (a) | 141,500 | 1,338,704 | |
| Sberbank of Russia (a) | 2,428,010 | 4,635,375 | |
| TOTAL RUSSIA | 18,476,988 | ||
| Slovenia - 0.4% | |||
| Krka dd Novo mesto | 5,625 | 390,448 | |
| South Africa - 41.5% | |||
| African Rainbow Minerals Ltd. | 127,000 | 1,000,102 | |
| AngloGold Ashanti Ltd. (a) | 125,100 | 2,033,663 | |
| Aveng Ltd. (a) | 970,000 | 316,173 | |
| Barloworld Ltd. | 123,800 | 715,914 | |
| Cashbuild Ltd. | 15,200 | 370,560 | |
| City Lodge Hotels Ltd. | 33,000 | 355,958 | |
| Clicks Group Ltd. | 156,919 | 1,146,089 | |
| DRDGOLD Ltd. (b) | 3,753,637 | 2,067,187 | |
| Exxaro Resources Ltd. | 41,000 | 258,496 | |
| FirstRand Ltd. | 720,100 | 2,314,296 | |
| Holdsport Ltd. | 168,800 | 723,331 | |
| Hulamin Ltd. | 1,042,200 | 420,973 | |
| Imperial Holdings Ltd. | 84,100 | 880,450 | |
| KAP Industrial Holdings Ltd. | 1,150,500 | 509,169 | |
| Life Healthcare Group Holdings Ltd. | 246,100 | 646,401 | |
| Mr Price Group Ltd. | 66,000 | 838,396 | |
| MTN Group Ltd. | 97,550 | 1,021,203 | |
| Murray & Roberts Holdings Ltd. | 421,100 | 436,327 | |
| Nampak Ltd. | 868,800 | 1,486,730 | |
| Naspers Ltd. Class N | 40,400 | 5,543,287 | |
| Northam Platinum Ltd. (a) | 360,100 | 1,227,126 | |
| Pioneer Foods Ltd. | 110,800 | 1,294,317 | |
| PSG Konsult Ltd. | 644,336 | 338,570 | |
| Remgro Ltd. | 135,500 | 2,432,960 | |
| RMB Holdings Ltd. | 183,300 | 747,995 | |
| Sasol Ltd. | 48,100 | 1,573,359 | |
| Shoprite Holdings Ltd. | 141,400 | 1,700,843 | |
| Spar Group Ltd. | 117,000 | 1,748,599 | |
| Standard Bank Group Ltd. | 137,363 | 1,232,434 | |
| Steinhoff International Holdings NV (South Africa) | 396,000 | 2,474,713 | |
| Super Group Ltd. (a) | 80,000 | 231,201 | |
| TOTAL SOUTH AFRICA | 38,086,822 | ||
| Turkey - 4.1% | |||
| Aselsan A/S | 205,000 | 1,462,402 | |
| Koc Holding A/S | 210,850 | 1,102,479 | |
| Turk Tuborg Bira ve Malt Sanayii A/S (a) | 110,000 | 249,643 | |
| Turkiye Garanti Bankasi A/S | 313,000 | 963,482 | |
| TOTAL TURKEY | 3,778,006 | ||
| United Arab Emirates - 3.8% | |||
| Agthia Group PJSC | 106,093 | 225,306 | |
| Aldar Properties PJSC (a) | 888,885 | 658,272 | |
| Dubai Islamic Bank Pakistan Ltd. (a) | 466,870 | 744,877 | |
| Emaar Malls Group PJSC (a) | 757,587 | 598,166 | |
| First Gulf Bank PJSC | 314,358 | 1,108,371 | |
| SHUAA Capital PSC (a) | 983,913 | 184,840 | |
| TOTAL UNITED ARAB EMIRATES | 3,519,832 | ||
| United Kingdom - 3.2% | |||
| Bupa Arabia ELS (HSBC Warrant Program) warrants 10/10/16 (a)(c) | 7,300 | 248,728 | |
| Georgia Healthcare Group PLC (a) | 129,000 | 365,667 | |
| Mediclinic International PLC | 20,000 | 264,063 | |
| NMC Health PLC | 24,500 | 374,807 | |
| Samba Financial Group ELS (HSBC Bank Warrant Program) warrants 6/29/17 (c) | 28,900 | 176,778 | |
| Saudi Dairy & Foodstuff Co. ELS (HSBC Warrant Program) warrants 6/4/18 (c) | 14,000 | 511,433 | |
| Savola Group ELS (HSBC Warrant Program) warrants 2/6/17 (a)(c) | 52,800 | 563,303 | |
| United International Transportation Co. ELS (HSBC Warrant Program) warrants 7/31/17 (a)(c) | 33,634 | 395,599 | |
| TOTAL UNITED KINGDOM | �� | 2,900,378 | |
| TOTAL COMMON STOCKS | |||
| (Cost $75,616,322) | 87,426,914 | ||
| Nonconvertible Preferred Stocks - 3.5% | |||
| Russia - 3.5% | |||
| Surgutneftegas OJSC (a) | 2,892,500 | 1,875,246 | |
| Tatneft PAO (a) | 449,400 | 1,332,121 | |
| TOTAL RUSSIA | |||
| (Cost $2,981,109) | 3,207,367 | ||
| Money Market Funds - 2.3% | |||
| Fidelity Cash Central Fund, 0.38% (d) | |||
| (Cost $2,127,277) | 2,127,277 | 2,127,277 | |
| TOTAL INVESTMENT PORTFOLIO - 101.2% | |||
| (Cost $80,724,708) | 92,761,558 | ||
| NET OTHER ASSETS (LIABILITIES) - (1.2)% | (1,082,693) | ||
| NET ASSETS - 100% | $91,678,865 |
Security Type Abbreviations
ELS – Equity-Linked Security
Categorizations in the Schedule of Investments are based on country or territory of incorporation.
Legend
(a) Non-income producing
(b) Security or a portion of the security purchased on a delayed delivery or when-issued basis.
(c) Security exempt from registration under Rule 144A of the Securities Act of 1933. These securities may be resold in transactions exempt from registration, normally to qualified institutional buyers. At the end of the period, the value of these securities amounted to $1,895,841 or 2.1% of net assets.
(d) Affiliated fund that is generally available only to investment companies and other accounts managed by Fidelity Investments. The rate quoted is the annualized seven-day yield of the fund at period end. A complete unaudited listing of the fund's holdings as of its most recent quarter end is available upon request. In addition, each Fidelity Central Fund's financial statements are available on the SEC's website or upon request.
Affiliated Central Funds
Information regarding fiscal year to date income earned by the Fund from investments in Fidelity Central Funds is as follows:
| Fund | Income earned |
| Fidelity Cash Central Fund | $2,883 |
| Total | $2,883 |
Investment Valuation
The following is a summary of the inputs used, as of April 30, 2016, involving the Fund's assets and liabilities carried at fair value. The inputs or methodology used for valuing securities may not be an indication of the risk associated with investing in those securities. For more information on valuation inputs, and their aggregation into the levels used below, please refer to the Investment Valuation section in the accompanying Notes to Financial Statements.
| Valuation Inputs at Reporting Date: | ||||
| Description | Total | Level 1 | Level 2 | Level 3 |
| Investments in Securities: | ||||
| Equities: | ||||
| Consumer Discretionary | $13,538,892 | $13,191,320 | $347,572 | $-- |
| Consumer Staples | 10,049,512 | 9,672,208 | 377,304 | -- |
| Energy | 16,757,116 | 7,449,372 | 9,307,744 | -- |
| Financials | 30,166,366 | 22,671,668 | 7,494,698 | -- |
| Health Care | 2,041,386 | 2,041,386 | -- | -- |
| Industrials | 6,551,783 | 6,383,884 | 167,899 | -- |
| Materials | 9,271,911 | 5,171,061 | 4,100,850 | -- |
| Telecommunication Services | 2,257,315 | 1,236,112 | 1,021,203 | -- |
| Money Market Funds | 2,127,277 | 2,127,277 | -- | -- |
| Total Investments in Securities: | $92,761,558 | $69,944,288 | $22,817,270 | $-- |
The following is a summary of transfers between Level 1 and Level 2 for the period ended April 30, 2016. Transfers are assumed to have occurred at the beginning of the period, and are primarily attributable to the valuation techniques used for foreign equity securities, as discussed in the accompanying Notes to Financial Statements:
| Transfers | Total |
| Level 1 to Level 2 | $562,303 |
| Level 2 to Level 1 | $852,918 |
See accompanying notes which are an integral part of the financial statements.
Financial Statements
Statement of Assets and Liabilities
| April 30, 2016 (Unaudited) | ||
| Assets | ||
| Investment in securities, at value — See accompanying schedule: Unaffiliated issuers (cost $78,597,431) | $90,634,281 | |
| Fidelity Central Funds (cost $2,127,277) | 2,127,277 | |
| Total Investments (cost $80,724,708) | $92,761,558 | |
| Foreign currency held at value (cost $46,482) | 46,429 | |
| Receivable for investments sold | 455,216 | |
| Receivable for fund shares sold | 264,048 | |
| Dividends receivable | 221,843 | |
| Distributions receivable from Fidelity Central Funds | 626 | |
| Prepaid expenses | 95 | |
| Receivable from investment adviser for expense reductions | 45,602 | |
| Other receivables | 210 | |
| Total assets | 93,795,627 | |
| Liabilities | ||
| Payable for investments purchased | ||
| Regular delivery | $1,524,245 | |
| Delayed delivery | 3,365 | |
| Payable for fund shares redeemed | 435,523 | |
| Accrued management fee | 56,299 | |
| Distribution and service plan fees payable | 6,476 | |
| Other affiliated payables | 22,131 | |
| Other payables and accrued expenses | 68,723 | |
| Total liabilities | 2,116,762 | |
| Net Assets | $91,678,865 | |
| Net Assets consist of: | ||
| Paid in capital | $102,235,302 | |
| Undistributed net investment income | 334,366 | |
| Accumulated undistributed net realized gain (loss) on investments and foreign currency transactions | (22,927,761) | |
| Net unrealized appreciation (depreciation) on investments and assets and liabilities in foreign currencies | 12,036,958 | |
| Net Assets | $91,678,865 | |
| Calculation of Maximum Offering Price | ||
| Class A: | ||
| Net Asset Value and redemption price per share ($5,977,139 ÷ 764,856 shares) | $7.81 | |
| Maximum offering price per share (100/94.25 of $7.81) | $8.29 | |
| Class T: | ||
| Net Asset Value and redemption price per share ($2,392,054 ÷ 306,697 shares) | $7.80 | |
| Maximum offering price per share (100/96.50 of $7.80) | $8.08 | |
| Class B: | ||
| Net Asset Value and offering price per share ($158,461 ÷ 20,034 shares)(a) | $7.91 | |
| Class C: | ||
| Net Asset Value and offering price per share ($6,618,271 ÷ 850,603 shares)(a) | $7.78 | |
| Emerging Europe, Middle East, Africa (EMEA): | ||
| Net Asset Value, offering price and redemption price per share ($73,827,085 ÷ 9,442,476 shares) | $7.82 | |
| Class I: | ||
| Net Asset Value, offering price and redemption price per share ($2,705,855 ÷ 346,629 shares) | $7.81 |
(a) Redemption price per share is equal to net asset value less any applicable contingent deferred sales charge.
See accompanying notes which are an integral part of the financial statements.
Statement of Operations
| Six months ended April 30, 2016 (Unaudited) | ||
| Investment Income | ||
| Dividends | $1,095,508 | |
| Income from Fidelity Central Funds | 2,883 | |
| Income before foreign taxes withheld | 1,098,391 | |
| Less foreign taxes withheld | (120,769) | |
| Total income | 977,622 | |
| Expenses | ||
| Management fee | $299,845 | |
| Transfer agent fees | 109,763 | |
| Distribution and service plan fees | 30,964 | |
| Accounting fees and expenses | 19,434 | |
| Custodian fees and expenses | 55,931 | |
| Independent trustees' compensation | 164 | |
| Registration fees | 71,693 | |
| Audit | 34,063 | |
| Legal | 110 | |
| Miscellaneous | 261 | |
| Total expenses before reductions | 622,228 | |
| Expense reductions | (66,024) | 556,204 |
| Net investment income (loss) | 421,418 | |
| Realized and Unrealized Gain (Loss) | ||
| Net realized gain (loss) on: | ||
| Investment securities: | ||
| Unaffiliated issuers | (5,108,175) | |
| Foreign currency transactions | 1,917 | |
| Total net realized gain (loss) | (5,106,258) | |
| Change in net unrealized appreciation (depreciation) on: Investment securities (net of decrease in deferred foreign taxes of $12,949) | 9,176,617 | |
| Assets and liabilities in foreign currencies | (5) | |
| Total change in net unrealized appreciation (depreciation) | 9,176,612 | |
| Net gain (loss) | 4,070,354 | |
| Net increase (decrease) in net assets resulting from operations | $4,491,772 |
See accompanying notes which are an integral part of the financial statements.
Statement of Changes in Net Assets
| Six months ended April 30, 2016 (Unaudited) | Year ended October 31, 2015 | |
| Increase (Decrease) in Net Assets | ||
| Operations | ||
| Net investment income (loss) | $421,418 | $1,633,113 |
| Net realized gain (loss) | (5,106,258) | (10,780,681) |
| Change in net unrealized appreciation (depreciation) | 9,176,612 | (7,778,956) |
| Net increase (decrease) in net assets resulting from operations | 4,491,772 | (16,926,524) |
| Distributions to shareholders from net investment income | (1,323,710) | (2,091,570) |
| Distributions to shareholders from net realized gain | – | (504,771) |
| Total distributions | (1,323,710) | (2,596,341) |
| Share transactions - net increase (decrease) | 5,429,758 | (17,106,646) |
| Redemption fees | 5,610 | 15,219 |
| Total increase (decrease) in net assets | 8,603,430 | (36,614,292) |
| Net Assets | ||
| Beginning of period | 83,075,435 | 119,689,727 |
| End of period (including undistributed net investment income of $334,366 and undistributed net investment income of $1,236,658, respectively) | $91,678,865 | $83,075,435 |
See accompanying notes which are an integral part of the financial statements.
Financial Highlights — Fidelity Emerging Europe, Middle East, Africa (EMEA) Fund Class A
| Six months ended (Unaudited) April 30, | Years ended October 31, | |||||
| 2016 | 2015 | 2014 | 2013 | 2012 | 2011 | |
| Selected Per–Share Data | ||||||
| Net asset value, beginning of period | $7.49 | $9.04 | $9.49 | $8.71 | $8.34 | $8.97 |
| Income from Investment Operations | ||||||
| Net investment income (loss)A | .03 | .12 | .13 | .16 | .18 | .16B |
| Net realized and unrealized gain (loss) | .40 | (1.50) | (.46) | .85 | .34 | (.70) |
| Total from investment operations | .43 | (1.38) | (.33) | 1.01 | .52 | (.54) |
| Distributions from net investment income | (.11) | (.14) | (.12) | (.15) | (.15) | (.08) |
| Distributions from net realized gain | – | (.04) | – | (.07) | – | (.02) |
| Total distributions | (.11) | (.17)C | (.12) | (.23)D | (.15) | (.10) |
| Redemption fees added to paid in capitalA | –E | –E | –E | –E | –E | .01 |
| Net asset value, end of period | $7.81 | $7.49 | $9.04 | $9.49 | $8.71 | $8.34 |
| Total ReturnF,G,H | 5.88% | (15.42)% | (3.48)% | 11.75% | 6.38% | (6.05)% |
| Ratios to Average Net AssetsI,J | ||||||
| Expenses before reductions | 1.82%K | 1.61% | 1.60% | 1.64% | 1.62% | 1.60% |
| Expenses net of fee waivers, if any | 1.65%K | 1.61% | 1.60% | 1.63% | 1.62% | 1.56% |
| Expenses net of all reductions | 1.65%K | 1.60% | 1.60% | 1.62% | 1.60% | 1.51% |
| Net investment income (loss) | .95%K | 1.51% | 1.45% | 1.82% | 2.09% | 1.70%B |
| Supplemental Data | ||||||
| Net assets, end of period (000 omitted) | $5,977 | $5,788 | $7,889 | $10,883 | $8,934 | $10,260 |
| Portfolio turnover rateL | 51%K | 50% | 38% | 64% | 30% | 53% |
A Calculated based on average shares outstanding during the period.
B Net Investment income per share reflects a large, non-recurring dividend which amounted to $.04 per share. Excluding this non-recurring dividend, the ratio of net investment income (loss) to average net assets would have been 1.25%.
C Total distributions of $.17 per share is comprised of distributions from net investment income of $.135 and distributions from net realized gain of $.039 per share.
D Total distributions of $.23 per share is comprised of distributions from net investment income of $.151 and distributions from net realized gain of $.074 per share.
E Amount represents less than $.005 per share.
F Total returns for periods of less than one year are not annualized.
G Total returns would have been lower if certain expenses had not been reduced during the applicable periods shown.
H Total returns do not include the effect of the sales charges.
I Fees and expenses of any underlying Fidelity Central Funds are not included in the Fund's expense ratio. The Fund indirectly bears its proportionate share of the expenses of any underlying Fidelity Central Funds.
J Expense ratios reflect operating expenses of the class. Expenses before reductions do not reflect amounts reimbursed by the investment adviser or reductions from brokerage service arrangements or reductions from other expense offset arrangements and do not represent the amount paid by the class during periods when reimbursements or reductions occur. Expenses net of fee waivers reflect expenses after reimbursement by the investment adviser but prior to reductions from brokerage service arrangements or other expense offset arrangements. Expenses net of all reductions represent the net expenses paid by the class.
K Annualized
L Amount does not include the portfolio activity of any underlying Fidelity Central Funds.
See accompanying notes which are an integral part of the financial statements.
Financial Highlights — Fidelity Emerging Europe, Middle East, Africa (EMEA) Fund Class T
| Six months ended (Unaudited) April 30, | Years ended October 31, | |||||
| 2016 | 2015 | 2014 | 2013 | 2012 | 2011 | |
| Selected Per–Share Data | ||||||
| Net asset value, beginning of period | $7.44 | $9.01 | $9.46 | $8.68 | $8.31 | $8.96 |
| Income from Investment Operations | ||||||
| Net investment income (loss)A | .02 | .10 | .11 | .14 | .15 | .13B |
| Net realized and unrealized gain (loss) | .41 | (1.51) | (.46) | .84 | .35 | (.71) |
| Total from investment operations | .43 | (1.41) | (.35) | .98 | .50 | (.58) |
| Distributions from net investment income | (.07) | (.13) | (.10) | (.12) | (.13) | (.07) |
| Distributions from net realized gain | – | (.04) | – | (.07) | – | (.02) |
| Total distributions | (.07) | (.16)C | (.10) | (.20)D | (.13) | (.08)E |
| Redemption fees added to paid in capitalA | –F | –F | –F | –F | –F | .01 |
| Net asset value, end of period | $7.80 | $7.44 | $9.01 | $9.46 | $8.68 | $8.31 |
| Total ReturnG,H,I | 5.91% | (15.80)% | (3.67)% | 11.42% | 6.14% | (6.42)% |
| Ratios to Average Net AssetsJ,K | ||||||
| Expenses before reductions | 2.12%L | 1.92% | 1.92% | 1.93% | 1.89% | 1.87% |
| Expenses net of fee waivers, if any | 1.90%L | 1.90% | 1.90% | 1.90% | 1.89% | 1.84% |
| Expenses net of all reductions | 1.89%L | 1.89% | 1.90% | 1.88% | 1.86% | 1.78% |
| Net investment income (loss) | .71%L | 1.22% | 1.15% | 1.55% | 1.82% | 1.42%B |
| Supplemental Data | ||||||
| Net assets, end of period (000 omitted) | $2,392 | $2,003 | $2,465 | $3,465 | $3,336 | $3,502 |
| Portfolio turnover rateM | 51%L | 50% | 38% | 64% | 30% | 53% |
A Calculated based on average shares outstanding during the period.
B Net Investment income per share reflects a large, non-recurring dividend which amounted to $.04 per share. Excluding this non-recurring dividend, the ratio of net investment income (loss) to average net assets would have been .98%.
C Total distributions of $.16 per share is comprised of distributions from net investment income of $.125 and distributions from net realized gain of $.039 per share.
D Total distributions of $.20 per share is comprised of distributions from net investment income of $.122 and distributions from net realized gain of $.074 per share.
E Total distributions of $.08 per share is comprised of distributions from net investment income of $.068 and distributions from net realized gain of $.015 per share.
F Amount represents less than $.005 per share.
G Total returns for periods of less than one year are not annualized.
H Total returns would have been lower if certain expenses had not been reduced during the applicable periods shown.
I Total returns do not include the effect of the sales charges.
J Fees and expenses of any underlying Fidelity Central Funds are not included in the Fund's expense ratio. The Fund indirectly bears its proportionate share of the expenses of any underlying Fidelity Central Funds.
K Expense ratios reflect operating expenses of the class. Expenses before reductions do not reflect amounts reimbursed by the investment adviser or reductions from brokerage service arrangements or reductions from other expense offset arrangements and do not represent the amount paid by the class during periods when reimbursements or reductions occur. Expenses net of fee waivers reflect expenses after reimbursement by the investment adviser but prior to reductions from brokerage service arrangements or other expense offset arrangements. Expenses net of all reductions represent the net expenses paid by the class.
L Annualized
M Amount does not include the portfolio activity of any underlying Fidelity Central Funds.
See accompanying notes which are an integral part of the financial statements.
Financial Highlights — Fidelity Emerging Europe, Middle East, Africa (EMEA) Fund Class B
| Six months ended (Unaudited) April 30, | Years ended October 31, | |||||
| 2016 | 2015 | 2014 | 2013 | 2012 | 2011 | |
| Selected Per–Share Data | ||||||
| Net asset value, beginning of period | $7.50 | $9.05 | $9.50 | $8.69 | $8.29 | $8.93 |
| Income from Investment Operations | ||||||
| Net investment income (loss)A | .01 | .06 | .06 | .09 | .11 | .09B |
| Net realized and unrealized gain (loss) | .41 | (1.51) | (.46) | .85 | .35 | (.71) |
| Total from investment operations | .42 | (1.45) | (.40) | .94 | .46 | (.62) |
| Distributions from net investment income | (.01) | (.06) | (.05) | (.06) | (.06) | (.02) |
| Distributions from net realized gain | – | (.04) | – | (.07) | – | (.01) |
| Total distributions | (.01) | (.10) | (.05) | (.13) | (.06) | (.03) |
| Redemption fees added to paid in capitalA | –C | –C | –C | –C | –C | .01 |
| Net asset value, end of period | $7.91 | $7.50 | $9.05 | $9.50 | $8.69 | $8.29 |
| Total ReturnD,E,F | 5.60% | (16.16)% | (4.23)% | 10.94% | 5.56% | (6.85)% |
| Ratios to Average Net AssetsG,H | ||||||
| Expenses before reductions | 2.57%I | 2.41% | 2.40% | 2.42% | 2.38% | 2.37% |
| Expenses net of fee waivers, if any | 2.40%I | 2.40% | 2.40% | 2.40% | 2.38% | 2.33% |
| Expenses net of all reductions | 2.40%I | 2.39% | 2.40% | 2.38% | 2.35% | 2.27% |
| Net investment income (loss) | .20%I | .72% | .65% | 1.05% | 1.33% | .93%B |
| Supplemental Data | ||||||
| Net assets, end of period (000 omitted) | $158 | $181 | $294 | $388 | $441 | $539 |
| Portfolio turnover rateJ | 51%I | 50% | 38% | 64% | 30% | 53% |
A Calculated based on average shares outstanding during the period.
B Net Investment income per share reflects a large, non-recurring dividend which amounted to $.04 per share. Excluding this non-recurring dividend, the ratio of net investment income (loss) to average net assets would have been .49%.
C Amount represents less than $.005 per share.
D Total returns for periods of less than one year are not annualized.
E Total returns would have been lower if certain expenses had not been reduced during the applicable periods shown.
F Total returns do not include the effect of the contingent deferred sales charge.
G Fees and expenses of any underlying Fidelity Central Funds are not included in the Fund's expense ratio. The Fund indirectly bears its proportionate share of the expenses of any underlying Fidelity Central Funds.
H Expense ratios reflect operating expenses of the class. Expenses before reductions do not reflect amounts reimbursed by the investment adviser or reductions from brokerage service arrangements or reductions from other expense offset arrangements and do not represent the amount paid by the class during periods when reimbursements or reductions occur. Expenses net of fee waivers reflect expenses after reimbursement by the investment adviser but prior to reductions from brokerage service arrangements or other expense offset arrangements. Expenses net of all reductions represent the net expenses paid by the class.
I Annualized
J Amount does not include the portfolio activity of any underlying Fidelity Central Funds.
See accompanying notes which are an integral part of the financial statements.
Financial Highlights — Fidelity Emerging Europe, Middle East, Africa (EMEA) Fund Class C
| Six months ended (Unaudited) April 30, | Years ended October 31, | |||||
| 2016 | 2015 | 2014 | 2013 | 2012 | 2011 | |
| Selected Per–Share Data | ||||||
| Net asset value, beginning of period | $7.39 | $8.93 | $9.39 | $8.62 | $8.24 | $8.90 |
| Income from Investment Operations | ||||||
| Net investment income (loss)A | .01 | .06 | .06 | .09 | .11 | .08B |
| Net realized and unrealized gain (loss) | .40 | (1.48) | (.46) | .83 | .35 | (.69) |
| Total from investment operations | .41 | (1.42) | (.40) | .92 | .46 | (.61) |
| Distributions from net investment income | (.02) | (.08) | (.06) | (.08) | (.08) | (.05) |
| Distributions from net realized gain | – | (.04) | – | (.07) | – | (.02) |
| Total distributions | (.02) | (.12) | (.06) | (.15) | (.08) | (.06)C |
| Redemption fees added to paid in capitalA | –D | –D | –D | –D | –D | .01 |
| Net asset value, end of period | $7.78 | $7.39 | $8.93 | $9.39 | $8.62 | $8.24 |
| Total ReturnE,F,G | 5.54% | (16.08)% | (4.24)% | 10.83% | 5.68% | (6.79)% |
| Ratios to Average Net AssetsH,I | ||||||
| Expenses before reductions | 2.61%J | 2.41% | 2.40% | 2.42% | 2.37% | 2.36% |
| Expenses net of fee waivers, if any | 2.40%J | 2.40% | 2.40% | 2.40% | 2.37% | 2.33% |
| Expenses net of all reductions | 2.40%J | 2.39% | 2.40% | 2.38% | 2.35% | 2.27% |
| Net investment income (loss) | .20%J | .72% | .65% | 1.05% | 1.34% | .93%B |
| Supplemental Data | ||||||
| Net assets, end of period (000 omitted) | $6,618 | $4,104 | $6,662 | $6,782 | $7,770 | $6,650 |
| Portfolio turnover rateK | 51%J | 50% | 38% | 64% | 30% | 53% |
A Calculated based on average shares outstanding during the period.
B Net Investment income per share reflects a large, non-recurring dividend which amounted to $.04 per share. Excluding this non-recurring dividend, the ratio of net investment income (loss) to average net assets would have been .49%.
C Total distributions of $.06 per share is comprised of distributions from net investment income of $.047 and distributions from net realized gain of $.015 per share.
D Amount represents less than $.005 per share.
E Total returns for periods of less than one year are not annualized.
F Total returns would have been lower if certain expenses had not been reduced during the applicable periods shown.
G Total returns do not include the effect of the contingent deferred sales charge.
H Fees and expenses of any underlying Fidelity Central Funds are not included in the Fund's expense ratio. The Fund indirectly bears its proportionate share of the expenses of any underlying Fidelity Central Funds.
I Expense ratios reflect operating expenses of the class. Expenses before reductions do not reflect amounts reimbursed by the investment adviser or reductions from brokerage service arrangements or reductions from other expense offset arrangements and do not represent the amount paid by the class during periods when reimbursements or reductions occur. Expenses net of fee waivers reflect expenses after reimbursement by the investment adviser but prior to reductions from brokerage service arrangements or other expense offset arrangements. Expenses net of all reductions represent the net expenses paid by the class.
J Annualized
K Amount does not include the portfolio activity of any underlying Fidelity Central Funds.
See accompanying notes which are an integral part of the financial statements.
Financial Highlights — Fidelity Emerging Europe, Middle East, Africa (EMEA) Fund
| Six months ended (Unaudited) April 30, | Years ended October 31, | |||||
| 2016 | 2015 | 2014 | 2013 | 2012 | 2011 | |
| Selected Per–Share Data | ||||||
| Net asset value, beginning of period | $7.50 | $9.08 | $9.52 | $8.75 | $8.37 | $9.00 |
| Income from Investment Operations | ||||||
| Net investment income (loss)A | .04 | .14 | .16 | .18 | .20 | .18B |
| Net realized and unrealized gain (loss) | .41 | (1.51) | (.47) | .84 | .35 | (.71) |
| Total from investment operations | .45 | (1.37) | (.31) | 1.02 | .55 | (.53) |
| Distributions from net investment income | (.13) | (.17) | (.13) | (.18) | (.17) | (.09) |
| Distributions from net realized gain | – | (.04) | – | (.07) | – | (.02) |
| Total distributions | (.13) | (.21) | (.13) | (.25) | (.17) | (.11) |
| Redemption fees added to paid in capitalA | –C | –C | –C | –C | –C | .01 |
| Net asset value, end of period | $7.82 | $7.50 | $9.08 | $9.52 | $8.75 | $8.37 |
| Total ReturnD,E | 6.19% | (15.33)% | (3.21)% | 11.90% | 6.81% | (5.91)% |
| Ratios to Average Net AssetsF,G | ||||||
| Expenses before reductions | 1.57%H | 1.39% | 1.37% | 1.40% | 1.37% | 1.35% |
| Expenses net of fee waivers, if any | 1.40%H | 1.38% | 1.37% | 1.40% | 1.37% | 1.31% |
| Expenses net of all reductions | 1.40%H | 1.38% | 1.37% | 1.38% | 1.34% | 1.25% |
| Net investment income (loss) | 1.20%H | 1.74% | 1.68% | 2.05% | 2.34% | 1.95%B |
| Supplemental Data | ||||||
| Net assets, end of period (000 omitted) | $73,827 | $67,521 | $96,784 | $110,265 | $111,441 | $114,117 |
| Portfolio turnover rateI | 51%H | 50% | 38% | 64% | 30% | 53% |
A Calculated based on average shares outstanding during the period.
B Net Investment income per share reflects a large, non-recurring dividend which amounted to $.04 per share. Excluding this non-recurring dividends, the ratio of net investment income (loss) to average net assets would have been 1.51%.
C Amount represents less than $.005 per share.
D Total returns for periods of less than one year are not annualized.
E Total returns would have been lower if certain expenses had not been reduced during the applicable periods shown.
F Fees and expenses of any underlying Fidelity Central Funds are not included in the Fund's expense ratio. The Fund indirectly bears its proportionate share of the expenses of any underlying Fidelity Central Funds.
G Expense ratios reflect operating expenses of the class. Expenses before reductions do not reflect amounts reimbursed by the investment adviser or reductions from brokerage service arrangements or reductions from other expense offset arrangements and do not represent the amount paid by the class during periods when reimbursements or reductions occur. Expenses net of fee waivers reflect expenses after reimbursement by the investment adviser but prior to reductions from brokerage service arrangements or other expense offset arrangements. Expenses net of all reductions represent the net expenses paid by the class.
H Annualized
I Amount does not include the portfolio activity of any underlying Fidelity Central Funds.
See accompanying notes which are an integral part of the financial statements.
Financial Highlights — Fidelity Emerging Europe, Middle East, Africa (EMEA) Fund Class I
| Six months ended (Unaudited) April 30, | Years ended October 31, | |||||
| 2016 | 2015 | 2014 | 2013 | 2012 | 2011 | |
| Selected Per–Share Data | ||||||
| Net asset value, beginning of period | $7.50 | $9.08 | $9.52 | $8.75 | $8.37 | $9.00 |
| Income from Investment Operations | ||||||
| Net investment income (loss)A | .04 | .15 | .16 | .19 | .21 | .19B |
| Net realized and unrealized gain (loss) | .41 | (1.51) | (.46) | .84 | .35 | (.72) |
| Total from investment operations | .45 | (1.36) | (.30) | 1.03 | .56 | (.53) |
| Distributions from net investment income | (.14) | (.18) | (.14) | (.19) | (.18) | (.09) |
| Distributions from net realized gain | – | (.04) | – | (.07) | – | (.02) |
| Total distributions | (.14) | (.22) | (.14) | (.26) | (.18) | (.11) |
| Redemption fees added to paid in capitalA | –C | –C | –C | –C | –C | .01 |
| Net asset value, end of period | $7.81 | $7.50 | $9.08 | $9.52 | $8.75 | $8.37 |
| Total ReturnD,E | 6.21% | (15.23)% | (3.09)% | 12.05% | 6.93% | (5.91)% |
| Ratios to Average Net AssetsF,G | ||||||
| Expenses before reductions | 1.43%H | 1.25% | 1.26% | 1.30% | 1.28% | 1.26% |
| Expenses net of fee waivers, if any | 1.40%H | 1.25% | 1.26% | 1.30% | 1.28% | 1.24% |
| Expenses net of all reductions | 1.40%H | 1.24% | 1.26% | 1.28% | 1.25% | 1.19% |
| Net investment income (loss) | 1.20%H | 1.88% | 1.79% | 2.15% | 2.43% | 2.02%B |
| Supplemental Data | ||||||
| Net assets, end of period (000 omitted) | $2,706 | $3,478 | $5,596 | $10,231 | $8,586 | $7,633 |
| Portfolio turnover rateI | 51%H | 50% | 38% | 64% | 30% | 53% |
A Calculated based on average shares outstanding during the period.
B Net Investment income per share reflects a large, non-recurring dividend which amounted to $.04 per share. Excluding this non-recurring dividend, the ratio of net investment income (loss) to average net assets would have been 1.58%.
C Amount represents less than $.005 per share.
D Total returns for periods of less than one year are not annualized.
E Total returns would have been lower if certain expenses had not been reduced during the applicable periods shown.
F Fees and expenses of any underlying Fidelity Central Funds are not included in the Fund's expense ratio. The Fund indirectly bears its proportionate share of the expenses of any underlying Fidelity Central Funds.
G Expense ratios reflect operating expenses of the class. Expenses before reductions do not reflect amounts reimbursed by the investment adviser or reductions from brokerage service arrangements or reductions from other expense offset arrangements and do not represent the amount paid by the class during periods when reimbursements or reductions occur. Expenses net of fee waivers reflect expenses after reimbursement by the investment adviser but prior to reductions from brokerage service arrangements or other expense offset arrangements. Expenses net of all reductions represent the net expenses paid by the class.
H Annualized
I Amount does not include the portfolio activity of any underlying Fidelity Central Funds.
See accompanying notes which are an integral part of the financial statements.
Notes to Financial Statements (Unaudited)
For the period ended April 30, 2016
1. Organization.
Fidelity Emerging Europe, Middle East, Africa (EMEA) Fund (the Fund) is a non-diversified fund of Fidelity Investment Trust (the Trust) and is authorized to issue an unlimited number of shares. The Trust is registered under the Investment Company Act of 1940, as amended (the 1940 Act), as an open-end management investment company organized as a Massachusetts business trust. The Fund offers Class A, Class T, Class C, Emerging Europe, Middle East, Africa (EMEA) and Class I shares, each of which, along with Class B shares, has equal rights as to assets and voting privileges. Class B shares are closed to new accounts and additional purchases, except for exchanges and reinvestments. Each class has exclusive voting rights with respect to matters that affect that class. Class B shares will automatically convert to Class A shares after a maximum holding period of seven years from the initial date of purchase. The Fund's investments in emerging markets can be subject to social, economic, regulatory, and political uncertainties and can be extremely volatile.
During the period, the Board of Trustees approved the conversion of all existing Class B shares into Class A shares, effective on or about July 1, 2016, regardless of the length of times shares have been held.
2. Investments in Fidelity Central Funds.
The Fund invests in Fidelity Central Funds, which are open-end investment companies generally available only to other investment companies and accounts managed by the investment adviser and its affiliates. The Fund's Schedule of Investments lists each of the Fidelity Central Funds held as of period end, if any, as an investment of the Fund, but does not include the underlying holdings of each Fidelity Central Fund. As an Investing Fund, the Fund indirectly bears its proportionate share of the expenses of the underlying Fidelity Central Funds.
The Money Market Central Funds seek preservation of capital and current income and are managed by Fidelity Investments Money Management, Inc. (FIMM), an affiliate of the investment adviser. Annualized expenses of the Money Market Central Funds as of their most recent shareholder report date are less than .005%.
A complete unaudited list of holdings for each Fidelity Central Fund is available upon request or at the Securities and Exchange Commission (the SEC) website at www.sec.gov. In addition, the financial statements of the Fidelity Central Funds are available on the SEC website or upon request.
3. Significant Accounting Policies.
The financial statements have been prepared in conformity with accounting principles generally accepted in the United States of America (GAAP), which require management to make certain estimates and assumptions at the date of the financial statements. Actual results could differ from those estimates. Subsequent events, if any, through the date that the financial statements were issued have been evaluated in the preparation of the financial statements. The following summarizes the significant accounting policies of the Fund:
Investment Valuation. Investments are valued as of 4:00 p.m. Eastern time on the last calendar day of the period. The Board of Trustees (the Board) has delegated the day to day responsibility for the valuation of the Fund's investments to the Fidelity Management & Research Company (FMR) Fair Value Committee (the Committee). In accordance with valuation policies and procedures approved by the Board, the Fund attempts to obtain prices from one or more third party pricing vendors or brokers to value its investments. When current market prices, quotations or currency exchange rates are not readily available or reliable, investments will be fair valued in good faith by the Committee, in accordance with procedures adopted by the Board. Factors used in determining fair value vary by investment type and may include market or investment specific events. The frequency with which these procedures are used cannot be predicted and they may be utilized to a significant extent. The Committee oversees the Fund's valuation policies and procedures and reports to the Board on the Committee's activities and fair value determinations. The Board monitors the appropriateness of the procedures used in valuing the Fund's investments and ratifies the fair value determinations of the Committee.
The Fund categorizes the inputs to valuation techniques used to value its investments into a disclosure hierarchy consisting of three levels as shown below:
- Level 1 – quoted prices in active markets for identical investments
- Level 2 – other significant observable inputs (including quoted prices for similar investments, interest rates, prepayment speeds, etc.)
- Level 3 – unobservable inputs (including the Fund's own assumptions based on the best information available)
Valuation techniques used to value the Fund's investments by major category are as follows:
Equity securities, including restricted securities, for which market quotations are readily available, are valued at the last reported sale price or official closing price as reported by a third party pricing vendor on the primary market or exchange on which they are traded and are categorized as Level 1 in the hierarchy. In the event there were no sales during the day or closing prices are not available, securities are valued at the last quoted bid price or may be valued using the last available price and are generally categorized as Level 2 in the hierarchy. For foreign equity securities, when market or security specific events arise, comparisons to the valuation of American Depositary Receipts (ADRs), futures contracts, Exchange-Traded Funds (ETFs) and certain indexes as well as quoted prices for similar securities may be used and would be categorized as Level 2 in the hierarchy. Utilizing these techniques may result in transfers between Level 1 and Level 2. For equity securities, including restricted securities, where observable inputs are limited, assumptions about market activity and risk are used and these securities may be categorized as Level 3 in the hierarchy.
Investments in open-end mutual funds, including the Fidelity Central Funds, are valued at their closing net asset value (NAV) each business day and are categorized as Level 1 in the hierarchy.
Changes in valuation techniques may result in transfers in or out of an assigned level within the disclosure hierarchy. The aggregate value of investments by input level as of April 30, 2016, including information on transfers between Levels 1 and 2 is included at the end of the Fund's Schedule of Investments.
Foreign Currency. The Fund may use foreign currency contracts to facilitate transactions in foreign-denominated securities. Gains and losses from these transactions may arise from changes in the value of the foreign currency or if the counterparties do not perform under the contracts' terms.
Foreign-denominated assets, including investment securities, and liabilities are translated into U.S. dollars at the exchange rates at period end. Purchases and sales of investment securities, income and dividends received and expenses denominated in foreign currencies are translated into U.S. dollars at the exchange rate in effect on the transaction date.
The effects of exchange rate fluctuations on investments are included with the net realized and unrealized gain (loss) on investment securities. Other foreign currency transactions resulting in realized and unrealized gain (loss) are disclosed separately.
Investment Transactions and Income. For financial reporting purposes, the Fund's investment holdings and NAV include trades executed through the end of the last business day of the period. The NAV per share for processing shareholder transactions is calculated as of the close of business of the New York Stock Exchange (NYSE), normally 4:00 p.m. Eastern time and includes trades executed through the end of the prior business day. Gains and losses on securities sold are determined on the basis of identified cost. Dividend income is recorded on the ex-dividend date, except for certain dividends from foreign securities where the ex-dividend date may have passed, which are recorded as soon as the Fund is informed of the ex-dividend date. Non-cash dividends included in dividend income, if any, are recorded at the fair market value of the securities received. Income and capital gain distributions from Fidelity Central Funds, if any, are recorded on the ex-dividend date. Investment income is recorded net of foreign taxes withheld where recovery of such taxes is uncertain.
Class Allocations and Expenses. Investment income, realized and unrealized capital gains and losses, common expenses of the Fund, and certain fund-level expense reductions, if any, are allocated daily on a pro-rata basis to each class based on the relative net assets of each class to the total net assets of the Fund. Each class differs with respect to transfer agent and distribution and service plan fees incurred. Certain expense reductions may also differ by class. For the reporting period, the allocated portion of income and expenses to each class as a percent of its average net assets may vary due to the timing of recording these transactions in relation to fluctuating net assets of the classes. Expenses directly attributable to a fund are charged to that fund. Expenses attributable to more than one fund are allocated among the respective funds on the basis of relative net assets or other appropriate methods. Expense estimates are accrued in the period to which they relate and adjustments are made when actual amounts are known.
Income Tax Information and Distributions to Shareholders. Each year, the Fund intends to qualify as a regulated investment company under Subchapter M of the Internal Revenue Code, including distributing substantially all of its taxable income and realized gains. As a result, no provision for U.S. Federal income taxes is required. The Fund files a U.S. federal tax return, in addition to state and local tax returns as required. The Fund's federal income tax returns are subject to examination by the Internal Revenue Service (IRS) for a period of three fiscal years after they are filed. State and local tax returns may be subject to examination for an additional fiscal year depending on the jurisdiction. Foreign taxes are provided for based on the Fund's understanding of the tax rules and rates that exist in the foreign markets in which it invests. The Fund is subject to a tax imposed on capital gains by certain countries in which it invests.
Distributions are declared and recorded on the ex-dividend date. Income dividends and capital gain distributions are declared separately for each class. Income and capital gain distributions are determined in accordance with income tax regulations, which may differ from GAAP.
Capital accounts within the financial statements are adjusted for permanent book-tax differences. These adjustments have no impact on net assets or the results of operations. Capital accounts are not adjusted for temporary book-tax differences which will reverse in a subsequent period.
Book-tax differences are primarily due to foreign currency transactions, certain foreign taxes, passive foreign investment companies (PFIC), capital loss carryforwards and losses deferred due to wash sales.
The federal tax cost of investment securities and unrealized appreciation (depreciation) as of period end were as follows:
| Gross unrealized appreciation | $16,887,440 |
| Gross unrealized depreciation | (5,733,815) |
| Net unrealized appreciation (depreciation) on securities | $11,153,625 |
| Tax cost | $81,607,933 |
Capital loss carryforwards are only available to offset future capital gains of the Fund to the extent provided by regulations and may be limited. Under the Regulated Investment Company Modernization Act of 2010 (the Act), the Fund is permitted to carry forward capital losses incurred in taxable years beginning after December 22, 2010 for an unlimited period and such capital losses are required to be used prior to any losses that expire. The capital loss carryforward information presented below, including any applicable limitation, is estimated as of prior fiscal period end and is subject to adjustment.
| Fiscal year of expiration | |
| 2018 | $(1,624,705) |
| No expiration | |
| Short-term | (3,290,678) |
| Long-term | (11,971,717) |
| Total no expiration | (15,262,395) |
| Total capital loss carryforward | $(16,887,100) |
Short-Term Trading (Redemption) Fees. Shares held by investors in the Fund less than 90 days may have been subject to a redemption fee equal to 1.50% of the NAV of shares redeemed. All redemption fees, which reduce the proceeds of the shareholder redemption, are retained by the Fund and accounted for as an addition to paid in capital.
Delayed Delivery Transactions and When-Issued Securities. During the period, the Fund transacted in securities on a delayed delivery or when-issued basis. Payment and delivery may take place after the customary settlement period for that security. The price of the underlying securities and the date when the securities will be delivered and paid for are fixed at the time the transaction is negotiated. The securities purchased on a delayed delivery or when-issued basis are identified as such in the Fund's Schedule of Investments. With respect to purchase commitments, the Fund identifies securities as segregated in its records with a value at least equal to the amount of the commitment. Losses may arise due to changes in the value of the underlying securities or if the counterparty does not perform under the contract's terms, or if the issuer does not issue the securities due to political, economic, or other factors.
Restricted Securities. The Fund may invest in securities that are subject to legal or contractual restrictions on resale. These securities generally may be resold in transactions exempt from registration or to the public if the securities are registered. Disposal of these securities may involve time-consuming negotiations and expense, and prompt sale at an acceptable price may be difficult. Information regarding restricted securities is included at the end of the Fund's Schedule of Investments.
4. Purchases and Sales of Investments.
Purchases and sales of securities, other than short-term securities, aggregated $22,842,835 and $19,602,882, respectively.
5. Fees and Other Transactions with Affiliates.
Management Fee. Fidelity Management & Research Company (the investment adviser) and its affiliates provide the Fund with investment management related services for which the Fund pays a monthly management fee. The management fee is the sum of an individual fund fee rate that is based on an annual rate of .55% of the Fund's average net assets and an annualized group fee rate that averaged .25% during the period. The group fee rate is based upon the average net assets of all the mutual funds advised by the investment adviser, including any mutual funds previously advised by the investment adviser that are currently advised by Fidelity SelectCo, LLC, an affiliate of the investment adviser. The group fee rate decreases as assets under management increase and increases as assets under management decrease. For the reporting period, the total annualized management fee rate was .80% of the Fund's average net assets.
Distribution and Service Plan Fees. In accordance with Rule 12b-1 of the 1940 Act, the Fund has adopted separate Distribution and Service Plans for each class of shares, except for the Class I. Certain classes pay Fidelity Distributors Corporation (FDC), an affiliate of the investment adviser, separate Distribution and Service Fees, each of which is based on an annual percentage of each class' average net assets. In addition, FDC may pay financial intermediaries for selling shares of the Fund and providing shareholder support services. For the period, the Distribution and Service Fee rates, total fees and amounts retained by FDC were as follows:
| Distribution Fee | Service Fee | Total Fees | Retained by FDC | |
| Class A | -% | .25% | $6,328 | $– |
| Class T | .25% | .25% | 4,536 | 4 |
| Class B | .75% | .25% | 717 | 538 |
| Class C | .75% | .25% | 19,383 | 2,551 |
| $30,964 | $3,093 |
Sales Load. FDC may receive a front-end sales charge of up to 5.75% for selling Class A shares and 3.50% for selling Class T shares, some of which is paid to financial intermediaries for selling shares of the Fund. Depending on the holding period, FDC may receive contingent deferred sales charges levied on Class A, Class T, Class B and Class C redemptions. The deferred sales charges range from 5.00% to 1.00% for Class B shares, 1.00% for Class C shares, 1.00% for certain purchases of Class A shares and .25% for certain purchases of Class T shares.
For the period, sales charge amounts retained by FDC were as follows:
| Retained by FDC | |
| Class A | $1,197 |
| Class T | 532 |
| Class B(a) | – |
| Class C(a) | 61 |
| $1,790 |
(a) When Class B and Class C shares are initially sold, FDC pays commissions from its own resources to financial intermediaries through which the sales are made.
Transfer Agent Fees. Fidelity Investments Institutional Operations Company, Inc., (FIIOC), an affiliate of the investment adviser, is the transfer, dividend disbursing and shareholder servicing agent for each class of the Fund. FIIOC receives account fees and asset-based fees that vary according to the account size and type of account of the shareholders of the respective classes of the Fund. FIIOC pays for typesetting, printing and mailing of shareholder reports, except proxy statements.
For the period, transfer agent fees for each class were as follows:
| Amount | % of Class-Level Average Net Assets(a) | |
| Class A | $7,504 | .30 |
| Class T | 3,080 | .34 |
| Class B | 224 | .31 |
| Class C | 5,632 | .29 |
| Emerging Europe, Middle East, Africa (EMEA) | 91,056 | .30 |
| Class I | 2,267 | .16 |
| $109,763 |
(a) Annualized
Accounting Fees. Fidelity Service Company, Inc. (FSC), an affiliate of the investment adviser, maintains the Fund's accounting records. The fee is based on the level of average net assets for each month.
Brokerage Commissions. The Fund placed a portion of its portfolio transactions with brokerage firms which are affiliates of the investment adviser. Brokerage commissions are included in net realized gain (loss) and change in net unrealized appreciation (depreciation) in the Statement of Operations. The commissions paid to these affiliated firms were $23 for the period.
Interfund Trades. The Fund may purchase from or sell securities to other Fidelity Funds under procedures adopted by the Board. The procedures have been designed to ensure these interfund trades are executed in accordance with Rule 17a-7 of the 1940 Act. Interfund trades are included within the respective purchases and sales amounts shown in the Purchases and Sales of Investments note.
6. Committed Line of Credit.
The Fund participates with other funds managed by the investment adviser or an affiliate in a $4.25 billion credit facility (the "line of credit") to be utilized for temporary or emergency purposes to fund shareholder redemptions or for other short-term liquidity purposes. The Fund has agreed to pay commitment fees on its pro-rata portion of the line of credit, which amounted to $65 and is reflected in Miscellaneous expenses on the Statement of Operations. During the period, the Fund did not borrow on this line of credit.
7. Expense Reductions.
The investment adviser voluntarily agreed to reimburse each class to the extent annual operating expenses exceeded certain levels of average net assets as noted in the table below. Some expenses, for example interest expense, including commitment fees, are excluded from this reimbursement.
The following classes were in reimbursement during the period:
| Expense Limitations | Reimbursement | |
| Class A | 1.65% | $4,376 |
| Class T | 1.90% | 2,026 |
| Class B | 2.40% | 121 |
| Class C | 2.40% | 4,082 |
| Emerging Europe, Middle East, Africa (EMEA) | 1.40% | 54,428 |
| Class I | 1.40% | 379 |
| $65,412 |
Commissions paid to certain brokers with whom the investment adviser, or its affiliates, places trades on behalf of the Fund include an amount in addition to trade execution, which may be rebated back to the Fund to offset certain expenses. This amount totaled $345 for the period.
In addition, during the period the investment adviser reimbursed and/or waived a portion of fund-level operating expenses in the amount of $267.
8. Distributions to Shareholders.
Distributions to shareholders of each class were as follows:
| Six months ended April 30, 2016 | Year ended October 31, 2015 | |
| From net investment income | ||
| Class A | $80,414 | $113,464 |
| Class T | 18,230 | 35,916 |
| Class B | 201 | 1,835 |
| Class C | 9,270 | 58,320 |
| Emerging Europe, Middle East, Africa (EMEA) | 1,152,813 | 1,776,301 |
| Class I | 62,782 | 105,734 |
| Total | $1,323,710 | $2,091,570 |
| From net realized gain | ||
| Class A | $– | $32,778 |
| Class T | – | 11,206 |
| Class B | – | 1,213 |
| Class C | – | 29,160 |
| Emerging Europe, Middle East, Africa (EMEA) | – | 407,505 |
| Class I | – | 22,909 |
| Total | $– | $504,771 |
9. Share Transactions.
Share transactions for each class were as follows and may contain automatic conversions between classes or exchanges between affiliated funds:
| Shares | Shares | Dollars | Dollars | |
| Six months ended April 30, 2016 | Year ended October 31, 2015 | Six months ended April 30, 2016 | Year ended October 31, 2015 | |
| Class A | ||||
| Shares sold | 125,223 | 200,433 | $908,033 | $1,636,757 |
| Reinvestment of distributions | 10,903 | 16,251 | 75,669 | 135,531 |
| Shares redeemed | (144,519) | (315,855) | (980,924) | (2,546,115) |
| Net increase (decrease) | (8,393) | (99,171) | $2,778 | $(773,827) |
| Class T | ||||
| Shares sold | 73,842 | 86,058 | $536,114 | $721,254 |
| Reinvestment of distributions | 2,627 | 5,631 | 18,230 | 46,793 |
| Shares redeemed | (38,900) | (96,309) | (273,521) | (767,911) |
| Net increase (decrease) | 37,569 | (4,620) | $280,823 | $136 |
| Class B | ||||
| Shares sold | 6,222 | 3,390 | $48,684 | $28,032 |
| Reinvestment of distributions | 29 | 349 | 201 | 2,936 |
| Shares redeemed | (10,329) | (12,164) | (74,883) | (100,803) |
| Net increase (decrease) | (4,078) | (8,425) | $(25,998) | $(69,835) |
| Class C | ||||
| Shares sold | 378,690 | 210,315 | $2,804,059 | $1,702,630 |
| Reinvestment of distributions | 776 | 8,117 | 5,381 | 67,210 |
| Shares redeemed | (84,612) | (408,507) | (573,923) | (3,365,409) |
| Net increase (decrease) | 294,854 | (190,075) | $2,235,517 | $(1,595,569) |
| Emerging Europe, Middle East, Africa (EMEA) | ||||
| Shares sold | 1,501,834 | 1,440,703 | $10,868,652 | $11,732,025 |
| Reinvestment of distributions | 155,366 | 247,446 | 1,078,225 | 2,063,699 |
| Shares redeemed | (1,214,338) | (3,348,545) | (8,241,773) | (27,229,428) |
| Net increase (decrease) | 442,862 | (1,660,396) | $3,705,104 | $(13,433,704) |
| Class I | ||||
| Shares sold | 44,669 | 131,915 | $316,782 | $1,069,757 |
| Reinvestment of distributions | 7,594 | 12,912 | 52,629 | 107,558 |
| Shares redeemed | (169,187) | (297,795) | (1,137,877) | (2,411,162) |
| Net increase (decrease) | (116,924) | (152,968) | $(768,466) | $(1,233,847) |
10. Other.
The Fund's organizational documents provide former and current trustees and officers with a limited indemnification against liabilities arising in connection with the performance of their duties to the Fund. In the normal course of business, the Fund may also enter into contracts that provide general indemnifications. The Fund's maximum exposure under these arrangements is unknown as this would be dependent on future claims that may be made against the Fund. The risk of material loss from such claims is considered remote.
Shareholder Expense Example
As a shareholder of the Fund, you incur two types of costs: (1) transaction costs, including sales charges (loads) on purchase payments or redemption proceeds, redemption fees and (2) ongoing costs, including management fees, distribution and/or service (12b-1) fees and other Fund expenses. This Example is intended to help you understand your ongoing costs (in dollars) of investing in the Fund and to compare these costs with the ongoing costs of investing in other mutual funds.
The Example is based on an investment of $1,000 invested at the beginning of the period and held for the entire period (November 1, 2015 to April 30, 2016).
Actual Expenses
The first line of the accompanying table for each class of the Fund provides information about actual account values and actual expenses. You may use the information in this line, together with the amount you invested, to estimate the expenses that you paid over the period. Simply divide your account value by $1,000.00 (for example, an $8,600 account value divided by $1,000.00 = 8.6), then multiply the result by the number in the first line for a class of the Fund under the heading entitled "Expenses Paid During Period" to estimate the expenses you paid on your account during this period. A small balance maintenance fee of $12.00 that is charged once a year may apply for certain accounts with a value of less than $2,000. This fee is not included in the table below. If it was, the estimate of expenses you paid during the period would be higher, and your ending account value lower, by this amount. In addition, the Fund, as a shareholder in the underlying Fidelity Central Funds, will indirectly bear its pro-rata share of the fees and expenses incurred by the underlying Fidelity Central Funds. These fees and expenses are not included in the Fund's annualized expense ratio used to calculate the expense estimate in the table below.
Hypothetical Example for Comparison Purposes
The second line of the accompanying table for each class of the Fund provides information about hypothetical account values and hypothetical expenses based on a Class' actual expense ratio and an assumed rate of return of 5% per year before expenses, which is not the Class' actual return. The hypothetical account values and expenses may not be used to estimate the actual ending account balance or expenses you paid for the period. You may use this information to compare the ongoing costs of investing in the Fund and other funds. To do so, compare this 5% hypothetical example with the 5% hypothetical examples that appear in the shareholder reports of the other funds. A small balance maintenance fee of $12.00 that is charged once a year may apply for certain accounts with a value of less than $2,000. This fee is not included in the table below. If it was, the estimate of expenses you paid during the period would be higher, and your ending account value lower, by this amount. In addition, the Fund, as a shareholder in the underlying Fidelity Central Funds, will indirectly bear its pro-rata share of the fees and expenses incurred by the underlying Fidelity Central Funds. These fees and expenses are not included in the Fund's annualized expense ratio used to calculate the expense estimate in the table below.
Please note that the expenses shown in the table are meant to highlight your ongoing costs only and do not reflect any transaction costs. Therefore, the second line of the table is useful in comparing ongoing costs only, and will not help you determine the relative total costs of owning different funds. In addition, if these transactional costs were included, your costs would have been higher.
| Annualized Expense Ratio-A | Beginning Account Value November 1, 2015 | Ending Account Value April 30, 2016 | Expenses Paid During Period-B November 1, 2015 to April 30, 2016 | |
| Class A | 1.65% | |||
| Actual | $1,000.00 | $1,058.80 | $8.45 | |
| Hypothetical-C | $1,000.00 | $1,016.66 | $8.27 | |
| Class T | 1.90% | |||
| Actual | $1,000.00 | $1,059.10 | $9.73 | |
| Hypothetical-C | $1,000.00 | $1,015.42 | $9.52 | |
| Class B | 2.40% | |||
| Actual | $1,000.00 | $1,056.00 | $12.27 | |
| Hypothetical-C | $1,000.00 | $1,012.93 | $12.01 | |
| Class C | 2.40% | |||
| Actual | $1,000.00 | $1,055.40 | $12.27 | |
| Hypothetical-C | $1,000.00 | $1,012.93 | $12.01 | |
| Emerging Europe, Middle East, Africa (EMEA) | 1.40% | |||
| Actual | $1,000.00 | $1,061.90 | $7.18 | |
| Hypothetical-C | $1,000.00 | $1,017.90 | $7.02 | |
| Class I | 1.40% | |||
| Actual | $1,000.00 | $1,062.10 | $7.18 | |
| Hypothetical-C | $1,000.00 | $1,017.90 | $7.02 |
A Annualized expense ratio reflects expenses net of applicable fee waivers.
B Expenses are equal to each Class' annualized expense ratio, multiplied by the average account value over the period, multiplied by 182/366 (to reflect the one-half year period).
C 5% return per year before expenses
![]()
AEME-SANN-0616
1.861993.107
Fidelity Advisor® Emerging Markets Discovery Fund - Semi-Annual Report April 30, 2016 Class A, Class T and Class C are classes of Fidelity® Emerging Markets Discovery Fund |
|
Contents
To view a fund's proxy voting guidelines and proxy voting record for the 12-month period ended June 30, visit http://www.fidelity.com/proxyvotingresults or visit the Securities and Exchange Commission's (SEC) web site at http://www.sec.gov.
You may also call 1-877-208-0098 to request a free copy of the proxy voting guidelines.
Standard & Poor's, S&P and S&P 500 are registered service marks of The McGraw-Hill Companies, Inc. and have been licensed for use by Fidelity Distributors Corporation.
Other third-party marks appearing herein are the property of their respective owners.
All other marks appearing herein are registered or unregistered trademarks or service marks of FMR LLC or an affiliated company. © 2016 FMR LLC. All rights reserved.
This report and the financial statements contained herein are submitted for the general information of the shareholders of the Fund. This report is not authorized for distribution to prospective investors in the Fund unless preceded or accompanied by an effective prospectus.
A fund files its complete schedule of portfolio holdings with the SEC for the first and third quarters of each fiscal year on Form N-Q. Forms N-Q are available on the SEC’s web site at http://www.sec.gov. A fund's Forms N-Q may be reviewed and copied at the SEC’s Public Reference Room in Washington, DC. Information regarding the operation of the SEC's Public Reference Room may be obtained by calling 1-800-SEC-0330.
For a complete list of a fund's portfolio holdings, view the most recent holdings listing, semiannual report, or annual report on Fidelity's web site at http://www.fidelity.com, http://www.advisor.fidelity.com, or http://www.401k.com, as applicable.
NOT FDIC INSURED •MAY LOSE VALUE •NO BANK GUARANTEE
Neither the Fund nor Fidelity Distributors Corporation is a bank.
Investment Summary (Unaudited)
Top Five Stocks as of April 30, 2016
| % of fund's net assets | % of fund's net assets 6 months ago | |
| Hyundai Glovis Co. Ltd. (Korea (South), Air Freight & Logistics) | 1.5 | 1.0 |
| 58.com, Inc. ADR (Cayman Islands, Internet Software & Services) | 1.4 | 1.1 |
| Techtronic Industries Co. Ltd. (Hong Kong, Household Durables) | 1.3 | 2.4 |
| Yandex NV (Netherlands, Internet Software & Services) | 1.3 | 0.0 |
| Advantech Co. Ltd. (Taiwan, Technology Hardware, Storage & Peripherals) | 1.3 | 1.4 |
| 6.8 |
Top Five Market Sectors as of April 30, 2016
| % of fund's net assets | % of fund's net assets 6 months ago | |
| Financials | 18.0 | 18.1 |
| Information Technology | 17.5 | 15.4 |
| Consumer Discretionary | 15.5 | 14.6 |
| Industrials | 14.2 | 17.0 |
| Materials | 9.9 | 10.2 |
Top Five Countries as of April 30, 2016
| (excluding cash equivalents) | % of fund's net assets | % of fund's net assets 6 months ago |
| India | 13.2 | 13.0 |
| Korea (South) | 12.0 | 13.3 |
| Cayman Islands | 10.1 | 11.4 |
| Taiwan | 9.8 | 9.6 |
| Brazil | 7.4 | 4.1 |
Percentages are adjusted for the effect of futures contracts, if applicable.
Asset Allocation (% of fund's net assets)
| As of April 30, 2016 | ||
| Stocks | 97.5% | |
| Short-Term Investments and Net Other Assets (Liabilities) | 2.5% | |

| As of October 31, 2015 | ||
| Stocks | 97.7% | |
| Short-Term Investments and Net Other Assets (Liabilities) | 2.3% | |

Percentages shown as 0.0% may reflect amounts less than 0.05%.
Investments April 30, 2016 (Unaudited)
Showing Percentage of Net Assets
| Common Stocks - 95.2% | |||
| Shares | Value | ||
| Argentina - 0.5% | |||
| Inversiones y Representaciones SA ADR (a) | 22,300 | $330,709 | |
| Bangladesh - 0.4% | |||
| BRAC Bank Ltd. | 449,466 | 237,421 | |
| Bermuda - 1.9% | |||
| Digital China Holdings Ltd. (H Shares) | 154,000 | 106,319 | |
| PAX Global Technology Ltd. | 390,000 | 335,876 | |
| Shangri-La Asia Ltd. | 676,000 | 825,832 | |
| TOTAL BERMUDA | 1,268,027 | ||
| Brazil - 5.7% | |||
| AES Tiete Energia SA unit | 53,700 | 220,468 | |
| BR Properties SA | 81,400 | 243,070 | |
| Cosan SA Industria e Comercio | 32,760 | 303,287 | |
| Direcional Engenharia SA | 219,000 | 391,612 | |
| Fibria Celulose SA | 33,700 | 297,683 | |
| FPC Par Corretora de Seguros | 132,000 | 443,294 | |
| Mills Estruturas e Servicos de Engenharia SA | 26,400 | 32,316 | |
| Minerva SA (b) | 127,100 | 390,622 | |
| QGEP Participacoes SA | 298,500 | 354,112 | |
| Smiles SA | 56,000 | 649,677 | |
| Tegma Gestao Logistica SA | 269,600 | 449,954 | |
| TOTAL BRAZIL | 3,776,095 | ||
| British Virgin Islands - 0.3% | |||
| Dolphin Capital Investors Ltd. (b) | 1,423,300 | 168,972 | |
| Canada - 1.5% | |||
| Pan American Silver Corp. | 30,600 | 479,502 | |
| Torex Gold Resources, Inc. (b) | 306,500 | 544,748 | |
| TOTAL CANADA | 1,024,250 | ||
| Cayman Islands - 10.1% | |||
| 51job, Inc. sponsored ADR (b) | 12,100 | 360,580 | |
| 58.com, Inc. ADR (b) | 16,400 | 896,260 | |
| Casetek Holdings | 48,000 | 216,203 | |
| China State Construction International Holdings Ltd. | 334,000 | 520,273 | |
| GCL-Poly Energy Holdings Ltd. | 1,040,000 | 154,985 | |
| Goodbaby International Holdings Ltd. (b) | 506,000 | 283,408 | |
| Haitian International Holdings Ltd. | 313,000 | 534,029 | |
| Ju Teng International Holdings Ltd. | 416,000 | 186,736 | |
| Kingboard Laminates Holdings Ltd. | 578,500 | 295,747 | |
| Kingsoft Corp. Ltd. | 77,000 | 176,792 | |
| Lee's Pharmaceutical Holdings Ltd. | 366,000 | 296,145 | |
| Pico Far East Holdings Ltd. | 2,320,000 | 628,995 | |
| Semiconductor Manufacturing International Corp. (b) | 2,077,000 | 170,746 | |
| SITC International Holdings Co. Ltd. | 928,000 | 501,557 | |
| Sunny Optical Technology Group Co. Ltd. | 109,000 | 336,184 | |
| TPK Holding Co. Ltd. | 30,000 | 62,966 | |
| Uni-President China Holdings Ltd. | 871,000 | 811,135 | |
| Yirendai Ltd. sponsored ADR (a) | 21,100 | 260,374 | |
| TOTAL CAYMAN ISLANDS | 6,693,115 | ||
| Chile - 4.1% | |||
| Compania Cervecerias Unidas SA sponsored ADR (a) | 22,800 | 511,176 | |
| CorpBanca SA | 40,999,981 | 373,153 | |
| Empresas CMPC SA | 219,687 | 496,783 | |
| Inversiones La Construccion SA | 34,117 | 402,273 | |
| Quinenco SA | 143,799 | 282,951 | |
| Vina Concha y Toro SA | 372,483 | 624,286 | |
| TOTAL CHILE | 2,690,622 | ||
| China - 5.5% | |||
| BBMG Corp. (H Shares) | 775,000 | 566,392 | |
| China Longyuan Power Grid Corp. Ltd. (H Shares) | 331,200 | 229,140 | |
| Huangshan Tourism Development Co. Ltd. | 343,100 | 719,824 | |
| Qingdao Haier Co. Ltd. | 547,886 | 704,951 | |
| Tong Ren Tang Technologies Co. Ltd. (H Shares) | 448,000 | 701,820 | |
| Zhengzhou Yutong Bus Co. Ltd. | 127,619 | 404,301 | |
| Zhuzhou CSR Times Electric Co. Ltd. (H Shares) | 57,000 | 324,315 | |
| TOTAL CHINA | 3,650,743 | ||
| Colombia - 0.3% | |||
| Organizacion Terpel SA | 59,128 | 205,486 | |
| Cyprus - 0.7% | |||
| Global Ports Investment PLC GDR (Reg. S) (b) | 136,700 | 452,477 | |
| Egypt - 0.3% | |||
| Citadel Capital Corp. (b) | 1,032,100 | 172,018 | |
| Georgia - 0.1% | |||
| TBC Bank JSC unit | 8,575 | 90,038 | |
| Greece - 0.7% | |||
| Titan Cement Co. SA (Reg.) | 18,800 | 428,859 | |
| Hong Kong - 2.8% | |||
| BYD Electronic International Co. Ltd. (b) | 146,000 | 83,613 | |
| China Resources Beer Holdings Co. Ltd. | 226,000 | 496,615 | |
| Far East Horizon Ltd. | 532,584 | 422,753 | |
| Techtronic Industries Co. Ltd. | 231,500 | 867,817 | |
| TOTAL HONG KONG | 1,870,798 | ||
| India - 13.2% | |||
| Adani Ports & Special Economic Zone | 133,403 | 478,379 | |
| Alembic Pharmaceuticals Ltd. (b) | 77,612 | 703,965 | |
| Arvind Mills Ltd. (b) | 78,092 | 326,062 | |
| Dr Lal Pathlabs Ltd. | 21,735 | 322,333 | |
| Edelweiss Financial Services Ltd. | 431,938 | 377,476 | |
| Exide Industries Ltd. (b) | 166,764 | 369,677 | |
| Grasim Industries Ltd. | 10,589 | 683,203 | |
| IDFC Ltd. | 317,213 | 232,070 | |
| Iifl Holdings Ltd. (b) | 115,270 | 378,215 | |
| Indraprastha Gas Ltd. (b) | 50,968 | 439,891 | |
| JK Cement Ltd. | 33,493 | 299,128 | |
| LIC Housing Finance Ltd. (b) | 47,601 | 331,288 | |
| Mahindra Lifespace Developers Ltd. (b) | 43,426 | 283,599 | |
| Manappuram General Finance & Leasing Ltd. | 732,000 | 441,346 | |
| Marksans Pharma Ltd. | 462,523 | 319,255 | |
| Mphasis BFL Ltd. | 49,287 | 363,018 | |
| Power Grid Corp. of India Ltd. | 368,175 | 794,820 | |
| Redington India Ltd. (b) | 97,326 | 159,120 | |
| Solar Industries India Ltd. (b) | 5,528 | 282,390 | |
| The Jammu & Kashmir Bank Ltd. | 200,767 | 207,642 | |
| Torrent Pharmaceuticals Ltd. | 30,108 | 648,275 | |
| VST Industries Ltd. (b) | 12,492 | 307,234 | |
| TOTAL INDIA | 8,748,386 | ||
| Indonesia - 1.8% | |||
| Link Net Tbk PT | 1,434,800 | 458,575 | |
| PT Bank Danamon Indonesia Tbk Series A | 820,800 | 204,764 | |
| PT Media Nusantara Citra Tbk | 442,100 | 78,779 | |
| PT Panin Life Tbk (b) | 30,841,700 | 423,290 | |
| TOTAL INDONESIA | 1,165,408 | ||
| Israel - 0.5% | |||
| Bezeq The Israel Telecommunication Corp. Ltd. | 155,760 | 332,242 | |
| Korea (South) - 11.4% | |||
| AMOREPACIFIC Group, Inc. | 2,952 | 432,877 | |
| Binggrea Co. Ltd. | 3,310 | 197,038 | |
| BS Financial Group, Inc. | 40,160 | 325,648 | |
| Com2uS Corp. | 2,269 | 256,276 | |
| Daou Technology, Inc. | 10,330 | 210,987 | |
| Devsisters Co. Ltd. (b) | 6,881 | 145,647 | |
| DGB Financial Group Co. Ltd. | 38,521 | 308,323 | |
| E-Mart Co. Ltd. | 2,431 | 389,367 | |
| Fila Korea Ltd. | 7,708 | 699,703 | |
| Hanon Systems | 47,137 | 423,777 | |
| Hyundai Glovis Co. Ltd. | 5,806 | 962,872 | |
| Hyundai HCN | 81,610 | 263,563 | |
| Hyundai Industrial Development & Construction Co. | 7,283 | 321,026 | |
| Hyundai Wia Corp. | 4,509 | 380,186 | |
| Koh Young Technology, Inc. | 5,832 | 213,799 | |
| Korea Express Co. Ltd. (b) | 2,438 | 413,897 | |
| Korean Reinsurance Co. | 22,174 | 257,415 | |
| Medy-Tox, Inc. | 1,829 | 675,294 | |
| NCSOFT Corp. | 1,959 | 391,569 | |
| Nice Information & Telecom, Inc. | 2,998 | 89,102 | |
| Silicon Works Co. Ltd. | 7,345 | 204,513 | |
| TOTAL KOREA (SOUTH) | 7,562,879 | ||
| Malaysia - 1.3% | |||
| Inari Amertron Bhd | 266,000 | 185,890 | |
| Top Glove Corp. Bhd | 532,500 | 676,104 | |
| TOTAL MALAYSIA | 861,994 | ||
| Mexico - 6.7% | |||
| Fibra Uno Administracion SA de CV | 223,100 | 531,146 | |
| Grupo Aeroportuario del Pacifico S.A.B. de CV Series B | 45,300 | 426,811 | |
| Grupo Comercial Chedraui S.A.B. de CV (a) | 171,700 | 486,618 | |
| Grupo GICSA SA de CV (b) | 256,832 | 201,827 | |
| Industrias Penoles SA de CV | 36,820 | 575,585 | |
| Macquarie Mexican (REIT) | 522,872 | 719,666 | |
| Megacable Holdings S.A.B. de CV unit | 74,500 | 344,036 | |
| Qualitas Controladora S.A.B. de CV | 293,900 | 394,950 | |
| Tenedora Nemak SA de CV | 200,800 | 288,047 | |
| Terrafina (a) | 260,200 | 480,635 | |
| TOTAL MEXICO | 4,449,321 | ||
| Netherlands - 1.3% | |||
| Yandex NV (b) | 41,700 | 853,599 | |
| Pakistan - 0.5% | |||
| Habib Bank Ltd. | 172,400 | 310,812 | |
| Panama - 0.8% | |||
| Copa Holdings SA Class A | 7,800 | 497,250 | |
| Philippines - 0.6% | |||
| Alliance Global Group, Inc. | 1,264,500 | 389,821 | |
| Poland - 1.6% | |||
| Asseco Poland SA | 20,300 | 307,934 | |
| Inter Cars SA | 8,764 | 546,236 | |
| Prime Car Management SA | 19,300 | 195,177 | |
| TOTAL POLAND | 1,049,347 | ||
| Romania - 0.3% | |||
| Banca Transilvania SA | 331,743 | 227,663 | |
| Russia - 0.9% | |||
| Inter Rao Ues JSC (b) | 13,451,004 | 373,278 | |
| Sistema JSFC sponsored GDR | 34,060 | 250,341 | |
| TOTAL RUSSIA | 623,619 | ||
| Singapore - 0.7% | |||
| First (REIT) | 271,800 | 252,630 | |
| First Resources Ltd. | 154,300 | 218,568 | |
| TOTAL SINGAPORE | 471,198 | ||
| South Africa - 2.4% | |||
| Alexander Forbes Group Holdings Ltd. | 491,636 | 247,972 | |
| Imperial Holdings Ltd. | 40,800 | 427,139 | |
| Northam Platinum Ltd. (b)(c) | 122,600 | 417,789 | |
| Reunert Ltd. | 97,700 | 490,997 | |
| TOTAL SOUTH AFRICA | 1,583,897 | ||
| Sri Lanka - 0.6% | |||
| Hatton National Bank PLC | 278,137 | 393,671 | |
| Taiwan - 9.8% | |||
| ADLINK Technology, Inc. | 96,087 | 198,105 | |
| Advantech Co. Ltd. | 120,000 | 846,980 | |
| Chipbond Technology Corp. | 118,000 | 157,075 | |
| Cleanaway Co. Ltd. | 68,000 | 368,387 | |
| CTCI Corp. | 335,000 | 436,082 | |
| Cub Elecparts, Inc. | 44,892 | 543,379 | |
| Elite Semiconductor Memory Technology, Inc. | 137,000 | 111,329 | |
| eMemory Technology, Inc. | 22,000 | 241,092 | |
| Everlight Electronics Co. Ltd. | 152,000 | 212,921 | |
| FLEXium Interconnect, Inc. | 79,442 | 182,970 | |
| Forhouse Corp. | 462,000 | 173,055 | |
| Hermes Microvision, Inc. | 4,000 | 123,208 | |
| Inventec Corp. | 418,000 | 276,268 | |
| Lite-On Technology Corp. | 318,640 | 387,659 | |
| Powertech Technology, Inc. | 175,000 | 354,301 | |
| Radiant Opto-Electronics Corp. | 84,000 | 121,048 | |
| Sirtec International Co. Ltd. | 168,000 | 202,309 | |
| St.Shine Optical Co. Ltd. | 27,000 | 504,845 | |
| Synnex Technology International Corp. | 264,000 | 261,932 | |
| Tong Hsing Electronics Industries Ltd. | 103,000 | 295,579 | |
| Universal Cement Corp. | 281,840 | 180,169 | |
| Vanguard International Semiconductor Corp. | 190,000 | 290,855 | |
| TOTAL TAIWAN | 6,469,548 | ||
| Thailand - 2.4% | |||
| Delta Electronics PCL (For. Reg.) | 110,600 | 228,041 | |
| PTT Global Chemical PCL (For. Reg.) | 240,400 | 430,269 | |
| Star Petroleum Refining PCL | 1,082,800 | 341,088 | |
| Thai Union Frozen Products PCL (For. Reg.) | 1,043,200 | 618,392 | |
| TOTAL THAILAND | 1,617,790 | ||
| Turkey - 1.9% | |||
| Aksa Akrilik Kimya Sanayii | 77,000 | 268,317 | |
| Aselsan A/S | 74,000 | 527,891 | |
| Tupras Turkiye Petrol Rafinelleri A/S | 16,576 | 437,505 | |
| TOTAL TURKEY | 1,233,713 | ||
| United Arab Emirates - 0.4% | |||
| National Bank of Ras Al-Khaimah PSC (b) | 196,514 | 284,105 | |
| United Kingdom - 0.7% | |||
| Bgeo Group PLC | 14,540 | 486,513 | |
| Vietnam - 0.5% | |||
| FTP Corp. | 142,600 | 310,946 | |
| TOTAL COMMON STOCKS | |||
| (Cost $66,186,963)�� | 62,983,352 | ||
| Nonconvertible Preferred Stocks - 2.3% | |||
| Brazil - 1.7% | |||
| Banco ABC Brasil SA | 72,600 | 250,145 | |
| Banco do Estado Rio Grande do Sul SA | 152,500 | 377,342 | |
| Metalurgica Gerdau SA (PN) | 635,900 | 538,044 | |
| TOTAL BRAZIL | 1,165,531 | ||
| Korea (South) - 0.6% | |||
| LG Chemical Ltd. | 2,215 | 381,838 | |
| TOTAL NONCONVERTIBLE PREFERRED STOCKS | |||
| (Cost $1,424,609) | 1,547,369 | ||
| Principal Amount | Value | ||
| Government Obligations - 0.1% | |||
| United States of America - 0.1% | |||
| U.S. Treasury Bills, yield at date of purchase 0.21% to 0.3% 5/19/16 to 7/14/16 (Cost $79,972) | 80,000 | 79,983 | |
| Shares | Value | ||
| Money Market Funds - 4.7% | |||
| Fidelity Cash Central Fund, 0.38% (d) | 2,015,766 | 2,015,766 | |
| Fidelity Securities Lending Cash Central Fund, 0.42% (d)(e) | 1,092,150 | 1,092,150 | |
| TOTAL MONEY MARKET FUNDS | |||
| (Cost $3,107,916) | 3,107,916 | ||
| TOTAL INVESTMENT PORTFOLIO - 102.3% | |||
| (Cost $70,799,460) | 67,718,620 | ||
| NET OTHER ASSETS (LIABILITIES) - (2.3)% | (1,542,085) | ||
| NET ASSETS - 100% | $66,176,535 |
Categorizations in the Schedule of Investments are based on country or territory of incorporation.
Legend
(a) Security or a portion of the security is on loan at period end.
(b) Non-income producing
(c) Security or a portion of the security purchased on a delayed delivery or when-issued basis.
(d) Affiliated fund that is generally available only to investment companies and other accounts managed by Fidelity Investments. The rate quoted is the annualized seven-day yield of the fund at period end. A complete unaudited listing of the fund's holdings as of its most recent quarter end is available upon request. In addition, each Fidelity Central Fund's financial statements are available on the SEC's website or upon request.
(e) Investment made with cash collateral received from securities on loan.
Affiliated Central Funds
Information regarding fiscal year to date income earned by the Fund from investments in Fidelity Central Funds is as follows:
| Fund | Income earned |
| Fidelity Cash Central Fund | $3,946 |
| Fidelity Securities Lending Cash Central Fund | 5,223 |
| Total | $9,169 |
Investment Valuation
The following is a summary of the inputs used, as of April 30, 2016, involving the Fund's assets and liabilities carried at fair value. The inputs or methodology used for valuing securities may not be an indication of the risk associated with investing in those securities. For more information on valuation inputs, and their aggregation into the levels used below, please refer to the Investment Valuation section in the accompanying Notes to Financial Statements.
| Valuation Inputs at Reporting Date: | ||||
| Description | Total | Level 1 | Level 2 | Level 3 |
| Investments in Securities: | ||||
| Equities: | ||||
| Consumer Discretionary | $10,236,503 | $7,630,451 | $2,606,052 | $-- |
| Consumer Staples | 5,483,928 | 4,176,178 | 1,307,750 | -- |
| Energy | 1,435,992 | 1,435,992 | -- | -- |
| Financials | 11,813,854 | 11,159,031 | 654,823 | -- |
| Health Care | 4,848,036 | 3,850,071 | 997,965 | -- |
| Industrials | 9,371,343 | 7,491,169 | 1,880,174 | -- |
| Information Technology | 11,639,928 | 9,792,930 | 1,846,998 | -- |
| Materials | 6,602,382 | 4,923,928 | 1,678,454 | -- |
| Telecommunication Services | 1,041,158 | 1,041,158 | -- | -- |
| Utilities | 2,057,597 | 1,828,457 | 229,140 | -- |
| Government Obligations | 79,983 | -- | 79,983 | -- |
| Money Market Funds | 3,107,916 | 3,107,916 | -- | -- |
| Total Investments in Securities: | $67,718,620 | $56,437,281 | $11,281,339 | $-- |
The following is a summary of transfers between Level 1 and Level 2 for the period ended April 30, 2016. Transfers are assumed to have occurred at the beginning of the period, and are primarily attributable to the valuation techniques used for foreign equity securities, as discussed in the accompanying Notes to Financial Statements:
| Transfers | Total |
| Level 1 to Level 2 | $513,350 |
| Level 2 to Level 1 | $11,800,840 |
The following is a reconciliation of Investments in Securities and Derivative Instruments for which Level 3 inputs were used in determining value:
| Investments in Securities: | |
| Beginning Balance | $792,670 |
| Net Realized Gain (Loss) on Investment Securities | -- |
| Net Unrealized Gain (Loss) on Investment Securities | -- |
| Cost of Purchases | -- |
| Proceeds of Sales | -- |
| Amortization/Accretion | -- |
| Transfers into Level 3 | -- |
| Transfers out of Level 3 | (792,670) |
| Ending Balance | $-- |
| The change in unrealized gain (loss) for the period attributable to Level 3 securities held at April 30, 2016 | $-- |
The information used in the above reconciliation represents fiscal year to date activity for any Investments in Securities identified as using Level 3 inputs at either the beginning or the end of the current fiscal period. Transfers into Level 3 were attributable to a lack of observable market data resulting from decreases in market activity, decreases in liquidity, security restructuring or corporate actions. Transfers in or out of Level 3 represent the beginning value of any Security or Instrument where a change in the pricing level occurred from the beginning to the end of the period. The cost of purchases and the proceeds of sales may include securities received or delivered through corporate actions or exchanges. Realized and unrealized gains (losses) disclosed in the reconciliation are included in Net Gain (Loss) on the Fund's Statement of Operations.
See accompanying notes which are an integral part of the financial statements.
Financial Statements
Statement of Assets and Liabilities
| April 30, 2016 (Unaudited) | ||
| Assets | ||
| Investment in securities, at value (including securities loaned of $1,056,713) — See accompanying schedule: Unaffiliated issuers (cost $67,691,544) | $64,610,704 | |
| Fidelity Central Funds (cost $3,107,916) | 3,107,916 | |
| Total Investments (cost $70,799,460) | $67,718,620 | |
| Foreign currency held at value (cost $67,248) | 67,236 | |
| Receivable for investments sold | 2,293,237 | |
| Receivable for fund shares sold | 90,727 | |
| Dividends receivable | 92,213 | |
| Distributions receivable from Fidelity Central Funds | 1,961 | |
| Prepaid expenses | 66 | |
| Other receivables | 16,941 | |
| Total assets | 70,281,001 | |
| Liabilities | ||
| Payable to custodian bank | $1,802,368 | |
| Payable for investments purchased | ||
| Regular delivery | 756,311 | |
| Delayed delivery | 35,139 | |
| Payable for fund shares redeemed | 265,965 | |
| Accrued management fee | 58,418 | |
| Distribution and service plan fees payable | 3,166 | |
| Other affiliated payables | 15,898 | |
| Other payables and accrued expenses | 75,051 | |
| Collateral on securities loaned, at value | 1,092,150 | |
| Total liabilities | 4,104,466 | |
| Net Assets | $66,176,535 | |
| Net Assets consist of: | ||
| Paid in capital | $74,137,370 | |
| Undistributed net investment income | 115,022 | |
| Accumulated undistributed net realized gain (loss) on investments and foreign currency transactions | (4,977,675) | |
| Net unrealized appreciation (depreciation) on investments and assets and liabilities in foreign currencies | (3,098,182) | |
| Net Assets | $66,176,535 | |
| Calculation of Maximum Offering Price | ||
| Class A: | ||
| Net Asset Value and redemption price per share ($4,358,567 ÷ 394,003 shares) | $11.06 | |
| Maximum offering price per share (100/94.25 of $11.06) | $11.73 | |
| Class T: | ||
| Net Asset Value and redemption price per share ($2,107,239 ÷ 191,242 shares) | $11.02 | |
| Maximum offering price per share (100/96.50 of $11.02) | $11.42 | |
| Class C: | ||
| Net Asset Value and offering price per share ($1,721,722 ÷ 158,821 shares)(a) | $10.84 | |
| Emerging Markets Discovery: | ||
| Net Asset Value, offering price and redemption price per share ($56,615,815 ÷ 5,096,251 shares) | $11.11 | |
| Class I: | ||
| Net Asset Value, offering price and redemption price per share ($1,373,192 ÷ 123,266 shares) | $11.14 |
(a) Redemption price per share is equal to net asset value less any applicable contingent deferred sales charge.
See accompanying notes which are an integral part of the financial statements.
Statement of Operations
| Six months ended April 30, 2016 (Unaudited) | ||
| Investment Income | ||
| Dividends | $711,619 | |
| Interest | 57 | |
| Income from Fidelity Central Funds | 9,169 | |
| Income before foreign taxes withheld | 720,845 | |
| Less foreign taxes withheld | (45,068) | |
| Total income | 675,777 | |
| Expenses | ||
| Management fee | $273,908 | |
| Transfer agent fees | 79,317 | |
| Distribution and service plan fees | 18,188 | |
| Accounting and security lending fees | 16,831 | |
| Custodian fees and expenses | 80,413 | |
| Independent trustees' compensation | 143 | |
| Registration fees | 29,054 | |
| Audit | 53,294 | |
| Legal | 94 | |
| Miscellaneous | 236 | |
| Total expenses before reductions | 551,478 | |
| Expense reductions | (67,843) | 483,635 |
| Net investment income (loss) | 192,142 | |
| Realized and Unrealized Gain (Loss) | ||
| Net realized gain (loss) on: | ||
| Investment securities: | ||
| Unaffiliated issuers | (2,937,454) | |
| Foreign currency transactions | 260 | |
| Futures contracts | 172,417 | |
| Total net realized gain (loss) | (2,764,777) | |
| Change in net unrealized appreciation (depreciation) on: Investment securities (net of increase in deferred foreign taxes of $8,025) | 3,777,452 | |
| Assets and liabilities in foreign currencies | 10,070 | |
| Total change in net unrealized appreciation (depreciation) | 3,787,522 | |
| Net gain (loss) | 1,022,745 | |
| Net increase (decrease) in net assets resulting from operations | $1,214,887 |
See accompanying notes which are an integral part of the financial statements.
Statement of Changes in Net Assets
| Six months ended April 30, 2016 (Unaudited) | Year ended October 31, 2015 | |
| Increase (Decrease) in Net Assets | ||
| Operations | ||
| Net investment income (loss) | $192,142 | $749,160 |
| Net realized gain (loss) | (2,764,777) | (1,932,100) |
| Change in net unrealized appreciation (depreciation) | 3,787,522 | (8,002,533) |
| Net increase (decrease) in net assets resulting from operations | 1,214,887 | (9,185,473) |
| Distributions to shareholders from net investment income | (490,717) | – |
| Share transactions - net increase (decrease) | (5,938,352) | (6,487,831) |
| Redemption fees | 30,593 | 32,392 |
| Total increase (decrease) in net assets | (5,183,589) | (15,640,912) |
| Net Assets | ||
| Beginning of period | 71,360,124 | 87,001,036 |
| End of period (including undistributed net investment income of $115,022 and undistributed net investment income of $413,597, respectively) | $66,176,535 | $71,360,124 |
See accompanying notes which are an integral part of the financial statements.
Financial Highlights — Fidelity Emerging Markets Discovery Fund Class A
| Six months ended (Unaudited) April 30, | Years ended October 31, | ||||
| 2016 | 2015 | 2014 | 2013 | 2012 A | |
| Selected Per–Share Data | |||||
| Net asset value, beginning of period | $10.92 | $12.17 | $12.49 | $11.89 | $10.00 |
| Income from Investment Operations | |||||
| Net investment income (loss)B | .02 | .09C | .04 | .08 | .12 |
| Net realized and unrealized gain (loss) | .17 | (1.34) | (.01) | .75 | 1.76 |
| Total from investment operations | .19 | (1.25) | .03 | .83 | 1.88 |
| Distributions from net investment income | (.05) | – | (.06) | (.04) | (.01) |
| Distributions from net realized gain | – | – | (.30) | (.20) | – |
| Total distributions | (.05) | – | (.36) | (.25)D | (.01) |
| Redemption fees added to paid in capitalB | –E | –E | .01 | .02 | .02 |
| Net asset value, end of period | $11.06 | $10.92 | $12.17 | $12.49 | $11.89 |
| Total ReturnF,G,H | 1.79% | (10.27)% | .31% | 7.20% | 19.00% |
| Ratios to Average Net AssetsI,J | |||||
| Expenses before reductions | 1.97%K | 1.88% | 1.82% | 1.87% | 3.49% |
| Expenses net of fee waivers, if any | 1.70%K | 1.70% | 1.70% | 1.70% | 1.70% |
| Expenses net of all reductions | 1.69%K | 1.69% | 1.70% | 1.64% | 1.64% |
| Net investment income (loss) | .40%K | .76%C | .29% | .62% | 1.16% |
| Supplemental Data | |||||
| Net assets, end of period (000 omitted) | $4,359 | $4,660 | $4,362 | $5,065 | $1,671 |
| Portfolio turnover rateL | 63%K | 103% | 148% | 179% | 83% |
A For the period November 1, 2011 (commencement of operations) to October 31, 2012.
B Calculated based on average shares outstanding during the period.
C Net Investment income per share reflects a large, non-recurring dividend which amounted to $.06 per share. Excluding this non-recurring dividend, the ratio of net investment income (loss) to average net assets would have been .22%.
D Total distributions of $.25 per share is comprised of distributions from net investment income of $.044 and distributions from net realized gain of $.203 per share.
E Amount represents less than $.005 per share.
F Total returns for periods of less than one year are not annualized.
G Total returns would have been lower if certain expenses had not been reduced during the applicable periods shown.
H Total returns do not include the effect of the sales charges.
I Fees and expenses of any underlying Fidelity Central Funds are not included in the Fund's expense ratio. The Fund indirectly bears its proportionate share of the expenses of any underlying Fidelity Central Funds.
J Expense ratios reflect operating expenses of the class. Expenses before reductions do not reflect amounts reimbursed by the investment adviser or reductions from brokerage service arrangements or reductions from other expense offset arrangements and do not represent the amount paid by the class during periods when reimbursements or reductions occur. Expense ratios before reductions for start-up periods may not be representative of longer-term operating periods. Expenses net of fee waivers reflect expenses after reimbursement by the investment adviser but prior to reductions from brokerage service arrangements or other expense offset arrangements. Expenses net of all reductions represent the net expenses paid by the class.
K Annualized
L Amount does not include the portfolio activity of any underlying Fidelity Central Funds.
See accompanying notes which are an integral part of the financial statements.
Financial Highlights — Fidelity Emerging Markets Discovery Fund Class T
| Six months ended (Unaudited) April 30, | Years ended October 31, | ||||
| 2016 | 2015 | 2014 | 2013 | 2012 A | |
| Selected Per–Share Data | |||||
| Net asset value, beginning of period | $10.86 | $12.13 | $12.44 | $11.87 | $10.00 |
| Income from Investment Operations | |||||
| Net investment income (loss)B | .01 | .06C | –D | .05 | .10 |
| Net realized and unrealized gain (loss) | .17 | (1.33) | –D | .74 | 1.75 |
| Total from investment operations | .18 | (1.27) | –D | .79 | 1.85 |
| Distributions from net investment income | (.02) | – | (.02) | (.03) | –D |
| Distributions from net realized gain | – | – | (.30) | (.20) | – |
| Total distributions | (.02) | – | (.32) | (.24)E | –D |
| Redemption fees added to paid in capitalB | –D | –D | .01 | .02 | .02 |
| Net asset value, end of period | $11.02 | $10.86 | $12.13 | $12.44 | $11.87 |
| Total ReturnF,G,H | 1.69% | (10.47)% | .05% | 6.87% | 18.75% |
| Ratios to Average Net AssetsI,J | |||||
| Expenses before reductions | 2.26%K | 2.16% | 2.10% | 2.19% | 3.77% |
| Expenses net of fee waivers, if any | 1.95%K | 1.95% | 1.95% | 1.95% | 1.95% |
| Expenses net of all reductions | 1.94%K | 1.94% | 1.95% | 1.89% | 1.89% |
| Net investment income (loss) | .15%K | .51%C | .04% | .37% | .91% |
| Supplemental Data | |||||
| Net assets, end of period (000 omitted) | $2,107 | $2,015 | $2,031 | $1,914 | $1,700 |
| Portfolio turnover rateL | 63%K | 103% | 148% | 179% | 83% |
A For the period November 1, 2011 (commencement of operations) to October 31, 2012.
B Calculated based on average shares outstanding during the period.
C Net Investment income per share reflects a large, non-recurring dividend which amounted to $.06 per share. Excluding this non-recurring dividend, the ratio of net investment income (loss) to average net assets would have been (.03) %.
D Amount represents less than $.005 per share.
E Total distributions of $.24 per share is comprised of distributions from net investment income of $.034 and distributions from net realized gain of $.203 per share.
F Total returns for periods of less than one year are not annualized.
G Total returns would have been lower if certain expenses had not been reduced during the applicable periods shown.
H Total returns do not include the effect of the sales charges.
I Fees and expenses of any underlying Fidelity Central Funds are not included in the Fund's expense ratio. The Fund indirectly bears its proportionate share of the expenses of any underlying Fidelity Central Funds.
J Expense ratios reflect operating expenses of the class. Expenses before reductions do not reflect amounts reimbursed by the investment adviser or reductions from brokerage service arrangements or reductions from other expense offset arrangements and do not represent the amount paid by the class during periods when reimbursements or reductions occur. Expense ratios before reductions for start-up periods may not be representative of longer-term operating periods. Expenses net of fee waivers reflect expenses after reimbursement by the investment adviser but prior to reductions from brokerage service arrangements or other expense offset arrangements. Expenses net of all reductions represent the net expenses paid by the class.
K Annualized
L Amount does not include the portfolio activity of any underlying Fidelity Central Funds.
See accompanying notes which are an integral part of the financial statements.
Financial Highlights — Fidelity Emerging Markets Discovery Fund Class C
| Six months ended (Unaudited) April 30, | Years ended October 31, | ||||
| 2016 | 2015 | 2014 | 2013 | 2012 A | |
| Selected Per–Share Data | |||||
| Net asset value, beginning of period | $10.69 | $12.00 | $12.35 | $11.82 | $10.00 |
| Income from Investment Operations | |||||
| Net investment income (loss)B | (.02) | –C,D | (.06) | (.02) | .04 |
| Net realized and unrealized gain (loss) | .17 | (1.31) | –D | .74 | 1.76 |
| Total from investment operations | .15 | (1.31) | (.06) | .72 | 1.80 |
| Distributions from net investment income | – | – | – | (.01) | – |
| Distributions from net realized gain | – | – | (.30) | (.20) | – |
| Total distributions | – | – | (.30) | (.21) | – |
| Redemption fees added to paid in capitalB | –D | –D | .01 | .02 | .02 |
| Net asset value, end of period | $10.84 | $10.69 | $12.00 | $12.35 | $11.82 |
| Total ReturnE,F,G | 1.40% | (10.92)% | (.42)% | 6.32% | 18.20% |
| Ratios to Average Net AssetsH,I | |||||
| Expenses before reductions | 2.72%J | 2.64% | 2.58% | 2.70% | 4.32% |
| Expenses net of fee waivers, if any | 2.45%J | 2.45% | 2.45% | 2.45% | 2.45% |
| Expenses net of all reductions | 2.44%J | 2.44% | 2.45% | 2.39% | 2.39% |
| Net investment income (loss) | (.35)%J | .01%C | (.46)% | (.13)% | .41% |
| Supplemental Data | |||||
| Net assets, end of period (000 omitted) | $1,722 | $1,675 | $1,750 | $2,082 | $1,474 |
| Portfolio turnover rateK | 63%J | 103% | 148% | 179% | 83% |
A For the period November 1, 2011 (commencement of operations) to October 31, 2012.
B Calculated based on average shares outstanding during the period.
C Net Investment income per share reflects a large, non-recurring dividend which amounted to $.06 per share. Excluding this non-recurring dividend, the ratio of net investment income (loss) to average net assets would have been (.52) %.
D Amount represents less than $.005 per share.
E Total returns for periods of less than one year are not annualized.
F Total returns would have been lower if certain expenses had not been reduced during the applicable periods shown.
G Total returns do not include the effect of the contingent deferred sales charge.
H Fees and expenses of any underlying Fidelity Central Funds are not included in the Fund's expense ratio. The Fund indirectly bears its proportionate share of the expenses of any underlying Fidelity Central Funds.
I Expense ratios reflect operating expenses of the class. Expenses before reductions do not reflect amounts reimbursed by the investment adviser or reductions from brokerage service arrangements or reductions from other expense offset arrangements and do not represent the amount paid by the class during periods when reimbursements or reductions occur. Expense ratios before reductions for start-up periods may not be representative of longer-term operating periods. Expenses net of fee waivers reflect expenses after reimbursement by the investment adviser but prior to reductions from brokerage service arrangements or other expense offset arrangements. Expenses net of all reductions represent the net expenses paid by the class.
J Annualized
K Amount does not include the portfolio activity of any underlying Fidelity Central Funds.
See accompanying notes which are an integral part of the financial statements.
Financial Highlights — Fidelity Emerging Markets Discovery Fund
| Six months ended (Unaudited) April 30, | Years ended October 31, | ||||
| 2016 | 2015 | 2014 | 2013 | 2012 A | |
| Selected Per–Share Data | |||||
| Net asset value, beginning of period | $10.98 | $12.21 | $12.52 | $11.92 | $10.00 |
| Income from Investment Operations | |||||
| Net investment income (loss)B | .03 | .12C | .07 | .11 | .15 |
| Net realized and unrealized gain (loss) | .19 | (1.35) | –D | .74 | 1.76 |
| Total from investment operations | .22 | (1.23) | .07 | .85 | 1.91 |
| Distributions from net investment income | (.09) | – | (.09) | (.07) | (.01) |
| Distributions from net realized gain | – | – | (.30) | (.20) | – |
| Total distributions | (.09) | – | (.39) | (.27) | (.01) |
| Redemption fees added to paid in capitalB | –D | –D | .01 | .02 | .02 |
| Net asset value, end of period | $11.11 | $10.98 | $12.21 | $12.52 | $11.92 |
| Total ReturnE,F | 1.99% | (10.07)% | .61% | 7.37% | 19.35% |
| Ratios to Average Net AssetsG,H | |||||
| Expenses before reductions | 1.64%I | 1.56% | 1.48% | 1.57% | 3.02% |
| Expenses net of fee waivers, if any | 1.45%I | 1.45% | 1.45% | 1.45% | 1.45% |
| Expenses net of all reductions | 1.44%I | 1.44% | 1.45% | 1.39% | 1.39% |
| Net investment income (loss) | .65%I | 1.01%C | .54% | .87% | 1.41% |
| Supplemental Data | |||||
| Net assets, end of period (000 omitted) | $56,616 | $61,601 | $78,377 | $96,731 | $39,135 |
| Portfolio turnover rateJ | 63%I | 103% | 148% | 179% | 83% |
A For the period November 1, 2011 (commencement of operations) to October 31, 2012.
B Calculated based on average shares outstanding during the period.
C Net Investment income per share reflects a large, non-recurring dividend which amounted to $.06 per share. Excluding this non-recurring dividend, the ratio of net investment income (loss) to average net assets would have been .48%.
D Amount represents less than $.005 per share.
E Total returns for periods of less than one year are not annualized.
F Total returns would have been lower if certain expenses had not been reduced during the applicable periods shown.
G Fees and expenses of any underlying Fidelity Central Funds are not included in the Fund's expense ratio. The Fund indirectly bears its proportionate share of the expenses of any underlying Fidelity Central Funds.
H Expense ratios reflect operating expenses of the class. Expenses before reductions do not reflect amounts reimbursed by the investment adviser or reductions from brokerage service arrangements or reductions from other expense offset arrangements and do not represent the amount paid by the class during periods when reimbursements or reductions occur. Expense ratios before reductions for start-up periods may not be representative of longer-term operating periods. Expenses net of fee waivers reflect expenses after reimbursement by the investment adviser but prior to reductions from brokerage service arrangements or other expense offset arrangements. Expenses net of all reductions represent the net expenses paid by the class.
I Annualized
J Amount does not include the portfolio activity of any underlying Fidelity Central Funds.
See accompanying notes which are an integral part of the financial statements.
Financial Highlights — Fidelity Emerging Markets Discovery Fund Class I
| Six months ended (Unaudited) April 30, | Years ended October 31, | ||||
| 2016 | 2015 | 2014 | 2013 | 2012 A | |
| Selected Per–Share Data | |||||
| Net asset value, beginning of period | $11.02 | $12.25 | $12.53 | $11.92 | $10.00 |
| Income from Investment Operations | |||||
| Net investment income (loss)B | .03 | .12C | .07 | .11 | .15 |
| Net realized and unrealized gain (loss) | .18 | (1.35) | –D | .75 | 1.76 |
| Total from investment operations | .21 | (1.23) | .07 | .86 | 1.91 |
| Distributions from net investment income | (.09) | – | (.06) | (.07) | (.01) |
| Distributions from net realized gain | – | – | (.30) | (.20) | – |
| Total distributions | (.09) | – | (.36) | (.27) | (.01) |
| Redemption fees added to paid in capitalB | –D | –D | .01 | .02 | .02 |
| Net asset value, end of period | $11.14 | $11.02 | $12.25 | $12.53 | $11.92 |
| Total ReturnE,F | 1.91% | (10.04)% | .61% | 7.45% | 19.35% |
| Ratios to Average Net AssetsG,H | |||||
| Expenses before reductions | 1.61%I | 1.54% | 1.56% | 1.60% | 3.21% |
| Expenses net of fee waivers, if any | 1.45%I | 1.45% | 1.45% | 1.45% | 1.45% |
| Expenses net of all reductions | 1.44%I | 1.43% | 1.45% | 1.39% | 1.39% |
| Net investment income (loss) | .65%I | 1.01%C | .54% | .87% | 1.41% |
| Supplemental Data | |||||
| Net assets, end of period (000 omitted) | $1,373 | $1,410 | $481 | $1,076 | $1,825 |
| Portfolio turnover rateJ | 63%I | 103% | 148% | 179% | 83% |
A For the period November 1, 2011 (commencement of operations) to October 31, 2012.
B Calculated based on average shares outstanding during the period.
C Net Investment income per share reflects a large, non-recurring dividend which amounted to $.06 per share. Excluding this non-recurring dividend, the ratio of net investment income (loss) to average net assets would have been .48%.
D Amount represents less than $.005 per share.
E Total returns for periods of less than one year are not annualized.
F Total returns would have been lower if certain expenses had not been reduced during the applicable periods shown.
G Fees and expenses of any underlying Fidelity Central Funds are not included in the Fund's expense ratio. The Fund indirectly bears its proportionate share of the expenses of any underlying Fidelity Central Funds.
H Expense ratios reflect operating expenses of the class. Expenses before reductions do not reflect amounts reimbursed by the investment adviser or reductions from brokerage service arrangements or reductions from other expense offset arrangements and do not represent the amount paid by the class during periods when reimbursements or reductions occur. Expense ratios before reductions for start-up periods may not be representative of longer-term operating periods. Expenses net of fee waivers reflect expenses after reimbursement by the investment adviser but prior to reductions from brokerage service arrangements or other expense offset arrangements. Expenses net of all reductions represent the net expenses paid by the class.
I Annualized
J Amount does not include the portfolio activity of any underlying Fidelity Central Funds.
See accompanying notes which are an integral part of the financial statements.
Notes to Financial Statements (Unaudited)
For the period ended April 30, 2016
1. Organization.
Fidelity Emerging Markets Discovery Fund (the Fund) is a fund of Fidelity Investment Trust (the Trust) and is authorized to issue an unlimited number of shares. The Trust is registered under the Investment Company Act of 1940, as amended (the 1940 Act), as an open-end management investment company organized as a Massachusetts business trust. The Fund offers Class A, Class T, Class C, Emerging Markets Discovery and Class I shares, each of which has equal rights as to assets and voting privileges. Each class has exclusive voting rights with respect to matters that affect that class. The Fund's investments in emerging markets can be subject to social, economic, regulatory, and political uncertainties and can be extremely volatile.
2. Investments in Fidelity Central Funds.
The Fund invests in Fidelity Central Funds, which are open-end investment companies generally available only to other investment companies and accounts managed by the investment adviser and its affiliates. The Fund's Schedule of Investments lists each of the Fidelity Central Funds held as of period end, if any, as an investment of the Fund, but does not include the underlying holdings of each Fidelity Central Fund. As an Investing Fund, the Fund indirectly bears its proportionate share of the expenses of the underlying Fidelity Central Funds.
The Money Market Central Funds seek preservation of capital and current income and are managed by Fidelity Investments Money Management, Inc. (FIMM), an affiliate of the investment adviser. Annualized expenses of the Money Market Central Funds as of their most recent shareholder report date are less than .005%.
A complete unaudited list of holdings for each Fidelity Central Fund is available upon request or at the Securities and Exchange Commission (the SEC) website at www.sec.gov. In addition, the financial statements of the Fidelity Central Funds are available on the SEC website or upon request.
3. Significant Accounting Policies.
The financial statements have been prepared in conformity with accounting principles generally accepted in the United States of America (GAAP), which require management to make certain estimates and assumptions at the date of the financial statements. Actual results could differ from those estimates. Subsequent events, if any, through the date that the financial statements were issued have been evaluated in the preparation of the financial statements. The following summarizes the significant accounting policies of the Fund:
Investment Valuation. Investments are valued as of 4:00 p.m. Eastern time on the last calendar day of the period. The Board of Trustees (the Board) has delegated the day to day responsibility for the valuation of the Fund's investments to the Fidelity Management & Research Company (FMR) Fair Value Committee (the Committee). In accordance with valuation policies and procedures approved by the Board, the Fund attempts to obtain prices from one or more third party pricing vendors or brokers to value its investments. When current market prices, quotations or currency exchange rates are not readily available or reliable, investments will be fair valued in good faith by the Committee, in accordance with procedures adopted by the Board. Factors used in determining fair value vary by investment type and may include market or investment specific events, changes in interest rates and credit quality. The frequency with which these procedures are used cannot be predicted and they may be utilized to a significant extent. The Committee oversees the Fund's valuation policies and procedures and reports to the Board on the Committee's activities and fair value determinations. The Board monitors the appropriateness of the procedures used in valuing the Fund's investments and ratifies the fair value determinations of the Committee.
The Fund categorizes the inputs to valuation techniques used to value its investments into a disclosure hierarchy consisting of three levels as shown below:
- Level 1 – quoted prices in active markets for identical investments
- Level 2 – other significant observable inputs (including quoted prices for similar investments, interest rates, prepayment speeds, etc.)
- Level 3 – unobservable inputs (including the Fund's own assumptions based on the best information available)
Valuation techniques used to value the Fund's investments by major category are as follows:
Equity securities, including restricted securities, for which market quotations are readily available, are valued at the last reported sale price or official closing price as reported by a third party pricing vendor on the primary market or exchange on which they are traded and are categorized as Level 1 in the hierarchy. In the event there were no sales during the day or closing prices are not available, securities are valued at the last quoted bid price or may be valued using the last available price and are generally categorized as Level 2 in the hierarchy. For foreign equity securities, when market or security specific events arise, comparisons to the valuation of American Depositary Receipts (ADRs), futures contracts, Exchange-Traded Funds (ETFs) and certain indexes as well as quoted prices for similar securities may be used and would be categorized as Level 2 in the hierarchy. Utilizing these techniques may result in transfers between Level 1 and Level 2. For equity securities, including restricted securities, where observable inputs are limited, assumptions about market activity and risk are used and these securities may be categorized as Level 3 in the hierarchy.
Debt securities, including restricted securities, are valued based on evaluated prices received from third party pricing vendors or from brokers who make markets in such securities. U.S. government and government agency obligations are valued by pricing vendors who utilize matrix pricing which considers yield or price of bonds of comparable quality, coupon, maturity and type or by broker-supplied prices. When independent prices are unavailable or unreliable, debt securities may be valued utilizing pricing methodologies which consider similar factors that would be used by third party pricing vendors. Debt securities are generally categorized as Level 2 in the hierarchy but may be Level 3 depending on the circumstances.
Investments in open-end mutual funds, including the Fidelity Central Funds, are valued at their closing net asset value (NAV) each business day and are categorized as Level 1 in the hierarchy.
Changes in valuation techniques may result in transfers in or out of an assigned level within the disclosure hierarchy. The aggregate value of investments by input level as of April 30, 2016, including information on transfers between Levels 1 and 2, as well as a roll forward of Level 3 investments, is included at the end of the Fund's Schedule of Investments.
Foreign Currency. The Fund may use foreign currency contracts to facilitate transactions in foreign-denominated securities. Gains and losses from these transactions may arise from changes in the value of the foreign currency or if the counterparties do not perform under the contracts' terms.
Foreign-denominated assets, including investment securities, and liabilities are translated into U.S. dollars at the exchange rates at period end. Purchases and sales of investment securities, income and dividends received and expenses denominated in foreign currencies are translated into U.S. dollars at the exchange rate in effect on the transaction date.
The effects of exchange rate fluctuations on investments are included with the net realized and unrealized gain (loss) on investment securities. Other foreign currency transactions resulting in realized and unrealized gain (loss) are disclosed separately.
Investment Transactions and Income. For financial reporting purposes, the Fund's investment holdings and NAV include trades executed through the end of the last business day of the period. The NAV per share for processing shareholder transactions is calculated as of the close of business of the New York Stock Exchange (NYSE), normally 4:00 p.m. Eastern time and includes trades executed through the end of the prior business day. Gains and losses on securities sold are determined on the basis of identified cost. Dividend income is recorded on the ex-dividend date, except for certain dividends from foreign securities where the ex-dividend date may have passed, which are recorded as soon as the Fund is informed of the ex-dividend date. Non-cash dividends included in dividend income, if any, are recorded at the fair market value of the securities received. Income and capital gain distributions from Fidelity Central Funds, if any, are recorded on the ex-dividend date. Interest income is accrued as earned and includes coupon interest and amortization of premium and accretion of discount on debt securities as applicable. Investment income is recorded net of foreign taxes withheld where recovery of such taxes is uncertain.
Class Allocations and Expenses. Investment income, realized and unrealized capital gains and losses, common expenses of the Fund, and certain fund-level expense reductions, if any, are allocated daily on a pro-rata basis to each class based on the relative net assets of each class to the total net assets of the Fund. Each class differs with respect to transfer agent and distribution and service plan fees incurred. Certain expense reductions may also differ by class. For the reporting period, the allocated portion of income and expenses to each class as a percent of its average net assets may vary due to the timing of recording these transactions in relation to fluctuating net assets of the classes. Expenses directly attributable to a fund are charged to that fund. Expenses attributable to more than one fund are allocated among the respective funds on the basis of relative net assets or other appropriate methods. Expense estimates are accrued in the period to which they relate and adjustments are made when actual amounts are known.
Income Tax Information and Distributions to Shareholders. Each year, the Fund intends to qualify as a regulated investment company under Subchapter M of the Internal Revenue Code, including distributing substantially all of its taxable income and realized gains. As a result, no provision for U.S. Federal income taxes is required. The Fund files a U.S. federal tax return, in addition to state and local tax returns as required. The Fund's federal income tax returns are subject to examination by the Internal Revenue Service (IRS) for a period of three fiscal years after they are filed. State and local tax returns may be subject to examination for an additional fiscal year depending on the jurisdiction. Foreign taxes are provided for based on the Fund's understanding of the tax rules and rates that exist in the foreign markets in which it invests. The Fund is subject to a tax imposed on capital gains by certain countries in which it invests. An estimated deferred tax liability for net unrealized appreciation on the applicable securities is included in Other payables and accrued expenses on the Statement of Assets & Liabilities.
Distributions are declared and recorded on the ex-dividend date. Income dividends and capital gain distributions are declared separately for each class. Income and capital gain distributions are determined in accordance with income tax regulations, which may differ from GAAP.
Capital accounts within the financial statements are adjusted for permanent book-tax differences. These adjustments have no impact on net assets or the results of operations. Capital accounts are not adjusted for temporary book-tax differences which will reverse in a subsequent period.
Book-tax differences are primarily due to foreign currency transactions, futures transactions, certain foreign taxes, passive foreign investment companies (PFIC), capital loss carryforwards and losses deferred due to wash sales.
The federal tax cost of investment securities and unrealized appreciation (depreciation) as of period end were as follows:
| Gross unrealized appreciation | $5,799,157 |
| Gross unrealized depreciation | (9,248,368) |
| Net unrealized appreciation (depreciation) on securities | $(3,449,211) |
| Tax cost | $71,167,831 |
Capital loss carryforwards are only available to offset future capital gains of the Fund to the extent provided by regulations and may be limited. Under the Regulated Investment Company Modernization Act of 2010 (the Act), the Fund is permitted to carry forward capital losses incurred in taxable years beginning after December 22, 2010 for an unlimited period and such capital losses are required to be used prior to any losses that expire. The capital loss carryforward information presented below, including any applicable limitation, is estimated as of prior fiscal period end and is subject to adjustment.
| No expiration | |
| Short-term | $(1,731,575) |
Short-Term Trading (Redemption) Fees. Shares held by investors in the Fund less than 90 days may have been subject to a redemption fee equal to 2.00% of the NAV of shares redeemed. All redemption fees, which reduce the proceeds of the shareholder redemption, are retained by the Fund and accounted for as an addition to paid in capital.
Delayed Delivery Transactions and When-Issued Securities. During the period, the Fund transacted in securities on a delayed delivery or when-issued basis. Payment and delivery may take place after the customary settlement period for that security. The price of the underlying securities and the date when the securities will be delivered and paid for are fixed at the time the transaction is negotiated. The securities purchased on a delayed delivery or when-issued basis are identified as such in the Fund's Schedule of Investments. The Fund may receive compensation for interest forgone in the purchase of a delayed delivery or when-issued security. With respect to purchase commitments, the Fund identifies securities as segregated in its records with a value at least equal to the amount of the commitment. Losses may arise due to changes in the value of the underlying securities or if the counterparty does not perform under the contract's terms, or if the issuer does not issue the securities due to political, economic, or other factors.
4. Derivative Instruments.
Risk Exposures and the Use of Derivative Instruments. The Fund's investment objective allows the Fund to enter into various types of derivative contracts, including futures contracts. Derivatives are investments whose value is primarily derived from underlying assets, indices or reference rates and may be transacted on an exchange or over-the-counter (OTC). Derivatives may involve a future commitment to buy or sell a specified asset based on specified terms, to exchange future cash flows at periodic intervals based on a notional principal amount, or for one party to make one or more payments upon the occurrence of specified events in exchange for periodic payments from the other party.
The Fund used derivatives to increase returns and to manage exposure to certain risks as defined below. The success of any strategy involving derivatives depends on analysis of numerous economic factors, and if the strategies for investment do not work as intended, the Fund may not achieve its objectives.
The Fund's use of derivatives increased or decreased its exposure to the following risk:
| Equity Risk | Equity risk relates to the fluctuations in the value of financial instruments as a result of changes in market prices (other than those arising from interest rate risk or foreign exchange risk), whether caused by factors specific to an individual investment, its issuer, or all factors affecting all instruments traded in a market or market segment. |
The Fund is also exposed to additional risks from investing in derivatives, such as liquidity risk and counterparty credit risk. Liquidity risk is the risk that the Fund will be unable to close out the derivative in the open market in a timely manner. Counterparty credit risk is the risk that the counterparty will not be able to fulfill its obligation to the Fund. Counterparty credit risk related to exchange-traded futures contracts may be mitigated by the protection provided by the exchange on which they trade.
Investing in derivatives may involve greater risks than investing in the underlying assets directly and, to varying degrees, may involve risk of loss in excess of any initial investment and collateral received and amounts recognized in the Statement of Assets and Liabilities. In addition, there may be the risk that the change in value of the derivative contract does not correspond to the change in value of the underlying instrument.
Futures Contracts. A futures contract is an agreement between two parties to buy or sell a specified underlying instrument for a fixed price at a specified future date. The Fund used futures contracts to manage its exposure to the stock market.
Upon entering into a futures contract, a fund is required to deposit either cash or securities (initial margin) with a clearing broker in an amount equal to a certain percentage of the face value of the contract. Futures contracts are marked-to-market daily and subsequent daily payments (variation margin) are made or received by a fund depending on the daily fluctuations in the value of the futures contracts and are recorded as unrealized appreciation or (depreciation). This receivable and/or payable, if any, is included in daily variation margin for derivative instruments in the Statement of Assets and Liabilities. Realized gain or (loss) is recorded upon the expiration or closing of a futures contract. The net realized gain (loss) and change in net unrealized appreciation (depreciation) on futures contracts during the period is included in the Statement of Operations.
Any open futures contracts at period end are presented in the Schedule of Investments under the caption "Futures Contracts". The underlying face amount at value reflects each contract's exposure to the underlying instrument or index at period end.
During the period the Fund recognized net realized gain (loss) of $172,417 related to its investment in futures contracts. This amount is included in the Statement of Operations.
5. Purchases and Sales of Investments.
Purchases and sales of securities, other than short-term securities, aggregated $19,964,528 and $25,414,601, respectively.
6. Fees and Other Transactions with Affiliates.
Management Fee. Fidelity Management & Research Company (the investment adviser) and its affiliates provide the Fund with investment management related services for which the Fund pays a monthly management fee. The management fee is the sum of an individual fund fee rate that is based on an annual rate of .60% of the Fund's average net assets and an annualized group fee rate that averaged .25% during the period. The group fee rate is based upon the average net assets of all the mutual funds advised by the investment adviser, including any mutual funds previously advised by the investment adviser that are currently advised by Fidelity SelectCo, LLC, an affiliate of the investment adviser. The group fee rate decreases as assets under management increase and increases as assets under management decrease. For the reporting period, the total annualized management fee rate was .85% of the Fund's average net assets.
Distribution and Service Plan Fees. In accordance with Rule 12b-1 of the 1940 Act, the Fund has adopted separate Distribution and Service Plans for each class of shares. Certain classes pay Fidelity Distributors Corporation (FDC), an affiliate of the investment adviser, separate Distribution and Service Fees, each of which is based on an annual percentage of each class' average net assets. In addition, FDC may pay financial intermediaries for selling shares of the Fund and providing shareholder support services. For the period, the Distribution and Service Fee rates, total fees and amounts retained by FDC were as follows:
| Distribution Fee | Service Fee | Total Fees | Retained by FDC | |
| Class A | -% | .25% | $5,319 | $166 |
| Class T | .25% | .25% | 4,870 | 17 |
| Class C | .75% | .25% | 7,999 | 2,824 |
| $18,188 | $3,007 |
Sales Load. FDC may receive a front-end sales charge of up to 5.75% for selling Class A shares and 3.50% for selling Class T shares, some of which is paid to financial intermediaries for selling shares of the Fund. Depending on the holding period, FDC may receive contingent deferred sales charges levied on Class A, Class T, and Class C redemptions. The deferred sales charges are 1.00% for Class C shares, 1.00% for certain purchases of Class A shares and .25% for certain purchases of Class T shares.
For the period, sales charge amounts retained by FDC were as follows:
| Retained by FDC | |
| Class A | $1,176 |
| Class T | 567 |
| Class C(a) | 89 |
| $1,832 |
(a) When Class C shares are initially sold, FDC pays commissions from its own resources to financial intermediaries through which the sales are made.
Transfer Agent Fees. Fidelity Investments Institutional Operations Company, Inc., (FIIOC), an affiliate of the investment adviser, is the transfer, dividend disbursing and shareholder servicing agent for each class of the Fund. FIIOC receives account fees and asset-based fees that vary according to the account size and type of account of the shareholders of the respective classes of the Fund. FIIOC pays for typesetting, printing and mailing of shareholder reports, except proxy statements.
For the period, transfer agent fees for each class were as follows:
| Amount | % of Class-Level Average Net Assets(a) | |
| Class A | $6,692 | .31 |
| Class T | 3,430 | .35 |
| Class C | 2,516 | .31 |
| Emerging Markets Discovery | 65,442 | .24 |
| Class I | 1,237 | .20 |
| $79,317 |
(a) Annualized
Accounting and Security Lending Fees. Fidelity Service Company, Inc. (FSC), an affiliate of the investment adviser, maintains the Fund's accounting records. The accounting fee is based on the level of average net assets for each month. Under a separate contract, FSC administers the security lending program. The security lending fee is based on the number and duration of lending transactions.
Brokerage Commissions. The Fund placed a portion of its portfolio transactions with brokerage firms which are affiliates of the investment adviser. Brokerage commissions are included in net realized gain (loss) and change in net unrealized appreciation (depreciation) in the Statement of Operations. The commissions paid to these affiliated firms were $201 for the period.
Interfund Trades. The Fund may purchase from or sell securities to other Fidelity Funds under procedures adopted by the Board. The procedures have been designed to ensure these interfund trades are executed in accordance with Rule 17a-7 of the 1940 Act. Interfund trades are included within the respective purchases and sales amounts shown in the Purchases and Sales of Investments note.
7. Committed Line of Credit.
The Fund participates with other funds managed by the investment adviser or an affiliate in a $4.25 billion credit facility (the "line of credit") to be utilized for temporary or emergency purposes to fund shareholder redemptions or for other short-term liquidity purposes. The Fund has agreed to pay commitment fees on its pro-rata portion of the line of credit, which amounted to $57 and is reflected in Miscellaneous expenses on the Statement of Operations. During the period, the Fund did not borrow on this line of credit.
8. Security Lending.
The Fund lends portfolio securities through a lending agent from time to time in order to earn additional income. For equity securities, a lending agent is used and may loan securities to certain qualified borrowers, including Fidelity Capital Markets (FCM), a broker-dealer affiliated with the Fund. On the settlement date of the loan, the Fund receives collateral (in the form of U.S. Treasury obligations, letters of credit and/or cash) against the loaned securities and maintains collateral in an amount not less than 100% of the market value of the loaned securities during the period of the loan. The market value of the loaned securities is determined at the close of business of the Fund and any additional required collateral is delivered to the Fund on the next business day. The Fund or borrower may terminate the loan at any time, and if the borrower defaults on its obligation to return the securities loaned because of insolvency or other reasons, the Fund may apply collateral received from the borrower against the obligation. The Fund may experience delays and costs in recovering the securities loaned. Any cash collateral received is invested in the Fidelity Securities Lending Cash Central Fund. The value of loaned securities and cash collateral at period end are disclosed on the Fund's Statement of Assets and Liabilities. Security lending income represents the income earned on investing cash collateral, less rebates paid to borrowers and any lending agent fees associated with the loan, plus any premium payments received for lending certain types of securities. Security lending income is presented in the Statement of Operations as a component of income from Fidelity Central Funds. Total security lending income during the period amounted to $5,223. During the period, there were no securities loaned to FCM.
9. Expense Reductions.
The investment adviser contractually agreed to reimburse each class to the extent annual operating expenses exceeded certain levels of average net assets as noted in the table below. This reimbursement will remain in place through December 31, 2016. Some expenses, for example interest expense, including commitment fees, are excluded from this reimbursement.
The following classes were in reimbursement during the period:
| Expense Limitations | Reimbursement | |
| Class A | 1.70% | $5,845 |
| Class T | 1.95% | 2,989 |
| Class C | 2.45% | 2,170 |
| Emerging Markets Discovery | 1.45% | 53,138 |
| Class I | 1.45% | 1,004 |
| $65,146 |
Commissions paid to certain brokers with whom the investment adviser, or its affiliates, places trades on behalf of the Fund include an amount in addition to trade execution, which may be rebated back to the Fund to offset certain expenses. This amount totaled $2,463 for the period.
In addition, during the period the investment adviser reimbursed and/or waived a portion of fund-level operating expenses in the amount of $234.
10. Distributions to Shareholders.
Distributions to shareholders of each class were as follows:
| Six months ended April 30, 2016 | Year ended October 31, 2015 | |
| From net investment income | ||
| Class A | $22,428 | $– |
| Class T | 4,316 | – |
| Emerging Markets Discovery | 453,104 | – |
| Class I | 10,869 | – |
| Total | $490,717 | $– |
11. Share Transactions.
Share transactions for each class were as follows and may contain automatic conversions between classes or exchanges between affiliated funds:
| Shares | Shares | Dollars | Dollars | |
| Six months ended April 30, 2016 | Year ended October 31, 2015 | Six months ended April 30, 2016 | Year ended October 31, 2015 | |
| Class A | ||||
| Shares sold | 55,629 | 161,641 | $577,534 | $1,908,467 |
| Reinvestment of distributions | 1,944 | – | 20,757 | – |
| Shares redeemed | (90,322) | (93,262) | (940,546) | (1,088,220) |
| Net increase (decrease) | (32,749) | 68,379 | $(342,255) | $820,247 |
| Class T | ||||
| Shares sold | 18,358 | 59,344 | $188,721 | $694,558 |
| Reinvestment of distributions | 389 | – | 4,146 | – |
| Shares redeemed | (13,066) | (41,200) | (133,700) | (472,328) |
| Net increase (decrease) | 5,681 | 18,144 | $59,167 | $222,230 |
| Class C | ||||
| Shares sold | 17,201 | 68,780 | $175,833 | $796,943 |
| Shares redeemed | (15,073) | (57,921) | (149,534) | (667,642) |
| Net increase (decrease) | 2,128 | 10,859 | $26,299 | $129,301 |
| Emerging Markets Discovery | ||||
| Shares sold | 828,955 | 2,311,392 | $8,559,244 | $27,313,497 |
| Reinvestment of distributions | 39,922 | – | 427,569 | – |
| Shares redeemed | (1,380,942) | (3,121,418) | (14,622,762) | (36,074,220) |
| Net increase (decrease) | (512,065) | (810,026) | $(5,635,949) | $(8,760,723) |
| Class I | ||||
| Shares sold | 56,585 | 209,924 | $587,375 | $2,474,235 |
| Reinvestment of distributions | 981 | – | 10,531 | – |
| Shares redeemed | (62,265) | (121,211) | (643,520) | (1,373,121) |
| Net increase (decrease) | (4,699) | 88,713 | $(45,614) | $1,101,114 |
12. Other.
The Fund's organizational documents provide former and current trustees and officers with a limited indemnification against liabilities arising in connection with the performance of their duties to the Fund. In the normal course of business, the Fund may also enter into contracts that provide general indemnifications. The Fund's maximum exposure under these arrangements is unknown as this would be dependent on future claims that may be made against the Fund. The risk of material loss from such claims is considered remote.
At the end of the period, the investment adviser or its affiliates were the owners of record of 12% of the total outstanding shares of the Fund.
Shareholder Expense Example
As a shareholder of the Fund, you incur two types of costs: (1) transaction costs, including sales charges (loads) on purchase payments or redemption proceeds, redemption fees and (2) ongoing costs, including management fees, distribution and/or service (12b-1) fees and other Fund expenses. This Example is intended to help you understand your ongoing costs (in dollars) of investing in the Fund and to compare these costs with the ongoing costs of investing in other mutual funds.
The Example is based on an investment of $1,000 invested at the beginning of the period and held for the entire period (November 1, 2015 to April 30, 2016).
Actual Expenses
The first line of the accompanying table for each class of the Fund provides information about actual account values and actual expenses. You may use the information in this line, together with the amount you invested, to estimate the expenses that you paid over the period. Simply divide your account value by $1,000.00 (for example, an $8,600 account value divided by $1,000.00 = 8.6), then multiply the result by the number in the first line for a class of the Fund under the heading entitled "Expenses Paid During Period" to estimate the expenses you paid on your account during this period. A small balance maintenance fee of $12.00 that is charged once a year may apply for certain accounts with a value of less than $2,000. This fee is not included in the table below. If it was, the estimate of expenses you paid during the period would be higher, and your ending account value lower, by this amount. In addition, the Fund, as a shareholder in the underlying Fidelity Central Funds, will indirectly bear its pro-rata share of the fees and expenses incurred by the underlying Fidelity Central Funds. These fees and expenses are not included in the Fund's annualized expense ratio used to calculate the expense estimate in the table below.
Hypothetical Example for Comparison Purposes
The second line of the accompanying table for each class of the Fund provides information about hypothetical account values and hypothetical expenses based on a Class' actual expense ratio and an assumed rate of return of 5% per year before expenses, which is not the Class' actual return. The hypothetical account values and expenses may not be used to estimate the actual ending account balance or expenses you paid for the period. You may use this information to compare the ongoing costs of investing in the Fund and other funds. To do so, compare this 5% hypothetical example with the 5% hypothetical examples that appear in the shareholder reports of the other funds. A small balance maintenance fee of $12.00 that is charged once a year may apply for certain accounts with a value of less than $2,000. This fee is not included in the table below. If it was, the estimate of expenses you paid during the period would be higher, and your ending account value lower, by this amount. In addition, the Fund, as a shareholder in the underlying Fidelity Central Funds, will indirectly bear its pro-rata share of the fees and expenses incurred by the underlying Fidelity Central Funds. These fees and expenses are not included in the Fund's annualized expense ratio used to calculate the expense estimate in the table below.
Please note that the expenses shown in the table are meant to highlight your ongoing costs only and do not reflect any transaction costs. Therefore, the second line of the table is useful in comparing ongoing costs only, and will not help you determine the relative total costs of owning different funds. In addition, if these transactional costs were included, your costs would have been higher.
| Annualized Expense Ratio-A | Beginning Account Value November 1, 2015 | Ending Account Value April 30, 2016 | Expenses Paid During Period-B November 1, 2015 to April 30, 2016 | |
| Class A | 1.70% | |||
| Actual | $1,000.00 | $1,017.90 | $8.53 | |
| Hypothetical-C | $1,000.00 | $1,016.41 | $8.52 | |
| Class T | 1.95% | |||
| Actual | $1,000.00 | $1,016.90 | $9.78 | |
| Hypothetical-C | $1,000.00 | $1,015.17 | $9.77 | |
| Class C | 2.45% | |||
| Actual | $1,000.00 | $1,014.00 | $12.27 | |
| Hypothetical-C | $1,000.00 | $1,012.68 | $12.26 | |
| Emerging Markets Discovery | 1.45% | |||
| Actual | $1,000.00 | $1,019.90 | $7.28 | |
| Hypothetical-C | $1,000.00 | $1,017.65 | $7.27 | |
| Class I | 1.45% | |||
| Actual | $1,000.00 | $1,019.10 | $7.28 | |
| Hypothetical-C | $1,000.00 | $1,017.65 | $7.27 |
A Annualized expense ratio reflects expenses net of applicable fee waivers.
B Expenses are equal to each Class' annualized expense ratio, multiplied by the average account value over the period, multiplied by 182/366 (to reflect the one-half year period).
C 5% return per year before expenses
![]()
AEMD-SANN-0616
1.931253.104
Fidelity Advisor® Emerging Markets Discovery Fund - Semi-Annual Report April 30, 2016 Class I is a class of Fidelity® Emerging Markets Discovery Fund |
|
Contents
To view a fund's proxy voting guidelines and proxy voting record for the 12-month period ended June 30, visit http://www.fidelity.com/proxyvotingresults or visit the Securities and Exchange Commission's (SEC) web site at http://www.sec.gov.
You may also call 1-877-208-0098 to request a free copy of the proxy voting guidelines.
Standard & Poor's, S&P and S&P 500 are registered service marks of The McGraw-Hill Companies, Inc. and have been licensed for use by Fidelity Distributors Corporation.
Other third-party marks appearing herein are the property of their respective owners.
All other marks appearing herein are registered or unregistered trademarks or service marks of FMR LLC or an affiliated company. © 2016 FMR LLC. All rights reserved.
This report and the financial statements contained herein are submitted for the general information of the shareholders of the Fund. This report is not authorized for distribution to prospective investors in the Fund unless preceded or accompanied by an effective prospectus.
A fund files its complete schedule of portfolio holdings with the SEC for the first and third quarters of each fiscal year on Form N-Q. Forms N-Q are available on the SEC’s web site at http://www.sec.gov. A fund's Forms N-Q may be reviewed and copied at the SEC’s Public Reference Room in Washington, DC. Information regarding the operation of the SEC's Public Reference Room may be obtained by calling 1-800-SEC-0330.
For a complete list of a fund's portfolio holdings, view the most recent holdings listing, semiannual report, or annual report on Fidelity's web site at http://www.fidelity.com, http://www.advisor.fidelity.com, or http://www.401k.com, as applicable.
NOT FDIC INSURED •MAY LOSE VALUE •NO BANK GUARANTEE
Neither the Fund nor Fidelity Distributors Corporation is a bank.
Investment Summary (Unaudited)
Top Five Stocks as of April 30, 2016
| % of fund's net assets | % of fund's net assets 6 months ago | |
| Hyundai Glovis Co. Ltd. (Korea (South), Air Freight & Logistics) | 1.5 | 1.0 |
| 58.com, Inc. ADR (Cayman Islands, Internet Software & Services) | 1.4 | 1.1 |
| Techtronic Industries Co. Ltd. (Hong Kong, Household Durables) | 1.3 | 2.4 |
| Yandex NV (Netherlands, Internet Software & Services) | 1.3 | 0.0 |
| Advantech Co. Ltd. (Taiwan, Technology Hardware, Storage & Peripherals) | 1.3 | 1.4 |
| 6.8 |
Top Five Market Sectors as of April 30, 2016
| % of fund's net assets | % of fund's net assets 6 months ago | |
| Financials | 18.0 | 18.1 |
| Information Technology | 17.5 | 15.4 |
| Consumer Discretionary | 15.5 | 14.6 |
| Industrials | 14.2 | 17.0 |
| Materials | 9.9 | 10.2 |
Top Five Countries as of April 30, 2016
| (excluding cash equivalents) | % of fund's net assets | % of fund's net assets 6 months ago |
| India | 13.2 | 13.0 |
| Korea (South) | 12.0 | 13.3 |
| Cayman Islands | 10.1 | 11.4 |
| Taiwan | 9.8 | 9.6 |
| Brazil | 7.4 | 4.1 |
Percentages are adjusted for the effect of futures contracts, if applicable.
Asset Allocation (% of fund's net assets)
| As of April 30, 2016 | ||
| Stocks | 97.5% | |
| Short-Term Investments and Net Other Assets (Liabilities) | 2.5% | |

| As of October 31, 2015 | ||
| Stocks | 97.7% | |
| Short-Term Investments and Net Other Assets (Liabilities) | 2.3% | |

Percentages shown as 0.0% may reflect amounts less than 0.05%.
Investments April 30, 2016 (Unaudited)
Showing Percentage of Net Assets
| Common Stocks - 95.2% | |||
| Shares | Value | ||
| Argentina - 0.5% | |||
| Inversiones y Representaciones SA ADR (a) | 22,300 | $330,709 | |
| Bangladesh - 0.4% | |||
| BRAC Bank Ltd. | 449,466 | 237,421 | |
| Bermuda - 1.9% | |||
| Digital China Holdings Ltd. (H Shares) | 154,000 | 106,319 | |
| PAX Global Technology Ltd. | 390,000 | 335,876 | |
| Shangri-La Asia Ltd. | 676,000 | 825,832 | |
| TOTAL BERMUDA | 1,268,027 | ||
| Brazil - 5.7% | |||
| AES Tiete Energia SA unit | 53,700 | 220,468 | |
| BR Properties SA | 81,400 | 243,070 | |
| Cosan SA Industria e Comercio | 32,760 | 303,287 | |
| Direcional Engenharia SA | 219,000 | 391,612 | |
| Fibria Celulose SA | 33,700 | 297,683 | |
| FPC Par Corretora de Seguros | 132,000 | 443,294 | |
| Mills Estruturas e Servicos de Engenharia SA | 26,400 | 32,316 | |
| Minerva SA (b) | 127,100 | 390,622 | |
| QGEP Participacoes SA | 298,500 | 354,112 | |
| Smiles SA | 56,000 | 649,677 | |
| Tegma Gestao Logistica SA | 269,600 | 449,954 | |
| TOTAL BRAZIL | 3,776,095 | ||
| British Virgin Islands - 0.3% | |||
| Dolphin Capital Investors Ltd. (b) | 1,423,300 | 168,972 | |
| Canada - 1.5% | |||
| Pan American Silver Corp. | 30,600 | 479,502 | |
| Torex Gold Resources, Inc. (b) | 306,500 | 544,748 | |
| TOTAL CANADA | 1,024,250 | ||
| Cayman Islands - 10.1% | |||
| 51job, Inc. sponsored ADR (b) | 12,100 | 360,580 | |
| 58.com, Inc. ADR (b) | 16,400 | 896,260 | |
| Casetek Holdings | 48,000 | 216,203 | |
| China State Construction International Holdings Ltd. | 334,000 | 520,273 | |
| GCL-Poly Energy Holdings Ltd. | 1,040,000 | 154,985 | |
| Goodbaby International Holdings Ltd. (b) | 506,000 | 283,408 | |
| Haitian International Holdings Ltd. | 313,000 | 534,029 | |
| Ju Teng International Holdings Ltd. | 416,000 | 186,736 | |
| Kingboard Laminates Holdings Ltd. | 578,500 | 295,747 | |
| Kingsoft Corp. Ltd. | 77,000 | 176,792 | |
| Lee's Pharmaceutical Holdings Ltd. | 366,000 | 296,145 | |
| Pico Far East Holdings Ltd. | 2,320,000 | 628,995 | |
| Semiconductor Manufacturing International Corp. (b) | 2,077,000 | 170,746 | |
| SITC International Holdings Co. Ltd. | 928,000 | 501,557 | |
| Sunny Optical Technology Group Co. Ltd. | 109,000 | 336,184 | |
| TPK Holding Co. Ltd. | 30,000 | 62,966 | |
| Uni-President China Holdings Ltd. | 871,000 | 811,135 | |
| Yirendai Ltd. sponsored ADR (a) | 21,100 | 260,374 | |
| TOTAL CAYMAN ISLANDS | 6,693,115 | ||
| Chile - 4.1% | |||
| Compania Cervecerias Unidas SA sponsored ADR (a) | 22,800 | 511,176 | |
| CorpBanca SA | 40,999,981 | 373,153 | |
| Empresas CMPC SA | 219,687 | 496,783 | |
| Inversiones La Construccion SA | 34,117 | 402,273 | |
| Quinenco SA | 143,799 | 282,951 | |
| Vina Concha y Toro SA | 372,483 | 624,286 | |
| TOTAL CHILE | 2,690,622 | ||
| China - 5.5% | |||
| BBMG Corp. (H Shares) | 775,000 | 566,392 | |
| China Longyuan Power Grid Corp. Ltd. (H Shares) | 331,200 | 229,140 | |
| Huangshan Tourism Development Co. Ltd. | 343,100 | 719,824 | |
| Qingdao Haier Co. Ltd. | 547,886 | 704,951 | |
| Tong Ren Tang Technologies Co. Ltd. (H Shares) | 448,000 | 701,820 | |
| Zhengzhou Yutong Bus Co. Ltd. | 127,619 | 404,301 | |
| Zhuzhou CSR Times Electric Co. Ltd. (H Shares) | 57,000 | 324,315 | |
| TOTAL CHINA | 3,650,743 | ||
| Colombia - 0.3% | |||
| Organizacion Terpel SA | 59,128 | 205,486 | |
| Cyprus - 0.7% | |||
| Global Ports Investment PLC GDR (Reg. S) (b) | 136,700 | 452,477 | |
| Egypt - 0.3% | |||
| Citadel Capital Corp. (b) | 1,032,100 | 172,018 | |
| Georgia - 0.1% | |||
| TBC Bank JSC unit | 8,575 | 90,038 | |
| Greece - 0.7% | |||
| Titan Cement Co. SA (Reg.) | 18,800 | 428,859 | |
| Hong Kong - 2.8% | |||
| BYD Electronic International Co. Ltd. (b) | 146,000 | 83,613 | |
| China Resources Beer Holdings Co. Ltd. | 226,000 | 496,615 | |
| Far East Horizon Ltd. | 532,584 | 422,753 | |
| Techtronic Industries Co. Ltd. | 231,500 | 867,817 | |
| TOTAL HONG KONG | 1,870,798 | ||
| India - 13.2% | |||
| Adani Ports & Special Economic Zone | 133,403 | 478,379 | |
| Alembic Pharmaceuticals Ltd. (b) | 77,612 | 703,965 | |
| Arvind Mills Ltd. (b) | 78,092 | 326,062 | |
| Dr Lal Pathlabs Ltd. | 21,735 | 322,333 | |
| Edelweiss Financial Services Ltd. | 431,938 | 377,476 | |
| Exide Industries Ltd. (b) | 166,764 | 369,677 | |
| Grasim Industries Ltd. | 10,589 | 683,203 | |
| IDFC Ltd. | 317,213 | 232,070 | |
| Iifl Holdings Ltd. (b) | 115,270 | 378,215 | |
| Indraprastha Gas Ltd. (b) | 50,968 | 439,891 | |
| JK Cement Ltd. | 33,493 | 299,128 | |
| LIC Housing Finance Ltd. (b) | 47,601 | 331,288 | |
| Mahindra Lifespace Developers Ltd. (b) | 43,426 | 283,599 | |
| Manappuram General Finance & Leasing Ltd. | 732,000 | 441,346 | |
| Marksans Pharma Ltd. | 462,523 | 319,255 | |
| Mphasis BFL Ltd. | 49,287 | 363,018 | |
| Power Grid Corp. of India Ltd. | 368,175 | 794,820 | |
| Redington India Ltd. (b) | 97,326 | 159,120 | |
| Solar Industries India Ltd. (b) | 5,528 | 282,390 | |
| The Jammu & Kashmir Bank Ltd. | 200,767 | 207,642 | |
| Torrent Pharmaceuticals Ltd. | 30,108 | 648,275 | |
| VST Industries Ltd. (b) | 12,492 | 307,234 | |
| TOTAL INDIA | 8,748,386 | ||
| Indonesia - 1.8% | |||
| Link Net Tbk PT | 1,434,800 | 458,575 | |
| PT Bank Danamon Indonesia Tbk Series A | 820,800 | 204,764 | |
| PT Media Nusantara Citra Tbk | 442,100 | 78,779 | |
| PT Panin Life Tbk (b) | 30,841,700 | 423,290 | |
| TOTAL INDONESIA | 1,165,408 | ||
| Israel - 0.5% | |||
| Bezeq The Israel Telecommunication Corp. Ltd. | 155,760 | 332,242 | |
| Korea (South) - 11.4% | |||
| AMOREPACIFIC Group, Inc. | 2,952 | 432,877 | |
| Binggrea Co. Ltd. | 3,310 | 197,038 | |
| BS Financial Group, Inc. | 40,160 | 325,648 | |
| Com2uS Corp. | 2,269 | 256,276 | |
| Daou Technology, Inc. | 10,330 | 210,987 | |
| Devsisters Co. Ltd. (b) | 6,881 | 145,647 | |
| DGB Financial Group Co. Ltd. | 38,521 | 308,323 | |
| E-Mart Co. Ltd. | 2,431 | 389,367 | |
| Fila Korea Ltd. | 7,708 | 699,703 | |
| Hanon Systems | 47,137 | 423,777 | |
| Hyundai Glovis Co. Ltd. | 5,806 | 962,872 | |
| Hyundai HCN | 81,610 | 263,563 | |
| Hyundai Industrial Development & Construction Co. | 7,283 | 321,026 | |
| Hyundai Wia Corp. | 4,509 | 380,186 | |
| Koh Young Technology, Inc. | 5,832 | 213,799 | |
| Korea Express Co. Ltd. (b) | 2,438 | 413,897 | |
| Korean Reinsurance Co. | 22,174 | 257,415 | |
| Medy-Tox, Inc. | 1,829 | 675,294 | |
| NCSOFT Corp. | 1,959 | 391,569 | |
| Nice Information & Telecom, Inc. | 2,998 | 89,102 | |
| Silicon Works Co. Ltd. | 7,345 | 204,513 | |
| TOTAL KOREA (SOUTH) | 7,562,879 | ||
| Malaysia - 1.3% | |||
| Inari Amertron Bhd | 266,000 | 185,890 | |
| Top Glove Corp. Bhd | 532,500 | 676,104 | |
| TOTAL MALAYSIA | 861,994 | ||
| Mexico - 6.7% | |||
| Fibra Uno Administracion SA de CV | 223,100 | 531,146 | |
| Grupo Aeroportuario del Pacifico S.A.B. de CV Series B | 45,300 | 426,811 | |
| Grupo Comercial Chedraui S.A.B. de CV (a) | 171,700 | 486,618 | |
| Grupo GICSA SA de CV (b) | 256,832 | 201,827 | |
| Industrias Penoles SA de CV | 36,820 | 575,585 | |
| Macquarie Mexican (REIT) | 522,872 | 719,666 | |
| Megacable Holdings S.A.B. de CV unit | 74,500 | 344,036 | |
| Qualitas Controladora S.A.B. de CV | 293,900 | 394,950 | |
| Tenedora Nemak SA de CV | 200,800 | 288,047 | |
| Terrafina (a) | 260,200 | 480,635 | |
| TOTAL MEXICO | 4,449,321 | ||
| Netherlands - 1.3% | |||
| Yandex NV (b) | 41,700 | 853,599 | |
| Pakistan - 0.5% | |||
| Habib Bank Ltd. | 172,400 | 310,812 | |
| Panama - 0.8% | |||
| Copa Holdings SA Class A | 7,800 | 497,250 | |
| Philippines - 0.6% | |||
| Alliance Global Group, Inc. | 1,264,500 | 389,821 | |
| Poland - 1.6% | |||
| Asseco Poland SA | 20,300 | 307,934 | |
| Inter Cars SA | 8,764 | 546,236 | |
| Prime Car Management SA | 19,300 | 195,177 | |
| TOTAL POLAND | 1,049,347 | ||
| Romania - 0.3% | |||
| Banca Transilvania SA | 331,743 | 227,663 | |
| Russia - 0.9% | |||
| Inter Rao Ues JSC (b) | 13,451,004 | 373,278 | |
| Sistema JSFC sponsored GDR | 34,060 | 250,341 | |
| TOTAL RUSSIA | 623,619 | ||
| Singapore - 0.7% | |||
| First (REIT) | 271,800 | 252,630 | |
| First Resources Ltd. | 154,300 | 218,568 | |
| TOTAL SINGAPORE | 471,198 | ||
| South Africa - 2.4% | |||
| Alexander Forbes Group Holdings Ltd. | 491,636 | 247,972 | |
| Imperial Holdings Ltd. | 40,800 | 427,139 | |
| Northam Platinum Ltd. (b)(c) | 122,600 | 417,789 | |
| Reunert Ltd. | 97,700 | 490,997 | |
| TOTAL SOUTH AFRICA | 1,583,897 | ||
| Sri Lanka - 0.6% | |||
| Hatton National Bank PLC | 278,137 | 393,671 | |
| Taiwan - 9.8% | |||
| ADLINK Technology, Inc. | 96,087 | 198,105 | |
| Advantech Co. Ltd. | 120,000 | 846,980 | |
| Chipbond Technology Corp. | 118,000 | 157,075 | |
| Cleanaway Co. Ltd. | 68,000 | 368,387 | |
| CTCI Corp. | 335,000 | 436,082 | |
| Cub Elecparts, Inc. | 44,892 | 543,379 | |
| Elite Semiconductor Memory Technology, Inc. | 137,000 | 111,329 | |
| eMemory Technology, Inc. | 22,000 | 241,092 | |
| Everlight Electronics Co. Ltd. | 152,000 | 212,921 | |
| FLEXium Interconnect, Inc. | 79,442 | 182,970 | |
| Forhouse Corp. | 462,000 | 173,055 | |
| Hermes Microvision, Inc. | 4,000 | 123,208 | |
| Inventec Corp. | 418,000 | 276,268 | |
| Lite-On Technology Corp. | 318,640 | 387,659 | |
| Powertech Technology, Inc. | 175,000 | 354,301 | |
| Radiant Opto-Electronics Corp. | 84,000 | 121,048 | |
| Sirtec International Co. Ltd. | 168,000 | 202,309 | |
| St.Shine Optical Co. Ltd. | 27,000 | 504,845 | |
| Synnex Technology International Corp. | 264,000 | 261,932 | |
| Tong Hsing Electronics Industries Ltd. | 103,000 | 295,579 | |
| Universal Cement Corp. | 281,840 | 180,169 | |
| Vanguard International Semiconductor Corp. | 190,000 | 290,855 | |
| TOTAL TAIWAN | 6,469,548 | ||
| Thailand - 2.4% | |||
| Delta Electronics PCL (For. Reg.) | 110,600 | 228,041 | |
| PTT Global Chemical PCL (For. Reg.) | 240,400 | 430,269 | |
| Star Petroleum Refining PCL | 1,082,800 | 341,088 | |
| Thai Union Frozen Products PCL (For. Reg.) | 1,043,200 | 618,392 | |
| TOTAL THAILAND | 1,617,790 | ||
| Turkey - 1.9% | |||
| Aksa Akrilik Kimya Sanayii | 77,000 | 268,317 | |
| Aselsan A/S | 74,000 | 527,891 | |
| Tupras Turkiye Petrol Rafinelleri A/S | 16,576 | 437,505 | |
| TOTAL TURKEY | 1,233,713 | ||
| United Arab Emirates - 0.4% | |||
| National Bank of Ras Al-Khaimah PSC (b) | 196,514 | 284,105 | |
| United Kingdom - 0.7% | |||
| Bgeo Group PLC | 14,540 | 486,513 | |
| Vietnam - 0.5% | |||
| FTP Corp. | 142,600 | 310,946 | |
| TOTAL COMMON STOCKS | |||
| (Cost $66,186,963) | 62,983,352 | ||
| Nonconvertible Preferred Stocks - 2.3% | |||
| Brazil - 1.7% | |||
| Banco ABC Brasil SA | 72,600 | 250,145 | |
| Banco do Estado Rio Grande do Sul SA | 152,500 | 377,342 | |
| Metalurgica Gerdau SA (PN) | 635,900 | 538,044 | |
| TOTAL BRAZIL | 1,165,531 | ||
| Korea (South) - 0.6% | |||
| LG Chemical Ltd. | 2,215 | 381,838 | |
| TOTAL NONCONVERTIBLE PREFERRED STOCKS | |||
| (Cost $1,424,609) | 1,547,369 | ||
| Principal Amount | Value | ||
| Government Obligations - 0.1% | |||
| United States of America - 0.1% | |||
| U.S. Treasury Bills, yield at date of purchase 0.21% to 0.3% 5/19/16 to 7/14/16 (Cost $79,972) | 80,000 | 79,983 | |
| Shares | Value | ||
| Money Market Funds - 4.7% | |||
| Fidelity Cash Central Fund, 0.38% (d) | 2,015,766 | 2,015,766 | |
| Fidelity Securities Lending Cash Central Fund, 0.42% (d)(e) | 1,092,150 | 1,092,150 | |
| TOTAL MONEY MARKET FUNDS | |||
| (Cost $3,107,916) | 3,107,916 | ||
| TOTAL INVESTMENT PORTFOLIO - 102.3% | |||
| (Cost $70,799,460) | 67,718,620 | ||
| NET OTHER ASSETS (LIABILITIES) - (2.3)% | (1,542,085) | ||
| NET ASSETS - 100% | $66,176,535 |
Categorizations in the Schedule of Investments are based on country or territory of incorporation.
Legend
(a) Security or a portion of the security is on loan at period end.
(b) Non-income producing
(c) Security or a portion of the security purchased on a delayed delivery or when-issued basis.
(d) Affiliated fund that is generally available only to investment companies and other accounts managed by Fidelity Investments. The rate quoted is the annualized seven-day yield of the fund at period end. A complete unaudited listing of the fund's holdings as of its most recent quarter end is available upon request. In addition, each Fidelity Central Fund's financial statements are available on the SEC's website or upon request.
(e) Investment made with cash collateral received from securities on loan.
Affiliated Central Funds
Information regarding fiscal year to date income earned by the Fund from investments in Fidelity Central Funds is as follows:
| Fund | Income earned |
| Fidelity Cash Central Fund | $3,946 |
| Fidelity Securities Lending Cash Central Fund | 5,223 |
| Total | $9,169 |
Investment Valuation
The following is a summary of the inputs used, as of April 30, 2016, involving the Fund's assets and liabilities carried at fair value. The inputs or methodology used for valuing securities may not be an indication of the risk associated with investing in those securities. For more information on valuation inputs, and their aggregation into the levels used below, please refer to the Investment Valuation section in the accompanying Notes to Financial Statements.
| Valuation Inputs at Reporting Date: | ||||
| Description | Total | Level 1 | Level 2 | Level 3 |
| Investments in Securities: | ||||
| Equities: | ||||
| Consumer Discretionary | $10,236,503 | $7,630,451 | $2,606,052 | $-- |
| Consumer Staples | 5,483,928 | 4,176,178 | 1,307,750 | -- |
| Energy | 1,435,992 | 1,435,992 | -- | -- |
| Financials | 11,813,854 | 11,159,031 | 654,823 | -- |
| Health Care | 4,848,036 | 3,850,071 | 997,965 | -- |
| Industrials | 9,371,343 | 7,491,169 | 1,880,174 | -- |
| Information Technology | 11,639,928 | 9,792,930 | 1,846,998 | -- |
| Materials | 6,602,382 | 4,923,928 | 1,678,454 | -- |
| Telecommunication Services | 1,041,158 | 1,041,158 | -- | -- |
| Utilities | 2,057,597 | 1,828,457 | 229,140 | -- |
| Government Obligations | 79,983 | -- | 79,983 | -- |
| Money Market Funds | 3,107,916 | 3,107,916 | -- | -- |
| Total Investments in Securities: | $67,718,620 | $56,437,281 | $11,281,339 | $-- |
The following is a summary of transfers between Level 1 and Level 2 for the period ended April 30, 2016. Transfers are assumed to have occurred at the beginning of the period, and are primarily attributable to the valuation techniques used for foreign equity securities, as discussed in the accompanying Notes to Financial Statements:
| Transfers | Total |
| Level 1 to Level 2 | $513,350 |
| Level 2 to Level 1 | $11,800,840 |
The following is a reconciliation of Investments in Securities and Derivative Instruments for which Level 3 inputs were used in determining value:
| Investments in Securities: | |
| Beginning Balance | $792,670 |
| Net Realized Gain (Loss) on Investment Securities | -- |
| Net Unrealized Gain (Loss) on Investment Securities | -- |
| Cost of Purchases | -- |
| Proceeds of Sales | -- |
| Amortization/Accretion | -- |
| Transfers into Level 3 | -- |
| Transfers out of Level 3 | (792,670) |
| Ending Balance | $-- |
| The change in unrealized gain (loss) for the period attributable to Level 3 securities held at April 30, 2016 | $-- |
The information used in the above reconciliation represents fiscal year to date activity for any Investments in Securities identified as using Level 3 inputs at either the beginning or the end of the current fiscal period. Transfers into Level 3 were attributable to a lack of observable market data resulting from decreases in market activity, decreases in liquidity, security restructuring or corporate actions. Transfers in or out of Level 3 represent the beginning value of any Security or Instrument where a change in the pricing level occurred from the beginning to the end of the period. The cost of purchases and the proceeds of sales may include securities received or delivered through corporate actions or exchanges. Realized and unrealized gains (losses) disclosed in the reconciliation are included in Net Gain (Loss) on the Fund's Statement of Operations.
See accompanying notes which are an integral part of the financial statements.
Financial Statements
Statement of Assets and Liabilities
| April 30, 2016 (Unaudited) | ||
| Assets | ||
| Investment in securities, at value (including securities loaned of $1,056,713) — See accompanying schedule: Unaffiliated issuers (cost $67,691,544) | $64,610,704 | |
| Fidelity Central Funds (cost $3,107,916) | 3,107,916 | |
| Total Investments (cost $70,799,460) | $67,718,620 | |
| Foreign currency held at value (cost $67,248) | 67,236 | |
| Receivable for investments sold | 2,293,237 | |
| Receivable for fund shares sold | 90,727 | |
| Dividends receivable | 92,213 | |
| Distributions receivable from Fidelity Central Funds | 1,961 | |
| Prepaid expenses | 66 | |
| Other receivables | 16,941 | |
| Total assets | 70,281,001 | |
| Liabilities | ||
| Payable to custodian bank | $1,802,368 | |
| Payable for investments purchased | ||
| Regular delivery | 756,311 | |
| Delayed delivery | 35,139 | |
| Payable for fund shares redeemed | 265,965 | |
| Accrued management fee | 58,418 | |
| Distribution and service plan fees payable | 3,166 | |
| Other affiliated payables | 15,898 | |
| Other payables and accrued expenses | 75,051 | |
| Collateral on securities loaned, at value | 1,092,150 | |
| Total liabilities | 4,104,466 | |
| Net Assets | $66,176,535 | |
| Net Assets consist of: | ||
| Paid in capital | $74,137,370 | |
| Undistributed net investment income | 115,022 | |
| Accumulated undistributed net realized gain (loss) on investments and foreign currency transactions | (4,977,675) | |
| Net unrealized appreciation (depreciation) on investments and assets and liabilities in foreign currencies | (3,098,182) | |
| Net Assets | $66,176,535 | |
| Calculation of Maximum Offering Price | ||
| Class A: | ||
| Net Asset Value and redemption price per share ($4,358,567 ÷ 394,003 shares) | $11.06 | |
| Maximum offering price per share (100/94.25 of $11.06) | $11.73 | |
| Class T: | ||
| Net Asset Value and redemption price per share ($2,107,239 ÷ 191,242 shares) | $11.02 | |
| Maximum offering price per share (100/96.50 of $11.02) | $11.42 | |
| Class C: | ||
| Net Asset Value and offering price per share ($1,721,722 ÷ 158,821 shares)(a) | $10.84 | |
| Emerging Markets Discovery: | ||
| Net Asset Value, offering price and redemption price per share ($56,615,815 ÷ 5,096,251 shares) | $11.11 | |
| Class I: | ||
| Net Asset Value, offering price and redemption price per share ($1,373,192 ÷ 123,266 shares) | $11.14 |
(a) Redemption price per share is equal to net asset value less any applicable contingent deferred sales charge.
See accompanying notes which are an integral part of the financial statements.
Statement of Operations
| Six months ended April 30, 2016 (Unaudited) | ||
| Investment Income | ||
| Dividends | $711,619 | |
| Interest | 57 | |
| Income from Fidelity Central Funds | 9,169 | |
| Income before foreign taxes withheld | 720,845 | |
| Less foreign taxes withheld | (45,068) | |
| Total income | 675,777 | |
| Expenses | ||
| Management fee | $273,908 | |
| Transfer agent fees | 79,317 | |
| Distribution and service plan fees | 18,188 | |
| Accounting and security lending fees | 16,831 | |
| Custodian fees and expenses | 80,413 | |
| Independent trustees' compensation | 143 | |
| Registration fees | 29,054 | |
| Audit | 53,294 | |
| Legal | 94 | |
| Miscellaneous | 236 | |
| Total expenses before reductions | 551,478 | |
| Expense reductions | (67,843) | 483,635 |
| Net investment income (loss) | 192,142 | |
| Realized and Unrealized Gain (Loss) | ||
| Net realized gain (loss) on: | ||
| Investment securities: | ||
| Unaffiliated issuers | (2,937,454) | |
| Foreign currency transactions | 260 | |
| Futures contracts | 172,417 | |
| Total net realized gain (loss) | (2,764,777) | |
| Change in net unrealized appreciation (depreciation) on: Investment securities (net of increase in deferred foreign taxes of $8,025) | 3,777,452 | |
| Assets and liabilities in foreign currencies | 10,070 | |
| Total change in net unrealized appreciation (depreciation) | 3,787,522 | |
| Net gain (loss) | 1,022,745 | |
| Net increase (decrease) in net assets resulting from operations | $1,214,887 |
See accompanying notes which are an integral part of the financial statements.
Statement of Changes in Net Assets
| Six months ended April 30, 2016 (Unaudited) | Year ended October 31, 2015 | |
| Increase (Decrease) in Net Assets | ||
| Operations | ||
| Net investment income (loss) | $192,142 | $749,160 |
| Net realized gain (loss) | (2,764,777) | (1,932,100) |
| Change in net unrealized appreciation (depreciation) | 3,787,522 | (8,002,533) |
| Net increase (decrease) in net assets resulting from operations | 1,214,887 | (9,185,473) |
| Distributions to shareholders from net investment income | (490,717) | – |
| Share transactions - net increase (decrease) | (5,938,352) | (6,487,831) |
| Redemption fees | 30,593 | 32,392 |
| Total increase (decrease) in net assets | (5,183,589) | (15,640,912) |
| Net Assets | ||
| Beginning of period | 71,360,124 | 87,001,036 |
| End of period (including undistributed net investment income of $115,022 and undistributed net investment income of $413,597, respectively) | $66,176,535 | $71,360,124 |
See accompanying notes which are an integral part of the financial statements.
Financial Highlights — Fidelity Emerging Markets Discovery Fund Class A
| Six months ended (Unaudited) April 30, | Years ended October 31, | ||||
| 2016 | 2015 | 2014 | 2013 | 2012 A | |
| Selected Per–Share Data | |||||
| Net asset value, beginning of period | $10.92 | $12.17 | $12.49 | $11.89 | $10.00 |
| Income from Investment Operations | |||||
| Net investment income (loss)B | .02 | .09C | .04 | .08 | .12 |
| Net realized and unrealized gain (loss) | .17 | (1.34) | (.01) | .75 | 1.76 |
| Total from investment operations | .19 | (1.25) | .03 | .83 | 1.88 |
| Distributions from net investment income | (.05) | – | (.06) | (.04) | (.01) |
| Distributions from net realized gain | – | – | (.30) | (.20) | – |
| Total distributions | (.05) | – | (.36) | (.25)D | (.01) |
| Redemption fees added to paid in capitalB | –E | –E | .01 | .02 | .02 |
| Net asset value, end of period | $11.06 | $10.92 | $12.17 | $12.49 | $11.89 |
| Total ReturnF,G,H | 1.79% | (10.27)% | .31% | 7.20% | 19.00% |
| Ratios to Average Net AssetsI,J | |||||
| Expenses before reductions | 1.97%K | 1.88% | 1.82% | 1.87% | 3.49% |
| Expenses net of fee waivers, if any | 1.70%K | 1.70% | 1.70% | 1.70% | 1.70% |
| Expenses net of all reductions | 1.69%K | 1.69% | 1.70% | 1.64% | 1.64% |
| Net investment income (loss) | .40%K | .76%C | .29% | .62% | 1.16% |
| Supplemental Data | |||||
| Net assets, end of period (000 omitted) | $4,359 | $4,660 | $4,362 | $5,065 | $1,671 |
| Portfolio turnover rateL | 63%K | 103% | 148% | 179% | 83% |
A For the period November 1, 2011 (commencement of operations) to October 31, 2012.
B Calculated based on average shares outstanding during the period.
C Net Investment income per share reflects a large, non-recurring dividend which amounted to $.06 per share. Excluding this non-recurring dividend, the ratio of net investment income (loss) to average net assets would have been .22%.
D Total distributions of $.25 per share is comprised of distributions from net investment income of $.044 and distributions from net realized gain of $.203 per share.
E Amount represents less than $.005 per share.
F Total returns for periods of less than one year are not annualized.
G Total returns would have been lower if certain expenses had not been reduced during the applicable periods shown.
H Total returns do not include the effect of the sales charges.
I Fees and expenses of any underlying Fidelity Central Funds are not included in the Fund's expense ratio. The Fund indirectly bears its proportionate share of the expenses of any underlying Fidelity Central Funds.
J Expense ratios reflect operating expenses of the class. Expenses before reductions do not reflect amounts reimbursed by the investment adviser or reductions from brokerage service arrangements or reductions from other expense offset arrangements and do not represent the amount paid by the class during periods when reimbursements or reductions occur. Expense ratios before reductions for start-up periods may not be representative of longer-term operating periods. Expenses net of fee waivers reflect expenses after reimbursement by the investment adviser but prior to reductions from brokerage service arrangements or other expense offset arrangements. Expenses net of all reductions represent the net expenses paid by the class.
K Annualized
L Amount does not include the portfolio activity of any underlying Fidelity Central Funds.
See accompanying notes which are an integral part of the financial statements.
Financial Highlights — Fidelity Emerging Markets Discovery Fund Class T
| Six months ended (Unaudited) April 30, | Years ended October 31, | ||||
| 2016 | 2015 | 2014 | 2013 | 2012 A | |
| Selected Per–Share Data | |||||
| Net asset value, beginning of period | $10.86 | $12.13 | $12.44 | $11.87 | $10.00 |
| Income from Investment Operations | |||||
| Net investment income (loss)B | .01 | .06C | –D | .05 | .10 |
| Net realized and unrealized gain (loss) | .17 | (1.33) | –D | .74 | 1.75 |
| Total from investment operations | .18 | (1.27) | –D | .79 | 1.85 |
| Distributions from net investment income | (.02) | – | (.02) | (.03) | –D |
| Distributions from net realized gain | – | – | (.30) | (.20) | – |
| Total distributions | (.02) | – | (.32) | (.24)E | –D |
| Redemption fees added to paid in capitalB | –D | –D | .01 | .02 | .02 |
| Net asset value, end of period | $11.02 | $10.86 | $12.13 | $12.44 | $11.87 |
| Total ReturnF,G,H | 1.69% | (10.47)% | .05% | 6.87% | 18.75% |
| Ratios to Average Net AssetsI,J | |||||
| Expenses before reductions | 2.26%K | 2.16% | 2.10% | 2.19% | 3.77% |
| Expenses net of fee waivers, if any | 1.95%K | 1.95% | 1.95% | 1.95% | 1.95% |
| Expenses net of all reductions | 1.94%K | 1.94% | 1.95% | 1.89% | 1.89% |
| Net investment income (loss) | .15%K | .51%C | .04% | .37% | .91% |
| Supplemental Data | |||||
| Net assets, end of period (000 omitted) | $2,107 | $2,015 | $2,031 | $1,914 | $1,700 |
| Portfolio turnover rateL | 63%K | 103% | 148% | 179% | 83% |
A For the period November 1, 2011 (commencement of operations) to October 31, 2012.
B Calculated based on average shares outstanding during the period.
C Net Investment income per share reflects a large, non-recurring dividend which amounted to $.06 per share. Excluding this non-recurring dividend, the ratio of net investment income (loss) to average net assets would have been (.03) %.
D Amount represents less than $.005 per share.
E Total distributions of $.24 per share is comprised of distributions from net investment income of $.034 and distributions from net realized gain of $.203 per share.
F Total returns for periods of less than one year are not annualized.
G Total returns would have been lower if certain expenses had not been reduced during the applicable periods shown.
H Total returns do not include the effect of the sales charges.
I Fees and expenses of any underlying Fidelity Central Funds are not included in the Fund's expense ratio. The Fund indirectly bears its proportionate share of the expenses of any underlying Fidelity Central Funds.
J Expense ratios reflect operating expenses of the class. Expenses before reductions do not reflect amounts reimbursed by the investment adviser or reductions from brokerage service arrangements or reductions from other expense offset arrangements and do not represent the amount paid by the class during periods when reimbursements or reductions occur. Expense ratios before reductions for start-up periods may not be representative of longer-term operating periods. Expenses net of fee waivers reflect expenses after reimbursement by the investment adviser but prior to reductions from brokerage service arrangements or other expense offset arrangements. Expenses net of all reductions represent the net expenses paid by the class.
K Annualized
L Amount does not include the portfolio activity of any underlying Fidelity Central Funds.
See accompanying notes which are an integral part of the financial statements.
Financial Highlights — Fidelity Emerging Markets Discovery Fund Class C
| Six months ended (Unaudited) April 30, | Years ended October 31, | ||||
| 2016 | 2015 | 2014 | 2013 | 2012 A | |
| Selected Per–Share Data | |||||
| Net asset value, beginning of period | $10.69 | $12.00 | $12.35 | $11.82 | $10.00 |
| Income from Investment Operations | |||||
| Net investment income (loss)B | (.02) | –C,D | (.06) | (.02) | .04 |
| Net realized and unrealized gain (loss) | .17 | (1.31) | –D | .74 | 1.76 |
| Total from investment operations | .15 | (1.31) | (.06) | .72 | 1.80 |
| Distributions from net investment income | – | – | – | (.01) | – |
| Distributions from net realized gain | – | – | (.30) | (.20) | – |
| Total distributions | – | – | (.30) | (.21) | – |
| Redemption fees added to paid in capitalB | –D | –D | .01 | .02 | .02 |
| Net asset value, end of period | $10.84 | $10.69 | $12.00 | $12.35 | $11.82 |
| Total ReturnE,F,G | 1.40% | (10.92)% | (.42)% | 6.32% | 18.20% |
| Ratios to Average Net AssetsH,I | |||||
| Expenses before reductions | 2.72%J | 2.64% | 2.58% | 2.70% | 4.32% |
| Expenses net of fee waivers, if any | 2.45%J | 2.45% | 2.45% | 2.45% | 2.45% |
| Expenses net of all reductions | 2.44%J | 2.44% | 2.45% | 2.39% | 2.39% |
| Net investment income (loss) | (.35)%J | .01%C | (.46)% | (.13)% | .41% |
| Supplemental Data | |||||
| Net assets, end of period (000 omitted) | $1,722 | $1,675 | $1,750 | $2,082 | $1,474 |
| Portfolio turnover rateK | 63%J | 103% | 148% | 179% | 83% |
A For the period November 1, 2011 (commencement of operations) to October 31, 2012.
B Calculated based on average shares outstanding during the period.
C Net Investment income per share reflects a large, non-recurring dividend which amounted to $.06 per share. Excluding this non-recurring dividend, the ratio of net investment income (loss) to average net assets would have been (.52) %.
D Amount represents less than $.005 per share.
E Total returns for periods of less than one year are not annualized.
F Total returns would have been lower if certain expenses had not been reduced during the applicable periods shown.
G Total returns do not include the effect of the contingent deferred sales charge.
H Fees and expenses of any underlying Fidelity Central Funds are not included in the Fund's expense ratio. The Fund indirectly bears its proportionate share of the expenses of any underlying Fidelity Central Funds.
I Expense ratios reflect operating expenses of the class. Expenses before reductions do not reflect amounts reimbursed by the investment adviser or reductions from brokerage service arrangements or reductions from other expense offset arrangements and do not represent the amount paid by the class during periods when reimbursements or reductions occur. Expense ratios before reductions for start-up periods may not be representative of longer-term operating periods. Expenses net of fee waivers reflect expenses after reimbursement by the investment adviser but prior to reductions from brokerage service arrangements or other expense offset arrangements. Expenses net of all reductions represent the net expenses paid by the class.
J Annualized
K Amount does not include the portfolio activity of any underlying Fidelity Central Funds.
See accompanying notes which are an integral part of the financial statements.
Financial Highlights — Fidelity Emerging Markets Discovery Fund
| Six months ended (Unaudited) April 30, | Years ended October 31, | ||||
| 2016 | 2015 | 2014 | 2013 | 2012 A | |
| Selected Per–Share Data | |||||
| Net asset value, beginning of period | $10.98 | $12.21 | $12.52 | $11.92 | $10.00 |
| Income from Investment Operations | |||||
| Net investment income (loss)B | .03 | .12C | .07 | .11 | .15 |
| Net realized and unrealized gain (loss) | .19 | (1.35) | –D | .74 | 1.76 |
| Total from investment operations | .22 | (1.23) | .07 | .85 | 1.91 |
| Distributions from net investment income | (.09) | – | (.09) | (.07) | (.01) |
| Distributions from net realized gain | – | – | (.30) | (.20) | – |
| Total distributions | (.09) | – | (.39) | (.27) | (.01) |
| Redemption fees added to paid in capitalB | –D | –D | .01 | .02 | .02 |
| Net asset value, end of period | $11.11 | $10.98 | $12.21 | $12.52 | $11.92 |
| Total ReturnE,F | 1.99% | (10.07)% | .61% | 7.37% | 19.35% |
| Ratios to Average Net AssetsG,H | |||||
| Expenses before reductions | 1.64%I | 1.56% | 1.48% | 1.57% | 3.02% |
| Expenses net of fee waivers, if any | 1.45%I | 1.45% | 1.45% | 1.45% | 1.45% |
| Expenses net of all reductions | 1.44%I | 1.44% | 1.45% | 1.39% | 1.39% |
| Net investment income (loss) | .65%I | 1.01%C | .54% | .87% | 1.41% |
| Supplemental Data | |||||
| Net assets, end of period (000 omitted) | $56,616 | $61,601 | $78,377 | $96,731 | $39,135 |
| Portfolio turnover rateJ | 63%I | 103% | 148% | 179% | 83% |
A For the period November 1, 2011 (commencement of operations) to October 31, 2012.
B Calculated based on average shares outstanding during the period.
C Net Investment income per share reflects a large, non-recurring dividend which amounted to $.06 per share. Excluding this non-recurring dividend, the ratio of net investment income (loss) to average net assets would have been .48%.
D Amount represents less than $.005 per share.
E Total returns for periods of less than one year are not annualized.
F Total returns would have been lower if certain expenses had not been reduced during the applicable periods shown.
G Fees and expenses of any underlying Fidelity Central Funds are not included in the Fund's expense ratio. The Fund indirectly bears its proportionate share of the expenses of any underlying Fidelity Central Funds.
H Expense ratios reflect operating expenses of the class. Expenses before reductions do not reflect amounts reimbursed by the investment adviser or reductions from brokerage service arrangements or reductions from other expense offset arrangements and do not represent the amount paid by the class during periods when reimbursements or reductions occur. Expense ratios before reductions for start-up periods may not be representative of longer-term operating periods. Expenses net of fee waivers reflect expenses after reimbursement by the investment adviser but prior to reductions from brokerage service arrangements or other expense offset arrangements. Expenses net of all reductions represent the net expenses paid by the class.
I Annualized
J Amount does not include the portfolio activity of any underlying Fidelity Central Funds.
See accompanying notes which are an integral part of the financial statements.
Financial Highlights — Fidelity Emerging Markets Discovery Fund Class I
| Six months ended (Unaudited) April 30, | Years ended October 31, | ||||
| 2016 | 2015 | 2014 | 2013 | 2012 A | |
| Selected Per–Share Data | |||||
| Net asset value, beginning of period | $11.02 | $12.25 | $12.53 | $11.92 | $10.00 |
| Income from Investment Operations | |||||
| Net investment income (loss)B | .03 | .12C | .07 | .11 | .15 |
| Net realized and unrealized gain (loss) | .18 | (1.35) | –D | .75 | 1.76 |
| Total from investment operations | .21 | (1.23) | .07 | .86 | 1.91 |
| Distributions from net investment income | (.09) | – | (.06) | (.07) | (.01) |
| Distributions from net realized gain | – | – | (.30) | (.20) | – |
| Total distributions | (.09) | – | (.36) | (.27) | (.01) |
| Redemption fees added to paid in capitalB | –D | –D | .01 | .02 | .02 |
| Net asset value, end of period | $11.14 | $11.02 | $12.25 | $12.53 | $11.92 |
| Total ReturnE,F | 1.91% | (10.04)% | .61% | 7.45% | 19.35% |
| Ratios to Average Net AssetsG,H | |||||
| Expenses before reductions | 1.61%I | 1.54% | 1.56% | 1.60% | 3.21% |
| Expenses net of fee waivers, if any | 1.45%I | 1.45% | 1.45% | 1.45% | 1.45% |
| Expenses net of all reductions | 1.44%I | 1.43% | 1.45% | 1.39% | 1.39% |
| Net investment income (loss) | .65%I | 1.01%C | .54% | .87% | 1.41% |
| Supplemental Data | |||||
| Net assets, end of period (000 omitted) | $1,373 | $1,410 | $481 | $1,076 | $1,825 |
| Portfolio turnover rateJ | 63%I | 103% | 148% | 179% | 83% |
A For the period November 1, 2011 (commencement of operations) to October 31, 2012.
B Calculated based on average shares outstanding during the period.
C Net Investment income per share reflects a large, non-recurring dividend which amounted to $.06 per share. Excluding this non-recurring dividend, the ratio of net investment income (loss) to average net assets would have been .48%.
D Amount represents less than $.005 per share.
E Total returns for periods of less than one year are not annualized.
F Total returns would have been lower if certain expenses had not been reduced during the applicable periods shown.
G Fees and expenses of any underlying Fidelity Central Funds are not included in the Fund's expense ratio. The Fund indirectly bears its proportionate share of the expenses of any underlying Fidelity Central Funds.
H Expense ratios reflect operating expenses of the class. Expenses before reductions do not reflect amounts reimbursed by the investment adviser or reductions from brokerage service arrangements or reductions from other expense offset arrangements and do not represent the amount paid by the class during periods when reimbursements or reductions occur. Expense ratios before reductions for start-up periods may not be representative of longer-term operating periods. Expenses net of fee waivers reflect expenses after reimbursement by the investment adviser but prior to reductions from brokerage service arrangements or other expense offset arrangements. Expenses net of all reductions represent the net expenses paid by the class.
I Annualized
J Amount does not include the portfolio activity of any underlying Fidelity Central Funds.
See accompanying notes which are an integral part of the financial statements.
Notes to Financial Statements (Unaudited)
For the period ended April 30, 2016
1. Organization.
Fidelity Emerging Markets Discovery Fund (the Fund) is a fund of Fidelity Investment Trust (the Trust) and is authorized to issue an unlimited number of shares. The Trust is registered under the Investment Company Act of 1940, as amended (the 1940 Act), as an open-end management investment company organized as a Massachusetts business trust. The Fund offers Class A, Class T, Class C, Emerging Markets Discovery and Class I shares, each of which has equal rights as to assets and voting privileges. Each class has exclusive voting rights with respect to matters that affect that class. The Fund's investments in emerging markets can be subject to social, economic, regulatory, and political uncertainties and can be extremely volatile.
2. Investments in Fidelity Central Funds.
The Fund invests in Fidelity Central Funds, which are open-end investment companies generally available only to other investment companies and accounts managed by the investment adviser and its affiliates. The Fund's Schedule of Investments lists each of the Fidelity Central Funds held as of period end, if any, as an investment of the Fund, but does not include the underlying holdings of each Fidelity Central Fund. As an Investing Fund, the Fund indirectly bears its proportionate share of the expenses of the underlying Fidelity Central Funds.
The Money Market Central Funds seek preservation of capital and current income and are managed by Fidelity Investments Money Management, Inc. (FIMM), an affiliate of the investment adviser. Annualized expenses of the Money Market Central Funds as of their most recent shareholder report date are less than .005%.
A complete unaudited list of holdings for each Fidelity Central Fund is available upon request or at the Securities and Exchange Commission (the SEC) website at www.sec.gov. In addition, the financial statements of the Fidelity Central Funds are available on the SEC website or upon request.
3. Significant Accounting Policies.
The financial statements have been prepared in conformity with accounting principles generally accepted in the United States of America (GAAP), which require management to make certain estimates and assumptions at the date of the financial statements. Actual results could differ from those estimates. Subsequent events, if any, through the date that the financial statements were issued have been evaluated in the preparation of the financial statements. The following summarizes the significant accounting policies of the Fund:
Investment Valuation. Investments are valued as of 4:00 p.m. Eastern time on the last calendar day of the period. The Board of Trustees (the Board) has delegated the day to day responsibility for the valuation of the Fund's investments to the Fidelity Management & Research Company (FMR) Fair Value Committee (the Committee). In accordance with valuation policies and procedures approved by the Board, the Fund attempts to obtain prices from one or more third party pricing vendors or brokers to value its investments. When current market prices, quotations or currency exchange rates are not readily available or reliable, investments will be fair valued in good faith by the Committee, in accordance with procedures adopted by the Board. Factors used in determining fair value vary by investment type and may include market or investment specific events, changes in interest rates and credit quality. The frequency with which these procedures are used cannot be predicted and they may be utilized to a significant extent. The Committee oversees the Fund's valuation policies and procedures and reports to the Board on the Committee's activities and fair value determinations. The Board monitors the appropriateness of the procedures used in valuing the Fund's investments and ratifies the fair value determinations of the Committee.
The Fund categorizes the inputs to valuation techniques used to value its investments into a disclosure hierarchy consisting of three levels as shown below:
- Level 1 – quoted prices in active markets for identical investments
- Level 2 – other significant observable inputs (including quoted prices for similar investments, interest rates, prepayment speeds, etc.)
- Level 3 – unobservable inputs (including the Fund's own assumptions based on the best information available)
Valuation techniques used to value the Fund's investments by major category are as follows:
Equity securities, including restricted securities, for which market quotations are readily available, are valued at the last reported sale price or official closing price as reported by a third party pricing vendor on the primary market or exchange on which they are traded and are categorized as Level 1 in the hierarchy. In the event there were no sales during the day or closing prices are not available, securities are valued at the last quoted bid price or may be valued using the last available price and are generally categorized as Level 2 in the hierarchy. For foreign equity securities, when market or security specific events arise, comparisons to the valuation of American Depositary Receipts (ADRs), futures contracts, Exchange-Traded Funds (ETFs) and certain indexes as well as quoted prices for similar securities may be used and would be categorized as Level 2 in the hierarchy. Utilizing these techniques may result in transfers between Level 1 and Level 2. For equity securities, including restricted securities, where observable inputs are limited, assumptions about market activity and risk are used and these securities may be categorized as Level 3 in the hierarchy.
Debt securities, including restricted securities, are valued based on evaluated prices received from third party pricing vendors or from brokers who make markets in such securities. U.S. government and government agency obligations are valued by pricing vendors who utilize matrix pricing which considers yield or price of bonds of comparable quality, coupon, maturity and type or by broker-supplied prices. When independent prices are unavailable or unreliable, debt securities may be valued utilizing pricing methodologies which consider similar factors that would be used by third party pricing vendors. Debt securities are generally categorized as Level 2 in the hierarchy but may be Level 3 depending on the circumstances.
Investments in open-end mutual funds, including the Fidelity Central Funds, are valued at their closing net asset value (NAV) each business day and are categorized as Level 1 in the hierarchy.
Changes in valuation techniques may result in transfers in or out of an assigned level within the disclosure hierarchy. The aggregate value of investments by input level as of April 30, 2016, including information on transfers between Levels 1 and 2, as well as a roll forward of Level 3 investments, is included at the end of the Fund's Schedule of Investments.
Foreign Currency. The Fund may use foreign currency contracts to facilitate transactions in foreign-denominated securities. Gains and losses from these transactions may arise from changes in the value of the foreign currency or if the counterparties do not perform under the contracts' terms.
Foreign-denominated assets, including investment securities, and liabilities are translated into U.S. dollars at the exchange rates at period end. Purchases and sales of investment securities, income and dividends received and expenses denominated in foreign currencies are translated into U.S. dollars at the exchange rate in effect on the transaction date.
The effects of exchange rate fluctuations on investments are included with the net realized and unrealized gain (loss) on investment securities. Other foreign currency transactions resulting in realized and unrealized gain (loss) are disclosed separately.
Investment Transactions and Income. For financial reporting purposes, the Fund's investment holdings and NAV include trades executed through the end of the last business day of the period. The NAV per share for processing shareholder transactions is calculated as of the close of business of the New York Stock Exchange (NYSE), normally 4:00 p.m. Eastern time and includes trades executed through the end of the prior business day. Gains and losses on securities sold are determined on the basis of identified cost. Dividend income is recorded on the ex-dividend date, except for certain dividends from foreign securities where the ex-dividend date may have passed, which are recorded as soon as the Fund is informed of the ex-dividend date. Non-cash dividends included in dividend income, if any, are recorded at the fair market value of the securities received. Income and capital gain distributions from Fidelity Central Funds, if any, are recorded on the ex-dividend date. Interest income is accrued as earned and includes coupon interest and amortization of premium and accretion of discount on debt securities as applicable. Investment income is recorded net of foreign taxes withheld where recovery of such taxes is uncertain.
Class Allocations and Expenses. Investment income, realized and unrealized capital gains and losses, common expenses of the Fund, and certain fund-level expense reductions, if any, are allocated daily on a pro-rata basis to each class based on the relative net assets of each class to the total net assets of the Fund. Each class differs with respect to transfer agent and distribution and service plan fees incurred. Certain expense reductions may also differ by class. For the reporting period, the allocated portion of income and expenses to each class as a percent of its average net assets may vary due to the timing of recording these transactions in relation to fluctuating net assets of the classes. Expenses directly attributable to a fund are charged to that fund. Expenses attributable to more than one fund are allocated among the respective funds on the basis of relative net assets or other appropriate methods. Expense estimates are accrued in the period to which they relate and adjustments are made when actual amounts are known.
Income Tax Information and Distributions to Shareholders. Each year, the Fund intends to qualify as a regulated investment company under Subchapter M of the Internal Revenue Code, including distributing substantially all of its taxable income and realized gains. As a result, no provision for U.S. Federal income taxes is required. The Fund files a U.S. federal tax return, in addition to state and local tax returns as required. The Fund's federal income tax returns are subject to examination by the Internal Revenue Service (IRS) for a period of three fiscal years after they are filed. State and local tax returns may be subject to examination for an additional fiscal year depending on the jurisdiction. Foreign taxes are provided for based on the Fund's understanding of the tax rules and rates that exist in the foreign markets in which it invests. The Fund is subject to a tax imposed on capital gains by certain countries in which it invests. An estimated deferred tax liability for net unrealized appreciation on the applicable securities is included in Other payables and accrued expenses on the Statement of Assets & Liabilities.
Distributions are declared and recorded on the ex-dividend date. Income dividends and capital gain distributions are declared separately for each class. Income and capital gain distributions are determined in accordance with income tax regulations, which may differ from GAAP.
Capital accounts within the financial statements are adjusted for permanent book-tax differences. These adjustments have no impact on net assets or the results of operations. Capital accounts are not adjusted for temporary book-tax differences which will reverse in a subsequent period.
Book-tax differences are primarily due to foreign currency transactions, futures transactions, certain foreign taxes, passive foreign investment companies (PFIC), capital loss carryforwards and losses deferred due to wash sales.
The federal tax cost of investment securities and unrealized appreciation (depreciation) as of period end were as follows:
| Gross unrealized appreciation | $5,799,157 |
| Gross unrealized depreciation | (9,248,368) |
| Net unrealized appreciation (depreciation) on securities | $(3,449,211) |
| Tax cost | $71,167,831 |
Capital loss carryforwards are only available to offset future capital gains of the Fund to the extent provided by regulations and may be limited. Under the Regulated Investment Company Modernization Act of 2010 (the Act), the Fund is permitted to carry forward capital losses incurred in taxable years beginning after December 22, 2010 for an unlimited period and such capital losses are required to be used prior to any losses that expire. The capital loss carryforward information presented below, including any applicable limitation, is estimated as of prior fiscal period end and is subject to adjustment.
| No expiration | |
| Short-term | $(1,731,575) |
Short-Term Trading (Redemption) Fees. Shares held by investors in the Fund less than 90 days may have been subject to a redemption fee equal to 2.00% of the NAV of shares redeemed. All redemption fees, which reduce the proceeds of the shareholder redemption, are retained by the Fund and accounted for as an addition to paid in capital.
Delayed Delivery Transactions and When-Issued Securities. During the period, the Fund transacted in securities on a delayed delivery or when-issued basis. Payment and delivery may take place after the customary settlement period for that security. The price of the underlying securities and the date when the securities will be delivered and paid for are fixed at the time the transaction is negotiated. The securities purchased on a delayed delivery or when-issued basis are identified as such in the Fund's Schedule of Investments. The Fund may receive compensation for interest forgone in the purchase of a delayed delivery or when-issued security. With respect to purchase commitments, the Fund identifies securities as segregated in its records with a value at least equal to the amount of the commitment. Losses may arise due to changes in the value of the underlying securities or if the counterparty does not perform under the contract's terms, or if the issuer does not issue the securities due to political, economic, or other factors.
4. Derivative Instruments.
Risk Exposures and the Use of Derivative Instruments. The Fund's investment objective allows the Fund to enter into various types of derivative contracts, including futures contracts. Derivatives are investments whose value is primarily derived from underlying assets, indices or reference rates and may be transacted on an exchange or over-the-counter (OTC). Derivatives may involve a future commitment to buy or sell a specified asset based on specified terms, to exchange future cash flows at periodic intervals based on a notional principal amount, or for one party to make one or more payments upon the occurrence of specified events in exchange for periodic payments from the other party.
The Fund used derivatives to increase returns and to manage exposure to certain risks as defined below. The success of any strategy involving derivatives depends on analysis of numerous economic factors, and if the strategies for investment do not work as intended, the Fund may not achieve its objectives.
The Fund's use of derivatives increased or decreased its exposure to the following risk:
| Equity Risk | Equity risk relates to the fluctuations in the value of financial instruments as a result of changes in market prices (other than those arising from interest rate risk or foreign exchange risk), whether caused by factors specific to an individual investment, its issuer, or all factors affecting all instruments traded in a market or market segment. |
The Fund is also exposed to additional risks from investing in derivatives, such as liquidity risk and counterparty credit risk. Liquidity risk is the risk that the Fund will be unable to close out the derivative in the open market in a timely manner. Counterparty credit risk is the risk that the counterparty will not be able to fulfill its obligation to the Fund. Counterparty credit risk related to exchange-traded futures contracts may be mitigated by the protection provided by the exchange on which they trade.
Investing in derivatives may involve greater risks than investing in the underlying assets directly and, to varying degrees, may involve risk of loss in excess of any initial investment and collateral received and amounts recognized in the Statement of Assets and Liabilities. In addition, there may be the risk that the change in value of the derivative contract does not correspond to the change in value of the underlying instrument.
Futures Contracts. A futures contract is an agreement between two parties to buy or sell a specified underlying instrument for a fixed price at a specified future date. The Fund used futures contracts to manage its exposure to the stock market.
Upon entering into a futures contract, a fund is required to deposit either cash or securities (initial margin) with a clearing broker in an amount equal to a certain percentage of the face value of the contract. Futures contracts are marked-to-market daily and subsequent daily payments (variation margin) are made or received by a fund depending on the daily fluctuations in the value of the futures contracts and are recorded as unrealized appreciation or (depreciation). This receivable and/or payable, if any, is included in daily variation margin for derivative instruments in the Statement of Assets and Liabilities. Realized gain or (loss) is recorded upon the expiration or closing of a futures contract. The net realized gain (loss) and change in net unrealized appreciation (depreciation) on futures contracts during the period is included in the Statement of Operations.
Any open futures contracts at period end are presented in the Schedule of Investments under the caption "Futures Contracts". The underlying face amount at value reflects each contract's exposure to the underlying instrument or index at period end.
During the period the Fund recognized net realized gain (loss) of $172,417 related to its investment in futures contracts. This amount is included in the Statement of Operations.
5. Purchases and Sales of Investments.
Purchases and sales of securities, other than short-term securities, aggregated $19,964,528 and $25,414,601, respectively.
6. Fees and Other Transactions with Affiliates.
Management Fee. Fidelity Management & Research Company (the investment adviser) and its affiliates provide the Fund with investment management related services for which the Fund pays a monthly management fee. The management fee is the sum of an individual fund fee rate that is based on an annual rate of .60% of the Fund's average net assets and an annualized group fee rate that averaged .25% during the period. The group fee rate is based upon the average net assets of all the mutual funds advised by the investment adviser, including any mutual funds previously advised by the investment adviser that are currently advised by Fidelity SelectCo, LLC, an affiliate of the investment adviser. The group fee rate decreases as assets under management increase and increases as assets under management decrease. For the reporting period, the total annualized management fee rate was .85% of the Fund's average net assets.
Distribution and Service Plan Fees. In accordance with Rule 12b-1 of the 1940 Act, the Fund has adopted separate Distribution and Service Plans for each class of shares. Certain classes pay Fidelity Distributors Corporation (FDC), an affiliate of the investment adviser, separate Distribution and Service Fees, each of which is based on an annual percentage of each class' average net assets. In addition, FDC may pay financial intermediaries for selling shares of the Fund and providing shareholder support services. For the period, the Distribution and Service Fee rates, total fees and amounts retained by FDC were as follows:
| Distribution Fee | Service Fee | Total Fees | Retained by FDC | |
| Class A | -% | .25% | $5,319 | $166 |
| Class T | .25% | .25% | 4,870 | 17 |
| Class C | .75% | .25% | 7,999 | 2,824 |
| $18,188 | $3,007 |
Sales Load. FDC may receive a front-end sales charge of up to 5.75% for selling Class A shares and 3.50% for selling Class T shares, some of which is paid to financial intermediaries for selling shares of the Fund. Depending on the holding period, FDC may receive contingent deferred sales charges levied on Class A, Class T, and Class C redemptions. The deferred sales charges are 1.00% for Class C shares, 1.00% for certain purchases of Class A shares and .25% for certain purchases of Class T shares.
For the period, sales charge amounts retained by FDC were as follows:
| Retained by FDC | |
| Class A | $1,176 |
| Class T | 567 |
| Class C(a) | 89 |
| $1,832 |
(a) When Class C shares are initially sold, FDC pays commissions from its own resources to financial intermediaries through which the sales are made.
Transfer Agent Fees. Fidelity Investments Institutional Operations Company, Inc., (FIIOC), an affiliate of the investment adviser, is the transfer, dividend disbursing and shareholder servicing agent for each class of the Fund. FIIOC receives account fees and asset-based fees that vary according to the account size and type of account of the shareholders of the respective classes of the Fund. FIIOC pays for typesetting, printing and mailing of shareholder reports, except proxy statements.
For the period, transfer agent fees for each class were as follows:
| Amount | % of Class-Level Average Net Assets(a) | |
| Class A | $6,692 | .31 |
| Class T | 3,430 | .35 |
| Class C | 2,516 | .31 |
| Emerging Markets Discovery | 65,442 | .24 |
| Class I | 1,237 | .20 |
| $79,317 |
(a) Annualized
Accounting and Security Lending Fees. Fidelity Service Company, Inc. (FSC), an affiliate of the investment adviser, maintains the Fund's accounting records. The accounting fee is based on the level of average net assets for each month. Under a separate contract, FSC administers the security lending program. The security lending fee is based on the number and duration of lending transactions.
Brokerage Commissions. The Fund placed a portion of its portfolio transactions with brokerage firms which are affiliates of the investment adviser. Brokerage commissions are included in net realized gain (loss) and change in net unrealized appreciation (depreciation) in the Statement of Operations. The commissions paid to these affiliated firms were $201 for the period.
Interfund Trades. The Fund may purchase from or sell securities to other Fidelity Funds under procedures adopted by the Board. The procedures have been designed to ensure these interfund trades are executed in accordance with Rule 17a-7 of the 1940 Act. Interfund trades are included within the respective purchases and sales amounts shown in the Purchases and Sales of Investments note.
7. Committed Line of Credit.
The Fund participates with other funds managed by the investment adviser or an affiliate in a $4.25 billion credit facility (the "line of credit") to be utilized for temporary or emergency purposes to fund shareholder redemptions or for other short-term liquidity purposes. The Fund has agreed to pay commitment fees on its pro-rata portion of the line of credit, which amounted to $57 and is reflected in Miscellaneous expenses on the Statement of Operations. During the period, the Fund did not borrow on this line of credit.
8. Security Lending.
The Fund lends portfolio securities through a lending agent from time to time in order to earn additional income. For equity securities, a lending agent is used and may loan securities to certain qualified borrowers, including Fidelity Capital Markets (FCM), a broker-dealer affiliated with the Fund. On the settlement date of the loan, the Fund receives collateral (in the form of U.S. Treasury obligations, letters of credit and/or cash) against the loaned securities and maintains collateral in an amount not less than 100% of the market value of the loaned securities during the period of the loan. The market value of the loaned securities is determined at the close of business of the Fund and any additional required collateral is delivered to the Fund on the next business day. The Fund or borrower may terminate the loan at any time, and if the borrower defaults on its obligation to return the securities loaned because of insolvency or other reasons, the Fund may apply collateral received from the borrower against the obligation. The Fund may experience delays and costs in recovering the securities loaned. Any cash collateral received is invested in the Fidelity Securities Lending Cash Central Fund. The value of loaned securities and cash collateral at period end are disclosed on the Fund's Statement of Assets and Liabilities. Security lending income represents the income earned on investing cash collateral, less rebates paid to borrowers and any lending agent fees associated with the loan, plus any premium payments received for lending certain types of securities. Security lending income is presented in the Statement of Operations as a component of income from Fidelity Central Funds. Total security lending income during the period amounted to $5,223. During the period, there were no securities loaned to FCM.
9. Expense Reductions.
The investment adviser contractually agreed to reimburse each class to the extent annual operating expenses exceeded certain levels of average net assets as noted in the table below. This reimbursement will remain in place through December 31, 2016. Some expenses, for example interest expense, including commitment fees, are excluded from this reimbursement.
The following classes were in reimbursement during the period:
| Expense Limitations | Reimbursement | |
| Class A | 1.70% | $5,845 |
| Class T | 1.95% | 2,989 |
| Class C | 2.45% | 2,170 |
| Emerging Markets Discovery | 1.45% | 53,138 |
| Class I | 1.45% | 1,004 |
| $65,146 |
Commissions paid to certain brokers with whom the investment adviser, or its affiliates, places trades on behalf of the Fund include an amount in addition to trade execution, which may be rebated back to the Fund to offset certain expenses. This amount totaled $2,463 for the period.
In addition, during the period the investment adviser reimbursed and/or waived a portion of fund-level operating expenses in the amount of $234.
10. Distributions to Shareholders.
Distributions to shareholders of each class were as follows:
| Six months ended April 30, 2016 | Year ended October 31, 2015 | |
| From net investment income | ||
| Class A | $22,428 | $– |
| Class T | 4,316 | – |
| Emerging Markets Discovery | 453,104 | – |
| Class I | 10,869 | – |
| Total | $490,717 | $– |
11. Share Transactions.
Share transactions for each class were as follows and may contain automatic conversions between classes or exchanges between affiliated funds:
| Shares | Shares | Dollars | Dollars | |
| Six months ended April 30, 2016 | Year ended October 31, 2015 | Six months ended April 30, 2016 | Year ended October 31, 2015 | |
| Class A | ||||
| Shares sold | 55,629 | 161,641 | $577,534 | $1,908,467 |
| Reinvestment of distributions | 1,944 | – | 20,757 | – |
| Shares redeemed | (90,322) | (93,262) | (940,546) | (1,088,220) |
| Net increase (decrease) | (32,749) | 68,379 | $(342,255) | $820,247 |
| Class T | ||||
| Shares sold | 18,358 | 59,344 | $188,721 | $694,558 |
| Reinvestment of distributions | 389 | – | 4,146 | – |
| Shares redeemed | (13,066) | (41,200) | (133,700) | (472,328) |
| Net increase (decrease) | 5,681 | 18,144 | $59,167 | $222,230 |
| Class C | ||||
| Shares sold | 17,201 | 68,780 | $175,833 | $796,943 |
| Shares redeemed | (15,073) | (57,921) | (149,534) | (667,642) |
| Net increase (decrease) | 2,128 | 10,859 | $26,299 | $129,301 |
| Emerging Markets Discovery | ||||
| Shares sold | 828,955 | 2,311,392 | $8,559,244 | $27,313,497 |
| Reinvestment of distributions | 39,922 | – | 427,569 | – |
| Shares redeemed | (1,380,942) | (3,121,418) | (14,622,762) | (36,074,220) |
| Net increase (decrease) | (512,065) | (810,026) | $(5,635,949) | $(8,760,723) |
| Class I | ||||
| Shares sold | 56,585 | 209,924 | $587,375 | $2,474,235 |
| Reinvestment of distributions | 981 | – | 10,531 | – |
| Shares redeemed | (62,265) | (121,211) | (643,520) | (1,373,121) |
| Net increase (decrease) | (4,699) | 88,713 | $(45,614) | $1,101,114 |
12. Other.
The Fund's organizational documents provide former and current trustees and officers with a limited indemnification against liabilities arising in connection with the performance of their duties to the Fund. In the normal course of business, the Fund may also enter into contracts that provide general indemnifications. The Fund's maximum exposure under these arrangements is unknown as this would be dependent on future claims that may be made against the Fund. The risk of material loss from such claims is considered remote.
At the end of the period, the investment adviser or its affiliates were the owners of record of 12% of the total outstanding shares of the Fund.
Shareholder Expense Example
As a shareholder of the Fund, you incur two types of costs: (1) transaction costs, including sales charges (loads) on purchase payments or redemption proceeds, redemption fees and (2) ongoing costs, including management fees, distribution and/or service (12b-1) fees and other Fund expenses. This Example is intended to help you understand your ongoing costs (in dollars) of investing in the Fund and to compare these costs with the ongoing costs of investing in other mutual funds.
The Example is based on an investment of $1,000 invested at the beginning of the period and held for the entire period (November 1, 2015 to April 30, 2016).
Actual Expenses
The first line of the accompanying table for each class of the Fund provides information about actual account values and actual expenses. You may use the information in this line, together with the amount you invested, to estimate the expenses that you paid over the period. Simply divide your account value by $1,000.00 (for example, an $8,600 account value divided by $1,000.00 = 8.6), then multiply the result by the number in the first line for a class of the Fund under the heading entitled "Expenses Paid During Period" to estimate the expenses you paid on your account during this period. A small balance maintenance fee of $12.00 that is charged once a year may apply for certain accounts with a value of less than $2,000. This fee is not included in the table below. If it was, the estimate of expenses you paid during the period would be higher, and your ending account value lower, by this amount. In addition, the Fund, as a shareholder in the underlying Fidelity Central Funds, will indirectly bear its pro-rata share of the fees and expenses incurred by the underlying Fidelity Central Funds. These fees and expenses are not included in the Fund's annualized expense ratio used to calculate the expense estimate in the table below.
Hypothetical Example for Comparison Purposes
The second line of the accompanying table for each class of the Fund provides information about hypothetical account values and hypothetical expenses based on a Class' actual expense ratio and an assumed rate of return of 5% per year before expenses, which is not the Class' actual return. The hypothetical account values and expenses may not be used to estimate the actual ending account balance or expenses you paid for the period. You may use this information to compare the ongoing costs of investing in the Fund and other funds. To do so, compare this 5% hypothetical example with the 5% hypothetical examples that appear in the shareholder reports of the other funds. A small balance maintenance fee of $12.00 that is charged once a year may apply for certain accounts with a value of less than $2,000. This fee is not included in the table below. If it was, the estimate of expenses you paid during the period would be higher, and your ending account value lower, by this amount. In addition, the Fund, as a shareholder in the underlying Fidelity Central Funds, will indirectly bear its pro-rata share of the fees and expenses incurred by the underlying Fidelity Central Funds. These fees and expenses are not included in the Fund's annualized expense ratio used to calculate the expense estimate in the table below.
Please note that the expenses shown in the table are meant to highlight your ongoing costs only and do not reflect any transaction costs. Therefore, the second line of the table is useful in comparing ongoing costs only, and will not help you determine the relative total costs of owning different funds. In addition, if these transactional costs were included, your costs would have been higher.
| Annualized Expense Ratio-A | Beginning Account Value November 1, 2015 | Ending Account Value April 30, 2016 | Expenses Paid During Period-B November 1, 2015 to April 30, 2016 | |
| Class A | 1.70% | |||
| Actual | $1,000.00 | $1,017.90 | $8.53 | |
| Hypothetical-C | $1,000.00 | $1,016.41 | $8.52 | |
| Class T | 1.95% | |||
| Actual | $1,000.00 | $1,016.90 | $9.78 | |
| Hypothetical-C | $1,000.00 | $1,015.17 | $9.77 | |
| Class C | 2.45% | |||
| Actual | $1,000.00 | $1,014.00 | $12.27 | |
| Hypothetical-C | $1,000.00 | $1,012.68 | $12.26 | |
| Emerging Markets Discovery | 1.45% | |||
| Actual | $1,000.00 | $1,019.90 | $7.28 | |
| Hypothetical-C | $1,000.00 | $1,017.65 | $7.27 | |
| Class I | 1.45% | |||
| Actual | $1,000.00 | $1,019.10 | $7.28 | |
| Hypothetical-C | $1,000.00 | $1,017.65 | $7.27 |
A Annualized expense ratio reflects expenses net of applicable fee waivers.
B Expenses are equal to each Class' annualized expense ratio, multiplied by the average account value over the period, multiplied by 182/366 (to reflect the one-half year period).
C 5% return per year before expenses
![]()
AEMDI-SANN-0616
1.931246.104
Fidelity® Emerging Europe, Middle East, Africa (EMEA) Fund Semi-Annual Report April 30, 2016 |
|
Contents
To view a fund's proxy voting guidelines and proxy voting record for the 12-month period ended June 30, visit http://www.fidelity.com/proxyvotingresults or visit the Securities and Exchange Commission's (SEC) web site at http://www.sec.gov.
You may also call 1-800-544-8544 to request a free copy of the proxy voting guidelines.
Standard & Poor's, S&P and S&P 500 are registered service marks of The McGraw-Hill Companies, Inc. and have been licensed for use by Fidelity Distributors Corporation.
Other third-party marks appearing herein are the property of their respective owners.
All other marks appearing herein are registered or unregistered trademarks or service marks of FMR LLC or an affiliated company. © 2016 FMR LLC. All rights reserved.
This report and the financial statements contained herein are submitted for the general information of the shareholders of the Fund. This report is not authorized for distribution to prospective investors in the Fund unless preceded or accompanied by an effective prospectus.
A fund files its complete schedule of portfolio holdings with the SEC for the first and third quarters of each fiscal year on Form N-Q. Forms N-Q are available on the SEC’s web site at http://www.sec.gov. A fund's Forms N-Q may be reviewed and copied at the SEC’s Public Reference Room in Washington, DC. Information regarding the operation of the SEC's Public Reference Room may be obtained by calling 1-800-SEC-0330.
For a complete list of a fund's portfolio holdings, view the most recent holdings listing, semiannual report, or annual report on Fidelity's web site at http://www.fidelity.com, http://www.advisor.fidelity.com, or http://www.401k.com, as applicable.
NOT FDIC INSURED •MAY LOSE VALUE •NO BANK GUARANTEE
Neither the Fund nor Fidelity Distributors Corporation is a bank.
Investment Summary (Unaudited)
Geographic Diversification (% of fund's net assets)
| As of April 30, 2016 | ||
| South Africa | 41.5% | |
| Russia | 23.7% | |
| Turkey | 4.1% | |
| United Arab Emirates | 3.8% | |
| Romania | 3.4% | |
| United Kingdom | 3.2% | |
| Hungary | 2.3% | |
| Poland | 2.2% | |
| Qatar | 2.0% | |
| Other* | 13.8% | |

* Includes Short-Term Investments and Net Other Assets (Liabilities).
Percentages are based on country or territory of incorporation and are adjusted for the effect of futures contracts, if applicable.
| As of October 31, 2015 | ||
| South Africa | 39.5% | |
| Russia | 21.4% | |
| United Arab Emirates | 5.2% | |
| Romania | 4.4% | |
| Poland | 4.3% | |
| Turkey | 4.3% | |
| United Kingdom | 3.4% | |
| Qatar | 3.2% | |
| Austria | 2.6% | |
| Other* | 11.7% | |
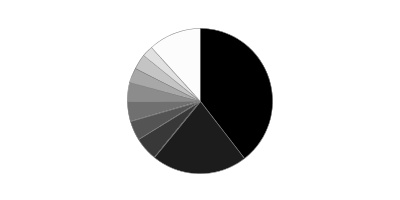
* Includes Short-Term Investments and Net Other Assets (Liabilities).
Percentages are based on country or territory of incorporation and are adjusted for the effect of futures contracts, if applicable.
Asset Allocation as of April 30, 2016
| % of fund's net assets | % of fund's net assets 6 months ago | |
| Stocks | 98.9 | 100.0 |
| Short-Term Investments and Net Other Assets (Liabilities) | 1.1 | 0.0 |
Top Ten Stocks as of April 30, 2016
| % of fund's net assets | % of fund's net assets 6 months ago | |
| Naspers Ltd. Class N (South Africa, Media) | 6.0 | 8.0 |
| Gazprom OAO (Russia, Oil, Gas & Consumable Fuels) | 5.7 | 3.7 |
| Sberbank of Russia (Russia, Banks) | 5.1 | 4.7 |
| Lukoil PJSC sponsored ADR (Russia, Oil, Gas & Consumable Fuels) | 4.5 | 3.9 |
| Steinhoff International Holdings NV (South Africa) (South Africa, Household Durables) | 2.7 | 2.4 |
| Remgro Ltd. (South Africa, Diversified Financial Services) | 2.7 | 2.6 |
| FirstRand Ltd. (South Africa, Diversified Financial Services) | 2.5 | 2.6 |
| DRDGOLD Ltd. (South Africa, Metals & Mining) | 2.3 | 0.9 |
| OTP Bank PLC (Hungary, Banks) | 2.3 | 1.4 |
| AngloGold Ashanti Ltd. (South Africa, Metals & Mining) | 2.2 | 1.1 |
| 36.0 |
Market Sectors as of April 30, 2016
| % of fund's net assets | % of fund's net assets 6 months ago | |
| Financials | 32.9 | 39.3 |
| Energy | 18.3 | 14.9 |
| Consumer Discretionary | 14.8 | 18.0 |
| Consumer Staples | 10.9 | 11.8 |
| Materials | 10.1 | 5.2 |
| Industrials | 7.2 | 3.1 |
| Telecommunication Services | 2.5 | 4.2 |
| Health Care | 2.2 | 3.5 |
Market Sectors may include more than one industry category.
The Fund may invest up to 35% of its total assets in any industry that represents more than 20% of the emerging Europe, Middle East and Africa markets. As of April 30, 2016, the Fund did not have more than 25% of its total assets invested in any one industry.
Percentages shown as 0.0% may reflect amounts less than 0.05%.
Investments April 30, 2016 (Unaudited)
Showing Percentage of Net Assets
| Common Stocks - 95.4% | |||
| Shares | Value | ||
| Austria - 0.8% | |||
| CA Immobilien Anlagen AG | 9,600 | $183,355 | |
| Wienerberger AG | 27,700 | 547,292 | |
| TOTAL AUSTRIA | 730,647 | ||
| Bailiwick of Jersey - 0.4% | |||
| Wizz Air Holdings PLC (a) | 13,888 | 381,498 | |
| Botswana - 0.4% | |||
| First National Bank of Botswana Ltd. | 990,388 | 332,305 | |
| British Virgin Islands - 0.4% | |||
| Lenta Ltd. GDR (a) | 62,600 | 403,770 | |
| Canada - 1.1% | |||
| Detour Gold Corp. (a) | 35,200 | 754,947 | |
| Osisko Gold Royalties Ltd. | 21,000 | 281,183 | |
| TOTAL CANADA | 1,036,130 | ||
| Croatia - 0.5% | |||
| Ledo d.d. | 290 | 440,111 | |
| Czech Republic - 1.0% | |||
| Komercni Banka A/S | 4,347 | 894,279 | |
| Estonia - 0.7% | |||
| Tallinna Kaubamaja AS | 77,800 | 611,122 | |
| Germany - 0.3% | |||
| UNIWHEELS AG | 6,802 | 258,397 | |
| Greece - 1.7% | |||
| Aegean Airlines SA | 18,300 | 167,899 | |
| Jumbo SA (a) | 26,536 | 347,572 | |
| Motor Oil (HELLAS) Corinth Refineries SA | 56,500 | 645,141 | |
| Sarantis SA | 37,800 | 377,304 | |
| TOTAL GREECE | 1,537,916 | ||
| Hungary - 2.3% | |||
| OTP Bank PLC | 77,900 | 2,063,000 | |
| Israel - 0.6% | |||
| Elbit Systems Ltd. (Israel) | 5,300 | 530,220 | |
| Kazakhstan - 0.4% | |||
| KazMunaiGas Exploration & Production JSC (Reg. S) GDR | 53,700 | 360,864 | |
| Kenya - 1.2% | |||
| British American Tobacco Kenya Ltd. | 31,700 | 266,468 | |
| Kcb Group Ltd. | 1,019,000 | 418,698 | |
| Safaricom Ltd. | 2,627,844 | 444,912 | |
| TOTAL KENYA | 1,130,078 | ||
| Lithuania - 0.6% | |||
| Apranga AB (a) | 174,566 | 521,705 | |
| Malta - 0.6% | |||
| Brait SA | 52,700 | 589,260 | |
| Netherlands - 0.3% | |||
| AmRest Holdings NV (a) | 4,600 | 269,351 | |
| Nigeria - 0.5% | |||
| Zenith Bank PLC | 6,802,168 | 434,130 | |
| Pakistan - 0.8% | |||
| Millat Tractors Ltd. | 77,000 | 382,410 | |
| United Bank Ltd. | 246,500 | 385,622 | |
| TOTAL PAKISTAN | 768,032 | ||
| Poland - 2.2% | |||
| Bank Polska Kasa Opieki SA | 21,700 | 882,622 | |
| Kruk SA | 8,900 | 444,190 | |
| NG2 SA | 7,600 | 338,490 | |
| Orbis SA | 24,200 | 385,481 | |
| TOTAL POLAND | 2,050,783 | ||
| Qatar - 2.0% | |||
| Al Meera Consumer Goods Co. (a) | 6,671 | 379,744 | |
| Qatar National Bank SAQ | 36,695 | 1,451,710 | |
| TOTAL QATAR | 1,831,454 | ||
| Romania - 3.4% | |||
| Banca Transilvania SA | 2,204,397 | 1,512,794 | |
| BRD-Groupe Societe Generale | 504,371 | 1,189,864 | |
| Fondul Propietatea SA GDR | 40,900 | 396,730 | |
| TOTAL ROMANIA | 3,099,388 | ||
| Russia - 20.2% | |||
| Gazprom OAO (a) | 2,001,228 | 5,213,998 | |
| Lukoil PJSC (a) | 14,000 | 594,820 | |
| Lukoil PJSC sponsored ADR | 84,095 | 3,564,367 | |
| Magnit OJSC (a) | 8,679 | 1,206,196 | |
| Megafon OJSC GDR | 68,800 | 791,200 | |
| Moscow Exchange MICEX-RTS OAO (a) | 718,000 | 1,132,328 | |
| NOVATEK OAO (a) | 141,500 | 1,338,704 | |
| Sberbank of Russia (a) | 2,428,010 | 4,635,375 | |
| TOTAL RUSSIA | 18,476,988 | ||
| Slovenia - 0.4% | |||
| Krka dd Novo mesto | 5,625 | 390,448 | |
| South Africa - 41.5% | |||
| African Rainbow Minerals Ltd. | 127,000 | 1,000,102 | |
| AngloGold Ashanti Ltd. (a) | 125,100 | 2,033,663 | |
| Aveng Ltd. (a) | 970,000 | 316,173 | |
| Barloworld Ltd. | 123,800 | 715,914 | |
| Cashbuild Ltd. | 15,200 | 370,560 | |
| City Lodge Hotels Ltd. | 33,000 | 355,958 | |
| Clicks Group Ltd. | 156,919 | 1,146,089 | |
| DRDGOLD Ltd. (b) | 3,753,637 | 2,067,187 | |
| Exxaro Resources Ltd. | 41,000 | 258,496 | |
| FirstRand Ltd. | 720,100 | 2,314,296 | |
| Holdsport Ltd. | 168,800 | 723,331 | |
| Hulamin Ltd. | 1,042,200 | 420,973 | |
| Imperial Holdings Ltd. | 84,100 | 880,450 | |
| KAP Industrial Holdings Ltd. | 1,150,500 | 509,169 | |
| Life Healthcare Group Holdings Ltd. | 246,100 | 646,401 | |
| Mr Price Group Ltd. | 66,000 | 838,396 | |
| MTN Group Ltd. | 97,550 | 1,021,203 | |
| Murray & Roberts Holdings Ltd. | 421,100 | 436,327 | |
| Nampak Ltd. | 868,800 | 1,486,730 | |
| Naspers Ltd. Class N | 40,400 | 5,543,287 | |
| Northam Platinum Ltd. (a) | 360,100 | 1,227,126 | |
| Pioneer Foods Ltd. | 110,800 | 1,294,317 | |
| PSG Konsult Ltd. | 644,336 | 338,570 | |
| Remgro Ltd. | 135,500 | 2,432,960 | |
| RMB Holdings Ltd. | 183,300 | 747,995 | |
| Sasol Ltd. | 48,100 | 1,573,359 | |
| Shoprite Holdings Ltd. | 141,400 | 1,700,843 | |
| Spar Group Ltd. | 117,000 | 1,748,599 | |
| Standard Bank Group Ltd. | 137,363 | 1,232,434 | |
| Steinhoff International Holdings NV (South Africa) | 396,000 | 2,474,713 | |
| Super Group Ltd. (a) | 80,000 | 231,201 | |
| TOTAL SOUTH AFRICA | 38,086,822 | ||
| Turkey - 4.1% | |||
| Aselsan A/S | 205,000 | 1,462,402 | |
| Koc Holding A/S | 210,850 | 1,102,479 | |
| Turk Tuborg Bira ve Malt Sanayii A/S (a) | 110,000 | 249,643 | |
| Turkiye Garanti Bankasi A/S | 313,000 | 963,482 | |
| TOTAL TURKEY | 3,778,006 | ||
| United Arab Emirates - 3.8% | |||
| Agthia Group PJSC | 106,093 | 225,306 | |
| Aldar Properties PJSC (a) | 888,885 | 658,272 | |
| Dubai Islamic Bank Pakistan Ltd. (a) | 466,870 | 744,877 | |
| Emaar Malls Group PJSC (a) | 757,587 | 598,166 | |
| First Gulf Bank PJSC | 314,358 | 1,108,371 | |
| SHUAA Capital PSC (a) | 983,913 | 184,840 | |
| TOTAL UNITED ARAB EMIRATES | 3,519,832 | ||
| United Kingdom - 3.2% | |||
| Bupa Arabia ELS (HSBC Warrant Program) warrants 10/10/16 (a)(c) | 7,300 | 248,728 | |
| Georgia Healthcare Group PLC (a) | 129,000 | 365,667 | |
| Mediclinic International PLC | 20,000 | 264,063 | |
| NMC Health PLC | 24,500 | 374,807 | |
| Samba Financial Group ELS (HSBC Bank Warrant Program) warrants 6/29/17 (c) | 28,900 | 176,778 | |
| Saudi Dairy & Foodstuff Co. ELS (HSBC Warrant Program) warrants 6/4/18 (c) | 14,000 | 511,433 | |
| Savola Group ELS (HSBC Warrant Program) warrants 2/6/17 (a)(c) | 52,800 | 563,303 | |
| United International Transportation Co. ELS (HSBC Warrant Program) warrants 7/31/17 (a)(c) | 33,634 | 395,599 | |
| TOTAL UNITED KINGDOM | 2,900,378 | ||
| TOTAL COMMON STOCKS | |||
| (Cost $75,616,322) | 87,426,914 | ||
| Nonconvertible Preferred Stocks - 3.5% | |||
| Russia - 3.5% | |||
| Surgutneftegas OJSC(a) | 2,892,500 | 1,875,246 | |
| Tatneft PAO (a) | 449,400 | 1,332,121 | |
| TOTAL RUSSIA | |||
| (Cost $2,981,109) | 3,207,367 | ||
| Money Market Funds - 2.3% | |||
| Fidelity Cash Central Fund, 0.38% (d) | |||
| (Cost $2,127,277) | 2,127,277 | 2,127,277 | |
| TOTAL INVESTMENT PORTFOLIO - 101.2% | |||
| (Cost $80,724,708) | 92,761,558 | ||
| NET OTHER ASSETS (LIABILITIES) - (1.2)% | (1,082,693) | ||
| NET ASSETS - 100% | $91,678,865 |
Security Type Abbreviations
ELS – Equity-Linked Security
Categorizations in the Schedule of Investments are based on country or territory of incorporation.
Legend
(a) Non-income producing
(b) Security or a portion of the security purchased on a delayed delivery or when-issued basis.
(c) Security exempt from registration under Rule 144A of the Securities Act of 1933. These securities may be resold in transactions exempt from registration, normally to qualified institutional buyers. At the end of the period, the value of these securities amounted to $1,895,841 or 2.1% of net assets.
(d) Affiliated fund that is generally available only to investment companies and other accounts managed by Fidelity Investments. The rate quoted is the annualized seven-day yield of the fund at period end. A complete unaudited listing of the fund's holdings as of its most recent quarter end is available upon request. In addition, each Fidelity Central Fund's financial statements are available on the SEC's website or upon request.
Affiliated Central Funds
Information regarding fiscal year to date income earned by the Fund from investments in Fidelity Central Funds is as follows:
| Fund | Income earned |
| Fidelity Cash Central Fund | $2,883 |
| Total | $2,883 |
Investment Valuation
The following is a summary of the inputs used, as of April 30, 2016, involving the Fund's assets and liabilities carried at fair value. The inputs or methodology used for valuing securities may not be an indication of the risk associated with investing in those securities. For more information on valuation inputs, and their aggregation into the levels used below, please refer to the Investment Valuation section in the accompanying Notes to Financial Statements.
| Valuation Inputs at Reporting Date: | ||||
| Description | Total | Level 1 | Level 2 | Level 3 |
| Investments in Securities: | ||||
| Equities: | ||||
| Consumer Discretionary | $13,538,892 | $13,191,320 | $347,572 | $-- |
| Consumer Staples | 10,049,512 | 9,672,208 | 377,304 | -- |
| Energy | 16,757,116 | 7,449,372 | 9,307,744 | -- |
| Financials | 30,166,366 | 22,671,668 | 7,494,698 | -- |
| Health Care | 2,041,386 | 2,041,386 | -- | -- |
| Industrials | 6,551,783 | 6,383,884 | 167,899 | -- |
| Materials | 9,271,911 | 5,171,061 | 4,100,850 | -- |
| Telecommunication Services | 2,257,315 | 1,236,112 | 1,021,203 | -- |
| Money Market Funds | 2,127,277 | 2,127,277 | -- | -- |
| Total Investments in Securities: | $92,761,558 | $69,944,288 | $22,817,270 | $-- |
The following is a summary of transfers between Level 1 and Level 2 for the period ended April 30, 2016. Transfers are assumed to have occurred at the beginning of the period, and are primarily attributable to the valuation techniques used for foreign equity securities, as discussed in the accompanying Notes to Financial Statements:
| Transfers | Total |
| Level 1 to Level 2 | $562,303 |
| Level 2 to Level 1 | $852,918 |
See accompanying notes which are an integral part of the financial statements.
Financial Statements
Statement of Assets and Liabilities
| April 30, 2016 (Unaudited) | ||
| Assets | ||
| Investment in securities, at value — See accompanying schedule: Unaffiliated issuers (cost $78,597,431) | $90,634,281 | |
| Fidelity Central Funds (cost $2,127,277) | 2,127,277 | |
| Total Investments (cost $80,724,708) | $92,761,558 | |
| Foreign currency held at value (cost $46,482) | 46,429 | |
| Receivable for investments sold | 455,216 | |
| Receivable for fund shares sold | 264,048 | |
| Dividends receivable | 221,843 | |
| Distributions receivable from Fidelity Central Funds | 626 | |
| Prepaid expenses | 95 | |
| Receivable from investment adviser for expense reductions | 45,602 | |
| Other receivables | 210 | |
| Total assets | 93,795,627 | |
| Liabilities | ||
| Payable for investments purchased | ||
| Regular delivery | $1,524,245 | |
| Delayed delivery | 3,365 | |
| Payable for fund shares redeemed | 435,523 | |
| Accrued management fee | 56,299 | |
| Distribution and service plan fees payable | 6,476 | |
| Other affiliated payables | 22,131 | |
| Other payables and accrued expenses | 68,723 | |
| Total liabilities | 2,116,762 | |
| Net Assets | $91,678,865 | |
| Net Assets consist of: | ||
| Paid in capital | $102,235,302 | |
| Undistributed net investment income | 334,366 | |
| Accumulated undistributed net realized gain (loss) on investments and foreign currency transactions | (22,927,761) | |
| Net unrealized appreciation (depreciation) on investments and assets and liabilities in foreign currencies | 12,036,958 | |
| Net Assets | $91,678,865 | |
| Calculation of Maximum Offering Price | ||
| Class A: | ||
| Net Asset Value and redemption price per share ($5,977,139 ÷ 764,856 shares) | $7.81 | |
| Maximum offering price per share (100/94.25 of $7.81) | $8.29 | |
| Class T: | ||
| Net Asset Value and redemption price per share ($2,392,054 ÷ 306,697 shares) | $7.80 | |
| Maximum offering price per share (100/96.50 of $7.80) | $8.08 | |
| Class B: | ||
| Net Asset Value and offering price per share ($158,461 ÷ 20,034 shares)(a) | $7.91 | |
| Class C: | ||
| Net Asset Value and offering price per share ($6,618,271 ÷ 850,603 shares)(a) | $7.78 | |
| Emerging Europe, Middle East, Africa (EMEA): | ||
| Net Asset Value, offering price and redemption price per share ($73,827,085 ÷ 9,442,476 shares) | $7.82 | |
| Class I: | ||
| Net Asset Value, offering price and redemption price per share ($2,705,855 ÷ 346,629 shares) | $7.81 |
(a) Redemption price per share is equal to net asset value less any applicable contingent deferred sales charge.
See accompanying notes which are an integral part of the financial statements.
Statement of Operations
| Six months ended April 30, 2016 (Unaudited) | ||
| Investment Income | ||
| Dividends | $1,095,508 | |
| Income from Fidelity Central Funds | 2,883 | |
| Income before foreign taxes withheld | 1,098,391 | |
| Less foreign taxes withheld | (120,769) | |
| Total income | 977,622 | |
| Expenses | ||
| Management fee | $299,845 | |
| Transfer agent fees | 109,763 | |
| Distribution and service plan fees | 30,964 | |
| Accounting fees and expenses | 19,434 | |
| Custodian fees and expenses | 55,931 | |
| Independent trustees' compensation | 164 | |
| Registration fees | 71,693 | |
| Audit | 34,063 | |
| Legal | 110 | |
| Miscellaneous | 261 | |
| Total expenses before reductions | 622,228 | |
| Expense reductions | (66,024) | 556,204 |
| Net investment income (loss) | 421,418 | |
| Realized and Unrealized Gain (Loss) | ||
| Net realized gain (loss) on: | ||
| Investment securities: | ||
| Unaffiliated issuers | (5,108,175) | |
| Foreign currency transactions | 1,917 | |
| Total net realized gain (loss) | (5,106,258) | |
| Change in net unrealized appreciation (depreciation) on: Investment securities (net of decrease in deferred foreign taxes of $12,949) | 9,176,617 | |
| Assets and liabilities in foreign currencies | (5) | |
| Total change in net unrealized appreciation (depreciation) | 9,176,612 | |
| Net gain (loss) | 4,070,354 | |
| Net increase (decrease) in net assets resulting from operations | $4,491,772 |
See accompanying notes which are an integral part of the financial statements.
Statement of Changes in Net Assets
| Six months ended April 30, 2016 (Unaudited) | Year ended October 31, 2015 | |
| Increase (Decrease) in Net Assets | ||
| Operations | ||
| Net investment income (loss) | $421,418 | $1,633,113 |
| Net realized gain (loss) | (5,106,258) | (10,780,681) |
| Change in net unrealized appreciation (depreciation) | 9,176,612 | (7,778,956) |
| Net increase (decrease) in net assets resulting from operations | 4,491,772 | (16,926,524) |
| Distributions to shareholders from net investment income | (1,323,710) | (2,091,570) |
| Distributions to shareholders from net realized gain | – | (504,771) |
| Total distributions | (1,323,710) | (2,596,341) |
| Share transactions - net increase (decrease) | 5,429,758 | (17,106,646) |
| Redemption fees | 5,610 | 15,219 |
| Total increase (decrease) in net assets | 8,603,430 | (36,614,292) |
| Net Assets | ||
| Beginning of period | 83,075,435 | 119,689,727 |
| End of period (including undistributed net investment income of $334,366 and undistributed net investment income of $1,236,658, respectively) | $91,678,865 | $83,075,435 |
See accompanying notes which are an integral part of the financial statements.
Financial Highlights — Fidelity Emerging Europe, Middle East, Africa (EMEA) Fund Class A
| Six months ended (Unaudited) April 30, | Years ended October 31, | |||||
| 2016 | 2015 | 2014 | 2013 | 2012 | 2011 | |
| Selected Per–Share Data | ||||||
| Net asset value, beginning of period | $7.49 | $9.04 | $9.49 | $8.71 | $8.34 | $8.97 |
| Income from Investment Operations | ||||||
| Net investment income (loss)A | .03 | .12 | .13 | .16 | .18 | .16B |
| Net realized and unrealized gain (loss) | .40 | (1.50) | (.46) | .85 | .34 | (.70) |
| Total from investment operations | .43 | (1.38) | (.33) | 1.01 | .52 | (.54) |
| Distributions from net investment income | (.11) | (.14) | (.12) | (.15) | (.15) | (.08) |
| Distributions from net realized gain | – | (.04) | – | (.07) | – | (.02) |
| Total distributions | (.11) | (.17)C | (.12) | (.23)D | (.15) | (.10) |
| Redemption fees added to paid in capitalA | –E | –E | –E | –E | –E | .01 |
| Net asset value, end of period | $7.81 | $7.49 | $9.04 | $9.49 | $8.71 | $8.34 |
| Total ReturnF,G,H | 5.88% | (15.42)% | (3.48)% | 11.75% | 6.38% | (6.05)% |
| Ratios to Average Net AssetsI,J | ||||||
| Expenses before reductions | 1.82%K | 1.61% | 1.60% | 1.64% | 1.62% | 1.60% |
| Expenses net of fee waivers, if any | 1.65%K | 1.61% | 1.60% | 1.63% | 1.62% | 1.56% |
| Expenses net of all reductions | 1.65%K | 1.60% | 1.60% | 1.62% | 1.60% | 1.51% |
| Net investment income (loss) | .95%K | 1.51% | 1.45% | 1.82% | 2.09% | 1.70%B |
| Supplemental Data | ||||||
| Net assets, end of period (000 omitted) | $5,977 | $5,788 | $7,889 | $10,883 | $8,934 | $10,260 |
| Portfolio turnover rateL | 51%K | 50% | 38% | 64% | 30% | 53% |
A Calculated based on average shares outstanding during the period.
B Net Investment income per share reflects a large, non-recurring dividend which amounted to $.04 per share. Excluding this non-recurring dividend, the ratio of net investment income (loss) to average net assets would have been 1.25%.
C Total distributions of $.17 per share is comprised of distributions from net investment income of $.135 and distributions from net realized gain of $.039 per share.
D Total distributions of $.23 per share is comprised of distributions from net investment income of $.151 and distributions from net realized gain of $.074 per share.
E Amount represents less than $.005 per share.
F Total returns for periods of less than one year are not annualized.
G Total returns would have been lower if certain expenses had not been reduced during the applicable periods shown.
H Total returns do not include the effect of the sales charges.
I Fees and expenses of any underlying Fidelity Central Funds are not included in the Fund's expense ratio. The Fund indirectly bears its proportionate share of the expenses of any underlying Fidelity Central Funds.
J Expense ratios reflect operating expenses of the class. Expenses before reductions do not reflect amounts reimbursed by the investment adviser or reductions from brokerage service arrangements or reductions from other expense offset arrangements and do not represent the amount paid by the class during periods when reimbursements or reductions occur. Expenses net of fee waivers reflect expenses after reimbursement by the investment adviser but prior to reductions from brokerage service arrangements or other expense offset arrangements. Expenses net of all reductions represent the net expenses paid by the class.
K Annualized
L Amount does not include the portfolio activity of any underlying Fidelity Central Funds.
See accompanying notes which are an integral part of the financial statements.
Financial Highlights — Fidelity Emerging Europe, Middle East, Africa (EMEA) Fund Class T
| Six months ended (Unaudited) April 30, | Years ended October 31, | |||||
| 2016 | 2015 | 2014 | 2013 | 2012 | 2011 | |
| Selected Per–Share Data | ||||||
| Net asset value, beginning of period | $7.44 | $9.01 | $9.46 | $8.68 | $8.31 | $8.96 |
| Income from Investment Operations | ||||||
| Net investment income (loss)A | .02 | .10 | .11 | .14 | .15 | .13B |
| Net realized and unrealized gain (loss) | .41 | (1.51) | (.46) | .84 | .35 | (.71) |
| Total from investment operations | .43 | (1.41) | (.35) | .98 | .50 | (.58) |
| Distributions from net investment income | (.07) | (.13) | (.10) | (.12) | (.13) | (.07) |
| Distributions from net realized gain | – | (.04) | – | (.07) | – | (.02) |
| Total distributions | (.07) | (.16)C | (.10) | (.20)D | (.13) | (.08)E |
| Redemption fees added to paid in capitalA | –F | –F | –F | –F | –F | .01 |
| Net asset value, end of period | $7.80 | $7.44 | $9.01 | $9.46 | $8.68 | $8.31 |
| Total ReturnG,H,I | 5.91% | (15.80)% | (3.67)% | 11.42% | 6.14% | (6.42)% |
| Ratios to Average Net AssetsJ,K | ||||||
| Expenses before reductions | 2.12%L | 1.92% | 1.92% | 1.93% | 1.89% | 1.87% |
| Expenses net of fee waivers, if any | 1.90%L | 1.90% | 1.90% | 1.90% | 1.89% | 1.84% |
| Expenses net of all reductions | 1.89%L | 1.89% | 1.90% | 1.88% | 1.86% | 1.78% |
| Net investment income (loss) | .71%L | 1.22% | 1.15% | 1.55% | 1.82% | 1.42%B |
| Supplemental Data | ||||||
| Net assets, end of period (000 omitted) | $2,392 | $2,003 | $2,465 | $3,465 | $3,336 | $3,502 |
| Portfolio turnover rateM | 51%L | 50% | 38% | 64% | 30% | 53% |
A Calculated based on average shares outstanding during the period.
B Net Investment income per share reflects a large, non-recurring dividend which amounted to $.04 per share. Excluding this non-recurring dividend, the ratio of net investment income (loss) to average net assets would have been .98%.
C Total distributions of $.16 per share is comprised of distributions from net investment income of $.125 and distributions from net realized gain of $.039 per share.
D Total distributions of $.20 per share is comprised of distributions from net investment income of $.122 and distributions from net realized gain of $.074 per share.
E Total distributions of $.08 per share is comprised of distributions from net investment income of $.068 and distributions from net realized gain of $.015 per share.
F Amount represents less than $.005 per share.
G Total returns for periods of less than one year are not annualized.
H Total returns would have been lower if certain expenses had not been reduced during the applicable periods shown.
I Total returns do not include the effect of the sales charges.
J Fees and expenses of any underlying Fidelity Central Funds are not included in the Fund's expense ratio. The Fund indirectly bears its proportionate share of the expenses of any underlying Fidelity Central Funds.
K Expense ratios reflect operating expenses of the class. Expenses before reductions do not reflect amounts reimbursed by the investment adviser or reductions from brokerage service arrangements or reductions from other expense offset arrangements and do not represent the amount paid by the class during periods when reimbursements or reductions occur. Expenses net of fee waivers reflect expenses after reimbursement by the investment adviser but prior to reductions from brokerage service arrangements or other expense offset arrangements. Expenses net of all reductions represent the net expenses paid by the class.
L Annualized
M Amount does not include the portfolio activity of any underlying Fidelity Central Funds.
See accompanying notes which are an integral part of the financial statements.
Financial Highlights — Fidelity Emerging Europe, Middle East, Africa (EMEA) Fund Class B
| Six months ended (Unaudited) April 30, | Years ended October 31, | |||||
| 2016 | 2015 | 2014 | 2013 | 2012 | 2011 | |
| Selected Per–Share Data | ||||||
| Net asset value, beginning of period | $7.50 | $9.05 | $9.50 | $8.69 | $8.29 | $8.93 |
| Income from Investment Operations | ||||||
| Net investment income (loss)A | .01 | .06 | .06 | .09 | .11 | .09B |
| Net realized and unrealized gain (loss) | .41 | (1.51) | (.46) | .85 | .35 | (.71) |
| Total from investment operations | .42 | (1.45) | (.40) | .94 | .46 | (.62) |
| Distributions from net investment income | (.01) | (.06) | (.05) | (.06) | (.06) | (.02) |
| Distributions from net realized gain | – | (.04) | – | (.07) | – | (.01) |
| Total distributions | (.01) | (.10) | (.05) | (.13) | (.06) | (.03) |
| Redemption fees added to paid in capitalA | –C | –C | –C | –C | –C | .01 |
| Net asset value, end of period | $7.91 | $7.50 | $9.05 | $9.50 | $8.69 | $8.29 |
| Total ReturnD,E,F | 5.60% | (16.16)% | (4.23)% | 10.94% | 5.56% | (6.85)% |
| Ratios to Average Net AssetsG,H | ||||||
| Expenses before reductions | 2.57%I | 2.41% | 2.40% | 2.42% | 2.38% | 2.37% |
| Expenses net of fee waivers, if any | 2.40%I | 2.40% | 2.40% | 2.40% | 2.38% | 2.33% |
| Expenses net of all reductions | 2.40%I | 2.39% | 2.40% | 2.38% | 2.35% | 2.27% |
| Net investment income (loss) | .20%I | .72% | .65% | 1.05% | 1.33% | .93%B |
| Supplemental Data | ||||||
| Net assets, end of period (000 omitted) | $158 | $181 | $294 | $388 | $441 | $539 |
| Portfolio turnover rateJ | 51%I | 50% | 38% | 64% | 30% | 53% |
A Calculated based on average shares outstanding during the period.
B Net Investment income per share reflects a large, non-recurring dividend which amounted to $.04 per share. Excluding this non-recurring dividend, the ratio of net investment income (loss) to average net assets would have been .49%.
C Amount represents less than $.005 per share.
D Total returns for periods of less than one year are not annualized.
E Total returns would have been lower if certain expenses had not been reduced during the applicable periods shown.
F Total returns do not include the effect of the contingent deferred sales charge.
G Fees and expenses of any underlying Fidelity Central Funds are not included in the Fund's expense ratio. The Fund indirectly bears its proportionate share of the expenses of any underlying Fidelity Central Funds.
H Expense ratios reflect operating expenses of the class. Expenses before reductions do not reflect amounts reimbursed by the investment adviser or reductions from brokerage service arrangements or reductions from other expense offset arrangements and do not represent the amount paid by the class during periods when reimbursements or reductions occur. Expenses net of fee waivers reflect expenses after reimbursement by the investment adviser but prior to reductions from brokerage service arrangements or other expense offset arrangements. Expenses net of all reductions represent the net expenses paid by the class.
I Annualized
J Amount does not include the portfolio activity of any underlying Fidelity Central Funds.
See accompanying notes which are an integral part of the financial statements.
Financial Highlights — Fidelity Emerging Europe, Middle East, Africa (EMEA) Fund Class C
| Six months ended (Unaudited) April 30, | Years ended October 31, | |||||
| 2016 | 2015 | 2014 | 2013 | 2012 | 2011 | |
| Selected Per–Share Data | ||||||
| Net asset value, beginning of period | $7.39 | $8.93 | $9.39 | $8.62 | $8.24 | $8.90 |
| Income from Investment Operations | ||||||
| Net investment income (loss)A | .01 | .06 | .06 | .09 | .11 | .08B |
| Net realized and unrealized gain (loss) | .40 | (1.48) | (.46) | .83 | .35 | (.69) |
| Total from investment operations | .41 | (1.42) | (.40) | .92 | .46 | (.61) |
| Distributions from net investment income | (.02) | (.08) | (.06) | (.08) | (.08) | (.05) |
| Distributions from net realized gain | – | (.04) | – | (.07) | – | (.02) |
| Total distributions | (.02) | (.12) | (.06) | (.15) | (.08) | (.06)C |
| Redemption fees added to paid in capitalA | –D | –D | –D | –D | –D | .01 |
| Net asset value, end of period | $7.78 | $7.39 | $8.93 | $9.39 | $8.62 | $8.24 |
| Total ReturnE,F,G | 5.54% | (16.08)% | (4.24)% | 10.83% | 5.68% | (6.79)% |
| Ratios to Average Net AssetsH,I | ||||||
| Expenses before reductions | 2.61%J | 2.41% | 2.40% | 2.42% | 2.37% | 2.36% |
| Expenses net of fee waivers, if any | 2.40%J | 2.40% | 2.40% | 2.40% | 2.37% | 2.33% |
| Expenses net of all reductions | 2.40%J | 2.39% | 2.40% | 2.38% | 2.35% | 2.27% |
| Net investment income (loss) | .20%J | .72% | .65% | 1.05% | 1.34% | .93%B |
| Supplemental Data | ||||||
| Net assets, end of period (000 omitted) | $6,618 | $4,104 | $6,662 | $6,782 | $7,770 | $6,650 |
| Portfolio turnover rateK | 51%J | 50% | 38% | 64% | 30% | 53% |
A Calculated based on average shares outstanding during the period.
B Net Investment income per share reflects a large, non-recurring dividend which amounted to $.04 per share. Excluding this non-recurring dividend, the ratio of net investment income (loss) to average net assets would have been .49%.
C Total distributions of $.06 per share is comprised of distributions from net investment income of $.047 and distributions from net realized gain of $.015 per share.
D Amount represents less than $.005 per share.
E Total returns for periods of less than one year are not annualized.
F Total returns would have been lower if certain expenses had not been reduced during the applicable periods shown.
G Total returns do not include the effect of the contingent deferred sales charge.
H Fees and expenses of any underlying Fidelity Central Funds are not included in the Fund's expense ratio. The Fund indirectly bears its proportionate share of the expenses of any underlying Fidelity Central Funds.
I Expense ratios reflect operating expenses of the class. Expenses before reductions do not reflect amounts reimbursed by the investment adviser or reductions from brokerage service arrangements or reductions from other expense offset arrangements and do not represent the amount paid by the class during periods when reimbursements or reductions occur. Expenses net of fee waivers reflect expenses after reimbursement by the investment adviser but prior to reductions from brokerage service arrangements or other expense offset arrangements. Expenses net of all reductions represent the net expenses paid by the class.
J Annualized
K Amount does not include the portfolio activity of any underlying Fidelity Central Funds.
See accompanying notes which are an integral part of the financial statements.
Financial Highlights — Fidelity Emerging Europe, Middle East, Africa (EMEA) Fund
| Six months ended (Unaudited) April 30, | Years ended October 31, | |||||
| 2016 | 2015 | 2014 | 2013 | 2012 | 2011 | |
| Selected Per–Share Data | ||||||
| Net asset value, beginning of period | $7.50 | $9.08 | $9.52 | $8.75 | $8.37 | $9.00 |
| Income from Investment Operations | ||||||
| Net investment income (loss)A | .04 | .14 | .16 | .18 | .20 | .18B |
| Net realized and unrealized gain (loss) | .41 | (1.51) | (.47) | .84 | .35 | (.71) |
| Total from investment operations | .45 | (1.37) | (.31) | 1.02 | .55 | (.53) |
| Distributions from net investment income | (.13) | (.17) | (.13) | (.18) | (.17) | (.09) |
| Distributions from net realized gain | – | (.04) | – | (.07) | – | (.02) |
| Total distributions | (.13) | (.21) | (.13) | (.25) | (.17) | (.11) |
| Redemption fees added to paid in capitalA | –C | –C | –C | –C | –C | .01 |
| Net asset value, end of period | $7.82 | $7.50 | $9.08 | $9.52 | $8.75 | $8.37 |
| Total ReturnD,E | 6.19% | (15.33)% | (3.21)% | 11.90% | 6.81% | (5.91)% |
| Ratios to Average Net AssetsF,G | ||||||
| Expenses before reductions | 1.57%H | 1.39% | 1.37% | 1.40% | 1.37% | 1.35% |
| Expenses net of fee waivers, if any | 1.40%H | 1.38% | 1.37% | 1.40% | 1.37% | 1.31% |
| Expenses net of all reductions | 1.40%H | 1.38% | 1.37% | 1.38% | 1.34% | 1.25% |
| Net investment income (loss) | 1.20%H | 1.74% | 1.68% | 2.05% | 2.34% | 1.95%B |
| Supplemental Data | ||||||
| Net assets, end of period (000 omitted) | $73,827 | $67,521 | $96,784 | $110,265 | $111,441 | $114,117 |
| Portfolio turnover rateI | 51%H | 50% | 38% | 64% | 30% | 53% |
A Calculated based on average shares outstanding during the period.
B Net Investment income per share reflects a large, non-recurring dividend which amounted to $.04 per share. Excluding this non-recurring dividends, the ratio of net investment income (loss) to average net assets would have been 1.51%.
C Amount represents less than $.005 per share.
D Total returns for periods of less than one year are not annualized.
E Total returns would have been lower if certain expenses had not been reduced during the applicable periods shown.
F Fees and expenses of any underlying Fidelity Central Funds are not included in the Fund's expense ratio. The Fund indirectly bears its proportionate share of the expenses of any underlying Fidelity Central Funds.
G Expense ratios reflect operating expenses of the class. Expenses before reductions do not reflect amounts reimbursed by the investment adviser or reductions from brokerage service arrangements or reductions from other expense offset arrangements and do not represent the amount paid by the class during periods when reimbursements or reductions occur. Expenses net of fee waivers reflect expenses after reimbursement by the investment adviser but prior to reductions from brokerage service arrangements or other expense offset arrangements. Expenses net of all reductions represent the net expenses paid by the class.
H Annualized
I Amount does not include the portfolio activity of any underlying Fidelity Central Funds.
See accompanying notes which are an integral part of the financial statements.
Financial Highlights — Fidelity Emerging Europe, Middle East, Africa (EMEA) Fund Class I
| Six months ended (Unaudited) April 30, | Years ended October 31, | |||||
| 2016 | 2015 | 2014 | 2013 | 2012 | 2011 | |
| Selected Per–Share Data | ||||||
| Net asset value, beginning of period | $7.50 | $9.08 | $9.52 | $8.75 | $8.37 | $9.00 |
| Income from Investment Operations | ||||||
| Net investment income (loss)A | .04 | .15 | .16 | .19 | .21 | .19B |
| Net realized and unrealized gain (loss) | .41 | (1.51) | (.46) | .84 | .35 | (.72) |
| Total from investment operations | .45 | (1.36) | (.30) | 1.03 | .56 | (.53) |
| Distributions from net investment income | (.14) | (.18) | (.14) | (.19) | (.18) | (.09) |
| Distributions from net realized gain | – | (.04) | – | (.07) | – | (.02) |
| Total distributions | (.14) | (.22) | (.14) | (.26) | (.18) | (.11) |
| Redemption fees added to paid in capitalA | –C | –C | –C | –C | –C | .01 |
| Net asset value, end of period | $7.81 | $7.50 | $9.08 | $9.52 | $8.75 | $8.37 |
| Total ReturnD,E | 6.21% | (15.23)% | (3.09)% | 12.05% | 6.93% | (5.91)% |
| Ratios to Average Net AssetsF,G | ||||||
| Expenses before reductions | 1.43%H | 1.25% | 1.26% | 1.30% | 1.28% | 1.26% |
| Expenses net of fee waivers, if any | 1.40%H | 1.25% | 1.26% | 1.30% | 1.28% | 1.24% |
| Expenses net of all reductions | 1.40%H | 1.24% | 1.26% | 1.28% | 1.25% | 1.19% |
| Net investment income (loss) | 1.20%H | 1.88% | 1.79% | 2.15% | 2.43% | 2.02%B |
| Supplemental Data | ||||||
| Net assets, end of period (000 omitted) | $2,706 | $3,478 | $5,596 | $10,231 | $8,586 | $7,633 |
| Portfolio turnover rateI | 51%H | 50% | 38% | 64% | 30% | 53% |
A Calculated based on average shares outstanding during the period.
B Net Investment income per share reflects a large, non-recurring dividend which amounted to $.04 per share. Excluding this non-recurring dividend, the ratio of net investment income (loss) to average net assets would have been 1.58%.
C Amount represents less than $.005 per share.
D Total returns for periods of less than one year are not annualized.
E Total returns would have been lower if certain expenses had not been reduced during the applicable periods shown.
F Fees and expenses of any underlying Fidelity Central Funds are not included in the Fund's expense ratio. The Fund indirectly bears its proportionate share of the expenses of any underlying Fidelity Central Funds.
G Expense ratios reflect operating expenses of the class. Expenses before reductions do not reflect amounts reimbursed by the investment adviser or reductions from brokerage service arrangements or reductions from other expense offset arrangements and do not represent the amount paid by the class during periods when reimbursements or reductions occur. Expenses net of fee waivers reflect expenses after reimbursement by the investment adviser but prior to reductions from brokerage service arrangements or other expense offset arrangements. Expenses net of all reductions represent the net expenses paid by the class.
H Annualized
I Amount does not include the portfolio activity of any underlying Fidelity Central Funds.
See accompanying notes which are an integral part of the financial statements.
Notes to Financial Statements (Unaudited)
For the period ended April 30, 2016
1. Organization.
Fidelity Emerging Europe, Middle East, Africa (EMEA) Fund (the Fund) is a non-diversified fund of Fidelity Investment Trust (the Trust) and is authorized to issue an unlimited number of shares. The Trust is registered under the Investment Company Act of 1940, as amended (the 1940 Act), as an open-end management investment company organized as a Massachusetts business trust. The Fund offers Class A, Class T, Class C, Emerging Europe, Middle East, Africa (EMEA) and Class I shares, each of which, along with Class B shares, has equal rights as to assets and voting privileges. Class B shares are closed to new accounts and additional purchases, except for exchanges and reinvestments. Each class has exclusive voting rights with respect to matters that affect that class. Class B shares will automatically convert to Class A shares after a maximum holding period of seven years from the initial date of purchase. The Fund's investments in emerging markets can be subject to social, economic, regulatory, and political uncertainties and can be extremely volatile.
During the period, the Board of Trustees approved the conversion of all existing Class B shares into Class A shares, effective on or about July 1, 2016, regardless of the length of times shares have been held.
2. Investments in Fidelity Central Funds.
The Fund invests in Fidelity Central Funds, which are open-end investment companies generally available only to other investment companies and accounts managed by the investment adviser and its affiliates. The Fund's Schedule of Investments lists each of the Fidelity Central Funds held as of period end, if any, as an investment of the Fund, but does not include the underlying holdings of each Fidelity Central Fund. As an Investing Fund, the Fund indirectly bears its proportionate share of the expenses of the underlying Fidelity Central Funds.
The Money Market Central Funds seek preservation of capital and current income and are managed by Fidelity Investments Money Management, Inc. (FIMM), an affiliate of the investment adviser. Annualized expenses of the Money Market Central Funds as of their most recent shareholder report date are less than .005%.
A complete unaudited list of holdings for each Fidelity Central Fund is available upon request or at the Securities and Exchange Commission (the SEC) website at www.sec.gov. In addition, the financial statements of the Fidelity Central Funds are available on the SEC website or upon request.
3. Significant Accounting Policies.
The financial statements have been prepared in conformity with accounting principles generally accepted in the United States of America (GAAP), which require management to make certain estimates and assumptions at the date of the financial statements. Actual results could differ from those estimates. Subsequent events, if any, through the date that the financial statements were issued have been evaluated in the preparation of the financial statements. The following summarizes the significant accounting policies of the Fund:
Investment Valuation. Investments are valued as of 4:00 p.m. Eastern time on the last calendar day of the period. The Board of Trustees (the Board) has delegated the day to day responsibility for the valuation of the Fund's investments to the Fidelity Management & Research Company (FMR) Fair Value Committee (the Committee). In accordance with valuation policies and procedures approved by the Board, the Fund attempts to obtain prices from one or more third party pricing vendors or brokers to value its investments. When current market prices, quotations or currency exchange rates are not readily available or reliable, investments will be fair valued in good faith by the Committee, in accordance with procedures adopted by the Board. Factors used in determining fair value vary by investment type and may include market or investment specific events. The frequency with which these procedures are used cannot be predicted and they may be utilized to a significant extent. The Committee oversees the Fund's valuation policies and procedures and reports to the Board on the Committee's activities and fair value determinations. The Board monitors the appropriateness of the procedures used in valuing the Fund's investments and ratifies the fair value determinations of the Committee.
The Fund categorizes the inputs to valuation techniques used to value its investments into a disclosure hierarchy consisting of three levels as shown below:
- Level 1 – quoted prices in active markets for identical investments
- Level 2 – other significant observable inputs (including quoted prices for similar investments, interest rates, prepayment speeds, etc.)
- Level 3 – unobservable inputs (including the Fund's own assumptions based on the best information available)
Valuation techniques used to value the Fund's investments by major category are as follows:
Equity securities, including restricted securities, for which market quotations are readily available, are valued at the last reported sale price or official closing price as reported by a third party pricing vendor on the primary market or exchange on which they are traded and are categorized as Level 1 in the hierarchy. In the event there were no sales during the day or closing prices are not available, securities are valued at the last quoted bid price or may be valued using the last available price and are generally categorized as Level 2 in the hierarchy. For foreign equity securities, when market or security specific events arise, comparisons to the valuation of American Depositary Receipts (ADRs), futures contracts, Exchange-Traded Funds (ETFs) and certain indexes as well as quoted prices for similar securities may be used and would be categorized as Level 2 in the hierarchy. Utilizing these techniques may result in transfers between Level 1 and Level 2. For equity securities, including restricted securities, where observable inputs are limited, assumptions about market activity and risk are used and these securities may be categorized as Level 3 in the hierarchy.
Investments in open-end mutual funds, including the Fidelity Central Funds, are valued at their closing net asset value (NAV) each business day and are categorized as Level 1 in the hierarchy.
Changes in valuation techniques may result in transfers in or out of an assigned level within the disclosure hierarchy. The aggregate value of investments by input level as of April 30, 2016, including information on transfers between Levels 1 and 2 is included at the end of the Fund's Schedule of Investments.
Foreign Currency. The Fund may use foreign currency contracts to facilitate transactions in foreign-denominated securities. Gains and losses from these transactions may arise from changes in the value of the foreign currency or if the counterparties do not perform under the contracts' terms.
Foreign-denominated assets, including investment securities, and liabilities are translated into U.S. dollars at the exchange rates at period end. Purchases and sales of investment securities, income and dividends received and expenses denominated in foreign currencies are translated into U.S. dollars at the exchange rate in effect on the transaction date.
The effects of exchange rate fluctuations on investments are included with the net realized and unrealized gain (loss) on investment securities. Other foreign currency transactions resulting in realized and unrealized gain (loss) are disclosed separately.
Investment Transactions and Income. For financial reporting purposes, the Fund's investment holdings and NAV include trades executed through the end of the last business day of the period. The NAV per share for processing shareholder transactions is calculated as of the close of business of the New York Stock Exchange (NYSE), normally 4:00 p.m. Eastern time and includes trades executed through the end of the prior business day. Gains and losses on securities sold are determined on the basis of identified cost. Dividend income is recorded on the ex-dividend date, except for certain dividends from foreign securities where the ex-dividend date may have passed, which are recorded as soon as the Fund is informed of the ex-dividend date. Non-cash dividends included in dividend income, if any, are recorded at the fair market value of the securities received. Income and capital gain distributions from Fidelity Central Funds, if any, are recorded on the ex-dividend date. Investment income is recorded net of foreign taxes withheld where recovery of such taxes is uncertain.
Class Allocations and Expenses. Investment income, realized and unrealized capital gains and losses, common expenses of the Fund, and certain fund-level expense reductions, if any, are allocated daily on a pro-rata basis to each class based on the relative net assets of each class to the total net assets of the Fund. Each class differs with respect to transfer agent and distribution and service plan fees incurred. Certain expense reductions may also differ by class. For the reporting period, the allocated portion of income and expenses to each class as a percent of its average net assets may vary due to the timing of recording these transactions in relation to fluctuating net assets of the classes. Expenses directly attributable to a fund are charged to that fund. Expenses attributable to more than one fund are allocated among the respective funds on the basis of relative net assets or other appropriate methods. Expense estimates are accrued in the period to which they relate and adjustments are made when actual amounts are known.
Income Tax Information and Distributions to Shareholders. Each year, the Fund intends to qualify as a regulated investment company under Subchapter M of the Internal Revenue Code, including distributing substantially all of its taxable income and realized gains. As a result, no provision for U.S. Federal income taxes is required. The Fund files a U.S. federal tax return, in addition to state and local tax returns as required. The Fund's federal income tax returns are subject to examination by the Internal Revenue Service (IRS) for a period of three fiscal years after they are filed. State and local tax returns may be subject to examination for an additional fiscal year depending on the jurisdiction. Foreign taxes are provided for based on the Fund's understanding of the tax rules and rates that exist in the foreign markets in which it invests. The Fund is subject to a tax imposed on capital gains by certain countries in which it invests.
Distributions are declared and recorded on the ex-dividend date. Income dividends and capital gain distributions are declared separately for each class. Income and capital gain distributions are determined in accordance with income tax regulations, which may differ from GAAP.
Capital accounts within the financial statements are adjusted for permanent book-tax differences. These adjustments have no impact on net assets or the results of operations. Capital accounts are not adjusted for temporary book-tax differences which will reverse in a subsequent period.
Book-tax differences are primarily due to foreign currency transactions, certain foreign taxes, passive foreign investment companies (PFIC), capital loss carryforwards and losses deferred due to wash sales.
The federal tax cost of investment securities and unrealized appreciation (depreciation) as of period end were as follows:
| Gross unrealized appreciation | $16,887,440 |
| Gross unrealized depreciation | (5,733,815) |
| Net unrealized appreciation (depreciation) on securities | $11,153,625 |
| Tax cost | $81,607,933 |
Capital loss carryforwards are only available to offset future capital gains of the Fund to the extent provided by regulations and may be limited. Under the Regulated Investment Company Modernization Act of 2010 (the Act), the Fund is permitted to carry forward capital losses incurred in taxable years beginning after December 22, 2010 for an unlimited period and such capital losses are required to be used prior to any losses that expire. The capital loss carryforward information presented below, including any applicable limitation, is estimated as of prior fiscal period end and is subject to adjustment.
| Fiscal year of expiration | |
| 2018 | $(1,624,705) |
| No expiration | |
| Short-term | (3,290,678) |
| Long-term | (11,971,717) |
| Total no expiration | (15,262,395) |
| Total capital loss carryforward | $(16,887,100) |
Short-Term Trading (Redemption) Fees. Shares held by investors in the Fund less than 90 days may have been subject to a redemption fee equal to 1.50% of the NAV of shares redeemed. All redemption fees, which reduce the proceeds of the shareholder redemption, are retained by the Fund and accounted for as an addition to paid in capital.
Delayed Delivery Transactions and When-Issued Securities. During the period, the Fund transacted in securities on a delayed delivery or when-issued basis. Payment and delivery may take place after the customary settlement period for that security. The price of the underlying securities and the date when the securities will be delivered and paid for are fixed at the time the transaction is negotiated. The securities purchased on a delayed delivery or when-issued basis are identified as such in the Fund's Schedule of Investments. With respect to purchase commitments, the Fund identifies securities as segregated in its records with a value at least equal to the amount of the commitment. Losses may arise due to changes in the value of the underlying securities or if the counterparty does not perform under the contract's terms, or if the issuer does not issue the securities due to political, economic, or other factors.
Restricted Securities. The Fund may invest in securities that are subject to legal or contractual restrictions on resale. These securities generally may be resold in transactions exempt from registration or to the public if the securities are registered. Disposal of these securities may involve time-consuming negotiations and expense, and prompt sale at an acceptable price may be difficult. Information regarding restricted securities is included at the end of the Fund's Schedule of Investments.
4. Purchases and Sales of Investments.
Purchases and sales of securities, other than short-term securities, aggregated $22,842,835 and $19,602,882, respectively.
5. Fees and Other Transactions with Affiliates.
Management Fee. Fidelity Management & Research Company (the investment adviser) and its affiliates provide the Fund with investment management related services for which the Fund pays a monthly management fee. The management fee is the sum of an individual fund fee rate that is based on an annual rate of .55% of the Fund's average net assets and an annualized group fee rate that averaged .25% during the period. The group fee rate is based upon the average net assets of all the mutual funds advised by the investment adviser, including any mutual funds previously advised by the investment adviser that are currently advised by Fidelity SelectCo, LLC, an affiliate of the investment adviser. The group fee rate decreases as assets under management increase and increases as assets under management decrease. For the reporting period, the total annualized management fee rate was .80% of the Fund's average net assets.
Distribution and Service Plan Fees. In accordance with Rule 12b-1 of the 1940 Act, the Fund has adopted separate Distribution and Service Plans for each class of shares, except for the Class I. Certain classes pay Fidelity Distributors Corporation (FDC), an affiliate of the investment adviser, separate Distribution and Service Fees, each of which is based on an annual percentage of each class' average net assets. In addition, FDC may pay financial intermediaries for selling shares of the Fund and providing shareholder support services. For the period, the Distribution and Service Fee rates, total fees and amounts retained by FDC were as follows:
| Distribution Fee | Service Fee | Total Fees | Retained by FDC | |
| Class A | -% | .25% | $6,328 | $– |
| Class T | .25% | .25% | 4,536 | 4 |
| Class B | .75% | .25% | 717 | 538 |
| Class C | .75% | .25% | 19,383 | 2,551 |
| $30,964 | $3,093 |
Sales Load. FDC may receive a front-end sales charge of up to 5.75% for selling Class A shares and 3.50% for selling Class T shares, some of which is paid to financial intermediaries for selling shares of the Fund. Depending on the holding period, FDC may receive contingent deferred sales charges levied on Class A, Class T, Class B and Class C redemptions. The deferred sales charges range from 5.00% to 1.00% for Class B shares, 1.00% for Class C shares, 1.00% for certain purchases of Class A shares and .25% for certain purchases of Class T shares.
For the period, sales charge amounts retained by FDC were as follows:
| Retained by FDC | |
| Class A | $1,197 |
| Class T | 532 |
| Class B(a) | – |
| Class C(a) | 61 |
| $1,790 |
(a) When Class B and Class C shares are initially sold, FDC pays commissions from its own resources to financial intermediaries through which the sales are made.
Transfer Agent Fees. Fidelity Investments Institutional Operations Company, Inc., (FIIOC), an affiliate of the investment adviser, is the transfer, dividend disbursing and shareholder servicing agent for each class of the Fund. FIIOC receives account fees and asset-based fees that vary according to the account size and type of account of the shareholders of the respective classes of the Fund. FIIOC pays for typesetting, printing and mailing of shareholder reports, except proxy statements.
For the period, transfer agent fees for each class were as follows:
| Amount | % of Class-Level Average Net Assets(a) | |
| Class A | $7,504 | .30 |
| Class T | 3,080 | .34 |
| Class B | 224 | .31 |
| Class C | 5,632 | .29 |
| Emerging Europe, Middle East, Africa (EMEA) | 91,056 | .30 |
| Class I | 2,267 | .16 |
| $109,763 |
(a) Annualized
Accounting Fees. Fidelity Service Company, Inc. (FSC), an affiliate of the investment adviser, maintains the Fund's accounting records. The fee is based on the level of average net assets for each month.
Brokerage Commissions. The Fund placed a portion of its portfolio transactions with brokerage firms which are affiliates of the investment adviser. Brokerage commissions are included in net realized gain (loss) and change in net unrealized appreciation (depreciation) in the Statement of Operations. The commissions paid to these affiliated firms were $23 for the period.
Interfund Trades. The Fund may purchase from or sell securities to other Fidelity Funds under procedures adopted by the Board. The procedures have been designed to ensure these interfund trades are executed in accordance with Rule 17a-7 of the 1940 Act. Interfund trades are included within the respective purchases and sales amounts shown in the Purchases and Sales of Investments note.
6. Committed Line of Credit.
The Fund participates with other funds managed by the investment adviser or an affiliate in a $4.25 billion credit facility (the "line of credit") to be utilized for temporary or emergency purposes to fund shareholder redemptions or for other short-term liquidity purposes. The Fund has agreed to pay commitment fees on its pro-rata portion of the line of credit, which amounted to $65 and is reflected in Miscellaneous expenses on the Statement of Operations. During the period, the Fund did not borrow on this line of credit.
7. Expense Reductions.
The investment adviser voluntarily agreed to reimburse each class to the extent annual operating expenses exceeded certain levels of average net assets as noted in the table below. Some expenses, for example interest expense, including commitment fees, are excluded from this reimbursement.
The following classes were in reimbursement during the period:
| Expense Limitations | Reimbursement | |
| Class A | 1.65% | $4,376 |
| Class T | 1.90% | 2,026 |
| Class B | 2.40% | 121 |
| Class C | 2.40% | 4,082 |
| Emerging Europe, Middle East, Africa (EMEA) | 1.40% | 54,428 |
| Class I | 1.40% | 379 |
| $65,412 |
Commissions paid to certain brokers with whom the investment adviser, or its affiliates, places trades on behalf of the Fund include an amount in addition to trade execution, which may be rebated back to the Fund to offset certain expenses. This amount totaled $345 for the period.
In addition, during the period the investment adviser reimbursed and/or waived a portion of fund-level operating expenses in the amount of $267.
8. Distributions to Shareholders.
Distributions to shareholders of each class were as follows:
| Six months ended April 30, 2016 | Year ended October 31, 2015 | |
| From net investment income | ||
| Class A | $80,414 | $113,464 |
| Class T | 18,230 | 35,916 |
| Class B | 201 | 1,835 |
| Class C | 9,270 | 58,320 |
| Emerging Europe, Middle East, Africa (EMEA) | 1,152,813 | 1,776,301 |
| Class I | 62,782 | 105,734 |
| Total | $1,323,710 | $2,091,570 |
| From net realized gain | ||
| Class A | $– | $32,778 |
| Class T | – | 11,206 |
| Class B | – | 1,213 |
| Class C | – | 29,160 |
| Emerging Europe, Middle East, Africa (EMEA) | – | 407,505 |
| Class I | – | 22,909 |
| Total | $– | $504,771 |
9. Share Transactions.
Share transactions for each class were as follows and may contain automatic conversions between classes or exchanges between affiliated funds:
| Shares | Shares | Dollars | Dollars | |
| Six months ended April 30, 2016 | Year ended October 31, 2015 | Six months ended April 30, 2016 | Year ended October 31, 2015 | |
| Class A | ||||
| Shares sold | 125,223 | 200,433 | $908,033 | $1,636,757 |
| Reinvestment of distributions | 10,903 | 16,251 | 75,669 | 135,531 |
| Shares redeemed | (144,519) | (315,855) | (980,924) | (2,546,115) |
| Net increase (decrease) | (8,393) | (99,171) | $2,778 | $(773,827) |
| Class T | ||||
| Shares sold | 73,842 | 86,058 | $536,114 | $721,254 |
| Reinvestment of distributions | 2,627 | 5,631 | 18,230 | 46,793 |
| Shares redeemed | (38,900) | (96,309) | (273,521) | (767,911) |
| Net increase (decrease) | 37,569 | (4,620) | $280,823 | $136 |
| Class B | ||||
| Shares sold | 6,222 | 3,390 | $48,684 | $28,032 |
| Reinvestment of distributions | 29 | 349 | 201 | 2,936 |
| Shares redeemed | (10,329) | (12,164) | (74,883) | (100,803) |
| Net increase (decrease) | (4,078) | (8,425) | $(25,998) | $(69,835) |
| Class C | ||||
| Shares sold | 378,690 | 210,315 | $2,804,059 | $1,702,630 |
| Reinvestment of distributions | 776 | 8,117 | 5,381 | 67,210 |
| Shares redeemed | (84,612) | (408,507) | (573,923) | (3,365,409) |
| Net increase (decrease) | 294,854 | (190,075) | $2,235,517 | $(1,595,569) |
| Emerging Europe, Middle East, Africa (EMEA) | ||||
| Shares sold | 1,501,834 | 1,440,703 | $10,868,652 | $11,732,025 |
| Reinvestment of distributions | 155,366 | 247,446 | 1,078,225 | 2,063,699 |
| Shares redeemed | (1,214,338) | (3,348,545) | (8,241,773) | (27,229,428) |
| Net increase (decrease) | 442,862 | (1,660,396) | $3,705,104 | $(13,433,704) |
| Class I�� | ||||
| Shares sold | 44,669 | 131,915 | $316,782 | $1,069,757 |
| Reinvestment of distributions | 7,594 | 12,912 | 52,629 | 107,558 |
| Shares redeemed | (169,187) | (297,795) | (1,137,877) | (2,411,162) |
| Net increase (decrease) | (116,924) | (152,968) | $(768,466) | $(1,233,847) |
10. Other.
The Fund's organizational documents provide former and current trustees and officers with a limited indemnification against liabilities arising in connection with the performance of their duties to the Fund. In the normal course of business, the Fund may also enter into contracts that provide general indemnifications. The Fund's maximum exposure under these arrangements is unknown as this would be dependent on future claims that may be made against the Fund. The risk of material loss from such claims is considered remote.
Shareholder Expense Example
As a shareholder of the Fund, you incur two types of costs: (1) transaction costs, including sales charges (loads) on purchase payments or redemption proceeds, redemption fees and (2) ongoing costs, including management fees, distribution and/or service (12b-1) fees and other Fund expenses. This Example is intended to help you understand your ongoing costs (in dollars) of investing in the Fund and to compare these costs with the ongoing costs of investing in other mutual funds.
The Example is based on an investment of $1,000 invested at the beginning of the period and held for the entire period (November 1, 2015 to April 30, 2016).
Actual Expenses
The first line of the accompanying table for each class of the Fund provides information about actual account values and actual expenses. You may use the information in this line, together with the amount you invested, to estimate the expenses that you paid over the period. Simply divide your account value by $1,000.00 (for example, an $8,600 account value divided by $1,000.00 = 8.6), then multiply the result by the number in the first line for a class of the Fund under the heading entitled "Expenses Paid During Period" to estimate the expenses you paid on your account during this period. A small balance maintenance fee of $12.00 that is charged once a year may apply for certain accounts with a value of less than $2,000. This fee is not included in the table below. If it was, the estimate of expenses you paid during the period would be higher, and your ending account value lower, by this amount. In addition, the Fund, as a shareholder in the underlying Fidelity Central Funds, will indirectly bear its pro-rata share of the fees and expenses incurred by the underlying Fidelity Central Funds. These fees and expenses are not included in the Fund's annualized expense ratio used to calculate the expense estimate in the table below.
Hypothetical Example for Comparison Purposes
The second line of the accompanying table for each class of the Fund provides information about hypothetical account values and hypothetical expenses based on a Class' actual expense ratio and an assumed rate of return of 5% per year before expenses, which is not the Class' actual return. The hypothetical account values and expenses may not be used to estimate the actual ending account balance or expenses you paid for the period. You may use this information to compare the ongoing costs of investing in the Fund and other funds. To do so, compare this 5% hypothetical example with the 5% hypothetical examples that appear in the shareholder reports of the other funds. A small balance maintenance fee of $12.00 that is charged once a year may apply for certain accounts with a value of less than $2,000. This fee is not included in the table below. If it was, the estimate of expenses you paid during the period would be higher, and your ending account value lower, by this amount. In addition, the Fund, as a shareholder in the underlying Fidelity Central Funds, will indirectly bear its pro-rata share of the fees and expenses incurred by the underlying Fidelity Central Funds. These fees and expenses are not included in the Fund's annualized expense ratio used to calculate the expense estimate in the table below.
Please note that the expenses shown in the table are meant to highlight your ongoing costs only and do not reflect any transaction costs. Therefore, the second line of the table is useful in comparing ongoing costs only, and will not help you determine the relative total costs of owning different funds. In addition, if these transactional costs were included, your costs would have been higher.
| Annualized Expense Ratio-A | Beginning Account Value November 1, 2015 | Ending Account Value April 30, 2016 | Expenses Paid During Period-B November 1, 2015 to April 30, 2016 | |
| Class A | 1.65% | |||
| Actual | $1,000.00 | $1,058.80 | $8.45 | |
| Hypothetical-C | $1,000.00 | $1,016.66 | $8.27 | |
| Class T | 1.90% | |||
| Actual | $1,000.00 | $1,059.10 | $9.73 | |
| Hypothetical-C | $1,000.00 | $1,015.42 | $9.52 | |
| Class B | 2.40% | |||
| Actual | $1,000.00 | $1,056.00 | $12.27 | |
| Hypothetical-C | $1,000.00 | $1,012.93 | $12.01 | |
| Class C | 2.40% | |||
| Actual | $1,000.00 | $1,055.40 | $12.27 | |
| Hypothetical-C | $1,000.00 | $1,012.93 | $12.01 | |
| Emerging Europe, Middle East, Africa (EMEA) | 1.40% | |||
| Actual | $1,000.00 | $1,061.90 | $7.18 | |
| Hypothetical-C | $1,000.00 | $1,017.90 | $7.02 | |
| Class I | 1.40% | |||
| Actual | $1,000.00 | $1,062.10 | $7.18 | |
| Hypothetical-C | $1,000.00 | $1,017.90 | $7.02 |
A Annualized expense ratio reflects expenses net of applicable fee waivers.
B Expenses are equal to each Class' annualized expense ratio, multiplied by the average account value over the period, multiplied by 182/366 (to reflect the one-half year period).
C 5% return per year before expenses
![]()
Corporate Headquarters
245 Summer St.
Boston, MA 02210
www.fidelity.com
EME-SANN-0616
1.861975.107
Fidelity Advisor® Worldwide Fund - Semi-Annual Report April 30, 2016 Class A, Class T, Class B and Class C are classes of Fidelity® Worldwide Fund |
|
Contents
To view a fund's proxy voting guidelines and proxy voting record for the 12-month period ended June 30, visit http://www.fidelity.com/proxyvotingresults or visit the Securities and Exchange Commission's (SEC) web site at http://www.sec.gov.
You may also call 1-877-208-0098 to request a free copy of the proxy voting guidelines.
Standard & Poor's, S&P and S&P 500 are registered service marks of The McGraw-Hill Companies, Inc. and have been licensed for use by Fidelity Distributors Corporation.
Other third-party marks appearing herein are the property of their respective owners.
All other marks appearing herein are registered or unregistered trademarks or service marks of FMR LLC or an affiliated company. © 2016 FMR LLC. All rights reserved.
This report and the financial statements contained herein are submitted for the general information of the shareholders of the Fund. This report is not authorized for distribution to prospective investors in the Fund unless preceded or accompanied by an effective prospectus.
A fund files its complete schedule of portfolio holdings with the SEC for the first and third quarters of each fiscal year on Form N-Q. Forms N-Q are available on the SEC’s web site at http://www.sec.gov. A fund's Forms N-Q may be reviewed and copied at the SEC’s Public Reference Room in Washington, DC. Information regarding the operation of the SEC's Public Reference Room may be obtained by calling 1-800-SEC-0330.
For a complete list of a fund's portfolio holdings, view the most recent holdings listing, semiannual report, or annual report on Fidelity's web site at http://www.fidelity.com, http://www.advisor.fidelity.com, or http://www.401k.com, as applicable.
NOT FDIC INSURED •MAY LOSE VALUE •NO BANK GUARANTEE
Neither the Fund nor Fidelity Distributors Corporation is a bank.
Investment Summary (Unaudited)
Geographic Diversification (% of fund's net assets)
| As of April 30, 2016 | ||
| United States of America* | 54.9% | |
| Japan | 7.3% | |
| United Kingdom | 6.6% | |
| France | 3.9% | |
| Canada | 3.7% | |
| Germany | 3.7% | |
| Ireland | 2.2% | |
| Switzerland | 1.8% | |
| Sweden | 1.6% | |
| Other | 14.3% | |

* Includes Short-Term Investments and Net Other Assets (Liabilities).
Percentages are based on country or territory of incorporation and are adjusted for the effect of futures contracts, if applicable.
| As of October 31, 2015 | ||
| United States of America* | 51.9% | |
| United Kingdom | 8.9% | |
| Japan | 6.9% | |
| France | 5.5% | |
| Netherlands | 3.1% | |
| Switzerland | 2.6% | |
| Germany | 2.4% | |
| Ireland | 1.9% | |
| Canada | 1.6% | |
| Other | 15.2% | |

* Includes Short-Term Investments and Net Other Assets (Liabilities).
Percentages are based on country or territory of incorporation and are adjusted for the effect of futures contracts, if applicable.
Asset Allocation as of April 30, 2016
| % of fund's net assets | % of fund's net assets 6 months ago | |
| Stocks | 99.4 | 98.4 |
| Other Investments | 0.0 | 0.1 |
| Short-Term Investments and Net Other Assets (Liabilities) | 0.6 | 1.5 |
Top Ten Stocks as of April 30, 2016
| % of fund's net assets | % of fund's net assets 6 months ago | |
| Adobe Systems, Inc. (United States of America, Software) | 2.8 | 2.9 |
| Alphabet, Inc. Class A (United States of America, Internet Software & Services) | 2.8 | 3.0 |
| McGraw Hill Financial, Inc. (United States of America, Diversified Financial Services) | 1.9 | 0.8 |
| AutoZone, Inc. (United States of America, Specialty Retail) | 1.8 | 1.4 |
| PayPal Holdings, Inc. (United States of America, IT Services) | 1.8 | 1.2 |
| Kansas City Southern (United States of America, Road & Rail) | 1.8 | 0.0 |
| Bristol-Myers Squibb Co. (United States of America, Pharmaceuticals) | 1.8 | 0.7 |
| MSCI, Inc. Class A (United States of America, Diversified Financial Services) | 1.7 | 0.0 |
| Reynolds American, Inc. (United States of America, Tobacco) | 1.7 | 1.0 |
| Visa, Inc. Class A (United States of America, IT Services) | 1.7 | 1.7 |
| 19.8 |
Market Sectors as of April 30, 2016
| % of fund's net assets | % of fund's net assets 6 months ago | |
| Information Technology | 18.1 | 21.9 |
| Financials | 16.0 | 17.0 |
| Consumer Discretionary | 14.3 | 16.1 |
| Health Care | 13.5 | 12.9 |
| Consumer Staples | 12.9 | 10.5 |
| Industrials | 12.4 | 8.4 |
| Energy | 5.7 | 6.1 |
| Telecommunication Services | 3.5 | 2.7 |
| Materials | 2.7 | 2.3 |
| Utilities | 0.3 | 0.6 |
Percentages shown as 0.0% may reflect amounts less than 0.05%.
Investments April 30, 2016 (Unaudited)
Showing Percentage of Net Assets
| Common Stocks - 99.3% | |||
| Shares | Value | ||
| Australia - 1.1% | |||
| 1-Page Ltd. (a) | 188,555 | $138,350 | |
| Ansell Ltd. (a) | 120,679 | 1,828,742 | |
| Australia & New Zealand Banking Group Ltd. | 183,181 | 3,357,696 | |
| Burson Group Ltd. | 486,326 | 1,841,494 | |
| Magellan Financial Group Ltd. | 81,493 | 1,332,209 | |
| Mantra Group Ltd. | 551,523 | 1,551,597 | |
| Ramsay Health Care Ltd. | 76,655 | 3,785,587 | |
| Spark Infrastructure Group unit | 1,965,824 | 3,094,059 | |
| TOTAL AUSTRALIA | 16,929,734 | ||
| Austria - 0.2% | |||
| Andritz AG | 28,200 | 1,579,324 | |
| Erste Group Bank AG | 65,200 | 1,875,390 | |
| TOTAL AUSTRIA | 3,454,714 | ||
| Bailiwick of Jersey - 0.6% | |||
| Integrated Diagnostics Holdings PLC | 332,800 | 1,547,520 | |
| Randgold Resources Ltd. sponsored ADR | 16,310 | 1,639,155 | |
| Regus PLC | 695,121 | 2,969,837 | |
| Wizz Air Holdings PLC (a) | 34,000 | 933,967 | |
| Wolseley PLC | 34,027 | 1,905,923 | |
| TOTAL BAILIWICK OF JERSEY | 8,996,402 | ||
| Belgium - 0.7% | |||
| Anheuser-Busch InBev SA NV | 67,411 | 8,344,127 | |
| KBC Groep NV | 55,093 | 3,093,020 | |
| TOTAL BELGIUM | 11,437,147 | ||
| Bermuda - 0.1% | |||
| PAX Global Technology Ltd. | 1,889,000 | 1,626,846 | |
| Canada - 3.7% | |||
| Alimentation Couche-Tard, Inc. Class B (sub. vtg.) | 52,000 | 2,279,429 | |
| Cenovus Energy, Inc. | 916,300 | 14,525,550 | |
| Constellation Software, Inc. | 9,200 | 3,595,384 | |
| Franco-Nevada Corp. | 19,800 | 1,389,168 | |
| Keyera Corp. | 63,000 | 2,029,035 | |
| PrairieSky Royalty Ltd. (b) | 897,799 | 18,904,798 | |
| Suncor Energy, Inc. | 39,400 | 1,156,533 | |
| The Toronto-Dominion Bank | 308,000 | 13,709,891 | |
| TOTAL CANADA | 57,589,788 | ||
| Cayman Islands - 0.6% | |||
| Alibaba Group Holding Ltd. sponsored ADR (a) | 31,400 | 2,415,916 | |
| Ctrip.com International Ltd. ADR (a) | 19,200 | 837,312 | |
| Goodbaby International Holdings Ltd. (a) | 5,171,000 | 2,896,250 | |
| Lee's Pharmaceutical Holdings Ltd. | 433,629 | 350,867 | |
| New Oriental Education & Technology Group, Inc. sponsored ADR | 54,800 | 2,145,968 | |
| TOTAL CAYMAN ISLANDS | 8,646,313 | ||
| Chile - 0.2% | |||
| Vina San Pedro SA | 357,223,088 | 3,519,919 | |
| China - 0.2% | |||
| Jiangsu Hengrui Medicine Co. Ltd. | 264,160 | 1,904,679 | |
| Kweichow Moutai Co. Ltd. | 41,800 | 1,621,884 | |
| TOTAL CHINA | 3,526,563 | ||
| Cyprus - 0.0% | |||
| SPDI Secure Property Development & Investment PLC (a) | 31,822 | 7,963 | |
| Denmark - 0.7% | |||
| NNIT A/S | 115,550 | 3,146,661 | |
| Novo Nordisk A/S Series B | 126,380 | 7,056,351 | |
| TOTAL DENMARK | 10,203,012 | ||
| Finland - 0.3% | |||
| Sampo Oyj (A Shares) | 94,300 | 4,117,209 | |
| France - 3.9% | |||
| Accor SA (b) | 101,869 | 4,512,416 | |
| ALTEN | 40,600 | 2,510,408 | |
| Altran Technologies SA | 155,600 | 2,308,190 | |
| Amundi SA | 38,700 | 1,780,957 | |
| Atos Origin SA | 28,300 | 2,518,889 | |
| AXA SA | 261,900 | 6,612,869 | |
| Capgemini SA | 52,200 | 4,873,179 | |
| Cegedim SA (a) | 35,010 | 961,315 | |
| Havas SA | 308,841 | 2,584,389 | |
| Sanofi SA | 31,628 | 2,606,987 | |
| Sodexo SA | 25,800 | 2,605,335 | |
| SR Teleperformance SA | 18,900 | 1,696,689 | |
| Total SA | 262,323 | 13,258,010 | |
| Unibail-Rodamco | 9,400 | 2,518,652 | |
| VINCI SA | 119,900 | 8,956,897 | |
| TOTAL FRANCE | 60,305,182 | ||
| Germany - 3.7% | |||
| adidas AG | 39,000 | 5,028,373 | |
| Axel Springer Verlag AG | 43,237 | 2,414,036 | |
| Bayer AG | 23,400 | 2,699,513 | |
| Beiersdorf AG | 15,300 | 1,372,810 | |
| Continental AG | 18,000 | 3,953,171 | |
| Deutsche Boerse AG | 32,400 | 2,659,672 | |
| Deutsche Telekom AG | 197,700 | 3,470,312 | |
| Fresenius SE & Co. KGaA | 29,600 | 2,152,914 | |
| GEA Group AG | 48,856 | 2,265,114 | |
| KION Group AG | 90,889 | 4,951,767 | |
| LEG Immobilien AG | 27,743 | 2,567,101 | |
| Nexus AG | 47,000 | 823,405 | |
| ProSiebenSat.1 Media AG | 70,700 | 3,604,118 | |
| Rational AG | 6,700 | 3,401,308 | |
| SAP AG | 86,403 | 6,779,270 | |
| Siemens AG | 43,936 | 4,597,826 | |
| Symrise AG | 39,500 | 2,616,977 | |
| United Internet AG | 28,291 | 1,381,144 | |
| TOTAL GERMANY | 56,738,831 | ||
| Greece - 0.1% | |||
| Folli Follie SA | 59,300 | 1,221,215 | |
| Hong Kong - 1.2% | |||
| AIA Group Ltd. | 1,415,000 | 8,468,217 | |
| China Resources Beer Holdings Co. Ltd. | 1,100,000 | 2,417,152 | |
| Techtronic Industries Co. Ltd. | 2,162,500 | 8,106,499 | |
| TOTAL HONG KONG | 18,991,868 | ||
| India - 1.1% | |||
| Bharti Infratel Ltd. | 667,227 | 3,766,276 | |
| Dr Lal Pathlabs Ltd. | 46,973 | 696,617 | |
| HDFC Bank Ltd. (a) | 21,187 | 430,665 | |
| HDFC Bank Ltd. sponsored ADR | 89,493 | 5,626,425 | |
| Housing Development Finance Corp. Ltd. | 385,477 | 6,316,436 | |
| Lupin Ltd. | 1,335 | 32,302 | |
| TOTAL INDIA | 16,868,721 | ||
| Indonesia - 0.0% | |||
| PT Kino Indonesia Tbk | 234,500 | 86,773 | |
| Ireland - 2.2% | |||
| Alkermes PLC (a) | 159,495 | 6,339,926 | |
| Cairn Homes PLC (a) | 1,347,939 | 1,728,672 | |
| CRH PLC | 70,100 | 2,040,113 | |
| Dalata Hotel Group PLC (a) | 372,400 | 1,880,071 | |
| Green REIT PLC | 621,300 | 1,025,867 | |
| Greencore Group PLC | 1,373,041 | 7,238,438 | |
| Irish Continental Group PLC unit | 7,900 | 46,586 | |
| James Hardie Industries PLC CDI | 115,144 | 1,622,297 | |
| Kerry Group PLC Class A | 56,100 | 5,002,159 | |
| Medtronic PLC | 35,000 | 2,770,250 | |
| Ryanair Holdings PLC sponsored ADR | 53,600 | 4,338,920 | |
| TOTAL IRELAND | 34,033,299 | ||
| Isle of Man - 0.4% | |||
| Optimal Payments PLC (a) | 794,588 | 4,425,779 | |
| Playtech Ltd. | 94,225 | 1,107,610 | |
| TOTAL ISLE OF MAN | 5,533,389 | ||
| Israel - 1.2% | |||
| Bezeq The Israel Telecommunication Corp. Ltd. | 3,079,900 | 6,569,552 | |
| Frutarom Industries Ltd. | 66,100 | 3,387,748 | |
| Partner Communications Co. Ltd. (a) | 177,040 | 921,104 | |
| Teva Pharmaceutical Industries Ltd. sponsored ADR | 140,700 | 7,661,115 | |
| TOTAL ISRAEL | 18,539,519 | ||
| Italy - 0.6% | |||
| De Longhi SpA | 106,950 | 2,462,733 | |
| Intesa Sanpaolo SpA | 1,894,200 | 5,265,498 | |
| Mediaset SpA | 189,800 | 854,109 | |
| Telecom Italia SpA (a) | 1,187,300 | 1,159,367 | |
| TOTAL ITALY | 9,741,707 | ||
| Japan - 7.3% | |||
| A/S One Corp. | 67,300 | 2,426,706 | |
| ACOM Co. Ltd. (a)(b) | 186,100 | 970,816 | |
| Ain Holdings, Inc. | 37,900 | 1,841,106 | |
| Aozora Bank Ltd. | 577,000 | 2,047,205 | |
| Asahi Group Holdings | 68,700 | 2,180,335 | |
| Astellas Pharma, Inc. (c) | 412,200 | 5,557,525 | |
| Broadleaf Co. Ltd. | 104,700 | 1,034,652 | |
| Casio Computer Co. Ltd. | 134,100 | 2,551,511 | |
| Daiichikosho Co. Ltd. | 46,200 | 1,936,786 | |
| Daito Trust Construction Co. Ltd. | 14,200 | 2,008,338 | |
| Dentsu, Inc. (c) | 78,700 | 3,998,669 | |
| Don Quijote Holdings Co. Ltd. | 71,000 | 2,525,884 | |
| Hoya Corp. (c) | 98,300 | 3,764,327 | |
| Japan Exchange Group, Inc. | 115,400 | 1,718,680 | |
| Japan Tobacco, Inc. (c) | 119,400 | 4,878,438 | |
| KDDI Corp. (c) | 281,300 | 8,103,053 | |
| Keyence Corp. (c) | 4,060 | 2,433,536 | |
| Misumi Group, Inc. (c) | 191,700 | 2,647,334 | |
| Mitsubishi UFJ Financial Group, Inc. | 507,500 | 2,342,019 | |
| Monex Group, Inc. | 844,900 | 2,179,604 | |
| NEC Corp. | 458,000 | 1,114,669 | |
| Nidec Corp. | 19,300 | 1,414,189 | |
| Nintendo Co. Ltd. | 18,300 | 2,477,839 | |
| Nippon Kanzai Co. Ltd. | 107,000 | 1,637,128 | |
| Nippon Telegraph & Telephone Corp. | 60,300 | 2,698,445 | |
| Olympus Corp. (c) | 195,400 | 7,612,124 | |
| ORIX Corp. (c) | 495,400 | 7,007,401 | |
| Seven & i Holdings Co. Ltd. (c) | 64,400 | 2,627,677 | |
| Seven Bank Ltd. (c) | 666,300 | 2,831,247 | |
| Shinsei Bank Ltd. | 919,000 | 1,288,049 | |
| Shionogi & Co. Ltd. | 57,900 | 2,955,341 | |
| Sony Corp. | 231,600 | 5,609,728 | |
| Sundrug Co. Ltd. (c) | 39,300 | 2,792,493 | |
| Tsuruha Holdings, Inc. (c) | 58,000 | 5,563,107 | |
| United Arrows Ltd. | 63,100 | 2,535,495 | |
| VT Holdings Co. Ltd. | 280,200 | 1,415,759 | |
| Welcia Holdings Co. Ltd. | 76,800 | 4,056,766 | |
| TOTAL JAPAN | 112,783,981 | ||
| Kenya - 0.1% | |||
| Safaricom Ltd. | 6,251,600 | 1,058,439 | |
| Luxembourg - 0.4% | |||
| Eurofins Scientific SA | 7,900 | 2,931,322 | |
| Grand City Properties SA | 100,234 | 2,213,970 | |
| Senvion SA | 54,800 | 963,193 | |
| TOTAL LUXEMBOURG | 6,108,485 | ||
| Marshall Islands - 0.1% | |||
| Hoegh LNG Partners LP | 49,800 | 897,396 | |
| Netherlands - 1.3% | |||
| AerCap Holdings NV (a) | 31,800 | 1,272,318 | |
| IMCD Group BV | 127,200 | 5,135,632 | |
| ING Groep NV (Certificaten Van Aandelen) | 314,600 | 3,852,689 | |
| Unilever NV (Certificaten Van Aandelen) (Bearer) | 233,500 | 10,257,618 | |
| TOTAL NETHERLANDS | 20,518,257 | ||
| New Zealand - 0.3% | |||
| EBOS Group Ltd. | 210,137 | 2,341,781 | |
| Ryman Healthcare Group Ltd. | 436,814 | 2,723,698 | |
| TOTAL NEW ZEALAND | 5,065,479 | ||
| Norway - 0.7% | |||
| Statoil ASA | 602,500 | 10,604,780 | |
| Philippines - 0.2% | |||
| D&L Industries, Inc. | 8,349,900 | 1,597,727 | |
| SM Investments Corp. | 106,630 | 2,140,081 | |
| TOTAL PHILIPPINES | 3,737,808 | ||
| South Africa - 0.7% | |||
| Distell Group Ltd. | 126,410 | 1,411,931 | |
| EOH Holdings Ltd. | 184,122 | 1,792,038 | |
| Naspers Ltd. Class N | 54,500 | 7,477,950 | |
| TOTAL SOUTH AFRICA | 10,681,919 | ||
| Spain - 1.0% | |||
| Amadeus IT Holding SA Class A | 103,000 | 4,686,942 | |
| Atresmedia Corporacion de Medios de Comunicacion SA | 108,300 | 1,409,981 | |
| Hispania Activos Inmobiliarios SA (a) | 76,100 | 1,115,370 | |
| Inditex SA | 126,730 | 4,068,220 | |
| Mediaset Espana Comunicacion SA | 183,300 | 2,380,126 | |
| Merlin Properties Socimi SA | 162,800 | 1,892,104 | |
| TOTAL SPAIN | 15,552,743 | ||
| Sweden - 1.6% | |||
| ASSA ABLOY AB (B Shares) | 214,400 | 4,496,007 | |
| Getinge AB (B Shares) | 152,600 | 3,226,654 | |
| HEXPOL AB (B Shares) (b) | 189,000 | 1,953,440 | |
| Indutrade AB | 13,200 | 740,178 | |
| Nordea Bank AB | 314,800 | 3,055,702 | |
| Saab AB (B Shares) | 65,000 | 2,223,474 | |
| Sandvik AB (b) | 142,700 | 1,464,237 | |
| Svenska Cellulosa AB (SCA) (B Shares) | 189,000 | 5,952,107 | |
| Svenska Handelsbanken AB (A Shares) | 154,000 | 2,054,384 | |
| TOTAL SWEDEN | 25,166,183 | ||
| Switzerland - 1.8% | |||
| Chubb Ltd. | 14,000 | 1,650,040 | |
| GAM Holding Ltd. | 88,177 | 1,148,976 | |
| Julius Baer Group Ltd. | 59,790 | 2,562,347 | |
| Novartis AG | 83,226 | 6,333,687 | |
| Partners Group Holding AG | 15,318 | 6,307,318 | |
| Schindler Holding AG (participation certificate) | 10,829 | 1,972,090 | |
| Syngenta AG (Switzerland) | 10,848 | 4,342,366 | |
| UBS Group AG | 246,320 | 4,262,391 | |
| TOTAL SWITZERLAND | 28,579,215 | ||
| Taiwan - 0.1% | |||
| JHL Biotech, Inc. (a) | 295,104 | 797,986 | |
| United Kingdom - 6.6% | |||
| AA PLC | 246,910 | 1,005,112 | |
| Associated British Foods PLC | 48,600 | 2,175,804 | |
| B&M European Value Retail S.A. | 583,765 | 2,366,134 | |
| BAE Systems PLC | 275,100 | 1,919,279 | |
| BCA Marketplace PLC | 511,600 | 1,246,497 | |
| BHP Billiton PLC | 192,312 | 2,627,846 | |
| BT Group PLC | 385,900 | 2,501,431 | |
| Bunzl PLC | 127,500 | 3,798,588 | |
| Cineworld Group PLC | 138,500 | 1,048,273 | |
| CMC Markets PLC | 654,000 | 2,388,980 | |
| Compass Group PLC | 131,200 | 2,336,461 | |
| Countryside Properties PLC (a) | 263,300 | 894,476 | |
| Diploma PLC | 147,500 | 1,576,526 | |
| GlaxoSmithKline PLC | 259,900 | 5,554,702 | |
| Hilton Food Group PLC | 350,100 | 2,880,019 | |
| Howden Joinery Group PLC | 675,800 | 4,877,979 | |
| Imperial Tobacco Group PLC | 222,944 | 12,113,186 | |
| ITV PLC | 586,400 | 1,929,555 | |
| Lloyds Banking Group PLC | 4,388,300 | 4,307,165 | |
| London Stock Exchange Group PLC | 10,881 | 431,334 | |
| McCarthy & Stone PLC | 298,600 | 1,012,215 | |
| Melrose Industries PLC | 98,908 | 539,491 | |
| Micro Focus International PLC | 239,300 | 5,346,197 | |
| Moneysupermarket.com Group PLC | 393,500 | 1,804,807 | |
| Persimmon PLC | 92,000 | 2,671,041 | |
| Reckitt Benckiser Group PLC | 54,500 | 5,309,330 | |
| Rex Bionics PLC (a) | 100,000 | 53,332 | |
| Rio Tinto PLC | 79,100 | 2,653,512 | |
| SABMiller PLC | 44,000 | 2,690,562 | |
| Shawbrook Group PLC | 574,700 | 2,406,646 | |
| Softcat PLC | 114,400 | 533,226 | |
| Spirax-Sarco Engineering PLC | 33,846 | 1,688,857 | |
| St. James's Place Capital PLC | 318,800 | 4,038,613 | |
| Standard Chartered PLC (United Kingdom) | 353,550 | 2,852,091 | |
| Taylor Wimpey PLC | 761,900 | 2,051,720 | |
| Virgin Money Holdings Uk PLC | 423,100 | 2,257,094 | |
| Vodafone Group PLC | 1,878,909 | 6,053,540 | |
| Workspace Group PLC | 48,900 | 596,609 | |
| TOTAL UNITED KINGDOM | 102,538,230 | ||
| United States of America - 54.3% | |||
| AAON, Inc. | 53,000 | 1,405,560 | |
| Activision Blizzard, Inc. | 66,000 | 2,275,020 | |
| Acuity Brands, Inc. | 22,000 | 5,365,580 | |
| Adobe Systems, Inc. (a) | 466,224 | 43,927,622 | |
| Air Products & Chemicals, Inc. | 7,000 | 1,021,230 | |
| Alaska Air Group, Inc. | 255,400 | 17,987,822 | |
| Albemarle Corp. U.S. | 110,000 | 7,277,600 | |
| Alphabet, Inc. Class A | 62,000 | 43,888,560 | |
| Amazon.com, Inc. (a) | 30,000 | 19,787,700 | |
| American Tower Corp. | 237,000 | 24,856,560 | |
| ANSYS, Inc. (a) | 91,000 | 8,260,070 | |
| Applied Materials, Inc. | 129,000 | 2,640,630 | |
| AT&T, Inc. | 335,000 | 13,004,700 | |
| AutoZone, Inc. (a) | 37,100 | 28,390,033 | |
| Bats Global Markets, Inc. | 39,300 | 931,803 | |
| BlackRock, Inc. Class A | 5,000 | 1,781,650 | |
| bluebird bio, Inc. (a) | 33,000 | 1,463,550 | |
| Boston Scientific Corp.(a) | 225,000 | 4,932,000 | |
| Bristol-Myers Squibb Co. | 374,900 | 27,060,282 | |
| Cigna Corp. | 17,000 | 2,355,180 | |
| CME Group, Inc. | 98,000 | 9,007,180 | |
| Cognizant Technology Solutions Corp. Class A (a) | 266,000 | 15,526,420 | |
| ConocoPhillips Co. | 361,000 | 17,252,190 | |
| Constellation Brands, Inc. Class A (sub. vtg.) | 110,600 | 17,260,236 | |
| Cummins, Inc. | 3,000 | 351,090 | |
| CVS Health Corp. | 61,000 | 6,130,500 | |
| D.R. Horton, Inc. | 118,000 | 3,547,080 | |
| Danaher Corp. | 28,300 | 2,738,025 | |
| E*TRADE Financial Corp. (a) | 127,000 | 3,197,860 | |
| Edwards Lifesciences Corp. (a) | 29,000 | 3,080,090 | |
| Electronic Arts, Inc. (a) | 108,000 | 6,679,800 | |
| Equifax, Inc. | 17,000 | 2,044,250 | |
| Estee Lauder Companies, Inc. Class A | 225,000 | 21,570,750 | |
| Extra Space Storage, Inc. | 83,000 | 7,050,850 | |
| Facebook, Inc. Class A (a) | 155,500 | 18,283,690 | |
| Gilead Sciences, Inc. | 66,000 | 5,821,860 | |
| Global Payments, Inc. | 31,400 | 2,266,452 | |
| HealthSouth Corp. warrants 1/17/17 (a) | 341 | 1,231 | |
| Hess Corp. | 155,000 | 9,241,100 | |
| Home Depot, Inc. | 92,000 | 12,317,880 | |
| Intercept Pharmaceuticals, Inc. (a) | 44,500 | 6,707,930 | |
| Interpublic Group of Companies, Inc. | 191,000 | 4,381,540 | |
| Ionis Pharmaceuticals, Inc. (a) | 37,000 | 1,515,890 | |
| J.B. Hunt Transport Services, Inc. | 15,000 | 1,243,200 | |
| Kansas City Southern | 294,000 | 27,856,500 | |
| Level 3 Communications, Inc. (a) | 83,000 | 4,337,580 | |
| Lockheed Martin Corp. | 38,000 | 8,830,440 | |
| lululemon athletica, Inc. (a) | 48,000 | 3,146,400 | |
| MasterCard, Inc. Class A | 225,000 | 21,822,750 | |
| McGraw Hill Financial, Inc. | 276,549 | 29,549,261 | |
| Medivation, Inc. (a) | 345,082 | 19,945,740 | |
| Molson Coors Brewing Co. Class B | 133,400 | 12,757,042 | |
| Monster Beverage Corp. | 10,000 | 1,442,200 | |
| MSCI, Inc. Class A | 339,300 | 25,766,442 | |
| Newell Brands, Inc. | 196,000 | 8,925,840 | |
| NewMarket Corp. | 9,140 | 3,711,388 | |
| NIKE, Inc. Class B | 214,000 | 12,613,160 | |
| Norfolk Southern Corp. | 189,000 | 17,030,790 | |
| Northrop Grumman Corp. | 44,000 | 9,075,440 | |
| NVIDIA Corp. | 11,900 | 422,807 | |
| O'Reilly Automotive, Inc. (a) | 24,000 | 6,304,320 | |
| PACCAR, Inc. | 69,000 | 4,064,790 | |
| PayPal Holdings, Inc. (a) | 716,000 | 28,052,880 | |
| Phillips 66 Co. | 14,000 | 1,149,540 | |
| Post Holdings, Inc. (a) | 127,800 | 9,181,152 | |
| Prestige Brands Holdings, Inc. (a) | 332,000 | 18,850,960 | |
| Priceline Group, Inc. (a) | 5,000 | 6,718,300 | |
| Public Storage | 9,000 | 2,203,290 | |
| PVH Corp. | 25,000 | 2,390,000 | |
| Raytheon Co. | 21,000 | 2,653,350 | |
| Regal Beloit Corp. | 30,000 | 1,932,600 | |
| Reynolds American, Inc. | 517,000 | 25,643,200 | |
| Salesforce.com, Inc. (a) | 125,300 | 9,497,740 | |
| ServiceMaster Global Holdings, Inc. (a) | 32,500 | 1,245,400 | |
| Sherwin-Williams Co. | 13,000 | 3,735,030 | |
| Skechers U.S.A., Inc. Class A (sub. vtg.) (a) | 23,200 | 766,760 | |
| SLM Corp. (a) | 72,443 | 490,439 | |
| Southwest Airlines Co. | 18,000 | 802,980 | |
| Spectrum Brands Holdings, Inc. | 43,000 | 4,884,800 | |
| Spirit Airlines, Inc. (a) | 223,900 | 9,835,927 | |
| The NASDAQ OMX Group, Inc. | 45,000 | 2,776,950 | |
| Ultragenyx Pharmaceutical, Inc. (a) | 21,700 | 1,467,354 | |
| Under Armour, Inc. Class A (sub. vtg.) (a) | 10,000 | 439,400 | |
| Union Pacific Corp. | 50,000 | 4,361,500 | |
| UnitedHealth Group, Inc. | 146,000 | 19,225,280 | |
| Visa, Inc. Class A | 330,500 | 25,527,820 | |
| Xylem, Inc. | 69,000 | 2,882,820 | |
| TOTAL UNITED STATES OF AMERICA | 840,148,608 | ||
| TOTAL COMMON STOCKS | |||
| (Cost $1,334,730,075) | 1,536,355,623 | ||
| Nonconvertible Preferred Stocks - 0.1% | |||
| Cayman Islands - 0.1% | |||
| China Internet Plus Holdings Ltd. Series A-11 (d) | |||
| (Cost $1,166,878) | 369,166 | 1,425,239 | |
| Money Market Funds - 2.1% | |||
| Fidelity Cash Central Fund, 0.38% (e) | 25,131,066 | 25,131,066 | |
| Fidelity Securities Lending Cash Central Fund, 0.42% (e)(f) | 7,590,746 | 7,590,746 | |
| TOTAL MONEY MARKET FUNDS | |||
| (Cost $32,721,812) | 32,721,812 | ||
| TOTAL INVESTMENT PORTFOLIO - 101.5% | |||
| (Cost $1,368,618,765) | 1,570,502,674 | ||
| NET OTHER ASSETS (LIABILITIES) - (1.5)% | (22,547,155) | ||
| NET ASSETS - 100% | $1,547,955,519 |
Categorizations in the Schedule of Investments are based on country or territory of incorporation.
Legend
(a) Non-income producing
(b) Security or a portion of the security is on loan at period end.
(c) A portion of the security sold on a delayed delivery basis.
(d) Restricted securities - Investment in securities not registered under the Securities Act of 1933 (excluding 144A issues). At the end of the period, the value of restricted securities (excluding 144A issues) amounted to $1,425,239 or 0.1% of net assets.
(e) Affiliated fund that is generally available only to investment companies and other accounts managed by Fidelity Investments. The rate quoted is the annualized seven-day yield of the fund at period end. A complete unaudited listing of the fund's holdings as of its most recent quarter end is available upon request. In addition, each Fidelity Central Fund's financial statements are available on the SEC's website or upon request.
(f) Investment made with cash collateral received from securities on loan.
Additional information on each restricted holding is as follows:
| Security | Acquisition Date | Acquisition Cost |
| China Internet Plus Holdings Ltd. Series A-11 | 1/26/15 | $1,166,878 |
Affiliated Central Funds
Information regarding fiscal year to date income earned by the Fund from investments in Fidelity Central Funds is as follows:
| Fund | Income earned |
| Fidelity Cash Central Fund | $52,860 |
| Fidelity Securities Lending Cash Central Fund | 115,427 |
| Total | $168,287 |
Investment Valuation
The following is a summary of the inputs used, as of April 30, 2016, involving the Fund's assets and liabilities carried at fair value. The inputs or methodology used for valuing securities may not be an indication of the risk associated with investing in those securities. For more information on valuation inputs, and their aggregation into the levels used below, please refer to the Investment Valuation section in the accompanying Notes to Financial Statements.
| Valuation Inputs at Reporting Date: | ||||
| Description | Total | Level 1 | Level 2 | Level 3 |
| Investments in Securities: | ||||
| Equities: | ||||
| Consumer Discretionary | $218,964,167 | $182,404,671 | $35,134,257 | $1,425,239 |
| Consumer Staples | 197,483,050 | 165,816,646 | 31,666,404 | -- |
| Energy | 89,018,932 | 65,156,142 | 23,862,790 | -- |
| Financials | 250,165,204 | 194,713,004 | 55,452,200 | -- |
| Health Care | 206,083,498 | 161,864,881 | 44,218,617 | -- |
| Industrials | 192,772,231 | 178,650,552 | 14,121,679 | -- |
| Information Technology | 283,977,132 | 265,991,431 | 17,985,701 | -- |
| Materials | 41,615,597 | 34,294,126 | 7,321,471 | -- |
| Telecommunication Services | 53,643,799 | 29,657,651 | 23,986,148 | -- |
| Utilities | 4,057,252 | 4,057,252 | -- | -- |
| Money Market Funds | 32,721,812 | 32,721,812 | -- | -- |
| Total Investments in Securities: | $1,570,502,674 | $1,315,328,168 | $253,749,267 | $1,425,239 |
The following is a summary of transfers between Level 1 and Level 2 for the period ended April 30, 2016. Transfers are assumed to have occurred at the beginning of the period, and are primarily attributable to the valuation techniques used for foreign equity securities, as discussed in the accompanying Notes to Financial Statements:
| Transfers | Total |
| Level 1 to Level 2 | $9,091,486 |
| Level 2 to Level 1 | $46,637,934 |
See accompanying notes which are an integral part of the financial statements.
Financial Statements
Statement of Assets and Liabilities
| April 30, 2016 (Unaudited) | ||
| Assets | ||
| Investment in securities, at value (including securities loaned of $7,029,594) — See accompanying schedule: Unaffiliated issuers (cost $1,335,896,953) | $1,537,780,862 | |
| Fidelity Central Funds (cost $32,721,812) | 32,721,812 | |
| Total Investments (cost $1,368,618,765) | $1,570,502,674 | |
| Foreign currency held at value (cost $56,309) | 55,661 | |
| Receivable for investments sold | ||
| Regular delivery | 56,537,304 | |
| Delayed delivery | 3,448,730 | |
| Receivable for fund shares sold | 748,207 | |
| Dividends receivable | 3,847,525 | |
| Distributions receivable from Fidelity Central Funds | 50,420 | |
| Prepaid expenses | 1,213 | |
| Other receivables | 57,052 | |
| Total assets | 1,635,248,786 | |
| Liabilities | ||
| Payable to custodian bank | $2,570,144 | |
| Payable for investments purchased | 51,436,354 | |
| Payable for fund shares redeemed | 24,394,053 | |
| Accrued management fee | 869,060 | |
| Distribution and service plan fees payable | 21,526 | |
| Other affiliated payables | 296,749 | |
| Other payables and accrued expenses | 114,635 | |
| Collateral on securities loaned, at value | 7,590,746 | |
| Total liabilities | 87,293,267 | |
| Net Assets | $1,547,955,519 | |
| Net Assets consist of: | ||
| Paid in capital | $1,389,384,590 | |
| Undistributed net investment income | 5,568,061 | |
| Accumulated undistributed net realized gain (loss) on investments and foreign currency transactions | (48,853,510) | |
| Net unrealized appreciation (depreciation) on investments and assets and liabilities in foreign currencies | 201,856,378 | |
| Net Assets | $1,547,955,519 | |
| Calculation of Maximum Offering Price | ||
| Class A: | ||
| Net Asset Value and redemption price per share ($31,310,008 ÷ 1,451,507 shares) | $21.57 | |
| Maximum offering price per share (100/94.25 of $21.57) | $22.89 | |
| Class T: | ||
| Net Asset Value and redemption price per share ($12,729,077 ÷ 593,461 shares) | $21.45 | |
| Maximum offering price per share (100/96.50 of $21.45) | $22.23 | |
| Class B: | ||
| Net Asset Value and offering price per share ($260,690 ÷ 12,281 shares)(a) | $21.23 | |
| Class C: | ||
| Net Asset Value and offering price per share ($11,119,959 ÷ 525,510 shares)(a) | $21.16 | |
| Worldwide: | ||
| Net Asset Value, offering price and redemption price per share ($1,468,611,488 ÷ 67,368,997 shares) | $21.80 | |
| Class I: | ||
| Net Asset Value, offering price and redemption price per share ($23,924,297 ÷ 1,102,338 shares) | $21.70 |
(a) Redemption price per share is equal to net asset value less any applicable contingent deferred sales charge.
See accompanying notes which are an integral part of the financial statements.
Statement of Operations
| Six months ended April 30, 2016 (Unaudited) | ||
| Investment Income | ||
| Dividends | $15,209,013 | |
| Interest | 2,357 | |
| Income from Fidelity Central Funds | 168,287 | |
| Income before foreign taxes withheld | 15,379,657 | |
| Less foreign taxes withheld | (836,245) | |
| Total income | 14,543,412 | |
| Expenses | ||
| Management fee | ||
| Basic fee | $5,237,370 | |
| Performance adjustment | 226,333 | |
| Transfer agent fees | 1,535,248 | |
| Distribution and service plan fees | 126,742 | |
| Accounting and security lending fees | 243,129 | |
| Custodian fees and expenses | 82,458 | |
| Independent trustees' compensation | 3,434 | |
| Registration fees | 83,611 | |
| Audit | 68,029 | |
| Legal | 3,483 | |
| Miscellaneous | 5,229 | |
| Total expenses before reductions | 7,615,066 | |
| Expense reductions | (26,777) | 7,588,289 |
| Net investment income (loss) | 6,955,123 | |
| Realized and Unrealized Gain (Loss) | ||
| Net realized gain (loss) on: | ||
| Investment securities: | ||
| Unaffiliated issuers (net of foreign taxes of $2,129) | (43,599,935) | |
| Foreign currency transactions | 348,368 | |
| Total net realized gain (loss) | (43,251,567) | |
| Change in net unrealized appreciation (depreciation) on: Investment securities (net of decrease in deferred foreign taxes of $31,438) | 1,538,838 | |
| Assets and liabilities in foreign currencies | (102,488) | |
| Total change in net unrealized appreciation (depreciation) | 1,436,350 | |
| Net gain (loss) | (41,815,217) | |
| Net increase (decrease) in net assets resulting from operations | $(34,860,094) |
See accompanying notes which are an integral part of the financial statements.
Statement of Changes in Net Assets
| Six months ended April 30, 2016 (Unaudited) | Year ended October 31, 2015 | |
| Increase (Decrease) in Net Assets | ||
| Operations | ||
| Net investment income (loss) | $6,955,123 | $8,944,137 |
| Net realized gain (loss) | (43,251,567) | 60,531,683 |
| Change in net unrealized appreciation (depreciation) | 1,436,350 | (24,468,691) |
| Net increase (decrease) in net assets resulting from operations | (34,860,094) | 45,007,129 |
| Distributions to shareholders from net investment income | (9,278,911) | (4,942,326) |
| Distributions to shareholders from net realized gain | (52,672,015) | (154,486,836) |
| Total distributions | (61,950,926) | (159,429,162) |
| Share transactions - net increase (decrease) | 20,375,577 | 128,269,740 |
| Redemption fees | 6,138 | 21,658 |
| Total increase (decrease) in net assets | (76,429,305) | 13,869,365 |
| Net Assets | ||
| Beginning of period | 1,624,384,824 | 1,610,515,459 |
| End of period (including undistributed net investment income of $5,568,061 and undistributed net investment income of $7,891,849, respectively) | $1,547,955,519 | $1,624,384,824 |
See accompanying notes which are an integral part of the financial statements.
Financial Highlights — Fidelity Worldwide Fund Class A
| Six months ended (Unaudited) April 30, | Years ended October 31, | |||||
| 2016 | 2015 | 2014 | 2013 | 2012 | 2011 | |
| Selected Per–Share Data | ||||||
| Net asset value, beginning of period | $22.88 | $24.64 | $25.18 | $19.69 | $17.89 | $17.50 |
| Income from Investment Operations | ||||||
| Net investment income (loss)A | .06 | .06 | .02 | .02 | .10 | .05 |
| Net realized and unrealized gain (loss) | (.55) | .58 | 1.46 | 5.66 | 1.72 | .47 |
| Total from investment operations | (.49) | .64 | 1.48 | 5.68 | 1.82 | .52 |
| Distributions from net investment income | (.07) | – | (.04) | (.11) | (.02) | (.08) |
| Distributions from net realized gain | (.75) | (2.40) | (1.98) | (.08) | – | (.05) |
| Total distributions | (.82) | (2.40) | (2.02) | (.19) | (.02) | (.13) |
| Redemption fees added to paid in capitalA,B | – | – | – | – | – | – |
| Net asset value, end of period | $21.57 | $22.88 | $24.64 | $25.18 | $19.69 | $17.89 |
| Total ReturnC,D,E | (2.27)% | 2.73% | 6.29% | 29.10% | 10.20% | 2.94% |
| Ratios to Average Net AssetsF,G | ||||||
| Expenses before reductions | 1.27%H | 1.27% | 1.31% | 1.45% | 1.43% | 1.41% |
| Expenses net of fee waivers, if any | 1.27%H | 1.26% | 1.31% | 1.45% | 1.43% | 1.40% |
| Expenses net of all reductions | 1.27%H | 1.26% | 1.31% | 1.42% | 1.41% | 1.38% |
| Net investment income (loss) | .60%H | .27% | .10% | .09% | .52% | .28% |
| Supplemental Data | ||||||
| Net assets, end of period (000 omitted) | $31,310 | $31,043 | $33,788 | $28,661 | $18,723 | $13,153 |
| Portfolio turnover rateI | 124%H | 151% | 163% | 161% | 186% | 203% |
A Calculated based on average shares outstanding during the period.
B Amount represents less than $.005 per share.
C Total returns for periods of less than one year are not annualized.
D Total returns would have been lower if certain expenses had not been reduced during the applicable periods shown.
E Total returns do not include the effect of the sales charges.
F Fees and expenses of any underlying Fidelity Central Funds are not included in the Fund's expense ratio. The Fund indirectly bears its proportionate share of the expenses of any underlying Fidelity Central Funds.
G Expense ratios reflect operating expenses of the class. Expenses before reductions do not reflect amounts reimbursed by the investment adviser or reductions from brokerage service arrangements or reductions from other expense offset arrangements and do not represent the amount paid by the class during periods when reimbursements or reductions occur. Expenses net of fee waivers reflect expenses after reimbursement by the investment adviser but prior to reductions from brokerage service arrangements or other expense offset arrangements. Expenses net of all reductions represent the net expenses paid by the class.
H Annualized
I Amount does not include the portfolio activity of any underlying Fidelity Central Funds.
See accompanying notes which are an integral part of the financial statements.
Financial Highlights — Fidelity Worldwide Fund Class T
| Six months ended (Unaudited) April 30, | Years ended October 31, | |||||
| 2016 | 2015 | 2014 | 2013 | 2012 | 2011 | |
| Selected Per–Share Data | ||||||
| Net asset value, beginning of period | $22.72 | $24.49 | $25.05 | $19.61 | $17.83 | $17.46 |
| Income from Investment Operations | ||||||
| Net investment income (loss)A | .03 | (.01) | (.04) | (.04) | .05 | .01 |
| Net realized and unrealized gain (loss) | (.55) | .57 | 1.46 | 5.63 | 1.73 | .45 |
| Total from investment operations | (.52) | .56 | 1.42 | 5.59 | 1.78 | .46 |
| Distributions from net investment income | – | – | – | (.07) | – | (.04) |
| Distributions from net realized gain | (.75) | (2.33) | (1.98) | (.08) | – | (.05) |
| Total distributions | (.75) | (2.33) | (1.98) | (.15) | – | (.09) |
| Redemption fees added to paid in capitalA,B | – | – | – | – | – | – |
| Net asset value, end of period | $21.45 | $22.72 | $24.49 | $25.05 | $19.61 | $17.83 |
| Total ReturnC,D,E | (2.38)% | 2.36% | 6.05% | 28.73% | 9.98% | 2.61% |
| Ratios to Average Net AssetsF,G | ||||||
| Expenses before reductions | 1.57%H | 1.57% | 1.58% | 1.71% | 1.68% | 1.66% |
| Expenses net of fee waivers, if any | 1.57%H | 1.56% | 1.58% | 1.70% | 1.68% | 1.65% |
| Expenses net of all reductions | 1.57%H | 1.56% | 1.58% | 1.68% | 1.66% | 1.63% |
| Net investment income (loss) | .30%H | (.04)% | (.17)% | (.16)% | .26% | .03% |
| Supplemental Data | ||||||
| Net assets, end of period (000 omitted) | $12,729 | $13,055 | $12,160 | $9,822 | $5,550 | $2,187 |
| Portfolio turnover rateI | 124%H | 151% | 163% | 161% | 186% | 203% |
A Calculated based on average shares outstanding during the period.
B Amount represents less than $.005 per share.
C Total returns for periods of less than one year are not annualized.
D Total returns would have been lower if certain expenses had not been reduced during the applicable periods shown.
E Total returns do not include the effect of the sales charges.
F Fees and expenses of any underlying Fidelity Central Funds are not included in the Fund's expense ratio. The Fund indirectly bears its proportionate share of the expenses of any underlying Fidelity Central Funds.
G Expense ratios reflect operating expenses of the class. Expenses before reductions do not reflect amounts reimbursed by the investment adviser or reductions from brokerage service arrangements or reductions from other expense offset arrangements and do not represent the amount paid by the class during periods when reimbursements or reductions occur. Expenses net of fee waivers reflect expenses after reimbursement by the investment adviser but prior to reductions from brokerage service arrangements or other expense offset arrangements. Expenses net of all reductions represent the net expenses paid by the class.
H Annualized
I Amount does not include the portfolio activity of any underlying Fidelity Central Funds.
See accompanying notes which are an integral part of the financial statements.
Financial Highlights — Fidelity Worldwide Fund Class B
| Six months ended (Unaudited) April 30, | Years ended October 31, | |||||
| 2016 | 2015 | 2014 | 2013 | 2012 | 2011 | |
| Selected Per–Share Data | ||||||
| Net asset value, beginning of period | $22.55 | $24.21 | $24.82 | $19.44 | $17.77 | $17.39 |
| Income from Investment Operations | ||||||
| Net investment income (loss)A | (.02) | (.13) | (.17) | (.14) | (.04) | (.09) |
| Net realized and unrealized gain (loss) | (.55) | .57 | 1.45 | 5.59 | 1.71 | .47 |
| Total from investment operations | (.57) | .44 | 1.28 | 5.45 | 1.67 | .38 |
| Distributions from net investment income | – | – | – | – | – | – |
| Distributions from net realized gain | (.75) | (2.10) | (1.89) | (.07) | – | – |
| Total distributions | (.75) | (2.10) | (1.89) | (.07) | – | – |
| Redemption fees added to paid in capitalA,B | – | – | – | – | – | – |
| Net asset value, end of period | $21.23 | $22.55 | $24.21 | $24.82 | $19.44 | $17.77 |
| Total ReturnC,D,E | (2.65)% | 1.88% | 5.49% | 28.13% | 9.40% | 2.19% |
| Ratios to Average Net AssetsF,G | ||||||
| Expenses before reductions | 2.06%H | 2.08% | 2.09% | 2.19% | 2.18% | 2.16% |
| Expenses net of fee waivers, if any | 2.06%H | 2.08% | 2.09% | 2.19% | 2.18% | 2.16% |
| Expenses net of all reductions | 2.06%H | 2.07% | 2.09% | 2.17% | 2.16% | 2.13% |
| Net investment income (loss) | (.19)%H | (.55)% | (.68)% | (.65)% | (.23)% | (.47)% |
| Supplemental Data | ||||||
| Net assets, end of period (000 omitted) | $261 | $367 | $573 | $710 | $304 | $256 |
| Portfolio turnover rateI | 124%H | 151% | 163% | 161% | 186% | 203% |
A Calculated based on average shares outstanding during the period.
B Amount represents less than $.005 per share.
C Total returns for periods of less than one year are not annualized.
D Total returns would have been lower if certain expenses had not been reduced during the applicable periods shown.
E Total returns do not include the effect of the contingent deferred sales charge.
F Fees and expenses of any underlying Fidelity Central Funds are not included in the Fund's expense ratio. The Fund indirectly bears its proportionate share of the expenses of any underlying Fidelity Central Funds.
G Expense ratios reflect operating expenses of the class. Expenses before reductions do not reflect amounts reimbursed by the investment adviser or reductions from brokerage service arrangements or reductions from other expense offset arrangements and do not represent the amount paid by the class during periods when reimbursements or reductions occur. Expenses net of fee waivers reflect expenses after reimbursement by the investment adviser but prior to reductions from brokerage service arrangements or other expense offset arrangements. Expenses net of all reductions represent the net expenses paid by the class.
H Annualized
I Amount does not include the portfolio activity of any underlying Fidelity Central Funds.
See accompanying notes which are an integral part of the financial statements.
Financial Highlights — Fidelity Worldwide Fund Class C
| Six months ended (Unaudited) April 30, | Years ended October 31, | |||||
| 2016 | 2015 | 2014 | 2013 | 2012 | 2011 | |
| Selected Per–Share Data | ||||||
| Net asset value, beginning of period | $22.48 | $24.12 | $24.78 | $19.41 | $17.74 | $17.36 |
| Income from Investment Operations | ||||||
| Net investment income (loss)A | (.02) | (.12) | (.15) | (.14) | (.04) | (.09) |
| Net realized and unrealized gain (loss) | (.55) | .57 | 1.44 | 5.58 | 1.71 | .47 |
| Total from investment operations | (.57) | .45 | 1.29 | 5.44 | 1.67 | .38 |
| Distributions from net investment income | – | – | – | – | – | – |
| Distributions from net realized gain | (.75) | (2.09) | (1.95) | (.07) | – | – |
| Total distributions | (.75) | (2.09) | (1.95) | (.07) | – | – |
| Redemption fees added to paid in capitalA,B | – | – | – | – | – | – |
| Net asset value, end of period | $21.16 | $22.48 | $24.12 | $24.78 | $19.41 | $17.74 |
| Total ReturnC,D,E | (2.66)% | 1.90% | 5.55% | 28.12% | 9.41% | 2.19% |
| Ratios to Average Net AssetsF,G | ||||||
| Expenses before reductions | 2.06%H | 2.07% | 2.04% | 2.15% | 2.18% | 2.16% |
| Expenses net of fee waivers, if any | 2.06%H | 2.07% | 2.04% | 2.14% | 2.18% | 2.15% |
| Expenses net of all reductions | 2.06%H | 2.06% | 2.03% | 2.12% | 2.16% | 2.13% |
| Net investment income (loss) | (.19)%H | (.54)% | (.63)% | (.60)% | (.23)% | (.47)% |
| Supplemental Data | ||||||
| Net assets, end of period (000 omitted) | $11,120 | $11,231 | $9,229 | $10,778 | $1,726 | $1,297 |
| Portfolio turnover rateI | 124%H | 151% | 163% | 161% | 186% | 203% |
A Calculated based on average shares outstanding during the period.
B Amount represents less than $.005 per share.
C Total returns for periods of less than one year are not annualized.
D Total returns would have been lower if certain expenses had not been reduced during the applicable periods shown.
E Total returns do not include the effect of the contingent deferred sales charge.
F Fees and expenses of any underlying Fidelity Central Funds are not included in the Fund's expense ratio. The Fund indirectly bears its proportionate share of the expenses of any underlying Fidelity Central Funds.
G Expense ratios reflect operating expenses of the class. Expenses before reductions do not reflect amounts reimbursed by the investment adviser or reductions from brokerage service arrangements or reductions from other expense offset arrangements and do not represent the amount paid by the class during periods when reimbursements or reductions occur. Expenses net of fee waivers reflect expenses after reimbursement by the investment adviser but prior to reductions from brokerage service arrangements or other expense offset arrangements. Expenses net of all reductions represent the net expenses paid by the class.
H Annualized
I Amount does not include the portfolio activity of any underlying Fidelity Central Funds.
See accompanying notes which are an integral part of the financial statements.
Financial Highlights — Fidelity Worldwide Fund
| Six months ended (Unaudited) April 30, | Years ended October 31, | |||||
| 2016 | 2015 | 2014 | 2013 | 2012 | 2011 | |
| Selected Per–Share Data | ||||||
| Net asset value, beginning of period | $23.14 | $24.92 | $25.41 | $19.85 | $18.02 | $17.58 |
| Income from Investment Operations | ||||||
| Net investment income (loss)A | .10 | .13 | .11 | .10 | .16 | .11 |
| Net realized and unrealized gain (loss) | (.55) | .58 | 1.47 | 5.70 | 1.74 | .48 |
| Total from investment operations | (.45) | .71 | 1.58 | 5.80 | 1.90 | .59 |
| Distributions from net investment income | (.14) | (.08) | (.09) | (.16) | (.07) | (.10) |
| Distributions from net realized gain | (.75) | (2.41) | (1.98) | (.08) | – | (.05) |
| Total distributions | (.89) | (2.49) | (2.07) | (.24) | (.07) | (.15) |
| Redemption fees added to paid in capitalA,B | – | – | – | – | – | – |
| Net asset value, end of period | $21.80 | $23.14 | $24.92 | $25.41 | $19.85 | $18.02 |
| Total ReturnC,D | (2.08)% | 3.01% | 6.64% | 29.54% | 10.56% | 3.32% |
| Ratios to Average Net AssetsE,F | ||||||
| Expenses before reductions | .96%G | .96% | .98% | 1.11% | 1.11% | 1.08% |
| Expenses net of fee waivers, if any | .96%G | .96% | .97% | 1.11% | 1.11% | 1.08% |
| Expenses net of all reductions | .95%G | .95% | .97% | 1.08% | 1.09% | 1.05% |
| Net investment income (loss) | .91%G | .57% | .44% | .43% | .84% | .60% |
| Supplemental Data | ||||||
| Net assets, end of period (000 omitted) | $1,468,611 | $1,543,516 | $1,535,658 | $1,464,415 | $1,081,240 | $1,114,694 |
| Portfolio turnover rateH | 124%G | 151% | 163% | 161% | 186% | 203% |
A Calculated based on average shares outstanding during the period.
B Amount represents less than $.005 per share.
C Total returns for periods of less than one year are not annualized.
D Total returns would have been lower if certain expenses had not been reduced during the applicable periods shown.
E Fees and expenses of any underlying Fidelity Central Funds are not included in the Fund's expense ratio. The Fund indirectly bears its proportionate share of the expenses of any underlying Fidelity Central Funds.
F Expense ratios reflect operating expenses of the class. Expenses before reductions do not reflect amounts reimbursed by the investment adviser or reductions from brokerage service arrangements or reductions from other expense offset arrangements and do not represent the amount paid by the class during periods when reimbursements or reductions occur. Expenses net of fee waivers reflect expenses after reimbursement by the investment adviser but prior to reductions from brokerage service arrangements or other expense offset arrangements. Expenses net of all reductions represent the net expenses paid by the class.
G Annualized
H Amount does not include the portfolio activity of any underlying Fidelity Central Funds.
See accompanying notes which are an integral part of the financial statements.
Financial Highlights — Fidelity Worldwide Fund Class I
| Six months ended (Unaudited) April 30, | Years ended October 31, | |||||
| 2016 | 2015 | 2014 | 2013 | 2012 | 2011 | |
| Selected Per–Share Data | ||||||
| Net asset value, beginning of period | $23.03 | $24.81 | $25.31 | $19.78 | $17.98 | $17.57 |
| Income from Investment Operations | ||||||
| Net investment income (loss)A | .09 | .13 | .10 | .08 | .14 | .10 |
| Net realized and unrealized gain (loss) | (.56) | .58 | 1.47 | 5.68 | 1.74 | .47 |
| Total from investment operations | (.47) | .71 | 1.57 | 5.76 | 1.88 | .57 |
| Distributions from net investment income | (.11) | (.07) | (.09) | (.15) | (.08) | (.11) |
| Distributions from net realized gain | (.75) | (2.41) | (1.98) | (.08) | – | (.05) |
| Total distributions | (.86) | (2.49)B | (2.07) | (.23) | (.08) | (.16) |
| Redemption fees added to paid in capitalA,C | – | – | – | – | – | – |
| Net asset value, end of period | $21.70 | $23.03 | $24.81 | $25.31 | $19.78 | $17.98 |
| Total ReturnD,E | (2.17)% | 3.00% | 6.63% | 29.44% | 10.49% | 3.23% |
| Ratios to Average Net AssetsF,G | ||||||
| Expenses before reductions | 1.05%H | .98% | 1.01% | 1.17% | 1.18% | 1.13% |
| Expenses net of fee waivers, if any | 1.05%H | .98% | 1.01% | 1.17% | 1.18% | 1.13% |
| Expenses net of all reductions | 1.05%H | .97% | 1.00% | 1.14% | 1.16% | 1.10% |
| Net investment income (loss) | .82%H | .55% | .40% | .37% | .77% | .56% |
| Supplemental Data | ||||||
| Net assets, end of period (000 omitted) | $23,924 | $25,173 | $19,107 | $10,639 | $4,291 | $3,086 |
| Portfolio turnover rateI | 124%H | 151% | 163% | 161% | 186% | 203% |
A Calculated based on average shares outstanding during the period.
B Total distributions of $2.49 per share is comprised of distributions from net investment income of $.074 and distributions from net realized gain of $2.413 per share.
C Amount represents less than $.005 per share.
D Total returns for periods of less than one year are not annualized.
E Total returns would have been lower if certain expenses had not been reduced during the applicable periods shown.
F Fees and expenses of any underlying Fidelity Central Funds are not included in the Fund's expense ratio. The Fund indirectly bears its proportionate share of the expenses of any underlying Fidelity Central Funds.
G Expense ratios reflect operating expenses of the class. Expenses before reductions do not reflect amounts reimbursed by the investment adviser or reductions from brokerage service arrangements or reductions from other expense offset arrangements and do not represent the amount paid by the class during periods when reimbursements or reductions occur. Expenses net of fee waivers reflect expenses after reimbursement by the investment adviser but prior to reductions from brokerage service arrangements or other expense offset arrangements. Expenses net of all reductions represent the net expenses paid by the class.
H Annualized
I Amount does not include the portfolio activity of any underlying Fidelity Central Funds.
See accompanying notes which are an integral part of the financial statements.
Notes to Financial Statements (Unaudited)
For the period ended April 30, 2016
1. Organization.
Fidelity Worldwide Fund (the Fund) is a fund of Fidelity Investment Trust (the Trust) and is authorized to issue an unlimited number of shares. The Trust is registered under the Investment Company Act of 1940, as amended (the 1940 Act), as an open-end management investment company organized as a Massachusetts business trust. The Fund offers Class A, Class T, Class C, Worldwide and Class I shares, each of which, along with Class B shares, has equal rights as to assets and voting privileges. Class B shares are closed to new accounts and additional purchases, except for exchanges and reinvestments. Each class has exclusive voting rights with respect to matters that affect that class. Class B shares will automatically convert to Class A shares after a maximum holding period of seven years from the initial date of purchase.
During the period, the Board of Trustees approved the conversion of all existing Class B shares into Class A shares, effective on or about July 1, 2016, regardless of the length of times shares have been held.
2. Investments in Fidelity Central Funds.
The Fund invests in Fidelity Central Funds, which are open-end investment companies generally available only to other investment companies and accounts managed by the investment adviser and its affiliates. The Fund's Schedule of Investments lists each of the Fidelity Central Funds held as of period end, if any, as an investment of the Fund, but does not include the underlying holdings of each Fidelity Central Fund. As an Investing Fund, the Fund indirectly bears its proportionate share of the expenses of the underlying Fidelity Central Funds.
The Money Market Central Funds seek preservation of capital and current income and are managed by Fidelity Investments Money Management, Inc. (FIMM), an affiliate of the investment adviser. Annualized expenses of the Money Market Central Funds as of their most recent shareholder report date are less than .005%.
A complete unaudited list of holdings for each Fidelity Central Fund is available upon request or at the Securities and Exchange Commission (the SEC) website at www.sec.gov. In addition, the financial statements of the Fidelity Central Funds are available on the SEC website or upon request.
3. Significant Accounting Policies.
The financial statements have been prepared in conformity with accounting principles generally accepted in the United States of America (GAAP), which require management to make certain estimates and assumptions at the date of the financial statements. Actual results could differ from those estimates. Subsequent events, if any, through the date that the financial statements were issued have been evaluated in the preparation of the financial statements. The following summarizes the significant accounting policies of the Fund:
Investment Valuation. Investments are valued as of 4:00 p.m. Eastern time on the last calendar day of the period. The Board of Trustees (the Board) has delegated the day to day responsibility for the valuation of the Fund's investments to the Fidelity Management & Research Company (FMR) Fair Value Committee (the Committee). In accordance with valuation policies and procedures approved by the Board, the Fund attempts to obtain prices from one or more third party pricing vendors or brokers to value its investments. When current market prices, quotations or currency exchange rates are not readily available or reliable, investments will be fair valued in good faith by the Committee, in accordance with procedures adopted by the Board. Factors used in determining fair value vary by investment type and may include market or investment specific events. The frequency with which these procedures are used cannot be predicted and they may be utilized to a significant extent. The Committee oversees the Fund's valuation policies and procedures and reports to the Board on the Committee's activities and fair value determinations. The Board monitors the appropriateness of the procedures used in valuing the Fund's investments and ratifies the fair value determinations of the Committee.
The Fund categorizes the inputs to valuation techniques used to value its investments into a disclosure hierarchy consisting of three levels as shown below:
- Level 1 – quoted prices in active markets for identical investments
- Level 2 – other significant observable inputs (including quoted prices for similar investments, interest rates, prepayment speeds, etc.)
- Level 3 – unobservable inputs (including the Fund's own assumptions based on the best information available)
Valuation techniques used to value the Fund's investments by major category are as follows:
Equity securities, including restricted securities, for which market quotations are readily available, are valued at the last reported sale price or official closing price as reported by a third party pricing vendor on the primary market or exchange on which they are traded and are categorized as Level 1 in the hierarchy. In the event there were no sales during the day or closing prices are not available, securities are valued at the last quoted bid price or may be valued using the last available price and are generally categorized as Level 2 in the hierarchy. For foreign equity securities, when market or security specific events arise, comparisons to the valuation of American Depositary Receipts (ADRs), futures contracts, Exchange-Traded Funds (ETFs) and certain indexes as well as quoted prices for similar securities may be used and would be categorized as Level 2 in the hierarchy. Utilizing these techniques may result in transfers between Level 1 and Level 2. For equity securities, including restricted securities, where observable inputs are limited, assumptions about market activity and risk are used and these securities may be categorized as Level 3 in the hierarchy.
Investments in open-end mutual funds, including the Fidelity Central Funds, are valued at their closing net asset value (NAV) each business day and are categorized as Level 1 in the hierarchy.
Changes in valuation techniques may result in transfers in or out of an assigned level within the disclosure hierarchy. The aggregate value of investments by input level as of April 30, 2016, including information on transfers between Levels 1 and 2 is included at the end of the Fund's Schedule of Investments.
Foreign Currency. The Fund may use foreign currency contracts to facilitate transactions in foreign-denominated securities. Gains and losses from these transactions may arise from changes in the value of the foreign currency or if the counterparties do not perform under the contracts' terms.
Foreign-denominated assets, including investment securities, and liabilities are translated into U.S. dollars at the exchange rates at period end. Purchases and sales of investment securities, income and dividends received and expenses denominated in foreign currencies are translated into U.S. dollars at the exchange rate in effect on the transaction date.
The effects of exchange rate fluctuations on investments are included with the net realized and unrealized gain (loss) on investment securities. Other foreign currency transactions resulting in realized and unrealized gain (loss) are disclosed separately.
Investment Transactions and Income. For financial reporting purposes, the Fund's investment holdings and NAV include trades executed through the end of the last business day of the period. The NAV per share for processing shareholder transactions is calculated as of the close of business of the New York Stock Exchange (NYSE), normally 4:00 p.m. Eastern time and includes trades executed through the end of the prior business day. Gains and losses on securities sold are determined on the basis of identified cost and may include proceeds received from litigation. Dividend income is recorded on the ex-dividend date, except for certain dividends from foreign securities where the ex-dividend date may have passed, which are recorded as soon as the Fund is informed of the ex-dividend date. Non-cash dividends included in dividend income, if any, are recorded at the fair market value of the securities received. Income and capital gain distributions from Fidelity Central Funds, if any, are recorded on the ex-dividend date. Distributions received on securities that represent a return of capital or capital gain are recorded as a reduction of cost of investments and/or as a realized gain. Subsequent to ex-dividend date the Fund determines the components of these distributions, based upon receipt of tax filings or other correspondence relating to the underlying investment. Interest income is accrued as earned and includes coupon interest and amortization of premium and accretion of discount on debt securities as applicable. Investment income is recorded net of foreign taxes withheld where recovery of such taxes is uncertain.
Class Allocations and Expenses. Investment income, realized and unrealized capital gains and losses, common expenses of the Fund, and certain fund-level expense reductions, if any, are allocated daily on a pro-rata basis to each class based on the relative net assets of each class to the total net assets of the Fund. Each class differs with respect to transfer agent and distribution and service plan fees incurred. Certain expense reductions may also differ by class. For the reporting period, the allocated portion of income and expenses to each class as a percent of its average net assets may vary due to the timing of recording these transactions in relation to fluctuating net assets of the classes. Expenses directly attributable to a fund are charged to that fund. Expenses attributable to more than one fund are allocated among the respective funds on the basis of relative net assets or other appropriate methods. Expense estimates are accrued in the period to which they relate and adjustments are made when actual amounts are known.
Income Tax Information and Distributions to Shareholders. Each year, the Fund intends to qualify as a regulated investment company under Subchapter M of the Internal Revenue Code, including distributing substantially all of its taxable income and realized gains. As a result, no provision for U.S. Federal income taxes is required. The Fund files a U.S. federal tax return, in addition to state and local tax returns as required. The Fund's federal income tax returns are subject to examination by the Internal Revenue Service (IRS) for a period of three fiscal years after they are filed. State and local tax returns may be subject to examination for an additional fiscal year depending on the jurisdiction. Foreign taxes are provided for based on the Fund's understanding of the tax rules and rates that exist in the foreign markets in which it invests. The Fund is subject to a tax imposed on capital gains by certain countries in which it invests.
Distributions are declared and recorded on the ex-dividend date. Income dividends and capital gain distributions are declared separately for each class. Income and capital gain distributions are determined in accordance with income tax regulations, which may differ from GAAP.
Capital accounts within the financial statements are adjusted for permanent book-tax differences. These adjustments have no impact on net assets or the results of operations. Capital accounts are not adjusted for temporary book-tax differences which will reverse in a subsequent period.
Book-tax differences are primarily due to futures contracts, foreign currency transactions, certain foreign taxes, passive foreign investment companies (PFIC), partnerships, deferred trustees compensation and losses deferred due to wash sales.
The federal tax cost of investment securities and unrealized appreciation (depreciation) as of period end were as follows:
| Gross unrealized appreciation | $244,600,092 |
| Gross unrealized depreciation | (44,752,721) |
| Net unrealized appreciation (depreciation) on securities | $199,847,371 |
| Tax cost | $1,370,655,303 |
Short-Term Trading (Redemption) Fees. Shares held by investors in the Fund less than 30 days may have been subject to a redemption fee equal to 1.00% of the NAV of shares redeemed. All redemption fees, which reduce the proceeds of the shareholder redemption, are retained by the Fund and accounted for as an addition to paid in capital.
Delayed Delivery Transactions and When-Issued Securities. During the period, the Fund transacted in securities on a delayed delivery or when-issued basis. Payment and delivery may take place after the customary settlement period for that security. The price of the underlying securities and the date when the securities will be delivered and paid for are fixed at the time the transaction is negotiated. With respect to purchase commitments, the Fund identifies securities as segregated in its records with a value at least equal to the amount of the commitment. Losses may arise due to changes in the value of the underlying securities or if the counterparty does not perform under the contract's terms, or if the issuer does not issue the securities due to political, economic, or other factors.
Restricted Securities. The Fund may invest in securities that are subject to legal or contractual restrictions on resale. These securities generally may be resold in transactions exempt from registration or to the public if the securities are registered. Disposal of these securities may involve time-consuming negotiations and expense, and prompt sale at an acceptable price may be difficult. Information regarding restricted securities is included at the end of the Fund's Schedule of Investments.
4. Purchases and Sales of Investments.
Purchases and sales of securities, other than short-term securities, aggregated $959,804,322 and $977,150,164, respectively.
5. Fees and Other Transactions with Affiliates.
Management Fee. Fidelity Management & Research Company (the investment adviser) and its affiliates provide the Fund with investment management related services for which the Fund pays a monthly management fee. The management fee is the sum of an individual fund fee rate that is based on an annual rate of .424% of the Fund's average net assets and an annualized group fee rate that averaged .25% during the period. The group fee rate is based upon the average net assets of all the mutual funds advised by the investment adviser, including any mutual funds previously advised by the investment adviser that are currently advised by Fidelity SelectCo, LLC, an affiliate of the investment adviser. The group fee rate decreases as assets under management increase and increases as assets under management decrease. In addition, the management fee is subject to a performance adjustment (up to a maximum of +/- .20% of the Fund's average net assets over a 36 month performance period). The upward or downward adjustment to the management fee is based on the relative investment performance of Worldwide as compared to its benchmark index, the MSCI World Index, over the same 36 month performance period. For the reporting period, the total annualized management fee rate, including the performance adjustment, was .70% of the Fund's average net assets. The performance adjustment included in the management fee rate may be higher or lower than the maximum performance adjustment rate due to the difference between the average net assets for the reporting and performance periods.
Distribution and Service Plan Fees. In accordance with Rule 12b-1 of the 1940 Act, the Fund has adopted separate Distribution and Service Plans for each class of shares. Certain classes pay Fidelity Distributors Corporation (FDC), an affiliate of the investment adviser, separate Distribution and Service Fees, each of which is based on an annual percentage of each class' average net assets. In addition, FDC may pay financial intermediaries for selling shares of the Fund and providing shareholder support services. For the period, the Distribution and Service Fee rates, total fees and amounts retained by FDC were as follows:
| Distribution Fee | Service Fee | Total Fees | Retained by FDC | |
| Class A | -% | .25% | $38,402 | $948 |
| Class T | .25% | .25% | 31,350 | 111 |
| Class B | .75% | .25% | 1,507 | 1,130 |
| Class C | .75% | .25% | 55,483 | 14,385 |
| $126,742 | $16,574 |
Sales Load. FDC may receive a front-end sales charge of up to 5.75% for selling Class A shares and 3.50% for selling Class T shares, some of which is paid to financial intermediaries for selling shares of the Fund. Depending on the holding period, FDC may receive contingent deferred sales charges levied on Class A, Class T, Class B, and Class C redemptions. The deferred sales charges range from 5.00% to 1.00% for Class B shares, 1.00% for Class C shares, 1.00% for certain purchases of Class A shares and .25% for certain purchases of Class T shares.
For the period, sales charge amounts retained by FDC were as follows:
| Retained by FDC | |
| Class A | $9,190 |
| Class T | 2,320 |
| Class B(a) | 69 |
| Class C(a) | 1,068 |
| $12,647 |
(a) When Class B and Class C shares are initially sold, FDC pays commissions from its own resources to financial intermediaries through which the sales are made.
Transfer Agent Fees. Fidelity Investments Institutional Operations Company, Inc., (FIIOC), an affiliate of the investment adviser, is the transfer, dividend disbursing and shareholder servicing agent for each class of the Fund. FIIOC receives account fees and asset-based fees that vary according to the account size and type of account of the shareholders of the respective classes of the Fund. FIIOC pays for typesetting, printing and mailing of shareholder reports, except proxy statements.
For the period, transfer agent fees for each class were as follows:
| Amount | % of Class-Level Average Net Assets(a) | |
| Class A | $39,375 | .26 |
| Class T | 19,127 | .30 |
| Class B | 451 | .30 |
| Class C | 16,541 | .30 |
| Worldwide | 1,424,795 | .19 |
| Class I | 34,959 | .29 |
| $1,535,248 |
(a) Annualized
Accounting and Security Lending Fees. Fidelity Service Company, Inc. (FSC), an affiliate of the investment adviser, maintains the Fund's accounting records. The accounting fee is based on the level of average net assets for each month. Under a separate contract, FSC administers the security lending program. The security lending fee is based on the number and duration of lending transactions.
Brokerage Commissions. The Fund placed a portion of its portfolio transactions with brokerage firms which are affiliates of the investment adviser. Brokerage commissions are included in net realized gain (loss) and change in net unrealized appreciation (depreciation) in the Statement of Operations. The commissions paid to these affiliated firms were $9,611 for the period.
Interfund Trades. The Fund may purchase from or sell securities to other Fidelity Funds under procedures adopted by the Board. The procedures have been designed to ensure these interfund trades are executed in accordance with Rule 17a-7 of the 1940 Act. Interfund trades are included within the respective purchases and sales amounts shown in the Purchases and Sales of Investments note.
6. Committed Line of Credit.
The Fund participates with other funds managed by the investment adviser or an affiliate in a $4.25 billion credit facility (the "line of credit") to be utilized for temporary or emergency purposes to fund shareholder redemptions or for other short-term liquidity purposes. The Fund has agreed to pay commitment fees on its pro-rata portion of the line of credit, which amounted to $1,379 and is reflected in Miscellaneous expenses on the Statement of Operations. During the period, the Fund did not borrow on this line of credit.
7. Security Lending.
The Fund lends portfolio securities through a lending agent from time to time in order to earn additional income. For equity securities, a lending agent is used and may loan securities to certain qualified borrowers, including Fidelity Capital Markets (FCM), a broker-dealer affiliated with the Fund. On the settlement date of the loan, the Fund receives collateral (in the form of U.S. Treasury obligations, letters of credit and/or cash) against the loaned securities and maintains collateral in an amount not less than 100% of the market value of the loaned securities during the period of the loan. The market value of the loaned securities is determined at the close of business of the Fund and any additional required collateral is delivered to the Fund on the next business day. The Fund or borrower may terminate the loan at any time, and if the borrower defaults on its obligation to return the securities loaned because of insolvency or other reasons, the Fund may apply collateral received from the borrower against the obligation. The Fund may experience delays and costs in recovering the securities loaned. Any cash collateral received is invested in the Fidelity Securities Lending Cash Central Fund. The value of loaned securities and cash collateral at period end are disclosed on the Fund's Statement of Assets and Liabilities. Security lending income represents the income earned on investing cash collateral, less rebates paid to borrowers and any lending agent fees associated with the loan, plus any premium payments received for lending certain types of securities. Security lending income is presented in the Statement of Operations as a component of income from Fidelity Central Funds. Total security lending income during the period amounted to $115,427. During the period, there were no securities loaned to FCM.
8. Expense Reductions.
Commissions paid to certain brokers with whom the investment adviser, or its affiliates, places trades on behalf of the Fund include an amount in addition to trade execution, which may be rebated back to the Fund to offset certain expenses. This amount totaled $20,702 for the period. In addition, through arrangements with the Fund's custodian, credits realized as a result of certain uninvested cash balances were used to reduce the Fund's expenses. During the period, these credits reduced the Fund's custody expenses by $297.
In addition, during the period the investment adviser reimbursed and/or waived a portion of fund-level operating expenses in the amount of $5,778.
9. Distributions to Shareholders.
Distributions to shareholders of each class were as follows:
| Six months ended April 30, 2016 | Year ended October 31, 2015 | |
| From net investment income | ||
| Class A | $95,208 | $– |
| Class T | 2,313 | – |
| Worldwide | 9,064,407 | 4,895,242 |
| Class I | 116,983 | 47,084 |
| Total | $9,278,911 | $4,942,326 |
| From net realized gain | ||
| Class A | $1,050,091 | $3,318,115 |
| Class T | 433,754 | 1,143,314 |
| Class B | 11,494 | 47,493 |
| Class C | 384,211 | 790,219 |
| Worldwide | 49,987,535 | 147,652,391 |
| Class I | 804,930 | 1,535,304 |
| Total | $52,672,015 | $154,486,836 |
10. Share Transactions.
Share transactions for each class were as follows and may contain automatic conversions between classes or exchanges between affiliated funds:
| Shares | Shares | Dollars | Dollars | |
| Six months ended April 30, 2016 | Year ended October 31, 2015 | Six months ended April 30, 2016 | Year ended October 31, 2015 | |
| Class A | ||||
| Shares sold | 230,209 | 416,197 | $4,950,696 | $9,650,572 |
| Reinvestment of distributions | 49,536 | 143,319 | 1,105,146 | 3,239,009 |
| Shares redeemed | (185,147) | (573,622) | (3,904,065) | (12,962,950) |
| Net increase (decrease) | 94,598 | (14,106) | $2,151,777 | $(73,369) |
| Class T | ||||
| Shares sold | 57,758 | 129,216 | $1,237,003 | $2,974,281 |
| Reinvestment of distributions | 19,370 | 50,075 | 430,197 | 1,126,698 |
| Shares redeemed | (58,217) | (101,388) | (1,245,210) | (2,303,572) |
| Net increase (decrease) | 18,911 | 77,903 | $421,990 | $1,797,407 |
| Class B | ||||
| Shares sold | 457 | 3,860 | $8,675 | $90,877 |
| Reinvestment of distributions | 487 | 1,857 | 10,726 | 41,646 |
| Shares redeemed | (4,925) | (13,140) | (103,223) | (300,445) |
| Net increase (decrease) | (3,981) | (7,423) | $(83,822) | $(167,922) |
| Class C | ||||
| Shares sold | 71,518 | 216,209 | $1,499,591 | $4,944,508 |
| Reinvestment of distributions | 15,568 | 31,721 | 341,870 | 709,279 |
| Shares redeemed | (61,233) | (130,941) | (1,257,272) | (2,958,600) |
| Net increase (decrease) | 25,853 | 116,989 | $584,189 | $2,695,187 |
| Worldwide | ||||
| Shares sold | 4,864,505 | 10,346,856 | $104,200,239 | $242,784,559 |
| Reinvestment of distributions | 2,542,668 | 6,500,654 | 57,260,887 | 148,214,908 |
| Shares redeemed | (6,730,731) | (11,769,221) | (144,609,657) | (274,209,696) |
| Net increase (decrease) | 676,442 | 5,078,289 | $16,851,469 | $116,789,771 |
| Class I | ||||
| Shares sold | 286,917 | 842,969 | $6,199,126 | $19,464,651 |
| Reinvestment of distributions | 28,687 | 64,929 | 643,439 | 1,473,244 |
| Shares redeemed | (306,329) | (584,975) | (6,392,591) | (13,709,229) |
| Net increase (decrease) | 9,275 | 322,923 | $449,974 | $7,228,666 |
11. Other.
The Fund's organizational documents provide former and current trustees and officers with a limited indemnification against liabilities arising in connection with the performance of their duties to the Fund. In the normal course of business, the Fund may also enter into contracts that provide general indemnifications. The Fund's maximum exposure under these arrangements is unknown as this would be dependent on future claims that may be made against the Fund. The risk of material loss from such claims is considered remote.
Shareholder Expense Example
As a shareholder of the Fund, you incur two types of costs: (1) transaction costs, including sales charges (loads) on purchase payments or redemption proceeds, redemption fees and (2) ongoing costs, including management fees, distribution and/or service (12b-1) fees and other Fund expenses. This Example is intended to help you understand your ongoing costs (in dollars) of investing in the Fund and to compare these costs with the ongoing costs of investing in other mutual funds.
The Example is based on an investment of $1,000 invested at the beginning of the period and held for the entire period (November 1, 2015 to April 30, 2016).
Actual Expenses
The first line of the accompanying table for each class of the Fund provides information about actual account values and actual expenses. You may use the information in this line, together with the amount you invested, to estimate the expenses that you paid over the period. Simply divide your account value by $1,000.00 (for example, an $8,600 account value divided by $1,000.00 = 8.6), then multiply the result by the number in the first line for a class of the Fund under the heading entitled "Expenses Paid During Period" to estimate the expenses you paid on your account during this period. A small balance maintenance fee of $12.00 that is charged once a year may apply for certain accounts with a value of less than $2,000. This fee is not included in the table below. If it was, the estimate of expenses you paid during the period would be higher, and your ending account value lower, by this amount. In addition, the Fund, as a shareholder in the underlying Fidelity Central Funds, will indirectly bear its pro-rata share of the fees and expenses incurred by the underlying Fidelity Central Funds. These fees and expenses are not included in the Fund's annualized expense ratio used to calculate the expense estimate in the table below.
Hypothetical Example for Comparison Purposes
The second line of the accompanying table for each class of the Fund provides information about hypothetical account values and hypothetical expenses based on a Class' actual expense ratio and an assumed rate of return of 5% per year before expenses, which is not the Class' actual return. The hypothetical account values and expenses may not be used to estimate the actual ending account balance or expenses you paid for the period. You may use this information to compare the ongoing costs of investing in the Fund and other funds. To do so, compare this 5% hypothetical example with the 5% hypothetical examples that appear in the shareholder reports of the other funds. A small balance maintenance fee of $12.00 that is charged once a year may apply for certain accounts with a value of less than $2,000. This fee is not included in the table below. If it was, the estimate of expenses you paid during the period would be higher, and your ending account value lower, by this amount. In addition, the Fund, as a shareholder in the underlying Fidelity Central Funds, will indirectly bear its pro-rata share of the fees and expenses incurred by the underlying Fidelity Central Funds. These fees and expenses are not included in the Fund's annualized expense ratio used to calculate the expense estimate in the table below.
Please note that the expenses shown in the table are meant to highlight your ongoing costs only and do not reflect any transaction costs. Therefore, the second line of the table is useful in comparing ongoing costs only, and will not help you determine the relative total costs of owning different funds. In addition, if these transactional costs were included, your costs would have been higher.
| Annualized Expense Ratio-A | Beginning Account Value November 1, 2015 | Ending Account Value April 30, 2016 | Expenses Paid During Period-B November 1, 2015 to April 30, 2016 | |
| Class A | 1.27% | |||
| Actual | $1,000.00 | $977.30 | $6.24 | |
| Hypothetical-C | $1,000.00 | $1,018.55 | $6.37 | |
| Class T | 1.57% | |||
| Actual | $1,000.00 | $976.20 | $7.71 | |
| Hypothetical-C | $1,000.00 | $1,017.06 | $7.87 | |
| Class B | 2.06% | |||
| Actual | $1,000.00 | $973.50 | $10.11 | |
| Hypothetical-C | $1,000.00 | $1,014.62 | $10.32 | |
| Class C | 2.06% | |||
| Actual | $1,000.00 | $973.40 | $10.11 | |
| Hypothetical-C | $1,000.00 | $1,014.62 | $10.32 | |
| Worldwide | .96% | |||
| Actual | $1,000.00 | $979.20 | $4.72 | |
| Hypothetical-C | $1,000.00 | $1,020.09 | $4.82 | |
| Class I | 1.05% | |||
| Actual | $1,000.00 | $978.30 | $5.16 | |
| Hypothetical-C | $1,000.00 | $1,019.64 | $5.27 |
A Annualized expense ratio reflects expenses net of applicable fee waivers.
B Expenses are equal to each Class' annualized expense ratio, multiplied by the average account value over the period, multiplied by 182/366 (to reflect the one-half year period).
C 5% return per year before expenses
![]()
AWLD-SANN-0616
1.883450.107
Fidelity Advisor® Worldwide Fund - Semi-Annual Report April 30, 2016 Class I is a class of Fidelity® Worldwide Fund |
|
Contents
To view a fund's proxy voting guidelines and proxy voting record for the 12-month period ended June 30, visit http://www.fidelity.com/proxyvotingresults or visit the Securities and Exchange Commission's (SEC) web site at http://www.sec.gov.
You may also call 1-877-208-0098 to request a free copy of the proxy voting guidelines.
Standard & Poor's, S&P and S&P 500 are registered service marks of The McGraw-Hill Companies, Inc. and have been licensed for use by Fidelity Distributors Corporation.
Other third-party marks appearing herein are the property of their respective owners.
All other marks appearing herein are registered or unregistered trademarks or service marks of FMR LLC or an affiliated company. © 2016 FMR LLC. All rights reserved.
This report and the financial statements contained herein are submitted for the general information of the shareholders of the Fund. This report is not authorized for distribution to prospective investors in the Fund unless preceded or accompanied by an effective prospectus.
A fund files its complete schedule of portfolio holdings with the SEC for the first and third quarters of each fiscal year on Form N-Q. Forms N-Q are available on the SEC’s web site at http://www.sec.gov. A fund's Forms N-Q may be reviewed and copied at the SEC’s Public Reference Room in Washington, DC. Information regarding the operation of the SEC's Public Reference Room may be obtained by calling 1-800-SEC-0330.
For a complete list of a fund's portfolio holdings, view the most recent holdings listing, semiannual report, or annual report on Fidelity's web site at http://www.fidelity.com, http://www.advisor.fidelity.com, or http://www.401k.com, as applicable.
NOT FDIC INSURED •MAY LOSE VALUE •NO BANK GUARANTEE
Neither the Fund nor Fidelity Distributors Corporation is a bank.
Investment Summary (Unaudited)
Geographic Diversification (% of fund's net assets)
| As of April 30, 2016 | ||
| United States of America* | 54.9% | |
| Japan | 7.3% | |
| United Kingdom | 6.6% | |
| France | 3.9% | |
| Canada | 3.7% | |
| Germany | 3.7% | |
| Ireland | 2.2% | |
| Switzerland | 1.8% | |
| Sweden | 1.6% | |
| Other | 14.3% | |

* Includes Short-Term Investments and Net Other Assets (Liabilities).
Percentages are based on country or territory of incorporation and are adjusted for the effect of futures contracts, if applicable.
| As of October 31, 2015 | ||
| United States of America* | 51.9% | |
| United Kingdom | 8.9% | |
| Japan | 6.9% | |
| France | 5.5% | |
| Netherlands | 3.1% | |
| Switzerland | 2.6% | |
| Germany | 2.4% | |
| Ireland | 1.9% | |
| Canada | 1.6% | |
| Other | 15.2% | |

* Includes Short-Term Investments and Net Other Assets (Liabilities).
Percentages are based on country or territory of incorporation and are adjusted for the effect of futures contracts, if applicable.
Asset Allocation as of April 30, 2016
| % of fund's net assets | % of fund's net assets 6 months ago | |
| Stocks | 99.4 | 98.4 |
| Other Investments | 0.0 | 0.1 |
| Short-Term Investments and Net Other Assets (Liabilities) | 0.6 | 1.5 |
Top Ten Stocks as of April 30, 2016
| % of fund's net assets | % of fund's net assets 6 months ago | |
| Adobe Systems, Inc. (United States of America, Software) | 2.8 | 2.9 |
| Alphabet, Inc. Class A (United States of America, Internet Software & Services) | 2.8 | 3.0 |
| McGraw Hill Financial, Inc. (United States of America, Diversified Financial Services) | 1.9 | 0.8 |
| AutoZone, Inc. (United States of America, Specialty Retail) | 1.8 | 1.4 |
| PayPal Holdings, Inc. (United States of America, IT Services) | 1.8 | 1.2 |
| Kansas City Southern (United States of America, Road & Rail) | 1.8 | 0.0 |
| Bristol-Myers Squibb Co. (United States of America, Pharmaceuticals) | 1.8 | 0.7 |
| MSCI, Inc. Class A (United States of America, Diversified Financial Services) | 1.7 | 0.0 |
| Reynolds American, Inc. (United States of America, Tobacco) | 1.7 | 1.0 |
| Visa, Inc. Class A (United States of America, IT Services) | 1.7 | 1.7 |
| 19.8 |
Market Sectors as of April 30, 2016
| % of fund's net assets | % of fund's net assets 6 months ago | |
| Information Technology | 18.1 | 21.9 |
| Financials | 16.0 | 17.0 |
| Consumer Discretionary | 14.3 | 16.1 |
| Health Care | 13.5 | 12.9 |
| Consumer Staples | 12.9 | 10.5 |
| Industrials | 12.4 | 8.4 |
| Energy | 5.7 | 6.1 |
| Telecommunication Services | 3.5 | 2.7 |
| Materials | 2.7 | 2.3 |
| Utilities | 0.3 | 0.6 |
Percentages shown as 0.0% may reflect amounts less than 0.05%.
Investments April 30, 2016 (Unaudited)
Showing Percentage of Net Assets
| Common Stocks - 99.3% | |||
| Shares | Value | ||
| Australia - 1.1% | |||
| 1-Page Ltd. (a) | 188,555 | $138,350 | |
| Ansell Ltd. (a) | 120,679 | 1,828,742 | |
| Australia & New Zealand Banking Group Ltd. | 183,181 | 3,357,696 | |
| Burson Group Ltd. | 486,326 | 1,841,494 | |
| Magellan Financial Group Ltd. | 81,493 | 1,332,209 | |
| Mantra Group Ltd. | 551,523 | 1,551,597 | |
| Ramsay Health Care Ltd. | 76,655 | 3,785,587 | |
| Spark Infrastructure Group unit | 1,965,824 | 3,094,059 | |
| TOTAL AUSTRALIA | 16,929,734 | ||
| Austria - 0.2% | |||
| Andritz AG | 28,200 | 1,579,324 | |
| Erste Group Bank AG | 65,200 | 1,875,390 | |
| TOTAL AUSTRIA | 3,454,714 | ||
| Bailiwick of Jersey - 0.6% | |||
| Integrated Diagnostics Holdings PLC | 332,800 | 1,547,520 | |
| Randgold Resources Ltd. sponsored ADR | 16,310 | 1,639,155 | |
| Regus PLC | 695,121 | 2,969,837 | |
| Wizz Air Holdings PLC (a) | 34,000 | 933,967 | |
| Wolseley PLC | 34,027 | 1,905,923 | |
| TOTAL BAILIWICK OF JERSEY | 8,996,402 | ||
| Belgium - 0.7% | |||
| Anheuser-Busch InBev SA NV | 67,411 | 8,344,127 | |
| KBC Groep NV | 55,093 | 3,093,020 | |
| TOTAL BELGIUM | 11,437,147 | ||
| Bermuda - 0.1% | |||
| PAX Global Technology Ltd. | 1,889,000 | 1,626,846 | |
| Canada - 3.7% | |||
| Alimentation Couche-Tard, Inc. Class B (sub. vtg.) | 52,000 | 2,279,429 | |
| Cenovus Energy, Inc. | 916,300 | 14,525,550 | |
| Constellation Software, Inc. | 9,200 | 3,595,384 | |
| Franco-Nevada Corp. | 19,800 | 1,389,168 | |
| Keyera Corp. | 63,000 | 2,029,035 | |
| PrairieSky Royalty Ltd. (b) | 897,799 | 18,904,798 | |
| Suncor Energy, Inc. | 39,400 | 1,156,533 | |
| The Toronto-Dominion Bank | 308,000 | 13,709,891 | |
| TOTAL CANADA | 57,589,788 | ||
| Cayman Islands - 0.6% | |||
| Alibaba Group Holding Ltd. sponsored ADR (a) | 31,400 | 2,415,916 | |
| Ctrip.com International Ltd. ADR (a) | 19,200 | 837,312 | |
| Goodbaby International Holdings Ltd. (a) | 5,171,000 | 2,896,250 | |
| Lee's Pharmaceutical Holdings Ltd. | 433,629 | 350,867 | |
| New Oriental Education & Technology Group, Inc. sponsored ADR | 54,800 | 2,145,968 | |
| TOTAL CAYMAN ISLANDS | 8,646,313 | ||
| Chile - 0.2% | |||
| Vina San Pedro SA | 357,223,088 | 3,519,919 | |
| China - 0.2% | |||
| Jiangsu Hengrui Medicine Co. Ltd. | 264,160 | 1,904,679 | |
| Kweichow Moutai Co. Ltd. | 41,800 | 1,621,884 | |
| TOTAL CHINA | 3,526,563 | ||
| Cyprus - 0.0% | |||
| SPDI Secure Property Development & Investment PLC (a) | 31,822 | 7,963 | |
| Denmark - 0.7% | |||
| NNIT A/S | 115,550 | 3,146,661 | |
| Novo Nordisk A/S Series B | 126,380 | 7,056,351 | |
| TOTAL DENMARK | 10,203,012 | ||
| Finland - 0.3% | |||
| Sampo Oyj (A Shares) | 94,300 | 4,117,209 | |
| France - 3.9% | |||
| Accor SA (b) | 101,869 | 4,512,416 | |
| ALTEN | 40,600 | 2,510,408 | |
| Altran Technologies SA | 155,600 | 2,308,190 | |
| Amundi SA | 38,700 | 1,780,957 | |
| Atos Origin SA | 28,300 | 2,518,889 | |
| AXA SA | 261,900 | 6,612,869 | |
| Capgemini SA | 52,200 | 4,873,179 | |
| Cegedim SA (a) | 35,010 | 961,315 | |
| Havas SA | 308,841 | 2,584,389 | |
| Sanofi SA | 31,628 | 2,606,987 | |
| Sodexo SA | 25,800 | 2,605,335 | |
| SR Teleperformance SA | 18,900 | 1,696,689 | |
| Total SA | 262,323 | 13,258,010 | |
| Unibail-Rodamco | 9,400 | 2,518,652 | |
| VINCI SA | 119,900 | 8,956,897 | |
| TOTAL FRANCE | 60,305,182 | ||
| Germany - 3.7% | |||
| adidas AG | 39,000 | 5,028,373 | |
| Axel Springer Verlag AG | 43,237 | 2,414,036 | |
| Bayer AG | 23,400 | 2,699,513 | |
| Beiersdorf AG | 15,300 | 1,372,810 | |
| Continental AG | 18,000 | 3,953,171 | |
| Deutsche Boerse AG | 32,400 | 2,659,672 | |
| Deutsche Telekom AG | 197,700 | 3,470,312 | |
| Fresenius SE & Co. KGaA | 29,600 | 2,152,914 | |
| GEA Group AG | 48,856 | 2,265,114 | |
| KION Group AG | 90,889 | 4,951,767 | |
| LEG Immobilien AG | 27,743 | 2,567,101 | |
| Nexus AG | 47,000 | 823,405 | |
| ProSiebenSat.1 Media AG | 70,700 | 3,604,118 | |
| Rational AG | 6,700 | 3,401,308 | |
| SAP AG | 86,403 | 6,779,270 | |
| Siemens AG | 43,936 | 4,597,826 | |
| Symrise AG | 39,500 | 2,616,977 | |
| United Internet AG | 28,291 | 1,381,144 | |
| TOTAL GERMANY | 56,738,831 | ||
| Greece - 0.1% | |||
| Folli Follie SA | 59,300 | 1,221,215 | |
| Hong Kong - 1.2% | |||
| AIA Group Ltd. | 1,415,000 | 8,468,217 | |
| China Resources Beer Holdings Co. Ltd. | 1,100,000 | 2,417,152 | |
| Techtronic Industries Co. Ltd. | 2,162,500 | 8,106,499 | |
| TOTAL HONG KONG | 18,991,868 | ||
| India - 1.1% | |||
| Bharti Infratel Ltd. | 667,227 | 3,766,276 | |
| Dr Lal Pathlabs Ltd. | 46,973 | 696,617 | |
| HDFC Bank Ltd. (a) | 21,187 | 430,665 | |
| HDFC Bank Ltd. sponsored ADR | 89,493 | 5,626,425 | |
| Housing Development Finance Corp. Ltd. | 385,477 | 6,316,436 | |
| Lupin Ltd. | 1,335 | 32,302 | |
| TOTAL INDIA | 16,868,721 | ||
| Indonesia - 0.0% | |||
| PT Kino Indonesia Tbk | 234,500 | 86,773 | |
| Ireland - 2.2% | |||
| Alkermes PLC (a) | 159,495 | 6,339,926 | |
| Cairn Homes PLC (a) | 1,347,939 | 1,728,672 | |
| CRH PLC | 70,100 | 2,040,113 | |
| Dalata Hotel Group PLC (a) | 372,400 | 1,880,071 | |
| Green REIT PLC | 621,300 | 1,025,867 | |
| Greencore Group PLC | 1,373,041 | 7,238,438 | |
| Irish Continental Group PLC unit | 7,900 | 46,586 | |
| James Hardie Industries PLC CDI | 115,144 | 1,622,297 | |
| Kerry Group PLC Class A | 56,100 | 5,002,159 | |
| Medtronic PLC | 35,000 | 2,770,250 | |
| Ryanair Holdings PLC sponsored ADR | 53,600 | 4,338,920 | |
| TOTAL IRELAND | 34,033,299 | ||
| Isle of Man - 0.4% | |||
| Optimal Payments PLC (a) | 794,588 | 4,425,779 | |
| Playtech Ltd. | 94,225 | 1,107,610 | |
| TOTAL ISLE OF MAN | 5,533,389 | ||
| Israel - 1.2% | |||
| Bezeq The Israel Telecommunication Corp. Ltd. | 3,079,900 | 6,569,552 | |
| Frutarom Industries Ltd. | 66,100 | 3,387,748 | |
| Partner Communications Co. Ltd. (a) | 177,040 | 921,104 | |
| Teva Pharmaceutical Industries Ltd. sponsored ADR | 140,700 | 7,661,115 | |
| TOTAL ISRAEL | 18,539,519 | ||
| Italy - 0.6% | |||
| De Longhi SpA | 106,950 | 2,462,733 | |
| Intesa Sanpaolo SpA | 1,894,200 | 5,265,498 | |
| Mediaset SpA | 189,800 | 854,109 | |
| Telecom Italia SpA (a) | 1,187,300 | 1,159,367 | |
| TOTAL ITALY | 9,741,707 | ||
| Japan - 7.3% | |||
| A/S One Corp. | 67,300 | 2,426,706 | |
| ACOM Co. Ltd. (a)(b) | 186,100 | 970,816 | |
| Ain Holdings, Inc. | 37,900 | 1,841,106 | |
| Aozora Bank Ltd. | 577,000 | 2,047,205 | |
| Asahi Group Holdings | 68,700 | 2,180,335 | |
| Astellas Pharma, Inc. (c) | 412,200 | 5,557,525 | |
| Broadleaf Co. Ltd. | 104,700 | 1,034,652 | |
| Casio Computer Co. Ltd. | 134,100 | 2,551,511 | |
| Daiichikosho Co. Ltd. | 46,200 | 1,936,786 | |
| Daito Trust Construction Co. Ltd. | 14,200 | 2,008,338 | |
| Dentsu, Inc. (c) | 78,700 | 3,998,669 | |
| Don Quijote Holdings Co. Ltd. | 71,000 | 2,525,884 | |
| Hoya Corp. (c) | 98,300 | 3,764,327 | |
| Japan Exchange Group, Inc. | 115,400 | 1,718,680 | |
| Japan Tobacco, Inc. (c) | 119,400 | 4,878,438 | |
| KDDI Corp. (c) | 281,300 | 8,103,053 | |
| Keyence Corp. (c) | 4,060 | 2,433,536 | |
| Misumi Group, Inc. (c) | 191,700 | 2,647,334 | |
| Mitsubishi UFJ Financial Group, Inc. | 507,500 | 2,342,019 | |
| Monex Group, Inc. | 844,900 | 2,179,604 | |
| NEC Corp. | 458,000 | 1,114,669 | |
| Nidec Corp. | 19,300 | 1,414,189 | |
| Nintendo Co. Ltd. | 18,300 | 2,477,839 | |
| Nippon Kanzai Co. Ltd. | 107,000 | 1,637,128 | |
| Nippon Telegraph & Telephone Corp. | 60,300 | 2,698,445 | |
| Olympus Corp. (c) | 195,400 | 7,612,124 | |
| ORIX Corp. (c) | 495,400 | 7,007,401 | |
| Seven & i Holdings Co. Ltd. (c) | 64,400 | 2,627,677 | |
| Seven Bank Ltd. (c) | 666,300 | 2,831,247 | |
| Shinsei Bank Ltd. | 919,000 | 1,288,049 | |
| Shionogi & Co. Ltd. | 57,900 | 2,955,341 | |
| Sony Corp. | 231,600 | 5,609,728 | |
| Sundrug Co. Ltd. (c) | 39,300 | 2,792,493 | |
| Tsuruha Holdings, Inc. (c) | 58,000 | 5,563,107 | |
| United Arrows Ltd. | 63,100 | 2,535,495 | |
| VT Holdings Co. Ltd. | 280,200 | 1,415,759 | |
| Welcia Holdings Co. Ltd. | 76,800 | 4,056,766 | |
| TOTAL JAPAN | 112,783,981 | ||
| Kenya - 0.1% | |||
| Safaricom Ltd. | 6,251,600 | 1,058,439 | |
| Luxembourg - 0.4% | |||
| Eurofins Scientific SA | 7,900 | 2,931,322 | |
| Grand City Properties SA | 100,234 | 2,213,970 | |
| Senvion SA | 54,800 | 963,193 | |
| TOTAL LUXEMBOURG | 6,108,485 | ||
| Marshall Islands - 0.1% | |||
| Hoegh LNG Partners LP | 49,800 | 897,396 | |
| Netherlands - 1.3% | |||
| AerCap Holdings NV (a) | 31,800 | 1,272,318 | |
| IMCD Group BV | 127,200 | 5,135,632 | |
| ING Groep NV (Certificaten Van Aandelen) | 314,600 | 3,852,689 | |
| Unilever NV (Certificaten Van Aandelen) (Bearer) | 233,500 | 10,257,618 | |
| TOTAL NETHERLANDS | 20,518,257 | ||
| New Zealand - 0.3% | |||
| EBOS Group Ltd. | 210,137 | 2,341,781 | |
| Ryman Healthcare Group Ltd. | 436,814 | 2,723,698 | |
| TOTAL NEW ZEALAND | 5,065,479 | ||
| Norway - 0.7% | |||
| Statoil ASA | 602,500 | 10,604,780 | |
| Philippines - 0.2% | |||
| D&L Industries, Inc. | 8,349,900 | 1,597,727 | |
| SM Investments Corp. | 106,630 | 2,140,081 | |
| TOTAL PHILIPPINES | 3,737,808 | ||
| South Africa - 0.7% | |||
| Distell Group Ltd. | 126,410 | 1,411,931 | |
| EOH Holdings Ltd. | 184,122 | 1,792,038 | |
| Naspers Ltd. Class N | 54,500 | 7,477,950 | |
| TOTAL SOUTH AFRICA | 10,681,919 | ||
| Spain - 1.0% | |||
| Amadeus IT Holding SA Class A | 103,000 | 4,686,942 | |
| Atresmedia Corporacion de Medios de Comunicacion SA | 108,300 | 1,409,981 | |
| Hispania Activos Inmobiliarios SA (a) | 76,100 | 1,115,370 | |
| Inditex SA | 126,730 | 4,068,220 | |
| Mediaset Espana Comunicacion SA | 183,300 | 2,380,126 | |
| Merlin Properties Socimi SA | 162,800 | 1,892,104 | |
| TOTAL SPAIN | 15,552,743 | ||
| Sweden - 1.6% | |||
| ASSA ABLOY AB (B Shares) | 214,400 | 4,496,007 | |
| Getinge AB (B Shares) | 152,600 | 3,226,654 | |
| HEXPOL AB (B Shares) (b) | 189,000 | 1,953,440 | |
| Indutrade AB | 13,200 | 740,178 | |
| Nordea Bank AB | 314,800 | 3,055,702 | |
| Saab AB (B Shares) | 65,000 | 2,223,474 | |
| Sandvik AB (b) | 142,700 | 1,464,237 | |
| Svenska Cellulosa AB (SCA) (B Shares) | 189,000 | 5,952,107 | |
| Svenska Handelsbanken AB (A Shares) | 154,000 | 2,054,384 | |
| TOTAL SWEDEN | 25,166,183 | ||
| Switzerland - 1.8% | |||
| Chubb Ltd. | 14,000 | 1,650,040 | |
| GAM Holding Ltd. | 88,177 | 1,148,976 | |
| Julius Baer Group Ltd. | 59,790 | 2,562,347 | |
| Novartis AG | 83,226 | 6,333,687 | |
| Partners Group Holding AG | 15,318 | 6,307,318 | |
| Schindler Holding AG (participation certificate) | 10,829 | 1,972,090 | |
| Syngenta AG (Switzerland) | 10,848 | 4,342,366 | |
| UBS Group AG | 246,320 | 4,262,391 | |
| TOTAL SWITZERLAND | 28,579,215 | ||
| Taiwan - 0.1% | |||
| JHL Biotech, Inc. (a) | 295,104 | 797,986 | |
| United Kingdom - 6.6% | |||
| AA PLC | 246,910 | 1,005,112 | |
| Associated British Foods PLC | 48,600 | 2,175,804 | |
| B&M European Value Retail S.A. | 583,765 | 2,366,134 | |
| BAE Systems PLC | 275,100 | 1,919,279 | |
| BCA Marketplace PLC | 511,600 | 1,246,497 | |
| BHP Billiton PLC | 192,312 | 2,627,846 | |
| BT Group PLC | 385,900 | 2,501,431 | |
| Bunzl PLC | 127,500 | 3,798,588 | |
| Cineworld Group PLC | 138,500 | 1,048,273 | |
| CMC Markets PLC | 654,000 | 2,388,980 | |
| Compass Group PLC | 131,200 | 2,336,461 | |
| Countryside Properties PLC (a) | 263,300 | 894,476 | |
| Diploma PLC | 147,500 | 1,576,526 | |
| GlaxoSmithKline PLC | 259,900 | 5,554,702 | |
| Hilton Food Group PLC | 350,100 | 2,880,019 | |
| Howden Joinery Group PLC | 675,800 | 4,877,979 | |
| Imperial Tobacco Group PLC | 222,944 | 12,113,186 | |
| ITV PLC | 586,400 | 1,929,555 | |
| Lloyds Banking Group PLC | 4,388,300 | 4,307,165 | |
| London Stock Exchange Group PLC | 10,881 | 431,334 | |
| McCarthy & Stone PLC | 298,600 | 1,012,215 | |
| Melrose Industries PLC | 98,908 | 539,491 | |
| Micro Focus International PLC | 239,300 | 5,346,197 | |
| Moneysupermarket.com Group PLC | 393,500 | 1,804,807 | |
| Persimmon PLC | 92,000 | 2,671,041 | |
| Reckitt Benckiser Group PLC | 54,500 | 5,309,330 | |
| Rex Bionics PLC (a) | 100,000 | 53,332 | |
| Rio Tinto PLC | 79,100 | 2,653,512 | |
| SABMiller PLC | 44,000 | 2,690,562 | |
| Shawbrook Group PLC | 574,700 | 2,406,646 | |
| Softcat PLC | 114,400 | 533,226 | |
| Spirax-Sarco Engineering PLC | 33,846 | 1,688,857 | |
| St. James's Place Capital PLC | 318,800 | 4,038,613 | |
| Standard Chartered PLC (United Kingdom) | 353,550 | 2,852,091 | |
| Taylor Wimpey PLC | 761,900 | 2,051,720 | |
| Virgin Money Holdings Uk PLC | 423,100 | 2,257,094 | |
| Vodafone Group PLC | 1,878,909 | 6,053,540 | |
| Workspace Group PLC | 48,900 | 596,609 | |
| TOTAL UNITED KINGDOM | 102,538,230 | ||
| United States of America - 54.3% | |||
| AAON, Inc. | 53,000 | 1,405,560 | |
| Activision Blizzard, Inc. | 66,000 | 2,275,020 | |
| Acuity Brands, Inc. | 22,000 | 5,365,580 | |
| Adobe Systems, Inc. (a) | 466,224 | 43,927,622 | |
| Air Products & Chemicals, Inc. | 7,000 | 1,021,230 | |
| Alaska Air Group, Inc. | 255,400 | 17,987,822 | |
| Albemarle Corp. U.S. | 110,000 | 7,277,600 | |
| Alphabet, Inc. Class A | 62,000 | 43,888,560 | |
| Amazon.com, Inc. (a) | 30,000 | 19,787,700 | |
| American Tower Corp. | 237,000 | 24,856,560 | |
| ANSYS, Inc. (a) | 91,000 | 8,260,070 | |
| Applied Materials, Inc. | 129,000 | 2,640,630 | |
| AT&T, Inc. | 335,000 | 13,004,700 | |
| AutoZone, Inc. (a) | 37,100 | 28,390,033 | |
| Bats Global Markets, Inc. | 39,300 | 931,803 | |
| BlackRock, Inc. Class A | 5,000 | 1,781,650 | |
| bluebird bio, Inc. (a) | 33,000 | 1,463,550 | |
| Boston Scientific Corp.(a) | 225,000 | 4,932,000 | |
| Bristol-Myers Squibb Co. | 374,900 | 27,060,282 | |
| Cigna Corp. | 17,000 | 2,355,180 | |
| CME Group, Inc. | 98,000 | 9,007,180 | |
| Cognizant Technology Solutions Corp. Class A (a) | 266,000 | 15,526,420 | |
| ConocoPhillips Co. | 361,000 | 17,252,190 | |
| Constellation Brands, Inc. Class A (sub. vtg.) | 110,600 | 17,260,236 | |
| Cummins, Inc. | 3,000 | 351,090 | |
| CVS Health Corp. | 61,000 | 6,130,500 | |
| D.R. Horton, Inc. | 118,000 | 3,547,080 | |
| Danaher Corp. | 28,300 | 2,738,025 | |
| E*TRADE Financial Corp. (a) | 127,000 | 3,197,860 | |
| Edwards Lifesciences Corp. (a) | 29,000 | 3,080,090 | |
| Electronic Arts, Inc. (a) | 108,000 | 6,679,800 | |
| Equifax, Inc. | 17,000 | 2,044,250 | |
| Estee Lauder Companies, Inc. Class A | 225,000 | 21,570,750 | |
| Extra Space Storage, Inc. | 83,000 | 7,050,850 | |
| Facebook, Inc. Class A (a) | 155,500 | 18,283,690 | |
| Gilead Sciences, Inc. | 66,000 | 5,821,860 | |
| Global Payments, Inc. | 31,400 | 2,266,452 | |
| HealthSouth Corp. warrants 1/17/17 (a) | 341 | 1,231 | |
| Hess Corp. | 155,000 | 9,241,100 | |
| Home Depot, Inc. | 92,000 | 12,317,880 | |
| Intercept Pharmaceuticals, Inc. (a) | 44,500 | 6,707,930 | |
| Interpublic Group of Companies, Inc. | 191,000 | 4,381,540 | |
| Ionis Pharmaceuticals, Inc. (a) | 37,000 | 1,515,890 | |
| J.B. Hunt Transport Services, Inc. | 15,000 | 1,243,200 | |
| Kansas City Southern | 294,000 | 27,856,500 | |
| Level 3 Communications, Inc. (a) | 83,000 | 4,337,580 | |
| Lockheed Martin Corp. | 38,000 | 8,830,440 | |
| lululemon athletica, Inc. (a) | 48,000 | 3,146,400 | |
| MasterCard, Inc. Class A | 225,000 | 21,822,750 | |
| McGraw Hill Financial, Inc. | 276,549 | 29,549,261 | |
| Medivation, Inc. (a) | 345,082 | 19,945,740 | |
| Molson Coors Brewing Co. Class B | 133,400 | 12,757,042 | |
| Monster Beverage Corp. | 10,000 | 1,442,200 | |
| MSCI, Inc. Class A | 339,300 | 25,766,442 | |
| Newell Brands, Inc. | 196,000 | 8,925,840 | |
| NewMarket Corp. | 9,140 | 3,711,388 | |
| NIKE, Inc. Class B | 214,000 | 12,613,160 | |
| Norfolk Southern Corp. | 189,000 | 17,030,790 | |
| Northrop Grumman Corp. | 44,000 | 9,075,440 | |
| NVIDIA Corp. | 11,900 | 422,807 | |
| O'Reilly Automotive, Inc. (a) | 24,000 | 6,304,320 | |
| PACCAR, Inc. | 69,000 | 4,064,790 | |
| PayPal Holdings, Inc. (a) | 716,000 | 28,052,880 | |
| Phillips 66 Co. | 14,000 | 1,149,540 | |
| Post Holdings, Inc. (a) | 127,800 | 9,181,152 | |
| Prestige Brands Holdings, Inc. (a) | 332,000 | 18,850,960 | |
| Priceline Group, Inc. (a) | 5,000 | 6,718,300 | |
| Public Storage | 9,000 | 2,203,290 | |
| PVH Corp. | 25,000 | 2,390,000 | |
| Raytheon Co. | 21,000 | 2,653,350 | |
| Regal Beloit Corp. | 30,000 | 1,932,600 | |
| Reynolds American, Inc. | 517,000 | 25,643,200 | |
| Salesforce.com, Inc. (a) | 125,300 | 9,497,740 | |
| ServiceMaster Global Holdings, Inc. (a) | 32,500 | 1,245,400 | |
| Sherwin-Williams Co. | 13,000 | 3,735,030 | |
| Skechers U.S.A., Inc. Class A (sub. vtg.) (a) | 23,200 | 766,760 | |
| SLM Corp. (a) | 72,443 | 490,439 | |
| Southwest Airlines Co. | 18,000 | 802,980 | |
| Spectrum Brands Holdings, Inc. | 43,000 | 4,884,800 | |
| Spirit Airlines, Inc. (a) | 223,900 | 9,835,927 | |
| The NASDAQ OMX Group, Inc. | 45,000 | 2,776,950 | |
| Ultragenyx Pharmaceutical, Inc. (a) | 21,700 | 1,467,354 | |
| Under Armour, Inc. Class A (sub. vtg.) (a) | 10,000 | 439,400 | |
| Union Pacific Corp. | 50,000 | 4,361,500 | |
| UnitedHealth Group, Inc. | 146,000 | 19,225,280 | |
| Visa, Inc. Class A | 330,500 | 25,527,820 | |
| Xylem, Inc. | 69,000 | 2,882,820 | |
| TOTAL UNITED STATES OF AMERICA | 840,148,608 | ||
| TOTAL COMMON STOCKS | |||
| (Cost $1,334,730,075) | 1,536,355,623 | ||
| Nonconvertible Preferred Stocks - 0.1% | |||
| Cayman Islands - 0.1% | |||
| China Internet Plus Holdings Ltd. Series A-11 (d) | |||
| (Cost $1,166,878) | 369,166 | 1,425,239 | |
| Money Market Funds - 2.1% | |||
| Fidelity Cash Central Fund, 0.38% (e) | 25,131,066 | 25,131,066 | |
| Fidelity Securities Lending Cash Central Fund, 0.42% (e)(f) | 7,590,746 | 7,590,746 | |
| TOTAL MONEY MARKET FUNDS | |||
| (Cost $32,721,812) | 32,721,812 | ||
| TOTAL INVESTMENT PORTFOLIO - 101.5% | |||
| (Cost $1,368,618,765) | 1,570,502,674 | ||
| NET OTHER ASSETS (LIABILITIES) - (1.5)% | (22,547,155) | ||
| NET ASSETS - 100% | $1,547,955,519 |
Categorizations in the Schedule of Investments are based on country or territory of incorporation.
Legend
(a) Non-income producing
(b) Security or a portion of the security is on loan at period end.
(c) A portion of the security sold on a delayed delivery basis.
(d) Restricted securities - Investment in securities not registered under the Securities Act of 1933 (excluding 144A issues). At the end of the period, the value of restricted securities (excluding 144A issues) amounted to $1,425,239 or 0.1% of net assets.
(e) Affiliated fund that is generally available only to investment companies and other accounts managed by Fidelity Investments. The rate quoted is the annualized seven-day yield of the fund at period end. A complete unaudited listing of the fund's holdings as of its most recent quarter end is available upon request. In addition, each Fidelity Central Fund's financial statements are available on the SEC's website or upon request.
(f) Investment made with cash collateral received from securities on loan.
Additional information on each restricted holding is as follows:
| Security | Acquisition Date | Acquisition Cost |
| China Internet Plus Holdings Ltd. Series A-11 | 1/26/15 | $1,166,878 |
Affiliated Central Funds
Information regarding fiscal year to date income earned by the Fund from investments in Fidelity Central Funds is as follows:
| Fund | Income earned |
| Fidelity Cash Central Fund | $52,860 |
| Fidelity Securities Lending Cash Central Fund | 115,427 |
| Total | $168,287 |
Investment Valuation
The following is a summary of the inputs used, as of April 30, 2016, involving the Fund's assets and liabilities carried at fair value. The inputs or methodology used for valuing securities may not be an indication of the risk associated with investing in those securities. For more information on valuation inputs, and their aggregation into the levels used below, please refer to the Investment Valuation section in the accompanying Notes to Financial Statements.
| Valuation Inputs at Reporting Date: | ||||
| Description | Total | Level 1 | Level 2 | Level 3 |
| Investments in Securities: | ||||
| Equities: | ||||
| Consumer Discretionary | $218,964,167 | $182,404,671 | $35,134,257 | $1,425,239 |
| Consumer Staples | 197,483,050 | 165,816,646 | 31,666,404 | -- |
| Energy | 89,018,932 | 65,156,142 | 23,862,790 | -- |
| Financials | 250,165,204 | 194,713,004 | 55,452,200 | -- |
| Health Care | 206,083,498 | 161,864,881 | 44,218,617 | -- |
| Industrials | 192,772,231 | 178,650,552 | 14,121,679 | -- |
| Information Technology | 283,977,132 | 265,991,431 | 17,985,701 | -- |
| Materials | 41,615,597 | 34,294,126 | 7,321,471 | -- |
| Telecommunication Services | 53,643,799 | 29,657,651 | 23,986,148 | -- |
| Utilities | 4,057,252 | 4,057,252 | -- | -- |
| Money Market Funds | 32,721,812 | 32,721,812 | -- | -- |
| Total Investments in Securities: | $1,570,502,674 | $1,315,328,168 | $253,749,267 | $1,425,239 |
The following is a summary of transfers between Level 1 and Level 2 for the period ended April 30, 2016. Transfers are assumed to have occurred at the beginning of the period, and are primarily attributable to the valuation techniques used for foreign equity securities, as discussed in the accompanying Notes to Financial Statements:
| Transfers | Total |
| Level 1 to Level 2 | $9,091,486 |
| Level 2 to Level 1 | $46,637,934 |
See accompanying notes which are an integral part of the financial statements.
Financial Statements
Statement of Assets and Liabilities
| April 30, 2016 (Unaudited) | ||
| Assets | ||
| Investment in securities, at value (including securities loaned of $7,029,594) — See accompanying schedule: Unaffiliated issuers (cost $1,335,896,953) | $1,537,780,862 | |
| Fidelity Central Funds (cost $32,721,812) | 32,721,812 | |
| Total Investments (cost $1,368,618,765) | $1,570,502,674 | |
| Foreign currency held at value (cost $56,309) | 55,661 | |
| Receivable for investments sold | ||
| Regular delivery | 56,537,304 | |
| Delayed delivery | 3,448,730 | |
| Receivable for fund shares sold | 748,207 | |
| Dividends receivable | 3,847,525 | |
| Distributions receivable from Fidelity Central Funds | 50,420 | |
| Prepaid expenses | 1,213 | |
| Other receivables | 57,052 | |
| Total assets | 1,635,248,786 | |
| Liabilities | ||
| Payable to custodian bank | $2,570,144 | |
| Payable for investments purchased | 51,436,354 | |
| Payable for fund shares redeemed | 24,394,053 | |
| Accrued management fee | 869,060 | |
| Distribution and service plan fees payable | 21,526 | |
| Other affiliated payables | 296,749 | |
| Other payables and accrued expenses | 114,635 | |
| Collateral on securities loaned, at value | 7,590,746 | |
| Total liabilities | 87,293,267 | |
| Net Assets | $1,547,955,519 | |
| Net Assets consist of: | ||
| Paid in capital | $1,389,384,590 | |
| Undistributed net investment income | 5,568,061 | |
| Accumulated undistributed net realized gain (loss) on investments and foreign currency transactions | (48,853,510) | |
| Net unrealized appreciation (depreciation) on investments and assets and liabilities in foreign currencies | 201,856,378 | |
| Net Assets | $1,547,955,519 | |
| Calculation of Maximum Offering Price | ||
| Class A: | ||
| Net Asset Value and redemption price per share ($31,310,008 ÷ 1,451,507 shares) | $21.57 | |
| Maximum offering price per share (100/94.25 of $21.57) | $22.89 | |
| Class T: | ||
| Net Asset Value and redemption price per share ($12,729,077 ÷ 593,461 shares) | $21.45 | |
| Maximum offering price per share (100/96.50 of $21.45) | $22.23 | |
| Class B: | ||
| Net Asset Value and offering price per share ($260,690 ÷ 12,281 shares)(a) | $21.23 | |
| Class C: | ||
| Net Asset Value and offering price per share ($11,119,959 ÷ 525,510 shares)(a) | $21.16 | |
| Worldwide: | ||
| Net Asset Value, offering price and redemption price per share ($1,468,611,488 ÷ 67,368,997 shares) | $21.80 | |
| Class I: | ||
| Net Asset Value, offering price and redemption price per share ($23,924,297 ÷ 1,102,338 shares) | $21.70 |
(a) Redemption price per share is equal to net asset value less any applicable contingent deferred sales charge.
See accompanying notes which are an integral part of the financial statements.
Statement of Operations
| Six months ended April 30, 2016 (Unaudited) | ||
| Investment Income | ||
| Dividends | $15,209,013 | |
| Interest | 2,357 | |
| Income from Fidelity Central Funds | 168,287 | |
| Income before foreign taxes withheld | 15,379,657 | |
| Less foreign taxes withheld | (836,245) | |
| Total income | 14,543,412 | |
| Expenses | ||
| Management fee | ||
| Basic fee | $5,237,370 | |
| Performance adjustment | 226,333 | |
| Transfer agent fees | 1,535,248 | |
| Distribution and service plan fees | 126,742 | |
| Accounting and security lending fees | 243,129 | |
| Custodian fees and expenses | 82,458 | |
| Independent trustees' compensation | 3,434 | |
| Registration fees | 83,611 | |
| Audit | 68,029 | |
| Legal | 3,483 | |
| Miscellaneous | 5,229 | |
| Total expenses before reductions | 7,615,066 | |
| Expense reductions | (26,777) | 7,588,289 |
| Net investment income (loss) | 6,955,123 | |
| Realized and Unrealized Gain (Loss) | ||
| Net realized gain (loss) on: | ||
| Investment securities: | ||
| Unaffiliated issuers (net of foreign taxes of $2,129) | (43,599,935) | |
| Foreign currency transactions | 348,368 | |
| Total net realized gain (loss) | (43,251,567) | |
| Change in net unrealized appreciation (depreciation) on: Investment securities (net of decrease in deferred foreign taxes of $31,438) | 1,538,838 | |
| Assets and liabilities in foreign currencies | (102,488) | |
| Total change in net unrealized appreciation (depreciation) | 1,436,350 | |
| Net gain (loss) | (41,815,217) | |
| Net increase (decrease) in net assets resulting from operations | $(34,860,094) |
See accompanying notes which are an integral part of the financial statements.
Statement of Changes in Net Assets
| Six months ended April 30, 2016 (Unaudited) | Year ended October 31, 2015 | |
| Increase (Decrease) in Net Assets | ||
| Operations | ||
| Net investment income (loss) | $6,955,123 | $8,944,137 |
| Net realized gain (loss) | (43,251,567) | 60,531,683 |
| Change in net unrealized appreciation (depreciation) | 1,436,350 | (24,468,691) |
| Net increase (decrease) in net assets resulting from operations | (34,860,094) | 45,007,129 |
| Distributions to shareholders from net investment income | (9,278,911) | (4,942,326) |
| Distributions to shareholders from net realized gain | (52,672,015) | (154,486,836) |
| Total distributions | (61,950,926) | (159,429,162) |
| Share transactions - net increase (decrease) | 20,375,577 | 128,269,740 |
| Redemption fees | 6,138 | 21,658 |
| Total increase (decrease) in net assets | (76,429,305) | 13,869,365 |
| Net Assets | ||
| Beginning of period | 1,624,384,824 | 1,610,515,459 |
| End of period (including undistributed net investment income of $5,568,061 and undistributed net investment income of $7,891,849, respectively) | $1,547,955,519 | $1,624,384,824 |
See accompanying notes which are an integral part of the financial statements.
Financial Highlights — Fidelity Worldwide Fund Class A
| Six months ended (Unaudited) April 30, | Years ended October 31, | |||||
| 2016 | 2015 | 2014 | 2013 | 2012 | 2011 | |
| Selected Per–Share Data | ||||||
| Net asset value, beginning of period | $22.88 | $24.64 | $25.18 | $19.69 | $17.89 | $17.50 |
| Income from Investment Operations | ||||||
| Net investment income (loss)A | .06 | .06 | .02 | .02 | .10 | .05 |
| Net realized and unrealized gain (loss) | (.55) | .58 | 1.46 | 5.66 | 1.72 | .47 |
| Total from investment operations | (.49) | .64 | 1.48 | 5.68 | 1.82 | .52 |
| Distributions from net investment income | (.07) | – | (.04) | (.11) | (.02) | (.08) |
| Distributions from net realized gain | (.75) | (2.40) | (1.98) | (.08) | – | (.05) |
| Total distributions | (.82) | (2.40) | (2.02) | (.19) | (.02) | (.13) |
| Redemption fees added to paid in capitalA,B | – | – | – | – | – | – |
| Net asset value, end of period | $21.57 | $22.88 | $24.64 | $25.18 | $19.69 | $17.89 |
| Total ReturnC,D,E | (2.27)% | 2.73% | 6.29% | 29.10% | 10.20% | 2.94% |
| Ratios to Average Net AssetsF,G | ||||||
| Expenses before reductions | 1.27%H | 1.27% | 1.31% | 1.45% | 1.43% | 1.41% |
| Expenses net of fee waivers, if any | 1.27%H | 1.26% | 1.31% | 1.45% | 1.43% | 1.40% |
| Expenses net of all reductions | 1.27%H | 1.26% | 1.31% | 1.42% | 1.41% | 1.38% |
| Net investment income (loss) | .60%H | .27% | .10% | .09% | .52% | .28% |
| Supplemental Data | ||||||
| Net assets, end of period (000 omitted) | $31,310 | $31,043 | $33,788 | $28,661 | $18,723 | $13,153 |
| Portfolio turnover rateI | 124%H | 151% | 163% | 161% | 186% | 203% |
A Calculated based on average shares outstanding during the period.
B Amount represents less than $.005 per share.
C Total returns for periods of less than one year are not annualized.
D Total returns would have been lower if certain expenses had not been reduced during the applicable periods shown.
E Total returns do not include the effect of the sales charges.
F Fees and expenses of any underlying Fidelity Central Funds are not included in the Fund's expense ratio. The Fund indirectly bears its proportionate share of the expenses of any underlying Fidelity Central Funds.
G Expense ratios reflect operating expenses of the class. Expenses before reductions do not reflect amounts reimbursed by the investment adviser or reductions from brokerage service arrangements or reductions from other expense offset arrangements and do not represent the amount paid by the class during periods when reimbursements or reductions occur. Expenses net of fee waivers reflect expenses after reimbursement by the investment adviser but prior to reductions from brokerage service arrangements or other expense offset arrangements. Expenses net of all reductions represent the net expenses paid by the class.
H Annualized
I Amount does not include the portfolio activity of any underlying Fidelity Central Funds.
See accompanying notes which are an integral part of the financial statements.
Financial Highlights — Fidelity Worldwide Fund Class T
| Six months ended (Unaudited) April 30, | Years ended October 31, | |||||
| 2016 | 2015 | 2014 | 2013 | 2012 | 2011 | |
| Selected Per–Share Data | ||||||
| Net asset value, beginning of period | $22.72 | $24.49 | $25.05 | $19.61 | $17.83 | $17.46 |
| Income from Investment Operations | ||||||
| Net investment income (loss)A | .03 | (.01) | (.04) | (.04) | .05 | .01 |
| Net realized and unrealized gain (loss) | (.55) | .57 | 1.46 | 5.63 | 1.73 | .45 |
| Total from investment operations | (.52) | .56 | 1.42 | 5.59 | 1.78 | .46 |
| Distributions from net investment income | – | – | – | (.07) | – | (.04) |
| Distributions from net realized gain | (.75) | (2.33) | (1.98) | (.08) | – | (.05) |
| Total distributions | (.75) | (2.33) | (1.98) | (.15) | – | (.09) |
| Redemption fees added to paid in capitalA,B | – | – | – | – | – | – |
| Net asset value, end of period | $21.45 | $22.72 | $24.49 | $25.05 | $19.61 | $17.83 |
| Total ReturnC,D,E | (2.38)% | 2.36% | 6.05% | 28.73% | 9.98% | 2.61% |
| Ratios to Average Net AssetsF,G | ||||||
| Expenses before reductions | 1.57%H | 1.57% | 1.58% | 1.71% | 1.68% | 1.66% |
| Expenses net of fee waivers, if any | 1.57%H | 1.56% | 1.58% | 1.70% | 1.68% | 1.65% |
| Expenses net of all reductions | 1.57%H | 1.56% | 1.58% | 1.68% | 1.66% | 1.63% |
| Net investment income (loss) | .30%H | (.04)% | (.17)% | (.16)% | .26% | .03% |
| Supplemental Data | ||||||
| Net assets, end of period (000 omitted) | $12,729 | $13,055 | $12,160 | $9,822 | $5,550 | $2,187 |
| Portfolio turnover rateI | 124%H | 151% | 163% | 161% | 186% | 203% |
A Calculated based on average shares outstanding during the period.
B Amount represents less than $.005 per share.
C Total returns for periods of less than one year are not annualized.
D Total returns would have been lower if certain expenses had not been reduced during the applicable periods shown.
E Total returns do not include the effect of the sales charges.
F Fees and expenses of any underlying Fidelity Central Funds are not included in the Fund's expense ratio. The Fund indirectly bears its proportionate share of the expenses of any underlying Fidelity Central Funds.
G Expense ratios reflect operating expenses of the class. Expenses before reductions do not reflect amounts reimbursed by the investment adviser or reductions from brokerage service arrangements or reductions from other expense offset arrangements and do not represent the amount paid by the class during periods when reimbursements or reductions occur. Expenses net of fee waivers reflect expenses after reimbursement by the investment adviser but prior to reductions from brokerage service arrangements or other expense offset arrangements. Expenses net of all reductions represent the net expenses paid by the class.
H Annualized
I Amount does not include the portfolio activity of any underlying Fidelity Central Funds.
See accompanying notes which are an integral part of the financial statements.
Financial Highlights — Fidelity Worldwide Fund Class B
| Six months ended (Unaudited) April 30, | Years ended October 31, | |||||
| 2016 | 2015 | 2014 | 2013 | 2012 | 2011 | |
| Selected Per–Share Data | ||||||
| Net asset value, beginning of period | $22.55 | $24.21 | $24.82 | $19.44 | $17.77 | $17.39 |
| Income from Investment Operations | ||||||
| Net investment income (loss)A | (.02) | (.13) | (.17) | (.14) | (.04) | (.09) |
| Net realized and unrealized gain (loss) | (.55) | .57 | 1.45 | 5.59 | 1.71 | .47 |
| Total from investment operations | (.57) | .44 | 1.28 | 5.45 | 1.67 | .38 |
| Distributions from net investment income | – | – | – | – | – | – |
| Distributions from net realized gain | (.75) | (2.10) | (1.89) | (.07) | – | – |
| Total distributions | (.75) | (2.10) | (1.89) | (.07) | – | – |
| Redemption fees added to paid in capitalA,B | – | – | – | – | – | – |
| Net asset value, end of period | $21.23 | $22.55 | $24.21 | $24.82 | $19.44 | $17.77 |
| Total ReturnC,D,E | (2.65)% | 1.88% | 5.49% | 28.13% | 9.40% | 2.19% |
| Ratios to Average Net AssetsF,G | ||||||
| Expenses before reductions | 2.06%H | 2.08% | 2.09% | 2.19% | 2.18% | 2.16% |
| Expenses net of fee waivers, if any | 2.06%H | 2.08% | 2.09% | 2.19% | 2.18% | 2.16% |
| Expenses net of all reductions | 2.06%H | 2.07% | 2.09% | 2.17% | 2.16% | 2.13% |
| Net investment income (loss) | (.19)%H | (.55)% | (.68)% | (.65)% | (.23)% | (.47)% |
| Supplemental Data | ||||||
| Net assets, end of period (000 omitted) | $261 | $367 | $573 | $710 | $304 | $256 |
| Portfolio turnover rateI | 124%H | 151% | 163% | 161% | 186% | 203% |
A Calculated based on average shares outstanding during the period.
B Amount represents less than $.005 per share.
C Total returns for periods of less than one year are not annualized.
D Total returns would have been lower if certain expenses had not been reduced during the applicable periods shown.
E Total returns do not include the effect of the contingent deferred sales charge.
F Fees and expenses of any underlying Fidelity Central Funds are not included in the Fund's expense ratio. The Fund indirectly bears its proportionate share of the expenses of any underlying Fidelity Central Funds.
G Expense ratios reflect operating expenses of the class. Expenses before reductions do not reflect amounts reimbursed by the investment adviser or reductions from brokerage service arrangements or reductions from other expense offset arrangements and do not represent the amount paid by the class during periods when reimbursements or reductions occur. Expenses net of fee waivers reflect expenses after reimbursement by the investment adviser but prior to reductions from brokerage service arrangements or other expense offset arrangements. Expenses net of all reductions represent the net expenses paid by the class.
H Annualized
I Amount does not include the portfolio activity of any underlying Fidelity Central Funds.
See accompanying notes which are an integral part of the financial statements.
Financial Highlights — Fidelity Worldwide Fund Class C
| Six months ended (Unaudited) April 30, | Years ended October 31, | |||||
| 2016 | 2015 | 2014 | 2013 | 2012 | 2011 | |
| Selected Per–Share Data | ||||||
| Net asset value, beginning of period | $22.48 | $24.12 | $24.78 | $19.41 | $17.74 | $17.36 |
| Income from Investment Operations | ||||||
| Net investment income (loss)A | (.02) | (.12) | (.15) | (.14) | (.04) | (.09) |
| Net realized and unrealized gain (loss) | (.55) | .57 | 1.44 | 5.58 | 1.71 | .47 |
| Total from investment operations | (.57) | .45 | 1.29 | 5.44 | 1.67 | .38 |
| Distributions from net investment income | – | – | – | – | – | – |
| Distributions from net realized gain | (.75) | (2.09) | (1.95) | (.07) | – | – |
| Total distributions | (.75) | (2.09) | (1.95) | (.07) | – | – |
| Redemption fees added to paid in capitalA,B | – | – | – | – | – | – |
| Net asset value, end of period | $21.16 | $22.48 | $24.12 | $24.78 | $19.41 | $17.74 |
| Total ReturnC,D,E | (2.66)% | 1.90% | 5.55% | 28.12% | 9.41% | 2.19% |
| Ratios to Average Net AssetsF,G | ||||||
| Expenses before reductions | 2.06%H | 2.07% | 2.04% | 2.15% | 2.18% | 2.16% |
| Expenses net of fee waivers, if any | 2.06%H | 2.07% | 2.04% | 2.14% | 2.18% | 2.15% |
| Expenses net of all reductions | 2.06%H | 2.06% | 2.03% | 2.12% | 2.16% | 2.13% |
| Net investment income (loss) | (.19)%H | (.54)% | (.63)% | (.60)% | (.23)% | (.47)% |
| Supplemental Data | ||||||
| Net assets, end of period (000 omitted) | $11,120 | $11,231 | $9,229 | $10,778 | $1,726 | $1,297 |
| Portfolio turnover rateI | 124%H | 151% | 163% | 161% | 186% | 203% |
A Calculated based on average shares outstanding during the period.
B Amount represents less than $.005 per share.
C Total returns for periods of less than one year are not annualized.
D Total returns would have been lower if certain expenses had not been reduced during the applicable periods shown.
E Total returns do not include the effect of the contingent deferred sales charge.
F Fees and expenses of any underlying Fidelity Central Funds are not included in the Fund's expense ratio. The Fund indirectly bears its proportionate share of the expenses of any underlying Fidelity Central Funds.
G Expense ratios reflect operating expenses of the class. Expenses before reductions do not reflect amounts reimbursed by the investment adviser or reductions from brokerage service arrangements or reductions from other expense offset arrangements and do not represent the amount paid by the class during periods when reimbursements or reductions occur. Expenses net of fee waivers reflect expenses after reimbursement by the investment adviser but prior to reductions from brokerage service arrangements or other expense offset arrangements. Expenses net of all reductions represent the net expenses paid by the class.
H Annualized
I Amount does not include the portfolio activity of any underlying Fidelity Central Funds.
See accompanying notes which are an integral part of the financial statements.
Financial Highlights — Fidelity Worldwide Fund
| Six months ended (Unaudited) April 30, | Years ended October 31, | |||||
| 2016 | 2015 | 2014 | 2013 | 2012 | 2011 | |
| Selected Per–Share Data | ||||||
| Net asset value, beginning of period | $23.14 | $24.92 | $25.41 | $19.85 | $18.02 | $17.58 |
| Income from Investment Operations | ||||||
| Net investment income (loss)A | .10 | .13 | .11 | .10 | .16 | .11 |
| Net realized and unrealized gain (loss) | (.55) | .58 | 1.47 | 5.70 | 1.74 | .48 |
| Total from investment operations | (.45) | .71 | 1.58 | 5.80 | 1.90 | .59 |
| Distributions from net investment income | (.14) | (.08) | (.09) | (.16) | (.07) | (.10) |
| Distributions from net realized gain | (.75) | (2.41) | (1.98) | (.08) | – | (.05) |
| Total distributions | (.89) | (2.49) | (2.07) | (.24) | (.07) | (.15) |
| Redemption fees added to paid in capitalA,B | – | – | – | – | – | – |
| Net asset value, end of period | $21.80 | $23.14 | $24.92 | $25.41 | $19.85 | $18.02 |
| Total ReturnC,D | (2.08)% | 3.01% | 6.64% | 29.54% | 10.56% | 3.32% |
| Ratios to Average Net AssetsE,F | ||||||
| Expenses before reductions | .96%G | .96% | .98% | 1.11% | 1.11% | 1.08% |
| Expenses net of fee waivers, if any | .96%G | .96% | .97% | 1.11% | 1.11% | 1.08% |
| Expenses net of all reductions | .95%G | .95% | .97% | 1.08% | 1.09% | 1.05% |
| Net investment income (loss) | .91%G | .57% | .44% | .43% | .84% | .60% |
| Supplemental Data | ||||||
| Net assets, end of period (000 omitted) | $1,468,611 | $1,543,516 | $1,535,658 | $1,464,415 | $1,081,240 | $1,114,694 |
| Portfolio turnover rateH | 124%G | 151% | 163% | 161% | 186% | 203% |
A Calculated based on average shares outstanding during the period.
B Amount represents less than $.005 per share.
C Total returns for periods of less than one year are not annualized.
D Total returns would have been lower if certain expenses had not been reduced during the applicable periods shown.
E Fees and expenses of any underlying Fidelity Central Funds are not included in the Fund's expense ratio. The Fund indirectly bears its proportionate share of the expenses of any underlying Fidelity Central Funds.
F Expense ratios reflect operating expenses of the class. Expenses before reductions do not reflect amounts reimbursed by the investment adviser or reductions from brokerage service arrangements or reductions from other expense offset arrangements and do not represent the amount paid by the class during periods when reimbursements or reductions occur. Expenses net of fee waivers reflect expenses after reimbursement by the investment adviser but prior to reductions from brokerage service arrangements or other expense offset arrangements. Expenses net of all reductions represent the net expenses paid by the class.
G Annualized
H Amount does not include the portfolio activity of any underlying Fidelity Central Funds.
See accompanying notes which are an integral part of the financial statements.
Financial Highlights — Fidelity Worldwide Fund Class I
| Six months ended (Unaudited) April 30, | Years ended October 31, | |||||
| 2016 | 2015 | 2014 | 2013 | 2012 | 2011 | |
| Selected Per–Share Data | ||||||
| Net asset value, beginning of period | $23.03 | $24.81 | $25.31 | $19.78 | $17.98 | $17.57 |
| Income from Investment Operations | ||||||
| Net investment income (loss)A | .09 | .13 | .10 | .08 | .14 | .10 |
| Net realized and unrealized gain (loss) | (.56) | .58 | 1.47 | 5.68 | 1.74 | .47 |
| Total from investment operations | (.47) | .71 | 1.57 | 5.76 | 1.88 | .57 |
| Distributions from net investment income | (.11) | (.07) | (.09) | (.15) | (.08) | (.11) |
| Distributions from net realized gain | (.75) | (2.41) | (1.98) | (.08) | – | (.05) |
| Total distributions | (.86) | (2.49)B | (2.07) | (.23) | (.08) | (.16) |
| Redemption fees added to paid in capitalA,C | – | – | – | – | – | – |
| Net asset value, end of period | $21.70 | $23.03 | $24.81 | $25.31 | $19.78 | $17.98 |
| Total ReturnD,E | (2.17)% | 3.00% | 6.63% | 29.44% | 10.49% | 3.23% |
| Ratios to Average Net AssetsF,G | ||||||
| Expenses before reductions | 1.05%H | .98% | 1.01% | 1.17% | 1.18% | 1.13% |
| Expenses net of fee waivers, if any | 1.05%H | .98% | 1.01% | 1.17% | 1.18% | 1.13% |
| Expenses net of all reductions | 1.05%H | .97% | 1.00% | 1.14% | 1.16% | 1.10% |
| Net investment income (loss) | .82%H | .55% | .40% | .37% | .77% | .56% |
| Supplemental Data | ||||||
| Net assets, end of period (000 omitted) | $23,924 | $25,173 | $19,107 | $10,639 | $4,291 | $3,086 |
| Portfolio turnover rateI | 124%H | 151% | 163% | 161% | 186% | 203% |
A Calculated based on average shares outstanding during the period.
B Total distributions of $2.49 per share is comprised of distributions from net investment income of $.074 and distributions from net realized gain of $2.413 per share.
C Amount represents less than $.005 per share.
D Total returns for periods of less than one year are not annualized.
E Total returns would have been lower if certain expenses had not been reduced during the applicable periods shown.
F Fees and expenses of any underlying Fidelity Central Funds are not included in the Fund's expense ratio. The Fund indirectly bears its proportionate share of the expenses of any underlying Fidelity Central Funds.
G Expense ratios reflect operating expenses of the class. Expenses before reductions do not reflect amounts reimbursed by the investment adviser or reductions from brokerage service arrangements or reductions from other expense offset arrangements and do not represent the amount paid by the class during periods when reimbursements or reductions occur. Expenses net of fee waivers reflect expenses after reimbursement by the investment adviser but prior to reductions from brokerage service arrangements or other expense offset arrangements. Expenses net of all reductions represent the net expenses paid by the class.
H Annualized
I Amount does not include the portfolio activity of any underlying Fidelity Central Funds.
See accompanying notes which are an integral part of the financial statements.
Notes to Financial Statements (Unaudited)
For the period ended April 30, 2016
1. Organization.
Fidelity Worldwide Fund (the Fund) is a fund of Fidelity Investment Trust (the Trust) and is authorized to issue an unlimited number of shares. The Trust is registered under the Investment Company Act of 1940, as amended (the 1940 Act), as an open-end management investment company organized as a Massachusetts business trust. The Fund offers Class A, Class T, Class C, Worldwide and Class I shares, each of which, along with Class B shares, has equal rights as to assets and voting privileges. Class B shares are closed to new accounts and additional purchases, except for exchanges and reinvestments. Each class has exclusive voting rights with respect to matters that affect that class. Class B shares will automatically convert to Class A shares after a maximum holding period of seven years from the initial date of purchase.
During the period, the Board of Trustees approved the conversion of all existing Class B shares into Class A shares, effective on or about July 1, 2016, regardless of the length of times shares have been held.
2. Investments in Fidelity Central Funds.
The Fund invests in Fidelity Central Funds, which are open-end investment companies generally available only to other investment companies and accounts managed by the investment adviser and its affiliates. The Fund's Schedule of Investments lists each of the Fidelity Central Funds held as of period end, if any, as an investment of the Fund, but does not include the underlying holdings of each Fidelity Central Fund. As an Investing Fund, the Fund indirectly bears its proportionate share of the expenses of the underlying Fidelity Central Funds.
The Money Market Central Funds seek preservation of capital and current income and are managed by Fidelity Investments Money Management, Inc. (FIMM), an affiliate of the investment adviser. Annualized expenses of the Money Market Central Funds as of their most recent shareholder report date are less than .005%.
A complete unaudited list of holdings for each Fidelity Central Fund is available upon request or at the Securities and Exchange Commission (the SEC) website at www.sec.gov. In addition, the financial statements of the Fidelity Central Funds are available on the SEC website or upon request.
3. Significant Accounting Policies.
The financial statements have been prepared in conformity with accounting principles generally accepted in the United States of America (GAAP), which require management to make certain estimates and assumptions at the date of the financial statements. Actual results could differ from those estimates. Subsequent events, if any, through the date that the financial statements were issued have been evaluated in the preparation of the financial statements. The following summarizes the significant accounting policies of the Fund:
Investment Valuation. Investments are valued as of 4:00 p.m. Eastern time on the last calendar day of the period. The Board of Trustees (the Board) has delegated the day to day responsibility for the valuation of the Fund's investments to the Fidelity Management & Research Company (FMR) Fair Value Committee (the Committee). In accordance with valuation policies and procedures approved by the Board, the Fund attempts to obtain prices from one or more third party pricing vendors or brokers to value its investments. When current market prices, quotations or currency exchange rates are not readily available or reliable, investments will be fair valued in good faith by the Committee, in accordance with procedures adopted by the Board. Factors used in determining fair value vary by investment type and may include market or investment specific events. The frequency with which these procedures are used cannot be predicted and they may be utilized to a significant extent. The Committee oversees the Fund's valuation policies and procedures and reports to the Board on the Committee's activities and fair value determinations. The Board monitors the appropriateness of the procedures used in valuing the Fund's investments and ratifies the fair value determinations of the Committee.
The Fund categorizes the inputs to valuation techniques used to value its investments into a disclosure hierarchy consisting of three levels as shown below:
- Level 1 – quoted prices in active markets for identical investments
- Level 2 – other significant observable inputs (including quoted prices for similar investments, interest rates, prepayment speeds, etc.)
- Level 3 – unobservable inputs (including the Fund's own assumptions based on the best information available)
Valuation techniques used to value the Fund's investments by major category are as follows:
Equity securities, including restricted securities, for which market quotations are readily available, are valued at the last reported sale price or official closing price as reported by a third party pricing vendor on the primary market or exchange on which they are traded and are categorized as Level 1 in the hierarchy. In the event there were no sales during the day or closing prices are not available, securities are valued at the last quoted bid price or may be valued using the last available price and are generally categorized as Level 2 in the hierarchy. For foreign equity securities, when market or security specific events arise, comparisons to the valuation of American Depositary Receipts (ADRs), futures contracts, Exchange-Traded Funds (ETFs) and certain indexes as well as quoted prices for similar securities may be used and would be categorized as Level 2 in the hierarchy. Utilizing these techniques may result in transfers between Level 1 and Level 2. For equity securities, including restricted securities, where observable inputs are limited, assumptions about market activity and risk are used and these securities may be categorized as Level 3 in the hierarchy.
Investments in open-end mutual funds, including the Fidelity Central Funds, are valued at their closing net asset value (NAV) each business day and are categorized as Level 1 in the hierarchy.
Changes in valuation techniques may result in transfers in or out of an assigned level within the disclosure hierarchy. The aggregate value of investments by input level as of April 30, 2016, including information on transfers between Levels 1 and 2 is included at the end of the Fund's Schedule of Investments.
Foreign Currency. The Fund may use foreign currency contracts to facilitate transactions in foreign-denominated securities. Gains and losses from these transactions may arise from changes in the value of the foreign currency or if the counterparties do not perform under the contracts' terms.
Foreign-denominated assets, including investment securities, and liabilities are translated into U.S. dollars at the exchange rates at period end. Purchases and sales of investment securities, income and dividends received and expenses denominated in foreign currencies are translated into U.S. dollars at the exchange rate in effect on the transaction date.
The effects of exchange rate fluctuations on investments are included with the net realized and unrealized gain (loss) on investment securities. Other foreign currency transactions resulting in realized and unrealized gain (loss) are disclosed separately.
Investment Transactions and Income. For financial reporting purposes, the Fund's investment holdings and NAV include trades executed through the end of the last business day of the period. The NAV per share for processing shareholder transactions is calculated as of the close of business of the New York Stock Exchange (NYSE), normally 4:00 p.m. Eastern time and includes trades executed through the end of the prior business day. Gains and losses on securities sold are determined on the basis of identified cost and may include proceeds received from litigation. Dividend income is recorded on the ex-dividend date, except for certain dividends from foreign securities where the ex-dividend date may have passed, which are recorded as soon as the Fund is informed of the ex-dividend date. Non-cash dividends included in dividend income, if any, are recorded at the fair market value of the securities received. Income and capital gain distributions from Fidelity Central Funds, if any, are recorded on the ex-dividend date. Distributions received on securities that represent a return of capital or capital gain are recorded as a reduction of cost of investments and/or as a realized gain. Subsequent to ex-dividend date the Fund determines the components of these distributions, based upon receipt of tax filings or other correspondence relating to the underlying investment. Interest income is accrued as earned and includes coupon interest and amortization of premium and accretion of discount on debt securities as applicable. Investment income is recorded net of foreign taxes withheld where recovery of such taxes is uncertain.
Class Allocations and Expenses. Investment income, realized and unrealized capital gains and losses, common expenses of the Fund, and certain fund-level expense reductions, if any, are allocated daily on a pro-rata basis to each class based on the relative net assets of each class to the total net assets of the Fund. Each class differs with respect to transfer agent and distribution and service plan fees incurred. Certain expense reductions may also differ by class. For the reporting period, the allocated portion of income and expenses to each class as a percent of its average net assets may vary due to the timing of recording these transactions in relation to fluctuating net assets of the classes. Expenses directly attributable to a fund are charged to that fund. Expenses attributable to more than one fund are allocated among the respective funds on the basis of relative net assets or other appropriate methods. Expense estimates are accrued in the period to which they relate and adjustments are made when actual amounts are known.
Income Tax Information and Distributions to Shareholders. Each year, the Fund intends to qualify as a regulated investment company under Subchapter M of the Internal Revenue Code, including distributing substantially all of its taxable income and realized gains. As a result, no provision for U.S. Federal income taxes is required. The Fund files a U.S. federal tax return, in addition to state and local tax returns as required. The Fund's federal income tax returns are subject to examination by the Internal Revenue Service (IRS) for a period of three fiscal years after they are filed. State and local tax returns may be subject to examination for an additional fiscal year depending on the jurisdiction. Foreign taxes are provided for based on the Fund's understanding of the tax rules and rates that exist in the foreign markets in which it invests. The Fund is subject to a tax imposed on capital gains by certain countries in which it invests.
Distributions are declared and recorded on the ex-dividend date. Income dividends and capital gain distributions are declared separately for each class. Income and capital gain distributions are determined in accordance with income tax regulations, which may differ from GAAP.
Capital accounts within the financial statements are adjusted for permanent book-tax differences. These adjustments have no impact on net assets or the results of operations. Capital accounts are not adjusted for temporary book-tax differences which will reverse in a subsequent period.
Book-tax differences are primarily due to futures contracts, foreign currency transactions, certain foreign taxes, passive foreign investment companies (PFIC), partnerships, deferred trustees compensation and losses deferred due to wash sales.
The federal tax cost of investment securities and unrealized appreciation (depreciation) as of period end were as follows:
| Gross unrealized appreciation | $244,600,092 |
| Gross unrealized depreciation | (44,752,721) |
| Net unrealized appreciation (depreciation) on securities | $199,847,371 |
| Tax cost | $1,370,655,303 |
Short-Term Trading (Redemption) Fees. Shares held by investors in the Fund less than 30 days may have been subject to a redemption fee equal to 1.00% of the NAV of shares redeemed. All redemption fees, which reduce the proceeds of the shareholder redemption, are retained by the Fund and accounted for as an addition to paid in capital.
Delayed Delivery Transactions and When-Issued Securities. During the period, the Fund transacted in securities on a delayed delivery or when-issued basis. Payment and delivery may take place after the customary settlement period for that security. The price of the underlying securities and the date when the securities will be delivered and paid for are fixed at the time the transaction is negotiated. With respect to purchase commitments, the Fund identifies securities as segregated in its records with a value at least equal to the amount of the commitment. Losses may arise due to changes in the value of the underlying securities or if the counterparty does not perform under the contract's terms, or if the issuer does not issue the securities due to political, economic, or other factors.
Restricted Securities. The Fund may invest in securities that are subject to legal or contractual restrictions on resale. These securities generally may be resold in transactions exempt from registration or to the public if the securities are registered. Disposal of these securities may involve time-consuming negotiations and expense, and prompt sale at an acceptable price may be difficult. Information regarding restricted securities is included at the end of the Fund's Schedule of Investments.
4. Purchases and Sales of Investments.
Purchases and sales of securities, other than short-term securities, aggregated $959,804,322 and $977,150,164, respectively.
5. Fees and Other Transactions with Affiliates.
Management Fee. Fidelity Management & Research Company (the investment adviser) and its affiliates provide the Fund with investment management related services for which the Fund pays a monthly management fee. The management fee is the sum of an individual fund fee rate that is based on an annual rate of .424% of the Fund's average net assets and an annualized group fee rate that averaged .25% during the period. The group fee rate is based upon the average net assets of all the mutual funds advised by the investment adviser, including any mutual funds previously advised by the investment adviser that are currently advised by Fidelity SelectCo, LLC, an affiliate of the investment adviser. The group fee rate decreases as assets under management increase and increases as assets under management decrease. In addition, the management fee is subject to a performance adjustment (up to a maximum of +/- .20% of the Fund's average net assets over a 36 month performance period). The upward or downward adjustment to the management fee is based on the relative investment performance of Worldwide as compared to its benchmark index, the MSCI World Index, over the same 36 month performance period. For the reporting period, the total annualized management fee rate, including the performance adjustment, was .70% of the Fund's average net assets. The performance adjustment included in the management fee rate may be higher or lower than the maximum performance adjustment rate due to the difference between the average net assets for the reporting and performance periods.
Distribution and Service Plan Fees. In accordance with Rule 12b-1 of the 1940 Act, the Fund has adopted separate Distribution and Service Plans for each class of shares. Certain classes pay Fidelity Distributors Corporation (FDC), an affiliate of the investment adviser, separate Distribution and Service Fees, each of which is based on an annual percentage of each class' average net assets. In addition, FDC may pay financial intermediaries for selling shares of the Fund and providing shareholder support services. For the period, the Distribution and Service Fee rates, total fees and amounts retained by FDC were as follows:
| Distribution Fee | Service Fee | Total Fees | Retained by FDC | |
| Class A | -% | .25% | $38,402 | $948 |
| Class T | .25% | .25% | 31,350 | 111 |
| Class B | .75% | .25% | 1,507 | 1,130 |
| Class C | .75% | .25% | 55,483 | 14,385 |
| $126,742 | $16,574 |
Sales Load. FDC may receive a front-end sales charge of up to 5.75% for selling Class A shares and 3.50% for selling Class T shares, some of which is paid to financial intermediaries for selling shares of the Fund. Depending on the holding period, FDC may receive contingent deferred sales charges levied on Class A, Class T, Class B, and Class C redemptions. The deferred sales charges range from 5.00% to 1.00% for Class B shares, 1.00% for Class C shares, 1.00% for certain purchases of Class A shares and .25% for certain purchases of Class T shares.
For the period, sales charge amounts retained by FDC were as follows:
| Retained by FDC | |
| Class A | $9,190 |
| Class T | 2,320 |
| Class B(a) | 69 |
| Class C(a) | 1,068 |
| $12,647 |
(a) When Class B and Class C shares are initially sold, FDC pays commissions from its own resources to financial intermediaries through which the sales are made.
Transfer Agent Fees. Fidelity Investments Institutional Operations Company, Inc., (FIIOC), an affiliate of the investment adviser, is the transfer, dividend disbursing and shareholder servicing agent for each class of the Fund. FIIOC receives account fees and asset-based fees that vary according to the account size and type of account of the shareholders of the respective classes of the Fund. FIIOC pays for typesetting, printing and mailing of shareholder reports, except proxy statements.
For the period, transfer agent fees for each class were as follows:
| Amount | % of Class-Level Average Net Assets(a) | |
| Class A | $39,375 | .26 |
| Class T | 19,127 | .30 |
| Class B | 451 | .30 |
| Class C | 16,541 | .30 |
| Worldwide | 1,424,795 | .19 |
| Class I | 34,959 | .29 |
| $1,535,248 |
(a) Annualized
Accounting and Security Lending Fees. Fidelity Service Company, Inc. (FSC), an affiliate of the investment adviser, maintains the Fund's accounting records. The accounting fee is based on the level of average net assets for each month. Under a separate contract, FSC administers the security lending program. The security lending fee is based on the number and duration of lending transactions.
Brokerage Commissions. The Fund placed a portion of its portfolio transactions with brokerage firms which are affiliates of the investment adviser. Brokerage commissions are included in net realized gain (loss) and change in net unrealized appreciation (depreciation) in the Statement of Operations. The commissions paid to these affiliated firms were $9,611 for the period.
Interfund Trades. The Fund may purchase from or sell securities to other Fidelity Funds under procedures adopted by the Board. The procedures have been designed to ensure these interfund trades are executed in accordance with Rule 17a-7 of the 1940 Act. Interfund trades are included within the respective purchases and sales amounts shown in the Purchases and Sales of Investments note.
6. Committed Line of Credit.
The Fund participates with other funds managed by the investment adviser or an affiliate in a $4.25 billion credit facility (the "line of credit") to be utilized for temporary or emergency purposes to fund shareholder redemptions or for other short-term liquidity purposes. The Fund has agreed to pay commitment fees on its pro-rata portion of the line of credit, which amounted to $1,379 and is reflected in Miscellaneous expenses on the Statement of Operations. During the period, the Fund did not borrow on this line of credit.
7. Security Lending.
The Fund lends portfolio securities through a lending agent from time to time in order to earn additional income. For equity securities, a lending agent is used and may loan securities to certain qualified borrowers, including Fidelity Capital Markets (FCM), a broker-dealer affiliated with the Fund. On the settlement date of the loan, the Fund receives collateral (in the form of U.S. Treasury obligations, letters of credit and/or cash) against the loaned securities and maintains collateral in an amount not less than 100% of the market value of the loaned securities during the period of the loan. The market value of the loaned securities is determined at the close of business of the Fund and any additional required collateral is delivered to the Fund on the next business day. The Fund or borrower may terminate the loan at any time, and if the borrower defaults on its obligation to return the securities loaned because of insolvency or other reasons, the Fund may apply collateral received from the borrower against the obligation. The Fund may experience delays and costs in recovering the securities loaned. Any cash collateral received is invested in the Fidelity Securities Lending Cash Central Fund. The value of loaned securities and cash collateral at period end are disclosed on the Fund's Statement of Assets and Liabilities. Security lending income represents the income earned on investing cash collateral, less rebates paid to borrowers and any lending agent fees associated with the loan, plus any premium payments received for lending certain types of securities. Security lending income is presented in the Statement of Operations as a component of income from Fidelity Central Funds. Total security lending income during the period amounted to $115,427. During the period, there were no securities loaned to FCM.
8. Expense Reductions.
Commissions paid to certain brokers with whom the investment adviser, or its affiliates, places trades on behalf of the Fund include an amount in addition to trade execution, which may be rebated back to the Fund to offset certain expenses. This amount totaled $20,702 for the period. In addition, through arrangements with the Fund's custodian, credits realized as a result of certain uninvested cash balances were used to reduce the Fund's expenses. During the period, these credits reduced the Fund's custody expenses by $297.
In addition, during the period the investment adviser reimbursed and/or waived a portion of fund-level operating expenses in the amount of $5,778.
9. Distributions to Shareholders.
Distributions to shareholders of each class were as follows:
| Six months ended April 30, 2016 | Year ended October 31, 2015 | |
| From net investment income | ||
| Class A | $95,208 | $– |
| Class T | 2,313 | – |
| Worldwide | 9,064,407 | 4,895,242 |
| Class I | 116,983 | 47,084 |
| Total | $9,278,911 | $4,942,326 |
| From net realized gain | ||
| Class A | $1,050,091 | $3,318,115 |
| Class T | 433,754 | 1,143,314 |
| Class B | 11,494 | 47,493 |
| Class C | 384,211 | 790,219 |
| Worldwide | 49,987,535 | 147,652,391 |
| Class I | 804,930 | 1,535,304 |
| Total | $52,672,015 | $154,486,836 |
10. Share Transactions.
Share transactions for each class were as follows and may contain automatic conversions between classes or exchanges between affiliated funds:
| Shares | Shares | Dollars | Dollars | |
| Six months ended April 30, 2016 | Year ended October 31, 2015 | Six months ended April 30, 2016 | Year ended October 31, 2015 | |
| Class A | ||||
| Shares sold | 230,209 | 416,197 | $4,950,696 | $9,650,572 |
| Reinvestment of distributions | 49,536 | 143,319 | 1,105,146 | 3,239,009 |
| Shares redeemed | (185,147) | (573,622) | (3,904,065) | (12,962,950) |
| Net increase (decrease) | 94,598 | (14,106) | $2,151,777 | $(73,369) |
| Class T | ||||
| Shares sold | 57,758 | 129,216 | $1,237,003 | $2,974,281 |
| Reinvestment of distributions | 19,370 | 50,075 | 430,197 | 1,126,698 |
| Shares redeemed | (58,217) | (101,388) | (1,245,210) | (2,303,572) |
| Net increase (decrease) | 18,911 | 77,903 | $421,990 | $1,797,407 |
| Class B | ||||
| Shares sold | 457 | 3,860 | $8,675 | $90,877 |
| Reinvestment of distributions | 487 | 1,857 | 10,726 | 41,646 |
| Shares redeemed | (4,925) | (13,140) | (103,223) | (300,445) |
| Net increase (decrease) | (3,981) | (7,423) | $(83,822) | $(167,922) |
| Class C | ||||
| Shares sold | 71,518 | 216,209 | $1,499,591 | $4,944,508 |
| Reinvestment of distributions | 15,568 | 31,721 | 341,870 | 709,279 |
| Shares redeemed | (61,233) | (130,941) | (1,257,272) | (2,958,600) |
| Net increase (decrease) | 25,853 | 116,989 | $584,189 | $2,695,187 |
| Worldwide | ||||
| Shares sold | 4,864,505 | 10,346,856 | $104,200,239 | $242,784,559 |
| Reinvestment of distributions | 2,542,668 | 6,500,654 | 57,260,887 | 148,214,908 |
| Shares redeemed | (6,730,731) | (11,769,221) | (144,609,657) | (274,209,696) |
| Net increase (decrease) | 676,442 | 5,078,289 | $16,851,469 | $116,789,771 |
| Class I | ||||
| Shares sold | 286,917 | 842,969 | $6,199,126 | $19,464,651 |
| Reinvestment of distributions | 28,687 | 64,929 | 643,439 | 1,473,244 |
| Shares redeemed | (306,329) | (584,975) | (6,392,591) | (13,709,229) |
| Net increase (decrease) | 9,275 | 322,923 | $449,974 | $7,228,666 |
11. Other.
The Fund's organizational documents provide former and current trustees and officers with a limited indemnification against liabilities arising in connection with the performance of their duties to the Fund. In the normal course of business, the Fund may also enter into contracts that provide general indemnifications. The Fund's maximum exposure under these arrangements is unknown as this would be dependent on future claims that may be made against the Fund. The risk of material loss from such claims is considered remote.
Shareholder Expense Example
As a shareholder of the Fund, you incur two types of costs: (1) transaction costs, including sales charges (loads) on purchase payments or redemption proceeds, redemption fees and (2) ongoing costs, including management fees, distribution and/or service (12b-1) fees and other Fund expenses. This Example is intended to help you understand your ongoing costs (in dollars) of investing in the Fund and to compare these costs with the ongoing costs of investing in other mutual funds.
The Example is based on an investment of $1,000 invested at the beginning of the period and held for the entire period (November 1, 2015 to April 30, 2016).
Actual Expenses
The first line of the accompanying table for each class of the Fund provides information about actual account values and actual expenses. You may use the information in this line, together with the amount you invested, to estimate the expenses that you paid over the period. Simply divide your account value by $1,000.00 (for example, an $8,600 account value divided by $1,000.00 = 8.6), then multiply the result by the number in the first line for a class of the Fund under the heading entitled "Expenses Paid During Period" to estimate the expenses you paid on your account during this period. A small balance maintenance fee of $12.00 that is charged once a year may apply for certain accounts with a value of less than $2,000. This fee is not included in the table below. If it was, the estimate of expenses you paid during the period would be higher, and your ending account value lower, by this amount. In addition, the Fund, as a shareholder in the underlying Fidelity Central Funds, will indirectly bear its pro-rata share of the fees and expenses incurred by the underlying Fidelity Central Funds. These fees and expenses are not included in the Fund's annualized expense ratio used to calculate the expense estimate in the table below.
Hypothetical Example for Comparison Purposes
The second line of the accompanying table for each class of the Fund provides information about hypothetical account values and hypothetical expenses based on a Class' actual expense ratio and an assumed rate of return of 5% per year before expenses, which is not the Class' actual return. The hypothetical account values and expenses may not be used to estimate the actual ending account balance or expenses you paid for the period. You may use this information to compare the ongoing costs of investing in the Fund and other funds. To do so, compare this 5% hypothetical example with the 5% hypothetical examples that appear in the shareholder reports of the other funds. A small balance maintenance fee of $12.00 that is charged once a year may apply for certain accounts with a value of less than $2,000. This fee is not included in the table below. If it was, the estimate of expenses you paid during the period would be higher, and your ending account value lower, by this amount. In addition, the Fund, as a shareholder in the underlying Fidelity Central Funds, will indirectly bear its pro-rata share of the fees and expenses incurred by the underlying Fidelity Central Funds. These fees and expenses are not included in the Fund's annualized expense ratio used to calculate the expense estimate in the table below.
Please note that the expenses shown in the table are meant to highlight your ongoing costs only and do not reflect any transaction costs. Therefore, the second line of the table is useful in comparing ongoing costs only, and will not help you determine the relative total costs of owning different funds. In addition, if these transactional costs were included, your costs would have been higher.
| Annualized Expense Ratio-A | Beginning Account Value November 1, 2015 | Ending Account Value April 30, 2016 | Expenses Paid During Period-B November 1, 2015 to April 30, 2016 | |
| Class A | 1.27% | |||
| Actual | $1,000.00 | $977.30 | $6.24 | |
| Hypothetical-C | $1,000.00 | $1,018.55 | $6.37 | |
| Class T | 1.57% | |||
| Actual | $1,000.00 | $976.20 | $7.71 | |
| Hypothetical-C | $1,000.00 | $1,017.06 | $7.87 | |
| Class B | 2.06% | |||
| Actual | $1,000.00 | $973.50 | $10.11 | |
| Hypothetical-C | $1,000.00 | $1,014.62 | $10.32 | |
| Class C | 2.06% | |||
| Actual | $1,000.00 | $973.40 | $10.11 | |
| Hypothetical-C | $1,000.00 | $1,014.62 | $10.32 | |
| Worldwide | .96% | |||
| Actual | $1,000.00 | $979.20 | $4.72 | |
| Hypothetical-C | $1,000.00 | $1,020.09 | $4.82 | |
| Class I | 1.05% | |||
| Actual | $1,000.00 | $978.30 | $5.16 | |
| Hypothetical-C | $1,000.00 | $1,019.64 | $5.27 |
A Annualized expense ratio reflects expenses net of applicable fee waivers.
B Expenses are equal to each Class' annualized expense ratio, multiplied by the average account value over the period, multiplied by 182/366 (to reflect the one-half year period).
C 5% return per year before expenses
![]()
AWLDI-SANN-0616
1.883440.107
Fidelity® Overseas Fund Semi-Annual Report April 30, 2016 |
|
Contents
To view a fund's proxy voting guidelines and proxy voting record for the 12-month period ended June 30, visit http://www.fidelity.com/proxyvotingresults or visit the Securities and Exchange Commission's (SEC) web site at http://www.sec.gov.
You may also call 1-800-835-5092 to request a free copy of the proxy voting guidelines.
Standard & Poor's, S&P and S&P 500 are registered service marks of The McGraw-Hill Companies, Inc. and have been licensed for use by Fidelity Distributors Corporation.
Other third-party marks appearing herein are the property of their respective owners.
All other marks appearing herein are registered or unregistered trademarks or service marks of FMR LLC or an affiliated company. © 2016 FMR LLC. All rights reserved.
This report and the financial statements contained herein are submitted for the general information of the shareholders of the Fund. This report is not authorized for distribution to prospective investors in the Fund unless preceded or accompanied by an effective prospectus.
A fund files its complete schedule of portfolio holdings with the SEC for the first and third quarters of each fiscal year on Form N-Q. Forms N-Q are available on the SEC’s web site at http://www.sec.gov. A fund's Forms N-Q may be reviewed and copied at the SEC’s Public Reference Room in Washington, DC. Information regarding the operation of the SEC's Public Reference Room may be obtained by calling 1-800-SEC-0330.
For a complete list of a fund's portfolio holdings, view the most recent holdings listing, semiannual report, or annual report on Fidelity's web site at http://www.fidelity.com, http://www.advisor.fidelity.com, or http://www.401k.com, as applicable.
NOT FDIC INSURED •MAY LOSE VALUE •NO BANK GUARANTEE
Neither the Fund nor Fidelity Distributors Corporation is a bank.
Investment Summary (Unaudited)
Geographic Diversification (% of fund's net assets)
| As of April 30, 2016 | ||
| United Kingdom | 22.0% | |
| Japan | 17.5% | |
| Germany | 8.8% | |
| United States of America* | 8.1% | |
| France | 8.0% | |
| Switzerland | 7.9% | |
| Sweden | 4.1% | |
| Netherlands | 2.7% | |
| Ireland | 2.6% | |
| Other | 18.3% | |

* Includes Short-Term Investments and Net Other Assets (Liabilities).
Percentages are based on country or territory of incorporation and are adjusted for the effect of futures contracts, if applicable.
| As of October 31, 2015 | ||
| United Kingdom | 27.6% | |
| Japan | 18.2% | |
| Switzerland | 7.8% | |
| Germany | 7.0% | |
| United States of America* | 6.7% | |
| France | 6.6% | |
| Sweden | 3.4% | |
| Australia | 2.9% | |
| Ireland | 2.8% | |
| Other | 17.0% | |

* Includes Short-Term Investments and Net Other Assets (Liabilities).
Percentages are based on country or territory of incorporation and are adjusted for the effect of futures contracts, if applicable.
Asset Allocation as of April 30, 2016
| % of fund's net assets | % of fund's net assets 6 months ago | |
| Stocks | 97.6 | 98.2 |
| Short-Term Investments and Net Other Assets (Liabilities) | 2.4 | 1.8 |
Top Ten Stocks as of April 30, 2016
| % of fund's net assets | % of fund's net assets 6 months ago | |
| Nestle SA (Switzerland, Food Products) | 2.2 | 2.1 |
| Novartis AG (Switzerland, Pharmaceuticals) | 1.8 | 0.0 |
| Bayer AG (Germany, Pharmaceuticals) | 1.6 | 1.5 |
| Total SA (France, Oil, Gas & Consumable Fuels) | 1.6 | 1.3 |
| Sanofi SA (France, Pharmaceuticals) | 1.5 | 1.7 |
| Anheuser-Busch InBev SA NV (Belgium, Beverages) | 1.3 | 1.2 |
| SAP AG (Germany, Software) | 1.2 | 0.0 |
| UBS Group AG (Switzerland, Capital Markets) | 1.1 | 1.2 |
| AIA Group Ltd. (Hong Kong, Insurance) | 1.1 | 1.1 |
| Fresenius SE & Co. KGaA (Germany, Health Care Providers & Services) | 1.1 | 1.2 |
| 14.5 |
Market Sectors as of April 30, 2016
| % of fund's net assets | % of fund's net assets 6 months ago | |
| Financials | 21.2 | 22.6 |
| Health Care | 16.3 | 15.8 |
| Consumer Discretionary | 14.8 | 16.2 |
| Consumer Staples | 12.0 | 11.9 |
| Information Technology | 11.1 | 9.6 |
| Industrials | 10.4 | 11.3 |
| Materials | 6.5 | 5.5 |
| Telecommunication Services | 3.0 | 3.5 |
| Energy | 2.3 | 1.8 |
Percentages shown as 0.0% may reflect amounts less than 0.05%.
Investments April 30, 2016 (Unaudited)
Showing Percentage of Net Assets
| Common Stocks - 96.6% | |||
| Shares | Value | ||
| Australia - 2.4% | |||
| Amcor Ltd. (a) | 3,956,685 | $46,330,368 | |
| Ansell Ltd. (a) | 527,656 | 7,995,981 | |
| Aub Group Ltd. | 2,948,275 | 19,502,972 | |
| Australia & New Zealand Banking Group Ltd. | 1,452,585 | 26,625,791 | |
| Flight Centre Travel Group Ltd. (b) | 736,160 | 22,003,350 | |
| Life Healthcare Group Ltd. | 1,672,012 | 1,728,987 | |
| TOTAL AUSTRALIA | 124,187,449 | ||
| Austria - 0.4% | |||
| Andritz AG | 380,700 | 21,320,873 | |
| Bailiwick of Jersey - 2.2% | |||
| Regus PLC | 5,936,170 | 25,361,708 | |
| Sanne Group PLC | 1,181,000 | 7,614,290 | |
| Wolseley PLC | 575,693 | 32,245,756 | |
| WPP PLC | 2,177,633 | 50,875,137 | |
| TOTAL BAILIWICK OF JERSEY | 116,096,891 | ||
| Belgium - 2.2% | |||
| Anheuser-Busch InBev SA NV | 562,012 | 69,565,792 | |
| KBC Groep NV | 821,837 | 46,139,410 | |
| TOTAL BELGIUM | 115,705,202 | ||
| Bermuda - 0.4% | |||
| Markit Ltd. (a) | 606,400 | 21,157,296 | |
| Canada - 0.9% | |||
| Constellation Software, Inc. | 64,400 | 25,167,686 | |
| Open Text Corp. | 353,900 | 19,814,677 | |
| TOTAL CANADA | 44,982,363 | ||
| Cayman Islands - 0.2% | |||
| Lifestyle International Holdings Ltd. | 5,835,500 | 9,666,645 | |
| Denmark - 0.5% | |||
| NNIT A/S | 876,493 | 23,868,680 | |
| France - 8.0% | |||
| ALTEN | 378,200 | 23,385,127 | |
| Amundi SA | 671,200 | 30,888,328 | |
| AXA SA | 1,569,900 | 39,639,343 | |
| Capgemini SA | 349,800 | 32,655,903 | |
| Christian Dior SA | 137,297 | 24,108,449 | |
| Ipsen SA | 293,700 | 17,773,518 | |
| Publicis Groupe SA | 574,300 | 42,500,049 | |
| Sanofi SA (b) | 925,747 | 76,306,142 | |
| Sodexo SA | 326,500 | 32,970,610 | |
| Total SA | 1,618,300 | 81,790,152 | |
| Zodiac Aerospace | 694,311 | 16,278,051 | |
| TOTAL FRANCE | 418,295,672 | ||
| Germany - 7.8% | |||
| adidas AG | 422,700 | 54,499,823 | |
| Axel Springer Verlag AG | 559,800 | 31,255,111 | |
| Bayer AG | 720,997 | 83,176,945 | |
| CompuGroup Medical AG | 466,300 | 18,314,033 | |
| Continental AG | 143,000 | 31,405,744 | |
| Deutsche Post AG | 1,508,219 | 44,301,312 | |
| Fresenius SE & Co. KGaA | 777,800 | 56,572,175 | |
| mutares AG | 422,100 | 7,008,221 | |
| SAP AG | 822,193 | 64,510,124 | |
| Wirecard AG (b) | 389,600 | 16,825,094 | |
| TOTAL GERMANY | 407,868,582 | ||
| Hong Kong - 1.7% | |||
| AIA Group Ltd. | 9,619,800 | 57,570,713 | |
| Techtronic Industries Co. Ltd. | 7,906,000 | 29,636,984 | |
| TOTAL HONG KONG | 87,207,697 | ||
| Indonesia - 0.4% | |||
| PT Bank Rakyat Indonesia Tbk | 29,074,800 | 22,818,030 | |
| Ireland - 2.6% | |||
| Allergan PLC (a) | 95,900 | 20,768,104 | |
| DCC PLC (United Kingdom) | 307,600 | 27,236,654 | |
| Kerry Group PLC Class A | 424,964 | 37,891,934 | |
| Medtronic PLC | 407,400 | 32,245,710 | |
| United Drug PLC (United Kingdom) | 2,088,200 | 18,673,181 | |
| TOTAL IRELAND | 136,815,583 | ||
| Isle of Man - 0.4% | |||
| Playtech Ltd. | 1,856,301 | 21,820,729 | |
| Israel - 0.5% | |||
| Frutarom Industries Ltd. | 534,972 | 27,418,308 | |
| Italy - 2.2% | |||
| DiaSorin S.p.A. | 420,800 | 24,573,689 | |
| Mediaset SpA | 6,103,900 | 27,467,834 | |
| OVS (a) | 3,316,500 | 21,646,082 | |
| Recordati SpA | 933,500 | 23,718,984 | |
| Reply SpA | 113,362 | 16,134,781 | |
| TOTAL ITALY | 113,541,370 | ||
| Japan - 17.5% | |||
| Ai Holdings Corp. | 1,147,100 | 32,778,765 | |
| Arc Land Sakamoto Co. Ltd. | 1,049,000 | 10,891,921 | |
| Astellas Pharma, Inc. | 3,444,300 | 46,438,099 | |
| Bridgestone Corp. | 910,500 | 33,513,162 | |
| Broadleaf Co. Ltd. | 514,300 | 5,082,346 | |
| Casio Computer Co. Ltd. (b) | 1,205,900 | 22,944,570 | |
| Daito Trust Construction Co. Ltd. | 291,800 | 41,269,933 | |
| Dentsu, Inc. | 648,000 | 32,924,238 | |
| Fukuda Denshi Co. Ltd. | 147,200 | 8,037,089 | |
| GMO Internet, Inc. | 1,223,400 | 14,364,585 | |
| Hoya Corp. | 1,141,100 | 43,697,598 | |
| Iriso Electronics Co. Ltd. | 290,700 | 13,843,440 | |
| Japan Tobacco, Inc. | 1,212,000 | 49,519,822 | |
| KDDI Corp. | 1,687,600 | 48,612,556 | |
| Keyence Corp. | 58,490 | 35,058,498 | |
| Leopalace21 Corp. (a) | 1,802,900 | 10,818,353 | |
| Makita Corp. | 496,500 | 31,320,913 | |
| Miraca Holdings, Inc. | 492,300 | 20,921,341 | |
| Misumi Group, Inc. | 1,842,600 | 25,445,896 | |
| Nakanishi, Inc. (c) | 645,100 | 21,142,738 | |
| NGK Spark Plug Co. Ltd. | 1,207,900 | 24,089,598 | |
| Nippon Paint Holdings Co. Ltd. | 1,020,700 | 26,800,406 | |
| Nitori Holdings Co. Ltd. | 322,200 | 29,970,664 | |
| NOF Corp. (c) | 1,181,000 | 9,296,079 | |
| OBIC Co. Ltd. | 431,900 | 22,701,068 | |
| Olympus Corp. | 1,270,500 | 49,494,392 | |
| ORIX Corp. | 2,813,100 | 39,791,119 | |
| Shinsei Bank Ltd. | 16,258,000 | 22,786,830 | |
| Ship Healthcare Holdings, Inc. | 855,300 | 21,107,435 | |
| SoftBank Corp. | 441,600 | 23,745,053 | |
| Software Service, Inc. | 108,400 | 4,186,863 | |
| Sundrug Co. Ltd. | 410,900 | 29,196,833 | |
| The Suruga Bank Ltd. | 829,300 | 16,124,882 | |
| Tsuruha Holdings, Inc. | 336,600 | 32,285,203 | |
| VT Holdings Co. Ltd. | 3,332,400 | 16,837,525 | |
| TOTAL JAPAN | 917,039,813 | ||
| Luxembourg - 0.4% | |||
| Eurofins Scientific SA | 52,259 | 19,390,882 | |
| Netherlands - 2.7% | |||
| Arcadis NV (b) | 772,600 | 13,230,174 | |
| IMCD Group BV | 1,012,578 | 40,882,293 | |
| ING Groep NV (Certificaten Van Aandelen) | 4,140,500 | 50,705,845 | |
| Koninklijke Philips Electronics NV | 1,297,500 | 35,653,445 | |
| TOTAL NETHERLANDS | 140,471,757 | ||
| New Zealand - 0.8% | |||
| EBOS Group Ltd. | 2,276,701 | 25,371,715 | |
| Trade Maine Group Ltd. | 5,178,779 | 16,489,336 | |
| TOTAL NEW ZEALAND | 41,861,051 | ||
| Panama - 0.3% | |||
| Copa Holdings SA Class A | 241,400 | 15,389,250 | |
| Portugal - 0.6% | |||
| NOS SGPS SA | 4,289,900 | 30,774,620 | |
| Spain - 1.4% | |||
| Amadeus IT Holding SA Class A | 1,135,500 | 51,670,118 | |
| Grifols SA ADR | 1,331,600 | 20,932,752 | |
| TOTAL SPAIN | 72,602,870 | ||
| Sweden - 4.1% | |||
| Addlife AB (a) | 42,593 | 538,350 | |
| Alfa Laval AB (b) | 1,157,800 | 18,252,711 | |
| HEXPOL AB (B Shares) (b) | 2,850,100 | 29,457,664 | |
| Nordea Bank AB | 4,984,800 | 48,386,474 | |
| Svenska Cellulosa AB (SCA) (B Shares) | 1,605,900 | 50,574,016 | |
| Svenska Handelsbanken AB (A Shares) | 2,201,800 | 29,372,348 | |
| Swedbank AB (A Shares) | 1,842,800 | 39,745,339 | |
| TOTAL SWEDEN | 216,326,902 | ||
| Switzerland - 7.9% | |||
| Credit Suisse Group AG | 2,714,777 | 41,314,733 | |
| Julius Baer Group Ltd. | 732,530 | 31,393,138 | |
| Nestle SA | 1,543,139 | 115,179,409 | |
| Novartis AG | 1,275,417 | 97,062,119 | |
| Sika AG | 8,220 | 34,986,198 | |
| Syngenta AG (Switzerland) | 88,162 | 35,290,533 | |
| UBS Group AG | 3,469,516 | 60,037,492 | |
| TOTAL SWITZERLAND | 415,263,622 | ||
| Taiwan - 0.4% | |||
| Taiwan Semiconductor Manufacturing Co. Ltd. | 4,310,000 | 19,771,084 | |
| United Kingdom - 22.0% | |||
| Aberdeen Asset Management PLC | 2,892,700 | 12,625,059 | |
| Aon PLC | 226,200 | 23,778,144 | |
| Ashmore Group PLC (b) | 5,032,900 | 22,583,587 | |
| British American Tobacco PLC (United Kingdom) | 814,400 | 49,655,669 | |
| BT Group PLC | 8,518,600 | 55,218,171 | |
| Capita Group PLC | 1,914,900 | 28,007,541 | |
| Cineworld Group PLC | 3,627,900 | 27,458,694 | |
| Close Brothers Group PLC | 1,386,800 | 24,559,033 | |
| Compass Group PLC | 1,932,000 | 34,405,807 | |
| Dechra Pharmaceuticals PLC | 474,295 | 7,664,759 | |
| Diageo PLC | 1,781,860 | 48,174,534 | |
| Diploma PLC | 2,053,503 | 21,948,481 | |
| Elementis PLC | 5,004,700 | 15,787,941 | |
| Essentra PLC | 2,771,843 | 32,886,637 | |
| Exova Group Ltd. PLC | 8,056,935 | 18,835,825 | |
| Hikma Pharmaceuticals PLC | 589,972 | 18,999,308 | |
| Hilton Food Group PLC | 1,138,579 | 9,366,263 | |
| Howden Joinery Group PLC | 4,019,500 | 29,013,077 | |
| IMI PLC | 1,164,999 | 15,915,928 | |
| Intertek Group PLC | 475,000 | 22,605,086 | |
| ITV PLC | 10,239,000 | 33,691,530 | |
| James Fisher and Sons PLC | 945,156 | 19,541,358 | |
| Jardine Lloyd Thompson Group PLC | 1,387,474 | 17,576,757 | |
| John Wood Group PLC | 1,765,596 | 16,110,855 | |
| London Stock Exchange Group PLC | 747,345 | 29,625,503 | |
| Melrose Industries PLC | 965,385 | 5,265,666 | |
| Micro Focus International PLC | 1,261,900 | 28,192,087 | |
| Next PLC | 241,400 | 17,935,894 | |
| Prudential PLC | 2,745,192 | 54,188,811 | |
| Reckitt Benckiser Group PLC | 548,300 | 53,414,780 | |
| Rio Tinto PLC | 1,347,700 | 45,210,344 | |
| Rolls-Royce Group PLC | 1,834,566 | 17,946,457 | |
| Rotork PLC | 3,702,547 | 10,116,656 | |
| SABMiller PLC | 536,700 | 32,818,737 | |
| Schroders PLC | 986,900 | 36,252,105 | |
| Senior Engineering Group PLC | 4,960,700 | 15,772,359 | |
| Shawbrook Group PLC | 4,800,286 | 20,101,946 | |
| Sinclair Pharma PLC (a) | 10,370,587 | 5,455,074 | |
| Softcat PLC | 4,743,200 | 22,108,380 | |
| Spectris PLC | 724,800 | 19,285,146 | |
| Spirax-Sarco Engineering PLC | 399,510 | 19,934,859 | |
| St. James's Place Capital PLC | 3,594,305 | 45,533,269 | |
| The Restaurant Group PLC | 2,659,400 | 10,689,787 | |
| Vodafone Group PLC | 7,625,732 | 24,568,872 | |
| Whitbread PLC | 544,300 | 30,794,169 | |
| TOTAL UNITED KINGDOM | 1,151,620,945 | ||
| United States of America - 5.7% | |||
| Alphabet, Inc. Class C | 51,593 | 35,754,465 | |
| Cognizant Technology Solutions Corp. Class A (a) | 550,500 | 32,132,685 | |
| Fidelity National Information Services, Inc. | 453,700 | 29,853,460 | |
| McGraw Hill Financial, Inc. | 485,300 | 51,854,305 | |
| McKesson Corp. | 153,117 | 25,696,095 | |
| Moody's Corp. | 215,500 | 20,627,660 | |
| MSCI, Inc. Class A | 553,200 | 42,010,008 | |
| PPG Industries, Inc. | 296,600 | 32,741,674 | |
| Verisk Analytics, Inc. (a) | 375,600 | 29,139,048 | |
| TOTAL UNITED STATES OF AMERICA | 299,809,400 | ||
| TOTAL COMMON STOCKS | |||
| (Cost $4,712,053,578) | 5,053,093,566 | ||
| Nonconvertible Preferred Stocks - 1.0% | |||
| Germany - 1.0% | |||
| Henkel AG & Co. KGaA | 460,400 | 52,549,404 | |
| United Kingdom - 0.0% | |||
| Rolls-Royce Group PLC | 130,254,186 | 190,321 | |
| Rolls-Royce Group PLC (C Shares) (a) | 170,064,268 | 248,489 | |
| TOTAL UNITED KINGDOM | 438,810 | ||
| TOTAL NONCONVERTIBLE PREFERRED STOCKS | |||
| (Cost $44,266,796) | 52,988,214 | ||
| Money Market Funds - 5.8% | |||
| Fidelity Cash Central Fund, 0.38% (d) | 117,556,732 | 117,556,732 | |
| Fidelity Securities Lending Cash Central Fund, 0.42% (d)(e) | 182,936,671 | 182,936,671 | |
| TOTAL MONEY MARKET FUNDS | |||
| (Cost $300,493,403) | 300,493,403 | ||
| TOTAL INVESTMENT PORTFOLIO - 103.4% | |||
| (Cost $5,056,813,777) | 5,406,575,183 | ||
| NET OTHER ASSETS (LIABILITIES) - (3.4)% | (177,557,639) | ||
| NET ASSETS - 100% | $5,229,017,544 |
Categorizations in the Schedule of Investments are based on country or territory of incorporation.
Legend
(a) Non-income producing
(b) Security or a portion of the security is on loan at period end.
(c) Security or a portion of the security purchased on a delayed delivery or when-issued basis.
(d) Affiliated fund that is generally available only to investment companies and other accounts managed by Fidelity Investments. The rate quoted is the annualized seven-day yield of the fund at period end. A complete unaudited listing of the fund's holdings as of its most recent quarter end is available upon request. In addition, each Fidelity Central Fund's financial statements are available on the SEC's website or upon request.
(e) Investment made with cash collateral received from securities on loan.
Affiliated Central Funds
Information regarding fiscal year to date income earned by the Fund from investments in Fidelity Central Funds is as follows:
| Fund | Income earned |
| Fidelity Cash Central Fund | $212,653 |
| Fidelity Securities Lending Cash Central Fund | 1,917,406 |
| Total | $2,130,059 |
Investment Valuation
The following is a summary of the inputs used, as of April 30, 2016, involving the Fund's assets and liabilities carried at fair value. The inputs or methodology used for valuing securities may not be an indication of the risk associated with investing in those securities. For more information on valuation inputs, and their aggregation into the levels used below, please refer to the Investment Valuation section in the accompanying Notes to Financial Statements.
| Valuation Inputs at Reporting Date: | ||||
| Description | Total | Level 1 | Level 2 | Level 3 |
| Investments in Securities: | ||||
| Equities: | ||||
| Consumer Discretionary | $780,460,410 | $442,204,110 | $338,256,300 | $-- |
| Consumer Staples | 630,192,396 | 252,766,146 | 377,426,250 | -- |
| Energy | 117,442,365 | 35,652,213 | 81,790,152 | -- |
| Financials | 1,112,027,067 | 701,131,073 | 410,895,994 | -- |
| Health Care | 841,852,738 | 453,458,922 | 388,393,816 | -- |
| Industrials | 552,845,752 | 383,878,430 | 168,967,322 | -- |
| Information Technology | 582,910,248 | 374,800,338 | 208,109,910 | -- |
| Materials | 336,206,152 | 254,899,323 | 81,306,829 | -- |
| Telecommunication Services | 152,144,652 | -- | 152,144,652 | -- |
| Money Market Funds | 300,493,403 | 300,493,403 | -- | -- |
| Total Investments in Securities: | $5,406,575,183 | $3,199,283,958 | $2,207,291,225 | $-- |
The following is a summary of transfers between Level 1 and Level 2 for the period ended April 30, 2016. Transfers are assumed to have occurred at the beginning of the period, and are primarily attributable to the valuation techniques used for foreign equity securities, as discussed in the accompanying Notes to Financial Statements:
| Transfers | Total |
| Level 1 to Level 2 | $23,308,879 |
| Level 2 to Level 1 | $328,385,769 |
See accompanying notes which are an integral part of the financial statements.
Financial Statements
Statement of Assets and Liabilities
| April 30, 2016 (Unaudited) | ||
| Assets | ||
| Investment in securities, at value (including securities loaned of $170,331,062) — See accompanying schedule: Unaffiliated issuers (cost $4,756,320,374) | $5,106,081,780 | |
| Fidelity Central Funds (cost $300,493,403) | 300,493,403 | |
| Total Investments (cost $5,056,813,777) | $5,406,575,183 | |
| Cash | 41,952 | |
| Foreign currency held at value (cost $1,154) | 2,229 | |
| Receivable for investments sold | ||
| Regular delivery | 8,642,354 | |
| Delayed delivery | 403,612 | |
| Receivable for fund shares sold | 8,438,111 | |
| Dividends receivable | 29,088,821 | |
| Distributions receivable from Fidelity Central Funds | 590,022 | |
| Prepaid expenses | 2,567 | |
| Other receivables | 276,286 | |
| Total assets | 5,454,061,137 | |
| Liabilities | ||
| Payable for investments purchased | ||
| Regular delivery | $16,585,383 | |
| Delayed delivery | 1,080,140 | |
| Payable for fund shares redeemed | 19,794,003 | |
| Accrued management fee | 3,485,251 | |
| Other affiliated payables | 787,010 | |
| Other payables and accrued expenses | 375,135 | |
| Collateral on securities loaned, at value | 182,936,671 | |
| Total liabilities | 225,043,593 | |
| Net Assets | $5,229,017,544 | |
| Net Assets consist of: | ||
| Paid in capital | $6,080,442,578 | |
| Undistributed net investment income | 57,390,251 | |
| Accumulated undistributed net realized gain (loss) on investments and foreign currency transactions | (1,259,003,036) | |
| Net unrealized appreciation (depreciation) on investments and assets and liabilities in foreign currencies | 350,187,751 | |
| Net Assets | $5,229,017,544 | |
| Overseas: | ||
| Net Asset Value, offering price and redemption price per share ($4,494,719,160 ÷ 110,726,753 shares) | $40.59 | |
| Class K: | ||
| Net Asset Value, offering price and redemption price per share ($734,298,384 ÷ 18,127,284 shares) | $40.51 |
See accompanying notes which are an integral part of the financial statements.
Statement of Operations
| Six months ended April 30, 2016 (Unaudited) | ||
| Investment Income | ||
| Dividends | $65,804,086 | |
| Special dividends | 22,808,863 | |
| Income from Fidelity Central Funds | 2,130,059 | |
| Income before foreign taxes withheld | 90,743,008 | |
| Less foreign taxes withheld | (5,835,176) | |
| Total income | 84,907,832 | |
| Expenses | ||
| Management fee | ||
| Basic fee | $16,234,438 | |
| Performance adjustment | 3,314,418 | |
| Transfer agent fees | 3,786,434 | |
| Accounting and security lending fees | 788,465 | |
| Custodian fees and expenses | 229,672 | |
| Independent trustees' compensation | 10,280 | |
| Appreciation in deferred trustee compensation account | 64 | |
| Registration fees | 117,068 | |
| Audit | 47,586 | |
| Legal | 15,236 | |
| Miscellaneous | 13,969 | |
| Total expenses before reductions | 24,557,630 | |
| Expense reductions | (42,177) | 24,515,453 |
| Net investment income (loss) | 60,392,379 | |
| Realized and Unrealized Gain (Loss) | ||
| Net realized gain (loss) on: | ||
| Investment securities: | ||
| Unaffiliated issuers | (17,439,922) | |
| Foreign currency transactions | 1,968,001 | |
| Total net realized gain (loss) | (15,471,921) | |
| Change in net unrealized appreciation (depreciation) on: Investment securities | (86,717,449) | |
| Assets and liabilities in foreign currencies | (217,135) | |
| Total change in net unrealized appreciation (depreciation) | (86,934,584) | |
| Net gain (loss) | (102,406,505) | |
| Net increase (decrease) in net assets resulting from operations | $(42,014,126) |
See accompanying notes which are an integral part of the financial statements.
Statement of Changes in Net Assets
| Six months ended April 30, 2016 (Unaudited) | Year ended October 31, 2015 | |
| Increase (Decrease) in Net Assets | ||
| Operations | ||
| Net investment income (loss) | $60,392,379 | $50,015,823 |
| Net realized gain (loss) | (15,471,921) | 123,820,228 |
| Change in net unrealized appreciation (depreciation) | (86,934,584) | 99,378,276 |
| Net increase (decrease) in net assets resulting from operations | (42,014,126) | 273,214,327 |
| Distributions to shareholders from net investment income | (49,659,846) | (58,590,311) |
| Distributions to shareholders from net realized gain | (685,981) | – |
| Total distributions | (50,345,827) | (58,590,311) |
| Share transactions - net increase (decrease) | 785,462,967 | 955,711,893 |
| Redemption fees | 39,729 | 55,180 |
| Total increase (decrease) in net assets | 693,142,743 | 1,170,391,089 |
| Net Assets | ||
| Beginning of period | 4,535,874,801 | 3,365,483,712 |
| End of period (including undistributed net investment income of $57,390,251 and undistributed net investment income of $46,657,718, respectively) | $5,229,017,544 | $4,535,874,801 |
See accompanying notes which are an integral part of the financial statements.
Financial Highlights — Fidelity Overseas Fund
| Six months ended (Unaudited) April 30, | Years ended October 31, | |||||
| 2016 | 2015 | 2014 | 2013 | 2012 | 2011 | |
| Selected Per–Share Data | ||||||
| Net asset value, beginning of period | $41.56 | $39.02 | $39.22 | $31.35 | $29.28 | $31.56 |
| Income from Investment Operations | ||||||
| Net investment income (loss)A | .49B | .52 | .77C | .54 | .73 | .47 |
| Net realized and unrealized gain (loss) | (1.03) | 2.69 | (.28) | 8.10 | 2.19 | (2.27) |
| Total from investment operations | (.54) | 3.21 | .49 | 8.64 | 2.92 | (1.80) |
| Distributions from net investment income | (.43) | (.67) | (.51) | (.77) | (.83) | (.48) |
| Distributions from net realized gain | (.01) | – | (.18) | – | (.02) | – |
| Total distributions | (.43)D | (.67) | (.69) | (.77) | (.85) | (.48) |
| Redemption fees added to paid in capitalA,E | – | – | – | – | – | – |
| Net asset value, end of period | $40.59 | $41.56 | $39.02 | $39.22 | $31.35 | $29.28 |
| Total ReturnF,G | (1.31)% | 8.34% | 1.27% | 28.17% | 10.37% | (5.83)% |
| Ratios to Average Net AssetsH,I | ||||||
| Expenses before reductions | 1.04%J | 1.04% | 1.04% | 1.09% | .69% | .73% |
| Expenses net of fee waivers, if any | 1.04%J | 1.04% | 1.04% | 1.09% | .69% | .73% |
| Expenses net of all reductions | 1.03%J | 1.03% | 1.04% | 1.06% | .67% | .67% |
| Net investment income (loss) | 2.48%B,J | 1.28% | 1.93%C | 1.54% | 2.52% | 1.44% |
| Supplemental Data | ||||||
| Net assets, end of period (000 omitted) | $4,494,719 | $3,844,290 | $2,738,667 | $1,874,922 | $1,639,725 | $2,215,717 |
| Portfolio turnover rateK | 31%J | 28% | 41% | 42% | 90% | 77% |
A Calculated based on average shares outstanding during the period.
B Net Investment income per share reflects a large, non-recurring dividend which amounted to $.19 per share. Excluding this non-recurring dividend, the ratio of net investment income (loss) to average net assets would have been 1.54%.
C Net Investment income per share reflects a large, non-recurring dividend which amounted to $.24 per share. Excluding this non-recurring dividend, the ratio of net investment income (loss) to average net assets would have been 1.34%.
D Total distributions of $.43 per share is comprised of distributions from net investment income of $.428 and distributions from net realized gain of $.006 per share.
E Amount represents less than $.005 per share.
F Total returns for periods of less than one year are not annualized.
G Total returns would have been lower if certain expenses had not been reduced during the applicable periods shown.
H Fees and expenses of any underlying Fidelity Central Funds are not included in the Fund's expense ratio. The Fund indirectly bears its proportionate share of the expenses of any underlying Fidelity Central Funds.
I Expense ratios reflect operating expenses of the class. Expenses before reductions do not reflect amounts reimbursed by the investment adviser or reductions from brokerage service arrangements or reductions from other expense offset arrangements and do not represent the amount paid by the class during periods when reimbursements or reductions occur. Expenses net of fee waivers reflect expenses after reimbursement by the investment adviser but prior to reductions from brokerage service arrangements or other expense offset arrangements. Expenses net of all reductions represent the net expenses paid by the class.
J Annualized
K Amount does not include the portfolio activity of any underlying Fidelity Central Funds.
See accompanying notes which are an integral part of the financial statements.
Financial Highlights — Fidelity Overseas Fund Class K
| Six months ended (Unaudited) April 30, | Years ended October 31, | |||||
| 2016 | 2015 | 2014 | 2013 | 2012 | 2011 | |
| Selected Per–Share Data | ||||||
| Net asset value, beginning of period | $41.49 | $38.96 | $39.17 | $31.32 | $29.29 | $31.59 |
| Income from Investment Operations | ||||||
| Net investment income (loss)A | .51B | .57 | .82C | .60 | .79 | .52 |
| Net realized and unrealized gain (loss) | (1.01) | 2.68 | (.28) | 8.08 | 2.18 | (2.27) |
| Total from investment operations | (.50) | 3.25 | .54 | 8.68 | 2.97 | (1.75) |
| Distributions from net investment income | (.47) | (.72) | (.58) | (.83) | (.92) | (.55) |
| Distributions from net realized gain | (.01) | – | (.18) | – | (.02) | – |
| Total distributions | (.48) | (.72) | (.75)D | (.83) | (.94) | (.55) |
| Redemption fees added to paid in capitalA,E | – | – | – | – | – | – |
| Net asset value, end of period | $40.51 | $41.49 | $38.96 | $39.17 | $31.32 | $29.29 |
| Total ReturnF,G | (1.24)% | 8.47% | 1.41% | 28.37% | 10.59% | (5.67)% |
| Ratios to Average Net AssetsH,I | ||||||
| Expenses before reductions | .91%J | .91% | .90% | .93% | .51% | .56% |
| Expenses net of fee waivers, if any | .91%J | .91% | .90% | .92% | .51% | .55% |
| Expenses net of all reductions | .91%J | .90% | .90% | .90% | .48% | .50% |
| Net investment income (loss) | 2.61%B,J | 1.40% | 2.06%C | 1.71% | 2.70% | 1.61% |
| Supplemental Data | ||||||
| Net assets, end of period (000 omitted) | $734,298 | $691,585 | $626,817 | $562,490 | $265,484 | $291,323 |
| Portfolio turnover rateK | 31%J | 28% | 41% | 42% | 90% | 77% |
A Calculated based on average shares outstanding during the period.
B Net Investment income per share reflects a large, non-recurring dividend which amounted to $.19 per share. Excluding this non-recurring dividend, the ratio of net investment income (loss) to average net assets would have been 1.67%.
C Net Investment income per share reflects a large, non-recurring dividend which amounted to $.24 per share. Excluding this non-recurring dividend, the ratio of net investment income (loss) to average net assets would have been 1.47%.
D Total distributions of $.75 per share is comprised of distributions from net investment income of $.575 and distributions from net realized gain of $.177 per share.
E Amount represents less than $.005 per share.
F Total returns for periods of less than one year are not annualized.
G Total returns would have been lower if certain expenses had not been reduced during the applicable periods shown.
H Fees and expenses of any underlying Fidelity Central Funds are not included in the Fund's expense ratio. The Fund indirectly bears its proportionate share of the expenses of any underlying Fidelity Central Funds.
I Expense ratios reflect operating expenses of the class. Expenses before reductions do not reflect amounts reimbursed by the investment adviser or reductions from brokerage service arrangements or reductions from other expense offset arrangements and do not represent the amount paid by the class during periods when reimbursements or reductions occur. Expenses net of fee waivers reflect expenses after reimbursement by the investment adviser but prior to reductions from brokerage service arrangements or other expense offset arrangements. Expenses net of all reductions represent the net expenses paid by the class.
J Annualized
K Amount does not include the portfolio activity of any underlying Fidelity Central Funds.
See accompanying notes which are an integral part of the financial statements.
Notes to Financial Statements (Unaudited)
For the period ended April 30, 2016
1. Organization.
Fidelity Overseas Fund (the Fund) is a fund of Fidelity Investment Trust (the Trust) and is authorized to issue an unlimited number of shares. The Trust is registered under the Investment Company Act of 1940, as amended (the 1940 Act), as an open-end management investment company organized as a Massachusetts business trust. The Fund offers Overseas and Class K shares, each of which has equal rights as to assets and voting privileges. Each class has exclusive voting rights with respect to matters that affect that class.
2. Investments in Fidelity Central Funds.
The Fund invests in Fidelity Central Funds, which are open-end investment companies generally available only to other investment companies and accounts managed by the investment adviser and its affiliates. The Fund's Schedule of Investments lists each of the Fidelity Central Funds held as of period end, if any, as an investment of the Fund, but does not include the underlying holdings of each Fidelity Central Fund. As an Investing Fund, the Fund indirectly bears its proportionate share of the expenses of the underlying Fidelity Central Funds.
The Money Market Central Funds seek preservation of capital and current income and are managed by Fidelity Investments Money Management, Inc. (FIMM), an affiliate of the investment adviser. Annualized expenses of the Money Market Central Funds as of their most recent shareholder report date are less than .005%.
A complete unaudited list of holdings for each Fidelity Central Fund is available upon request or at the Securities and Exchange Commission (the SEC) website at www.sec.gov. In addition, the financial statements of the Fidelity Central Funds are available on the SEC website or upon request.
3. Significant Accounting Policies.
The financial statements have been prepared in conformity with accounting principles generally accepted in the United States of America (GAAP), which require management to make certain estimates and assumptions at the date of the financial statements. Actual results could differ from those estimates. Subsequent events, if any, through the date that the financial statements were issued have been evaluated in the preparation of the financial statements. The following summarizes the significant accounting policies of the Fund:
Investment Valuation. Investments are valued as of 4:00 p.m. Eastern time on the last calendar day of the period. The Board of Trustees (the Board) has delegated the day to day responsibility for the valuation of the Fund's investments to the Fidelity Management & Research Company (FMR) Fair Value Committee (the Committee). In accordance with valuation policies and procedures approved by the Board, the Fund attempts to obtain prices from one or more third party pricing vendors or brokers to value its investments. When current market prices, quotations or currency exchange rates are not readily available or reliable, investments will be fair valued in good faith by the Committee, in accordance with procedures adopted by the Board. Factors used in determining fair value vary by investment type and may include market or investment specific events. The frequency with which these procedures are used cannot be predicted and they may be utilized to a significant extent. The Committee oversees the Fund's valuation policies and procedures and reports to the Board on the Committee's activities and fair value determinations. The Board monitors the appropriateness of the procedures used in valuing the Fund's investments and ratifies the fair value determinations of the Committee.
The Fund categorizes the inputs to valuation techniques used to value its investments into a disclosure hierarchy consisting of three levels as shown below:
- Level 1 – quoted prices in active markets for identical investments
- Level 2 – other significant observable inputs (including quoted prices for similar investments, interest rates, prepayment speeds, etc.)
- Level 3 – unobservable inputs (including the Fund's own assumptions based on the best information available)
Valuation techniques used to value the Fund's investments by major category are as follows:
Equity securities, including restricted securities, for which market quotations are readily available, are valued at the last reported sale price or official closing price as reported by a third party pricing vendor on the primary market or exchange on which they are traded and are categorized as Level 1 in the hierarchy. In the event there were no sales during the day or closing prices are not available, securities are valued at the last quoted bid price or may be valued using the last available price and are generally categorized as Level 2 in the hierarchy. For foreign equity securities, when market or security specific events arise, comparisons to the valuation of American Depositary Receipts (ADRs), futures contracts, Exchange-Traded Funds (ETFs) and certain indexes as well as quoted prices for similar securities may be used and would be categorized as Level 2 in the hierarchy. Utilizing these techniques may result in transfers between Level 1 and Level 2. For equity securities, including restricted securities, where observable inputs are limited, assumptions about market activity and risk are used and these securities may be categorized as Level 3 in the hierarchy.
Investments in open-end mutual funds, including the Fidelity Central Funds, are valued at their closing net asset value (NAV) each business day and are categorized as Level 1 in the hierarchy.
Changes in valuation techniques may result in transfers in or out of an assigned level within the disclosure hierarchy. The aggregate value of investments by input level as of April 30, 2016, including information on transfers between Levels 1 and 2 is included at the end of the Fund's Schedule of Investments.
Foreign Currency. The Fund may use foreign currency contracts to facilitate transactions in foreign-denominated securities. Gains and losses from these transactions may arise from changes in the value of the foreign currency or if the counterparties do not perform under the contracts' terms.
Foreign-denominated assets, including investment securities, and liabilities are translated into U.S. dollars at the exchange rates at period end. Purchases and sales of investment securities, income and dividends received and expenses denominated in foreign currencies are translated into U.S. dollars at the exchange rate in effect on the transaction date.
The effects of exchange rate fluctuations on investments are included with the net realized and unrealized gain (loss) on investment securities. Other foreign currency transactions resulting in realized and unrealized gain (loss) are disclosed separately.
Investment Transactions and Income. For financial reporting purposes, the Fund's investment holdings and NAV include trades executed through the end of the last business day of the period. The NAV per share for processing shareholder transactions is calculated as of the close of business of the New York Stock Exchange (NYSE), normally 4:00 p.m. Eastern time and includes trades executed through the end of the prior business day. Gains and losses on securities sold are determined on the basis of identified cost and may include proceeds received from litigation. Dividend income is recorded on the ex-dividend date, except for certain dividends from foreign securities where the ex-dividend date may have passed, which are recorded as soon as the Fund is informed of the ex-dividend date. Non-cash dividends included in dividend income, if any, are recorded at the fair market value of the securities received. Income and capital gain distributions from Fidelity Central Funds, if any, are recorded on the ex-dividend date. Distributions received on securities that represent a return of capital or capital gain are recorded as a reduction of cost of investments and/or as a realized gain. Subsequent to ex-dividend date the Fund determines the components of these distributions, based upon receipt of tax filings or other correspondence relating to the underlying investment. Large, non-recurring dividends recognized by the Fund are presented separately on the Statement of Operations as "Special Dividends" and the impact of these dividends is presented in the Financial Highlights. Investment income is recorded net of foreign taxes withheld where recovery of such taxes is uncertain.
Class Allocations and Expenses. Investment income, realized and unrealized capital gains and losses, common expenses of the Fund, and certain fund-level expense reductions, if any, are allocated daily on a pro-rata basis to each class based on the relative net assets of each class to the total net assets of the Fund. Each class differs with respect to transfer agent fees incurred. Certain expense reductions may also differ by class. For the reporting period, the allocated portion of income and expenses to each class as a percent of its average net assets may vary due to the timing of recording these transactions in relation to fluctuating net assets of the classes. Expenses directly attributable to a fund are charged to that fund. Expenses attributable to more than one fund are allocated among the respective funds on the basis of relative net assets or other appropriate methods. Expense estimates are accrued in the period to which they relate and adjustments are made when actual amounts are known.
Deferred Trustee Compensation. Under a Deferred Compensation Plan (the Plan), independent Trustees may elect to defer receipt of a portion of their annual compensation. Deferred amounts are invested in a cross-section of Fidelity funds, are marked-to-market and remain in the Fund until distributed in accordance with the Plan. The investment of deferred amounts and the offsetting payable to the Trustees are included in the accompanying Statement of Assets and Liabilities.
Income Tax Information and Distributions to Shareholders. Each year, the Fund intends to qualify as a regulated investment company under Subchapter M of the Internal Revenue Code, including distributing substantially all of its taxable income and realized gains. As a result, no provision for U.S. Federal income taxes is required. The Fund files a U.S. federal tax return, in addition to state and local tax returns as required. The Fund's federal income tax returns are subject to examination by the Internal Revenue Service (IRS) for a period of three fiscal years after they are filed. State and local tax returns may be subject to examination for an additional fiscal year depending on the jurisdiction. Foreign taxes are provided for based on the Fund's understanding of the tax rules and rates that exist in the foreign markets in which it invests.
Distributions are declared and recorded on the ex-dividend date. Income dividends and capital gain distributions are declared separately for each class. Income and capital gain distributions are determined in accordance with income tax regulations, which may differ from GAAP.
Capital accounts within the financial statements are adjusted for permanent book-tax differences. These adjustments have no impact on net assets or the results of operations. Capital accounts are not adjusted for temporary book-tax differences which will reverse in a subsequent period.
Book-tax differences are primarily due to foreign currency transactions, passive foreign investment companies (PFIC), deferred trustees compensation, capital loss carryforwards and losses deferred due to wash sales.
The federal tax cost of investment securities and unrealized appreciation (depreciation) as of period end were as follows:
| Gross unrealized appreciation | $668,130,456 |
| Gross unrealized depreciation | (318,887,140) |
| Net unrealized appreciation (depreciation) on securities | $349,243,316 |
| Tax cost | $5,057,331,867 |
Capital loss carryforwards are only available to offset future capital gains of the Fund to the extent provided by regulations and may be limited. Under the Regulated Investment Company Modernization Act of 2010 (the Act), the Fund is permitted to carry forward capital losses incurred in taxable years beginning after December 22, 2010 for an unlimited period and such capital losses are required to be used prior to any losses that expire. The capital loss carryforward information presented below, including any applicable limitation, is estimated as of prior fiscal period end and is subject to adjustment.
| Fiscal year of expiration | |
| 2016 | $(293,353,140) |
| 2017 | (939,719,765) |
| Total capital loss carryforward | $(1,233,072,905) |
Short-Term Trading (Redemption) Fees. Shares held by investors in the Fund less than 30 days may have been subject to a redemption fee equal to 1.00% of the NAV of shares redeemed. All redemption fees, which reduce the proceeds of the shareholder redemption, are retained by the Fund and accounted for as an addition to paid in capital.
Delayed Delivery Transactions and When-Issued Securities. During the period, the Fund transacted in securities on a delayed delivery or when-issued basis. Payment and delivery may take place after the customary settlement period for that security. The price of the underlying securities and the date when the securities will be delivered and paid for are fixed at the time the transaction is negotiated. The securities purchased on a delayed delivery or when-issued basis are identified as such in the Fund's Schedule of Investments. With respect to purchase commitments, the Fund identifies securities as segregated in its records with a value at least equal to the amount of the commitment. Losses may arise due to changes in the value of the underlying securities or if the counterparty does not perform under the contract's terms, or if the issuer does not issue the securities due to political, economic, or other factors.
4. Purchases and Sales of Investments.
Purchases and sales of securities, other than short-term securities, aggregated $1,493,569,715 and $739,215,640, respectively.
5. Fees and Other Transactions with Affiliates.
Management Fee. Fidelity Management & Research Company (the investment adviser) and its affiliates provide the Fund with investment management related services for which the Fund pays a monthly management fee. The management fee is the sum of an individual fund fee rate that is based on an annual rate of .424% of the Fund's average net assets and an annualized group fee rate that averaged .25% during the period. The group fee rate is based upon the average net assets of all the mutual funds advised by the investment adviser, including any mutual funds previously advised by the investment adviser that are currently advised by Fidelity SelectCo, LLC, an affiliate of the investment adviser. The group fee rate decreases as assets under management increase and increases as assets under management decrease. In addition, the management fee is subject to a performance adjustment (up to a maximum of +/- .20% of the Fund's average net assets over a 36 month performance period). The upward or downward adjustment to the management fee is based on the relative investment performance of Overseas as compared to its benchmark index, the MSCI EAFE Index, over the same 36 month performance period. For the reporting period, the total annualized management fee rate, including the performance adjustment, was .81% of the Fund's average net assets. The performance adjustment included in the management fee rate may be higher or lower than the maximum performance adjustment rate due to the difference between the average net assets for the reporting and performance periods.
Transfer Agent Fees. Fidelity Investments Institutional Operations Company, Inc. (FIIOC), an affiliate of the investment adviser, is the transfer, dividend disbursing and shareholder servicing agent for each class of the Fund. FIIOC receives account fees and asset-based fees that vary according to the account size and type of account of the shareholders of Overseas. FIIOC receives an asset-based fee of Class K's average net assets. FIIOC pays for typesetting, printing and mailing of shareholder reports, except proxy statements.
For the period, transfer agent fees for each class were as follows:
| Amount | % of Class-Level Average Net Assets(a) | |
| Overseas | $3,622,377 | .18 |
| Class K | 164,057 | .05 |
| $3,786,434 |
(a) Annualized
Accounting and Security Lending Fees. Fidelity Service Company, Inc. (FSC), an affiliate of the investment adviser, maintains the Fund's accounting records. The accounting fee is based on the level of average net assets for each month. Under a separate contract, FSC administers the security lending program. The security lending fee is based on the number and duration of lending transactions.
Brokerage Commissions. The Fund placed a portion of its portfolio transactions with brokerage firms which are affiliates of the investment adviser. Brokerage commissions are included in net realized gain (loss) and change in net unrealized appreciation (depreciation) in the Statement of Operations. The commissions paid to these affiliated firms were $3,175 for the period.
Interfund Trades. The Fund may purchase from or sell securities to other Fidelity Funds under procedures adopted by the Board. The procedures have been designed to ensure these interfund trades are executed in accordance with Rule 17a-7 of the 1940 Act. Interfund trades are included within the respective purchases and sales amounts shown in the Purchases and Sales of Investments note.
6. Committed Line of Credit.
The Fund participates with other funds managed by the investment adviser or an affiliate in a $4.25 billion credit facility (the "line of credit") to be utilized for temporary or emergency purposes to fund shareholder redemptions or for other short-term liquidity purposes. The Fund has agreed to pay commitment fees on its pro-rata portion of the line of credit, which amounted to $4,184 and is reflected in Miscellaneous expenses on the Statement of Operations. During the period, the Fund did not borrow on this line of credit.
7. Security Lending.
The Fund lends portfolio securities through a lending agent from time to time in order to earn additional income. For equity securities, a lending agent is used and may loan securities to certain qualified borrowers, including Fidelity Capital Markets (FCM), a broker-dealer affiliated with the Fund. On the settlement date of the loan, the Fund receives collateral (in the form of U.S. Treasury obligations, letters of credit and/or cash) against the loaned securities and maintains collateral in an amount not less than 100% of the market value of the loaned securities during the period of the loan. The market value of the loaned securities is determined at the close of business of the Fund and any additional required collateral is delivered to the Fund on the next business day. The Fund or borrower may terminate the loan at any time, and if the borrower defaults on its obligation to return the securities loaned because of insolvency or other reasons, the Fund may apply collateral received from the borrower against the obligation. The Fund may experience delays and costs in recovering the securities loaned. Any cash collateral received is invested in the Fidelity Securities Lending Cash Central Fund. The value of loaned securities and cash collateral at period end are disclosed on the Fund's Statement of Assets and Liabilities. Security lending income represents the income earned on investing cash collateral, less rebates paid to borrowers and any lending agent fees associated with the loan, plus any premium payments received for lending certain types of securities. Security lending income is presented in the Statement of Operations as a component of income from Fidelity Central Funds. Total security lending income during the period amounted to $1,917,406. During the period, there were no securities loaned to FCM.
8. Expense Reductions.
Commissions paid to certain brokers with whom the investment adviser, or its affiliates, places trades on behalf of the Fund include an amount in addition to trade execution, which may be rebated back to the Fund to offset certain expenses. This amount totaled $24,807 for the period. In addition, through arrangements with the Fund's custodian credits realized as a result of certain uninvested cash balances were used to reduce the Fund's expenses. During the period, these credits reduced the Fund's custody expenses by $248.
In addition, during the period the investment adviser reimbursed and/or waived a portion of fund-level operating expenses in the amount of $17,122.
9. Distributions to Shareholders.
Distributions to shareholders of each class were as follows:
| Six months ended April 30, 2016 | Year ended October 31, 2015 | |
| From net investment income | ||
| Overseas | $41,702,378 | $46,955,922 |
| Class K | 7,957,468 | 11,634,389 |
| Total | $49,659,846 | $58,590,311 |
| From net realized gain | ||
| Overseas | $584,612 | $– |
| Class K | 101,369 | – |
| Total | $685,981 | $– |
10. Share Transactions.
Share transactions for each class were as follows and may contain automatic conversions between classes or exchanges between affiliated funds:
| Shares | Shares | Dollars | Dollars | |
| Six months ended April 30, 2016 | Year ended October 31, 2015 | Six months ended April 30, 2016 | Year ended October 31, 2015 | |
| Overseas | ||||
| Shares sold | 24,942,391 | 34,064,489 | $990,623,129 | $1,419,067,045 |
| Reinvestment of distributions | 981,115 | 1,181,070 | 40,667,201 | 46,087,315 |
| Shares redeemed | (7,706,033) | (12,920,043) | (302,885,946) | (529,687,795) |
| Net increase (decrease) | 18,217,473 | 22,325,516 | $728,404,384 | $935,466,565 |
| Class K | ||||
| Shares sold | 2,965,450 | 4,973,273 | $115,891,575 | $202,328,225 |
| Reinvestment of distributions | 194,940 | 298,984 | 8,058,837 | 11,634,389 |
| Shares redeemed | (1,703,694) | (4,690,550) | (66,891,829) | (193,717,286) |
| Net increase (decrease) | 1,456,696 | 581,707 | $57,058,583 | $20,245,328 |
11. Other.
The Fund's organizational documents provide former and current trustees and officers with a limited indemnification against liabilities arising in connection with the performance of their duties to the Fund. In the normal course of business, the Fund may also enter into contracts that provide general indemnifications. The Fund's maximum exposure under these arrangements is unknown as this would be dependent on future claims that may be made against the Fund. The risk of material loss from such claims is considered remote.
At the end of the period, Strategic Advisers International Fund was the owner of record of approximately 12% of the total outstanding shares of the Fund. Mutual funds managed by the investment adviser or its affiliates were the owners of record, in the aggregate, of approximately 35% of the total outstanding shares of the Fund.
Shareholder Expense Example
As a shareholder of the Fund, you incur two types of costs: (1) transaction costs, including redemption fees and (2) ongoing costs, including management fees and other Fund expenses. This Example is intended to help you understand your ongoing costs (in dollars) of investing in the Fund and to compare these costs with the ongoing costs of investing in other mutual funds.
The Example is based on an investment of $1,000 invested at the beginning of the period and held for the entire period (November 1, 2015 to April 30, 2016).
Actual Expenses
The first line of the accompanying table for each class of the Fund provides information about actual account values and actual expenses. You may use the information in this line, together with the amount you invested, to estimate the expenses that you paid over the period. Simply divide your account value by $1,000.00 (for example, an $8,600 account value divided by $1,000.00 = 8.6), then multiply the result by the number in the first line for a class of the Fund under the heading entitled "Expenses Paid During Period" to estimate the expenses you paid on your account during this period. A small balance maintenance fee of $12.00 that is charged once a year may apply for certain accounts with a value of less than $2,000. This fee is not included in the table below. If it was, the estimate of expenses you paid during the period would be higher, and your ending account value lower, by this amount. In addition, the Fund, as a shareholder in the underlying Fidelity Central Funds, will indirectly bear its pro-rata share of the fees and expenses incurred by the underlying Fidelity Central Funds. These fees and expenses are not included in the Fund's annualized expense ratio used to calculate the expense estimate in the table below.
Hypothetical Example for Comparison Purposes
The second line of the accompanying table for each class of the Fund provides information about hypothetical account values and hypothetical expenses based on a Class' actual expense ratio and an assumed rate of return of 5% per year before expenses, which is not the Class' actual return. The hypothetical account values and expenses may not be used to estimate the actual ending account balance or expenses you paid for the period. You may use this information to compare the ongoing costs of investing in the Fund and other funds. To do so, compare this 5% hypothetical example with the 5% hypothetical examples that appear in the shareholder reports of the other funds. A small balance maintenance fee of $12.00 that is charged once a year may apply for certain accounts with a value of less than $2,000. This fee is not included in the table below. If it was, the estimate of expenses you paid during the period would be higher, and your ending account value lower, by this amount. In addition, the Fund, as a shareholder in the underlying Fidelity Central Funds, will indirectly bear its pro-rata share of the fees and expenses incurred by the underlying Fidelity Central Funds. These fees and expenses are not included in the Fund's annualized expense ratio used to calculate the expense estimate in the table below.
Please note that the expenses shown in the table are meant to highlight your ongoing costs only and do not reflect any transaction costs. Therefore, the second line of the table is useful in comparing ongoing costs only, and will not help you determine the relative total costs of owning different funds. In addition, if these transactional costs were included, your costs would have been higher.
| Annualized Expense Ratio-A | Beginning Account Value November 1, 2015 | Ending Account Value April 30, 2016 | Expenses Paid During Period-B November 1, 2015 to April 30, 2016 | |
| Overseas | 1.04% | |||
| Actual | $1,000.00 | $986.90 | $5.14 | |
| Hypothetical-C | $1,000.00 | $1,019.69 | $5.22 | |
| Class K | .91% | |||
| Actual | $1,000.00 | $987.60 | $4.50 | |
| Hypothetical-C | $1,000.00 | $1,020.34 | $4.57 |
A Annualized expense ratio reflects expenses net of applicable fee waivers.
B Expenses are equal to each Class' annualized expense ratio, multiplied by the average account value over the period, multiplied by 182/366 (to reflect the one-half year period).
C 5% return per year before expenses
![]()
Corporate Headquarters
245 Summer St.
Boston, MA 02210
www.fidelity.com
OVE-K-SANN-0616
1.863322.107
Fidelity Advisor® Total International Equity Fund - Semi-Annual Report April 30, 2016 Class I is a class of Fidelity® Total International Equity Fund |
|
Contents
To view a fund's proxy voting guidelines and proxy voting record for the 12-month period ended June 30, visit http://www.fidelity.com/proxyvotingresults or visit the Securities and Exchange Commission's (SEC) web site at http://www.sec.gov.
You may also call 1-877-208-0098 to request a free copy of the proxy voting guidelines.
Standard & Poor's, S&P and S&P 500 are registered service marks of The McGraw-Hill Companies, Inc. and have been licensed for use by Fidelity Distributors Corporation.
Other third-party marks appearing herein are the property of their respective owners.
All other marks appearing herein are registered or unregistered trademarks or service marks of FMR LLC or an affiliated company. © 2016 FMR LLC. All rights reserved.
This report and the financial statements contained herein are submitted for the general information of the shareholders of the Fund. This report is not authorized for distribution to prospective investors in the Fund unless preceded or accompanied by an effective prospectus.
A fund files its complete schedule of portfolio holdings with the SEC for the first and third quarters of each fiscal year on Form N-Q. Forms N-Q are available on the SEC’s web site at http://www.sec.gov. A fund's Forms N-Q may be reviewed and copied at the SEC’s Public Reference Room in Washington, DC. Information regarding the operation of the SEC's Public Reference Room may be obtained by calling 1-800-SEC-0330.
For a complete list of a fund's portfolio holdings, view the most recent holdings listing, semiannual report, or annual report on Fidelity's web site at http://www.fidelity.com, http://www.advisor.fidelity.com, or http://www.401k.com, as applicable.
NOT FDIC INSURED •MAY LOSE VALUE •NO BANK GUARANTEE
Neither the Fund nor Fidelity Distributors Corporation is a bank.
Investment Summary (Unaudited)
Geographic Diversification (% of fund's net assets)
| As of April 30, 2016 | ||
| Japan | 13.7% | |
| United Kingdom | 13.5% | |
| United States of America* | 12.7% | |
| Switzerland | 7.7% | |
| France | 7.0% | |
| Germany | 3.8% | |
| India | 3.3% | |
| Australia | 3.2% | |
| Spain | 2.8% | |
| Other | 32.3% | |
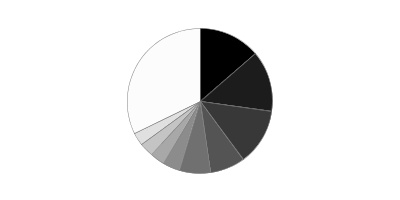
* Includes Short-Term investments and Net Other Assets (Liabilities).
Percentages are based on country or territory of incorporation and are adjusted for the effect of futures contracts, if applicable.
| As of October 31, 2015 | ||
| United Kingdom | 15.7% | |
| Japan | 14.0% | |
| United States of America* | 10.2% | |
| Switzerland | 8.4% | |
| France | 6.6% | |
| Germany | 3.8% | |
| Sweden | 2.9% | |
| Australia | 2.7% | |
| India | 2.6% | |
| Other | 33.1% | |

* Includes Short-Term investments and Net Other Assets (Liabilities).
Percentages are based on country or territory of incorporation and are adjusted for the effect of futures contracts, if applicable.
Asset Allocation as of April 30, 2016
| % of fund's net assets | % of fund's net assets 6 months ago | |
| Stocks | 98.5 | 99.0 |
| Short-Term Investments and Net Other Assets (Liabilities) | 1.5 | 1.0 |
Top Ten Stocks as of April 30, 2016
| % of fund's net assets | % of fund's net assets 6 months ago | |
| Nestle SA (Switzerland, Food Products) | 2.6 | 2.1 |
| Novartis AG (Switzerland, Pharmaceuticals) | 1.8 | 2.3 |
| Anheuser-Busch InBev SA NV (Belgium, Beverages) | 1.5 | 1.2 |
| Roche Holding AG (participation certificate) (Switzerland, Pharmaceuticals) | 1.3 | 1.3 |
| Total SA (France, Oil, Gas & Consumable Fuels) | 1.2 | 1.2 |
| Taiwan Semiconductor Manufacturing Co. Ltd. (Taiwan, Semiconductors & Semiconductor Equipment) | 1.2 | 1.1 |
| Reckitt Benckiser Group PLC (United Kingdom, Household Products) | 1.1 | 1.0 |
| CSL Ltd. (Australia, Biotechnology) | 1.1 | 0.8 |
| Novo Nordisk A/S Series B sponsored ADR (Denmark, Pharmaceuticals) | 1.1 | 1.0 |
| Astellas Pharma, Inc. (Japan, Pharmaceuticals) | 1.1 | 1.1 |
| 14.0 |
Market Sectors as of April 30, 2016
| % of fund's net assets | % of fund's net assets 6 months ago | |
| Financials | 19.3 | 22.0 |
| Health Care | 14.1 | 14.7 |
| Consumer Discretionary | 13.8 | 16.1 |
| Consumer Staples | 13.7 | 11.4 |
| Information Technology | 12.4 | 11.3 |
| Industrials | 11.3 | 11.1 |
| Materials | 5.2 | 4.9 |
| Energy | 3.6 | 2.9 |
| Telecommunication Services | 2.9 | 2.7 |
| Utilities | 2.2 | 1.9 |
Investments April 30, 2016 (Unaudited)
Showing Percentage of Net Assets
| Common Stocks - 97.4% | |||
| Shares | Value | ||
| Argentina - 0.2% | |||
| Banco Macro SA sponsored ADR | 5,400 | $338,202 | |
| Grupo Financiero Galicia SA sponsored ADR | 11,900 | 338,793 | |
| TOTAL ARGENTINA | 676,995 | ||
| Australia - 3.2% | |||
| Amcor Ltd. (a) | 31,664 | 370,766 | |
| Ansell Ltd. (a) | 33,670 | 510,228 | |
| Beacon Lighting Group Ltd. | 28,000 | 38,747 | |
| CSL Ltd. | 42,420 | 3,392,481 | |
| DuluxGroup Ltd. | 22,765 | 110,780 | |
| Imdex Ltd. (a) | 134,227 | 20,922 | |
| Macquarie Group Ltd. | 9,698 | 468,241 | |
| RCG Corp. Ltd. | 97,518 | 101,583 | |
| Sydney Airport unit | 140,091 | 725,389 | |
| TFS Corp. Ltd. | 64,586 | 76,608 | |
| Transurban Group unit | 173,855 | 1,530,768 | |
| Westpac Banking Corp. | 108,726 | 2,552,187 | |
| TOTAL AUSTRALIA | 9,898,700 | ||
| Austria - 0.5% | |||
| Andritz AG | 25,972 | 1,454,546 | |
| Zumtobel AG | 4,500 | 58,586 | |
| TOTAL AUSTRIA | 1,513,132 | ||
| Bailiwick of Jersey - 0.3% | |||
| Integrated Diagnostics Holdings PLC | 14,600 | 67,890 | |
| Wolseley PLC | 15,116 | 846,678 | |
| TOTAL BAILIWICK OF JERSEY | 914,568 | ||
| Belgium - 1.9% | |||
| Anheuser-Busch InBev SA NV | 38,071 | 4,712,425 | |
| Gimv NV | 819 | 45,483 | |
| KBC Ancora | 4,281 | 151,127 | |
| KBC Groep NV | 21,007 | 1,179,371 | |
| TOTAL BELGIUM | 6,088,406 | ||
| Bermuda - 0.7% | |||
| Axalta Coating Systems (a) | 11,500 | 327,405 | |
| China Gas Holdings Ltd. | 278,000 | 401,358 | |
| China Resource Gas Group Ltd. | 142,000 | 401,837 | |
| Credicorp Ltd. (United States) | 4,200 | 610,764 | |
| Markit Ltd. (a) | 8,000 | 279,120 | |
| Vostok New Ventures Ltd. SDR (a) | 13,260 | 75,461 | |
| TOTAL BERMUDA | 2,095,945 | ||
| Brazil - 1.1% | |||
| BB Seguridade Participacoes SA | 55,700 | 485,862 | |
| Cielo SA | 60,036 | 584,780 | |
| Kroton Educacional SA | 140,300 | 522,160 | |
| Qualicorp SA | 90,800 | 393,376 | |
| Smiles SA | 30,300 | 351,521 | |
| Ultrapar Participacoes SA | 25,600 | 539,057 | |
| Weg SA | 102,500 | 452,410 | |
| TOTAL BRAZIL | 3,329,166 | ||
| British Virgin Islands - 0.1% | |||
| Mail.Ru Group Ltd. GDR (Reg. S) (a) | 14,800 | 299,700 | |
| Canada - 0.7% | |||
| Cara Operations Ltd. | 4,100 | 106,070 | |
| Constellation Software, Inc. | 100 | 39,080 | |
| Imperial Oil Ltd. | 24,900 | 825,766 | |
| McCoy Global, Inc. | 15,800 | 25,815 | |
| New Look Vision Group, Inc. | 3,000 | 74,241 | |
| Pason Systems, Inc. | 43,100 | 626,559 | |
| Potash Corp. of Saskatchewan, Inc. | 21,900 | 387,487 | |
| ShawCor Ltd. Class A | 1,900 | 51,335 | |
| Tesco Corp. | 5,500 | 52,030 | |
| TOTAL CANADA | 2,188,383 | ||
| Cayman Islands - 2.5% | |||
| 58.com, Inc. ADR (a) | 9,700 | 530,105 | |
| Alibaba Group Holding Ltd. sponsored ADR (a) | 21,800 | 1,677,292 | |
| Baidu.com, Inc. sponsored ADR (a) | 5,000 | 971,500 | |
| ENN Energy Holdings Ltd. | 62,000 | 302,414 | |
| Fu Shou Yuan International Group Ltd. | 482,000 | 338,167 | |
| International Housewares Retail Co. Ltd. | 300,000 | 49,032 | |
| New Oriental Education & Technology Group, Inc. sponsored ADR | 9,900 | 387,684 | |
| Shenzhou International Group Holdings Ltd. | 79,000 | 408,393 | |
| Sino Biopharmaceutical Ltd. | 516,000 | 365,640 | |
| TAL Education Group ADR (a) | 6,200 | 358,732 | |
| Tencent Holdings Ltd. | 122,900 | 2,500,808 | |
| Value Partners Group Ltd. | 55,000 | 52,500 | |
| TOTAL CAYMAN ISLANDS | 7,942,267 | ||
| China - 0.6% | |||
| China Pacific Insurance (Group) Co. Ltd. (H Shares) | 132,200 | 463,552 | |
| Inner Mongoli Yili Industries Co. Ltd. | 139,000 | 322,699 | |
| Jiangsu Hengrui Medicine Co. Ltd. | 45,830 | 330,449 | |
| Kweichow Moutai Co. Ltd. | 10,340 | 401,203 | |
| Shanghai International Airport Co. Ltd. | 72,800 | 305,974 | |
| TOTAL CHINA | 1,823,877 | ||
| Denmark - 1.3% | |||
| Jyske Bank A/S (Reg.) | 15,654 | 640,880 | |
| Novo Nordisk A/S Series B sponsored ADR | 60,760 | 3,389,800 | |
| Scandinavian Tobacco Group A/S | 3,000 | 47,725 | |
| Spar Nord Bank A/S | 11,631 | 94,842 | |
| TOTAL DENMARK | 4,173,247 | ||
| Finland - 0.5% | |||
| Sampo Oyj (A Shares) | 27,653 | 1,207,351 | |
| Tikkurila Oyj | 26,280 | 460,707 | |
| TOTAL FINLAND | 1,668,058 | ||
| France - 7.0% | |||
| Atos Origin SA | 16,004 | 1,424,463 | |
| AXA SA | 75,806 | 1,914,071 | |
| Bouygues SA (b) | 12,277 | 409,363 | |
| Capgemini SA | 15,802 | 1,475,210 | |
| Dassault Systemes SA | 4,500 | 351,931 | |
| Elis SA | 5,500 | 100,985 | |
| Essilor International SA | 9,145 | 1,183,801 | |
| Havas SA | 80,986 | 677,693 | |
| Laurent-Perrier Group SA | 759 | 64,530 | |
| Orange SA | 59,500 | 988,529 | |
| Renault SA | 9,911 | 956,459 | |
| Sanofi SA | 29,328 | 2,417,406 | |
| Societe Generale Series A | 31,200 | 1,227,632 | |
| SR Teleperformance SA | 5,700 | 511,700 | |
| Total SA | 77,133 | 3,898,362 | |
| Unibail-Rodamco | 5,000 | 1,339,709 | |
| Vetoquinol SA | 1,700 | 70,466 | |
| VINCI SA | 24,100 | 1,800,344 | |
| Virbac SA | 730 | 133,157 | |
| Vivendi SA (b) | 57,152 | 1,097,908 | |
| TOTAL FRANCE | 22,043,719 | ||
| Germany - 3.6% | |||
| adidas AG | 2,800 | 361,011 | |
| alstria office REIT-AG | 6,200 | 86,967 | |
| Axel Springer Verlag AG | 9,300 | 519,244 | |
| BASF AG | 23,970 | 1,980,290 | |
| Bayer AG | 16,012 | 1,847,205 | |
| CompuGroup Medical AG | 7,646 | 300,298 | |
| Continental AG | 2,383 | 523,356 | |
| CTS Eventim AG | 7,980 | 279,516 | |
| Fielmann AG | 2,458 | 181,228 | |
| Fresenius SE & Co. KGaA | 18,300 | 1,331,024 | |
| GEA Group AG | 11,615 | 538,507 | |
| Nexus AG | 4,000 | 70,077 | |
| SAP AG | 37,730 | 2,960,335 | |
| Wirecard AG (b) | 8,800 | 380,033 | |
| TOTAL GERMANY | 11,359,091 | ||
| Greece - 0.0% | |||
| Titan Cement Co. SA (Reg.) | 1,844 | 42,065 | |
| Hong Kong - 1.4% | |||
| AIA Group Ltd. | 429,800 | 2,572,184 | |
| Guangdong Investment Ltd. | 334,000 | 471,629 | |
| Power Assets Holdings Ltd. | 87,500 | 832,483 | |
| Techtronic Industries Co. Ltd. | 96,500 | 361,747 | |
| TOTAL HONG KONG | 4,238,043 | ||
| India - 3.3% | |||
| Adani Ports & Special Economic Zone | 130,670 | 468,579 | |
| Amara Raja Batteries Ltd. | 25,033 | 360,220 | |
| Asian Paints India Ltd. | 32,877 | 428,747 | |
| Bharti Infratel Ltd. | 65,320 | 368,710 | |
| Colgate-Palmolive (India) | 28,645 | 362,604 | |
| GlaxoSmithKline Consumer Healthcare Ltd. (a) | 4,231 | 375,650 | |
| HCL Technologies Ltd. | 38,811 | 438,384 | |
| HDFC Bank Ltd. (a) | 19,066 | 387,551 | |
| Hindustan Unilever Ltd. | 39,555 | 516,816 | |
| Housing Development Finance Corp. Ltd. | 87,831 | 1,439,201 | |
| IndusInd Bank Ltd. | 23,402 | 369,515 | |
| Infosys Ltd. | 54,376 | 987,776 | |
| ITC Ltd. | 117,362 | 574,129 | |
| Jyothy Laboratories Ltd. | 16,417 | 75,232 | |
| LIC Housing Finance Ltd. (a) | 52,804 | 367,499 | |
| Lupin Ltd. | 15,964 | 386,269 | |
| Maruti Suzuki India Ltd. (a) | 8,151 | 465,637 | |
| Power Grid Corp. of India Ltd. | 160,535 | 346,564 | |
| Sun Pharmaceutical Industries Ltd. | 44,169 | 539,466 | |
| Tata Consultancy Services Ltd. | 18,951 | 723,371 | |
| Titan Co. Ltd. | 55,471 | 297,207 | |
| TOTAL INDIA | 10,279,127 | ||
| Indonesia - 0.9% | |||
| PT ACE Hardware Indonesia Tbk | 4,792,900 | 336,172 | |
| PT Bank Central Asia Tbk | 537,100 | 531,480 | |
| PT Bank Rakyat Indonesia Tbk | 575,000 | 451,263 | |
| PT Kalbe Farma Tbk | 3,267,100 | 340,633 | |
| PT Matahari Department Store Tbk | 279,100 | 402,100 | |
| PT Surya Citra Media Tbk | 1,553,000 | 376,827 | |
| PT Tower Bersama Infrastructure Tbk (a) | 621,800 | 279,357 | |
| TOTAL INDONESIA | 2,717,832 | ||
| Ireland - 1.6% | |||
| Allergan PLC (a) | 2,200 | 476,432 | |
| CRH PLC sponsored ADR | 59,929 | 1,744,533 | |
| FBD Holdings PLC | 5,372 | 39,368 | |
| James Hardie Industries PLC: | |||
| CDI | 23,978 | 337,833 | |
| sponsored ADR | 112,225 | 1,573,395 | |
| Medtronic PLC | 10,600 | 838,990 | |
| TOTAL IRELAND | 5,010,551 | ||
| Isle of Man - 0.3% | |||
| Playtech Ltd. | 76,677 | 901,334 | |
| Israel - 1.1% | |||
| Azrieli Group | 11,796 | 468,500 | |
| Check Point Software Technologies Ltd. (a) | 4,000 | 331,480 | |
| Frutarom Industries Ltd. | 6,900 | 353,638 | |
| Ituran Location & Control Ltd. | 5,661 | 117,749 | |
| Strauss Group Ltd. | 6,859 | 108,692 | |
| Teva Pharmaceutical Industries Ltd. sponsored ADR | 35,509 | 1,933,465 | |
| TOTAL ISRAEL | 3,313,524 | ||
| Italy - 1.6% | |||
| Azimut Holding SpA | 22,914 | 576,704 | |
| Banco di Desio e della Brianza SpA | 19,000 | 53,563 | |
| Beni Stabili SpA SIIQ | 190,326 | 141,003 | |
| Eni SpA | 94,900 | 1,550,375 | |
| Interpump Group SpA | 49,391 | 710,898 | |
| Intesa Sanpaolo SpA | 297,500 | 826,991 | |
| Mediaset SpA | 121,000 | 544,506 | |
| Telecom Italia SpA (a) | 638,800 | 623,771 | |
| TOTAL ITALY | 5,027,811 | ||
| Japan - 13.7% | |||
| Aoki Super Co. Ltd. | 6,000 | 70,898 | |
| Artnature, Inc. | 12,300 | 101,984 | |
| Asahi Co. Ltd. | 6,600 | 97,893 | |
| Astellas Pharma, Inc. | 245,800 | 3,314,022 | |
| Autobacs Seven Co. Ltd. | 5,800 | 100,069 | |
| Azbil Corp. | 8,200 | 210,398 | |
| Broadleaf Co. Ltd. | 2,700 | 26,682 | |
| Central Automotive Products Ltd. | 8,000 | 66,678 | |
| Century21 Real Estate Japan Ltd. (c) | 2,500 | 27,834 | |
| Coca-Cola Central Japan Co. Ltd. | 18,700 | 342,601 | |
| Daiichikosho Co. Ltd. | 3,300 | 138,342 | |
| Daikokutenbussan Co. Ltd. | 5,000 | 224,719 | |
| DENSO Corp. | 48,600 | 1,847,343 | |
| Dentsu, Inc. | 21,800 | 1,107,636 | |
| East Japan Railway Co. | 20,600 | 1,812,307 | |
| Funai Soken Holdings, Inc. | 3,000 | 45,516 | |
| GCA Savvian Group Corp. | 6,800 | 62,834 | |
| Glory Ltd. | 3,900 | 127,730 | |
| Goldcrest Co. Ltd. | 7,960 | 113,977 | |
| Hokuriku Electrical Construction Co. Ltd. | 5,000 | 36,583 | |
| Hoya Corp. | 50,700 | 1,941,520 | |
| Hub Co. Ltd. | 2,500 | 40,088 | |
| Itochu Corp. | 85,300 | 1,084,044 | |
| Iwatsuka Confectionary Co. Ltd. | 800 | 36,244 | |
| Japan Digital Laboratory Co. | 6,100 | 82,516 | |
| Japan Tobacco, Inc. | 70,800 | 2,892,742 | |
| KDDI Corp. | 49,800 | 1,434,526 | |
| Keyence Corp. | 2,621 | 1,571,009 | |
| Kobayashi Pharmaceutical Co. Ltd. | 2,000 | 159,305 | |
| Koshidaka Holdings Co. Ltd. | 4,000 | 78,655 | |
| Lasertec Corp. | 6,300 | 81,908 | |
| Makita Corp. | 12,700 | 801,159 | |
| Medikit Co. Ltd. | 2,200 | 76,699 | |
| Meiko Network Japan Co. Ltd. | 2,700 | 29,778 | |
| Mitsubishi UFJ Financial Group, Inc. | 357,000 | 1,647,489 | |
| Mitsui Fudosan Co. Ltd. | 54,000 | 1,318,811 | |
| Nagaileben Co. Ltd. | 8,600 | 175,497 | |
| Nakano Refrigerators Co. Ltd. | 2,000 | 47,850 | |
| ND Software Co. Ltd. | 6,000 | 49,390 | |
| Nihon Parkerizing Co. Ltd. | 20,200 | 178,172 | |
| Nintendo Co. Ltd. | 4,400 | 595,765 | |
| Nippon Prologis REIT, Inc. (c) | 241 | 577,879 | |
| Nippon Telegraph & Telephone Corp. | 41,900 | 1,875,039 | |
| NS Tool Co. Ltd. | 3,800 | 63,002 | |
| OBIC Co. Ltd. | 17,800 | 935,585 | |
| Olympus Corp. | 43,600 | 1,698,509 | |
| ORIX Corp. | 71,100 | 1,005,705 | |
| OSG Corp. | 33,500 | 622,551 | |
| Paramount Bed Holdings Co. Ltd. | 3,400 | 126,476 | |
| ProNexus, Inc. | 8,000 | 80,904 | |
| San-Ai Oil Co. Ltd. | 11,000 | 77,092 | |
| Seven & i Holdings Co. Ltd. | 23,200 | 946,617 | |
| Seven Bank Ltd. | 398,800 | 1,694,584 | |
| Shinsei Bank Ltd. | 334,000 | 468,127 | |
| SHO-BOND Holdings Co. Ltd. | 22,100 | 956,249 | |
| Shoei Co. Ltd. | 5,800 | 87,794 | |
| SK Kaken Co. Ltd. | 1,100 | 90,257 | |
| Software Service, Inc. | 1,600 | 61,799 | |
| Sony Corp. | 31,300 | 758,137 | |
| Sony Financial Holdings, Inc. | 44,000 | 543,969 | |
| Sumitomo Mitsui Financial Group, Inc. | 42,600 | 1,281,907 | |
| Techno Medica Co. Ltd. | 1,800 | 37,734 | |
| The Monogatari Corp. | 1,500 | 70,800 | |
| The Nippon Synthetic Chemical Industry Co. Ltd. | 6,000 | 36,206 | |
| TKC Corp. | 3,300 | 89,656 | |
| Tocalo Co. Ltd. | 2,800 | 50,368 | |
| Toyota Motor Corp. | 50,000 | 2,534,487 | |
| Tsutsumi Jewelry Co. Ltd. | 2,200 | 45,954 | |
| USS Co. Ltd. | 110,600 | 1,749,509 | |
| Workman Co. Ltd. | 3,800 | 119,455 | |
| Yamada Consulting Group Co. Ltd. | 2,000 | 61,101 | |
| Yamato Kogyo Co. Ltd. | 1,700 | 39,907 | |
| TOTAL JAPAN | 42,986,572 | ||
| Kenya - 0.2% | |||
| Safaricom Ltd. | 4,376,100 | 740,904 | |
| Korea (South) - 1.6% | |||
| AMOREPACIFIC Corp. | 1,718 | 611,068 | |
| AMOREPACIFIC Group, Inc. | 3,162 | 463,671 | |
| BGFretail Co. Ltd. | 4,710 | 764,667 | |
| Coway Co. Ltd. | 4,513 | 388,401 | |
| KT&G Corp. | 5,617 | 603,043 | |
| Leeno Industrial, Inc. | 959 | 35,868 | |
| LG Chemical Ltd. | 2,168 | 562,023 | |
| LG Household & Health Care Ltd. | 620 | 544,954 | |
| NAVER Corp. | 1,801 | 1,064,243 | |
| TOTAL KOREA (SOUTH) | 5,037,938 | ||
| Luxembourg - 0.3% | |||
| Eurofins Scientific SA | 1,000 | 371,053 | |
| RTL Group SA | 6,427 | 534,133 | |
| TOTAL LUXEMBOURG | 905,186 | ||
| Mexico - 2.2% | |||
| Banregio Grupo Financiero S.A.B. de CV | 64,200 | 384,723 | |
| Consorcio ARA S.A.B. de CV | 254,355 | 99,793 | |
| El Puerto de Liverpool S.A.B. de CV Class C | 31,300 | 355,796 | |
| Fomento Economico Mexicano S.A.B. de CV: | |||
| unit | 71,500 | 665,269 | |
| sponsored ADR | 7,333 | 683,509 | |
| Gruma S.A.B. de CV Series B | 26,400 | 385,658 | |
| Grupo Aeroportuario del Pacifico S.A.B. de CV Series B | 45,000 | 423,984 | |
| Grupo Aeroportuario del Sureste S.A.B. de CV Series B | 28,135 | 432,066 | |
| Grupo Aeroportuario Norte S.A.B. de CV | 65,200 | 377,300 | |
| Grupo Financiero Banorte S.A.B. de CV Series O | 106,900 | 606,866 | |
| Grupo GICSA SA de CV (a) | 272,500 | 214,140 | |
| Infraestructura Energetica Nova S.A.B. de CV | 84,400 | 329,807 | |
| Kimberly-Clark de Mexico SA de CV Series A | 173,200 | 409,930 | |
| Megacable Holdings S.A.B. de CV unit | 81,200 | 374,977 | |
| Promotora y Operadora de Infraestructura S.A.B. de CV | 27,700 | 351,292 | |
| Tenedora Nemak SA de CV | 233,700 | 335,242 | |
| Wal-Mart de Mexico SA de CV Series V | 167,600 | 414,503 | |
| TOTAL MEXICO | 6,844,855 | ||
| Netherlands - 1.6% | |||
| Aalberts Industries NV | 6,100 | 208,985 | |
| Heijmans NV (Certificaten Van Aandelen) (a) | 4,481 | 42,228 | |
| ING Groep NV (Certificaten Van Aandelen) | 113,576 | 1,390,887 | |
| Koninklijke KPN NV | 150,029 | 589,562 | |
| Mylan N.V. | 9,800 | 408,758 | |
| PostNL NV (a) | 74,300 | 324,995 | |
| RELX NV | 100,780 | 1,691,160 | |
| VastNed Retail NV | 5,035 | 221,677 | |
| TOTAL NETHERLANDS | 4,878,252 | ||
| Norway - 0.0% | |||
| Kongsberg Gruppen ASA | 4,500 | 75,449 | |
| Philippines - 0.9% | |||
| Ayala Corp. | 26,950 | 441,766 | |
| Ayala Land, Inc. | 590,400 | 434,939 | |
| D&L Industries, Inc. | 1,653,900 | 316,469 | |
| GT Capital Holdings, Inc. | 12,985 | 377,389 | |
| International Container Terminal Services, Inc. | 241,940 | 334,349 | |
| Jollibee Food Corp. | 16,980 | 82,887 | |
| SM Investments Corp. | 20,420 | 409,833 | |
| SM Prime Holdings, Inc. | 859,600 | 413,946 | |
| TOTAL PHILIPPINES | 2,811,578 | ||
| Russia - 0.3% | |||
| Magnit OJSC (a) | 3,350 | 465,579 | |
| NOVATEK OAO GDR (Reg. S) | 5,300 | 508,800 | |
| TOTAL RUSSIA | 974,379 | ||
| South Africa - 2.0% | |||
| Aspen Pharmacare Holdings Ltd. | 23,800 | 560,891 | |
| Bidvest Group Ltd. | 20,132 | 510,935 | |
| Clicks Group Ltd. | 60,693 | 443,283 | |
| Discovery Ltd. | 48,767 | 435,829 | |
| FirstRand Ltd. | 169,400 | 544,427 | |
| Mondi Ltd. | 21,100 | 405,362 | |
| Mr Price Group Ltd. | 33,900 | 430,631 | |
| Naspers Ltd. Class N | 17,300 | 2,373,735 | |
| Sanlam Ltd. | 107,700 | 522,035 | |
| TOTAL SOUTH AFRICA | 6,227,128 | ||
| Spain - 2.8% | |||
| Amadeus IT Holding SA Class A | 42,900 | 1,952,134 | |
| Hispania Activos Inmobiliarios SA (a) | 38,400 | 562,815 | |
| Iberdrola SA | 254,372 | 1,810,808 | |
| Inditex SA | 91,236 | 2,928,810 | |
| Mediaset Espana Comunicacion SA | 49,300 | 640,154 | |
| Merlin Properties Socimi SA | 36,100 | 419,564 | |
| Prosegur Compania de Seguridad SA (Reg.) | 106,676 | 616,854 | |
| TOTAL SPAIN | 8,931,139 | ||
| Sweden - 2.4% | |||
| ASSA ABLOY AB (B Shares) | 136,700 | 2,866,624 | |
| Fagerhult AB | 49,855 | 1,160,942 | |
| Intrum Justitia AB | 11,563 | 414,978 | |
| Nordea Bank AB | 138,267 | 1,342,131 | |
| Saab AB (B Shares) | 3,000 | 102,622 | |
| Sandvik AB (b) | 48,200 | 494,578 | |
| Svenska Handelsbanken AB (A Shares) (b) | 87,445 | 1,166,530 | |
| TOTAL SWEDEN | 7,548,405 | ||
| Switzerland - 7.7% | |||
| Credit Suisse Group AG | 48,674 | 740,743 | |
| Lafargeholcim Ltd. (Reg.) | 13,560 | 686,552 | |
| Nestle SA | 107,904 | 8,053,917 | |
| Novartis AG | 72,031 | 5,481,722 | |
| Roche Holding AG (participation certificate) | 15,701 | 3,972,498 | |
| Schindler Holding AG: | |||
| (participation certificate) | 7,634 | 1,390,243 | |
| (Reg.) | 2,251 | 413,688 | |
| Sika AG | 90 | 383,061 | |
| Syngenta AG (Switzerland) | 3,219 | 1,288,540 | |
| Tecan Group AG | 600 | 83,311 | |
| UBS Group AG | 22,589 | 390,112 | |
| Zurich Insurance Group AG | 5,646 | 1,266,874 | |
| TOTAL SWITZERLAND | 24,151,261 | ||
| Taiwan - 1.6% | |||
| Addcn Technology Co. Ltd. | 8,500 | 65,257 | |
| Advantech Co. Ltd. | 48,000 | 338,792 | |
| ECLAT Textile Co. Ltd. | 34,643 | 395,194 | |
| Largan Precision Co. Ltd. | 5,870 | 412,497 | |
| Taiwan Semiconductor Manufacturing Co. Ltd. | 835,035 | 3,830,521 | |
| TOTAL TAIWAN | 5,042,261 | ||
| Thailand - 0.4% | |||
| Airports of Thailand PCL (For. Reg.) | 37,800 | 424,330 | |
| Bangkok Dusit Medical Services PCL (For. Reg.) | 527,200 | 359,317 | |
| Thai Beverage PCL | 612,400 | 339,248 | |
| TOTAL THAILAND | 1,122,895 | ||
| Turkey - 0.5% | |||
| Bim Birlesik Magazalar A/S JSC | 19,000 | 418,299 | |
| Koc Holding A/S | 83,000 | 433,985 | |
| Tofas Turk Otomobil Fabrikasi A/S | 44,054 | 348,590 | |
| Tupras Turkiye Petrol Rafinelleri A/S | 15,000 | 395,908 | |
| TOTAL TURKEY | 1,596,782 | ||
| United Arab Emirates - 0.1% | |||
| DP World Ltd. | 20,486 | 387,185 | |
| United Kingdom - 13.5% | |||
| AA PLC | 21,973 | 89,447 | |
| Alliance Pharma PLC | 64,414 | 42,353 | |
| Associated British Foods PLC | 28,900 | 1,293,842 | |
| AstraZeneca PLC (United Kingdom) | 31,527 | 1,808,786 | |
| Aviva PLC | 160,179 | 1,014,812 | |
| Babcock International Group PLC | 28,323 | 392,115 | |
| BAE Systems PLC | 249,621 | 1,741,520 | |
| Barclays PLC | 406,095 | 1,019,607 | |
| Bellway PLC | 6,328 | 226,253 | |
| Berendsen PLC | 67,555 | 1,164,754 | |
| British American Tobacco PLC (United Kingdom) | 5,700 | 347,541 | |
| Britvic PLC | 8,417 | 86,581 | |
| Bunzl PLC | 42,632 | 1,270,129 | |
| Compass Group PLC | 72,807 | 1,296,575 | |
| Dechra Pharmaceuticals PLC | 9,600 | 155,139 | |
| DP Poland PLC (a) | 200,000 | 75,980 | |
| Elementis PLC | 47,708 | 150,501 | |
| Great Portland Estates PLC | 13,972 | 154,747 | |
| Hikma Pharmaceuticals PLC | 13,118 | 422,449 | |
| Hilton Food Group PLC | 5,400 | 44,422 | |
| Howden Joinery Group PLC | 67,400 | 486,499 | |
| HSBC Holdings PLC sponsored ADR | 53,617 | 1,787,055 | |
| Imperial Tobacco Group PLC | 38,114 | 2,070,843 | |
| Informa PLC | 223,214 | 2,134,646 | |
| InterContinental Hotel Group PLC ADR | 69,496 | 2,789,569 | |
| ITE Group PLC | 41,200 | 93,460 | |
| ITV PLC | 374,619 | 1,232,687 | |
| JUST EAT Ltd. (a) | 12,540 | 70,268 | |
| Lloyds Banking Group PLC | 2,277,100 | 2,234,999 | |
| Micro Focus International PLC | 36,100 | 806,510 | |
| National Grid PLC | 115,665 | 1,650,378 | |
| NMC Health PLC | 22,600 | 345,740 | |
| Prudential PLC | 122,580 | 2,419,672 | |
| Reckitt Benckiser Group PLC | 36,651 | 3,570,500 | |
| Rightmove PLC | 7,800 | 439,695 | |
| Rio Tinto PLC | 69,603 | 2,334,923 | |
| Royal Dutch Shell PLC Class B (United Kingdom) | 39,530 | 1,037,855 | |
| Shaftesbury PLC | 41,837 | 556,284 | |
| Spectris PLC | 7,970 | 212,062 | |
| Spirax-Sarco Engineering PLC | 5,699 | 284,370 | |
| Taylor Wimpey PLC | 29,400 | 79,171 | |
| Ted Baker PLC | 3,375 | 117,613 | |
| Topps Tiles PLC | 33,400 | 66,371 | |
| Ultra Electronics Holdings PLC | 5,901 | 152,269 | |
| Unite Group PLC | 66,977 | 618,986 | |
| Vodafone Group PLC sponsored ADR | 63,826 | 2,089,663 | |
| TOTAL UNITED KINGDOM | 42,479,641 | ||
| United States of America - 11.2% | |||
| A.O. Smith Corp. | 4,200 | 324,324 | |
| Alphabet, Inc.: | |||
| Class A | 2,030 | 1,436,996 | |
| Class C | 406 | 281,362 | |
| Altria Group, Inc. | 11,100 | 696,081 | |
| Amazon.com, Inc. (a) | 600 | 395,754 | |
| Amphenol Corp. Class A | 5,400 | 301,482 | |
| ANSYS, Inc. (a) | 500 | 45,385 | |
| Autoliv, Inc. | 13,654 | 1,672,205 | |
| Berkshire Hathaway, Inc. Class B (a) | 9,016 | 1,311,648 | |
| Broadridge Financial Solutions, Inc. | 1,340 | 80,186 | |
| Chevron Corp. | 9,000 | 919,620 | |
| China Biologic Products, Inc. (a) | 10,200 | 1,193,400 | |
| ConocoPhillips Co. | 22,200 | 1,060,938 | |
| Constellation Brands, Inc. Class A (sub. vtg.) | 8,300 | 1,295,298 | |
| Danaher Corp. | 3,200 | 309,600 | |
| Domino's Pizza, Inc. | 6,800 | 821,984 | |
| Ecolab, Inc. | 2,800 | 321,944 | |
| Edgewell Personal Care Co. (a) | 5,400 | 443,178 | |
| Energizer Holdings, Inc. | 1,000 | 43,490 | |
| Facebook, Inc. Class A (a) | 2,800 | 329,224 | |
| Gartner, Inc. Class A (a) | 3,400 | 296,378 | |
| International Flavors & Fragrances, Inc. | 3,100 | 370,357 | |
| Kennedy-Wilson Holdings, Inc. | 7,773 | 167,975 | |
| Martin Marietta Materials, Inc. | 4,970 | 841,073 | |
| MasterCard, Inc. Class A | 26,000 | 2,521,740 | |
| McGraw Hill Financial, Inc. | 19,800 | 2,115,630 | |
| MercadoLibre, Inc. | 3,100 | 387,159 | |
| Mettler-Toledo International, Inc. (a) | 1,000 | 357,950 | |
| Mohawk Industries, Inc. (a) | 8,665 | 1,669,139 | |
| Molson Coors Brewing Co. Class B | 14,800 | 1,415,324 | |
| Moody's Corp. | 9,900 | 947,628 | |
| MSCI, Inc. Class A | 12,200 | 926,468 | |
| NIKE, Inc. Class B | 5,600 | 330,064 | |
| Philip Morris International, Inc. | 18,500 | 1,815,220 | |
| PPG Industries, Inc. | 2,900 | 320,131 | |
| PriceSmart, Inc. | 8,885 | 768,908 | |
| ResMed, Inc. | 12,720 | 709,776 | |
| Reynolds American, Inc. | 24,900 | 1,235,040 | |
| Sherwin-Williams Co. | 2,300 | 660,813 | |
| SS&C Technologies Holdings, Inc. | 14,054 | 859,402 | |
| The Walt Disney Co. | 3,000 | 309,780 | |
| TransDigm Group, Inc. (a) | 1,500 | 341,805 | |
| Visa, Inc. Class A | 32,877 | 2,539,419 | |
| TOTAL UNITED STATES OF AMERICA | 35,191,278 | ||
| TOTAL COMMON STOCKS | |||
| (Cost $262,015,051) | 305,478,629 | ||
| Nonconvertible Preferred Stocks - 1.1% | |||
| Brazil - 0.9% | |||
| Ambev SA sponsored ADR | 152,100 | 850,239 | |
| Banco Bradesco SA (PN) | 113,850 | 857,372 | |
| Itau Unibanco Holding SA | 94,300 | 901,255 | |
| TOTAL BRAZIL | 2,608,866 | ||
| Germany - 0.2% | |||
| Sartorius AG (non-vtg.) | 900 | 222,031 | |
| Volkswagen AG | 2,990 | 432,927 | |
| TOTAL GERMANY | 654,958 | ||
| TOTAL NONCONVERTIBLE PREFERRED STOCKS | |||
| (Cost $3,142,197) | 3,263,824 | ||
| Money Market Funds - 2.2% | |||
| Fidelity Cash Central Fund, 0.38% (d) | 3,860,982 | 3,860,982 | |
| Fidelity Securities Lending Cash Central Fund, 0.42% (d)(e) | 3,158,800 | 3,158,800 | |
| TOTAL MONEY MARKET FUNDS | |||
| (Cost $7,019,782) | 7,019,782 | ||
| TOTAL INVESTMENT PORTFOLIO - 100.7% | |||
| (Cost $272,177,030) | 315,762,235 | ||
| NET OTHER ASSETS (LIABILITIES) - (0.7)% | (2,185,787) | ||
| NET ASSETS - 100% | $313,576,448 |
Categorizations in the Schedule of Investments are based on country or territory of incorporation.
Legend
(a) Non-income producing
(b) Security or a portion of the security is on loan at period end.
(c) Security or a portion of the security purchased on a delayed delivery or when-issued basis.
(d) Affiliated fund that is generally available only to investment companies and other accounts managed by Fidelity Investments. The rate quoted is the annualized seven-day yield of the fund at period end. A complete unaudited listing of the fund's holdings as of its most recent quarter end is available upon request. In addition, each Fidelity Central Fund's financial statements are available on the SEC's website or upon request.
(e) Investment made with cash collateral received from securities on loan.
Affiliated Central Funds
Information regarding fiscal year to date income earned by the Fund from investments in Fidelity Central Funds is as follows:
| Fund | Income earned |
| Fidelity Cash Central Fund | $6,565 |
| Fidelity Securities Lending Cash Central Fund | 41,244 |
| Total | $47,809 |
Investment Valuation
The following is a summary of the inputs used, as of April 30, 2016, involving the Fund's assets and liabilities carried at fair value. The inputs or methodology used for valuing securities may not be an indication of the risk associated with investing in those securities. For more information on valuation inputs, and their aggregation into the levels used below, please refer to the Investment Valuation section in the accompanying Notes to Financial Statements.
| Valuation Inputs at Reporting Date: | ||||
| Description | Total | Level 1 | Level 2 | Level 3 |
| Investments in Securities: | ||||
| Equities: | ||||
| Consumer Discretionary | $44,289,186 | $31,864,746 | $12,424,440 | $-- |
| Consumer Staples | 43,532,195 | 26,785,127 | 16,747,068 | -- |
| Energy | 11,569,512 | 5,005,828 | 6,563,684 | -- |
| Financials | 59,479,309 | 30,876,288 | 28,603,021 | -- |
| Health Care | 44,295,373 | 22,767,675 | 21,527,698 | -- |
| Industrials | 34,242,642 | 25,865,080 | 8,377,562 | -- |
| Information Technology | 38,595,430 | 23,298,008 | 15,297,422 | -- |
| Materials | 17,201,467 | 14,479,937 | 2,721,530 | -- |
| Telecommunication Services | 8,990,061 | 3,478,634 | 5,511,427 | -- |
| Utilities | 6,547,278 | 676,371 | 5,870,907 | -- |
| Money Market Funds | 7,019,782 | 7,019,782 | -- | -- |
| Total Investments in Securities: | $315,762,235 | $192,117,476 | $123,644,759 | $-- |
The following is a summary of transfers between Level 1 and Level 2 for the period ended April 30, 2016. Transfers are assumed to have occurred at the beginning of the period, and are primarily attributable to the valuation techniques used for foreign equity securities, as discussed in the accompanying Notes to Financial Statements:
| Transfers | Total |
| Level 1 to Level 2 | $4,099,814 |
| Level 2 to Level 1 | $34,866,774 |
See accompanying notes which are an integral part of the financial statements.
Financial Statements
Statement of Assets and Liabilities
| April 30, 2016 (Unaudited) | ||
| Assets | ||
| Investment in securities, at value (including securities loaned of $2,961,201) — See accompanying schedule: Unaffiliated issuers (cost $265,157,248) | $308,742,453 | |
| Fidelity Central Funds (cost $7,019,782) | 7,019,782 | |
| Total Investments (cost $272,177,030) | $315,762,235 | |
| Foreign currency held at value (cost $18,143) | 17,488 | |
| Receivable for investments sold | 433,383 | |
| Receivable for fund shares sold | 52,780 | |
| Dividends receivable | 1,829,196 | |
| Distributions receivable from Fidelity Central Funds | 23,163 | |
| Prepaid expenses | 265 | |
| Receivable from investment adviser for expense reductions | 56 | |
| Other receivables | 24,958 | |
| Total assets | 318,143,524 | |
| Liabilities | ||
| Payable to custodian bank | $71,380 | |
| Payable for investments purchased | ||
| Regular delivery | 521,035 | |
| Delayed delivery | 44,749 | |
| Payable for fund shares redeemed | 436,104 | |
| Accrued management fee | 199,146 | |
| Distribution and service plan fees payable | 10,041 | |
| Other affiliated payables | 47,252 | |
| Other payables and accrued expenses | 78,569 | |
| Collateral on securities loaned, at value | 3,158,800 | |
| Total liabilities | 4,567,076 | |
| Net Assets | $313,576,448 | |
| Net Assets consist of: | ||
| Paid in capital | $303,103,887 | |
| Undistributed net investment income | 1,912,194 | |
| Accumulated undistributed net realized gain (loss) on investments and foreign currency transactions | (35,054,648) | |
| Net unrealized appreciation (depreciation) on investments and assets and liabilities in foreign currencies | 43,615,015 | |
| Net Assets | $313,576,448 | |
| Calculation of Maximum Offering Price | ||
| Class A: | ||
| Net Asset Value and redemption price per share ($8,818,273 ÷ 1,166,002 shares) | $7.56 | |
| Maximum offering price per share (100/94.25 of $7.56) | $8.02 | |
| Class T: | ||
| Net Asset Value and redemption price per share ($13,627,834 ÷ 1,793,896 shares) | $7.60 | |
| Maximum offering price per share (100/96.50 of $7.60) | $7.88 | |
| Class B: | ||
| Net Asset Value and offering price per share ($93,240 ÷ 12,203 shares)(a) | $7.64 | |
| Class C: | ||
| Net Asset Value and offering price per share ($3,077,150 ÷ 406,220 shares)(a) | $7.58 | |
| Total International Equity: | ||
| Net Asset Value, offering price and redemption price per share ($284,995,679 ÷ 37,639,906 shares) | $7.57 | |
| Class I: | ||
| Net Asset Value, offering price and redemption price per share ($2,964,272 ÷ 393,120 shares) | $7.54 |
(a) Redemption price per share is equal to net asset value less any applicable contingent deferred sales charge.
See accompanying notes which are an integral part of the financial statements.
Statement of Operations
| Six months ended April 30, 2016 (Unaudited) | ||
| Investment Income | ||
| Dividends | $4,405,366 | |
| Income from Fidelity Central Funds | 47,809 | |
| Income before foreign taxes withheld | 4,453,175 | |
| Less foreign taxes withheld | (400,599) | |
| Total income | 4,052,576 | |
| Expenses | ||
| Management fee | ||
| Basic fee | $1,101,234 | |
| Performance adjustment | 185,483 | |
| Transfer agent fees | 204,427 | |
| Distribution and service plan fees | 59,906 | |
| Accounting and security lending fees | 81,700 | |
| Custodian fees and expenses | 112,889 | |
| Independent trustees' compensation | 693 | |
| Registration fees | 33,115 | |
| Audit | 63,656 | |
| Legal | 868 | |
| Miscellaneous | 1,090 | |
| Total expenses before reductions | 1,845,061 | |
| Expense reductions | (13,581) | 1,831,480 |
| Net investment income (loss) | 2,221,096 | |
| Realized and Unrealized Gain (Loss) | ||
| Net realized gain (loss) on: | ||
| Investment securities: | ||
| Unaffiliated issuers | (5,285,836) | |
| Foreign currency transactions | 74,152 | |
| Total net realized gain (loss) | (5,211,684) | |
| Change in net unrealized appreciation (depreciation) on: Investment securities (net of decrease in deferred foreign taxes of $30,538) | (4,718,985) | |
| Assets and liabilities in foreign currencies | 3,044 | |
| Total change in net unrealized appreciation (depreciation) | (4,715,941) | |
| Net gain (loss) | (9,927,625) | |
| Net increase (decrease) in net assets resulting from operations | $(7,706,529) |
See accompanying notes which are an integral part of the financial statements.
Statement of Changes in Net Assets
| Six months ended April 30, 2016 (Unaudited) | Year ended October 31, 2015 | |
| Increase (Decrease) in Net Assets | ||
| Operations | ||
| Net investment income (loss) | $2,221,096 | $4,170,618 |
| Net realized gain (loss) | (5,211,684) | (5,852,740) |
| Change in net unrealized appreciation (depreciation) | (4,715,941) | (558,579) |
| Net increase (decrease) in net assets resulting from operations | (7,706,529) | (2,240,701) |
| Distributions to shareholders from net investment income | (3,869,339) | (5,482,469) |
| Distributions to shareholders from net realized gain | – | (1,726,810) |
| Total distributions | (3,869,339) | (7,209,279) |
| Share transactions - net increase (decrease) | (11,041,483) | (4,678,824) |
| Redemption fees | 426 | 1,289 |
| Total increase (decrease) in net assets | (22,616,925) | (14,127,515) |
| Net Assets | ||
| Beginning of period | 336,193,373 | 350,320,888 |
| End of period (including undistributed net investment income of $1,912,194 and undistributed net investment income of $3,560,437, respectively) | $313,576,448 | $336,193,373 |
See accompanying notes which are an integral part of the financial statements.
Financial Highlights — Fidelity Total International Equity Fund Class A
| Six months ended (Unaudited) April 30, | Years ended October 31, | |||||
| 2016 | 2015 | 2014 | 2013 | 2012 | 2011 | |
| Selected Per–Share Data | ||||||
| Net asset value, beginning of period | $7.79 | $8.00 | $8.27 | $7.31 | $6.67 | $7.36 |
| Income from Investment Operations | ||||||
| Net investment income (loss)A | .04 | .07 | .13 | .09 | .13 | .11 |
| Net realized and unrealized gain (loss) | (.21) | (.14) | (.12) | 1.24 | .59 | (.69) |
| Total from investment operations | (.17) | (.07) | .01 | 1.33 | .72 | (.58) |
| Distributions from net investment income | (.06) | (.10) | (.10) | (.13) | (.08) | (.09) |
| Distributions from net realized gain | – | (.04) | (.18) | (.25) | – | (.02) |
| Total distributions | (.06) | (.14) | (.28) | (.37)B | (.08) | (.11) |
| Redemption fees added to paid in capitalA,C | – | – | – | – | – | – |
| Net asset value, end of period | $7.56 | $7.79 | $8.00 | $8.27 | $7.31 | $6.67 |
| Total ReturnD,E,F | (2.18)% | (.89)% | .19% | 19.00% | 10.88% | (8.03)% |
| Ratios to Average Net AssetsG,H | ||||||
| Expenses before reductions | 1.53%I | 1.48% | 1.44% | 1.50% | 1.57% | 1.73% |
| Expenses net of fee waivers, if any | 1.45%I | 1.45% | 1.44% | 1.45% | 1.45% | 1.45% |
| Expenses net of all reductions | 1.45%I | 1.44% | 1.44% | 1.43% | 1.42% | 1.42% |
| Net investment income (loss) | 1.12%I | .86% | 1.63% | 1.21% | 1.88% | 1.44% |
| Supplemental Data | ||||||
| Net assets, end of period (000 omitted) | $8,818 | $9,163 | $9,164 | $9,034 | $5,767 | $4,307 |
| Portfolio turnover rateJ | 43%I | 53% | 85% | 89% | 110% | 75% |
A Calculated based on average shares outstanding during the period.
B Total distributions of $.37 per share is comprised of distributions from net investment income of $.126 and distributions from net realized gain of $.245 per share.
C Amount represents less than $.005 per share.
D Total returns for periods of less than one year are not annualized.
E Total returns would have been lower if certain expenses had not been reduced during the applicable periods shown.
F Total returns do not include the effect of the sales charges.
G Fees and expenses of any underlying Fidelity Central Funds are not included in the Fund's expense ratio. The Fund indirectly bears its proportionate share of the expenses of any underlying Fidelity Central Funds.
H Expense ratios reflect operating expenses of the class. Expenses before reductions do not reflect amounts reimbursed by the investment adviser or reductions from brokerage service arrangements or reductions from other expense offset arrangements and do not represent the amount paid by the class during periods when reimbursements or reductions occur. Expenses net of fee waivers reflect expenses after reimbursement by the investment adviser but prior to reductions from brokerage service arrangements or other expense offset arrangements. Expenses net of all reductions represent the net expenses paid by the class.
I Annualized
J Amount does not include the portfolio activity of any underlying Fidelity Central Funds.
See accompanying notes which are an integral part of the financial statements.
Financial Highlights — Fidelity Total International Equity Fund Class T
| Six months ended (Unaudited) April 30, | Years ended October 31, | |||||
| 2016 | 2015 | 2014 | 2013 | 2012 | 2011 | |
| Selected Per–Share Data | ||||||
| Net asset value, beginning of period | $7.81 | $8.04 | $8.32 | $7.37 | $6.73 | $7.41 |
| Income from Investment Operations | ||||||
| Net investment income (loss)A | .03 | .05 | .11 | .07 | .11 | .09 |
| Net realized and unrealized gain (loss) | (.20) | (.15) | (.12) | 1.25 | .59 | (.68) |
| Total from investment operations | (.17) | (.10) | (.01) | 1.32 | .70 | (.59) |
| Distributions from net investment income | (.04) | (.09) | (.09) | (.13) | (.06) | (.07) |
| Distributions from net realized gain | – | (.04) | (.18) | (.25) | – | (.02) |
| Total distributions | (.04) | (.13) | (.27) | (.37)B | (.06) | (.09) |
| Redemption fees added to paid in capitalA,C | – | – | – | – | – | – |
| Net asset value, end of period | $7.60 | $7.81 | $8.04 | $8.32 | $7.37 | $6.73 |
| Total ReturnD,E,F | (2.15)% | (1.26)% | (.06)% | 18.73% | 10.52% | (8.08)% |
| Ratios to Average Net AssetsG,H | ||||||
| Expenses before reductions | 1.75%I | 1.70% | 1.68% | 1.75% | 1.84% | 2.02% |
| Expenses net of fee waivers, if any | 1.70%I | 1.70% | 1.68% | 1.70% | 1.70% | 1.70% |
| Expenses net of all reductions | 1.70%I | 1.69% | 1.68% | 1.67% | 1.67% | 1.67% |
| Net investment income (loss) | .87%I | .61% | 1.38% | .96% | 1.63% | 1.19% |
| Supplemental Data | ||||||
| Net assets, end of period (000 omitted) | $13,628 | $13,962 | $10,282 | $7,909 | $2,348 | $997 |
| Portfolio turnover rateJ | 43%I | 53% | 85% | 89% | 110% | 75% |
A Calculated based on average shares outstanding during the period.
B Total distributions of $.37 per share is comprised of distributions from net investment income of $.128 and distributions from net realized gain of $.245 per share.
C Amount represents less than $.005 per share.
D Total returns for periods of less than one year are not annualized.
E Total returns would have been lower if certain expenses had not been reduced during the applicable periods shown.
F Total returns do not include the effect of the sales charges.
G Fees and expenses of any underlying Fidelity Central Funds are not included in the Fund's expense ratio. The Fund indirectly bears its proportionate share of the expenses of any underlying Fidelity Central Funds.
H Expense ratios reflect operating expenses of the class. Expenses before reductions do not reflect amounts reimbursed by the investment adviser or reductions from brokerage service arrangements or reductions from other expense offset arrangements and do not represent the amount paid by the class during periods when reimbursements or reductions occur. Expenses net of fee waivers reflect expenses after reimbursement by the investment adviser but prior to reductions from brokerage service arrangements or other expense offset arrangements. Expenses net of all reductions represent the net expenses paid by the class.
I Annualized
J Amount does not include the portfolio activity of any underlying Fidelity Central Funds.
See accompanying notes which are an integral part of the financial statements.
Financial Highlights — Fidelity Total International Equity Fund Class B
| Six months ended (Unaudited) April 30, | Years ended October 31, | |||||
| 2016 | 2015 | 2014 | 2013 | 2012 | 2011 | |
| Selected Per–Share Data | ||||||
| Net asset value, beginning of period | $7.84 | $8.05 | $8.31 | $7.33 | $6.68 | $7.37 |
| Income from Investment Operations | ||||||
| Net investment income (loss)A | .01 | .01 | .07 | .04 | .08 | .05 |
| Net realized and unrealized gain (loss) | (.21) | (.14) | (.12) | 1.24 | .59 | (.68) |
| Total from investment operations | (.20) | (.13) | (.05) | 1.28 | .67 | (.63) |
| Distributions from net investment income | – | (.04) | (.03) | (.05) | (.02) | (.04) |
| Distributions from net realized gain | – | (.04) | (.18) | (.25) | – | (.02) |
| Total distributions | – | (.08) | (.21) | (.30) | (.02) | (.06) |
| Redemption fees added to paid in capitalA,B | – | – | – | – | – | – |
| Net asset value, end of period | $7.64 | $7.84 | $8.05 | $8.31 | $7.33 | $6.68 |
| Total ReturnC,D,E | (2.55)% | (1.62)% | (.56)% | 18.05% | 10.05% | (8.66)% |
| Ratios to Average Net AssetsF,G | ||||||
| Expenses before reductions | 2.30%H | 2.26% | 2.22% | 2.26% | 2.34% | 2.51% |
| Expenses net of fee waivers, if any | 2.20%H | 2.20% | 2.20% | 2.20% | 2.20% | 2.20% |
| Expenses net of all reductions | 2.20%H | 2.19% | 2.20% | 2.18% | 2.17% | 2.17% |
| Net investment income (loss) | .37%H | .11% | .87% | .46% | 1.13% | .69% |
| Supplemental Data | ||||||
| Net assets, end of period (000 omitted) | $93 | $120 | $168 | $192 | $220 | $254 |
| Portfolio turnover rateI | 43%H | 53% | 85% | 89% | 110% | 75% |
A Calculated based on average shares outstanding during the period.
B Amount represents less than $.005 per share.
C Total returns for periods of less than one year are not annualized.
D Total returns would have been lower if certain expenses had not been reduced during the applicable periods shown.
E Total returns do not include the effect of the contingent deferred sales charge.
F Fees and expenses of any underlying Fidelity Central Funds are not included in the Fund's expense ratio. The Fund indirectly bears its proportionate share of the expenses of any underlying Fidelity Central Funds.
G Expense ratios reflect operating expenses of the class. Expenses before reductions do not reflect amounts reimbursed by the investment adviser or reductions from brokerage service arrangements or reductions from other expense offset arrangements and do not represent the amount paid by the class during periods when reimbursements or reductions occur. Expenses net of fee waivers reflect expenses after reimbursement by the investment adviser but prior to reductions from brokerage service arrangements or other expense offset arrangements. Expenses net of all reductions represent the net expenses paid by the class.
H Annualized
I Amount does not include the portfolio activity of any underlying Fidelity Central Funds.
See accompanying notes which are an integral part of the financial statements.
Financial Highlights — Fidelity Total International Equity Fund Class C
| Six months ended (Unaudited) April 30, | Years ended October 31, | |||||
| 2016 | 2015 | 2014 | 2013 | 2012 | 2011 | |
| Selected Per–Share Data | ||||||
| Net asset value, beginning of period | $7.77 | $8.00 | $8.28 | $7.31 | $6.67 | $7.36 |
| Income from Investment Operations | ||||||
| Net investment income (loss)A | .01 | .01 | .07 | .04 | .08 | .05 |
| Net realized and unrealized gain (loss) | (.20) | (.15) | (.12) | 1.25 | .58 | (.69) |
| Total from investment operations | (.19) | (.14) | (.05) | 1.29 | .66 | (.64) |
| Distributions from net investment income | – | (.05) | (.05) | (.08) | (.02) | (.03) |
| Distributions from net realized gain | – | (.04) | (.18) | (.25) | – | (.02) |
| Total distributions | – | (.09) | (.23) | (.32)B | (.02) | (.05) |
| Redemption fees added to paid in capitalA,C | – | – | – | – | – | – |
| Net asset value, end of period | $7.58 | $7.77 | $8.00 | $8.28 | $7.31 | $6.67 |
| Total ReturnD,E,F | (2.45)% | (1.73)% | (.57)% | 18.30% | 9.98% | (8.72)% |
| Ratios to Average Net AssetsG,H | ||||||
| Expenses before reductions | 2.31%I | 2.26% | 2.22% | 2.26% | 2.31% | 2.51% |
| Expenses net of fee waivers, if any | 2.20%I | 2.20% | 2.20% | 2.20% | 2.20% | 2.20% |
| Expenses net of all reductions | 2.20%I | 2.19% | 2.20% | 2.18% | 2.17% | 2.17% |
| Net investment income (loss) | .37%I | .11% | .87% | .46% | 1.13% | .69% |
| Supplemental Data | ||||||
| Net assets, end of period (000 omitted) | $3,077 | $3,311 | $4,028 | $3,584 | $2,737 | $1,396 |
| Portfolio turnover rateJ | 43%I | 53% | 85% | 89% | 110% | 75% |
A Calculated based on average shares outstanding during the period.
B Total distributions of $.32 per share is comprised of distributions from net investment income of $.075 and distributions from net realized gain of $.245 per share.
C Amount represents less than $.005 per share.
D Total returns for periods of less than one year are not annualized.
E Total returns would have been lower if certain expenses had not been reduced during the applicable periods shown.
F Total returns do not include the effect of the contingent deferred sales charge.
G Fees and expenses of any underlying Fidelity Central Funds are not included in the Fund's expense ratio. The Fund indirectly bears its proportionate share of the expenses of any underlying Fidelity Central Funds.
H Expense ratios reflect operating expenses of the class. Expenses before reductions do not reflect amounts reimbursed by the investment adviser or reductions from brokerage service arrangements or reductions from other expense offset arrangements and do not represent the amount paid by the class during periods when reimbursements or reductions occur. Expenses net of fee waivers reflect expenses after reimbursement by the investment adviser but prior to reductions from brokerage service arrangements or other expense offset arrangements. Expenses net of all reductions represent the net expenses paid by the class.
I Annualized
J Amount does not include the portfolio activity of any underlying Fidelity Central Funds.
See accompanying notes which are an integral part of the financial statements.
Financial Highlights — Fidelity Total International Equity Fund
| Six months ended (Unaudited) April 30, | Years ended October 31, | |||||
| 2016 | 2015 | 2014 | 2013 | 2012 | 2011 | |
| Selected Per–Share Data | ||||||
| Net asset value, beginning of period | $7.82 | $8.03 | $8.29 | $7.32 | $6.69 | $7.37 |
| Income from Investment Operations | ||||||
| Net investment income (loss)A | .05 | .10 | .16 | .12 | .15 | .12 |
| Net realized and unrealized gain (loss) | (.20) | (.14) | (.12) | 1.24 | .58 | (.68) |
| Total from investment operations | (.15) | (.04) | .04 | 1.36 | .73 | (.56) |
| Distributions from net investment income | (.10) | (.13) | (.12) | (.15) | (.10) | (.10) |
| Distributions from net realized gain | – | (.04) | (.18) | (.25) | – | (.02) |
| Total distributions | (.10) | (.17) | (.30) | (.39)B | (.10) | (.12) |
| Redemption fees added to paid in capitalA,C | – | – | – | – | – | – |
| Net asset value, end of period | $7.57 | $7.82 | $8.03 | $8.29 | $7.32 | $6.69 |
| Total ReturnD,E | (2.00)% | (.51)% | .55% | 19.48% | 11.03% | (7.70)% |
| Ratios to Average Net AssetsF,G | ||||||
| Expenses before reductions | 1.12%H�� | 1.07% | 1.04% | 1.09% | 1.16% | 1.42% |
| Expenses net of fee waivers, if any | 1.12%H | 1.07% | 1.04% | 1.09% | 1.16% | 1.20% |
| Expenses net of all reductions | 1.12%H | 1.06% | 1.04% | 1.07% | 1.13% | 1.17% |
| Net investment income (loss) | 1.46%H | 1.24% | 2.03% | 1.57% | 2.16% | 1.69% |
| Supplemental Data | ||||||
| Net assets, end of period (000 omitted) | $284,996 | $307,035 | $324,438 | $324,395 | $281,979 | $131,338 |
| Portfolio turnover rateI | 43%H | 53% | 85% | 89% | 110% | 75% |
A Calculated based on average shares outstanding during the period.
B Total distributions of $.39 per share is comprised of distributions from net investment income of $.148 and distributions from net realized gain of $.245 per share.
C Amount represents less than $.005 per share.
D Total returns for periods of less than one year are not annualized.
E Total returns would have been lower if certain expenses had not been reduced during the applicable periods shown.
F Fees and expenses of any underlying Fidelity Central Funds are not included in the Fund's expense ratio. The Fund indirectly bears its proportionate share of the expenses of any underlying Fidelity Central Funds.
G Expense ratios reflect operating expenses of the class. Expenses before reductions do not reflect amounts reimbursed by the investment adviser or reductions from brokerage service arrangements or reductions from other expense offset arrangements and do not represent the amount paid by the class during periods when reimbursements or reductions occur. Expenses net of fee waivers reflect expenses after reimbursement by the investment adviser but prior to reductions from brokerage service arrangements or other expense offset arrangements. Expenses net of all reductions represent the net expenses paid by the class.
H Annualized
I Amount does not include the portfolio activity of any underlying Fidelity Central Funds.
See accompanying notes which are an integral part of the financial statements.
Financial Highlights — Fidelity Total International Equity Fund Class I
| Six months ended (Unaudited) April 30, | Years ended October 31, | |||||
| 2016 | 2015 | 2014 | 2013 | 2012 | 2011 | |
| Selected Per–Share Data | ||||||
| Net asset value, beginning of period | $7.78 | $7.99 | $8.26 | $7.30 | $6.67 | $7.35 |
| Income from Investment Operations | ||||||
| Net investment income (loss)A | .05 | .09 | .15 | .11 | .14 | .12 |
| Net realized and unrealized gain (loss) | (.20) | (.14) | (.12) | 1.24 | .59 | (.68) |
| Total from investment operations | (.15) | (.05) | .03 | 1.35 | .73 | (.56) |
| Distributions from net investment income | (.09) | (.12) | (.12) | (.15) | (.10) | (.10) |
| Distributions from net realized gain | – | (.04) | (.18) | (.25) | – | (.02) |
| Total distributions | (.09) | (.16) | (.30) | (.39)B | (.10) | (.12) |
| Redemption fees added to paid in capitalA,C | – | – | – | – | – | – |
| Net asset value, end of period | $7.54 | $7.78 | $7.99 | $8.26 | $7.30 | $6.67 |
| Total ReturnD,E | (1.99)% | (.64)% | .37% | 19.40% | 11.06% | (7.72)% |
| Ratios to Average Net AssetsF,G | ||||||
| Expenses before reductions | 1.24%H | 1.17% | 1.15% | 1.21% | 1.27% | 1.48% |
| Expenses net of fee waivers, if any | 1.20%H | 1.17% | 1.15% | 1.20% | 1.20% | 1.20% |
| Expenses net of all reductions | 1.20%H | 1.16% | 1.15% | 1.18% | 1.17% | 1.17% |
| Net investment income (loss) | 1.37%H | 1.14% | 1.91% | 1.46% | 2.13% | 1.69% |
| Supplemental Data | ||||||
| Net assets, end of period (000 omitted) | $2,964 | $2,602 | $2,240 | $2,372 | $1,514 | $197 |
| Portfolio turnover rateI | 43%H | 53% | 85% | 89% | 110% | 75% |
A Calculated based on average shares outstanding during the period.
B Total distributions of $.39 per share is comprised of distributions from net investment income of $.148 and distributions from net realized gain of $.245 per share.
C Amount represents less than $.005 per share.
D Total returns for periods of less than one year are not annualized.
E Total returns would have been lower if certain expenses had not been reduced during the applicable periods shown.
F Fees and expenses of any underlying Fidelity Central Funds are not included in the Fund's expense ratio. The Fund indirectly bears its proportionate share of the expenses of any underlying Fidelity Central Funds.
G Expense ratios reflect operating expenses of the class. Expenses before reductions do not reflect amounts reimbursed by the investment adviser or reductions from brokerage service arrangements or reductions from other expense offset arrangements and do not represent the amount paid by the class during periods when reimbursements or reductions occur. Expenses net of fee waivers reflect expenses after reimbursement by the investment adviser but prior to reductions from brokerage service arrangements or other expense offset arrangements. Expenses net of all reductions represent the net expenses paid by the class.
H Annualized
I Amount does not include the portfolio activity of any underlying Fidelity Central Funds.
See accompanying notes which are an integral part of the financial statements.
Notes to Financial Statements (Unaudited)
For the period ended April 30, 2016
1. Organization.
Fidelity Total International Equity Fund (the Fund) is a fund of Fidelity Investment Trust (the Trust) and is authorized to issue an unlimited number of shares. The Trust is registered under the Investment Company Act of 1940, as amended (the 1940 Act), as an open-end management investment company organized as a Massachusetts business trust. The Fund offers Class A, Class T, Class C, Total International Equity and Class I shares, each of which, along with Class B shares, has equal rights as to assets and voting privileges. Class B shares are closed to new accounts and additional purchases, except for exchanges and reinvestments. Each class has exclusive voting rights with respect to matters that affect that class. Class B shares will automatically convert to Class A shares after a maximum holding period of seven years from the initial date of purchase. The Fund's investments in emerging markets can be subject to social, economic, regulatory, and political uncertainties and can be extremely volatile.
During the period, the Board of Trustees approved the conversion of all existing Class B shares into Class A shares, effective on or about July 1, 2016, regardless of the length of times shares have been held.
2. Investments in Fidelity Central Funds.
The Fund invests in Fidelity Central Funds, which are open-end investment companies generally available only to other investment companies and accounts managed by the investment adviser and its affiliates. The Fund's Schedule of Investments lists each of the Fidelity Central Funds held as of period end, if any, as an investment of the Fund, but does not include the underlying holdings of each Fidelity Central Fund. As an Investing Fund, the Fund indirectly bears its proportionate share of the expenses of the underlying Fidelity Central Funds.
The Money Market Central Funds seek preservation of capital and current income and are managed by Fidelity Investments Money Management, Inc. (FIMM), an affiliate of the investment adviser. Annualized expenses of the Money Market Central Funds as of their most recent shareholder report date are less than .005%.
A complete unaudited list of holdings for each Fidelity Central Fund is available upon request or at the Securities and Exchange Commission (the SEC) website at www.sec.gov. In addition, the financial statements of the Fidelity Central Funds are available on the SEC website or upon request.
3. Significant Accounting Policies.
The financial statements have been prepared in conformity with accounting principles generally accepted in the United States of America (GAAP), which require management to make certain estimates and assumptions at the date of the financial statements. Actual results could differ from those estimates. Subsequent events, if any, through the date that the financial statements were issued have been evaluated in the preparation of the financial statements. The following summarizes the significant accounting policies of the Fund:
Investment Valuation. Investments are valued as of 4:00 p.m. Eastern time on the last calendar day of the period. The Board of Trustees (the Board) has delegated the day to day responsibility for the valuation of the Fund's investments to the Fidelity Management & Research Company (FMR) Fair Value Committee (the Committee). In accordance with valuation policies and procedures approved by the Board, the Fund attempts to obtain prices from one or more third party pricing vendors or brokers to value its investments. When current market prices, quotations or currency exchange rates are not readily available or reliable, investments will be fair valued in good faith by the Committee, in accordance with procedures adopted by the Board. Factors used in determining fair value vary by investment type and may include market or investment specific events. The frequency with which these procedures are used cannot be predicted and they may be utilized to a significant extent. The Committee oversees the Fund's valuation policies and procedures and reports to the Board on the Committee's activities and fair value determinations. The Board monitors the appropriateness of the procedures used in valuing the Fund's investments and ratifies the fair value determinations of the Committee.
The Fund categorizes the inputs to valuation techniques used to value its investments into a disclosure hierarchy consisting of three levels as shown below:
- Level 1 – quoted prices in active markets for identical investments
- Level 2 – other significant observable inputs (including quoted prices for similar investments, interest rates, prepayment speeds, etc.)
- Level 3 – unobservable inputs (including the Fund's own assumptions based on the best information available)
Valuation techniques used to value the Fund's investments by major category are as follows:
Equity securities, including restricted securities, for which market quotations are readily available, are valued at the last reported sale price or official closing price as reported by a third party pricing vendor on the primary market or exchange on which they are traded and are categorized as Level 1 in the hierarchy. In the event there were no sales during the day or closing prices are not available, securities are valued at the last quoted bid price or may be valued using the last available price and are generally categorized as Level 2 in the hierarchy. For foreign equity securities, when market or security specific events arise, comparisons to the valuation of American Depositary Receipts (ADRs), futures contracts, Exchange-Traded Funds (ETFs) and certain indexes as well as quoted prices for similar securities may be used and would be categorized as Level 2 in the hierarchy. Utilizing these techniques may result in transfers between Level 1 and Level 2. For equity securities, including restricted securities, where observable inputs are limited, assumptions about market activity and risk are used and these securities may be categorized as Level 3 in the hierarchy.
Investments in open-end mutual funds, including the Fidelity Central Funds, are valued at their closing net asset value (NAV) each business day and are categorized as Level 1 in the hierarchy.
Changes in valuation techniques may result in transfers in or out of an assigned level within the disclosure hierarchy. The aggregate value of investments by input level as of April 30, 2016, including information on transfers between Levels 1 and 2 is included at the end of the Fund's Schedule of Investments.
Foreign Currency. The Fund may use foreign currency contracts to facilitate transactions in foreign-denominated securities. Gains and losses from these transactions may arise from changes in the value of the foreign currency or if the counterparties do not perform under the contracts' terms.
Foreign-denominated assets, including investment securities, and liabilities are translated into U.S. dollars at the exchange rates at period end. Purchases and sales of investment securities, income and dividends received and expenses denominated in foreign currencies are translated into U.S. dollars at the exchange rate in effect on the transaction date.
The effects of exchange rate fluctuations on investments are included with the net realized and unrealized gain (loss) on investment securities. Other foreign currency transactions resulting in realized and unrealized gain (loss) are disclosed separately.
Investment Transactions and Income. For financial reporting purposes, the Fund's investment holdings and NAV include trades executed through the end of the last business day of the period. The NAV per share for processing shareholder transactions is calculated as of the close of business of the New York Stock Exchange (NYSE), normally 4:00 p.m. Eastern time and includes trades executed through the end of the prior business day. Gains and losses on securities sold are determined on the basis of identified cost. Dividend income is recorded on the ex-dividend date, except for certain dividends from foreign securities where the ex-dividend date may have passed, which are recorded as soon as the Fund is informed of the ex-dividend date. Non-cash dividends included in dividend income, if any, are recorded at the fair market value of the securities received. Income and capital gain distributions from Fidelity Central Funds, if any, are recorded on the ex-dividend date. Distributions received on securities that represent a return of capital or capital gain are recorded as a reduction of cost of investments and/or as a realized gain. Subsequent to ex-dividend date the Fund determines the components of these distributions, based upon receipt of tax filings or other correspondence relating to the underlying investment. Interest income is accrued as earned and includes coupon interest and amortization of premium and accretion of discount on debt securities as applicable. Investment income is recorded net of foreign taxes withheld where recovery of such taxes is uncertain.
Class Allocations and Expenses. Investment income, realized and unrealized capital gains and losses, common expenses of the Fund, and certain fund-level expense reductions, if any, are allocated daily on a pro-rata basis to each class based on the relative net assets of each class to the total net assets of the Fund. Each class differs with respect to transfer agent and distribution and service plan fees incurred. Certain expense reductions may also differ by class. For the reporting period, the allocated portion of income and expenses to each class as a percent of its average net assets may vary due to the timing of recording these transactions in relation to fluctuating net assets of the classes. Expenses directly attributable to a fund are charged to that fund. Expenses attributable to more than one fund are allocated among the respective funds on the basis of relative net assets or other appropriate methods. Expense estimates are accrued in the period to which they relate and adjustments are made when actual amounts are known.
Income Tax Information and Distributions to Shareholders. Each year, the Fund intends to qualify as a regulated investment company under Subchapter M of the Internal Revenue Code, including distributing substantially all of its taxable income and realized gains. As a result, no provision for U.S. Federal income taxes is required. The Fund files a U.S. federal tax return, in addition to state and local tax returns as required. The Fund's federal income tax returns are subject to examination by the Internal Revenue Service (IRS) for a period of three fiscal years after they are filed. State and local tax returns may be subject to examination for an additional fiscal year depending on the jurisdiction. Foreign taxes are provided for based on the Fund's understanding of the tax rules and rates that exist in the foreign markets in which it invests. The Fund is subject to a tax imposed on capital gains by certain countries in which it invests.
Distributions are declared and recorded on the ex-dividend date. Income dividends and capital gain distributions are declared separately for each class. Income and capital gain distributions are determined in accordance with income tax regulations, which may differ from GAAP.
Capital accounts within the financial statements are adjusted for permanent book-tax differences. These adjustments have no impact on net assets or the results of operations. Capital accounts are not adjusted for temporary book-tax differences which will reverse in a subsequent period.
Book-tax differences are primarily due to foreign currency transactions, partnerships, certain foreign taxes, passive foreign investment companies (PFIC), capital loss carryforwards and losses deferred due to wash sales.
The federal tax cost of investment securities and unrealized appreciation (depreciation) as of period end were as follows:
| Gross unrealized appreciation | $ 56,805,584 |
| Gross unrealized depreciation | (15,433,463) |
| Net unrealized appreciation (depreciation) on securities | $41,372,121 |
| Tax cost | $274,390,114 |
Capital loss carryforwards are only available to offset future capital gains of the Fund to the extent provided by regulations and may be limited. Under the Regulated Investment Company Modernization Act of 2010 (the Act), the Fund is permitted to carry forward capital losses incurred in taxable years beginning after December 22, 2010 for an unlimited period and such capital losses are required to be used prior to any losses that expire. The capital loss carryforward information presented below, including any applicable limitation, is estimated as of prior fiscal period end and is subject to adjustment.
| Fiscal year of expiration | |
| 2017 | $(13,607,298) |
| 2019 | (8,855,997) |
| Total with expiration | $(22,463,295) |
| No expiration | |
| Short-term | (5,613,592) |
| Total capital loss carryforward | $(28,076,887) |
Due to large subscriptions in a prior period, $22,463,295 of capital losses that will be available to offset future capital gains of the Fund will be limited to approximately $4,535,766 per year.
Short-Term Trading (Redemption) Fees. Shares held by investors in the Fund less than 30 days may have been subject to a redemption fee equal to 1.00% of the NAV of shares redeemed. All redemption fees, which reduce the proceeds of the shareholder redemption, are retained by the Fund and accounted for as an addition to paid in capital.
Delayed Delivery Transactions and When-Issued Securities. During the period, the Fund transacted in securities on a delayed delivery or when-issued basis. Payment and delivery may take place after the customary settlement period for that security. The price of the underlying securities and the date when the securities will be delivered and paid for are fixed at the time the transaction is negotiated. The securities purchased on a delayed delivery or when-issued basis are identified as such in the Fund's Schedule of Investments. With respect to purchase commitments, the Fund identifies securities as segregated in its records with a value at least equal to the amount of the commitment. Losses may arise due to changes in the value of the underlying securities or if the counterparty does not perform under the contract's terms, or if the issuer does not issue the securities due to political, economic, or other factors.
4. Purchases and Sales of Investments.
Purchases and sales of securities, other than short-term securities, aggregated $67,742,727 and $81,527,820, respectively.
5. Fees and Other Transactions with Affiliates.
Management Fee. Fidelity Management & Research Company (the investment adviser) and its affiliates provide the Fund with investment management related services for which the Fund pays a monthly management fee. The management fee is the sum of an individual fund fee rate that is based on an annual rate of .45% of the Fund's average net assets and an annualized group fee rate that averaged .25% during the period. The group fee rate is based upon the average net assets of all the mutual funds advised by the investment adviser, including any mutual funds previously advised by the investment adviser that are currently advised by Fidelity SelectCo, LLC, an affiliate of the investment adviser. The group fee rate decreases as assets under management increase and increases as assets under management decrease. In addition, the management fee is subject to a performance adjustment (up to a maximum of +/- .20% of the Fund's average net assets over a 36 month performance period). The upward or downward adjustment to the management fee is based on the relative investment performance of Total International Equity as compared to its benchmark index, the MSCI All Country World ex USA Index, over the same 36 month performance period. For the reporting period, the total annualized management fee rate, including the performance adjustment, was .82% of the Fund's average net assets. The performance adjustment included in the management fee rate may be higher or lower than the maximum performance adjustment rate due to the difference between the average net assets for the reporting and performance periods.
Distribution and Service Plan Fees. In accordance with Rule 12b-1 of the 1940 Act, the Fund has adopted separate Distribution and Service Plans for each class of shares. Certain classes pay Fidelity Distributors Corporation (FDC), an affiliate of the investment adviser, separate Distribution and Service Fees, each of which is based on an annual percentage of each class' average net assets. In addition, FDC may pay financial intermediaries for selling shares of the Fund and providing shareholder support services. For the period, the Distribution and Service Fee rates, total fees and amounts retained by FDC were as follows:
| Distribution Fee | Service Fee | Total Fees | Retained by FDC | |
| Class A | -% | .25% | $10,969 | $810 |
| Class T | .25% | .25% | 32,951 | 57 |
| Class B | .75% | .25% | 515 | 386 |
| Class C | .75% | .25% | 15,471 | 2,767 |
| $59,906 | $4,020 |
Sales Load. FDC may receive a front-end sales charge of up to 5.75% for selling Class A shares and 3.50% for selling Class T shares, some of which is paid to financial intermediaries for selling shares of the Fund. Depending on the holding period, FDC may receive contingent deferred sales charges levied on Class A, Class T, Class B, and Class C redemptions. The deferred sales charges range from 5.00% to 1.00% for Class B shares, 1.00% for Class C shares, 1.00% for certain purchases of Class A shares and .25% for certain purchases of Class T shares.
For the period, sales charge amounts retained by FDC were as follows:
| Retained by FDC | |
| Class A | $1,356 |
| Class T | 488 |
| Class B(a) | – |
| Class C(a) | 295 |
| $2,139 |
(a) When Class B and Class C shares are initially sold, FDC pays commissions from its own resources to financial intermediaries through which the sales are made.
Transfer Agent Fees. Fidelity Investments Institutional Operations Company, Inc., (FIIOC), an affiliate of the investment adviser, is the transfer, dividend disbursing and shareholder servicing agent for each class of the Fund. FIIOC receives account fees and asset-based fees that vary according to the account size and type of account of the shareholders of the respective classes of the Fund. FIIOC pays for typesetting, printing and mailing of shareholder reports, except proxy statements.
For the period, transfer agent fees for each class were as follows:
| Amount | % of Class-Level Average Net Assets(a) | |
| Class A | $12,141 | .28 |
| Class T | 16,142 | .24 |
| Class B | 152 | .30 |
| Class C | 4,828 | .31 |
| Total International Equity | 168,031 | .12 |
| Class I | 3,133 | .24 |
| $204,427 |
(a) Annualized
Accounting and Security Lending Fees. Fidelity Service Company, Inc. (FSC), an affiliate of the investment adviser, maintains the Fund's accounting records. The accounting fee is based on the level of average net assets for each month. Under a separate contract, FSC administers the security lending program. The security lending fee is based on the number and duration of lending transactions.
Brokerage Commissions. The Fund placed a portion of its portfolio transactions with brokerage firms which are affiliates of the investment adviser. Brokerage commissions are included in net realized gain (loss) and change in net unrealized appreciation (depreciation) in the Statement of Operations. The commissions paid to these affiliated firms were $330 for the period.
Interfund Trades. The Fund may purchase from or sell securities to other Fidelity Funds under procedures adopted by the Board. The procedures have been designed to ensure these interfund trades are executed in accordance with Rule 17a-7 of the 1940 Act. Interfund trades are included within the respective purchases and sales amounts shown in the Purchases and Sales of Investments note.
6. Committed Line of Credit.
The Fund participates with other funds managed by the investment adviser or an affiliate in a $4.25 billion credit facility (the "line of credit") to be utilized for temporary or emergency purposes to fund shareholder redemptions or for other short-term liquidity purposes. The Fund has agreed to pay commitment fees on its pro-rata portion of the line of credit, which amounted to $282 and is reflected in Miscellaneous expenses on the Statement of Operations. During the period, the Fund did not borrow on this line of credit.
7. Security Lending.
The Fund lends portfolio securities through a lending agent from time to time in order to earn additional income. For equity securities, a lending agent is used and may loan securities to certain qualified borrowers, including Fidelity Capital Markets (FCM), a broker-dealer affiliated with the Fund. On the settlement date of the loan, the Fund receives collateral (in the form of U.S. Treasury obligations, letters of credit and/or cash) against the loaned securities and maintains collateral in an amount not less than 100% of the market value of the loaned securities during the period of the loan. The market value of the loaned securities is determined at the close of business of the Fund and any additional required collateral is delivered to the Fund on the next business day. The Fund or borrower may terminate the loan at any time, and if the borrower defaults on its obligation to return the securities loaned because of insolvency or other reasons, the Fund may apply collateral received from the borrower against the obligation. The Fund may experience delays and costs in recovering the securities loaned. Any cash collateral received is invested in the Fidelity Securities Lending Cash Central Fund. The value of loaned securities and cash collateral at period end are disclosed on the Fund's Statement of Assets and Liabilities. Security lending income represents the income earned on investing cash collateral, less rebates paid to borrowers and any lending agent fees associated with the loan, plus any premium payments received for lending certain types of securities. Security lending income is presented in the Statement of Operations as a component of income from Fidelity Central Funds. Total security lending income during the period amounted to $41,244. During the period, there were no securities loaned to FCM.
8. Expense Reductions.
The investment adviser contractually agreed to reimburse each class to the extent annual operating expenses exceeded certain levels of average net assets as noted in the table below. This reimbursement will remain in place through December 31, 2016. Some expenses, for example interest expense, including commitment fees, are excluded from this reimbursement.
The following classes were in reimbursement during the period:
| Expense Limitations | Reimbursement | |
| Class A | 1.45% | $3,471 |
| Class T | 1.70% | 3,118 |
| Class B | 2.20% | 49 |
| Class C | 2.20% | 1,763 |
| Class I | 1.20% | 563 |
| $8,964 |
Commissions paid to certain brokers with whom the investment adviser, or its affiliates, places trades on behalf of the Fund include an amount in addition to trade execution, which may be rebated back to the Fund to offset certain expenses. This amount totaled $3,442 for the period.
In addition, during the period the investment adviser reimbursed and/or waived a portion of fund-level operating expenses in the amount of $1,175.
9. Distributions to Shareholders.
Distributions to shareholders of each class were as follows:
| Six months ended April 30, 2016 | Year ended October 31, 2015 | |
| From net investment income | ||
| Class A | $72,361 | $113,499 |
| Class T | 77,358 | 118,041 |
| Class B | – | 852 |
| Class C | – | 26,493 |
| Total International Equity | 3,691,251 | 5,189,901 |
| Class I | 28,369 | 33,683 |
| Total | $3,869,339 | $5,482,469 |
| From net realized gain | ||
| Class A | $– | $45,400 |
| Class T | – | 52,463 |
| Class B | – | 832 |
| Class C | – | 19,994 |
| Total International Equity | – | 1,596,893 |
| Class I | – | 11,228 |
| Total | $– | $1,726,810 |
10. Share Transactions.
Share transactions for each class were as follows and may contain automatic conversions between classes or exchanges between affiliated funds:
| Shares | Shares | Dollars | Dollars | |
| Six months ended April 30, 2016 | Year ended October 31, 2015 | Six months ended April 30, 2016 | Year ended October 31, 2015 | |
| Class A | ||||
| Shares sold | 125,145 | 302,437 | $923,609 | $2,413,258 |
| Reinvestment of distributions | 9,322 | 20,115 | 71,782 | 158,306 |
| Shares redeemed | (145,056) | (290,995) | (1,062,034) | (2,277,557) |
| Net increase (decrease) | (10,589) | 31,557 | $(66,643) | $294,007 |
| Class T | ||||
| Shares sold | 242,570 | 824,018 | $1,805,986 | $6,637,966 |
| Reinvestment of distributions | 9,988 | 21,537 | 77,308 | 170,355 |
| Shares redeemed | (245,478) | (337,655) | (1,795,924) | (2,691,540) |
| Net increase (decrease) | 7,080 | 507,900 | $87,370 | $4,116,781 |
| Class B | ||||
| Shares sold | 1,079 | 2,293 | $7,667 | $19,363 |
| Reinvestment of distributions | – | 210 | – | 1,675 |
| Shares redeemed | (4,239) | (7,999) | (31,696) | (62,934) |
| Net increase (decrease) | (3,160) | (5,496) | $(24,029) | $(41,896) |
| Class C | ||||
| Shares sold | 40,022 | 142,460 | $294,781 | $1,136,553 |
| Reinvestment of distributions | – | 4,767 | – | 37,661 |
| Shares redeemed | (60,109) | (224,769) | (446,353) | (1,823,746) |
| Net increase (decrease) | (20,087) | (77,542) | $(151,572) | $(649,532) |
| Total International Equity | ||||
| Shares sold | 2,536,155 | 6,834,390 | $18,902,576 | $54,586,662 |
| Reinvestment of distributions | 471,692 | 851,193 | 3,632,026 | 6,698,889 |
| Shares redeemed | (4,642,011) | (8,793,992) | (33,862,381) | (70,164,751) |
| Net increase (decrease) | (1,634,164) | (1,108,409) | $(11,327,779) | $(8,879,200) |
| Class I | ||||
| Shares sold | 102,309 | 149,022 | $761,726 | $1,222,878 |
| Reinvestment of distributions | 3,671 | 5,728 | 28,160 | 44,910 |
| Shares redeemed | (47,313) | (100,501) | (348,716) | (786,772) |
| Net increase (decrease) | 58,667 | 54,249 | $441,170 | $481,016 |
11. Other.
The Fund's organizational documents provide former and current trustees and officers with a limited indemnification against liabilities arising in connection with the performance of their duties to the Fund. In the normal course of business, the Fund may also enter into contracts that provide general indemnifications. The Fund's maximum exposure under these arrangements is unknown as this would be dependent on future claims that may be made against the Fund. The risk of material loss from such claims is considered remote.
At the end of the period, a shareholder of record owned approximately 71% of the total outstanding shares of the Fund.
Shareholder Expense Example
As a shareholder of the Fund, you incur two types of costs: (1) transaction costs, including sales charges (loads) on purchase payments or redemption proceeds, redemption fees and (2) ongoing costs, including management fees, distribution and/or service (12b-1) fees and other Fund expenses. This Example is intended to help you understand your ongoing costs (in dollars) of investing in the Fund and to compare these costs with the ongoing costs of investing in other mutual funds.
The Example is based on an investment of $1,000 invested at the beginning of the period and held for the entire period (November 1, 2015 to April 30, 2016).
Actual Expenses
The first line of the accompanying table for each class of the Fund provides information about actual account values and actual expenses. You may use the information in this line, together with the amount you invested, to estimate the expenses that you paid over the period. Simply divide your account value by $1,000.00 (for example, an $8,600 account value divided by $1,000.00 = 8.6), then multiply the result by the number in the first line for a class of the Fund under the heading entitled "Expenses Paid During Period" to estimate the expenses you paid on your account during this period. A small balance maintenance fee of $12.00 that is charged once a year may apply for certain accounts with a value of less than $2,000. This fee is not included in the table below. If it was, the estimate of expenses you paid during the period would be higher, and your ending account value lower, by this amount. In addition, the Fund, as a shareholder in the underlying Fidelity Central Funds, will indirectly bear its pro-rata share of the fees and expenses incurred by the underlying Fidelity Central Funds. These fees and expenses are not included in the Fund's annualized expense ratio used to calculate the expense estimate in the table below.
Hypothetical Example for Comparison Purposes
The second line of the accompanying table for each class of the Fund provides information about hypothetical account values and hypothetical expenses based on a Class' actual expense ratio and an assumed rate of return of 5% per year before expenses, which is not the Class' actual return. The hypothetical account values and expenses may not be used to estimate the actual ending account balance or expenses you paid for the period. You may use this information to compare the ongoing costs of investing in the Fund and other funds. To do so, compare this 5% hypothetical example with the 5% hypothetical examples that appear in the shareholder reports of the other funds. A small balance maintenance fee of $12.00 that is charged once a year may apply for certain accounts with a value of less than $2,000. This fee is not included in the table below. If it was, the estimate of expenses you paid during the period would be higher, and your ending account value lower, by this amount. In addition, the Fund, as a shareholder in the underlying Fidelity Central Funds, will indirectly bear its pro-rata share of the fees and expenses incurred by the underlying Fidelity Central Funds. These fees and expenses are not included in the Fund's annualized expense ratio used to calculate the expense estimate in the table below.
Please note that the expenses shown in the table are meant to highlight your ongoing costs only and do not reflect any transaction costs. Therefore, the second line of the table is useful in comparing ongoing costs only, and will not help you determine the relative total costs of owning different funds. In addition, if these transactional costs were included, your costs would have been higher.
| Annualized Expense Ratio-A | Beginning Account Value November 1, 2015 | Ending Account Value April 30, 2016 | Expenses Paid During Period-B November 1, 2015 to April 30, 2016 | |
| Class A | 1.45% | |||
| Actual | $1,000.00 | $978.20 | $7.13 | |
| Hypothetical-C | $1,000.00 | $1,017.65 | $7.27 | |
| Class T | 1.70% | |||
| Actual | $1,000.00 | $978.50 | $8.36 | |
| Hypothetical-C | $1,000.00 | $1,016.41 | $8.52 | |
| Class B | 2.20% | |||
| Actual | $1,000.00 | $974.50 | $10.80 | |
| Hypothetical-C | $1,000.00 | $1,013.92 | $11.02 | |
| Class C | 2.20% | |||
| Actual | $1,000.00 | $975.50 | $10.81 | |
| Hypothetical-C | $1,000.00 | $1,013.92 | $11.02 | |
| Total International Equity | 1.12% | |||
| Actual | $1,000.00 | $980.00 | $5.51 | |
| Hypothetical-C | $1,000.00 | $1,019.29 | $5.62 | |
| Class I | 1.20% | |||
| Actual | $1,000.00 | $980.10 | $5.91 | |
| Hypothetical-C | $1,000.00 | $1,018.90 | $6.02 |
A Annualized expense ratio reflects expenses net of applicable fee waivers.
B Expenses are equal to each Class' annualized expense ratio, multiplied by the average account value over the period, multiplied by 182/366 (to reflect the one-half year period).
C 5% return per year before expenses
![]()
ATIEI-SANN-0616
1.853360.108
Fidelity® Global Equity Income Fund Semi-Annual Report April 30, 2016 |
|
Contents
To view a fund's proxy voting guidelines and proxy voting record for the 12-month period ended June 30, visit http://www.fidelity.com/proxyvotingresults or visit the Securities and Exchange Commission's (SEC) web site at http://www.sec.gov.
You may also call 1-800-544-8544 to request a free copy of the proxy voting guidelines.
Standard & Poor's, S&P and S&P 500 are registered service marks of The McGraw-Hill Companies, Inc. and have been licensed for use by Fidelity Distributors Corporation.
Other third-party marks appearing herein are the property of their respective owners.
All other marks appearing herein are registered or unregistered trademarks or service marks of FMR LLC or an affiliated company. © 2016 FMR LLC. All rights reserved.
This report and the financial statements contained herein are submitted for the general information of the shareholders of the Fund. This report is not authorized for distribution to prospective investors in the Fund unless preceded or accompanied by an effective prospectus.
A fund files its complete schedule of portfolio holdings with the SEC for the first and third quarters of each fiscal year on Form N-Q. Forms N-Q are available on the SEC’s web site at http://www.sec.gov. A fund's Forms N-Q may be reviewed and copied at the SEC’s Public Reference Room in Washington, DC. Information regarding the operation of the SEC's Public Reference Room may be obtained by calling 1-800-SEC-0330.
For a complete list of a fund's portfolio holdings, view the most recent holdings listing, semiannual report, or annual report on Fidelity's web site at http://www.fidelity.com, http://www.advisor.fidelity.com, or http://www.401k.com, as applicable.
NOT FDIC INSURED •MAY LOSE VALUE •NO BANK GUARANTEE
Neither the Fund nor Fidelity Distributors Corporation is a bank.
Investment Summary (Unaudited)
Geographic Diversification (% of fund's net assets)
| As of April 30, 2016 | ||
| United States of America* | 49.8% | |
| Japan | 10.7% | |
| United Kingdom | 10.6% | |
| Ireland | 4.2% | |
| Canada | 3.5% | |
| Israel | 2.8% | |
| France | 2.8% | |
| Taiwan | 2.2% | |
| Hong Kong | 1.8% | |
| Other | 11.6% | |

* Includes Short-Term investments and Net Other Assets (Liabilities).
Percentages are based on country or territory of incorporation and are adjusted for the effect of futures contracts, if applicable.
| As of October 31, 2015 | ||
| United States of America* | 46.2% | |
| United Kingdom | 13.0% | |
| Japan | 11.1% | |
| Ireland | 4.1% | |
| Canada | 3.3% | |
| Israel | 3.2% | |
| France | 2.9% | |
| Bailiwick of Jersey | 1.9% | |
| Hong Kong | 1.9% | |
| Other | 12.4% | |
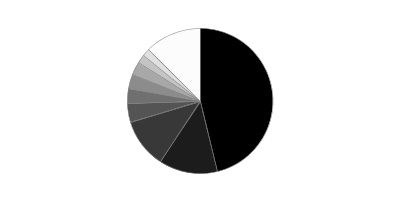
* Includes Short-Term investments and Net Other Assets (Liabilities).
Percentages are based on country or territory of incorporation and are adjusted for the effect of futures contracts, if applicable.
Asset Allocation as of April 30, 2016
| % of fund's net assets | % of fund's net assets 6 months ago | |
| Stocks | 88.8 | 95.7 |
| Short-Term Investments and Net Other Assets (Liabilities) | 11.2 | 4.3 |
Top Ten Stocks as of April 30, 2016
| % of fund's net assets | % of fund's net assets 6 months ago | |
| Johnson & Johnson (United States of America, Pharmaceuticals) | 2.6 | 2.4 |
| Accenture PLC Class A (Ireland, IT Services) | 1.9 | 1.8 |
| General Electric Co. (United States of America, Industrial Conglomerates) | 1.9 | 2.4 |
| Apple, Inc. (United States of America, Technology Hardware, Storage & Peripherals) | 1.9 | 2.6 |
| Chevron Corp. (United States of America, Oil, Gas & Consumable Fuels) | 1.8 | 1.8 |
| Taiwan Semiconductor Manufacturing Co. Ltd. (Taiwan, Semiconductors & Semiconductor Equipment) | 1.8 | 1.7 |
| CVS Health Corp. (United States of America, Food & Staples Retailing) | 1.7 | 1.8 |
| JPMorgan Chase & Co. (United States of America, Banks) | 1.6 | 2.7 |
| Microsoft Corp. (United States of America, Software) | 1.6 | 1.8 |
| Exxon Mobil Corp. (United States of America, Oil, Gas & Consumable Fuels) | 1.5 | 1.6 |
| 18.3 |
Market Sectors as of April 30, 2016
| % of fund's net assets | % of fund's net assets 6 months ago | |
| Financials | 17.3 | 20.7 |
| Information Technology | 14.6 | 17.0 |
| Consumer Staples | 13.0 | 14.5 |
| Health Care | 12.6 | 13.4 |
| Consumer Discretionary | 11.9 | 13.3 |
| Industrials | 8.1 | 6.6 |
| Energy | 6.5 | 5.1 |
| Telecommunication Services | 3.2 | 3.2 |
| Materials | 1.6 | 1.9 |
Investments April 30, 2016 (Unaudited)
Showing Percentage of Net Assets
| Common Stocks - 88.8% | |||
| Shares | Value | ||
| Australia - 0.0% | |||
| Telstra Corp. Ltd. | 2,621 | $10,642 | |
| Bailiwick of Jersey - 1.5% | |||
| Shire PLC | 6,500 | 405,613 | |
| Wolseley PLC | 13,715 | 768,206 | |
| TOTAL BAILIWICK OF JERSEY | 1,173,819 | ||
| Belgium - 0.6% | |||
| Anheuser-Busch InBev SA NV | 3,800 | 470,364 | |
| Canada - 3.5% | |||
| Constellation Software, Inc. | 1,000 | 390,803 | |
| Fairfax Financial Holdings Ltd. (sub. vtg.) | 741 | 397,165 | |
| Imperial Oil Ltd. | 22,100 | 732,909 | |
| PrairieSky Royalty Ltd. | 5,200 | 109,496 | |
| Suncor Energy, Inc. | 39,000 | 1,144,792 | |
| TOTAL CANADA | 2,775,165 | ||
| Cayman Islands - 0.3% | |||
| SITC International Holdings Co. Ltd. | 493,000 | 266,452 | |
| Chile - 0.4% | |||
| Vina San Pedro SA | 33,308,523 | 328,207 | |
| France - 2.8% | |||
| Bouygues SA (a) | 6,606 | 220,270 | |
| Cegedim SA (b) | 6,000 | 164,750 | |
| Renault SA | 5,700 | 550,077 | |
| Sanofi SA | 11,900 | 980,876 | |
| VINCI SA | 3,500 | 261,461 | |
| TOTAL FRANCE | 2,177,434 | ||
| Germany - 1.7% | |||
| adidas AG | 3,700 | 477,051 | |
| AURELIUS AG | 8,199 | 490,255 | |
| SAP AG | 4,179 | 327,889 | |
| TOTAL GERMANY | 1,295,195 | ||
| Hong Kong - 1.8% | |||
| HKT Trust/HKT Ltd. unit | 400,600 | 575,839 | |
| Techtronic Industries Co. Ltd. | 220,500 | 826,582 | |
| TOTAL HONG KONG | 1,402,421 | ||
| Indonesia - 0.5% | |||
| PT Bank Central Asia Tbk | 403,800 | 399,575 | |
| Ireland - 4.2% | |||
| Accenture PLC Class A | 13,340 | 1,506,353 | |
| Greencore Group PLC | 118,486 | 624,638 | |
| Medtronic PLC | 14,300 | 1,131,845 | |
| TOTAL IRELAND | 3,262,836 | ||
| Isle of Man - 1.3% | |||
| Optimal Payments PLC (b) | 103,000 | 573,700 | |
| Playtech Ltd. | 38,635 | 454,153 | |
| TOTAL ISLE OF MAN | 1,027,853 | ||
| Israel - 2.8% | |||
| Bezeq The Israel Telecommunication Corp. Ltd. | 251,000 | 535,393 | |
| Cellcom Israel Ltd. (Israel) (b) | 46,380 | 348,056 | |
| Partner Communications Co. Ltd. (b) | 18,620 | 96,876 | |
| Rami Levi Chain Stores Hashikma Marketing 2006 Ltd. | 4,496 | 184,583 | |
| Teva Pharmaceutical Industries Ltd. sponsored ADR | 19,550 | 1,064,498 | |
| TOTAL ISRAEL | 2,229,406 | ||
| Italy - 0.2% | |||
| Astaldi SpA | 37,353 | 183,146 | |
| Japan - 10.7% | |||
| A/S One Corp. | 10,000 | 360,580 | |
| Astellas Pharma, Inc. | 80,100 | 1,079,956 | |
| Broadleaf Co. Ltd. | 7,800 | 77,080 | |
| Casio Computer Co. Ltd. | 9,600 | 182,658 | |
| Daiichikosho Co. Ltd. | 19,500 | 817,474 | |
| Daito Trust Construction Co. Ltd. | 4,100 | 579,872 | |
| Hoya Corp. | 30,700 | 1,175,634 | |
| Inaba Denki Sangyo Co. Ltd. | 2,200 | 69,077 | |
| Japan Tobacco, Inc. | 12,600 | 514,810 | |
| KDDI Corp. | 23,800 | 685,576 | |
| NEC Corp. | 106,000 | 257,980 | |
| Nippon Telegraph & Telephone Corp. | 7,300 | 326,677 | |
| Olympus Corp. | 18,900 | 736,280 | |
| ORIX Corp. | 15,600 | 220,661 | |
| Shinsei Bank Ltd. | 403,000 | 564,835 | |
| Sony Corp. | 10,600 | 256,749 | |
| Tsuruha Holdings, Inc. | 4,600 | 441,212 | |
| USS Co. Ltd. | 5,000 | 79,092 | |
| TOTAL JAPAN | 8,426,203 | ||
| Netherlands - 1.1% | |||
| Altice NV Class A (b) | 17,479 | 265,190 | |
| LyondellBasell Industries NV Class A | 6,900 | 570,423 | |
| TOTAL NETHERLANDS | 835,613 | ||
| Singapore - 0.5% | |||
| United Overseas Bank Ltd. | 28,791 | 398,195 | |
| South Africa - 1.0% | |||
| Capitec Bank Holdings Ltd. | 10,100 | 419,361 | |
| EOH Holdings Ltd. | 17,400 | 169,352 | |
| Lewis Group Ltd. | 54,500 | 183,807 | |
| TOTAL SOUTH AFRICA | 772,520 | ||
| Spain - 0.5% | |||
| Amadeus IT Holding SA Class A | 8,800 | 400,438 | |
| Sweden - 0.5% | |||
| Sandvik AB (a) | 38,900 | 399,151 | |
| Switzerland - 1.5% | |||
| Banque Cantonale Vaudoise | 510 | 351,678 | |
| Chubb Ltd. | 5,400 | 636,444 | |
| Sika AG | 50 | 212,811 | |
| TOTAL SWITZERLAND | 1,200,933 | ||
| Taiwan - 2.2% | |||
| ECLAT Textile Co. Ltd. | 20,298 | 231,552 | |
| King's Town Bank | 120,000 | 83,584 | |
| Taiwan Semiconductor Manufacturing Co. Ltd. | 301,000 | 1,380,765 | |
| TOTAL TAIWAN | 1,695,901 | ||
| United Kingdom - 10.6% | |||
| British American Tobacco PLC (United Kingdom) | 13,100 | 798,734 | |
| Hilton Food Group PLC | 56,200 | 462,317 | |
| Howden Joinery Group PLC | 38,700 | 279,340 | |
| Imperial Tobacco Group PLC | 15,015 | 815,808 | |
| ITV PLC | 272,800 | 897,651 | |
| Lloyds Banking Group PLC | 873,700 | 857,546 | |
| Micro Focus International PLC | 50,000 | 1,117,049 | |
| Reckitt Benckiser Group PLC | 5,545 | 540,188 | |
| SABMiller PLC | 6,400 | 391,354 | |
| St. James's Place Capital PLC | 28,239 | 357,736 | |
| The Restaurant Group PLC | 21,900 | 88,030 | |
| WH Smith PLC | 41,552 | 1,016,955 | |
| Whitbread PLC | 5,856 | 331,307 | |
| William Hill PLC | 54,552 | 249,249 | |
| Wuliangye Yibin Co. Ltd. ELS (UBS Warrant Programme) warrants 3/7/19 (b)(c) | 27,300 | 119,758 | |
| TOTAL UNITED KINGDOM | 8,323,022 | ||
| United States of America - 38.6% | |||
| American Tower Corp. | 6,860 | 719,477 | |
| Amgen, Inc. | 3,820 | 604,706 | |
| Apple, Inc. | 15,550 | 1,457,657 | |
| Bank of America Corp. | 59,580 | 867,485 | |
| BWX Technologies, Inc. | 22,800 | 761,292 | |
| C.H. Robinson Worldwide, Inc. | 1,900 | 134,843 | |
| Chevron Corp. | 14,165 | 1,447,380 | |
| CME Group, Inc. | 2,500 | 229,775 | |
| Comcast Corp. Class A | 10,700 | 650,132 | |
| ConocoPhillips Co. | 11,400 | 544,806 | |
| CVB Financial Corp. | 28,410 | 488,084 | |
| CVS Health Corp. | 12,900 | 1,296,450 | |
| Danaher Corp. | 9,000 | 870,750 | |
| Deluxe Corp. | 1,800 | 113,004 | |
| Diamond Hill Investment Group, Inc. | 2,600 | 455,676 | |
| Dr. Pepper Snapple Group, Inc. | 5,541 | 503,732 | |
| E.I. du Pont de Nemours & Co. | 7,400 | 487,734 | |
| EMC Corp. | 17,900 | 467,369 | |
| Exxon Mobil Corp. | 13,630 | 1,204,892 | |
| First NBC Bank Holding Co. (b) | 2,200 | 47,828 | |
| General Electric Co. | 48,100 | 1,479,075 | |
| H&R Block, Inc. | 13,600 | 275,264 | |
| IBM Corp. | 5,270 | 769,104 | |
| Johnson & Johnson | 17,900 | 2,006,232 | |
| JPMorgan Chase & Co. | 19,730 | 1,246,936 | |
| McDonald's Corp. | 3,900 | 493,311 | |
| McGraw Hill Financial, Inc. | 6,040 | 645,374 | |
| Microsoft Corp. | 24,864 | 1,239,968 | |
| Molson Coors Brewing Co. Class B | 3,100 | 296,453 | |
| MSCI, Inc. Class A | 5,400 | 410,076 | |
| Oracle Corp. | 21,726 | 865,998 | |
| PepsiCo, Inc. | 7,600 | 782,496 | |
| Procter & Gamble Co. | 10,900 | 873,308 | |
| Roper Technologies, Inc. | 2,100 | 369,789 | |
| SunTrust Banks, Inc. | 13,300 | 555,142 | |
| Target Corp. | 13,200 | 1,049,400 | |
| The Coca-Cola Co. | 18,500 | 828,800 | |
| U.S. Bancorp | 20,780 | 887,098 | |
| United Technologies Corp. | 4,300 | 448,791 | |
| VF Corp. | 3,820 | 240,851 | |
| Wells Fargo & Co. | 23,457 | 1,172,381 | |
| TOTAL UNITED STATES OF AMERICA | 30,288,919 | ||
| TOTAL COMMON STOCKS | |||
| (Cost $64,628,757) | 69,743,410 | ||
| Principal Amount(d) | Value | ||
| Nonconvertible Bonds - 0.0% | |||
| Canada - 0.0% | |||
| Constellation Software, Inc. 7.6% 3/31/40(e) | |||
| (Cost $2,060) | 2,400 | 2,082 | |
| Shares | Value | ||
| Money Market Funds - 12.0% | |||
| Fidelity Cash Central Fund, 0.38% (f) | 8,871,507 | 8,871,507 | |
| Fidelity Securities Lending Cash Central Fund, 0.42% (f)(g) | 571,878 | 571,878 | |
| TOTAL MONEY MARKET FUNDS | |||
| (Cost $9,443,385) | 9,443,385 | ||
| TOTAL INVESTMENT PORTFOLIO - 100.8% | |||
| (Cost $74,074,202) | 79,188,877 | ||
| NET OTHER ASSETS (LIABILITIES) - (0.8)% | (639,640) | ||
| NET ASSETS - 100% | $78,549,237 |
Currency Abbreviations
CAD – Canadian dollar
Security Type Abbreviations
ELS – Equity-Linked Security
Categorizations in the Schedule of Investments are based on country or territory of incorporation.
Legend
(a) Security or a portion of the security is on loan at period end.
(b) Non-income producing
(c) Security exempt from registration under Rule 144A of the Securities Act of 1933. These securities may be resold in transactions exempt from registration, normally to qualified institutional buyers. At the end of the period, the value of these securities amounted to $119,758 or 0.2% of net assets.
(d) Amount is stated in United States dollars unless otherwise noted.
(e) Coupon rates for floating and adjustable rate securities reflect the rates in effect at period end.
(f) Affiliated fund that is generally available only to investment companies and other accounts managed by Fidelity Investments. The rate quoted is the annualized seven-day yield of the fund at period end. A complete unaudited listing of the fund's holdings as of its most recent quarter end is available upon request. In addition, each Fidelity Central Fund's financial statements are available on the SEC's website or upon request.
(g) Investment made with cash collateral received from securities on loan.
Affiliated Central Funds
Information regarding fiscal year to date income earned by the Fund from investments in Fidelity Central Funds is as follows:
| Fund | Income earned |
| Fidelity Cash Central Fund | $6,448 |
| Fidelity Securities Lending Cash Central Fund | 2,839 |
| Total | $9,287 |
Investment Valuation
The following is a summary of the inputs used, as of April 30, 2016, involving the Fund's assets and liabilities carried at fair value. The inputs or methodology used for valuing securities may not be an indication of the risk associated with investing in those securities. For more information on valuation inputs, and their aggregation into the levels used below, please refer to the Investment Valuation section in the accompanying Notes to Financial Statements.
| Valuation Inputs at Reporting Date: | ||||
| Description | Total | Level 1 | Level 2 | Level 3 |
| Investments in Securities: | ||||
| Equities: | ||||
| Consumer Discretionary | $9,441,722 | $7,279,167 | $2,162,555 | $-- |
| Consumer Staples | 10,153,454 | 7,858,510 | 2,294,944 | -- |
| Energy | 5,184,275 | 5,184,275 | -- | -- |
| Financials | 13,601,997 | 11,259,325 | 2,342,672 | -- |
| Health Care | 9,710,970 | 4,972,031 | 4,738,939 | -- |
| Industrials | 6,345,307 | 5,241,572 | 1,103,735 | -- |
| Information Technology | 11,455,658 | 9,411,944 | 2,043,714 | -- |
| Materials | 1,270,968 | 1,270,968 | -- | -- |
| Telecommunication Services | 2,579,059 | 980,325 | 1,598,734 | -- |
| Corporate Bonds | 2,082 | -- | 2,082 | -- |
| Money Market Funds | 9,443,385 | 9,443,385 | -- | -- |
| Total Investments in Securities: | $79,188,877 | $62,901,502 | $16,287,375 | $-- |
The following is a summary of transfers between Level 1 and Level 2 for the period ended April 30, 2016. Transfers are assumed to have occurred at the beginning of the period, and are primarily attributable to the valuation techniques used for foreign equity securities, as discussed in the accompanying Notes to Financial Statements:
| Transfers | Total |
| Level 1 to Level 2 | $0 |
| Level 2 to Level 1 | $1,602,987 |
See accompanying notes which are an integral part of the financial statements.
Financial Statements
Statement of Assets and Liabilities
| April 30, 2016 (Unaudited) | ||
| Assets | ||
| Investment in securities, at value (including securities loaned of $525,883) — See accompanying schedule: Unaffiliated issuers (cost $64,630,817) | $69,745,492 | |
| Fidelity Central Funds (cost $9,443,385) | 9,443,385 | |
| Total Investments (cost $74,074,202) | $79,188,877 | |
| Receivable for investments sold | 83 | |
| Receivable for fund shares sold | 185,376 | |
| Dividends receivable | 319,679 | |
| Interest receivable | 12 | |
| Distributions receivable from Fidelity Central Funds | 3,211 | |
| Prepaid expenses | 37 | |
| Receivable from investment adviser for expense reductions | 5,246 | |
| Other receivables | 22 | |
| Total assets | 79,702,543 | |
| Liabilities | ||
| Payable for fund shares redeemed | $479,254 | |
| Accrued management fee | 45,183 | |
| Other affiliated payables | 20,135 | |
| Other payables and accrued expenses | 36,856 | |
| Collateral on securities loaned, at value | 571,878 | |
| Total liabilities | 1,153,306 | |
| Net Assets | $78,549,237 | |
| Net Assets consist of: | ||
| Paid in capital | $74,233,530 | |
| Undistributed net investment income | 242,892 | |
| Accumulated undistributed net realized gain (loss) on investments and foreign currency transactions | (1,047,174) | |
| Net unrealized appreciation (depreciation) on investments and assets and liabilities in foreign currencies | 5,119,989 | |
| Net Assets, for 6,573,097 shares outstanding | $78,549,237 | |
| Net Asset Value, offering price and redemption price per share ($78,549,237 ÷ 6,573,097 shares) | $11.95 |
See accompanying notes which are an integral part of the financial statements.
Statement of Operations
| Six months ended April 30, 2016 (Unaudited) | ||
| Investment Income | ||
| Dividends | $873,208 | |
| Interest | 85 | |
| Income from Fidelity Central Funds | 9,287 | |
| Income before foreign taxes withheld | 882,580 | |
| Less foreign taxes withheld | (31,997) | |
| Total income | 850,583 | |
| Expenses | ||
| Management fee | $244,332 | |
| Transfer agent fees | 94,060 | |
| Accounting and security lending fees | 18,107 | |
| Custodian fees and expenses | 6,718 | |
| Independent trustees' compensation | 148 | |
| Registration fees | 20,807 | |
| Audit | 37,895 | |
| Legal | 294 | |
| Miscellaneous | 2,333 | |
| Total expenses before reductions | 424,694 | |
| Expense reductions | (5,492) | 419,202 |
| Net investment income (loss) | 431,381 | |
| Realized and Unrealized Gain (Loss) | ||
| Net realized gain (loss) on: | ||
| Investment securities: | ||
| Unaffiliated issuers | (959,742) | |
| Foreign currency transactions | 2,784 | |
| Total net realized gain (loss) | (956,958) | |
| Change in net unrealized appreciation (depreciation) on: Investment securities | 859,153 | |
| Assets and liabilities in foreign currencies | 7,344 | |
| Total change in net unrealized appreciation (depreciation) | 866,497 | |
| Net gain (loss) | (90,461) | |
| Net increase (decrease) in net assets resulting from operations | $340,920 |
See accompanying notes which are an integral part of the financial statements.
Statement of Changes in Net Assets
| Six months ended April 30, 2016 (Unaudited) | Year ended October 31, 2015 | |
| Increase (Decrease) in Net Assets | ||
| Operations | ||
| Net investment income (loss) | $431,381 | $812,981 |
| Net realized gain (loss) | (956,958) | 1,091,922 |
| Change in net unrealized appreciation (depreciation) | 866,497 | (622,502) |
| Net increase (decrease) in net assets resulting from operations | 340,920 | 1,282,401 |
| Distributions to shareholders from net investment income | (277,990) | (855,399) |
| Distributions to shareholders from net realized gain | (910,524) | (3,941,634) |
| Total distributions | (1,188,514) | (4,797,033) |
| Share transactions | ||
| Proceeds from sales of shares | 20,159,983 | 33,328,285 |
| Reinvestment of distributions | 1,095,123 | 4,498,152 |
| Cost of shares redeemed | (9,787,582) | (18,426,196) |
| Net increase (decrease) in net assets resulting from share transactions | 11,467,524 | 19,400,241 |
| Redemption fees | 3,735 | 1,475 |
| Total increase (decrease) in net assets | 10,623,665 | 15,887,084 |
| Net Assets | ||
| Beginning of period | 67,925,572 | 52,038,488 |
| End of period (including undistributed net investment income of $242,892 and undistributed net investment income of $89,501, respectively) | $78,549,237 | $67,925,572 |
| Other Information | ||
| Shares | ||
| Sold | 1,718,661 | 2,706,849 |
| Issued in reinvestment of distributions | 90,893 | 370,373 |
| Redeemed | (838,907) | (1,519,683) |
| Net increase (decrease) | 970,647 | 1,557,539 |
See accompanying notes which are an integral part of the financial statements.
Financial Highlights — Fidelity Global Equity Income Fund
| Six months ended (Unaudited) April 30, | Years ended October 31, | ||||
| 2016 | 2015 | 2014 | 2013 | 2012 A | |
| Selected Per–Share Data | |||||
| Net asset value, beginning of period | $12.12 | $12.87 | $12.20 | $10.16 | $10.00 |
| Income from Investment Operations | |||||
| Net investment income (loss)B | .07 | .16 | .28C | .22 | .08 |
| Net realized and unrealized gain (loss) | (.03) | .21 | .92 | 2.06 | .15 |
| Total from investment operations | .04 | .37 | 1.20 | 2.28 | .23 |
| Distributions from net investment income | (.05) | (.16) | (.25) | (.21) | (.07) |
| Distributions from net realized gain | (.16) | (.95) | (.28) | (.03) | – |
| Total distributions | (.21) | (1.12)D | (.53) | (.24) | (.07) |
| Redemption fees added to paid in capitalB,E | – | – | – | – | – |
| Net asset value, end of period | $11.95 | $12.12 | $12.87 | $12.20 | $10.16 |
| Total ReturnF,G | .32% | 2.93% | 10.10% | 22.73% | 2.25% |
| Ratios to Average Net AssetsH,I | |||||
| Expenses before reductions | 1.21%J | 1.15% | 1.16% | 1.28% | 2.18%J |
| Expenses net of fee waivers, if any | 1.20%J | 1.15% | 1.16% | 1.20% | 1.20%J |
| Expenses net of all reductions | 1.20%J | 1.14% | 1.16% | 1.19% | 1.17%J |
| Net investment income (loss) | 1.23%J | 1.27% | 2.21%C | 1.94% | 1.62%J |
| Supplemental Data | |||||
| Net assets, end of period (000 omitted) | $78,549 | $67,926 | $52,038 | $42,271 | $26,838 |
| Portfolio turnover rateK | 25%J | 64% | 92% | 66% | 33%L |
A For the period May 2, 2012 (commencement of operations) to October 31, 2012.
B Calculated based on average shares outstanding during the period.
C Net Investment income per share reflects a large, non-recurring dividend which amounted to $.08 per share. Excluding this non-recurring dividend, the ratio of net investment income (loss) to average net assets would have been 1.56%.
D Total distributions of $1.12 per share is comprised of distributions from net investment income of $.164 and distributions from net realized gain of $.954 per share.
E Amount represents less than $.005 per share.
F Total returns for periods of less than one year are not annualized.
G Total returns would have been lower if certain expenses had not been reduced during the applicable periods shown.
H Fees and expenses of any underlying Fidelity Central Funds are not included in the Fund's expense ratio. The Fund indirectly bears its proportionate share of the expenses of any underlying Fidelity Central Funds.
I Expense ratios reflect operating expenses of the Fund. Expenses before reductions do not reflect amounts reimbursed by the investment adviser or reductions from brokerage service arrangements or reductions from other expense offset arrangements and do not represent the amount paid by the Fund during periods when reimbursements or reductions occur. Expense ratios before reductions for start-up periods may not be representative of longer term operating periods. Expenses net of fee waivers reflect expenses after reimbursement by the investment adviser but prior to reductions from brokerage service arrangements or other expense offset arrangements. Expenses net of all reductions represent the net expenses paid by the Fund.
J Annualized
K Amount does not include the portfolio activity of any underlying Fidelity Central Funds.
L Amount not annualized.
See accompanying notes which are an integral part of the financial statements.
Notes to Financial Statements (Unaudited)
For the period ended April 30, 2016
1. Organization.
Fidelity Global Equity Income Fund (the Fund) is a fund of Fidelity Investment Trust (the Trust) and is authorized to issue an unlimited number of shares. Share transactions on the Statement of Changes in Net Assets may contain exchanges between affiliated funds. The Trust is registered under the Investment Company Act of 1940, as amended (the 1940 Act), as an open-end management investment company organized as a Massachusetts business trust.
2. Investments in Fidelity Central Funds.
The Fund invests in Fidelity Central Funds, which are open-end investment companies generally available only to other investment companies and accounts managed by the investment adviser and its affiliates. The Fund's Schedule of Investments lists each of the Fidelity Central Funds held as of period end, if any, as an investment of the Fund, but does not include the underlying holdings of each Fidelity Central Fund. As an Investing Fund, the Fund indirectly bears its proportionate share of the expenses of the underlying Fidelity Central Funds.
The Money Market Central Funds seek preservation of capital and current income and are managed by Fidelity Investments Money Management, Inc. (FIMM), an affiliate of the investment adviser. Annualized expenses of the Money Market Central Funds as of their most recent shareholder report date are less than .005%.
A complete unaudited list of holdings for each Fidelity Central Fund is available upon request or at the Securities and Exchange Commission (the SEC) website at www.sec.gov. In addition, the financial statements of the Fidelity Central Funds are available on the SEC website or upon request.
3. Significant Accounting Policies.
The financial statements have been prepared in conformity with accounting principles generally accepted in the United States of America (GAAP), which require management to make certain estimates and assumptions at the date of the financial statements. Actual results could differ from those estimates. Subsequent events, if any, through the date that the financial statements were issued have been evaluated in the preparation of the financial statements. The following summarizes the significant accounting policies of the Fund:
Investment Valuation. Investments are valued as of 4:00 p.m. Eastern time on the last calendar day of the period. The Board of Trustees (the Board) has delegated the day to day responsibility for the valuation of the Fund's investments to the Fidelity Management & Research Company (FMR) Fair Value Committee (the Committee). In accordance with valuation policies and procedures approved by the Board, the Fund attempts to obtain prices from one or more third party pricing vendors or brokers to value its investments. When current market prices, quotations or currency exchange rates are not readily available or reliable, investments will be fair valued in good faith by the Committee, in accordance with procedures adopted by the Board. Factors used in determining fair value vary by investment type and may include market or investment specific events, changes in interest rates and credit quality. The frequency with which these procedures are used cannot be predicted and they may be utilized to a significant extent. The Committee oversees the Fund's valuation policies and procedures and reports to the Board on the Committee's activities and fair value determinations. The Board monitors the appropriateness of the procedures used in valuing the Fund's investments and ratifies the fair value determinations of the Committee.
The Fund categorizes the inputs to valuation techniques used to value its investments into a disclosure hierarchy consisting of three levels as shown below:
- Level 1 – quoted prices in active markets for identical investments
- Level 2 – other significant observable inputs (including quoted prices for similar investments, interest rates, prepayment speeds, etc.)
- Level 3 – unobservable inputs (including the Fund's own assumptions based on the best information available)
Valuation techniques used to value the Fund's investments by major category are as follows:
Equity securities, including restricted securities, for which market quotations are readily available, are valued at the last reported sale price or official closing price as reported by a third party pricing vendor on the primary market or exchange on which they are traded and are categorized as Level 1 in the hierarchy. In the event there were no sales during the day or closing prices are not available, securities are valued at the last quoted bid price or may be valued using the last available price and are generally categorized as Level 2 in the hierarchy. For foreign equity securities, when market or security specific events arise, comparisons to the valuation of American Depositary Receipts (ADRs), futures contracts, Exchange-Traded Funds (ETFs) and certain indexes as well as quoted prices for similar securities may be used and would be categorized as Level 2 in the hierarchy. Utilizing these techniques may result in transfers between Level 1 and Level 2. For equity securities, including restricted securities, where observable inputs are limited, assumptions about market activity and risk are used and these securities may be categorized as Level 3 in the hierarchy.
Debt securities, including restricted securities, are valued based on evaluated prices received from third party pricing vendors or from brokers who make markets in such securities. Corporate bonds are valued by pricing vendors who utilize matrix pricing which considers yield or price of bonds of comparable quality, coupon, maturity and type or by broker-supplied prices. When independent prices are unavailable or unreliable, debt securities may be valued utilizing pricing methodologies which consider similar factors that would be used by third party pricing vendors. Debt securities are generally categorized as Level 2 in the hierarchy but may be Level 3 depending on the circumstances.
Investments in open-end mutual funds, including the Fidelity Central Funds, are valued at their closing net asset value (NAV) each business day and are categorized as Level 1 in the hierarchy.
Changes in valuation techniques may result in transfers in or out of an assigned level within the disclosure hierarchy. The aggregate value of investments by input level as of April 30, 2016, including information on transfers between Levels 1 and 2, is included at the end of the Fund's Schedule of Investments.
Foreign Currency. The Fund may use foreign currency contracts to facilitate transactions in foreign-denominated securities. Gains and losses from these transactions may arise from changes in the value of the foreign currency or if the counterparties do not perform under the contracts' terms.
Foreign-denominated assets, including investment securities, and liabilities are translated into U.S. dollars at the exchange rates at period end. Purchases and sales of investment securities, income and dividends received and expenses denominated in foreign currencies are translated into U.S. dollars at the exchange rate in effect on the transaction date.
The effects of exchange rate fluctuations on investments are included with the net realized and unrealized gain (loss) on investment securities. Other foreign currency transactions resulting in realized and unrealized gain (loss) are disclosed separately.
Investment Transactions and Income. For financial reporting purposes, the Fund's investment holdings and NAV include trades executed through the end of the last business day of the period. The NAV per share for processing shareholder transactions is calculated as of the close of business of the New York Stock Exchange (NYSE), normally 4:00 p.m. Eastern time and includes trades executed through the end of the prior business day. Gains and losses on securities sold are determined on the basis of identified cost. Dividend income is recorded on the ex-dividend date, except for certain dividends from foreign securities where the ex-dividend date may have passed, which are recorded as soon as the Fund is informed of the ex-dividend date. Non-cash dividends included in dividend income, if any, are recorded at the fair market value of the securities received. Income and capital gain distributions from Fidelity Central Funds, if any, are recorded on the ex-dividend date. Distributions received on securities that represent a return of capital or capital gain are recorded as a reduction of cost of investments and/or as a realized gain. Subsequent to ex-dividend date the Fund determines the components of these distributions, based upon receipt of tax filings or other correspondence relating to the underlying investment. Interest income is accrued as earned and includes coupon interest and amortization of premium and accretion of discount on debt securities as applicable. Investment income is recorded net of foreign taxes withheld where recovery of such taxes is uncertain.
Expenses. Expenses directly attributable to a fund are charged to that fund. Expenses attributable to more than one fund are allocated among the respective funds on the basis of relative net assets or other appropriate methods. Expense estimates are accrued in the period to which they relate and adjustments are made when actual amounts are known.
Income Tax Information and Distributions to Shareholders. Each year, the Fund intends to qualify as a regulated investment company under Subchapter M of the Internal Revenue Code, including distributing substantially all of its taxable income and realized gains. As a result, no provision for U.S. Federal income taxes is required. The Fund files a U.S. federal tax return, in addition to state and local tax returns as required. The Fund's federal income tax returns are subject to examination by the Internal Revenue Service (IRS) for a period of three fiscal years after they are filed. State and local tax returns may be subject to examination for an additional fiscal year depending on the jurisdiction. Foreign taxes are provided for based on the Fund's understanding of the tax rules and rates that exist in the foreign markets in which it invests.
Distributions are declared and recorded on the ex-dividend date. Income and capital gain distributions are determined in accordance with income tax regulations, which may differ from GAAP.
Capital accounts within the financial statements are adjusted for permanent book-tax differences. These adjustments have no impact on net assets or the results of operations. Capital accounts are not adjusted for temporary book-tax differences which will reverse in a subsequent period.
Book-tax differences are primarily due to foreign currency transactions, passive foreign investment companies (PFIC), partnerships and losses deferred due to wash sales.
The federal tax cost of investment securities and unrealized appreciation (depreciation) as of period end were as follows:
| Gross unrealized appreciation | $8,394,640 |
| Gross unrealized depreciation | (3,359,979) |
| Net unrealized appreciation (depreciation) on securities | $5,034,661 |
| Tax cost | $74,154,216 |
Short-Term Trading (Redemption) Fees. Shares held by investors in the Fund less than 30 days may have been subject to a redemption fee equal to 1.00% of the NAV of shares redeemed. All redemption fees, which reduce the proceeds of the shareholder redemption, are retained by the Fund and accounted for as an addition to paid in capital.
4. Purchases and Sales of Investments.
Purchases and sales of securities, other than short-term securities, aggregated $13,047,868 and $8,214,170, respectively.
5. Fees and Other Transactions with Affiliates.
Management Fee. Fidelity Management & Research Company (the investment adviser) and its affiliates provide the Fund with investment management related services for which the Fund pays a monthly management fee. The management fee is the sum of an individual fund fee rate that is based on an annual rate of .45% of the Fund's average net assets and an annualized group fee rate that averaged .25% during the period. The group fee rate is based upon the average net assets of all the mutual funds advised by the investment adviser, including any mutual funds previously advised by the investment adviser that are currently advised by Fidelity SelectCo, LLC, an affiliate of the investment adviser. The group fee rate decreases as assets under management increase and increases as assets under management decrease. For the reporting period, the total annualized management fee rate was .70% of the Fund's average net assets.
Transfer Agent Fees. Fidelity Investments Institutional Operations Company, Inc. (FIIOC), an affiliate of the investment adviser, is the Fund's transfer, dividend disbursing and shareholder servicing agent. FIIOC receives account fees and asset-based fees that vary according to account size and type of account. FIIOC pays for typesetting, printing and mailing of shareholder reports, except proxy statements. For the period, the transfer agent fees were equivalent to an annualized rate of .27% of average net assets.
Accounting and Security Lending Fees. Fidelity Service Company, Inc. (FSC), an affiliate of the investment adviser, maintains the Fund's accounting records. The accounting fee is based on the level of average net assets for each month. Under a separate contract, FSC administers the security lending program. The security lending fee is based on the number and duration of lending transactions.
Brokerage Commissions. The Fund placed a portion of its portfolio transactions with brokerage firms which are affiliates of the investment adviser. Brokerage commissions are included in net realized gain (loss) and change in net unrealized appreciation (depreciation) in the Statement of Operations. The commissions paid to these affiliated firms were $45 for the period.
Interfund Trades. The Fund may purchase from or sell securities to other Fidelity Funds under procedures adopted by the Board. The procedures have been designed to ensure these interfund trades are executed in accordance with Rule 17a-7 of the 1940 Act. Interfund trades are included within the respective purchases and sales amounts shown in the Purchases and Sales of Investments note.
6. Committed Line of Credit.
The Fund participates with other funds managed by the investment adviser or an affiliate in a $4.25 billion credit facility (the "line of credit") to be utilized for temporary or emergency purposes to fund shareholder redemptions or for other short-term liquidity purposes. The Fund has agreed to pay commitment fees on its pro-rata portion of the line of credit, which amounted to $60 and is reflected in Miscellaneous expenses on the Statement of Operations. During the period, the Fund did not borrow on this line of credit.
7. Security Lending.
The Fund lends portfolio securities through a lending agent from time to time in order to earn additional income. For equity securities, a lending agent is used and may loan securities to certain qualified borrowers, including Fidelity Capital Markets (FCM), a broker-dealer affiliated with the Fund. On the settlement date of the loan, the Fund receives collateral (in the form of U.S. Treasury obligations, letters of credit and/or cash) against the loaned securities and maintains collateral in an amount not less than 100% of the market value of the loaned securities during the period of the loan. The market value of the loaned securities is determined at the close of business of the Fund and any additional required collateral is delivered to the Fund on the next business day. The Fund or borrower may terminate the loan at any time, and if the borrower defaults on its obligation to return the securities loaned because of insolvency or other reasons, the Fund may apply collateral received from the borrower against the obligation. The Fund may experience delays and costs in recovering the securities loaned. Any cash collateral received is invested in the Fidelity Securities Lending Cash Central Fund. The value of loaned securities and cash collateral at period end are disclosed on the Fund's Statement of Assets and Liabilities. Security lending income represents the income earned on investing cash collateral, less rebates paid to borrowers and any lending agent fees associated with the loan, plus any premium payments received for lending certain types of securities. Security lending income is presented in the Statement of Operations as a component of income from Fidelity Central Funds. Total security lending income during the period amounted to $2,839. During the period, there were no securities loaned to FCM.
8. Expense Reductions.
Commissions paid to certain brokers with whom the investment adviser, or its affiliates, places trades on behalf of the Fund include an amount in addition to trade execution, which may be rebated back to the Fund to offset certain expenses. This amount totaled $5,246 for the period. Through arrangements with the Fund's custodian, credits realized as a result of certain uninvested cash balances were used to reduce the Fund's expenses. During the period, these credits reduced the Fund's custody expenses by $3.
In addition, during the period the investment adviser reimbursed and/or waived a portion of operating expenses in the amount of $243.
9. Other.
The Fund's organizational documents provide former and current trustees and officers with a limited indemnification against liabilities arising in connection with the performance of their duties to the Fund. In the normal course of business, the Fund may also enter into contracts that provide general indemnifications. The Fund's maximum exposure under these arrangements is unknown as this would be dependent on future claims that may be made against the Fund. The risk of material loss from such claims is considered remote.
Shareholder Expense Example
As a shareholder of a Fund, you incur two types of costs: (1) transaction costs, including redemption fees and (2) ongoing costs, including management fees and other Fund expenses. This Example is intended to help you understand your ongoing costs (in dollars) of investing in the Funds and to compare these costs with the ongoing costs of investing in other mutual funds.
The Example is based on an investment of $1,000 invested at the beginning of the period and held for the entire period (November 1, 2015 to April 30, 2016).
Actual Expenses
The first line of the accompanying table provides information about actual account values and actual expenses. You may use the information in this line, together with the amount you invested, to estimate the expenses that you paid over the period. Simply divide your account value by $1,000.00 (for example, an $8,600 account value divided by $1,000.00 = 8.6), then multiply the result by the number in the first line under the heading entitled "Expenses Paid During Period" to estimate the expenses you paid on your account during this period. A small balance maintenance fee of $12.00 that is charged once a year may apply for certain accounts with a value of less than $2,000. This fee is not included in the table below. If it was, the estimate of expenses you paid during the period would be higher, and your ending account value lower, by this amount. In addition, the Fund, as a shareholder in the underlying Fidelity Central Funds, will indirectly bear its pro-rata share of the fees and expenses incurred by the underlying Fidelity Central Funds. These fees and expenses are not included in the Fund's annualized expense ratio used to calculate the expense estimate in the table below.
Hypothetical Example for Comparison Purposes
The second line of the accompanying table provides information about hypothetical account values and hypothetical expenses based on the Fund's actual expense ratio and an assumed rate of return of 5% per year before expenses, which is not the Fund's actual return. The hypothetical account values and expenses may not be used to estimate the actual ending account balance or expenses you paid for the period. You may use this information to compare the ongoing costs of investing in the Fund and other funds. To do so, compare this 5% hypothetical example with the 5% hypothetical examples that appear in the shareholder reports of the other funds. A small balance maintenance fee of $12.00 that is charged once a year may apply for certain accounts with a value of less than $2,000. This fee is not included in the table below. If it was, the estimate of expenses you paid during the period would be higher, and your ending account value lower, by this amount. In addition, the Fund, as a shareholder in the underlying Fidelity Central Funds, will indirectly bear its pro-rata share of the fees and expenses incurred by the underlying Fidelity Central Funds. These fees and expenses are not included in the Fund's annualized expense ratio used to calculate the expense estimate in the table below.
Please note that the expenses shown in the table are meant to highlight your ongoing costs only and do not reflect any transaction costs. Therefore, the second line of the table is useful in comparing ongoing costs only, and will not help you determine the relative total costs of owning different funds. In addition, if these transactional costs were included, your costs would have been higher.
| Annualized Expense Ratio-A | Beginning Account Value November 1, 2015 | Ending Account Value April 30, 2016 | Expenses Paid During Period-B November 1, 2015 to April 30, 2016 | |
| Actual | 1.20% | $1,000.00 | $1,003.20 | $5.98 |
| Hypothetical-C | $1,000.00 | $1,018.90 | $6.02 |
A Annualized expense ratio reflects expenses net of applicable fee waivers.
B Expenses are equal to the Fund's annualized expense ratio, multiplied by the average account value over the period, multiplied by 182/366 (to reflect the one-half year period).
C 5% return per year before expenses
![]()
Corporate Headquarters
245 Summer St.
Boston, MA 02210
www.fidelity.com
GED-SANN-0616
1.938166.103
Fidelity® Global Commodity Stock Fund Semi-Annual Report April 30, 2016 |
|
Contents
To view a fund's proxy voting guidelines and proxy voting record for the 12-month period ended June 30, visit http://www.fidelity.com/proxyvotingresults or visit the Securities and Exchange Commission's (SEC) web site at http://www.sec.gov.
You may also call 1-800-544-8544 to request a free copy of the proxy voting guidelines.
Standard & Poor's, S&P and S&P 500 are registered service marks of The McGraw-Hill Companies, Inc. and have been licensed for use by Fidelity Distributors Corporation.
Other third-party marks appearing herein are the property of their respective owners.
All other marks appearing herein are registered or unregistered trademarks or service marks of FMR LLC or an affiliated company. © 2016 FMR LLC. All rights reserved.
This report and the financial statements contained herein are submitted for the general information of the shareholders of the Fund. This report is not authorized for distribution to prospective investors in the Fund unless preceded or accompanied by an effective prospectus.
A fund files its complete schedule of portfolio holdings with the SEC for the first and third quarters of each fiscal year on Form N-Q. Forms N-Q are available on the SEC’s web site at http://www.sec.gov. A fund's Forms N-Q may be reviewed and copied at the SEC’s Public Reference Room in Washington, DC. Information regarding the operation of the SEC's Public Reference Room may be obtained by calling 1-800-SEC-0330.
For a complete list of a fund's portfolio holdings, view the most recent holdings listing, semiannual report, or annual report on Fidelity's web site at http://www.fidelity.com, http://www.advisor.fidelity.com, or http://www.401k.com, as applicable.
NOT FDIC INSURED •MAY LOSE VALUE •NO BANK GUARANTEE
Neither the Fund nor Fidelity Distributors Corporation is a bank.
Investment Summary (Unaudited)
Top Ten Stocks as of April 30, 2016
| % of fund's net assets | % of fund's net assets 6 months ago | |
| Monsanto Co. | 5.5 | 6.9 |
| Syngenta AG (Switzerland) | 4.5 | 3.7 |
| Chevron Corp. | 4.0 | 3.8 |
| Rio Tinto PLC | 3.6 | 4.3 |
| BHP Billiton PLC | 3.3 | 4.7 |
| Potash Corp. of Saskatchewan, Inc. | 3.0 | 4.9 |
| Agrium, Inc. | 3.0 | 3.8 |
| CF Industries Holdings, Inc. | 2.8 | 2.5 |
| The Mosaic Co. | 2.6 | 3.9 |
| Total SA | 2.3 | 2.2 |
| 34.6 |
Top Sectors (% of fund's net assets)
| As of April 30, 2016 | ||
| Agriculture | 34.2% | |
| Energy | 32.2% | |
| Metals | 26.0% | |
| Other | 5.5% | |
| Short-Term Investment and Net Other Assets | 2.1% | |

| As of October 31, 2015 | ||
| Agriculture | 37.7% | |
| Energy | 29.6% | |
| Metals | 26.5% | |
| Other | 6.1% | |
| Short-Term Investment and Net Other Assets | 0.1% | |

Investments April 30, 2016 (Unaudited)
Showing Percentage of Net Assets
| Common Stocks - 96.9% | |||
| Shares | Value | ||
| Aerospace & Defense - 0.4% | |||
| Aerospace & Defense - 0.4% | |||
| Rolls-Royce Group PLC | 120,320 | $1,177,018 | |
| Chemicals - 27.0% | |||
| Commodity Chemicals - 0.6% | |||
| LyondellBasell Industries NV Class A | 19,400 | 1,603,798 | |
| Diversified Chemicals - 0.8% | |||
| E.I. du Pont de Nemours & Co. | 24,000 | 1,581,840 | |
| Eastman Chemical Co. | 6,700 | 511,746 | |
| 2,093,586 | |||
| Fertilizers & Agricultural Chemicals - 25.2% | |||
| Agrium, Inc. | 92,100 | 7,936,441 | |
| CF Industries Holdings, Inc. | 229,460 | 7,588,242 | |
| FMC Corp. | 25,100 | 1,085,826 | |
| Israel Chemicals Ltd. | 152,200 | 755,206 | |
| Monsanto Co. | 158,500 | 14,848,283 | |
| OCI NV (a)(b) | 67,400 | 1,332,450 | |
| Potash Corp. of Saskatchewan, Inc. | 455,000 | 8,050,530 | |
| Sociedad Quimica y Minera de Chile SA (PN-B) sponsored ADR | 185,800 | 3,870,214 | |
| Syngenta AG (Switzerland) | 30,463 | 12,194,092 | |
| The Mosaic Co. | 245,861 | 6,881,649 | |
| Yara International ASA | 83,000 | 3,323,360 | |
| 67,866,293 | |||
| Specialty Chemicals - 0.4% | |||
| Albemarle Corp. U.S. | 8,300 | 549,128 | |
| W.R. Grace & Co. | 6,700 | 513,756 | |
| 1,062,884 | |||
| TOTAL CHEMICALS | 72,626,561 | ||
| Containers & Packaging - 1.1% | |||
| Metal & Glass Containers - 0.4% | |||
| Ball Corp. | 14,800 | 1,056,424 | |
| Paper Packaging - 0.7% | |||
| Graphic Packaging Holding Co. | 35,700 | 474,096 | |
| Smurfit Kappa Group PLC | 20,000 | 530,158 | |
| WestRock Co. | 19,659 | 822,729 | |
| 1,826,983 | |||
| TOTAL CONTAINERS & PACKAGING | 2,883,407 | ||
| Electrical Equipment - 0.5% | |||
| Electrical Components & Equipment - 0.5% | |||
| Regal Beloit Corp. | 9,100 | 586,222 | |
| SolarCity Corp. (a) | 20,500 | 621,560 | |
| 1,207,782 | |||
| Energy Equipment & Services - 0.5% | |||
| Oil & Gas Equipment & Services - 0.5% | |||
| Baker Hughes, Inc. | 17,300 | 836,628 | |
| Dril-Quip, Inc. (a) | 1,800 | 116,676 | |
| SBM Offshore NV | 37,500 | 502,176 | |
| 1,455,480 | |||
| Food Products - 3.4% | |||
| Agricultural Products - 3.2% | |||
| Archer Daniels Midland Co. | 48,600 | 1,941,084 | |
| Bunge Ltd. | 11,500 | 718,750 | |
| Darling International, Inc. (a) | 164,100 | 2,377,809 | |
| First Resources Ltd. | 1,033,700 | 1,464,251 | |
| Golden Agri-Resources Ltd. | 2,237,800 | 665,591 | |
| SLC Agricola SA | 294,200 | 1,327,610 | |
| 8,495,095 | |||
| Packaged Foods & Meats - 0.2% | |||
| Adecoagro SA (a) | 61,200 | 652,392 | |
| TOTAL FOOD PRODUCTS | 9,147,487 | ||
| Household Products - 0.3% | |||
| Household Products - 0.3% | |||
| Svenska Cellulosa AB (SCA) (B Shares) | 21,200 | 667,644 | |
| Independent Power and Renewable Electricity Producers - 1.4% | |||
| Independent Power Producers & Energy Traders - 0.3% | |||
| China Resources Power Holdings Co. Ltd. | 396,000 | 666,962 | |
| Renewable Electricity - 1.1% | |||
| Huaneng Renewables Corp. Ltd. (H Shares) | 3,010,000 | 888,204 | |
| NextEra Energy Partners LP | 71,600 | 2,068,524 | |
| 2,956,728 | |||
| TOTAL INDEPENDENT POWER AND RENEWABLE ELECTRICITY PRODUCERS | 3,623,690 | ||
| Machinery - 1.3% | |||
| Agricultural & Farm Machinery - 1.2% | |||
| AGCO Corp. | 27,100 | 1,449,037 | |
| Deere & Co. | 12,500 | 1,051,375 | |
| Jain Irrigation Systems Ltd. (a) | 954,603 | 878,070 | |
| 3,378,482 | |||
| Construction Machinery & Heavy Trucks - 0.1% | |||
| Caterpillar, Inc. | 3,000 | 233,160 | |
| TOTAL MACHINERY | 3,611,642 | ||
| Metals & Mining - 25.2% | |||
| Aluminum - 0.4% | |||
| Alcoa, Inc. | 93,600 | 1,045,512 | |
| Diversified Metals & Mining - 10.6% | |||
| Anglo American PLC (United Kingdom) | 62,851 | 701,066 | |
| BHP Billiton PLC | 644,273 | 8,803,665 | |
| Boliden AB (b) | 31,200 | 543,930 | |
| First Quantum Minerals Ltd. | 115,724 | 985,964 | |
| Freeport-McMoRan, Inc. (b) | 48,100 | 673,400 | |
| Glencore Xstrata PLC | 1,335,538 | 3,178,865 | |
| Grupo Mexico SA de CV Series B | 568,211 | 1,445,244 | |
| Ivanhoe Mines Ltd. (a) | 906,400 | 751,300 | |
| MMC Norilsk Nickel PJSC sponsored ADR | 66,400 | 979,400 | |
| Rio Tinto PLC | 292,187 | 9,801,792 | |
| South32 Ltd. (a) | 443,636 | 559,949 | |
| Turquoise Hill Resources Ltd. (a) | 53,000 | 158,404 | |
| 28,582,979 | |||
| Gold - 8.2% | |||
| Agnico Eagle Mines Ltd. (Canada) | 35,800 | 1,692,275 | |
| AngloGold Ashanti Ltd. sponsored ADR (a) | 35,600 | 585,620 | |
| Argonaut Gold, Inc. (a) | 319,700 | 749,118 | |
| B2Gold Corp. (a) | 965,680 | 2,147,324 | |
| Barrick Gold Corp. | 150,400 | 2,911,625 | |
| Compania de Minas Buenaventura SA sponsored ADR (a)(b) | 60,500 | 614,075 | |
| Continental Gold, Inc. (a) | 479,200 | 1,057,929 | |
| Franco-Nevada Corp. | 21,700 | 1,523,687 | |
| Goldcorp, Inc. | 137,910 | 2,778,644 | |
| Newcrest Mining Ltd. (a) | 58,573 | 844,848 | |
| Newmont Mining Corp. | 87,500 | 3,059,875 | |
| Premier Gold Mines Ltd. (a) | 200,500 | 599,247 | |
| Randgold Resources Ltd. sponsored ADR | 16,600 | 1,668,300 | |
| SEMAFO, Inc. (a) | 139,900 | 623,289 | |
| Sibanye Gold Ltd. ADR (b) | 41,400 | 637,560 | |
| Torex Gold Resources, Inc. (a) | 351,200 | 624,194 | |
| 22,117,610 | |||
| Precious Metals & Minerals - 0.5% | |||
| Impala Platinum Holdings Ltd. (a) | 60,500 | 250,751 | |
| Industrias Penoles SA de CV | 35,035 | 547,681 | |
| Tahoe Resources, Inc. | 40,600 | 573,390 | |
| 1,371,822 | |||
| Silver - 0.6% | |||
| Silver Wheaton Corp. | 76,500 | 1,602,921 | |
| Steel - 4.9% | |||
| ArcelorMittal SA Class A unit (b) | 193,710 | 1,090,587 | |
| Fortescue Metals Group Ltd. | 100,000 | 259,279 | |
| Hitachi Metals Ltd. (c) | 63,700 | 646,820 | |
| Hyundai Steel Co. | 17,664 | 969,791 | |
| JFE Holdings, Inc. | 34,100 | 478,537 | |
| Kobe Steel Ltd. | 498,000 | 478,189 | |
| Nippon Steel & Sumitomo Metal Corp. | 111,200 | 2,313,824 | |
| Nucor Corp. | 40,700 | 2,026,046 | |
| POSCO | 9,750 | 2,031,585 | |
| Steel Dynamics, Inc. | 20,600 | 519,326 | |
| Thyssenkrupp AG | 66,200 | 1,539,545 | |
| Voestalpine AG | 19,200 | 692,087 | |
| 13,045,616 | |||
| TOTAL METALS & MINING | 67,766,460 | ||
| Oil, Gas & Consumable Fuels - 30.3% | |||
| Coal & Consumable Fuels - 0.4% | |||
| Cameco Corp. | 70,800 | 885,917 | |
| Coal India Ltd. | 55,487 | 240,616 | |
| 1,126,533 | |||
| Integrated Oil & Gas - 16.5% | |||
| BP PLC | 478,800 | 2,637,892 | |
| Cenovus Energy, Inc. | 171,300 | 2,715,515 | |
| Chevron Corp. | 104,800 | 10,708,464 | |
| China Petroleum & Chemical Corp. (H Shares) | 1,290,000 | 909,043 | |
| Eni SpA | 58,000 | 947,542 | |
| Exxon Mobil Corp. | 50,700 | 4,481,880 | |
| Imperial Oil Ltd. | 58,700 | 1,946,686 | |
| InterOil Corp. (a) | 19,100 | 639,277 | |
| Lukoil PJSC sponsored ADR | 40,300 | 1,708,116 | |
| Occidental Petroleum Corp. | 9,400 | 720,510 | |
| Royal Dutch Shell PLC: | |||
| Class A (United Kingdom) | 150,000 | 3,928,980 | |
| Class B (United Kingdom) | 39,863 | 1,046,598 | |
| Statoil ASA | 115,800 | 2,038,230 | |
| Suncor Energy, Inc. | 109,032 | 3,200,485 | |
| Total SA | 122,600 | 6,196,300 | |
| YPF SA Class D sponsored ADR | 33,300 | 670,995 | |
| 44,496,513 | |||
| Oil & Gas Exploration & Production - 12.9% | |||
| Anadarko Petroleum Corp. | 106,600 | 5,624,216 | |
| Apache Corp. | 19,300 | 1,049,920 | |
| Cabot Oil & Gas Corp. | 50,700 | 1,186,380 | |
| Carrizo Oil & Gas, Inc. (a) | 15,500 | 548,235 | |
| Cimarex Energy Co. | 4,600 | 500,848 | |
| CNOOC Ltd. sponsored ADR (b) | 16,700 | 2,061,281 | |
| Cobalt International Energy, Inc. (a) | 284,500 | 918,935 | |
| ConocoPhillips Co. | 67,900 | 3,244,941 | |
| Continental Resources, Inc. (a) | 13,900 | 517,914 | |
| Devon Energy Corp. | 30,200 | 1,047,336 | |
| EOG Resources, Inc. | 29,300 | 2,420,766 | |
| EQT Corp. | 26,601 | 1,864,730 | |
| Hess Corp. | 13,700 | 816,794 | |
| Marathon Oil Corp. | 58,900 | 829,901 | |
| Newfield Exploration Co. (a) | 14,100 | 511,125 | |
| Noble Energy, Inc. | 60,900 | 2,199,099 | |
| NOVATEK OAO GDR (Reg. S) | 11,200 | 1,075,200 | |
| PDC Energy, Inc. (a) | 12,800 | 803,712 | |
| Pioneer Natural Resources Co. | 3,410 | 566,401 | |
| PrairieSky Royalty Ltd. | 91,000 | 1,916,171 | |
| QEP Resources, Inc. | 20,700 | 371,151 | |
| SM Energy Co. | 55,300 | 1,723,148 | |
| Southwestern Energy Co. (a)(b) | 42,100 | 565,403 | |
| Tullow Oil PLC (a) | 148,500 | 606,895 | |
| Whiting Petroleum Corp. (a)(b) | 76,700 | 920,400 | |
| Woodside Petroleum Ltd. | 35,573 | 766,538 | |
| 34,657,440 | |||
| Oil & Gas Storage & Transport - 0.5% | |||
| Teekay LNG Partners LP | 5,400 | 74,196 | |
| Williams Partners LP | 37,900 | 1,145,717 | |
| 1,219,913 | |||
| TOTAL OIL, GAS & CONSUMABLE FUELS | 81,500,399 | ||
| Paper & Forest Products - 4.5% | |||
| Forest Products - 0.6% | |||
| TFS Corp. Ltd. | 632,575 | 750,326 | |
| West Fraser Timber Co. Ltd. | 26,900 | 886,304 | |
| 1,636,630 | |||
| Paper Products - 3.9% | |||
| Empresas CMPC SA | 534,203 | 1,208,006 | |
| Fibria Celulose SA | 198,300 | 1,751,648 | |
| Mondi PLC | 172,100 | 3,289,148 | |
| Oji Holdings Corp. | 174,000 | 714,538 | |
| Stora Enso Oyj (R Shares) (b) | 176,500 | 1,540,012 | |
| UPM-Kymmene Corp. (b) | 103,500 | 1,976,791 | |
| 10,480,143 | |||
| TOTAL PAPER & FOREST PRODUCTS | 12,116,773 | ||
| Real Estate Investment Trusts - 0.7% | |||
| Specialized REITs - 0.7% | |||
| Potlatch Corp. | 52,400 | 1,845,528 | |
| Semiconductors & Semiconductor Equipment - 0.3% | |||
| Semiconductor Equipment - 0.3% | |||
| SolarEdge Technologies, Inc. (a) | 27,400 | 734,046 | |
| TOTAL COMMON STOCKS | |||
| (Cost $331,791,961) | 260,363,917 | ||
| Nonconvertible Preferred Stocks - 1.0% | |||
| Aerospace & Defense - 0.0% | |||
| Aerospace & Defense - 0.0% | |||
| Rolls-Royce Group PLC | 8,542,720 | 12,482 | |
| Metals & Mining - 0.7% | |||
| Steel - 0.7% | |||
| Vale SA (PN-A) sponsored ADR | 449,300 | 2,039,822 | |
| Oil, Gas & Consumable Fuels - 0.3% | |||
| Integrated Oil & Gas - 0.3% | |||
| Petroleo Brasileiro SA - Petrobras (PN) sponsored (non-vtg.) (a) | 123,600 | 729,240 | |
| TOTAL NONCONVERTIBLE PREFERRED STOCKS | |||
| (Cost $5,284,416) | 2,781,544 | ||
| Money Market Funds - 5.3% | |||
| Fidelity Cash Central Fund, 0.38% (d) | 6,967,597 | 6,967,597 | |
| Fidelity Securities Lending Cash Central Fund, 0.42% (d)(e) | 7,338,155 | 7,338,155 | |
| TOTAL MONEY MARKET FUNDS | |||
| (Cost $14,305,752) | 14,305,752 | ||
| TOTAL INVESTMENT PORTFOLIO - 103.2% | |||
| (Cost $351,382,129) | 277,451,213 | ||
| NET OTHER ASSETS (LIABILITIES) - (3.2)% | (8,591,938) | ||
| NET ASSETS - 100% | $268,859,275 |
Legend
(a) Non-income producing
(b) Security or a portion of the security is on loan at period end.
(c) Security or a portion of the security purchased on a delayed delivery or when-issued basis.
(d) Affiliated fund that is generally available only to investment companies and other accounts managed by Fidelity Investments. The rate quoted is the annualized seven-day yield of the fund at period end. A complete unaudited listing of the fund's holdings as of its most recent quarter end is available upon request. In addition, each Fidelity Central Fund's financial statements are available on the SEC's website or upon request.
(e) Investment made with cash collateral received from securities on loan.
Affiliated Central Funds
Information regarding fiscal year to date income earned by the Fund from investments in Fidelity Central Funds is as follows:
| Fund | Income earned |
| Fidelity Cash Central Fund | $4,891 |
| Fidelity Securities Lending Cash Central Fund | 106,267 |
| Total | $111,158 |
Investment Valuation
The following is a summary of the inputs used, as of April 30, 2016, involving the Fund's assets and liabilities carried at fair value. The inputs or methodology used for valuing securities may not be an indication of the risk associated with investing in those securities. For more information on valuation inputs, and their aggregation into the levels used below, please refer to the Investment Valuation section in the accompanying Notes to Financial Statements.
| Valuation Inputs at Reporting Date: | ||||
| Description | Total | Level 1 | Level 2 | Level 3 |
| Investments in Securities: | ||||
| Common Stocks | $260,363,917 | $215,835,216 | $44,528,701 | $-- |
| Nonconvertible Preferred Stocks | 2,781,544 | 2,781,544 | -- | -- |
| Money Market Funds | 14,305,752 | 14,305,752 | -- | -- |
| Total Investments in Securities: | $277,451,213 | $232,922,512 | $44,528,701 | $-- |
The following is a summary of transfers between Level 1 and Level 2 for the period ended April 30, 2016. Transfers are assumed to have occurred at the beginning of the period, and are primarily attributable to the valuation techniques used for foreign equity securities, as discussed in the accompanying Notes to Financial Statements:
| Transfers | Total |
| Level 1 to Level 2 | $0 |
| Level 2 to Level 1 | $14,804,712 |
Other Information
Distribution of investments by country or territory of incorporation, as a percentage of Total Net Assets, is as follows (Unaudited):
| United States of America | 40.3% |
| Canada | 17.3% |
| United Kingdom | 11.9% |
| Switzerland | 4.5% |
| France | 2.3% |
| Brazil | 2.2% |
| Norway | 2.0% |
| Chile | 1.8% |
| Bailiwick of Jersey | 1.8% |
| Japan | 1.8% |
| Russia | 1.4% |
| Finland | 1.3% |
| Netherlands | 1.3% |
| Australia | 1.2% |
| Korea (South) | 1.1% |
| Hong Kong | 1.1% |
| Others (Individually Less Than 1%) | 6.7% |
| 100.0% |
See accompanying notes which are an integral part of the financial statements.
Financial Statements
Statement of Assets and Liabilities
| April 30, 2016 (Unaudited) | ||
| Assets | ||
| Investment in securities, at value (including securities loaned of $7,031,911) — See accompanying schedule: Unaffiliated issuers (cost $337,076,377) | $263,145,461 | |
| Fidelity Central Funds (cost $14,305,752) | 14,305,752 | |
| Total Investments (cost $351,382,129) | $277,451,213 | |
| Foreign currency held at value (cost $26,141) | 26,141 | |
| Receivable for investments sold | 1,128,703 | |
| Receivable for fund shares sold | 1,257,584 | |
| Dividends receivable | 1,107,997 | |
| Distributions receivable from Fidelity Central Funds | 21,225 | |
| Prepaid expenses | 281 | |
| Other receivables | 6,912 | |
| Total assets | 281,000,056 | |
| Liabilities | ||
| Payable to custodian bank | $324 | |
| Payable for investments purchased | ||
| Regular delivery | 3,410,510 | |
| Delayed delivery | 76,258 | |
| Payable for fund shares redeemed | 1,052,362 | |
| Accrued management fee | 142,776 | |
| Distribution and service plan fees payable | 18,314 | |
| Other affiliated payables | 65,802 | |
| Other payables and accrued expenses | 36,280 | |
| Collateral on securities loaned, at value | 7,338,155 | |
| Total liabilities | 12,140,781 | |
| Net Assets | $268,859,275 | |
| Net Assets consist of: | ||
| Paid in capital | $443,643,861 | |
| Undistributed net investment income | 1,567,386 | |
| Accumulated undistributed net realized gain (loss) on investments and foreign currency transactions | (102,409,631) | |
| Net unrealized appreciation (depreciation) on investments and assets and liabilities in foreign currencies | (73,942,341) | |
| Net Assets | $268,859,275 | |
| Calculation of Maximum Offering Price | ||
| Class A: | ||
| Net Asset Value and redemption price per share ($32,034,388 ÷ 3,073,781 shares) | $10.42 | |
| Maximum offering price per share (100/94.25 of $10.42) | $11.06 | |
| Class T: | ||
| Net Asset Value and redemption price per share ($6,177,528 ÷ 592,800 shares) | $10.42 | |
| Maximum offering price per share (100/96.50 of $10.42) | $10.80 | |
| Class B: | ||
| Net Asset Value and offering price per share ($805,040 ÷ 77,326 shares)(a) | $10.41 | |
| Class C: | ||
| Net Asset Value and offering price per share ($11,528,539 ÷ 1,114,551 shares)(a) | $10.34 | |
| Global Commodity Stock: | ||
| Net Asset Value, offering price and redemption price per share ($187,023,903 ÷ 17,915,595 shares) | $10.44 | |
| Class I: | ||
| Net Asset Value, offering price and redemption price per share ($31,289,877 ÷ 2,999,773 shares) | $10.43 |
(a) Redemption price per share is equal to net asset value less any applicable contingent deferred sales charge.
See accompanying notes which are an integral part of the financial statements.
Statement of Operations
| Six months ended April 30, 2016 (Unaudited) | ||
| Investment Income | ||
| Dividends | $3,551,835 | |
| Income from Fidelity Central Funds | 111,158 | |
| Income before foreign taxes withheld | 3,662,993 | |
| Less foreign taxes withheld | (261,962) | |
| Total income | 3,401,031 | |
| Expenses | ||
| Management fee | $741,086 | |
| Transfer agent fees | 311,622 | |
| Distribution and service plan fees | 101,260 | |
| Accounting and security lending fees | 55,708 | |
| Custodian fees and expenses | 29,898 | |
| Independent trustees' compensation | 460 | |
| Registration fees | 75,498 | |
| Audit | 31,910 | |
| Legal | 915 | |
| Miscellaneous | 719 | |
| Total expenses before reductions | 1,349,076 | |
| Expense reductions | (5,501) | 1,343,575 |
| Net investment income (loss) | 2,057,456 | |
| Realized and Unrealized Gain (Loss) | ||
| Net realized gain (loss) on: | ||
| Investment securities: | ||
| Unaffiliated issuers | (32,971,910) | |
| Foreign currency transactions | (34,212) | |
| Total net realized gain (loss) | (33,006,122) | |
| Change in net unrealized appreciation (depreciation) on: Investment securities | 47,992,729 | |
| Assets and liabilities in foreign currencies | 14,367 | |
| Total change in net unrealized appreciation (depreciation) | 48,007,096 | |
| Net gain (loss) | 15,000,974 | |
| Net increase (decrease) in net assets resulting from operations | $17,058,430 |
See accompanying notes which are an integral part of the financial statements.
Statement of Changes in Net Assets
| Six months ended April 30, 2016 (Unaudited) | Year ended October 31, 2015 | |
| Increase (Decrease) in Net Assets | ||
| Operations | ||
| Net investment income (loss) | $2,057,456 | $5,601,197 |
| Net realized gain (loss) | (33,006,122) | (22,741,457) |
| Change in net unrealized appreciation (depreciation) | 48,007,096 | (54,129,193) |
| Net increase (decrease) in net assets resulting from operations | 17,058,430 | (71,269,453) |
| Distributions to shareholders from net investment income | (5,140,876) | (3,898,874) |
| Distributions to shareholders from net realized gain | (224,075) | (629,272) |
| Total distributions | (5,364,951) | (4,528,146) |
| Share transactions - net increase (decrease) | 26,135,446 | (20,805,112) |
| Redemption fees | 5,198 | 7,987 |
| Total increase (decrease) in net assets | 37,834,123 | (96,594,724) |
| Net Assets | ||
| Beginning of period | 231,025,152 | 327,619,876 |
| End of period (including undistributed net investment income of $1,567,386 and undistributed net investment income of $4,650,806, respectively) | $268,859,275 | $231,025,152 |
See accompanying notes which are an integral part of the financial statements.
Financial Highlights — Fidelity Global Commodity Stock Fund Class A
| Six months ended (Unaudited) April 30, | Years ended October 31, | |||||
| 2016 | 2015 | 2014 | 2013 | 2012 | 2011 | |
| Selected Per–Share Data | ||||||
| Net asset value, beginning of period | $10.05 | $13.25 | $14.17 | $14.59 | $15.14 | $15.60 |
| Income from Investment Operations | ||||||
| Net investment income (loss)A | .08 | .22 | .15 | .16 | .11 | .12 |
| Net realized and unrealized gain (loss) | .51 | (3.25) | (.91) | (.45) | (.59) | (.38) |
| Total from investment operations | .59 | (3.03) | (.76) | (.29) | (.48) | (.26) |
| Distributions from net investment income | (.21) | (.14) | (.15) | (.13) | (.05) | (.13) |
| Distributions from net realized gain | (.01) | (.03) | (.01) | – | (.01) | (.06) |
| Total distributions | (.22) | (.17) | (.16) | (.13) | (.07)B | (.20)C |
| Redemption fees added to paid in capitalA,D | – | – | – | – | – | – |
| Net asset value, end of period | $10.42 | $10.05 | $13.25 | $14.17 | $14.59 | $15.14 |
| Total ReturnE,F,G | 6.14% | (23.16)% | (5.41)% | (2.00)% | (3.19)% | (1.80)% |
| Ratios to Average Net AssetsH,I | ||||||
| Expenses before reductions | 1.43%J | 1.34% | 1.35% | 1.36% | 1.34% | 1.32% |
| Expenses net of fee waivers, if any | 1.43%J | 1.34% | 1.35% | 1.35% | 1.34% | 1.32% |
| Expenses net of all reductions | 1.42%J | 1.34% | 1.35% | 1.34% | 1.33% | 1.31% |
| Net investment income (loss) | 1.77%J | 1.85% | 1.05% | 1.12% | .80% | .71% |
| Supplemental Data | ||||||
| Net assets, end of period (000 omitted) | $32,034 | $31,391 | $51,586 | $71,293 | $99,694 | $127,979 |
| Portfolio turnover rateK | 99%J | 77% | 75% | 65% | 91% | 71% |
A Calculated based on average shares outstanding during the period.
B Total distributions of $.07 per share is comprised of distributions from net investment income of $.052 and distributions from net realized gain of $.014 per share.
C Total distributions of $.20 per share is comprised of distributions from net investment income of $.133 and distributions from net realized gain of $.062 per share.
D Amount represents less than $.005 per share.
E Total returns for periods of less than one year are not annualized.
F Total returns would have been lower if certain expenses had not been reduced during the applicable periods shown.
G Total returns do not include the effect of the sales charges.
H Fees and expenses of any underlying Fidelity Central Funds are not included in the Fund's expense ratio. The Fund indirectly bears its proportionate share of the expenses of any underlying Fidelity Central Funds.
I Expense ratios reflect operating expenses of the class. Expenses before reductions do not reflect amounts reimbursed by the investment adviser or reductions from brokerage service arrangements or reductions from other expense offset arrangements and do not represent the amount paid by the class during periods when reimbursements or reductions occur. Expenses net of fee waivers reflect expenses after reimbursement by the investment adviser but prior to reductions from brokerage service arrangements or other expense offset arrangements. Expenses net of all reductions represent the net expenses paid by the class.
J Annualized
K Amount does not include the portfolio activity of any underlying Fidelity Central Funds.
See accompanying notes which are an integral part of the financial statements.
Financial Highlights — Fidelity Global Commodity Stock Fund Class T
| Six months ended (Unaudited) April 30, | Years ended October 31, | |||||
| 2016 | 2015 | 2014 | 2013 | 2012 | 2011 | |
| Selected Per–Share Data | ||||||
| Net asset value, beginning of period | $10.02 | $13.21 | $14.13 | $14.54 | $15.08 | $15.55 |
| Income from Investment Operations | ||||||
| Net investment income (loss)A | .07 | .19 | .11 | .12 | .08 | .07 |
| Net realized and unrealized gain (loss) | .51 | (3.25) | (.90) | (.45) | (.60) | (.38) |
| Total from investment operations | .58 | (3.06) | (.79) | (.33) | (.52) | (.31) |
| Distributions from net investment income | (.17) | (.10) | (.11) | (.08) | (.01) | (.10) |
| Distributions from net realized gain | (.01) | (.03) | (.01) | – | (.01) | (.06) |
| Total distributions | (.18) | (.13) | (.13)B | (.08) | (.02) | (.16) |
| Redemption fees added to paid in capitalA,C | – | – | – | – | – | – |
| Net asset value, end of period | $10.42 | $10.02 | $13.21 | $14.13 | $14.54 | $15.08 |
| Total ReturnD,E,F | 6.03% | (23.40)% | (5.65)% | (2.26)% | (3.43)% | (2.09)% |
| Ratios to Average Net AssetsG,H | ||||||
| Expenses before reductions | 1.70%I | 1.63% | 1.62% | 1.62% | 1.61% | 1.60% |
| Expenses net of fee waivers, if any | 1.70%I | 1.63% | 1.62% | 1.61% | 1.61% | 1.60% |
| Expenses net of all reductions | 1.70%I | 1.62% | 1.62% | 1.60% | 1.60% | 1.59% |
| Net investment income (loss) | 1.50%I | 1.57% | .78% | .86% | .53% | .43% |
| Supplemental Data | ||||||
| Net assets, end of period (000 omitted) | $6,178 | $6,335 | $9,867 | $12,551 | $16,692 | $20,831 |
| Portfolio turnover rateJ | 99%I | 77% | 75% | 65% | 91% | 71% |
A Calculated based on average shares outstanding during the period.
B Total distributions of $.13 per share is comprised of distributions from net investment income of $.113 and distributions from net realized gain of $.013 per share.
C Amount represents less than $.005 per share.
D Total returns for periods of less than one year are not annualized.
E Total returns would have been lower if certain expenses had not been reduced during the applicable periods shown.
F Total returns do not include the effect of the sales charges.
G Fees and expenses of any underlying Fidelity Central Funds are not included in the Fund's expense ratio. The Fund indirectly bears its proportionate share of the expenses of any underlying Fidelity Central Funds.
H Expense ratios reflect operating expenses of the class. Expenses before reductions do not reflect amounts reimbursed by the investment adviser or reductions from brokerage service arrangements or reductions from other expense offset arrangements and do not represent the amount paid by the class during periods when reimbursements or reductions occur. Expenses net of fee waivers reflect expenses after reimbursement by the investment adviser but prior to reductions from brokerage service arrangements or other expense offset arrangements. Expenses net of all reductions represent the net expenses paid by the class.
I Annualized
J Amount does not include the portfolio activity of any underlying Fidelity Central Funds.
See accompanying notes which are an integral part of the financial statements.
Financial Highlights — Fidelity Global Commodity Stock Fund Class B
| Six months ended (Unaudited) April 30, | Years ended October 31, | |||||
| 2016 | 2015 | 2014 | 2013 | 2012 | 2011 | |
| Selected Per–Share Data | ||||||
| Net asset value, beginning of period | $9.97 | $13.12 | $14.01 | $14.41 | $15.00 | $15.46 |
| Income from Investment Operations | ||||||
| Net investment income (loss)A | .05 | .13 | .04 | .05 | –B | (.01) |
| Net realized and unrealized gain (loss) | .51 | (3.24) | (.89) | (.45) | (.59) | (.39) |
| Total from investment operations | .56 | (3.11) | (.85) | (.40) | (.59) | (.40) |
| Distributions from net investment income | (.11) | (.02) | (.03) | –B | – | – |
| Distributions from net realized gain | (.01) | (.03) | (.01) | – | – | (.06) |
| Total distributions | (.12) | (.04)C | (.04) | –B | – | (.06) |
| Redemption fees added to paid in capitalA,B | – | – | – | – | – | – |
| Net asset value, end of period | $10.41 | $9.97 | $13.12 | $14.01 | $14.41 | $15.00 |
| Total ReturnD,E,F | 5.72% | (23.76)% | (6.06)% | (2.75)% | (3.93)% | (2.62)% |
| Ratios to Average Net AssetsG,H | ||||||
| Expenses before reductions | 2.18%I | 2.13% | 2.11% | 2.11% | 2.10% | 2.11% |
| Expenses net of fee waivers, if any | 2.18%I | 2.12% | 2.11% | 2.11% | 2.10% | 2.11% |
| Expenses net of all reductions | 2.17%I | 2.12% | 2.11% | 2.10% | 2.10% | 2.10% |
| Net investment income (loss) | 1.03%I | 1.07% | .29% | .36% | .03% | (.09)% |
| Supplemental Data | ||||||
| Net assets, end of period (000 omitted) | $805 | $864 | $1,584 | $2,303 | $3,097 | $4,324 |
| Portfolio turnover rateJ | 99%I | 77% | 75% | 65% | 91% | 71% |
A Calculated based on average shares outstanding during the period.
B Amount represents less than $.005 per share.
C Total distributions of $.04 per share is comprised of distributions from net investment income of $.016 and distributions from net realized gain of $.026 per share.
D Total returns for periods of less than one year are not annualized.
E Total returns would have been lower if certain expenses had not been reduced during the applicable periods shown.
F Total returns do not include the effect of the contingent deferred sales charge.
G Fees and expenses of any underlying Fidelity Central Funds are not included in the Fund's expense ratio. The Fund indirectly bears its proportionate share of the expenses of any underlying Fidelity Central Funds.
H Expense ratios reflect operating expenses of the class. Expenses before reductions do not reflect amounts reimbursed by the investment adviser or reductions from brokerage service arrangements or reductions from other expense offset arrangements and do not represent the amount paid by the class during periods when reimbursements or reductions occur. Expenses net of fee waivers reflect expenses after reimbursement by the investment adviser but prior to reductions from brokerage service arrangements or other expense offset arrangements. Expenses net of all reductions represent the net expenses paid by the class.
I Annualized
J Amount does not include the portfolio activity of any underlying Fidelity Central Funds.
See accompanying notes which are an integral part of the financial statements.
Financial Highlights — Fidelity Global Commodity Stock Fund Class C
| Six months ended (Unaudited) April 30, | Years ended October 31, | |||||
| 2016 | 2015 | 2014 | 2013 | 2012 | 2011 | |
| Selected Per–Share Data | ||||||
| Net asset value, beginning of period | $9.92 | $13.06 | $13.96 | $14.37 | $14.95 | $15.45 |
| Income from Investment Operations | ||||||
| Net investment income (loss)A | .05 | .13 | .04 | .05 | .01 | (.01) |
| Net realized and unrealized gain (loss) | .50 | (3.22) | (.89) | (.44) | (.59) | (.38) |
| Total from investment operations | .55 | (3.09) | (.85) | (.39) | (.58) | (.39) |
| Distributions from net investment income | (.12) | (.03) | (.03) | (.02) | – | (.05) |
| Distributions from net realized gain | (.01) | (.03) | (.01) | – | – | (.06) |
| Total distributions | (.13) | (.05)B | (.05)C | (.02) | – | (.11) |
| Redemption fees added to paid in capitalA,D | – | – | – | – | – | – |
| Net asset value, end of period | $10.34 | $9.92 | $13.06 | $13.96 | $14.37 | $14.95 |
| Total ReturnE,F,G | 5.70% | (23.74)% | (6.13)% | (2.75)% | (3.88)% | (2.58)% |
| Ratios to Average Net AssetsH,I | ||||||
| Expenses before reductions | 2.18%J | 2.12% | 2.11% | 2.11% | 2.10% | 2.09% |
| Expenses net of fee waivers, if any | 2.18%J | 2.12% | 2.11% | 2.11% | 2.10% | 2.09% |
| Expenses net of all reductions | 2.17%J | 2.11% | 2.11% | 2.10% | 2.09% | 2.08% |
| Net investment income (loss) | 1.02%J | 1.08% | .29% | .36% | .03% | (.07)% |
| Supplemental Data | ||||||
| Net assets, end of period (000 omitted) | $11,529 | $11,274 | $17,659 | $23,830 | $31,865 | $37,185 |
| Portfolio turnover rateK | 99%J | 77% | 75% | 65% | 91% | 71% |
A Calculated based on average shares outstanding during the period.
B Total distributions of $.05 per share is comprised of distributions from net investment income of $.025 and distributions from net realized gain of $.026 per share.
C Total distributions of $.05 per share is comprised of distributions from net investment income of $.033 and distributions from net realized gain of $.013 per share.
D Amount represents less than $.005 per share.
E Total returns for periods of less than one year are not annualized.
F Total returns would have been lower if certain expenses had not been reduced during the applicable periods shown.
G Total returns do not include the effect of the contingent deferred sales charge.
H Fees and expenses of any underlying Fidelity Central Funds are not included in the Fund's expense ratio. The Fund indirectly bears its proportionate share of the expenses of any underlying Fidelity Central Funds.
I Expense ratios reflect operating expenses of the class. Expenses before reductions do not reflect amounts reimbursed by the investment adviser or reductions from brokerage service arrangements or reductions from other expense offset arrangements and do not represent the amount paid by the class during periods when reimbursements or reductions occur. Expenses net of fee waivers reflect expenses after reimbursement by the investment adviser but prior to reductions from brokerage service arrangements or other expense offset arrangements. Expenses net of all reductions represent the net expenses paid by the class.
J Annualized
K Amount does not include the portfolio activity of any underlying Fidelity Central Funds.
See accompanying notes which are an integral part of the financial statements.
Financial Highlights — Fidelity Global Commodity Stock Fund
| Six months ended (Unaudited) April 30, | Years ended October 31, | |||||
| 2016 | 2015 | 2014 | 2013 | 2012 | 2011 | |
| Selected Per–Share Data | ||||||
| Net asset value, beginning of period | $10.09 | $13.31 | $14.24 | $14.66 | $15.21 | $15.66 |
| Income from Investment Operations | ||||||
| Net investment income (loss)A | .09 | .25 | .19 | .19 | .15 | .16 |
| Net realized and unrealized gain (loss) | .51 | (3.27) | (.92) | (.45) | (.60) | (.39) |
| Total from investment operations | .60 | (3.02) | (.73) | (.26) | (.45) | (.23) |
| Distributions from net investment income | (.24) | (.18) | (.19) | (.16) | (.08) | (.16) |
| Distributions from net realized gain | (.01) | (.03) | (.01) | – | (.01) | (.06) |
| Total distributions | (.25) | (.20)B | (.20) | (.16) | (.10)C | (.22) |
| Redemption fees added to paid in capitalA,D | – | – | – | – | – | – |
| Net asset value, end of period | $10.44 | $10.09 | $13.31 | $14.24 | $14.66 | $15.21 |
| Total ReturnE,F | 6.26% | (22.97)% | (5.16)% | (1.75)% | (2.96)% | (1.59)% |
| Ratios to Average Net AssetsG,H | ||||||
| Expenses before reductions | 1.18%I | 1.12% | 1.11% | 1.11% | 1.10% | 1.08% |
| Expenses net of fee waivers, if any | 1.18%I | 1.12% | 1.11% | 1.11% | 1.10% | 1.08% |
| Expenses net of all reductions | 1.17%I | 1.11% | 1.11% | 1.09% | 1.09% | 1.07% |
| Net investment income (loss) | 2.03%I | 2.08% | 1.29% | 1.37% | 1.04% | .95% |
| Supplemental Data | ||||||
| Net assets, end of period (000 omitted) | $187,024 | $156,320 | $223,084 | $273,476 | $387,242 | $531,224 |
| Portfolio turnover rateJ | 99%I | 77% | 75% | 65% | 91% | 71% |
A Calculated based on average shares outstanding during the period.
B Total distributions of $.20 per share is comprised of distributions from net investment income of $.178 and distributions from net realized gain of $.026 per share.
C Total distributions of $.10 per share is comprised of distributions from net investment income of $.084 and distributions from net realized gain of $.014 per share.
D Amount represents less than $.005 per share.
E Total returns for periods of less than one year are not annualized.
F Total returns would have been lower if certain expenses had not been reduced during the applicable periods shown.
G Fees and expenses of any underlying Fidelity Central Funds are not included in the Fund's expense ratio. The Fund indirectly bears its proportionate share of the expenses of any underlying Fidelity Central Funds.
H Expense ratios reflect operating expenses of the class. Expenses before reductions do not reflect amounts reimbursed by the investment adviser or reductions from brokerage service arrangements or reductions from other expense offset arrangements and do not represent the amount paid by the class during periods when reimbursements or reductions occur. Expenses net of fee waivers reflect expenses after reimbursement by the investment adviser but prior to reductions from brokerage service arrangements or other expense offset arrangements. Expenses net of all reductions represent the net expenses paid by the class.
I Annualized
J Amount does not include the portfolio activity of any underlying Fidelity Central Funds.
See accompanying notes which are an integral part of the financial statements.
Financial Highlights — Fidelity Global Commodity Stock Fund Class I
| Six months ended (Unaudited) April 30, | Years ended October 31, | |||||
| 2016 | 2015 | 2014 | 2013 | 2012 | 2011 | |
| Selected Per–Share Data | ||||||
| Net asset value, beginning of period | $10.09 | $13.31 | $14.24 | $14.67 | $15.22 | $15.66 |
| Income from Investment Operations | ||||||
| Net investment income (loss)A | .09 | .25 | .19 | .20 | .16 | .16 |
| Net realized and unrealized gain (loss) | .51 | (3.26) | (.92) | (.45) | (.60) | (.38) |
| Total from investment operations | .60 | (3.01) | (.73) | (.25) | (.44) | (.22) |
| Distributions from net investment income | (.25) | (.19) | (.19) | (.18) | (.09) | (.16) |
| Distributions from net realized gain | (.01) | (.03) | (.01) | – | (.01) | (.06) |
| Total distributions | (.26) | (.21)B | (.20) | (.18) | (.11)C | (.22) |
| Redemption fees added to paid in capitalA,D | – | – | – | – | – | – |
| Net asset value, end of period | $10.43 | $10.09 | $13.31 | $14.24 | $14.67 | $15.22 |
| Total ReturnE,F | 6.27% | (22.93)% | (5.16)% | (1.71)% | (2.90)% | (1.50)% |
| Ratios to Average Net AssetsG,H | ||||||
| Expenses before reductions | 1.14%I | 1.09% | 1.06% | 1.04% | 1.04% | 1.03% |
| Expenses net of fee waivers, if any | 1.14%I | 1.08% | 1.06% | 1.04% | 1.04% | 1.03% |
| Expenses net of all reductions | 1.13%I | 1.08% | 1.06% | 1.03% | 1.03% | 1.03% |
| Net investment income (loss) | 2.07%I | 2.11% | 1.34% | 1.43% | 1.10% | .99% |
| Supplemental Data | ||||||
| Net assets, end of period (000 omitted) | $31,290 | $24,841 | $23,840 | $31,613 | $50,540 | $58,925 |
| Portfolio turnover rateJ | 99%I | 77% | 75% | 65% | 91% | 71% |
A Calculated based on average shares outstanding during the period.
B Total distributions of $.21 per share is comprised of distributions from net investment income of $.186 and distributions from net realized gain of $.026 per share.
C Total distributions of $.11 per share is comprised of distributions from net investment income of $.093 and distributions from net realized gain of $.014 per share.
D Amount represents less than $.005 per share.
E Total returns for periods of less than one year are not annualized.
F Total returns would have been lower if certain expenses had not been reduced during the applicable periods shown.
G Fees and expenses of any underlying Fidelity Central Funds are not included in the Fund's expense ratio. The Fund indirectly bears its proportionate share of the expenses of any underlying Fidelity Central Funds.
H Expense ratios reflect operating expenses of the class. Expenses before reductions do not reflect amounts reimbursed by the investment adviser or reductions from brokerage service arrangements or reductions from other expense offset arrangements and do not represent the amount paid by the class during periods when reimbursements or reductions occur. Expenses net of fee waivers reflect expenses after reimbursement by the investment adviser but prior to reductions from brokerage service arrangements or other expense offset arrangements. Expenses net of all reductions represent the net expenses paid by the class.
I Annualized
J Amount does not include the portfolio activity of any underlying Fidelity Central Funds.
See accompanying notes which are an integral part of the financial statements.
Notes to Financial Statements (Unaudited)
For the period ended April 30, 2016
1. Organization.
Fidelity Global Commodity Stock Fund (the Fund) is a non-diversified fund of Fidelity Investment Trust (the Trust) and is authorized to issue an unlimited number of shares. The Trust is registered under the Investment Company Act of 1940, as amended (the 1940 Act), as an open-end management investment company organized as a Massachusetts business trust. The Fund offers Class A, Class T, Class C, Global Commodity Stock and Class I shares, each of which, along with Class B shares, has equal rights as to assets and voting privileges. Class B shares are closed to new accounts and additional purchases, except for exchanges and reinvestments. Each class has exclusive voting rights with respect to matters that affect that class. Class B shares will automatically convert to Class A shares after a maximum holding period of seven years from the initial date of purchase. The Fund's investments in emerging markets can be subject to social, economic, regulatory, and political uncertainties and can be extremely volatile.
During the period, the Board of Trustees approved the conversion of all existing Class B shares into Class A shares, effective on or about July 1, 2016, regardless of the length of times shares have been held.
2. Investments in Fidelity Central Funds.
The Fund invests in Fidelity Central Funds, which are open-end investment companies generally available only to other investment companies and accounts managed by the investment adviser and its affiliates. The Fund's Schedule of Investments lists each of the Fidelity Central Funds held as of period end, if any, as an investment of the Fund, but does not include the underlying holdings of each Fidelity Central Fund. As an Investing Fund, the Fund indirectly bears its proportionate share of the expenses of the underlying Fidelity Central Funds.
The Money Market Central Funds seek preservation of capital and current income and are managed by Fidelity Investments Money Management, Inc. (FIMM), an affiliate of the investment adviser. Annualized expenses of the Money Market Central Funds as of their most recent shareholder report date are less than .005%.
A complete unaudited list of holdings for each Fidelity Central Fund is available upon request or at the Securities and Exchange Commission (the SEC) website at www.sec.gov. In addition, the financial statements of the Fidelity Central Funds are available on the SEC website or upon request.
3. Significant Accounting Policies.
The financial statements have been prepared in conformity with accounting principles generally accepted in the United States of America (GAAP), which require management to make certain estimates and assumptions at the date of the financial statements. Actual results could differ from those estimates. Subsequent events, if any, through the date that the financial statements were issued have been evaluated in the preparation of the financial statements. The following summarizes the significant accounting policies of the Fund:
Investment Valuation. Investments are valued as of 4:00 p.m. Eastern time on the last calendar day of the period. The Board of Trustees (the Board) has delegated the day to day responsibility for the valuation of the Fund's investments to the Fidelity Management & Research Company (FMR) Fair Value Committee (the Committee). In accordance with valuation policies and procedures approved by the Board, the Fund attempts to obtain prices from one or more third party pricing vendors or brokers to value its investments. When current market prices, quotations or currency exchange rates are not readily available or reliable, investments will be fair valued in good faith by the Committee, in accordance with procedures adopted by the Board. Factors used in determining fair value vary by investment type and may include market or investment specific events. The frequency with which these procedures are used cannot be predicted and they may be utilized to a significant extent. The Committee oversees the Fund's valuation policies and procedures and reports to the Board on the Committee's activities and fair value determinations. The Board monitors the appropriateness of the procedures used in valuing the Fund's investments and ratifies the fair value determinations of the Committee.
The Fund categorizes the inputs to valuation techniques used to value its investments into a disclosure hierarchy consisting of three levels as shown below:
- Level 1 – quoted prices in active markets for identical investments
- Level 2 – other significant observable inputs (including quoted prices for similar investments, interest rates, prepayment speeds, etc.)
- Level 3 – unobservable inputs (including the Fund's own assumptions based on the best information available)
Valuation techniques used to value the Fund's investments by major category are as follows:
Equity securities, including restricted securities, for which market quotations are readily available, are valued at the last reported sale price or official closing price as reported by a third party pricing vendor on the primary market or exchange on which they are traded and are categorized as Level 1 in the hierarchy. In the event there were no sales during the day or closing prices are not available, securities are valued at the last quoted bid price or may be valued using the last available price and are generally categorized as Level 2 in the hierarchy. For foreign equity securities, when market or security specific events arise, comparisons to the valuation of American Depositary Receipts (ADRs), futures contracts, Exchange-Traded Funds (ETFs) and certain indexes as well as quoted prices for similar securities may be used and would be categorized as Level 2 in the hierarchy. Utilizing these techniques may result in transfers between Level 1 and Level 2. For equity securities, including restricted securities, where observable inputs are limited, assumptions about market activity and risk are used and these securities may be categorized as Level 3 in the hierarchy.
Investments in open-end mutual funds, including the Fidelity Central Funds, are valued at their closing net asset value (NAV) each business day and are categorized as Level 1 in the hierarchy.
Changes in valuation techniques may result in transfers in or out of an assigned level within the disclosure hierarchy. The aggregate value of investments by input level as of April 30, 2016, including information on transfers between Levels 1 and 2, is included at the end of the Fund's Schedule of Investments.
Foreign Currency. The Fund may use foreign currency contracts to facilitate transactions in foreign-denominated securities. Gains and losses from these transactions may arise from changes in the value of the foreign currency or if the counterparties do not perform under the contracts' terms.
Foreign-denominated assets, including investment securities, and liabilities are translated into U.S. dollars at the exchange rates at period end. Purchases and sales of investment securities, income and dividends received and expenses denominated in foreign currencies are translated into U.S. dollars at the exchange rate in effect on the transaction date.
The effects of exchange rate fluctuations on investments are included with the net realized and unrealized gain (loss) on investment securities. Other foreign currency transactions resulting in realized and unrealized gain (loss) are disclosed separately.
Investment Transactions and Income. For financial reporting purposes, the Fund's investment holdings and NAV include trades executed through the end of the last business day of the period. The NAV per share for processing shareholder transactions is calculated as of the close of business of the New York Stock Exchange (NYSE), normally 4:00 p.m. Eastern time and includes trades executed through the end of the prior business day. Gains and losses on securities sold are determined on the basis of identified cost and may include proceeds received from litigation. Dividend income is recorded on the ex-dividend date, except for certain dividends from foreign securities where the ex-dividend date may have passed, which are recorded as soon as the Fund is informed of the ex-dividend date. Non-cash dividends included in dividend income, if any, are recorded at the fair market value of the securities received. Income and capital gain distributions from Fidelity Central Funds, if any, are recorded on the ex-dividend date. Distributions received on securities that represent a return of capital or capital gain are recorded as a reduction of cost of investments and/or as a realized gain. Subsequent to ex-dividend date the Fund determines the components of these distributions, based upon receipt of tax filings or other correspondence relating to the underlying investment. Investment income is recorded net of foreign taxes withheld where recovery of such taxes is uncertain.
Class Allocations and Expenses. Investment income, realized and unrealized capital gains and losses, common expenses of the Fund, and certain fund-level expense reductions, if any, are allocated daily on a pro-rata basis to each class based on the relative net assets of each class to the total net assets of the Fund. Each class differs with respect to transfer agent and distribution and service plan fees incurred. Certain expense reductions may also differ by class. For the reporting period, the allocated portion of income and expenses to each class as a percent of its average net assets may vary due to the timing of recording these transactions in relation to fluctuating net assets of the classes. Expenses directly attributable to a fund are charged to that fund. Expenses attributable to more than one fund are allocated among the respective funds on the basis of relative net assets or other appropriate methods. Expense estimates are accrued in the period to which they relate and adjustments are made when actual amounts are known.
Income Tax Information and Distributions to Shareholders. Each year, the Fund intends to qualify as a regulated investment company under Subchapter M of the Internal Revenue Code, including distributing substantially all of its taxable income and realized gains. As a result, no provision for U.S. Federal income taxes is required. The Fund files a U.S. federal tax return, in addition to state and local tax returns as required. The Fund's federal income tax returns are subject to examination by the Internal Revenue Service (IRS) for a period of three fiscal years after they are filed. State and local tax returns may be subject to examination for an additional fiscal year depending on the jurisdiction. Foreign taxes are provided for based on the Fund's understanding of the tax rules and rates that exist in the foreign markets in which it invests.
Distributions are declared and recorded on the ex-dividend date. Income dividends and capital gain distributions are declared separately for each class. Income and capital gain distributions are determined in accordance with income tax regulations, which may differ from GAAP.
Capital accounts within the financial statements are adjusted for permanent book-tax differences. These adjustments have no impact on net assets or the results of operations. Capital accounts are not adjusted for temporary book-tax differences which will reverse in a subsequent period.
Book-tax differences are primarily due to foreign currency transactions, passive foreign investment companies (PFIC), partnerships, capital loss carryforwards and losses deferred due to wash sales.
The federal tax cost of investment securities and unrealized appreciation (depreciation) as of period end were as follows:
| Gross unrealized appreciation | $14,424,349 |
| Gross unrealized depreciation | (93,694,823) |
| Net unrealized appreciation (depreciation) on securities | $(79,270,474) |
| Tax cost | $356,721,687 |
Capital loss carryforwards are only available to offset future capital gains of the Fund to the extent provided by regulations and may be limited. Under the Regulated Investment Company Modernization Act of 2010 (the Act), the Fund is permitted to carry forward capital losses incurred in taxable years beginning after December 22, 2010 for an unlimited period and such capital losses are required to be used prior to any losses that expire. The capital loss carryforward information presented below, including any applicable limitation, is estimated as of prior fiscal period end and is subject to adjustment.
| Fiscal year of expiration | |
| 2019 | $(6,952,413) |
| No expiration | |
| Short-term | (17,522,131) |
| Long-term | (40,298,374) |
| Total no expiration | (57,820,505) |
| Total capital loss carryforward | $(64,772,918) |
Short-Term Trading (Redemption) Fees. Shares held by investors in the Fund less than 30 days may have been subject to a redemption fee equal to 1.00% of the NAV of shares redeemed. All redemption fees, which reduce the proceeds of the shareholder redemption, are retained by the Fund and accounted for as an addition to paid in capital.
Delayed Delivery Transactions and When-Issued Securities. During the period, the Fund transacted in securities on a delayed delivery or when-issued basis. Payment and delivery may take place after the customary settlement period for that security. The price of the underlying securities and the date when the securities will be delivered and paid for are fixed at the time the transaction is negotiated. The securities purchased on a delayed delivery or when-issued basis are identified as such in the Fund's Schedule of Investments. With respect to purchase commitments, the Fund identifies securities as segregated in its records with a value at least equal to the amount of the commitment. Losses may arise due to changes in the value of the underlying securities or if the counterparty does not perform under the contract's terms, or if the issuer does not issue the securities due to political, economic, or other factors.
4. Purchases and Sales of Investments.
Purchases and sales of securities, other than short-term securities, aggregated $124,970,983 and $107,482,256, respectively.
5. Fees and Other Transactions with Affiliates.
Management Fee. Fidelity Management & Research Company (the investment adviser) and its affiliates provide the Fund with investment management related services for which the Fund pays a monthly management fee. The management fee is the sum of an individual fund fee rate that is based on an annual rate of .45% of the Fund's average net assets and an annualized group fee rate that averaged .25% during the period. The group fee rate is based upon the average net assets of all the mutual funds advised by the investment adviser, including any mutual funds previously advised by the investment adviser that are currently advised by Fidelity SelectCo, LLC, an affiliate of the investment adviser. The group fee rate decreases as assets under management increase and increases as assets under management decrease. For the reporting period, the total annualized management fee rate was .70% of the Fund's average net assets.
Distribution and Service Plan Fees. In accordance with Rule 12b-1 of the 1940 Act, the Fund has adopted separate Distribution and Service Plans for each class of shares. Certain classes pay Fidelity Distributors Corporation (FDC), an affiliate of the investment adviser, separate Distribution and Service Fees, each of which is based on an annual percentage of each class' average net assets. In addition, FDC may pay financial intermediaries for selling shares of the Fund and providing shareholder support services. For the period, the Distribution and Service Fee rates, total fees and amounts retained by FDC were as follows:
| Distribution Fee | Service Fee | Total Fees | Retained by FDC | |
| Class A | -% | .25% | $34,521 | $– |
| Class T | .25% | .25% | 13,584 | – |
| Class B | .75% | .25% | 3,615 | 2,711 |
| Class C | .75% | .25% | 49,540 | 6,624 |
| $101,260 | $9,335 |
Sales Load. FDC may receive a front-end sales charge of up to 5.75% for selling Class A shares and 3.50% for selling Class T shares, some of which is paid to financial intermediaries for selling shares of the Fund. Depending on the holding period, FDC may receive contingent deferred sales charges levied on Class A, Class T, Class B, and Class C redemptions. The deferred sales charges range from 5.00% to 1.00% for Class B shares, 1.00% for Class C shares, 1.00% for certain purchases of Class A shares and .25% for certain purchases of Class T shares.
For the period, sales charge amounts retained by FDC were as follows:
| Retained by FDC | |
| Class A | $10,807 |
| Class T | 1,023 |
| Class B(a) | 350 |
| Class C(a) | 334 |
| $12,514 |
(a) When Class B and Class C shares are initially sold, FDC pays commissions from its own resources to financial intermediaries through which the sales are made.
Transfer Agent Fees. Fidelity Investments Institutional Operations Company, Inc., (FIIOC), an affiliate of the investment adviser, is the transfer, dividend disbursing and shareholder servicing agent for each class of the Fund. FIIOC receives account fees and asset-based fees that vary according to the account size and type of account of the shareholders of the respective classes of the Fund. FIIOC pays for typesetting, printing and mailing of shareholder reports, except proxy statements.
For the period, transfer agent fees for each class were as follows:
| Amount | % of Class-Level Average Net Assets(a) | |
| Class A | $41,634 | .30 |
| Class T | 8,788 | .32 |
| Class B | 1,083 | .30 |
| Class C | 14,985 | .30 |
| Global Commodity Stock | 214,868 | .30 |
| Class I | 30,264 | .26 |
| $ 311,622 |
(a) Annualized
Accounting and Security Lending Fees. Fidelity Service Company, Inc. (FSC), an affiliate of the investment adviser, maintains the Fund's accounting records. The accounting fee is based on the level of average net assets for each month. Under a separate contract, FSC administers the security lending program. The security lending fee is based on the number and duration of lending transactions.
Brokerage Commissions. The Fund placed a portion of its portfolio transactions with brokerage firms which are affiliates of the investment adviser. Brokerage commissions are included in net realized gain (loss) and change in net unrealized appreciation (depreciation) in the Statement of Operations. The commissions paid to these affiliated firms were $4,386 for the period.
Interfund Trades. The Fund may purchase from or sell securities to other Fidelity Funds under procedures adopted by the Board. The procedures have been designed to ensure these interfund trades are executed in accordance with Rule 17a-7 of the 1940 Act. Interfund trades are included within the respective purchases and sales amounts shown in the Purchases and Sales of Investments note.
6. Committed Line of Credit.
The Fund participates with other funds managed by the investment adviser or an affiliate in a $4.25 billion credit facility (the "line of credit") to be utilized for temporary or emergency purposes to fund shareholder redemptions or for other short-term liquidity purposes. The Fund has agreed to pay commitment fees on its pro-rata portion of the line of credit, which amounted to $180 and is reflected in Miscellaneous expenses on the Statement of Operations. During the period, the Fund did not borrow on this line of credit.
7. Security Lending.
The Fund lends portfolio securities through a lending agent from time to time in order to earn additional income. For equity securities, a lending agent is used and may loan securities to certain qualified borrowers, including Fidelity Capital Markets (FCM), a broker-dealer affiliated with the Fund. On the settlement date of the loan, the Fund receives collateral (in the form of U.S. Treasury obligations, letters of credit and/or cash) against the loaned securities and maintains collateral in an amount not less than 100% of the market value of the loaned securities during the period of the loan. The market value of the loaned securities is determined at the close of business of the Fund and any additional required collateral is delivered to the Fund on the next business day. The Fund or borrower may terminate the loan at any time, and if the borrower defaults on its obligation to return the securities loaned because of insolvency or other reasons, the Fund may apply collateral received from the borrower against the obligation. The Fund may experience delays and costs in recovering the securities loaned. Any cash collateral received is invested in the Fidelity Securities Lending Cash Central Fund. The value of loaned securities and cash collateral at period end are disclosed on the Fund's Statement of Assets and Liabilities. Security lending income represents the income earned on investing cash collateral, less rebates paid to borrowers and any lending agent fees associated with the loan, plus any premium payments received for lending certain types of securities. Security lending income is presented in the Statement of Operations as a component of income from Fidelity Central Funds. Total security lending income during the period amounted to $106,267. During the period, there were no securities loaned to FCM.
8. Expense Reductions.
Commissions paid to certain brokers with whom the investment adviser, or its affiliates, places trades on behalf of the Fund include an amount in addition to trade execution, which may be rebated back to the Fund to offset certain expenses. This amount totaled $4,774 for the period.
In addition, during the period the investment adviser reimbursed and/or waived a portion of fund-level operating expenses in the amount of $727.
9. Distributions to Shareholders.
Distributions to shareholders of each class were as follows:
| Six months ended April 30, 2016 | Year ended October 31, 2015 | |
| From net investment income | ||
| Class A | $638,599 | $520,699 |
| Class T | 103,956 | 72,766 |
| Class B | 8,861 | 1,871 |
| Class C | 133,173 | 32,755 |
| Global Commodity Stock | 3,642,366 | 2,937,401 |
| Class I | 613,921 | 333,382 |
| Total | $5,140,876 | $3,898,874 |
| From net realized gain | ||
| Class A | $30,410 | $97,397 |
| Class T | 6,044 | 19,110 |
| Class B | 836 | 3,040 |
| Class C | 11,098 | 34,065 |
| Global Commodity Stock | 151,130 | 429,058 |
| Class I | 24,557 | 46,602 |
| Total | $224,075 | $629,272 |
10. Share Transactions.
Share transactions for each class were as follows and may contain automatic conversions between classes or exchanges between affiliated funds:
| Shares | Shares | Dollars | Dollars | |
| Six months ended April 30, 2016 | Year ended October 31, 2015 | Six months ended April 30, 2016 | Year ended October 31, 2015 | |
| Class A | ||||
| Shares sold | 429,562 | 526,290 | $3,833,800 | $6,210,169 |
| Reinvestment of distributions | 70,559 | 46,881 | 655,495 | 594,452 |
| Shares redeemed | (549,813) | (1,342,823) | (4,931,070) | (16,036,860) |
| Net increase (decrease) | (49,692) | (769,652) | $(441,775) | $(9,232,239) |
| Class T | ||||
| Shares sold | 60,531 | 79,898 | $540,227 | $963,935 |
| Reinvestment of distributions | 11,521 | 7,092 | 107,030 | 89,851 |
| Shares redeemed | (111,329) | (201,781) | (1,011,230) | (2,371,414) |
| Net increase (decrease) | (39,277) | (114,791) | $(363,973) | $(1,317,628) |
| Class B | ||||
| Shares sold | 2,904 | 580 | $29,575 | $7,071 |
| Reinvestment of distributions | 982 | 371 | 9,133 | 4,698 |
| Shares redeemed | (13,281) | (35,007) | (118,751) | (422,886) |
| Net increase (decrease) | (9,395) | (34,056) | $(80,043) | $(411,117) |
| Class C | ||||
| Shares sold | 147,205 | 206,447 | $1,336,468 | $2,471,711 |
| Reinvestment of distributions | 14,787 | 4,962 | 136,635 | 62,526 |
| Shares redeemed | (184,114) | (426,784) | (1,670,395) | (5,161,590) |
| Net increase (decrease) | (22,122) | (215,375) | $(197,292) | $(2,627,353) |
| Global Commodity Stock | ||||
| Shares sold | 4,803,019 | 4,004,137 | $43,836,205 | $47,467,615 |
| Reinvestment of distributions | 376,092 | 238,065 | 3,493,876 | 3,023,431 |
| Shares redeemed | (2,761,293) | (5,506,523) | (25,223,516) | (65,599,040) |
| Net increase (decrease) | 2,417,818 | (1,264,321) | $22,106,565 | $(15,107,994) |
| Class I | ||||
| Shares sold | 1,846,997 | 1,576,324 | $16,610,772 | $18,219,363 |
| Reinvestment of distributions | 60,388 | 24,972 | 560,405 | 316,895 |
| Shares redeemed | (1,370,427) | (929,289) | (12,059,213) | (10,645,039) |
| Net increase (decrease) | 536,958 | 672,007 | $5,111,964 | $7,891,219 |
11. Other.
The Fund's organizational documents provide former and current trustees and officers with a limited indemnification against liabilities arising in connection with the performance of their duties to the Fund. In the normal course of business, the Fund may also enter into contracts that provide general indemnifications. The Fund's maximum exposure under these arrangements is unknown as this would be dependent on future claims that may be made against the Fund. The risk of material loss from such claims is considered remote.
At the end of the period, the investment adviser or its affiliates were the owner of record of 20% of the outstanding shares of the Fund.
Shareholder Expense Example
As a shareholder of the Fund, you incur two types of costs: (1) transaction costs, including sales charges (loads) on purchase payments or redemption proceeds, redemption fees and (2) ongoing costs, including management fees, distribution and/or service (12b-1) fees and other Fund expenses. This Example is intended to help you understand your ongoing costs (in dollars) of investing in the Fund and to compare these costs with the ongoing costs of investing in other mutual funds.
The Example is based on an investment of $1,000 invested at the beginning of the period and held for the entire period (November 1, 2015 to April 30, 2016).
Actual Expenses
The first line of the accompanying table for each class of the Fund provides information about actual account values and actual expenses. You may use the information in this line, together with the amount you invested, to estimate the expenses that you paid over the period. Simply divide your account value by $1,000.00 (for example, an $8,600 account value divided by $1,000.00 = 8.6), then multiply the result by the number in the first line for a class of the Fund under the heading entitled "Expenses Paid During Period" to estimate the expenses you paid on your account during this period. A small balance maintenance fee of $12.00 that is charged once a year may apply for certain accounts with a value of less than $2,000. This fee is not included in the table below. If it was, the estimate of expenses you paid during the period would be higher, and your ending account value lower, by this amount. In addition, the Fund, as a shareholder in the underlying Fidelity Central Funds, will indirectly bear its pro-rata share of the fees and expenses incurred by the underlying Fidelity Central Funds. These fees and expenses are not included in the Fund's annualized expense ratio used to calculate the expense estimate in the table below.
Hypothetical Example for Comparison Purposes
The second line of the accompanying table for each class of the Fund provides information about hypothetical account values and hypothetical expenses based on a Class' actual expense ratio and an assumed rate of return of 5% per year before expenses, which is not the Class' actual return. The hypothetical account values and expenses may not be used to estimate the actual ending account balance or expenses you paid for the period. You may use this information to compare the ongoing costs of investing in the Fund and other funds. To do so, compare this 5% hypothetical example with the 5% hypothetical examples that appear in the shareholder reports of the other funds. A small balance maintenance fee of $12.00 that is charged once a year may apply for certain accounts with a value of less than $2,000. This fee is not included in the table below. If it was, the estimate of expenses you paid during the period would be higher, and your ending account value lower, by this amount. In addition, the Fund, as a shareholder in the underlying Fidelity Central Funds, will indirectly bear its pro-rata share of the fees and expenses incurred by the underlying Fidelity Central Funds. These fees and expenses are not included in the Fund's annualized expense ratio used to calculate the expense estimate in the table below.
Please note that the expenses shown in the table are meant to highlight your ongoing costs only and do not reflect any transaction costs. Therefore, the second line of the table is useful in comparing ongoing costs only, and will not help you determine the relative total costs of owning different funds. In addition, if these transactional costs were included, your costs would have been higher.
| Annualized Expense Ratio-A | Beginning Account Value November 1, 2015 | Ending Account Value April 30, 2016 | Expenses Paid During Period-B November 1, 2015 to April 30, 2016 | |
| Class A | 1.43% | |||
| Actual | $1,000.00 | $1,061.40 | $7.33 | |
| Hypothetical-C | $1,000.00 | $1,017.75 | $7.17 | |
| Class T | 1.70% | |||
| Actual | $1,000.00 | $1,060.30 | $8.71 | |
| Hypothetical-C | $1,000.00 | $1,016.41 | $8.52 | |
| Class B | 2.18% | |||
| Actual | $1,000.00 | $1,057.20 | $11.15 | |
| Hypothetical-C | $1,000.00 | $1,014.02 | $10.92 | |
| Class C | 2.18% | |||
| Actual | $1,000.00 | $1,057.00 | $11.15 | |
| Hypothetical-C | $1,000.00 | $1,014.02 | $10.92 | |
| Global Commodity Stock | 1.18% | |||
| Actual | $1,000.00 | $1,062.60 | $6.05 | |
| Hypothetical-C | $1,000.00 | $1,019.00 | $5.92 | |
| Class I | 1.14% | |||
| Actual | $1,000.00 | $1,062.70 | $5.85 | |
| Hypothetical-C | $1,000.00 | $1,019.19 | $5.72 |
A Annualized expense ratio reflects expenses net of applicable fee waivers.
B Expenses are equal to each Class' annualized expense ratio, multiplied by the average account value over the period, multiplied by 182/366 (to reflect the one-half year period).
C 5% return per year before expenses
![]()
Corporate Headquarters
245 Summer St.
Boston, MA 02210
www.fidelity.com
GCS-SANN-0616
1.879383.107
Fidelity® International Value Fund Semi-Annual Report April 30, 2016 |
|
Contents
To view a fund's proxy voting guidelines and proxy voting record for the 12-month period ended June 30, visit http://www.fidelity.com/proxyvotingresults or visit the Securities and Exchange Commission's (SEC) web site at http://www.sec.gov.
You may also call 1-800-544-8544 to request a free copy of the proxy voting guidelines.
Standard & Poor's, S&P and S&P 500 are registered service marks of The McGraw-Hill Companies, Inc. and have been licensed for use by Fidelity Distributors Corporation.
Other third-party marks appearing herein are the property of their respective owners.
All other marks appearing herein are registered or unregistered trademarks or service marks of FMR LLC or an affiliated company. © 2016 FMR LLC. All rights reserved.
This report and the financial statements contained herein are submitted for the general information of the shareholders of the Fund. This report is not authorized for distribution to prospective investors in the Fund unless preceded or accompanied by an effective prospectus.
A fund files its complete schedule of portfolio holdings with the SEC for the first and third quarters of each fiscal year on Form N-Q. Forms N-Q are available on the SEC’s web site at http://www.sec.gov. A fund's Forms N-Q may be reviewed and copied at the SEC’s Public Reference Room in Washington, DC. Information regarding the operation of the SEC's Public Reference Room may be obtained by calling 1-800-SEC-0330.
For a complete list of a fund's portfolio holdings, view the most recent holdings listing, semiannual report, or annual report on Fidelity's web site at http://www.fidelity.com, http://www.advisor.fidelity.com, or http://www.401k.com, as applicable.
NOT FDIC INSURED •MAY LOSE VALUE •NO BANK GUARANTEE
Neither the Fund nor Fidelity Distributors Corporation is a bank.
Investment Summary (Unaudited)
Geographic Diversification (% of fund's net assets)
| As of April 30, 2016 | ||
| United Kingdom | 20.6% | |
| Japan | 19.6% | |
| France | 17.9% | |
| Switzerland | 7.9% | |
| United States of America* | 6.5% | |
| Germany | 6.0% | |
| Netherlands | 3.7% | |
| Australia | 3.7% | |
| Italy | 3.1% | |
| Other | 11.0% | |

* Includes Short-Term investments and Net Other Assets (Liabilities).
Percentages are based on country or territory of incorporation and are adjusted for the effect of futures contracts, if applicable.
| As of October 31, 2015 | ||
| United Kingdom | 23.5% | |
| Japan | 20.6% | |
| France | 16.3% | |
| Switzerland | 8.2% | |
| United States of America* | 6.0% | |
| Germany | 5.5% | |
| Netherlands | 3.7% | |
| Australia | 2.9% | |
| Spain | 2.0% | |
| Other | 11.3% | |

* Includes Short-Term investments and Net Other Assets (Liabilities).
Percentages are based on country or territory of incorporation and are adjusted for the effect of futures contracts, if applicable.
Asset Allocation as of April 30, 2016
| % of fund's net assets | % of fund's net assets 6 months ago | |
| Stocks | 98.8 | 97.6 |
| Short-Term Investments and Net Other Assets (Liabilities) | 1.2 | 2.4 |
Top Ten Stocks as of April 30, 2016
| % of fund's net assets | % of fund's net assets 6 months ago | |
| Total SA (France, Oil, Gas & Consumable Fuels) | 3.5 | 3.1 |
| Westpac Banking Corp. (Australia, Banks) | 2.2 | 1.5 |
| Toyota Motor Corp. (Japan, Automobiles) | 2.2 | 2.4 |
| Nestle SA (Switzerland, Food Products) | 2.2 | 2.7 |
| Sanofi SA (France, Pharmaceuticals) | 2.1 | 2.6 |
| Rio Tinto PLC (United Kingdom, Metals & Mining) | 2.0 | 1.6 |
| Vodafone Group PLC sponsored ADR (United Kingdom, Wireless Telecommunication Services) | 1.9 | 1.8 |
| Imperial Tobacco Group PLC (United Kingdom, Tobacco) | 1.8 | 1.8 |
| Novartis AG (Switzerland, Pharmaceuticals) | 1.8 | 2.6 |
| BASF AG (Germany, Chemicals) | 1.7 | 1.7 |
| 21.4 |
Market Sectors as of April 30, 2016
| % of fund's net assets | % of fund's net assets 6 months ago | |
| Financials | 24.3 | 26.3 |
| Consumer Discretionary | 13.8 | 14.4 |
| Health Care | 13.6 | 16.0 |
| Consumer Staples | 9.3 | 9.3 |
| Industrials | 8.8 | 8.0 |
| Energy | 8.2 | 6.7 |
| Telecommunication Services | 6.8 | 6.1 |
| Materials | 5.8 | 4.1 |
| Information Technology | 4.4 | 3.6 |
| Utilities | 3.8 | 3.1 |
Investments April 30, 2016 (Unaudited)
Showing Percentage of Net Assets
| Common Stocks - 98.4% | |||
| Shares | Value | ||
| Australia - 3.7% | |||
| Ansell Ltd. (a) | 101,524 | $1,538,472 | |
| Macquarie Group Ltd. | 27,058 | 1,306,420 | |
| Transurban Group unit | 216,635 | 1,907,439 | |
| Westpac Banking Corp. (b) | 315,896 | 7,415,205 | |
| TOTAL AUSTRALIA | 12,167,536 | ||
| Bailiwick of Jersey - 0.7% | |||
| Wolseley PLC | 43,009 | 2,409,023 | |
| Belgium - 0.5% | |||
| Anheuser-Busch InBev SA NV | 13,670 | 1,692,071 | |
| Canada - 1.1% | |||
| Imperial Oil Ltd. | 70,500 | 2,338,013 | |
| Potash Corp. of Saskatchewan, Inc. | 62,500 | 1,105,842 | |
| TOTAL CANADA | 3,443,855 | ||
| Finland - 1.1% | |||
| Sampo Oyj (A Shares) | 80,434 | 3,511,809 | |
| France - 17.9% | |||
| Atos Origin SA | 46,498 | 4,138,632 | |
| AXA SA (b) | 220,121 | 5,557,967 | |
| Bouygues SA (b) | 34,935 | 1,164,868 | |
| Capgemini SA | 45,493 | 4,247,041 | |
| Havas SA | 237,066 | 1,983,774 | |
| Orange SA | 172,900 | 2,872,549 | |
| Renault SA | 28,345 | 2,735,429 | |
| Sanofi SA | 85,210 | 7,023,567 | |
| Societe Generale Series A | 89,900 | 3,537,311 | |
| SR Teleperformance SA | 16,600 | 1,490,214 | |
| Total SA | 224,102 | 11,326,284 | |
| Unibail-Rodamco | 14,600 | 3,911,949 | |
| VINCI SA (b) | 70,100 | 5,236,685 | |
| Vivendi SA | 164,892 | 3,167,628 | |
| TOTAL FRANCE | 58,393,898 | ||
| Germany - 5.6% | |||
| Axel Springer Verlag AG | 26,500 | 1,479,565 | |
| BASF AG | 69,079 | 5,706,986 | |
| Bayer AG | 16,503 | 1,903,849 | |
| Continental AG | 6,766 | 1,485,953 | |
| Fresenius SE & Co. KGaA | 53,300 | 3,876,700 | |
| GEA Group AG | 32,955 | 1,527,895 | |
| SAP AG | 30,421 | 2,386,864 | |
| TOTAL GERMANY | 18,367,812 | ||
| Hong Kong - 0.7% | |||
| Power Assets Holdings Ltd. | 250,500 | 2,383,280 | |
| Ireland - 1.2% | |||
| Allergan PLC (a) | 6,180 | 1,338,341 | |
| Medtronic PLC | 30,700 | 2,429,905 | |
| TOTAL IRELAND | 3,768,246 | ||
| Israel - 1.4% | |||
| Teva Pharmaceutical Industries Ltd. sponsored ADR | 85,999 | 4,682,646 | |
| Italy - 3.1% | |||
| Eni SpA | 273,600 | 4,469,784 | |
| Intesa Sanpaolo SpA | 843,500 | 2,344,762 | |
| Mediaset SpA | 344,400 | 1,549,816 | |
| Telecom Italia SpA (a) | 1,809,900 | 1,767,320 | |
| TOTAL ITALY | 10,131,682 | ||
| Japan - 19.6% | |||
| Astellas Pharma, Inc. | 237,700 | 3,204,813 | |
| Dentsu, Inc. | 63,000 | 3,200,968 | |
| East Japan Railway Co. | 24,000 | 2,111,426 | |
| Hoya Corp. | 85,000 | 3,255,013 | |
| Itochu Corp. | 242,900 | 3,086,920 | |
| Japan Tobacco, Inc. | 91,900 | 3,754,845 | |
| KDDI Corp. | 143,200 | 4,124,981 | |
| Makita Corp. | 36,100 | 2,277,311 | |
| Mitsubishi UFJ Financial Group, Inc. | 1,037,200 | 4,786,487 | |
| Nippon Prologis REIT, Inc. (c) | 681 | 1,632,928 | |
| Nippon Telegraph & Telephone Corp. | 121,600 | 5,441,640 | |
| OBIC Co. Ltd. | 37,600 | 1,976,291 | |
| Olympus Corp. | 70,900 | 2,762,025 | |
| ORIX Corp. | 206,700 | 2,923,758 | |
| Seven & i Holdings Co. Ltd. | 67,400 | 2,750,084 | |
| Seven Bank Ltd. | 497,900 | 2,115,681 | |
| Sony Corp. | 88,500 | 2,143,614 | |
| Sony Financial Holdings, Inc. | 127,800 | 1,579,983 | |
| Sumitomo Mitsui Financial Group, Inc. | 123,900 | 3,728,364 | |
| Toyota Motor Corp. | 144,000 | 7,299,324 | |
| TOTAL JAPAN | 64,156,456 | ||
| Luxembourg - 0.5% | |||
| RTL Group SA | 19,239 | 1,598,910 | |
| Netherlands - 3.7% | |||
| ING Groep NV (Certificaten Van Aandelen) | 327,390 | 4,009,319 | |
| Koninklijke KPN NV | 425,668 | 1,672,729 | |
| Mylan N.V. | 28,600 | 1,192,906 | |
| PostNL NV (a) | 92,431 | 404,302 | |
| RELX NV | 292,810 | 4,913,559 | |
| TOTAL NETHERLANDS | 12,192,815 | ||
| Spain - 2.2% | |||
| Iberdrola SA | 738,976 | 5,260,579 | |
| Mediaset Espana Comunicacion SA | 146,500 | 1,902,283 | |
| TOTAL SPAIN | 7,162,862 | ||
| Sweden - 1.6% | |||
| Nordea Bank AB | 395,200 | 3,836,129 | |
| Sandvik AB (b) | 137,100 | 1,406,775 | |
| TOTAL SWEDEN | 5,242,904 | ||
| Switzerland - 7.9% | |||
| Credit Suisse Group AG | 139,828 | 2,127,967 | |
| Lafargeholcim Ltd. (Reg.) | 38,610 | 1,954,850 | |
| Nestle SA | 97,429 | 7,272,070 | |
| Novartis AG | 76,736 | 5,839,783 | |
| Syngenta AG (Switzerland) | 9,247 | 3,701,499 | |
| UBS Group AG | 64,958 | 1,121,825 | |
| Zurich Insurance Group AG | 16,404 | 3,680,801 | |
| TOTAL SWITZERLAND | 25,698,795 | ||
| United Kingdom - 20.6% | |||
| AstraZeneca PLC (United Kingdom) | 90,857 | 5,212,701 | |
| Aviva PLC | 465,420 | 2,948,663 | |
| BAE Systems PLC | 384,029 | 2,679,239 | |
| Barclays PLC | 1,179,880 | 2,962,394 | |
| Bunzl PLC | 122,364 | 3,645,572 | |
| Compass Group PLC | 209,239 | 3,726,209 | |
| HSBC Holdings PLC sponsored ADR (b) | 155,871 | 5,195,180 | |
| Imperial Tobacco Group PLC | 110,738 | 6,016,713 | |
| Informa PLC | 303,133 | 2,898,930 | |
| ITV PLC | 1,071,296 | 3,525,110 | |
| Lloyds Banking Group PLC | 5,108,500 | 5,014,049 | |
| Micro Focus International PLC | 70,200 | 1,568,337 | |
| National Grid PLC | 336,150 | 4,796,392 | |
| Prudential PLC | 73,355 | 1,447,994 | |
| Rio Tinto PLC | 198,126 | 6,646,394 | |
| Royal Dutch Shell PLC Class B (United Kingdom) | 113,561 | 2,981,529 | |
| Vodafone Group PLC sponsored ADR | 185,558 | 6,075,169 | |
| TOTAL UNITED KINGDOM | 67,340,575 | ||
| United States of America - 5.3% | |||
| Altria Group, Inc. | 31,400 | 1,969,094 | |
| Chevron Corp. | 25,900 | 2,646,462 | |
| ConocoPhillips Co. | 63,100 | 3,015,549 | |
| Constellation Brands, Inc. Class A (sub. vtg.) | 24,100 | 3,761,046 | |
| Edgewell Personal Care Co. (a) | 15,600 | 1,280,292 | |
| McGraw Hill Financial, Inc. | 24,100 | 2,575,085 | |
| Molson Coors Brewing Co. Class B | 19,900 | 1,903,037 | |
| TOTAL UNITED STATES OF AMERICA | 17,150,565 | ||
| TOTAL COMMON STOCKS | |||
| (Cost $335,758,650) | 321,495,740 | ||
| Nonconvertible Preferred Stocks - 0.4% | |||
| Germany - 0.4% | |||
| Volkswagen AG | |||
| (Cost $1,940,159) | 8,731 | 1,264,175 | |
| Money Market Funds - 5.5% | |||
| Fidelity Cash Central Fund, 0.38% (d) | 2,939,485 | 2,939,485 | |
| Fidelity Securities Lending Cash Central Fund, 0.42% (d)(e) | 15,029,266 | 15,029,266 | |
| TOTAL MONEY MARKET FUNDS | |||
| (Cost $17,968,751) | 17,968,751 | ||
| TOTAL INVESTMENT PORTFOLIO - 104.3% | |||
| (Cost $355,667,560) | 340,728,666 | ||
| NET OTHER ASSETS (LIABILITIES) - (4.3)% | (13,926,556) | ||
| NET ASSETS - 100% | $326,802,110 |
Categorizations in the Schedule of Investments are based on country or territory of incorporation.
Legend
(a) Non-income producing
(b) Security or a portion of the security is on loan at period end.
(c) Security or a portion of the security purchased on a delayed delivery or when-issued basis. Interest rate to be determined at settlement date.
(d) Affiliated fund that is generally available only to investment companies and other accounts managed by Fidelity Investments. The rate quoted is the annualized seven-day yield of the fund at period end. A complete unaudited listing of the fund's holdings as of its most recent quarter end is available upon request. In addition, each Fidelity Central Fund's financial statements are available on the SEC's website or upon request.
(e) Investment made with cash collateral received from securities on loan.
Affiliated Central Funds
Information regarding fiscal year to date income earned by the Fund from investments in Fidelity Central Funds is as follows:
| Fund | Income earned |
| Fidelity Cash Central Fund | $6,324 |
| Fidelity Securities Lending Cash Central Fund | 137,227 |
| Total | $143,551 |
Investment Valuation
The following is a summary of the inputs used, as of April 30, 2016, involving the Fund's assets and liabilities carried at fair value. The inputs or methodology used for valuing securities may not be an indication of the risk associated with investing in those securities. For more information on valuation inputs, and their aggregation into the levels used below, please refer to the Investment Valuation section in the accompanying Notes to Financial Statements.
| Valuation Inputs at Reporting Date: | ||||
| Description | Total | Level 1 | Level 2 | Level 3 |
| Investments in Securities: | ||||
| Equities: | ||||
| Consumer Discretionary | $44,875,247 | $25,337,504 | $19,537,743 | $-- |
| Consumer Staples | 30,399,252 | 16,622,253 | 13,776,999 | -- |
| Energy | 26,777,621 | 8,000,024 | 18,777,597 | -- |
| Financials | 79,272,030 | 25,467,716 | 53,804,314 | -- |
| Health Care | 44,260,721 | 16,962,819 | 27,297,902 | -- |
| Industrials | 29,347,669 | 16,783,750 | 12,563,919 | -- |
| Information Technology | 14,317,165 | 5,815,378 | 8,501,787 | -- |
| Materials | 19,115,571 | 12,469,177 | 6,646,394 | -- |
| Telecommunication Services | 21,954,388 | 6,075,169 | 15,879,219 | -- |
| Utilities | 12,440,251 | -- | 12,440,251 | -- |
| Money Market Funds | 17,968,751 | 17,968,751 | -- | -- |
| Total Investments in Securities: | $340,728,666 | $151,502,541 | $189,226,125 | $-- |
The following is a summary of transfers between Level 1 and Level 2 for the period ended April 30, 2016. Transfers are assumed to have occurred at the beginning of the period, and are primarily attributable to the valuation techniques used for foreign equity securities, as discussed in the accompanying Notes to Financial Statements:
| Transfers | Total |
| Level 1 to Level 2 | $9,505,293 |
| Level 2 to Level 1 | $16,220,609 |
See accompanying notes which are an integral part of the financial statements.
Financial Statements
Statement of Assets and Liabilities
| April 30, 2016 (Unaudited) | ||
| Assets | ||
| Investment in securities, at value (including securities loaned of $14,114,361) — See accompanying schedule: Unaffiliated issuers (cost $337,698,809) | $322,759,915 | |
| Fidelity Central Funds (cost $17,968,751) | 17,968,751 | |
| Total Investments (cost $355,667,560) | $340,728,666 | |
| Foreign currency held at value (cost $60,596) | 59,602 | |
| Receivable for investments sold | 406,523 | |
| Receivable for fund shares sold | 71,546 | |
| Dividends receivable | 2,263,594 | |
| Distributions receivable from Fidelity Central Funds | 50,580 | |
| Prepaid expenses | 155 | |
| Receivable from investment adviser for expense reductions | 525 | |
| Other receivables | 2,134 | |
| Total assets | 343,583,325 | |
| Liabilities | ||
| Payable for investments purchased | ||
| Regular delivery | $734,074 | |
| Delayed delivery | 88,039 | |
| Payable for fund shares redeemed | 628,459 | |
| Accrued management fee | 192,067 | |
| Distribution and service plan fees payable | 7,207 | |
| Other affiliated payables | 59,645 | |
| Other payables and accrued expenses | 42,458 | |
| Collateral on securities loaned, at value | 15,029,266 | |
| Total liabilities | 16,781,215 | |
| Net Assets | $326,802,110 | |
| Net Assets consist of: | ||
| Paid in capital | $445,477,213 | |
| Undistributed net investment income | 3,722,812 | |
| Accumulated undistributed net realized gain (loss) on investments and foreign currency transactions | (107,513,209) | |
| Net unrealized appreciation (depreciation) on investments and assets and liabilities in foreign currencies | (14,884,706) | |
| Net Assets | $326,802,110 | |
| Calculation of Maximum Offering Price | ||
| Class A: | ||
| Net Asset Value and redemption price per share ($8,316,805 ÷ 1,059,524 shares) | $7.85 | |
| Maximum offering price per share (100/94.25 of $7.85) | $8.33 | |
| Class T: | ||
| Net Asset Value and redemption price per share ($4,007,441 ÷ 510,734 shares) | $7.85 | |
| Maximum offering price per share (100/96.50 of $7.85) | $8.13 | |
| Class B: | ||
| Net Asset Value and offering price per share ($185,710 ÷ 23,320 shares)(a) | $7.96 | |
| Class C: | ||
| Net Asset Value and offering price per share ($4,412,832 ÷ 562,495 shares)(a) | $7.85 | |
| International Value: | ||
| Net Asset Value, offering price and redemption price per share ($307,974,481 ÷ 39,244,446 shares) | $7.85 | |
| Class I: | ||
| Net Asset Value, offering price and redemption price per share ($1,904,841 ÷ 242,277 shares) | $7.86 |
(a) Redemption price per share is equal to net asset value less any applicable contingent deferred sales charge.
See accompanying notes which are an integral part of the financial statements.
Statement of Operations
| Six months ended April 30, 2016 (Unaudited) | ||
| Investment Income | ||
| Dividends | $6,260,678 | |
| Income from Fidelity Central Funds | 143,551 | |
| Income before foreign taxes withheld | 6,404,229 | |
| Less foreign taxes withheld | (490,131) | |
| Total income | 5,914,098 | |
| Expenses | ||
| Management fee | ||
| Basic fee | $1,070,146 | |
| Performance adjustment | 83,742 | |
| Transfer agent fees | 269,737 | |
| Distribution and service plan fees | 43,317 | |
| Accounting and security lending fees | 79,749 | |
| Custodian fees and expenses | 39,497 | |
| Independent trustees' compensation | 642 | |
| Registration fees | 74,413 | |
| Audit | 33,078 | |
| Legal | 304 | |
| Miscellaneous | 750 | |
| Total expenses before reductions | 1,695,375 | |
| Expense reductions | (5,259) | 1,690,116 |
| Net investment income (loss) | 4,223,982 | |
| Realized and Unrealized Gain (Loss) | ||
| Net realized gain (loss) on: | ||
| Investment securities: | ||
| Unaffiliated issuers | (1,140,494) | |
| Foreign currency transactions | 130,172 | |
| Total net realized gain (loss) | (1,010,322) | |
| Change in net unrealized appreciation (depreciation) on: Investment securities | (14,207,322) | |
| Assets and liabilities in foreign currencies | 7,902 | |
| Total change in net unrealized appreciation (depreciation) | (14,199,420) | |
| Net gain (loss) | (15,209,742) | |
| Net increase (decrease) in net assets resulting from operations | $(10,985,760) |
See accompanying notes which are an integral part of the financial statements.
Statement of Changes in Net Assets
| Six months ended April 30, 2016 (Unaudited) | Year ended October 31, 2015 | |
| Increase (Decrease) in Net Assets | ||
| Operations | ||
| Net investment income (loss) | $4,223,982 | $4,113,357 |
| Net realized gain (loss) | (1,010,322) | (2,475,305) |
| Change in net unrealized appreciation (depreciation) | (14,199,420) | (2,310,957) |
| Net increase (decrease) in net assets resulting from operations | (10,985,760) | (672,905) |
| Distributions to shareholders from net investment income | (4,084,383) | (7,553,931) |
| Share transactions - net increase (decrease) | 54,490,310 | 87,547,372 |
| Redemption fees | 433 | 863 |
| Total increase (decrease) in net assets | 39,420,600 | 79,321,399 |
| Net Assets | ||
| Beginning of period | 287,381,510 | 208,060,111 |
| End of period (including undistributed net investment income of $3,722,812 and undistributed net investment income of $3,583,213, respectively) | $326,802,110 | $287,381,510 |
See accompanying notes which are an integral part of the financial statements.
Financial Highlights — Fidelity International Value Fund Class A
| Six months ended (Unaudited) April 30, | Years ended October 31, | |||||
| 2016 | 2015 | 2014 | 2013 | 2012 | 2011 | |
| Selected Per–Share Data | ||||||
| Net asset value, beginning of period | $8.27 | $8.62 | $8.96 | $7.39 | $7.02 | $8.22 |
| Income from Investment Operations | ||||||
| Net investment income (loss)A | .09 | .13 | .31B | .17 | .20 | .22 |
| Net realized and unrealized gain (loss) | (.42) | (.20) | (.47) | 1.64 | .39 | (1.19) |
| Total from investment operations | (.33) | (.07) | (.16) | 1.81 | .59 | (.97) |
| Distributions from net investment income | (.09) | (.28) | (.17) | (.20) | (.22) | (.19) |
| Distributions from net realized gain | – | – | (.01) | (.04) | – | (.03) |
| Total distributions | (.09) | (.28) | (.18) | (.24) | (.22) | (.23)C |
| Redemption fees added to paid in capitalA,D | – | – | – | – | – | – |
| Net asset value, end of period | $7.85 | $8.27 | $8.62 | $8.96 | $7.39 | $7.02 |
| Total ReturnE,F,G | (4.05)% | (.81)% | (1.76)% | 25.24% | 8.82% | (12.19)% |
| Ratios to Average Net AssetsH,I | ||||||
| Expenses before reductions | 1.43%J | 1.37% | 1.32% | 1.39% | 1.44% | 1.36% |
| Expenses net of fee waivers, if any | 1.43%J | 1.37% | 1.32% | 1.39% | 1.44% | 1.36% |
| Expenses net of all reductions | 1.43%J | 1.36% | 1.32% | 1.36% | 1.41% | 1.34% |
| Net investment income (loss) | 2.44%J | 1.58% | 3.44%B | 2.08% | 2.85% | 2.79% |
| Supplemental Data | ||||||
| Net assets, end of period (000 omitted) | $8,317 | $8,956 | $6,296 | $6,191 | $4,491 | $4,668 |
| Portfolio turnover rateK | 26%J | 44% | 69% | 79% | 74% | 83% |
A Calculated based on average shares outstanding during the period.
B Net Investment income per share reflects a large, non-recurring dividend which amounted to $.14 per share. Excluding this non-recurring dividend, the ratio of net investment income (loss) to average net assets would have been 1.90%.
C Total distributions of $.23 per share is comprised of distributions from net investment income of $.191 and distributions from net realized gain of $.034 per share.
D Amount represents less than $.005 per share.
E Total returns for periods of less than one year are not annualized.
F Total returns would have been lower if certain expenses had not been reduced during the applicable periods shown.
G Total returns do not include the effect of the sales charges.
H Fees and expenses of any underlying Fidelity Central Funds are not included in the Fund's expense ratio. The Fund indirectly bears its proportionate share of the expenses of any underlying Fidelity Central Funds.
I Expense ratios reflect operating expenses of the class. Expenses before reductions do not reflect amounts reimbursed by the investment adviser or reductions from brokerage service arrangements or reductions from other expense offset arrangements and do not represent the amount paid by the class during periods when reimbursements or reductions occur. Expenses net of fee waivers reflect expenses after reimbursement by the investment adviser but prior to reductions from brokerage service arrangements or other expense offset arrangements. Expenses net of all reductions represent the net expenses paid by the class.
J Annualized
K Amount does not include the portfolio activity of any underlying Fidelity Central Funds.
See accompanying notes which are an integral part of the financial statements.
Financial Highlights — Fidelity International Value Fund Class T
| Six months ended (Unaudited) April 30, | Years ended October 31, | |||||
| 2016 | 2015 | 2014 | 2013 | 2012 | 2011 | |
| Selected Per–Share Data | ||||||
| Net asset value, beginning of period | $8.25 | $8.60 | $8.94 | $7.38 | $7.00 | $8.20 |
| Income from Investment Operations | ||||||
| Net investment income (loss)A | .08 | .11 | .28B | .15 | .18 | .20 |
| Net realized and unrealized gain (loss) | (.42) | (.20) | (.46) | 1.64 | .40 | (1.19) |
| Total from investment operations | (.34) | (.09) | (.18) | 1.79 | .58 | (.99) |
| Distributions from net investment income | (.06) | (.26) | (.15) | (.19) | (.20) | (.17) |
| Distributions from net realized gain | – | – | (.01) | (.04) | – | (.03) |
| Total distributions | (.06) | (.26) | (.16) | (.23) | (.20) | (.21)C |
| Redemption fees added to paid in capitalA,D | – | – | – | – | – | – |
| Net asset value, end of period | $7.85 | $8.25 | $8.60 | $8.94 | $7.38 | $7.00 |
| Total ReturnE,F,G | (4.14)% | (1.09)% | (1.99)% | 24.86% | 8.60% | (12.42)% |
| Ratios to Average Net AssetsH,I | ||||||
| Expenses before reductions | 1.73%J | 1.66% | 1.59% | 1.66% | 1.71% | 1.63% |
| Expenses net of fee waivers, if any | 1.70%J | 1.66% | 1.59% | 1.65% | 1.70% | 1.62% |
| Expenses net of all reductions | 1.70%J | 1.65% | 1.59% | 1.63% | 1.67% | 1.60% |
| Net investment income (loss) | 2.17%J | 1.29% | 3.17%B | 1.81% | 2.58% | 2.52% |
| Supplemental Data | ||||||
| Net assets, end of period (000 omitted) | $4,007 | $4,086 | $3,604 | $3,758 | $2,693 | $2,468 |
| Portfolio turnover rateK | 26 %J | 44% | 69% | 79% | 74% | 83% |
A Calculated based on average shares outstanding during the period.
B Net Investment income per share reflects a large, non-recurring dividend which amounted to $.14 per share. Excluding this non-recurring dividends, the ratio of net investment income (loss) to average net assets would have been 1.64%.
C Total distributions of $.21 per share is comprised of distributions from net investment income of $.173 and distributions from net realized gain of $.034 per share.
D Amount represents less than $.005 per share.
E Total returns for periods of less than one year are not annualized.
F Total returns would have been lower if certain expenses had not been reduced during the applicable periods shown.
G Total returns do not include the effect of the sales charges.
H Fees and expenses of any underlying Fidelity Central Funds are not included in the Fund's expense ratio. The Fund indirectly bears its proportionate share of the expenses of any underlying Fidelity Central Funds.
I Expense ratios reflect operating expenses of the class. Expenses before reductions do not reflect amounts reimbursed by the investment adviser or reductions from brokerage service arrangements or reductions from other expense offset arrangements and do not represent the amount paid by the class during periods when reimbursements or reductions occur. Expenses net of fee waivers reflect expenses after reimbursement by the investment adviser but prior to reductions from brokerage service arrangements or other expense offset arrangements. Expenses net of all reductions represent the net expenses paid by the class.
J Annualized
K Amount does not include the portfolio activity of any underlying Fidelity Central Funds.
See accompanying notes which are an integral part of the financial statements.
Financial Highlights — Fidelity International Value Fund Class B
| Six months ended (Unaudited) April 30, | Years ended October 31, | |||||
| 2016 | 2015 | 2014 | 2013 | 2012 | 2011 | |
| Selected Per–Share Data | ||||||
| Net asset value, beginning of period | $8.34 | $8.66 | $8.98 | $7.39 | $7.00 | $8.20 |
| Income from Investment Operations | ||||||
| Net investment income (loss)A | .07 | .07 | .24B | .11 | .14 | .17 |
| Net realized and unrealized gain (loss) | (.45) | (.21) | (.45) | 1.65 | .41 | (1.20) |
| Total from investment operations | (.38) | (.14) | (.21) | 1.76 | .55 | (1.03) |
| Distributions from net investment income | –C | (.18) | (.09) | (.13) | (.16) | (.13) |
| Distributions from net realized gain | – | – | (.01) | (.04) | – | (.03) |
| Total distributions | –C | (.18) | (.11)D | (.17) | (.16) | (.17)E |
| Redemption fees added to paid in capitalA,C | – | – | – | – | – | – |
| Net asset value, end of period | $7.96 | $8.34 | $8.66 | $8.98 | $7.39 | $7.00 |
| Total ReturnF,G,H | (4.51)% | (1.64)% | (2.39)% | 24.30% | 8.07% | (12.88)% |
| Ratios to Average Net AssetsI,J | ||||||
| Expenses before reductions | 2.21%K | 2.15% | 2.08% | 2.14% | 2.19% | 2.11% |
| Expenses net of fee waivers, if any | 2.20%K | 2.15% | 2.08% | 2.14% | 2.19% | 2.11% |
| Expenses net of all reductions | 2.20%K | 2.14% | 2.08% | 2.11% | 2.16% | 2.09% |
| Net investment income (loss) | 1.66%K | .81% | 2.68%B | 1.32% | 2.09% | 2.04% |
| Supplemental Data | ||||||
| Net assets, end of period (000 omitted) | $186 | $302 | $414 | $678 | $691 | $901 |
| Portfolio turnover rateL | 26%K | 44% | 69% | 79% | 74% | 83% |
A Calculated based on average shares outstanding during the period.
B Net Investment income per share reflects a large, non-recurring dividend which amounted to $.14 per share. Excluding this non-recurring dividend, the ratio of net investment income (loss) to average net assets would have been 1.15%.
C Amount represents less than $.005 per share.
D Total distributions of $.11 per share is comprised of distributions from net investment income of $.093 and distributions from net realized gain of $.014 per share.
E Total distributions of $.17 per share is comprised of distributions from net investment income of $.131 and distributions from net realized gain of $.034 per share.
F Total returns for periods of less than one year are not annualized.
G Total returns would have been lower if certain expenses had not been reduced during the applicable periods shown.
H Total returns do not include the effect of the contingent deferred sales charge.
I Fees and expenses of any underlying Fidelity Central Funds are not included in the Fund's expense ratio. The Fund indirectly bears its proportionate share of the expenses of any underlying Fidelity Central Funds.
J Expense ratios reflect operating expenses of the class. Expenses before reductions do not reflect amounts reimbursed by the investment adviser or reductions from brokerage service arrangements or reductions from other expense offset arrangements and do not represent the amount paid by the class during periods when reimbursements or reductions occur. Expenses net of fee waivers reflect expenses after reimbursement by the investment adviser but prior to reductions from brokerage service arrangements or other expense offset arrangements. Expenses net of all reductions represent the net expenses paid by the class.
K Annualized
L Amount does not include the portfolio activity of any underlying Fidelity Central Funds.
See accompanying notes which are an integral part of the financial statements.
Financial Highlights — Fidelity International Value Fund Class C
| Six months ended (Unaudited) April 30, | Years ended October 31, | |||||
| 2016 | 2015 | 2014 | 2013 | 2012 | 2011 | |
| Selected Per–Share Data | ||||||
| Net asset value, beginning of period | $8.23 | $8.59 | $8.93 | $7.38 | $7.00 | $8.20 |
| Income from Investment Operations | ||||||
| Net investment income (loss)A | .06 | .07 | .24B | .11 | .14 | .16 |
| Net realized and unrealized gain (loss) | (.42) | (.20) | (.45) | 1.63 | .41 | (1.19) |
| Total from investment operations | (.36) | (.13) | (.21) | 1.74 | .55 | (1.03) |
| Distributions from net investment income | (.02) | (.23) | (.11) | (.15) | (.17) | (.14) |
| Distributions from net realized gain | – | – | (.01) | (.04) | – | (.03) |
| Total distributions | (.02) | (.23) | (.13)C | (.19) | (.17) | (.17) |
| Redemption fees added to paid in capitalA,D | – | – | – | – | – | – |
| Net asset value, end of period | $7.85 | $8.23 | $8.59 | $8.93 | $7.38 | $7.00 |
| Total ReturnE,F,G | (4.40)% | (1.58)% | (2.43)% | 24.17% | 8.12% | (12.84)% |
| Ratios to Average Net AssetsH,I | ||||||
| Expenses before reductions | 2.21%J | 2.15% | 2.07% | 2.14% | 2.19% | 2.12% |
| Expenses net of fee waivers, if any | 2.20%J | 2.14% | 2.07% | 2.14% | 2.19% | 2.11% |
| Expenses net of all reductions | 2.20%J | 2.14% | 2.07% | 2.11% | 2.16% | 2.09% |
| Net investment income (loss) | 1.67%J | .81% | 2.69%B | 1.33% | 2.09% | 2.04% |
| Supplemental Data | ||||||
| Net assets, end of period (000 omitted) | $4,413 | $4,502 | $3,647 | $3,231 | $2,249 | $2,108 |
| Portfolio turnover rateK | 26%J | 44% | 69% | 79% | 74% | 83% |
A Calculated based on average shares outstanding during the period.
B Net Investment income per share reflects a large, non-recurring dividend which amounted to $.14 per share. Excluding this non-recurring dividend, the ratio of net investment income (loss) to average net assets would have been 1.15%.
C Total distributions of $.13 per share is comprised of distributions from net investment income of $.111 and distributions from net realized gain of $.014 per share.
D Amount represents less than $.005 per share.
E Total returns for periods of less than one year are not annualized.
F Total returns would have been lower if certain expenses had not been reduced during the applicable periods shown.
G Total returns do not include the effect of the contingent deferred sales charge.
H Fees and expenses of any underlying Fidelity Central Funds are not included in the Fund's expense ratio. The Fund indirectly bears its proportionate share of the expenses of any underlying Fidelity Central Funds.
I Expense ratios reflect operating expenses of the class. Expenses before reductions do not reflect amounts reimbursed by the investment adviser or reductions from brokerage service arrangements or reductions from other expense offset arrangements and do not represent the amount paid by the class during periods when reimbursements or reductions occur. Expenses net of fee waivers reflect expenses after reimbursement by the investment adviser but prior to reductions from brokerage service arrangements or other expense offset arrangements. Expenses net of all reductions represent the net expenses paid by the class.
J Annualized
K Amount does not include the portfolio activity of any underlying Fidelity Central Funds.
See accompanying notes which are an integral part of the financial statements.
Financial Highlights — Fidelity International Value Fund
| Six months ended (Unaudited) April 30, | Years ended October 31, | |||||
| 2016 | 2015 | 2014 | 2013 | 2012 | 2011 | |
| Selected Per–Share Data | ||||||
| Net asset value, beginning of period | $8.29 | $8.64 | $8.97 | $7.40 | $7.03 | $8.23 |
| Income from Investment Operations | ||||||
| Net investment income (loss)A | .11 | .16 | .34B | .19 | .22 | .25 |
| Net realized and unrealized gain (loss) | (.43) | (.19) | (.46) | 1.65 | .40 | (1.20) |
| Total from investment operations | (.32) | (.03) | (.12) | 1.84 | .62 | (.95) |
| Distributions from net investment income | (.12) | (.32) | (.20) | (.22) | (.25) | (.22) |
| Distributions from net realized gain | – | – | (.01) | (.04) | – | (.03) |
| Total distributions | (.12) | (.32) | (.21) | (.27)C | (.25) | (.25) |
| Redemption fees added to paid in capitalA,D | – | – | – | – | – | – |
| Net asset value, end of period | $7.85 | $8.29 | $8.64 | $8.97 | $7.40 | $7.03 |
| Total ReturnE,F | (3.96)% | (.41)% | (1.34)% | 25.57% | 9.19% | (11.91)% |
| Ratios to Average Net AssetsG,H | ||||||
| Expenses before reductions | 1.07%I | 1.02% | .96% | 1.05% | 1.13% | 1.04% |
| Expenses net of fee waivers, if any | 1.07%I | 1.02% | .96% | 1.05% | 1.13% | 1.03% |
| Expenses net of all reductions | 1.07%I | 1.01% | .95% | 1.02% | 1.10% | 1.01% |
| Net investment income (loss) | 2.79%I | 1.93% | 3.80%B | 2.41% | 3.16% | 3.11% |
| Supplemental Data | ||||||
| Net assets, end of period (000 omitted) | $307,974 | $267,567 | $192,789 | $181,568 | $128,983 | $150,967 |
| Portfolio turnover rateJ | 26%I | 44% | 69% | 79% | 74% | 83% |
A Calculated based on average shares outstanding during the period.
B Net Investment income per share reflects a large, non-recurring dividend which amounted to $.14 per share. Excluding this non-recurring dividend, the ratio of net investment income (loss) to average net assets would have been 2.27%.
C Total distributions of $.27 per share is comprised of distributions from net investment income of $.223 and distributions from net realized gain of $.042 per share.
D Amount represents less than $.005 per share.
E Total returns for periods of less than one year are not annualized.
F Total returns would have been lower if certain expenses had not been reduced during the applicable periods shown.
G Fees and expenses of any underlying Fidelity Central Funds are not included in the Fund's expense ratio. The Fund indirectly bears its proportionate share of the expenses of any underlying Fidelity Central Funds.
H Expense ratios reflect operating expenses of the class. Expenses before reductions do not reflect amounts reimbursed by the investment adviser or reductions from brokerage service arrangements or reductions from other expense offset arrangements and do not represent the amount paid by the class during periods when reimbursements or reductions occur. Expenses net of fee waivers reflect expenses after reimbursement by the investment adviser but prior to reductions from brokerage service arrangements or other expense offset arrangements. Expenses net of all reductions represent the net expenses paid by the class.
I Annualized
J Amount does not include the portfolio activity of any underlying Fidelity Central Funds.
See accompanying notes which are an integral part of the financial statements.
Financial Highlights — Fidelity International Value Fund Class I
| Six months ended (Unaudited) April 30, | Years ended October 31, | |||||
| 2016 | 2015 | 2014 | 2013 | 2012 | 2011 | |
| Selected Per–Share Data | ||||||
| Net asset value, beginning of period | $8.29 | $8.65 | $8.98 | $7.41 | $7.04 | $8.24 |
| Income from Investment Operations | ||||||
| Net investment income (loss)A | .10 | .15 | .33B | .19 | .22 | .25 |
| Net realized and unrealized gain (loss) | (.43) | (.19) | (.45) | 1.65 | .40 | (1.19) |
| Total from investment operations | (.33) | (.04) | (.12) | 1.84 | .62 | (.94) |
| Distributions from net investment income | (.10) | (.32) | (.19) | (.23) | (.25) | (.22) |
| Distributions from net realized gain | – | – | (.01) | (.04) | – | (.03) |
| Total distributions | (.10) | (.32) | (.21)C | (.27) | (.25) | (.26)D |
| Redemption fees added to paid in capitalA,E | – | – | – | – | – | – |
| Net asset value, end of period | $7.86 | $8.29 | $8.65 | $8.98 | $7.41 | $7.04 |
| Total ReturnF,G | (4.07)% | (.53)% | (1.41)% | 25.64% | 9.22% | (11.83)% |
| Ratios to Average Net AssetsH,I | ||||||
| Expenses before reductions | 1.20%J | 1.14% | 1.05% | 1.07% | 1.10% | .98% |
| Expenses net of fee waivers, if any | 1.20%J | 1.14% | 1.05% | 1.07% | 1.10% | .98% |
| Expenses net of all reductions | 1.20%J | 1.13% | 1.04% | 1.04% | 1.07% | .96% |
| Net investment income (loss) | 2.67%J | 1.81% | 3.71%B | 2.39% | 3.18% | 3.17% |
| Supplemental Data | ||||||
| Net assets, end of period (000 omitted) | $1,905 | $1,969 | $1,310 | $239 | $372 | $473 |
| Portfolio turnover rateK | 26%J | 44% | 69% | 79% | 74% | 83% |
A Calculated based on average shares outstanding during the period.
B Net Investment income per share reflects a large, non-recurring dividend which amounted to $.14 per share. Excluding this non-recurring dividend, the ratio of net investment income (loss) to average net assets would have been 2.18%.
C Total distributions of $.21 per share is comprised of distributions from net investment income of $.191 and distributions from net realized gain of $.014 per share.
D Total distributions of $.26 per share is comprised of distributions from net investment income of $.221 and distributions from net realized gain of $.034 per share.
E Amount represents less than $.005 per share.
F Total returns for periods of less than one year are not annualized.
G Total returns would have been lower if certain expenses had not been reduced during the applicable periods shown.
H Fees and expenses of any underlying Fidelity Central Funds are not included in the Fund's expense ratio. The Fund indirectly bears its proportionate share of the expenses of any underlying Fidelity Central Funds.
I Expense ratios reflect operating expenses of the class. Expenses before reductions do not reflect amounts reimbursed by the investment adviser or reductions from brokerage service arrangements or reductions from other expense offset arrangements and do not represent the amount paid by the class during periods when reimbursements or reductions occur. Expenses net of fee waivers reflect expenses after reimbursement by the investment adviser but prior to reductions from brokerage service arrangements or other expense offset arrangements. Expenses net of all reductions represent the net expenses paid by the class.
J Annualized
K Amount does not include the portfolio activity of any underlying Fidelity Central Funds.
See accompanying notes which are an integral part of the financial statements.
Notes to Financial Statements (Unaudited)
For the period ended April 30, 2016
1. Organization.
Fidelity International Value Fund (the Fund) is a fund of Fidelity Investment Trust (the Trust) and is authorized to issue an unlimited number of shares. The Trust is registered under the Investment Company Act of 1940, as amended (the 1940 Act), as an open-end management investment company organized as a Massachusetts business trust. The Fund offers Class A, Class T, Class C, International Value and Class I shares, each of which, along with Class B shares, has equal rights as to assets and voting privileges. Class B shares are closed to new accounts and additional purchases, except for exchanges and reinvestments. Each class has exclusive voting rights with respect to matters that affect that class. Class B shares will automatically convert to Class A shares after a maximum holding period of seven four years from the initial date of purchase.
During the period, the Board of Trustees approved the conversion of all existing Class B shares into Class A shares, effective on or about July 1, 2016, regardless of the length of times shares have been held.
2. Investments in Fidelity Central Funds.
The Fund invests in Fidelity Central Funds, which are open-end investment companies generally available only to other investment companies and accounts managed by the investment adviser and its affiliates. The Fund's Schedule of Investments lists each of the Fidelity Central Funds held as of period end, if any, as an investment of the Fund, but does not include the underlying holdings of each Fidelity Central Fund. As an Investing Fund, the Fund indirectly bears its proportionate share of the expenses of the underlying Fidelity Central Funds.
The Money Market Central Funds seek preservation of capital and current income and are managed by Fidelity Investments Money Management, Inc. (FIMM), an affiliate of the investment adviser. Annualized expenses of the Money Market Central Funds as of their most recent shareholder report date are less than .005%.
A complete unaudited list of holdings for each Fidelity Central Fund is available upon request or at the Securities and Exchange Commission (the SEC) website at www.sec.gov. In addition, the financial statements of the Fidelity Central Funds are available on the SEC website or upon request.
3. Significant Accounting Policies.
The financial statements have been prepared in conformity with accounting principles generally accepted in the United States of America (GAAP), which require management to make certain estimates and assumptions at the date of the financial statements. Actual results could differ from those estimates. Subsequent events, if any, through the date that the financial statements were issued have been evaluated in the preparation of the financial statements. The following summarizes the significant accounting policies of the Fund:
Investment Valuation. Investments are valued as of 4:00 p.m. Eastern time on the last calendar day of the period. The Board of Trustees (the Board) has delegated the day to day responsibility for the valuation of the Fund's investments to the Fidelity Management & Research Company (FMR) Fair Value Committee (the Committee). In accordance with valuation policies and procedures approved by the Board, the Fund attempts to obtain prices from one or more third party pricing vendors or brokers to value its investments. When current market prices, quotations or currency exchange rates are not readily available or reliable, investments will be fair valued in good faith by the Committee, in accordance with procedures adopted by the Board. Factors used in determining fair value vary by investment type and may include market or investment specific events. The frequency with which these procedures are used cannot be predicted and they may be utilized to a significant extent. The Committee oversees the Fund's valuation policies and procedures and reports to the Board on the Committee's activities and fair value determinations. The Board monitors the appropriateness of the procedures used in valuing the Fund's investments and ratifies the fair value determinations of the Committee.
The Fund categorizes the inputs to valuation techniques used to value its investments into a disclosure hierarchy consisting of three levels as shown below:
- Level 1 – quoted prices in active markets for identical investments
- Level 2 – other significant observable inputs (including quoted prices for similar investments, interest rates, prepayment speeds, etc.)
- Level 3 – unobservable inputs (including the Fund's own assumptions based on the best information available)
Valuation techniques used to value the Fund's investments by major category are as follows:
Equity securities, including restricted securities, for which market quotations are readily available, are valued at the last reported sale price or official closing price as reported by a third party pricing vendor on the primary market or exchange on which they are traded and are categorized as Level 1 in the hierarchy. In the event there were no sales during the day or closing prices are not available, securities are valued at the last quoted bid price or may be valued using the last available price and are generally categorized as Level 2 in the hierarchy. For foreign equity securities, when market or security specific events arise, comparisons to the valuation of American Depositary Receipts (ADRs), futures contracts, Exchange-Traded Funds (ETFs) and certain indexes as well as quoted prices for similar securities may be used and would be categorized as Level 2 in the hierarchy. Utilizing these techniques may result in transfers between Level 1 and Level 2. For equity securities, including restricted securities, where observable inputs are limited, assumptions about market activity and risk are used and these securities may be categorized as Level 3 in the hierarchy.
Investments in open-end mutual funds, including the Fidelity Central Funds, are valued at their closing net asset value (NAV) each business day and are categorized as Level 1 in the hierarchy.
Changes in valuation techniques may result in transfers in or out of an assigned level within the disclosure hierarchy. The aggregate value of investments by input level as of April 30, 2016, including information on transfers between Levels 1 and 2, is included at the end of the Fund's Schedule of Investments.
Foreign Currency. The Fund may use foreign currency contracts to facilitate transactions in foreign-denominated securities. Gains and losses from these transactions may arise from changes in the value of the foreign currency or if the counterparties do not perform under the contracts' terms.
Foreign-denominated assets, including investment securities, and liabilities are translated into U.S. dollars at the exchange rates at period end. Purchases and sales of investment securities, income and dividends received and expenses denominated in foreign currencies are translated into U.S. dollars at the exchange rate in effect on the transaction date.
The effects of exchange rate fluctuations on investments are included with the net realized and unrealized gain (loss) on investment securities. Other foreign currency transactions resulting in realized and unrealized gain (loss) are disclosed separately.
Investment Transactions and Income. For financial reporting purposes, the Fund's investment holdings and NAV include trades executed through the end of the last business day of the period. The NAV per share for processing shareholder transactions is calculated as of the close of business of the New York Stock Exchange (NYSE), normally 4:00 p.m. Eastern time and includes trades executed through the end of the prior business day. Gains and losses on securities sold are determined on the basis of identified cost. Dividend income is recorded on the ex-dividend date, except for certain dividends from foreign securities where the ex-dividend date may have passed, which are recorded as soon as the Fund is informed of the ex-dividend date. Non-cash dividends included in dividend income, if any, are recorded at the fair market value of the securities received. Income and capital gain distributions from Fidelity Central Funds, if any, are recorded on the ex-dividend date. Distributions received on securities that represent a return of capital or capital gain are recorded as a reduction of cost of investments and/or as a realized gain. Subsequent to ex-dividend date the Fund determines the components of these distributions, based upon receipt of tax filings or other correspondence relating to the underlying investment. Investment income is recorded net of foreign taxes withheld where recovery of such taxes is uncertain.
Class Allocations and Expenses. Investment income, realized and unrealized capital gains and losses, common expenses of the Fund, and certain fund-level expense reductions, if any, are allocated daily on a pro-rata basis to each class based on the relative net assets of each class to the total net assets of the Fund. Each class differs with respect to transfer agent and distribution and service plan fees incurred. Certain expense reductions may also differ by class. For the reporting period, the allocated portion of income and expenses to each class as a percent of its average net assets may vary due to the timing of recording these transactions in relation to fluctuating net assets of the classes. Expenses directly attributable to a fund are charged to that fund. Expenses attributable to more than one fund are allocated among the respective funds on the basis of relative net assets or other appropriate methods. Expense estimates are accrued in the period to which they relate and adjustments are made when actual amounts are known.
Income Tax Information and Distributions to Shareholders. Each year, the Fund intends to qualify as a regulated investment company under Subchapter M of the Internal Revenue Code, including distributing substantially all of its taxable income and realized gains. As a result, no provision for U.S. Federal income taxes is required. The Fund files a U.S. federal tax return, in addition to state and local tax returns as required. The Fund's federal income tax returns are subject to examination by the Internal Revenue Service (IRS) for a period of three fiscal years after they are filed. State and local tax returns may be subject to examination for an additional fiscal year depending on the jurisdiction. Foreign taxes are provided for based on the Fund's understanding of the tax rules and rates that exist in the foreign markets in which it invests.
Distributions are declared and recorded on the ex-dividend date. Income dividends and capital gain distributions are declared separately for each class. Income and capital gain distributions are determined in accordance with income tax regulations, which may differ from GAAP.
Capital accounts within the financial statements are adjusted for permanent book-tax differences. These adjustments have no impact on net assets or the results of operations. Capital accounts are not adjusted for temporary book-tax differences which will reverse in a subsequent period.
Book-tax differences are primarily due to foreign currency transactions, passive foreign investment companies (PFIC), partnerships, capital loss carryforwards, and losses deferred due to wash sales.
The federal tax cost of investment securities and unrealized appreciation (depreciation) as of period end were as follows:
| Gross unrealized appreciation | $20,798,749 |
| Gross unrealized depreciation | (36,225,329) |
| Net unrealized appreciation (depreciation) on securities | $(15,426,580) |
| Tax cost | $356,155,246 |
Capital loss carryforwards are only available to offset future capital gains of the Fund to the extent provided by regulations and may be limited. Under the Regulated Investment Company Modernization Act of 2010 (the Act), the Fund is permitted to carry forward capital losses incurred in taxable years beginning after December 22, 2010 for an unlimited period and such capital losses are required to be used prior to any losses that expire. The capital loss carryforward information presented below, including any applicable limitation, is estimated as of prior fiscal period end and is subject to adjustment.
| Fiscal year of expiration | |
| 2016 | $(2,663,413) |
| 2017 | (65,376,972) |
| 2018 | (3,571,319) |
| 2019 | (31,368,797) |
| Total with expiration | $(102,980,501) |
| No expiration | |
| Short-term | $(3,001,927) |
| Total capital loss carryforward | $(105,982,428) |
Short-Term Trading (Redemption) Fees. Shares held by investors in the Fund less than 30 days may have been subject to a redemption fee equal to 1.00% of the NAV of shares redeemed. All redemption fees, which reduce the proceeds of the shareholder redemption, are retained by the Fund and accounted for as an addition to paid in capital.
Delayed Delivery Transactions and When-Issued Securities. During the period, the Fund transacted in securities on a delayed delivery or when-issued basis. Payment and delivery may take place after the customary settlement period for that security. The price of the underlying securities and the date when the securities will be delivered and paid for are fixed at the time the transaction is negotiated. The securities purchased on a delayed delivery or when-issued basis are identified as such in the Fund's Schedule of Investments. With respect to purchase commitments, the Fund identifies securities as segregated in its records with a value at least equal to the amount of the commitment. Losses may arise due to changes in the value of the underlying securities or if the counterparty does not perform under the contract's terms, or if the issuer does not issue the securities due to political, economic, or other factors.
4. Purchases and Sales of Investments.
Purchases and sales of securities, other than short-term securities, aggregated $96,477,809 and $39,058,065, respectively.
5. Fees and Other Transactions with Affiliates.
Management Fee. Fidelity Management & Research Company (the investment adviser) and its affiliates provide the Fund with investment management related services for which the Fund pays a monthly management fee. The management fee is the sum of an individual fund fee rate that is based on an annual rate of .45% of the Fund's average net assets and an annualized group fee rate that averaged .25% during the period. The group fee rate is based upon the average net assets of all the mutual funds advised by the investment adviser, including any mutual funds previously advised by the investment adviser that are currently advised by Fidelity SelectCo, LLC, an affiliate of the investment adviser. The group fee rate decreases as assets under management increase and increases as assets under management decrease. In addition, the management fee is subject to a performance adjustment (up to a maximum of +/- .20% of the Fund's average net assets over a 36 month performance period). The upward or downward adjustment to the management fee is based on the relative investment performance of International Value as compared to its benchmark index, the MSCI EAFE Value Index, over the same 36 month performance period. For the reporting period, the total annualized management fee rate, including the performance adjustment, was .75% of the Fund's average net assets. The performance adjustment included in the management fee rate may be higher or lower than the maximum performance adjustment rate due to the difference between the average net assets for the reporting and performance periods.
Distribution and Service Plan Fees. In accordance with Rule 12b-1 of the 1940 Act, the Fund has adopted separate Distribution and Service Plans for each class of shares. Certain classes pay Fidelity Distributors Corporation (FDC), an affiliate of the investment adviser, separate Distribution and Service Fees, each of which is based on an annual percentage of each class' average net assets. In addition, FDC may pay financial intermediaries for selling shares of the Fund and providing shareholder support services. For the period, the Distribution and Service Fee rates, total fees and amounts retained by FDC were as follows:
| Distribution Fee | Service Fee | Total Fees | Retained by FDC | |
| Class A | -% | .25% | $10,630 | $247 |
| Class T | .25% | .25% | 9,834 | – |
| Class B | .75% | .25% | 1,216 | 912 |
| Class C | .75% | .25% | 21,637 | 4,385 |
| $43,317 | $5,544 |
Sales Load. FDC may receive a front-end sales charge of up to 5.75% for selling Class A shares and 3.50% for selling Class T shares, some of which is paid to financial intermediaries for selling shares of the Fund. Depending on the holding period, FDC may receive contingent deferred sales charges levied on Class A, Class T, Class B, and Class C redemptions. The deferred sales charges 5.00% to 1.00% for Class B shares, 1.00% for Class C shares, 1.00% for certain purchases of Class A shares and .25% for certain purchases of Class T shares.
For the period, sales charge amounts retained by FDC were as follows:
| Retained by FDC | |
| Class A | $1,140 |
| Class T | 718 |
| Class B(a) | 10 |
| Class C(a) | 800 |
| $2,668 |
(a) When Class B and Class C shares are initially sold, FDC pays commissions from its own resources to financial intermediaries through which the sales are made.
Transfer Agent Fees. Fidelity Investments Institutional Operations Company, Inc., (FIIOC), an affiliate of the investment adviser, is the transfer, dividend disbursing and shareholder servicing agent for each class of the Fund. FIIOC receives account fees and asset-based fees that vary according to the account size and type of account of the shareholders of the respective classes of the Fund. FIIOC pays for typesetting, printing and mailing of shareholder reports, except proxy statements.
For the period, transfer agent fees for each class were as follows:
| Amount | % of Class-Level Average Net Assets(a) | |
| Class A | $11,787 | .28 |
| Class T | 6,443 | .33 |
| Class B | 378 | .31 |
| Class C | 6,617 | .31 |
| International Value | 241,632 | .17 |
| Class I | 2,880 | .30 |
| $269,737 |
(a) Annualized
Accounting and Security Lending Fees. Fidelity Service Company, Inc. (FSC), an affiliate of the investment adviser, maintains the Fund's accounting records. The accounting fee is based on the level of average net assets for each month. Under a separate contract, FSC administers the security lending program. The security lending fee is based on the number and duration of lending transactions.
Brokerage Commissions. The Fund placed a portion of its portfolio transactions with brokerage firms which are affiliates of the investment adviser. Brokerage commissions are included in net realized gain (loss) and change in net unrealized appreciation (depreciation) in the Statement of Operations. The commissions paid to these affiliated firms were $136 for the period.
Interfund Trades. The Funds may purchase from or sell securities to other Fidelity Funds under procedures adopted by the Board. The procedures have been designed to ensure these interfund trades are executed in accordance with Rule 17a-7 of the 1940 Act. Interfund trades are included within the respective purchases and sales amounts shown in the Purchases and Sales of Investments note.
6. Committed Line of Credit.
The Fund participates with other funds managed by the investment adviser or an affiliate in a $4.25 billion credit facility (the "line of credit") to be utilized for temporary or emergency purposes to fund shareholder redemptions or for other short-term liquidity purposes. The Fund has agreed to pay commitment fees on its pro-rata portion of the line of credit, which amounted to $266 and is reflected in Miscellaneous expenses on the Statement of Operations. During the period, the Fund did not borrow on this line of credit.
7. Security Lending.
The Fund lends portfolio securities through a lending agent from time to time in order to earn additional income. For equity securities, a lending agent is used and may loan securities to certain qualified borrowers, including Fidelity Capital Markets (FCM), a broker-dealer affiliated with the Fund. On the settlement date of the loan, the Fund receives collateral (in the form of U.S. Treasury obligations, letters of credit and/or cash) against the loaned securities and maintains collateral in an amount not less than 100% of the market value of the loaned securities during the period of the loan. The market value of the loaned securities is determined at the close of business of the Fund and any additional required collateral is delivered to the Fund on the next business day. The Fund or borrower may terminate the loan at any time, and if the borrower defaults on its obligation to return the securities loaned because of insolvency or other reasons, the Fund may apply collateral received from the borrower against the obligation. The Fund may experience delays and costs in recovering the securities loaned. Any cash collateral received is invested in the Fidelity Securities Lending Cash Central Fund. The value of loaned securities and cash collateral at period end are disclosed on the Fund's Statement of Assets and Liabilities. At period end, there were no security loans outstanding with FCM. Security lending income represents the income earned on investing cash collateral, less rebates paid to borrowers and any lending agent fees associated with the loan, plus any premium payments received for lending certain types of securities. Security lending income is presented in the Statement of Operations as a component of income from Fidelity Central Funds. Total security lending income during the period amounted to $137,227, including $139 from securities loaned to FCM.
8. Expense Reductions.
The investment adviser voluntarily agreed to reimburse each class to the extent annual operating expenses exceeded certain levels of average net assets as noted in the table below. Some expenses, for example interest expense, including commitment fees, are excluded from this reimbursement.
| Expense Limitations | Reimbursement | |
| Class T | 1.70% | $607 |
| Class B | 2.20% | 10 |
| Class C | 2.20% | 147 |
| Class I | 1.20% | 31 |
| $795 |
Commissions paid to certain brokers with whom the investment adviser, or its affiliates, places trades on behalf of the Fund include an amount in addition to trade execution, which may be rebated back to the Fund to offset certain expenses. This amount totaled $3,400 for the period.
In addition, during the period the investments adviser reimbursed and/or waived a portion of fund-level operating expenses in the amount of $1,064.
9. Distributions to Shareholders.
Distributions to shareholders of each class were as follows:
| Six months ended April 30, 2016 | Year ended October 31, 2015 | |
| From net investment income | ||
| Class A | $95,726 | $204,314 |
| Class T | 30,318 | 109,443 |
| Class B | 141 | 8,373 |
| Class C | 10,293 | 99,311 |
| International Value | 3,924,604 | 7,079,700 |
| Class I | 23,301 | 52,790 |
| Total | $4,084,383 | $7,553,931 |
10. Share Transactions.
Share transactions for each class were as follows and may contain automatic conversions between classes or exchanges between affiliated funds:
| Shares | Shares | Dollars | Dollars | |
| Six months ended April 30, 2016 | Year ended October 31, 2015 | Six months ended April 30, 2016 | Year ended October 31, 2015 | |
| Class A | ||||
| Shares sold | 145,262 | 527,583 | $1,133,082 | $4,502,640 |
| Reinvestment of distributions | 11,425 | 23,604 | 93,224 | 197,333 |
| Shares redeemed | (179,619) | (198,812) | (1,367,494) | (1,665,353) |
| Net increase (decrease) | (22,932) | 352,375 | $(141,188) | $3,034,620 |
| Class T | ||||
| Shares sold | 57,909 | 117,820 | $455,086 | $1,007,336 |
| Reinvestment of distributions | 3,669 | 12,981 | 29,980 | 108,520 |
| Shares redeemed | (45,795) | (54,747) | (348,759) | (463,119) |
| Net increase (decrease) | 15,783 | 76,054 | $136,307 | $652,737 |
| Class B | ||||
| Shares sold | 2 | 2,257 | $14 | $18,258 |
| Reinvestment of distributions | 15 | 891 | 124 | 7,565 |
| Shares redeemed | (12,943) | (14,741) | (101,798) | (124,607) |
| Net increase (decrease) | (12,926) | (11,593) | $(101,660) | $(98,784) |
| Class C | ||||
| Shares sold | 71,013 | 208,019 | $540,561 | $1,779,247 |
| Reinvestment of distributions | 1,181 | 10,999 | 9,659 | 92,173 |
| Shares redeemed | (56,610) | (96,570) | (438,654) | (802,299) |
| Net increase (decrease) | 15,584 | 122,448 | $111,566 | $1,069,121 |
| International Value | ||||
| Shares sold | 9,108,775 | 14,508,730 | $70,505,949 | $121,044,962 |
| Reinvestment of distributions | 470,177 | 823,202 | 3,831,944 | 6,873,736 |
| Shares redeemed | (2,629,480) | (5,350,163) | (19,886,444) | (45,687,658) |
| Net increase (decrease) | 6,949,472 | 9,981,769 | $54,451,449 | $82,231,040 |
| Class I | ||||
| Shares sold | 30,535 | 413,299 | $237,842 | $3,523,105 |
| Reinvestment of distributions | 2,528 | 5,275 | 20,650 | 44,098 |
| Shares redeemed | (28,411) | (332,392) | (224,656) | (2,908,565) |
| Net increase (decrease) | 4,652 | 86,182 | $33,836 | $658,638 |
11. Other.
The Fund's organizational documents provide former and current trustees and officers with a limited indemnification against liabilities arising in connection with the performance of their duties to the Fund. In the normal course of business, the Fund may also enter into contracts that provide general indemnifications. The Fund's maximum exposure under these arrangements is unknown as this would be dependent on future claims that may be made against the Fund. The risk of material loss from such claims is considered remote.
At the end of the period, Strategic Advisers International II Fund, was the owner of record of approximately 69% of the total outstanding shares of the Fund.
Shareholder Expense Example
As a shareholder of the Fund, you incur two types of costs: (1) transaction costs, including sales charges (loads) on purchase payments or redemption proceeds, redemption fees and (2) ongoing costs, including management fees, distribution and/or service (12b-1) fees and other Fund expenses. This Example is intended to help you understand your ongoing costs (in dollars) of investing in the Fund and to compare these costs with the ongoing costs of investing in other mutual funds.
The Example is based on an investment of $1,000 invested at the beginning of the period and held for the entire period (November 1, 2015 to April 30, 2016).
Actual Expenses
The first line of the accompanying table for each class of the Fund provides information about actual account values and actual expenses. You may use the information in this line, together with the amount you invested, to estimate the expenses that you paid over the period. Simply divide your account value by $1,000.00 (for example, an $8,600 account value divided by $1,000.00 = 8.6), then multiply the result by the number in the first line for a class of the Fund under the heading entitled "Expenses Paid During Period" to estimate the expenses you paid on your account during this period. A small balance maintenance fee of $12.00 that is charged once a year may apply for certain accounts with a value of less than $2,000. This fee is not included in the table below. If it was, the estimate of expenses you paid during the period would be higher, and your ending account value lower, by this amount. In addition, the Fund, as a shareholder in the underlying Fidelity Central Funds, will indirectly bear its pro-rata share of the fees and expenses incurred by the underlying Fidelity Central Funds. These fees and expenses are not included in the Fund's annualized expense ratio used to calculate the expense estimate in the table below.
Hypothetical Example for Comparison Purposes
The second line of the accompanying table for each class of the Fund provides information about hypothetical account values and hypothetical expenses based on a Class' actual expense ratio and an assumed rate of return of 5% per year before expenses, which is not the Class' actual return. The hypothetical account values and expenses may not be used to estimate the actual ending account balance or expenses you paid for the period. You may use this information to compare the ongoing costs of investing in the Fund and other funds. To do so, compare this 5% hypothetical example with the 5% hypothetical examples that appear in the shareholder reports of the other funds. A small balance maintenance fee of $12.00 that is charged once a year may apply for certain accounts with a value of less than $2,000. This fee is not included in the table below. If it was, the estimate of expenses you paid during the period would be higher, and your ending account value lower, by this amount. In addition, the Fund, as a shareholder in the underlying Fidelity Central Funds, will indirectly bear its pro-rata share of the fees and expenses incurred by the underlying Fidelity Central Funds. These fees and expenses are not included in the Fund's annualized expense ratio used to calculate the expense estimate in the table below.
Please note that the expenses shown in the table are meant to highlight your ongoing costs only and do not reflect any transaction costs. Therefore, the second line of the table is useful in comparing ongoing costs only, and will not help you determine the relative total costs of owning different funds. In addition, if these transactional costs were included, your costs would have been higher.
| Annualized Expense Ratio-A | Beginning Account Value November 1, 2015 | Ending Account Value April 30, 2016 | Expenses Paid During Period-B November 1, 2015 to April 30, 2016 | |
| Class A | 1.43% | |||
| Actual | $1,000.00 | $959.50 | $6.97 | |
| Hypothetical-C | $1,000.00 | $1,017.75 | $7.17 | |
| Class T | 1.70% | |||
| Actual | $1,000.00 | $958.60 | $8.28 | |
| Hypothetical-C | $1,000.00 | $1,016.41 | $8.52 | |
| Class B | 2.20% | |||
| Actual | $1,000.00 | $954.90 | $10.69 | |
| Hypothetical-C | $1,000.00 | $1,013.92 | $11.02 | |
| Class C | 2.20% | |||
| Actual | $1,000.00 | $956.00 | $10.70 | |
| Hypothetical-C | $1,000.00 | $1,013.92 | $11.02 | |
| International Value | 1.07% | |||
| Actual | $1,000.00 | $960.40 | $5.22 | |
| Hypothetical-C | $1,000.00 | $1,019.54 | $5.37 | |
| Class I | 1.20% | |||
| Actual | $1,000.00 | $959.30 | $5.85 | |
| Hypothetical-C | $1,000.00 | $1,018.90 | $6.02 |
A Annualized expense ratio reflects expenses net of applicable fee waivers.
B Expenses are equal to each Class' annualized expense ratio, multiplied by the average account value over the period, multiplied by 182/366 (to reflect the one-half year period).
C 5% return per year before expenses
![]()
Corporate Headquarters
245 Summer St.
Boston, MA 02210
www.fidelity.com
FIV-SANN-0616
1.827485.109
Fidelity Advisor® Emerging Europe, Middle East, Africa (EMEA) Fund - Semi-Annual Report April 30, 2016 Class I is a class of Fidelity® Emerging Europe, Middle East, Africa (EMEA) Fund |
|
Contents
To view a fund's proxy voting guidelines and proxy voting record for the 12-month period ended June 30, visit http://www.fidelity.com/proxyvotingresults or visit the Securities and Exchange Commission's (SEC) web site at http://www.sec.gov.
You may also call 1-877-208-0098 to request a free copy of the proxy voting guidelines.
Standard & Poor's, S&P and S&P 500 are registered service marks of The McGraw-Hill Companies, Inc. and have been licensed for use by Fidelity Distributors Corporation.
Other third-party marks appearing herein are the property of their respective owners.
All other marks appearing herein are registered or unregistered trademarks or service marks of FMR LLC or an affiliated company. © 2016 FMR LLC. All rights reserved.
This report and the financial statements contained herein are submitted for the general information of the shareholders of the Fund. This report is not authorized for distribution to prospective investors in the Fund unless preceded or accompanied by an effective prospectus.
A fund files its complete schedule of portfolio holdings with the SEC for the first and third quarters of each fiscal year on Form N-Q. Forms N-Q are available on the SEC’s web site at http://www.sec.gov. A fund's Forms N-Q may be reviewed and copied at the SEC’s Public Reference Room in Washington, DC. Information regarding the operation of the SEC's Public Reference Room may be obtained by calling 1-800-SEC-0330.
For a complete list of a fund's portfolio holdings, view the most recent holdings listing, semiannual report, or annual report on Fidelity's web site at http://www.fidelity.com, http://www.advisor.fidelity.com, or http://www.401k.com, as applicable.
NOT FDIC INSURED •MAY LOSE VALUE •NO BANK GUARANTEE
Neither the Fund nor Fidelity Distributors Corporation is a bank.
Investment Summary (Unaudited)
Geographic Diversification (% of fund's net assets)
| As of April 30, 2016 | ||
| South Africa | 41.5% | |
| Russia | 23.7% | |
| Turkey | 4.1% | |
| United Arab Emirates | 3.8% | |
| Romania | 3.4% | |
| United Kingdom | 3.2% | |
| Hungary | 2.3% | |
| Poland | 2.2% | |
| Qatar | 2.0% | |
| Other* | 13.8% | |
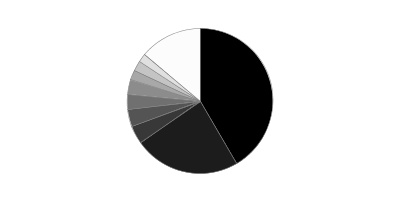
* Includes Short-Term Investments and Net Other Assets (Liabilities).
Percentages are based on country or territory of incorporation and are adjusted for the effect of futures contracts, if applicable.
| As of October 31, 2015 | ||
| South Africa | 39.5% | |
| Russia | 21.4% | |
| United Arab Emirates | 5.2% | |
| Romania | 4.4% | |
| Poland | 4.3% | |
| Turkey | 4.3% | |
| United Kingdom | 3.4% | |
| Qatar | 3.2% | |
| Austria | 2.6% | |
| Other* | 11.7% | |

* Includes Short-Term Investments and Net Other Assets (Liabilities).
Percentages are based on country or territory of incorporation and are adjusted for the effect of futures contracts, if applicable.
Asset Allocation as of April 30, 2016
| % of fund's net assets | % of fund's net assets 6 months ago | |
| Stocks | 98.9 | 100.0 |
| Short-Term Investments and Net Other Assets (Liabilities) | 1.1 | 0.0 |
Top Ten Stocks as of April 30, 2016
| % of fund's net assets | % of fund's net assets 6 months ago | |
| Naspers Ltd. Class N (South Africa, Media) | 6.0 | 8.0 |
| Gazprom OAO (Russia, Oil, Gas & Consumable Fuels) | 5.7 | 3.7 |
| Sberbank of Russia (Russia, Banks) | 5.1 | 4.7 |
| Lukoil PJSC sponsored ADR (Russia, Oil, Gas & Consumable Fuels) | 4.5 | 3.9 |
| Steinhoff International Holdings NV (South Africa) (South Africa, Household Durables) | 2.7 | 2.4 |
| Remgro Ltd. (South Africa, Diversified Financial Services) | 2.7 | 2.6 |
| FirstRand Ltd. (South Africa, Diversified Financial Services) | 2.5 | 2.6 |
| DRDGOLD Ltd. (South Africa, Metals & Mining) | 2.3 | 0.9 |
| OTP Bank PLC (Hungary, Banks) | 2.3 | 1.4 |
| AngloGold Ashanti Ltd. (South Africa, Metals & Mining) | 2.2 | 1.1 |
| 36.0 |
Market Sectors as of April 30, 2016
| % of fund's net assets | % of fund's net assets 6 months ago | |
| Financials | 32.9 | 39.3 |
| Energy | 18.3 | 14.9 |
| Consumer Discretionary | 14.8 | 18.0 |
| Consumer Staples | 10.9 | 11.8 |
| Materials | 10.1 | 5.2 |
| Industrials | 7.2 | 3.1 |
| Telecommunication Services | 2.5 | 4.2 |
| Health Care | 2.2 | 3.5 |
Market Sectors may include more than one industry category.
The Fund may invest up to 35% of its total assets in any industry that represents more than 20% of the emerging Europe, Middle East and Africa markets. As of April 30, 2016, the Fund did not have more than 25% of its total assets invested in any one industry.
Percentages shown as 0.0% may reflect amounts less than 0.05%.
Investments April 30, 2016 (Unaudited)
Showing Percentage of Net Assets
| Common Stocks - 95.4% | |||
| Shares | Value | ||
| Austria - 0.8% | |||
| CA Immobilien Anlagen AG | 9,600 | $183,355 | |
| Wienerberger AG | 27,700 | 547,292 | |
| TOTAL AUSTRIA | 730,647 | ||
| Bailiwick of Jersey - 0.4% | |||
| Wizz Air Holdings PLC (a) | 13,888 | 381,498 | |
| Botswana - 0.4% | |||
| First National Bank of Botswana Ltd. | 990,388 | 332,305 | |
| British Virgin Islands - 0.4% | |||
| Lenta Ltd. GDR (a) | 62,600 | 403,770 | |
| Canada - 1.1% | |||
| Detour Gold Corp. (a) | 35,200 | 754,947 | |
| Osisko Gold Royalties Ltd. | 21,000 | 281,183 | |
| TOTAL CANADA | 1,036,130 | ||
| Croatia - 0.5% | |||
| Ledo d.d. | 290 | 440,111 | |
| Czech Republic - 1.0% | |||
| Komercni Banka A/S | 4,347 | 894,279 | |
| Estonia - 0.7% | |||
| Tallinna Kaubamaja AS | 77,800 | 611,122 | |
| Germany - 0.3% | |||
| UNIWHEELS AG | 6,802 | 258,397 | |
| Greece - 1.7% | |||
| Aegean Airlines SA | 18,300 | 167,899 | |
| Jumbo SA (a) | 26,536 | 347,572 | |
| Motor Oil (HELLAS) Corinth Refineries SA | 56,500 | 645,141 | |
| Sarantis SA | 37,800 | 377,304 | |
| TOTAL GREECE | 1,537,916 | ||
| Hungary - 2.3% | |||
| OTP Bank PLC | 77,900 | 2,063,000 | |
| Israel - 0.6% | |||
| Elbit Systems Ltd. (Israel) | 5,300 | 530,220 | |
| Kazakhstan - 0.4% | |||
| KazMunaiGas Exploration & Production JSC (Reg. S) GDR | 53,700 | 360,864 | |
| Kenya - 1.2% | |||
| British American Tobacco Kenya Ltd. | 31,700 | 266,468 | |
| Kcb Group Ltd. | 1,019,000 | 418,698 | |
| Safaricom Ltd. | 2,627,844 | 444,912 | |
| TOTAL KENYA | 1,130,078 | ||
| Lithuania - 0.6% | |||
| Apranga AB (a) | 174,566 | 521,705 | |
| Malta - 0.6% | |||
| Brait SA | 52,700 | 589,260 | |
| Netherlands - 0.3% | |||
| AmRest Holdings NV (a) | 4,600 | 269,351 | |
| Nigeria - 0.5% | |||
| Zenith Bank PLC | 6,802,168 | 434,130 | |
| Pakistan - 0.8% | |||
| Millat Tractors Ltd. | 77,000 | 382,410 | |
| United Bank Ltd. | 246,500 | 385,622 | |
| TOTAL PAKISTAN | 768,032 | ||
| Poland - 2.2% | |||
| Bank Polska Kasa Opieki SA | 21,700 | 882,622 | |
| Kruk SA | 8,900 | 444,190 | |
| NG2 SA | 7,600 | 338,490 | |
| Orbis SA | 24,200 | 385,481 | |
| TOTAL POLAND | 2,050,783 | ||
| Qatar - 2.0% | |||
| Al Meera Consumer Goods Co. (a) | 6,671 | 379,744 | |
| Qatar National Bank SAQ | 36,695 | 1,451,710 | |
| TOTAL QATAR | 1,831,454 | ||
| Romania - 3.4% | |||
| Banca Transilvania SA | 2,204,397 | 1,512,794 | |
| BRD-Groupe Societe Generale | 504,371 | 1,189,864 | |
| Fondul Propietatea SA GDR | 40,900 | 396,730 | |
| TOTAL ROMANIA | 3,099,388 | ||
| Russia - 20.2% | |||
| Gazprom OAO (a) | 2,001,228 | 5,213,998 | |
| Lukoil PJSC (a) | 14,000 | 594,820 | |
| Lukoil PJSC sponsored ADR | 84,095 | 3,564,367 | |
| Magnit OJSC (a) | 8,679 | 1,206,196 | |
| Megafon OJSC GDR | 68,800 | 791,200 | |
| Moscow Exchange MICEX-RTS OAO (a) | 718,000 | 1,132,328 | |
| NOVATEK OAO (a) | 141,500 | 1,338,704 | |
| Sberbank of Russia (a) | 2,428,010 | 4,635,375 | |
| TOTAL RUSSIA | 18,476,988 | ||
| Slovenia - 0.4% | |||
| Krka dd Novo mesto | 5,625 | 390,448 | |
| South Africa - 41.5% | |||
| African Rainbow Minerals Ltd. | 127,000 | 1,000,102 | |
| AngloGold Ashanti Ltd. (a) | 125,100 | 2,033,663 | |
| Aveng Ltd. (a) | 970,000 | 316,173 | |
| Barloworld Ltd. | 123,800 | 715,914 | |
| Cashbuild Ltd. | 15,200 | 370,560 | |
| City Lodge Hotels Ltd. | 33,000 | 355,958 | |
| Clicks Group Ltd. | 156,919 | 1,146,089 | |
| DRDGOLD Ltd. (b) | 3,753,637 | 2,067,187 | |
| Exxaro Resources Ltd. | 41,000 | 258,496 | |
| FirstRand Ltd. | 720,100 | 2,314,296 | |
| Holdsport Ltd. | 168,800 | 723,331 | |
| Hulamin Ltd. | 1,042,200 | 420,973 | |
| Imperial Holdings Ltd. | 84,100 | 880,450 | |
| KAP Industrial Holdings Ltd. | 1,150,500 | 509,169 | |
| Life Healthcare Group Holdings Ltd. | 246,100 | 646,401 | |
| Mr Price Group Ltd. | 66,000 | 838,396 | |
| MTN Group Ltd. | 97,550 | 1,021,203 | |
| Murray & Roberts Holdings Ltd. | 421,100 | 436,327 | |
| Nampak Ltd. | 868,800 | 1,486,730 | |
| Naspers Ltd. Class N | 40,400 | 5,543,287 | |
| Northam Platinum Ltd. (a) | 360,100 | 1,227,126 | |
| Pioneer Foods Ltd. | 110,800 | 1,294,317 | |
| PSG Konsult Ltd. | 644,336 | 338,570 | |
| Remgro Ltd. | 135,500 | 2,432,960 | |
| RMB Holdings Ltd. | 183,300 | 747,995 | |
| Sasol Ltd. | 48,100 | 1,573,359 | |
| Shoprite Holdings Ltd. | 141,400 | 1,700,843 | |
| Spar Group Ltd. | 117,000 | 1,748,599 | |
| Standard Bank Group Ltd. | 137,363 | 1,232,434 | |
| Steinhoff International Holdings NV (South Africa) | 396,000 | 2,474,713 | |
| Super Group Ltd. (a) | 80,000 | 231,201 | |
| TOTAL SOUTH AFRICA | 38,086,822 | ||
| Turkey - 4.1% | |||
| Aselsan A/S | 205,000 | 1,462,402 | |
| Koc Holding A/S | 210,850 | 1,102,479 | |
| Turk Tuborg Bira ve Malt Sanayii A/S (a) | 110,000 | 249,643 | |
| Turkiye Garanti Bankasi A/S | 313,000 | 963,482 | |
| TOTAL TURKEY | 3,778,006 | ||
| United Arab Emirates - 3.8% | |||
| Agthia Group PJSC | 106,093 | 225,306 | |
| Aldar Properties PJSC (a) | 888,885 | 658,272 | |
| Dubai Islamic Bank Pakistan Ltd. (a) | 466,870 | 744,877 | |
| Emaar Malls Group PJSC (a) | 757,587 | 598,166 | |
| First Gulf Bank PJSC | 314,358 | 1,108,371 | |
| SHUAA Capital PSC (a) | 983,913 | 184,840 | |
| TOTAL UNITED ARAB EMIRATES | 3,519,832 | ||
| United Kingdom - 3.2% | |||
| Bupa Arabia ELS (HSBC Warrant Program) warrants 10/10/16 (a)(c) | 7,300 | 248,728 | |
| Georgia Healthcare Group PLC (a) | 129,000 | 365,667 | |
| Mediclinic International PLC | 20,000 | 264,063 | |
| NMC Health PLC | 24,500 | 374,807 | |
| Samba Financial Group ELS (HSBC Bank Warrant Program) warrants 6/29/17 (c) | 28,900 | 176,778 | |
| Saudi Dairy & Foodstuff Co. ELS (HSBC Warrant Program) warrants 6/4/18 (c) | 14,000 | 511,433 | |
| Savola Group ELS (HSBC Warrant Program) warrants 2/6/17 (a)(c) | 52,800 | 563,303 | |
| United International Transportation Co. ELS (HSBC Warrant Program) warrants 7/31/17 (a)(c) | 33,634 | 395,599 | |
| TOTAL UNITED KINGDOM | 2,900,378 | ||
| TOTAL COMMON STOCKS | |||
| (Cost $75,616,322) | 87,426,914 | ||
| Nonconvertible Preferred Stocks - 3.5% | |||
| Russia - 3.5% | |||
| Surgutneftegas OJSC (a) | 2,892,500 | 1,875,246 | |
| Tatneft PAO (a) | 449,400 | 1,332,121 | |
| TOTAL RUSSIA | |||
| (Cost $2,981,109) | 3,207,367 | ||
| Money Market Funds - 2.3% | |||
| Fidelity Cash Central Fund, 0.38% (d) | |||
| (Cost $2,127,277) | 2,127,277 | 2,127,277 | |
| TOTAL INVESTMENT PORTFOLIO - 101.2% | |||
| (Cost $80,724,708) | 92,761,558 | ||
| NET OTHER ASSETS (LIABILITIES) - (1.2)% | (1,082,693) | ||
| NET ASSETS - 100% | $91,678,865 |
Security Type Abbreviations
ELS – Equity-Linked Security
Categorizations in the Schedule of Investments are based on country or territory of incorporation.
Legend
(a) Non-income producing
(b) Security or a portion of the security purchased on a delayed delivery or when-issued basis.
(c) Security exempt from registration under Rule 144A of the Securities Act of 1933. These securities may be resold in transactions exempt from registration, normally to qualified institutional buyers. At the end of the period, the value of these securities amounted to $1,895,841 or 2.1% of net assets.
(d) Affiliated fund that is generally available only to investment companies and other accounts managed by Fidelity Investments. The rate quoted is the annualized seven-day yield of the fund at period end. A complete unaudited listing of the fund's holdings as of its most recent quarter end is available upon request. In addition, each Fidelity Central Fund's financial statements are available on the SEC's website or upon request.
Affiliated Central Funds
Information regarding fiscal year to date income earned by the Fund from investments in Fidelity Central Funds is as follows:
| Fund | Income earned |
| Fidelity Cash Central Fund | $2,883 |
| Total | $2,883 |
Investment Valuation
The following is a summary of the inputs used, as of April 30, 2016, involving the Fund's assets and liabilities carried at fair value. The inputs or methodology used for valuing securities may not be an indication of the risk associated with investing in those securities. For more information on valuation inputs, and their aggregation into the levels used below, please refer to the Investment Valuation section in the accompanying Notes to Financial Statements.
| Valuation Inputs at Reporting Date: | ||||
| Description | Total | Level 1 | Level 2 | Level 3 |
| Investments in Securities: | ||||
| Equities: | ||||
| Consumer Discretionary | $13,538,892 | $13,191,320 | $347,572 | $-- |
| Consumer Staples | 10,049,512 | 9,672,208 | 377,304 | -- |
| Energy | 16,757,116 | 7,449,372 | 9,307,744 | -- |
| Financials | 30,166,366 | 22,671,668 | 7,494,698 | -- |
| Health Care | 2,041,386 | 2,041,386 | -- | -- |
| Industrials | 6,551,783 | 6,383,884 | 167,899 | -- |
| Materials | 9,271,911 | 5,171,061 | 4,100,850 | -- |
| Telecommunication Services | 2,257,315 | 1,236,112 | 1,021,203 | -- |
| Money Market Funds | 2,127,277 | 2,127,277 | -- | -- |
| Total Investments in Securities: | $92,761,558 | $69,944,288 | $22,817,270 | $-- |
The following is a summary of transfers between Level 1 and Level 2 for the period ended April 30, 2016. Transfers are assumed to have occurred at the beginning of the period, and are primarily attributable to the valuation techniques used for foreign equity securities, as discussed in the accompanying Notes to Financial Statements:
| Transfers | Total |
| Level 1 to Level 2 | $562,303 |
| Level 2 to Level 1 | $852,918 |
See accompanying notes which are an integral part of the financial statements.
Financial Statements
Statement of Assets and Liabilities
| April 30, 2016 (Unaudited) | ||
| Assets | ||
| Investment in securities, at value — See accompanying schedule: Unaffiliated issuers (cost $78,597,431) | $90,634,281 | |
| Fidelity Central Funds (cost $2,127,277) | 2,127,277 | |
| Total Investments (cost $80,724,708) | $92,761,558 | |
| Foreign currency held at value (cost $46,482) | 46,429 | |
| Receivable for investments sold | 455,216 | |
| Receivable for fund shares sold | 264,048 | |
| Dividends receivable | 221,843 | |
| Distributions receivable from Fidelity Central Funds | 626 | |
| Prepaid expenses | 95 | |
| Receivable from investment adviser for expense reductions | 45,602 | |
| Other receivables | 210 | |
| Total assets | 93,795,627 | |
| Liabilities | ||
| Payable for investments purchased | ||
| Regular delivery | $1,524,245 | |
| Delayed delivery | 3,365 | |
| Payable for fund shares redeemed | 435,523 | |
| Accrued management fee | 56,299 | |
| Distribution and service plan fees payable | 6,476 | |
| Other affiliated payables | 22,131 | |
| Other payables and accrued expenses | 68,723 | |
| Total liabilities | 2,116,762 | |
| Net Assets | $91,678,865 | |
| Net Assets consist of: | ||
| Paid in capital | $102,235,302 | |
| Undistributed net investment income | 334,366 | |
| Accumulated undistributed net realized gain (loss) on investments and foreign currency transactions | (22,927,761) | |
| Net unrealized appreciation (depreciation) on investments and assets and liabilities in foreign currencies | 12,036,958 | |
| Net Assets | $91,678,865 | |
| Calculation of Maximum Offering Price | ||
| Class A: | ||
| Net Asset Value and redemption price per share ($5,977,139 ÷ 764,856 shares) | $7.81 | |
| Maximum offering price per share (100/94.25 of $7.81) | $8.29 | |
| Class T: | ||
| Net Asset Value and redemption price per share ($2,392,054 ÷ 306,697 shares) | $7.80 | |
| Maximum offering price per share (100/96.50 of $7.80) | $8.08 | |
| Class B: | ||
| Net Asset Value and offering price per share ($158,461 ÷ 20,034 shares)(a) | $7.91 | |
| Class C: | ||
| Net Asset Value and offering price per share ($6,618,271 ÷ 850,603 shares)(a) | $7.78 | |
| Emerging Europe, Middle East, Africa (EMEA): | ||
| Net Asset Value, offering price and redemption price per share ($73,827,085 ÷ 9,442,476 shares) | $7.82 | |
| Class I: | ||
| Net Asset Value, offering price and redemption price per share ($2,705,855 ÷ 346,629 shares) | $7.81 |
(a) Redemption price per share is equal to net asset value less any applicable contingent deferred sales charge.
See accompanying notes which are an integral part of the financial statements.
Statement of Operations
| Six months ended April 30, 2016 (Unaudited) | ||
| Investment Income | ||
| Dividends | $1,095,508 | |
| Income from Fidelity Central Funds | 2,883 | |
| Income before foreign taxes withheld | 1,098,391 | |
| Less foreign taxes withheld | (120,769) | |
| Total income | 977,622 | |
| Expenses | ||
| Management fee | $299,845 | |
| Transfer agent fees | 109,763 | |
| Distribution and service plan fees | 30,964 | |
| Accounting fees and expenses | 19,434 | |
| Custodian fees and expenses | 55,931 | |
| Independent trustees' compensation | 164 | |
| Registration fees | 71,693 | |
| Audit | 34,063 | |
| Legal | 110 | |
| Miscellaneous | 261 | |
| Total expenses before reductions | 622,228 | |
| Expense reductions | (66,024) | 556,204 |
| Net investment income (loss) | 421,418 | |
| Realized and Unrealized Gain (Loss) | ||
| Net realized gain (loss) on: | ||
| Investment securities: | ||
| Unaffiliated issuers | (5,108,175) | |
| Foreign currency transactions | 1,917 | |
| Total net realized gain (loss) | (5,106,258) | |
| Change in net unrealized appreciation (depreciation) on: Investment securities (net of decrease in deferred foreign taxes of $12,949) | 9,176,617 | |
| Assets and liabilities in foreign currencies | (5) | |
| Total change in net unrealized appreciation (depreciation) | 9,176,612 | |
| Net gain (loss) | 4,070,354 | |
| Net increase (decrease) in net assets resulting from operations | $4,491,772 |
See accompanying notes which are an integral part of the financial statements.
Statement of Changes in Net Assets
| Six months ended April 30, 2016 (Unaudited) | Year ended October 31, 2015 | |
| Increase (Decrease) in Net Assets | ||
| Operations | ||
| Net investment income (loss) | $421,418 | $1,633,113 |
| Net realized gain (loss) | (5,106,258) | (10,780,681) |
| Change in net unrealized appreciation (depreciation) | 9,176,612 | (7,778,956) |
| Net increase (decrease) in net assets resulting from operations | 4,491,772 | (16,926,524) |
| Distributions to shareholders from net investment income | (1,323,710) | (2,091,570) |
| Distributions to shareholders from net realized gain | – | (504,771) |
| Total distributions | (1,323,710) | (2,596,341) |
| Share transactions - net increase (decrease) | 5,429,758 | (17,106,646) |
| Redemption fees | 5,610 | 15,219 |
| Total increase (decrease) in net assets | 8,603,430 | (36,614,292) |
| Net Assets | ||
| Beginning of period | 83,075,435 | 119,689,727 |
| End of period (including undistributed net investment income of $334,366 and undistributed net investment income of $1,236,658, respectively) | $91,678,865 | $83,075,435 |
See accompanying notes which are an integral part of the financial statements.
Financial Highlights — Fidelity Emerging Europe, Middle East, Africa (EMEA) Fund Class A
| Six months ended (Unaudited) April 30, | Years ended October 31, | |||||
| 2016 | 2015 | 2014 | 2013 | 2012 | 2011 | |
| Selected Per–Share Data | ||||||
| Net asset value, beginning of period | $7.49 | $9.04 | $9.49 | $8.71 | $8.34 | $8.97 |
| Income from Investment Operations | ||||||
| Net investment income (loss)A | .03 | .12 | .13 | .16 | .18 | .16B |
| Net realized and unrealized gain (loss) | .40 | (1.50) | (.46) | .85 | .34 | (.70) |
| Total from investment operations | .43 | (1.38) | (.33) | 1.01 | .52 | (.54) |
| Distributions from net investment income | (.11) | (.14) | (.12) | (.15) | (.15) | (.08) |
| Distributions from net realized gain | – | (.04) | – | (.07) | – | (.02) |
| Total distributions | (.11) | (.17)C | (.12) | (.23)D | (.15) | (.10) |
| Redemption fees added to paid in capitalA | –E | –E | –E | –E | –E | .01 |
| Net asset value, end of period | $7.81 | $7.49 | $9.04 | $9.49 | $8.71 | $8.34 |
| Total ReturnF,G,H | 5.88% | (15.42)% | (3.48)% | 11.75% | 6.38% | (6.05)% |
| Ratios to Average Net AssetsI,J | ||||||
| Expenses before reductions | 1.82%K | 1.61% | 1.60% | 1.64% | 1.62% | 1.60% |
| Expenses net of fee waivers, if any | 1.65%K | 1.61% | 1.60% | 1.63% | 1.62% | 1.56% |
| Expenses net of all reductions | 1.65%K | 1.60% | 1.60% | 1.62% | 1.60% | 1.51% |
| Net investment income (loss) | .95%K | 1.51% | 1.45% | 1.82% | 2.09% | 1.70%B |
| Supplemental Data | ||||||
| Net assets, end of period (000 omitted) | $5,977 | $5,788 | $7,889 | $10,883 | $8,934 | $10,260 |
| Portfolio turnover rateL | 51%K | 50% | 38% | 64% | 30% | 53% |
A Calculated based on average shares outstanding during the period.
B Net Investment income per share reflects a large, non-recurring dividend which amounted to $.04 per share. Excluding this non-recurring dividend, the ratio of net investment income (loss) to average net assets would have been 1.25%.
C Total distributions of $.17 per share is comprised of distributions from net investment income of $.135 and distributions from net realized gain of $.039 per share.
D Total distributions of $.23 per share is comprised of distributions from net investment income of $.151 and distributions from net realized gain of $.074 per share.
E Amount represents less than $.005 per share.
F Total returns for periods of less than one year are not annualized.
G Total returns would have been lower if certain expenses had not been reduced during the applicable periods shown.
H Total returns do not include the effect of the sales charges.
I Fees and expenses of any underlying Fidelity Central Funds are not included in the Fund's expense ratio. The Fund indirectly bears its proportionate share of the expenses of any underlying Fidelity Central Funds.
J Expense ratios reflect operating expenses of the class. Expenses before reductions do not reflect amounts reimbursed by the investment adviser or reductions from brokerage service arrangements or reductions from other expense offset arrangements and do not represent the amount paid by the class during periods when reimbursements or reductions occur. Expenses net of fee waivers reflect expenses after reimbursement by the investment adviser but prior to reductions from brokerage service arrangements or other expense offset arrangements. Expenses net of all reductions represent the net expenses paid by the class.
K Annualized
L Amount does not include the portfolio activity of any underlying Fidelity Central Funds.
See accompanying notes which are an integral part of the financial statements.
Financial Highlights — Fidelity Emerging Europe, Middle East, Africa (EMEA) Fund Class T
| Six months ended (Unaudited) April 30, | Years ended October 31, | |||||
| 2016 | 2015 | 2014 | 2013 | 2012 | 2011 | |
| Selected Per–Share Data | ||||||
| Net asset value, beginning of period | $7.44 | $9.01 | $9.46 | $8.68 | $8.31 | $8.96 |
| Income from Investment Operations | ||||||
| Net investment income (loss)A | .02 | .10 | .11 | .14 | .15 | .13B |
| Net realized and unrealized gain (loss) | .41 | (1.51) | (.46) | .84 | .35 | (.71) |
| Total from investment operations | .43 | (1.41) | (.35) | .98 | .50 | (.58) |
| Distributions from net investment income | (.07) | (.13) | (.10) | (.12) | (.13) | (.07) |
| Distributions from net realized gain | – | (.04) | – | (.07) | – | (.02) |
| Total distributions | (.07) | (.16)C | (.10) | (.20)D | (.13) | (.08)E |
| Redemption fees added to paid in capitalA | –F | –F | –F | –F | –F | .01 |
| Net asset value, end of period | $7.80 | $7.44 | $9.01 | $9.46 | $8.68 | $8.31 |
| Total ReturnG,H,I | 5.91% | (15.80)% | (3.67)% | 11.42% | 6.14% | (6.42)% |
| Ratios to Average Net AssetsJ,K | ||||||
| Expenses before reductions | 2.12%L | 1.92% | 1.92% | 1.93% | 1.89% | 1.87% |
| Expenses net of fee waivers, if any | 1.90%L | 1.90% | 1.90% | 1.90% | 1.89% | 1.84% |
| Expenses net of all reductions | 1.89%L | 1.89% | 1.90% | 1.88% | 1.86% | 1.78% |
| Net investment income (loss) | .71%L | 1.22% | 1.15% | 1.55% | 1.82% | 1.42%B |
| Supplemental Data | ||||||
| Net assets, end of period (000 omitted) | $2,392 | $2,003 | $2,465 | $3,465 | $3,336 | $3,502 |
| Portfolio turnover rateM | 51%L | 50% | 38% | 64% | 30% | 53% |
A Calculated based on average shares outstanding during the period.
B Net Investment income per share reflects a large, non-recurring dividend which amounted to $.04 per share. Excluding this non-recurring dividend, the ratio of net investment income (loss) to average net assets would have been .98%.
C Total distributions of $.16 per share is comprised of distributions from net investment income of $.125 and distributions from net realized gain of $.039 per share.
D Total distributions of $.20 per share is comprised of distributions from net investment income of $.122 and distributions from net realized gain of $.074 per share.
E Total distributions of $.08 per share is comprised of distributions from net investment income of $.068 and distributions from net realized gain of $.015 per share.
F Amount represents less than $.005 per share.
G Total returns for periods of less than one year are not annualized.
H Total returns would have been lower if certain expenses had not been reduced during the applicable periods shown.
I Total returns do not include the effect of the sales charges.
J Fees and expenses of any underlying Fidelity Central Funds are not included in the Fund's expense ratio. The Fund indirectly bears its proportionate share of the expenses of any underlying Fidelity Central Funds.
K Expense ratios reflect operating expenses of the class. Expenses before reductions do not reflect amounts reimbursed by the investment adviser or reductions from brokerage service arrangements or reductions from other expense offset arrangements and do not represent the amount paid by the class during periods when reimbursements or reductions occur. Expenses net of fee waivers reflect expenses after reimbursement by the investment adviser but prior to reductions from brokerage service arrangements or other expense offset arrangements. Expenses net of all reductions represent the net expenses paid by the class.
L Annualized
M Amount does not include the portfolio activity of any underlying Fidelity Central Funds.
See accompanying notes which are an integral part of the financial statements.
Financial Highlights — Fidelity Emerging Europe, Middle East, Africa (EMEA) Fund Class B
| Six months ended (Unaudited) April 30, | Years ended October 31, | |||||
| 2016 | 2015 | 2014 | 2013 | 2012 | 2011 | |
| Selected Per–Share Data | ||||||
| Net asset value, beginning of period | $7.50 | $9.05 | $9.50 | $8.69 | $8.29 | $8.93 |
| Income from Investment Operations | ||||||
| Net investment income (loss)A | .01 | .06 | .06 | .09 | .11 | .09B |
| Net realized and unrealized gain (loss) | .41 | (1.51) | (.46) | .85 | .35 | (.71) |
| Total from investment operations | .42 | (1.45) | (.40) | .94 | .46 | (.62) |
| Distributions from net investment income | (.01) | (.06) | (.05) | (.06) | (.06) | (.02) |
| Distributions from net realized gain | – | (.04) | – | (.07) | – | (.01) |
| Total distributions | (.01) | (.10) | (.05) | (.13) | (.06) | (.03) |
| Redemption fees added to paid in capitalA | –C | –C | –C | –C | –C | .01 |
| Net asset value, end of period | $7.91 | $7.50 | $9.05 | $9.50 | $8.69 | $8.29 |
| Total ReturnD,E,F | 5.60% | (16.16)% | (4.23)% | 10.94% | 5.56% | (6.85)% |
| Ratios to Average Net AssetsG,H | ||||||
| Expenses before reductions | 2.57%I | 2.41% | 2.40% | 2.42% | 2.38% | 2.37% |
| Expenses net of fee waivers, if any | 2.40%I | 2.40% | 2.40% | 2.40% | 2.38% | 2.33% |
| Expenses net of all reductions | 2.40%I | 2.39% | 2.40% | 2.38% | 2.35% | 2.27% |
| Net investment income (loss) | .20%I | .72% | .65% | 1.05% | 1.33% | .93%B |
| Supplemental Data | ||||||
| Net assets, end of period (000 omitted) | $158 | $181 | $294 | $388 | $441 | $539 |
| Portfolio turnover rateJ | 51%I | 50% | 38% | 64% | 30% | 53% |
A Calculated based on average shares outstanding during the period.
B Net Investment income per share reflects a large, non-recurring dividend which amounted to $.04 per share. Excluding this non-recurring dividend, the ratio of net investment income (loss) to average net assets would have been .49%.
C Amount represents less than $.005 per share.
D Total returns for periods of less than one year are not annualized.
E Total returns would have been lower if certain expenses had not been reduced during the applicable periods shown.
F Total returns do not include the effect of the contingent deferred sales charge.
G Fees and expenses of any underlying Fidelity Central Funds are not included in the Fund's expense ratio. The Fund indirectly bears its proportionate share of the expenses of any underlying Fidelity Central Funds.
H Expense ratios reflect operating expenses of the class. Expenses before reductions do not reflect amounts reimbursed by the investment adviser or reductions from brokerage service arrangements or reductions from other expense offset arrangements and do not represent the amount paid by the class during periods when reimbursements or reductions occur. Expenses net of fee waivers reflect expenses after reimbursement by the investment adviser but prior to reductions from brokerage service arrangements or other expense offset arrangements. Expenses net of all reductions represent the net expenses paid by the class.
I Annualized
J Amount does not include the portfolio activity of any underlying Fidelity Central Funds.
See accompanying notes which are an integral part of the financial statements.
Financial Highlights — Fidelity Emerging Europe, Middle East, Africa (EMEA) Fund Class C
| Six months ended (Unaudited) April 30, | Years ended October 31, | |||||
| 2016 | 2015 | 2014 | 2013 | 2012 | 2011 | |
| Selected Per–Share Data | ||||||
| Net asset value, beginning of period | $7.39 | $8.93 | $9.39 | $8.62 | $8.24 | $8.90 |
| Income from Investment Operations | ||||||
| Net investment income (loss)A | .01 | .06 | .06 | .09 | .11 | .08B |
| Net realized and unrealized gain (loss) | .40 | (1.48) | (.46) | .83 | .35 | (.69) |
| Total from investment operations | .41 | (1.42) | (.40) | .92 | .46 | (.61) |
| Distributions from net investment income | (.02) | (.08) | (.06) | (.08) | (.08) | (.05) |
| Distributions from net realized gain | – | (.04) | – | (.07) | – | (.02) |
| Total distributions | (.02) | (.12) | (.06) | (.15) | (.08) | (.06)C |
| Redemption fees added to paid in capitalA | –D | –D | –D | –D | –D | .01 |
| Net asset value, end of period | $7.78 | $7.39 | $8.93 | $9.39 | $8.62 | $8.24 |
| Total ReturnE,F,G | 5.54% | (16.08)% | (4.24)% | 10.83% | 5.68% | (6.79)% |
| Ratios to Average Net AssetsH,I | ||||||
| Expenses before reductions | 2.61%J | 2.41% | 2.40% | 2.42% | 2.37% | 2.36% |
| Expenses net of fee waivers, if any | 2.40%J | 2.40% | 2.40% | 2.40% | 2.37% | 2.33% |
| Expenses net of all reductions | 2.40%J | 2.39% | 2.40% | 2.38% | 2.35% | 2.27% |
| Net investment income (loss) | .20%J | .72% | .65% | 1.05% | 1.34% | .93%B |
| Supplemental Data | ||||||
| Net assets, end of period (000 omitted) | $6,618 | $4,104 | $6,662 | $6,782 | $7,770 | $6,650 |
| Portfolio turnover rateK | 51%J | 50% | 38% | 64% | 30% | 53% |
A Calculated based on average shares outstanding during the period.
B Net Investment income per share reflects a large, non-recurring dividend which amounted to $.04 per share. Excluding this non-recurring dividend, the ratio of net investment income (loss) to average net assets would have been .49%.
C Total distributions of $.06 per share is comprised of distributions from net investment income of $.047 and distributions from net realized gain of $.015 per share.
D Amount represents less than $.005 per share.
E Total returns for periods of less than one year are not annualized.
F Total returns would have been lower if certain expenses had not been reduced during the applicable periods shown.
G Total returns do not include the effect of the contingent deferred sales charge.
H Fees and expenses of any underlying Fidelity Central Funds are not included in the Fund's expense ratio. The Fund indirectly bears its proportionate share of the expenses of any underlying Fidelity Central Funds.
I Expense ratios reflect operating expenses of the class. Expenses before reductions do not reflect amounts reimbursed by the investment adviser or reductions from brokerage service arrangements or reductions from other expense offset arrangements and do not represent the amount paid by the class during periods when reimbursements or reductions occur. Expenses net of fee waivers reflect expenses after reimbursement by the investment adviser but prior to reductions from brokerage service arrangements or other expense offset arrangements. Expenses net of all reductions represent the net expenses paid by the class.
J Annualized
K Amount does not include the portfolio activity of any underlying Fidelity Central Funds.
See accompanying notes which are an integral part of the financial statements.
Financial Highlights — Fidelity Emerging Europe, Middle East, Africa (EMEA) Fund
| Six months ended (Unaudited) April 30, | Years ended October 31, | |||||
| 2016 | 2015 | 2014 | 2013 | 2012 | 2011 | |
| Selected Per–Share Data | ||||||
| Net asset value, beginning of period | $7.50 | $9.08 | $9.52 | $8.75 | $8.37 | $9.00 |
| Income from Investment Operations | ||||||
| Net investment income (loss)A | .04 | .14 | .16 | .18 | .20 | .18B |
| Net realized and unrealized gain (loss) | .41 | (1.51) | (.47) | .84 | .35 | (.71) |
| Total from investment operations | .45 | (1.37) | (.31) | 1.02 | .55 | (.53) |
| Distributions from net investment income | (.13) | (.17) | (.13) | (.18) | (.17) | (.09) |
| Distributions from net realized gain | – | (.04) | – | (.07) | – | (.02) |
| Total distributions | (.13) | (.21) | (.13) | (.25) | (.17) | (.11) |
| Redemption fees added to paid in capitalA | –C | –C | –C | –C | –C | .01 |
| Net asset value, end of period | $7.82 | $7.50 | $9.08 | $9.52 | $8.75 | $8.37 |
| Total ReturnD,E | 6.19% | (15.33)% | (3.21)% | 11.90% | 6.81% | (5.91)% |
| Ratios to Average Net AssetsF,G | ||||||
| Expenses before reductions | 1.57%H | 1.39% | 1.37% | 1.40% | 1.37% | 1.35% |
| Expenses net of fee waivers, if any | 1.40%H | 1.38% | 1.37% | 1.40% | 1.37% | 1.31% |
| Expenses net of all reductions | 1.40%H | 1.38% | 1.37% | 1.38% | 1.34% | 1.25% |
| Net investment income (loss) | 1.20%H | 1.74% | 1.68% | 2.05% | 2.34% | 1.95%B |
| Supplemental Data | ||||||
| Net assets, end of period (000 omitted) | $73,827 | $67,521 | $96,784 | $110,265 | $111,441 | $114,117 |
| Portfolio turnover rateI | 51%H | 50% | 38% | 64% | 30% | 53% |
A Calculated based on average shares outstanding during the period.
B Net Investment income per share reflects a large, non-recurring dividend which amounted to $.04 per share. Excluding this non-recurring dividends, the ratio of net investment income (loss) to average net assets would have been 1.51%.
C Amount represents less than $.005 per share.
D Total returns for periods of less than one year are not annualized.
E Total returns would have been lower if certain expenses had not been reduced during the applicable periods shown.
F Fees and expenses of any underlying Fidelity Central Funds are not included in the Fund's expense ratio. The Fund indirectly bears its proportionate share of the expenses of any underlying Fidelity Central Funds.
G Expense ratios reflect operating expenses of the class. Expenses before reductions do not reflect amounts reimbursed by the investment adviser or reductions from brokerage service arrangements or reductions from other expense offset arrangements and do not represent the amount paid by the class during periods when reimbursements or reductions occur. Expenses net of fee waivers reflect expenses after reimbursement by the investment adviser but prior to reductions from brokerage service arrangements or other expense offset arrangements. Expenses net of all reductions represent the net expenses paid by the class.
H Annualized
I Amount does not include the portfolio activity of any underlying Fidelity Central Funds.
See accompanying notes which are an integral part of the financial statements.
Financial Highlights — Fidelity Emerging Europe, Middle East, Africa (EMEA) Fund Class I
| Six months ended (Unaudited) April 30, | Years ended October 31, | |||||
| 2016 | 2015 | 2014 | 2013 | 2012 | 2011 | |
| Selected Per–Share Data | ||||||
| Net asset value, beginning of period | $7.50 | $9.08 | $9.52 | $8.75 | $8.37 | $9.00 |
| Income from Investment Operations | ||||||
| Net investment income (loss)A | .04 | .15 | .16 | .19 | .21 | .19B |
| Net realized and unrealized gain (loss) | .41 | (1.51) | (.46) | .84 | .35 | (.72) |
| Total from investment operations | .45 | (1.36) | (.30) | 1.03 | .56 | (.53) |
| Distributions from net investment income | (.14) | (.18) | (.14) | (.19) | (.18) | (.09) |
| Distributions from net realized gain | – | (.04) | – | (.07) | – | (.02) |
| Total distributions | (.14) | (.22) | (.14) | (.26) | (.18) | (.11) |
| Redemption fees added to paid in capitalA | –C | –C | –C | –C | –C | .01 |
| Net asset value, end of period | $7.81 | $7.50 | $9.08 | $9.52 | $8.75 | $8.37 |
| Total ReturnD,E | 6.21% | (15.23)% | (3.09)% | 12.05% | 6.93% | (5.91)% |
| Ratios to Average Net AssetsF,G | ||||||
| Expenses before reductions | 1.43%H | 1.25% | 1.26% | 1.30% | 1.28% | 1.26% |
| Expenses net of fee waivers, if any | 1.40%H | 1.25% | 1.26% | 1.30% | 1.28% | 1.24% |
| Expenses net of all reductions | 1.40%H | 1.24% | 1.26% | 1.28% | 1.25% | 1.19% |
| Net investment income (loss) | 1.20%H | 1.88% | 1.79% | 2.15% | 2.43% | 2.02%B |
| Supplemental Data | ||||||
| Net assets, end of period (000 omitted) | $2,706 | $3,478 | $5,596 | $10,231 | $8,586 | $7,633 |
| Portfolio turnover rateI | 51%H | 50% | 38% | 64% | 30% | 53% |
A Calculated based on average shares outstanding during the period.
B Net Investment income per share reflects a large, non-recurring dividend which amounted to $.04 per share. Excluding this non-recurring dividend, the ratio of net investment income (loss) to average net assets would have been 1.58%.
C Amount represents less than $.005 per share.
D Total returns for periods of less than one year are not annualized.
E Total returns would have been lower if certain expenses had not been reduced during the applicable periods shown.
F Fees and expenses of any underlying Fidelity Central Funds are not included in the Fund's expense ratio. The Fund indirectly bears its proportionate share of the expenses of any underlying Fidelity Central Funds.
G Expense ratios reflect operating expenses of the class. Expenses before reductions do not reflect amounts reimbursed by the investment adviser or reductions from brokerage service arrangements or reductions from other expense offset arrangements and do not represent the amount paid by the class during periods when reimbursements or reductions occur. Expenses net of fee waivers reflect expenses after reimbursement by the investment adviser but prior to reductions from brokerage service arrangements or other expense offset arrangements. Expenses net of all reductions represent the net expenses paid by the class.
H Annualized
I Amount does not include the portfolio activity of any underlying Fidelity Central Funds.
See accompanying notes which are an integral part of the financial statements.
Notes to Financial Statements (Unaudited)
For the period ended April 30, 2016
1. Organization.
Fidelity Emerging Europe, Middle East, Africa (EMEA) Fund (the Fund) is a non-diversified fund of Fidelity Investment Trust (the Trust) and is authorized to issue an unlimited number of shares. The Trust is registered under the Investment Company Act of 1940, as amended (the 1940 Act), as an open-end management investment company organized as a Massachusetts business trust. The Fund offers Class A, Class T, Class C, Emerging Europe, Middle East, Africa (EMEA) and Class I shares, each of which, along with Class B shares, has equal rights as to assets and voting privileges. Class B shares are closed to new accounts and additional purchases, except for exchanges and reinvestments. Each class has exclusive voting rights with respect to matters that affect that class. Class B shares will automatically convert to Class A shares after a maximum holding period of seven years from the initial date of purchase. The Fund's investments in emerging markets can be subject to social, economic, regulatory, and political uncertainties and can be extremely volatile.
During the period, the Board of Trustees approved the conversion of all existing Class B shares into Class A shares, effective on or about July 1, 2016, regardless of the length of times shares have been held.
2. Investments in Fidelity Central Funds.
The Fund invests in Fidelity Central Funds, which are open-end investment companies generally available only to other investment companies and accounts managed by the investment adviser and its affiliates. The Fund's Schedule of Investments lists each of the Fidelity Central Funds held as of period end, if any, as an investment of the Fund, but does not include the underlying holdings of each Fidelity Central Fund. As an Investing Fund, the Fund indirectly bears its proportionate share of the expenses of the underlying Fidelity Central Funds.
The Money Market Central Funds seek preservation of capital and current income and are managed by Fidelity Investments Money Management, Inc. (FIMM), an affiliate of the investment adviser. Annualized expenses of the Money Market Central Funds as of their most recent shareholder report date are less than .005%.
A complete unaudited list of holdings for each Fidelity Central Fund is available upon request or at the Securities and Exchange Commission (the SEC) website at www.sec.gov. In addition, the financial statements of the Fidelity Central Funds are available on the SEC website or upon request.
3. Significant Accounting Policies.
The financial statements have been prepared in conformity with accounting principles generally accepted in the United States of America (GAAP), which require management to make certain estimates and assumptions at the date of the financial statements. Actual results could differ from those estimates. Subsequent events, if any, through the date that the financial statements were issued have been evaluated in the preparation of the financial statements. The following summarizes the significant accounting policies of the Fund:
Investment Valuation. Investments are valued as of 4:00 p.m. Eastern time on the last calendar day of the period. The Board of Trustees (the Board) has delegated the day to day responsibility for the valuation of the Fund's investments to the Fidelity Management & Research Company (FMR) Fair Value Committee (the Committee). In accordance with valuation policies and procedures approved by the Board, the Fund attempts to obtain prices from one or more third party pricing vendors or brokers to value its investments. When current market prices, quotations or currency exchange rates are not readily available or reliable, investments will be fair valued in good faith by the Committee, in accordance with procedures adopted by the Board. Factors used in determining fair value vary by investment type and may include market or investment specific events. The frequency with which these procedures are used cannot be predicted and they may be utilized to a significant extent. The Committee oversees the Fund's valuation policies and procedures and reports to the Board on the Committee's activities and fair value determinations. The Board monitors the appropriateness of the procedures used in valuing the Fund's investments and ratifies the fair value determinations of the Committee.
The Fund categorizes the inputs to valuation techniques used to value its investments into a disclosure hierarchy consisting of three levels as shown below:
- Level 1 – quoted prices in active markets for identical investments
- Level 2 – other significant observable inputs (including quoted prices for similar investments, interest rates, prepayment speeds, etc.)
- Level 3 – unobservable inputs (including the Fund's own assumptions based on the best information available)
Valuation techniques used to value the Fund's investments by major category are as follows:
Equity securities, including restricted securities, for which market quotations are readily available, are valued at the last reported sale price or official closing price as reported by a third party pricing vendor on the primary market or exchange on which they are traded and are categorized as Level 1 in the hierarchy. In the event there were no sales during the day or closing prices are not available, securities are valued at the last quoted bid price or may be valued using the last available price and are generally categorized as Level 2 in the hierarchy. For foreign equity securities, when market or security specific events arise, comparisons to the valuation of American Depositary Receipts (ADRs), futures contracts, Exchange-Traded Funds (ETFs) and certain indexes as well as quoted prices for similar securities may be used and would be categorized as Level 2 in the hierarchy. Utilizing these techniques may result in transfers between Level 1 and Level 2. For equity securities, including restricted securities, where observable inputs are limited, assumptions about market activity and risk are used and these securities may be categorized as Level 3 in the hierarchy.
Investments in open-end mutual funds, including the Fidelity Central Funds, are valued at their closing net asset value (NAV) each business day and are categorized as Level 1 in the hierarchy.
Changes in valuation techniques may result in transfers in or out of an assigned level within the disclosure hierarchy. The aggregate value of investments by input level as of April 30, 2016, including information on transfers between Levels 1 and 2 is included at the end of the Fund's Schedule of Investments.
Foreign Currency. The Fund may use foreign currency contracts to facilitate transactions in foreign-denominated securities. Gains and losses from these transactions may arise from changes in the value of the foreign currency or if the counterparties do not perform under the contracts' terms.
Foreign-denominated assets, including investment securities, and liabilities are translated into U.S. dollars at the exchange rates at period end. Purchases and sales of investment securities, income and dividends received and expenses denominated in foreign currencies are translated into U.S. dollars at the exchange rate in effect on the transaction date.
The effects of exchange rate fluctuations on investments are included with the net realized and unrealized gain (loss) on investment securities. Other foreign currency transactions resulting in realized and unrealized gain (loss) are disclosed separately.
Investment Transactions and Income. For financial reporting purposes, the Fund's investment holdings and NAV include trades executed through the end of the last business day of the period. The NAV per share for processing shareholder transactions is calculated as of the close of business of the New York Stock Exchange (NYSE), normally 4:00 p.m. Eastern time and includes trades executed through the end of the prior business day. Gains and losses on securities sold are determined on the basis of identified cost. Dividend income is recorded on the ex-dividend date, except for certain dividends from foreign securities where the ex-dividend date may have passed, which are recorded as soon as the Fund is informed of the ex-dividend date. Non-cash dividends included in dividend income, if any, are recorded at the fair market value of the securities received. Income and capital gain distributions from Fidelity Central Funds, if any, are recorded on the ex-dividend date. Investment income is recorded net of foreign taxes withheld where recovery of such taxes is uncertain.
Class Allocations and Expenses. Investment income, realized and unrealized capital gains and losses, common expenses of the Fund, and certain fund-level expense reductions, if any, are allocated daily on a pro-rata basis to each class based on the relative net assets of each class to the total net assets of the Fund. Each class differs with respect to transfer agent and distribution and service plan fees incurred. Certain expense reductions may also differ by class. For the reporting period, the allocated portion of income and expenses to each class as a percent of its average net assets may vary due to the timing of recording these transactions in relation to fluctuating net assets of the classes. Expenses directly attributable to a fund are charged to that fund. Expenses attributable to more than one fund are allocated among the respective funds on the basis of relative net assets or other appropriate methods. Expense estimates are accrued in the period to which they relate and adjustments are made when actual amounts are known.
Income Tax Information and Distributions to Shareholders. Each year, the Fund intends to qualify as a regulated investment company under Subchapter M of the Internal Revenue Code, including distributing substantially all of its taxable income and realized gains. As a result, no provision for U.S. Federal income taxes is required. The Fund files a U.S. federal tax return, in addition to state and local tax returns as required. The Fund's federal income tax returns are subject to examination by the Internal Revenue Service (IRS) for a period of three fiscal years after they are filed. State and local tax returns may be subject to examination for an additional fiscal year depending on the jurisdiction. Foreign taxes are provided for based on the Fund's understanding of the tax rules and rates that exist in the foreign markets in which it invests. The Fund is subject to a tax imposed on capital gains by certain countries in which it invests.
Distributions are declared and recorded on the ex-dividend date. Income dividends and capital gain distributions are declared separately for each class. Income and capital gain distributions are determined in accordance with income tax regulations, which may differ from GAAP.
Capital accounts within the financial statements are adjusted for permanent book-tax differences. These adjustments have no impact on net assets or the results of operations. Capital accounts are not adjusted for temporary book-tax differences which will reverse in a subsequent period.
Book-tax differences are primarily due to foreign currency transactions, certain foreign taxes, passive foreign investment companies (PFIC), capital loss carryforwards and losses deferred due to wash sales.
The federal tax cost of investment securities and unrealized appreciation (depreciation) as of period end were as follows:
| Gross unrealized appreciation | $16,887,440 |
| Gross unrealized depreciation | (5,733,815) |
| Net unrealized appreciation (depreciation) on securities | $11,153,625 |
| Tax cost | $81,607,933 |
Capital loss carryforwards are only available to offset future capital gains of the Fund to the extent provided by regulations and may be limited. Under the Regulated Investment Company Modernization Act of 2010 (the Act), the Fund is permitted to carry forward capital losses incurred in taxable years beginning after December 22, 2010 for an unlimited period and such capital losses are required to be used prior to any losses that expire. The capital loss carryforward information presented below, including any applicable limitation, is estimated as of prior fiscal period end and is subject to adjustment.
| Fiscal year of expiration | |
| 2018 | $(1,624,705) |
| No expiration | |
| Short-term | (3,290,678) |
| Long-term | (11,971,717) |
| Total no expiration | (15,262,395) |
| Total capital loss carryforward | $(16,887,100) |
Short-Term Trading (Redemption) Fees. Shares held by investors in the Fund less than 90 days may have been subject to a redemption fee equal to 1.50% of the NAV of shares redeemed. All redemption fees, which reduce the proceeds of the shareholder redemption, are retained by the Fund and accounted for as an addition to paid in capital.
Delayed Delivery Transactions and When-Issued Securities. During the period, the Fund transacted in securities on a delayed delivery or when-issued basis. Payment and delivery may take place after the customary settlement period for that security. The price of the underlying securities and the date when the securities will be delivered and paid for are fixed at the time the transaction is negotiated. The securities purchased on a delayed delivery or when-issued basis are identified as such in the Fund's Schedule of Investments. With respect to purchase commitments, the Fund identifies securities as segregated in its records with a value at least equal to the amount of the commitment. Losses may arise due to changes in the value of the underlying securities or if the counterparty does not perform under the contract's terms, or if the issuer does not issue the securities due to political, economic, or other factors.
Restricted Securities. The Fund may invest in securities that are subject to legal or contractual restrictions on resale. These securities generally may be resold in transactions exempt from registration or to the public if the securities are registered. Disposal of these securities may involve time-consuming negotiations and expense, and prompt sale at an acceptable price may be difficult. Information regarding restricted securities is included at the end of the Fund's Schedule of Investments.
4. Purchases and Sales of Investments.
Purchases and sales of securities, other than short-term securities, aggregated $22,842,835 and $19,602,882, respectively.
5. Fees and Other Transactions with Affiliates.
Management Fee. Fidelity Management & Research Company (the investment adviser) and its affiliates provide the Fund with investment management related services for which the Fund pays a monthly management fee. The management fee is the sum of an individual fund fee rate that is based on an annual rate of .55% of the Fund's average net assets and an annualized group fee rate that averaged .25% during the period. The group fee rate is based upon the average net assets of all the mutual funds advised by the investment adviser, including any mutual funds previously advised by the investment adviser that are currently advised by Fidelity SelectCo, LLC, an affiliate of the investment adviser. The group fee rate decreases as assets under management increase and increases as assets under management decrease. For the reporting period, the total annualized management fee rate was .80% of the Fund's average net assets.
Distribution and Service Plan Fees. In accordance with Rule 12b-1 of the 1940 Act, the Fund has adopted separate Distribution and Service Plans for each class of shares, except for the Class I. Certain classes pay Fidelity Distributors Corporation (FDC), an affiliate of the investment adviser, separate Distribution and Service Fees, each of which is based on an annual percentage of each class' average net assets. In addition, FDC may pay financial intermediaries for selling shares of the Fund and providing shareholder support services. For the period, the Distribution and Service Fee rates, total fees and amounts retained by FDC were as follows:
| Distribution Fee | Service Fee | Total Fees | Retained by FDC | |
| Class A | -% | .25% | $6,328 | $– |
| Class T | .25% | .25% | 4,536 | 4 |
| Class B | .75% | .25% | 717 | 538 |
| Class C | .75% | .25% | 19,383 | 2,551 |
| $30,964 | $3,093 |
Sales Load. FDC may receive a front-end sales charge of up to 5.75% for selling Class A shares and 3.50% for selling Class T shares, some of which is paid to financial intermediaries for selling shares of the Fund. Depending on the holding period, FDC may receive contingent deferred sales charges levied on Class A, Class T, Class B and Class C redemptions. The deferred sales charges range from 5.00% to 1.00% for Class B shares, 1.00% for Class C shares, 1.00% for certain purchases of Class A shares and .25% for certain purchases of Class T shares.
For the period, sales charge amounts retained by FDC were as follows:
| Retained by FDC | |
| Class A | $1,197 |
| Class T | 532 |
| Class B(a) | – |
| Class C(a) | 61 |
| $1,790 |
(a) When Class B and Class C shares are initially sold, FDC pays commissions from its own resources to financial intermediaries through which the sales are made.
Transfer Agent Fees. Fidelity Investments Institutional Operations Company, Inc., (FIIOC), an affiliate of the investment adviser, is the transfer, dividend disbursing and shareholder servicing agent for each class of the Fund. FIIOC receives account fees and asset-based fees that vary according to the account size and type of account of the shareholders of the respective classes of the Fund. FIIOC pays for typesetting, printing and mailing of shareholder reports, except proxy statements.
For the period, transfer agent fees for each class were as follows:
| Amount | % of Class-Level Average Net Assets(a) | |
| Class A | $7,504 | .30 |
| Class T | 3,080 | .34 |
| Class B | 224 | .31 |
| Class C | 5,632 | .29 |
| Emerging Europe, Middle East, Africa (EMEA) | 91,056 | .30 |
| Class I | 2,267 | .16 |
| $109,763 |
(a) Annualized
Accounting Fees. Fidelity Service Company, Inc. (FSC), an affiliate of the investment adviser, maintains the Fund's accounting records. The fee is based on the level of average net assets for each month.
Brokerage Commissions. The Fund placed a portion of its portfolio transactions with brokerage firms which are affiliates of the investment adviser. Brokerage commissions are included in net realized gain (loss) and change in net unrealized appreciation (depreciation) in the Statement of Operations. The commissions paid to these affiliated firms were $23 for the period.
Interfund Trades. The Fund may purchase from or sell securities to other Fidelity Funds under procedures adopted by the Board. The procedures have been designed to ensure these interfund trades are executed in accordance with Rule 17a-7 of the 1940 Act. Interfund trades are included within the respective purchases and sales amounts shown in the Purchases and Sales of Investments note.
6. Committed Line of Credit.
The Fund participates with other funds managed by the investment adviser or an affiliate in a $4.25 billion credit facility (the "line of credit") to be utilized for temporary or emergency purposes to fund shareholder redemptions or for other short-term liquidity purposes. The Fund has agreed to pay commitment fees on its pro-rata portion of the line of credit, which amounted to $65 and is reflected in Miscellaneous expenses on the Statement of Operations. During the period, the Fund did not borrow on this line of credit.
7. Expense Reductions.
The investment adviser voluntarily agreed to reimburse each class to the extent annual operating expenses exceeded certain levels of average net assets as noted in the table below. Some expenses, for example interest expense, including commitment fees, are excluded from this reimbursement.
The following classes were in reimbursement during the period:
| Expense Limitations | Reimbursement | |
| Class A | 1.65% | $4,376 |
| Class T | 1.90% | 2,026 |
| Class B | 2.40% | 121 |
| Class C | 2.40% | 4,082 |
| Emerging Europe, Middle East, Africa (EMEA) | 1.40% | 54,428 |
| Class I | 1.40% | 379 |
| $65,412 |
Commissions paid to certain brokers with whom the investment adviser, or its affiliates, places trades on behalf of the Fund include an amount in addition to trade execution, which may be rebated back to the Fund to offset certain expenses. This amount totaled $345 for the period.
In addition, during the period the investment adviser reimbursed and/or waived a portion of fund-level operating expenses in the amount of $267.
8. Distributions to Shareholders.
Distributions to shareholders of each class were as follows:
| Six months ended April 30, 2016 | Year ended October 31, 2015 | |
| From net investment income | ||
| Class A | $80,414 | $113,464 |
| Class T | 18,230 | 35,916 |
| Class B | 201 | 1,835 |
| Class C | 9,270 | 58,320 |
| Emerging Europe, Middle East, Africa (EMEA) | 1,152,813 | 1,776,301 |
| Class I | 62,782 | 105,734 |
| Total | $1,323,710 | $2,091,570 |
| From net realized gain | ||
| Class A | $– | $32,778 |
| Class T | – | 11,206 |
| Class B | – | 1,213 |
| Class C | – | 29,160 |
| Emerging Europe, Middle East, Africa (EMEA) | – | 407,505 |
| Class I | – | 22,909 |
| Total | $– | $504,771 |
9. Share Transactions.
Share transactions for each class were as follows and may contain automatic conversions between classes or exchanges between affiliated funds:
| Shares | Shares | Dollars | Dollars | |
| Six months ended April 30, 2016 | Year ended October 31, 2015 | Six months ended April 30, 2016 | Year ended October 31, 2015 | |
| Class A | ||||
| Shares sold | 125,223 | 200,433 | $908,033 | $1,636,757 |
| Reinvestment of distributions | 10,903 | 16,251 | 75,669 | 135,531 |
| Shares redeemed | (144,519) | (315,855) | (980,924) | (2,546,115) |
| Net increase (decrease) | (8,393) | (99,171) | $2,778 | $(773,827) |
| Class T | ||||
| Shares sold | 73,842 | 86,058 | $536,114 | $721,254 |
| Reinvestment of distributions | 2,627 | 5,631 | 18,230 | 46,793 |
| Shares redeemed | (38,900) | (96,309) | (273,521) | (767,911) |
| Net increase (decrease) | 37,569 | (4,620) | $280,823 | $136 |
| Class B | ||||
| Shares sold | 6,222 | 3,390 | $48,684 | $28,032 |
| Reinvestment of distributions | 29 | 349 | 201 | 2,936 |
| Shares redeemed | (10,329) | (12,164) | (74,883) | (100,803) |
| Net increase (decrease) | (4,078) | (8,425) | $(25,998) | $(69,835) |
| Class C | ||||
| Shares sold | 378,690 | 210,315 | $2,804,059 | $1,702,630 |
| Reinvestment of distributions | 776 | 8,117 | 5,381 | 67,210 |
| Shares redeemed | (84,612) | (408,507) | (573,923) | (3,365,409) |
| Net increase (decrease) | 294,854 | (190,075) | $2,235,517 | $(1,595,569) |
| Emerging Europe, Middle East, Africa (EMEA) | ||||
| Shares sold | 1,501,834 | 1,440,703 | $10,868,652 | $11,732,025 |
| Reinvestment of distributions | 155,366 | 247,446 | 1,078,225 | 2,063,699 |
| Shares redeemed | (1,214,338) | (3,348,545) | (8,241,773) | (27,229,428) |
| Net increase (decrease) | 442,862 | (1,660,396) | $3,705,104 | $(13,433,704) |
| Class I | ||||
| Shares sold | 44,669 | 131,915 | $316,782 | $1,069,757 |
| Reinvestment of distributions | 7,594 | 12,912 | 52,629 | 107,558 |
| Shares redeemed | (169,187) | (297,795) | (1,137,877) | (2,411,162) |
| Net increase (decrease) | (116,924) | (152,968) | $(768,466) | $(1,233,847) |
10. Other.
The Fund's organizational documents provide former and current trustees and officers with a limited indemnification against liabilities arising in connection with the performance of their duties to the Fund. In the normal course of business, the Fund may also enter into contracts that provide general indemnifications. The Fund's maximum exposure under these arrangements is unknown as this would be dependent on future claims that may be made against the Fund. The risk of material loss from such claims is considered remote.
Shareholder Expense Example
As a shareholder of the Fund, you incur two types of costs: (1) transaction costs, including sales charges (loads) on purchase payments or redemption proceeds, redemption fees and (2) ongoing costs, including management fees, distribution and/or service (12b-1) fees and other Fund expenses. This Example is intended to help you understand your ongoing costs (in dollars) of investing in the Fund and to compare these costs with the ongoing costs of investing in other mutual funds.
The Example is based on an investment of $1,000 invested at the beginning of the period and held for the entire period (November 1, 2015 to April 30, 2016).
Actual Expenses
The first line of the accompanying table for each class of the Fund provides information about actual account values and actual expenses. You may use the information in this line, together with the amount you invested, to estimate the expenses that you paid over the period. Simply divide your account value by $1,000.00 (for example, an $8,600 account value divided by $1,000.00 = 8.6), then multiply the result by the number in the first line for a class of the Fund under the heading entitled "Expenses Paid During Period" to estimate the expenses you paid on your account during this period. A small balance maintenance fee of $12.00 that is charged once a year may apply for certain accounts with a value of less than $2,000. This fee is not included in the table below. If it was, the estimate of expenses you paid during the period would be higher, and your ending account value lower, by this amount. In addition, the Fund, as a shareholder in the underlying Fidelity Central Funds, will indirectly bear its pro-rata share of the fees and expenses incurred by the underlying Fidelity Central Funds. These fees and expenses are not included in the Fund's annualized expense ratio used to calculate the expense estimate in the table below.
Hypothetical Example for Comparison Purposes
The second line of the accompanying table for each class of the Fund provides information about hypothetical account values and hypothetical expenses based on a Class' actual expense ratio and an assumed rate of return of 5% per year before expenses, which is not the Class' actual return. The hypothetical account values and expenses may not be used to estimate the actual ending account balance or expenses you paid for the period. You may use this information to compare the ongoing costs of investing in the Fund and other funds. To do so, compare this 5% hypothetical example with the 5% hypothetical examples that appear in the shareholder reports of the other funds. A small balance maintenance fee of $12.00 that is charged once a year may apply for certain accounts with a value of less than $2,000. This fee is not included in the table below. If it was, the estimate of expenses you paid during the period would be higher, and your ending account value lower, by this amount. In addition, the Fund, as a shareholder in the underlying Fidelity Central Funds, will indirectly bear its pro-rata share of the fees and expenses incurred by the underlying Fidelity Central Funds. These fees and expenses are not included in the Fund's annualized expense ratio used to calculate the expense estimate in the table below.
Please note that the expenses shown in the table are meant to highlight your ongoing costs only and do not reflect any transaction costs. Therefore, the second line of the table is useful in comparing ongoing costs only, and will not help you determine the relative total costs of owning different funds. In addition, if these transactional costs were included, your costs would have been higher.
| Annualized Expense Ratio-A | Beginning Account Value November 1, 2015 | Ending Account Value April 30, 2016 | Expenses Paid During Period-B November 1, 2015 to April 30, 2016 | |
| Class A | 1.65% | |||
| Actual | $1,000.00 | $1,058.80 | $8.45 | |
| Hypothetical-C | $1,000.00 | $1,016.66 | $8.27 | |
| Class T | 1.90% | |||
| Actual | $1,000.00 | $1,059.10 | $9.73 | |
| Hypothetical-C | $1,000.00 | $1,015.42 | $9.52 | |
| Class B | 2.40% | |||
| Actual | $1,000.00 | $1,056.00 | $12.27 | |
| Hypothetical-C | $1,000.00 | $1,012.93 | $12.01 | |
| Class C | 2.40% | |||
| Actual | $1,000.00 | $1,055.40 | $12.27 | |
| Hypothetical-C | $1,000.00 | $1,012.93 | $12.01 | |
| Emerging Europe, Middle East, Africa (EMEA) | 1.40% | |||
| Actual | $1,000.00 | $1,061.90 | $7.18 | |
| Hypothetical-C | $1,000.00 | $1,017.90 | $7.02 | |
| Class I | 1.40% | |||
| Actual | $1,000.00 | $1,062.10 | $7.18 | |
| Hypothetical-C | $1,000.00 | $1,017.90 | $7.02 |
A Annualized expense ratio reflects expenses net of applicable fee waivers.
B Expenses are equal to each Class' annualized expense ratio, multiplied by the average account value over the period, multiplied by 182/366 (to reflect the one-half year period).
C 5% return per year before expenses
![]()
AEMEI-SANN-0616
1.861984.107
Fidelity Advisor® Latin America Fund - Semi-Annual Report April 30, 2016 Class A, Class T, Class B and Class C are classes of Fidelity® Latin America Fund |
|
Contents
To view a fund's proxy voting guidelines and proxy voting record for the 12-month period ended June 30, visit http://www.fidelity.com/proxyvotingresults or visit the Securities and Exchange Commission's (SEC) web site at http://www.sec.gov.
You may also call 1-877-208-0098 to request a free copy of the proxy voting guidelines.
Standard & Poor's, S&P and S&P 500 are registered service marks of The McGraw-Hill Companies, Inc. and have been licensed for use by Fidelity Distributors Corporation.
Other third-party marks appearing herein are the property of their respective owners.
All other marks appearing herein are registered or unregistered trademarks or service marks of FMR LLC or an affiliated company. © 2016 FMR LLC. All rights reserved.
This report and the financial statements contained herein are submitted for the general information of the shareholders of the Fund. This report is not authorized for distribution to prospective investors in the Fund unless preceded or accompanied by an effective prospectus.
A fund files its complete schedule of portfolio holdings with the SEC for the first and third quarters of each fiscal year on Form N-Q. Forms N-Q are available on the SEC’s web site at http://www.sec.gov. A fund's Forms N-Q may be reviewed and copied at the SEC’s Public Reference Room in Washington, DC. Information regarding the operation of the SEC's Public Reference Room may be obtained by calling 1-800-SEC-0330.
For a complete list of a fund's portfolio holdings, view the most recent holdings listing, semiannual report, or annual report on Fidelity's web site at http://www.fidelity.com, http://www.advisor.fidelity.com, or http://www.401k.com, as applicable.
NOT FDIC INSURED •MAY LOSE VALUE •NO BANK GUARANTEE
Neither the Fund nor Fidelity Distributors Corporation is a bank.
Investment Summary (Unaudited)
Geographic Diversification (% of fund's net assets)
| As of April 30, 2016 | ||
| Brazil | 45.5% | |
| Mexico | 30.6% | |
| United States of America* | 8.4% | |
| Chile | 3.8% | |
| Bermuda | 3.7% | |
| Panama | 2.6% | |
| United Kingdom | 1.4% | |
| Spain | 1.0% | |
| Peru | 1.0% | |
| Other | 2.0% | |

* Includes Short-Term investments and Net Other Assets (Liabilities).
Percentages are based on country or territory of incorporation and are adjusted for the effect of futures contracts, if applicable.
| As of October 31, 2015 | ||
| Brazil | 39.0% | |
| Mexico | 33.2% | |
| Chile | 12.5% | |
| Colombia | 5.6% | |
| United States of America* | 3.2% | |
| Peru | 3.0% | |
| Panama | 1.6% | |
| Belgium | 0.9% | |
| Spain | 0.7% | |
| Other | 0.3% | |
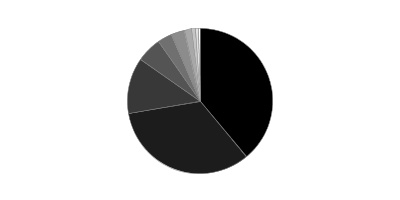
* Includes Short-Term investments and Net Other Assets (Liabilities).
Percentages are based on country or territory of incorporation and are adjusted for the effect of futures contracts, if applicable.
Asset Allocation as of April 30, 2016
| % of fund's net assets | % of fund's net assets 6 months ago | |
| Stocks | 96.6 | 97.2 |
| Short-Term Investments and Net Other Assets (Liabilities) | 3.4 | 2.8 |
Top Ten Stocks as of April 30, 2016
| % of fund's net assets | % of fund's net assets 6 months ago | |
| Itau Unibanco Holding SA (Brazil, Banks) | 8.0 | 4.7 |
| Grupo Financiero Banorte S.A.B. de CV Series O (Mexico, Banks) | 5.0 | 0.0 |
| Fomento Economico Mexicano S.A.B. de CV unit (Mexico, Beverages) | 4.4 | 5.5 |
| Cielo SA (Brazil, IT Services) | 3.9 | 1.1 |
| Credicorp Ltd. (United States) (Bermuda, Banks) | 3.7 | 0.0 |
| Itausa-Investimentos Itau SA (PN) (Brazil, Banks) | 3.5 | 1.5 |
| Kroton Educacional SA (Brazil, Diversified Consumer Services) | 2.6 | 0.0 |
| BB Seguridade Participacoes SA (Brazil, Insurance) | 2.5 | 1.0 |
| Kimberly-Clark de Mexico SA de CV Series A (Mexico, Household Products) | 2.3 | 1.1 |
| Petroleo Brasileiro SA - Petrobras (PN) (non-vtg.) (Brazil, Oil, Gas & Consumable Fuels) | 2.3 | 1.8 |
| 38.2 |
Market Sectors as of April 30, 2016
| % of fund's net assets | % of fund's net assets 6 months ago | |
| Financials | 35.2 | 26.9 |
| Consumer Staples | 16.4 | 28.0 |
| Consumer Discretionary | 14.5 | 8.1 |
| Industrials | 10.2 | 5.8 |
| Health Care | 6.2 | 1.4 |
| Information Technology | 5.9 | 1.1 |
| Materials | 3.6 | 7.8 |
| Energy | 2.3 | 5.0 |
| Utilities | 1.5 | 4.6 |
| Telecommunication Services | 0.8 | 8.5 |
Market Sectors may include more than one industry category.
The Fund may invest up to 35% of its total assets in any industry that represents more than 20% of the Latin American market. As of April 30, 2016, the Fund did not have more than 25% of its total assets invested in any one industry.
Percentages shown as 0.0% may reflect amounts less than 0.05%.
Investments April 30, 2016 (Unaudited)
Showing Percentage of Net Assets
| Common Stocks - 81.6% | |||
| Shares | Value | ||
| Argentina - 1.0% | |||
| Grupo Financiero Galicia SA sponsored ADR | 180,473 | $5,138,066 | |
| Bermuda - 3.7% | |||
| Credicorp Ltd. (United States) | 135,801 | 19,748,181 | |
| Brazil - 30.5% | |||
| BB Seguridade Participacoes SA | 1,513,600 | 13,202,879 | |
| CCR SA | 2,130,502 | 10,022,977 | |
| Cielo SA | 2,117,948 | 20,629,863 | |
| CVC Brasil Operadora e Agencia de Viagens SA | 1,341,033 | 7,408,484 | |
| Equatorial Energia SA | 668,406 | 8,267,498 | |
| Estacio Participacoes SA | 2,243,220 | 7,742,101 | |
| Fibria Celulose SA | 982,462 | 8,678,402 | |
| FPC Par Corretora de Seguros | 1,667,889 | 5,601,255 | |
| Grendene SA | 1,074,900 | 5,310,039 | |
| Hypermarcas SA | 1,101,286 | 9,715,205 | |
| Industrias Romi SA | 549,100 | 295,365 | |
| Kroton Educacional SA | 3,718,837 | 13,840,551 | |
| Linx SA | 338,067 | 4,649,435 | |
| Mills Estruturas e Servicos de Engenharia SA | 2,521,458 | 3,086,527 | |
| Multiplus SA | 580,948 | 6,410,402 | |
| Odontoprev SA | 2,036,893 | 6,194,926 | |
| Qualicorp SA | 2,460,713 | 10,660,645 | |
| Smiles SA | 814,156 | 9,445,322 | |
| Tegma Gestao Logistica SA | 2,562,627 | 4,276,944 | |
| Valid Solucoes SA | 659,175 | 6,708,185 | |
| TOTAL BRAZIL | 162,147,005 | ||
| Chile - 3.8% | |||
| Banmedica SA | 3,100,772 | 5,256,540 | |
| CorpBanca SA | 742,999,828 | 6,762,263 | |
| Forus SA | 1,878,297 | 5,668,936 | |
| Vina San Pedro SA | 238,206,744 | 2,347,184 | |
| TOTAL CHILE | 20,034,923 | ||
| France - 1.0% | |||
| Edenred SA | 264,421 | 5,213,790 | |
| Mexico - 30.6% | |||
| Banregio Grupo Financiero S.A.B. de CV | 360,000 | 2,157,324 | |
| Compartamos S.A.B. de CV | 5,797,311 | 11,530,835 | |
| Credito Real S.A.B. de CV | 2,385,302 | 5,261,497 | |
| Embotelladoras Arca S.A.B. de CV | 1,099,169 | 7,587,327 | |
| Fomento Economico Mexicano S.A.B. de CV unit | 2,516,609 | 23,415,691 | |
| Genomma Lab Internacional SA de CV (a)(b) | 9,725,099 | 10,683,412 | |
| Gruma S.A.B. de CV Series B | 614,429 | 8,975,739 | |
| Grupo Aeroportuario Norte S.A.B. de CV | 911,563 | 5,275,040 | |
| Grupo Comercial Chedraui S.A.B. de CV | 355,158 | 1,006,560 | |
| Grupo Financiero Banorte S.A.B. de CV Series O | 4,658,402 | 26,445,532 | |
| Grupo GICSA SA de CV(a) | 5,477,756 | 4,304,607 | |
| Grupo Herdez S.A.B. de CV | 2,034,846 | 4,503,837 | |
| Kimberly-Clark de Mexico SA de CV Series A | 5,199,395 | 12,305,938 | |
| Megacable Holdings S.A.B. de CV unit | 2,210,548 | 10,208,173 | |
| Promotora y Operadora de Infraestructura S.A.B. de CV | 685,467 | 7,175,139 | |
| Qualitas Controladora S.A.B. de CV | 4,665,846 | 6,270,070 | |
| Telesites S.A.B. de C.V. (a) | 6,986,994 | 4,288,530 | |
| Tenedora Nemak SA de CV | 3,169,744 | 4,546,985 | |
| Unifin Financiera SAPI de CV | 2,278,967 | 6,718,486 | |
| TOTAL MEXICO | 162,660,722 | ||
| Panama - 2.6% | |||
| Copa Holdings SA Class A | 97,338 | 6,205,298 | |
| Intergroup Financial Services Corp. | 259,297 | 7,389,965 | |
| TOTAL PANAMA | 13,595,263 | ||
| Peru - 1.0% | |||
| Alicorp SA Class C (a) | 2,843,073 | 5,391,229 | |
| Spain - 1.0% | |||
| Prosegur Compania de Seguridad SA (Reg.) | 946,444 | 5,472,815 | |
| United Kingdom - 1.4% | |||
| British American Tobacco PLC (United Kingdom) | 125,624 | 7,659,558 | |
| United States of America - 5.0% | |||
| First Cash Financial Services, Inc. | 110,047 | 5,032,449 | |
| MercadoLibre, Inc. | 46,959 | 5,864,710 | |
| Monsanto Co. | 112,070 | 10,498,718 | |
| PriceSmart, Inc. | 60,590 | 5,243,459 | |
| TOTAL UNITED STATES OF AMERICA | 26,639,336 | ||
| TOTAL COMMON STOCKS | |||
| (Cost $370,927,690) | 433,700,888 | ||
| Nonconvertible Preferred Stocks - 15.0% | |||
| Brazil - 15.0% | |||
| Alpargatas SA (PN) | 2,325,383 | 6,254,210 | |
| Itau Unibanco Holding SA | 4,473,142 | 42,751,231 | |
| Itausa-Investimentos Itau SA (PN) | 7,391,854 | 18,612,621 | |
| Petroleo Brasileiro SA - Petrobras (PN) (non-vtg.) (a) | 4,099,671 | 12,194,413 | |
| TOTAL NONCONVERTIBLE PREFERRED STOCKS | |||
| (Cost $47,767,968) | 79,812,475 | ||
| Money Market Funds - 3.2% | |||
| Fidelity Cash Central Fund, 0.38% (c) | 15,233,830 | 15,233,830 | |
| Fidelity Securities Lending Cash Central Fund, 0.42% (c)(d) | 1,908,000 | 1,908,000 | |
| TOTAL MONEY MARKET FUNDS | |||
| (Cost $17,141,830) | 17,141,830 | ||
| TOTAL INVESTMENT PORTFOLIO - 99.8% | |||
| (Cost $435,837,488) | 530,655,193 | ||
| NET OTHER ASSETS (LIABILITIES) - 0.2% | 1,322,703 | ||
| NET ASSETS - 100% | $531,977,896 |
Categorizations in the Schedule of Investments are based on country or territory of incorporation.
Legend
(a) Non-income producing
(b) Security or a portion of the security is on loan at period end.
(c) Affiliated fund that is generally available only to investment companies and other accounts managed by Fidelity Investments. The rate quoted is the annualized seven-day yield of the fund at period end. A complete unaudited listing of the fund's holdings as of its most recent quarter end is available upon request. In addition, each Fidelity Central Fund's financial statements are available on the SEC's website or upon request.
(d) Investment made with cash collateral received from securities on loan.
Affiliated Central Funds
Information regarding fiscal year to date income earned by the Fund from investments in Fidelity Central Funds is as follows:
| Fund | Income earned |
| Fidelity Cash Central Fund | $13,871 |
| Fidelity Securities Lending Cash Central Fund | 13,739 |
| Total | $27,610 |
Investment Valuation
The following is a summary of the inputs used, as of April 30, 2016, involving the Fund's assets and liabilities carried at fair value. The inputs or methodology used for valuing securities may not be an indication of the risk associated with investing in those securities. For more information on valuation inputs, and their aggregation into the levels used below, please refer to the Investment Valuation section in the accompanying Notes to Financial Statements.
| Valuation Inputs at Reporting Date: | ||||
| Description | Total | Level 1 | Level 2 | Level 3 |
| Investments in Securities: | ||||
| Equities: | ||||
| Consumer Discretionary | $76,835,203 | $76,835,203 | $-- | $-- |
| Consumer Staples | 88,151,727 | 80,492,169 | 7,659,558 | -- |
| Energy | 12,194,413 | 12,194,413 | -- | -- |
| Financials | 186,927,261 | 186,927,261 | -- | -- |
| Health Care | 32,795,523 | 32,795,523 | -- | -- |
| Industrials | 53,732,080 | 53,732,080 | -- | -- |
| Information Technology | 31,144,008 | 31,144,008 | -- | -- |
| Materials | 19,177,120 | 19,177,120 | -- | -- |
| Telecommunication Services | 4,288,530 | 4,288,530 | -- | -- |
| Utilities | 8,267,498 | 8,267,498 | -- | -- |
| Money Market Funds | 17,141,830 | 17,141,830 | -- | -- |
| Total Investments in Securities: | $530,655,193 | $522,995,635 | $7,659,558 | $-- |
See accompanying notes which are an integral part of the financial statements.
Financial Statements
Statement of Assets and Liabilities
| April 30, 2016 (Unaudited) | ||
| Assets | ||
| Investment in securities, at value (including securities loaned of $1,986,076) — See accompanying schedule: Unaffiliated issuers (cost $418,695,658) | $513,513,363 | |
| Fidelity Central Funds (cost $17,141,830) | 17,141,830 | |
| Total Investments (cost $435,837,488) | $530,655,193 | |
| Foreign currency held at value (cost $848,641) | 845,098 | |
| Receivable for investments sold | 11,521,261 | |
| Receivable for fund shares sold | 886,476 | |
| Dividends receivable | 2,157,717 | |
| Distributions receivable from Fidelity Central Funds | 5,465 | |
| Prepaid expenses | 839 | |
| Other receivables | 4,697 | |
| Total assets | 546,076,746 | |
| Liabilities | ||
| Payable for investments purchased | $9,981,660 | |
| Payable for fund shares redeemed | 1,673,044 | |
| Accrued management fee | 295,020 | |
| Distribution and service plan fees payable | 10,382 | |
| Other affiliated payables | 141,288 | |
| Other payables and accrued expenses | 89,456 | |
| Collateral on securities loaned, at value | 1,908,000 | |
| Total liabilities | 14,098,850 | |
| Net Assets | $531,977,896 | |
| Net Assets consist of: | ||
| Paid in capital | $621,439,296 | |
| Undistributed net investment income | 5,280,315 | |
| Accumulated undistributed net realized gain (loss) on investments and foreign currency transactions | (189,596,126) | |
| Net unrealized appreciation (depreciation) on investments and assets and liabilities in foreign currencies | 94,854,411 | |
| Net Assets | $531,977,896 | |
| Calculation of Maximum Offering Price | ||
| Class A: | ||
| Net Asset Value and redemption price per share ($15,995,909 ÷ 829,375 shares) | $19.29 | |
| Maximum offering price per share (100/94.25 of $19.29) | $20.47 | |
| Class T: | ||
| Net Asset Value and redemption price per share ($5,751,716 ÷ 297,544 shares) | $19.33 | |
| Maximum offering price per share (100/96.50 of $19.33) | $20.03 | |
| Class B: | ||
| Net Asset Value and offering price per share ($424,337 ÷ 21,533 shares)(a) | $19.71 | |
| Class C: | ||
| Net Asset Value and offering price per share ($5,785,469 ÷ 296,693 shares)(a) | $19.50 | |
| Latin America: | ||
| Net Asset Value, offering price and redemption price per share ($500,862,877 ÷ 26,047,611 shares) | $19.23 | |
| Class I: | ||
| Net Asset Value, offering price and redemption price per share ($3,157,588 ÷ 164,416 shares) | $19.20 |
(a) Redemption price per share is equal to net asset value less any applicable contingent deferred sales charge.
See accompanying notes which are an integral part of the financial statements.
Statement of Operations
| Six months ended April 30, 2016 (Unaudited) | ||
| Investment Income | ||
| Dividends | $11,941,726 | |
| Income from Fidelity Central Funds | 27,610 | |
| Income before foreign taxes withheld | 11,969,336 | |
| Less foreign taxes withheld | (658,372) | |
| Total income | 11,310,964 | |
| Expenses | ||
| Management fee | $1,625,345 | |
| Transfer agent fees | 695,198 | |
| Distribution and service plan fees | 56,456 | |
| Accounting and security lending fees | 120,506 | |
| Custodian fees and expenses | 201,427 | |
| Independent trustees' compensation | 1,051 | |
| Registration fees | 43,549 | |
| Audit | 39,945 | |
| Legal | 713 | |
| Interest | 882 | |
| Miscellaneous | 1,577 | |
| Total expenses before reductions | 2,786,649 | |
| Expense reductions | (7,128) | 2,779,521 |
| Net investment income (loss) | 8,531,443 | |
| Realized and Unrealized Gain (Loss) | ||
| Net realized gain (loss) on: | ||
| Investment securities: | ||
| Unaffiliated issuers | (101,386,798) | |
| Foreign currency transactions | (358,721) | |
| Total net realized gain (loss) | (101,745,519) | |
| Change in net unrealized appreciation (depreciation) on: Investment securities | 133,562,288 | |
| Assets and liabilities in foreign currencies | 76,379 | |
| Total change in net unrealized appreciation (depreciation) | 133,638,667 | |
| Net gain (loss) | 31,893,148 | |
| Net increase (decrease) in net assets resulting from operations | $40,424,591 |
See accompanying notes which are an integral part of the financial statements.
Statement of Changes in Net Assets
| Six months ended April 30, 2016 (Unaudited) | Year ended October 31, 2015 | |
| Increase (Decrease) in Net Assets | ||
| Operations | ||
| Net investment income (loss) | $8,531,443 | $10,341,112 |
| Net realized gain (loss) | (101,745,519) | (87,419,393) |
| Change in net unrealized appreciation (depreciation) | 133,638,667 | (231,042,995) |
| Net increase (decrease) in net assets resulting from operations | 40,424,591 | (308,121,276) |
| Distributions to shareholders from net investment income | (10,264,003) | (12,592,762) |
| Distributions to shareholders from net realized gain | – | (66,395,306) |
| Total distributions | (10,264,003) | (78,988,068) |
| Share transactions - net increase (decrease) | (8,769,783) | (98,503,600) |
| Redemption fees | 24,821 | 127,133 |
| Total increase (decrease) in net assets | 21,415,626 | (485,485,811) |
| Net Assets | ||
| Beginning of period | 510,562,270 | 996,048,081 |
| End of period (including undistributed net investment income of $5,280,315 and undistributed net investment income of $7,012,875, respectively) | $531,977,896 | $510,562,270 |
See accompanying notes which are an integral part of the financial statements.
Financial Highlights — Fidelity Latin America Fund Class A
| Six months ended (Unaudited) April 30, | Years ended October 31, | |||||
| 2016 | 2015 | 2014 | 2013 | 2012 | 2011 | |
| Selected Per–Share Data | ||||||
| Net asset value, beginning of period | $18.09 | $30.31 | $40.71 | $48.95 | $52.38 | $57.48 |
| Income from Investment Operations | ||||||
| Net investment income (loss)A | .29 | .28 | .49 | .72 | .92 | 1.15 |
| Net realized and unrealized gain (loss) | 1.22 | (10.11) | (4.08) | (4.73) | (3.66) | (5.87) |
| Total from investment operations | 1.51 | (9.83) | (3.59) | (4.01) | (2.74) | (4.72) |
| Distributions from net investment income | (.31) | (.31) | (.57) | (.79) | (.70) | (.19) |
| Distributions from net realized gain | – | (2.08) | (6.25) | (3.45) | – | (.20) |
| Total distributions | (.31) | (2.39) | (6.82) | (4.24) | (.70) | (.39) |
| Redemption fees added to paid in capitalA | –B | –B | .01 | .01 | .01 | .01 |
| Net asset value, end of period | $19.29 | $18.09 | $30.31 | $40.71 | $48.95 | $52.38 |
| Total ReturnC,D,E | 8.51% | (34.60)% | (9.06)% | (8.93)% | (5.23)% | (8.26)% |
| Ratios to Average Net AssetsF,G | ||||||
| Expenses before reductions | 1.42%H | 1.40% | 1.38% | 1.37% | 1.35% | 1.34% |
| Expenses net of fee waivers, if any | 1.42%H | 1.40% | 1.38% | 1.37% | 1.35% | 1.34% |
| Expenses net of all reductions | 1.42%H | 1.39% | 1.38% | 1.35% | 1.35% | 1.34% |
| Net investment income (loss) | 3.43%H | 1.26% | 1.52% | 1.66% | 1.80% | 2.05% |
| Supplemental Data | ||||||
| Net assets, end of period (000 omitted) | $15,996�� | $16,424 | $34,898 | $48,464 | $69,654 | $91,407 |
| Portfolio turnover rateI | 165%H | 30% | 30% | 23% | 23% | 11% |
A Calculated based on average shares outstanding during the period.
B Amount represents less than $.005 per share.
C Total returns for periods of less than one year are not annualized.
D Total returns would have been lower if certain expenses had not been reduced during the applicable periods shown.
E Total returns do not include the effect of the sales charges.
F Fees and expenses of any underlying Fidelity Central Funds are not included in the Fund's expense ratio. The Fund indirectly bears its proportionate share of the expenses of any underlying Fidelity Central Funds.
G Expense ratios reflect operating expenses of the class. Expenses before reductions do not reflect amounts reimbursed by the investment adviser or reductions from brokerage service arrangements or reductions from other expense offset arrangements and do not represent the amount paid by the class during periods when reimbursements or reductions occur. Expenses net of fee waivers reflect expenses after reimbursement by the investment adviser but prior to reductions from brokerage service arrangements or other expense offset arrangements. Expenses net of all reductions represent the net expenses paid by the class.
H Annualized
I Amount does not include the portfolio activity of any underlying Fidelity Central Funds.
See accompanying notes which are an integral part of the financial statements.
Financial Highlights — Fidelity Latin America Fund Class T
| Six months ended (Unaudited) April 30, | Years ended October 31, | |||||
| 2016 | 2015 | 2014 | 2013 | 2012 | 2011 | |
| Selected Per–Share Data | ||||||
| Net asset value, beginning of period | $18.11 | $30.33 | $40.68 | $48.88 | $52.27 | $57.47 |
| Income from Investment Operations | ||||||
| Net investment income (loss)A | .27 | .22 | .40 | .61 | .78 | .99 |
| Net realized and unrealized gain (loss) | 1.21 | (10.13) | (4.08) | (4.74) | (3.65) | (5.85) |
| Total from investment operations | 1.48 | (9.91) | (3.68) | (4.13) | (2.87) | (4.86) |
| Distributions from net investment income | (.26) | (.23) | (.43) | (.63) | (.53) | (.15) |
| Distributions from net realized gain | – | (2.08) | (6.25) | (3.45) | – | (.20) |
| Total distributions | (.26) | (2.31) | (6.68) | (4.08) | (.53) | (.35) |
| Redemption fees added to paid in capitalA | –B | –B | .01 | .01 | .01 | .01 |
| Net asset value, end of period | $19.33 | $18.11 | $30.33 | $40.68 | $48.88 | $52.27 |
| Total ReturnC,D,E | 8.33% | (34.78)% | (9.30)% | (9.17)% | (5.49)% | (8.50)% |
| Ratios to Average Net AssetsF,G | ||||||
| Expenses before reductions | 1.71%H | 1.67% | 1.65% | 1.63% | 1.61% | 1.61% |
| Expenses net of fee waivers, if any | 1.71%H | 1.67% | 1.65% | 1.63% | 1.61% | 1.61% |
| Expenses net of all reductions | 1.71%H | 1.66% | 1.65% | 1.61% | 1.61% | 1.61% |
| Net investment income (loss) | 3.14%H | .99% | 1.25% | 1.40% | 1.54% | 1.78% |
| Supplemental Data | ||||||
| Net assets, end of period (000 omitted) | $5,752 | $5,284 | $9,761 | $12,705 | $19,334 | $26,020 |
| Portfolio turnover rateI | 165%H | 30% | 30% | 23% | 23% | 11% |
A Calculated based on average shares outstanding during the period.
B Amount represents less than $.005 per share.
C Total returns for periods of less than one year are not annualized.
D Total returns would have been lower if certain expenses had not been reduced during the applicable periods shown.
E Total returns do not include the effect of the sales charges.
F Fees and expenses of any underlying Fidelity Central Funds are not included in the Fund's expense ratio. The Fund indirectly bears its proportionate share of the expenses of any underlying Fidelity Central Funds.
G Expense ratios reflect operating expenses of the class. Expenses before reductions do not reflect amounts reimbursed by the investment adviser or reductions from brokerage service arrangements or reductions from other expense offset arrangements and do not represent the amount paid by the class during periods when reimbursements or reductions occur. Expenses net of fee waivers reflect expenses after reimbursement by the investment adviser but prior to reductions from brokerage service arrangements or other expense offset arrangements. Expenses net of all reductions represent the net expenses paid by the class.
H Annualized
I Amount does not include the portfolio activity of any underlying Fidelity Central Funds.
See accompanying notes which are an integral part of the financial statements.
Financial Highlights — Fidelity Latin America Fund Class B
| Six months ended (Unaudited) April 30, | Years ended October 31, | |||||
| 2016 | 2015 | 2014 | 2013 | 2012 | 2011 | |
| Selected Per–Share Data | ||||||
| Net asset value, beginning of period | $18.27 | $30.46 | $40.63 | $48.72 | $52.06 | $57.44 |
| Income from Investment Operations | ||||||
| Net investment income (loss)A | .23 | .12 | .25 | .40 | .53 | .72 |
| Net realized and unrealized gain (loss) | 1.24 | (10.23) | (4.08) | (4.74) | (3.63) | (5.84) |
| Total from investment operations | 1.47 | (10.11) | (3.83) | (4.34) | (3.10) | (5.12) |
| Distributions from net investment income | (.03) | – | (.10) | (.31) | (.25) | (.07) |
| Distributions from net realized gain | – | (2.08) | (6.25) | (3.45) | – | (.20) |
| Total distributions | (.03) | (2.08) | (6.35) | (3.76) | (.25) | (.27) |
| Redemption fees added to paid in capitalA | –B | –B | .01 | .01 | .01 | .01 |
| Net asset value, end of period | $19.71 | $18.27 | $30.46 | $40.63 | $48.72 | $52.06 |
| Total ReturnC,D,E | 8.10% | (35.09)% | (9.73)% | (9.60)% | (5.95)% | (8.94)% |
| Ratios to Average Net AssetsF,G | ||||||
| Expenses before reductions | 2.17%H | 2.16% | 2.14% | 2.12% | 2.10% | 2.10% |
| Expenses net of fee waivers, if any | 2.17%H | 2.15% | 2.14% | 2.12% | 2.10% | 2.10% |
| Expenses net of all reductions | 2.17%H | 2.15% | 2.13% | 2.10% | 2.10% | 2.10% |
| Net investment income (loss) | 2.68%H | .50% | .76% | .91% | 1.05% | 1.29% |
| Supplemental Data | ||||||
| Net assets, end of period (000 omitted) | $424 | $628 | $2,211 | $4,764 | $9,492 | $14,114 |
| Portfolio turnover rateI | 165%H | 30% | 30% | 23% | 23% | 11% |
A Calculated based on average shares outstanding during the period.
B Amount represents less than $.005 per share.
C Total returns for periods of less than one year are not annualized.
D Total returns would have been lower if certain expenses had not been reduced during the applicable periods shown.
E Total returns do not include the effect of the contingent deferred sales charge.
F Fees and expenses of any underlying Fidelity Central Funds are not included in the Fund's expense ratio. The Fund indirectly bears its proportionate share of the expenses of any underlying Fidelity Central Funds.
G Expense ratios reflect operating expenses of the class. Expenses before reductions do not reflect amounts reimbursed by the investment adviser or reductions from brokerage service arrangements or reductions from other expense offset arrangements and do not represent the amount paid by the class during periods when reimbursements or reductions occur. Expenses net of fee waivers reflect expenses after reimbursement by the investment adviser but prior to reductions from brokerage service arrangements or other expense offset arrangements. Expenses net of all reductions represent the net expenses paid by the class.
H Annualized
I Amount does not include the portfolio activity of any underlying Fidelity Central Funds.
See accompanying notes which are an integral part of the financial statements.
Financial Highlights — Fidelity Latin America Fund Class C
| Six months ended (Unaudited) April 30, | Years ended October 31, | |||||
| 2016 | 2015 | 2014 | 2013 | 2012 | 2011 | |
| Selected Per–Share Data | ||||||
| Net asset value, beginning of period | $18.18 | $30.37 | $40.59 | $48.73 | $52.05 | $57.44 |
| Income from Investment Operations | ||||||
| Net investment income (loss)A | .23 | .11 | .25 | .40 | .54 | .73 |
| Net realized and unrealized gain (loss) | 1.22 | (10.17) | (4.07) | (4.74) | (3.64) | (5.84) |
| Total from investment operations | 1.45 | (10.06) | (3.82) | (4.34) | (3.10) | (5.11) |
| Distributions from net investment income | (.13) | (.05) | (.16) | (.36) | (.23) | (.09) |
| Distributions from net realized gain | – | (2.08) | (6.25) | (3.45) | – | (.20) |
| Total distributions | (.13) | (2.13) | (6.41) | (3.81) | (.23) | (.29) |
| Redemption fees added to paid in capitalA | –B | –B | .01 | .01 | .01 | .01 |
| Net asset value, end of period | $19.50 | $18.18 | $30.37 | $40.59 | $48.73 | $52.05 |
| Total ReturnC,D,E | 8.07% | (35.08)% | (9.74)% | (9.62)% | (5.94)% | (8.93)% |
| Ratios to Average Net AssetsF,G | ||||||
| Expenses before reductions | 2.17%H | 2.15% | 2.13% | 2.12% | 2.10% | 2.08% |
| Expenses net of fee waivers, if any | 2.17%H | 2.15% | 2.13% | 2.12% | 2.10% | 2.08% |
| Expenses net of all reductions | 2.16%H | 2.15% | 2.13% | 2.10% | 2.10% | 2.08% |
| Net investment income (loss) | 2.69%H | .51% | .77% | .91% | 1.06% | 1.31% |
| Supplemental Data | ||||||
| Net assets, end of period (000 omitted) | $5,785 | $5,394 | $11,349 | $15,185 | $27,405 | $35,203 |
| Portfolio turnover rateI | 165%H | 30% | 30% | 23% | 23% | 11% |
A Calculated based on average shares outstanding during the period.
B Amount represents less than $.005 per share.
C Total returns for periods of less than one year are not annualized.
D Total returns would have been lower if certain expenses had not been reduced during the applicable periods shown.
E Total returns do not include the effect of the contingent deferred sales charge.
F Fees and expenses of any underlying Fidelity Central Funds are not included in the Fund's expense ratio. The Fund indirectly bears its proportionate share of the expenses of any underlying Fidelity Central Funds.
G Expense ratios reflect operating expenses of the class. Expenses before reductions do not reflect amounts reimbursed by the investment adviser or reductions from brokerage service arrangements or reductions from other expense offset arrangements and do not represent the amount paid by the class during periods when reimbursements or reductions occur. Expenses net of fee waivers reflect expenses after reimbursement by the investment adviser but prior to reductions from brokerage service arrangements or other expense offset arrangements. Expenses net of all reductions represent the net expenses paid by the class.
H Annualized
I Amount does not include the portfolio activity of any underlying Fidelity Central Funds.
See accompanying notes which are an integral part of the financial statements.
Financial Highlights — Fidelity Latin America Fund
| Six months ended (Unaudited) April 30, | Years ended October 31, | |||||
| 2016 | 2015 | 2014 | 2013 | 2012 | 2011 | |
| Selected Per–Share Data | ||||||
| Net asset value, beginning of period | $18.08 | $30.34 | $40.80 | $49.09 | $52.48 | $57.50 |
| Income from Investment Operations | ||||||
| Net investment income (loss)A | .31 | .34 | .59 | .87 | 1.09 | 1.34 |
| Net realized and unrealized gain (loss) | 1.22 | (10.11) | (4.10) | (4.74) | (3.67) | (5.88) |
| Total from investment operations | 1.53 | (9.77) | (3.51) | (3.87) | (2.58) | (4.54) |
| Distributions from net investment income | (.38) | (.41) | (.71) | (.98) | (.82) | (.29) |
| Distributions from net realized gain | – | (2.08) | (6.25) | (3.45) | – | (.20) |
| Total distributions | (.38) | (2.49) | (6.96) | (4.43) | (.82) | (.49) |
| Redemption fees added to paid in capitalA | –B | –B | .01 | .01 | .01 | .01 |
| Net asset value, end of period | $19.23 | $18.08 | $30.34 | $40.80 | $49.09 | $52.48 |
| Total ReturnC,D | 8.67% | (34.45)% | (8.79)% | (8.63)% | (4.91)% | (7.96)% |
| Ratios to Average Net AssetsE,F | ||||||
| Expenses before reductions | 1.17%G | 1.13% | 1.08% | 1.04% | 1.02% | 1.00% |
| Expenses net of fee waivers, if any | 1.17%G | 1.12% | 1.08% | 1.04% | 1.02% | 1.00% |
| Expenses net of all reductions | 1.17%G | 1.12% | 1.07% | 1.03% | 1.02% | 1.00% |
| Net investment income (loss) | 3.68%G | 1.53% | 1.83% | 1.99% | 2.14% | 2.39% |
| Supplemental Data | ||||||
| Net assets, end of period (000 omitted) | $500,863 | $481,005 | $933,298 | $1,324,748 | $2,274,601 | $2,884,301 |
| Portfolio turnover rateH | 165%G | 30% | 30% | 23% | 23% | 11% |
A Calculated based on average shares outstanding during the period.
B Amount represents less than $.005 per share.
C Total returns for periods of less than one year are not annualized.
D Total returns would have been lower if certain expenses had not been reduced during the applicable periods shown.
E Fees and expenses of any underlying Fidelity Central Funds are not included in the Fund's expense ratio. The Fund indirectly bears its proportionate share of the expenses of any underlying Fidelity Central Funds.
F Expense ratios reflect operating expenses of the class. Expenses before reductions do not reflect amounts reimbursed by the investment adviser or reductions from brokerage service arrangements or reductions from other expense offset arrangements and do not represent the amount paid by the class during periods when reimbursements or reductions occur. Expenses net of fee waivers reflect expenses after reimbursement by the investment adviser but prior to reductions from brokerage service arrangements or other expense offset arrangements. Expenses net of all reductions represent the net expenses paid by the class.
G Annualized
H Amount does not include the portfolio activity of any underlying Fidelity Central Funds.
See accompanying notes which are an integral part of the financial statements.
Financial Highlights — Fidelity Latin America Fund Class I
| Six months ended (Unaudited) April 30, | Years ended October 31, | |||||
| 2016 | 2015 | 2014 | 2013 | 2012 | 2011 | |
| Selected Per–Share Data | ||||||
| Net asset value, beginning of period | $18.08 | $30.35 | $40.79 | $49.07 | $52.51 | $57.49 |
| Income from Investment Operations | ||||||
| Net investment income (loss)A | .31 | .36 | .60 | .87 | 1.08 | 1.32 |
| Net realized and unrealized gain (loss) | 1.21 | (10.13) | (4.07) | (4.74) | (3.67) | (5.88) |
| Total from investment operations | 1.52 | (9.77) | (3.47) | (3.87) | (2.59) | (4.56) |
| Distributions from net investment income | (.40) | (.42) | (.73) | (.97) | (.86) | (.23) |
| Distributions from net realized gain | – | (2.08) | (6.25) | (3.45) | – | (.20) |
| Total distributions | (.40) | (2.50) | (6.98) | (4.42) | (.86) | (.43) |
| Redemption fees added to paid in capitalA | –B | –B | .01 | .01 | .01 | .01 |
| Net asset value, end of period | $19.20 | $18.08 | $30.35 | $40.79 | $49.07 | $52.51 |
| Total ReturnC,D | 8.66% | (34.42)% | (8.69)% | (8.63)% | (4.93)% | (7.98)% |
| Ratios to Average Net AssetsE,F | ||||||
| Expenses before reductions | 1.13%G | 1.06% | 1.04% | 1.03% | 1.04% | 1.04% |
| Expenses net of fee waivers, if any | 1.13%G | 1.06% | 1.04% | 1.03% | 1.04% | 1.04% |
| Expenses net of all reductions | 1.12%G | 1.05% | 1.04% | 1.01% | 1.04% | 1.04% |
| Net investment income (loss) | 3.73%G | 1.60% | 1.86% | 2.00% | 2.12% | 2.35% |
| Supplemental Data | ||||||
| Net assets, end of period (000 omitted) | $3,158 | $1,828 | $4,531 | $5,131 | $7,928 | $9,603 |
| Portfolio turnover rateH | 165%G | 30% | 30% | 23% | 23% | 11% |
A Calculated based on average shares outstanding during the period.
B Amount represents less than $.005 per share.
C Total returns for periods of less than one year are not annualized.
D Total returns would have been lower if certain expenses had not been reduced during the applicable periods shown.
E Fees and expenses of any underlying Fidelity Central Funds are not included in the Fund's expense ratio. The Fund indirectly bears its proportionate share of the expenses of any underlying Fidelity Central Funds.
F Expense ratios reflect operating expenses of the class. Expenses before reductions do not reflect amounts reimbursed by the investment adviser or reductions from brokerage service arrangements or reductions from other expense offset arrangements and do not represent the amount paid by the class during periods when reimbursements or reductions occur. Expenses net of fee waivers reflect expenses after reimbursement by the investment adviser but prior to reductions from brokerage service arrangements or other expense offset arrangements. Expenses net of all reductions represent the net expenses paid by the class.
G Annualized
H Amount does not include the portfolio activity of any underlying Fidelity Central Funds.
See accompanying notes which are an integral part of the financial statements.
Notes to Financial Statements (Unaudited)
For the period ended April 30, 2016
1. Organization.
Fidelity Latin America Fund (the Fund) is a non-diversified fund of Fidelity Investment Trust (the Trust) and is authorized to issue an unlimited number of shares. The Trust is registered under the Investment Company Act of 1940, as amended (the 1940 Act), as an open-end management investment company organized as a Massachusetts business trust. The Fund offers Class A, Class T, Class C, Latin America and Institutional Class shares, each of which, along with Class B shares, has equal rights as to assets and voting privileges. Class B shares are closed to new accounts and additional purchases, except for exchanges and reinvestments. Each class has exclusive voting rights with respect to matters that affect that class. Class B shares will automatically convert to Class A shares after a maximum holding period of seven years from the initial date of purchase. The Fund's investments in emerging markets can be subject to social, economic, regulatory, and political uncertainties and can be extremely volatile.
During the period, the Board of Trustees approved the conversion of all existing Class B shares into Class A shares, effective on or about July 1, 2016, regardless of the length of times shares have been held.
2. Investments in Fidelity Central Funds.
The Fund invests in Fidelity Central Funds, which are open-end investment companies generally available only to other investment companies and accounts managed by the investment adviser and its affiliates. The Fund's Schedule of Investments lists each of the Fidelity Central Funds held as of period end, if any, as an investment of the Fund, but does not include the underlying holdings of each Fidelity Central Fund. As an Investing Fund, the Fund indirectly bears its proportionate share of the expenses of the underlying Fidelity Central Funds.
The Money Market Central Funds seek preservation of capital and current income and are managed by Fidelity Investments Money Management, Inc. (FIMM), an affiliate of the investment adviser. Annualized expenses of the Money Market Central Funds as of their most recent shareholder report date are less than .005%.
A complete unaudited list of holdings for each Fidelity Central Fund is available upon request or at the Securities and Exchange Commission (the SEC) website at www.sec.gov. In addition, the financial statements of the Fidelity Central Funds are available on the SEC website or upon request.
3. Significant Accounting Policies.
The financial statements have been prepared in conformity with accounting principles generally accepted in the United States of America (GAAP), which require management to make certain estimates and assumptions at the date of the financial statements. Actual results could differ from those estimates. Subsequent events, if any, through the date that the financial statements were issued have been evaluated in the preparation of the financial statements. The following summarizes the significant accounting policies of the Fund:
Investment Valuation. Investments are valued as of 4:00 p.m. Eastern time on the last calendar day of the period. The Board of Trustees (the Board) has delegated the day to day responsibility for the valuation of the Fund's investments to the Fidelity Management & Research Company (FMR) Fair Value Committee (the Committee). In accordance with valuation policies and procedures approved by the Board, the Fund attempts to obtain prices from one or more third party pricing vendors or brokers to value its investments. When current market prices, quotations or currency exchange rates are not readily available or reliable, investments will be fair valued in good faith by the Committee, in accordance with procedures adopted by the Board. Factors used in determining fair value vary by investment type and may include market or investment specific events. The frequency with which these procedures are used cannot be predicted and they may be utilized to a significant extent. The Committee oversees the Fund's valuation policies and procedures and reports to the Board on the Committee's activities and fair value determinations. The Board monitors the appropriateness of the procedures used in valuing the Fund's investments and ratifies the fair value determinations of the Committee.
The Fund categorizes the inputs to valuation techniques used to value its investments into a disclosure hierarchy consisting of three levels as shown below:
- Level 1 – quoted prices in active markets for identical investments
- Level 2 – other significant observable inputs (including quoted prices for similar investments, interest rates, prepayment speeds, etc.)
- Level 3 – unobservable inputs (including the Fund's own assumptions based on the best information available)
Valuation techniques used to value the Fund's investments by major category are as follows:
Equity securities, including restricted securities, for which market quotations are readily available, are valued at the last reported sale price or official closing price as reported by a third party pricing vendor on the primary market or exchange on which they are traded and are categorized as Level 1 in the hierarchy. In the event there were no sales during the day or closing prices are not available, securities are valued at the last quoted bid price or may be valued using the last available price and are generally categorized as Level 2 in the hierarchy. For foreign equity securities, when market or security specific events arise, comparisons to the valuation of American Depositary Receipts (ADRs), futures contracts, Exchange-Traded Funds (ETFs) and certain indexes as well as quoted prices for similar securities may be used and would be categorized as Level 2 in the hierarchy. Utilizing these techniques may result in transfers between Level 1 and Level 2. For equity securities, including restricted securities, where observable inputs are limited, assumptions about market activity and risk are used and these securities may be categorized as Level 3 in the hierarchy.
Investments in open-end mutual funds, including the Fidelity Central Funds, are valued at their closing net asset value (NAV) each business day and are categorized as Level 1 in the hierarchy.
Changes in valuation techniques may result in transfers in or out of an assigned level within the disclosure hierarchy. The aggregate value of investments by input level as of April 30, 2016 is included at the end of the Fund's Schedule of Investments.
Foreign Currency. The Fund may use foreign currency contracts to facilitate transactions in foreign-denominated securities. Gains and losses from these transactions may arise from changes in the value of the foreign currency or if the counterparties do not perform under the contracts' terms.
Foreign-denominated assets, including investment securities, and liabilities are translated into U.S. dollars at the exchange rates at period end. Purchases and sales of investment securities, income and dividends received and expenses denominated in foreign currencies are translated into U.S. dollars at the exchange rate in effect on the transaction date.
The effects of exchange rate fluctuations on investments are included with the net realized and unrealized gain (loss) on investment securities. Other foreign currency transactions resulting in realized and unrealized gain (loss) are disclosed separately.
Investment Transactions and Income. For financial reporting purposes, the Fund's investment holdings and NAV include trades executed through the end of the last business day of the period. The NAV per share for processing shareholder transactions is calculated as of the close of business of the New York Stock Exchange (NYSE), normally 4:00 p.m. Eastern time and includes trades executed through the end of the prior business day. Gains and losses on securities sold are determined on the basis of identified cost. Dividend income is recorded on the ex-dividend date, except for certain dividends from foreign securities where the ex-dividend date may have passed, which are recorded as soon as the Fund is informed of the ex-dividend date. Non-cash dividends included in dividend income, if any, are recorded at the fair market value of the securities received. Income and capital gain distributions from Fidelity Central Funds, if any, are recorded on the ex-dividend date. Distributions received on securities that represent a return of capital or capital gain are recorded as a reduction of cost of investments and/or as a realized gain. Subsequent to ex-dividend date the Fund determines the components of these distributions, based upon receipt of tax filings or other correspondence relating to the underlying investment. Interest income is accrued as earned and includes coupon interest and amortization of premium and accretion of discount on debt securities as applicable. Investment income is recorded net of foreign taxes withheld where recovery of such taxes is uncertain.
Class Allocations and Expenses. Investment income, realized and unrealized capital gains and losses, common expenses of the Fund, and certain fund-level expense reductions, if any, are allocated daily on a pro-rata basis to each class based on the relative net assets of each class to the total net assets of the Fund. Each class differs with respect to transfer agent and distribution and service plan fees incurred. Certain expense reductions may also differ by class. For the reporting period, the allocated portion of income and expenses to each class as a percent of its average net assets may vary due to the timing of recording these transactions in relation to fluctuating net assets of the classes. Expenses directly attributable to a fund are charged to that fund. Expenses attributable to more than one fund are allocated among the respective funds on the basis of relative net assets or other appropriate methods. Expense estimates are accrued in the period to which they relate and adjustments are made when actual amounts are known.
Income Tax Information and Distributions to Shareholders. Each year, the Fund intends to qualify as a regulated investment company under Subchapter M of the Internal Revenue Code, including distributing substantially all of its taxable income and realized gains. As a result, no provision for U.S. Federal income taxes is required. The Fund files a U.S. federal tax return, in addition to state and local tax returns as required. The Fund's federal income tax returns are subject to examination by the Internal Revenue Service (IRS) for a period of three fiscal years after they are filed. State and local tax returns may be subject to examination for an additional fiscal year depending on the jurisdiction. Foreign taxes are provided for based on the Fund's understanding of the tax rules and rates that exist in the foreign markets in which it invests.
Distributions are declared and recorded on the ex-dividend date. Income dividends and capital gain distributions are declared separately for each class. Income and capital gain distributions are determined in accordance with income tax regulations, which may differ from GAAP.
Capital accounts within the financial statements are adjusted for permanent book-tax differences. These adjustments have no impact on net assets or the results of operations. Capital accounts are not adjusted for temporary book-tax differences which will reverse in a subsequent period.
Book-tax differences are primarily due to foreign currency transactions, passive foreign investment companies (PFIC), capital loss carryforwards, deferred trustees compensation and losses deferred due to wash sales.
The federal tax cost of investment securities and unrealized appreciation (depreciation) as of period end were as follows:
| Gross unrealized appreciation | $108,291,244 |
| Gross unrealized depreciation | (19,001,999) |
| Net unrealized appreciation (depreciation) on securities | $89,289,245 |
| Tax cost | $441,365,948 |
Capital loss carryforwards are only available to offset future capital gains of the Fund to the extent provided by regulations and may be limited. Under the Regulated Investment Company Modernization Act of 2010 (the Act), the Fund is permitted to carry forward capital losses incurred in taxable years beginning after December 22, 2010 for an unlimited period and such capital losses are required to be used prior to any losses that expire. The capital loss carryforward information presented below, including any applicable limitation, is estimated as of prior fiscal period end and is subject to adjustment.
| No expiration | |
| Short-term | $(34,655,095) |
| Long-term | (50,107,400) |
| Total capital loss carryforward | $(84,762,495) |
Short-Term Trading (Redemption) Fees. Shares held by investors in the Fund less than 90 days may have been subject to a redemption fee equal to 1.50% of the NAV of shares redeemed. All redemption fees, which reduce the proceeds of the shareholder redemption, are retained by the Fund and accounted for as an addition to paid in capital.
4. Purchases and Sales of Investments.
Purchases and sales of securities, other than short-term securities, aggregated $384,349,836 and $399,551,878, respectively.
5. Fees and Other Transactions with Affiliates.
Management Fee. Fidelity Management & Research Company (the investment adviser) and its affiliates provide the Fund with investment management related services for which the Fund pays a monthly management fee. The management fee is the sum of an individual fund fee rate that is based on an annual rate of .45% of the Fund's average net assets and an annualized group fee rate that averaged .25% during the period. The group fee rate is based upon the average net assets of all the mutual funds advised by the investment adviser, including any mutual funds previously advised by the investment adviser that are currently advised by Fidelity SelectCo, LLC, an affiliate of the investment adviser. The group fee rate decreases as assets under management increase and increases as assets under management decrease. For the reporting period, the total annualized management fee rate was .70% of the Fund's average net assets.
Distribution and Service Plan Fees. In accordance with Rule 12b-1 of the 1940 Act, the Fund has adopted separate Distribution and Service Plans for each class of shares. Certain classes pay Fidelity Distributors Corporation (FDC), an affiliate of the investment adviser, separate Distribution and Service Fees, each of which is based on an annual percentage of each class' average net assets. In addition, FDC may pay financial intermediaries for selling shares of the Fund and providing shareholder support services. For the period, the Distribution and Service Fee rates, total fees and amounts retained by FDC were as follows:
| Distribution Fee | Service Fee | Total Fees | Retained by FDC | |
| Class A | -% | .25% | $17,807 | $– |
| Class T | .25% | .25% | 12,316 | – |
| Class B | .75% | .25% | 2,397 | 1,798 |
| Class C | .75% | .25% | 23,936 | 1,863 |
| $56,456 | $3,661 |
Sales Load. FDC may receive a front-end sales charge of up to 5.75% for selling Class A shares and 3.50% for selling Class T shares, some of which is paid to financial intermediaries for selling shares of the Fund. Depending on the holding period, FDC may receive contingent deferred sales charges levied on Class A, Class T, Class B, and Class C redemptions. The deferred sales charges range from 5.00% to 1.00% for Class B shares, 1.00% for Class C shares, 1.00% for certain purchases of Class A shares and .25% for certain purchases of Class T shares.
For the period, sales charge amounts retained by FDC were as follows:
| Retained by FDC | |
| Class A | $2,586 |
| Class T | 808 |
| Class B(a) | 36 |
| Class C(a) | 385 |
| $3,815 |
(a) When Class B and Class C shares are initially sold, FDC pays commissions from its own resources to financial intermediaries through which the sales are made.
Transfer Agent Fees. Fidelity Investments Institutional Operations Company, Inc., (FIIOC), an affiliate of the investment adviser, is the transfer, dividend disbursing and shareholder servicing agent for each class of the Fund. FIIOC receives account fees and asset-based fees that vary according to the account size and type of account of the shareholders of the respective classes of the Fund. FIIOC pays for typesetting, printing and mailing of shareholder reports, except proxy statements.
For the period, transfer agent fees for each class were as follows:
| Amount | % of Class-Level Average Net Assets(a) | |
| Class A | $21,549 | .30 |
| Class T | 8,453 | .34 |
| Class B | 721 | .30 |
| Class C | 7,142 | .30 |
| Latin America | 654,143 | .30 |
| Class I | 3,190 | .25 |
| $695,198 |
(a) Annualized
Accounting and Security Lending Fees. Fidelity Service Company, Inc. (FSC), an affiliate of the investment adviser, maintains the Fund's accounting records. The accounting fee is based on the level of average net assets for each month. Under a separate contract, FSC administers the security lending program. The security lending fee is based on the number and duration of lending transactions.
Brokerage Commissions. The Fund placed a portion of its portfolio transactions with brokerage firms which are affiliates of the investment adviser. Brokerage commissions are included in net realized gain (loss) and change in net unrealized appreciation (depreciation) in the Statement of Operations. The commissions paid to these affiliated firms were $6,916 for the period.
Interfund Lending Program. Pursuant to an Exemptive Order issued by the SEC, the Fund, along with other registered investment companies having management contracts with FMR or other affiliated entities of FMR, may participate in an interfund lending program. This program provides an alternative credit facility allowing the funds to borrow from, or lend money to, other participating affiliated funds. At period end, there were no interfund loans outstanding. The Fund's activity in this program during the period for which loans were outstanding was as follows:
| Borrower or Lender | Average Loan Balance | Weighted Average Interest Rate | Interest Expense |
| Borrower | $7,287,286 | .62% | $882 |
Interfund Trades. The Fund may purchase from or sell securities to other Fidelity Funds under procedures adopted by the Board. The procedures have been designed to ensure these interfund trades are executed in accordance with Rule 17a-7 of the 1940 Act. Interfund trades are included within the respective purchases and sales amounts shown in the Purchases and Sales of Investments note.
6. Committed Line of Credit.
The Fund participates with other funds managed by the investment adviser or an affiliate in a $4.25 billion credit facility (the "line of credit") to be utilized for temporary or emergency purposes to fund shareholder redemptions or for other short-term liquidity purposes. The Fund has agreed to pay commitment fees on its pro-rata portion of the line of credit, which amounted to $400 and is reflected in Miscellaneous expenses on the Statement of Operations. During the period, the Fund did not borrow on this line of credit.
7. Security Lending.
The Fund lends portfolio securities through a lending agent from time to time in order to earn additional income. For equity securities, a lending agent is used and may loan securities to certain qualified borrowers, including Fidelity Capital Markets (FCM), a broker-dealer affiliated with the Fund. On the settlement date of the loan, the Fund receives collateral (in the form of U.S. Treasury obligations, letters of credit and/or cash) against the loaned securities and maintains collateral in an amount not less than 100% of the market value of the loaned securities during the period of the loan. The market value of the loaned securities is determined at the close of business of the Fund and any additional required collateral is delivered to the Fund on the next business day. The Fund or borrower may terminate the loan at any time, and if the borrower defaults on its obligation to return the securities loaned because of insolvency or other reasons, the Fund may apply collateral received from the borrower against the obligation. The Fund may experience delays and costs in recovering the securities loaned. Any cash collateral received is invested in the Fidelity Securities Lending Cash Central Fund. The value of loaned securities and cash collateral at period end are disclosed on the Fund's Statement of Assets and Liabilities. At period end, there were no security loans outstanding with FCM. Security lending income represents the income earned on investing cash collateral, less rebates paid to borrowers and any lending agent fees associated with the loan, plus any premium payments received for lending certain types of securities. Security lending income is presented in the Statement of Operations as a component of income from Fidelity Central Funds. Total security lending income during the period amounted to $13,739, including $185 from securities loaned to FCM.
8. Expense Reductions.
Commissions paid to certain brokers with whom the investment adviser, or its affiliates, places trades on behalf of the Fund include an amount in addition to trade execution, which may be rebated back to the Fund to offset certain expenses. This amount totaled $5,446 for the period.
In addition, during the period the investment adviser reimbursed and/or waived a portion of fund-level operating expenses in the amount of $1,682.
9. Distributions to Shareholders.
Distributions to shareholders of each class were as follows:
| Six months ended April 30, 2016 | Year ended October 31, 2015 | |
| From net investment income | ||
| Class A | $264,922 | $341,444 |
| Class T | 74,433 | 71,167 |
| Class B | 1,059 | – |
| Class C | 37,419 | 18,114 |
| Latin America | 9,833,214 | 12,109,807 |
| Class I | 52,956 | 52,230 |
| Total | $10,264,003 | $12,592,762 |
| From net realized gain | ||
| Class A | $– | $2,330,553 |
| Class T | – | 658,521 |
| Class B | – | 144,042 |
| Class C | – | 754,025 |
| Latin America | – | 62,251,897 |
| Class I | – | 256,268 |
| Total | $– | $66,395,306 |
10. Share Transactions.
Share transactions for each class were as follows and may contain automatic conversions between classes or exchanges between affiliated funds:
| Shares | Shares | Dollars | Dollars | |
| Six months ended April 30, 2016 | Year ended October 31, 2015 | Six months ended April 30, 2016 | Year ended October 31, 2015 | |
| Class A | ||||
| Shares sold | 66,880 | 218,330 | $1,163,572 | $4,910,163 |
| Reinvestment of distributions | 14,810 | 103,775 | 256,538 | 2,587,573 |
| Shares redeemed | (160,323) | (565,352) | (2,718,955) | (12,518,797) |
| Net increase (decrease) | (78,633) | (243,247) | $(1,298,845) | $(5,021,061) |
| Class T | ||||
| Shares sold | 31,261 | 29,946 | $528,543 | $658,518 |
| Reinvestment of distributions | 4,243 | 28,508 | 73,689 | 713,357 |
| Shares redeemed | (29,741) | (88,493) | (509,091) | (1,990,592) |
| Net increase (decrease) | 5,763 | (30,039) | $93,141 | $(618,717) |
| Class B | ||||
| Shares sold | 1 | 116 | $10 | $2,989 |
| Reinvestment of distributions | 59 | 5,261 | 1,009 | 133,376 |
| Shares redeemed | (12,894) | (43,584) | (221,180) | (982,322) |
| Net increase (decrease) | (12,834) | (38,207) | $(220,161) | $(845,957) |
| Class C | ||||
| Shares sold | 46,774 | 48,350 | $817,698 | $1,099,271 |
| Reinvestment of distributions | 1,720 | 25,875 | 30,044 | 652,617 |
| Shares redeemed | (48,571) | (151,109) | (821,023) | (3,411,105) |
| Net increase (decrease) | (77) | (76,884) | $26,719 | $(1,659,217) |
| Latin America | ||||
| Shares sold | 2,247,110 | 2,736,036 | $38,271,000 | $60,647,605 |
| Reinvestment of distributions | 545,601 | 2,862,287 | 9,420,593 | 71,197,829 |
| Shares redeemed | (3,343,417) | (9,758,242) | (56,149,551) | (221,025,945) |
| Net increase (decrease) | (550,706) | (4,159,919) | $(8,457,958) | $(89,180,511) |
| Class I | ||||
| Shares sold | 98,480 | 41,136 | $1,665,317 | $906,993 |
| Reinvestment of distributions | 2,787 | 11,139 | 48,070 | 276,862 |
| Shares redeemed | (37,940) | (100,491) | (626,066) | (2,361,992) |
| Net increase (decrease) | 63,327 | (48,216) | $1,087,321 | $(1,178,137) |
11. Other.
The Fund's organizational documents provide former and current trustees and officers with a limited indemnification against liabilities arising in connection with the performance of their duties to the Fund. In the normal course of business, the Fund may also enter into contracts that provide general indemnifications. The Fund's maximum exposure under these arrangements is unknown as this would be dependent on future claims that may be made against the Fund. The risk of material loss from such claims is considered remote.
Shareholder Expense Example
As a shareholder of the Fund, you incur two types of costs: (1) transaction costs, including sales charges (loads) on purchase payments or redemption proceeds, redemption fees and (2) ongoing costs, including management fees, distribution and/or service (12b-1) fees and other Fund expenses. This Example is intended to help you understand your ongoing costs (in dollars) of investing in the Fund and to compare these costs with the ongoing costs of investing in other mutual funds.
The Example is based on an investment of $1,000 invested at the beginning of the period and held for the entire period (November 1, 2015 to April 30, 2016).
Actual Expenses
The first line of the accompanying table for each class of the Fund provides information about actual account values and actual expenses. You may use the information in this line, together with the amount you invested, to estimate the expenses that you paid over the period. Simply divide your account value by $1,000.00 (for example, an $8,600 account value divided by $1,000.00 = 8.6), then multiply the result by the number in the first line for a class of the Fund under the heading entitled "Expenses Paid During Period" to estimate the expenses you paid on your account during this period. A small balance maintenance fee of $12.00 that is charged once a year may apply for certain accounts with a value of less than $2,000. This fee is not included in the table below. If it was, the estimate of expenses you paid during the period would be higher, and your ending account value lower, by this amount. In addition, the Fund, as a shareholder in the underlying Fidelity Central Funds, will indirectly bear its pro-rata share of the fees and expenses incurred by the underlying Fidelity Central Funds. These fees and expenses are not included in the Fund's annualized expense ratio used to calculate the expense estimate in the table below.
Hypothetical Example for Comparison Purposes
The second line of the accompanying table for each class of the Fund provides information about hypothetical account values and hypothetical expenses based on a Class' actual expense ratio and an assumed rate of return of 5% per year before expenses, which is not the Class' actual return. The hypothetical account values and expenses may not be used to estimate the actual ending account balance or expenses you paid for the period. You may use this information to compare the ongoing costs of investing in the Fund and other funds. To do so, compare this 5% hypothetical example with the 5% hypothetical examples that appear in the shareholder reports of the other funds. A small balance maintenance fee of $12.00 that is charged once a year may apply for certain accounts with a value of less than $2,000. This fee is not included in the table below. If it was, the estimate of expenses you paid during the period would be higher, and your ending account value lower, by this amount. In addition, the Fund, as a shareholder in the underlying Fidelity Central Funds, will indirectly bear its pro-rata share of the fees and expenses incurred by the underlying Fidelity Central Funds. These fees and expenses are not included in the Fund's annualized expense ratio used to calculate the expense estimate in the table below.
Please note that the expenses shown in the table are meant to highlight your ongoing costs only and do not reflect any transaction costs. Therefore, the second line of the table is useful in comparing ongoing costs only, and will not help you determine the relative total costs of owning different funds. In addition, if these transactional costs were included, your costs would have been higher.
| Annualized Expense Ratio-A | Beginning Account Value November 1, 2015 | Ending Account Value April 30, 2016 | Expenses Paid During Period-B November 1, 2015 to April 30, 2016 | |
| Class A | 1.42% | |||
| Actual | $1,000.00 | $1,085.10 | $7.36 | |
| Hypothetical-C | $1,000.00 | $1,017.80 | $7.12 | |
| Class T | 1.71% | |||
| Actual | $1,000.00 | $1,083.30 | $8.86 | |
| Hypothetical-C | $1,000.00 | $1,016.36 | $8.57 | |
| Class B | 2.17% | |||
| Actual | $1,000.00 | $1,081.00 | $11.23 | |
| Hypothetical-C | $1,000.00 | $1,014.07 | $10.87 | |
| Class C | 2.17% | |||
| Actual | $1,000.00 | $1,080.70 | $11.23 | |
| Hypothetical-C | $1,000.00 | $1,014.07 | $10.87 | |
| Latin America | 1.17% | |||
| Actual | $1,000.00 | $1,086.70 | $6.07 | |
| Hypothetical-C | $1,000.00 | $1,019.05 | $5.87 | |
| Class I | 1.13% | |||
| Actual | $1,000.00 | 1,086.60 | $5.86 | |
| Hypothetical-C | $1,000.00 | $1,019.24 | $5.67 |
A Annualized expense ratio reflects expenses net of applicable fee waivers.
B Expenses are equal to each Class' annualized expense ratio, multiplied by the average account value over the period, multiplied by 182/366 (to reflect the one-half year period).
C 5% return per year before expenses
![]()
FALAA-SANN-0616
1.917421.105
Fidelity® Emerging Markets Fund Semi-Annual Report April 30, 2016 |
|
Contents
To view a fund's proxy voting guidelines and proxy voting record for the 12-month period ended June 30, visit http://www.fidelity.com/proxyvotingresults or visit the Securities and Exchange Commission's (SEC) web site at http://www.sec.gov.
You may also call 1-800-835-5092 to request a free copy of the proxy voting guidelines.
Standard & Poor's, S&P and S&P 500 are registered service marks of The McGraw-Hill Companies, Inc. and have been licensed for use by Fidelity Distributors Corporation.
Other third-party marks appearing herein are the property of their respective owners.
All other marks appearing herein are registered or unregistered trademarks or service marks of FMR LLC or an affiliated company. © 2016 FMR LLC. All rights reserved.
This report and the financial statements contained herein are submitted for the general information of the shareholders of the Fund. This report is not authorized for distribution to prospective investors in the Fund unless preceded or accompanied by an effective prospectus.
A fund files its complete schedule of portfolio holdings with the SEC for the first and third quarters of each fiscal year on Form N-Q. Forms N-Q are available on the SEC’s web site at http://www.sec.gov. A fund's Forms N-Q may be reviewed and copied at the SEC’s Public Reference Room in Washington, DC. Information regarding the operation of the SEC's Public Reference Room may be obtained by calling 1-800-SEC-0330.
For a complete list of a fund's portfolio holdings, view the most recent holdings listing, semiannual report, or annual report on Fidelity's web site at http://www.fidelity.com, http://www.advisor.fidelity.com, or http://www.401k.com, as applicable.
NOT FDIC INSURED •MAY LOSE VALUE •NO BANK GUARANTEE
Neither the Fund nor Fidelity Distributors Corporation is a bank.
Investment Summary (Unaudited)
Geographic Diversification (% of fund's net assets)
| As of April 30, 2016 | ||
| India | 13.5% | |
| United States of America* | 11.6% | |
| Cayman Islands | 9.4% | |
| Mexico | 8.5% | |
| Brazil | 8.3% | |
| South Africa | 6.8% | |
| Korea (South) | 5.5% | |
| Taiwan | 5.2% | |
| Philippines | 3.9% | |
| Other | 27.3% | |
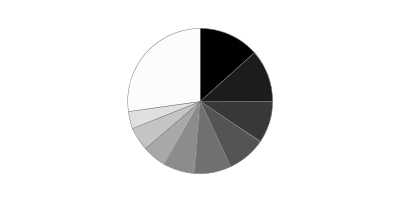
* Includes Short-Term investments and Net Other Assets (Liabilities).
Percentages are based on country or territory of incorporation and are adjusted for the effect of futures contracts, if applicable.
| As of October 31, 2015 | ||
| India | 10.6% | |
| United States of America* | 9.1% | |
| Korea (South) | 8.6% | |
| China | 8.0% | |
| Cayman Islands | 7.7% | |
| South Africa | 7.4% | |
| Mexico | 6.8% | |
| Taiwan | 6.7% | |
| Brazil | 6.3% | |
| Other | 28.8% | |

* Includes Short-Term investments and Net Other Assets (Liabilities).
Percentages are based on country or territory of incorporation and are adjusted for the effect of futures contracts, if applicable.
Asset Allocation as of April 30, 2016
| % of fund's net assets | % of fund's net assets 6 months ago | |
| Stocks | 98.7 | 99.3 |
| Short-Term Investments and Net Other Assets (Liabilities) | 1.3 | 0.7 |
Top Ten Stocks as of April 30, 2016
| % of fund's net assets | % of fund's net assets 6 months ago | |
| Taiwan Semiconductor Manufacturing Co. Ltd. (Taiwan, Semiconductors & Semiconductor Equipment) | 3.6 | 3.4 |
| Tencent Holdings Ltd. (Cayman Islands, Internet Software & Services) | 3.4 | 3.2 |
| Naspers Ltd. Class N (South Africa, Media) | 2.0 | 2.2 |
| Alibaba Group Holding Ltd. sponsored ADR (Cayman Islands, Internet Software & Services) | 1.6 | 0.7 |
| Infosys Ltd. (India, IT Services) | 1.4 | 0.0 |
| Baidu.com, Inc. sponsored ADR (Cayman Islands, Internet Software & Services) | 1.3 | 0.0 |
| Itau Unibanco Holding SA (Brazil, Banks) | 1.2 | 0.0 |
| Banco Bradesco SA (PN) (Brazil, Banks) | 1.2 | 0.0 |
| Housing Development Finance Corp. Ltd. (India, Thrifts & Mortgage Finance) | 1.2 | 1.3 |
| Ambev SA sponsored ADR (Brazil, Beverages) | 1.2 | 1.0 |
| 18.1 |
Market Sectors as of April 30, 2016
| % of fund's net assets | % of fund's net assets 6 months ago | |
| Information Technology | 21.7 | 23.1 |
| Financials | 18.4 | 19.8 |
| Consumer Discretionary | 14.2 | 18.5 |
| Consumer Staples | 13.8 | 8.5 |
| Industrials | 9.8 | 11.3 |
| Health Care | 8.3 | 8.4 |
| Materials | 5.8 | 4.7 |
| Utilities | 3.3 | 2.5 |
| Energy | 2.0 | 1.1 |
| Telecommunication Services | 1.4 | 1.4 |
Percentages shown as 0.0% may reflect amounts less than 0.05%.
Investments April 30, 2016 (Unaudited)
Showing Percentage of Net Assets
| Common Stocks - 95.1% | |||
| Shares | Value | ||
| Argentina - 0.9% | |||
| Banco Macro SA sponsored ADR | 253,800 | $15,895,494 | |
| Grupo Financiero Galicia SA sponsored ADR | 565,400 | 16,096,938 | |
| TOTAL ARGENTINA | 31,992,432 | ||
| Australia - 1.0% | |||
| Amcor Ltd. (a) | 1,507,331 | 17,649,927 | |
| Sydney Airport unit | 3,215,206 | 16,648,284 | |
| TOTAL AUSTRALIA | 34,298,211 | ||
| Belgium - 0.5% | |||
| Anheuser-Busch InBev SA NV | 124,900 | 15,460,110 | |
| Bermuda - 2.8% | |||
| Axalta Coating Systems (a) | 542,400 | 15,442,128 | |
| China Gas Holdings Ltd. | 13,294,000 | 19,192,999 | |
| China Resource Gas Group Ltd. | 6,777,000 | 19,177,830 | |
| Credicorp Ltd. (United States) | 190,532 | 27,707,163 | |
| Markit Ltd. (a) | 378,200 | 13,195,398 | |
| TOTAL BERMUDA | 94,715,518 | ||
| Brazil - 4.7% | |||
| BB Seguridade Participacoes SA | 2,662,820 | 23,227,332 | |
| Cielo SA | 2,840,354 | 27,666,456 | |
| Kroton Educacional SA | 6,649,560 | 24,747,944 | |
| Qualicorp SA | 4,297,200 | 18,616,931 | |
| Smiles SA | 1,428,100 | 16,567,912 | |
| Ultrapar Participacoes SA | 1,214,800 | 25,579,942 | |
| Weg SA | 4,856,990 | 21,437,554 | |
| TOTAL BRAZIL | 157,844,071 | ||
| British Virgin Islands - 0.4% | |||
| Mail.Ru Group Ltd. GDR (Reg. S) (a) | 699,800 | 14,170,950 | |
| Cayman Islands - 9.4% | |||
| Alibaba Group Holding Ltd. sponsored ADR (a) | 715,800 | 55,073,652 | |
| Baidu.com, Inc. sponsored ADR (a) | 228,500 | 44,397,550 | |
| ENN Energy Holdings Ltd. | 2,956,000 | 14,418,302 | |
| Fu Shou Yuan International Group Ltd. (b) | 22,806,000 | 16,000,500 | |
| New Oriental Education & Technology Group, Inc. sponsored ADR | 481,400 | 18,851,624 | |
| Shenzhou International Group Holdings Ltd. | 3,742,000 | 19,344,370 | |
| Sino Biopharmaceutical Ltd. | 24,372,000 | 17,270,105 | |
| TAL Education Group ADR (a) | 291,200 | 16,848,832 | |
| Tencent Holdings Ltd. | 5,721,000 | 116,412,715 | |
| TOTAL CAYMAN ISLANDS | 318,617,650 | ||
| China - 2.6% | |||
| China Pacific Insurance (Group) Co. Ltd. (H Shares) | 6,272,000 | 21,992,431 | |
| Inner Mongoli Yili Industries Co. Ltd. | 6,626,208 | 15,383,246 | |
| Jiangsu Hengrui Medicine Co. Ltd. | 2,175,571 | 15,686,572 | |
| Kweichow Moutai Co. Ltd. | 493,792 | 19,159,653 | |
| Shanghai International Airport Co. Ltd. | 3,524,600 | 14,813,659 | |
| TOTAL CHINA | 87,035,561 | ||
| Denmark - 0.5% | |||
| Novo Nordisk A/S Series B sponsored ADR | 290,800 | 16,223,732 | |
| France - 0.5% | |||
| Dassault Systemes SA | 212,862 | 16,647,280 | |
| Germany - 1.0% | |||
| adidas AG | 130,300 | 16,799,922 | |
| Wirecard AG (b) | 413,963 | 17,877,224 | |
| TOTAL GERMANY | 34,677,146 | ||
| Hong Kong - 1.7% | |||
| AIA Group Ltd. | 3,067,000 | 18,354,787 | |
| Guangdong Investment Ltd. | 15,741,000 | 22,227,261 | |
| Techtronic Industries Co. Ltd. | 4,548,000 | 17,048,951 | |
| TOTAL HONG KONG | 57,630,999 | ||
| India - 13.5% | |||
| Adani Ports & Special Economic Zone | 6,242,535 | 22,385,557 | |
| Amara Raja Batteries Ltd. | 1,160,524 | 16,699,714 | |
| Asian Paints India Ltd. | 1,554,398 | 20,270,789 | |
| Bharti Infratel Ltd. | 3,098,742 | 17,491,375 | |
| Colgate-Palmolive (India) | 1,354,322 | 17,143,742 | |
| GlaxoSmithKline Consumer Healthcare Ltd. (a) | 200,035 | 17,760,144 | |
| HCL Technologies Ltd. | 1,831,903 | 20,692,006 | |
| HDFC Bank Ltd. (a) | 855,782 | 17,395,339 | |
| Hindustan Unilever Ltd. | 1,870,173 | 24,435,242 | |
| Housing Development Finance Corp. Ltd. | 2,451,311 | 40,167,247 | |
| IndusInd Bank Ltd. | 1,114,105 | 17,591,573 | |
| Infosys Ltd. | 2,637,820 | 47,917,757 | |
| ITC Ltd. | 5,606,750 | 27,427,922 | |
| LIC Housing Finance Ltd. (a) | 2,503,611 | 17,424,323 | |
| Lupin Ltd. | 753,518 | 18,232,333 | |
| Maruti Suzuki India Ltd. (a) | 385,100 | 21,999,378 | |
| Power Grid Corp. of India Ltd. | 7,639,726 | 16,492,713 | |
| Sun Pharmaceutical Industries Ltd. | 2,084,366 | 25,457,786 | |
| Tata Consultancy Services Ltd. | 901,167 | 34,398,069 | |
| Titan Co. Ltd. | 2,684,343 | 14,382,393 | |
| TOTAL INDIA | 455,765,402 | ||
| Indonesia - 3.8% | |||
| PT ACE Hardware Indonesia Tbk | 230,253,400 | 16,149,863 | |
| PT Bank Central Asia Tbk | 25,348,100 | 25,082,856 | |
| PT Bank Rakyat Indonesia Tbk | 27,241,900 | 21,379,562 | |
| PT Kalbe Farma Tbk | 158,104,300 | 16,484,184 | |
| PT Matahari Department Store Tbk | 13,334,600 | 19,211,207 | |
| PT Surya Citra Media Tbk | 74,367,300 | 18,044,841 | |
| PT Tower Bersama Infrastructure Tbk (a) | 30,089,100 | 13,518,192 | |
| TOTAL INDONESIA | 129,870,705 | ||
| Isle of Man - 0.4% | |||
| Playtech Ltd. | 1,074,286 | 12,628,180 | |
| Israel - 1.4% | |||
| Check Point Software Technologies Ltd. (a) | 190,200 | 15,761,874 | |
| Frutarom Industries Ltd. | 325,900 | 16,702,980 | |
| Teva Pharmaceutical Industries Ltd. sponsored ADR | 279,700 | 15,229,665 | |
| TOTAL ISRAEL | 47,694,519 | ||
| Kenya - 0.5% | |||
| Safaricom Ltd. | 98,651,000 | 16,702,298 | |
| Korea (South) - 5.5% | |||
| AMOREPACIFIC Corp. | 82,091 | 29,198,579 | |
| AMOREPACIFIC Group, Inc. | 148,868 | 21,829,772 | |
| Coway Co. Ltd. | 215,727 | 18,566,070 | |
| KT&G Corp. | 264,441 | 28,390,462 | |
| LG Chemical Ltd. | 102,407 | 26,547,563 | |
| LG Household & Health Care Ltd. | 29,661 | 26,070,768 | |
| NAVER Corp. | 58,652 | 34,658,524 | |
| TOTAL KOREA (SOUTH) | 185,261,738 | ||
| Luxembourg - 0.5% | |||
| Eurofins Scientific SA | 45,580 | 16,912,616 | |
| Mexico - 8.5% | |||
| Banregio Grupo Financiero S.A.B. de CV | 2,857,515 | 17,123,847 | |
| El Puerto de Liverpool S.A.B. de CV Class C | 1,481,500 | 16,840,619 | |
| Fomento Economico Mexicano S.A.B. de CV unit | 3,374,867 | 31,401,319 | |
| Gruma S.A.B. de CV Series B | 1,244,700 | 18,182,901 | |
| Grupo Aeroportuario del Pacifico S.A.B. de CV Series B | 2,124,857 | 20,020,129 | |
| Grupo Aeroportuario del Sureste S.A.B. de CV Series B | 1,327,960 | 20,393,342 | |
| Grupo Aeroportuario Norte S.A.B. de CV | 3,088,700 | 17,873,713 | |
| Grupo Financiero Banorte S.A.B. de CV Series O | 5,100,400 | 28,954,734 | |
| Grupo GICSA SA de CV (a) | 14,416,570 | 11,329,032 | |
| Infraestructura Energetica Nova S.A.B. de CV | 3,983,200 | 15,565,009 | |
| Kimberly-Clark de Mexico SA de CV Series A | 8,174,500 | 19,347,423 | |
| Megacable Holdings S.A.B. de CV unit | 3,931,052 | 18,153,353 | |
| Promotora y Operadora de Infraestructura S.A.B. de CV | 1,309,300 | 16,604,590 | |
| Tenedora Nemak SA de CV | 11,309,300 | 16,223,145 | |
| Wal-Mart de Mexico SA de CV Series V | 7,931,800 | 19,616,679 | |
| TOTAL MEXICO | 287,629,835 | ||
| Philippines - 3.9% | |||
| Ayala Corp. | 1,274,520 | 20,891,994 | |
| Ayala Land, Inc. | 28,090,400 | 20,693,789 | |
| D&L Industries, Inc. | 78,821,700 | 15,082,286 | |
| GT Capital Holdings, Inc. | 615,950 | 17,901,640 | |
| International Container Terminal Services, Inc. | 11,708,080 | 16,179,977 | |
| SM Investments Corp. | 973,692 | 19,542,155 | |
| SM Prime Holdings, Inc. | 41,003,500 | 19,745,493 | |
| TOTAL PHILIPPINES | 130,037,334 | ||
| Russia - 1.4% | |||
| Magnit OJSC (a) | 160,055 | 22,244,241 | |
| NOVATEK OAO GDR (Reg. S) | 254,100 | 24,393,600 | |
| TOTAL RUSSIA | 46,637,841 | ||
| South Africa - 6.8% | |||
| Aspen Pharmacare Holdings Ltd. | 1,138,890 | 26,840,050 | |
| Bidvest Group Ltd. | 951,498 | 24,148,308 | |
| Discovery Ltd. | 2,303,985 | 20,590,644 | |
| FirstRand Ltd. | 8,009,800 | 25,742,319 | |
| Mondi Ltd. | 998,966 | 19,191,600 | |
| Mr Price Group Ltd. | 1,614,588 | 20,510,068 | |
| Naspers Ltd. Class N | 492,512 | 67,577,618 | |
| Sanlam Ltd. | 5,124,900 | 24,841,018 | |
| TOTAL SOUTH AFRICA | 229,441,625 | ||
| Spain - 0.5% | |||
| Amadeus IT Holding SA Class A | 374,000 | 17,018,603 | |
| Switzerland - 0.5% | |||
| Sika AG | 3,880 | 16,514,167 | |
| Taiwan - 5.2% | |||
| Advantech Co. Ltd. | 2,284,000 | 16,120,856 | |
| ECLAT Textile Co. Ltd. | 1,660,288 | 18,939,917 | |
| Largan Precision Co. Ltd. | 283,000 | 19,887,007 | |
| Taiwan Semiconductor Manufacturing Co. Ltd. | 26,409,000 | 121,144,904 | |
| TOTAL TAIWAN | 176,092,684 | ||
| Thailand - 1.6% | |||
| Airports of Thailand PCL (For. Reg.) | 1,793,900 | 20,137,709 | |
| Bangkok Dusit Medical Services PCL (For. Reg.) | 25,512,600 | 17,388,313 | |
| Thai Beverage PCL | 29,095,600 | 16,117,948 | |
| TOTAL THAILAND | 53,643,970 | ||
| Turkey - 2.2% | |||
| Bim Birlesik Magazalar A/S JSC | 863,000 | 18,999,571 | |
| Koc Holding A/S | 3,962,000 | 20,716,247 | |
| Tofas Turk Otomobil Fabrikasi A/S | 2,131,847 | 16,868,868 | |
| Tupras Turkiye Petrol Rafinelleri A/S | 701,000 | 18,502,091 | |
| TOTAL TURKEY | 75,086,777 | ||
| United Arab Emirates - 0.5% | |||
| DP World Ltd. | 966,954 | 18,275,431 | |
| United Kingdom - 2.1% | |||
| British American Tobacco PLC (United Kingdom) | 271,100 | 16,529,533 | |
| Hikma Pharmaceuticals PLC | 620,223 | 19,973,504 | |
| NMC Health PLC | 1,068,200 | 16,341,581 | |
| Prudential PLC | 860,149 | 16,978,940 | |
| TOTAL UNITED KINGDOM | 69,823,558 | ||
| United States of America - 10.3% | |||
| A.O. Smith Corp. | 200,500 | 15,482,610 | |
| Alphabet, Inc. Class C | 19,645 | 13,614,181 | |
| Amazon.com, Inc. (a) | 27,400 | 18,072,766 | |
| Amphenol Corp. Class A | 253,700 | 14,164,071 | |
| China Biologic Products, Inc. (a) | 152,778 | 17,875,026 | |
| Danaher Corp. | 152,300 | 14,735,025 | |
| Ecolab, Inc. | 131,800 | 15,154,364 | |
| Facebook, Inc. Class A (a) | 129,400 | 15,214,852 | |
| Gartner, Inc. Class A (a) | 161,900 | 14,112,823 | |
| International Flavors & Fragrances, Inc. | 136,110 | 16,261,062 | |
| MasterCard, Inc. Class A | 159,200 | 15,440,808 | |
| McGraw Hill Financial, Inc. | 162,300 | 17,341,755 | |
| MercadoLibre, Inc. | 145,000 | 18,109,050 | |
| Mettler-Toledo International, Inc. (a) | 43,980 | 15,742,641 | |
| Moody's Corp. | 167,700 | 16,052,244 | |
| MSCI, Inc. Class A | 226,300 | 17,185,222 | |
| NIKE, Inc. Class B | 264,900 | 15,613,206 | |
| Philip Morris International, Inc. | 164,300 | 16,121,116 | |
| PPG Industries, Inc. | 138,156 | 15,251,041 | |
| The Walt Disney Co. | 143,200 | 14,786,832 | |
| TransDigm Group, Inc. (a) | 67,400 | 15,358,438 | |
| Visa, Inc. Class A | 194,800 | 15,046,352 | |
| TOTAL UNITED STATES OF AMERICA | 346,735,485 | ||
| TOTAL COMMON STOCKS | |||
| (Cost $2,853,955,571) | 3,211,086,428 | ||
| Nonconvertible Preferred Stocks - 3.6% | |||
| Brazil - 3.6% | |||
| Ambev SA sponsored ADR | 7,122,280 | 39,813,545 | |
| Banco Bradesco SA (PN) | 5,419,920 | 40,815,855 | |
| Itau Unibanco Holding SA | 4,422,300 | 42,265,320 | |
| TOTAL NONCONVERTIBLE PREFERRED STOCKS | |||
| (Cost $122,024,142) | 122,894,720 | ||
| Money Market Funds - 1.8% | |||
| Fidelity Cash Central Fund, 0.38% (c) | 40,807,246 | 40,807,246 | |
| Fidelity Securities Lending Cash Central Fund, 0.42% (c)(d) | 18,737,780 | 18,737,780 | |
| TOTAL MONEY MARKET FUNDS | |||
| (Cost $59,545,026) | 59,545,026 | ||
| TOTAL INVESTMENT PORTFOLIO - 100.5% | |||
| (Cost $3,035,524,739) | 3,393,526,174 | ||
| NET OTHER ASSETS (LIABILITIES) - (0.5)% | (17,164,414) | ||
| NET ASSETS - 100% | $3,376,361,760 |
Categorizations in the Schedule of Investments are based on country or territory of incorporation.
Legend
(a) Non-income producing
(b) Security or a portion of the security is on loan at period end.
(c) Affiliated fund that is generally available only to investment companies and other accounts managed by Fidelity Investments. The rate quoted is the annualized seven-day yield of the fund at period end. A complete unaudited listing of the fund's holdings as of its most recent quarter end is available upon request. In addition, each Fidelity Central Fund's financial statements are available on the SEC's website or upon request.
(d) Investment made with cash collateral received from securities on loan.
Affiliated Central Funds
Information regarding fiscal year to date income earned by the Fund from investments in Fidelity Central Funds is as follows:
| Fund | Income earned |
| Fidelity Cash Central Fund | $75,602 |
| Fidelity Securities Lending Cash Central Fund | 328,352 |
| Total | $403,954 |
Investment Valuation
The following is a summary of the inputs used, as of April 30, 2016, involving the Fund's assets and liabilities carried at fair value. The inputs or methodology used for valuing securities may not be an indication of the risk associated with investing in those securities. For more information on valuation inputs, and their aggregation into the levels used below, please refer to the Investment Valuation section in the accompanying Notes to Financial Statements.
| Valuation Inputs at Reporting Date: | ||||
| Description | Total | Level 1 | Level 2 | Level 3 |
| Investments in Securities: | ||||
| Equities: | ||||
| Consumer Discretionary | $478,150,199 | $425,756,378 | $52,393,821 | $-- |
| Consumer Staples | 460,633,916 | 444,104,383 | 16,529,533 | -- |
| Energy | 68,475,633 | 68,475,633 | -- | -- |
| Financials | 633,964,289 | 559,242,792 | 74,721,497 | -- |
| Health Care | 274,275,039 | 257,004,934 | 17,270,105 | -- |
| Industrials | 331,452,442 | 331,452,442 | -- | -- |
| Information Technology | 738,175,744 | 452,700,368 | 285,475,376 | -- |
| Materials | 194,067,907 | 194,067,907 | -- | -- |
| Telecommunication Services | 47,711,865 | 47,711,865 | -- | -- |
| Utilities | 107,074,114 | 32,057,722 | 75,016,392 | -- |
| Money Market Funds | 59,545,026 | 59,545,026 | -- | -- |
| Total Investments in Securities: | $3,393,526,174 | $2,872,119,450 | $521,406,724 | $-- |
The following is a summary of transfers between Level 1 and Level 2 for the period ended April 30, 2016. Transfers are assumed to have occurred at the beginning of the period, and are primarily attributable to the valuation techniques used for foreign equity securities, as discussed in the accompanying Notes to Financial Statements:
| Transfers | Total |
| Level 1 to Level 2 | $0 |
| Level 2 to Level 1 | $677,669,702 |
See accompanying notes which are an integral part of the financial statements.
Financial Statements
Statement of Assets and Liabilities
| April 30, 2016 (Unaudited) | ||
| Assets | ||
| Investment in securities, at value (including securities loaned of $17,887,433) — See accompanying schedule: Unaffiliated issuers (cost $2,975,979,713) | $3,333,981,148 | |
| Fidelity Central Funds (cost $59,545,026) | 59,545,026 | |
| Total Investments (cost $3,035,524,739) | $3,393,526,174 | |
| Foreign currency held at value (cost $1,000) | 558 | |
| Receivable for investments sold | 413,790 | |
| Receivable for fund shares sold | 5,018,549 | |
| Dividends receivable | 4,411,251 | |
| Distributions receivable from Fidelity Central Funds | 199,878 | |
| Prepaid expenses | 2,120 | |
| Other receivables | 1,830,965 | |
| Total assets | 3,405,403,285 | |
| Liabilities | ||
| Payable for fund shares redeemed | $7,317,521 | |
| Accrued management fee | 1,954,961 | |
| Other affiliated payables | 607,598 | |
| Other payables and accrued expenses | 423,665 | |
| Collateral on securities loaned, at value | 18,737,780 | |
| Total liabilities | 29,041,525 | |
| Net Assets | $3,376,361,760 | |
| Net Assets consist of: | ||
| Paid in capital | $3,461,571,887 | |
| Undistributed net investment income | 1,559,020 | |
| Accumulated undistributed net realized gain (loss) on investments and foreign currency transactions | (444,154,246) | |
| Net unrealized appreciation (depreciation) on investments and assets and liabilities in foreign currencies | 357,385,099 | |
| Net Assets | $3,376,361,760 | |
| Emerging Markets: | ||
| Net Asset Value, offering price and redemption price per share ($2,806,595,386 ÷ 124,804,753 shares) | $22.49 | |
| Class K: | ||
| Net Asset Value, offering price and redemption price per share ($569,766,374 ÷ 25,321,147 shares) | $22.50 |
See accompanying notes which are an integral part of the financial statements.
Statement of Operations
| Six months ended April 30, 2016 (Unaudited) | ||
| Investment Income | ||
| Dividends | $21,326,584 | |
| Interest | 209 | |
| Income from Fidelity Central Funds | 403,954 | |
| Income before foreign taxes withheld | 21,730,747 | |
| Less foreign taxes withheld | (2,263,836) | |
| Total income | 19,466,911 | |
| Expenses | ||
| Management fee | $11,276,881 | |
| Transfer agent fees | 3,228,698 | |
| Accounting and security lending fees | 699,469 | |
| Custodian fees and expenses | 691,002 | |
| Independent trustees' compensation | 7,020 | |
| Registration fees | 92,118 | |
| Audit | 70,629 | |
| Legal | 4,179 | |
| Interest | 7,392 | |
| Miscellaneous | 11,028 | |
| Total expenses before reductions | 16,088,416 | |
| Expense reductions | (46,079) | 16,042,337 |
| Net investment income (loss) | 3,424,574 | |
| Realized and Unrealized Gain (Loss) | ||
| Net realized gain (loss) on: | ||
| Investment securities: | ||
| Unaffiliated issuers | (182,579,350) | |
| Foreign currency transactions | (11,086) | |
| Total net realized gain (loss) | (182,590,436) | |
| Change in net unrealized appreciation (depreciation) on: Investment securities (net of decrease in deferred foreign taxes of $363,195) | 177,537,436 | |
| Assets and liabilities in foreign currencies | 46,114 | |
| Total change in net unrealized appreciation (depreciation) | 177,583,550 | |
| Net gain (loss) | (5,006,886) | |
| Net increase (decrease) in net assets resulting from operations | $(1,582,312) |
See accompanying notes which are an integral part of the financial statements.
Statement of Changes in Net Assets
| Six months ended April 30, 2016 (Unaudited) | Year ended October 31, 2015 | |
| Increase (Decrease) in Net Assets | ||
| Operations | ||
| Net investment income (loss) | $3,424,574 | $26,242,657 |
| Net realized gain (loss) | (182,590,436) | (231,739,571) |
| Change in net unrealized appreciation (depreciation) | 177,583,550 | (191,944,680) |
| Net increase (decrease) in net assets resulting from operations | (1,582,312) | (397,441,594) |
| Distributions to shareholders from net investment income | (17,361,594) | (18,114,621) |
| Distributions to shareholders from net realized gain | – | (2,942,055) |
| Total distributions | (17,361,594) | (21,056,676) |
| Share transactions - net increase (decrease) | 100,654,003 | 716,596,433 |
| Redemption fees | 1,677,235 | 519,430 |
| Total increase (decrease) in net assets | 83,387,332 | 298,617,593 |
| Net Assets | ||
| Beginning of period | 3,292,974,428 | 2,994,356,835 |
| End of period (including undistributed net investment income of $1,559,020 and undistributed net investment income of $15,496,040, respectively) | $3,376,361,760 | $3,292,974,428 |
See accompanying notes which are an integral part of the financial statements.
Financial Highlights — Fidelity Emerging Markets Fund
| Six months ended (Unaudited) April 30, | Years ended October 31, | |||||
| 2016 | 2015 | 2014 | 2013 | 2012 | 2011 | |
| Selected Per–Share Data | ||||||
| Net asset value, beginning of period | $22.55 | $25.44 | $24.43 | $22.15 | $22.23 | $25.72 |
| Income from Investment Operations | ||||||
| Net investment income (loss)A | .02 | .19 | .17 | .20 | .33 | .35 |
| Net realized and unrealized gain (loss) | .02B | (2.91) | .86 | 2.38 | (.11) | (3.48) |
| Total from investment operations | .04 | (2.72) | 1.03 | 2.58 | .22 | (3.13) |
| Distributions from net investment income | (.11) | (.14) | (.02) | (.30) | (.30) | (.24) |
| Distributions from net realized gain | – | (.03) | – | – | – | (.13) |
| Total distributions | (.11) | (.17) | (.02) | (.30) | (.30) | (.37) |
| Redemption fees added to paid in capitalA | .01 | –C | –C | –C | –C | .01 |
| Net asset value, end of period | $22.49 | $22.55 | $25.44 | $24.43 | $22.15 | $22.23 |
| Total ReturnD,E | .23% | (10.76)% | 4.22% | 11.78% | 1.03% | (12.33)% |
| Ratios to Average Net AssetsF,G | ||||||
| Expenses before reductions | 1.03%H | 1.05% | 1.07% | 1.08% | 1.09% | 1.07% |
| Expenses net of fee waivers, if any | 1.03%H | 1.05% | 1.07% | 1.08% | 1.09% | 1.07% |
| Expenses net of all reductions | 1.02%H | 1.03% | 1.07% | 1.03% | 1.03% | 1.01% |
| Net investment income (loss) | .18%H | .78% | .71% | .85% | 1.50% | 1.38% |
| Supplemental Data | ||||||
| Net assets, end of period (000 omitted) | $2,806,595 | $2,738,934 | $2,370,927 | $2,241,338 | $2,203,756 | $2,907,884 |
| Portfolio turnover rateI | 85%H | 107% | 94% | 119% | 176% | 122% |
A Calculated based on average shares outstanding during the period.
B The amount shown for a share outstanding does not correspond with the aggregate net gain (loss) on investments for the period due to the timing of sales and repurchases of shares in relation to fluctuating market values of the investments of the Fund.
C Amount represents less than $.005 per share.
D Total returns for periods of less than one year are not annualized.
E Total returns would have been lower if certain expenses had not been reduced during the applicable periods shown.
F Fees and expenses of any underlying Fidelity Central Funds are not included in the Fund's expense ratio. The Fund indirectly bears its proportionate share of the expenses of any underlying Fidelity Central Funds.
G Expense ratios reflect operating expenses of the class. Expenses before reductions do not reflect amounts reimbursed by the investment adviser or reductions from brokerage service arrangements or reductions from other expense offset arrangements and do not represent the amount paid by the class during periods when reimbursements or reductions occur. Expenses net of fee waivers reflect expenses after reimbursement by the investment adviser but prior to reductions from brokerage service arrangements or other expense offset arrangements. Expenses net of all reductions represent the net expenses paid by the class.
H Annualized
I Amount does not include the portfolio activity of any underlying Fidelity Central Funds.
See accompanying notes which are an integral part of the financial statements.
Financial Highlights — Fidelity Emerging Markets Fund Class K
| Six months ended (Unaudited) April 30, | Years ended October 31, | |||||
| 2016 | 2015 | 2014 | 2013 | 2012 | 2011 | |
| Selected Per–Share Data | ||||||
| Net asset value, beginning of period | $22.58 | $25.48 | $24.42 | $22.15 | $22.23 | $25.75 |
| Income from Investment Operations | ||||||
| Net investment income (loss)A | .04 | .24 | .23 | .25 | .37 | .40 |
| Net realized and unrealized gain (loss) | .02B | (2.92) | .86 | 2.38 | (.10) | (3.48) |
| Total from investment operations | .06 | (2.68) | 1.09 | 2.63 | .27 | (3.08) |
| Distributions from net investment income | (.15) | (.20) | (.03) | (.36) | (.35) | (.32) |
| Distributions from net realized gain | – | (.03) | – | – | – | (.13) |
| Total distributions | (.15) | (.22)C | (.03) | (.36) | (.35) | (.45) |
| Redemption fees added to paid in capitalA | .01 | –D | –D | –D | –D | .01 |
| Net asset value, end of period | $22.50 | $22.58 | $25.48 | $24.42 | $22.15 | $22.23 |
| Total ReturnE,F | .33% | (10.60)% | 4.47% | 12.01% | 1.25% | (12.17)% |
| Ratios to Average Net AssetsG,H | ||||||
| Expenses before reductions | .84%I | .85% | .86% | .87% | .87% | .87% |
| Expenses net of fee waivers, if any | .84%I | .85% | .85% | .87% | .87% | .87% |
| Expenses net of all reductions | .84%I | .83% | .85% | .82% | .81% | .80% |
| Net investment income (loss) | .36%I | .98% | .92% | 1.07% | 1.72% | 1.58% |
| Supplemental Data | ||||||
| Net assets, end of period (000 omitted) | $569,766 | $554,041 | $623,430 | $547,369 | $607,919 | $497,821 |
| Portfolio turnover rateJ | 85%I | 107% | 94% | 119% | 176% | 122% |
A Calculated based on average shares outstanding during the period.
B The amount shown for a share outstanding does not correspond with the aggregate net gain (loss) on investments for the period due to the timing of sales and repurchases of shares in relation to fluctuating market values of the investments of the Fund.
C Total distributions of $.22 per share is comprised of distributions from net investment income of $.195 and distributions from net realized gain of $.025 per share.
D Amount represents less than $.005 per share.
E Total returns for periods of less than one year are not annualized.
F Total returns would have been lower if certain expenses had not been reduced during the applicable periods shown.
G Fees and expenses of any underlying Fidelity Central Funds are not included in the Fund's expense ratio. The Fund indirectly bears its proportionate share of the expenses of any underlying Fidelity Central Funds.
H Expense ratios reflect operating expenses of the class. Expenses before reductions do not reflect amounts reimbursed by the investment adviser or reductions from brokerage service arrangements or reductions from other expense offset arrangements and do not represent the amount paid by the class during periods when reimbursements or reductions occur. Expenses net of fee waivers reflect expenses after reimbursement by the investment adviser but prior to reductions from brokerage service arrangements or other expense offset arrangements. Expenses net of all reductions represent the net expenses paid by the class.
I Annualized
J Amount does not include the portfolio activity of any underlying Fidelity Central Funds.
See accompanying notes which are an integral part of the financial statements.
Notes to Financial Statements (Unaudited)
For the period ended April 30, 2016
1. Organization.
Fidelity Emerging Markets Fund (the Fund) is a fund of Fidelity Investment Trust (the Trust) and is authorized to issue an unlimited number of shares. The Trust is registered under the Investment Company Act of 1940, as amended (the 1940 Act), as an open-end management investment company organized as a Massachusetts business trust. The Fund offers Emerging Markets and Class K shares, each of which has equal rights as to assets and voting privileges. Each class has exclusive voting rights with respect to matters that affect that class. The Fund's investments in emerging markets can be subject to social, economic, regulatory, and political uncertainties and can be extremely volatile.
2. Investments in Fidelity Central Funds.
The Fund invests in Fidelity Central Funds, which are open-end investment companies generally available only to other investment companies and accounts managed by the investment adviser and its affiliates. The Fund's Schedule of Investments lists each of the Fidelity Central Funds held as of period end, if any, as an investment of the Fund, but does not include the underlying holdings of each Fidelity Central Fund. As an Investing Fund, the Fund indirectly bears its proportionate share of the expenses of the underlying Fidelity Central Funds.
The Money Market Central Funds seek preservation of capital and current income and are managed by Fidelity Investments Money Management, Inc. (FIMM), an affiliate of the investment adviser. Annualized expenses of the Money Market Central Funds as of their most recent shareholder report date are less than .005%.
A complete unaudited list of holdings for each Fidelity Central Fund is available upon request or at the Securities and Exchange Commission (the SEC) website at www.sec.gov. In addition, the financial statements of the Fidelity Central Funds are available on the SEC website or upon request.
3. Significant Accounting Policies.
The financial statements have been prepared in conformity with accounting principles generally accepted in the United States of America (GAAP), which require management to make certain estimates and assumptions at the date of the financial statements. Actual results could differ from those estimates. Subsequent events, if any, through the date that the financial statements were issued have been evaluated in the preparation of the financial statements. The following summarizes the significant accounting policies of the Fund:
Investment Valuation. Investments are valued as of 4:00 p.m. Eastern time on the last calendar day of the period. The Board of Trustees (the Board) has delegated the day to day responsibility for the valuation of the Fund's investments to the Fidelity Management & Research Company (FMR) Fair Value Committee (the Committee). In accordance with valuation policies and procedures approved by the Board, the Fund attempts to obtain prices from one or more third party pricing vendors or brokers to value its investments. When current market prices, quotations or currency exchange rates are not readily available or reliable, investments will be fair valued in good faith by the Committee, in accordance with procedures adopted by the Board. Factors used in determining fair value vary by investment type and may include market or investment specific events. The frequency with which these procedures are used cannot be predicted and they may be utilized to a significant extent. The Committee oversees the Fund's valuation policies and procedures and reports to the Board on the Committee's activities and fair value determinations. The Board monitors the appropriateness of the procedures used in valuing the Fund's investments and ratifies the fair value determinations of the Committee.
The Fund categorizes the inputs to valuation techniques used to value its investments into a disclosure hierarchy consisting of three levels as shown below:
- Level 1 – quoted prices in active markets for identical investments
- Level 2 – other significant observable inputs (including quoted prices for similar investments, interest rates, prepayment speeds, etc.)
- Level 3 – unobservable inputs (including the Fund's own assumptions based on the best information available)
Valuation techniques used to value the Fund's investments by major category are as follows:
Equity securities, including restricted securities, for which market quotations are readily available, are valued at the last reported sale price or official closing price as reported by a third party pricing vendor on the primary market or exchange on which they are traded and are categorized as Level 1 in the hierarchy. In the event there were no sales during the day or closing prices are not available, securities are valued at the last quoted bid price or may be valued using the last available price and are generally categorized as Level 2 in the hierarchy. For foreign equity securities, when market or security specific events arise, comparisons to the valuation of American Depositary Receipts (ADRs), futures contracts, Exchange-Traded Funds (ETFs) and certain indexes as well as quoted prices for similar securities may be used and would be categorized as Level 2 in the hierarchy. Utilizing these techniques may result in transfers between Level 1 and Level 2. For equity securities, including restricted securities, where observable inputs are limited, assumptions about market activity and risk are used and these securities may be categorized as Level 3 in the hierarchy.
Investments in open-end mutual funds, including the Fidelity Central Funds, are valued at their closing net asset value (NAV) each business day and are categorized as Level 1 in the hierarchy.
Changes in valuation techniques may result in transfers in or out of an assigned level within the disclosure hierarchy. The aggregate value of investments by input level as of April 30, 2016, including information on transfers between Levels 1 and 2, is included at the end of the Fund's Schedule of Investments.
Foreign Currency. The Fund may use foreign currency contracts to facilitate transactions in foreign-denominated securities. Gains and losses from these transactions may arise from changes in the value of the foreign currency or if the counterparties do not perform under the contracts' terms.
Foreign-denominated assets, including investment securities, and liabilities are translated into U.S. dollars at the exchange rates at period end. Purchases and sales of investment securities, income and dividends received and expenses denominated in foreign currencies are translated into U.S. dollars at the exchange rate in effect on the transaction date.
The effects of exchange rate fluctuations on investments are included with the net realized and unrealized gain (loss) on investment securities. Other foreign currency transactions resulting in realized and unrealized gain (loss) are disclosed separately.
Investment Transactions and Income. For financial reporting purposes, the Fund's investment holdings and NAV include trades executed through the end of the last business day of the period. The NAV per share for processing shareholder transactions is calculated as of the close of business of the New York Stock Exchange (NYSE), normally 4:00 p.m. Eastern time and includes trades executed through the end of the prior business day. Gains and losses on securities sold are determined on the basis of identified cost and may include proceeds received from litigation. Dividend income is recorded on the ex-dividend date, except for certain dividends from foreign securities where the ex-dividend date may have passed, which are recorded as soon as the Fund is informed of the ex-dividend date. Non-cash dividends included in dividend income, if any, are recorded at the fair market value of the securities received. Income and capital gain distributions from Fidelity Central Funds, if any, are recorded on the ex-dividend date. Interest income is accrued as earned and includes coupon interest and amortization of premium and accretion of discount on debt securities as applicable. Investment income is recorded net of foreign taxes withheld where recovery of such taxes is uncertain.
Class Allocations and Expenses. Investment income, realized and unrealized capital gains and losses, common expenses of the Fund, and certain fund-level expense reductions, if any, are allocated daily on a pro-rata basis to each class based on the relative net assets of each class to the total net assets of the Fund. Each class differs with respect to transfer agent fees incurred. Certain expense reductions may also differ by class. For the reporting period, the allocated portion of income and expenses to each class as a percent of its average net assets may vary due to the timing of recording these transactions in relation to fluctuating net assets of the classes. Expenses directly attributable to a fund are charged to that fund. Expenses attributable to more than one fund are allocated among the respective funds on the basis of relative net assets or other appropriate methods. Expense estimates are accrued in the period to which they relate and adjustments are made when actual amounts are known.
Income Tax Information and Distributions to Shareholders. Each year, the Fund intends to qualify as a regulated investment company under Subchapter M of the Internal Revenue Code, including distributing substantially all of its taxable income and realized gains. As a result, no provision for U.S. Federal income taxes is required. The Fund files a U.S. federal tax return, in addition to state and local tax returns as required. The Fund's federal income tax returns are subject to examination by the Internal Revenue Service (IRS) for a period of three fiscal years after they are filed. State and local tax returns may be subject to examination for an additional fiscal year depending on the jurisdiction. Foreign taxes are provided for based on the Fund's understanding of the tax rules and rates that exist in the foreign markets in which it invests. The Fund is subject to a tax imposed on capital gains by certain countries in which it invests.
Distributions are declared and recorded on the ex-dividend date. Income dividends and capital gain distributions are declared separately for each class. Income and capital gain distributions are determined in accordance with income tax regulations, which may differ from GAAP.
Capital accounts within the financial statements are adjusted for permanent book-tax differences. These adjustments have no impact on net assets or the results of operations. Capital accounts are not adjusted for temporary book-tax differences which will reverse in a subsequent period.
Book-tax differences are primarily due to foreign currency transactions, certain foreign taxes, passive foreign investment companies (PFIC), deferred trustees compensation, capital loss carryforwards and losses deferred due to wash sales.
The federal tax cost of investment securities and unrealized appreciation (depreciation) as of period end were as follows:
| Gross unrealized appreciation | $457,105,971 |
| Gross unrealized depreciation | (137,734,879) |
| Net unrealized appreciation (depreciation) on securities | $319,371,092 |
| Tax cost | $3,074,155,082 |
Capital loss carryforwards are only available to offset future capital gains of the Fund to the extent provided by regulations and may be limited. Under the Regulated Investment Company Modernization Act of 2010 (the Act), the Fund is permitted to carry forward capital losses incurred in taxable years beginning after December 22, 2010 for an unlimited period and such capital losses are required to be used prior to any losses that expire. The capital loss carryforward information presented below, including any applicable limitation, is estimated as of prior fiscal period end and is subject to adjustment.
| Fiscal year of expiration | |
| 2017 | $(24,838,920) |
| No expiration | |
| Short-term | (189,293,193) |
| Long-term | (24,501,874) |
| Total no expiration | (213,795,067) |
| Total capital loss carryforward | $(238,633,987) |
Short-Term Trading (Redemption) Fees. Shares held by investors in the Fund less than 90 days may have been subject to a redemption fee equal to 1.50% of the NAV of shares redeemed. All redemption fees, which reduce the proceeds of the shareholder redemption, are retained by the Fund and accounted for as an addition to paid in capital.
4. Purchases and Sales of Investments.
Purchases and sales of securities, other than short-term securities, aggregated $1,445,739,072 and $1,365,772,666, respectively.
5. Fees and Other Transactions with Affiliates.
Management Fee. Fidelity Management & Research Company (the investment adviser) and its affiliates provide the Fund with investment management related services for which the Fund pays a monthly management fee. The management fee is the sum of an individual fund fee rate that is based on an annual rate of .45% of the Fund's average net assets and an annualized group fee rate that averaged .25% during the period. The group fee rate is based upon the average net assets of all the mutual funds advised by the investment adviser, including any mutual funds previously advised by the investment adviser that are currently advised by Fidelity SelectCo, LLC, an affiliate of the investment adviser. The group fee rate decreases as assets under management increase and increases as assets under management decrease. For the reporting period, the total annualized management fee rate was .70% of the Fund's average net assets.
Transfer Agent Fees. Fidelity Investments Institutional Operations Company, Inc., (FIIOC), an affiliate of the investment adviser, is the transfer, dividend disbursing and shareholder servicing agent for each class of the Fund. FIIOC receives account fees and asset-based fees that vary according to the account size and type of account of the shareholders of Emerging Markets. FIIOC receives an asset-based fee of Class K's average net assets. FIIOC pays for typesetting, printing and mailing of shareholder reports, except proxy statements.
For the period, transfer agent fees for each class were as follows:
| Amount | % of Class-Level Average Net Assets(a) | |
| Emerging Markets | $3,103,080 | .23 |
| Class K | 125,618 | .05 |
| $3,228,698 |
(a) Annualized
Accounting and Security Lending Fees. Fidelity Service Company, Inc. (FSC), an affiliate of the investment adviser, maintains the Fund's accounting records. The accounting fee is based on the level of average net assets for each month. Under a separate contract, FSC administers the security lending program. The security lending fee is based on the number and duration of lending transactions.
Brokerage Commissions. The Fund placed a portion of its portfolio transactions with brokerage firms which are affiliates of the investment adviser. Brokerage commissions are included in net realized gain (loss) and change in net unrealized appreciation (depreciation) in the Statement of Operations. The commissions paid to these affiliated firms were $5,446 for the period.
Interfund Lending Program. Pursuant to an Exemptive Order issued by the SEC, the Fund, along with other registered investment companies having management contracts with FMR or other affiliated entities of FMR, may participate in an interfund lending program. This program provides an alternative credit facility allowing the funds to borrow from, or lend money to, other participating affiliated funds. At period end, there were no interfund loans outstanding. The Fund's activity in this program during the period for which loans were outstanding was as follows:
| Borrower or Lender | Average Loan Balance | Weighted Average Interest Rate | Interest Expense |
| Borrower | $45,190,667 | .65% | $7,392 |
Interfund Trades. The Fund may purchase from or sell securities to other Fidelity Funds under procedures adopted by the Board. The procedures have been designed to ensure these interfund trades are executed in accordance with Rule 17a-7 of the 1940 Act. Interfund trades are included within the respective purchases and sales amounts shown in the Purchases and Sales of Investments note.
6. Committed Line of Credit.
The Fund participates with other funds managed by the investment adviser or an affiliate in a $4.25 billion credit facility (the "line of credit") to be utilized for temporary or emergency purposes to fund shareholder redemptions or for other short-term liquidity purposes. The Fund has agreed to pay commitment fees on its pro-rata portion of the line of credit, which amounted to $2,841 and is reflected in Miscellaneous expenses on the Statement of Operations. During the period, the Fund did not borrow on this line of credit.
7. Security Lending.
The Fund lends portfolio securities through a lending agent from time to time in order to earn additional income. For equity securities, a lending agent is used and may loan securities to certain qualified borrowers, including Fidelity Capital Markets (FCM), a broker-dealer affiliated with the Fund. On the settlement date of the loan, the Fund receives collateral (in the form of U.S. Treasury obligations, letters of credit and/or cash) against the loaned securities and maintains collateral in an amount not less than 100% of the market value of the loaned securities during the period of the loan. The market value of the loaned securities is determined at the close of business of the Fund and any additional required collateral is delivered to the Fund on the next business day. The Fund or borrower may terminate the loan at any time, and if the borrower defaults on its obligation to return the securities loaned because of insolvency or other reasons, the Fund may apply collateral received from the borrower against the obligation. The Fund may experience delays and costs in recovering the securities loaned. Any cash collateral received is invested in the Fidelity Securities Lending Cash Central Fund. The value of loaned securities and cash collateral at period end are disclosed on the Fund's Statement of Assets and Liabilities. Security lending income represents the income earned on investing cash collateral, less rebates paid to borrowers and any lending agent fees associated with the loan, plus any premium payments received for lending certain types of securities. Security lending income is presented in the Statement of Operations as a component of income from Fidelity Central Funds. Total security lending income during the period amounted to $328,352, including $978 from securities loaned to FCM.
8. Expense Reductions.
Commissions paid to certain brokers with whom the investment adviser, or its affiliates, places trades on behalf of the Fund include an amount in addition to trade execution, which may be rebated back to the Fund to offset certain expenses. This amount totaled $32,983 for the period. In addition, through arrangements with the Fund's custodian, credits realized as a result of certain uninvested cash balances were used to reduce the Fund's expenses. During the period, these credits reduced the Fund's custody expenses by $1,328.
In addition, during the period the investment adviser reimbursed and/or waived a portion of fund-level operating expenses in the amount of $11,768.
9. Distributions to Shareholders.
Distributions to shareholders of each class were as follows:
| Six months ended April 30, 2016 | Year ended October 31, 2015 | |
| From net investment income | ||
| Emerging Markets | $13,660,209 | $13,346,829 |
| Class K | 3,701,385 | 4,767,792 |
| Total | $17,361,594 | $18,114,621 |
| From net realized gain | ||
| Emerging Markets | $– | $2,332,143 |
| Class K | – | 609,912 |
| Total | $– | $2,942,055 |
10. Share Transactions.
Share transactions for each class were as follows and may contain automatic conversions between classes or exchanges between affiliated funds:
| Shares | Shares | Dollars | Dollars | |
| Six months ended April 30, 2016 | Year ended October 31, 2015 | Six months ended April 30, 2016 | Year ended October 31, 2015 | |
| Emerging Markets | ||||
| Shares sold | 29,103,318 | 55,410,811 | $613,674,115 | $1,332,719,199 |
| Reinvestment of distributions | 572,542 | 546,115 | 12,670,348 | 13,577,228 |
| Shares redeemed | (26,341,490) | (27,685,404) | (540,823,971) | (631,200,476) |
| Net increase (decrease) | 3,334,370 | 28,271,522 | $85,520,492 | $715,095,951 |
| Class K | ||||
| Shares sold | 3,504,590 | 8,915,876 | $73,202,280 | $215,741,410 |
| Reinvestment of distributions | 167,256 | 216,324 | 3,701,385 | 5,377,704 |
| Shares redeemed | (2,884,189) | (9,064,709) | (61,770,154) | (219,618,632) |
| Net increase (decrease) | 787,657 | 67,491 | $15,133,511 | $1,500,482 |
11. Other.
The Fund's organizational documents provide former and current trustees and officers with a limited indemnification against liabilities arising in connection with the performance of their duties to the Fund. In the normal course of business, the Fund may also enter into contracts that provide general indemnifications. The Fund's maximum exposure under these arrangements is unknown as this would be dependent on future claims that may be made against the Fund. The risk of material loss from such claims is considered remote.
At the end of the period, Strategic Advisers Emerging Markets Fund was the owner of record of approximately 14% of the total outstanding shares of the Fund.
Shareholder Expense Example
As a shareholder of the Fund, you incur two types of costs: (1) transaction costs, including redemption fees and (2) ongoing costs, including management fees and other Fund expenses. This Example is intended to help you understand your ongoing costs (in dollars) of investing in the Fund and to compare these costs with the ongoing costs of investing in other mutual funds.
The Example is based on an investment of $1,000 invested at the beginning of the period and held for the entire period (November 1, 2015 to April 30, 2016).
Actual Expenses
The first line of the accompanying table for each class of the Fund provides information about actual account values and actual expenses. You may use the information in this line, together with the amount you invested, to estimate the expenses that you paid over the period. Simply divide your account value by $1,000.00 (for example, an $8,600 account value divided by $1,000.00 = 8.6), then multiply the result by the number in the first line for a class of the Fund under the heading entitled "Expenses Paid During Period" to estimate the expenses you paid on your account during this period. A small balance maintenance fee of $12.00 that is charged once a year may apply for certain accounts with a value of less than $2,000. This fee is not included in the table below. If it was, the estimate of expenses you paid during the period would be higher, and your ending account value lower, by this amount. In addition, the Fund, as a shareholder in the underlying Fidelity Central Funds, will indirectly bear its pro-rata share of the fees and expenses incurred by the underlying Fidelity Central Funds. These fees and expenses are not included in the Fund's annualized expense ratio used to calculate the expense estimate in the table below.
Hypothetical Example for Comparison Purposes
The second line of the accompanying table for each class of the Fund provides information about hypothetical account values and hypothetical expenses based on a Class' actual expense ratio and an assumed rate of return of 5% per year before expenses, which is not the Class' actual return. The hypothetical account values and expenses may not be used to estimate the actual ending account balance or expenses you paid for the period. You may use this information to compare the ongoing costs of investing in the Fund and other funds. To do so, compare this 5% hypothetical example with the 5% hypothetical examples that appear in the shareholder reports of the other funds. A small balance maintenance fee of $12.00 that is charged once a year may apply for certain accounts with a value of less than $2,000. This fee is not included in the table below. If it was, the estimate of expenses you paid during the period would be higher, and your ending account value lower, by this amount. In addition, the Fund, as a shareholder in the underlying Fidelity Central Funds, will indirectly bear its pro-rata share of the fees and expenses incurred by the underlying Fidelity Central Funds. These fees and expenses are not included in the Fund's annualized expense ratio used to calculate the expense estimate in the table below.
Please note that the expenses shown in the table are meant to highlight your ongoing costs only and do not reflect any transaction costs. Therefore, the second line of the table is useful in comparing ongoing costs only, and will not help you determine the relative total costs of owning different funds. In addition, if these transactional costs were included, your costs would have been higher.
| Annualized Expense Ratio-A | Beginning Account Value November 1, 2015 | Ending Account Value April 30, 2016 | Expenses Paid During Period-B November 1, 2015 to April 30, 2016 | |
| Emerging Markets | 1.03% | |||
| Actual | $1,000.00 | $1,002.30 | $5.13 | |
| Hypothetical-C | $1,000.00 | $1,019.74 | $5.17 | |
| Class K | .84% | |||
| Actual | $1,000.00 | $1,003.30 | $4.18 | |
| Hypothetical-C | $1,000.00 | $1,020.69 | $4.22 |
A Annualized expense ratio reflects expenses net of applicable fee waivers.
B Expenses are equal to each Class' annualized expense ratio, multiplied by the average account value over the period, multiplied by 182/366 (to reflect the one-half year period).
C 5% return per year before expenses
![]()
Corporate Headquarters
245 Summer St.
Boston, MA 02210
www.fidelity.com
EMF-K-SANN-0616
1.863019.107
Fidelity Advisor® Europe Fund - Semi-Annual Report April 30, 2016 Class A, Class T, Class B and Class C are classes of Fidelity® Europe Fund |
|
Contents
To view a fund's proxy voting guidelines and proxy voting record for the 12-month period ended June 30, visit http://www.fidelity.com/proxyvotingresults or visit the Securities and Exchange Commission's (SEC) web site at http://www.sec.gov.
You may also call 1-877-208-0098 to request a free copy of the proxy voting guidelines.
Standard & Poor's, S&P and S&P 500 are registered service marks of The McGraw-Hill Companies, Inc. and have been licensed for use by Fidelity Distributors Corporation.
Other third-party marks appearing herein are the property of their respective owners.
All other marks appearing herein are registered or unregistered trademarks or service marks of FMR LLC or an affiliated company. © 2016 FMR LLC. All rights reserved.
This report and the financial statements contained herein are submitted for the general information of the shareholders of the Fund. This report is not authorized for distribution to prospective investors in the Fund unless preceded or accompanied by an effective prospectus.
A fund files its complete schedule of portfolio holdings with the SEC for the first and third quarters of each fiscal year on Form N-Q. Forms N-Q are available on the SEC’s web site at http://www.sec.gov. A fund's Forms N-Q may be reviewed and copied at the SEC’s Public Reference Room in Washington, DC. Information regarding the operation of the SEC's Public Reference Room may be obtained by calling 1-800-SEC-0330.
For a complete list of a fund's portfolio holdings, view the most recent holdings listing, semiannual report, or annual report on Fidelity's web site at http://www.fidelity.com, http://www.advisor.fidelity.com, or http://www.401k.com, as applicable.
NOT FDIC INSURED •MAY LOSE VALUE •NO BANK GUARANTEE
Neither the Fund nor Fidelity Distributors Corporation is a bank.
Investment Summary (Unaudited)
Geographic Diversification (% of fund's net assets)
| As of April 30, 2016 | ||
| United Kingdom | 25.5% | |
| Sweden | 15.9% | |
| Germany | 14.5% | |
| France | 9.1% | |
| Denmark | 6.2% | |
| Bailiwick of Jersey | 5.5% | |
| Isle of Man | 3.8% | |
| Spain | 3.2% | |
| Ireland | 3.0% | |
| Other* | 13.3% | |

* Includes Short-Term investments and Net Other Assets (Liabilities).
Percentages are based on country or territory of incorporation and are adjusted for the effect of futures contracts, if applicable.
| As of October 31, 2015 | ||
| United Kingdom | 30.9% | |
| Sweden | 16.5% | |
| France | 10.5% | |
| Germany | 9.4% | |
| Denmark | 6.6% | |
| Bailiwick of Jersey | 5.4% | |
| Isle of Man | 3.1% | |
| Spain | 2.8% | |
| Finland | 2.7% | |
| Other* | 12.1% | |

* Includes Short-Term investments and Net Other Assets (Liabilities).
Percentages are based on country or territory of incorporation and are adjusted for the effect of futures contracts, if applicable.
Asset Allocation as of April 30, 2016
| % of fund's net assets | % of fund's net assets 6 months ago | |
| Stocks | 98.3 | 99.7 |
| Short-Term Investments and Net Other Assets (Liabilities) | 1.7 | 0.3 |
Top Ten Stocks as of April 30, 2016
| % of fund's net assets | % of fund's net assets 6 months ago | |
| SAP AG (Germany, Software) | 3.5 | 0.0 |
| Getinge AB (B Shares) (Sweden, Health Care Equipment & Supplies) | 3.5 | 2.9 |
| Shire PLC (Bailiwick of Jersey, Pharmaceuticals) | 3.2 | 3.2 |
| William Hill PLC (United Kingdom, Hotels, Restaurants & Leisure) | 3.1 | 2.0 |
| Standard Chartered PLC (United Kingdom) (United Kingdom, Banks) | 3.0 | 2.9 |
| Bayer AG (Germany, Pharmaceuticals) | 2.8 | 2.4 |
| Prudential PLC (United Kingdom, Insurance) | 2.1 | 1.8 |
| LEG Immobilien AG (Germany, Real Estate Management & Development) | 2.0 | 1.5 |
| Optimal Payments PLC (Isle of Man, IT Services) | 2.0 | 1.5 |
| Svenska Cellulosa AB (SCA) (B Shares) (Sweden, Household Products) | 1.9 | 1.6 |
| 27.1 |
Market Sectors as of April 30, 2016
| % of fund's net assets | % of fund's net assets 6 months ago | |
| Financials | 24.6 | 31.6 |
| Industrials | 17.7 | 17.5 |
| Health Care | 17.3 | 19.8 |
| Consumer Discretionary | 16.7 | 16.8 |
| Information Technology | 13.4 | 5.4 |
| Consumer Staples | 3.8 | 3.0 |
| Materials | 1.9 | 4.3 |
| Energy | 1.6 | 0.0 |
| Utilities | 1.3 | 1.3 |
Percentages shown as 0.0% may reflect amounts less than 0.05%.
Investments April 30, 2016 (Unaudited)
Showing Percentage of Net Assets
| Common Stocks - 98.3% | |||
| Shares | Value | ||
| Austria - 1.2% | |||
| Andritz AG | 277,200 | $15,524,418 | |
| Bailiwick of Jersey - 5.5% | |||
| Shire PLC | 652,600 | 40,723,546 | |
| Wolseley PLC | 265,134 | 14,850,704 | |
| WPP PLC | 620,800 | 14,503,493 | |
| TOTAL BAILIWICK OF JERSEY | 70,077,743 | ||
| Bermuda - 2.2% | |||
| Vostok Emerging Finance Ltd. (depository receipt) (a)(b)(c) | 53,380,307 | 7,179,016 | |
| Vostok New Ventures Ltd. SDR (a) | 3,662,236 | 20,841,196 | |
| TOTAL BERMUDA | 28,020,212 | ||
| Denmark - 6.2% | |||
| Carlsberg A/S Series B | 241,500 | 23,519,470 | |
| DSV de Sammensluttede Vognmaend A/S | 236,000 | 9,930,612 | |
| Novozymes A/S Series B | 343,955 | 16,484,143 | |
| Scandinavian Tobacco Group A/S | 436,427 | 6,942,867 | |
| William Demant Holding A/S (a) | 210,000 | 21,582,535 | |
| TOTAL DENMARK | 78,459,627 | ||
| Finland - 2.2% | |||
| Amer Group PLC (A Shares) | 450,500 | 13,319,119 | |
| Valmet Corp. | 1,119,700 | 14,039,132 | |
| TOTAL FINLAND | 27,358,251 | ||
| France - 9.1% | |||
| Bollore Group | 3,447,549 | 13,658,751 | |
| Capgemini SA | 198,200 | 18,503,145 | |
| Eurazeo SA | 207,255 | 14,595,016 | |
| Havas SA | 2,857,100 | 23,908,285 | |
| Publicis Groupe SA | 230,946 | 17,090,748 | |
| Wendel SA | 146,000 | 16,868,190 | |
| Zodiac Aerospace | 454,600 | 10,658,051 | |
| TOTAL FRANCE | 115,282,186 | ||
| Germany - 14.5% | |||
| adidas AG | 140,700 | 18,140,821 | |
| Bayer AG | 308,000 | 35,532,047 | |
| Brenntag AG | 338,000 | 19,819,648 | |
| CompuGroup Medical AG | 259,600 | 10,195,846 | |
| Fresenius SE & Co. KGaA | 206,797 | 15,041,085 | |
| GEA Group AG | 332,091 | 15,396,760 | |
| LEG Immobilien AG | 270,421 | 25,022,458 | |
| SAP AG | 571,242 | 44,820,245 | |
| TOTAL GERMANY | 183,968,910 | ||
| Ireland - 3.0% | |||
| DCC PLC (United Kingdom) | 149,700 | 13,255,290 | |
| Ryanair Holdings PLC sponsored ADR | 137,767 | 11,152,239 | |
| United Drug PLC (United Kingdom) | 1,554,241 | 13,898,393 | |
| TOTAL IRELAND | 38,305,922 | ||
| Isle of Man - 3.8% | |||
| Optimal Payments PLC (a) | 4,443,710 | 24,751,037 | |
| Playtech Ltd. | 1,974,395 | 23,208,918 | |
| TOTAL ISLE OF MAN | 47,959,955 | ||
| Malta - 1.0% | |||
| Kambi Group PLC (a)(b) | 752,299 | 12,974,791 | |
| Netherlands - 1.8% | |||
| CSM NV (exchangeable) | 295,400 | 7,539,543 | |
| RELX NV | 929,903 | 15,604,430 | |
| TOTAL NETHERLANDS | 23,143,973 | ||
| Norway - 1.6% | |||
| TGS Nopec Geophysical Co. ASA | 1,199,700 | 20,069,871 | |
| Spain - 3.2% | |||
| Amadeus IT Holding SA Class A | 520,000 | 23,662,229 | |
| Red Electrica Corporacion SA | 180,600 | 16,123,886 | |
| TOTAL SPAIN | 39,786,115 | ||
| Sweden - 15.9% | |||
| Elekta AB (B Shares) (b) | 2,889,502 | 21,121,328 | |
| Getinge AB (B Shares) | 2,070,400 | 43,777,611 | |
| H&M Hennes & Mauritz AB (B Shares) | 653,350 | 23,228,016 | |
| Hemfosa Fastigheter AB (b) | 1,181,300 | 12,319,842 | |
| Hemfosa Fastigheter AB rights 5/10/16 (a)(b) | 1,181,300 | 426,598 | |
| Indutrade AB | 301,100 | 16,883,902 | |
| Kungsleden AB (b) | 1,999,100 | 13,753,933 | |
| Lundbergfoeretagen AB (b) | 94,092 | 5,109,741 | |
| Pandox AB | 781,300 | 13,260,924 | |
| Sandvik AB (b) | 1,121,100 | 11,503,545 | |
| Svenska Cellulosa AB (SCA) (B Shares) | 776,700 | 24,460,327 | |
| Svenska Handelsbanken AB (A Shares) | 1,135,800 | 15,151,746 | |
| TOTAL SWEDEN | 200,997,513 | ||
| Switzerland - 1.6% | |||
| Julius Baer Group Ltd. | 484,660 | 20,770,478 | |
| United Kingdom - 25.5% | |||
| Aldermore Group PLC (a) | 412,035 | 1,131,844 | |
| Big Yellow Group PLC | 1,014,100 | 11,942,923 | |
| Bunzl PLC | 672,658 | 20,040,398 | |
| CMC Markets PLC | 2,220,400 | 8,110,844 | |
| Compass Group PLC | 1,178,117 | 20,980,366 | |
| Dechra Pharmaceuticals PLC | 982,700 | 15,880,746 | |
| Diploma PLC | 1,298,700 | 13,880,911 | |
| International Personal Finance PLC | 4,993,203 | 19,523,611 | |
| Micro Focus International PLC | 611,300 | 13,657,043 | |
| Prudential PLC | 1,315,049 | 25,958,454 | |
| Rolls-Royce Group PLC | 1,344,192 | 13,149,423 | |
| Saga PLC | 2,083,300 | 6,380,253 | |
| Schroders PLC | 216,222 | 7,942,550 | |
| Senior Engineering Group PLC | 3,385,600 | 10,764,388 | |
| Shawbrook Group PLC | 2,658,100 | 11,131,208 | |
| Softcat PLC | 2,168,878 | 10,109,289 | |
| St. James's Place Capital PLC | 577,862 | 7,320,454 | |
| Standard Chartered PLC (United Kingdom) | 4,774,215 | 38,513,636 | |
| Unite Group PLC | 1,114,687 | 10,301,685 | |
| Virgin Money Holdings Uk PLC | 1,292,548 | 6,895,302 | |
| William Hill PLC | 8,566,773 | 39,141,723 | |
| Worldpay Group PLC (a) | 2,438,800 | 9,510,855 | |
| TOTAL UNITED KINGDOM | 322,267,906 | ||
| TOTAL COMMON STOCKS | |||
| (Cost $1,212,366,663) | 1,244,967,871 | ||
| Nonconvertible Preferred Stocks - 0.0% | |||
| United Kingdom - 0.0% | |||
| Rolls-Royce Group PLC | |||
| (Cost $139,439) | 95,437,632 | 139,449 | |
| Money Market Funds - 5.5% | |||
| Fidelity Cash Central Fund, 0.38% (d) | 19,143,324 | 19,143,324 | |
| Fidelity Securities Lending Cash Central Fund, 0.42% (d)(e) | 51,164,371 | 51,164,371 | |
| TOTAL MONEY MARKET FUNDS | |||
| (Cost $70,307,695) | 70,307,695 | ||
| TOTAL INVESTMENT PORTFOLIO - 103.8% | |||
| (Cost $1,282,813,797) | 1,315,415,015 | ||
| NET OTHER ASSETS (LIABILITIES) - (3.8)% | (48,637,843) | ||
| NET ASSETS - 100% | $1,266,777,172 |
Categorizations in the Schedule of Investments are based on country or territory of incorporation.
Legend
(a) Non-income producing
(b) Security or a portion of the security is on loan at period end.
(c) Affiliated company
(d) Affiliated fund that is generally available only to investment companies and other accounts managed by Fidelity Investments. The rate quoted is the annualized seven-day yield of the fund at period end. A complete unaudited listing of the fund's holdings as of its most recent quarter end is available upon request. In addition, each Fidelity Central Fund's financial statements are available on the SEC's website or upon request.
(e) Investment made with cash collateral received from securities on loan.
Affiliated Central Funds
Information regarding fiscal year to date income earned by the Fund from investments in Fidelity Central Funds is as follows:
| Fund | Income earned |
| Fidelity Cash Central Fund | $14,049 |
| Fidelity Securities Lending Cash Central Fund | 470,655 |
| Total | $484,704 |
Other Affiliated Issuers
An affiliated company is a company in which the Fund has ownership of at least 5% of the voting securities. Fiscal year to date transactions with companies which are or were affiliates are as follows:
| Affiliate | Value, beginning of period | Purchases | Sales Proceeds | Dividend Income | Value, end of period |
| Vostok Emerging Finance Ltd. (depository receipt) | $1,697,310 | $3,320,861 | $-- | $-- | $7,179,016 |
| Total | $1,697,310 | $3,320,861 | $-- | $-- | $7,179,016 |
Investment Valuation
The following is a summary of the inputs used, as of April 30, 2016, involving the Fund's assets and liabilities carried at fair value. The inputs or methodology used for valuing securities may not be an indication of the risk associated with investing in those securities. For more information on valuation inputs, and their aggregation into the levels used below, please refer to the Investment Valuation section in the accompanying Notes to Financial Statements.
| Valuation Inputs at Reporting Date: | ||||
| Description | Total | Level 1 | Level 2 | Level 3 |
| Investments in Securities: | ||||
| Equities: | ||||
| Consumer Discretionary | $212,152,716 | $159,578,109 | $52,574,607 | $-- |
| Consumer Staples | 47,979,797 | 47,979,797 | -- | -- |
| Energy | 20,069,871 | 20,069,871 | -- | -- |
| Financials | 314,133,845 | 252,253,167 | 61,880,678 | -- |
| Health Care | 217,753,137 | 177,029,591 | 40,723,546 | -- |
| Industrials | 224,647,621 | 209,796,917 | 14,850,704 | -- |
| Information Technology | 168,222,761 | 123,402,516 | 44,820,245 | -- |
| Materials | 24,023,686 | 24,023,686 | -- | -- |
| Utilities | 16,123,886 | 16,123,886 | -- | -- |
| Money Market Funds | 70,307,695 | 70,307,695 | -- | -- |
| Total Investments in Securities: | $1,315,415,015 | $1,100,565,235 | $214,849,780 | $-- |
The following is a summary of transfers between Level 1 and Level 2 for the period ended April 30, 2016. Transfers are assumed to have occurred at the beginning of the period, and are primarily attributable to the valuation techniques used for foreign equity securities, as discussed in the accompanying Notes to Financial Statements:
| Transfers | Total |
| Level 1 to Level 2 | $14,998,864 |
| Level 2 to Level 1 | $104,687,573 |
See accompanying notes which are an integral part of the financial statements.
Financial Statements
Statement of Assets and Liabilities
| April 30, 2016 (Unaudited) | ||
| Assets | ||
| Investment in securities, at value (including securities loaned of $47,749,257) — See accompanying schedule: Unaffiliated issuers (cost $1,205,694,084) | $1,237,928,304 | |
| Fidelity Central Funds (cost $70,307,695) | 70,307,695 | |
| Other affiliated issuers (cost $6,812,018) | 7,179,016 | |
| Total Investments (cost $1,282,813,797) | $1,315,415,015 | |
| Foreign currency held at value (cost $415,926) | 416,697 | |
| Receivable for investments sold | 16,944,779 | |
| Receivable for fund shares sold | 359,129 | |
| Dividends receivable | 6,058,099 | |
| Distributions receivable from Fidelity Central Funds | 118,618 | |
| Prepaid expenses | 1,099 | |
| Other receivables | 385,751 | |
| Total assets | 1,339,699,187 | |
| Liabilities | ||
| Payable for investments purchased | $15,172,992 | |
| Payable for fund shares redeemed | 5,402,754 | |
| Accrued management fee | 852,908 | |
| Distribution and service plan fees payable | 17,090 | |
| Other affiliated payables | 255,438 | |
| Other payables and accrued expenses | 56,462 | |
| Collateral on securities loaned, at value | 51,164,371 | |
| Total liabilities | 72,922,015 | |
| Net Assets | $1,266,777,172 | |
| Net Assets consist of: | ||
| Paid in capital | $1,471,111,712 | |
| Undistributed net investment income | 6,329,298 | |
| Accumulated undistributed net realized gain (loss) on investments and foreign currency transactions | (243,252,646) | |
| Net unrealized appreciation (depreciation) on investments and assets and liabilities in foreign currencies | 32,588,808 | |
| Net Assets | $1,266,777,172 | |
| Calculation of Maximum Offering Price | ||
| Class A: | ||
| Net Asset Value and redemption price per share ($20,856,215 ÷ 580,720 shares) | $35.91 | |
| Maximum offering price per share (100/94.25 of $35.91) | $38.10 | |
| Class T: | ||
| Net Asset Value and redemption price per share ($8,671,461 ÷ 241,352 shares) | $35.93 | |
| Maximum offering price per share (100/96.50 of $35.93) | $37.23 | |
| Class B: | ||
| Net Asset Value and offering price per share ($330,539 ÷ 9,203 shares)(a) | $35.92 | |
| Class C: | ||
| Net Asset Value and offering price per share ($10,556,892 ÷ 295,836 shares)(a) | $35.68 | |
| Europe: | ||
| Net Asset Value, offering price and redemption price per share ($1,220,777,096 ÷ 33,951,628 shares) | $35.96 | |
| Class I: | ||
| Net Asset Value, offering price and redemption price per share ($5,584,969 ÷ 155,274 shares) | $35.97 |
(a) Redemption price per share is equal to net asset value less any applicable contingent deferred sales charge.
See accompanying notes which are an integral part of the financial statements.
Statement of Operations
| Six months ended April 30, 2016 (Unaudited) | ||
| Investment Income | ||
| Dividends | $14,304,511 | |
| Income from Fidelity Central Funds | 484,704 | |
| Income before foreign taxes withheld | 14,789,215 | |
| Less foreign taxes withheld | (1,301,648) | |
| Total income | 13,487,567 | |
| Expenses | ||
| Management fee | ||
| Basic fee | $4,572,219 | |
| Performance adjustment | 720,162 | |
| Transfer agent fees | 1,275,395 | |
| Distribution and service plan fees | 103,701 | |
| Accounting and security lending fees | 300,640 | |
| Custodian fees and expenses | 58,646 | |
| Independent trustees' compensation | 2,980 | |
| Registration fees | 82,776 | |
| Audit | 51,983 | |
| Legal | 2,453 | |
| Interest | 1,158 | |
| Miscellaneous | 4,678 | |
| Total expenses before reductions | 7,176,791 | |
| Expense reductions | (17,200) | 7,159,591 |
| Net investment income (loss) | 6,327,976 | |
| Realized and Unrealized Gain (Loss) | ||
| Net realized gain (loss) on: | ||
| Investment securities: | ||
| Unaffiliated issuers | (9,336,540) | |
| Foreign currency transactions | 527,156 | |
| Total net realized gain (loss) | (8,809,384) | |
| Change in net unrealized appreciation (depreciation) on: Investment securities | (29,111,544) | |
| Assets and liabilities in foreign currencies | (229,593) | |
| Total change in net unrealized appreciation (depreciation) | (29,341,137) | |
| Net gain (loss) | (38,150,521) | |
| Net increase (decrease) in net assets resulting from operations | $(31,822,545) |
See accompanying notes which are an integral part of the financial statements.
Statement of Changes in Net Assets
| Six months ended April 30, 2016 (Unaudited) | Year ended October 31, 2015 | |
| Increase (Decrease) in Net Assets | ||
| Operations | ||
| Net investment income (loss) | $6,327,976 | $17,742,695 |
| Net realized gain (loss) | (8,809,384) | 56,856,298 |
| Change in net unrealized appreciation (depreciation) | (29,341,137) | (21,376,933) |
| Net increase (decrease) in net assets resulting from operations | (31,822,545) | 53,222,060 |
| Distributions to shareholders from net investment income | (15,981,681) | (31,603,696) |
| Distributions to shareholders from net realized gain | (5,885,187) | – |
| Total distributions | (21,866,868) | (31,603,696) |
| Share transactions - net increase (decrease) | (114,922,308) | 125,806,049 |
| Redemption fees | 7,934 | 48,244 |
| Total increase (decrease) in net assets | (168,603,787) | 147,472,657 |
| Net Assets | ||
| Beginning of period | 1,435,380,959 | 1,287,908,302 |
| End of period (including undistributed net investment income of $6,329,298 and undistributed net investment income of $15,983,003, respectively) | $1,266,777,172 | $1,435,380,959 |
See accompanying notes which are an integral part of the financial statements.
Financial Highlights — Fidelity Europe Fund Class A
| Six months ended (Unaudited) April 30, | Years ended October 31, | ||
| 2016 | 2015 | 2014 A | |
| Selected Per–Share Data | |||
| Net asset value, beginning of period | $37.06 | $36.24 | $39.45 |
| Income from Investment Operations | |||
| Net investment income (loss)B | .12 | .37 | .47 |
| Net realized and unrealized gain (loss) | (.83) | 1.29 | (3.68) |
| Total from investment operations | (.71) | 1.66 | (3.21) |
| Distributions from net investment income | (.29) | (.84) | – |
| Distributions from net realized gain | (.15) | – | – |
| Total distributions | (.44) | (.84) | – |
| Redemption fees added to paid in capitalB,C | – | – | – |
| Net asset value, end of period | $35.91 | $37.06 | $36.24 |
| Total ReturnD,E,F | (1.94)% | 4.63% | (8.14)% |
| Ratios to Average Net AssetsG,H | |||
| Expenses before reductions | 1.40%I | 1.33% | 1.35%I |
| Expenses net of fee waivers, if any | 1.39%I | 1.33% | 1.35%I |
| Expenses net of all reductions | 1.39%I | 1.31% | 1.35%I |
| Net investment income (loss) | .67%I | .98% | 1.94%I |
| Supplemental Data | |||
| Net assets, end of period (000 omitted) | $20,856 | $23,381 | $23,633 |
| Portfolio turnover rateJ | 43%I | 87% | 80%K |
A For the period March 18, 2014 (commencement of sale of shares) to October 31, 2014.
B Calculated based on average shares outstanding during the period.
C Amount represents less than $.005 per share.
D Total returns for periods of less than one year are not annualized.
E Total returns would have been lower if certain expenses had not been reduced during the applicable periods shown.
F Total returns do not include the effect of the sales charges.
G Fees and expenses of any underlying Fidelity Central Funds are not included in the Fund's expense ratio. The Fund indirectly bears its proportionate share of the expenses of any underlying Fidelity Central Funds.
H Expense ratios reflect operating expenses of the class. Expenses before reductions do not reflect amounts reimbursed by the investment adviser or reductions from brokerage service arrangements or reductions from other expense offset arrangements and do not represent the amount paid by the class during periods when reimbursements or reductions occur. Expenses net of fee waivers reflect expenses after reimbursement by the investment adviser but prior to reductions from brokerage service arrangements or other expense offset arrangements. Expenses net of all reductions represent the net expenses paid by the class.
I Annualized
J Amount does not include the portfolio activity of any underlying Fidelity Central Funds.
K The portfolio turnover rate does not include the assets acquired in the merger.
See accompanying notes which are an integral part of the financial statements.
Financial Highlights — Fidelity Europe Fund Class T
| Six months ended (Unaudited) April 30, | Years ended October 31, | ||
| 2016 | 2015 | 2014 A | |
| Selected Per–Share Data | |||
| Net asset value, beginning of period | $36.94 | $36.18 | $39.45 |
| Income from Investment Operations | |||
| Net investment income (loss)B | .06 | .26 | .40 |
| Net realized and unrealized gain (loss) | (.82) | 1.29 | (3.67) |
| Total from investment operations | (.76) | 1.55 | (3.27) |
| Distributions from net investment income | (.09) | (.79) | – |
| Distributions from net realized gain | (.15) | – | – |
| Total distributions | (.25)C | (.79) | – |
| Redemption fees added to paid in capitalB,D | – | – | – |
| Net asset value, end of period | $35.93 | $36.94 | $36.18 |
| Total ReturnE,F,G | (2.08)% | 4.33% | (8.29)% |
| Ratios to Average Net AssetsH,I | |||
| Expenses before reductions | 1.70%J | 1.61% | 1.62%J |
| Expenses net of fee waivers, if any | 1.70%J | 1.61% | 1.61%J |
| Expenses net of all reductions | 1.70%J | 1.59% | 1.61%J |
| Net investment income (loss) | .36%J | .70% | 1.68%J |
| Supplemental Data | |||
| Net assets, end of period (000 omitted) | $8,671 | $9,632 | $13,679 |
| Portfolio turnover rateK | 43%J | 87% | 80%L |
A For the period March 18, 2014 (commencement of sale of shares) to October 31, 2014.
B Calculated based on average shares outstanding during the period.
C Total distributions of $.25 per share is comprised of distributions from net investment income of $.092 and distributions from net realized gain of $.154 per share.
D Amount represents less than $.005 per share.
E Total returns for periods of less than one year are not annualized.
F Total returns would have been lower if certain expenses had not been reduced during the applicable periods shown.
G Total returns do not include the effect of the sales charges.
H Fees and expenses of any underlying Fidelity Central Funds are not included in the Fund's expense ratio. The Fund indirectly bears its proportionate share of the expenses of any underlying Fidelity Central Funds.
I Expense ratios reflect operating expenses of the class. Expenses before reductions do not reflect amounts reimbursed by the investment adviser or reductions from brokerage service arrangements or reductions from other expense offset arrangements and do not represent the amount paid by the class during periods when reimbursements or reductions occur. Expenses net of fee waivers reflect expenses after reimbursement by the investment adviser but prior to reductions from brokerage service arrangements or other expense offset arrangements. Expenses net of all reductions represent the net expenses paid by the class.
J Annualized
K Amount does not include the portfolio activity of any underlying Fidelity Central Funds.
L The portfolio turnover rate does not include the assets acquired in the merger.
See accompanying notes which are an integral part of the financial statements.
Financial Highlights — Fidelity Europe Fund Class B
| Six months ended (Unaudited) April 30, | Years ended October 31, | ||
| 2016 | 2015 | 2014 A | |
| Selected Per–Share Data | |||
| Net asset value, beginning of period | $36.77 | $36.07 | $39.45 |
| Income from Investment Operations | |||
| Net investment income (loss)B | (.02) | .06 | .28 |
| Net realized and unrealized gain (loss) | (.83) | 1.29 | (3.66) |
| Total from investment operations | (.85) | 1.35 | (3.38) |
| Distributions from net investment income | – | (.65) | – |
| Redemption fees added to paid in capitalB,C | – | – | – |
| Net asset value, end of period | $35.92 | $36.77 | $36.07 |
| Total ReturnD,E,F | (2.31)% | 3.78% | (8.57)% |
| Ratios to Average Net AssetsG,H | |||
| Expenses before reductions | 2.19%I | 2.15% | 2.11%I |
| Expenses net of fee waivers, if any | 2.19%I | 2.15% | 2.11%I |
| Expenses net of all reductions | 2.19%I | 2.13% | 2.11%I |
| Net investment income (loss) | (.12)%I | .16% | 1.19%I |
| Supplemental Data | |||
| Net assets, end of period (000 omitted) | $331 | $530 | $1,065 |
| Portfolio turnover rateJ | 43%I | 87% | 80%K |
A For the period March 18, 2014 (commencement of sale of shares) to October 31, 2014.
B Calculated based on average shares outstanding during the period.
C Amount represents less than $.005 per share.
D Total returns for periods of less than one year are not annualized.
E Total returns would have been lower if certain expenses had not been reduced during the applicable periods shown.
F Total returns do not include the effect of the contingent deferred sales charge.
G Fees and expenses of any underlying Fidelity Central Funds are not included in the Fund's expense ratio. The Fund indirectly bears its proportionate share of the expenses of any underlying Fidelity Central Funds.
H Expense ratios reflect operating expenses of the class. Expenses before reductions do not reflect amounts reimbursed by the investment adviser or reductions from brokerage service arrangements or reductions from other expense offset arrangements and do not represent the amount paid by the class during periods when reimbursements or reductions occur. Expenses net of fee waivers reflect expenses after reimbursement by the investment adviser but prior to reductions from brokerage service arrangements or other expense offset arrangements. Expenses net of all reductions represent the net expenses paid by the class.
I Annualized
J Amount does not include the portfolio activity of any underlying Fidelity Central Funds.
K The portfolio turnover rate does not include the assets acquired in the merger.
See accompanying notes which are an integral part of the financial statements.
Financial Highlights — Fidelity Europe Fund Class C
| Six months ended (Unaudited) April 30, | Years ended October 31, | ||
| 2016 | 2015 | 2014 A | |
| Selected Per–Share Data | |||
| Net asset value, beginning of period | $36.81 | $36.07 | $39.45 |
| Income from Investment Operations | |||
| Net investment income (loss)B | (.02) | .07 | .29 |
| Net realized and unrealized gain (loss) | (.83) | 1.29 | (3.67) |
| Total from investment operations | (.85) | 1.36 | (3.38) |
| Distributions from net investment income | (.12) | (.62) | – |
| Distributions from net realized gain | (.15) | – | – |
| Total distributions | (.28)C | (.62) | – |
| Redemption fees added to paid in capitalB,D | – | – | – |
| Net asset value, end of period | $35.68 | $36.81 | $36.07 |
| Total ReturnE,F,G | (2.33)% | 3.79% | (8.57)% |
| Ratios to Average Net AssetsH,I | |||
| Expenses before reductions | 2.18%J | 2.13% | 2.10%J |
| Expenses net of fee waivers, if any | 2.18%J | 2.13% | 2.10%J |
| Expenses net of all reductions | 2.18%J | 2.11% | 2.10%J |
| Net investment income (loss) | (.12)%J | .18% | 1.19%J |
| Supplemental Data | |||
| Net assets, end of period (000 omitted) | $10,557 | $11,151 | $6,818 |
| Portfolio turnover rateK | 43%J | 87% | 80%L |
A For the period March 18, 2014 (commencement of sale of shares) to October 31, 2014.
B Calculated based on average shares outstanding during the period.
C Total distributions of $.28 per share is comprised of distributions from net investment income of $.123 and distributions from net realized gain of $.154 per share.
D Amount represents less than $.005 per share.
E Total returns for periods of less than one year are not annualized.
F Total returns would have been lower if certain expenses had not been reduced during the applicable periods shown.
G Total returns do not include the effect of the contingent deferred sales charge.
H Fees and expenses of any underlying Fidelity Central Funds are not included in the Fund's expense ratio. The Fund indirectly bears its proportionate share of the expenses of any underlying Fidelity Central Funds.
I Expense ratios reflect operating expenses of the class. Expenses before reductions do not reflect amounts reimbursed by the investment adviser or reductions from brokerage service arrangements or reductions from other expense offset arrangements and do not represent the amount paid by the class during periods when reimbursements or reductions occur. Expenses net of fee waivers reflect expenses after reimbursement by the investment adviser but prior to reductions from brokerage service arrangements or other expense offset arrangements. Expenses net of all reductions represent the net expenses paid by the class.
J Annualized
K Amount does not include the portfolio activity of any underlying Fidelity Central Funds.
L The portfolio turnover rate does not include the assets acquired in the merger.
See accompanying notes which are an integral part of the financial statements.
Financial Highlights — Fidelity Europe Fund
| Six months ended (Unaudited) April 30, | Years ended October 31, | |||||
| 2016 | 2015 | 2014 | 2013 | 2012 | 2011 | |
| Selected Per–Share Data | ||||||
| Net asset value, beginning of period | $37.19 | $36.32 | $37.92 | $30.15 | $27.67 | $30.83 |
| Income from Investment Operations | ||||||
| Net investment income (loss)A | .17 | .48 | .94B | .61 | .64 | .48 |
| Net realized and unrealized gain (loss) | (.82) | 1.30 | (2.00) | 7.87 | 2.45 | (2.97) |
| Total from investment operations | (.65) | 1.78 | (1.06) | 8.48 | 3.09 | (2.49) |
| Distributions from net investment income | (.43) | (.91) | (.52) | (.70) | (.60) | (.67) |
| Distributions from net realized gain | (.15) | – | (.02) | (.01) | (.02) | – |
| Total distributions | (.58) | (.91) | (.54) | (.71) | (.61)C | (.67) |
| Redemption fees added to paid in capitalA,D | – | – | – | – | – | – |
| Net asset value, end of period | $35.96 | $37.19 | $36.32 | $37.92 | $30.15 | $27.67 |
| Total ReturnE,F | (1.78)% | 4.97% | (2.82)% | 28.71% | 11.53% | (8.32)% |
| Ratios to Average Net AssetsG,H | ||||||
| Expenses before reductions | 1.08%I | 1.03% | .97% | 1.06% | .83% | 1.10% |
| Expenses net of fee waivers, if any | 1.08%I | 1.03% | .97% | 1.05% | .83% | 1.10% |
| Expenses net of all reductions | 1.08%I | 1.01% | .96% | 1.02% | .80% | 1.06% |
| Net investment income (loss) | .99%I | 1.28% | 2.43%B | 1.82% | 2.33% | 1.56% |
| Supplemental Data | ||||||
| Net assets, end of period (000 omitted) | $1,220,777 | $1,384,134 | $1,237,047 | $957,048 | $602,520 | $621,778 |
| Portfolio turnover rateJ | 43%I | 87% | 80%K | 59% | 127% | 117% |
A Calculated based on average shares outstanding during the period.
B Net Investment income per share reflects a large, non-recurring dividend which amounted to $.19 per share. Excluding this non-recurring dividend, the ratio of net investment income (loss) to average net assets would have been 1.93%.
C Total distributions of $.61 per share is comprised of distributions from net investment income of $.595 and distributions from net realized gain of $.017 per share.
D Amount represents less than $.005 per share.
E Total returns for periods of less than one year are not annualized.
F Total returns would have been lower if certain expenses had not been reduced during the applicable periods shown.
G Fees and expenses of any underlying Fidelity Central Funds are not included in the Fund's expense ratio. The Fund indirectly bears its proportionate share of the expenses of any underlying Fidelity Central Funds.
H Expense ratios reflect operating expenses of the class. Expenses before reductions do not reflect amounts reimbursed by the investment adviser or reductions from brokerage service arrangements or reductions from other expense offset arrangements and do not represent the amount paid by the class during periods when reimbursements or reductions occur. Expenses net of fee waivers reflect expenses after reimbursement by the investment adviser but prior to reductions from brokerage service arrangements or other expense offset arrangements. Expenses net of all reductions represent the net expenses paid by the class.
I Annualized
J Amount does not include the portfolio activity of any underlying Fidelity Central Funds.
K The portfolio turnover rate does not include the assets acquired in the merger.
See accompanying notes which are an integral part of the financial statements.
Financial Highlights — Fidelity Europe Fund Class I
| Six months ended (Unaudited) April 30, | Years ended October 31, | ||
| 2016 | 2015 | 2014 A | |
| Selected Per–Share Data | |||
| Net asset value, beginning of period | $37.21 | $36.32 | $39.45 |
| Income from Investment Operations | |||
| Net investment income (loss)B | .18 | .50 | .56 |
| Net realized and unrealized gain (loss) | (.82) | 1.30 | (3.69) |
| Total from investment operations | (.64) | 1.80 | (3.13) |
| Distributions from net investment income | (.45) | (.91) | – |
| Distributions from net realized gain | (.15) | – | – |
| Total distributions | (.60) | (.91) | – |
| Redemption fees added to paid in capitalB,C | – | – | – |
| Net asset value, end of period | $35.97 | $37.21 | $36.32 |
| Total ReturnD,E | (1.75)% | 5.02% | (7.93)% |
| Ratios to Average Net AssetsF,G | |||
| Expenses before reductions | 1.02%H | .98% | .97%H |
| Expenses net of fee waivers, if any | 1.02%H | .98% | .97%H |
| Expenses net of all reductions | 1.02%H | .96% | .96%H |
| Net investment income (loss) | 1.05%H | 1.33% | 2.33%H |
| Supplemental Data | |||
| Net assets, end of period (000 omitted) | $5,585 | $6,552 | $5,666 |
| Portfolio turnover rateI | 43%H | 87% | 80%J |
A For the period March 18, 2014 (commencement of sale of shares) to October 31, 2014.
B Calculated based on average shares outstanding during the period.
C Amount represents less than $.005 per share.
D Total returns for periods of less than one year are not annualized.
E Total returns would have been lower if certain expenses had not been reduced during the applicable periods shown.
F Fees and expenses of any underlying Fidelity Central Funds are not included in the Fund's expense ratio. The Fund indirectly bears its proportionate share of the expenses of any underlying Fidelity Central Funds.
G Expense ratios reflect operating expenses of the class. Expenses before reductions do not reflect amounts reimbursed by the investment adviser or reductions from brokerage service arrangements or reductions from other expense offset arrangements and do not represent the amount paid by the class during periods when reimbursements or reductions occur. Expenses net of fee waivers reflect expenses after reimbursement by the investment adviser but prior to reductions from brokerage service arrangements or other expense offset arrangements. Expenses net of all reductions represent the net expenses paid by the class.
H Annualized
I Amount does not include the portfolio activity of any underlying Fidelity Central Funds.
J The portfolio turnover rate does not include the assets acquired in the merger.
See accompanying notes which are an integral part of the financial statements.
Notes to Financial Statements (Unaudited)
For the period ended April 30, 2016
1. Organization.
Fidelity Europe Fund (the Fund) is a fund of Fidelity Investment Trust (the Trust) and is authorized to issue an unlimited number of shares. The Trust is registered under the Investment Company Act of 1940, as amended (the 1940 Act), as an open-end management investment company organized as a Massachusetts business trust. The Fund offers Class A, Class T, Class C, Europe and Class I shares, each of which, along with Class B shares, has equal rights as to assets and voting privileges. Class B shares are closed to new accounts and additional purchases, except for exchanges and reinvestments. Each class has exclusive voting rights with respect to matters that affect that class. Class B shares will automatically convert to Class A shares after a holding period of seven years from the initial date of purchase.
During the period, the Board of Trustees approved the conversion of all existing Class B shares into Class A shares, effective on or about July 1, 2016, regardless of the length of times shares have been held.
2. Investments in Fidelity Central Funds.
The Fund invests in Fidelity Central Funds, which are open-end investment companies generally available only to other investment companies and accounts managed by the investment adviser and its affiliates. The Fund's Schedule of Investments lists each of the Fidelity Central Funds held as of period end, if any, as an investment of the Fund, but does not include the underlying holdings of each Fidelity Central Fund. As an Investing Fund, the Fund indirectly bears its proportionate share of the expenses of the underlying Fidelity Central Funds.
The Money Market Central Funds seek preservation of capital and current income and are managed by Fidelity Investments Money Management, Inc. (FIMM), an affiliate of the investment adviser. Annualized expenses of the Money Market Central Funds as of their most recent shareholder report date are less than .005%.
A complete unaudited list of holdings for each Fidelity Central Fund is available upon request or at the Securities and Exchange Commission (the SEC) website at www.sec.gov. In addition, the financial statements of the Fidelity Central Funds are available on the SEC website or upon request.
3. Significant Accounting Policies.
The financial statements have been prepared in conformity with accounting principles generally accepted in the United States of America (GAAP), which require management to make certain estimates and assumptions at the date of the financial statements. Actual results could differ from those estimates. Subsequent events, if any, through the date that the financial statements were issued have been evaluated in the preparation of the financial statements. The following summarizes the significant accounting policies of the Fund:
Investment Valuation. Investments are valued as of 4:00 p.m. Eastern time on the last calendar day of the period. The Board of Trustees (the Board) has delegated the day to day responsibility for the valuation of the Fund's investments to the Fidelity Management & Research Company (FMR) Fair Value Committee (the Committee). In accordance with valuation policies and procedures approved by the Board, the Fund attempts to obtain prices from one or more third party pricing vendors or brokers to value its investments. When current market prices, quotations or currency exchange rates are not readily available or reliable, investments will be fair valued in good faith by the Committee, in accordance with procedures adopted by the Board. Factors used in determining fair value vary by investment type and may include market or investment specific events. The frequency with which these procedures are used cannot be predicted and they may be utilized to a significant extent. The Committee oversees the Fund's valuation policies and procedures and reports to the Board on the Committee's activities and fair value determinations. The Board monitors the appropriateness of the procedures used in valuing the Fund's investments and ratifies the fair value determinations of the Committee.
The Fund categorizes the inputs to valuation techniques used to value its investments into a disclosure hierarchy consisting of three levels as shown below:
- Level 1 – quoted prices in active markets for identical investments
- Level 2 – other significant observable inputs (including quoted prices for similar investments, interest rates, prepayment speeds, etc.)
- Level 3 – unobservable inputs (including the Fund's own assumptions based on the best information available)
Valuation techniques used to value the Fund's investments by major category are as follows:
Equity securities, including restricted securities, for which market quotations are readily available, are valued at the last reported sale price or official closing price as reported by a third party pricing vendor on the primary market or exchange on which they are traded and are categorized as Level 1 in the hierarchy. In the event there were no sales during the day or closing prices are not available, securities are valued at the last quoted bid price or may be valued using the last available price and are generally categorized as Level 2 in the hierarchy. For foreign equity securities, when market or security specific events arise, comparisons to the valuation of American Depositary Receipts (ADRs), futures contracts, Exchange-Traded Funds (ETFs) and certain indexes as well as quoted prices for similar securities may be used and would be categorized as Level 2 in the hierarchy. Utilizing these techniques may result in transfers between Level 1 and Level 2. For equity securities, including restricted securities, where observable inputs are limited, assumptions about market activity and risk are used and these securities may be categorized as Level 3 in the hierarchy.
Investments in open-end mutual funds, including the Fidelity Central Funds, are valued at their closing net asset value (NAV) each business day and are categorized as Level 1 in the hierarchy.
Changes in valuation techniques may result in transfers in or out of an assigned level within the disclosure hierarchy. The aggregate value of investments by input level as of April 30, 2016, including information on transfers between Levels 1 and 2, is included at the end of the Fund's Schedule of Investments.
Foreign Currency. The Fund may use foreign currency contracts to facilitate transactions in foreign-denominated securities. Gains and losses from these transactions may arise from changes in the value of the foreign currency or if the counterparties do not perform under the contracts' terms.
Foreign-denominated assets, including investment securities, and liabilities are translated into U.S. dollars at the exchange rates at period end. Purchases and sales of investment securities, income and dividends received and expenses denominated in foreign currencies are translated into U.S. dollars at the exchange rate in effect on the transaction date.
The effects of exchange rate fluctuations on investments are included with the net realized and unrealized gain (loss) on investment securities. Other foreign currency transactions resulting in realized and unrealized gain (loss) are disclosed separately.
Investment Transactions and Income. For financial reporting purposes, the Fund's investment holdings and NAV include trades executed through the end of the last business day of the period. The NAV per share for processing shareholder transactions is calculated as of the close of business of the New York Stock Exchange (NYSE), normally 4:00 p.m. Eastern time and includes trades executed through the end of the prior business day. Gains and losses on securities sold are determined on the basis of identified cost. Dividend income is recorded on the ex-dividend date, except for certain dividends from foreign securities where the ex-dividend date may have passed, which are recorded as soon as the Fund is informed of the ex-dividend date. Non-cash dividends included in dividend income, if any, are recorded at the fair market value of the securities received. Income and capital gain distributions from Fidelity Central Funds, if any, are recorded on the ex-dividend date. Interest income is accrued as earned and includes coupon interest and amortization of premium and accretion of discount on debt securities as applicable. Investment income is recorded net of foreign taxes withheld where recovery of such taxes is uncertain.
Class Allocations and Expenses. Investment income, realized and unrealized capital gains and losses, common expenses of the Fund, and certain fund-level expense reductions, if any, are allocated daily on a pro-rata basis to each class based on the relative net assets of each class to the total net assets of the Fund. Each class differs with respect to transfer agent and distribution and service plan fees incurred. Certain expense reductions may also differ by class. For the reporting period, the allocated portion of income and expenses to each class as a percent of its average net assets may vary due to the timing of recording these transactions in relation to fluctuating net assets of the classes. Expenses directly attributable to a fund are charged to that fund. Expenses attributable to more than one fund are allocated among the respective funds on the basis of relative net assets or other appropriate methods. Expense estimates are accrued in the period to which they relate and adjustments are made when actual amounts are known.
Income Tax Information and Distributions to Shareholders. Each year, the Fund intends to qualify as a regulated investment company under Subchapter M of the Internal Revenue Code, including distributing substantially all of its taxable income and realized gains. As a result, no provision for U.S. Federal income taxes is required. The Fund files a U.S. federal tax return, in addition to state and local tax returns as required. The Fund's federal income tax returns are subject to examination by the Internal Revenue Service (IRS) for a period of three fiscal years after they are filed. State and local tax returns may be subject to examination for an additional fiscal year depending on the jurisdiction. Foreign taxes are provided for based on the Fund's understanding of the tax rules and rates that exist in the foreign markets in which it invests.
Distributions are declared and recorded on the ex-dividend date. Income dividends and capital gain distributions are declared separately for each class. Income and capital gain distributions are determined in accordance with income tax regulations, which may differ from GAAP.
Capital accounts within the financial statements are adjusted for permanent book-tax differences. These adjustments have no impact on net assets or the results of operations. Capital accounts are not adjusted for temporary book-tax differences which will reverse in a subsequent period.
Book-tax differences are primarily due to foreign currency transactions, passive foreign investment companies (PFIC), deferred trustees compensation, expiring capital loss carryforwards, capital loss carryforwards and losses deferred due to wash sales.
The federal tax cost of investment securities and unrealized appreciation (depreciation) as of period end were as follows:
| Gross unrealized appreciation | $129,342,669 |
| Gross unrealized depreciation | (101,437,512) |
| Net unrealized appreciation (depreciation) on securities | 27,905,157 |
| Tax cost | $1,287,509,858 |
Capital loss carryforwards are only available to offset future capital gains of the Fund to the extent provided by regulations and may be limited. Under the Regulated Investment Company Modernization Act of 2010 (the Act), the Fund is permitted to carry forward capital losses incurred in taxable years beginning after December 22, 2010 for an unlimited period and such capital losses are required to be used prior to any losses that expire. The capital loss carryforward information presented below, including any applicable limitation, is estimated as of prior fiscal period end and is subject to adjustment.
| Fiscal year of expiration | |
| 2016 | $(29,326,707) |
| 2017 | (199,044,876) |
| Total capital loss carryforward | $(228,371,583) |
The Fund acquired $27,783,139 of its capital loss carryforward as part of a merger in a prior period. The losses acquired that will be available to offset future capital gains of the Fund will be limited to approximately $13,187,073 per year.
In addition, due to large redemptions in a prior period, $199,044,876 of capital losses that existed in the Fund prior to the mergers will be limited to approximately $32,029,274 per year.
Short-Term Trading (Redemption) Fees. Shares held by investors in the Fund less than 30 days may have been subject to a redemption fee equal to 1.00% of the NAV of shares redeemed. All redemption fees, which reduce the proceeds of the shareholder redemption, are retained by the Fund and accounted for as an addition to paid in capital.
4. Purchases and Sales of Investments.
Purchases and sales of securities, other than short-term securities, aggregated $283,545,193 and $431,225,868, respectively.
5. Fees and Other Transactions with Affiliates.
Management Fee. Fidelity Management & Research Company (the investment adviser) and its affiliates provide the Fund with investment management related services for which the Fund pays a monthly management fee. The management fee is the sum of an individual fund fee rate that is based on an annual rate of .45% of the Fund's average net assets and an annualized group fee rate that averaged .25% during the period. The group fee rate is based upon the average net assets of all the mutual funds advised by the investment adviser, including any mutual funds previously advised by the investment adviser that are currently advised by Fidelity SelectCo, LLC, an affiliate of the investment adviser. The group fee rate decreases as assets under management increase and increases as assets under management decrease. In addition, the management fee is subject to a performance adjustment (up to a maximum of +/- .20% of the Fund's average net assets over a 36 month performance period). The upward or downward adjustment to the management fee is based on the relative investment performance of Europe as compared to its benchmark index, the MSCI Europe Index, over the same 36 month performance period. For the reporting period, the total annualized management fee rate, including the performance adjustment, was .81% of the Fund's average net assets. The performance adjustment included in the management fee rate may be higher or lower than the maximum performance adjustment rate due to the difference between the average net assets for the reporting and performance periods.
Distribution and Service Plan Fees. In accordance with Rule 12b-1 of the 1940 Act, the Fund has adopted separate Distribution and Service Plans for each class of shares. Certain classes pay Fidelity Distributors Corporation (FDC), an affiliate of the investment adviser, separate Distribution and Service Fees, each of which is based on an annual percentage of each class' average net assets. In addition, FDC may pay financial intermediaries for selling shares of the Fund and providing shareholder support services. For the period, the Distribution and Service Fee rates, total fees and amounts retained by FDC were as follows:
| Distribution Fee | Service Fee | Total Fees | Retained by FDC | |
| Class A | -% | .25% | $26,590 | $886 |
| Class T | .25% | .25% | 21,666 | – |
| Class B | .75% | .25% | 2,040 | 1,569 |
| Class C | .75% | .25% | 53,405 | 15,830 |
| $103,701 | $18,285 |
Sales Load. FDC may receive a front-end sales charge of up to 5.75% for selling Class A shares and 3.50% for selling Class T shares, some of which is paid to financial intermediaries for selling shares of the Fund. Depending on the holding period, FDC may receive contingent deferred sales charges levied on Class A, Class T, Class B, and Class C redemptions. The deferred sales charges range from 5.00% to 1.00% for Class B shares, 1.00% for Class C shares, 1.00% for certain purchases of Class A shares and .25% for certain purchases of Class T shares.
For the period, sales charge amounts retained by FDC were as follows:
| Retained by FDC | |
| Class A | $10,882 |
| Class T | 686 |
| Class B(a) | 121 |
| Class C(a) | 2,570 |
| $14,259 |
(a) When Class B and Class C shares are initially sold, FDC pays commissions from its own resources to financial intermediaries through which the sales are made.
Transfer Agent Fees. Fidelity Investments Institutional Operations Company, Inc., (FIIOC), an affiliate of the investment adviser, is the transfer, dividend disbursing and shareholder servicing agent for each class of the Fund. FIIOC receives account fees and asset-based fees that vary according to the account size and type of account of the shareholders of the respective classes of the Fund. FIIOC pays for typesetting, printing and mailing of shareholder reports, except proxy statements.
For the period, transfer agent fees for each class were as follows:
| Amount | % of Class-Level Average Net Assets(a) | |
| Class A | $27,543 | .26 |
| Class T | 13,690 | .32 |
| Class B | 615 | .30 |
| Class C | 15,934 | .30 |
| Europe | 1,213,618 | .19 |
| Class I | 3,995 | .13 |
| $1,275,395 |
(a) Annualized
Accounting and Security Lending Fees. Fidelity Service Company, Inc. (FSC), an affiliate of the investment adviser, maintains the Fund's accounting records. The accounting fee is based on the level of average net assets for each month. Under a separate contract, FSC administers the security lending program. The security lending fee is based on the number and duration of lending transactions.
Brokerage Commissions. The Fund placed a portion of its portfolio transactions with brokerage firms which are affiliates of the investment adviser. Brokerage commissions are included in net realized gain (loss) and change in net unrealized appreciation (depreciation) in the Statement of Operations. The commissions paid to these affiliated firms were $35 for the period.
Interfund Lending Program. Pursuant to an Exemptive Order issued by the SEC, the Fund, along with other registered investment companies having management contracts with FMR or other affiliated entities of FMR, may participate in an interfund lending program. This program provides an alternative credit facility allowing the funds to borrow from, or lend money to, other participating affiliated funds. At period end, there were no interfund loans outstanding. The Fund's activity in this program during the period for which loans were outstanding was as follows:
| Borrower or Lender | Average Loan Balance | Weighted Average Interest Rate | Interest Expense |
| Borrower | $6,354,364 | .60% | $1,158 |
Interfund Trades. The Fund may purchase from or sell securities to other Fidelity Funds under procedures adopted by the Board. The procedures have been designed to ensure these interfund trades are executed in accordance with Rule 17a-7 of the 1940 Act. Interfund trades are included within the respective purchases and sales amounts shown in the Purchases and Sales of Investments note.
6. Committed Line of Credit.
The Fund participates with other funds managed by the investment adviser or an affiliate in a $4.25 billion credit facility (the "line of credit") to be utilized for temporary or emergency purposes to fund shareholder redemptions or for other short-term liquidity purposes. The Fund has agreed to pay commitment fees on its pro-rata portion of the line of credit, which amounted to $1,177 and is reflected in Miscellaneous expenses on the Statement of Operations. During the period, the Fund did not borrow on this line of credit.
7. Security Lending.
The Fund lends portfolio securities through a lending agent from time to time in order to earn additional income. For equity securities, a lending agent is used and may loan securities to certain qualified borrowers, including Fidelity Capital Markets (FCM), a broker-dealer affiliated with the Fund. On the settlement date of the loan, the Fund receives collateral (in the form of U.S. Treasury obligations, letters of credit and/or cash) against the loaned securities and maintains collateral in an amount not less than 100% of the market value of the loaned securities during the period of the loan. The market value of the loaned securities is determined at the close of business of the Fund and any additional required collateral is delivered to the Fund on the next business day. The Fund or borrower may terminate the loan at any time, and if the borrower defaults on its obligation to return the securities loaned because of insolvency or other reasons, the Fund may apply collateral received from the borrower against the obligation. The Fund may experience delays and costs in recovering the securities loaned. Any cash collateral received is invested in the Fidelity Securities Lending Cash Central Fund. The value of loaned securities and cash collateral at period end are disclosed on the Fund's Statement of Assets and Liabilities. Security lending income represents the income earned on investing cash collateral, less rebates paid to borrowers and any lending agent fees associated with the loan, plus any premium payments received for lending certain types of securities. Security lending income is presented in the Statement of Operations as a component of income from Fidelity Central Funds. Total security lending income during the period amounted to $470,655. During the period, there were no securities loaned to FCM.
8. Expense Reductions.
Commissions paid to certain brokers with whom the investment adviser, or its affiliates, places trades on behalf of the Fund include an amount in addition to trade execution, which may be rebated back to the Fund to offset certain expenses. This amount totaled $12,221 for the period.
In addition, during the period the investment adviser reimbursed and/or waived a portion of fund-level operating expenses in the amount of $4,979.
9. Distributions to Shareholders.
Distributions to shareholders of each class were as follows:
| Six months ended April 30, 2016 | Year ended October 31, 2015 | |
| From net investment income | ||
| Class A | $174,443 | $549,660 |
| Class T | 23,347 | 299,142 |
| Class B | – | 18,443 |
| Class C | 38,160 | 108,670 |
| Europe | 15,664,870 | 30,497,764 |
| Class I | 80,861 | 130,017 |
| Total | $15,981,681 | $31,603,696 |
| From net realized gain | ||
| Class A | $94,260 | $– |
| Class T | 39,080 | – |
| Class C | 47,778 | – |
| Europe | 5,676,211 | – |
| Class I | 27,858 | – |
| Total | $5,885,187 | $– |
10. Share Transactions.
Share transactions for each class were as follows and may contain automatic conversions between classes or exchanges between affiliated funds:
| Shares | Shares | Dollars | Dollars | |
| Six months ended April 30, 2016 | Year ended October 31, 2015 | Six months ended April 30, 2016 | Year ended October 31, 2015 | |
| Class A | ||||
| Shares sold | 78,312 | 402,890 | $2,720,240 | $15,313,815 |
| Reinvestment of distributions | 7,044 | 14,493 | 257,822 | 527,143 |
| Shares redeemed | (135,509) | (438,670) | (4,688,764) | (16,388,542) |
| Net increase (decrease) | (50,153) | (21,287) | $(1,710,702) | $(547,584) |
| Class T | ||||
| Shares sold | 10,132 | 101,998 | $350,155 | $3,848,880 |
| Reinvestment of distributions | 1,677 | 8,153 | 61,481 | 296,280 |
| Shares redeemed | (31,208) | (227,511) | (1,080,460) | (8,571,443) |
| Net increase (decrease) | (19,399) | (117,360) | $(668,824) | $(4,426,283) |
| Class B | ||||
| Shares sold | 183 | 7,973 | $6,068 | $306,370 |
| Reinvestment of distributions | – | 481 | – | 17,468 |
| Shares redeemed | (5,404) | (23,568) | (183,746) | (877,823) |
| Net increase (decrease) | (5,221) | (15,114) | $(177,678) | $(553,985) |
| Class C | ||||
| Shares sold | 44,908 | 197,774 | $1,558,483 | $7,494,390 |
| Reinvestment of distributions | 2,232 | 2,632 | 81,438 | 95,708 |
| Shares redeemed | (54,231) | (86,511) | (1,829,878) | (3,194,278) |
| Net increase (decrease) | (7,091) | 113,895 | $(189,957) | $4,395,820 |
| Europe | ||||
| Shares sold | 1,463,207 | 10,168,406 | $50,880,628 | $387,319,779 |
| Reinvestment of distributions | 559,844 | 803,462 | 20,484,708 | 29,241,922 |
| Shares redeemed | (5,291,129) | (7,807,853) | (182,859,606) | (290,372,067) |
| Net increase (decrease) | (3,268,078) | 3,164,015 | $(111,494,270) | $126,189,634 |
| Class I | ||||
| Shares sold | 36,393 | 130,676 | $1,295,144 | $4,946,083 |
| Reinvestment of distributions | 2,803 | 2,526 | 102,586 | 91,940 |
| Shares redeemed | (59,997) | (113,122) | (2,078,607) | (4,289,576) |
| Net increase (decrease) | (20,801) | 20,080 | $(680,877) | $748,447 |
11. Other.
The Fund's organizational documents provide former and current trustees and officers with a limited indemnification against liabilities arising in connection with the performance of their duties to the Fund. In the normal course of business, the Fund may also enter into contracts that provide general indemnifications. The Fund's maximum exposure under these arrangements is unknown as this would be dependent on future claims that may be made against the Fund. The risk of material loss from such claims is considered remote.
Shareholder Expense Example
As a shareholder of the Fund, you incur two types of costs: (1) transaction costs, including sales charges (loads) on purchase payments or redemption proceeds, redemption fees and (2) ongoing costs, including management fees, distribution and/or service (12b-1) fees and other Fund expenses. This Example is intended to help you understand your ongoing costs (in dollars) of investing in the Fund and to compare these costs with the ongoing costs of investing in other mutual funds.
The Example is based on an investment of $1,000 invested at the beginning of the period and held for the entire period (November 1, 2015 to April 30, 2016).
Actual Expenses
The first line of the accompanying table for each class of the Fund provides information about actual account values and actual expenses. You may use the information in this line, together with the amount you invested, to estimate the expenses that you paid over the period. Simply divide your account value by $1,000.00 (for example, an $8,600 account value divided by $1,000.00 = 8.6), then multiply the result by the number in the first line for a class of the Fund under the heading entitled "Expenses Paid During Period" to estimate the expenses you paid on your account during this period. A small balance maintenance fee of $12.00 that is charged once a year may apply for certain accounts with a value of less than $2,000. This fee is not included in the table below. If it was, the estimate of expenses you paid during the period would be higher, and your ending account value lower, by this amount. In addition, the Fund, as a shareholder in the underlying Fidelity Central Funds, will indirectly bear its pro-rata share of the fees and expenses incurred by the underlying Fidelity Central Funds. These fees and expenses are not included in the Fund's annualized expense ratio used to calculate the expense estimate in the table below.
Hypothetical Example for Comparison Purposes
The second line of the accompanying table for each class of the Fund provides information about hypothetical account values and hypothetical expenses based on a Class' actual expense ratio and an assumed rate of return of 5% per year before expenses, which is not the Class' actual return. The hypothetical account values and expenses may not be used to estimate the actual ending account balance or expenses you paid for the period. You may use this information to compare the ongoing costs of investing in the Fund and other funds. To do so, compare this 5% hypothetical example with the 5% hypothetical examples that appear in the shareholder reports of the other funds. A small balance maintenance fee of $12.00 that is charged once a year may apply for certain accounts with a value of less than $2,000. This fee is not included in the table below. If it was, the estimate of expenses you paid during the period would be higher, and your ending account value lower, by this amount. In addition, the Fund, as a shareholder in the underlying Fidelity Central Funds, will indirectly bear its pro-rata share of the fees and expenses incurred by the underlying Fidelity Central Funds. These fees and expenses are not included in the Fund's annualized expense ratio used to calculate the expense estimate in the table below.
Please note that the expenses shown in the table are meant to highlight your ongoing costs only and do not reflect any transaction costs. Therefore, the second line of the table is useful in comparing ongoing costs only, and will not help you determine the relative total costs of owning different funds. In addition, if these transactional costs were included, your costs would have been higher.
| Annualized Expense Ratio-A | Beginning Account Value November 1, 2015 | Ending Account Value April 30, 2016 | Expenses Paid During Period-B November 1, 2015 to April 30, 2016 | |
| Class A | 1.39% | |||
| Actual | $1,000.00 | $980.60 | $6.84 | |
| Hypothetical-C | $1,000.00 | $1,017.95 | $6.97 | |
| Class T | 1.70% | |||
| Actual | $1,000.00 | $979.20 | $8.37 | |
| Hypothetical-C | $1,000.00 | $1,016.41 | $8.52 | |
| Class B | 2.19% | |||
| Actual | $1,000.00 | $976.90 | $10.76 | |
| Hypothetical-C | $1,000.00 | $1,013.97 | $10.97 | |
| Class C | 2.18% | |||
| Actual | $1,000.00 | 976.70 | 10.71 | |
| Hypothetical-C | $1,000.00 | $1,014.02 | $10.92 | |
| Europe | 1.08% | |||
| Actual | $1,000.00 | $982.20 | $5.32 | |
| Hypothetical-C | $1,000.00 | $1,019.49 | $5.42 | |
| Class I | 1.02% | |||
| Actual | $1,000.00 | $982.50 | $5.03 | |
| Hypothetical-C | $1,000.00 | $1,019.79 | $5.12 |
A Annualized expense ratio reflects expenses net of applicable fee waivers.
B Expenses are equal to each Class' annualized expense ratio, multiplied by the average account value over the period, multiplied by 182/366 (to reflect the one-half year period).
C 5% return per year before expenses
![]()
AEUF-SANN-0616
1.9585995.102
Fidelity® International Small Cap Opportunities Fund Semi-Annual Report April 30, 2016 |
|
Contents
To view a fund's proxy voting guidelines and proxy voting record for the 12-month period ended June 30, visit http://www.fidelity.com/proxyvotingresults or visit the Securities and Exchange Commission's (SEC) web site at http://www.sec.gov.
You may also call 1-800-544-8544 to request a free copy of the proxy voting guidelines.
Standard & Poor's, S&P and S&P 500 are registered service marks of The McGraw-Hill Companies, Inc. and have been licensed for use by Fidelity Distributors Corporation.
Other third-party marks appearing herein are the property of their respective owners.
All other marks appearing herein are registered or unregistered trademarks or service marks of FMR LLC or an affiliated company. © 2016 FMR LLC. All rights reserved.
This report and the financial statements contained herein are submitted for the general information of the shareholders of the Fund. This report is not authorized for distribution to prospective investors in the Fund unless preceded or accompanied by an effective prospectus.
A fund files its complete schedule of portfolio holdings with the SEC for the first and third quarters of each fiscal year on Form N-Q. Forms N-Q are available on the SEC’s web site at http://www.sec.gov. A fund's Forms N-Q may be reviewed and copied at the SEC’s Public Reference Room in Washington, DC. Information regarding the operation of the SEC's Public Reference Room may be obtained by calling 1-800-SEC-0330.
For a complete list of a fund's portfolio holdings, view the most recent holdings listing, semiannual report, or annual report on Fidelity's web site at http://www.fidelity.com, http://www.advisor.fidelity.com, or http://www.401k.com, as applicable.
NOT FDIC INSURED •MAY LOSE VALUE •NO BANK GUARANTEE
Neither the Fund nor Fidelity Distributors Corporation is a bank.
Investment Summary (Unaudited)
Geographic Diversification (% of fund's net assets)
| As of April 30, 2016 | ||
| Japan | 25.1% | |
| United Kingdom | 20.5% | |
| United States of America* | 15.5% | |
| Germany | 6.6% | |
| Italy | 3.7% | |
| Sweden | 3.2% | |
| Netherlands | 2.5% | |
| France | 2.2% | |
| Canada | 2.0% | |
| Other | 18.7% | |

* Includes Short-Term investments and Net Other Assets (Liabilities).
Percentages are based on country or territory of incorporation and are adjusted for the effect of futures contracts, if applicable.
| As of October 31, 2015 | ||
| Japan | 26.0% | |
| United Kingdom | 21.7% | |
| United States of America* | 15.0% | |
| Germany | 5.7% | |
| Italy | 4.3% | |
| Sweden | 3.0% | |
| Netherlands | 2.8% | |
| Australia | 2.0% | |
| Canada | 1.9% | |
| Other | 17.6% | |

* Includes Short-Term investments and Net Other Assets (Liabilities).
Percentages are based on country or territory of incorporation and are adjusted for the effect of futures contracts, if applicable.
Asset Allocation as of April 30, 2016
| % of fund's net assets | % of fund's net assets 6 months ago | |
| Stocks | 92.2 | 91.8 |
| Short-Term Investments and Net Other Assets (Liabilities) | 7.8 | 8.2 |
Top Ten Stocks as of April 30, 2016
| % of fund's net assets | % of fund's net assets 6 months ago | |
| USS Co. Ltd. (Japan, Specialty Retail) | 2.0 | 2.0 |
| Spirax-Sarco Engineering PLC (United Kingdom, Machinery) | 1.8 | 1.6 |
| Berendsen PLC (United Kingdom, Commercial Services & Supplies) | 1.7 | 1.7 |
| CTS Eventim AG (Germany, Media) | 1.7 | 2.0 |
| Fagerhult AB (Sweden, Electrical Equipment) | 1.7 | 1.3 |
| Unite Group PLC (United Kingdom, Real Estate Management & Development) | 1.6 | 1.9 |
| CompuGroup Medical AG (Germany, Health Care Technology) | 1.6 | 1.0 |
| OBIC Co. Ltd. (Japan, IT Services) | 1.5 | 1.8 |
| Sartorius AG (non-vtg.) (Germany, Health Care Equipment & Supplies) | 1.4 | 1.6 |
| Azimut Holding SpA (Italy, Capital Markets) | 1.4 | 1.3 |
| 16.4 |
Market Sectors as of April 30, 2016
| % of fund's net assets | % of fund's net assets 6 months ago | |
| Consumer Discretionary | 20.6 | 20.5 |
| Industrials | 18.1 | 18.3 |
| Financials | 15.9 | 18.7 |
| Information Technology | 10.7 | 9.2 |
| Health Care | 10.3 | 8.5 |
| Consumer Staples | 8.5 | 8.5 |
| Materials | 6.7 | 6.7 |
| Energy | 1.4 | 1.4 |
Investments April 30, 2016 (Unaudited)
Showing Percentage of Net Assets
| Common Stocks - 90.8% | |||
| Shares | Value | ||
| Australia - 2.0% | |||
| Beacon Lighting Group Ltd. | 2,000,000 | $2,767,674 | |
| DuluxGroup Ltd. | 1,577,979 | 7,678,825 | |
| Imdex Ltd. (a) | 2,434,488 | 379,468 | |
| RCG Corp. Ltd. (b) | 6,779,148 | 7,061,699 | |
| TFS Corp. Ltd. (b) | 4,354,304 | 5,164,840 | |
| TOTAL AUSTRALIA | 23,052,506 | ||
| Austria - 1.1% | |||
| Andritz AG | 165,900 | 9,291,129 | |
| Zumtobel AG | 316,081 | 4,115,128 | |
| TOTAL AUSTRIA | 13,406,257 | ||
| Bailiwick of Jersey - 0.4% | |||
| Integrated Diagnostics Holdings PLC | 944,579 | 4,392,292 | |
| Belgium - 1.2% | |||
| Gimv NV | 56,688 | 3,148,164 | |
| KBC Ancora | 304,448 | 10,747,590 | |
| TOTAL BELGIUM | 13,895,754 | ||
| Bermuda - 0.3% | |||
| Vostok New Ventures Ltd. SDR (a) | 712,589 | 4,055,229 | |
| Canada - 2.0% | |||
| Cara Operations Ltd. | 282,000 | 7,295,545 | |
| McCoy Global, Inc. | 636,215 | 1,039,484 | |
| New Look Vision Group, Inc. | 197,200 | 4,880,099 | |
| Pason Systems, Inc. | 448,000 | 6,512,728 | |
| ShawCor Ltd. Class A | 135,600 | 3,663,697 | |
| Tesco Corp. | 40,447 | 382,629 | |
| TOTAL CANADA | 23,774,182 | ||
| Cayman Islands - 0.6% | |||
| 58.com, Inc. ADR (a) | 67,900 | 3,710,735 | |
| Value Partners Group Ltd. | 3,938,000 | 3,759,022 | |
| TOTAL CAYMAN ISLANDS | 7,469,757 | ||
| Denmark - 1.6% | |||
| Jyske Bank A/S (Reg.) | 213,127 | 8,725,494 | |
| Scandinavian Tobacco Group A/S | 200,000 | 3,181,685 | |
| Spar Nord Bank A/S | 796,369 | 6,493,770 | |
| TOTAL DENMARK | 18,400,949 | ||
| Finland - 0.6% | |||
| Tikkurila Oyj | 431,646 | 7,567,063 | |
| France - 2.2% | |||
| Elis SA | 380,597 | 6,988,095 | |
| Laurent-Perrier Group SA | 49,163 | 4,179,836 | |
| Vetoquinol SA | 118,184 | 4,898,823 | |
| Virbac SA (b) | 51,152 | 9,330,455 | |
| TOTAL FRANCE | 25,397,209 | ||
| Germany - 5.2% | |||
| alstria office REIT-AG | 448,700 | 6,293,853 | |
| CompuGroup Medical AG | 476,478 | 18,713,776 | |
| CTS Eventim AG | 568,280 | 19,905,189 | |
| Fielmann AG | 151,773 | 11,190,188 | |
| Nexus AG | 278,558 | 4,880,131 | |
| TOTAL GERMANY | 60,983,137 | ||
| Greece - 0.3% | |||
| Titan Cement Co. SA (Reg.) | 139,480 | 3,181,769 | |
| India - 0.5% | |||
| Jyothy Laboratories Ltd. | 1,189,354 | 5,450,307 | |
| Ireland - 1.3% | |||
| FBD Holdings PLC | 240,328 | 1,761,200 | |
| James Hardie Industries PLC: | |||
| CDI | 405,775 | 5,717,080 | |
| sponsored ADR | 564,575 | 7,915,342 | |
| TOTAL IRELAND | 15,393,622 | ||
| Isle of Man - 0.7% | |||
| Playtech Ltd. | 717,342 | 8,432,321 | |
| Israel - 2.0% | |||
| Azrieli Group | 165,005 | 6,553,478 | |
| Ituran Location & Control Ltd. | 383,208 | 7,970,726 | |
| Sarine Technologies Ltd. | 665,700 | 816,749 | |
| Strauss Group Ltd. | 484,244 | 7,673,617 | |
| TOTAL ISRAEL | 23,014,570 | ||
| Italy - 3.7% | |||
| Azimut Holding SpA | 641,097 | 16,135,257 | |
| Banco di Desio e della Brianza SpA | 1,070,000 | 3,016,451 | |
| Beni Stabili SpA SIIQ | 12,945,675 | 9,590,769 | |
| Interpump Group SpA | 1,027,943 | 14,795,470 | |
| TOTAL ITALY | 43,537,947 | ||
| Japan - 25.1% | |||
| Aoki Super Co. Ltd. | 273,000 | 3,225,856 | |
| Artnature, Inc. | 891,000 | 7,387,610 | |
| Asahi Co. Ltd. | 460,400 | 6,828,776 | |
| Autobacs Seven Co. Ltd. | 380,300 | 6,561,433 | |
| Azbil Corp. | 594,000 | 15,241,018 | |
| Broadleaf Co. Ltd. | 76,700 | 757,954 | |
| Central Automotive Products Ltd. (c) | 12,000 | 100,017 | |
| Century21 Real Estate Japan Ltd. (c) | 4,100 | 45,648 | |
| Coca-Cola Central Japan Co. Ltd. | 333,300 | 6,106,357 | |
| Daiichikosho Co. Ltd. | 221,300 | 9,277,286 | |
| Daikokutenbussan Co. Ltd. | 169,100 | 7,599,991 | |
| Funai Soken Holdings, Inc. | 210,000 | 3,186,088 | |
| GCA Savvian Group Corp. | 447,600 | 4,135,967 | |
| Glory Ltd. (d) | 277,100 | 9,075,383 | |
| Goldcrest Co. Ltd. | 522,130 | 7,476,255 | |
| Iwatsuka Confectionary Co. Ltd. | 50,400 | 2,283,383 | |
| Japan Digital Laboratory Co. | 459,100 | 6,210,344 | |
| Kobayashi Pharmaceutical Co. Ltd. | 132,000 | 10,514,151 | |
| Koshidaka Holdings Co. Ltd. | 166,900 | 3,281,884 | |
| Lasertec Corp. | 376,136 | 4,890,217 | |
| Medikit Co. Ltd. (c) | 126,700 | 4,417,152 | |
| Meiko Network Japan Co. Ltd. | 112,600 | 1,241,872 | |
| Miraial Co. Ltd. | 38,200 | 269,148 | |
| Nagaileben Co. Ltd. | 562,600 | 11,480,790 | |
| Nakano Refrigerators Co. Ltd. | 135,000 | 3,229,851 | |
| ND Software Co. Ltd. | 73,843 | 607,845 | |
| Nihon Parkerizing Co. Ltd. | 1,427,500 | 12,591,122 | |
| NS Tool Co. Ltd. (b) | 35,600 | 590,226 | |
| OBIC Co. Ltd. | 336,500 | 17,686,755 | |
| OSG Corp. | 715,000 | 13,287,288 | |
| Paramount Bed Holdings Co. Ltd. | 229,400 | 8,533,414 | |
| ProNexus, Inc. (d) | 569,600 | 5,760,400 | |
| San-Ai Oil Co. Ltd. | 630,000 | 4,415,294 | |
| Seven Bank Ltd. | 2,834,900 | 12,046,080 | |
| SHO-BOND Holdings Co. Ltd. | 263,700 | 11,410,078 | |
| Shoei Co. Ltd. | 309,426 | 4,683,769 | |
| SK Kaken Co. Ltd. | 75,000 | 6,153,866 | |
| Software Service, Inc. | 62,900 | 2,429,462 | |
| Techno Medica Co. Ltd. | 79,491 | 1,666,416 | |
| The Monogatari Corp. | 104,300 | 4,922,928 | |
| The Nippon Synthetic Chemical Industry Co. Ltd. | 391,000 | 2,359,434 | |
| TKC Corp. | 247,400 | 6,721,508 | |
| Tocalo Co. Ltd. | 117,000 | 2,104,645 | |
| Tsutsumi Jewelry Co. Ltd. | 139,000 | 2,903,454 | |
| USS Co. Ltd. | 1,498,300 | 23,700,626 | |
| Workman Co. Ltd. | 212,500 | 6,680,033 | |
| Yamada Consulting Group Co. Ltd. | 134,495 | 4,108,888 | |
| Yamato Kogyo Co. Ltd. | 99,100 | 2,326,325 | |
| TOTAL JAPAN | 292,514,287 | ||
| Korea (South) - 1.4% | |||
| BGFretail Co. Ltd. | 84,156 | 13,662,702 | |
| Leeno Industrial, Inc. | 57,500 | 2,150,588 | |
| TOTAL KOREA (SOUTH) | 15,813,290 | ||
| Mexico - 0.6% | |||
| Consorcio ARA S.A.B. de CV | 17,196,078 | 6,746,637 | |
| Netherlands - 2.5% | |||
| Aalberts Industries NV | 319,501 | 10,946,071 | |
| Heijmans NV (Certificaten Van Aandelen) (a) | 304,192 | 2,866,633 | |
| VastNed Retail NV | 337,390 | 14,854,328 | |
| TOTAL NETHERLANDS | 28,667,032 | ||
| Norway - 0.5% | |||
| Kongsberg Gruppen ASA | 320,500 | 5,373,610 | |
| Philippines - 0.4% | |||
| Jollibee Food Corp. | 1,026,090 | 5,008,829 | |
| South Africa - 0.6% | |||
| Clicks Group Ltd. | 899,913 | 6,572,695 | |
| Spain - 2.0% | |||
| Hispania Activos Inmobiliarios SA (a) | 210,543 | 3,085,853 | |
| Merlin Properties Socimi SA | 613,100 | 7,125,606 | |
| Prosegur Compania de Seguridad SA (Reg.) | 2,317,590 | 13,401,470 | |
| TOTAL SPAIN | 23,612,929 | ||
| Sweden - 3.2% | |||
| Fagerhult AB | 842,305 | 19,614,223 | |
| Intrum Justitia AB (b) | 273,334 | 9,809,520 | |
| Saab AB (B Shares) | 227,500 | 7,782,160 | |
| TOTAL SWEDEN | 37,205,903 | ||
| Switzerland - 0.3% | |||
| Tecan Group AG | 24,053 | 3,339,789 | |
| Taiwan - 0.3% | |||
| Addcn Technology Co. Ltd. | 516,900 | 3,968,399 | |
| United Kingdom - 20.5% | |||
| AA PLC | 1,441,400 | 5,867,599 | |
| Alliance Pharma PLC | 4,253,100 | 2,796,488 | |
| Bellway PLC | 439,872 | 15,727,333 | |
| Berendsen PLC | 1,173,163 | 20,227,172 | |
| Britvic PLC | 543,571 | 5,591,441 | |
| Dechra Pharmaceuticals PLC | 609,609 | 9,851,476 | |
| DP Poland PLC (a)(e) | 8,208,000 | 3,118,211 | |
| Elementis PLC | 3,262,010 | 10,290,411 | |
| Great Portland Estates PLC | 961,189 | 10,645,665 | |
| Hilton Food Group PLC | 222,288 | 1,828,602 | |
| Howden Joinery Group PLC | 1,639,800 | 11,836,209 | |
| Informa PLC | 1,613,965 | 15,434,713 | |
| InterContinental Hotel Group PLC ADR (b) | 216,931 | 8,707,610 | |
| ITE Group PLC | 2,882,634 | 6,539,069 | |
| JUST EAT Ltd. (a) | 819,470 | 4,591,909 | |
| Rightmove PLC | 166,747 | 9,399,723 | |
| Shaftesbury PLC | 1,092,673 | 14,528,688 | |
| Spectris PLC | 557,278 | 14,827,798 | |
| Spirax-Sarco Engineering PLC | 408,791 | 20,397,965 | |
| Taylor Wimpey PLC | 1,686,800 | 4,542,383 | |
| Ted Baker PLC | 233,700 | 8,144,078 | |
| Topps Tiles PLC | 2,473,300 | 4,914,853 | |
| Ultra Electronics Holdings PLC | 392,558 | 10,129,531 | |
| Unite Group PLC | 2,079,823 | 19,221,254 | |
| TOTAL UNITED KINGDOM | 239,160,181 | ||
| United States of America - 7.7% | |||
| ANSYS, Inc. (a) | 36,085 | 3,275,435 | |
| Autoliv, Inc. (b) | 65,200 | 7,985,044 | |
| Broadridge Financial Solutions, Inc. | 93,905 | 5,619,275 | |
| China Biologic Products, Inc. (a) | 110,380 | 12,914,460 | |
| Domino's Pizza, Inc. | 44,000 | 5,318,720 | |
| Energizer Holdings, Inc. | 54,409 | 2,366,247 | |
| Kennedy-Wilson Holdings, Inc. | 556,629 | 12,028,753 | |
| Martin Marietta Materials, Inc. | 34,720 | 5,875,666 | |
| Mohawk Industries, Inc. (a) | 42,600 | 8,206,038 | |
| PriceSmart, Inc. | 147,199 | 12,738,601 | |
| ResMed, Inc. | 86,095 | 4,804,101 | |
| SS&C Technologies Holdings, Inc. | 152,058 | 9,298,347 | |
| TOTAL UNITED STATES OF AMERICA | 90,430,687 | ||
| TOTAL COMMON STOCKS | |||
| (Cost $941,309,093) | 1,059,819,139 | ||
| Nonconvertible Preferred Stocks - 1.4% | |||
| Germany - 1.4% | |||
| Sartorius AG (non-vtg.) | |||
| (Cost $9,231,224) | 65,520 | 16,163,851 | |
| Money Market Funds - 8.5% | |||
| Fidelity Cash Central Fund, 0.38% (f) | 85,942,201 | 85,942,201 | |
| Fidelity Securities Lending Cash Central Fund, 0.42% (f)(g) | 13,328,610 | 13,328,610 | |
| TOTAL MONEY MARKET FUNDS | |||
| (Cost $99,270,811) | 99,270,811 | ||
| TOTAL INVESTMENT PORTFOLIO - 100.7% | |||
| (Cost $1,049,811,128) | 1,175,253,801 | ||
| NET OTHER ASSETS (LIABILITIES) - (0.7)% | (7,959,739) | ||
| NET ASSETS - 100% | $1,167,294,062 |
Categorizations in the Schedule of Investments are based on country or territory of incorporation.
Legend
(a) Non-income producing
(b) Security or a portion of the security is on loan at period end.
(c) Security or a portion of the security purchased on a delayed delivery or when-issued basis.
(d) A portion of the security sold on a delayed delivery basis.
(e) Affiliated company
(f) Affiliated fund that is generally available only to investment companies and other accounts managed by Fidelity Investments. The rate quoted is the annualized seven-day yield of the fund at period end. A complete unaudited listing of the fund's holdings as of its most recent quarter end is available upon request. In addition, each Fidelity Central Fund's financial statements are available on the SEC's website or upon request.
(g) Investment made with cash collateral received from securities on loan.
Affiliated Central Funds
Information regarding fiscal year to date income earned by the Fund from investments in Fidelity Central Funds is as follows:
| Fund | Income earned |
| Fidelity Cash Central Fund | $167,523 |
| Fidelity Securities Lending Cash Central Fund | 77,863 |
| Total | $245,386 |
Other Affiliated Issuers
An affiliated company is a company in which the Fund has ownership of at least 5% of the voting securities. Fiscal year to date transactions with companies which are or were affiliates are as follows:
| Affiliate | Value, beginning of period | Purchases | Sales Proceeds | Dividend Income | Value, end of period |
| DP Poland PLC | $2,507,081 | $321,456 | $-- | $-- | $3,118,211 |
| Total | $2,507,081 | $321,456 | $-- | $-- | $3,118,211 |
Investment Valuation
The following is a summary of the inputs used, as of April 30, 2016, involving the Fund's assets and liabilities carried at fair value. The inputs or methodology used for valuing securities may not be an indication of the risk associated with investing in those securities. For more information on valuation inputs, and their aggregation into the levels used below, please refer to the Investment Valuation section in the accompanying Notes to Financial Statements.
| Valuation Inputs at Reporting Date: | ||||
| Description | Total | Level 1 | Level 2 | Level 3 |
| Investments in Securities: | ||||
| Equities: | ||||
| Consumer Discretionary | $241,379,798 | $171,197,720 | $70,182,078 | $-- |
| Consumer Staples | 97,181,396 | 60,064,048 | 37,117,348 | -- |
| Energy | 16,013,832 | 11,598,538 | 4,415,294 | -- |
| Financials | 188,656,059 | 161,193,087 | 27,462,972 | -- |
| Health Care | 121,220,721 | 92,085,642 | 29,135,079 | -- |
| Industrials | 209,307,773 | 156,554,926 | 52,752,847 | -- |
| Information Technology | 125,022,200 | 73,245,256 | 51,776,944 | -- |
| Materials | 77,201,211 | 50,588,695 | 26,612,516 | -- |
| Money Market Funds | 99,270,811 | 99,270,811 | -- | -- |
| Total Investments in Securities: | $1,175,253,801 | $875,798,723 | $299,455,078 | $-- |
The following is a summary of transfers between Level 1 and Level 2 for the period ended April 30, 2016. Transfers are assumed to have occurred at the beginning of the period, and are primarily attributable to the valuation techniques used for foreign equity securities, as discussed in the accompanying Notes to Financial Statements:
| Transfers | Total |
| Level 1 to Level 2 | $3,963,761 |
| Level 2 to Level 1 | $28,474,370 |
See accompanying notes which are an integral part of the financial statements.
Financial Statements
Statement of Assets and Liabilities
| April 30, 2016 (Unaudited) | ||
| Assets | ||
| Investment in securities, at value (including securities loaned of $13,034,826) — See accompanying schedule: Unaffiliated issuers (cost $948,419,765) | $1,072,864,779 | |
| Fidelity Central Funds (cost $99,270,811) | 99,270,811 | |
| Other affiliated issuers (cost $2,120,552) | 3,118,211 | |
| Total Investments (cost $1,049,811,128) | $1,175,253,801 | |
| Receivable for investments sold | ||
| Regular delivery | 759,807 | |
| Delayed delivery | 139,587 | |
| Receivable for fund shares sold | 1,947,400 | |
| Dividends receivable | 5,382,395 | |
| Distributions receivable from Fidelity Central Funds | 62,435 | |
| Prepaid expenses | 498 | |
| Other receivables | 2,840 | |
| Total assets | 1,183,548,763 | |
| Liabilities | ||
| Payable to custodian bank | $27,592 | |
| Payable for investments purchased | ||
| Regular delivery | 62,835 | |
| Delayed delivery | 30,608 | |
| Payable for fund shares redeemed | 1,639,204 | |
| Accrued management fee | 826,592 | |
| Distribution and service plan fees payable | 30,380 | |
| Other affiliated payables | 242,791 | |
| Other payables and accrued expenses | 66,089 | |
| Collateral on securities loaned, at value | 13,328,610 | |
| Total liabilities | 16,254,701 | |
| Net Assets | $1,167,294,062 | |
| Net Assets consist of: | ||
| Paid in capital | $1,286,497,613 | |
| Undistributed net investment income | 3,446,654 | |
| Accumulated undistributed net realized gain (loss) on investments and foreign currency transactions | (248,244,637) | |
| Net unrealized appreciation (depreciation) on investments and assets and liabilities in foreign currencies | 125,594,432 | |
| Net Assets | $1,167,294,062 | |
| Calculation of Maximum Offering Price | ||
| Class A: | ||
| Net Asset Value and redemption price per share ($50,512,499 ÷ 3,421,332 shares) | $14.76 | |
| Maximum offering price per share (100/94.25 of $14.76) | $15.66 | |
| Class T: | ||
| Net Asset Value and redemption price per share ($13,820,005 ÷ 943,286 shares) | $14.65 | |
| Maximum offering price per share (100/96.50 of $14.65) | $15.18 | |
| Class B: | ||
| Net Asset Value and offering price per share ($354,955 ÷ 24,616 shares)(a) | $14.42 | |
| Class C: | ||
| Net Asset Value and offering price per share ($16,766,047 ÷ 1,174,289 shares)(a) | $14.28 | |
| International Small Cap Opportunities: | ||
| Net Asset Value, offering price and redemption price per share ($943,035,473 ÷ 63,201,820 shares) | $14.92 | |
| Class I: | ||
| Net Asset Value, offering price and redemption price per share ($142,805,083 ÷ 9,576,371 shares) | $14.91 |
(a) Redemption price per share is equal to net asset value less any applicable contingent deferred sales charge.
See accompanying notes which are an integral part of the financial statements.
Statement of Operations
| Six months ended April 30, 2016 (Unaudited) | ||
| Investment Income | ||
| Dividends | $10,624,721 | |
| Income from Fidelity Central Funds | 245,386 | |
| Income before foreign taxes withheld | 10,870,107 | |
| Less foreign taxes withheld | (928,950) | |
| Total income | 9,941,157 | |
| Expenses | ||
| Management fee | ||
| Basic fee | $4,515,535 | |
| Performance adjustment | 205,580 | |
| Transfer agent fees | 1,169,397 | |
| Distribution and service plan fees | 178,936 | |
| Accounting and security lending fees | 247,112 | |
| Custodian fees and expenses | 97,381 | |
| Independent trustees' compensation | 2,222 | |
| Registration fees | 58,793 | |
| Audit | 45,289 | |
| Legal | 1,350 | |
| Miscellaneous | 2,905 | |
| Total expenses before reductions | 6,524,500 | |
| Expense reductions | (4,405) | 6,520,095 |
| Net investment income (loss) | 3,421,062 | |
| Realized and Unrealized Gain (Loss) | ||
| Net realized gain (loss) on: | ||
| Investment securities: | ||
| Unaffiliated issuers | 13,404,515 | |
| Foreign currency transactions | 1,988 | |
| Total net realized gain (loss) | 13,406,503 | |
| Change in net unrealized appreciation (depreciation) on: Investment securities | (4,093,560) | |
| Assets and liabilities in foreign currencies | 188,590 | |
| Total change in net unrealized appreciation (depreciation) | (3,904,970) | |
| Net gain (loss) | 9,501,533 | |
| Net increase (decrease) in net assets resulting from operations | $12,922,595 |
See accompanying notes which are an integral part of the financial statements.
Statement of Changes in Net Assets
| Six months ended April 30, 2016 (Unaudited) | Year ended October 31, 2015 | |
| Increase (Decrease) in Net Assets | ||
| Operations | ||
| Net investment income (loss) | $3,421,062 | $4,880,273 |
| Net realized gain (loss) | 13,406,503 | 32,155,951 |
| Change in net unrealized appreciation (depreciation) | (3,904,970) | 15,708,708 |
| Net increase (decrease) in net assets resulting from operations | 12,922,595 | 52,744,932 |
| Distributions to shareholders from net investment income | (4,852,691) | (3,982,311) |
| Distributions to shareholders from net realized gain | (4,655,673) | (949,656) |
| Total distributions | (9,508,364) | (4,931,967) |
| Share transactions - net increase (decrease) | 206,876,426 | 250,623,581 |
| Redemption fees | 159,056 | 196,651 |
| Total increase (decrease) in net assets | 210,449,713 | 298,633,197 |
| Net Assets | ||
| Beginning of period | 956,844,349 | 658,211,152 |
| End of period (including undistributed net investment income of $3,446,654 and undistributed net investment income of $4,878,283, respectively) | $1,167,294,062 | $956,844,349 |
See accompanying notes which are an integral part of the financial statements.
Financial Highlights — Fidelity International Small Cap Opportunities Fund Class A
| Six months ended (Unaudited) April 30, | Years ended October 31, | |||||
| 2016 | 2015 | 2014 | 2013 | 2012 | 2011 | |
| Selected Per–Share Data | ||||||
| Net asset value, beginning of period | $14.75 | $13.65 | $13.68 | $10.78 | $9.75 | $9.82 |
| Income from Investment Operations | ||||||
| Net investment income (loss)A | .03 | .06 | .05 | .07 | .08 | .15B |
| Net realized and unrealized gain (loss) | .10 | 1.11 | .05 | 2.91 | 1.07 | (.07) |
| Total from investment operations | .13 | 1.17 | .10 | 2.98 | 1.15 | .08 |
| Distributions from net investment income | (.05) | (.05) | (.06) | (.08) | (.11) | (.11) |
| Distributions from net realized gain | (.07) | (.02) | (.08) | (.01) | (.01) | (.04) |
| Total distributions | (.12) | (.07) | (.13)C | (.08)D | (.12) | (.15) |
| Redemption fees added to paid in capitalA,E | – | – | – | – | – | – |
| Net asset value, end of period | $14.76 | $14.75 | $13.65 | $13.68 | $10.78 | $9.75 |
| Total ReturnF,G,H | .89% | 8.62% | .78% | 27.85% | 12.00% | .81% |
| Ratios to Average Net AssetsI,J | ||||||
| Expenses before reductions | 1.47%K | 1.52% | 1.63% | 1.70% | 1.75% | 1.34% |
| Expenses net of fee waivers, if any | 1.47%K | 1.52% | 1.63% | 1.65% | 1.65% | 1.33% |
| Expenses net of all reductions | 1.47%K | 1.51% | 1.63% | 1.64% | 1.64% | 1.32% |
| Net investment income (loss) | .40%K | .38% | .33% | .59% | .85% | 1.44%B |
| Supplemental Data | ||||||
| Net assets, end of period (000 omitted) | $50,512 | $42,289 | $25,041 | $22,052 | $18,194 | $18,686 |
| Portfolio turnover rateL | 19%K | 21% | 18% | 31% | 28% | 24% |
A Calculated based on average shares outstanding during the period.
B Net Investment income per share reflects a large, non-recurring dividend which amounted to $.06 per share. Excluding this non-recurring dividend, the ratio of net investment income (loss) to average net assets would have been .80%.
C Total distributions of $.13 per share is comprised of distributions from net investment income of $.055 and distributions from net realized gain of $.079 per share.
D Total distributions of $.08 per share is comprised of distributions from net investment income of $.077 and distributions from net realized gain of $.005 per share.
E Amount represents less than $.005 per share.
F Total returns for periods of less than one year are not annualized.
G Total returns would have been lower if certain expenses had not been reduced during the applicable periods shown.
H Total returns do not include the effect of the sales charges.
I Fees and expenses of any underlying Fidelity Central Funds are not included in the Fund's expense ratio. The Fund indirectly bears its proportionate share of the expenses of any underlying Fidelity Central Funds.
J Expense ratios reflect operating expenses of the class. Expenses before reductions do not reflect amounts reimbursed by the investment adviser or reductions from brokerage service arrangements or reductions from other expense offset arrangements and do not represent the amount paid by the class during periods when reimbursements or reductions occur. Expenses net of fee waivers reflect expenses after reimbursement by the investment adviser but prior to reductions from brokerage service arrangements or other expense offset arrangements. Expenses net of all reductions represent the net expenses paid by the class.
K Annualized
L Amount does not include the portfolio activity of any underlying Fidelity Central Funds.
See accompanying notes which are an integral part of the financial statements.
Financial Highlights — Fidelity International Small Cap Opportunities Fund Class T
| Six months ended (Unaudited) April 30, | Years ended October 31, | |||||
| 2016 | 2015 | 2014 | 2013 | 2012 | 2011 | |
| Selected Per–Share Data | ||||||
| Net asset value, beginning of period | $14.62 | $13.53 | $13.56 | $10.69 | $9.66 | $9.72 |
| Income from Investment Operations | ||||||
| Net investment income (loss)A | .01 | .01 | .01 | .04 | .06 | .12B |
| Net realized and unrealized gain (loss) | .10 | 1.11 | .06 | 2.89 | 1.06 | (.06) |
| Total from investment operations | .11 | 1.12 | .07 | 2.93 | 1.12 | .06 |
| Distributions from net investment income | (.01) | (.01) | (.02) | (.05) | (.08) | (.08) |
| Distributions from net realized gain | (.07) | (.02) | (.08) | (.01) | (.01) | (.04) |
| Total distributions | (.08) | (.03) | (.10) | (.06) | (.09) | (.12) |
| Redemption fees added to paid in capitalA,C | – | – | – | – | – | – |
| Net asset value, end of period | $14.65 | $14.62 | $13.53 | $13.56 | $10.69 | $9.66 |
| Total ReturnD,E,F | .75% | 8.27% | .55% | 27.53% | 11.72% | .60% |
| Ratios to Average Net AssetsG,H | ||||||
| Expenses before reductions | 1.79%I | 1.80% | 1.89% | 1.96% | 2.02% | 1.60% |
| Expenses net of fee waivers, if any | 1.78%I | 1.80% | 1.89% | 1.90% | 1.90% | 1.60% |
| Expenses net of all reductions | 1.78%I | 1.80% | 1.89% | 1.89% | 1.89% | 1.59% |
| Net investment income (loss) | .08%I | .10% | .07% | .34% | .60% | 1.17%B |
| Supplemental Data | ||||||
| Net assets, end of period (000 omitted) | $13,820 | $13,296 | $9,913 | $9,634 | $8,169 | $8,701 |
| Portfolio turnover rateJ | 19%I | 21% | 18% | 31% | 28% | 24% |
A Calculated based on average shares outstanding during the period.
B Net Investment income per share reflects a large, non-recurring dividend which amounted to $.06 per share. Excluding this non-recurring dividend, the ratio of net investment income (loss) to average net assets would have been .54%.
C Amount represents less than $.005 per share.
D Total returns for periods of less than one year are not annualized.
E Total returns would have been lower if certain expenses had not been reduced during the applicable periods shown.
F Total returns do not include the effect of the sales charges.
G Fees and expenses of any underlying Fidelity Central Funds are not included in the Fund's expense ratio. The Fund indirectly bears its proportionate share of the expenses of any underlying Fidelity Central Funds.
H Expense ratios reflect operating expenses of the class. Expenses before reductions do not reflect amounts reimbursed by the investment adviser or reductions from brokerage service arrangements or reductions from other expense offset arrangements and do not represent the amount paid by the class during periods when reimbursements or reductions occur. Expenses net of fee waivers reflect expenses after reimbursement by the investment adviser but prior to reductions from brokerage service arrangements or other expense offset arrangements. Expenses net of all reductions represent the net expenses paid by the class.
I Annualized
J Amount does not include the portfolio activity of any underlying Fidelity Central Funds.
See accompanying notes which are an integral part of the financial statements.
Financial Highlights — Fidelity International Small Cap Opportunities Fund Class B
| Six months ended (Unaudited) April 30, | Years ended October 31, | |||||
| 2016 | 2015 | 2014 | 2013 | 2012 | 2011 | |
| Selected Per–Share Data | ||||||
| Net asset value, beginning of period | $14.35 | $13.31 | $13.31 | $10.50 | $9.48 | $9.54 |
| Income from Investment Operations | ||||||
| Net investment income (loss)A | (.03) | (.06) | (.06) | (.02) | .01 | .07B |
| Net realized and unrealized gain (loss) | .10 | 1.10 | .06 | 2.84 | 1.05 | (.06) |
| Total from investment operations | .07 | 1.04 | – | 2.82 | 1.06 | .01 |
| Distributions from net investment income | – | – | – | –C | (.03) | (.06) |
| Distributions from net realized gain | – | – | – | (.01) | (.01) | (.02) |
| Total distributions | – | – | – | (.01) | (.04) | (.07)D |
| Redemption fees added to paid in capitalA,C | – | – | – | – | – | – |
| Net asset value, end of period | $14.42 | $14.35 | $13.31 | $13.31 | $10.50 | $9.48 |
| Total ReturnE,F,G | .49% | 7.81% | -% | 26.86% | 11.21% | .10% |
| Ratios to Average Net AssetsH,I | ||||||
| Expenses before reductions | 2.28%J | 2.30% | 2.38% | 2.46% | 2.50% | 2.09% |
| Expenses net of fee waivers, if any | 2.28%J | 2.30% | 2.38% | 2.40% | 2.40% | 2.09% |
| Expenses net of all reductions | 2.28%J | 2.29% | 2.38% | 2.39% | 2.39% | 2.07% |
| Net investment income (loss) | (.41)%J | (.39)% | (.43)% | (.16)% | .10% | .68%B |
| Supplemental Data | ||||||
| Net assets, end of period (000 omitted) | $355 | $604 | $744 | $1,410 | $1,966 | $2,293 |
| Portfolio turnover rateK | 19%J | 21% | 18% | 31% | 28% | 24% |
A Calculated based on average shares outstanding during the period.
B Net Investment income per share reflects a large, non-recurring dividend which amounted to $.06 per share. Excluding this non-recurring dividend, the ratio of net investment income (loss) to average net assets would have been .05%.
C Amount represents less than $.005 per share.
D Total distributions of $.07 per share is comprised of distributions from net investment income of $.058 and distributions from net realized gain of $.015 per share.
E Total returns for periods of less than one year are not annualized.
F Total returns would have been lower if certain expenses had not been reduced during the applicable periods shown.
G Total returns do not include the effect of the contingent deferred sales charge.
H Fees and expenses of any underlying Fidelity Central Funds are not included in the Fund's expense ratio. The Fund indirectly bears its proportionate share of the expenses of any underlying Fidelity Central Funds.
I Expense ratios reflect operating expenses of the class. Expenses before reductions do not reflect amounts reimbursed by the investment adviser or reductions from brokerage service arrangements or reductions from other expense offset arrangements and do not represent the amount paid by the class during periods when reimbursements or reductions occur. Expenses net of fee waivers reflect expenses after reimbursement by the investment adviser but prior to reductions from brokerage service arrangements or other expense offset arrangements. Expenses net of all reductions represent the net expenses paid by the class.
J Annualized
K Amount does not include the portfolio activity of any underlying Fidelity Central Funds.
See accompanying notes which are an integral part of the financial statements.
Financial Highlights — Fidelity International Small Cap Opportunities Fund Class C
| Six months ended (Unaudited) April 30, | Years ended October 31, | |||||
| 2016 | 2015 | 2014 | 2013 | 2012 | 2011 | |
| Selected Per–Share Data | ||||||
| Net asset value, beginning of period | $14.26 | $13.23 | $13.28 | $10.48 | $9.47 | $9.53 |
| Income from Investment Operations | ||||||
| Net investment income (loss)A | (.03) | (.05) | (.06) | (.02) | .01 | .07B |
| Net realized and unrealized gain (loss) | .10 | 1.08 | .06 | 2.84 | 1.04 | (.06) |
| Total from investment operations | .07 | 1.03 | – | 2.82 | 1.05 | .01 |
| Distributions from net investment income | – | – | – | (.01) | (.03) | (.06) |
| Distributions from net realized gain | (.05) | – | (.05) | (.01) | (.01) | (.02) |
| Total distributions | (.05) | – | (.05) | (.02) | (.04) | (.07)C |
| Redemption fees added to paid in capitalA,D | – | – | – | – | – | – |
| Net asset value, end of period | $14.28 | $14.26 | $13.23 | $13.28 | $10.48 | $9.47 |
| Total ReturnE,F,G | .51% | 7.79% | .03% | 26.91% | 11.13% | .10% |
| Ratios to Average Net AssetsH,I | ||||||
| Expenses before reductions | 2.27%J | 2.27% | 2.38% | 2.45% | 2.50% | 2.09% |
| Expenses net of fee waivers, if any | 2.27%J | 2.27% | 2.38% | 2.40% | 2.40% | 2.09% |
| Expenses net of all reductions | 2.27%J | 2.26% | 2.38% | 2.39% | 2.39% | 2.07% |
| Net investment income (loss) | (.40)%J | (.36)% | (.42)% | (.16)% | .10% | .68%B |
| Supplemental Data | ||||||
| Net assets, end of period (000 omitted) | $16,766 | $17,370 | $8,438 | $8,070 | $6,608 | $6,900 |
| Portfolio turnover rateK | 19%J | 21% | 18% | 31% | 28% | 24% |
A Calculated based on average shares outstanding during the period.
B Net Investment income per share reflects a large, non-recurring dividend which amounted to $.06 per share. Excluding this non-recurring dividend, the ratio of net investment income (loss) to average net assets would have been .05%.
C Total distributions of $.07 per share is comprised of distributions from net investment income of $.058 and distributions from net realized gain of $.015 per share.
D Amount represents less than $.005 per share.
E Total returns for periods of less than one year are not annualized.
F Total returns would have been lower if certain expenses had not been reduced during the applicable periods shown.
G Total returns do not include the effect of the contingent deferred sales charge.
H Fees and expenses of any underlying Fidelity Central Funds are not included in the Fund's expense ratio. The Fund indirectly bears its proportionate share of the expenses of any underlying Fidelity Central Funds.
I Expense ratios reflect operating expenses of the class. Expenses before reductions do not reflect amounts reimbursed by the investment adviser or reductions from brokerage service arrangements or reductions from other expense offset arrangements and do not represent the amount paid by the class during periods when reimbursements or reductions occur. Expenses net of fee waivers reflect expenses after reimbursement by the investment adviser but prior to reductions from brokerage service arrangements or other expense offset arrangements. Expenses net of all reductions represent the net expenses paid by the class.
J Annualized
K Amount does not include the portfolio activity of any underlying Fidelity Central Funds.
See accompanying notes which are an integral part of the financial statements.
Financial Highlights — Fidelity International Small Cap Opportunities Fund
| Six months ended (Unaudited) April 30, | Years ended October 31, | |||||
| 2016 | 2015 | 2014 | 2013 | 2012 | 2011 | |
| Selected Per–Share Data | ||||||
| Net asset value, beginning of period | $14.91 | $13.80 | $13.82 | $10.88 | $9.85 | $9.92 |
| Income from Investment Operations | ||||||
| Net investment income (loss)A | .05 | .10 | .09 | .10 | .11 | .17B |
| Net realized and unrealized gain (loss) | .11 | 1.12 | .06 | 2.95 | 1.07 | (.06) |
| Total from investment operations | .16 | 1.22 | .15 | 3.05 | 1.18 | .11 |
| Distributions from net investment income | (.08) | (.09) | (.09) | (.10) | (.14) | (.14) |
| Distributions from net realized gain | (.07) | (.02) | (.08) | (.01) | (.01) | (.04) |
| Total distributions | (.15) | (.11) | (.17) | (.11) | (.15) | (.18) |
| Redemption fees added to paid in capitalA,C | – | – | – | – | – | – |
| Net asset value, end of period | $14.92 | $14.91 | $13.80 | $13.82 | $10.88 | $9.85 |
| Total ReturnD,E | 1.03% | 8.92% | 1.11% | 28.24% | 12.21% | 1.10% |
| Ratios to Average Net AssetsF,G | ||||||
| Expenses before reductions | 1.19%H | 1.23% | 1.30% | 1.39% | 1.47% | 1.08% |
| Expenses net of fee waivers, if any | 1.19%H | 1.22% | 1.30% | 1.39% | 1.40% | 1.08% |
| Expenses net of all reductions | 1.19%H | 1.22% | 1.30% | 1.38% | 1.39% | 1.06% |
| Net investment income (loss) | .68%H | .68% | .65% | .85% | 1.10% | 1.69%B |
| Supplemental Data | ||||||
| Net assets, end of period (000 omitted) | $943,035 | $762,563 | $584,253 | $518,121 | $334,918 | $328,262 |
| Portfolio turnover rateI | 19%H | 21% | 18% | 31% | 28% | 24% |
A Calculated based on average shares outstanding during the period.
B Net Investment income per share reflects a large, non-recurring dividend which amounted to $.07 per share. Excluding this non-recurring dividend, the ratio of net investment income (loss) to average net assets would have been 1.06%.
C Amount represents less than $.005 per share.
D Total returns for periods of less than one year are not annualized.
E Total returns would have been lower if certain expenses had not been reduced during the applicable periods shown.
F Fees and expenses of any underlying Fidelity Central Funds are not included in the Fund's expense ratio. The Fund indirectly bears its proportionate share of the expenses of any underlying Fidelity Central Funds.
G Expense ratios reflect operating expenses of the class. Expenses before reductions do not reflect amounts reimbursed by the investment adviser or reductions from brokerage service arrangements or reductions from other expense offset arrangements and do not represent the amount paid by the class during periods when reimbursements or reductions occur. Expenses net of fee waivers reflect expenses after reimbursement by the investment adviser but prior to reductions from brokerage service arrangements or other expense offset arrangements. Expenses net of all reductions represent the net expenses paid by the class.
H Annualized
I Amount does not include the portfolio activity of any underlying Fidelity Central Funds.
See accompanying notes which are an integral part of the financial statements.
Financial Highlights — Fidelity International Small Cap Opportunities Fund Class I
| Six months ended (Unaudited) April 30, | Years ended October 31, | |||||
| 2016 | 2015 | 2014 | 2013 | 2012 | 2011 | |
| Selected Per–Share Data | ||||||
| Net asset value, beginning of period | $14.91 | $13.81 | $13.83 | $10.90 | $9.86 | $9.93 |
| Income from Investment Operations | ||||||
| Net investment income (loss)A | .05 | .10 | .08 | .11 | .11 | .18B |
| Net realized and unrealized gain (loss) | .10 | 1.13 | .07 | 2.93 | 1.08 | (.06) |
| Total from investment operations | .15 | 1.23 | .15 | 3.04 | 1.19 | .12 |
| Distributions from net investment income | (.08) | (.11) | (.09) | (.10) | (.14) | (.15) |
| Distributions from net realized gain | (.07) | (.02) | (.08) | (.01) | (.01) | (.04) |
| Total distributions | (.15) | (.13) | (.17) | (.11) | (.15) | (.19) |
| Redemption fees added to paid in capitalA,C | – | – | – | – | – | – |
| Net asset value, end of period | $14.91 | $14.91 | $13.81 | $13.83 | $10.90 | $9.86 |
| Total ReturnD,E | 1.02% | 8.98% | 1.11% | 28.11% | 12.32% | 1.13% |
| Ratios to Average Net AssetsF,G | ||||||
| Expenses before reductions | 1.17%H | 1.19% | 1.36% | 1.38% | 1.44% | 1.03% |
| Expenses net of fee waivers, if any | 1.17%H | 1.19% | 1.36% | 1.37% | 1.40% | 1.03% |
| Expenses net of all reductions | 1.17%H | 1.18% | 1.36% | 1.37% | 1.39% | 1.02% |
| Net investment income (loss) | .69%H | .71% | .60% | .87% | 1.10% | 1.74%B |
| Supplemental Data | ||||||
| Net assets, end of period (000 omitted) | $142,805 | $120,723 | $29,822 | $5,670 | $4,591 | $1,395 |
| Portfolio turnover rateI | 19%H | 21% | 18% | 31% | 28% | 24% |
A Calculated based on average shares outstanding during the period.
B Net Investment income per share reflects a large, non-recurring dividend which amounted to $.07 per share. Excluding this non-recurring dividend, the ratio of net investment income (loss) to average net assets would have been 1.11%.
C Amount represents less than $.005 per share.
D Total returns for periods of less than one year are not annualized.
E Total returns would have been lower if certain expenses had not been reduced during the applicable periods shown.
F Fees and expenses of any underlying Fidelity Central Funds are not included in the Fund's expense ratio. The Fund indirectly bears its proportionate share of the expenses of any underlying Fidelity Central Funds.
G Expense ratios reflect operating expenses of the class. Expenses before reductions do not reflect amounts reimbursed by the investment adviser or reductions from brokerage service arrangements or reductions from other expense offset arrangements and do not represent the amount paid by the class during periods when reimbursements or reductions occur. Expenses net of fee waivers reflect expenses after reimbursement by the investment adviser but prior to reductions from brokerage service arrangements or other expense offset arrangements. Expenses net of all reductions represent the net expenses paid by the class.
H Annualized
I Amount does not include the portfolio activity of any underlying Fidelity Central Funds.
See accompanying notes which are an integral part of the financial statements.
Notes to Financial Statements (Unaudited)
For the period ended April 30, 2016
1. Organization.
Fidelity International Small Cap Opportunities Fund (the Fund) is a fund of Fidelity Investment Trust (the Trust) and is authorized to issue an unlimited number of shares. The Trust is registered under the Investment Company Act of 1940, as amended (the 1940 Act), as an open-end management investment company organized as a Massachusetts business trust. The Fund offers Class A, Class T, Class C, International Small Cap Opportunities and Class I shares, each of which, along with Class B shares, has equal rights as to assets and voting privileges. Class B shares are closed to new accounts and additional purchases, except for exchanges and reinvestments. Each class has exclusive voting rights with respect to matters that affect that class. Class B shares will automatically convert to Class A shares after a maximum holding period of seven years from the initial date of purchase.
During the period, the Board of Trustees approved the conversion of all existing Class B shares into Class A shares, effective on or about July 1, 2016, regardless of the length of times shares have been held.
2. Investments in Fidelity Central Funds.
The Fund invests in Fidelity Central Funds, which are open-end investment companies generally available only to other investment companies and accounts managed by the investment adviser and its affiliates. The Fund's Schedule of Investments lists each of the Fidelity Central Funds held as of period end, if any, as an investment of the Fund, but does not include the underlying holdings of each Fidelity Central Fund. As an Investing Fund, the Fund indirectly bears its proportionate share of the expenses of the underlying Fidelity Central Funds.
The Money Market Central Funds seek preservation of capital and current income and are managed by Fidelity Investments Money Management, Inc. (FIMM), an affiliate of the investment adviser. Annualized expenses of the Money Market Central Funds as of their most recent shareholder report date are less than .005%.
A complete unaudited list of holdings for each Fidelity Central Fund is available upon request or at the Securities and Exchange Commission (the SEC) website at www.sec.gov. In addition, the financial statements of the Fidelity Central Funds are available on the SEC website or upon request.
3. Significant Accounting Policies.
The financial statements have been prepared in conformity with accounting principles generally accepted in the United States of America (GAAP), which require management to make certain estimates and assumptions at the date of the financial statements. Actual results could differ from those estimates. Subsequent events, if any, through the date that the financial statements were issued have been evaluated in the preparation of the financial statements. The following summarizes the significant accounting policies of the Fund:
Investment Valuation. Investments are valued as of 4:00 p.m. Eastern time on the last calendar day of the period. The Board of Trustees (the Board) has delegated the day to day responsibility for the valuation of the Fund's investments to the Fidelity Management & Research Company (FMR)Fair Value Committee (the Committee). In accordance with valuation policies and procedures approved by the Board, the Fund attempts to obtain prices from one or more third party pricing vendors or brokers to value its investments. When current market prices, quotations or currency exchange rates are not readily available or reliable, investments will be fair valued in good faith by the Committee, in accordance with procedures adopted by the Board. Factors used in determining fair value vary by investment type and may include market or investment specific events. The frequency with which these procedures are used cannot be predicted and they may be utilized to a significant extent. The Committee oversees the Fund's valuation policies and procedures and reports to the Board on the Committee's activities and fair value determinations. The Board monitors the appropriateness of the procedures used in valuing the Fund's investments and ratifies the fair value determinations of the Committee.
The Fund categorizes the inputs to valuation techniques used to value its investments into a disclosure hierarchy consisting of three levels as shown below:
- Level 1 – quoted prices in active markets for identical investments
- Level 2 – other significant observable inputs (including quoted prices for similar investments, interest rates, prepayment speeds, etc.)
- Level 3 – unobservable inputs (including the Fund's own assumptions based on the best information available)
Valuation techniques used to value the Fund's investments by major category are as follows:
Equity securities, including restricted securities, for which market quotations are readily available, are valued at the last reported sale price or official closing price as reported by a third party pricing vendor on the primary market or exchange on which they are traded and are categorized as Level 1 in the hierarchy. In the event there were no sales during the day or closing prices are not available, securities are valued at the last quoted bid price or may be valued using the last available price and are generally categorized as Level 2 in the hierarchy. For foreign equity securities, when market or security specific events arise, comparisons to the valuation of American Depositary Receipts (ADRs), futures contracts, Exchange-Traded Funds (ETFs) and certain indexes as well as quoted prices for similar securities may be used and would be categorized as Level 2 in the hierarchy. Utilizing these techniques may result in transfers between Level 1 and Level 2. For equity securities, including restricted securities, where observable inputs are limited, assumptions about market activity and risk are used and these securities may be categorized as Level 3 in the hierarchy.
Investments in open-end mutual funds, including the Fidelity Central Funds, are valued at their closing net asset value (NAV) each business day and are categorized as Level 1 in the hierarchy.
Changes in valuation techniques may result in transfers in or out of an assigned level within the disclosure hierarchy. The aggregate value of investments by input level as of April 30, 2016, including information on transfers between Levels 1 and 2 is included at the end of the Fund's Schedule of Investments.
Foreign Currency. The Fund may use foreign currency contracts to facilitate transactions in foreign-denominated securities. Gains and losses from these transactions may arise from changes in the value of the foreign currency or if the counterparties do not perform under the contracts' terms.
Foreign-denominated assets, including investment securities, and liabilities are translated into U.S. dollars at the exchange rates at period end. Purchases and sales of investment securities, income and dividends received and expenses denominated in foreign currencies are translated into U.S. dollars at the exchange rate in effect on the transaction date.
The effects of exchange rate fluctuations on investments are included with the net realized and unrealized gain (loss) on investment securities. Other foreign currency transactions resulting in realized and unrealized gain (loss) are disclosed separately.
Investment Transactions and Income. For financial reporting purposes, the Fund's investment holdings and NAV include trades executed through the end of the last business day of the period. The NAV per share for processing shareholder transactions is calculated as of the close of business of the New York Stock Exchange (NYSE), normally 4:00 p.m. Eastern time and includes trades executed through the end of the prior business day. Gains and losses on securities sold are determined on the basis of identified cost. Dividend income is recorded on the ex-dividend date, except for certain dividends from foreign securities where the ex-dividend date may have passed, which are recorded as soon as the Fund is informed of the ex-dividend date. Non-cash dividends included in dividend income, if any, are recorded at the fair market value of the securities received. Income and capital gain distributions from Fidelity Central Funds, if any, are recorded on the ex-dividend date. Distributions received on securities that represent a return of capital or capital gain are recorded as a reduction of cost of investments and/or as a realized gain. Subsequent to ex-dividend date the Fund determines the components of these distributions, based upon receipt of tax filings or other correspondence relating to the underlying investment. Investment income is recorded net of foreign taxes withheld where recovery of such taxes is uncertain.
Class Allocations and Expenses. Investment income, realized and unrealized capital gains and losses, common expenses of the Fund, and certain fund-level expense reductions, if any, are allocated daily on a pro-rata basis to each class based on the relative net assets of each class to the total net assets of the Fund. Each class differs with respect to transfer agent and distribution and service plan fees incurred. Certain expense reductions may also differ by class. For the reporting period, the allocated portion of income and expenses to each class as a percent of its average net assets may vary due to the timing of recording these transactions in relation to fluctuating net assets of the classes. Expenses directly attributable to a fund are charged to that fund. Expenses attributable to more than one fund are allocated among the respective funds on the basis of relative net assets or other appropriate methods. Expense estimates are accrued in the period to which they relate and adjustments are made when actual amounts are known.
Income Tax Information and Distributions to Shareholders. Each year, the Fund intends to qualify as a regulated investment company under Subchapter M of the Internal Revenue Code, including distributing substantially all of its taxable income and realized gains. As a result, no provision for U.S. Federal income taxes is required. The Fund files a U.S. federal tax return, in addition to state and local tax returns as required. The Fund's federal income tax returns are subject to examination by the Internal Revenue Service (IRS) for a period of three fiscal years after they are filed. State and local tax returns may be subject to examination for an additional fiscal year depending on the jurisdiction. Foreign taxes are provided for based on the Fund's understanding of the tax rules and rates that exist in the foreign markets in which it invests.
Distributions are declared and recorded on the ex-dividend date. Income dividends and capital gain distributions are declared separately for each class. Income and capital gain distributions are determined in accordance with income tax regulations, which may differ from GAAP.
Capital accounts within the financial statements are adjusted for permanent book-tax differences. These adjustments have no impact on net assets or the results of operations. Capital accounts are not adjusted for temporary book-tax differences which will reverse in a subsequent period.
Book-tax differences are primarily due to foreign currency transactions, partnerships, passive foreign investment companies (PFIC), capital loss carryforwards and losses deferred due to wash sales.
The federal tax cost of investment securities and unrealized appreciation (depreciation) as of period end were as follows:
| Gross unrealized appreciation | $176,851,154 |
| Gross unrealized depreciation | (57,863,025) |
| Net unrealized appreciation (depreciation) on securities | $118,988,129 |
| Tax cost | $1,056,265,672 |
Capital loss carryforwards are only available to offset future capital gains of the Fund to the extent provided by regulations and may be limited. Under the Regulated Investment Company Modernization Act of 2010 (the Act), the Fund is permitted to carry forward capital losses incurred in taxable years beginning after December 22, 2010 for an unlimited period and such capital losses are required to be used prior to any losses that expire. The capital loss carryforward information presented below, including any applicable limitation, is estimated as of prior fiscal period end and is subject to adjustment.
| Fiscal year of expiration |
| 2017 | $(252,792,060) |
Short-Term Trading (Redemption) Fees. Shares held by investors in the Fund less than 90 days may have been subject to a redemption fee equal to 2.00% of the NAV of shares redeemed. All redemption fees, which reduce the proceeds of the shareholder redemption, are retained by the Fund and accounted for as an addition to paid in capital.
4. Purchases and Sales of Investments.
Purchases and sales of securities, other than short-term securities, aggregated $281,152,699 and $93,148,449, respectively.
5. Fees and Other Transactions with Affiliates.
Management Fee. Fidelity Management & Research Company (the investment adviser) and its affiliates provide the Fund with investment management related services for which the Fund pays a monthly management fee. The management fee is the sum of an individual fund fee rate that is based on an annual rate of .60% of the Fund's average net assets and an annualized group fee rate that averaged .25% during the period. The group fee rate is based upon the average net assets of all the mutual funds advised by the investment adviser, including any mutual funds previously advised by the investment adviser that are currently advised by Fidelity SelectCo, LLC, an affiliate of the investment adviser. The group fee rate decreases as assets under management increase and increases as assets under management decrease. In addition, the management fee is subject to a performance adjustment (up to a maximum of +/- .20% of the Fund's average net assets over a 36 month performance period). The upward or downward adjustment to the management fee is based on the relative investment performance of International Small Cap Opportunities as compared to its benchmark index, the MSCI EAFE Small Cap Index, over the same 36 month performance period. For the reporting period, the total annualized management fee rate, including the performance adjustment, was .89% of the Fund's average net assets. The performance adjustment included in the management fee rate may be higher or lower than the maximum performance adjustment rate due to the difference between the average net assets for the reporting and performance periods.
Distribution and Service Plan Fees. In accordance with Rule 12b-1 of the 1940 Act, the Fund has adopted separate Distribution and Service Plans for each class of shares. Certain classes pay Fidelity Distributors Corporation (FDC), an affiliate of the investment adviser, separate Distribution and Service Fees, each of which is based on an annual percentage of each class' average net assets. In addition, FDC may pay financial intermediaries for selling shares of the Fund and providing shareholder support services. For the period, the Distribution and Service Fee rates, total fees and amounts retained by FDC were as follows:
| Distribution Fee | Service Fee | Total Fees | Retained by FDC | |
| Class A | -% | .25% | $58,445 | $2,292 |
| Class T | .25% | .25% | 33,578 | – |
| Class B | .75% | .25% | 2,413 | 1,810 |
| Class C | .75% | .25% | 84,500 | 22,481 |
| $178,936 | $26,583 |
Sales Load. FDC may receive a front-end sales charge of up to 5.75% for selling Class A shares and 3.50% for selling Class T shares, some of which is paid to financial intermediaries for selling shares of the Fund. Depending on the holding period, FDC may receive contingent deferred sales charges levied on Class A, Class T, Class B, and Class C redemptions. The deferred sales charges range from 5.00% to 1.00% for Class B shares, 1.00% for Class C shares, 1.00% for certain purchases of Class A shares and .25% for certain purchases of Class T shares.
For the period, sales charge amounts retained by FDC were as follows:
| Retained by FDC | |
| Class A | $12,019 |
| Class T | 3,054 |
| Class B(a) | 13 |
| Class C(a) | 2,125 |
| $17,211 |
(a) When Class B and Class C shares are initially sold, FDC pays commissions from its own resources to financial intermediaries through which the sales are made.
Transfer Agent Fees. Fidelity Investments Institutional Operations Company, Inc., (FIIOC), an affiliate of the investment adviser, is the transfer, dividend disbursing and shareholder servicing agent for each class of the Fund. FIIOC receives account fees and asset-based fees that vary according to the account size and type of account of the shareholders of the respective classes of the Fund. FIIOC pays for typesetting, printing and mailing of shareholder reports, except proxy statements.
For the period, transfer agent fees for each class were as follows:
| Amount | % of Class-Level Average Net Assets(a) | |
| Class A | $57,114 | .24 |
| Class T | 21,051 | .31 |
| Class B | 732 | .30 |
| Class C | 24,999 | .30 |
| International Small Cap Opportunities | 936,327 | .22 |
| Class I | 129,174 | .20 |
| $1,169,397 |
(a) Annualized
Accounting and Security Lending Fees. Fidelity Service Company, Inc. (FSC), an affiliate of the investment adviser, maintains the Fund's accounting records. The accounting fee is based on the level of average net assets for each month. Under a separate contract, FSC administers the security lending program. The security lending fee is based on the number and duration of lending transactions.
Brokerage Commissions. The Fund placed a portion of its portfolio transactions with brokerage firms which are affiliates of the investment adviser. Brokerage commissions are included in net realized gain (loss) and change in net unrealized appreciation (depreciation) in the Statement of Operations. The commissions paid to these affiliated firms were $611 for the period.
Interfund Trades. The Fund may purchase from or sell securities to other Fidelity Funds under procedures adopted by the Board. The procedures have been designed to ensure these interfund trades are executed in accordance with Rule 17a-7 of the 1940 Act. Interfund trades are included within the respective purchases and sales amounts shown in the Purchases and Sales of Investments note.
6. Committed Line of Credit.
The Fund participates with other funds managed by the investment adviser or an affiliate in a $4.25 billion credit facility (the "line of credit") to be utilized for temporary or emergency purposes to fund shareholder redemptions or for other short-term liquidity purposes. The Fund has agreed to pay commitment fees on its pro-rata portion of the line of credit, which amounted to $918 and is reflected in Miscellaneous expenses on the Statement of Operations. During the period, the Fund did not borrow on this line of credit.
7. Security Lending.
The Fund lends portfolio securities through a lending agent from time to time in order to earn additional income. For equity securities, a lending agent is used and may loan securities to certain qualified borrowers, including Fidelity Capital Markets (FCM), a broker-dealer affiliated with the Fund. On the settlement date of the loan, the Fund receives collateral (in the form of U.S. Treasury obligations, letters of credit and/or cash) against the loaned securities and maintains collateral in an amount not less than 100% of the market value of the loaned securities during the period of the loan. The market value of the loaned securities is determined at the close of business of the Fund and any additional required collateral is delivered to the Fund on the next business day. The Fund or borrower may terminate the loan at any time, and if the borrower defaults on its obligation to return the securities loaned because of insolvency or other reasons, the Fund may apply collateral received from the borrower against the obligation. The Fund may experience delays and costs in recovering the securities loaned. Any cash collateral received is invested in the Fidelity Securities Lending Cash Central Fund. The value of loaned securities and cash collateral at period end are disclosed on the Fund's Statement of Assets and Liabilities. At period end, there were no security loans outstanding with FCM. Security lending income represents the income earned on investing cash collateral, less rebates paid to borrowers and any lending agent fees associated with the loan, plus any premium payments received for lending certain types of securities. Security lending income is presented in the Statement of Operations as a component of income from Fidelity Central Funds. Total security lending income during the period amounted to $77,863, including $1,988 from securities loaned to FCM.
8. Expense Reductions.
Commissions paid to certain brokers with whom the investment adviser, or its affiliates, places trades on behalf of the Fund include an amount in addition to trade execution, which may be rebated back to the Fund to offset certain expenses. This amount totaled $705 for the period. Through arrangements with the Fund's custodian, credits realized as a result of certain uninvested cash balances were used to reduce the Fund's expenses. During the period, these credits reduced the Fund's expenses by $47.
In addition, during the period the investment adviser reimbursed and/or waived a portion of fund- level operating expenses in the amount of $3,653.
9. Distributions to Shareholders.
Distributions to shareholders of each class were as follows:
| Six months ended April 30, 2016 | Year ended October 31, 2015 | |
| From net investment income | ||
| Class A | $159,395 | $91,925 |
| Class T | 9,385 | 4,261 |
| International Small Cap Opportunities | 3,989,748 | 3,599,410 |
| Class I | 694,163 | 286,715 |
| Total | $4,852,691 | $3,982,311 |
| From net realized gain | ||
| Class A | $214,570 | $38,609 |
| Class T | 65,696 | 14,913 |
| Class C | 66,143 | – |
| International Small Cap Opportunities | 3,723,825 | 839,863 |
| Class I | 585,439 | 56,271 |
| Total | $4,655,673 | $949,656 |
10. Share Transactions.
Share transactions for each class were as follows and may contain automatic conversions between classes or exchanges between affiliated funds:
| Shares | Shares | Dollars | Dollars | |
| Six months ended April 30, 2016 | Year ended October 31, 2015 | Six months ended April 30, 2016 | Year ended October 31, 2015 | |
| Class A | ||||
| Shares sold | 950,569 | 1,605,762 | $13,701,055 | $23,674,805 |
| Reinvestment of distributions | 24,184 | 9,185 | 359,376 | 124,545 |
| Shares redeemed | (419,609) | (582,997) | (5,931,692) | (8,244,833) |
| Net increase (decrease) | 555,144 | 1,031,950 | $8,128,739 | $15,554,517 |
| Class T | ||||
| Shares sold | 160,496 | 309,765 | $2,280,756 | $4,543,322 |
| Reinvestment of distributions | 5,021 | 1,404 | 74,158 | 18,926 |
| Shares redeemed | (131,388) | (134,926) | (1,815,377) | (1,907,198) |
| Net increase (decrease) | 34,129 | 176,243 | $539,537 | $2,655,050 |
| Class B | ||||
| Shares sold | 3,601 | 9,791 | $51,565 | $136,845 |
| Shares redeemed | (21,080) | (23,615) | (295,529) | (329,326) |
| Net increase (decrease) | (17,479) | (13,824) | $(243,964) | $(192,481) |
| Class C | ||||
| Shares sold | 212,639 | 838,785 | $2,969,254 | $12,019,463 |
| Reinvestment of distributions | 4,483 | – | 64,648 | – |
| Shares redeemed | (260,791) | (258,762) | (3,487,650) | (3,578,649) |
| Net increase (decrease) | (43,669) | 580,023 | $(453,748) | $8,440,814 |
| International Small Cap Opportunities | ||||
| Shares sold | 21,099,085 | 18,903,102 | $306,137,737 | $282,906,392 |
| Reinvestment of distributions | 402,267 | 239,997 | 6,034,011 | 3,280,752 |
| Shares redeemed | (9,435,850) | (10,354,861) | (135,324,878) | (146,998,081) |
| Net increase (decrease) | 12,065,502 | 8,788,238 | $176,846,870 | $139,189,063 |
| Class I | ||||
| Shares sold | 2,990,658 | 7,108,830 | $43,408,539 | $102,023,907 |
| Reinvestment of distributions | 75,351 | 23,468 | 1,129,506 | 320,812 |
| Shares redeemed | (1,586,288) | (1,195,608) | (22,479,053) | (17,368,101) |
| Net increase (decrease) | 1,479,721 | 5,936,690 | $22,058,992 | $84,976,618 |
11. Other.
The Fund's organizational documents provide former and current trustees and officers with a limited indemnification against liabilities arising in connection with the performance of their duties to the Fund. In the normal course of business, the Fund may also enter into contracts that provide general indemnifications. The Fund's maximum exposure under these arrangements is unknown as this would be dependent on future claims that may be made against the Fund. The risk of material loss from such claims is considered remote.
Mutual funds managed by the investment adviser or its affiliates were the owners of record, in the aggregate, of approximately 22% of the total outstanding shares of the Fund.
Shareholder Expense Example
As a shareholder of the Fund, you incur two types of costs: (1) transaction costs, including sales charges (loads) on purchase payments or redemption proceeds, redemption fees and (2) ongoing costs, including management fees, distribution and/or service (12b-1) fees and other Fund expenses. This Example is intended to help you understand your ongoing costs (in dollars) of investing in the Fund and to compare these costs with the ongoing costs of investing in other mutual funds.
The Example is based on an investment of $1,000 invested at the beginning of the period and held for the entire period (November 1, 2015 to April 30, 2016).
Actual Expenses
The first line of the accompanying table for each class of the Fund provides information about actual account values and actual expenses. You may use the information in this line, together with the amount you invested, to estimate the expenses that you paid over the period. Simply divide your account value by $1,000.00 (for example, an $8,600 account value divided by $1,000.00 = 8.6), then multiply the result by the number in the first line for a class of the Fund under the heading entitled "Expenses Paid During Period" to estimate the expenses you paid on your account during this period. A small balance maintenance fee of $12.00 that is charged once a year may apply for certain accounts with a value of less than $2,000. This fee is not included in the table below. If it was, the estimate of expenses you paid during the period would be higher, and your ending account value lower, by this amount. In addition, the Fund, as a shareholder in the underlying Fidelity Central Funds, will indirectly bear its pro-rata share of the fees and expenses incurred by the underlying Fidelity Central Funds. These fees and expenses are not included in the Fund's annualized expense ratio used to calculate the expense estimate in the table below.
Hypothetical Example for Comparison Purposes
The second line of the accompanying table for each class of the Fund provides information about hypothetical account values and hypothetical expenses based on a Class' actual expense ratio and an assumed rate of return of 5% per year before expenses, which is not the Class' actual return. The hypothetical account values and expenses may not be used to estimate the actual ending account balance or expenses you paid for the period. You may use this information to compare the ongoing costs of investing in the Fund and other funds. To do so, compare this 5% hypothetical example with the 5% hypothetical examples that appear in the shareholder reports of the other funds. A small balance maintenance fee of $12.00 that is charged once a year may apply for certain accounts with a value of less than $2,000. This fee is not included in the table below. If it was, the estimate of expenses you paid during the period would be higher, and your ending account value lower, by this amount. In addition, the Fund, as a shareholder in the underlying Fidelity Central Funds, will indirectly bear its pro-rata share of the fees and expenses incurred by the underlying Fidelity Central Funds. These fees and expenses are not included in the Fund's annualized expense ratio used to calculate the expense estimate in the table below.
Please note that the expenses shown in the table are meant to highlight your ongoing costs only and do not reflect any transaction costs. Therefore, the second line of the table is useful in comparing ongoing costs only, and will not help you determine the relative total costs of owning different funds. In addition, if these transactional costs were included, your costs would have been higher.
| Annualized Expense Ratio-A | Beginning Account Value November 1, 2015 | Ending Account Value April 30, 2016 | Expenses Paid During Period-B November 1, 2015 to April 30, 2016 | |
| Class A | 1.47% | |||
| Actual | $1,000.00 | $1,008.90 | $7.34 | |
| Hypothetical-C | $1,000.00 | $1,017.55 | $7.37 | |
| Class T | 1.78% | |||
| Actual | $1,000.00 | $1,007.50 | $8.88 | |
| Hypothetical-C | $1,000.00 | $1,016.01 | $8.92 | |
| Class B | 2.28% | |||
| Actual | $1,000.00 | $1,004.90 | $11.37 | |
| Hypothetical-C | $1,000.00 | $1,013.53 | $11.41 | |
| Class C | 2.27% | |||
| Actual | $1,000.00 | $1,005.10 | $11.32 | |
| Hypothetical-C | $1,000.00 | $1,013.58 | $11.36 | |
| International Small Cap Opportunities | 1.19% | |||
| Actual | $1,000.00 | $1,010.30 | $5.95 | |
| Hypothetical-C | $1,000.00 | $1,018.95 | $5.97 | |
| Class I | 1.17% | |||
| Actual | $1,000.00 | $1,010.20 | $5.85 | |
| Hypothetical-C | $1,000.00 | $1,019.05 | $5.87 |
A Annualized expense ratio reflects expenses net of applicable fee waivers.
B Expenses are equal to each Class' annualized expense ratio, multiplied by the average account value over the period, multiplied by 182/366 (to reflect the one-half year period).
C 5% return per year before expenses
![]()
Corporate Headquarters
245 Summer St.
Boston, MA 02210
www.fidelity.com
ILS-SANN-0616
1.815078.110
Fidelity Advisor® International Growth Fund - Semi-Annual Report April 30, 2016 Class Z is a class of Fidelity® International Growth Fund |
|
Contents
To view a fund's proxy voting guidelines and proxy voting record for the 12-month period ended June 30, visit http://www.fidelity.com/proxyvotingresults or visit the Securities and Exchange Commission's (SEC) web site at http://www.sec.gov.
You may also call 1-877-208-0098 to request a free copy of the proxy voting guidelines.
Standard & Poor's, S&P and S&P 500 are registered service marks of The McGraw-Hill Companies, Inc. and have been licensed for use by Fidelity Distributors Corporation.
Other third-party marks appearing herein are the property of their respective owners.
All other marks appearing herein are registered or unregistered trademarks or service marks of FMR LLC or an affiliated company. © 2016 FMR LLC. All rights reserved.
This report and the financial statements contained herein are submitted for the general information of the shareholders of the Fund. This report is not authorized for distribution to prospective investors in the Fund unless preceded or accompanied by an effective prospectus.
A fund files its complete schedule of portfolio holdings with the SEC for the first and third quarters of each fiscal year on Form N-Q. Forms N-Q are available on the SEC’s web site at http://www.sec.gov. A fund's Forms N-Q may be reviewed and copied at the SEC’s Public Reference Room in Washington, DC. Information regarding the operation of the SEC's Public Reference Room may be obtained by calling 1-800-SEC-0330.
For a complete list of a fund's portfolio holdings, view the most recent holdings listing, semiannual report, or annual report on Fidelity's web site at http://www.fidelity.com, http://www.advisor.fidelity.com, or http://www.401k.com, as applicable.
NOT FDIC INSURED •MAY LOSE VALUE •NO BANK GUARANTEE
Neither the Fund nor Fidelity Distributors Corporation is a bank.
Investment Summary (Unaudited)
Geographic Diversification (% of fund's net assets)
| As of April 30, 2016 | ||
| United States of America* | 20.8% | |
| Japan | 14.1% | |
| United Kingdom | 13.2% | |
| Switzerland | 12.7% | |
| Spain | 4.9% | |
| Belgium | 4.5% | |
| Sweden | 4.4% | |
| Australia | 4.0% | |
| Denmark | 3.3% | |
| Other | 18.1% | |

* Includes Short-Term investments and Net Other Assets (Liabilities).
Percentages are based on country or territory of incorporation and are adjusted for the effect of futures contracts, if applicable.
| As of October 31, 2015 | ||
| United States of America* | 17.7% | |
| United Kingdom | 14.4% | |
| Japan | 14.0% | |
| Switzerland | 13.6% | |
| Sweden | 6.1% | |
| Spain | 4.5% | |
| Belgium | 4.2% | |
| Australia | 3.4% | |
| Denmark | 3.3% | |
| Other | 18.8% | |
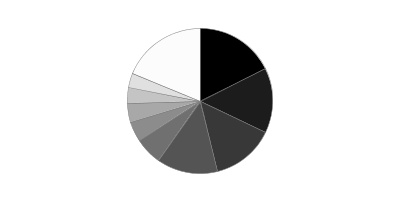
* Includes Short-Term investments and Net Other Assets (Liabilities).
Percentages are based on country or territory of incorporation and are adjusted for the effect of futures contracts, if applicable.
Asset Allocation as of April 30, 2016
| % of fund's net assets | % of fund's net assets 6 months ago | |
| Stocks | 97.3 | 97.7 |
| Short-Term Investments and Net Other Assets (Liabilities) | 2.7 | 2.3 |
Top Ten Stocks as of April 30, 2016
| % of fund's net assets | % of fund's net assets 6 months ago | |
| Nestle SA (Switzerland, Food Products) | 4.9 | 3.0 |
| Roche Holding AG (participation certificate) (Switzerland, Pharmaceuticals) | 3.5 | 3.6 |
| Anheuser-Busch InBev SA NV (Belgium, Beverages) | 3.5 | 2.6 |
| Reckitt Benckiser Group PLC (United Kingdom, Household Products) | 3.2 | 2.8 |
| CSL Ltd. (Australia, Biotechnology) | 2.9 | 2.2 |
| Novartis AG (Switzerland, Pharmaceuticals) | 2.9 | 3.7 |
| Novo Nordisk A/S Series B sponsored ADR (Denmark, Pharmaceuticals) | 2.8 | 2.5 |
| Inditex SA (Spain, Specialty Retail) | 2.6 | 2.8 |
| ASSA ABLOY AB (B Shares) (Sweden, Building Products) | 2.6 | 2.2 |
| InterContinental Hotel Group PLC ADR (United Kingdom, Hotels, Restaurants & Leisure) | 2.3 | 2.0 |
| 31.2 |
Market Sectors as of April 30, 2016
| % of fund's net assets | % of fund's net assets 6 months ago | |
| Consumer Staples | 20.4 | 15.3 |
| Health Care | 19.0 | 18.5 |
| Information Technology | 14.2 | 11.7 |
| Financials | 13.5 | 18.1 |
| Consumer Discretionary | 13.3 | 15.1 |
| Industrials | 11.5 | 12.5 |
| Materials | 4.7 | 6.0 |
| Energy | 0.4 | 0.3 |
| Telecommunication Services | 0.3 | 0.2 |
Investments April 30, 2016 (Unaudited)
Showing Percentage of Net Assets
| Common Stocks - 97.3% | |||
| Shares | Value | ||
| Australia - 4.0% | |||
| CSL Ltd. | 609,912 | $48,776,866 | |
| Sydney Airport unit | 1,123,380 | 5,816,843 | |
| Transurban Group unit | 1,422,746 | 12,527,069 | |
| TOTAL AUSTRALIA | 67,120,778 | ||
| Austria - 1.2% | |||
| Andritz AG | 351,321 | 19,675,520 | |
| Belgium - 4.5% | |||
| Anheuser-Busch InBev SA NV | 469,291 | 58,088,795 | |
| KBC Groep NV | 302,468 | 16,981,098 | |
| TOTAL BELGIUM | 75,069,893 | ||
| Canada - 0.4% | |||
| Pason Systems, Inc. | 495,200 | 7,198,891 | |
| Cayman Islands - 0.9% | |||
| 58.com, Inc. ADR (a) | 128,870 | 7,042,746 | |
| Alibaba Group Holding Ltd. sponsored ADR (a) | 99,200 | 7,632,448 | |
| TOTAL CAYMAN ISLANDS | 14,675,194 | ||
| Denmark - 3.3% | |||
| Jyske Bank A/S (Reg.) | 202,800 | 8,302,703 | |
| Novo Nordisk A/S Series B sponsored ADR (b) | 826,700 | 46,121,593 | |
| TOTAL DENMARK | 54,424,296 | ||
| Finland - 0.3% | |||
| Tikkurila Oyj | 283,000 | 4,961,192 | |
| France - 1.1% | |||
| Essilor International SA | 135,658 | 17,560,644 | |
| Germany - 3.0% | |||
| Bayer AG | 155,100 | 17,892,923 | |
| SAP AG | 399,516 | 31,346,444 | |
| TOTAL GERMANY | 49,239,367 | ||
| Hong Kong - 1.9% | |||
| AIA Group Ltd. | 5,289,400 | 31,654,975 | |
| India - 0.5% | |||
| Housing Development Finance Corp. Ltd. | 562,904 | 9,223,760 | |
| Ireland - 3.1% | |||
| CRH PLC sponsored ADR | 909,066 | 26,462,911 | |
| James Hardie Industries PLC: | |||
| CDI | 1,130,041 | 15,921,470 | |
| sponsored ADR | 601,500 | 8,433,030 | |
| TOTAL IRELAND | 50,817,411 | ||
| Isle of Man - 0.5% | |||
| Playtech Ltd. | 654,346 | 7,691,806 | |
| Israel - 0.3% | |||
| Azrieli Group | 118,800 | 4,718,361 | |
| Italy - 0.7% | |||
| Azimut Holding SpA | 204,600 | 5,149,414 | |
| Interpump Group SpA | 511,426 | 7,361,097 | |
| TOTAL ITALY | 12,510,511 | ||
| Japan - 14.1% | |||
| Astellas Pharma, Inc. | 2,477,400 | 33,401,778 | |
| Coca-Cola Central Japan Co. Ltd. | 190,700 | 3,493,796 | |
| DENSO Corp. | 727,400 | 27,649,326 | |
| East Japan Railway Co. | 184,100 | 16,196,396 | |
| Hoya Corp. | 336,900 | 12,901,342 | |
| Japan Tobacco, Inc. | 589,000 | 24,065,326 | |
| Keyence Corp. | 40,062 | 24,012,883 | |
| Mitsui Fudosan Co. Ltd. | 836,000 | 20,417,154 | |
| Nintendo Co. Ltd. | 61,000 | 8,259,462 | |
| Olympus Corp. | 281,300 | 10,958,499 | |
| OSG Corp. | 344,800 | 6,407,632 | |
| Seven Bank Ltd. | 2,658,200 | 11,295,245 | |
| Shinsei Bank Ltd. | 5,146,000 | 7,212,512 | |
| SHO-BOND Holdings Co. Ltd. | 182,600 | 7,900,949 | |
| USS Co. Ltd. | 1,301,100 | 20,581,249 | |
| TOTAL JAPAN | 234,753,549 | ||
| Kenya - 0.3% | |||
| Safaricom Ltd. | 30,975,500 | 5,244,367 | |
| Korea (South) - 0.9% | |||
| BGFretail Co. Ltd. | 54,496 | 8,847,410 | |
| NAVER Corp. | 9,215 | 5,445,310 | |
| TOTAL KOREA (SOUTH) | 14,292,720 | ||
| Mexico - 0.6% | |||
| Fomento Economico Mexicano S.A.B. de CV sponsored ADR | 106,355 | 9,913,350 | |
| South Africa - 1.3% | |||
| Clicks Group Ltd. | 755,618 | 5,518,807 | |
| Naspers Ltd. Class N | 112,300 | 15,408,694 | |
| TOTAL SOUTH AFRICA | 20,927,501 | ||
| Spain - 4.9% | |||
| Amadeus IT Holding SA Class A | 514,500 | 23,411,956 | |
| Hispania Activos Inmobiliarios SA (a) | 215,259 | 3,154,974 | |
| Inditex SA | 1,361,301 | 43,699,772 | |
| Merlin Properties Socimi SA | 378,500 | 4,399,024 | |
| Prosegur Compania de Seguridad SA (Reg.) | 1,127,849 | 6,521,790 | |
| TOTAL SPAIN | 81,187,516 | ||
| Sweden - 4.4% | |||
| ASSA ABLOY AB (B Shares) (b) | 2,033,083 | 42,634,121 | |
| Fagerhult AB | 409,153 | 9,527,687 | |
| Intrum Justitia AB (b) | 112,700 | 4,044,623 | |
| Svenska Handelsbanken AB (A Shares) (b) | 1,313,920 | 17,527,894 | |
| TOTAL SWEDEN | 73,734,325 | ||
| Switzerland - 12.7% | |||
| Nestle SA | 1,091,098 | 81,439,212 | |
| Novartis AG | 625,183 | 47,577,841 | |
| Roche Holding AG (participation certificate) | 232,368 | 58,791,248 | |
| Schindler Holding AG: | |||
| (participation certificate) | 107,226 | 19,527,137 | |
| (Reg.) | 18,350 | 3,372,360 | |
| TOTAL SWITZERLAND | 210,707,798 | ||
| Taiwan - 1.1% | |||
| Taiwan Semiconductor Manufacturing Co. Ltd. | 3,934,000 | 18,046,275 | |
| United Kingdom - 13.2% | |||
| Associated British Foods PLC | 413,100 | 18,494,337 | |
| Babcock International Group PLC | 400,384 | 5,543,075 | |
| BAE Systems PLC | 1,722,200 | 12,015,201 | |
| Berendsen PLC | 707,573 | 12,199,669 | |
| Howden Joinery Group PLC | 626,100 | 4,519,241 | |
| Informa PLC | 1,396,912 | 13,358,986 | |
| InterContinental Hotel Group PLC ADR (b) | 968,696 | 38,883,457 | |
| Lloyds Banking Group PLC | 7,613,300 | 7,472,538 | |
| Prudential PLC | 1,155,443 | 22,807,906 | |
| Reckitt Benckiser Group PLC | 542,845 | 52,883,360 | |
| Rightmove PLC | 77,900 | 4,391,314 | |
| SABMiller PLC | 292,366 | 17,877,926 | |
| Shaftesbury PLC | 319,433 | 4,247,330 | |
| Unite Group PLC | 476,676 | 4,405,332 | |
| TOTAL UNITED KINGDOM | 219,099,672 | ||
| United States of America - 18.1% | |||
| Alphabet, Inc. Class A | 29,136 | 20,624,792 | |
| Autoliv, Inc. (b) | 198,769 | 24,343,239 | |
| Berkshire Hathaway, Inc. Class B (a) | 129,184 | 18,793,688 | |
| China Biologic Products, Inc. (a) | 87,966 | 10,292,022 | |
| Domino's Pizza, Inc. | 82,990 | 10,031,831 | |
| Martin Marietta Materials, Inc. | 66,400 | 11,236,872 | |
| MasterCard, Inc. Class A | 351,000 | 34,043,490 | |
| McGraw Hill Financial, Inc. | 117,100 | 12,512,135 | |
| Mohawk Industries, Inc. (a) | 117,400 | 22,614,762 | |
| Molson Coors Brewing Co. Class B | 108,600 | 10,385,418 | |
| Moody's Corp. | 94,100 | 9,007,252 | |
| MSCI, Inc. Class A | 103,200 | 7,837,008 | |
| Philip Morris International, Inc. | 210,708 | 20,674,669 | |
| PriceSmart, Inc. | 95,700 | 8,281,878 | |
| ResMed, Inc. | 170,700 | 9,525,060 | |
| Reynolds American, Inc. | 363,200 | 18,014,720 | |
| Sherwin-Williams Co. | 32,600 | 9,366,306 | |
| SS&C Technologies Holdings, Inc. | 178,400 | 10,909,160 | |
| Visa, Inc. Class A | 424,260 | 32,769,842 | |
| TOTAL UNITED STATES OF AMERICA | 301,264,144 | ||
| TOTAL COMMON STOCKS | |||
| (Cost $1,493,495,241) | 1,615,713,816 | ||
| Money Market Funds - 8.3% | |||
| Fidelity Cash Central Fund, 0.38% (c) | 31,871,334 | 31,871,334 | |
| Fidelity Securities Lending Cash Central Fund, 0.42% (c)(d) | 106,690,874 | 106,690,874 | |
| TOTAL MONEY MARKET FUNDS | |||
| (Cost $138,562,208) | 138,562,208 | ||
| TOTAL INVESTMENT PORTFOLIO - 105.6% | |||
| (Cost $1,632,057,449) | 1,754,276,024 | ||
| NET OTHER ASSETS (LIABILITIES) - (5.6)% | (93,656,005) | ||
| NET ASSETS - 100% | $1,660,620,019 |
Categorizations in the Schedule of Investments are based on country or territory of incorporation.
Legend
(a) Non-income producing
(b) Security or a portion of the security is on loan at period end.
(c) Affiliated fund that is generally available only to investment companies and other accounts managed by Fidelity Investments. The rate quoted is the annualized seven-day yield of the fund at period end. A complete unaudited listing of the fund's holdings as of its most recent quarter end is available upon request. In addition, each Fidelity Central Fund's financial statements are available on the SEC's website or upon request.
(d) Investment made with cash collateral received from securities on loan.
Affiliated Central Funds
Information regarding fiscal year to date income earned by the Fund from investments in Fidelity Central Funds is as follows:
| Fund | Income earned |
| Fidelity Cash Central Fund | $72,393 |
| Fidelity Securities Lending Cash Central Fund | 330,325 |
| Total | $402,718 |
Investment Valuation
The following is a summary of the inputs used, as of April 30, 2016, involving the Fund's assets and liabilities carried at fair value. The inputs or methodology used for valuing securities may not be an indication of the risk associated with investing in those securities. For more information on valuation inputs, and their aggregation into the levels used below, please refer to the Investment Valuation section in the accompanying Notes to Financial Statements.
| Valuation Inputs at Reporting Date: | ||||
| Description | Total | Level 1 | Level 2 | Level 3 |
| Investments in Securities: | ||||
| Equities: | ||||
| Consumer Discretionary | $221,090,557 | $172,859,982 | $48,230,575 | $-- |
| Consumer Staples | 337,979,004 | 176,097,310 | 161,881,694 | -- |
| Energy | 7,198,891 | 7,198,891 | -- | -- |
| Financials | 227,120,303 | 108,732,079 | 118,388,224 | -- |
| Health Care | 313,799,816 | 150,169,108 | 163,630,708 | -- |
| Industrials | 191,271,169 | 148,750,991 | 42,520,178 | -- |
| Information Technology | 235,627,928 | 153,962,864 | 81,665,064 | --�� |
| Materials | 76,381,781 | 76,381,781 | -- | -- |
| Telecommunication Services | 5,244,367 | 5,244,367 | -- | -- |
| Money Market Funds | 138,562,208 | 138,562,208 | -- | -- |
| Total Investments in Securities: | $1,754,276,024 | $1,137,959,581 | $616,316,443 | $-- |
The following is a summary of transfers between Level 1 and Level 2 for the period ended April 30, 2016. Transfers are assumed to have occurred at the beginning of the period, and are primarily attributable to the valuation techniques used for foreign equity securities, as discussed in the accompanying Notes to Financial Statements:
| Transfers | Total |
| Level 1 to Level 2 | $0 |
| Level 2 to Level 1 | $144,428,405 |
See accompanying notes which are an integral part of the financial statements.
Financial Statements
Statement of Assets and Liabilities
| April 30, 2016 (Unaudited) | ||
| Assets | ||
| Investment in securities, at value (including securities loaned of $103,770,133) — See accompanying schedule: Unaffiliated issuers (cost $1,493,495,241) | $1,615,713,816 | |
| Fidelity Central Funds (cost $138,562,208) | 138,562,208 | |
| Total Investments (cost $1,632,057,449) | $1,754,276,024 | |
| Foreign currency held at value (cost $11,880) | 11,898 | |
| Receivable for investments sold | 3,654,551 | |
| Receivable for fund shares sold | 4,651,062 | |
| Dividends receivable | 9,823,503 | |
| Distributions receivable from Fidelity Central Funds | 94,556 | |
| Prepaid expenses | 599 | |
| Other receivables | 7,870 | |
| Total assets | 1,772,520,063 | |
| Liabilities | ||
| Payable for investments purchased | $1,891,035 | |
| Payable for fund shares redeemed | 1,836,507 | |
| Accrued management fee | 985,763 | |
| Distribution and service plan fees payable | 103,976 | |
| Other affiliated payables | 304,114 | |
| Other payables and accrued expenses | 87,775 | |
| Collateral on securities loaned, at value | 106,690,874 | |
| Total liabilities | 111,900,044 | |
| Net Assets | $1,660,620,019 | |
| Net Assets consist of: | ||
| Paid in capital | $1,599,467,631 | |
| Undistributed net investment income | 11,086,000 | |
| Accumulated undistributed net realized gain (loss) on investments and foreign currency transactions | (72,316,667) | |
| Net unrealized appreciation (depreciation) on investments and assets and liabilities in foreign currencies | 122,383,055 | |
| Net Assets | $1,660,620,019 | |
| Calculation of Maximum Offering Price | ||
| Class A: | ||
| Net Asset Value and redemption price per share ($227,299,900 ÷ 20,745,349 shares) | $10.96 | |
| Maximum offering price per share (100/94.25 of $10.96) | $11.63 | |
| Class T: | ||
| Net Asset Value and redemption price per share ($28,247,384 ÷ 2,581,799 shares) | $10.94 | |
| Maximum offering price per share (100/96.50 of $10.94) | $11.34 | |
| Class B: | ||
| Net Asset Value and offering price per share ($543,488 ÷ 50,206 shares)(a) | $10.83 | |
| Class C: | ||
| Net Asset Value and offering price per share ($54,803,250 ÷ 5,077,799 shares)(a) | $10.79 | |
| International Growth: | ||
| Net Asset Value, offering price and redemption price per share ($989,531,658 ÷ 89,694,739 shares) | $11.03 | |
| Class I: | ||
| Net Asset Value, offering price and redemption price per share ($344,685,048 ÷ 31,300,215 shares) | $11.01 | |
| Class Z: | ||
| Net Asset Value, offering price and redemption price per share ($15,509,291 ÷ 1,406,850 shares) | $11.02 |
(a) Redemption price per share is equal to net asset value less any applicable contingent deferred sales charge.
See accompanying notes which are an integral part of the financial statements.
Statement of Operations
| Six months ended April 30, 2016 (Unaudited) | ||
| Investment Income | ||
| Dividends | $21,128,805 | |
| Income from Fidelity Central Funds | 402,718 | |
| Income before foreign taxes withheld | 21,531,523 | |
| Less foreign taxes withheld | (2,212,929) | |
| Total income | 19,318,594 | |
| Expenses | ||
| Management fee | ||
| Basic fee | $5,303,523 | |
| Performance adjustment | 109,270 | |
| Transfer agent fees | 1,418,766 | |
| Distribution and service plan fees | 585,143 | |
| Accounting and security lending fees | 345,576 | |
| Custodian fees and expenses | 79,671 | |
| Independent trustees' compensation | 3,216 | |
| Registration fees | 88,683 | |
| Audit | 42,540 | |
| Legal | 2,186 | |
| Miscellaneous | 4,732 | |
| Total expenses before reductions | 7,983,306 | |
| Expense reductions | (16,973) | 7,966,333 |
| Net investment income (loss) | 11,352,261 | |
| Realized and Unrealized Gain (Loss) | ||
| Net realized gain (loss) on: | ||
| Investment securities: | ||
| Unaffiliated issuers | (34,889,540) | |
| Foreign currency transactions | 296,655 | |
| Total net realized gain (loss) | (34,592,885) | |
| Change in net unrealized appreciation (depreciation) on: Investment securities (net of decrease in deferred foreign taxes of $4,737) | (7,895,661) | |
| Assets and liabilities in foreign currencies | 94,033 | |
| Total change in net unrealized appreciation (depreciation) | (7,801,628) | |
| Net gain (loss) | (42,394,513) | |
| Net increase (decrease) in net assets resulting from operations | $(31,042,252) |
See accompanying notes which are an integral part of the financial statements.
Statement of Changes in Net Assets
| Six months ended April 30, 2016 (Unaudited) | Year ended October 31, 2015 | |
| Increase (Decrease) in Net Assets | ||
| Operations | ||
| Net investment income (loss) | $11,352,261 | $10,205,219 |
| Net realized gain (loss) | (34,592,885) | (27,463,177) |
| Change in net unrealized appreciation (depreciation) | (7,801,628) | 41,450,250 |
| Net increase (decrease) in net assets resulting from operations | (31,042,252) | 24,192,292 |
| Distributions to shareholders from net investment income | (9,313,522) | (7,019,924) |
| Distributions to shareholders from net realized gain | (1,062,119) | – |
| Total distributions | (10,375,641) | (7,019,924) |
| Share transactions - net increase (decrease) | 228,113,558 | 519,861,476 |
| Redemption fees | 45,309 | 54,094 |
| Total increase (decrease) in net assets | 186,740,974 | 537,087,938 |
| Net Assets | ||
| Beginning of period | 1,473,879,045 | 936,791,107 |
| End of period (including undistributed net investment income of $11,086,000 and undistributed net investment income of $9,047,261, respectively) | $1,660,620,019 | $1,473,879,045 |
See accompanying notes which are an integral part of the financial statements.
Financial Highlights — Fidelity International Growth Fund Class A
| Six months ended (Unaudited) April 30, | Years ended October 31, | |||||
| 2016 | 2015 | 2014 | 2013 | 2012 | 2011 | |
| Selected Per–Share Data | ||||||
| Net asset value, beginning of period | $11.30 | $11.01 | $10.78 | $8.91 | $8.09 | $8.38 |
| Income from Investment Operations | ||||||
| Net investment income (loss)A | .07 | .07 | .09 | .08 | .08 | .08 |
| Net realized and unrealized gain (loss) | (.35) | .28 | .18 | 1.88 | .81 | (.31) |
| Total from investment operations | (.28) | .35 | .27 | 1.96 | .89 | (.23) |
| Distributions from net investment income | (.05) | (.06) | (.03) | (.08) | (.06) | (.05) |
| Distributions from net realized gain | (.01) | – | (.01) | (.01) | (.01) | (.01) |
| Total distributions | (.06) | (.06) | (.04) | (.09) | (.07) | (.06) |
| Redemption fees added to paid in capitalA,B | – | – | – | – | – | – |
| Net asset value, end of period | $10.96 | $11.30 | $11.01 | $10.78 | $8.91 | $8.09 |
| Total ReturnC,D,E | (2.51)% | 3.20% | 2.54% | 22.18% | 11.10% | (2.76)% |
| Ratios to Average Net AssetsF,G | ||||||
| Expenses before reductions | 1.26%H | 1.26% | 1.35% | 1.44% | 1.58% | 1.77% |
| Expenses net of fee waivers, if any | 1.26%H | 1.26% | 1.35% | 1.43% | 1.45% | 1.45% |
| Expenses net of all reductions | 1.26%H | 1.25% | 1.34% | 1.42% | 1.44% | 1.43% |
| Net investment income (loss) | 1.29%H | .66% | .84% | .80% | .99% | .92% |
| Supplemental Data | ||||||
| Net assets, end of period (000 omitted) | $227,300 | $184,878 | $119,017 | $74,595 | $21,874 | $6,352 |
| Portfolio turnover rateI | 35%H | 26% | 27% | 32% | 32% | 68% |
A Calculated based on average shares outstanding during the period.
B Amount represents less than $.005 per share.
C Total returns for periods of less than one year are not annualized.
D Total returns would have been lower if certain expenses had not been reduced during the applicable periods shown.
E Total returns do not include the effect of the sales charges.
F Fees and expenses of any underlying Fidelity Central Funds are not included in the Fund's expense ratio. The Fund indirectly bears its proportionate share of the expenses of any underlying Fidelity Central Funds.
G Expense ratios reflect operating expenses of the class. Expenses before reductions do not reflect amounts reimbursed by the investment adviser or reductions from brokerage service arrangements or reductions from other expense offset arrangements and do not represent the amount paid by the class during periods when reimbursements or reductions occur. Expenses net of fee waivers reflect expenses after reimbursement by the investment adviser but prior to reductions from brokerage service arrangements or other expense offset arrangements. Expenses net of all reductions represent the net expenses paid by the class.
H Annualized
I Amount does not include the portfolio activity of any underlying Fidelity Central Funds.
See accompanying notes which are an integral part of the financial statements.
Financial Highlights — Fidelity International Growth Fund Class T
| Six months ended (Unaudited) April 30, | Years ended October 31, | |||||
| 2016 | 2015 | 2014 | 2013 | 2012 | 2011 | |
| Selected Per–Share Data | ||||||
| Net asset value, beginning of period | $11.26 | $10.96 | $10.75 | $8.89 | $8.08 | $8.38 |
| Income from Investment Operations | ||||||
| Net investment income (loss)A | .05 | .04 | .06 | .05 | .06 | .06 |
| Net realized and unrealized gain (loss) | (.35) | .27 | .18 | 1.88 | .81 | (.31) |
| Total from investment operations | (.30) | .31 | .24 | 1.93 | .87 | (.25) |
| Distributions from net investment income | (.01) | (.01) | (.02) | (.07) | (.05) | (.04) |
| Distributions from net realized gain | (.01) | – | (.01) | (.01) | (.01) | (.01) |
| Total distributions | (.02) | (.01) | (.03) | (.07)B | (.06) | (.05) |
| Redemption fees added to paid in capitalA,C | – | – | – | – | – | – |
| Net asset value, end of period | $10.94 | $11.26 | $10.96 | $10.75 | $8.89 | $8.08 |
| Total ReturnD,E,F | (2.69)% | 2.85% | 2.21% | 21.91% | 10.82% | (3.03)% |
| Ratios to Average Net AssetsG,H | ||||||
| Expenses before reductions | 1.60%I | 1.58% | 1.65% | 1.69% | 1.85% | 2.03% |
| Expenses net of fee waivers, if any | 1.60%I | 1.58% | 1.65% | 1.69% | 1.70% | 1.70% |
| Expenses net of all reductions | 1.60%I | 1.58% | 1.65% | 1.68% | 1.69% | 1.68% |
| Net investment income (loss) | .95%I | .33% | .53% | .54% | .74% | .67% |
| Supplemental Data | ||||||
| Net assets, end of period (000 omitted) | $28,247 | $28,833 | $26,369 | $23,118 | $10,690 | $2,917 |
| Portfolio turnover rateJ | 35%I | 26% | 27% | 32% | 32% | 68% |
A Calculated based on average shares outstanding during the period.
B Total distributions of $0.07 per share is comprised of distributions from net investment income of $0.69 and distributions from net realized gain of $0.005 per share.
C Amount represents less than $.005 per share.
D Total returns for periods of less than one year are not annualized.
E Total returns would have been lower if certain expenses had not been reduced during the applicable periods shown.
F Total returns do not include the effect of the sales charges.
G Fees and expenses of any underlying Fidelity Central Funds are not included in the Fund's expense ratio. The Fund indirectly bears its proportionate share of the expenses of any underlying Fidelity Central Funds.
H Expense ratios reflect operating expenses of the class. Expenses before reductions do not reflect amounts reimbursed by the investment adviser or reductions from brokerage service arrangements or reductions from other expense offset arrangements and do not represent the amount paid by the class during periods when reimbursements or reductions occur. Expenses net of fee waivers reflect expenses after reimbursement by the investment adviser but prior to reductions from brokerage service arrangements or other expense offset arrangements. Expenses net of all reductions represent the net expenses paid by the class.
I Annualized
J Amount does not include the portfolio activity of any underlying Fidelity Central Funds.
See accompanying notes which are an integral part of the financial statements.
Financial Highlights — Fidelity International Growth Fund Class B
| Six months ended (Unaudited) April 30, | Years ended October 31, | |||||
| 2016 | 2015 | 2014 | 2013 | 2012 | 2011 | |
| Selected Per–Share Data | ||||||
| Net asset value, beginning of period | $11.16 | $10.91 | $10.73 | $8.88 | $8.06 | $8.36 |
| Income from Investment Operations | ||||||
| Net investment income (loss)A | .02 | (.02) | –B | –B | .02 | .01 |
| Net realized and unrealized gain (loss) | (.34) | .27 | .19 | 1.89 | .80 | (.30) |
| Total from investment operations | (.32) | .25 | .19 | 1.89 | .82 | (.29) |
| Distributions from net investment income | – | – | – | (.03) | – | (.01) |
| Distributions from net realized gain | (.01) | – | (.01) | (.01) | – | –B |
| Total distributions | (.01) | – | (.01) | (.04) | – | (.01) |
| Redemption fees added to paid in capitalA,B | – | – | – | – | – | – |
| Net asset value, end of period | $10.83 | $11.16 | $10.91 | $10.73 | $8.88 | $8.06 |
| Total ReturnC,D,E | (2.89)% | 2.29% | 1.76% | 21.35% | 10.17% | (3.47)% |
| Ratios to Average Net AssetsF,G | ||||||
| Expenses before reductions | 2.09%H | 2.07% | 2.14% | 2.19% | 2.35% | 2.55% |
| Expenses net of fee waivers, if any | 2.09%H | 2.07% | 2.14% | 2.18% | 2.20% | 2.20% |
| Expenses net of all reductions | 2.09%H | 2.06% | 2.14% | 2.17% | 2.19% | 2.18% |
| Net investment income (loss) | .45%H | (.15)% | .04% | .05% | .24% | .17% |
| Supplemental Data | ||||||
| Net assets, end of period (000 omitted) | $543 | $800 | $1,404 | $1,579 | $1,116 | $473 |
| Portfolio turnover rateI | 35%H | 26% | 27% | 32% | 32% | 68% |
A Calculated based on average shares outstanding during the period.
B Amount represents less than $.005 per share.
C Total returns for periods of less than one year are not annualized.
D Total returns would have been lower if certain expenses had not been reduced during the applicable periods shown.
E Total returns do not include the effect of the contingent deferred sales charge.
F Fees and expenses of any underlying Fidelity Central Funds are not included in the Fund's expense ratio. The Fund indirectly bears its proportionate share of the expenses of any underlying Fidelity Central Funds.
G Expense ratios reflect operating expenses of the class. Expenses before reductions do not reflect amounts reimbursed by the investment adviser or reductions from brokerage service arrangements or reductions from other expense offset arrangements and do not represent the amount paid by the class during periods when reimbursements or reductions occur. Expenses net of fee waivers reflect expenses after reimbursement by the investment adviser but prior to reductions from brokerage service arrangements or other expense offset arrangements. Expenses net of all reductions represent the net expenses paid by the class.
H Annualized
I Amount does not include the portfolio activity of any underlying Fidelity Central Funds.
See accompanying notes which are an integral part of the financial statements.
Financial Highlights — Fidelity International Growth Fund Class C
| Six months ended (Unaudited) April 30, | Years ended October 31, | |||||
| 2016 | 2015 | 2014 | 2013 | 2012 | 2011 | |
| Selected Per–Share Data | ||||||
| Net asset value, beginning of period | $11.12 | $10.87 | $10.69 | $8.84 | $8.03 | $8.34 |
| Income from Investment Operations | ||||||
| Net investment income (loss)A | .03 | (.02) | .01 | .01 | .02 | .01 |
| Net realized and unrealized gain (loss) | (.35) | .27 | .18 | 1.87 | .80 | (.31) |
| Total from investment operations | (.32) | .25 | .19 | 1.88 | .82 | (.30) |
| Distributions from net investment income | – | – | – | (.02) | (.01) | (.01) |
| Distributions from net realized gain | (.01) | – | (.01) | (.01) | (.01) | (.01) |
| Total distributions | (.01) | – | (.01) | (.03) | (.01)B | (.01)C |
| Redemption fees added to paid in capitalA,D | – | – | – | – | – | – |
| Net asset value, end of period | $10.79 | $11.12 | $10.87 | $10.69 | $8.84 | $8.03 |
| Total ReturnE,F,G | (2.90)% | 2.30% | 1.77% | 21.29% | 10.27% | (3.57)% |
| Ratios to Average Net AssetsH,I | ||||||
| Expenses before reductions | 2.05%J | 2.06% | 2.12% | 2.19% | 2.33% | 2.52% |
| Expenses net of fee waivers, if any | 2.05%J | 2.06% | 2.12% | 2.18% | 2.20% | 2.20% |
| Expenses net of all reductions | 2.05%J | 2.05% | 2.12% | 2.17% | 2.19% | 2.18% |
| Net investment income (loss) | .49%J | (.15)% | .06% | .05% | .24% | .17% |
| Supplemental Data | ||||||
| Net assets, end of period (000 omitted) | $54,803 | $52,378 | $32,737 | $17,196 | $5,648 | $2,767 |
| Portfolio turnover rateK | 35%J | 26% | 27% | 32% | 32% | 68% |
A Calculated based on average shares outstanding during the period.
B Total distributions of $.01 per share is comprised of distributions from net investment income of $.007 and distributions from net realized gain of $.006 per share.
C Total distributions of $.01 per share is comprised of distributions from net investment income of $.008 and distributions from net realized gain of $.005 per share.
D Amount represents less than $.005 per share.
E Total returns for periods of less than one year are not annualized.
F Total returns would have been lower if certain expenses had not been reduced during the applicable periods shown.
G Total returns do not include the effect of the contingent deferred sales charge.
H Fees and expenses of any underlying Fidelity Central Funds are not included in the Fund's expense ratio. The Fund indirectly bears its proportionate share of the expenses of any underlying Fidelity Central Funds.
I Expense ratios reflect operating expenses of the class. Expenses before reductions do not reflect amounts reimbursed by the investment adviser or reductions from brokerage service arrangements or reductions from other expense offset arrangements and do not represent the amount paid by the class during periods when reimbursements or reductions occur. Expenses net of fee waivers reflect expenses after reimbursement by the investment adviser but prior to reductions from brokerage service arrangements or other expense offset arrangements. Expenses net of all reductions represent the net expenses paid by the class.
J Annualized
K Amount does not include the portfolio activity of any underlying Fidelity Central Funds.
See accompanying notes which are an integral part of the financial statements.
Financial Highlights — Fidelity International Growth Fund
| Six months ended (Unaudited) April 30, | Years ended October 31, | |||||
| 2016 | 2015 | 2014 | 2013 | 2012 | 2011 | |
| Selected Per–Share Data | ||||||
| Net asset value, beginning of period | $11.38 | $11.10 | $10.84 | $8.95 | $8.12 | $8.40 |
| Income from Investment Operations | ||||||
| Net investment income (loss)A | .09 | .11 | .13 | .11 | .11 | .10 |
| Net realized and unrealized gain (loss) | (.35) | .26 | .19 | 1.88 | .81 | (.30) |
| Total from investment operations | (.26) | .37 | .32 | 1.99 | .92 | (.20) |
| Distributions from net investment income | (.08) | (.09) | (.05) | (.10) | (.08) | (.07) |
| Distributions from net realized gain | (.01) | – | (.01) | (.01) | (.01) | (.01) |
| Total distributions | (.09) | (.09) | (.06) | (.10)B | (.09) | (.08) |
| Redemption fees added to paid in capitalA,C | – | – | – | – | – | – |
| Net asset value, end of period | $11.03 | $11.38 | $11.10 | $10.84 | $8.95 | $8.12 |
| Total ReturnD,E | (2.34)% | 3.36% | 2.96% | 22.48% | 11.41% | (2.47)% |
| Ratios to Average Net AssetsF,G | ||||||
| Expenses before reductions | .96%H | .97% | 1.04% | 1.13% | 1.28% | 1.52% |
| Expenses net of fee waivers, if any | .96%H | .97% | 1.04% | 1.13% | 1.20% | 1.20% |
| Expenses net of all reductions | .96%H | .96% | 1.04% | 1.11% | 1.19% | 1.18% |
| Net investment income (loss) | 1.58%H | .94% | 1.14% | 1.11% | 1.24% | 1.17% |
| Supplemental Data | ||||||
| Net assets, end of period (000 omitted) | $989,532 | $938,348 | $635,607 | $430,914 | $149,526 | $53,437 |
| Portfolio turnover rateI | 35%H | 26% | 27% | 32% | 32% | 68% |
A Calculated based on average shares outstanding during the period.
B Total distributions of $.10 per share is comprised of distributions from net investment income of $.097 and distributions from net realized gain of $.005 per share.
C Amount represents less than $.005 per share.
D Total returns for periods of less than one year are not annualized.
E Total returns would have been lower if certain expenses had not been reduced during the applicable periods shown.
F Fees and expenses of any underlying Fidelity Central Funds are not included in the Fund's expense ratio. The Fund indirectly bears its proportionate share of the expenses of any underlying Fidelity Central Funds.
G Expense ratios reflect operating expenses of the class. Expenses before reductions do not reflect amounts reimbursed by the investment adviser or reductions from brokerage service arrangements or reductions from other expense offset arrangements and do not represent the amount paid by the class during periods when reimbursements or reductions occur. Expenses net of fee waivers reflect expenses after reimbursement by the investment adviser but prior to reductions from brokerage service arrangements or other expense offset arrangements. Expenses net of all reductions represent the net expenses paid by the class.
H Annualized
I Amount does not include the portfolio activity of any underlying Fidelity Central Funds.
See accompanying notes which are an integral part of the financial statements.
Financial Highlights — Fidelity International Growth Fund Class I
| Six months ended (Unaudited) April 30, | Years ended October 31, | |||||
| 2016 | 2015 | 2014 | 2013 | 2012 | 2011 | |
| Selected Per–Share Data | ||||||
| Net asset value, beginning of period | $11.36 | $11.08 | $10.84 | $8.94 | $8.12 | $8.40 |
| Income from Investment Operations | ||||||
| Net investment income (loss)A | .08 | .11 | .13 | .11 | .10 | .10 |
| Net realized and unrealized gain (loss) | (.34) | .27 | .18 | 1.90 | .81 | (.30) |
| Total from investment operations | (.26) | .38 | .31 | 2.01 | .91 | (.20) |
| Distributions from net investment income | (.08) | (.10) | (.06) | (.10) | (.08) | (.07) |
| Distributions from net realized gain | (.01) | – | (.01) | (.01) | (.01) | (.01) |
| Total distributions | (.09) | (.10) | (.07) | (.11) | (.09) | (.08) |
| Redemption fees added to paid in capitalA,B | – | – | – | – | – | – |
| Net asset value, end of period | $11.01 | $11.36 | $11.08 | $10.84 | $8.94 | $8.12 |
| Total ReturnC,D | (2.34)% | 3.41% | 2.84% | 22.66% | 11.28% | (2.47)% |
| Ratios to Average Net AssetsE,F | ||||||
| Expenses before reductions | .97%G | .98% | 1.04% | 1.11% | 1.27% | 1.50% |
| Expenses net of fee waivers, if any | .97%G | .98% | 1.04% | 1.11% | 1.20% | 1.20% |
| Expenses net of all reductions | .96%G | .97% | 1.04% | 1.09% | 1.19% | 1.18% |
| Net investment income (loss) | 1.58%G | .94% | 1.14% | 1.13% | 1.24% | 1.17% |
| Supplemental Data | ||||||
| Net assets, end of period (000 omitted) | $344,685 | $267,745 | $121,554 | $38,771 | $3,992 | $493 |
| Portfolio turnover rateH | 35%G | 26% | 27% | 32% | 32% | 68% |
A Calculated based on average shares outstanding during the period.
B Amount represents less than $.005 per share.
C Total returns for periods of less than one year are not annualized.
D Total returns would have been lower if certain expenses had not been reduced during the applicable periods shown.
E Fees and expenses of any underlying Fidelity Central Funds are not included in the Fund's expense ratio. The Fund indirectly bears its proportionate share of the expenses of any underlying Fidelity Central Funds.
F Expense ratios reflect operating expenses of the class. Expenses before reductions do not reflect amounts reimbursed by the investment adviser or reductions from brokerage service arrangements or reductions from other expense offset arrangements and do not represent the amount paid by the class during periods when reimbursements or reductions occur. Expenses net of fee waivers reflect expenses after reimbursement by the investment adviser but prior to reductions from brokerage service arrangements or other expense offset arrangements. Expenses net of all reductions represent the net expenses paid by the class.
G Annualized
H Amount does not include the portfolio activity of any underlying Fidelity Central Funds.
See accompanying notes which are an integral part of the financial statements.
Financial Highlights — Fidelity International Growth Fund Class Z
| Six months ended (Unaudited) April 30, | Years ended October 31, | |||
| April 30, | 2016 | 2015 | 2014 | 2013 A |
| Selected Per–Share Data | ||||
| Net asset value, beginning of period | $11.38 | $11.10 | $10.84 | $10.26 |
| Income from Investment Operations | ||||
| Net investment income (loss)B | .09 | .12 | .14 | .02 |
| Net realized and unrealized gain (loss) | (.35) | .27 | .19 | .56 |
| Total from investment operations | (.26) | .39 | .33 | .58 |
| Distributions from net investment income | (.09) | (.11) | (.06) | – |
| Distributions from net realized gain | (.01) | – | (.01) | – |
| Total distributions | (.10) | (.11) | (.07) | – |
| Redemption fees added to paid in capitalB,C | – | – | – | – |
| Net asset value, end of period | $11.02 | $11.38 | $11.10 | $10.84 |
| Total ReturnD,E | (2.29)% | 3.52% | 3.07% | 5.65% |
| Ratios to Average Net AssetsF,G | ||||
| Expenses before reductions | .83%H | .84% | .88% | .94%H |
| Expenses net of fee waivers, if any | .83%H | .84% | .88% | .94%H |
| Expenses net of all reductions | .83%H | .83% | .88% | .93%H |
| Net investment income (loss) | 1.71%H | 1.07% | 1.30% | .65%H |
| Supplemental Data | ||||
| Net assets, end of period (000 omitted) | $15,509 | $897 | $104 | $106 |
| Portfolio turnover rateI | 35%H | 26% | 27% | 32% |
A For the period August 13, 2013 (commencement of sale of shares) to October 31, 2013.
B Calculated based on average shares outstanding during the period.
C Amount represents less than $.005 per share.
D Total returns for periods of less than one year are not annualized.
E Total returns would have been lower if certain expenses had not been reduced during the applicable periods shown.
F Fees and expenses of any underlying Fidelity Central Funds are not included in the Fund's expense ratio. The Fund indirectly bears its proportionate share of the expenses of any underlying Fidelity Central Funds.
G Expense ratios reflect operating expenses of the class. Expenses before reductions do not reflect amounts reimbursed by the investment adviser or reductions from brokerage service arrangements or reductions from other expense offset arrangements and do not represent the amount paid by the class during periods when reimbursements or reductions occur. Expense ratios before reductions for start-up periods may not be representative of longer-term operating periods. Expenses net of fee waivers reflect expenses after reimbursement by the investment adviser but prior to reductions from brokerage service arrangements or other expense offset arrangements. Expenses net of all reductions represent the net expenses paid by the class.
H Annualized
I Amount does not include the portfolio activity of any underlying Fidelity Central Funds.
See accompanying notes which are an integral part of the financial statements.
Notes to Financial Statements (Unaudited)
For the period ended April 30, 2016
1. Organization.
Fidelity International Growth Fund (the Fund) is a fund of Fidelity Investment Trust (the Trust) and is authorized to issue an unlimited number of shares. The Trust is registered under the Investment Company Act of 1940, as amended (the 1940 Act), as an open-end management investment company organized as a Massachusetts business trust. The Fund offers Class A, Class T, Class C, International Growth, Class I and Class Z shares, each of which, along with Class B shares, has equal rights as to assets and voting privileges. Class B shares are closed to new accounts and additional purchases, except for exchanges and reinvestments. Each class has exclusive voting rights with respect to matters that affect that class. Class B shares will automatically convert to Class A shares after a maximum holding period of seven years from the initial date of purchase.
During the period, the Board of Trustees approved the conversion of all existing Class B shares into Class A shares, effective on or about July 1, 2016, regardless of the length of times shares have been held.
2. Investments in Fidelity Central Funds.
The Fund invests in Fidelity Central Funds, which are open-end investment companies generally available only to other investment companies and accounts managed by the investment adviser and its affiliates. The Fund's Schedule of Investments lists each of the Fidelity Central Funds held as of period end, if any, as an investment of the Fund, but does not include the underlying holdings of each Fidelity Central Fund. As an Investing Fund, the Fund indirectly bears its proportionate share of the expenses of the underlying Fidelity Central Funds.
The Money Market Central Funds seek preservation of capital and current income and are managed by Fidelity Investments Money Management, Inc. (FIMM), an affiliate of the investment adviser. Annualized expenses of the Money Market Central Funds as of their most recent shareholder report date are less than .005%.
A complete unaudited list of holdings for each Fidelity Central Fund is available upon request or at the Securities and Exchange Commission (the SEC) website at www.sec.gov. In addition, the financial statements of the Fidelity Central Funds are available on the SEC website or upon request.
3. Significant Accounting Policies.
The financial statements have been prepared in conformity with accounting principles generally accepted in the United States of America (GAAP), which require management to make certain estimates and assumptions at the date of the financial statements. Actual results could differ from those estimates. Subsequent events, if any, through the date that the financial statements were issued have been evaluated in the preparation of the financial statements. The following summarizes the significant accounting policies of the Fund:
Investment Valuation. Investments are valued as of 4:00 p.m. Eastern time on the last calendar day of the period. The Board of Trustees (the Board) has delegated the day to day responsibility for the valuation of the Fund's investments to the Fidelity Management & Research Company (FMR) Fair Value Committee (the Committee). In accordance with valuation policies and procedures approved by the Board, the Fund attempts to obtain prices from one or more third party pricing vendors or brokers to value its investments. When current market prices, quotations or currency exchange rates are not readily available or reliable, investments will be fair valued in good faith by the Committee, in accordance with procedures adopted by the Board. Factors used in determining fair value vary by investment type and may include market or investment specific events. The frequency with which these procedures are used cannot be predicted and they may be utilized to a significant extent. The Committee oversees the Fund's valuation policies and procedures and reports to the Board on the Committee's activities and fair value determinations. The Board monitors the appropriateness of the procedures used in valuing the Fund's investments and ratifies the fair value determinations of the Committee.
The Fund categorizes the inputs to valuation techniques used to value its investments into a disclosure hierarchy consisting of three levels as shown below:
- Level 1 – quoted prices in active markets for identical investments
- Level 2 – other significant observable inputs (including quoted prices for similar investments, interest rates, prepayment speeds, etc.)
- Level 3 – unobservable inputs (including the Fund's own assumptions based on the best information available)
Valuation techniques used to value the Fund's investments by major category are as follows:
Equity securities, including restricted securities, for which market quotations are readily available, are valued at the last reported sale price or official closing price as reported by a third party pricing vendor on the primary market or exchange on which they are traded and are categorized as Level 1 in the hierarchy. In the event there were no sales during the day or closing prices are not available, securities are valued at the last quoted bid price or may be valued using the last available price and are generally categorized as Level 2 in the hierarchy. For foreign equity securities, when market or security specific events arise, comparisons to the valuation of American Depositary Receipts (ADRs), futures contracts, Exchange-Traded Funds (ETFs) and certain indexes as well as quoted prices for similar securities may be used and would be categorized as Level 2 in the hierarchy. Utilizing these techniques may result in transfers between Level 1 and Level 2. For equity securities, including restricted securities, where observable inputs are limited, assumptions about market activity and risk are used and these securities may be categorized as Level 3 in the hierarchy.
Investments in open-end mutual funds, including the Fidelity Central Funds, are valued at their closing net asset value (NAV) each business day and are categorized as Level 1 in the hierarchy.
Changes in valuation techniques may result in transfers in or out of an assigned level within the disclosure hierarchy. The aggregate value of investments by input level as of April 30, 2016, including information on transfers between Levels 1 and 2, is included at the end of the Fund's Schedule of Investments.
Foreign Currency. The Fund may use foreign currency contracts to facilitate transactions in foreign-denominated securities. Gains and losses from these transactions may arise from changes in the value of the foreign currency or if the counterparties do not perform under the contracts' terms.
Foreign-denominated assets, including investment securities, and liabilities are translated into U.S. dollars at the exchange rates at period end. Purchases and sales of investment securities, income and dividends received and expenses denominated in foreign currencies are translated into U.S. dollars at the exchange rate in effect on the transaction date.
The effects of exchange rate fluctuations on investments are included with the net realized and unrealized gain (loss) on investment securities. Other foreign currency transactions resulting in realized and unrealized gain (loss) are disclosed separately.
Investment Transactions and Income. For financial reporting purposes, the Fund's investment holdings and NAV include trades executed through the end of the last business day of the period. The NAV per share for processing shareholder transactions is calculated as of the close of business of the New York Stock Exchange (NYSE), normally 4:00 p.m. Eastern time and includes trades executed through the end of the prior business day. Gains and losses on securities sold are determined on the basis of identified cost. Dividend income is recorded on the ex-dividend date, except for certain dividends from foreign securities where the ex-dividend date may have passed, which are recorded as soon as the Fund is informed of the ex-dividend date. Non-cash dividends included in dividend income, if any, are recorded at the fair market value of the securities received. Income and capital gain distributions from Fidelity Central Funds, if any, are recorded on the ex-dividend date. Distributions received on securities that represent a return of capital or capital gain are recorded as a reduction of cost of investments and/or as a realized gain. Subsequent to ex-dividend date the Fund determines the components of these distributions, based upon receipt of tax filings or other correspondence relating to the underlying investment. Investment income is recorded net of foreign taxes withheld where recovery of such taxes is uncertain.
Class Allocations and Expenses. Investment income, realized and unrealized capital gains and losses, common expenses of the Fund, and certain fund-level expense reductions, if any, are allocated daily on a pro-rata basis to each class based on the relative net assets of each class to the total net assets of the Fund. Each class differs with respect to transfer agent and distribution and service plan fees incurred. Certain expense reductions may also differ by class. For the reporting period, the allocated portion of income and expenses to each class as a percent of its average net assets may vary due to the timing of recording these transactions in relation to fluctuating net assets of the classes. Expenses directly attributable to a fund are charged to that fund. Expenses attributable to more than one fund are allocated among the respective funds on the basis of relative net assets or other appropriate methods. Expense estimates are accrued in the period to which they relate and adjustments are made when actual amounts are known.
Income Tax Information and Distributions to Shareholders. Each year, the Fund intends to qualify as a regulated investment company under Subchapter M of the Internal Revenue Code, including distributing substantially all of its taxable income and realized gains. As a result, no provision for U.S. Federal income taxes is required. The Fund files a U.S. federal tax return, in addition to state and local tax returns as required. The Fund's federal income tax returns are subject to examination by the Internal Revenue Service (IRS) for a period of three fiscal years after they are filed. State and local tax returns may be subject to examination for an additional fiscal year depending on the jurisdiction. Foreign taxes are provided for based on the Fund's understanding of the tax rules and rates that exist in the foreign markets in which it invests.
Distributions are declared and recorded on the ex-dividend date. Income dividends and capital gain distributions are declared separately for each class. Income and capital gain distributions are determined in accordance with income tax regulations, which may differ from GAAP.
Capital accounts within the financial statements are adjusted for permanent book-tax differences. These adjustments have no impact on net assets or the results of operations. Capital accounts are not adjusted for temporary book-tax differences which will reverse in a subsequent period.
Book-tax differences are primarily due to foreign currency transactions, certain foreign taxes, passive foreign investment companies (PFIC), partnerships, capital loss carryforwards and losses deferred due to wash sales.
The federal tax cost of investment securities and unrealized appreciation (depreciation) as of period end were as follows:
| Gross unrealized appreciation | $176,397,956 |
| Gross unrealized depreciation | (59,559,141) |
| Net unrealized appreciation (depreciation) on securities | $116,838,815 |
| Tax cost | $1,637,437,209 |
Capital loss carryforwards are only available to offset future capital gains of the Fund to the extent provided by regulations and may be limited. Under the Regulated Investment Company Modernization Act of 2010 (the Act), the Fund is permitted to carry forward capital losses incurred in taxable years beginning after December 22, 2010 for an unlimited period and such capital losses are required to be used prior to any losses that expire. The capital loss carryforward information presented below, including any applicable limitation, is estimated as of prior fiscal period end and is subject to adjustment.
| No expiration | |
| Short-term | $(26,434,969) |
| Long-term | (7,319,866) |
| Total no expiration | $(33,754,835) |
Short-Term Trading (Redemption) Fees. Shares held by investors in the Fund less than 30 days may have been subject to a redemption fee equal to 1.00% of the NAV of shares redeemed. All redemption fees, which reduce the proceeds of the shareholder redemption, are retained by the Fund and accounted for as an addition to paid in capital.
4. Purchases and Sales of Investments.
Purchases and sales of securities, other than short-term securities, aggregated $479,246,265 and $260,718,084, respectively.
5. Fees and Other Transactions with Affiliates.
Management Fee. Fidelity Management & Research Company (the investment adviser) and its affiliates provide the Fund with investment management related services for which the Fund pays a monthly management fee. The management fee is the sum of an individual fund fee rate that is based on an annual rate of .45% of the Fund's average net assets and an annualized group fee rate that averaged .25% during the period. The group fee rate is based upon the average net assets of all the mutual funds advised by the investment adviser, including any mutual funds previously advised by the investment adviser that are currently advised by Fidelity SelectCo, LLC, an affiliate of the investment adviser. The group fee rate decreases as assets under management increase and increases as assets under management decrease. In addition, the management fee is subject to a performance adjustment (up to a maximum of +/- .20% of the Fund's average net assets over a 36 month performance period). The upward or downward adjustment to the management fee is based on the relative investment performance of International Growth as compared to its benchmark index, the MSCI EAFE Growth Index, over the same 36 month performance period. For the reporting period, the total annualized management fee rate, including the performance adjustment, was .71% of the Fund's average net assets. The performance adjustment included in the management fee rate may be higher or lower than the maximum performance adjustment rate due to the difference between the average net assets for the reporting and performance periods.
Distribution and Service Plan Fees. In accordance with Rule 12b-1 of the 1940 Act, the Fund has adopted separate Distribution and Service Plans for each class of shares. Certain classes pay Fidelity Distributors Corporation (FDC), an affiliate of the investment adviser, separate Distribution and Service Fees, each of which is based on an annual percentage of each class' average net assets. In addition, FDC may pay financial intermediaries for selling shares of the Fund and providing shareholder support services. For the period, the Distribution and Service Fee rates, total fees and amounts retained by FDC were as follows:
| Distribution Fee | Service Fee | Total Fees | Retained by FDC | |
| Class A | -% | .25% | $249,157 | $357 |
| Class T | .25% | .25% | 69,243 | – |
| Class B | .75% | .25% | 3,364 | 2,523 |
| Class C | .75% | .25% | 263,379 | 98,751 |
| $585,143 | $101,631 |
Sales Load. FDC may receive a front-end sales charge of up to 5.75% for selling Class A shares and 3.50% for selling Class T shares, some of which is paid to financial intermediaries for selling shares of the Fund. Depending on the holding period, FDC may receive contingent deferred sales charges levied on Class A, Class T, Class B and Class C redemptions. The deferred sales charges range from 5.00% to 1.00% for Class B shares, 1.00% for Class C shares, 1.00% for certain purchases of Class A shares and .25% for certain purchases of Class T shares.
For the period, sales charge amounts retained by FDC were as follows:
| Retained by FDC | |
| Class A | $44,378 |
| Class T | 6,336 |
| Class B(a) | 6 |
| Class C(a) | 4,765 |
| $55,485 |
(a) When Class B and Class C shares are initially sold, FDC pays commissions from its own resources to financial intermediaries through which the sales are made.
Transfer Agent Fees. Fidelity Investments Institutional Operations Company, Inc., (FIIOC), an affiliate of the investment adviser, is the transfer, dividend disbursing and shareholder servicing agent for each class of the Fund. FIIOC receives account fees and asset-based fees that vary according to the account size and type of account of the shareholders of the respective classes of the Fund, except for Class Z. FIIOC receives an asset-based fee of Class Z's average net assets. FIIOC pays for typesetting, printing and mailing of shareholder reports, except proxy statements.
For the period, transfer agent fees for each class were as follows:
| Amount | % of Class-Level Average Net Assets(a) | |
| Class A | $220,276 | .22 |
| Class T | 43,164 | .31 |
| Class B | 1,028 | .31 |
| Class C | 69,895 | .27 |
| International Growth | 819,000 | .18 |
| Class I | 263,135 | .18 |
| Class Z | 2,268 | .05 |
| $1,418,766 |
(a) Annualized
Accounting and Security Lending Fees. Fidelity Service Company, Inc. (FSC), an affiliate of the investment adviser, maintains the Fund's accounting records. The accounting fee is based on the level of average net assets for each month. Under a separate contract, FSC administers the security lending program. The security lending fee is based on the number and duration of lending transactions.
Brokerage Commissions. The Fund placed a portion of its portfolio transactions with brokerage firms which are affiliates of the investment adviser. Brokerage commissions are included in net realized gain (loss) and change in net unrealized appreciation (depreciation) in the Statement of Operations. The commissions paid to these affiliated firms were $799 for the period.
Interfund Trades. The Fund may purchase from or sell securities to other Fidelity Funds under procedures adopted by the Board. The procedures have been designed to ensure these interfund trades are executed in accordance with Rule 17a-7 of the 1940 Act. Interfund trades are included within the respective purchases and sales amounts shown in the Purchases and Sales of Investments note.
6. Committed Line of Credit.
The Fund participates with other funds managed by the investment adviser or an affiliate in a $4.25 billion credit facility (the "line of credit") to be utilized for temporary or emergency purposes to fund shareholder redemptions or for other short-term liquidity purposes. The Fund has agreed to pay commitment fees on its pro-rata portion of the line of credit, which amounted to $1,311 and is reflected in Miscellaneous expenses on the Statement of Operations. During the period, the Fund did not borrow on this line of credit.
7. Security Lending.
The Fund lends portfolio securities through a lending agent from time to time in order to earn additional income. For equity securities, a lending agent is used and may loan securities to certain qualified borrowers, including Fidelity Capital Markets (FCM), a broker-dealer affiliated with the Fund. On the settlement date of the loan, the Fund receives collateral (in the form of U.S. Treasury obligations, letters of credit and/or cash) against the loaned securities and maintains collateral in an amount not less than 100% of the market value of the loaned securities during the period of the loan. The market value of the loaned securities is determined at the close of business of the Fund and any additional required collateral is delivered to the Fund on the next business day. The Fund or borrower may terminate the loan at any time, and if the borrower defaults on its obligation to return the securities loaned because of insolvency or other reasons, the Fund may apply collateral received from the borrower against the obligation. The Fund may experience delays and costs in recovering the securities loaned. Any cash collateral received is invested in the Fidelity Securities Lending Cash Central Fund. The value of loaned securities and cash collateral at period end are disclosed on the Fund's Statement of Assets and Liabilities. The value of securities loaned to FCM at period end was $10,140,516. Security lending income represents the income earned on investing cash collateral, less rebates paid to borrowers and any lending agent fees associated with the loan, plus any premium payments received for lending certain types of securities. Security lending income is presented in the Statement of Operations as a component of income from Fidelity Central Funds. Total security lending income during the period amounted to $330,325, including $34,892 from securities loaned to FCM.
8. Expense Reductions.
Commissions paid to certain brokers with whom the investment adviser, or its affiliates, places trades on behalf of the Fund include an amount in addition to trade execution, which may be rebated back to the Fund to offset certain expenses. This amount totaled $11,575 for the period. In addition, through arrangements with the Fund's custodian, credits realized as a result of certain uninvested cash balances were used to reduce the Fund's expenses. During the period, these credits reduced the Fund's custody expenses by $35.
In addition, during the period the investment adviser reimbursed and/or waived a portion of fund-level operating expenses in the amount of $5,363.
9. Distributions to Shareholders.
Distributions to shareholders of each class were as follows:
| Six months ended April 30, 2016 | Year ended October 31, 2015 | |
| From net investment income | ||
| Class A | $857,306 | $684,914 |
| Class T | 25,900 | 29,128 |
| International Growth | 6,508,406 | 5,239,951 |
| Class I | 1,913,593 | 1,064,923 |
| Class Z | 8,317 | 1,008 |
| Total | $9,313,522 | $7,019,924 |
| From net realized gain | ||
| Class A | $137,169 | $– |
| Class T | 20,720 | – |
| Class B | 561 | – |
| Class C | 39,156 | – |
| International Growth | 667,539 | – |
| Class I | 196,266 | – |
| Class Z | 708 | – |
| Total | $1,062,119 | $– |
10. Share Transactions.
Share transactions for each class were as follows and may contain automatic conversions between classes or exchanges between affiliated funds:
| Shares | Shares | Dollars | Dollars | |
| Six months ended April 30, 2016 | Year ended October 31, 2015 | Six months ended April 30, 2016 | Year ended October 31, 2015 | |
| Class A | ||||
| Shares sold | 6,246,540 | 9,298,452 | $67,129,589 | $105,707,223 |
| Reinvestment of distributions | 86,341 | 60,570 | 970,468 | 669,298 |
| Shares redeemed | (1,954,972) | (3,798,128) | (20,859,132) | (42,982,992) |
| Net increase (decrease) | 4,377,909 | 5,560,894 | $47,240,925 | $63,393,529 |
| Class T | ||||
| Shares sold | 366,792 | 1,158,910 | $3,936,696 | $13,286,739 |
| Reinvestment of distributions | 4,067 | 2,593 | 45,714 | 28,654 |
| Shares redeemed | (350,025) | (1,005,399) | (3,686,315) | (11,627,373) |
| Net increase (decrease) | 20,834 | 156,104 | $296,095 | $1,688,020 |
| Class B | ||||
| Shares sold | 1,881 | 30,282 | $19,678 | $347,009 |
| Reinvestment of distributions | 50 | – | 556 | – |
| Shares redeemed | (23,393) | (87,349) | (246,379) | (994,341) |
| Net increase (decrease) | (21,462) | (57,067) | $(226,145) | $(647,332) |
| Class C | ||||
| Shares sold | 819,268 | 2,689,800 | $8,736,707 | $30,433,427 |
| Reinvestment of distributions | 3,485 | – | 38,678 | – |
| Shares redeemed | (454,625) | (991,400) | (4,741,050) | (10,978,888) |
| Net increase (decrease) | 368,128 | 1,698,400 | $4,034,335 | $19,454,539 |
| International Growth | ||||
| Shares sold | 17,140,428 | 39,705,804 | $183,584,698 | $456,131,993 |
| Reinvestment of distributions | 515,203 | 387,169 | 5,821,794 | 4,301,448 |
| Shares redeemed | (10,385,791) | (14,942,156) | (110,850,155) | (169,380,325) |
| Net increase (decrease) | 7,269,840 | 25,150,817 | $78,556,337 | $291,053,116 |
| Class I | ||||
| Shares sold | 13,087,526 | 17,728,493 | $140,430,050 | $201,877,753 |
| Reinvestment of distributions | 177,277 | 92,582 | 1,999,688 | 1,026,733 |
| Shares redeemed | (5,525,257) | (5,227,430) | (58,460,124) | (58,733,231) |
| Net increase (decrease) | 7,739,546 | 12,593,645 | $83,969,614 | $144,171,255 |
| Class Z | ||||
| Shares sold | 1,378,158 | 88,007 | $14,776,889 | $956,120 |
| Reinvestment of distributions | 799 | 91 | 9,025 | 1,008 |
| Shares redeemed | (50,920) | (18,621) | (543,517) | (208,779) |
| Net increase (decrease) | 1,328,037 | 69,477 | $14,242,397 | $748,349 |
11. Other.
The Fund's organizational documents provide former and current trustees and officers with a limited indemnification against liabilities arising in connection with the performance of their duties to the Fund. In the normal course of business, the Fund may also enter into contracts that provide general indemnifications. The Fund's maximum exposure under these arrangements is unknown as this would be dependent on future claims that may be made against the Fund. The risk of material loss from such claims is considered remote.
Shareholder Expense Example
As a shareholder of the Fund, you incur two types of costs: (1) transaction costs, including sales charges (loads) on purchase payments or redemption proceeds, redemption fees and (2) ongoing costs, including management fees, distribution and/or service (12b-1) fees and other Fund expenses. This Example is intended to help you understand your ongoing costs (in dollars) of investing in the Fund and to compare these costs with the ongoing costs of investing in other mutual funds.
The Example is based on an investment of $1,000 invested at the beginning of the period and held for the entire period (November 1, 2015 to April 30, 2016).
Actual Expenses
The first line of the accompanying table for each class of the Fund provides information about actual account values and actual expenses. You may use the information in this line, together with the amount you invested, to estimate the expenses that you paid over the period. Simply divide your account value by $1,000.00 (for example, an $8,600 account value divided by $1,000.00 = 8.6), then multiply the result by the number in the first line for a class of the Fund under the heading entitled "Expenses Paid During Period" to estimate the expenses you paid on your account during this period. A small balance maintenance fee of $12.00 that is charged once a year may apply for certain accounts with a value of less than $2,000. This fee is not included in the table below. If it was, the estimate of expenses you paid during the period would be higher, and your ending account value lower, by this amount. In addition, the Fund, as a shareholder in the underlying Fidelity Central Funds, will indirectly bear its pro-rata share of the fees and expenses incurred by the underlying Fidelity Central Funds. These fees and expenses are not included in the Fund's annualized expense ratio used to calculate the expense estimate in the table below.
Hypothetical Example for Comparison Purposes
The second line of the accompanying table for each class of the Fund provides information about hypothetical account values and hypothetical expenses based on a Class' actual expense ratio and an assumed rate of return of 5% per year before expenses, which is not the Class' actual return. The hypothetical account values and expenses may not be used to estimate the actual ending account balance or expenses you paid for the period. You may use this information to compare the ongoing costs of investing in the Fund and other funds. To do so, compare this 5% hypothetical example with the 5% hypothetical examples that appear in the shareholder reports of the other funds. A small balance maintenance fee of $12.00 that is charged once a year may apply for certain accounts with a value of less than $2,000. This fee is not included in the table below. If it was, the estimate of expenses you paid during the period would be higher, and your ending account value lower, by this amount. In addition, the Fund, as a shareholder in the underlying Fidelity Central Funds, will indirectly bear its pro-rata share of the fees and expenses incurred by the underlying Fidelity Central Funds. These fees and expenses are not included in the Fund's annualized expense ratio used to calculate the expense estimate in the table below.
Please note that the expenses shown in the table are meant to highlight your ongoing costs only and do not reflect any transaction costs. Therefore, the second line of the table is useful in comparing ongoing costs only, and will not help you determine the relative total costs of owning different funds. In addition, if these transactional costs were included, your costs would have been higher.
| Annualized Expense Ratio-A | Beginning Account Value November 1, 2015 | Ending Account Value April 30, 2016 | Expenses Paid During Period-B November 1, 2015 to April 30, 2016 | |
| Class A | 1.26% | |||
| Actual | $1,000.00 | $974.90 | $6.19 | |
| Hypothetical-C | $1,000.00 | $1,018.60 | $6.32 | |
| Class T | 1.60% | |||
| Actual | $1,000.00 | $973.10 | $7.85 | |
| Hypothetical-C | $1,000.00 | $1,016.91 | $8.02 | |
| Class B | 2.09% | |||
| Actual | $1,000.00 | $971.10 | $10.24 | |
| Hypothetical-C | $1,000.00 | $1,014.47 | $10.47 | |
| Class C | 2.05% | |||
| Actual | $1,000.00 | $971.00 | $10.05 | |
| Hypothetical-C | $1,000.00 | $1,014.67 | $10.27 | |
| International Growth | .96% | |||
| Actual | $1,000.00 | $976.60 | $4.72 | |
| Hypothetical-C | $1,000.00 | $1,020.09 | $4.82 | |
| Class I | .97% | |||
| Actual | $1,000.00 | $976.60 | $4.77 | |
| Hypothetical-C | $1,000.00 | $1,020.04 | $4.87 | |
| Class Z | .83% | |||
| Actual | $1,000.00 | $977.10 | $4.08 | |
| Hypothetical-C | $1,000.00 | $1,020.74 | $4.17 |
A Annualized expense ratio reflects expenses net of applicable fee waivers.
B Expenses are equal to each Class' annualized expense ratio, multiplied by the average account value over the period, multiplied by 182/366 (to reflect the one-half year period).
C 5% return per year before expenses
![]()
AIGFZ-SANN-0616
1.9585039.102
Fidelity® International Discovery Fund Semi-Annual Report April 30, 2016 |
|
Contents
To view a fund's proxy voting guidelines and proxy voting record for the 12-month period ended June 30, visit http://www.fidelity.com/proxyvotingresults or visit the Securities and Exchange Commission's (SEC) web site at http://www.sec.gov.
You may also call 1-800-835-5092 to request a free copy of the proxy voting guidelines.
Standard & Poor's, S&P and S&P 500 are registered service marks of The McGraw-Hill Companies, Inc. and have been licensed for use by Fidelity Distributors Corporation.
Other third-party marks appearing herein are the property of their respective owners.
All other marks appearing herein are registered or unregistered trademarks or service marks of FMR LLC or an affiliated company. © 2016 FMR LLC. All rights reserved.
This report and the financial statements contained herein are submitted for the general information of the shareholders of the Fund. This report is not authorized for distribution to prospective investors in the Fund unless preceded or accompanied by an effective prospectus.
A fund files its complete schedule of portfolio holdings with the SEC for the first and third quarters of each fiscal year on Form N-Q. Forms N-Q are available on the SEC’s web site at http://www.sec.gov. A fund's Forms N-Q may be reviewed and copied at the SEC’s Public Reference Room in Washington, DC. Information regarding the operation of the SEC's Public Reference Room may be obtained by calling 1-800-SEC-0330.
For a complete list of a fund's portfolio holdings, view the most recent holdings listing, semiannual report, or annual report on Fidelity's web site at http://www.fidelity.com, http://www.advisor.fidelity.com, or http://www.401k.com, as applicable.
NOT FDIC INSURED •MAY LOSE VALUE •NO BANK GUARANTEE
Neither the Fund nor Fidelity Distributors Corporation is a bank.
Investment Summary (Unaudited)
Geographic Diversification (% of fund's net assets)
| As of April 30, 2016 | ||
| Japan | 17.3% | |
| United Kingdom | 14.5% | |
| France | 9.6% | |
| Germany | 8.0% | |
| United States of America* | 5.8% | |
| Switzerland | 4.3% | |
| Sweden | 4.1% | |
| Hong Kong | 3.3% | |
| Netherlands | 3.3% | |
| Other | 29.8% | |

* Includes Short-Term investments and Net Other Assets (Liabilities).
Percentages are based on country or territory of incorporation and are adjusted for the effect of futures contracts, if applicable.
| As of October 31, 2015 | ||
| United Kingdom | 19.1% | |
| Japan | 15.9% | |
| France | 9.6% | |
| United States of America* | 7.3% | |
| Germany | 5.5% | |
| Switzerland | 5.1% | |
| Netherlands | 4.0% | |
| Sweden | 3.1% | |
| Hong Kong | 3.0% | |
| Other | 27.4% | |
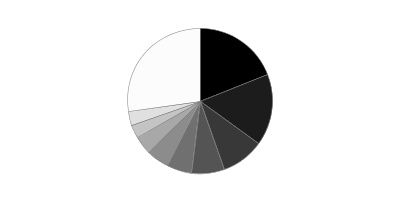
* Includes Short-Term investments and Net Other Assets (Liabilities).
Percentages are based on country or territory of incorporation and are adjusted for the effect of futures contracts, if applicable.
Asset Allocation as of April 30, 2016
| % of fund's net assets | % of fund's net assets 6 months ago | |
| Stocks and Equity Futures | 99.1 | 97.5 |
| Other Investments | 0.0 | 0.1 |
| Short-Term Investments and Net Other Assets (Liabilities) | 0.9 | 2.4 |
Top Ten Stocks as of April 30, 2016
| % of fund's net assets | % of fund's net assets 6 months ago | |
| Total SA (France, Oil, Gas & Consumable Fuels) | 2.2 | 2.0 |
| Unilever NV (Certificaten Van Aandelen) (Bearer) (Netherlands, Personal Products) | 1.7 | 1.6 |
| Statoil ASA (Norway, Oil, Gas & Consumable Fuels) | 1.6 | 0.0 |
| Anheuser-Busch InBev SA NV (Belgium, Beverages) | 1.5 | 1.4 |
| AIA Group Ltd. (Hong Kong, Insurance) | 1.5 | 1.3 |
| ORIX Corp. (Japan, Diversified Financial Services) | 1.4 | 0.9 |
| Techtronic Industries Co. Ltd. (Hong Kong, Household Durables) | 1.4 | 1.3 |
| VINCI SA (France, Construction & Engineering) | 1.4 | 0.9 |
| KDDI Corp. (Japan, Wireless Telecommunication Services) | 1.4 | 1.1 |
| Novo Nordisk A/S Series B (Denmark, Pharmaceuticals) | 1.3 | 1.2 |
| 15.4 |
Market Sectors as of April 30, 2016
| % of fund's net assets | % of fund's net assets 6 months ago | |
| Financials | 21.6 | 24.2 |
| Consumer Discretionary | 15.3 | 17.4 |
| Consumer Staples | 13.2 | 11.9 |
| Health Care | 12.5 | 12.8 |
| Industrials | 10.7 | 10.5 |
| Information Technology | 10.0 | 7.5 |
| Energy | 5.0 | 4.3 |
| Telecommunication Services | 4.8 | 4.9 |
| Materials | 3.6 | 2.3 |
| Utilities | 0.6 | 0.0 |
Percentages shown as 0.0% may reflect amounts less than 0.05%.
Investments April 30, 2016 (Unaudited)
Showing Percentage of Net Assets
| Common Stocks - 97.1% | |||
| Shares | Value (000s) | ||
| Australia - 2.5% | |||
| 1-Page Ltd. (a)(b) | 2,531,460 | $1,857 | |
| Ansell Ltd. (a) | 1,588,251 | 24,068 | |
| Australia & New Zealand Banking Group Ltd. | 2,945,060 | 53,983 | |
| Burson Group Ltd. | 7,454,296 | 28,226 | |
| Magellan Financial Group Ltd. | 1,204,177 | 19,685 | |
| Mantra Group Ltd. | 7,793,893 | 21,927 | |
| Ramsay Health Care Ltd. | 1,164,235 | 57,495 | |
| Spark Infrastructure Group unit | 31,636,214 | 49,793 | |
| TOTAL AUSTRALIA | 257,034 | ||
| Austria - 0.5% | |||
| Andritz AG | 444,500 | 24,894 | |
| Erste Group Bank AG | 995,900 | 28,646 | |
| TOTAL AUSTRIA | 53,540 | ||
| Bailiwick of Jersey - 1.2% | |||
| Integrated Diagnostics Holdings PLC | 4,932,400 | 22,936 | |
| Randgold Resources Ltd. sponsored ADR | 241,314 | 24,252 | |
| Regus PLC | 11,055,488 | 47,233 | |
| Wolseley PLC | 514,260 | 28,805 | |
| TOTAL BAILIWICK OF JERSEY | 123,226 | ||
| Belgium - 2.0% | |||
| Anheuser-Busch InBev SA NV | 1,203,427 | 148,960 | |
| KBC Groep NV | 857,319 | 48,131 | |
| TOTAL BELGIUM | 197,091 | ||
| Bermuda - 0.3% | |||
| PAX Global Technology Ltd. | 29,071,000 | 25,037 | |
| Canada - 2.2% | |||
| Alimentation Couche-Tard, Inc. Class B (sub. vtg.) | 781,500 | 34,257 | |
| Cenovus Energy, Inc. | 2,806,100 | 44,483 | |
| Constellation Software, Inc. | 156,500 | 61,161 | |
| Franco-Nevada Corp. | 297,300 | 20,859 | |
| PrairieSky Royalty Ltd. (b) | 1,734,473 | 36,522 | |
| Suncor Energy, Inc. | 676,200 | 19,849 | |
| TOTAL CANADA | 217,131 | ||
| Cayman Islands - 0.9% | |||
| Alibaba Group Holding Ltd. sponsored ADR (a) | 453,700 | 34,908 | |
| Ctrip.com International Ltd. ADR (a) | 294,500 | 12,843 | |
| Lee's Pharmaceutical Holdings Ltd. | 6,734,664 | 5,449 | |
| New Oriental Education & Technology Group, Inc. sponsored ADR | 830,000 | 32,503 | |
| TOTAL CAYMAN ISLANDS | 85,703 | ||
| China - 0.6% | |||
| Jiangsu Hengrui Medicine Co. Ltd. | 4,183,623 | 30,165 | |
| Kweichow Moutai Co. Ltd. | 663,582 | 25,748 | |
| TOTAL CHINA | 55,913 | ||
| Cyprus - 0.0% | |||
| SPDI Secure Property Development & Investment PLC (a) | 517,230 | 129 | |
| Denmark - 1.3% | |||
| Novo Nordisk A/S Series B | 2,371,645 | 132,419 | |
| Finland - 0.7% | |||
| Sampo Oyj (A Shares) | 1,653,500 | 72,193 | |
| France - 9.6% | |||
| Accor SA (b) | 1,684,918 | 74,636 | |
| ALTEN | 608,659 | 37,635 | |
| Altran Technologies SA | 2,384,000 | 35,365 | |
| Amundi SA | 516,400 | 23,765 | |
| Atos Origin SA | 444,123 | 39,530 | |
| AXA SA (b) | 4,402,300 | 111,156 | |
| Capgemini SA | 855,800 | 79,894 | |
| Cegedim SA (a) | 536,390 | 14,728 | |
| Havas SA | 4,815,644 | 40,297 | |
| Sanofi SA | 467,356 | 38,523 | |
| Sodexo SA | 431,200 | 43,543 | |
| SR Teleperformance SA | 290,100 | 26,043 | |
| Total SA | 4,385,111 | 221,630 | |
| Unibail-Rodamco | 156,500 | 41,933 | |
| VINCI SA (b) | 1,924,900 | 143,796 | |
| TOTAL FRANCE | 972,474 | ||
| Germany - 8.0% | |||
| Axel Springer Verlag AG | 625,002 | 34,896 | |
| Bayer AG | 345,100 | 39,812 | |
| Beiersdorf AG | 242,900 | 21,794 | |
| Continental AG | 297,600 | 65,359 | |
| Deutsche Boerse AG | 526,494 | 43,219 | |
| Deutsche Telekom AG | 3,241,500 | 56,899 | |
| Fresenius SE & Co. KGaA | 468,700 | 34,090 | |
| GEA Group AG | 878,941 | 40,750 | |
| KION Group AG | 1,369,149 | 74,593 | |
| LEG Immobilien AG | 314,266 | 29,080 | |
| Nexus AG | 614,500 | 10,766 | |
| ProSiebenSat.1 Media AG | 1,170,000 | 59,644 | |
| Rational AG | 104,405 | 53,002 | |
| SAP AG | 1,390,594 | 109,107 | |
| Siemens AG | 685,498 | 71,736 | |
| Symrise AG | 637,700 | 42,249 | |
| United Internet AG | 430,714 | 21,027 | |
| TOTAL GERMANY | 808,023 | ||
| Hong Kong - 3.3% | |||
| AIA Group Ltd. | 24,704,000 | 147,844 | |
| China Resources Beer Holdings Co. Ltd. | 16,944,000 | 37,233 | |
| Techtronic Industries Co. Ltd. | 38,444,000 | 144,114 | |
| TOTAL HONG KONG | 329,191 | ||
| India - 2.6% | |||
| Bharti Infratel Ltd. | 12,647,734 | 71,392 | |
| Dr Lal Pathlabs Ltd. | 798,016 | 11,835 | |
| HDFC Bank Ltd. sponsored ADR | 1,290,984 | 81,164 | |
| Housing Development Finance Corp. Ltd. | 6,148,295 | 100,746 | |
| TOTAL INDIA | 265,137 | ||
| Ireland - 2.7% | |||
| Cairn Homes PLC (a) | 17,549,270 | 22,506 | |
| CRH PLC | 1,051,000 | 30,587 | |
| Dalata Hotel Group PLC (a) | 5,686,103 | 28,706 | |
| Green REIT PLC | 9,492,200 | 15,673 | |
| Irish Continental Group PLC unit | 101,800 | 600 | |
| James Hardie Industries PLC CDI | 1,482,921 | 20,893 | |
| Kerry Group PLC Class A | 983,700 | 87,712 | |
| Ryanair Holdings PLC sponsored ADR | 809,300 | 65,513 | |
| TOTAL IRELAND | 272,190 | ||
| Isle of Man - 0.8% | |||
| Optimal Payments PLC (a) | 11,752,725 | 65,462 | |
| Playtech Ltd. | 1,386,935 | 16,303 | |
| TOTAL ISLE OF MAN | 81,765 | ||
| Israel - 1.9% | |||
| Frutarom Industries Ltd. | 1,032,000 | 52,892 | |
| Partner Communications Co. Ltd. (a) | 2,268,862 | 11,804 | |
| Teva Pharmaceutical Industries Ltd. sponsored ADR | 2,291,300 | 124,761 | |
| TOTAL ISRAEL | 189,457 | ||
| Italy - 1.6% | |||
| De Longhi SpA | 1,669,626 | 38,446 | |
| Intesa Sanpaolo SpA | 30,697,900 | 85,334 | |
| Mediaset SpA | 3,440,200 | 15,481 | |
| Telecom Italia SpA (a) | 25,339,200 | 24,743 | |
| TOTAL ITALY | 164,004 | ||
| Japan - 17.3% | |||
| ACOM Co. Ltd. (a) | 3,246,300 | 16,935 | |
| Aozora Bank Ltd. | 9,464,000 | 33,578 | |
| Asahi Group Holdings | 1,066,900 | 33,860 | |
| Astellas Pharma, Inc. | 6,953,700 | 93,754 | |
| Casio Computer Co. Ltd. (b) | 2,015,200 | 38,343 | |
| Daito Trust Construction Co. Ltd. | 209,500 | 29,630 | |
| Dentsu, Inc. | 1,274,300 | 64,746 | |
| Don Quijote Holdings Co. Ltd. | 1,338,100 | 47,604 | |
| Hoya Corp. | 1,793,800 | 68,692 | |
| Japan Exchange Group, Inc. | 1,920,700 | 28,605 | |
| Japan Tobacco, Inc. | 2,318,600 | 94,733 | |
| KDDI Corp. | 4,728,900 | 136,219 | |
| Keyence Corp. | 95,360 | 57,158 | |
| Misumi Group, Inc. | 3,181,300 | 43,933 | |
| Mitsubishi UFJ Financial Group, Inc. | 11,142,500 | 51,421 | |
| Monex Group, Inc. | 12,207,949 | 31,493 | |
| NEC Corp. | 8,879,000 | 21,609 | |
| Nidec Corp. | 324,300 | 23,763 | |
| Nintendo Co. Ltd. | 274,100 | 37,113 | |
| Nippon Telegraph & Telephone Corp. | 904,500 | 40,477 | |
| Olympus Corp. | 3,148,400 | 122,651 | |
| ORIX Corp. | 10,231,600 | 144,725 | |
| Seven & i Holdings Co. Ltd. | 1,034,700 | 42,218 | |
| Seven Bank Ltd. | 12,039,600 | 51,159 | |
| Shinsei Bank Ltd. | 14,227,000 | 19,940 | |
| Shionogi & Co. Ltd. | 856,200 | 43,702 | |
| Sony Corp. | 3,594,500 | 87,065 | |
| Sundrug Co. Ltd. | 622,500 | 44,232 | |
| Tsuruha Holdings, Inc. | 834,000 | 79,994 | |
| United Arrows Ltd. | 991,300 | 39,833 | |
| VT Holdings Co. Ltd. | 3,872,500 | 19,566 | |
| Welcia Holdings Co. Ltd. | 1,150,800 | 60,788 | |
| TOTAL JAPAN | 1,749,539 | ||
| Luxembourg - 0.9% | |||
| Eurofins Scientific SA | 120,139 | 44,578 | |
| Grand City Properties SA | 1,528,397 | 33,759 | |
| Senvion SA | 708,900 | 12,460 | |
| TOTAL LUXEMBOURG | 90,797 | ||
| Marshall Islands - 0.1% | |||
| Hoegh LNG Partners LP (c) | 715,655 | 12,896 | |
| Netherlands - 3.3% | |||
| AerCap Holdings NV (a) | 562,900 | 22,522 | |
| IMCD Group BV | 1,926,800 | 77,794 | |
| ING Groep NV (Certificaten Van Aandelen) | 4,956,300 | 60,696 | |
| Unilever NV (Certificaten Van Aandelen) (Bearer) | 3,814,100 | 167,553 | |
| TOTAL NETHERLANDS | 328,565 | ||
| New Zealand - 0.8% | |||
| EBOS Group Ltd. | 3,154,998 | 35,160 | |
| Ryman Healthcare Group Ltd. | 7,137,434 | 44,505 | |
| TOTAL NEW ZEALAND | 79,665 | ||
| Norway - 1.6% | |||
| Statoil ASA (b) | 9,044,100 | 159,188 | |
| Philippines - 0.3% | |||
| SM Investments Corp. | 1,641,730 | 32,950 | |
| Romania - 0.2% | |||
| Banca Transilvania SA | 31,143,575 | 21,373 | |
| South Africa - 1.3% | |||
| EOH Holdings Ltd. | 2,855,067 | 27,788 | |
| Naspers Ltd. Class N | 720,500 | 98,860 | |
| TOTAL SOUTH AFRICA | 126,648 | ||
| Spain - 2.5% | |||
| Amadeus IT Holding SA Class A | 1,717,100 | 78,135 | |
| Atresmedia Corporacion de Medios de Comunicacion SA | 1,719,200 | 22,383 | |
| Hispania Activos Inmobiliarios SA (a) | 1,085,200 | 15,905 | |
| Inditex SA | 2,288,877 | 73,476 | |
| Mediaset Espana Comunicacion SA | 2,931,000 | 38,059 | |
| Merlin Properties Socimi SA | 2,483,100 | 28,859 | |
| TOTAL SPAIN | 256,817 | ||
| Sweden - 4.1% | |||
| ASSA ABLOY AB (B Shares) | 3,682,800 | 77,229 | |
| Getinge AB (B Shares) | 2,461,330 | 52,044 | |
| HEXPOL AB (B Shares) (b) | 2,967,500 | 30,671 | |
| Indutrade AB (b) | 201,100 | 11,276 | |
| Nordea Bank AB | 5,749,200 | 55,806 | |
| Saab AB (B Shares) | 980,200 | 33,530 | |
| Sandvik AB (b) | 2,242,600 | 23,011 | |
| Svenska Cellulosa AB (SCA) (B Shares) | 3,034,500 | 95,564 | |
| Svenska Handelsbanken AB (A Shares) (b) | 2,567,100 | 34,246 | |
| TOTAL SWEDEN | 413,377 | ||
| Switzerland - 4.3% | |||
| GAM Holding Ltd. | 1,405,187 | 18,310 | |
| Julius Baer Group Ltd. | 949,640 | 40,698 | |
| Novartis AG | 1,375,538 | 104,682 | |
| Partners Group Holding AG | 247,326 | 101,839 | |
| Schindler Holding AG (participation certificate) | 181,273 | 33,012 | |
| Syngenta AG (Switzerland) | 175,928 | 70,423 | |
| UBS Group AG | 3,690,490 | 63,861 | |
| TOTAL SWITZERLAND | 432,825 | ||
| Taiwan - 0.1% | |||
| JHL Biotech, Inc. (a) | 4,953,560 | 13,395 | |
| United Kingdom - 14.5% | |||
| AA PLC | 3,830,868 | 15,595 | |
| Associated British Foods PLC | 772,200 | 34,571 | |
| B&M European Value Retail S.A. | 9,180,129 | 37,209 | |
| BAE Systems PLC | 4,147,100 | 28,933 | |
| BCA Marketplace PLC | 7,762,300 | 18,913 | |
| BHP Billiton PLC | 2,881,014 | 39,368 | |
| BT Group PLC | 6,133,600 | 39,758 | |
| Bunzl PLC | 2,075,300 | 61,829 | |
| Cineworld Group PLC | 2,055,200 | 15,555 | |
| CMC Markets PLC | 8,647,600 | 31,589 | |
| Compass Group PLC | 2,013,000 | 35,848 | |
| Countryside Properties PLC (a) | 3,408,200 | 11,578 | |
| Diploma PLC | 2,312,600 | 24,718 | |
| GlaxoSmithKline PLC | 3,812,600 | 81,485 | |
| Howden Joinery Group PLC | 10,913,100 | 78,772 | |
| Imperial Tobacco Group PLC | 1,848,336 | 100,425 | |
| ITV PLC | 9,444,600 | 31,078 | |
| Lloyds Banking Group PLC | 69,181,900 | 67,903 | |
| London Stock Exchange Group PLC | 473,136 | 18,756 | |
| McCarthy & Stone PLC | 4,009,500 | 13,592 | |
| Melrose Industries PLC | 1,586,476 | 8,653 | |
| Micro Focus International PLC | 3,609,242 | 80,634 | |
| Moneysupermarket.com Group PLC | 5,210,600 | 23,899 | |
| Persimmon PLC | 1,469,800 | 42,673 | |
| Reckitt Benckiser Group PLC | 900,800 | 87,755 | |
| Rex Bionics PLC (a)(c) | 1,297,286 | 692 | |
| Rio Tinto PLC | 1,185,200 | 39,759 | |
| SABMiller PLC | 719,300 | 43,985 | |
| Shawbrook Group PLC | 8,951,700 | 37,487 | |
| Softcat PLC | 1,526,900 | 7,117 | |
| Spirax-Sarco Engineering PLC | 539,500 | 26,920 | |
| St. James's Place Capital PLC | 5,394,300 | 68,336 | |
| Standard Chartered PLC (United Kingdom) | 5,296,810 | 42,729 | |
| Taylor Wimpey PLC | 11,716,900 | 31,552 | |
| Virgin Money Holdings Uk PLC | 5,874,500 | 31,338 | |
| Vodafone Group PLC | 30,823,796 | 99,309 | |
| Workspace Group PLC | 649,000 | 7,918 | |
| TOTAL UNITED KINGDOM | 1,468,231 | ||
| United States of America - 3.1% | |||
| Constellation Brands, Inc. Class A (sub. vtg.) | 520,000 | 81,151 | |
| Global Payments, Inc. | 465,000 | 33,564 | |
| McGraw Hill Financial, Inc. | 462,400 | 49,407 | |
| Molson Coors Brewing Co. Class B | 121,600 | 11,629 | |
| MSCI, Inc. Class A | 586,700 | 44,554 | |
| Visa, Inc. Class A | 1,147,700 | 88,648 | |
| TOTAL UNITED STATES OF AMERICA | 308,953 | ||
| TOTAL COMMON STOCKS | |||
| (Cost $8,697,817) | 9,796,876 | ||
| Nonconvertible Preferred Stocks - 0.2% | |||
| Cayman Islands - 0.2% | |||
| China Internet Plus Holdings Ltd. Series A-11 (d) | |||
| (Cost $18,833) | 5,958,244 | 23,003 | |
| Principal Amount (000s) | Value (000s) | ||
| Government Obligations - 0.1% | |||
| United States of America - 0.1% | |||
| U.S. Treasury Bills, yield at date of purchase 0.2% to 0.33% 5/5/16 to 7/28/16 (e) | |||
| (Cost $11,655) | 11,660 | 11,657 | |
| Shares | Value (000s) | ||
| Money Market Funds - 5.1% | |||
| Fidelity Cash Central Fund, 0.38% (f) | 199,763,053 | 199,763 | |
| Fidelity Securities Lending Cash Central Fund, 0.42% (f)(g) | 311,707,412 | 311,707 | |
| TOTAL MONEY MARKET FUNDS | |||
| (Cost $511,470) | 511,470 | ||
| TOTAL INVESTMENT PORTFOLIO - 102.5% | |||
| (Cost $9,239,775) | 10,343,006 | ||
| NET OTHER ASSETS (LIABILITIES) - (2.5)% | (248,078) | ||
| NET ASSETS - 100% | $10,094,928 |
| Futures Contracts | |||
| Expiration Date | Underlying Face Amount at Value (000s) | Unrealized Appreciation/(Depreciation) (000s) | |
| Purchased | |||
| Equity Index Contracts | |||
| 2,402 CME Nikkei 225 Contracts (Japan) | June 2016 | 179,021 | $(11,598) |
The face value of futures purchased as a percentage of Net Assets is 1.8%
Categorizations in the Schedule of Investments are based on country or territory of incorporation.
Legend
(a) Non-income producing
(b) Security or a portion of the security is on loan at period end.
(c) Affiliated company
(d) Restricted securities - Investment in securities not registered under the Securities Act of 1933 (excluding 144A issues). At the end of the period, the value of restricted securities (excluding 144A issues) amounted to $23,003,000 or 0.2% of net assets.
(e) Security or a portion of the security was pledged to cover margin requirements for futures contracts. At period end, the value of securities pledged amounted to $11,657,000.
(f) Affiliated fund that is generally available only to investment companies and other accounts managed by Fidelity Investments. The rate quoted is the annualized seven-day yield of the fund at period end. A complete unaudited listing of the fund's holdings as of its most recent quarter end is available upon request. In addition, each Fidelity Central Fund's financial statements are available on the SEC's website or upon request.
(g) Investment made with cash collateral received from securities on loan.
Additional information on each restricted holding is as follows:
| Security | Acquisition Date | Acquisition Cost (000s) |
| China Internet Plus Holdings Ltd. Series A-11 | 1/26/15 | $18,833 |
Affiliated Central Funds
Information regarding fiscal year to date income earned by the Fund from investments in Fidelity Central Funds is as follows:
| Fund | Income earned |
| (Amounts in thousands) | |
| Fidelity Cash Central Fund | $545 |
| Fidelity Securities Lending Cash Central Fund | 2,593 |
| Total | $3,138 |
Other Affiliated Issuers
An affiliated company is a company in which the Fund has ownership of at least 5% of the voting securities. Fiscal year to date transactions with companies which are or were affiliates are as follows:
| Affiliate (Amounts in thousands) | Value, beginning of period | Purchases | Sales Proceeds* | Dividend Income | Value, end of period |
| Hoegh LNG Partners LP | $11,465 | $-- | $-- | $832 | $12,896 |
| Rex Bionics PLC | 976 | -- | 4 | -- | 692 |
| Total | $12,441 | $-- | $4 | $832 | $13,588 |
* Includes the value of securities delivered through in-kind transactions, if applicable.
Investment Valuation
The following is a summary of the inputs used, as of April 30, 2016, involving the Fund's assets and liabilities carried at fair value. The inputs or methodology used for valuing securities may not be an indication of the risk associated with investing in those securities. For more information on valuation inputs, and their aggregation into the levels used below, please refer to the Investment Valuation section in the accompanying Notes to Financial Statements.
| Valuation Inputs at Reporting Date: | ||||
| Description | Total | Level 1 | Level 2 | Level 3 |
| (Amounts in thousands) | ||||
| Investments in Securities: | ||||
| Equities: | ||||
| Consumer Discretionary | $1,534,838 | $1,034,716 | $477,119 | $23,003 |
| Consumer Staples | 1,334,162 | 853,349 | 480,813 | -- |
| Energy | 494,568 | 113,750 | 380,818 | -- |
| Financials | 2,185,536 | 1,236,886 | 948,650 | -- |
| Health Care | 1,265,979 | 574,622 | 691,357 | -- |
| Industrials | 1,107,038 | 909,868 | 197,170 | -- |
| Information Technology | 982,951 | 693,397 | 289,554 | -- |
| Materials | 371,953 | 262,239 | 109,714 | -- |
| Telecommunication Services | 480,601 | 83,196 | 397,405 | -- |
| Utilities | 62,253 | 62,253 | -- | -- |
| Government Obligations | 11,657 | -- | 11,657 | -- |
| Money Market Funds | 511,470 | 511,470 | -- | -- |
| Total Investments in Securities: | $10,343,006 | $6,335,746 | $3,984,257 | $23,003 |
| Derivative Instruments: | ||||
| Liabilities | ||||
| Futures Contracts | $(11,598) | $(11,598) | $-- | $-- |
| Total Liabilities | $(11,598) | $(11,598) | $-- | $-- |
| Total Derivative Instruments: | $(11,598) | $(11,598) | $-- | $-- |
The following is a summary of transfers between Level 1 and Level 2 for the period ended April 30, 2016. Transfers are assumed to have occurred at the beginning of the period, and are primarily attributable to the valuation techniques used for foreign equity securities, as discussed in the accompanying Notes to Financial Statements:
| Transfers | Total (000s) |
| Level 1 to Level 2 | $123,459 |
| Level 2 to Level 1 | $733,107 |
Value of Derivative Instruments
The following table is a summary of the Fund's value of derivative instruments by primary risk exposure as of April 30, 2016. For additional information on derivative instruments, please refer to the Derivative Instruments section in the accompanying Notes to Financial Statements.
| Primary Risk Exposure / Derivative Type | Value (000s) | |
| Asset | Liability | |
| Equity Risk | ||
| Futures Contracts(a) | $0 | $(11,598) |
| Total Equity Risk | 0 | (11,598) |
| Total Value of Derivatives | $0 | $(11,598) |
(a) Reflects gross cumulative appreciation (depreciation) on futures contracts as presented in the Schedule of Investments. In the Statement of Assets and Liabilities, the period end daily variation margin is included in receivable or payable for daily variation margin for derivative instruments, and the net cumulative appreciation (depreciation) is included in net unrealized appreciation (depreciation).
See accompanying notes which are an integral part of the financial statements.
Financial Statements
Statement of Assets and Liabilities
| Amounts in thousands (except per-share amounts) | April 30, 2016 (Unaudited) | |
| Assets | ||
| Investment in securities, at value (including securities loaned of $292,726) — See accompanying schedule: Unaffiliated issuers (cost $8,709,825) | $9,817,948 | |
| Fidelity Central Funds (cost $511,470) | 511,470 | |
| Other affiliated issuers (cost $18,480) | 13,588 | |
| Total Investments (cost $9,239,775) | $10,343,006 | |
| Foreign currency held at value (cost $3,534) | 3,534 | |
| Receivable for investments sold | 83,114 | |
| Receivable for fund shares sold | 9,626 | |
| Dividends receivable | 48,955 | |
| Distributions receivable from Fidelity Central Funds | 957 | |
| Prepaid expenses | 9 | |
| Other receivables | 4,089 | |
| Total assets | 10,493,290 | |
| Liabilities | ||
| Payable to custodian bank | $705 | |
| Payable for investments purchased | 56,857 | |
| Payable for fund shares redeemed | 16,003 | |
| Accrued management fee | 6,281 | |
| Distribution and service plan fees payable | 100 | |
| Payable for daily variation margin for derivative instruments | 4,684 | |
| Other affiliated payables | 1,444 | |
| Other payables and accrued expenses | 581 | |
| Collateral on securities loaned, at value | 311,707 | |
| Total liabilities | 398,362 | |
| Net Assets | $10,094,928 | |
| Net Assets consist of: | ||
| Paid in capital | $9,352,158 | |
| Undistributed net investment income | 88,416 | |
| Accumulated undistributed net realized gain (loss) on investments and foreign currency transactions | (436,449) | |
| Net unrealized appreciation (depreciation) on investments and assets and liabilities in foreign currencies | 1,090,803 | |
| Net Assets | $10,094,928 | |
| Calculation of Maximum Offering Price | ||
| Class A: | ||
| Net Asset Value and redemption price per share ($260,942.4 ÷ 6,913.487 shares) | $37.74 | |
| Maximum offering price per share (100/94.25 of $37.74) | $40.04 | |
| Class T: | ||
| Net Asset Value and redemption price per share ($38,584.3 ÷ 1,028.093 shares) | $37.53 | |
| Maximum offering price per share (100/96.50 of $37.53) | $38.89 | |
| Class B: | ||
| Net Asset Value and offering price per share ($1,398.6 ÷ 37.492 shares)(a) | $37.30 | |
| Class C: | ||
| Net Asset Value and offering price per share ($32,708.8 ÷ 878.178 shares)(a) | $37.25 | |
| International Discovery: | ||
| Net Asset Value, offering price and redemption price per share ($6,797,488.8 ÷ 178,912.550 shares) | $37.99 | |
| Class K: | ||
| Net Asset Value, offering price and redemption price per share ($2,151,531.2 ÷ 56,751.079 shares) | $37.91 | |
| Class I: | ||
| Net Asset Value, offering price and redemption price per share ($781,184.7 ÷ 20,610.933 shares) | $37.90 | |
| Class Z: | ||
| Net Asset Value, offering price and redemption price per share ($31,088.8 ÷ 820.463 shares) | $37.89 |
(a) Redemption price per share is equal to net asset value less any applicable contingent deferred sales charge.
See accompanying notes which are an integral part of the financial statements.
Statement of Operations
| Amounts in thousands | Six months ended April 30, 2016 (Unaudited) | |
| Investment Income | ||
| Dividends (including $832 earned from other affiliated issuers) | $115,061 | |
| Special dividends | 37,704 | |
| Interest | 30 | |
| Income from Fidelity Central Funds | 3,138 | |
| Income before foreign taxes withheld | 155,933 | |
| Less foreign taxes withheld | (11,075) | |
| Total income | 144,858 | |
| Expenses | ||
| Management fee | ||
| Basic fee | $34,526 | |
| Performance adjustment | 6,890 | |
| Transfer agent fees | 8,001 | |
| Distribution and service plan fees | 600 | |
| Accounting and security lending fees | 905 | |
| Custodian fees and expenses | 660 | |
| Independent trustees' compensation | 23 | |
| Registration fees | 158 | |
| Audit | 78 | |
| Legal | 14 | |
| Miscellaneous | 35 | |
| Total expenses before reductions | 51,890 | |
| Expense reductions | (113) | 51,777 |
| Net investment income (loss) | 93,081 | |
| Realized and Unrealized Gain (Loss) | ||
| Net realized gain (loss) on: | ||
| Investment securities: | ||
| Unaffiliated issuers | (355,764) | |
| Other affiliated issuers | (19) | |
| Foreign currency transactions | 4,399 | |
| Futures contracts | (10,549) | |
| Total net realized gain (loss) | (361,933) | |
| Change in net unrealized appreciation (depreciation) on: Investment securities | (204,729) | |
| Assets and liabilities in foreign currencies | (1,103) | |
| Futures contracts | (20,801) | |
| Total change in net unrealized appreciation (depreciation) | (226,633) | |
| Net gain (loss) | (588,566) | |
| Net increase (decrease) in net assets resulting from operations | $(495,485) |
See accompanying notes which are an integral part of the financial statements.
Statement of Changes in Net Assets
| Amounts in thousands | Six months ended April 30, 2016 (Unaudited) | Year ended October 31, 2015 |
| Increase (Decrease) in Net Assets | ||
| Operations | ||
| Net investment income (loss) | $93,081 | $149,838 |
| Net realized gain (loss) | (361,933) | 245,770 |
| Change in net unrealized appreciation (depreciation) | (226,633) | 655 |
| Net increase (decrease) in net assets resulting from operations | (495,485) | 396,263 |
| Distributions to shareholders from net investment income | (113,434) | (74,589) |
| Distributions to shareholders from net realized gain | (1,362) | – |
| Total distributions | (114,796) | (74,589) |
| Share transactions - net increase (decrease) | (262,006) | (353,147) |
| Redemption fees | 42 | 95 |
| Total increase (decrease) in net assets | (872,245) | (31,378) |
| Net Assets | ||
| Beginning of period | 10,967,173 | 10,998,551 |
| End of period (including undistributed net investment income of $88,416 and undistributed net investment income of $108,769, respectively) | $10,094,928 | $10,967,173 |
See accompanying notes which are an integral part of the financial statements.
Financial Highlights — Fidelity International Discovery Fund Class A
| Six months ended (Unaudited) April 30, | Years ended October 31, | |||||
| 2016 | 2015 | 2014 | 2013 | 2012 | 2011 | |
| Selected Per–Share Data | ||||||
| Net asset value, beginning of period | $39.78 | $38.70 | $39.49 | $31.66 | $29.43 | $32.07 |
| Income from Investment Operations | ||||||
| Net investment income (loss)A | .27B | .40C | .53D | .34 | .41 | .42 |
| Net realized and unrealized gain (loss) | (2.04) | .79 | (.67) | 7.97 | 2.11 | (2.52) |
| Total from investment operations | (1.77) | 1.19 | (.14) | 8.31 | 2.52 | (2.10) |
| Distributions from net investment income | (.27) | (.11) | (.33) | (.45) | (.29) | (.38) |
| Distributions from net realized gain | (.01) | – | (.31) | (.03) | – | (.16) |
| Total distributions | (.27)E | (.11) | (.65)F | (.48) | (.29) | (.54) |
| Redemption fees added to paid in capitalA,G | – | – | – | – | – | – |
| Net asset value, end of period | $37.74 | $39.78 | $38.70 | $39.49 | $31.66 | $29.43 |
| Total ReturnH,I,J | (4.47)% | 3.09% | (.36)% | 26.59% | 8.70% | (6.71)% |
| Ratios to Average Net AssetsK,L | ||||||
| Expenses before reductions | 1.37%M | 1.33% | 1.28% | 1.35% | 1.34% | 1.30% |
| Expenses net of fee waivers, if any | 1.37%M | 1.33% | 1.28% | 1.35% | 1.34% | 1.29% |
| Expenses net of all reductions | 1.37%M | 1.32% | 1.28% | 1.33% | 1.31% | 1.25% |
| Net investment income (loss) | 1.45%B,M | 1.00%C | 1.35%D | .97% | 1.41% | 1.31% |
| Supplemental Data | ||||||
| Net assets, end of period (in millions) | $261 | $283 | $297 | $347 | $299 | $320 |
| Portfolio turnover rateN | 49%M,O | 60%O | 57% | 65% | 68% | 75% |
A Calculated based on average shares outstanding during the period.
B Net Investment income per share reflects a large, non-recurring dividend which amounted to $.14 per share. Excluding this non-recurring dividend, the ratio of net investment income (loss) to average net assets would have been .72%.
C Net Investment income per share reflects a large, non-recurring dividend which amounted to $.12 per share. Excluding this non-recurring dividend, the ratio of net investment income (loss) to average net assets would have been .69%.
D Net Investment income per share reflects a large, non-recurring dividend which amounted to $.22 per share. Excluding this non-recurring dividend, the ratio of net investment income (loss) to average net assets would have been .80%.
E Total distributions of $.27 per share is comprised of distributions from net investment income of $.269 and distributions from net realized gain of $.005 per share.
F Total distributions of $.65 per share is comprised of distributions from net investment income of $.334 and distributions from net realized gain of $.311 per share.
G Amount represents less than $.005 per share.
H Total returns for periods of less than one year are not annualized.
I Total returns would have been lower if certain expenses had not been reduced during the applicable periods shown.
J Total returns do not include the effect of the sales charges.
K Fees and expenses of any underlying Fidelity Central Funds are not included in the Fund's expense ratio. The Fund indirectly bears its proportionate share of the expenses of any underlying Fidelity Central Funds.
L Expense ratios reflect operating expenses of the class. Expenses before reductions do not reflect amounts reimbursed by the investment adviser or reductions from brokerage service arrangements or reductions from other expense offset arrangements and do not represent the amount paid by the class during periods when reimbursements or reductions occur. Expenses net of fee waivers reflect expenses after reimbursement by the investment adviser but prior to reductions from brokerage service arrangements or other expense offset arrangements. Expenses net of all reductions represent the net expenses paid by the class.
M Annualized
N Amount does not include the portfolio activity of any underlying Fidelity Central Funds.
O Portfolio turnover rate excludes securities received or delivered in-kind.
See accompanying notes which are an integral part of the financial statements.
Financial Highlights — Fidelity International Discovery Fund Class T
| Six months ended (Unaudited) April 30, | Years ended October 31, | |||||
| 2016 | 2015 | 2014 | 2013 | 2012 | 2011 | |
| Selected Per–Share Data | ||||||
| Net asset value, beginning of period | $39.51 | $38.43 | $39.23 | $31.42 | $29.18 | $31.81 |
| Income from Investment Operations | ||||||
| Net investment income (loss)A | .23B | .30C | .44D | .26 | .34 | .34 |
| Net realized and unrealized gain (loss) | (2.03) | .80 | (.68) | 7.92 | 2.09 | (2.51) |
| Total from investment operations | (1.80) | 1.10 | (.24) | 8.18 | 2.43 | (2.17) |
| Distributions from net investment income | (.17) | (.02) | (.25) | (.34) | (.19) | (.30) |
| Distributions from net realized gain | (.01) | – | (.31) | (.03) | – | (.16) |
| Total distributions | (.18) | (.02) | (.56) | (.37) | (.19) | (.46) |
| Redemption fees added to paid in capitalA,E | – | – | – | – | – | – |
| Net asset value, end of period | $37.53 | $39.51 | $38.43 | $39.23 | $31.42 | $29.18 |
| Total ReturnF,G,H | (4.59)% | 2.86% | (.60)% | 26.31% | 8.41% | (6.96)% |
| Ratios to Average Net AssetsI,J | ||||||
| Expenses before reductions | 1.61%K | 1.57% | 1.51% | 1.59% | 1.59% | 1.56% |
| Expenses net of fee waivers, if any | 1.61%K | 1.57% | 1.51% | 1.59% | 1.59% | 1.55% |
| Expenses net of all reductions | 1.61%K | 1.56% | 1.51% | 1.57% | 1.56% | 1.51% |
| Net investment income (loss) | 1.21%B,K | .76%C | 1.11%D | .73% | 1.16% | 1.05% |
| Supplemental Data | ||||||
| Net assets, end of period (in millions) | $39 | $43 | $49 | $53 | $46 | $61 |
| Portfolio turnover rateL | 49%K,M | 60%M | 57% | 65% | 68% | 75% |
A Calculated based on average shares outstanding during the period.
B Net Investment income per share reflects a large, non-recurring dividend which amounted to $.14 per share. Excluding this non-recurring dividend, the ratio of net investment income (loss) to average net assets would have been .48%.
C Net Investment income per share reflects a large, non-recurring dividend which amounted to $.12 per share. Excluding this non-recurring dividend, the ratio of net investment income (loss) to average net assets would have been .45%.
D Net Investment income per share reflects a large, non-recurring dividend which amounted to $.21 per share. Excluding this non-recurring dividend, the ratio of net investment income (loss) to average net assets would have been .56%.
E Amount represents less than $.005 per share.
F Total returns for periods of less than one year are not annualized.
G Total returns would have been lower if certain expenses had not been reduced during the applicable periods shown.
H Total returns do not include the effect of the sales charges.
I Fees and expenses of any underlying Fidelity Central Funds are not included in the Fund's expense ratio. The Fund indirectly bears its proportionate share of the expenses of any underlying Fidelity Central Funds.
J Expense ratios reflect operating expenses of the class. Expenses before reductions do not reflect amounts reimbursed by the investment adviser or reductions from brokerage service arrangements or reductions from other expense offset arrangements and do not represent the amount paid by the class during periods when reimbursements or reductions occur. Expenses net of fee waivers reflect expenses after reimbursement by the investment adviser but prior to reductions from brokerage service arrangements or other expense offset arrangements. Expenses net of all reductions represent the net expenses paid by the class.
K Annualized
L Amount does not include the portfolio activity of any underlying Fidelity Central Funds.
M Portfolio turnover rate excludes securities received or delivered in-kind.
See accompanying notes which are an integral part of the financial statements.
Financial Highlights — Fidelity International Discovery Fund Class B
| Six months ended (Unaudited) April 30, | Years ended October 31, | |||||
| 2016 | 2015 | 2014 | 2013 | 2012 | 2011 | |
| Selected Per–Share Data | ||||||
| Net asset value, beginning of period | $39.20 | $38.32 | $39.08 | $31.28 | $29.02 | $31.60 |
| Income from Investment Operations | ||||||
| Net investment income (loss)A | .13B | .08C | .22D | .08 | .19 | .17 |
| Net realized and unrealized gain (loss) | (2.03) | .80 | (.66) | 7.90 | 2.09 | (2.48) |
| Total from investment operations | (1.90) | .88 | (.44) | 7.98 | 2.28 | (2.31) |
| Distributions from net investment income | – | – | (.01) | (.15) | (.02) | (.12) |
| Distributions from net realized gain | – | – | (.31) | (.03) | – | (.16) |
| Total distributions | – | – | (.32) | (.18) | (.02) | (.27)E |
| Redemption fees added to paid in capitalA,F | – | – | – | – | – | – |
| Net asset value, end of period | $37.30 | $39.20 | $38.32 | $39.08 | $31.28 | $29.02 |
| Total ReturnG,H,I | (4.85)% | 2.30% | (1.12)% | 25.64% | 7.85% | (7.39)% |
| Ratios to Average Net AssetsJ,K | ||||||
| Expenses before reductions | 2.14%L | 2.12% | 2.06% | 2.10% | 2.09% | 2.06% |
| Expenses net of fee waivers, if any | 2.14%L | 2.12% | 2.06% | 2.10% | 2.09% | 2.06% |
| Expenses net of all reductions | 2.14%L | 2.11% | 2.05% | 2.08% | 2.06% | 2.02% |
| Net investment income (loss) | .68%B,L | .21%C | .57%D | .22% | .66% | .54% |
| Supplemental Data | ||||||
| Net assets, end of period (in millions) | $1 | $2 | $5 | $7 | $8 | $10 |
| Portfolio turnover rateM | 49%L,N | 60%N | 57% | 65% | 68% | 75% |
A Calculated based on average shares outstanding during the period.
B Net Investment income per share reflects a large, non-recurring dividend which amounted to $.14 per share. Excluding this non-recurring dividend, the ratio of net investment income (loss) to average net assets would have been (.05) %.
C Net Investment income per share reflects a large, non-recurring dividend which amounted to $.12 per share. Excluding this non-recurring dividend, the ratio of net investment income (loss) to average net assets would have been (.10) %.
D Net Investment income per share reflects a large, non-recurring dividend which amounted to $.21 per share. Excluding this non-recurring dividend, the ratio of net investment income (loss) to average net assets would have been .02%.
E Total distributions of $.27 per share is comprised of distributions from net investment income of $.115 and distributions from net realized gain of $.155 per share.
F Amount represents less than $.005 per share.
G Total returns for periods of less than one year are not annualized.
H Total returns would have been lower if certain expenses had not been reduced during the applicable periods shown.
I Total returns do not include the effect of the contingent deferred sales charge.
J Fees and expenses of any underlying Fidelity Central Funds are not included in the Fund's expense ratio. The Fund indirectly bears its proportionate share of the expenses of any underlying Fidelity Central Funds.
K Expense ratios reflect operating expenses of the class. Expenses before reductions do not reflect amounts reimbursed by the investment adviser or reductions from brokerage service arrangements or reductions from other expense offset arrangements and do not represent the amount paid by the class during periods when reimbursements or reductions occur. Expenses net of fee waivers reflect expenses after reimbursement by the investment adviser but prior to reductions from brokerage service arrangements or other expense offset arrangements. Expenses net of all reductions represent the net expenses paid by the class.
L Annualized
M Amount does not include the portfolio activity of any underlying Fidelity Central Funds.
N Portfolio turnover rate excludes securities received or delivered in-kind.
See accompanying notes which are an integral part of the financial statements.
Financial Highlights — Fidelity International Discovery Fund Class C
| Six months ended (Unaudited) April 30, | Years ended October 31, | |||||
| 2016 | 2015 | 2014 | 2013 | 2012 | 2011 | |
| Selected Per–Share Data | ||||||
| Net asset value, beginning of period | $39.14 | $38.25 | $39.07 | $31.32 | $29.08 | $31.68 |
| Income from Investment Operations | ||||||
| Net investment income (loss)A | .13B | .10C | .23D | .08 | .19 | .18 |
| Net realized and unrealized gain (loss) | (2.02) | .79 | (.66) | 7.90 | 2.09 | (2.49) |
| Total from investment operations | (1.89) | .89 | (.43) | 7.98 | 2.28 | (2.31) |
| Distributions from net investment income | – | – | (.08) | (.20) | (.04) | (.14) |
| Distributions from net realized gain | – | – | (.31) | (.03) | – | (.16) |
| Total distributions | – | – | (.39) | (.23) | (.04) | (.29)E |
| Redemption fees added to paid in capitalA,F | – | – | – | – | – | – |
| Net asset value, end of period | $37.25 | $39.14 | $38.25 | $39.07 | $31.32 | $29.08 |
| Total ReturnG,H,I | (4.83)% | 2.33% | (1.10)% | 25.65% | 7.86% | (7.37)% |
| Ratios to Average Net AssetsJ,K | ||||||
| Expenses before reductions | 2.12%L | 2.09% | 2.03% | 2.10% | 2.09% | 2.05% |
| Expenses net of fee waivers, if any | 2.12%L | 2.09% | 2.03% | 2.09% | 2.09% | 2.04% |
| Expenses net of all reductions | 2.12%L | 2.08% | 2.02% | 2.07% | 2.06% | 2.00% |
| Net investment income (loss) | .70%B,L | .24%C | .60%D | .23% | .66% | .56% |
| Supplemental Data | ||||||
| Net assets, end of period (in millions) | $33 | $32 | $35 | $36 | $30 | $33 |
| Portfolio turnover rateM | 49%L,N | 60%N | 57% | 65% | 68% | 75% |
A Calculated based on average shares outstanding during the period.
B Net Investment income per share reflects a large, non-recurring dividend which amounted to $.14 per share. Excluding this non-recurring dividend, the ratio of net investment income (loss) to average net assets would have been (.03) %.
C Net Investment income per share reflects a large, non-recurring dividend which amounted to $.12 per share. Excluding this non-recurring dividend, the ratio of net investment income (loss) to average net assets would have been (.06) %.
D Net Investment income per share reflects a large, non-recurring dividend which amounted to $.21 per share. Excluding this non-recurring dividend, the ratio of net investment income (loss) to average net assets would have been .05%.
E Total distributions of $.29 per share is comprised of distributions from net investment income of $.137 and distributions from net realized gain of $.155 per share.
F Amount represents less than $.005 per share.
G Total returns for periods of less than one year are not annualized.
H Total returns would have been lower if certain expenses had not been reduced during the applicable periods shown.
I Total returns do not include the effect of the contingent deferred sales charge.
J Fees and expenses of any underlying Fidelity Central Funds are not included in the Fund's expense ratio. The Fund indirectly bears its proportionate share of the expenses of any underlying Fidelity Central Funds.
K Expense ratios reflect operating expenses of the class. Expenses before reductions do not reflect amounts reimbursed by the investment adviser or reductions from brokerage service arrangements or reductions from other expense offset arrangements and do not represent the amount paid by the class during periods when reimbursements or reductions occur. Expenses net of fee waivers reflect expenses after reimbursement by the investment adviser but prior to reductions from brokerage service arrangements or other expense offset arrangements. Expenses net of all reductions represent the net expenses paid by the class.
L Annualized
M Amount does not include the portfolio activity of any underlying Fidelity Central Funds.
N Portfolio turnover rate excludes securities received or delivered in-kind.
See accompanying notes which are an integral part of the financial statements.
Financial Highlights — Fidelity International Discovery Fund
| Six months ended (Unaudited) April 30, | Years ended October 31, | |||||
| 2016 | 2015 | 2014 | 2013 | 2012 | 2011 | |
| Selected Per–Share Data | ||||||
| Net asset value, beginning of period | $40.12 | $39.03 | $39.82 | $31.91 | $29.69 | $32.34 |
| Income from Investment Operations | ||||||
| Net investment income (loss)A | .34B | .54C | .67D | .47 | .51 | .53 |
| Net realized and unrealized gain (loss) | (2.06) | .81 | (.68) | 8.02 | 2.12 | (2.54) |
| Total from investment operations | (1.72) | 1.35 | (.01) | 8.49 | 2.63 | (2.01) |
| Distributions from net investment income | (.41) | (.26) | (.47) | (.55) | (.41) | (.48) |
| Distributions from net realized gain | (.01) | – | (.31) | (.03) | – | (.16) |
| Total distributions | (.41)E | (.26) | (.78) | (.58) | (.41) | (.64) |
| Redemption fees added to paid in capitalA,F | – | – | – | – | – | – |
| Net asset value, end of period | $37.99 | $40.12 | $39.03 | $39.82 | $31.91 | $29.69 |
| Total ReturnG,H | (4.33)% | 3.47% | (.01)% | 27.03% | 9.03% | (6.39)% |
| Ratios to Average Net AssetsI,J | ||||||
| Expenses before reductions | 1.02%K | .99% | .93% | 1.00% | 1.01% | .97% |
| Expenses net of fee waivers, if any | 1.02%K | .99% | .93% | 1.00% | 1.01% | .96% |
| Expenses net of all reductions | 1.02%K | .98% | .93% | .98% | .98% | .92% |
| Net investment income (loss) | 1.80%B,K | 1.34%C | 1.69%D | 1.32% | 1.73% | 1.64% |
| Supplemental Data | ||||||
| Net assets, end of period (in millions) | $6,797 | $7,209 | $7,464 | $7,800 | $5,965 | $6,806 |
| Portfolio turnover rateL | 49%K,M | 60%M | 57% | 65% | 68% | 75% |
A Calculated based on average shares outstanding during the period.
B Net Investment income per share reflects a large, non-recurring dividend which amounted to $.14 per share. Excluding this non-recurring dividend, the ratio of net investment income (loss) to average net assets would have been 1.07%.
C Net Investment income per share reflects a large, non-recurring dividend which amounted to $.12 per share. Excluding this non-recurring dividend, the ratio of net investment income (loss) to average net assets would have been 1.03%.
D Net Investment income per share reflects a large, non-recurring dividend which amounted to $.22 per share. Excluding this non-recurring dividend, the ratio of net investment income (loss) to average net assets would have been 1.15%.
E Total distributions of $.41 per share is comprised of distributions from net investment income of $.409 and distributions from net realized gain of $.005 per share.
F Amount represents less than $.005 per share.
G Total returns for periods of less than one year are not annualized.
H Total returns would have been lower if certain expenses had not been reduced during the applicable periods shown.
I Fees and expenses of any underlying Fidelity Central Funds are not included in the Fund's expense ratio. The Fund indirectly bears its proportionate share of the expenses of any underlying Fidelity Central Funds.
J Expense ratios reflect operating expenses of the class. Expenses before reductions do not reflect amounts reimbursed by the investment adviser or reductions from brokerage service arrangements or reductions from other expense offset arrangements and do not represent the amount paid by the class during periods when reimbursements or reductions occur. Expenses net of fee waivers reflect expenses after reimbursement by the investment adviser but prior to reductions from brokerage service arrangements or other expense offset arrangements. Expenses net of all reductions represent the net expenses paid by the class.
K Annualized
L Amount does not include the portfolio activity of any underlying Fidelity Central Funds.
M Portfolio turnover rate excludes securities received or delivered in-kind.
See accompanying notes which are an integral part of the financial statements.
Financial Highlights — Fidelity International Discovery Fund Class K
| Six months ended (Unaudited) April 30, | Years ended October 31, | |||||
| 2016 | 2015 | 2014 | 2013 | 2012 | 2011 | |
| Selected Per–Share Data | ||||||
| Net asset value, beginning of period | $40.06 | $38.97 | $39.76 | $31.87 | $29.66 | $32.32 |
| Income from Investment Operations | ||||||
| Net investment income (loss)A | .36B | .59C | .72D | .52 | .57 | .58 |
| Net realized and unrealized gain (loss) | (2.04) | .81 | (.67) | 8.01 | 2.11 | (2.54) |
| Total from investment operations | (1.68) | 1.40 | .05 | 8.53 | 2.68 | (1.96) |
| Distributions from net investment income | (.46) | (.31) | (.53) | (.61) | (.47) | (.55) |
| Distributions from net realized gain | (.01) | – | (.31) | (.03) | – | (.16) |
| Total distributions | (.47) | (.31) | (.84) | (.64) | (.47) | (.70)E |
| Redemption fees added to paid in capitalA,F | – | – | – | – | – | – |
| Net asset value, end of period | $37.91 | $40.06 | $38.97 | $39.76 | $31.87 | $29.66 |
| Total ReturnG,H | (4.25)% | 3.61% | .13% | 27.23% | 9.24% | (6.24)% |
| Ratios to Average Net AssetsI,J | ||||||
| Expenses before reductions | .89%K | .86% | .80% | .85% | .83% | .80% |
| Expenses net of fee waivers, if any | .89%K | .86% | .80% | .85% | .83% | .79% |
| Expenses net of all reductions | .89%K | .85% | .79% | .83% | .80% | .75% |
| Net investment income (loss) | 1.94%B,K | 1.47%C | 1.83%D | 1.47% | 1.91% | 1.81% |
| Supplemental Data | ||||||
| Net assets, end of period (in millions) | $2,152 | $2,308 | $2,464 | $2,576 | $1,776 | $1,245 |
| Portfolio turnover rateL | 49%K,M | 60%M | 57% | 65% | 68% | 75% |
A Calculated based on average shares outstanding during the period.
B Net Investment income per share reflects a large, non-recurring dividend which amounted to $.14 per share. Excluding this non-recurring dividend, the ratio of net investment income (loss) to average net assets would have been 1.20%.
C Net Investment income per share reflects a large, non-recurring dividend which amounted to $.12 per share. Excluding this non-recurring dividend, the ratio of net investment income (loss) to average net assets would have been 1.16%.
D Net Investment income per share reflects a large, non-recurring dividend which amounted to $.22 per share. Excluding this non-recurring dividend, the ratio of net investment income (loss) to average net assets would have been 1.28%.
E Total distributions of $.70 per share is comprised of distributions from net investment income of $.548 and distributions from net realized gain of $.155 per share.
F Amount represents less than $.005 per share.
G Total returns for periods of less than one year are not annualized.
H Total returns would have been lower if certain expenses had not been reduced during the applicable periods shown.
I Fees and expenses of any underlying Fidelity Central Funds are not included in the Fund's expense ratio. The Fund indirectly bears its proportionate share of the expenses of any underlying Fidelity Central Funds.
J Expense ratios reflect operating expenses of the class. Expenses before reductions do not reflect amounts reimbursed by the investment adviser or reductions from brokerage service arrangements or reductions from other expense offset arrangements and do not represent the amount paid by the class during periods when reimbursements or reductions occur. Expenses net of fee waivers reflect expenses after reimbursement by the investment adviser but prior to reductions from brokerage service arrangements or other expense offset arrangements. Expenses net of all reductions represent the net expenses paid by the class.
K Annualized
L Amount does not include the portfolio activity of any underlying Fidelity Central Funds.
M Portfolio turnover rate excludes securities received or delivered in-kind.
See accompanying notes which are an integral part of the financial statements.
Financial Highlights — Fidelity International Discovery Fund Class I
| Six months ended (Unaudited) April 30, | Years ended October 31, | |||||
| 2016 | 2015 | 2014 | 2013 | 2012 | 2011 | |
| Selected Per–Share Data | ||||||
| Net asset value, beginning of period | $40.03 | $38.96 | $39.76 | $31.87 | $29.65 | $32.31 |
| Income from Investment Operations | ||||||
| Net investment income (loss)A | .34B | .53C | .67D | .47 | .52 | .54 |
| Net realized and unrealized gain (loss) | (2.05) | .80 | (.68) | 8.01 | 2.11 | (2.55) |
| Total from investment operations | (1.71) | 1.33 | (.01) | 8.48 | 2.63 | (2.01) |
| Distributions from net investment income | (.42) | (.26) | (.48) | (.56) | (.41) | (.50) |
| Distributions from net realized gain | (.01) | – | (.31) | (.03) | – | (.16) |
| Total distributions | (.42)E | (.26) | (.79) | (.59) | (.41) | (.65)F |
| Redemption fees added to paid in capitalA,G | – | – | – | – | – | – |
| Net asset value, end of period | $37.90 | $40.03 | $38.96 | $39.76 | $31.87 | $29.65 |
| Total ReturnH,I | (4.31)% | 3.44% | (.01)% | 27.03% | 9.07% | (6.39)% |
| Ratios to Average Net AssetsJ,K | ||||||
| Expenses before reductions | 1.03%L | 1.00% | .93% | 1.00% | 1.00% | .95% |
| Expenses net of fee waivers, if any | 1.03%L | .99% | .93% | 1.00% | 1.00% | .94% |
| Expenses net of all reductions | 1.03%L | .98% | .93% | .97% | .97% | .90% |
| Net investment income (loss) | 1.80%B,L | 1.33%C | 1.69%D | 1.33% | 1.75% | 1.66% |
| Supplemental Data | ||||||
| Net assets, end of period (in millions) | $781 | $1,061 | $650 | $476 | $294 | $278 |
| Portfolio turnover rateM | 49%L,N | 60%N | 57% | 65% | 68% | 75% |
A Calculated based on average shares outstanding during the period.
B Net Investment income per share reflects a large, non-recurring dividend which amounted to $.14 per share. Excluding this non-recurring dividend, the ratio of net investment income (loss) to average net assets would have been 1.06%.
C Net Investment income per share reflects a large, non-recurring dividend which amounted to $.12 per share. Excluding this non-recurring dividend, the ratio of net investment income (loss) to average net assets would have been 1.03%.
D Net Investment income per share reflects a large, non-recurring dividend which amounted to $.22 per share. Excluding this non-recurring dividend, the ratio of net investment income (loss) to average net assets would have been 1.14%.
E Total distributions of $.42 per share is comprised of distributions from net investment income of $.418 and distributions from net realized gain of $.005 per share.
F Total distributions of $.65 per share is comprised of distributions from net investment income of $.497 and distributions from net realized gain of $.155 per share.
G Amount represents less than $.005 per share.
H Total returns for periods of less than one year are not annualized.
I Total returns would have been lower if certain expenses had not been reduced during the applicable periods shown.
J Fees and expenses of any underlying Fidelity Central Funds are not included in the Fund's expense ratio. The Fund indirectly bears its proportionate share of the expenses of any underlying Fidelity Central Funds.
K Expense ratios reflect operating expenses of the class. Expenses before reductions do not reflect amounts reimbursed by the investment adviser or reductions from brokerage service arrangements or reductions from other expense offset arrangements and do not represent the amount paid by the class during periods when reimbursements or reductions occur. Expenses net of fee waivers reflect expenses after reimbursement by the investment adviser but prior to reductions from brokerage service arrangements or other expense offset arrangements. Expenses net of all reductions represent the net expenses paid by the class.
L Annualized
M Amount does not include the portfolio activity of any underlying Fidelity Central Funds.
N Portfolio turnover rate excludes securities received or delivered in-kind.
See accompanying notes which are an integral part of the financial statements.
Financial Highlights — Fidelity International Discovery Fund Class Z
| Six months ended (Unaudited) April 30, | Years ended October 31, | |||
| 2016 | 2015 | 2014 | 2013 A | |
| Selected Per–Share Data | ||||
| Net asset value, beginning of period | $40.03 | $38.96 | $39.77 | $37.22 |
| Income from Investment Operations | ||||
| Net investment income (loss)B | .36C | .59D | .72E | .07 |
| Net realized and unrealized gain (loss) | (2.03) | .80 | (.68) | 2.48 |
| Total from investment operations | (1.67) | 1.39 | .04 | 2.55 |
| Distributions from net investment income | (.46) | (.32) | (.54) | – |
| Distributions from net realized gain | (.01) | – | (.31) | – |
| Total distributions | (.47) | (.32) | (.85) | – |
| Redemption fees added to paid in capitalB,F | – | – | – | – |
| Net asset value, end of period | $37.89 | $40.03 | $38.96 | $39.77 |
| Total ReturnG,H | (4.24)% | 3.58% | .12% | 6.85% |
| Ratios to Average Net AssetsI,J | ||||
| Expenses before reductions | .89%K | .86% | .80% | .85%K |
| Expenses net of fee waivers, if any | .89%K | .86% | .80% | .85%K |
| Expenses net of all reductions | .89%K | .85% | .79% | .83%K |
| Net investment income (loss) | 1.94%C,K | 1.47%D | 1.83%E | .76%K |
| Supplemental Data | ||||
| Net assets, end of period (000 omitted) | $31,089 | $30,093 | $35,125 | $107 |
| Portfolio turnover rateL | 49%K,M | 60%M | 57% | 65% |
A For the period August 13, 2013 (commencement of sale of shares) to October 31, 2013.
B Calculated based on average shares outstanding during the period.
C Net Investment income per share reflects a large, non-recurring dividend which amounted to $.14 per share. Excluding this non-recurring dividend, the ratio of net investment income (loss) to average net assets would have been 1.20%.
D Net Investment income per share reflects a large, non-recurring dividend which amounted to $.12 per share. Excluding this non-recurring dividend, the ratio of net investment income (loss) to average net assets would have been 1.16%.
E Net Investment income per share reflects a large, non-recurring dividend which amounted to $.21 per share. Excluding this non-recurring dividend, the ratio of net investment income (loss) to average net assets would have been 1.28%.
F Amount represents less than $.005 per share.
G Total returns for periods of less than one year are not annualized.
H Total returns would have been lower if certain expenses had not been reduced during the applicable periods shown.
I Fees and expenses of any underlying Fidelity Central Funds are not included in the Fund's expense ratio. The Fund indirectly bears its proportionate share of the expenses of any underlying Fidelity Central Funds.
J Expense ratios reflect operating expenses of the class. Expenses before reductions do not reflect amounts reimbursed by the investment adviser or reductions from brokerage service arrangements or reductions from other expense offset arrangements and do not represent the amount paid by the class during periods when reimbursements or reductions occur. Expense ratios before reductions for start-up periods may not be representative of longer-term operating periods. Expenses net of fee waivers reflect expenses after reimbursement by the investment adviser but prior to reductions from brokerage service arrangements or other expense offset arrangements. Expenses net of all reductions represent the net expenses paid by the class.
K Annualized
L Amount does not include the portfolio activity of any underlying Fidelity Central Funds.
M Portfolio turnover rate excludes securities received or delivered in-kind.
See accompanying notes which are an integral part of the financial statements.
Notes to Financial Statements (Unaudited)
For the period ended April 30, 2016
(Amounts in thousands except percentages)
1. Organization.
Fidelity International Discovery Fund (the Fund) is a fund of Fidelity Investment Trust (the Trust) and is authorized to issue an unlimited number of shares. The Trust is registered under the Investment Company Act of 1940, as amended (the 1940 Act), as an open-end management investment company organized as a Massachusetts business trust. The Fund offers Class A, Class T, Class C, International Discovery, Class K, Class I and Class Z shares, each of which, along with Class B shares, has equal rights as to assets and voting privileges. Class B shares are closed to new accounts and additional purchases, except for exchanges and reinvestments. Each class has exclusive voting rights with respect to matters that affect that class. Class B shares will automatically convert to Class A shares after a maximum holding period of seven years from the initial date of purchase.
During the period, the Board of Trustees approved the conversion of all existing Class B shares into Class A shares, effective on or about July 1, 2016, regardless of the length of times shares have been held.
2. Investments in Fidelity Central Funds.
The Fund invests in Fidelity Central Funds, which are open-end investment companies generally available only to other investment companies and accounts managed by the investment adviser and its affiliates. The Fund's Schedule of Investments lists each of the Fidelity Central Funds held as of period end, if any, as an investment of the Fund, but does not include the underlying holdings of each Fidelity Central Fund. As an Investing Fund, the Fund indirectly bears its proportionate share of the expenses of the underlying Fidelity Central Funds.
The Money Market Central Funds seek preservation of capital and current income and are managed by Fidelity Investments Money Management, Inc. (FIMM), an affiliate of the investment adviser. Annualized expenses of the Money Market Central Funds as of their most recent shareholder report date are less than .005%.
A complete unaudited list of holdings for each Fidelity Central Fund is available upon request or at the Securities and Exchange Commission (the SEC) website at www.sec.gov. In addition, the financial statements of the Fidelity Central Funds are available on the SEC website or upon request.
3. Significant Accounting Policies.
The financial statements have been prepared in conformity with accounting principles generally accepted in the United States of America (GAAP), which require management to make certain estimates and assumptions at the date of the financial statements. Actual results could differ from those estimates. Subsequent events, if any, through the date that the financial statements were issued have been evaluated in the preparation of the financial statements. The following summarizes the significant accounting policies of the Fund:
Investment Valuation. Investments are valued as of 4:00 p.m. Eastern time on the last calendar day of the period. The Board of Trustees (the Board) has delegated the day to day responsibility for the valuation of the Fund's investments to the Fidelity Management & Research Company (FMR) Fair Value Committee (the Committee). In accordance with valuation policies and procedures approved by the Board, the Fund attempts to obtain prices from one or more third party pricing vendors or brokers to value its investments. When current market prices, quotations or currency exchange rates are not readily available or reliable, investments will be fair valued in good faith by the Committee, in accordance with procedures adopted by the Board. Factors used in determining fair value vary by investment type and may include market or investment specific events, changes in interest rates and credit quality. The frequency with which these procedures are used cannot be predicted and they may be utilized to a significant extent. The Committee oversees the Fund's valuation policies and procedures and reports to the Board on the Committee's activities and fair value determinations. The Board monitors the appropriateness of the procedures used in valuing the Fund's investments and ratifies the fair value determinations of the Committee.
The Fund categorizes the inputs to valuation techniques used to value its investments into a disclosure hierarchy consisting of three levels as shown below:
- Level 1 – quoted prices in active markets for identical investments
- Level 2 – other significant observable inputs (including quoted prices for similar investments, interest rates, prepayment speeds, etc.)
- Level 3 – unobservable inputs (including the Fund's own assumptions based on the best information available)
Valuation techniques used to value the Fund's investments by major category are as follows:
Equity securities, including restricted securities, for which market quotations are readily available, are valued at the last reported sale price or official closing price as reported by a third party pricing vendor on the primary market or exchange on which they are traded and are categorized as Level 1 in the hierarchy. In the event there were no sales during the day or closing prices are not available, securities are valued at the last quoted bid price or may be valued using the last available price and are generally categorized as Level 2 in the hierarchy. For foreign equity securities, when market or security specific events arise, comparisons to the valuation of American Depositary Receipts (ADRs), futures contracts, Exchange-Traded Funds (ETFs) and certain indexes as well as quoted prices for similar securities may be used and would be categorized as Level 2 in the hierarchy. Utilizing these techniques may result in transfers between Level 1 and Level 2. For equity securities, including restricted securities, where observable inputs are limited, assumptions about market activity and risk are used and these securities may be categorized as Level 3 in the hierarchy.
Debt securities, including restricted securities, are valued based on evaluated prices received from third party pricing vendors or from brokers who make markets in such securities. U.S. government and government agency obligations are valued by pricing vendors who utilize matrix pricing which considers yield or price of bonds of comparable quality, coupon, maturity and type or by broker-supplied prices. When independent prices are unavailable or unreliable, debt securities may be valued utilizing pricing methodologies which consider similar factors that would be used by third party pricing vendors. Debt securities are generally categorized as Level 2 in the hierarchy but may be Level 3 depending on the circumstances.
Futures contracts are valued at the settlement price established each day by the board of trade or exchange on which they are traded and are categorized as Level 1 in the hierarchy. Investments in open-end mutual funds, including the Fidelity Central Funds, are valued at their closing net asset value (NAV) each business day and are categorized as Level 1 in the hierarchy.
Changes in valuation techniques may result in transfers in or out of an assigned level within the disclosure hierarchy. The aggregate value of investments by input level as of April 30, 2016, including information on transfers between Levels 1 and 2, is included at the end of the Fund's Schedule of Investments.
Foreign Currency. The Fund may use foreign currency contracts to facilitate transactions in foreign-denominated securities. Gains and losses from these transactions may arise from changes in the value of the foreign currency or if the counterparties do not perform under the contracts' terms.
Foreign-denominated assets, including investment securities, and liabilities are translated into U.S. dollars at the exchange rates at period end. Purchases and sales of investment securities, income and dividends received and expenses denominated in foreign currencies are translated into U.S. dollars at the exchange rate in effect on the transaction date.
The effects of exchange rate fluctuations on investments are included with the net realized and unrealized gain (loss) on investment securities. Other foreign currency transactions resulting in realized and unrealized gain (loss) are disclosed separately.
Investment Transactions and Income. For financial reporting purposes, the Fund's investment holdings and NAV include trades executed through the end of the last business day of the period. The NAV per share for processing shareholder transactions is calculated as of the close of business of the New York Stock Exchange (NYSE), normally 4:00 p.m. Eastern time and includes trades executed through the end of the prior business day. Gains and losses on securities sold are determined on the basis of identified cost. Dividend income is recorded on the ex-dividend date, except for certain dividends from foreign securities where the ex-dividend date may have passed, which are recorded as soon as the Fund is informed of the ex-dividend date. Non-cash dividends included in dividend income, if any, are recorded at the fair market value of the securities received. Income and capital gain distributions from Fidelity Central Funds, if any, are recorded on the ex-dividend date. Distributions received on securities that represent a return of capital or capital gain are recorded as a reduction of cost of investments and/or as a realized gain. Subsequent to ex-dividend date the Fund determines the components of these distributions, based upon receipt of tax filings or other correspondence relating to the underlying investment. Large, non-recurring dividends recognized by the Fund are presented separately on the Statement of Operations as "Special Dividends" and the impact of these dividends is presented in the Financial Highlights. Interest income is accrued as earned and includes coupon interest and amortization of premium and accretion of discount on debt securities as applicable. Investment income is recorded net of foreign taxes withheld where recovery of such taxes is uncertain.
Class Allocations and Expenses. Investment income, realized and unrealized capital gains and losses, common expenses of the Fund, and certain fund-level expense reductions, if any, are allocated daily on a pro-rata basis to each class based on the relative net assets of each class to the total net assets of the Fund. Each class differs with respect to transfer agent and distribution and service plan fees incurred. Certain expense reductions may also differ by class. For the reporting period, the allocated portion of income and expenses to each class as a percent of its average net assets may vary due to the timing of recording these transactions in relation to fluctuating net assets of the classes. Expenses directly attributable to a fund are charged to that fund. Expenses attributable to more than one fund are allocated among the respective funds on the basis of relative net assets or other appropriate methods. Expense estimates are accrued in the period to which they relate and adjustments are made when actual amounts are known.
Deferred Trustee Compensation. Under a Deferred Compensation Plan (the Plan), independent Trustees may elect to defer receipt of a portion of their annual compensation. Deferred amounts are invested in a cross-section of Fidelity funds, are marked-to-market and remain in the Fund until distributed in accordance with the Plan. The investment of deferred amounts and the offsetting payable to the Trustees are included in the accompanying Statement of Assets and Liabilities.
Income Tax Information and Distributions to Shareholders. Each year, the Fund intends to qualify as a regulated investment company under Subchapter M of the Internal Revenue Code, including distributing substantially all of its taxable income and realized gains. As a result, no provision for U.S. Federal income taxes is required. The Fund files a U.S. federal tax return, in addition to state and local tax returns as required. The Fund's federal income tax returns are subject to examination by the Internal Revenue Service (IRS) for a period of three fiscal years after they are filed. State and local tax returns may be subject to examination for an additional fiscal year depending on the jurisdiction. Foreign taxes are provided for based on the Fund's understanding of the tax rules and rates that exist in the foreign markets in which it invests.
Distributions are declared and recorded on the ex-dividend date. Income dividends and capital gain distributions are declared separately for each class. Income and capital gain distributions are determined in accordance with income tax regulations, which may differ from GAAP.
Capital accounts within the financial statements are adjusted for permanent book-tax differences. These adjustments have no impact on net assets or the results of operations. Capital accounts are not adjusted for temporary book-tax differences which will reverse in a subsequent period.
Book-tax differences are primarily due to futures contracts, foreign currency transactions, passive foreign investment companies (PFIC), market discount, certain foreign taxes, redemptions in-kind, deferred trustees compensation, capital loss carryforwards and losses deferred due to wash sales.
The federal tax cost of investment securities and unrealized appreciation (depreciation) as of period end were as follows:
| Gross unrealized appreciation | $1,550,136 |
| Gross unrealized depreciation | (447,894) |
| Net unrealized appreciation (depreciation) on securities | $1,102,242 |
| Tax cost | $9,240,764 |
Capital loss carryforwards are only available to offset future capital gains of the Fund to the extent provided by regulations and may be limited. Under the Regulated Investment Company Modernization Act of 2010 (the Act), the Fund is permitted to carry forward capital losses incurred in taxable years beginning after December 22, 2010 for an unlimited period and such capital losses are required to be used prior to any losses that expire. The capital loss carryforward information presented below, including any applicable limitation, is estimated as of prior fiscal period end and is subject to adjustment.
| Fiscal year of expiration | |
| 2017 | $(49,248) |
Short-Term Trading (Redemption) Fees. Shares held by investors in the Fund less than 30 days may have been subject to a redemption fee equal to 1.00% of the NAV of shares redeemed. All redemption fees, which reduce the proceeds of the shareholder redemption, are retained by the Fund and accounted for as an addition to paid in capital.
Restricted Securities. The Fund may invest in securities that are subject to legal or contractual restrictions on resale. These securities generally may be resold in transactions exempt from registration or to the public if the securities are registered. Disposal of these securities may involve time-consuming negotiations and expense, and prompt sale at an acceptable price may be difficult. Information regarding restricted securities is included at the end of the Fund's Schedule of Investments.
4. Derivative Instruments.
Risk Exposures and the Use of Derivative Instruments. The Fund's investment objective allows the Fund to enter into various types of derivative contracts, including futures contracts. Derivatives are investments whose value is primarily derived from underlying assets, indices or reference rates and may be transacted on an exchange or over-the-counter (OTC). Derivatives may involve a future commitment to buy or sell a specified asset based on specified terms, to exchange future cash flows at periodic intervals based on a notional principal amount, or for one party to make one or more payments upon the occurrence of specified events in exchange for periodic payments from the other party.
The Fund used derivatives to increase returns and to manage exposure to certain risks as defined below. The success of any strategy involving derivatives depends on analysis of numerous economic factors, and if the strategies for investment do not work as intended, the Fund may not achieve its objectives.
The Fund's use of derivatives increased or decreased its exposure to the following risk:
| Equity Risk | Equity risk relates to the fluctuations in the value of financial instruments as a result of changes in market prices (other than those arising from interest rate risk or foreign exchange risk), whether caused by factors specific to an individual investment, its issuer, or all factors affecting all instruments traded in a market or market segment. |
The Fund is also exposed to additional risks from investing in derivatives, such as liquidity risk and counterparty credit risk. Liquidity risk is the risk that the Fund will be unable to close out the derivative in the open market in a timely manner. Counterparty credit risk is the risk that the counterparty will not be able to fulfill its obligation to the Fund. Counterparty credit risk related to exchange-traded futures contracts may be mitigated by the protection provided by the exchange on which they trade.
Investing in derivatives may involve greater risks than investing in the underlying assets directly and, to varying degrees, may involve risk of loss in excess of any initial investment and collateral received and amounts recognized in the Statement of Assets and Liabilities. In addition, there may be the risk that the change in value of the derivative contract does not correspond to the change in value of the underlying instrument.
Futures Contracts. A futures contract is an agreement between two parties to buy or sell a specified underlying instrument for a fixed price at a specified future date. The Fund used futures contracts to manage its exposure to the stock market.
Upon entering into a futures contract, a fund is required to deposit either cash or securities (initial margin) with a clearing broker in an amount equal to a certain percentage of the face value of the contract. Futures contracts are marked-to-market daily and subsequent daily payments (variation margin) are made or received by a fund depending on the daily fluctuations in the value of the futures contracts and are recorded as unrealized appreciation or (depreciation). This receivable and/or payable, if any, is included in daily variation margin for derivative instruments in the Statement of Assets and Liabilities. Realized gain or (loss) is recorded upon the expiration or closing of a futures contract.
Any open futures contracts at period end are presented in the Schedule of Investments under the caption "Futures Contracts". The underlying face amount at value reflects each contract's exposure to the underlying instrument or index at period end and is representative of volume of activity during the period. Securities deposited to meet initial margin requirements are identified in the Schedule of Investments.
During the period the Fund recognized net realized gain (loss) of $(10,549) and a change in net unrealized appreciation (depreciation) of $(20,801) related to its investment in futures contracts. These amounts are included in the Statement of Operations.
5. Purchases and Sales of Investments.
Purchases and sales of securities, other than short-term securities and in-kind transactions, aggregated $2,445,746 and $2,483,783, respectively.
Redemptions In-Kind. During the period, 1,487 shares of the Fund held by an unaffiliated entity were redeemed in-kind for cash and investments with a value of $55,670. The net realized gain of $10,064 on investments delivered through the in-kind redemption is included in the accompanying Statement of Operations. The amount of in-kind redemptions is included in share transactions in the accompanying Statement of Changes in Net Assets as well as Note 11: Share Transactions. The Fund recognized no gain or loss for federal income tax purposes.
6. Fees and Other Transactions with Affiliates.
Management Fee. Fidelity Management & Research Company (the investment adviser) and its affiliates provide the Fund with investment management related services for which the Fund pays a monthly management fee. The management fee is the sum of an individual fund fee rate that is based on an annual rate of .424% of the Fund's average net assets and an annualized group fee rate that averaged .25% during the period. The group fee rate is based upon the average net assets of all the mutual funds advised by the investment adviser, including any mutual funds previously advised by the investment adviser that are currently advised by Fidelity SelectCo, LLC, an affiliate of the investment adviser. The group fee rate decreases as assets under management increase and increases as assets under management decrease. In addition, the management fee is subject to a performance adjustment (up to a maximum of +/- .20% of the Fund's average net assets over a 36 month performance period). The upward or downward adjustment to the management fee is based on the relative investment performance of International Discovery as compared to its benchmark index, the MSCI EAFE Index, over the same 36 month performance period. For the reporting period, the total annualized management fee rate, including the performance adjustment, was .81% of the Fund's average net assets. The performance adjustment included in the management fee rate may be higher or lower than the maximum performance adjustment rate due to the difference between the average net assets for the reporting and performance periods.
Distribution and Service Plan Fees. In accordance with Rule 12b-1 of the 1940 Act, the Fund has adopted separate Distribution and Service Plans for each class of shares. Certain classes pay Fidelity Distributors Corporation (FDC), an affiliate of the investment adviser, separate Distribution and Service Fees, each of which is based on an annual percentage of each class' average net assets. In addition, FDC may pay financial intermediaries for selling shares of the Fund and providing shareholder support services. For the period, the Distribution and Service Fee rates, total fees and amounts retained by FDC were as follows:
| Distribution Fee | Service Fee | Total Fees | Retained by FDC | |
| Class A | -% | .25% | $331 | $– |
| Class T | .25% | .25% | 99 | – |
| Class B | .75% | .25% | 9 | 7 |
| Class C | .75% | .25% | 161 | 15 |
| $600 | $22 |
Sales Load. FDC may receive a front-end sales charge of up to 5.75% for selling Class A shares and 3.50% for selling Class T shares, some of which is paid to financial intermediaries for selling shares of the Fund. Depending on the holding period, FDC may receive contingent deferred sales charges levied on Class A, Class T, Class B, and Class C redemptions. The deferred sales charges range from 5.00% to 1.00% for Class B shares, 1.00% for Class C shares, 1.00% for certain purchases of Class A shares and .25% for certain purchases of Class T shares.
For the period, sales charge amounts retained by FDC were as follows:
| Retained by FDC | |
| Class A | $32 |
| Class T | 3 |
| Class B(a) | –(b) |
| Class C(a) | 1 |
| $36 |
(a) When Class B and Class C shares are initially sold, FDC pays commissions from its own resources to financial intermediaries through which the sales are made.
(b) In the amount of less than five hundred dollars.
Transfer Agent Fees. Fidelity Investments Institutional Operations Company, Inc., (FIIOC), an affiliate of the investment adviser, is the transfer, dividend disbursing and shareholder servicing agent for each class of the Fund. FIIOC receives account fees and asset-based fees that vary according to the account size and type of account of the shareholders of the respective classes of the Fund, except for Class K and Class Z. FIIOC receives an asset-based fee of Class K's and Class Z's average net assets. FIIOC pays for typesetting, printing and mailing of shareholder reports, except proxy statements.
For the period, transfer agent fees for each class were as follows:
| Amount | % of Class-Level Average Net Assets(a) | |
| Class A | $369 | .28 |
| Class T | 53 | .27 |
| Class B | 3 | .30 |
| Class C | 45 | .28 |
| International Discovery | 6,165 | .18 |
| Class K | 508 | .05 |
| Class I | 851 | .19 |
| Class Z | 7 | .05 |
| $8,001 |
(a) Annualized
Accounting and Security Lending Fees. Fidelity Service Company, Inc. (FSC), an affiliate of the investment adviser, maintains the Fund's accounting records. The accounting fee is based on the level of average net assets for each month. Under a separate contract, FSC administers the security lending program. The security lending fee is based on the number and duration of lending transactions.
Brokerage Commissions. The Fund placed a portion of its portfolio transactions with brokerage firms which are affiliates of the investment adviser. Brokerage commissions are included in net realized gain (loss) and change in net unrealized appreciation (depreciation) in the Statement of Operations. The commissions paid to these affiliated firms were $6 for the period.
Interfund Trades. The Fund may purchase from or sell securities to other Fidelity Funds under procedures adopted by the Board. The procedures have been designed to ensure these interfund trades are executed in accordance with Rule 17a-7 of the 1940 Act. Interfund trades are included within the respective purchases and sales amounts shown in the Purchases and Sales of Investments note.
7. Committed Line of Credit.
The Fund participates with other funds managed by the investment adviser or an affiliate in a $4.25 billion credit facility (the "line of credit") to be utilized for temporary or emergency purposes to fund shareholder redemptions or for other short-term liquidity purposes. The Fund has agreed to pay commitment fees on its pro-rata portion of the line of credit, which amounted to $9 and is reflected in Miscellaneous expenses on the Statement of Operations. During the period, the Fund did not borrow on this line of credit.
8. Security Lending.
The Fund lends portfolio securities through a lending agent from time to time in order to earn additional income. For equity securities, a lending agent is used and may loan securities to certain qualified borrowers, including Fidelity Capital Markets (FCM), a broker-dealer affiliated with the Fund. On the settlement date of the loan, the Fund receives collateral (in the form of U.S. Treasury obligations, letters of credit and/or cash) against the loaned securities and maintains collateral in an amount not less than 100% of the market value of the loaned securities during the period of the loan. The market value of the loaned securities is determined at the close of business of the Fund and any additional required collateral is delivered to the Fund on the next business day. The Fund or borrower may terminate the loan at any time, and if the borrower defaults on its obligation to return the securities loaned because of insolvency or other reasons, the Fund may apply collateral received from the borrower against the obligation. The Fund may experience delays and costs in recovering the securities loaned. Any cash collateral received is invested in the Fidelity Securities Lending Cash Central Fund. The value of loaned securities and cash collateral at period end are disclosed on the Fund's Statement of Assets and Liabilities. The value of securities loaned to FCM at period end was $75. Security lending income represents the income earned on investing cash collateral, less rebates paid to borrowers and any lending agent fees associated with the loan, plus any premium payments received for lending certain types of securities. Security lending income is presented in the Statement of Operations as a component of income from Fidelity Central Funds. Total security lending income during the period amounted to $2,593, including $5 from securities loaned to FCM.
9. Expense Reductions.
Commissions paid to certain brokers with whom the investment adviser, or its affiliates, places trades on behalf of the Fund include an amount in addition to trade execution, which may be rebated back to the Fund to offset certain expenses. This amount totaled $74 for the period.
In addition, during the period the investment adviser reimbursed and/or waived a portion of fund-level operating expenses in the amount of $39.
10. Distributions to Shareholders.
Distributions to shareholders of each class were as follows:
| Six months ended April 30, 2016 | Year ended October 31, 2015 | |
| From net investment income | ||
| Class A | $1,912 | $864 |
| Class T | 184 | 23 |
| International Discovery | 73,519 | 49,040 |
| Class K | 26,239 | 19,835 |
| Class I | 11,205 | 4,544 |
| Class Z | 375 | 283 |
| Total | $113,434 | $74,589 |
| From net realized gain | ||
| Class A | $36 | $– |
| Class T | 5 | – |
| International Discovery | 899 | – |
| Class K | 284 | – |
| Class I | 134 | – |
| Class Z | 4 | – |
| Total | $1,362 | $– |
11. Share Transactions.
Share transactions for each class were as follows and may contain automatic conversions between classes or exchanges between affiliated funds:
| Shares | Shares | Dollars | Dollars | |
| Six months ended April 30, 2016 | Year ended October 31, 2015 | Six months ended April 30, 2016 | Year ended October 31, 2015 | |
| Class A | ||||
| Shares sold | 543 | 1,331 | $20,433 | $53,289 |
| Reinvestment of distributions | 48 | 22 | 1,922 | 843 |
| Shares redeemed | (784) | (1,915) | (29,432) | (76,178) |
| Net increase (decrease) | (193) | (562) | $(7,077) | $(22,046) |
| Class T | ||||
| Shares sold | 76 | 178 | $2,881 | $7,105 |
| Reinvestment of distributions | 5 | 1 | 183 | 23 |
| Shares redeemed | (140) | (355) | (5,252) | (13,954) |
| Net increase (decrease) | (59) | (176) | $(2,188) | $(6,826) |
| Class B | ||||
| Shares sold | – | 1 | $15 | $53 |
| Shares redeemed | (20) | (64) | (758) | (2,536) |
| Net increase (decrease) | (20) | (63) | $(743) | $(2,483) |
| Class C | ||||
| Shares sold | 159 | 201 | $5,952 | $7,918 |
| Shares redeemed | (92) | (314) | (3,380) | (12,486) |
| Net increase (decrease) | 67 | (113) | $2,572 | $(4,568) |
| International Discovery | ||||
| Shares sold | 9,886 | 20,827 | $372,799 | $832,233 |
| Reinvestment of distributions | 1,781 | 1,199 | 70,961 | 46,913 |
| Shares redeemed | (12,452) | (33,573) | (467,188) | (1,345,593) |
| Net increase (decrease) | (785) | (11,547) | $(23,428) | $(466,447) |
| Class K | ||||
| Shares sold | 7,943 | 15,372 | $296,942 | $613,737 |
| Reinvestment of distributions | 667 | 508 | 26,523 | 19,835 |
| Shares redeemed | (9,474)(a) | (21,494)(b) | (358,588)(a) | (860,632)(b) |
| Net increase (decrease) | (864) | (5,614) | $(35,123) | $(227,060) |
| Class I | ||||
| Shares sold | 6,739 | 15,392 | $253,947 | $602,134 |
| Reinvestment of distributions | 52 | 33 | 2,069 | 1,286 |
| Shares redeemed | (12,681) | (5,606) | (454,709) | (221,504) |
| Net increase (decrease) | (5,890) | 9,819 | $(198,693) | $381,916 |
| Class Z | ||||
| Shares sold | 202 | 402 | $7,794 | $16,312 |
| Reinvestment of distributions | 10 | 7 | 379 | 283 |
| Shares redeemed | (144) | (559) | (5,499) | (22,228) |
| Net increase (decrease) | 68 | (150) | $2,674 | $(5,633) |
(a) Amount includes in-kind redemptions (see Note 5: Redemptions In-Kind).
(b) Amount includes in-kind redemptions.
12. Other.
The Fund's organizational documents provide former and current trustees and officers with a limited indemnification against liabilities arising in connection with the performance of their duties to the Fund. In the normal course of business, the Fund may also enter into contracts that provide general indemnifications. The Fund's maximum exposure under these arrangements is unknown as this would be dependent on future claims that may be made against the Fund. The risk of material loss from such claims is considered remote.
At the end of the period, Strategic Advisers International Fund was the owner of record of approximately 13% of the total outstanding shares of the Fund. Mutual funds managed by the investment adviser or its affiliates were the owners of record, in the aggregate, of approximately 20% of the total outstanding shares of the Fund.
Shareholder Expense Example
As a shareholder of the Fund, you incur two types of costs: (1) transaction costs, including sales charges (loads) on purchase payments or redemption proceeds, redemption fees and (2) ongoing costs, including management fees, distribution and/or service (12b-1) fees and other Fund expenses. This Example is intended to help you understand your ongoing costs (in dollars) of investing in the Fund and to compare these costs with the ongoing costs of investing in other mutual funds.
The Example is based on an investment of $1,000 invested at the beginning of the period and held for the entire period (November 1, 2015 to April 30, 2016).
Actual Expenses
The first line of the accompanying table for each class of the Fund provides information about actual account values and actual expenses. You may use the information in this line, together with the amount you invested, to estimate the expenses that you paid over the period. Simply divide your account value by $1,000.00 (for example, an $8,600 account value divided by $1,000.00 = 8.6), then multiply the result by the number in the first line for a class of the Fund under the heading entitled "Expenses Paid During Period" to estimate the expenses you paid on your account during this period. A small balance maintenance fee of $12.00 that is charged once a year may apply for certain accounts with a value of less than $2,000. This fee is not included in the table below. If it was, the estimate of expenses you paid during the period would be higher, and your ending account value lower, by this amount. In addition, the Fund, as a shareholder in the underlying Fidelity Central Funds, will indirectly bear its pro-rata share of the fees and expenses incurred by the underlying Fidelity Central Funds. These fees and expenses are not included in the Fund's annualized expense ratio used to calculate the expense estimate in the table below.
Hypothetical Example for Comparison Purposes
The second line of the accompanying table for each class of the Fund provides information about hypothetical account values and hypothetical expenses based on a Class' actual expense ratio and an assumed rate of return of 5% per year before expenses, which is not the Class' actual return. The hypothetical account values and expenses may not be used to estimate the actual ending account balance or expenses you paid for the period. You may use this information to compare the ongoing costs of investing in the Fund and other funds. To do so, compare this 5% hypothetical example with the 5% hypothetical examples that appear in the shareholder reports of the other funds. A small balance maintenance fee of $12.00 that is charged once a year may apply for certain accounts with a value of less than $2,000. This fee is not included in the table below. If it was, the estimate of expenses you paid during the period would be higher, and your ending account value lower, by this amount. In addition, the Fund, as a shareholder in the underlying Fidelity Central Funds, will indirectly bear its pro-rata share of the fees and expenses incurred by the underlying Fidelity Central Funds. These fees and expenses are not included in the Fund's annualized expense ratio used to calculate the expense estimate in the table below.
Please note that the expenses shown in the table are meant to highlight your ongoing costs only and do not reflect any transaction costs. Therefore, the second line of the table is useful in comparing ongoing costs only, and will not help you determine the relative total costs of owning different funds. In addition, if these transactional costs were included, your costs would have been higher.
| Annualized Expense Ratio-A | Beginning Account Value November 1, 2015 | Ending Account Value April 30, 2016 | Expenses Paid During Period-B November 1, 2015 to April 30, 2016 | |
| Class A | 1.37% | |||
| Actual | $1,000.00 | $955.30 | $6.66 | |
| Hypothetical-C | $1,000.00 | $1,018.05 | $6.87 | |
| Class T | 1.61% | |||
| Actual | $1,000.00 | $954.10 | $7.82 | |
| Hypothetical-C | $1,000.00 | $1,016.86 | $8.07 | |
| Class B | 2.14% | |||
| Actual | $1,000.00 | $951.50 | $10.38 | |
| Hypothetical-C | $1,000.00 | $1,014.22 | $10.72 | |
| Class C | 2.12% | |||
| Actual | $1,000.00 | $951.70 | $10.29 | |
| Hypothetical-C | $1,000.00 | $1,014.32 | $10.62 | |
| International Discovery | 1.02% | |||
| Actual | $1,000.00 | $956.70 | $4.96 | |
| Hypothetical-C | $1,000.00 | $1,019.79 | $5.12 | |
| Class K | .89% | |||
| Actual | $1,000.00 | $957.50 | $4.33 | |
| Hypothetical-C | $1,000.00 | $1,020.44 | $4.47 | |
| Class I | 1.03% | |||
| Actual | $1,000.00 | $956.90 | $5.01 | |
| Hypothetical-C | $1,000.00 | $1,019.74 | $5.17 | |
| Class Z | .89% | |||
| Actual | $1,000.00 | $957.60 | $4.33 | |
| Hypothetical-C | $1,000.00 | $1,020.44 | $4.47 |
A Annualized expense ratio reflects expenses net of applicable fee waivers.
B Expenses are equal to each Class' annualized expense ratio, multiplied by the average account value over the period, multiplied by 182/366 (to reflect the one-half year period).
C 5% return per year before expenses
![]()
Corporate Headquarters
245 Summer St.
Boston, MA 02210
www.fidelity.com
IGI-K-SANN-0616
1.863311.107
Fidelity Advisor® International Growth Fund - Semi-Annual Report April 30, 2016 Class A, Class T, Class B and Class C are classes of Fidelity® International Growth Fund |
|
Contents
To view a fund's proxy voting guidelines and proxy voting record for the 12-month period ended June 30, visit http://www.fidelity.com/proxyvotingresults or visit the Securities and Exchange Commission's (SEC) web site at http://www.sec.gov.
You may also call 1-877-208-0098 to request a free copy of the proxy voting guidelines.
Standard & Poor's, S&P and S&P 500 are registered service marks of The McGraw-Hill Companies, Inc. and have been licensed for use by Fidelity Distributors Corporation.
Other third-party marks appearing herein are the property of their respective owners.
All other marks appearing herein are registered or unregistered trademarks or service marks of FMR LLC or an affiliated company. © 2016 FMR LLC. All rights reserved.
This report and the financial statements contained herein are submitted for the general information of the shareholders of the Fund. This report is not authorized for distribution to prospective investors in the Fund unless preceded or accompanied by an effective prospectus.
A fund files its complete schedule of portfolio holdings with the SEC for the first and third quarters of each fiscal year on Form N-Q. Forms N-Q are available on the SEC’s web site at http://www.sec.gov. A fund's Forms N-Q may be reviewed and copied at the SEC’s Public Reference Room in Washington, DC. Information regarding the operation of the SEC's Public Reference Room may be obtained by calling 1-800-SEC-0330.
For a complete list of a fund's portfolio holdings, view the most recent holdings listing, semiannual report, or annual report on Fidelity's web site at http://www.fidelity.com, http://www.advisor.fidelity.com, or http://www.401k.com, as applicable.
NOT FDIC INSURED •MAY LOSE VALUE •NO BANK GUARANTEE
Neither the Fund nor Fidelity Distributors Corporation is a bank.
Investment Summary (Unaudited)
Geographic Diversification (% of fund's net assets)
| As of April 30, 2016 | ||
| United States of America* | 20.8% | |
| Japan | 14.1% | |
| United Kingdom | 13.2% | |
| Switzerland | 12.7% | |
| Spain | 4.9% | |
| Belgium | 4.5% | |
| Sweden | 4.4% | |
| Australia | 4.0% | |
| Denmark | 3.3% | |
| Other | 18.1% | |

* Includes Short-Term investments and Net Other Assets (Liabilities).
Percentages are based on country or territory of incorporation and are adjusted for the effect of futures contracts, if applicable.
| As of October 31, 2015 | ||
| United States of America* | 17.7% | |
| United Kingdom | 14.4% | |
| Japan | 14.0% | |
| Switzerland | 13.6% | |
| Sweden | 6.1% | |
| Spain | 4.5% | |
| Belgium | 4.2% | |
| Australia | 3.4% | |
| Denmark | 3.3% | |
| Other | 18.8% | |

* Includes Short-Term investments and Net Other Assets (Liabilities).
Percentages are based on country or territory of incorporation and are adjusted for the effect of futures contracts, if applicable.
Asset Allocation as of April 30, 2016
| % of fund's net assets | % of fund's net assets 6 months ago | |
| Stocks | 97.3 | 97.7 |
| Short-Term Investments and Net Other Assets (Liabilities) | 2.7 | 2.3 |
Top Ten Stocks as of April 30, 2016
| % of fund's net assets | % of fund's net assets 6 months ago | |
| Nestle SA (Switzerland, Food Products) | 4.9 | 3.0 |
| Roche Holding AG (participation certificate) (Switzerland, Pharmaceuticals) | 3.5 | 3.6 |
| Anheuser-Busch InBev SA NV (Belgium, Beverages) | 3.5 | 2.6 |
| Reckitt Benckiser Group PLC (United Kingdom, Household Products) | 3.2 | 2.8 |
| CSL Ltd. (Australia, Biotechnology) | 2.9 | 2.2 |
| Novartis AG (Switzerland, Pharmaceuticals) | 2.9 | 3.7 |
| Novo Nordisk A/S Series B sponsored ADR (Denmark, Pharmaceuticals) | 2.8 | 2.5 |
| Inditex SA (Spain, Specialty Retail) | 2.6 | 2.8 |
| ASSA ABLOY AB (B Shares) (Sweden, Building Products) | 2.6 | 2.2 |
| InterContinental Hotel Group PLC ADR (United Kingdom, Hotels, Restaurants & Leisure) | 2.3 | 2.0 |
| 31.2 |
Market Sectors as of April 30, 2016
| % of fund's net assets | % of fund's net assets 6 months ago | |
| Consumer Staples | 20.4 | 15.3 |
| Health Care | 19.0 | 18.5 |
| Information Technology | 14.2 | 11.7 |
| Financials | 13.5 | 18.1 |
| Consumer Discretionary | 13.3 | 15.1 |
| Industrials | 11.5 | 12.5 |
| Materials | 4.7 | 6.0 |
| Energy | 0.4 | 0.3 |
| Telecommunication Services | 0.3 | 0.2 |
Investments April 30, 2016 (Unaudited)
Showing Percentage of Net Assets
| Common Stocks - 97.3% | |||
| Shares | Value | ||
| Australia - 4.0% | |||
| CSL Ltd. | 609,912 | $48,776,866 | |
| Sydney Airport unit | 1,123,380 | 5,816,843 | |
| Transurban Group unit | 1,422,746 | 12,527,069 | |
| TOTAL AUSTRALIA | 67,120,778 | ||
| Austria - 1.2% | |||
| Andritz AG | 351,321 | 19,675,520 | |
| Belgium - 4.5% | |||
| Anheuser-Busch InBev SA NV | 469,291 | 58,088,795 | |
| KBC Groep NV | 302,468 | 16,981,098 | |
| TOTAL BELGIUM | 75,069,893 | ||
| Canada - 0.4% | |||
| Pason Systems, Inc. | 495,200 | 7,198,891 | |
| Cayman Islands - 0.9% | |||
| 58.com, Inc. ADR (a) | 128,870 | 7,042,746 | |
| Alibaba Group Holding Ltd. sponsored ADR (a) | 99,200 | 7,632,448 | |
| TOTAL CAYMAN ISLANDS | 14,675,194 | ||
| Denmark - 3.3% | |||
| Jyske Bank A/S (Reg.) | 202,800 | 8,302,703 | |
| Novo Nordisk A/S Series B sponsored ADR (b) | 826,700 | 46,121,593 | |
| TOTAL DENMARK | 54,424,296 | ||
| Finland - 0.3% | |||
| Tikkurila Oyj | 283,000 | 4,961,192 | |
| France - 1.1% | |||
| Essilor International SA | 135,658 | 17,560,644 | |
| Germany - 3.0% | |||
| Bayer AG | 155,100 | 17,892,923 | |
| SAP AG | 399,516 | 31,346,444 | |
| TOTAL GERMANY | 49,239,367 | ||
| Hong Kong - 1.9% | |||
| AIA Group Ltd. | 5,289,400 | 31,654,975 | |
| India - 0.5% | |||
| Housing Development Finance Corp. Ltd. | 562,904 | 9,223,760 | |
| Ireland - 3.1% | |||
| CRH PLC sponsored ADR | 909,066 | 26,462,911 | |
| James Hardie Industries PLC: | |||
| CDI | 1,130,041 | 15,921,470 | |
| sponsored ADR | 601,500 | 8,433,030 | |
| TOTAL IRELAND | 50,817,411 | ||
| Isle of Man - 0.5% | |||
| Playtech Ltd. | 654,346 | 7,691,806 | |
| Israel - 0.3% | |||
| Azrieli Group | 118,800 | 4,718,361 | |
| Italy - 0.7% | |||
| Azimut Holding SpA | 204,600 | 5,149,414 | |
| Interpump Group SpA | 511,426 | 7,361,097 | |
| TOTAL ITALY | 12,510,511 | ||
| Japan - 14.1% | |||
| Astellas Pharma, Inc. | 2,477,400 | 33,401,778 | |
| Coca-Cola Central Japan Co. Ltd. | 190,700 | 3,493,796 | |
| DENSO Corp. | 727,400 | 27,649,326 | |
| East Japan Railway Co. | 184,100 | 16,196,396 | |
| Hoya Corp. | 336,900 | 12,901,342 | |
| Japan Tobacco, Inc. | 589,000 | 24,065,326 | |
| Keyence Corp. | 40,062 | 24,012,883 | |
| Mitsui Fudosan Co. Ltd. | 836,000 | 20,417,154 | |
| Nintendo Co. Ltd. | 61,000 | 8,259,462 | |
| Olympus Corp. | 281,300 | 10,958,499 | |
| OSG Corp. | 344,800 | 6,407,632 | |
| Seven Bank Ltd. | 2,658,200 | 11,295,245 | |
| Shinsei Bank Ltd. | 5,146,000 | 7,212,512 | |
| SHO-BOND Holdings Co. Ltd. | 182,600 | 7,900,949 | |
| USS Co. Ltd. | 1,301,100 | 20,581,249 | |
| TOTAL JAPAN | 234,753,549 | ||
| Kenya - 0.3% | |||
| Safaricom Ltd. | 30,975,500 | 5,244,367 | |
| Korea (South) - 0.9% | |||
| BGFretail Co. Ltd. | 54,496 | 8,847,410 | |
| NAVER Corp. | 9,215 | 5,445,310 | |
| TOTAL KOREA (SOUTH) | 14,292,720 | ||
| Mexico - 0.6% | |||
| Fomento Economico Mexicano S.A.B. de CV sponsored ADR | 106,355 | 9,913,350 | |
| South Africa - 1.3% | |||
| Clicks Group Ltd. | 755,618 | 5,518,807 | |
| Naspers Ltd. Class N | 112,300 | 15,408,694 | |
| TOTAL SOUTH AFRICA | 20,927,501 | ||
| Spain - 4.9% | |||
| Amadeus IT Holding SA Class A | 514,500 | 23,411,956 | |
| Hispania Activos Inmobiliarios SA (a) | 215,259 | 3,154,974 | |
| Inditex SA | 1,361,301 | 43,699,772 | |
| Merlin Properties Socimi SA | 378,500 | 4,399,024 | |
| Prosegur Compania de Seguridad SA (Reg.) | 1,127,849 | 6,521,790 | |
| TOTAL SPAIN | 81,187,516 | ||
| Sweden - 4.4% | |||
| ASSA ABLOY AB (B Shares) (b) | 2,033,083 | 42,634,121 | |
| Fagerhult AB | 409,153 | 9,527,687 | |
| Intrum Justitia AB (b) | 112,700 | 4,044,623 | |
| Svenska Handelsbanken AB (A Shares) (b) | 1,313,920 | 17,527,894 | |
| TOTAL SWEDEN | 73,734,325 | ||
| Switzerland - 12.7% | |||
| Nestle SA | 1,091,098 | 81,439,212 | |
| Novartis AG | 625,183 | 47,577,841 | |
| Roche Holding AG (participation certificate) | 232,368 | 58,791,248 | |
| Schindler Holding AG: | |||
| (participation certificate) | 107,226 | 19,527,137 | |
| (Reg.) | 18,350 | 3,372,360 | |
| TOTAL SWITZERLAND | 210,707,798 | ||
| Taiwan - 1.1% | |||
| Taiwan Semiconductor Manufacturing Co. Ltd. | 3,934,000 | 18,046,275 | |
| United Kingdom - 13.2% | |||
| Associated British Foods PLC | 413,100 | 18,494,337 | |
| Babcock International Group PLC | 400,384 | 5,543,075 | |
| BAE Systems PLC | 1,722,200 | 12,015,201 | |
| Berendsen PLC | 707,573 | 12,199,669 | |
| Howden Joinery Group PLC | 626,100 | 4,519,241 | |
| Informa PLC | 1,396,912 | 13,358,986 | |
| InterContinental Hotel Group PLC ADR (b) | 968,696 | 38,883,457 | |
| Lloyds Banking Group PLC | 7,613,300 | 7,472,538 | |
| Prudential PLC | 1,155,443 | 22,807,906 | |
| Reckitt Benckiser Group PLC | 542,845 | 52,883,360 | |
| Rightmove PLC | 77,900 | 4,391,314 | |
| SABMiller PLC | 292,366 | 17,877,926 | |
| Shaftesbury PLC | 319,433 | 4,247,330 | |
| Unite Group PLC | 476,676 | 4,405,332 | |
| TOTAL UNITED KINGDOM | 219,099,672 | ||
| United States of America - 18.1% | |||
| Alphabet, Inc. Class A | 29,136 | 20,624,792 | |
| Autoliv, Inc. (b) | 198,769 | 24,343,239 | |
| Berkshire Hathaway, Inc. Class B (a) | 129,184 | 18,793,688 | |
| China Biologic Products, Inc. (a) | 87,966 | 10,292,022 | |
| Domino's Pizza, Inc. | 82,990 | 10,031,831 | |
| Martin Marietta Materials, Inc. | 66,400 | 11,236,872 | |
| MasterCard, Inc. Class A | 351,000 | 34,043,490 | |
| McGraw Hill Financial, Inc. | 117,100 | 12,512,135 | |
| Mohawk Industries, Inc. (a) | 117,400 | 22,614,762 | |
| Molson Coors Brewing Co. Class B | 108,600 | 10,385,418 | |
| Moody's Corp. | 94,100 | 9,007,252 | |
| MSCI, Inc. Class A | 103,200 | 7,837,008 | |
| Philip Morris International, Inc. | 210,708 | 20,674,669 | |
| PriceSmart, Inc. | 95,700 | 8,281,878 | |
| ResMed, Inc. | 170,700 | 9,525,060 | |
| Reynolds American, Inc. | 363,200 | 18,014,720 | |
| Sherwin-Williams Co. | 32,600 | 9,366,306 | |
| SS&C Technologies Holdings, Inc. | 178,400 | 10,909,160 | |
| Visa, Inc. Class A | 424,260 | 32,769,842 | |
| TOTAL UNITED STATES OF AMERICA | 301,264,144 | ||
| TOTAL COMMON STOCKS | |||
| (Cost $1,493,495,241) | 1,615,713,816 | ||
| Money Market Funds - 8.3% | |||
| Fidelity Cash Central Fund, 0.38% (c) | 31,871,334 | 31,871,334 | |
| Fidelity Securities Lending Cash Central Fund, 0.42% (c)(d) | 106,690,874 | 106,690,874 | |
| TOTAL MONEY MARKET FUNDS | |||
| (Cost $138,562,208) | 138,562,208 | ||
| TOTAL INVESTMENT PORTFOLIO - 105.6% | |||
| (Cost $1,632,057,449) | 1,754,276,024 | ||
| NET OTHER ASSETS (LIABILITIES) - (5.6)% | (93,656,005) | ||
| NET ASSETS - 100% | $1,660,620,019 |
Categorizations in the Schedule of Investments are based on country or territory of incorporation.
Legend
(a) Non-income producing
(b) Security or a portion of the security is on loan at period end.
(c) Affiliated fund that is generally available only to investment companies and other accounts managed by Fidelity Investments. The rate quoted is the annualized seven-day yield of the fund at period end. A complete unaudited listing of the fund's holdings as of its most recent quarter end is available upon request. In addition, each Fidelity Central Fund's financial statements are available on the SEC's website or upon request.
(d) Investment made with cash collateral received from securities on loan.
Affiliated Central Funds
Information regarding fiscal year to date income earned by the Fund from investments in Fidelity Central Funds is as follows:
| Fund | Income earned |
| Fidelity Cash Central Fund | $72,393 |
| Fidelity Securities Lending Cash Central Fund | 330,325 |
| Total | $402,718 |
Investment Valuation
The following is a summary of the inputs used, as of April 30, 2016, involving the Fund's assets and liabilities carried at fair value. The inputs or methodology used for valuing securities may not be an indication of the risk associated with investing in those securities. For more information on valuation inputs, and their aggregation into the levels used below, please refer to the Investment Valuation section in the accompanying Notes to Financial Statements.
| Valuation Inputs at Reporting Date: | ||||
| Description | Total | Level 1 | Level 2 | Level 3 |
| Investments in Securities: | ||||
| Equities: | ||||
| Consumer Discretionary | $221,090,557 | $172,859,982 | $48,230,575 | $-- |
| Consumer Staples | 337,979,004 | 176,097,310 | 161,881,694 | -- |
| Energy | 7,198,891 | 7,198,891 | -- | -- |
| Financials | 227,120,303 | 108,732,079 | 118,388,224 | -- |
| Health Care | 313,799,816 | 150,169,108 | 163,630,708 | -- |
| Industrials | 191,271,169 | 148,750,991 | 42,520,178 | -- |
| Information Technology | 235,627,928 | 153,962,864 | 81,665,064 | -- |
| Materials | 76,381,781 | 76,381,781 | -- | -- |
| Telecommunication Services | 5,244,367 | 5,244,367 | -- | -- |
| Money Market Funds | 138,562,208 | 138,562,208 | -- | -- |
| Total Investments in Securities: | $1,754,276,024 | $1,137,959,581 | $616,316,443 | $-- |
The following is a summary of transfers between Level 1 and Level 2 for the period ended April 30, 2016. Transfers are assumed to have occurred at the beginning of the period, and are primarily attributable to the valuation techniques used for foreign equity securities, as discussed in the accompanying Notes to Financial Statements:
| Transfers | Total |
| Level 1 to Level 2 | $0 |
| Level 2 to Level 1 | $144,428,405 |
See accompanying notes which are an integral part of the financial statements.
Financial Statements
Statement of Assets and Liabilities
| April 30, 2016 (Unaudited) | ||
| Assets | ||
| Investment in securities, at value (including securities loaned of $103,770,133) — See accompanying schedule: Unaffiliated issuers (cost $1,493,495,241) | $1,615,713,816 | |
| Fidelity Central Funds (cost $138,562,208) | 138,562,208 | |
| Total Investments (cost $1,632,057,449) | $1,754,276,024 | |
| Foreign currency held at value (cost $11,880) | 11,898 | |
| Receivable for investments sold | 3,654,551 | |
| Receivable for fund shares sold | 4,651,062 | |
| Dividends receivable | 9,823,503 | |
| Distributions receivable from Fidelity Central Funds | 94,556 | |
| Prepaid expenses | 599 | |
| Other receivables | 7,870 | |
| Total assets | 1,772,520,063 | |
| Liabilities | ||
| Payable for investments purchased | $1,891,035 | |
| Payable for fund shares redeemed | 1,836,507 | |
| Accrued management fee | 985,763 | |
| Distribution and service plan fees payable | 103,976 | |
| Other affiliated payables | 304,114 | |
| Other payables and accrued expenses | 87,775 | |
| Collateral on securities loaned, at value | 106,690,874 | |
| Total liabilities | 111,900,044 | |
| Net Assets | $1,660,620,019 | |
| Net Assets consist of: | ||
| Paid in capital | $1,599,467,631 | |
| Undistributed net investment income | 11,086,000 | |
| Accumulated undistributed net realized gain (loss) on investments and foreign currency transactions | (72,316,667) | |
| Net unrealized appreciation (depreciation) on investments and assets and liabilities in foreign currencies | 122,383,055 | |
| Net Assets | $1,660,620,019 | |
| Calculation of Maximum Offering Price | ||
| Class A: | ||
| Net Asset Value and redemption price per share ($227,299,900 ÷ 20,745,349 shares) | $10.96 | |
| Maximum offering price per share (100/94.25 of $10.96) | $11.63 | |
| Class T: | ||
| Net Asset Value and redemption price per share ($28,247,384 ÷ 2,581,799 shares) | $10.94 | |
| Maximum offering price per share (100/96.50 of $10.94) | $11.34 | |
| Class B: | ||
| Net Asset Value and offering price per share ($543,488 ÷ 50,206 shares)(a) | $10.83 | |
| Class C: | ||
| Net Asset Value and offering price per share ($54,803,250 ÷ 5,077,799 shares)(a) | $10.79 | |
| International Growth: | ||
| Net Asset Value, offering price and redemption price per share ($989,531,658 ÷ 89,694,739 shares) | $11.03 | |
| Class I: | ||
| Net Asset Value, offering price and redemption price per share ($344,685,048 ÷ 31,300,215 shares) | $11.01 | |
| Class Z: | ||
| Net Asset Value, offering price and redemption price per share ($15,509,291 ÷ 1,406,850 shares) | $11.02 |
(a) Redemption price per share is equal to net asset value less any applicable contingent deferred sales charge.
See accompanying notes which are an integral part of the financial statements.
Statement of Operations
| Six months ended April 30, 2016 (Unaudited) | ||
| Investment Income | ||
| Dividends | $21,128,805 | |
| Income from Fidelity Central Funds | 402,718 | |
| Income before foreign taxes withheld | 21,531,523 | |
| Less foreign taxes withheld | (2,212,929) | |
| Total income | 19,318,594 | |
| Expenses | ||
| Management fee | ||
| Basic fee | $5,303,523 | |
| Performance adjustment | 109,270 | |
| Transfer agent fees | 1,418,766 | |
| Distribution and service plan fees | 585,143 | |
| Accounting and security lending fees | 345,576 | |
| Custodian fees and expenses | 79,671 | |
| Independent trustees' compensation | 3,216 | |
| Registration fees | 88,683 | |
| Audit | 42,540 | |
| Legal | 2,186 | |
| Miscellaneous | 4,732 | |
| Total expenses before reductions | 7,983,306 | |
| Expense reductions | (16,973) | 7,966,333 |
| Net investment income (loss) | 11,352,261 | |
| Realized and Unrealized Gain (Loss) | ||
| Net realized gain (loss) on: | ||
| Investment securities: | ||
| Unaffiliated issuers | (34,889,540) | |
| Foreign currency transactions | 296,655 | |
| Total net realized gain (loss) | (34,592,885) | |
| Change in net unrealized appreciation (depreciation) on: Investment securities (net of decrease in deferred foreign taxes of $4,737) | (7,895,661) | |
| Assets and liabilities in foreign currencies | 94,033 | |
| Total change in net unrealized appreciation (depreciation) | (7,801,628) | |
| Net gain (loss) | (42,394,513) | |
| Net increase (decrease) in net assets resulting from operations | $(31,042,252) |
See accompanying notes which are an integral part of the financial statements.
Statement of Changes in Net Assets
| Six months ended April 30, 2016 (Unaudited) | Year ended October 31, 2015 | |
| Increase (Decrease) in Net Assets | ||
| Operations | ||
| Net investment income (loss) | $11,352,261 | $10,205,219 |
| Net realized gain (loss) | (34,592,885) | (27,463,177) |
| Change in net unrealized appreciation (depreciation) | (7,801,628) | 41,450,250 |
| Net increase (decrease) in net assets resulting from operations | (31,042,252) | 24,192,292 |
| Distributions to shareholders from net investment income | (9,313,522) | (7,019,924) |
| Distributions to shareholders from net realized gain | (1,062,119) | – |
| Total distributions | (10,375,641) | (7,019,924) |
| Share transactions - net increase (decrease) | 228,113,558 | 519,861,476 |
| Redemption fees | 45,309 | 54,094 |
| Total increase (decrease) in net assets | 186,740,974 | 537,087,938 |
| Net Assets | ||
| Beginning of period | 1,473,879,045 | 936,791,107 |
| End of period (including undistributed net investment income of $11,086,000 and undistributed net investment income of $9,047,261, respectively) | $1,660,620,019 | $1,473,879,045 |
See accompanying notes which are an integral part of the financial statements.
Financial Highlights — Fidelity International Growth Fund Class A
| Six months ended (Unaudited) April 30, | Years ended October 31, | |||||
| 2016 | 2015 | 2014 | 2013 | 2012 | 2011 | |
| Selected Per–Share Data | ||||||
| Net asset value, beginning of period | $11.30 | $11.01 | $10.78 | $8.91 | $8.09 | $8.38 |
| Income from Investment Operations | ||||||
| Net investment income (loss)A | .07 | .07 | .09 | .08 | .08 | .08 |
| Net realized and unrealized gain (loss) | (.35) | .28 | .18 | 1.88 | .81 | (.31) |
| Total from investment operations | (.28) | .35 | .27 | 1.96 | .89 | (.23) |
| Distributions from net investment income | (.05) | (.06) | (.03) | (.08) | (.06) | (.05) |
| Distributions from net realized gain | (.01) | – | (.01) | (.01) | (.01) | (.01) |
| Total distributions | (.06) | (.06) | (.04) | (.09) | (.07) | (.06) |
| Redemption fees added to paid in capitalA,B | – | – | – | – | – | – |
| Net asset value, end of period | $10.96 | $11.30 | $11.01 | $10.78 | $8.91 | $8.09 |
| Total ReturnC,D,E | (2.51)% | 3.20% | 2.54% | 22.18% | 11.10% | (2.76)% |
| Ratios to Average Net AssetsF,G | ||||||
| Expenses before reductions | 1.26%H | 1.26% | 1.35% | 1.44% | 1.58% | 1.77% |
| Expenses net of fee waivers, if any | 1.26%H | 1.26% | 1.35% | 1.43% | 1.45% | 1.45% |
| Expenses net of all reductions | 1.26%H | 1.25% | 1.34% | 1.42% | 1.44% | 1.43% |
| Net investment income (loss) | 1.29%H | .66% | .84% | .80% | .99% | .92% |
| Supplemental Data | ||||||
| Net assets, end of period (000 omitted) | $227,300 | $184,878 | $119,017 | $74,595 | $21,874 | $6,352 |
| Portfolio turnover rateI | 35%H | 26% | 27% | 32% | 32% | 68% |
A Calculated based on average shares outstanding during the period.
B Amount represents less than $.005 per share.
C Total returns for periods of less than one year are not annualized.
D Total returns would have been lower if certain expenses had not been reduced during the applicable periods shown.
E Total returns do not include the effect of the sales charges.
F Fees and expenses of any underlying Fidelity Central Funds are not included in the Fund's expense ratio. The Fund indirectly bears its proportionate share of the expenses of any underlying Fidelity Central Funds.
G Expense ratios reflect operating expenses of the class. Expenses before reductions do not reflect amounts reimbursed by the investment adviser or reductions from brokerage service arrangements or reductions from other expense offset arrangements and do not represent the amount paid by the class during periods when reimbursements or reductions occur. Expenses net of fee waivers reflect expenses after reimbursement by the investment adviser but prior to reductions from brokerage service arrangements or other expense offset arrangements. Expenses net of all reductions represent the net expenses paid by the class.
H Annualized
I Amount does not include the portfolio activity of any underlying Fidelity Central Funds.
See accompanying notes which are an integral part of the financial statements.
Financial Highlights — Fidelity International Growth Fund Class T
| Six months ended (Unaudited) April 30, | Years ended October 31, | |||||
| 2016 | 2015 | 2014 | 2013 | 2012 | 2011 | |
| Selected Per–Share Data | ||||||
| Net asset value, beginning of period | $11.26 | $10.96 | $10.75 | $8.89 | $8.08 | $8.38 |
| Income from Investment Operations | ||||||
| Net investment income (loss)A | .05 | .04 | .06 | .05 | .06 | .06 |
| Net realized and unrealized gain (loss) | (.35) | .27 | .18 | 1.88 | .81 | (.31) |
| Total from investment operations | (.30) | .31 | .24 | 1.93 | .87 | (.25) |
| Distributions from net investment income | (.01) | (.01) | (.02) | (.07) | (.05) | (.04) |
| Distributions from net realized gain | (.01) | – | (.01) | (.01) | (.01) | (.01) |
| Total distributions | (.02) | (.01) | (.03) | (.07)B | (.06) | (.05) |
| Redemption fees added to paid in capitalA,C | – | – | – | – | – | – |
| Net asset value, end of period | $10.94 | $11.26 | $10.96 | $10.75 | $8.89 | $8.08 |
| Total ReturnD,E,F | (2.69)% | 2.85% | 2.21% | 21.91% | 10.82% | (3.03)% |
| Ratios to Average Net AssetsG,H | ||||||
| Expenses before reductions | 1.60%I | 1.58% | 1.65% | 1.69% | 1.85% | 2.03% |
| Expenses net of fee waivers, if any | 1.60%I | 1.58% | 1.65% | 1.69% | 1.70% | 1.70% |
| Expenses net of all reductions | 1.60%I | 1.58% | 1.65% | 1.68% | 1.69% | 1.68% |
| Net investment income (loss) | .95%I | .33% | .53% | .54% | .74% | .67% |
| Supplemental Data | ||||||
| Net assets, end of period (000 omitted) | $28,247 | $28,833 | $26,369 | $23,118 | $10,690 | $2,917 |
| Portfolio turnover rateJ | 35%I | 26% | 27% | 32% | 32% | 68% |
A Calculated based on average shares outstanding during the period.
B Total distributions of $0.07 per share is comprised of distributions from net investment income of $0.69 and distributions from net realized gain of $0.005 per share.
C Amount represents less than $.005 per share.
D Total returns for periods of less than one year are not annualized.
E Total returns would have been lower if certain expenses had not been reduced during the applicable periods shown.
F Total returns do not include the effect of the sales charges.
G Fees and expenses of any underlying Fidelity Central Funds are not included in the Fund's expense ratio. The Fund indirectly bears its proportionate share of the expenses of any underlying Fidelity Central Funds.
H Expense ratios reflect operating expenses of the class. Expenses before reductions do not reflect amounts reimbursed by the investment adviser or reductions from brokerage service arrangements or reductions from other expense offset arrangements and do not represent the amount paid by the class during periods when reimbursements or reductions occur. Expenses net of fee waivers reflect expenses after reimbursement by the investment adviser but prior to reductions from brokerage service arrangements or other expense offset arrangements. Expenses net of all reductions represent the net expenses paid by the class.
I Annualized
J Amount does not include the portfolio activity of any underlying Fidelity Central Funds.
See accompanying notes which are an integral part of the financial statements.
Financial Highlights — Fidelity International Growth Fund Class B
| Six months ended (Unaudited) April 30, | Years ended October 31, | |||||
| 2016 | 2015 | 2014 | 2013 | 2012 | 2011 | |
| Selected Per–Share Data | ||||||
| Net asset value, beginning of period | $11.16 | $10.91 | $10.73 | $8.88 | $8.06 | $8.36 |
| Income from Investment Operations | ||||||
| Net investment income (loss)A | .02 | (.02) | –B | –B | .02 | .01 |
| Net realized and unrealized gain (loss) | (.34) | .27 | .19 | 1.89 | .80 | (.30) |
| Total from investment operations | (.32) | .25 | .19 | 1.89 | .82 | (.29) |
| Distributions from net investment income | – | – | – | (.03) | – | (.01) |
| Distributions from net realized gain | (.01) | – | (.01) | (.01) | – | –B |
| Total distributions | (.01) | – | (.01) | (.04) | – | (.01) |
| Redemption fees added to paid in capitalA,B | – | – | – | – | – | – |
| Net asset value, end of period | $10.83 | $11.16 | $10.91 | $10.73 | $8.88 | $8.06 |
| Total ReturnC,D,E | (2.89)% | 2.29% | 1.76% | 21.35% | 10.17% | (3.47)% |
| Ratios to Average Net AssetsF,G | ||||||
| Expenses before reductions | 2.09%H | 2.07% | 2.14% | 2.19% | 2.35% | 2.55% |
| Expenses net of fee waivers, if any | 2.09%H | 2.07% | 2.14% | 2.18% | 2.20% | 2.20% |
| Expenses net of all reductions | 2.09%H | 2.06% | 2.14% | 2.17% | 2.19% | 2.18% |
| Net investment income (loss) | .45%H | (.15)% | .04% | .05% | .24% | .17% |
| Supplemental Data | ||||||
| Net assets, end of period (000 omitted) | $543 | $800 | $1,404 | $1,579 | $1,116 | $473 |
| Portfolio turnover rateI | 35%H | 26% | 27% | 32% | 32% | 68% |
A Calculated based on average shares outstanding during the period.
B Amount represents less than $.005 per share.
C Total returns for periods of less than one year are not annualized.
D Total returns would have been lower if certain expenses had not been reduced during the applicable periods shown.
E Total returns do not include the effect of the contingent deferred sales charge.
F Fees and expenses of any underlying Fidelity Central Funds are not included in the Fund's expense ratio. The Fund indirectly bears its proportionate share of the expenses of any underlying Fidelity Central Funds.
G Expense ratios reflect operating expenses of the class. Expenses before reductions do not reflect amounts reimbursed by the investment adviser or reductions from brokerage service arrangements or reductions from other expense offset arrangements and do not represent the amount paid by the class during periods when reimbursements or reductions occur. Expenses net of fee waivers reflect expenses after reimbursement by the investment adviser but prior to reductions from brokerage service arrangements or other expense offset arrangements. Expenses net of all reductions represent the net expenses paid by the class.
H Annualized
I Amount does not include the portfolio activity of any underlying Fidelity Central Funds.
See accompanying notes which are an integral part of the financial statements.
Financial Highlights — Fidelity International Growth Fund Class C
| Six months ended (Unaudited) April 30, | Years ended October 31, | |||||
| 2016 | 2015 | 2014 | 2013 | 2012 | 2011 | |
| Selected Per–Share Data | ||||||
| Net asset value, beginning of period | $11.12 | $10.87 | $10.69 | $8.84 | $8.03 | $8.34 |
| Income from Investment Operations | ||||||
| Net investment income (loss)A | .03 | (.02) | .01 | .01 | .02 | .01 |
| Net realized and unrealized gain (loss) | (.35) | .27 | .18 | 1.87 | .80 | (.31) |
| Total from investment operations | (.32) | .25 | .19 | 1.88 | .82 | (.30) |
| Distributions from net investment income | – | – | – | (.02) | (.01) | (.01) |
| Distributions from net realized gain | (.01) | – | (.01) | (.01) | (.01) | (.01) |
| Total distributions | (.01) | – | (.01) | (.03) | (.01)B | (.01)C |
| Redemption fees added to paid in capitalA,D | – | – | – | – | – | – |
| Net asset value, end of period | $10.79 | $11.12 | $10.87 | $10.69 | $8.84 | $8.03 |
| Total ReturnE,F,G | (2.90)% | 2.30% | 1.77% | 21.29% | 10.27% | (3.57)% |
| Ratios to Average Net AssetsH,I | ||||||
| Expenses before reductions | 2.05%J | 2.06% | 2.12% | 2.19% | 2.33% | 2.52% |
| Expenses net of fee waivers, if any | 2.05%J | 2.06% | 2.12% | 2.18% | 2.20% | 2.20% |
| Expenses net of all reductions | 2.05%J | 2.05% | 2.12% | 2.17% | 2.19% | 2.18% |
| Net investment income (loss) | .49%J | (.15)% | .06% | .05% | .24% | .17% |
| Supplemental Data | ||||||
| Net assets, end of period (000 omitted) | $54,803 | $52,378 | $32,737 | $17,196 | $5,648 | $2,767 |
| Portfolio turnover rateK | 35%J | 26% | 27% | 32% | 32% | 68% |
A Calculated based on average shares outstanding during the period.
B Total distributions of $.01 per share is comprised of distributions from net investment income of $.007 and distributions from net realized gain of $.006 per share.
C Total distributions of $.01 per share is comprised of distributions from net investment income of $.008 and distributions from net realized gain of $.005 per share.
D Amount represents less than $.005 per share.
E Total returns for periods of less than one year are not annualized.
F Total returns would have been lower if certain expenses had not been reduced during the applicable periods shown.
G Total returns do not include the effect of the contingent deferred sales charge.
H Fees and expenses of any underlying Fidelity Central Funds are not included in the Fund's expense ratio. The Fund indirectly bears its proportionate share of the expenses of any underlying Fidelity Central Funds.
I Expense ratios reflect operating expenses of the class. Expenses before reductions do not reflect amounts reimbursed by the investment adviser or reductions from brokerage service arrangements or reductions from other expense offset arrangements and do not represent the amount paid by the class during periods when reimbursements or reductions occur. Expenses net of fee waivers reflect expenses after reimbursement by the investment adviser but prior to reductions from brokerage service arrangements or other expense offset arrangements. Expenses net of all reductions represent the net expenses paid by the class.
J Annualized
K Amount does not include the portfolio activity of any underlying Fidelity Central Funds.
See accompanying notes which are an integral part of the financial statements.
Financial Highlights — Fidelity International Growth Fund
| Six months ended (Unaudited) April 30, | Years ended October 31, | |||||
| 2016 | 2015 | 2014 | 2013 | 2012 | 2011 | |
| Selected Per–Share Data | ||||||
| Net asset value, beginning of period | $11.38 | $11.10 | $10.84 | $8.95 | $8.12 | $8.40 |
| Income from Investment Operations | ||||||
| Net investment income (loss)A | .09 | .11 | .13 | .11 | .11 | .10 |
| Net realized and unrealized gain (loss) | (.35) | .26 | .19 | 1.88 | .81 | (.30) |
| Total from investment operations | (.26) | .37 | .32 | 1.99 | .92 | (.20) |
| Distributions from net investment income | (.08) | (.09) | (.05) | (.10) | (.08) | (.07) |
| Distributions from net realized gain | (.01) | – | (.01) | (.01) | (.01) | (.01) |
| Total distributions | (.09) | (.09) | (.06) | (.10)B | (.09) | (.08) |
| Redemption fees added to paid in capitalA,C | – | – | – | – | – | – |
| Net asset value, end of period | $11.03 | $11.38 | $11.10 | $10.84 | $8.95 | $8.12 |
| Total ReturnD,E | (2.34)% | 3.36% | 2.96% | 22.48% | 11.41% | (2.47)% |
| Ratios to Average Net AssetsF,G | ||||||
| Expenses before reductions | .96%H | .97% | 1.04% | 1.13% | 1.28% | 1.52% |
| Expenses net of fee waivers, if any | .96%H | .97% | 1.04% | 1.13% | 1.20% | 1.20% |
| Expenses net of all reductions | .96%H | .96% | 1.04% | 1.11% | 1.19% | 1.18% |
| Net investment income (loss) | 1.58%H | .94% | 1.14% | 1.11% | 1.24% | 1.17% |
| Supplemental Data | ||||||
| Net assets, end of period (000 omitted) | $989,532 | $938,348 | $635,607 | $430,914 | $149,526 | $53,437 |
| Portfolio turnover rateI | 35%H | 26% | 27% | 32% | 32% | 68% |
A Calculated based on average shares outstanding during the period.
B Total distributions of $.10 per share is comprised of distributions from net investment income of $.097 and distributions from net realized gain of $.005 per share.
C Amount represents less than $.005 per share.
D Total returns for periods of less than one year are not annualized.
E Total returns would have been lower if certain expenses had not been reduced during the applicable periods shown.
F Fees and expenses of any underlying Fidelity Central Funds are not included in the Fund's expense ratio. The Fund indirectly bears its proportionate share of the expenses of any underlying Fidelity Central Funds.
G Expense ratios reflect operating expenses of the class. Expenses before reductions do not reflect amounts reimbursed by the investment adviser or reductions from brokerage service arrangements or reductions from other expense offset arrangements and do not represent the amount paid by the class during periods when reimbursements or reductions occur. Expenses net of fee waivers reflect expenses after reimbursement by the investment adviser but prior to reductions from brokerage service arrangements or other expense offset arrangements. Expenses net of all reductions represent the net expenses paid by the class.
H Annualized
I Amount does not include the portfolio activity of any underlying Fidelity Central Funds.
See accompanying notes which are an integral part of the financial statements.
Financial Highlights — Fidelity International Growth Fund Class I
| Six months ended (Unaudited) April 30, | Years ended October 31, | |||||
| 2016 | 2015 | 2014 | 2013 | 2012 | 2011 | |
| Selected Per–Share Data | ||||||
| Net asset value, beginning of period | $11.36 | $11.08 | $10.84 | $8.94 | $8.12 | $8.40 |
| Income from Investment Operations | ||||||
| Net investment income (loss)A | .08 | .11 | .13 | .11 | .10 | .10 |
| Net realized and unrealized gain (loss) | (.34) | .27 | .18 | 1.90 | .81 | (.30) |
| Total from investment operations | (.26) | .38 | .31 | 2.01 | .91 | (.20) |
| Distributions from net investment income | (.08) | (.10) | (.06) | (.10) | (.08) | (.07) |
| Distributions from net realized gain | (.01) | – | (.01) | (.01) | (.01) | (.01) |
| Total distributions | (.09) | (.10) | (.07) | (.11) | (.09) | (.08) |
| Redemption fees added to paid in capitalA,B | – | – | – | – | – | – |
| Net asset value, end of period | $11.01 | $11.36 | $11.08 | $10.84 | $8.94 | $8.12 |
| Total ReturnC,D | (2.34)% | 3.41% | 2.84% | 22.66% | 11.28% | (2.47)% |
| Ratios to Average Net AssetsE,F | ||||||
| Expenses before reductions | .97%G | .98% | 1.04% | 1.11% | 1.27% | 1.50% |
| Expenses net of fee waivers, if any | .97%G | .98% | 1.04% | 1.11% | 1.20% | 1.20% |
| Expenses net of all reductions | .96%G | .97% | 1.04% | 1.09% | 1.19% | 1.18% |
| Net investment income (loss) | 1.58%G | .94% | 1.14% | 1.13% | 1.24% | 1.17% |
| Supplemental Data | ||||||
| Net assets, end of period (000 omitted) | $344,685 | $267,745 | $121,554 | $38,771 | $3,992 | $493 |
| Portfolio turnover rateH | 35%G | 26% | 27% | 32% | 32% | 68% |
A Calculated based on average shares outstanding during the period.
B Amount represents less than $.005 per share.
C Total returns for periods of less than one year are not annualized.
D Total returns would have been lower if certain expenses had not been reduced during the applicable periods shown.
E Fees and expenses of any underlying Fidelity Central Funds are not included in the Fund's expense ratio. The Fund indirectly bears its proportionate share of the expenses of any underlying Fidelity Central Funds.
F Expense ratios reflect operating expenses of the class. Expenses before reductions do not reflect amounts reimbursed by the investment adviser or reductions from brokerage service arrangements or reductions from other expense offset arrangements and do not represent the amount paid by the class during periods when reimbursements or reductions occur. Expenses net of fee waivers reflect expenses after reimbursement by the investment adviser but prior to reductions from brokerage service arrangements or other expense offset arrangements. Expenses net of all reductions represent the net expenses paid by the class.
G Annualized
H Amount does not include the portfolio activity of any underlying Fidelity Central Funds.
See accompanying notes which are an integral part of the financial statements.
Financial Highlights — Fidelity International Growth Fund Class Z
| Six months ended (Unaudited) April 30, | Years ended October 31, | |||
| April 30, | 2016 | 2015 | 2014 | 2013 A |
| Selected Per–Share Data | ||||
| Net asset value, beginning of period | $11.38 | $11.10 | $10.84 | $10.26 |
| Income from Investment Operations | ||||
| Net investment income (loss)B | .09 | .12 | .14 | .02 |
| Net realized and unrealized gain (loss) | (.35) | .27 | .19 | .56 |
| Total from investment operations | (.26) | .39 | .33 | .58 |
| Distributions from net investment income | (.09) | (.11) | (.06) | – |
| Distributions from net realized gain | (.01) | – | (.01) | – |
| Total distributions | (.10) | (.11) | (.07) | – |
| Redemption fees added to paid in capitalB,C | – | – | – | – |
| Net asset value, end of period | $11.02 | $11.38 | $11.10 | $10.84 |
| Total ReturnD,E | (2.29)% | 3.52% | 3.07% | 5.65% |
| Ratios to Average Net AssetsF,G | ||||
| Expenses before reductions | .83%H | .84% | .88% | .94%H |
| Expenses net of fee waivers, if any | .83%H | .84% | .88% | .94%H |
| Expenses net of all reductions | .83%H | .83% | .88% | .93%H |
| Net investment income (loss) | 1.71%H | 1.07% | 1.30% | .65%H |
| Supplemental Data | ||||
| Net assets, end of period (000 omitted) | $15,509 | $897 | $104 | $106 |
| Portfolio turnover rateI | 35%H | 26% | 27% | 32% |
A For the period August 13, 2013 (commencement of sale of shares) to October 31, 2013.
B Calculated based on average shares outstanding during the period.
C Amount represents less than $.005 per share.
D Total returns for periods of less than one year are not annualized.
E Total returns would have been lower if certain expenses had not been reduced during the applicable periods shown.
F Fees and expenses of any underlying Fidelity Central Funds are not included in the Fund's expense ratio. The Fund indirectly bears its proportionate share of the expenses of any underlying Fidelity Central Funds.
G Expense ratios reflect operating expenses of the class. Expenses before reductions do not reflect amounts reimbursed by the investment adviser or reductions from brokerage service arrangements or reductions from other expense offset arrangements and do not represent the amount paid by the class during periods when reimbursements or reductions occur. Expense ratios before reductions for start-up periods may not be representative of longer-term operating periods. Expenses net of fee waivers reflect expenses after reimbursement by the investment adviser but prior to reductions from brokerage service arrangements or other expense offset arrangements. Expenses net of all reductions represent the net expenses paid by the class.
H Annualized
I Amount does not include the portfolio activity of any underlying Fidelity Central Funds.
See accompanying notes which are an integral part of the financial statements.
Notes to Financial Statements (Unaudited)
For the period ended April 30, 2016
1. Organization.
Fidelity International Growth Fund (the Fund) is a fund of Fidelity Investment Trust (the Trust) and is authorized to issue an unlimited number of shares. The Trust is registered under the Investment Company Act of 1940, as amended (the 1940 Act), as an open-end management investment company organized as a Massachusetts business trust. The Fund offers Class A, Class T, Class C, International Growth, Class I and Class Z shares, each of which, along with Class B shares, has equal rights as to assets and voting privileges. Class B shares are closed to new accounts and additional purchases, except for exchanges and reinvestments. Each class has exclusive voting rights with respect to matters that affect that class. Class B shares will automatically convert to Class A shares after a maximum holding period of seven years from the initial date of purchase.
During the period, the Board of Trustees approved the conversion of all existing Class B shares into Class A shares, effective on or about July 1, 2016, regardless of the length of times shares have been held.
2. Investments in Fidelity Central Funds.
The Fund invests in Fidelity Central Funds, which are open-end investment companies generally available only to other investment companies and accounts managed by the investment adviser and its affiliates. The Fund's Schedule of Investments lists each of the Fidelity Central Funds held as of period end, if any, as an investment of the Fund, but does not include the underlying holdings of each Fidelity Central Fund. As an Investing Fund, the Fund indirectly bears its proportionate share of the expenses of the underlying Fidelity Central Funds.
The Money Market Central Funds seek preservation of capital and current income and are managed by Fidelity Investments Money Management, Inc. (FIMM), an affiliate of the investment adviser. Annualized expenses of the Money Market Central Funds as of their most recent shareholder report date are less than .005%.
A complete unaudited list of holdings for each Fidelity Central Fund is available upon request or at the Securities and Exchange Commission (the SEC) website at www.sec.gov. In addition, the financial statements of the Fidelity Central Funds are available on the SEC website or upon request.
3. Significant Accounting Policies.
The financial statements have been prepared in conformity with accounting principles generally accepted in the United States of America (GAAP), which require management to make certain estimates and assumptions at the date of the financial statements. Actual results could differ from those estimates. Subsequent events, if any, through the date that the financial statements were issued have been evaluated in the preparation of the financial statements. The following summarizes the significant accounting policies of the Fund:
Investment Valuation. Investments are valued as of 4:00 p.m. Eastern time on the last calendar day of the period. The Board of Trustees (the Board) has delegated the day to day responsibility for the valuation of the Fund's investments to the Fidelity Management & Research Company (FMR) Fair Value Committee (the Committee). In accordance with valuation policies and procedures approved by the Board, the Fund attempts to obtain prices from one or more third party pricing vendors or brokers to value its investments. When current market prices, quotations or currency exchange rates are not readily available or reliable, investments will be fair valued in good faith by the Committee, in accordance with procedures adopted by the Board. Factors used in determining fair value vary by investment type and may include market or investment specific events. The frequency with which these procedures are used cannot be predicted and they may be utilized to a significant extent. The Committee oversees the Fund's valuation policies and procedures and reports to the Board on the Committee's activities and fair value determinations. The Board monitors the appropriateness of the procedures used in valuing the Fund's investments and ratifies the fair value determinations of the Committee.
The Fund categorizes the inputs to valuation techniques used to value its investments into a disclosure hierarchy consisting of three levels as shown below:
- Level 1 – quoted prices in active markets for identical investments
- Level 2 – other significant observable inputs (including quoted prices for similar investments, interest rates, prepayment speeds, etc.)
- Level 3 – unobservable inputs (including the Fund's own assumptions based on the best information available)
Valuation techniques used to value the Fund's investments by major category are as follows:
Equity securities, including restricted securities, for which market quotations are readily available, are valued at the last reported sale price or official closing price as reported by a third party pricing vendor on the primary market or exchange on which they are traded and are categorized as Level 1 in the hierarchy. In the event there were no sales during the day or closing prices are not available, securities are valued at the last quoted bid price or may be valued using the last available price and are generally categorized as Level 2 in the hierarchy. For foreign equity securities, when market or security specific events arise, comparisons to the valuation of American Depositary Receipts (ADRs), futures contracts, Exchange-Traded Funds (ETFs) and certain indexes as well as quoted prices for similar securities may be used and would be categorized as Level 2 in the hierarchy. Utilizing these techniques may result in transfers between Level 1 and Level 2. For equity securities, including restricted securities, where observable inputs are limited, assumptions about market activity and risk are used and these securities may be categorized as Level 3 in the hierarchy.
Investments in open-end mutual funds, including the Fidelity Central Funds, are valued at their closing net asset value (NAV) each business day and are categorized as Level 1 in the hierarchy.
Changes in valuation techniques may result in transfers in or out of an assigned level within the disclosure hierarchy. The aggregate value of investments by input level as of April 30, 2016, including information on transfers between Levels 1 and 2, is included at the end of the Fund's Schedule of Investments.
Foreign Currency. The Fund may use foreign currency contracts to facilitate transactions in foreign-denominated securities. Gains and losses from these transactions may arise from changes in the value of the foreign currency or if the counterparties do not perform under the contracts' terms.
Foreign-denominated assets, including investment securities, and liabilities are translated into U.S. dollars at the exchange rates at period end. Purchases and sales of investment securities, income and dividends received and expenses denominated in foreign currencies are translated into U.S. dollars at the exchange rate in effect on the transaction date.
The effects of exchange rate fluctuations on investments are included with the net realized and unrealized gain (loss) on investment securities. Other foreign currency transactions resulting in realized and unrealized gain (loss) are disclosed separately.
Investment Transactions and Income. For financial reporting purposes, the Fund's investment holdings and NAV include trades executed through the end of the last business day of the period. The NAV per share for processing shareholder transactions is calculated as of the close of business of the New York Stock Exchange (NYSE), normally 4:00 p.m. Eastern time and includes trades executed through the end of the prior business day. Gains and losses on securities sold are determined on the basis of identified cost. Dividend income is recorded on the ex-dividend date, except for certain dividends from foreign securities where the ex-dividend date may have passed, which are recorded as soon as the Fund is informed of the ex-dividend date. Non-cash dividends included in dividend income, if any, are recorded at the fair market value of the securities received. Income and capital gain distributions from Fidelity Central Funds, if any, are recorded on the ex-dividend date. Distributions received on securities that represent a return of capital or capital gain are recorded as a reduction of cost of investments and/or as a realized gain. Subsequent to ex-dividend date the Fund determines the components of these distributions, based upon receipt of tax filings or other correspondence relating to the underlying investment. Investment income is recorded net of foreign taxes withheld where recovery of such taxes is uncertain.
Class Allocations and Expenses. Investment income, realized and unrealized capital gains and losses, common expenses of the Fund, and certain fund-level expense reductions, if any, are allocated daily on a pro-rata basis to each class based on the relative net assets of each class to the total net assets of the Fund. Each class differs with respect to transfer agent and distribution and service plan fees incurred. Certain expense reductions may also differ by class. For the reporting period, the allocated portion of income and expenses to each class as a percent of its average net assets may vary due to the timing of recording these transactions in relation to fluctuating net assets of the classes. Expenses directly attributable to a fund are charged to that fund. Expenses attributable to more than one fund are allocated among the respective funds on the basis of relative net assets or other appropriate methods. Expense estimates are accrued in the period to which they relate and adjustments are made when actual amounts are known.
Income Tax Information and Distributions to Shareholders. Each year, the Fund intends to qualify as a regulated investment company under Subchapter M of the Internal Revenue Code, including distributing substantially all of its taxable income and realized gains. As a result, no provision for U.S. Federal income taxes is required. The Fund files a U.S. federal tax return, in addition to state and local tax returns as required. The Fund's federal income tax returns are subject to examination by the Internal Revenue Service (IRS) for a period of three fiscal years after they are filed. State and local tax returns may be subject to examination for an additional fiscal year depending on the jurisdiction. Foreign taxes are provided for based on the Fund's understanding of the tax rules and rates that exist in the foreign markets in which it invests.
Distributions are declared and recorded on the ex-dividend date. Income dividends and capital gain distributions are declared separately for each class. Income and capital gain distributions are determined in accordance with income tax regulations, which may differ from GAAP.
Capital accounts within the financial statements are adjusted for permanent book-tax differences. These adjustments have no impact on net assets or the results of operations. Capital accounts are not adjusted for temporary book-tax differences which will reverse in a subsequent period.
Book-tax differences are primarily due to foreign currency transactions, certain foreign taxes, passive foreign investment companies (PFIC), partnerships, capital loss carryforwards and losses deferred due to wash sales.
The federal tax cost of investment securities and unrealized appreciation (depreciation) as of period end were as follows:
| Gross unrealized appreciation | $176,397,956 |
| Gross unrealized depreciation | (59,559,141) |
| Net unrealized appreciation (depreciation) on securities | $116,838,815 |
| Tax cost | $1,637,437,209 |
Capital loss carryforwards are only available to offset future capital gains of the Fund to the extent provided by regulations and may be limited. Under the Regulated Investment Company Modernization Act of 2010 (the Act), the Fund is permitted to carry forward capital losses incurred in taxable years beginning after December 22, 2010 for an unlimited period and such capital losses are required to be used prior to any losses that expire. The capital loss carryforward information presented below, including any applicable limitation, is estimated as of prior fiscal period end and is subject to adjustment.
| No expiration | |
| Short-term | $(26,434,969) |
| Long-term | (7,319,866) |
| Total no expiration | $(33,754,835) |
Short-Term Trading (Redemption) Fees. Shares held by investors in the Fund less than 30 days may have been subject to a redemption fee equal to 1.00% of the NAV of shares redeemed. All redemption fees, which reduce the proceeds of the shareholder redemption, are retained by the Fund and accounted for as an addition to paid in capital.
4. Purchases and Sales of Investments.
Purchases and sales of securities, other than short-term securities, aggregated $479,246,265 and $260,718,084, respectively.
5. Fees and Other Transactions with Affiliates.
Management Fee. Fidelity Management & Research Company (the investment adviser) and its affiliates provide the Fund with investment management related services for which the Fund pays a monthly management fee. The management fee is the sum of an individual fund fee rate that is based on an annual rate of .45% of the Fund's average net assets and an annualized group fee rate that averaged .25% during the period. The group fee rate is based upon the average net assets of all the mutual funds advised by the investment adviser, including any mutual funds previously advised by the investment adviser that are currently advised by Fidelity SelectCo, LLC, an affiliate of the investment adviser. The group fee rate decreases as assets under management increase and increases as assets under management decrease. In addition, the management fee is subject to a performance adjustment (up to a maximum of +/- .20% of the Fund's average net assets over a 36 month performance period). The upward or downward adjustment to the management fee is based on the relative investment performance of International Growth as compared to its benchmark index, the MSCI EAFE Growth Index, over the same 36 month performance period. For the reporting period, the total annualized management fee rate, including the performance adjustment, was .71% of the Fund's average net assets. The performance adjustment included in the management fee rate may be higher or lower than the maximum performance adjustment rate due to the difference between the average net assets for the reporting and performance periods.
Distribution and Service Plan Fees. In accordance with Rule 12b-1 of the 1940 Act, the Fund has adopted separate Distribution and Service Plans for each class of shares. Certain classes pay Fidelity Distributors Corporation (FDC), an affiliate of the investment adviser, separate Distribution and Service Fees, each of which is based on an annual percentage of each class' average net assets. In addition, FDC may pay financial intermediaries for selling shares of the Fund and providing shareholder support services. For the period, the Distribution and Service Fee rates, total fees and amounts retained by FDC were as follows:
| Distribution Fee | Service Fee | Total Fees | Retained by FDC | |
| Class A | -% | .25% | $249,157 | $357 |
| Class T | .25% | .25% | 69,243 | – |
| Class B | .75% | .25% | 3,364 | 2,523 |
| Class C | .75% | .25% | 263,379 | 98,751 |
| $585,143 | $101,631 |
Sales Load. FDC may receive a front-end sales charge of up to 5.75% for selling Class A shares and 3.50% for selling Class T shares, some of which is paid to financial intermediaries for selling shares of the Fund. Depending on the holding period, FDC may receive contingent deferred sales charges levied on Class A, Class T, Class B and Class C redemptions. The deferred sales charges range from 5.00% to 1.00% for Class B shares, 1.00% for Class C shares, 1.00% for certain purchases of Class A shares and .25% for certain purchases of Class T shares.
For the period, sales charge amounts retained by FDC were as follows:
| Retained by FDC | |
| Class A | $44,378 |
| Class T | 6,336 |
| Class B(a) | 6 |
| Class C(a) | 4,765 |
| $55,485 |
(a) When Class B and Class C shares are initially sold, FDC pays commissions from its own resources to financial intermediaries through which the sales are made.
Transfer Agent Fees. Fidelity Investments Institutional Operations Company, Inc., (FIIOC), an affiliate of the investment adviser, is the transfer, dividend disbursing and shareholder servicing agent for each class of the Fund. FIIOC receives account fees and asset-based fees that vary according to the account size and type of account of the shareholders of the respective classes of the Fund, except for Class Z. FIIOC receives an asset-based fee of Class Z's average net assets. FIIOC pays for typesetting, printing and mailing of shareholder reports, except proxy statements.
For the period, transfer agent fees for each class were as follows:
| Amount | % of Class-Level Average Net Assets(a) | |
| Class A | $220,276 | .22 |
| Class T | 43,164 | .31 |
| Class B | 1,028 | .31 |
| Class C | 69,895 | .27 |
| International Growth | 819,000 | .18 |
| Class I | 263,135 | .18 |
| Class Z | 2,268 | .05 |
| $1,418,766 |
(a) Annualized
Accounting and Security Lending Fees. Fidelity Service Company, Inc. (FSC), an affiliate of the investment adviser, maintains the Fund's accounting records. The accounting fee is based on the level of average net assets for each month. Under a separate contract, FSC administers the security lending program. The security lending fee is based on the number and duration of lending transactions.
Brokerage Commissions. The Fund placed a portion of its portfolio transactions with brokerage firms which are affiliates of the investment adviser. Brokerage commissions are included in net realized gain (loss) and change in net unrealized appreciation (depreciation) in the Statement of Operations. The commissions paid to these affiliated firms were $799 for the period.
Interfund Trades. The Fund may purchase from or sell securities to other Fidelity Funds under procedures adopted by the Board. The procedures have been designed to ensure these interfund trades are executed in accordance with Rule 17a-7 of the 1940 Act. Interfund trades are included within the respective purchases and sales amounts shown in the Purchases and Sales of Investments note.
6. Committed Line of Credit.
The Fund participates with other funds managed by the investment adviser or an affiliate in a $4.25 billion credit facility (the "line of credit") to be utilized for temporary or emergency purposes to fund shareholder redemptions or for other short-term liquidity purposes. The Fund has agreed to pay commitment fees on its pro-rata portion of the line of credit, which amounted to $1,311 and is reflected in Miscellaneous expenses on the Statement of Operations. During the period, the Fund did not borrow on this line of credit.
7. Security Lending.
The Fund lends portfolio securities through a lending agent from time to time in order to earn additional income. For equity securities, a lending agent is used and may loan securities to certain qualified borrowers, including Fidelity Capital Markets (FCM), a broker-dealer affiliated with the Fund. On the settlement date of the loan, the Fund receives collateral (in the form of U.S. Treasury obligations, letters of credit and/or cash) against the loaned securities and maintains collateral in an amount not less than 100% of the market value of the loaned securities during the period of the loan. The market value of the loaned securities is determined at the close of business of the Fund and any additional required collateral is delivered to the Fund on the next business day. The Fund or borrower may terminate the loan at any time, and if the borrower defaults on its obligation to return the securities loaned because of insolvency or other reasons, the Fund may apply collateral received from the borrower against the obligation. The Fund may experience delays and costs in recovering the securities loaned. Any cash collateral received is invested in the Fidelity Securities Lending Cash Central Fund. The value of loaned securities and cash collateral at period end are disclosed on the Fund's Statement of Assets and Liabilities. The value of securities loaned to FCM at period end was $10,140,516. Security lending income represents the income earned on investing cash collateral, less rebates paid to borrowers and any lending agent fees associated with the loan, plus any premium payments received for lending certain types of securities. Security lending income is presented in the Statement of Operations as a component of income from Fidelity Central Funds. Total security lending income during the period amounted to $330,325, including $34,892 from securities loaned to FCM.
8. Expense Reductions.
Commissions paid to certain brokers with whom the investment adviser, or its affiliates, places trades on behalf of the Fund include an amount in addition to trade execution, which may be rebated back to the Fund to offset certain expenses. This amount totaled $11,575 for the period. In addition, through arrangements with the Fund's custodian, credits realized as a result of certain uninvested cash balances were used to reduce the Fund's expenses. During the period, these credits reduced the Fund's custody expenses by $35.
In addition, during the period the investment adviser reimbursed and/or waived a portion of fund-level operating expenses in the amount of $5,363.
9. Distributions to Shareholders.
Distributions to shareholders of each class were as follows:
| Six months ended April 30, 2016 | Year ended October 31, 2015 | |
| From net investment income | ||
| Class A | $857,306 | $684,914 |
| Class T | 25,900 | 29,128 |
| International Growth | 6,508,406 | 5,239,951 |
| Class I | 1,913,593 | 1,064,923 |
| Class Z | 8,317 | 1,008 |
| Total | $9,313,522 | $7,019,924 |
| From net realized gain | ||
| Class A | $137,169 | $– |
| Class T | 20,720 | – |
| Class B | 561 | – |
| Class C | 39,156 | – |
| International Growth | 667,539 | – |
| Class I | 196,266 | – |
| Class Z | 708 | – |
| Total | $1,062,119 | $– |
10. Share Transactions.
Share transactions for each class were as follows and may contain automatic conversions between classes or exchanges between affiliated funds:
| Shares | Shares | Dollars | Dollars | |
| Six months ended April 30, 2016 | Year ended October 31, 2015 | Six months ended April 30, 2016 | Year ended October 31, 2015 | |
| Class A | ||||
| Shares sold | 6,246,540 | 9,298,452 | $67,129,589 | $105,707,223 |
| Reinvestment of distributions | 86,341 | 60,570 | 970,468 | 669,298 |
| Shares redeemed | (1,954,972) | (3,798,128) | (20,859,132) | (42,982,992) |
| Net increase (decrease) | 4,377,909 | 5,560,894 | $47,240,925 | $63,393,529 |
| Class T | ||||
| Shares sold | 366,792 | 1,158,910 | $3,936,696 | $13,286,739 |
| Reinvestment of distributions | 4,067 | 2,593 | 45,714 | 28,654 |
| Shares redeemed | (350,025) | (1,005,399) | (3,686,315) | (11,627,373) |
| Net increase (decrease) | 20,834 | 156,104 | $296,095 | $1,688,020 |
| Class B | ||||
| Shares sold | 1,881 | 30,282 | $19,678 | $347,009 |
| Reinvestment of distributions | 50 | – | 556 | – |
| Shares redeemed | (23,393) | (87,349) | (246,379) | (994,341) |
| Net increase (decrease) | (21,462) | (57,067) | $(226,145) | $(647,332) |
| Class C | ||||
| Shares sold | 819,268 | 2,689,800 | $8,736,707 | $30,433,427 |
| Reinvestment of distributions | 3,485 | – | 38,678 | – |
| Shares redeemed | (454,625) | (991,400) | (4,741,050) | (10,978,888) |
| Net increase (decrease) | 368,128 | 1,698,400 | $4,034,335 | $19,454,539 |
| International Growth | ||||
| Shares sold | 17,140,428 | 39,705,804 | $183,584,698 | $456,131,993 |
| Reinvestment of distributions | 515,203 | 387,169 | 5,821,794 | 4,301,448 |
| Shares redeemed | (10,385,791) | (14,942,156) | (110,850,155) | (169,380,325) |
| Net increase (decrease) | 7,269,840 | 25,150,817 | $78,556,337 | $291,053,116 |
| Class I | ||||
| Shares sold | 13,087,526 | 17,728,493 | $140,430,050 | $201,877,753 |
| Reinvestment of distributions | 177,277 | 92,582 | 1,999,688 | 1,026,733 |
| Shares redeemed | (5,525,257) | (5,227,430) | (58,460,124) | (58,733,231) |
| Net increase (decrease) | 7,739,546 | 12,593,645 | $83,969,614 | $144,171,255 |
| Class Z | ||||
| Shares sold | 1,378,158 | 88,007 | $14,776,889 | $956,120 |
| Reinvestment of distributions | 799 | 91 | 9,025 | 1,008 |
| Shares redeemed | (50,920) | (18,621) | (543,517) | (208,779) |
| Net increase (decrease) | 1,328,037 | 69,477 | $14,242,397 | $748,349 |
11. Other.
The Fund's organizational documents provide former and current trustees and officers with a limited indemnification against liabilities arising in connection with the performance of their duties to the Fund. In the normal course of business, the Fund may also enter into contracts that provide general indemnifications. The Fund's maximum exposure under these arrangements is unknown as this would be dependent on future claims that may be made against the Fund. The risk of material loss from such claims is considered remote.
Shareholder Expense Example
As a shareholder of the Fund, you incur two types of costs: (1) transaction costs, including sales charges (loads) on purchase payments or redemption proceeds, redemption fees and (2) ongoing costs, including management fees, distribution and/or service (12b-1) fees and other Fund expenses. This Example is intended to help you understand your ongoing costs (in dollars) of investing in the Fund and to compare these costs with the ongoing costs of investing in other mutual funds.
The Example is based on an investment of $1,000 invested at the beginning of the period and held for the entire period (November 1, 2015 to April 30, 2016).
Actual Expenses
The first line of the accompanying table for each class of the Fund provides information about actual account values and actual expenses. You may use the information in this line, together with the amount you invested, to estimate the expenses that you paid over the period. Simply divide your account value by $1,000.00 (for example, an $8,600 account value divided by $1,000.00 = 8.6), then multiply the result by the number in the first line for a class of the Fund under the heading entitled "Expenses Paid During Period" to estimate the expenses you paid on your account during this period. A small balance maintenance fee of $12.00 that is charged once a year may apply for certain accounts with a value of less than $2,000. This fee is not included in the table below. If it was, the estimate of expenses you paid during the period would be higher, and your ending account value lower, by this amount. In addition, the Fund, as a shareholder in the underlying Fidelity Central Funds, will indirectly bear its pro-rata share of the fees and expenses incurred by the underlying Fidelity Central Funds. These fees and expenses are not included in the Fund's annualized expense ratio used to calculate the expense estimate in the table below.
Hypothetical Example for Comparison Purposes
The second line of the accompanying table for each class of the Fund provides information about hypothetical account values and hypothetical expenses based on a Class' actual expense ratio and an assumed rate of return of 5% per year before expenses, which is not the Class' actual return. The hypothetical account values and expenses may not be used to estimate the actual ending account balance or expenses you paid for the period. You may use this information to compare the ongoing costs of investing in the Fund and other funds. To do so, compare this 5% hypothetical example with the 5% hypothetical examples that appear in the shareholder reports of the other funds. A small balance maintenance fee of $12.00 that is charged once a year may apply for certain accounts with a value of less than $2,000. This fee is not included in the table below. If it was, the estimate of expenses you paid during the period would be higher, and your ending account value lower, by this amount. In addition, the Fund, as a shareholder in the underlying Fidelity Central Funds, will indirectly bear its pro-rata share of the fees and expenses incurred by the underlying Fidelity Central Funds. These fees and expenses are not included in the Fund's annualized expense ratio used to calculate the expense estimate in the table below.
Please note that the expenses shown in the table are meant to highlight your ongoing costs only and do not reflect any transaction costs. Therefore, the second line of the table is useful in comparing ongoing costs only, and will not help you determine the relative total costs of owning different funds. In addition, if these transactional costs were included, your costs would have been higher.
| Annualized Expense Ratio-A | Beginning Account Value November 1, 2015 | Ending Account Value April 30, 2016 | Expenses Paid During Period-B November 1, 2015 to April 30, 2016 | |
| Class A | 1.26% | |||
| Actual | $1,000.00 | $974.90 | $6.19 | |
| Hypothetical-C | $1,000.00 | $1,018.60 | $6.32 | |
| Class T | 1.60% | |||
| Actual | $1,000.00 | $973.10 | $7.85 | |
| Hypothetical-C | $1,000.00 | $1,016.91 | $8.02 | |
| Class B | 2.09% | |||
| Actual | $1,000.00 | $971.10 | $10.24 | |
| Hypothetical-C | $1,000.00 | $1,014.47 | $10.47 | |
| Class C | 2.05% | |||
| Actual | $1,000.00 | $971.00 | $10.05 | |
| Hypothetical-C | $1,000.00 | $1,014.67 | $10.27 | |
| International Growth | .96% | |||
| Actual | $1,000.00 | $976.60 | $4.72 | |
| Hypothetical-C | $1,000.00 | $1,020.09 | $4.82 | |
| Class I | .97% | |||
| Actual | $1,000.00 | $976.60 | $4.77 | |
| Hypothetical-C | $1,000.00 | $1,020.04 | $4.87 | |
| Class Z | .83% | |||
| Actual | $1,000.00 | $977.10 | $4.08 | |
| Hypothetical-C | $1,000.00 | $1,020.74 | $4.17 |
A Annualized expense ratio reflects expenses net of applicable fee waivers.
B Expenses are equal to each Class' annualized expense ratio, multiplied by the average account value over the period, multiplied by 182/366 (to reflect the one-half year period).
C 5% return per year before expenses
![]()
AIGF-SANN-0616
1.853352.108
Fidelity Advisor® International Value Fund - Semi-Annual Report April 30, 2016 Class I is a class of Fidelity® International Value Fund |
|
Contents
To view a fund's proxy voting guidelines and proxy voting record for the 12-month period ended June 30, visit http://www.fidelity.com/proxyvotingresults or visit the Securities and Exchange Commission's (SEC) web site at http://www.sec.gov.
You may also call 1-877-208-0098 to request a free copy of the proxy voting guidelines.
Standard & Poor's, S&P and S&P 500 are registered service marks of The McGraw-Hill Companies, Inc. and have been licensed for use by Fidelity Distributors Corporation.
Other third-party marks appearing herein are the property of their respective owners.
All other marks appearing herein are registered or unregistered trademarks or service marks of FMR LLC or an affiliated company. © 2016 FMR LLC. All rights reserved.
This report and the financial statements contained herein are submitted for the general information of the shareholders of the Fund. This report is not authorized for distribution to prospective investors in the Fund unless preceded or accompanied by an effective prospectus.
A fund files its complete schedule of portfolio holdings with the SEC for the first and third quarters of each fiscal year on Form N-Q. Forms N-Q are available on the SEC’s web site at http://www.sec.gov. A fund's Forms N-Q may be reviewed and copied at the SEC’s Public Reference Room in Washington, DC. Information regarding the operation of the SEC's Public Reference Room may be obtained by calling 1-800-SEC-0330.
For a complete list of a fund's portfolio holdings, view the most recent holdings listing, semiannual report, or annual report on Fidelity's web site at http://www.fidelity.com, http://www.advisor.fidelity.com, or http://www.401k.com, as applicable.
NOT FDIC INSURED •MAY LOSE VALUE •NO BANK GUARANTEE
Neither the Fund nor Fidelity Distributors Corporation is a bank.
Investment Summary (Unaudited)
Geographic Diversification (% of fund's net assets)
| As of April 30, 2016 | ||
| United Kingdom | 20.6% | |
| Japan | 19.6% | |
| France | 17.9% | |
| Switzerland | 7.9% | |
| United States of America* | 6.5% | |
| Germany | 6.0% | |
| Netherlands | 3.7% | |
| Australia | 3.7% | |
| Italy | 3.1% | |
| Other | 11.0% | |
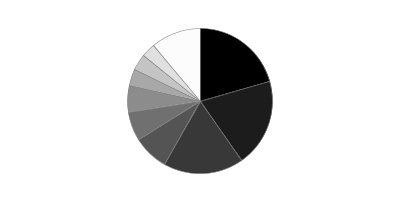
* Includes Short-Term investments and Net Other Assets (Liabilities).
Percentages are based on country or territory of incorporation and are adjusted for the effect of futures contracts, if applicable.
| As of October 31, 2015 | ||
| United Kingdom | 23.5% | |
| Japan | 20.6% | |
| France | 16.3% | |
| Switzerland | 8.2% | |
| United States of America* | 6.0% | |
| Germany | 5.5% | |
| Netherlands | 3.7% | |
| Australia | 2.9% | |
| Spain | 2.0% | |
| Other | 11.3% | |
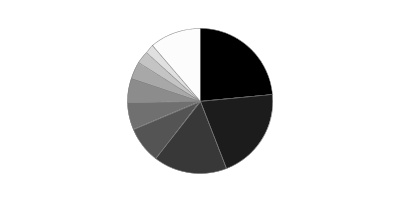
* Includes Short-Term investments and Net Other Assets (Liabilities).
Percentages are based on country or territory of incorporation and are adjusted for the effect of futures contracts, if applicable.
Asset Allocation as of April 30, 2016
| % of fund's net assets | % of fund's net assets 6 months ago | |
| Stocks | 98.8 | 97.6 |
| Short-Term Investments and Net Other Assets (Liabilities) | 1.2 | 2.4 |
Top Ten Stocks as of April 30, 2016
| % of fund's net assets | % of fund's net assets 6 months ago | |
| Total SA (France, Oil, Gas & Consumable Fuels) | 3.5 | 3.1 |
| Westpac Banking Corp. (Australia, Banks) | 2.2 | 1.5 |
| Toyota Motor Corp. (Japan, Automobiles) | 2.2 | 2.4 |
| Nestle SA (Switzerland, Food Products) | 2.2 | 2.7 |
| Sanofi SA (France, Pharmaceuticals) | 2.1 | 2.6 |
| Rio Tinto PLC (United Kingdom, Metals & Mining) | 2.0 | 1.6 |
| Vodafone Group PLC sponsored ADR (United Kingdom, Wireless Telecommunication Services) | 1.9 | 1.8 |
| Imperial Tobacco Group PLC (United Kingdom, Tobacco) | 1.8 | 1.8 |
| Novartis AG (Switzerland, Pharmaceuticals) | 1.8 | 2.6 |
| BASF AG (Germany, Chemicals) | 1.7 | 1.7 |
| 21.4 |
Market Sectors as of April 30, 2016
| % of fund's net assets | % of fund's net assets 6 months ago | |
| Financials | 24.3 | 26.3 |
| Consumer Discretionary | 13.8 | 14.4 |
| Health Care | 13.6 | 16.0 |
| Consumer Staples | 9.3 | 9.3 |
| Industrials | 8.8 | 8.0 |
| Energy | 8.2 | 6.7 |
| Telecommunication Services | 6.8 | 6.1 |
| Materials | 5.8 | 4.1 |
| Information Technology | 4.4 | 3.6 |
| Utilities | 3.8 | 3.1 |
Investments April 30, 2016 (Unaudited)
Showing Percentage of Net Assets
| Common Stocks - 98.4% | |||
| Shares | Value | ||
| Australia - 3.7% | |||
| Ansell Ltd. (a) | 101,524 | $1,538,472 | |
| Macquarie Group Ltd. | 27,058 | 1,306,420 | |
| Transurban Group unit | 216,635 | 1,907,439 | |
| Westpac Banking Corp. (b) | 315,896 | 7,415,205 | |
| TOTAL AUSTRALIA | 12,167,536 | ||
| Bailiwick of Jersey - 0.7% | |||
| Wolseley PLC | 43,009 | 2,409,023 | |
| Belgium - 0.5% | |||
| Anheuser-Busch InBev SA NV | 13,670 | 1,692,071 | |
| Canada - 1.1% | |||
| Imperial Oil Ltd. | 70,500 | 2,338,013 | |
| Potash Corp. of Saskatchewan, Inc. | 62,500 | 1,105,842 | |
| TOTAL CANADA | 3,443,855 | ||
| Finland - 1.1% | |||
| Sampo Oyj (A Shares) | 80,434 | 3,511,809 | |
| France - 17.9% | |||
| Atos Origin SA | 46,498 | 4,138,632 | |
| AXA SA (b) | 220,121 | 5,557,967 | |
| Bouygues SA (b) | 34,935 | 1,164,868 | |
| Capgemini SA | 45,493 | 4,247,041 | |
| Havas SA | 237,066 | 1,983,774 | |
| Orange SA | 172,900 | 2,872,549 | |
| Renault SA | 28,345 | 2,735,429 | |
| Sanofi SA | 85,210 | 7,023,567 | |
| Societe Generale Series A | 89,900 | 3,537,311 | |
| SR Teleperformance SA | 16,600 | 1,490,214 | |
| Total SA | 224,102 | 11,326,284 | |
| Unibail-Rodamco | 14,600 | 3,911,949 | |
| VINCI SA (b) | 70,100 | 5,236,685 | |
| Vivendi SA | 164,892 | 3,167,628 | |
| TOTAL FRANCE | 58,393,898 | ||
| Germany - 5.6% | |||
| Axel Springer Verlag AG | 26,500 | 1,479,565 | |
| BASF AG | 69,079 | 5,706,986 | |
| Bayer AG | 16,503 | 1,903,849 | |
| Continental AG | 6,766 | 1,485,953 | |
| Fresenius SE & Co. KGaA | 53,300 | 3,876,700 | |
| GEA Group AG | 32,955 | 1,527,895 | |
| SAP AG | 30,421 | 2,386,864 | |
| TOTAL GERMANY | 18,367,812 | ||
| Hong Kong - 0.7% | |||
| Power Assets Holdings Ltd. | 250,500 | 2,383,280 | |
| Ireland - 1.2% | |||
| Allergan PLC (a) | 6,180 | 1,338,341 | |
| Medtronic PLC | 30,700 | 2,429,905 | |
| TOTAL IRELAND | 3,768,246 | ||
| Israel - 1.4% | |||
| Teva Pharmaceutical Industries Ltd. sponsored ADR | 85,999 | 4,682,646 | |
| Italy - 3.1% | |||
| Eni SpA | 273,600 | 4,469,784 | |
| Intesa Sanpaolo SpA | 843,500 | 2,344,762 | |
| Mediaset SpA | 344,400 | 1,549,816 | |
| Telecom Italia SpA (a) | 1,809,900 | 1,767,320 | |
| TOTAL ITALY | 10,131,682 | ||
| Japan - 19.6% | |||
| Astellas Pharma, Inc. | 237,700 | 3,204,813 | |
| Dentsu, Inc. | 63,000 | 3,200,968 | |
| East Japan Railway Co. | 24,000 | 2,111,426 | |
| Hoya Corp. | 85,000 | 3,255,013 | |
| Itochu Corp. | 242,900 | 3,086,920 | |
| Japan Tobacco, Inc. | 91,900 | 3,754,845 | |
| KDDI Corp. | 143,200 | 4,124,981 | |
| Makita Corp. | 36,100 | 2,277,311 | |
| Mitsubishi UFJ Financial Group, Inc. | 1,037,200 | 4,786,487 | |
| Nippon Prologis REIT, Inc. (c) | 681 | 1,632,928 | |
| Nippon Telegraph & Telephone Corp. | 121,600 | 5,441,640 | |
| OBIC Co. Ltd. | 37,600 | 1,976,291 | |
| Olympus Corp. | 70,900 | 2,762,025 | |
| ORIX Corp. | 206,700 | 2,923,758 | |
| Seven & i Holdings Co. Ltd. | 67,400 | 2,750,084 | |
| Seven Bank Ltd. | 497,900 | 2,115,681 | |
| Sony Corp. | 88,500 | 2,143,614 | |
| Sony Financial Holdings, Inc. | 127,800 | 1,579,983 | |
| Sumitomo Mitsui Financial Group, Inc. | 123,900 | 3,728,364 | |
| Toyota Motor Corp. | 144,000 | 7,299,324 | |
| TOTAL JAPAN | 64,156,456 | ||
| Luxembourg - 0.5% | |||
| RTL Group SA | 19,239 | 1,598,910 | |
| Netherlands - 3.7% | |||
| ING Groep NV (Certificaten Van Aandelen) | 327,390 | 4,009,319 | |
| Koninklijke KPN NV | 425,668 | 1,672,729 | |
| Mylan N.V. | 28,600 | 1,192,906 | |
| PostNL NV (a) | 92,431 | 404,302 | |
| RELX NV | 292,810 | 4,913,559 | |
| TOTAL NETHERLANDS | 12,192,815 | ||
| Spain - 2.2% | |||
| Iberdrola SA | 738,976 | 5,260,579 | |
| Mediaset Espana Comunicacion SA | 146,500 | 1,902,283 | |
| TOTAL SPAIN | 7,162,862 | ||
| Sweden - 1.6% | |||
| Nordea Bank AB | 395,200 | 3,836,129 | |
| Sandvik AB (b) | 137,100 | 1,406,775 | |
| TOTAL SWEDEN | 5,242,904 | ||
| Switzerland - 7.9% | |||
| Credit Suisse Group AG | 139,828 | 2,127,967 | |
| Lafargeholcim Ltd. (Reg.) | 38,610 | 1,954,850 | |
| Nestle SA | 97,429 | 7,272,070 | |
| Novartis AG | 76,736 | 5,839,783 | |
| Syngenta AG (Switzerland) | 9,247 | 3,701,499 | |
| UBS Group AG | 64,958 | 1,121,825 | |
| Zurich Insurance Group AG | 16,404 | 3,680,801 | |
| TOTAL SWITZERLAND | 25,698,795 | ||
| United Kingdom - 20.6% | |||
| AstraZeneca PLC (United Kingdom) | 90,857 | 5,212,701 | |
| Aviva PLC | 465,420 | 2,948,663 | |
| BAE Systems PLC | 384,029 | 2,679,239 | |
| Barclays PLC | 1,179,880 | 2,962,394 | |
| Bunzl PLC | 122,364 | 3,645,572 | |
| Compass Group PLC | 209,239 | 3,726,209 | |
| HSBC Holdings PLC sponsored ADR (b) | 155,871 | 5,195,180 | |
| Imperial Tobacco Group PLC | 110,738 | 6,016,713 | |
| Informa PLC | 303,133 | 2,898,930 | |
| ITV PLC | 1,071,296 | 3,525,110 | |
| Lloyds Banking Group PLC | 5,108,500 | 5,014,049 | |
| Micro Focus International PLC | 70,200 | 1,568,337 | |
| National Grid PLC | 336,150 | 4,796,392 | |
| Prudential PLC | 73,355 | 1,447,994 | |
| Rio Tinto PLC | 198,126 | 6,646,394 | |
| Royal Dutch Shell PLC Class B (United Kingdom) | 113,561 | 2,981,529 | |
| Vodafone Group PLC sponsored ADR | 185,558 | 6,075,169 | |
| TOTAL UNITED KINGDOM | 67,340,575 | ||
| United States of America - 5.3% | |||
| Altria Group, Inc. | 31,400 | 1,969,094 | |
| Chevron Corp. | 25,900 | 2,646,462 | |
| ConocoPhillips Co. | 63,100 | 3,015,549 | |
| Constellation Brands, Inc. Class A (sub. vtg.) | 24,100 | 3,761,046 | |
| Edgewell Personal Care Co. (a) | 15,600 | 1,280,292 | |
| McGraw Hill Financial, Inc. | 24,100 | 2,575,085 | |
| Molson Coors Brewing Co. Class B | 19,900 | 1,903,037 | |
| TOTAL UNITED STATES OF AMERICA | 17,150,565 | ||
| TOTAL COMMON STOCKS | |||
| (Cost $335,758,650) | 321,495,740 | ||
| Nonconvertible Preferred Stocks - 0.4% | |||
| Germany - 0.4% | |||
| Volkswagen AG | |||
| (Cost $1,940,159) | 8,731 | 1,264,175 | |
| Money Market Funds - 5.5% | |||
| Fidelity Cash Central Fund, 0.38% (d) | 2,939,485 | 2,939,485 | |
| Fidelity Securities Lending Cash Central Fund, 0.42% (d)(e) | 15,029,266 | 15,029,266 | |
| TOTAL MONEY MARKET FUNDS | |||
| (Cost $17,968,751) | 17,968,751 | ||
| TOTAL INVESTMENT PORTFOLIO - 104.3% | |||
| (Cost $355,667,560) | 340,728,666 | ||
| NET OTHER ASSETS (LIABILITIES) - (4.3)% | (13,926,556) | ||
| NET ASSETS - 100% | $326,802,110 |
Categorizations in the Schedule of Investments are based on country or territory of incorporation.
Legend
(a) Non-income producing
(b) Security or a portion of the security is on loan at period end.
(c) Security or a portion of the security purchased on a delayed delivery or when-issued basis. Interest rate to be determined at settlement date.
(d) Affiliated fund that is generally available only to investment companies and other accounts managed by Fidelity Investments. The rate quoted is the annualized seven-day yield of the fund at period end. A complete unaudited listing of the fund's holdings as of its most recent quarter end is available upon request. In addition, each Fidelity Central Fund's financial statements are available on the SEC's website or upon request.
(e) Investment made with cash collateral received from securities on loan.
Affiliated Central Funds
Information regarding fiscal year to date income earned by the Fund from investments in Fidelity Central Funds is as follows:
| Fund | Income earned |
| Fidelity Cash Central Fund | $6,324 |
| Fidelity Securities Lending Cash Central Fund | 137,227 |
| Total | $143,551 |
Investment Valuation
The following is a summary of the inputs used, as of April 30, 2016, involving the Fund's assets and liabilities carried at fair value. The inputs or methodology used for valuing securities may not be an indication of the risk associated with investing in those securities. For more information on valuation inputs, and their aggregation into the levels used below, please refer to the Investment Valuation section in the accompanying Notes to Financial Statements.
| Valuation Inputs at Reporting Date: | ||||
| Description | Total | Level 1 | Level 2 | Level 3 |
| Investments in Securities: | ||||
| Equities: | ||||
| Consumer Discretionary | $44,875,247 | $25,337,504 | $19,537,743 | $-- |
| Consumer Staples | 30,399,252 | 16,622,253 | 13,776,999 | -- |
| Energy | 26,777,621 | 8,000,024 | 18,777,597 | -- |
| Financials | 79,272,030 | 25,467,716 | 53,804,314 | -- |
| Health Care | 44,260,721 | 16,962,819 | 27,297,902 | -- |
| Industrials | 29,347,669 | 16,783,750 | 12,563,919 | -- |
| Information Technology | 14,317,165 | 5,815,378 | 8,501,787 | -- |
| Materials | 19,115,571 | 12,469,177 | 6,646,394 | -- |
| Telecommunication Services | 21,954,388 | 6,075,169 | 15,879,219 | -- |
| Utilities | 12,440,251 | -- | 12,440,251 | -- |
| Money Market Funds | 17,968,751 | 17,968,751 | -- | -- |
| Total Investments in Securities: | $340,728,666 | $151,502,541 | $189,226,125 | $-- |
The following is a summary of transfers between Level 1 and Level 2 for the period ended April 30, 2016. Transfers are assumed to have occurred at the beginning of the period, and are primarily attributable to the valuation techniques used for foreign equity securities, as discussed in the accompanying Notes to Financial Statements:
| Transfers | Total |
| Level 1 to Level 2 | $9,505,293 |
| Level 2 to Level 1 | $16,220,609 |
See accompanying notes which are an integral part of the financial statements.
Financial Statements
Statement of Assets and Liabilities
| April 30, 2016 (Unaudited) | ||
| Assets | ||
| Investment in securities, at value (including securities loaned of $14,114,361) — See accompanying schedule: Unaffiliated issuers (cost $337,698,809) | $322,759,915 | |
| Fidelity Central Funds (cost $17,968,751) | 17,968,751 | |
| Total Investments (cost $355,667,560) | $340,728,666 | |
| Foreign currency held at value (cost $60,596) | 59,602 | |
| Receivable for investments sold | 406,523 | |
| Receivable for fund shares sold | 71,546 | |
| Dividends receivable | 2,263,594 | |
| Distributions receivable from Fidelity Central Funds | 50,580 | |
| Prepaid expenses | 155 | |
| Receivable from investment adviser for expense reductions | 525 | |
| Other receivables | 2,134 | |
| Total assets | 343,583,325 | |
| Liabilities | ||
| Payable for investments purchased | ||
| Regular delivery | $734,074 | |
| Delayed delivery | 88,039 | |
| Payable for fund shares redeemed | 628,459 | |
| Accrued management fee | 192,067 | |
| Distribution and service plan fees payable | 7,207 | |
| Other affiliated payables | 59,645 | |
| Other payables and accrued expenses | 42,458 | |
| Collateral on securities loaned, at value | 15,029,266 | |
| Total liabilities | 16,781,215 | |
| Net Assets | $326,802,110 | |
| Net Assets consist of: | ||
| Paid in capital | $445,477,213 | |
| Undistributed net investment income | 3,722,812 | |
| Accumulated undistributed net realized gain (loss) on investments and foreign currency transactions | (107,513,209) | |
| Net unrealized appreciation (depreciation) on investments and assets and liabilities in foreign currencies | (14,884,706) | |
| Net Assets | $326,802,110 | |
| Calculation of Maximum Offering Price | ||
| Class A: | ||
| Net Asset Value and redemption price per share ($8,316,805 ÷ 1,059,524 shares) | $7.85 | |
| Maximum offering price per share (100/94.25 of $7.85) | $8.33 | |
| Class T: | ||
| Net Asset Value and redemption price per share ($4,007,441 ÷ 510,734 shares) | $7.85 | |
| Maximum offering price per share (100/96.50 of $7.85) | $8.13 | |
| Class B: | ||
| Net Asset Value and offering price per share ($185,710 ÷ 23,320 shares)(a) | $7.96 | |
| Class C: | ||
| Net Asset Value and offering price per share ($4,412,832 ÷ 562,495 shares)(a) | $7.85 | |
| International Value: | ||
| Net Asset Value, offering price and redemption price per share ($307,974,481 ÷ 39,244,446 shares) | $7.85 | |
| Class I: | ||
| Net Asset Value, offering price and redemption price per share ($1,904,841 ÷ 242,277 shares) | $7.86 |
(a) Redemption price per share is equal to net asset value less any applicable contingent deferred sales charge.
See accompanying notes which are an integral part of the financial statements.
Statement of Operations
| Six months ended April 30, 2016 (Unaudited) | ||
| Investment Income | ||
| Dividends | $6,260,678 | |
| Income from Fidelity Central Funds | 143,551 | |
| Income before foreign taxes withheld | 6,404,229 | |
| Less foreign taxes withheld | (490,131) | |
| Total income | 5,914,098 | |
| Expenses | ||
| Management fee | ||
| Basic fee | $1,070,146 | |
| Performance adjustment | 83,742 | |
| Transfer agent fees | 269,737 | |
| Distribution and service plan fees | 43,317 | |
| Accounting and security lending fees | 79,749 | |
| Custodian fees and expenses | 39,497 | |
| Independent trustees' compensation | 642 | |
| Registration fees | 74,413 | |
| Audit | 33,078 | |
| Legal | 304 | |
| Miscellaneous | 750 | |
| Total expenses before reductions | 1,695,375 | |
| Expense reductions | (5,259) | 1,690,116 |
| Net investment income (loss) | 4,223,982 | |
| Realized and Unrealized Gain (Loss) | ||
| Net realized gain (loss) on: | ||
| Investment securities: | ||
| Unaffiliated issuers | (1,140,494) | |
| Foreign currency transactions | 130,172 | |
| Total net realized gain (loss) | (1,010,322) | |
| Change in net unrealized appreciation (depreciation) on: Investment securities | (14,207,322) | |
| Assets and liabilities in foreign currencies | 7,902 | |
| Total change in net unrealized appreciation (depreciation) | (14,199,420) | |
| Net gain (loss) | (15,209,742) | |
| Net increase (decrease) in net assets resulting from operations | $(10,985,760) |
See accompanying notes which are an integral part of the financial statements.
Statement of Changes in Net Assets
| Six months ended April 30, 2016 (Unaudited) | Year ended October 31, 2015 | |
| Increase (Decrease) in Net Assets | ||
| Operations | ||
| Net investment income (loss) | $4,223,982 | $4,113,357 |
| Net realized gain (loss) | (1,010,322) | (2,475,305) |
| Change in net unrealized appreciation (depreciation) | (14,199,420) | (2,310,957) |
| Net increase (decrease) in net assets resulting from operations | (10,985,760) | (672,905) |
| Distributions to shareholders from net investment income | (4,084,383) | (7,553,931) |
| Share transactions - net increase (decrease) | 54,490,310 | 87,547,372 |
| Redemption fees | 433 | 863 |
| Total increase (decrease) in net assets | 39,420,600 | 79,321,399 |
| Net Assets | ||
| Beginning of period | 287,381,510 | 208,060,111 |
| End of period (including undistributed net investment income of $3,722,812 and undistributed net investment income of $3,583,213, respectively) | $326,802,110 | $287,381,510 |
See accompanying notes which are an integral part of the financial statements.
Financial Highlights — Fidelity International Value Fund Class A
| Six months ended (Unaudited) April 30, | Years ended October 31, | |||||
| 2016 | 2015 | 2014 | 2013 | 2012 | 2011 | |
| Selected Per–Share Data | ||||||
| Net asset value, beginning of period | $8.27 | $8.62 | $8.96 | $7.39 | $7.02 | $8.22 |
| Income from Investment Operations | ||||||
| Net investment income (loss)A | .09 | .13 | .31B | .17 | .20 | .22 |
| Net realized and unrealized gain (loss) | (.42) | (.20) | (.47) | 1.64 | .39 | (1.19) |
| Total from investment operations | (.33) | (.07) | (.16) | 1.81 | .59 | (.97) |
| Distributions from net investment income | (.09) | (.28) | (.17) | (.20) | (.22) | (.19) |
| Distributions from net realized gain | – | – | (.01) | (.04) | – | (.03) |
| Total distributions | (.09) | (.28) | (.18) | (.24) | (.22) | (.23)C |
| Redemption fees added to paid in capitalA,D | – | – | – | – | – | – |
| Net asset value, end of period | $7.85 | $8.27 | $8.62 | $8.96 | $7.39 | $7.02 |
| Total ReturnE,F,G | (4.05)% | (.81)% | (1.76)% | 25.24% | 8.82% | (12.19)% |
| Ratios to Average Net AssetsH,I | ||||||
| Expenses before reductions | 1.43%J | 1.37% | 1.32% | 1.39% | 1.44% | 1.36% |
| Expenses net of fee waivers, if any | 1.43%J | 1.37% | 1.32% | 1.39% | 1.44% | 1.36% |
| Expenses net of all reductions | 1.43%J | 1.36% | 1.32% | 1.36% | 1.41% | 1.34% |
| Net investment income (loss) | 2.44%J | 1.58% | 3.44%B | 2.08% | 2.85% | 2.79% |
| Supplemental Data | ||||||
| Net assets, end of period (000 omitted) | $8,317 | $8,956 | $6,296 | $6,191 | $4,491 | $4,668 |
| Portfolio turnover rateK | 26%J | 44% | 69% | 79% | 74% | 83% |
A Calculated based on average shares outstanding during the period.
B Net Investment income per share reflects a large, non-recurring dividend which amounted to $.14 per share. Excluding this non-recurring dividend, the ratio of net investment income (loss) to average net assets would have been 1.90%.
C Total distributions of $.23 per share is comprised of distributions from net investment income of $.191 and distributions from net realized gain of $.034 per share.
D Amount represents less than $.005 per share.
E Total returns for periods of less than one year are not annualized.
F Total returns would have been lower if certain expenses had not been reduced during the applicable periods shown.
G Total returns do not include the effect of the sales charges.
H Fees and expenses of any underlying Fidelity Central Funds are not included in the Fund's expense ratio. The Fund indirectly bears its proportionate share of the expenses of any underlying Fidelity Central Funds.
I Expense ratios reflect operating expenses of the class. Expenses before reductions do not reflect amounts reimbursed by the investment adviser or reductions from brokerage service arrangements or reductions from other expense offset arrangements and do not represent the amount paid by the class during periods when reimbursements or reductions occur. Expenses net of fee waivers reflect expenses after reimbursement by the investment adviser but prior to reductions from brokerage service arrangements or other expense offset arrangements. Expenses net of all reductions represent the net expenses paid by the class.
J Annualized
K Amount does not include the portfolio activity of any underlying Fidelity Central Funds.
See accompanying notes which are an integral part of the financial statements.
Financial Highlights — Fidelity International Value Fund Class T
| Six months ended (Unaudited) April 30, | Years ended October 31, | |||||
| 2016 | 2015 | 2014 | 2013 | 2012 | 2011 | |
| Selected Per–Share Data | ||||||
| Net asset value, beginning of period | $8.25 | $8.60 | $8.94 | $7.38 | $7.00 | $8.20 |
| Income from Investment Operations | ||||||
| Net investment income (loss)A | .08 | .11 | .28B | .15 | .18 | .20 |
| Net realized and unrealized gain (loss) | (.42) | (.20) | (.46) | 1.64 | .40 | (1.19) |
| Total from investment operations | (.34) | (.09) | (.18) | 1.79 | .58 | (.99) |
| Distributions from net investment income | (.06) | (.26) | (.15) | (.19) | (.20) | (.17) |
| Distributions from net realized gain | – | – | (.01) | (.04) | – | (.03) |
| Total distributions | (.06) | (.26) | (.16) | (.23) | (.20) | (.21)C |
| Redemption fees added to paid in capitalA,D | – | – | – | – | – | – |
| Net asset value, end of period | $7.85 | $8.25 | $8.60 | $8.94 | $7.38 | $7.00 |
| Total ReturnE,F,G | (4.14)% | (1.09)% | (1.99)% | 24.86% | 8.60% | (12.42)% |
| Ratios to Average Net AssetsH,I | ||||||
| Expenses before reductions | 1.73%J | 1.66% | 1.59% | 1.66% | 1.71% | 1.63% |
| Expenses net of fee waivers, if any | 1.70%J | 1.66% | 1.59% | 1.65% | 1.70% | 1.62% |
| Expenses net of all reductions | 1.70%J | 1.65% | 1.59% | 1.63% | 1.67% | 1.60% |
| Net investment income (loss) | 2.17%J | 1.29% | 3.17%B | 1.81% | 2.58% | 2.52% |
| Supplemental Data | ||||||
| Net assets, end of period (000 omitted) | $4,007 | $4,086 | $3,604 | $3,758 | $2,693 | $2,468 |
| Portfolio turnover rateK | 26 %J | 44% | 69% | 79% | 74% | 83% |
A Calculated based on average shares outstanding during the period.
B Net Investment income per share reflects a large, non-recurring dividend which amounted to $.14 per share. Excluding this non-recurring dividends, the ratio of net investment income (loss) to average net assets would have been 1.64%.
C Total distributions of $.21 per share is comprised of distributions from net investment income of $.173 and distributions from net realized gain of $.034 per share.
D Amount represents less than $.005 per share.
E Total returns for periods of less than one year are not annualized.
F Total returns would have been lower if certain expenses had not been reduced during the applicable periods shown.
G Total returns do not include the effect of the sales charges.
H Fees and expenses of any underlying Fidelity Central Funds are not included in the Fund's expense ratio. The Fund indirectly bears its proportionate share of the expenses of any underlying Fidelity Central Funds.
I Expense ratios reflect operating expenses of the class. Expenses before reductions do not reflect amounts reimbursed by the investment adviser or reductions from brokerage service arrangements or reductions from other expense offset arrangements and do not represent the amount paid by the class during periods when reimbursements or reductions occur. Expenses net of fee waivers reflect expenses after reimbursement by the investment adviser but prior to reductions from brokerage service arrangements or other expense offset arrangements. Expenses net of all reductions represent the net expenses paid by the class.
J Annualized
K Amount does not include the portfolio activity of any underlying Fidelity Central Funds.
See accompanying notes which are an integral part of the financial statements.
Financial Highlights — Fidelity International Value Fund Class B
| Six months ended (Unaudited) April 30, | Years ended October 31, | |||||
| 2016 | 2015 | 2014 | 2013 | 2012 | 2011 | |
| Selected Per–Share Data | ||||||
| Net asset value, beginning of period | $8.34 | $8.66 | $8.98 | $7.39 | $7.00 | $8.20 |
| Income from Investment Operations | ||||||
| Net investment income (loss)A | .07 | .07 | .24B | .11 | .14 | .17 |
| Net realized and unrealized gain (loss) | (.45) | (.21) | (.45) | 1.65 | .41 | (1.20) |
| Total from investment operations | (.38) | (.14) | (.21) | 1.76 | .55 | (1.03) |
| Distributions from net investment income | –C | (.18) | (.09) | (.13) | (.16) | (.13) |
| Distributions from net realized gain | – | – | (.01) | (.04) | – | (.03) |
| Total distributions | –C | (.18) | (.11)D | (.17) | (.16) | (.17)E |
| Redemption fees added to paid in capitalA,C | – | – | – | – | – | – |
| Net asset value, end of period | $7.96 | $8.34 | $8.66 | $8.98 | $7.39 | $7.00 |
| Total ReturnF,G,H | (4.51)% | (1.64)% | (2.39)% | 24.30% | 8.07% | (12.88)% |
| Ratios to Average Net AssetsI,J | ||||||
| Expenses before reductions | 2.21%K | 2.15% | 2.08% | 2.14% | 2.19% | 2.11% |
| Expenses net of fee waivers, if any | 2.20%K | 2.15% | 2.08% | 2.14% | 2.19% | 2.11% |
| Expenses net of all reductions | 2.20%K | 2.14% | 2.08% | 2.11% | 2.16% | 2.09% |
| Net investment income (loss) | 1.66%K | .81% | 2.68%B | 1.32% | 2.09% | 2.04% |
| Supplemental Data | ||||||
| Net assets, end of period (000 omitted) | $186 | $302 | $414 | $678 | $691 | $901 |
| Portfolio turnover rateL | 26%K | 44% | 69% | 79% | 74% | 83% |
A Calculated based on average shares outstanding during the period.
B Net Investment income per share reflects a large, non-recurring dividend which amounted to $.14 per share. Excluding this non-recurring dividend, the ratio of net investment income (loss) to average net assets would have been 1.15%.
C Amount represents less than $.005 per share.
D Total distributions of $.11 per share is comprised of distributions from net investment income of $.093 and distributions from net realized gain of $.014 per share.
E Total distributions of $.17 per share is comprised of distributions from net investment income of $.131 and distributions from net realized gain of $.034 per share.
F Total returns for periods of less than one year are not annualized.
G Total returns would have been lower if certain expenses had not been reduced during the applicable periods shown.
H Total returns do not include the effect of the contingent deferred sales charge.
I Fees and expenses of any underlying Fidelity Central Funds are not included in the Fund's expense ratio. The Fund indirectly bears its proportionate share of the expenses of any underlying Fidelity Central Funds.
J Expense ratios reflect operating expenses of the class. Expenses before reductions do not reflect amounts reimbursed by the investment adviser or reductions from brokerage service arrangements or reductions from other expense offset arrangements and do not represent the amount paid by the class during periods when reimbursements or reductions occur. Expenses net of fee waivers reflect expenses after reimbursement by the investment adviser but prior to reductions from brokerage service arrangements or other expense offset arrangements. Expenses net of all reductions represent the net expenses paid by the class.
K Annualized
L Amount does not include the portfolio activity of any underlying Fidelity Central Funds.
See accompanying notes which are an integral part of the financial statements.
Financial Highlights — Fidelity International Value Fund Class C
| Six months ended (Unaudited) April 30, | Years ended October 31, | |||||
| 2016 | 2015 | 2014 | 2013 | 2012 | 2011 | |
| Selected Per–Share Data | ||||||
| Net asset value, beginning of period | $8.23 | $8.59 | $8.93 | $7.38 | $7.00 | $8.20 |
| Income from Investment Operations | ||||||
| Net investment income (loss)A | .06 | .07 | .24B | .11 | .14 | .16 |
| Net realized and unrealized gain (loss) | (.42) | (.20) | (.45) | 1.63 | .41 | (1.19) |
| Total from investment operations | (.36) | (.13) | (.21) | 1.74 | .55 | (1.03) |
| Distributions from net investment income | (.02) | (.23) | (.11) | (.15) | (.17) | (.14) |
| Distributions from net realized gain | – | – | (.01) | (.04) | – | (.03) |
| Total distributions | (.02) | (.23) | (.13)C | (.19) | (.17) | (.17) |
| Redemption fees added to paid in capitalA,D | – | – | – | – | – | – |
| Net asset value, end of period | $7.85 | $8.23 | $8.59 | $8.93 | $7.38 | $7.00 |
| Total ReturnE,F,G | (4.40)% | (1.58)% | (2.43)% | 24.17% | 8.12% | (12.84)% |
| Ratios to Average Net AssetsH,I | ||||||
| Expenses before reductions | 2.21%J | 2.15% | 2.07% | 2.14% | 2.19% | 2.12% |
| Expenses net of fee waivers, if any | 2.20%J | 2.14% | 2.07% | 2.14% | 2.19% | 2.11% |
| Expenses net of all reductions | 2.20%J | 2.14% | 2.07% | 2.11% | 2.16% | 2.09% |
| Net investment income (loss) | 1.67%J | .81% | 2.69%B | 1.33% | 2.09% | 2.04% |
| Supplemental Data | ||||||
| Net assets, end of period (000 omitted) | $4,413 | $4,502 | $3,647 | $3,231 | $2,249 | $2,108 |
| Portfolio turnover rateK | 26%J | 44% | 69% | 79% | 74% | 83% |
A Calculated based on average shares outstanding during the period.
B Net Investment income per share reflects a large, non-recurring dividend which amounted to $.14 per share. Excluding this non-recurring dividend, the ratio of net investment income (loss) to average net assets would have been 1.15%.
C Total distributions of $.13 per share is comprised of distributions from net investment income of $.111 and distributions from net realized gain of $.014 per share.
D Amount represents less than $.005 per share.
E Total returns for periods of less than one year are not annualized.
F Total returns would have been lower if certain expenses had not been reduced during the applicable periods shown.
G Total returns do not include the effect of the contingent deferred sales charge.
H Fees and expenses of any underlying Fidelity Central Funds are not included in the Fund's expense ratio. The Fund indirectly bears its proportionate share of the expenses of any underlying Fidelity Central Funds.
I Expense ratios reflect operating expenses of the class. Expenses before reductions do not reflect amounts reimbursed by the investment adviser or reductions from brokerage service arrangements or reductions from other expense offset arrangements and do not represent the amount paid by the class during periods when reimbursements or reductions occur. Expenses net of fee waivers reflect expenses after reimbursement by the investment adviser but prior to reductions from brokerage service arrangements or other expense offset arrangements. Expenses net of all reductions represent the net expenses paid by the class.
J Annualized
K Amount does not include the portfolio activity of any underlying Fidelity Central Funds.
See accompanying notes which are an integral part of the financial statements.
Financial Highlights — Fidelity International Value Fund
| Six months ended (Unaudited) April 30, | Years ended October 31, | |||||
| 2016 | 2015 | 2014 | 2013 | 2012 | 2011 | |
| Selected Per–Share Data | ||||||
| Net asset value, beginning of period | $8.29 | $8.64 | $8.97 | $7.40 | $7.03 | $8.23 |
| Income from Investment Operations | ||||||
| Net investment income (loss)A | .11 | .16 | .34B | .19 | .22 | .25 |
| Net realized and unrealized gain (loss) | (.43) | (.19) | (.46) | 1.65 | .40 | (1.20) |
| Total from investment operations | (.32) | (.03) | (.12) | 1.84 | .62 | (.95) |
| Distributions from net investment income | (.12) | (.32) | (.20) | (.22) | (.25) | (.22) |
| Distributions from net realized gain | – | – | (.01) | (.04) | – | (.03) |
| Total distributions | (.12) | (.32) | (.21) | (.27)C | (.25) | (.25) |
| Redemption fees added to paid in capitalA,D | – | – | – | – | – | – |
| Net asset value, end of period | $7.85 | $8.29 | $8.64 | $8.97 | $7.40 | $7.03 |
| Total ReturnE,F | (3.96)% | (.41)% | (1.34)% | 25.57% | 9.19% | (11.91)% |
| Ratios to Average Net AssetsG,H | ||||||
| Expenses before reductions | 1.07%I | 1.02% | .96% | 1.05% | 1.13% | 1.04% |
| Expenses net of fee waivers, if any | 1.07%I | 1.02% | .96% | 1.05% | 1.13% | 1.03% |
| Expenses net of all reductions | 1.07%I | 1.01% | .95% | 1.02% | 1.10% | 1.01% |
| Net investment income (loss) | 2.79%I | 1.93% | 3.80%B | 2.41% | 3.16% | 3.11% |
| Supplemental Data | ||||||
| Net assets, end of period (000 omitted) | $307,974 | $267,567 | $192,789 | $181,568 | $128,983 | $150,967 |
| Portfolio turnover rateJ | 26%I | 44% | 69% | 79% | 74% | 83% |
A Calculated based on average shares outstanding during the period.
B Net Investment income per share reflects a large, non-recurring dividend which amounted to $.14 per share. Excluding this non-recurring dividend, the ratio of net investment income (loss) to average net assets would have been 2.27%.
C Total distributions of $.27 per share is comprised of distributions from net investment income of $.223 and distributions from net realized gain of $.042 per share.
D Amount represents less than $.005 per share.
E Total returns for periods of less than one year are not annualized.
F Total returns would have been lower if certain expenses had not been reduced during the applicable periods shown.
G Fees and expenses of any underlying Fidelity Central Funds are not included in the Fund's expense ratio. The Fund indirectly bears its proportionate share of the expenses of any underlying Fidelity Central Funds.
H Expense ratios reflect operating expenses of the class. Expenses before reductions do not reflect amounts reimbursed by the investment adviser or reductions from brokerage service arrangements or reductions from other expense offset arrangements and do not represent the amount paid by the class during periods when reimbursements or reductions occur. Expenses net of fee waivers reflect expenses after reimbursement by the investment adviser but prior to reductions from brokerage service arrangements or other expense offset arrangements. Expenses net of all reductions represent the net expenses paid by the class.
I Annualized
J Amount does not include the portfolio activity of any underlying Fidelity Central Funds.
See accompanying notes which are an integral part of the financial statements.
Financial Highlights — Fidelity International Value Fund Class I
| Six months ended (Unaudited) April 30, | Years ended October 31, | |||||
| 2016 | 2015 | 2014 | 2013 | 2012 | 2011 | |
| Selected Per–Share Data | ||||||
| Net asset value, beginning of period | $8.29 | $8.65 | $8.98 | $7.41 | $7.04 | $8.24 |
| Income from Investment Operations | ||||||
| Net investment income (loss)A | .10 | .15 | .33B | .19 | .22 | .25 |
| Net realized and unrealized gain (loss) | (.43) | (.19) | (.45) | 1.65 | .40 | (1.19) |
| Total from investment operations | (.33) | (.04) | (.12) | 1.84 | .62 | (.94) |
| Distributions from net investment income | (.10) | (.32) | (.19) | (.23) | (.25) | (.22) |
| Distributions from net realized gain | – | – | (.01) | (.04) | – | (.03) |
| Total distributions | (.10) | (.32) | (.21)C | (.27) | (.25) | (.26)D |
| Redemption fees added to paid in capitalA,E | – | – | – | – | – | – |
| Net asset value, end of period | $7.86 | $8.29 | $8.65 | $8.98 | $7.41 | $7.04 |
| Total ReturnF,G | (4.07)% | (.53)% | (1.41)% | 25.64% | 9.22% | (11.83)% |
| Ratios to Average Net AssetsH,I | ||||||
| Expenses before reductions | 1.20%J | 1.14% | 1.05% | 1.07% | 1.10% | .98% |
| Expenses net of fee waivers, if any | 1.20%J | 1.14% | 1.05% | 1.07% | 1.10% | .98% |
| Expenses net of all reductions | 1.20%J | 1.13% | 1.04% | 1.04% | 1.07% | .96% |
| Net investment income (loss) | 2.67%J | 1.81% | 3.71%B | 2.39% | 3.18% | 3.17% |
| Supplemental Data | ||||||
| Net assets, end of period (000 omitted) | $1,905 | $1,969 | $1,310 | $239 | $372 | $473 |
| Portfolio turnover rateK | 26%J | 44% | 69% | 79% | 74% | 83% |
A Calculated based on average shares outstanding during the period.
B Net Investment income per share reflects a large, non-recurring dividend which amounted to $.14 per share. Excluding this non-recurring dividend, the ratio of net investment income (loss) to average net assets would have been 2.18%.
C Total distributions of $.21 per share is comprised of distributions from net investment income of $.191 and distributions from net realized gain of $.014 per share.
D Total distributions of $.26 per share is comprised of distributions from net investment income of $.221 and distributions from net realized gain of $.034 per share.
E Amount represents less than $.005 per share.
F Total returns for periods of less than one year are not annualized.
G Total returns would have been lower if certain expenses had not been reduced during the applicable periods shown.
H Fees and expenses of any underlying Fidelity Central Funds are not included in the Fund's expense ratio. The Fund indirectly bears its proportionate share of the expenses of any underlying Fidelity Central Funds.
I Expense ratios reflect operating expenses of the class. Expenses before reductions do not reflect amounts reimbursed by the investment adviser or reductions from brokerage service arrangements or reductions from other expense offset arrangements and do not represent the amount paid by the class during periods when reimbursements or reductions occur. Expenses net of fee waivers reflect expenses after reimbursement by the investment adviser but prior to reductions from brokerage service arrangements or other expense offset arrangements. Expenses net of all reductions represent the net expenses paid by the class.
J Annualized
K Amount does not include the portfolio activity of any underlying Fidelity Central Funds.
See accompanying notes which are an integral part of the financial statements.
Notes to Financial Statements (Unaudited)
For the period ended April 30, 2016
1. Organization.
Fidelity International Value Fund (the Fund) is a fund of Fidelity Investment Trust (the Trust) and is authorized to issue an unlimited number of shares. The Trust is registered under the Investment Company Act of 1940, as amended (the 1940 Act), as an open-end management investment company organized as a Massachusetts business trust. The Fund offers Class A, Class T, Class C, International Value and Class I shares, each of which, along with Class B shares, has equal rights as to assets and voting privileges. Class B shares are closed to new accounts and additional purchases, except for exchanges and reinvestments. Each class has exclusive voting rights with respect to matters that affect that class. Class B shares will automatically convert to Class A shares after a maximum holding period of seven four years from the initial date of purchase.
During the period, the Board of Trustees approved the conversion of all existing Class B shares into Class A shares, effective on or about July 1, 2016, regardless of the length of times shares have been held.
2. Investments in Fidelity Central Funds.
The Fund invests in Fidelity Central Funds, which are open-end investment companies generally available only to other investment companies and accounts managed by the investment adviser and its affiliates. The Fund's Schedule of Investments lists each of the Fidelity Central Funds held as of period end, if any, as an investment of the Fund, but does not include the underlying holdings of each Fidelity Central Fund. As an Investing Fund, the Fund indirectly bears its proportionate share of the expenses of the underlying Fidelity Central Funds.
The Money Market Central Funds seek preservation of capital and current income and are managed by Fidelity Investments Money Management, Inc. (FIMM), an affiliate of the investment adviser. Annualized expenses of the Money Market Central Funds as of their most recent shareholder report date are less than .005%.
A complete unaudited list of holdings for each Fidelity Central Fund is available upon request or at the Securities and Exchange Commission (the SEC) website at www.sec.gov. In addition, the financial statements of the Fidelity Central Funds are available on the SEC website or upon request.
3. Significant Accounting Policies.
The financial statements have been prepared in conformity with accounting principles generally accepted in the United States of America (GAAP), which require management to make certain estimates and assumptions at the date of the financial statements. Actual results could differ from those estimates. Subsequent events, if any, through the date that the financial statements were issued have been evaluated in the preparation of the financial statements. The following summarizes the significant accounting policies of the Fund:
Investment Valuation. Investments are valued as of 4:00 p.m. Eastern time on the last calendar day of the period. The Board of Trustees (the Board) has delegated the day to day responsibility for the valuation of the Fund's investments to the Fidelity Management & Research Company (FMR) Fair Value Committee (the Committee). In accordance with valuation policies and procedures approved by the Board, the Fund attempts to obtain prices from one or more third party pricing vendors or brokers to value its investments. When current market prices, quotations or currency exchange rates are not readily available or reliable, investments will be fair valued in good faith by the Committee, in accordance with procedures adopted by the Board. Factors used in determining fair value vary by investment type and may include market or investment specific events. The frequency with which these procedures are used cannot be predicted and they may be utilized to a significant extent. The Committee oversees the Fund's valuation policies and procedures and reports to the Board on the Committee's activities and fair value determinations. The Board monitors the appropriateness of the procedures used in valuing the Fund's investments and ratifies the fair value determinations of the Committee.
The Fund categorizes the inputs to valuation techniques used to value its investments into a disclosure hierarchy consisting of three levels as shown below:
- Level 1 – quoted prices in active markets for identical investments
- Level 2 – other significant observable inputs (including quoted prices for similar investments, interest rates, prepayment speeds, etc.)
- Level 3 – unobservable inputs (including the Fund's own assumptions based on the best information available)
Valuation techniques used to value the Fund's investments by major category are as follows:
Equity securities, including restricted securities, for which market quotations are readily available, are valued at the last reported sale price or official closing price as reported by a third party pricing vendor on the primary market or exchange on which they are traded and are categorized as Level 1 in the hierarchy. In the event there were no sales during the day or closing prices are not available, securities are valued at the last quoted bid price or may be valued using the last available price and are generally categorized as Level 2 in the hierarchy. For foreign equity securities, when market or security specific events arise, comparisons to the valuation of American Depositary Receipts (ADRs), futures contracts, Exchange-Traded Funds (ETFs) and certain indexes as well as quoted prices for similar securities may be used and would be categorized as Level 2 in the hierarchy. Utilizing these techniques may result in transfers between Level 1 and Level 2. For equity securities, including restricted securities, where observable inputs are limited, assumptions about market activity and risk are used and these securities may be categorized as Level 3 in the hierarchy.
Investments in open-end mutual funds, including the Fidelity Central Funds, are valued at their closing net asset value (NAV) each business day and are categorized as Level 1 in the hierarchy.
Changes in valuation techniques may result in transfers in or out of an assigned level within the disclosure hierarchy. The aggregate value of investments by input level as of April 30, 2016, including information on transfers between Levels 1 and 2, is included at the end of the Fund's Schedule of Investments.
Foreign Currency. The Fund may use foreign currency contracts to facilitate transactions in foreign-denominated securities. Gains and losses from these transactions may arise from changes in the value of the foreign currency or if the counterparties do not perform under the contracts' terms.
Foreign-denominated assets, including investment securities, and liabilities are translated into U.S. dollars at the exchange rates at period end. Purchases and sales of investment securities, income and dividends received and expenses denominated in foreign currencies are translated into U.S. dollars at the exchange rate in effect on the transaction date.
The effects of exchange rate fluctuations on investments are included with the net realized and unrealized gain (loss) on investment securities. Other foreign currency transactions resulting in realized and unrealized gain (loss) are disclosed separately.
Investment Transactions and Income. For financial reporting purposes, the Fund's investment holdings and NAV include trades executed through the end of the last business day of the period. The NAV per share for processing shareholder transactions is calculated as of the close of business of the New York Stock Exchange (NYSE), normally 4:00 p.m. Eastern time and includes trades executed through the end of the prior business day. Gains and losses on securities sold are determined on the basis of identified cost. Dividend income is recorded on the ex-dividend date, except for certain dividends from foreign securities where the ex-dividend date may have passed, which are recorded as soon as the Fund is informed of the ex-dividend date. Non-cash dividends included in dividend income, if any, are recorded at the fair market value of the securities received. Income and capital gain distributions from Fidelity Central Funds, if any, are recorded on the ex-dividend date. Distributions received on securities that represent a return of capital or capital gain are recorded as a reduction of cost of investments and/or as a realized gain. Subsequent to ex-dividend date the Fund determines the components of these distributions, based upon receipt of tax filings or other correspondence relating to the underlying investment. Investment income is recorded net of foreign taxes withheld where recovery of such taxes is uncertain.
Class Allocations and Expenses. Investment income, realized and unrealized capital gains and losses, common expenses of the Fund, and certain fund-level expense reductions, if any, are allocated daily on a pro-rata basis to each class based on the relative net assets of each class to the total net assets of the Fund. Each class differs with respect to transfer agent and distribution and service plan fees incurred. Certain expense reductions may also differ by class. For the reporting period, the allocated portion of income and expenses to each class as a percent of its average net assets may vary due to the timing of recording these transactions in relation to fluctuating net assets of the classes. Expenses directly attributable to a fund are charged to that fund. Expenses attributable to more than one fund are allocated among the respective funds on the basis of relative net assets or other appropriate methods. Expense estimates are accrued in the period to which they relate and adjustments are made when actual amounts are known.
Income Tax Information and Distributions to Shareholders. Each year, the Fund intends to qualify as a regulated investment company under Subchapter M of the Internal Revenue Code, including distributing substantially all of its taxable income and realized gains. As a result, no provision for U.S. Federal income taxes is required. The Fund files a U.S. federal tax return, in addition to state and local tax returns as required. The Fund's federal income tax returns are subject to examination by the Internal Revenue Service (IRS) for a period of three fiscal years after they are filed. State and local tax returns may be subject to examination for an additional fiscal year depending on the jurisdiction. Foreign taxes are provided for based on the Fund's understanding of the tax rules and rates that exist in the foreign markets in which it invests.
Distributions are declared and recorded on the ex-dividend date. Income dividends and capital gain distributions are declared separately for each class. Income and capital gain distributions are determined in accordance with income tax regulations, which may differ from GAAP.
Capital accounts within the financial statements are adjusted for permanent book-tax differences. These adjustments have no impact on net assets or the results of operations. Capital accounts are not adjusted for temporary book-tax differences which will reverse in a subsequent period.
Book-tax differences are primarily due to foreign currency transactions, passive foreign investment companies (PFIC), partnerships, capital loss carryforwards, and losses deferred due to wash sales.
The federal tax cost of investment securities and unrealized appreciation (depreciation) as of period end were as follows:
| Gross unrealized appreciation | $20,798,749 |
| Gross unrealized depreciation | (36,225,329) |
| Net unrealized appreciation (depreciation) on securities | $(15,426,580) |
| Tax cost | $356,155,246 |
Capital loss carryforwards are only available to offset future capital gains of the Fund to the extent provided by regulations and may be limited. Under the Regulated Investment Company Modernization Act of 2010 (the Act), the Fund is permitted to carry forward capital losses incurred in taxable years beginning after December 22, 2010 for an unlimited period and such capital losses are required to be used prior to any losses that expire. The capital loss carryforward information presented below, including any applicable limitation, is estimated as of prior fiscal period end and is subject to adjustment.
| Fiscal year of expiration | |
| 2016 | $(2,663,413) |
| 2017 | (65,376,972) |
| 2018 | (3,571,319) |
| 2019 | (31,368,797) |
| Total with expiration | $(102,980,501) |
| No expiration | |
| Short-term | $(3,001,927) |
| Total capital loss carryforward | $(105,982,428) |
Short-Term Trading (Redemption) Fees. Shares held by investors in the Fund less than 30 days may have been subject to a redemption fee equal to 1.00% of the NAV of shares redeemed. All redemption fees, which reduce the proceeds of the shareholder redemption, are retained by the Fund and accounted for as an addition to paid in capital.
Delayed Delivery Transactions and When-Issued Securities. During the period, the Fund transacted in securities on a delayed delivery or when-issued basis. Payment and delivery may take place after the customary settlement period for that security. The price of the underlying securities and the date when the securities will be delivered and paid for are fixed at the time the transaction is negotiated. The securities purchased on a delayed delivery or when-issued basis are identified as such in the Fund's Schedule of Investments. With respect to purchase commitments, the Fund identifies securities as segregated in its records with a value at least equal to the amount of the commitment. Losses may arise due to changes in the value of the underlying securities or if the counterparty does not perform under the contract's terms, or if the issuer does not issue the securities due to political, economic, or other factors.
4. Purchases and Sales of Investments.
Purchases and sales of securities, other than short-term securities, aggregated $96,477,809 and $39,058,065, respectively.
5. Fees and Other Transactions with Affiliates.
Management Fee. Fidelity Management & Research Company (the investment adviser) and its affiliates provide the Fund with investment management related services for which the Fund pays a monthly management fee. The management fee is the sum of an individual fund fee rate that is based on an annual rate of .45% of the Fund's average net assets and an annualized group fee rate that averaged .25% during the period. The group fee rate is based upon the average net assets of all the mutual funds advised by the investment adviser, including any mutual funds previously advised by the investment adviser that are currently advised by Fidelity SelectCo, LLC, an affiliate of the investment adviser. The group fee rate decreases as assets under management increase and increases as assets under management decrease. In addition, the management fee is subject to a performance adjustment (up to a maximum of +/- .20% of the Fund's average net assets over a 36 month performance period). The upward or downward adjustment to the management fee is based on the relative investment performance of International Value as compared to its benchmark index, the MSCI EAFE Value Index, over the same 36 month performance period. For the reporting period, the total annualized management fee rate, including the performance adjustment, was .75% of the Fund's average net assets. The performance adjustment included in the management fee rate may be higher or lower than the maximum performance adjustment rate due to the difference between the average net assets for the reporting and performance periods.
Distribution and Service Plan Fees. In accordance with Rule 12b-1 of the 1940 Act, the Fund has adopted separate Distribution and Service Plans for each class of shares. Certain classes pay Fidelity Distributors Corporation (FDC), an affiliate of the investment adviser, separate Distribution and Service Fees, each of which is based on an annual percentage of each class' average net assets. In addition, FDC may pay financial intermediaries for selling shares of the Fund and providing shareholder support services. For the period, the Distribution and Service Fee rates, total fees and amounts retained by FDC were as follows:
| Distribution Fee | Service Fee | Total Fees | Retained by FDC | |
| Class A | -% | .25% | $10,630 | $247 |
| Class T | .25% | .25% | 9,834 | – |
| Class B | .75% | .25% | 1,216 | 912 |
| Class C | .75% | .25% | 21,637 | 4,385 |
| $43,317 | $5,544 |
Sales Load. FDC may receive a front-end sales charge of up to 5.75% for selling Class A shares and 3.50% for selling Class T shares, some of which is paid to financial intermediaries for selling shares of the Fund. Depending on the holding period, FDC may receive contingent deferred sales charges levied on Class A, Class T, Class B, and Class C redemptions. The deferred sales charges 5.00% to 1.00% for Class B shares, 1.00% for Class C shares, 1.00% for certain purchases of Class A shares and .25% for certain purchases of Class T shares.
For the period, sales charge amounts retained by FDC were as follows:
| Retained by FDC | |
| Class A | $1,140 |
| Class T | 718 |
| Class B(a) | 10 |
| Class C(a) | 800 |
| $2,668 |
(a) When Class B and Class C shares are initially sold, FDC pays commissions from its own resources to financial intermediaries through which the sales are made.
Transfer Agent Fees. Fidelity Investments Institutional Operations Company, Inc., (FIIOC), an affiliate of the investment adviser, is the transfer, dividend disbursing and shareholder servicing agent for each class of the Fund. FIIOC receives account fees and asset-based fees that vary according to the account size and type of account of the shareholders of the respective classes of the Fund. FIIOC pays for typesetting, printing and mailing of shareholder reports, except proxy statements.
For the period, transfer agent fees for each class were as follows:
| Amount | % of Class-Level Average Net Assets(a) | |
| Class A | $11,787 | .28 |
| Class T | 6,443 | .33 |
| Class B | 378 | .31 |
| Class C | 6,617 | .31 |
| International Value | 241,632 | .17 |
| Class I | 2,880 | .30 |
| $269,737 |
(a) Annualized
Accounting and Security Lending Fees. Fidelity Service Company, Inc. (FSC), an affiliate of the investment adviser, maintains the Fund's accounting records. The accounting fee is based on the level of average net assets for each month. Under a separate contract, FSC administers the security lending program. The security lending fee is based on the number and duration of lending transactions.
Brokerage Commissions. The Fund placed a portion of its portfolio transactions with brokerage firms which are affiliates of the investment adviser. Brokerage commissions are included in net realized gain (loss) and change in net unrealized appreciation (depreciation) in the Statement of Operations. The commissions paid to these affiliated firms were $136 for the period.
Interfund Trades. The Funds may purchase from or sell securities to other Fidelity Funds under procedures adopted by the Board. The procedures have been designed to ensure these interfund trades are executed in accordance with Rule 17a-7 of the 1940 Act. Interfund trades are included within the respective purchases and sales amounts shown in the Purchases and Sales of Investments note.
6. Committed Line of Credit.
The Fund participates with other funds managed by the investment adviser or an affiliate in a $4.25 billion credit facility (the "line of credit") to be utilized for temporary or emergency purposes to fund shareholder redemptions or for other short-term liquidity purposes. The Fund has agreed to pay commitment fees on its pro-rata portion of the line of credit, which amounted to $266 and is reflected in Miscellaneous expenses on the Statement of Operations. During the period, the Fund did not borrow on this line of credit.
7. Security Lending.
The Fund lends portfolio securities through a lending agent from time to time in order to earn additional income. For equity securities, a lending agent is used and may loan securities to certain qualified borrowers, including Fidelity Capital Markets (FCM), a broker-dealer affiliated with the Fund. On the settlement date of the loan, the Fund receives collateral (in the form of U.S. Treasury obligations, letters of credit and/or cash) against the loaned securities and maintains collateral in an amount not less than 100% of the market value of the loaned securities during the period of the loan. The market value of the loaned securities is determined at the close of business of the Fund and any additional required collateral is delivered to the Fund on the next business day. The Fund or borrower may terminate the loan at any time, and if the borrower defaults on its obligation to return the securities loaned because of insolvency or other reasons, the Fund may apply collateral received from the borrower against the obligation. The Fund may experience delays and costs in recovering the securities loaned. Any cash collateral received is invested in the Fidelity Securities Lending Cash Central Fund. The value of loaned securities and cash collateral at period end are disclosed on the Fund's Statement of Assets and Liabilities. At period end, there were no security loans outstanding with FCM. Security lending income represents the income earned on investing cash collateral, less rebates paid to borrowers and any lending agent fees associated with the loan, plus any premium payments received for lending certain types of securities. Security lending income is presented in the Statement of Operations as a component of income from Fidelity Central Funds. Total security lending income during the period amounted to $137,227, including $139 from securities loaned to FCM.
8. Expense Reductions.
The investment adviser voluntarily agreed to reimburse each class to the extent annual operating expenses exceeded certain levels of average net assets as noted in the table below. Some expenses, for example interest expense, including commitment fees, are excluded from this reimbursement.
| Expense Limitations | Reimbursement | |
| Class T | 1.70% | $607 |
| Class B | 2.20% | 10 |
| Class C | 2.20% | 147 |
| Class I | 1.20% | 31 |
| $795 |
Commissions paid to certain brokers with whom the investment adviser, or its affiliates, places trades on behalf of the Fund include an amount in addition to trade execution, which may be rebated back to the Fund to offset certain expenses. This amount totaled $3,400 for the period.
In addition, during the period the investments adviser reimbursed and/or waived a portion of fund-level operating expenses in the amount of $1,064.
9. Distributions to Shareholders.
Distributions to shareholders of each class were as follows:
| Six months ended April 30, 2016 | Year ended October 31, 2015 | |
| From net investment income | ||
| Class A | $95,726 | $204,314 |
| Class T | 30,318 | 109,443 |
| Class B | 141 | 8,373 |
| Class C | 10,293 | 99,311 |
| International Value | 3,924,604 | 7,079,700 |
| Class I | 23,301 | 52,790 |
| Total | $4,084,383 | $7,553,931 |
10. Share Transactions.
Share transactions for each class were as follows and may contain automatic conversions between classes or exchanges between affiliated funds:
| Shares | Shares | Dollars | Dollars | |
| Six months ended April 30, 2016 | Year ended October 31, 2015 | Six months ended April 30, 2016 | Year ended October 31, 2015 | |
| Class A | ||||
| Shares sold | 145,262 | 527,583 | $1,133,082 | $4,502,640 |
| Reinvestment of distributions | 11,425 | 23,604 | 93,224 | 197,333 |
| Shares redeemed | (179,619) | (198,812) | (1,367,494) | (1,665,353) |
| Net increase (decrease) | (22,932) | 352,375 | $(141,188) | $3,034,620 |
| Class T | ||||
| Shares sold | 57,909 | 117,820 | $455,086 | $1,007,336 |
| Reinvestment of distributions | 3,669 | 12,981 | 29,980 | 108,520 |
| Shares redeemed | (45,795) | (54,747) | (348,759) | (463,119) |
| Net increase (decrease) | 15,783 | 76,054 | $136,307 | $652,737 |
| Class B | ||||
| Shares sold | 2 | 2,257 | $14 | $18,258 |
| Reinvestment of distributions | 15 | 891 | 124 | 7,565 |
| Shares redeemed | (12,943) | (14,741) | (101,798) | (124,607) |
| Net increase (decrease) | (12,926) | (11,593) | $(101,660) | $(98,784) |
| Class C | ||||
| Shares sold | 71,013 | 208,019 | $540,561 | $1,779,247 |
| Reinvestment of distributions | 1,181 | 10,999 | 9,659 | 92,173 |
| Shares redeemed | (56,610) | (96,570) | (438,654) | (802,299) |
| Net increase (decrease) | 15,584 | 122,448 | $111,566 | $1,069,121 |
| International Value | ||||
| Shares sold | 9,108,775 | 14,508,730 | $70,505,949 | $121,044,962 |
| Reinvestment of distributions | 470,177 | 823,202 | 3,831,944 | 6,873,736 |
| Shares redeemed | (2,629,480) | (5,350,163) | (19,886,444) | (45,687,658) |
| Net increase (decrease) | 6,949,472 | 9,981,769 | $54,451,449 | $82,231,040 |
| Class I | ||||
| Shares sold | 30,535 | 413,299 | $237,842 | $3,523,105 |
| Reinvestment of distributions | 2,528 | 5,275 | 20,650 | 44,098 |
| Shares redeemed | (28,411) | (332,392) | (224,656) | (2,908,565) |
| Net increase (decrease) | 4,652 | 86,182 | $33,836 | $658,638 |
11. Other.
The Fund's organizational documents provide former and current trustees and officers with a limited indemnification against liabilities arising in connection with the performance of their duties to the Fund. In the normal course of business, the Fund may also enter into contracts that provide general indemnifications. The Fund's maximum exposure under these arrangements is unknown as this would be dependent on future claims that may be made against the Fund. The risk of material loss from such claims is considered remote.
At the end of the period, Strategic Advisers International II Fund, was the owner of record of approximately 69% of the total outstanding shares of the Fund.
Shareholder Expense Example
As a shareholder of the Fund, you incur two types of costs: (1) transaction costs, including sales charges (loads) on purchase payments or redemption proceeds, redemption fees and (2) ongoing costs, including management fees, distribution and/or service (12b-1) fees and other Fund expenses. This Example is intended to help you understand your ongoing costs (in dollars) of investing in the Fund and to compare these costs with the ongoing costs of investing in other mutual funds.
The Example is based on an investment of $1,000 invested at the beginning of the period and held for the entire period (November 1, 2015 to April 30, 2016).
Actual Expenses
The first line of the accompanying table for each class of the Fund provides information about actual account values and actual expenses. You may use the information in this line, together with the amount you invested, to estimate the expenses that you paid over the period. Simply divide your account value by $1,000.00 (for example, an $8,600 account value divided by $1,000.00 = 8.6), then multiply the result by the number in the first line for a class of the Fund under the heading entitled "Expenses Paid During Period" to estimate the expenses you paid on your account during this period. A small balance maintenance fee of $12.00 that is charged once a year may apply for certain accounts with a value of less than $2,000. This fee is not included in the table below. If it was, the estimate of expenses you paid during the period would be higher, and your ending account value lower, by this amount. In addition, the Fund, as a shareholder in the underlying Fidelity Central Funds, will indirectly bear its pro-rata share of the fees and expenses incurred by the underlying Fidelity Central Funds. These fees and expenses are not included in the Fund's annualized expense ratio used to calculate the expense estimate in the table below.
Hypothetical Example for Comparison Purposes
The second line of the accompanying table for each class of the Fund provides information about hypothetical account values and hypothetical expenses based on a Class' actual expense ratio and an assumed rate of return of 5% per year before expenses, which is not the Class' actual return. The hypothetical account values and expenses may not be used to estimate the actual ending account balance or expenses you paid for the period. You may use this information to compare the ongoing costs of investing in the Fund and other funds. To do so, compare this 5% hypothetical example with the 5% hypothetical examples that appear in the shareholder reports of the other funds. A small balance maintenance fee of $12.00 that is charged once a year may apply for certain accounts with a value of less than $2,000. This fee is not included in the table below. If it was, the estimate of expenses you paid during the period would be higher, and your ending account value lower, by this amount. In addition, the Fund, as a shareholder in the underlying Fidelity Central Funds, will indirectly bear its pro-rata share of the fees and expenses incurred by the underlying Fidelity Central Funds. These fees and expenses are not included in the Fund's annualized expense ratio used to calculate the expense estimate in the table below.
Please note that the expenses shown in the table are meant to highlight your ongoing costs only and do not reflect any transaction costs. Therefore, the second line of the table is useful in comparing ongoing costs only, and will not help you determine the relative total costs of owning different funds. In addition, if these transactional costs were included, your costs would have been higher.
| Annualized Expense Ratio-A | Beginning Account Value November 1, 2015 | Ending Account Value April 30, 2016 | Expenses Paid During Period-B November 1, 2015 to April 30, 2016 | |
| Class A | 1.43% | |||
| Actual | $1,000.00 | $959.50 | $6.97 | |
| Hypothetical-C | $1,000.00 | $1,017.75 | $7.17 | |
| Class T | 1.70% | |||
| Actual | $1,000.00 | $958.60 | $8.28 | |
| Hypothetical-C | $1,000.00 | $1,016.41 | $8.52 | |
| Class B | 2.20% | |||
| Actual | $1,000.00 | $954.90 | $10.69 | |
| Hypothetical-C | $1,000.00 | $1,013.92 | $11.02 | |
| Class C | 2.20% | |||
| Actual | $1,000.00 | $956.00 | $10.70 | |
| Hypothetical-C | $1,000.00 | $1,013.92 | $11.02 | |
| International Value | 1.07% | |||
| Actual | $1,000.00 | $960.40 | $5.22 | |
| Hypothetical-C | $1,000.00 | $1,019.54 | $5.37 | |
| Class I | 1.20% | |||
| Actual | $1,000.00 | $959.30 | $5.85 | |
| Hypothetical-C | $1,000.00 | $1,018.90 | $6.02 |
A Annualized expense ratio reflects expenses net of applicable fee waivers.
B Expenses are equal to each Class' annualized expense ratio, multiplied by the average account value over the period, multiplied by 182/366 (to reflect the one-half year period).
C 5% return per year before expenses
![]()
AFIVI-SANN-0616
1.827492.109
Fidelity® International Small Cap Fund Semi-Annual Report April 30, 2016 |
|
Contents
To view a fund's proxy voting guidelines and proxy voting record for the 12-month period ended June 30, visit http://www.fidelity.com/proxyvotingresults or visit the Securities and Exchange Commission's (SEC) web site at http://www.sec.gov.
You may also call 1-800-544-8544 to request a free copy of the proxy voting guidelines.
Standard & Poor's, S&P and S&P 500 are registered service marks of The McGraw-Hill Companies, Inc. and have been licensed for use by Fidelity Distributors Corporation.
Other third-party marks appearing herein are the property of their respective owners.
All other marks appearing herein are registered or unregistered trademarks or service marks of FMR LLC or an affiliated company. © 2016 FMR LLC. All rights reserved.
This report and the financial statements contained herein are submitted for the general information of the shareholders of the Fund. This report is not authorized for distribution to prospective investors in the Fund unless preceded or accompanied by an effective prospectus.
A fund files its complete schedule of portfolio holdings with the SEC for the first and third quarters of each fiscal year on Form N-Q. Forms N-Q are available on the SEC’s web site at http://www.sec.gov. A fund's Forms N-Q may be reviewed and copied at the SEC’s Public Reference Room in Washington, DC. Information regarding the operation of the SEC's Public Reference Room may be obtained by calling 1-800-SEC-0330.
For a complete list of a fund's portfolio holdings, view the most recent holdings listing, semiannual report, or annual report on Fidelity's web site at http://www.fidelity.com, http://www.advisor.fidelity.com, or http://www.401k.com, as applicable.
NOT FDIC INSURED •MAY LOSE VALUE •NO BANK GUARANTEE
Neither the Fund nor Fidelity Distributors Corporation is a bank.
Investment Summary (Unaudited)
Geographic Diversification (% of fund's net assets)
| As of April 30, 2016 | ||
| Japan | 22.2% | |
| United Kingdom | 14.8% | |
| United States of America* | 5.9% | |
| Canada | 4.1% | |
| France | 4.0% | |
| Cayman Islands | 3.9% | |
| Australia | 3.6% | |
| Switzerland | 3.3% | |
| Ireland | 2.5% | |
| Other | 35.7% | |

* Includes Short-Term investments and Net Other Assets (Liabilities).
Percentages are based on country or territory of incorporation and are adjusted for the effect of futures contracts, if applicable.
| As of October 31, 2015 | ||
| Japan | 21.6% | |
| United Kingdom | 14.5% | |
| United States of America* | 6.6% | |
| Canada | 4.0% | |
| Switzerland | 3.9% | |
| Cayman Islands | 3.7% | |
| Germany | 3.4% | |
| France | 3.3% | |
| Australia | 2.9% | |
| Other | 36.1% | |
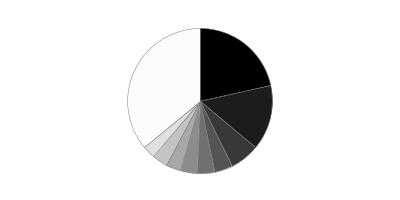
* Includes Short-Term investments and Net Other Assets (Liabilities).
Percentages are based on country or territory of incorporation and are adjusted for the effect of futures contracts, if applicable.
Asset Allocation as of April 30, 2016
| % of fund's net assets | % of fund's net assets 6 months ago | |
| Stocks | 95.0 | 94.6 |
| Short-Term Investments and Net Other Assets (Liabilities) | 5.0 | 5.4 |
Top Ten Stocks as of April 30, 2016
| % of fund's net assets | % of fund's net assets 6 months ago | |
| Micro Focus International PLC (United Kingdom, Software) | 1.3 | 1.1 |
| EBOS Group Ltd. (New Zealand, Health Care Providers & Services) | 1.2 | 1.1 |
| United Drug PLC (United Kingdom) (Ireland, Health Care Providers & Services) | 1.1 | 1.0 |
| Tsuruha Holdings, Inc. (Japan, Food & Staples Retailing) | 1.1 | 0.9 |
| Nuplex Industries Ltd. (New Zealand, Chemicals) | 1.0 | 0.9 |
| Nitori Holdings Co. Ltd. (Japan, Specialty Retail) | 1.0 | 0.9 |
| Frutarom Industries Ltd. (Israel, Chemicals) | 1.0 | 1.1 |
| Allied World Assurance Co. Holdings AG (Switzerland, Insurance) | 1.0 | 0.9 |
| JSR Corp. (Japan, Chemicals) | 0.9 | 1.0 |
| GUD Holdings Ltd. (Australia, Household Durables) | 0.9 | 0.5 |
| 10.5 |
Market Sectors as of April 30, 2016
| % of fund's net assets | % of fund's net assets 6 months ago | |
| Financials | 20.9 | 22.6 |
| Industrials | 19.4 | 18.9 |
| Consumer Discretionary | 15.2 | 16.3 |
| Information Technology | 9.4 | 10.0 |
| Consumer Staples | 8.9 | 7.5 |
| Health Care | 8.9 | 8.5 |
| Materials | 7.8 | 6.9 |
| Energy | 4.1 | 3.5 |
| Utilities | 0.4 | 0.4 |
Investments April 30, 2016 (Unaudited)
Showing Percentage of Net Assets
| Common Stocks - 94.6% | |||
| Shares | Value | ||
| Australia - 3.6% | |||
| Aub Group Ltd. | 470,441 | $3,111,988 | |
| Austal Ltd. | 919,229 | 1,090,340 | |
| Challenger Ltd. | 769,974 | 5,245,630 | |
| GUD Holdings Ltd. (a) | 1,286,901 | 8,356,349 | |
| Imdex Ltd. (b)(c) | 13,086,370 | 2,039,795 | |
| Life Healthcare Group Ltd. | 2,075,053 | 2,145,763 | |
| Nanosonics Ltd. (b) | 1,719,782 | 2,902,952 | |
| Programmed Maintenance Services Ltd. | 1,870,070 | 2,083,095 | |
| SAI Global Ltd. | 1,348,285 | 3,741,865 | |
| SomnoMed Ltd. (a)(b) | 672,977 | 1,453,222 | |
| TOTAL AUSTRALIA | 32,170,999 | ||
| Austria - 1.8% | |||
| Andritz AG | 118,732 | 6,649,514 | |
| IMMOFINANZ Immobilien Anlagen AG (a)(b) | 1,934,143 | 4,560,048 | |
| RHI AG | 218,140 | 4,690,891 | |
| TOTAL AUSTRIA | 15,900,453 | ||
| Bailiwick of Jersey - 0.6% | |||
| Regus PLC | 1,332,800 | 5,694,258 | |
| Belgium - 1.0% | |||
| Barco NV | 67,583 | 4,719,767 | |
| Econocom Group SA | 362,620 | 3,907,202 | |
| TOTAL BELGIUM | 8,626,969 | ||
| Bermuda - 1.6% | |||
| BW Offshore Ltd. | 5,305,227 | 1,159,634 | |
| Hiscox Ltd. | 389,355 | 5,122,999 | |
| Petra Diamonds Ltd. | 3,093,474 | 5,333,635 | |
| Travelport Worldwide Ltd. | 228,600 | 3,188,970 | |
| TOTAL BERMUDA | 14,805,238 | ||
| Brazil - 0.3% | |||
| MAHLE Metal Leve SA | 362,500 | 2,385,222 | |
| British Virgin Islands - 0.3% | |||
| Gem Diamonds Ltd. | 1,174,862 | 2,326,060 | |
| Canada - 4.1% | |||
| AutoCanada, Inc. (a) | 254,084 | 4,157,444 | |
| Dorel Industries, Inc. Class B (sub. vtg.) | 122,003 | 2,714,851 | |
| Genesis Land Development Corp. | 1,051,822 | 2,221,510 | |
| Jean Coutu Group, Inc. Class A (sub. vtg.) | 244,913 | 3,724,348 | |
| Lassonde Industries, Inc. Class A (sub. vtg.) | 37,869 | 5,281,499 | |
| McCoy Global, Inc. | 1,341,870 | 2,192,423 | |
| Open Text Corp. | 136,048 | 7,617,257 | |
| ShawCor Ltd. Class A | 117,885 | 3,185,065 | |
| Whitecap Resources, Inc. (a) | 696,153 | 5,221,009 | |
| TOTAL CANADA | 36,315,406 | ||
| Cayman Islands - 3.9% | |||
| AMVIG Holdings Ltd. | 16,168,000 | 6,657,294 | |
| Best Pacific International Holdings Ltd. | 1,678,000 | 995,768 | |
| China High Precision Automation Group Ltd. (b) | 712,000 | 1 | |
| China Metal Recycling (Holdings) Ltd. (b) | 436,800 | 1 | |
| Greatview Aseptic Pack Co. Ltd. | 5,597,000 | 2,834,467 | |
| Haitian International Holdings Ltd. | 2,600,000 | 4,436,023 | |
| Lifestyle International Holdings Ltd. | 3,347,000 | 5,544,385 | |
| Pico Far East Holdings Ltd. | 18,482,000 | 5,010,814 | |
| SITC International Holdings Co. Ltd. | 12,181,000 | 6,583,480 | |
| Value Partners Group Ltd. | 3,286,000 | 3,136,655 | |
| TOTAL CAYMAN ISLANDS | 35,198,888 | ||
| Chile - 0.9% | |||
| Quinenco SA | 2,409,395 | 4,740,929 | |
| Vina San Pedro SA | 352,175,653 | 3,470,184 | |
| TOTAL CHILE | 8,211,113 | ||
| Denmark - 0.7% | |||
| Jyske Bank A/S (Reg.) | 153,703 | 6,292,655 | |
| Finland - 2.4% | |||
| Amer Group PLC (A Shares) | 201,445 | 5,955,760 | |
| Asiakastieto Group Oyj | 192,023 | 3,518,015 | |
| Cramo Oyj (B Shares) | 186,710 | 3,734,951 | |
| Olvi PLC (A Shares) | 126,157 | 3,504,504 | |
| Tikkurila Oyj | 269,946 | 4,732,347 | |
| TOTAL FINLAND | 21,445,577 | ||
| France - 4.0% | |||
| ALTEN | 105,219 | 6,505,975 | |
| Coface SA | 358,202 | 2,891,212 | |
| Rexel SA | 300,300 | 4,549,248 | |
| Saft Groupe SA | 116,100 | 3,608,000 | |
| The Lisi Group | 143,009 | 4,092,174 | |
| The Vicat Group | 88,556 | 6,165,184 | |
| Thermador Groupe SA | 27,557 | 2,519,914 | |
| Wendel SA | 47,235 | 5,457,321 | |
| TOTAL FRANCE | 35,789,028 | ||
| Germany - 2.0% | |||
| AURELIUS AG | 86,435 | 5,168,339 | |
| CompuGroup Medical AG | 178,949 | 7,028,260 | |
| mutares AG | 144,900 | 2,405,807 | |
| SHW Group | 102,339 | 2,953,018 | |
| TOTAL GERMANY | 17,555,424 | ||
| Greece - 0.4% | |||
| Metka SA | 435,516 | 3,332,417 | |
| Hong Kong - 1.9% | |||
| Dah Sing Banking Group Ltd. | 3,157,200 | 5,616,923 | |
| Far East Horizon Ltd. | 4,274,000 | 3,392,604 | |
| Magnificent Hotel Investment L | 113,522,000 | 2,805,015 | |
| Shun Ho Technology Holdings Ltd. | 1,650,033 | 552,810 | |
| Techtronic Industries Co. Ltd. | 1,142,000 | 4,280,981 | |
| TOTAL HONG KONG | 16,648,333 | ||
| India - 0.6% | |||
| Edelweiss Financial Services Ltd. | 3,634,440 | 3,176,178 | |
| Torrent Pharmaceuticals Ltd. | 100,431 | 2,162,444 | |
| TOTAL INDIA | 5,338,622 | ||
| Indonesia - 0.7% | |||
| PT ACE Hardware Indonesia Tbk | 43,202,200 | 3,030,182 | |
| PT Media Nusantara Citra Tbk | 17,060,400 | 3,040,032 | |
| TOTAL INDONESIA | 6,070,214 | ||
| Ireland - 2.5% | |||
| C&C Group PLC | 885,778 | 3,978,942 | |
| Mincon Group PLC | 5,015,823 | 4,284,553 | |
| Origin Enterprises PLC | 588,700 | 4,147,007 | |
| United Drug PLC (United Kingdom) | 1,079,749 | 9,655,373 | |
| TOTAL IRELAND | 22,065,875 | ||
| Isle of Man - 0.6% | |||
| Optimal Payments PLC (b) | 1,050,400 | 5,850,627 | |
| Israel - 1.0% | |||
| Frutarom Industries Ltd. | 167,089 | 8,563,621 | |
| Italy - 1.1% | |||
| Banco di Desio e della Brianza SpA | 669,139 | 1,886,379 | |
| Danieli & C. Officine Meccaniche SpA | 98,967 | 2,170,119 | |
| Recordati SpA | 232,561 | 5,909,063 | |
| TOTAL ITALY | 9,965,561 | ||
| Japan - 22.2% | |||
| A/S One Corp. | 142,500 | 5,138,270 | |
| Aeon Delight Co. Ltd. | 192,900 | 5,326,040 | |
| Ain Holdings, Inc. | 61,100 | 2,968,116 | |
| Arc Land Sakamoto Co. Ltd. | 432,300 | 4,488,634 | |
| Broadleaf Co. Ltd. | 383,300 | 3,787,796 | |
| Central Automotive Products Ltd. (d) | 316,000 | 2,633,793 | |
| Daiwa Industries Ltd. | 495,600 | 4,248,249 | |
| Dexerials Corp. | 303,900 | 2,459,684 | |
| Fuji Corp. | 149,100 | 2,347,486 | |
| Fukuda Denshi Co. Ltd. | 129,800 | 7,087,053 | |
| Funai Soken Holdings, Inc. | 190,320 | 2,887,506 | |
| GMO Internet, Inc. | 404,200 | 4,745,925 | |
| Iida Group Holdings Co. Ltd. | 223,551 | 4,175,060 | |
| Japan Meat Co. Ltd. | 195,300 | 1,940,491 | |
| JSR Corp. | 621,100 | 8,514,147 | |
| KAWAI Musical Instruments Manufacturing Co. Ltd. | 165,700 | 3,016,977 | |
| Kinugawa Rubber Industrial Co. Ltd. | 733,000 | 5,103,808 | |
| Konica Minolta, Inc. | 286,800 | 2,475,534 | |
| Kotobuki Spirits Co. Ltd. | 165,900 | 3,228,062 | |
| Leopalace21 Corp. (b) | 966,500 | 5,799,511 | |
| Meitec Corp. | 145,700 | 5,054,040 | |
| Minebea Mitsumi, Inc. | 382,000 | 3,128,958 | |
| Miraca Holdings, Inc. | 131,500 | 5,588,374 | |
| Mitani Shoji Co. Ltd. | 247,700 | 7,137,523 | |
| Monex Group, Inc. | 699,100 | 1,803,481 | |
| Nihon House Holdings Co. Ltd. (a) | 795,600 | 2,681,573 | |
| Nihon Parkerizing Co. Ltd. (d) | 366,900 | 3,236,205 | |
| Nitori Holdings Co. Ltd. | 95,300 | 8,864,694 | |
| Paramount Bed Holdings Co. Ltd. | 205,600 | 7,648,082 | |
| Ricoh Leasing Co. Ltd. | 243,600 | 7,037,993 | |
| S Foods, Inc. (a) | 337,600 | 8,036,637 | |
| San-Ai Oil Co. Ltd. | 589,000 | 4,127,949 | |
| Shinsei Bank Ltd. | 3,781,000 | 5,299,360 | |
| Ship Healthcare Holdings, Inc. | 161,700 | 3,990,497 | |
| TKC Corp. | 239,700 | 6,512,310 | |
| Toshiba Plant Systems & Services Corp. | 582,700 | 7,205,920 | |
| Toyo Suisan Kaisha Ltd. | 103,400 | 3,651,856 | |
| Tsuruha Holdings, Inc. | 100,000 | 9,591,564 | |
| VT Holdings Co. Ltd. | 1,114,800 | 5,632,719 | |
| Welcia Holdings Co. Ltd. | 77,700 | 4,104,307 | |
| Yamada Consulting Group Co. Ltd. | 174,600 | 5,334,116 | |
| TOTAL JAPAN | 198,040,300 | ||
| Korea (South) - 1.3% | |||
| BGFretail Co. Ltd. | 17,709 | 2,875,051 | |
| Fila Korea Ltd. | 43,834 | 3,979,083 | |
| Hy-Lok Corp. | 125,792 | 3,123,733 | |
| NS Shopping Co. Ltd. (b) | 12,780 | 1,673,249 | |
| TOTAL KOREA (SOUTH) | 11,651,116 | ||
| Luxembourg - 0.5% | |||
| Grand City Properties SA | 189,517 | 4,186,054 | |
| Mexico - 0.0% | |||
| Genomma Lab Internacional SA de CV (b) | 66,889 | 73,480 | |
| Netherlands - 2.1% | |||
| Amsterdam Commodities NV | 196,055 | 5,296,907 | |
| Arcadis NV | 199,900 | 3,423,132 | |
| BinckBank NV | 737,859 | 4,343,556 | |
| IMCD Group BV | 142,000 | 5,733,174 | |
| TOTAL NETHERLANDS | 18,796,769 | ||
| New Zealand - 2.2% | |||
| EBOS Group Ltd. | 929,004 | 10,352,886 | |
| Nuplex Industries Ltd. | 2,454,889 | 9,033,445 | |
| TOTAL NEW ZEALAND | 19,386,331 | ||
| Norway - 2.0% | |||
| ABG Sundal Collier ASA (a) | 6,615,910 | 4,617,748 | |
| Ekornes A/S | 331,597 | 3,871,175 | |
| Kongsberg Gruppen ASA | 337,433 | 5,657,514 | |
| Spectrum ASA | 1,183,572 | 3,895,336 | |
| TOTAL NORWAY | 18,041,773 | ||
| Philippines - 0.2% | |||
| Century Pacific Food, Inc. | 4,939,000 | 1,984,631 | |
| Portugal - 0.5% | |||
| NOS SGPS SA | 670,400 | 4,809,274 | |
| Romania - 0.4% | |||
| Banca Transilvania SA | 5,501,626 | 3,775,557 | |
| Singapore - 2.2% | |||
| Boustead Projects Pte Ltd. (b) | 618,906 | 296,832 | |
| Boustead Singapore Ltd. | 2,267,369 | 1,315,052 | |
| Hour Glass Ltd. | 8,087,500 | 4,510,261 | |
| Mapletree Industrial (REIT) | 3,150,494 | 3,759,931 | |
| OSIM International Ltd. | 3,765,300 | 3,891,711 | |
| Wing Tai Holdings Ltd. | 4,110,600 | 5,731,029 | |
| TOTAL SINGAPORE | 19,504,816 | ||
| South Africa - 0.8% | |||
| Clicks Group Ltd. | 992,132 | 7,246,235 | |
| Spain - 0.5% | |||
| Hispania Activos Inmobiliarios SA (b) | 315,800 | 4,628,567 | |
| Sweden - 1.1% | |||
| Addlife AB (b) | 59,554 | 752,726 | |
| AddTech AB (B Shares) | 211,219 | 2,656,528 | |
| Coor Service Management Holding AB | 474,600 | 2,245,802 | |
| Ratos AB (B Shares) (a) | 711,500 | 4,162,440 | |
| TOTAL SWEDEN | 9,817,496 | ||
| Switzerland - 3.3% | |||
| Allied World Assurance Co. Holdings AG | 239,504 | 8,521,552 | |
| Daetwyler Holdings AG | 18,222 | 2,708,701 | |
| Pargesa Holding SA | 27,516 | 1,911,750 | |
| Vontobel Holdings AG | 189,326 | 8,190,377 | |
| VZ Holding AG | 24,982 | 7,773,509 | |
| TOTAL SWITZERLAND | 29,105,889 | ||
| Taiwan - 2.2% | |||
| King's Town Bank | 4,364,000 | 3,039,656 | |
| Sunspring Metal Corp. | 3,075,000 | 3,864,811 | |
| Tripod Technology Corp. | 2,830,000 | 5,177,631 | |
| Vanguard International Semiconductor Corp. | 3,124,000 | 4,782,274 | |
| Yung Chi Paint & Varnish Manufacturing Co. Ltd. | 1,182,000 | 2,630,895 | |
| TOTAL TAIWAN | 19,495,267 | ||
| Thailand - 1.0% | |||
| Delta Electronics PCL (For. Reg.) | 2,525,300 | 5,206,804 | |
| TISCO Financial Group PCL | 2,773,700 | 3,455,210 | |
| TOTAL THAILAND | 8,662,014 | ||
| Turkey - 0.4% | |||
| Aygaz A/S | 864,000 | 3,560,372 | |
| United Kingdom - 14.8% | |||
| Aberdeen Asset Management PLC | 799,849 | 3,490,905 | |
| AEW UK REIT PLC | 2,828,268 | 4,132,524 | |
| Alliance Pharma PLC | 3,728,897 | 2,451,815 | |
| Amec Foster Wheeler PLC | 556,552 | 4,016,424 | |
| Ashmore Group PLC (a) | 1,036,507 | 4,651,006 | |
| BBA Aviation PLC | 2,510,798 | 7,344,642 | |
| Bond International Software PLC | 899,666 | 1,156,801 | |
| Brammer PLC (a) | 1,014,728 | 2,587,259 | |
| Brewin Dolphin Holding PLC | 808,175 | 3,235,570 | |
| Cineworld Group PLC | 431,676 | 3,267,251 | |
| Close Brothers Group PLC | 269,680 | 4,775,800 | |
| Countrywide PLC | 1,161,507 | 6,031,621 | |
| Diploma PLC | 363,251 | 3,882,540 | |
| Elementis PLC | 1,178,900 | 3,718,985 | |
| Empiric Student Property PLC | 1,836,872 | 3,012,729 | |
| Exova Group Ltd. PLC | 1,002,769 | 2,344,313 | |
| Informa PLC | 560,320 | 5,358,467 | |
| ITE Group PLC | 1,873,654 | 4,250,263 | |
| James Fisher and Sons PLC | 204,800 | 4,234,296 | |
| Jardine Lloyd Thompson Group PLC | 270,900 | 3,431,807 | |
| John Wood Group PLC | 542,500 | 4,950,248 | |
| Luxfer Holdings PLC sponsored ADR | 491,254 | 6,312,614 | |
| McColl's Retail Group PLC | 1,844,974 | 4,313,254 | |
| Mears Group PLC | 1,047,710 | 6,100,483 | |
| Melrose Industries PLC | 142,773 | 778,751 | |
| Micro Focus International PLC | 507,044 | 11,327,864 | |
| PayPoint PLC | 243,111 | 2,994,518 | |
| Sinclair Pharma PLC (b) | 6,297,432 | 3,312,537 | |
| Spectris PLC | 200,847 | 5,344,045 | |
| The Restaurant Group PLC | 676,100 | 2,717,668 | |
| Ultra Electronics Holdings PLC | 259,525 | 6,696,759 | |
| TOTAL UNITED KINGDOM | 132,223,759 | ||
| United States of America - 0.9% | |||
| Dillard's, Inc. Class A | 93,994 | 6,621,877 | |
| Hornbeck Offshore Services, Inc. (a)(b) | 152,170 | 1,786,476 | |
| YOU On Demand Holdings, Inc. warrants 8/30/17 (b)(e) | 27,500 | 615 | |
| TOTAL UNITED STATES OF AMERICA | 8,408,968 | ||
| TOTAL COMMON STOCKS | |||
| (Cost $827,590,703) | 843,951,228 | ||
| Nonconvertible Preferred Stocks - 0.4% | |||
| Brazil - 0.4% | |||
| Banco ABC Brasil SA | |||
| (Cost $3,961,678) | 1,117,476 | 3,850,284 | |
| Money Market Funds - 6.0% | |||
| Fidelity Cash Central Fund, 0.38% (f) | 39,282,539 | 39,282,539 | |
| Fidelity Securities Lending Cash Central Fund, 0.42% (f)(g) | 13,711,375 | 13,711,375 | |
| TOTAL MONEY MARKET FUNDS | |||
| (Cost $52,993,914) | 52,993,914 | ||
| TOTAL INVESTMENT PORTFOLIO - 101.0% | |||
| (Cost $884,546,295) | 900,795,426 | ||
| NET OTHER ASSETS (LIABILITIES) - (1.0)% | (8,908,552) | ||
| NET ASSETS - 100% | $891,886,874 |
Categorizations in the Schedule of Investments are based on country or territory of incorporation.
Legend
(a) Security or a portion of the security is on loan at period end.
(b) Non-income producing
(c) Affiliated company
(d) Security or a portion of the security purchased on a delayed delivery or when-issued basis.
(e) Restricted securities - Investment in securities not registered under the Securities Act of 1933 (excluding 144A issues). At the end of the period, the value of restricted securities (excluding 144A issues) amounted to $615 or 0.0% of net assets.
(f) Affiliated fund that is generally available only to investment companies and other accounts managed by Fidelity Investments. The rate quoted is the annualized seven-day yield of the fund at period end. A complete unaudited listing of the fund's holdings as of its most recent quarter end is available upon request. In addition, each Fidelity Central Fund's financial statements are available on the SEC's website or upon request.
(g) Investment made with cash collateral received from securities on loan.
Additional information on each restricted holding is as follows:
| Security | Acquisition Date | Acquisition Cost |
| YOU On Demand Holdings, Inc. warrants 8/30/17 | 9/14/12 | $0 |
Affiliated Central Funds
Information regarding fiscal year to date income earned by the Fund from investments in Fidelity Central Funds is as follows:
| Fund | Income earned |
| Fidelity Cash Central Fund | $61,241 |
| Fidelity Securities Lending Cash Central Fund | 178,311 |
| Total | $239,552 |
Other Affiliated Issuers
An affiliated company is a company in which the Fund has ownership of at least 5% of the voting securities. Fiscal year to date transactions with companies which are or were affiliates are as follows:
| Affiliate | Value, beginning of period | Purchases | Sales Proceeds | Dividend Income | Value, end of period |
| Imdex Ltd. | $1,246,756 | $769,515 | $-- | $-- | $2,039,795 |
| Total | $1,246,756 | $769,515 | $-- | $-- | $2,039,795 |
Investment Valuation
The following is a summary of the inputs used, as of April 30, 2016, involving the Fund's assets and liabilities carried at fair value. The inputs or methodology used for valuing securities may not be an indication of the risk associated with investing in those securities. For more information on valuation inputs, and their aggregation into the levels used below, please refer to the Investment Valuation section in the accompanying Notes to Financial Statements.
| Valuation Inputs at Reporting Date: | ||||
| Description | Total | Level 1 | Level 2 | Level 3 |
| Investments in Securities: | ||||
| Equities: | ||||
| Consumer Discretionary | $135,678,269 | $77,543,137 | $58,135,132 | $-- |
| Consumer Staples | 79,343,595 | 45,822,562 | 33,521,033 | -- |
| Energy | 36,083,912 | 31,955,963 | 4,127,949 | -- |
| Financials | 184,335,775 | 152,249,248 | 32,086,527 | -- |
| Health Care | 77,652,797 | 48,200,521 | 29,452,276 | -- |
| Industrials | 175,903,353 | 121,229,081 | 54,674,272 | -- |
| Information Technology | 84,766,467 | 64,785,217 | 19,981,249 | 1 |
| Materials | 70,476,972 | 49,234,858 | 21,242,113 | 1 |
| Utilities | 3,560,372 | 3,560,372 | -- | -- |
| Money Market Funds | 52,993,914 | 52,993,914 | -- | -- |
| Total Investments in Securities: | $900,795,426 | $647,574,873 | $253,220,551 | $2 |
The following is a summary of transfers between Level 1 and Level 2 for the period ended April 30, 2016. Transfers are assumed to have occurred at the beginning of the period, and are primarily attributable to the valuation techniques used for foreign equity securities, as discussed in the accompanying Notes to Financial Statements:
| Transfers | Total |
| Level 1 to Level 2 | $3,784,452 |
| Level 2 to Level 1 | $53,766,744 |
See accompanying notes which are an integral part of the financial statements.
Financial Statements
Statement of Assets and Liabilities
| April 30, 2016 (Unaudited) | ||
| Assets | ||
| Investment in securities, at value (including securities loaned of $13,024,078) — See accompanying schedule: Unaffiliated issuers (cost $826,178,703) | $845,761,717 | |
| Fidelity Central Funds (cost $52,993,914) | 52,993,914 | |
| Other affiliated issuers (cost $5,373,678) | 2,039,795 | |
| Total Investments (cost $884,546,295) | $900,795,426 | |
| Foreign currency held at value (cost $3,435,438) | 3,443,129 | |
| Receivable for investments sold | 1,018,282 | |
| Receivable for fund shares sold | 680,172 | |
| Dividends receivable | 5,489,031 | |
| Distributions receivable from Fidelity Central Funds | 53,923 | |
| Prepaid expenses | 773 | |
| Other receivables | 13,513 | |
| Total assets | 911,494,249 | |
| Liabilities | ||
| Payable for investments purchased | ||
| Regular delivery | $2,507,860 | |
| Delayed delivery | 73,580 | |
| Payable for fund shares redeemed | 2,257,365 | |
| Accrued management fee | 696,108 | |
| Distribution and service plan fees payable | 20,488 | |
| Other affiliated payables | 220,069 | |
| Other payables and accrued expenses | 120,530 | |
| Collateral on securities loaned, at value | 13,711,375 | |
| Total liabilities | 19,607,375 | |
| Net Assets | $891,886,874 | |
| Net Assets consist of: | ||
| Paid in capital | $875,247,184 | |
| Undistributed net investment income | 8,805,214 | |
| Accumulated undistributed net realized gain (loss) on investments and foreign currency transactions | (8,523,197) | |
| Net unrealized appreciation (depreciation) on investments and assets and liabilities in foreign currencies | 16,357,673 | |
| Net Assets | $891,886,874 | |
| Calculation of Maximum Offering Price | ||
| Class A: | ||
| Net Asset Value and redemption price per share ($31,897,656 ÷ 1,419,288 shares) | $22.47 | |
| Maximum offering price per share (100/94.25 of $22.47) | $23.84 | |
| Class T: | ||
| Net Asset Value and redemption price per share ($13,016,808 ÷ 582,355 shares) | $22.35 | |
| Maximum offering price per share (100/96.50 of $22.35) | $23.16 | |
| Class B: | ||
| Net Asset Value and offering price per share ($276,630 ÷ 12,519 shares)(a) | $22.10 | |
| Class C: | ||
| Net Asset Value and offering price per share ($9,910,610 ÷ 455,303 shares)(a) | $21.77 | |
| International Small Cap: | ||
| Net Asset Value, offering price and redemption price per share ($828,798,591 ÷ 36,296,748 shares) | $22.83 | |
| Class I: | ||
| Net Asset Value, offering price and redemption price per share ($7,986,579 ÷ 347,003 shares) | $23.02 |
(a) Redemption price per share is equal to net asset value less any applicable contingent deferred sales charge.
See accompanying notes which are an integral part of the financial statements.
Statement of Operations
| Six months ended April 30, 2016 (Unaudited) | ||
| Investment Income | ||
| Dividends | $15,653,620 | |
| Income from Fidelity Central Funds | 239,552 | |
| Income before foreign taxes withheld | 15,893,172 | |
| Less foreign taxes withheld | (1,109,413) | |
| Total income | 14,783,759 | |
| Expenses | ||
| Management fee | ||
| Basic fee | $3,548,462 | |
| Performance adjustment | 764,573 | |
| Transfer agent fees | 1,114,365 | |
| Distribution and service plan fees | 119,772 | |
| Accounting and security lending fees | 200,536 | |
| Custodian fees and expenses | 146,102 | |
| Independent trustees' compensation | 1,816 | |
| Registration fees | 47,264 | |
| Audit | 52,823 | |
| Legal | 1,099 | |
| Miscellaneous | 2,661 | |
| Total expenses before reductions | 5,999,473 | |
| Expense reductions | (7,275) | 5,992,198 |
| Net investment income (loss) | 8,791,561 | |
| Realized and Unrealized Gain (Loss) | ||
| Net realized gain (loss) on: | ||
| Investment securities: | ||
| Unaffiliated issuers | (883,158) | |
| Foreign currency transactions | (42,970) | |
| Total net realized gain (loss) | (926,128) | |
| Change in net unrealized appreciation (depreciation) on: Investment securities | 17,069,850 | |
| Assets and liabilities in foreign currencies | 179,334 | |
| Total change in net unrealized appreciation (depreciation) | 17,249,184 | |
| Net gain (loss) | 16,323,056 | |
| Net increase (decrease) in net assets resulting from operations | $25,114,617 |
See accompanying notes which are an integral part of the financial statements.
Statement of Changes in Net Assets
| Six months ended April 30, 2016 (Unaudited) | Year ended October 31, 2015 | |
| Increase (Decrease) in Net Assets | ||
| Operations | ||
| Net investment income (loss) | $8,791,561 | $11,998,423 |
| Net realized gain (loss) | (926,128) | 25,838,406 |
| Change in net unrealized appreciation (depreciation) | 17,249,184 | 6,824,724 |
| Net increase (decrease) in net assets resulting from operations | 25,114,617 | 44,661,553 |
| Distributions to shareholders from net investment income | (10,933,091) | (7,662,528) |
| Distributions to shareholders from net realized gain | (23,540,154) | (116,906,834) |
| Total distributions | (34,473,245) | (124,569,362) |
| Share transactions - net increase (decrease) | 27,183,054 | 53,722,708 |
| Redemption fees | 70,645 | 103,111 |
| Total increase (decrease) in net assets | 17,895,071 | (26,081,990) |
| Net Assets | ||
| Beginning of period | 873,991,803 | 900,073,793 |
| End of period (including undistributed net investment income of $8,805,214 and undistributed net investment income of $10,946,744, respectively) | $891,886,874 | $873,991,803 |
See accompanying notes which are an integral part of the financial statements.
Financial Highlights — Fidelity International Small Cap Fund Class A
| Six months ended (Unaudited) April 30, | Years ended October 31, | |||||
| 2016 | 2015 | 2014 | 2013 | 2012 | 2011 | |
| Selected Per–Share Data | ||||||
| Net asset value, beginning of period | $22.69 | $24.98 | $26.34 | $19.74 | $18.97 | $20.42 |
| Income from Investment Operations | ||||||
| Net investment income (loss)A | .20 | .27 | .17 | .06 | .06 | .10 |
| Net realized and unrealized gain (loss) | .45 | 1.05 | (.89) | 6.94 | 1.09 | (.88) |
| Total from investment operations | .65 | 1.32 | (.72) | 7.00 | 1.15 | (.78) |
| Distributions from net investment income | (.25) | (.16) | (.05) | (.07) | (.11) | (.02) |
| Distributions from net realized gain | (.62) | (3.45) | (.60) | (.33) | (.27) | (.66) |
| Total distributions | (.87) | (3.61) | (.65) | (.40) | (.38) | (.68) |
| Redemption fees added to paid in capitalA | –B | –B | .01 | –B | –B | .01 |
| Net asset value, end of period | $22.47 | $22.69 | $24.98 | $26.34 | $19.74 | $18.97 |
| Total ReturnC,D,E | 2.97% | 6.21% | (2.79)% | 36.18% | 6.28% | (4.00)% |
| Ratios to Average Net AssetsF,G | ||||||
| Expenses before reductions | 1.66%H | 1.59% | 1.50% | 1.61% | 1.63% | 1.56% |
| Expenses net of fee waivers, if any | 1.66%H | 1.58% | 1.50% | 1.61% | 1.63% | 1.55% |
| Expenses net of all reductions | 1.66%H | 1.58% | 1.50% | 1.60% | 1.60% | 1.54% |
| Net investment income (loss) | 1.88%H | 1.18% | .65% | .25% | .32% | .49% |
| Supplemental Data | ||||||
| Net assets, end of period (000 omitted) | $31,898 | $28,238 | $24,572 | $24,020 | $14,125 | $17,185 |
| Portfolio turnover rateI | 25%H | 36% | 102% | 54% | 68% | 47% |
A Calculated based on average shares outstanding during the period.
B Amount represents less than $.005 per share.
C Total returns for periods of less than one year are not annualized.
D Total returns would have been lower if certain expenses had not been reduced during the applicable periods shown.
E Total returns do not include the effect of the sales charges.
F Fees and expenses of any underlying Fidelity Central Funds are not included in the Fund's expense ratio. The Fund indirectly bears its proportionate share of the expenses of any underlying Fidelity Central Funds.
G Expense ratios reflect operating expenses of the class. Expenses before reductions do not reflect amounts reimbursed by the investment adviser or reductions from brokerage service arrangements or reductions from other expense offset arrangements and do not represent the amount paid by the class during periods when reimbursements or reductions occur. Expenses net of fee waivers reflect expenses after reimbursement by the investment adviser but prior to reductions from brokerage service arrangements or other expense offset arrangements. Expenses net of all reductions represent the net expenses paid by the class.
H Annualized
I Amount does not include the portfolio activity of any underlying Fidelity Central Funds.
See accompanying notes which are an integral part of the financial statements.
Financial Highlights — Fidelity International Small Cap Fund Class T
| Six months ended (Unaudited) April 30, | Years ended October 31, | |||||
| 2016 | 2015 | 2014 | 2013 | 2012 | 2011 | |
| Selected Per–Share Data | ||||||
| Net asset value, beginning of period | $22.55 | $24.81 | $26.17 | $19.59 | $18.80 | $20.23 |
| Income from Investment Operations | ||||||
| Net investment income (loss)A | .17 | .21 | .10 | –B | .01 | .05 |
| Net realized and unrealized gain (loss) | .44 | 1.04 | (.87) | 6.90 | 1.08 | (.86) |
| Total from investment operations | .61 | 1.25 | (.77) | 6.90 | 1.09 | (.81) |
| Distributions from net investment income | (.19) | (.06) | – | – | (.03) | – |
| Distributions from net realized gain | (.62) | (3.45) | (.60) | (.32) | (.27) | (.63) |
| Total distributions | (.81) | (3.51) | (.60) | (.32) | (.30) | (.63) |
| Redemption fees added to paid in capitalA | –B | –B | .01 | –B | –B | .01 |
| Net asset value, end of period | $22.35 | $22.55 | $24.81 | $26.17 | $19.59 | $18.80 |
| Total ReturnC,D,E | 2.81% | 5.90% | (3.00)% | 35.80% | 5.97% | (4.18)% |
| Ratios to Average Net AssetsF,G | ||||||
| Expenses before reductions | 1.95%H | 1.87% | 1.77% | 1.87% | 1.88% | 1.82% |
| Expenses net of fee waivers, if any | 1.95%H | 1.86% | 1.77% | 1.87% | 1.88% | 1.81% |
| Expenses net of all reductions | 1.95%H | 1.86% | 1.76% | 1.85% | 1.85% | 1.79% |
| Net investment income (loss) | 1.58%H | .90% | .38% | (.01)% | .07% | .24% |
| Supplemental Data | ||||||
| Net assets, end of period (000 omitted) | $13,017 | $12,400 | $12,296 | $13,530 | $9,262 | $13,744 |
| Portfolio turnover rateI | 25%H | 36% | 102% | 54% | 68% | 47% |
A Calculated based on average shares outstanding during the period.
B Amount represents less than $.005 per share.
C Total returns for periods of less than one year are not annualized.
D Total returns would have been lower if certain expenses had not been reduced during the applicable periods shown.
E Total returns do not include the effect of the sales charges.
F Fees and expenses of any underlying Fidelity Central Funds are not included in the Fund's expense ratio. The Fund indirectly bears its proportionate share of the expenses of any underlying Fidelity Central Funds.
G Expense ratios reflect operating expenses of the class. Expenses before reductions do not reflect amounts reimbursed by the investment adviser or reductions from brokerage service arrangements or reductions from other expense offset arrangements and do not represent the amount paid by the class during periods when reimbursements or reductions occur. Expenses net of fee waivers reflect expenses after reimbursement by the investment adviser but prior to reductions from brokerage service arrangements or other expense offset arrangements. Expenses net of all reductions represent the net expenses paid by the class.
H Annualized
I Amount does not include the portfolio activity of any underlying Fidelity Central Funds.
See accompanying notes which are an integral part of the financial statements.
Financial Highlights — Fidelity International Small Cap Fund Class B
| Six months ended (Unaudited) April 30, | Years ended October 31, | |||||
| 2016 | 2015 | 2014 | 2013 | 2012 | 2011 | |
| Selected Per–Share Data | ||||||
| Net asset value, beginning of period | $22.22 | $24.51 | $25.87 | $19.22 | $18.38 | $19.79 |
| Income from Investment Operations | ||||||
| Net investment income (loss)A | .12 | .09 | (.03) | (.11) | (.08) | (.05) |
| Net realized and unrealized gain (loss) | .44 | 1.04 | (.87) | 6.84 | 1.07 | (.85) |
| Total from investment operations | .56 | 1.13 | (.90) | 6.73 | .99 | (.90) |
| Distributions from net investment income | (.06) | – | – | – | – | – |
| Distributions from net realized gain | (.62) | (3.42) | (.47) | (.08) | (.15) | (.52) |
| Total distributions | (.68) | (3.42) | (.47) | (.08) | (.15) | (.52) |
| Redemption fees added to paid in capitalA | –B | –B | .01 | –B | –B | .01 |
| Net asset value, end of period | $22.10 | $22.22 | $24.51 | $25.87 | $19.22 | $18.38 |
| Total ReturnC,D,E | 2.59% | 5.40% | (3.52)% | 35.14% | 5.45% | (4.68)% |
| Ratios to Average Net AssetsF,G | ||||||
| Expenses before reductions | 2.44%H | 2.36% | 2.28% | 2.37% | 2.38% | 2.32% |
| Expenses net of fee waivers, if any | 2.44%H | 2.36% | 2.28% | 2.36% | 2.38% | 2.30% |
| Expenses net of all reductions | 2.44%H | 2.36% | 2.27% | 2.35% | 2.35% | 2.29% |
| Net investment income (loss) | 1.09%H | .41% | (.13)% | (.51)% | (.43)% | (.26)% |
| Supplemental Data | ||||||
| Net assets, end of period (000 omitted) | $277 | $390 | $507 | $795 | $790 | $2,067 |
| Portfolio turnover rateI | 25%H | 36% | 102% | 54% | 68% | 47% |
A Calculated based on average shares outstanding during the period.
B Amount represents less than $.005 per share.
��C Total returns for periods of less than one year are not annualized.
D Total returns would have been lower if certain expenses had not been reduced during the applicable periods shown.
E Total returns do not include the effect of the contingent deferred sales charge.
F Fees and expenses of any underlying Fidelity Central Funds are not included in the Fund's expense ratio. The Fund indirectly bears its proportionate share of the expenses of any underlying Fidelity Central Funds.
G Expense ratios reflect operating expenses of the class. Expenses before reductions do not reflect amounts reimbursed by the investment adviser or reductions from brokerage service arrangements or reductions from other expense offset arrangements and do not represent the amount paid by the class during periods when reimbursements or reductions occur. Expenses net of fee waivers reflect expenses after reimbursement by the investment adviser but prior to reductions from brokerage service arrangements or other expense offset arrangements. Expenses net of all reductions represent the net expenses paid by the class.
H Annualized
I Amount does not include the portfolio activity of any underlying Fidelity Central Funds.
See accompanying notes which are an integral part of the financial statements.
Financial Highlights — Fidelity International Small Cap Fund Class C
| Six months ended (Unaudited) April 30, | Years ended October 31, | |||||
| 2016 | 2015 | 2014 | 2013 | 2012 | 2011 | |
| Selected Per–Share Data | ||||||
| Net asset value, beginning of period | $21.96 | $24.27 | $25.68 | $19.18 | $18.38 | $19.85 |
| Income from Investment Operations | ||||||
| Net investment income (loss)A | .11 | .09 | (.02) | (.11) | (.08) | (.04) |
| Net realized and unrealized gain (loss) | .45 | 1.02 | (.85) | 6.79 | 1.07 | (.85) |
| Total from investment operations | .56 | 1.11 | (.87) | 6.68 | .99 | (.89) |
| Distributions from net investment income | (.13) | – | – | – | – | – |
| Distributions from net realized gain | (.62) | (3.42) | (.55) | (.18) | (.19) | (.59) |
| Total distributions | (.75) | (3.42) | (.55) | (.18) | (.19) | (.59) |
| Redemption fees added to paid in capitalA | –B | –B | .01 | –B | –B | .01 |
| Net asset value, end of period | $21.77 | $21.96 | $24.27 | $25.68 | $19.18 | $18.38 |
| Total ReturnC,D,E | 2.61% | 5.37% | (3.43)% | 35.15% | 5.46% | (4.64)% |
| Ratios to Average Net AssetsF,G | ||||||
| Expenses before reductions | 2.44%H | 2.36% | 2.23% | 2.33% | 2.38% | 2.27% |
| Expenses net of fee waivers, if any | 2.44%H | 2.35% | 2.22% | 2.33% | 2.38% | 2.26% |
| Expenses net of all reductions | 2.44%H | 2.35% | 2.22% | 2.32% | 2.35% | 2.24% |
| Net investment income (loss) | 1.09%H | .41% | (.07)% | (.47)% | (.43)% | (.21)% |
| Supplemental Data | ||||||
| Net assets, end of period (000 omitted) | $9,911 | $11,359 | $12,576 | $13,426 | $6,799 | $9,545 |
| Portfolio turnover rateI | 25%H | 36% | 102% | 54% | 68% | 47% |
A Calculated based on average shares outstanding during the period.
B Amount represents less than $.005 per share.
C Total returns for periods of less than one year are not annualized.
D Total returns would have been lower if certain expenses had not been reduced during the applicable periods shown.
E Total returns do not include the effect of the contingent deferred sales charge.
F Fees and expenses of any underlying Fidelity Central Funds are not included in the Fund's expense ratio. The Fund indirectly bears its proportionate share of the expenses of any underlying Fidelity Central Funds.
G Expense ratios reflect operating expenses of the class. Expenses before reductions do not reflect amounts reimbursed by the investment adviser or reductions from brokerage service arrangements or reductions from other expense offset arrangements and do not represent the amount paid by the class during periods when reimbursements or reductions occur. Expenses net of fee waivers reflect expenses after reimbursement by the investment adviser but prior to reductions from brokerage service arrangements or other expense offset arrangements. Expenses net of all reductions represent the net expenses paid by the class.
H Annualized
I Amount does not include the portfolio activity of any underlying Fidelity Central Funds.
See accompanying notes which are an integral part of the financial statements.
Financial Highlights — Fidelity International Small Cap Fund
| Six months ended (Unaudited) April 30, | Years ended October 31, | |||||
| 2016 | 2015 | 2014 | 2013 | 2012 | 2011 | |
| Selected Per–Share Data | ||||||
| Net asset value, beginning of period | $23.06 | $25.34 | $26.67 | $19.99 | $19.23 | $20.66 |
| Income from Investment Operations | ||||||
| Net investment income (loss)A | .23 | .34 | .25 | .12 | .11 | .17 |
| Net realized and unrealized gain (loss) | .45 | 1.07 | (.90) | 7.02 | 1.10 | (.89) |
| Total from investment operations | .68 | 1.41 | (.65) | 7.14 | 1.21 | (.72) |
| Distributions from net investment income | (.29) | (.24) | (.09) | (.14) | (.18) | (.06) |
| Distributions from net realized gain | (.62) | (3.45) | (.60) | (.33) | (.27) | (.66) |
| Total distributions | (.91) | (3.69) | (.69) | (.46)B | (.45) | (.72) |
| Redemption fees added to paid in capitalA | –C | –C | .01 | –C | –C | .01 |
| Net asset value, end of period | $22.83 | $23.06 | $25.34 | $26.67 | $19.99 | $19.23 |
| Total ReturnD,E | 3.07% | 6.53% | (2.48)% | 36.56% | 6.55% | (3.65)% |
| Ratios to Average Net AssetsF,G | ||||||
| Expenses before reductions | 1.40%H | 1.31% | 1.21% | 1.33% | 1.35% | 1.26% |
| Expenses net of fee waivers, if any | 1.40%H | 1.31% | 1.20% | 1.32% | 1.35% | 1.25% |
| Expenses net of all reductions | 1.40%H | 1.31% | 1.20% | 1.31% | 1.33% | 1.23% |
| Net investment income (loss) | 2.13%H | 1.45% | .95% | .53% | .59% | .80% |
| Supplemental Data | ||||||
| Net assets, end of period (000 omitted) | $828,799 | $811,534 | $842,031 | $1,029,629 | $692,769 | $856,692 |
| Portfolio turnover rateI | 25%H | 36% | 102% | 54% | 68% | 47% |
A Calculated based on average shares outstanding during the period.
B Total distributions of $.46 per share is comprised of distributions from net investment income of $.136 and distributions from net realized gain of $.327 per share.
C Amount represents less than $.005 per share.
D Total returns for periods of less than one year are not annualized.
E Total returns would have been lower if certain expenses had not been reduced during the applicable periods shown.
F Fees and expenses of any underlying Fidelity Central Funds are not included in the Fund's expense ratio. The Fund indirectly bears its proportionate share of the expenses of any underlying Fidelity Central Funds.
G Expense ratios reflect operating expenses of the class. Expenses before reductions do not reflect amounts reimbursed by the investment adviser or reductions from brokerage service arrangements or reductions from other expense offset arrangements and do not represent the amount paid by the class during periods when reimbursements or reductions occur. Expenses net of fee waivers reflect expenses after reimbursement by the investment adviser but prior to reductions from brokerage service arrangements or other expense offset arrangements. Expenses net of all reductions represent the net expenses paid by the class.
H Annualized
I Amount does not include the portfolio activity of any underlying Fidelity Central Funds.
See accompanying notes which are an integral part of the financial statements.
Financial Highlights — Fidelity International Small Cap Fund Class I
| Six months ended (Unaudited) April 30, | Years ended October 31, | |||||
| 2016 | 2015 | 2014 | 2013 | 2012 | 2011 | |
| Selected Per–Share Data | ||||||
| Net asset value, beginning of period | $23.24 | $25.34 | $26.67 | $20.00 | $19.24 | $20.66 |
| Income from Investment Operations | ||||||
| Net investment income (loss)A | .24 | .36 | .29 | .16 | .13 | .18 |
| Net realized and unrealized gain (loss) | .47 | 1.07 | (.90) | 7.00 | 1.10 | (.89) |
| Total from investment operations | .71 | 1.43 | (.61) | 7.16 | 1.23 | (.71) |
| Distributions from net investment income | (.31) | (.08) | (.13) | (.16) | (.20) | (.06) |
| Distributions from net realized gain | (.62) | (3.45) | (.60) | (.33) | (.27) | (.66) |
| Total distributions | (.93) | (3.53) | (.73) | (.49) | (.47) | (.72) |
| Redemption fees added to paid in capitalA | –B | –B | .01 | –B | –B | .01 |
| Net asset value, end of period | $23.02 | $23.24 | $25.34 | $26.67 | $20.00 | $19.24 |
| Total ReturnC,D | 3.16% | 6.60% | (2.35)% | 36.68% | 6.65% | (3.62)% |
| Ratios to Average Net AssetsE,F | ||||||
| Expenses before reductions | 1.34%G | 1.24% | 1.08% | 1.20% | 1.25% | 1.22% |
| Expenses net of fee waivers, if any | 1.34%G | 1.23% | 1.08% | 1.20% | 1.25% | 1.21% |
| Expenses net of all reductions | 1.34%G | 1.23% | 1.08% | 1.18% | 1.22% | 1.19% |
| Net investment income (loss) | 2.20%G | 1.53% | 1.07% | .66% | .70% | .84% |
| Supplemental Data | ||||||
| Net assets, end of period (000 omitted) | $7,987 | $10,070 | $8,092 | $67,038 | $9,503 | $15,752 |
| Portfolio turnover rateH | 25%G | 36% | 102% | 54% | 68% | 47% |
A Calculated based on average shares outstanding during the period.
B Amount represents less than $.005 per share.
C Total returns for periods of less than one year are not annualized.
D Total returns would have been lower if certain expenses had not been reduced during the applicable periods shown.
E Fees and expenses of any underlying Fidelity Central Funds are not included in the Fund's expense ratio. The Fund indirectly bears its proportionate share of the expenses of any underlying Fidelity Central Funds.
F Expense ratios reflect operating expenses of the class. Expenses before reductions do not reflect amounts reimbursed by the investment adviser or reductions from brokerage service arrangements or reductions from other expense offset arrangements and do not represent the amount paid by the class during periods when reimbursements or reductions occur. Expenses net of fee waivers reflect expenses after reimbursement by the investment adviser but prior to reductions from brokerage service arrangements or other expense offset arrangements. Expenses net of all reductions represent the net expenses paid by the class.
G Annualized
H Amount does not include the portfolio activity of any underlying Fidelity Central Funds.
See accompanying notes which are an integral part of the financial statements.
Notes to Financial Statements (Unaudited)
For the period ended April 30, 2016
1. Organization.
Fidelity International Small Cap Fund (the Fund) is a fund of Fidelity Investment Trust (the Trust) and is authorized to issue an unlimited number of shares. The Trust is registered under the Investment Company Act of 1940, as amended (the 1940 Act), as an open-end management investment company organized as a Massachusetts business trust. The Fund offers Class A, Class T, Class C, International Small Cap and Class I shares, each of which, along with Class B shares, has equal rights as to assets and voting privileges. Class B shares are closed to new accounts and additional purchases, except for exchanges and reinvestments. Each class has exclusive voting rights with respect to matters that affect that class. Class B shares will automatically convert to Class A shares after a maximum holding period of seven years from the initial date of purchase. The Fund's investments in emerging markets can be subject to social, economic, regulatory, and political uncertainties and can be extremely volatile.
During the period, the Board of Trustees approved the conversion of all existing Class B shares into Class A shares, effective on or about July 1, 2016, regardless of the length of times shares have been held.
2. Investments in Fidelity Central Funds.
The Fund invests in Fidelity Central Funds, which are open-end investment companies generally available only to other investment companies and accounts managed by the investment adviser and its affiliates. The Fund's Schedule of Investments lists each of the Fidelity Central Funds held as of period end, if any, as an investment of the Fund, but does not include the underlying holdings of each Fidelity Central Fund. As an Investing Fund, the Fund indirectly bears its proportionate share of the expenses of the underlying Fidelity Central Funds.
The Money Market Central Funds seek preservation of capital and current income and are managed by Fidelity Investments Money Management, Inc. (FIMM), an affiliate of the investment adviser. Annualized expenses of the Money Market Central Funds as of their most recent shareholder report date are less than .005%.
A complete unaudited list of holdings for each Fidelity Central Fund is available upon request or at the Securities and Exchange Commission (the SEC) website at www.sec.gov. In addition, the financial statements of the Fidelity Central Funds are available on the SEC website or upon request.
3. Significant Accounting Policies.
The financial statements have been prepared in conformity with accounting principles generally accepted in the United States of America (GAAP), which require management to make certain estimates and assumptions at the date of the financial statements. Actual results could differ from those estimates. Subsequent events, if any, through the date that the financial statements were issued have been evaluated in the preparation of the financial statements. The following summarizes the significant accounting policies of the Fund:
Investment Valuation. Investments are valued as of 4:00 p.m. Eastern time on the last calendar day of the period. The Board of Trustees (the Board) has delegated the day to day responsibility for the valuation of the Fund's investments to the Fidelity Management & Research Company (FMR) Fair Value Committee (the Committee). In accordance with valuation policies and procedures approved by the Board, the Fund attempts to obtain prices from one or more third party pricing vendors or brokers to value its investments. When current market prices, quotations or currency exchange rates are not readily available or reliable, investments will be fair valued in good faith by the Committee, in accordance with procedures adopted by the Board. Factors used in determining fair value vary by investment type and may include market or investment specific events. The frequency with which these procedures are used cannot be predicted and they may be utilized to a significant extent. The Committee oversees the Fund's valuation policies and procedures and reports to the Board on the Committee's activities and fair value determinations. The Board monitors the appropriateness of the procedures used in valuing the Fund's investments and ratifies the fair value determinations of the Committee.
The Fund categorizes the inputs to valuation techniques used to value its investments into a disclosure hierarchy consisting of three levels as shown below:
- Level 1 – quoted prices in active markets for identical investments
- Level 2 – other significant observable inputs (including quoted prices for similar investments, interest rates, prepayment speeds, etc.)
- Level 3 – unobservable inputs (including the Fund's own assumptions based on the best information available)
Valuation techniques used to value the Fund's investments by major category are as follows:
Equity securities, including restricted securities, for which market quotations are readily available, are valued at the last reported sale price or official closing price as reported by a third party pricing vendor on the primary market or exchange on which they are traded and are categorized as Level 1 in the hierarchy. In the event there were no sales during the day or closing prices are not available, securities are valued at the last quoted bid price or may be valued using the last available price and are generally categorized as Level 2 in the hierarchy. For foreign equity securities, when market or security specific events arise, comparisons to the valuation of American Depositary Receipts (ADRs), futures contracts, Exchange-Traded Funds (ETFs) and certain indexes as well as quoted prices for similar securities may be used and would be categorized as Level 2 in the hierarchy. Utilizing these techniques may result in transfers between Level 1 and Level 2. For equity securities, including restricted securities, where observable inputs are limited, assumptions about market activity and risk are used and these securities may be categorized as Level 3 in the hierarchy.
Investments in open-end mutual funds, including the Fidelity Central Funds, are valued at their closing net asset value (NAV) each business day and are categorized as Level 1 in the hierarchy.
Changes in valuation techniques may result in transfers in or out of an assigned level within the disclosure hierarchy. The aggregate value of investments by input level as of April 30, 2016, including information on transfers between Levels 1 and 2, is included at the end of the Fund's Schedule of Investments.
Foreign Currency. The Fund may use foreign currency contracts to facilitate transactions in foreign-denominated securities. Gains and losses from these transactions may arise from changes in the value of the foreign currency or if the counterparties do not perform under the contracts' terms.
Foreign-denominated assets, including investment securities, and liabilities are translated into U.S. dollars at the exchange rates at period end. Purchases and sales of investment securities, income and dividends received and expenses denominated in foreign currencies are translated into U.S. dollars at the exchange rate in effect on the transaction date.
The effects of exchange rate fluctuations on investments are included with the net realized and unrealized gain (loss) on investment securities. Other foreign currency transactions resulting in realized and unrealized gain (loss) are disclosed separately.
Investment Transactions and Income. For financial reporting purposes, the Fund's investment holdings and NAV include trades executed through the end of the last business day of the period. The NAV per share for processing shareholder transactions is calculated as of the close of business of the New York Stock Exchange (NYSE), normally 4:00 p.m. Eastern time and includes trades executed through the end of the prior business day. Gains and losses on securities sold are determined on the basis of identified cost and may include proceeds received from litigation. Dividend income is recorded on the ex-dividend date, except for certain dividends from foreign securities where the ex-dividend date may have passed, which are recorded as soon as the Fund is informed of the ex-dividend date. Non-cash dividends included in dividend income, if any, are recorded at the fair market value of the securities received. Income and capital gain distributions from Fidelity Central Funds, if any, are recorded on the ex-dividend date. Distributions received on securities that represent a return of capital or capital gain are recorded as a reduction of cost of investments and/or as a realized gain. Subsequent to ex-dividend date the Fund determines the components of these distributions, based upon receipt of tax filings or other correspondence relating to the underlying investment.
Class Allocations and Expenses. Investment income, realized and unrealized capital gains and losses, common expenses of the Fund, and certain fund-level expense reductions, if any, are allocated daily on a pro-rata basis to each class based on the relative net assets of each class to the total net assets of the Fund. Each class differs with respect to transfer agent and distribution and service plan fees incurred. Certain expense reductions may also differ by class. For the reporting period, the allocated portion of income and expenses to each class as a percent of its average net assets may vary due to the timing of recording these transactions in relation to fluctuating net assets of the classes. Expenses directly attributable to a fund are charged to that fund. Expenses attributable to more than one fund are allocated among the respective funds on the basis of relative net assets or other appropriate methods. Expense estimates are accrued in the period to which they relate and adjustments are made when actual amounts are known.
Income Tax Information and Distributions to Shareholders. Each year, the Fund intends to qualify as a regulated investment company under Subchapter M of the Internal Revenue Code, including distributing substantially all of its taxable income and realized gains. As a result, no provision for U.S. Federal income taxes is required. The Fund files a U.S. federal tax return, in addition to state and local tax returns as required. The Fund's federal income tax returns are subject to examination by the Internal Revenue Service (IRS) for a period of three fiscal years after they are filed. State and local tax returns may be subject to examination for an additional fiscal year depending on the jurisdiction. Foreign taxes are provided for based on the Fund's understanding of the tax rules and rates that exist in the foreign markets in which it invests.
Distributions are declared and recorded on the ex-dividend date. Income dividends and capital gain distributions are declared separately for each class. Income and capital gain distributions are determined in accordance with income tax regulations, which may differ from GAAP.
Capital accounts within the financial statements are adjusted for permanent book-tax differences. These adjustments have no impact on net assets or the results of operations. Capital accounts are not adjusted for temporary book-tax differences which will reverse in a subsequent period.
Book-tax differences are primarily due to foreign currency transactions, certain foreign taxes, passive foreign investment companies (PFIC) and losses deferred due to wash sales.
The federal tax cost of investment securities and unrealized appreciation (depreciation) as of period end were as follows:
| Gross unrealized appreciation | $118,739,691 |
| Gross unrealized depreciation | (109,342,665) |
| Net unrealized appreciation (depreciation) on securities | $9,397,026 |
| Tax cost | $891,398,400 |
Short-Term Trading (Redemption) Fees. Shares held by investors in the Fund less than 90 days may have been subject to a redemption fee equal to 2.00% of the NAV of shares redeemed. All redemption fees, which reduce the proceeds of the shareholder redemption, are retained by the Fund and accounted for as an addition to paid in capital.
Delayed Delivery Transactions and When-Issued Securities. During the period, the Fund transacted in securities on a delayed delivery or when-issued basis. Payment and delivery may take place after the customary settlement period for that security. The price of the underlying securities and the date when the securities will be delivered and paid for are fixed at the time the transaction is negotiated. The securities purchased on a delayed delivery or when-issued basis are identified as such in the Fund's Schedule of Investments. With respect to purchase commitments, the Fund identifies securities as segregated in its records with a value at least equal to the amount of the commitment. Losses may arise due to changes in the value of the underlying securities or if the counterparty does not perform under the contract's terms, or if the issuer does not issue the securities due to political, economic, or other factors.
Restricted Securities. The Fund may invest in securities that are subject to legal or contractual restrictions on resale. These securities generally may be resold in transactions exempt from registration or to the public if the securities are registered. Disposal of these securities may involve time-consuming negotiations and expense, and prompt sale at an acceptable price may be difficult. Information regarding restricted securities is included at the end of the Fund's Schedule of Investments.
4. Purchases and Sales of Investments.
Purchases and sales of securities, other than short-term securities, aggregated $105,149,143 and $100,546,287, respectively.
5. Fees and Other Transactions with Affiliates.
Management Fee. Fidelity Management & Research Company (the investment adviser) and its affiliates provide the Fund with investment management related services for which the Fund pays a monthly management fee. The management fee is the sum of an individual fund fee rate that is based on an annual rate of .60% of the Fund's average net assets and an annualized group fee rate that averaged .25% during the period. The group fee rate is based upon the average net assets of all the mutual funds advised by the investment adviser, including any mutual funds previously advised by the investment adviser that are currently advised by Fidelity SelectCo, LLC, an affiliate of the investment adviser. The group fee rate decreases as assets under management increase and increases as assets under management decrease. In addition, the management fee is subject to a performance adjustment (up to a maximum of +/- .20% of the Fund's average net assets over a 36 month performance period). The upward or downward adjustment to the management fee is based on the relative investment performance of International Small Cap as compared to its benchmark index, the MSCI ACWI (All Country World Index) ex USA Small Cap Index effective April 1, 2014 (the MSCI EAFE Small Cap Index prior to April 1, 2014), over the same 36 month performance period. For the reporting period, the total annualized management fee rate, including the performance adjustment, was 1.03% of the Fund's average net assets. The performance adjustment included in the management fee rate may be higher or lower than the maximum performance adjustment rate due to the difference between the average net assets for the reporting and performance periods.
Distribution and Service Plan Fees. In accordance with Rule 12b-1 of the 1940 Act, the Fund has adopted separate Distribution and Service Plans for each class of shares. Certain classes pay Fidelity Distributors Corporation (FDC), an affiliate of the investment adviser, separate Distribution and Service Fees, each of which is based on an annual percentage of each class' average net assets. In addition, FDC may pay financial intermediaries for selling shares of the Fund and providing shareholder support services. For the period, the Distribution and Service Fee rates, total fees and amounts retained by FDC were as follows:
| Distribution Fee | Service Fee | Total Fees | Retained by FDC | |
| Class A | -% | .25% | $36,761 | $– |
| Class T | .25% | .25% | 30,678 | – |
| Class B | .75% | .25% | 1,596 | 1,197 |
| Class C | .75% | .25% | 50,737 | 8,321 |
| $119,772 | $9,518 |
Sales Load. FDC may receive a front-end sales charge of up to 5.75% for selling Class A shares and 3.50% for selling Class T shares, some of which is paid to financial intermediaries for selling shares of the Fund. Depending on the holding period, FDC may receive contingent deferred sales charges levied on Class A, Class T, Class B, and Class C redemptions. The deferred sales charges range from 5.00% to 1.00% for Class B shares, 1.00% for Class C shares, 1.00% for certain purchases of Class A shares and .25% for certain purchases of Class T shares.
For the period, sales charge amounts retained by FDC were as follows:
| Retained by FDC | |
| Class A | $8,966 |
| Class T | 1,548 |
| Class B(a) | 8 |
| Class C(a) | 1,861 |
| $12,383 |
(a) When Class B and Class C shares are initially sold, FDC pays commissions from its own resources to financial intermediaries through which the sales are made.
Transfer Agent Fees. Fidelity Investments Institutional Operations Company, Inc., (FIIOC), an affiliate of the investment adviser, is the transfer, dividend disbursing and shareholder servicing agent for each class of the Fund. FIIOC receives account fees and asset-based fees that vary according to the account size and type of account of the shareholders of the respective classes of the Fund. FIIOC pays for typesetting, printing and mailing of shareholder reports, except proxy statements.
For the period, transfer agent fees for each class were as follows:
| Amount | % of Class-Level Average Net Assets(a) | |
| Class A | $39,714 | .27 |
| Class T | 19,256 | .31 |
| Class B | 483 | .30 |
| Class C | 15,549 | .31 |
| International Small Cap | 1,030,543 | .27 |
| Class I | 8,820 | .20 |
| $1,114,365 |
(a) Annualized
Accounting and Security Lending Fees. Fidelity Service Company, Inc. (FSC), an affiliate of the investment adviser, maintains the Fund's accounting records. The accounting fee is based on the level of average net assets for each month. Under a separate contract, FSC administers the security lending program. The security lending fee is based on the number and duration of lending transactions.
Brokerage Commissions. The Fund placed a portion of its portfolio transactions with brokerage firms which are affiliates of the investment adviser. Brokerage commissions are included in net realized gain (loss) and change in net unrealized appreciation (depreciation) in the Statement of Operations. The commissions paid to these affiliated firms were $6 for the period.
Interfund Trades. The Fund may purchase from or sell securities to other Fidelity Funds under procedures adopted by the Board. The procedures have been designed to ensure these interfund trades are executed in accordance with Rule 17a-7 of the 1940 Act. Interfund trades are included within the respective purchases and sales amounts shown in the Purchases and Sales of Investments note.
6. Committed Line of Credit.
The Fund participates with other funds managed by the investment adviser or an affiliate in a $4.25 billion credit facility (the "line of credit") to be utilized for temporary or emergency purposes to fund shareholder redemptions or for other short-term liquidity purposes. The Fund has agreed to pay commitment fees on its pro-rata portion of the line of credit, which amounted to $731 and is reflected in Miscellaneous expenses on the Statement of Operations. During the period, the Fund did not borrow on this line of credit.
7. Security Lending.
The Fund lends portfolio securities through a lending agent from time to time in order to earn additional income. For equity securities, a lending agent is used and may loan securities to certain qualified borrowers, including Fidelity Capital Markets (FCM), a broker-dealer affiliated with the Fund. On the settlement date of the loan, the Fund receives collateral (in the form of U.S. Treasury obligations, letters of credit and/or cash) against the loaned securities and maintains collateral in an amount not less than 100% of the market value of the loaned securities during the period of the loan. The market value of the loaned securities is determined at the close of business of the Fund and any additional required collateral is delivered to the Fund on the next business day. The Fund or borrower may terminate the loan at any time, and if the borrower defaults on its obligation to return the securities loaned because of insolvency or other reasons, the Fund may apply collateral received from the borrower against the obligation. The Fund may experience delays and costs in recovering the securities loaned. Any cash collateral received is invested in the Fidelity Securities Lending Cash Central Fund. The value of loaned securities and cash collateral at period end are disclosed on the Fund's Statement of Assets and Liabilities. At period end, there were no security loans outstanding with FCM. Security lending income represents the income earned on investing cash collateral, less rebates paid to borrowers and any lending agent fees associated with the loan, plus any premium payments received for lending certain types of securities. Security lending income is presented in the Statement of Operations as a component of income from Fidelity Central Funds. Total security lending income during the period amounted to $178,311, including $844 from securities loaned to FCM.
8. Expense Reductions.
Commissions paid to certain brokers with whom the investment adviser, or its affiliates, places trades on behalf of the Fund include an amount in addition to trade execution, which may be rebated back to the Fund to offset certain expenses. This amount totaled $4,199 for the period. In addition, through arrangements with the Fund's custodian, credits realized as a result of certain uninvested cash balances were used to reduce the Fund's expenses. During the period, these credits reduced the Fund's custody expenses by $15.
In addition, during the period the investment adviser reimbursed and/or waived a portion of fund-level operating expenses in the amount of $3,061.
9. Distributions to Shareholders.
Distributions to shareholders of each class were as follows:
| �� | Six months ended April 30, 2016 | Year ended October 31, 2015 |
| From net investment income | ||
| Class A | $319,347 | $155,785 |
| Class T | 106,306 | 27,108 |
| Class B | 996 | – |
| Class C | 64,383 | – |
| International Small Cap | 10,307,620 | 7,454,709 |
| Class I | 134,439 | 24,926 |
| Total | $10,933,091 | $7,662,528 |
| From net realized gain | ||
| Class A | $788,825 | $3,382,206 |
| Class T | 339,739 | 1,671,017 |
| Class B | 10,287 | 66,002 |
| Class C | 319,340 | 1,697,539 |
| International Small Cap | 21,811,338 | 109,040,767 |
| Class I | 270,625 | 1,049,303 |
| Total | $23,540,154 | $116,906,834 |
10. Share Transactions.
Share transactions for each class were as follows and may contain automatic conversions between classes or exchanges between affiliated funds:
| Shares | Shares | Dollars | Dollars | |
| Six months ended April 30, 2016 | Year ended October 31, 2015 | Six months ended April 30, 2016 | Year ended October 31, 2015 | |
| Class A | ||||
| Shares sold | 325,140 | 432,152 | $6,861,060 | $9,990,970 |
| Reinvestment of distributions | 49,226 | 159,613 | 1,077,561 | 3,404,539 |
| Shares redeemed | (199,361) | (331,016) | (4,291,584) | (7,450,558) |
| Net increase (decrease) | 175,005 | 260,749 | $3,647,037 | $5,944,951 |
| Class T | ||||
| Shares sold | 98,594 | 124,085 | $2,040,918 | $2,869,552 |
| Reinvestment of distributions | 20,220 | 77,005 | 440,798 | 1,636,354 |
| Shares redeemed | (86,353) | (146,828) | (1,830,831) | (3,289,706) |
| Net increase (decrease) | 32,461 | 54,262 | $650,885 | $1,216,200 |
| Class B | ||||
| Shares sold | 2,210 | 4,667 | $44,407 | $108,058 |
| Reinvestment of distributions | 493 | 2,954 | 10,648 | 62,128 |
| Shares redeemed | (7,751) | (10,732) | (163,958) | (240,945) |
| Net increase (decrease) | (5,048) | (3,111) | $(108,903) | $(70,759) |
| Class C | ||||
| Shares sold | 60,963 | 196,292 | $1,285,274 | $4,379,607 |
| Reinvestment of distributions | 16,869 | 71,584 | 358,801 | 1,488,229 |
| Shares redeemed | (139,670) | (268,981) | (2,822,873) | (5,818,752) |
| Net increase (decrease) | (61,838) | (1,105) | $(1,178,798) | $49,084 |
| International Small Cap | ||||
| Shares sold | 4,597,133 | 7,876,402 | $99,766,157 | $184,799,928 |
| Reinvestment of distributions | 1,408,054 | 5,231,399 | 31,286,953 | 113,102,853 |
| Shares redeemed | (4,905,938) | (11,138,439) | (105,124,693) | (253,855,534) |
| Net increase (decrease) | 1,099,249 | 1,969,362 | $25,928,417 | $44,047,247 |
| Class I | ||||
| Shares sold | 181,821 | 256,693 | $3,999,752 | $5,987,647 |
| Reinvestment of distributions | 16,670 | 46,102 | 373,252 | 1,003,648 |
| Shares redeemed | (284,792) | (188,812) | (6,128,588) | (4,455,310) |
| Net increase (decrease) | (86,301) | 113,983 | $(1,755,584) | $2,535,985 |
11. Other.
The Fund's organizational documents provide former and current trustees and officers with a limited indemnification against liabilities arising in connection with the performance of their duties to the Fund. In the normal course of business, the Fund may also enter into contracts that provide general indemnifications. The Fund's maximum exposure under these arrangements is unknown as this would be dependent on future claims that may be made against the Fund. The risk of material loss from such claims is considered remote.
At the end of the period, the investment adviser or its affiliates were the owner of record of 14% of the total outstanding shares of the Fund.
Shareholder Expense Example
As a shareholder of the Fund, you incur two types of costs: (1) transaction costs, including sales charges (loads) on purchase payments or redemption proceeds, redemption fees and (2) ongoing costs, including management fees, distribution and/or service (12b-1) fees and other Fund expenses. This Example is intended to help you understand your ongoing costs (in dollars) of investing in the Fund and to compare these costs with the ongoing costs of investing in other mutual funds.
The Example is based on an investment of $1,000 invested at the beginning of the period and held for the entire period (November 1, 2015 to April 30, 2016).
Actual Expenses
The first line of the accompanying table for each class of the Fund provides information about actual account values and actual expenses. You may use the information in this line, together with the amount you invested, to estimate the expenses that you paid over the period. Simply divide your account value by $1,000.00 (for example, an $8,600 account value divided by $1,000.00 = 8.6), then multiply the result by the number in the first line for a class of the Fund under the heading entitled "Expenses Paid During Period" to estimate the expenses you paid on your account during this period. A small balance maintenance fee of $12.00 that is charged once a year may apply for certain accounts with a value of less than $2,000. This fee is not included in the table below. If it was, the estimate of expenses you paid during the period would be higher, and your ending account value lower, by this amount. In addition, the Fund, as a shareholder in the underlying Fidelity Central Funds, will indirectly bear its pro-rata share of the fees and expenses incurred by the underlying Fidelity Central Funds. These fees and expenses are not included in the Fund's annualized expense ratio used to calculate the expense estimate in the table below.
Hypothetical Example for Comparison Purposes
The second line of the accompanying table for each class of the Fund provides information about hypothetical account values and hypothetical expenses based on a Class' actual expense ratio and an assumed rate of return of 5% per year before expenses, which is not the Class' actual return. The hypothetical account values and expenses may not be used to estimate the actual ending account balance or expenses you paid for the period. You may use this information to compare the ongoing costs of investing in the Fund and other funds. To do so, compare this 5% hypothetical example with the 5% hypothetical examples that appear in the shareholder reports of the other funds. A small balance maintenance fee of $12.00 that is charged once a year may apply for certain accounts with a value of less than $2,000. This fee is not included in the table below. If it was, the estimate of expenses you paid during the period would be higher, and your ending account value lower, by this amount. In addition, the Fund, as a shareholder in the underlying Fidelity Central Funds, will indirectly bear its pro-rata share of the fees and expenses incurred by the underlying Fidelity Central Funds. These fees and expenses are not included in the Fund's annualized expense ratio used to calculate the expense estimate in the table below.
Please note that the expenses shown in the table are meant to highlight your ongoing costs only and do not reflect any transaction costs. Therefore, the second line of the table is useful in comparing ongoing costs only, and will not help you determine the relative total costs of owning different funds. In addition, if these transactional costs were included, your costs would have been higher.
| Annualized Expense Ratio-A | Beginning Account Value November 1, 2015 | Ending Account Value April 30, 2016 | Expenses Paid During Period-B November 1, 2015 to April 30, 2016 | |
| Class A | 1.66% | |||
| Actual | $1,000.00 | $1,029.70 | $8.38 | |
| Hypothetical-C | $1,000.00 | $1,016.61 | $8.32 | |
| Class T | 1.95% | |||
| Actual | $1,000.00 | $1,028.10 | $9.83 | |
| Hypothetical-C | $1,000.00 | $1,015.17 | $9.77 | |
| Class B | 2.44% | |||
| Actual | $1,000.00 | $1,025.90 | $12.29 | |
| Hypothetical-C | $1,000.00 | $1,012.73 | $12.21 | |
| Class C | 2.44% | |||
| Actual | $1,000.00 | $1,026.10 | $12.29 | |
| Hypothetical-C | $1,000.00 | $1,012.73 | $12.21 | |
| International Small Cap | 1.40% | |||
| Actual | $1,000.00 | $1,030.70 | $7.07 | |
| Hypothetical-C | $1,000.00 | $1,017.90 | $7.02 | |
| Class I | 1.34% | |||
| Actual | $1,000.00 | $1,031.60 | $6.77 | |
| Hypothetical-C | $1,000.00 | $1,018.20 | $6.72 |
A Annualized expense ratio reflects expenses net of applicable fee waivers.
B Expenses are equal to each Class' annualized expense ratio, multiplied by the average account value over the period, multiplied by 182/366 (to reflect the one-half year period).
C 5% return per year before expenses
![]()
Corporate Headquarters
245 Summer St.
Boston, MA 02210
www.fidelity.com
ISC-SANN-0616
1.800662.112
Fidelity Advisor® International Growth Fund - Semi-Annual Report April 30, 2016 Class I is a class of Fidelity® International Growth Fund |
|
Contents
To view a fund's proxy voting guidelines and proxy voting record for the 12-month period ended June 30, visit http://www.fidelity.com/proxyvotingresults or visit the Securities and Exchange Commission's (SEC) web site at http://www.sec.gov.
You may also call 1-877-208-0098 to request a free copy of the proxy voting guidelines.
Standard & Poor's, S&P and S&P 500 are registered service marks of The McGraw-Hill Companies, Inc. and have been licensed for use by Fidelity Distributors Corporation.
Other third-party marks appearing herein are the property of their respective owners.
All other marks appearing herein are registered or unregistered trademarks or service marks of FMR LLC or an affiliated company. © 2016 FMR LLC. All rights reserved.
This report and the financial statements contained herein are submitted for the general information of the shareholders of the Fund. This report is not authorized for distribution to prospective investors in the Fund unless preceded or accompanied by an effective prospectus.
A fund files its complete schedule of portfolio holdings with the SEC for the first and third quarters of each fiscal year on Form N-Q. Forms N-Q are available on the SEC’s web site at http://www.sec.gov. A fund's Forms N-Q may be reviewed and copied at the SEC’s Public Reference Room in Washington, DC. Information regarding the operation of the SEC's Public Reference Room may be obtained by calling 1-800-SEC-0330.
For a complete list of a fund's portfolio holdings, view the most recent holdings listing, semiannual report, or annual report on Fidelity's web site at http://www.fidelity.com, http://www.advisor.fidelity.com, or http://www.401k.com, as applicable.
NOT FDIC INSURED •MAY LOSE VALUE •NO BANK GUARANTEE
Neither the Fund nor Fidelity Distributors Corporation is a bank.
Investment Summary (Unaudited)
Geographic Diversification (% of fund's net assets)
| As of April 30, 2016 | ||
| United States of America* | 20.8% | |
| Japan | 14.1% | |
| United Kingdom | 13.2% | |
| Switzerland | 12.7% | |
| Spain | 4.9% | |
| Belgium | 4.5% | |
| Sweden | 4.4% | |
| Australia | 4.0% | |
| Denmark | 3.3% | |
| Other | 18.1% | |

* Includes Short-Term investments and Net Other Assets (Liabilities).
Percentages are based on country or territory of incorporation and are adjusted for the effect of futures contracts, if applicable.
| As of October 31, 2015 | ||
| United States of America* | 17.7% | |
| United Kingdom | 14.4% | |
| Japan | 14.0% | |
| Switzerland | 13.6% | |
| Sweden | 6.1% | |
| Spain | 4.5% | |
| Belgium | 4.2% | |
| Australia | 3.4% | |
| Denmark | 3.3% | |
| Other | 18.8% | |

* Includes Short-Term investments and Net Other Assets (Liabilities).
Percentages are based on country or territory of incorporation and are adjusted for the effect of futures contracts, if applicable.
Asset Allocation as of April 30, 2016
| % of fund's net assets | % of fund's net assets 6 months ago | |
| Stocks | 97.3 | 97.7 |
| Short-Term Investments and Net Other Assets (Liabilities) | 2.7 | 2.3 |
Top Ten Stocks as of April 30, 2016
| % of fund's net assets | % of fund's net assets 6 months ago | |
| Nestle SA (Switzerland, Food Products) | 4.9 | 3.0 |
| Roche Holding AG (participation certificate) (Switzerland, Pharmaceuticals) | 3.5 | 3.6 |
| Anheuser-Busch InBev SA NV (Belgium, Beverages) | 3.5 | 2.6 |
| Reckitt Benckiser Group PLC (United Kingdom, Household Products) | 3.2 | 2.8 |
| CSL Ltd. (Australia, Biotechnology) | 2.9 | 2.2 |
| Novartis AG (Switzerland, Pharmaceuticals) | 2.9 | 3.7 |
| Novo Nordisk A/S Series B sponsored ADR (Denmark, Pharmaceuticals) | 2.8 | 2.5 |
| Inditex SA (Spain, Specialty Retail) | 2.6 | 2.8 |
| ASSA ABLOY AB (B Shares) (Sweden, Building Products) | 2.6 | 2.2 |
| InterContinental Hotel Group PLC ADR (United Kingdom, Hotels, Restaurants & Leisure) | 2.3 | 2.0 |
| 31.2 |
Market Sectors as of April 30, 2016
| % of fund's net assets | % of fund's net assets 6 months ago | |
| Consumer Staples | 20.4 | 15.3 |
| Health Care | 19.0 | 18.5 |
| Information Technology | 14.2 | 11.7 |
| Financials | 13.5 | 18.1 |
| Consumer Discretionary | 13.3 | 15.1 |
| Industrials | 11.5 | 12.5 |
| Materials | 4.7 | 6.0 |
| Energy | 0.4 | 0.3 |
| Telecommunication Services | 0.3 | 0.2 |
Investments April 30, 2016 (Unaudited)
Showing Percentage of Net Assets
| Common Stocks - 97.3% | |||
| Shares | Value | ||
| Australia - 4.0% | |||
| CSL Ltd. | 609,912 | $48,776,866 | |
| Sydney Airport unit | 1,123,380 | 5,816,843 | |
| Transurban Group unit | 1,422,746 | 12,527,069 | |
| TOTAL AUSTRALIA | 67,120,778 | ||
| Austria - 1.2% | |||
| Andritz AG | 351,321 | 19,675,520 | |
| Belgium - 4.5% | |||
| Anheuser-Busch InBev SA NV | 469,291 | 58,088,795 | |
| KBC Groep NV | 302,468 | 16,981,098 | |
| TOTAL BELGIUM | 75,069,893 | ||
| Canada - 0.4% | |||
| Pason Systems, Inc. | 495,200 | 7,198,891 | |
| Cayman Islands - 0.9% | |||
| 58.com, Inc. ADR (a) | 128,870 | 7,042,746 | |
| Alibaba Group Holding Ltd. sponsored ADR (a) | 99,200 | 7,632,448 | |
| TOTAL CAYMAN ISLANDS | 14,675,194 | ||
| Denmark - 3.3% | |||
| Jyske Bank A/S (Reg.) | 202,800 | 8,302,703 | |
| Novo Nordisk A/S Series B sponsored ADR (b) | 826,700 | 46,121,593 | |
| TOTAL DENMARK | 54,424,296 | ||
| Finland - 0.3% | |||
| Tikkurila Oyj | 283,000 | 4,961,192 | |
| France - 1.1% | |||
| Essilor International SA | 135,658 | 17,560,644 | |
| Germany - 3.0% | |||
| Bayer AG | 155,100 | 17,892,923 | |
| SAP AG | 399,516 | 31,346,444 | |
| TOTAL GERMANY | 49,239,367 | ||
| Hong Kong - 1.9% | |||
| AIA Group Ltd. | 5,289,400 | 31,654,975 | |
| India - 0.5% | |||
| Housing Development Finance Corp. Ltd. | 562,904 | 9,223,760 | |
| Ireland - 3.1% | |||
| CRH PLC sponsored ADR | 909,066 | 26,462,911 | |
| James Hardie Industries PLC: | |||
| CDI | 1,130,041 | 15,921,470 | |
| sponsored ADR | 601,500 | 8,433,030 | |
| TOTAL IRELAND | 50,817,411 | ||
| Isle of Man - 0.5% | |||
| Playtech Ltd. | 654,346 | 7,691,806 | |
| Israel - 0.3% | |||
| Azrieli Group | 118,800 | 4,718,361 | |
| Italy - 0.7% | |||
| Azimut Holding SpA | 204,600 | 5,149,414 | |
| Interpump Group SpA | 511,426 | 7,361,097 | |
| TOTAL ITALY | 12,510,511 | ||
| Japan - 14.1% | |||
| Astellas Pharma, Inc. | 2,477,400 | 33,401,778 | |
| Coca-Cola Central Japan Co. Ltd. | 190,700 | 3,493,796 | |
| DENSO Corp. | 727,400 | 27,649,326 | |
| East Japan Railway Co. | 184,100 | 16,196,396 | |
| Hoya Corp. | 336,900 | 12,901,342 | |
| Japan Tobacco, Inc. | 589,000 | 24,065,326 | |
| Keyence Corp. | 40,062 | 24,012,883 | |
| Mitsui Fudosan Co. Ltd. | 836,000 | 20,417,154 | |
| Nintendo Co. Ltd. | 61,000 | 8,259,462 | |
| Olympus Corp. | 281,300 | 10,958,499 | |
| OSG Corp. | 344,800 | 6,407,632 | |
| Seven Bank Ltd. | 2,658,200 | 11,295,245 | |
| Shinsei Bank Ltd. | 5,146,000 | 7,212,512 | |
| SHO-BOND Holdings Co. Ltd. | 182,600 | 7,900,949 | |
| USS Co. Ltd. | 1,301,100 | 20,581,249 | |
| TOTAL JAPAN | 234,753,549 | ||
| Kenya - 0.3% | |||
| Safaricom Ltd. | 30,975,500 | 5,244,367 | |
| Korea (South) - 0.9% | |||
| BGFretail Co. Ltd. | 54,496 | 8,847,410 | |
| NAVER Corp. | 9,215 | 5,445,310 | |
| TOTAL KOREA (SOUTH) | 14,292,720 | ||
| Mexico - 0.6% | |||
| Fomento Economico Mexicano S.A.B. de CV sponsored ADR | 106,355 | 9,913,350 | |
| South Africa - 1.3% | |||
| Clicks Group Ltd. | 755,618 | 5,518,807 | |
| Naspers Ltd. Class N | 112,300 | 15,408,694 | |
| TOTAL SOUTH AFRICA | 20,927,501 | ||
| Spain - 4.9% | |||
| Amadeus IT Holding SA Class A | 514,500 | 23,411,956 | |
| Hispania Activos Inmobiliarios SA (a) | 215,259 | 3,154,974 | |
| Inditex SA | 1,361,301 | 43,699,772 | |
| Merlin Properties Socimi SA | 378,500 | 4,399,024 | |
| Prosegur Compania de Seguridad SA (Reg.) | 1,127,849 | 6,521,790 | |
| TOTAL SPAIN | 81,187,516 | ||
| Sweden - 4.4% | |||
| ASSA ABLOY AB (B Shares) (b) | 2,033,083 | 42,634,121 | |
| Fagerhult AB | 409,153 | 9,527,687 | |
| Intrum Justitia AB (b) | 112,700 | 4,044,623 | |
| Svenska Handelsbanken AB (A Shares) (b) | 1,313,920 | 17,527,894 | |
| TOTAL SWEDEN | 73,734,325 | ||
| Switzerland - 12.7% | |||
| Nestle SA | 1,091,098 | 81,439,212 | |
| Novartis AG | 625,183 | 47,577,841 | |
| Roche Holding AG (participation certificate) | 232,368 | 58,791,248 | |
| Schindler Holding AG: | |||
| (participation certificate) | 107,226 | 19,527,137 | |
| (Reg.) | 18,350 | 3,372,360 | |
| TOTAL SWITZERLAND | 210,707,798 | ||
| Taiwan - 1.1% | |||
| Taiwan Semiconductor Manufacturing Co. Ltd. | 3,934,000 | 18,046,275 | |
| United Kingdom - 13.2% | |||
| Associated British Foods PLC | 413,100 | 18,494,337 | |
| Babcock International Group PLC | 400,384 | 5,543,075 | |
| BAE Systems PLC | 1,722,200 | 12,015,201 | |
| Berendsen PLC | 707,573 | 12,199,669 | |
| Howden Joinery Group PLC | 626,100 | 4,519,241 | |
| Informa PLC | 1,396,912 | 13,358,986 | |
| InterContinental Hotel Group PLC ADR (b) | 968,696 | 38,883,457 | |
| Lloyds Banking Group PLC | 7,613,300 | 7,472,538 | |
| Prudential PLC | 1,155,443 | 22,807,906 | |
| Reckitt Benckiser Group PLC | 542,845 | 52,883,360 | |
| Rightmove PLC | 77,900 | 4,391,314 | |
| SABMiller PLC | 292,366 | 17,877,926 | |
| Shaftesbury PLC | 319,433 | 4,247,330 | |
| Unite Group PLC | 476,676 | 4,405,332 | |
| TOTAL UNITED KINGDOM | 219,099,672 | ||
| United States of America - 18.1% | |||
| Alphabet, Inc. Class A | 29,136 | 20,624,792 | |
| Autoliv, Inc. (b) | 198,769 | 24,343,239 | |
| Berkshire Hathaway, Inc. Class B (a) | 129,184 | 18,793,688 | |
| China Biologic Products, Inc. (a) | 87,966 | 10,292,022 | |
| Domino's Pizza, Inc. | 82,990 | 10,031,831 | |
| Martin Marietta Materials, Inc. | 66,400 | 11,236,872 | |
| MasterCard, Inc. Class A | 351,000 | 34,043,490 | |
| McGraw Hill Financial, Inc. | 117,100 | 12,512,135 | |
| Mohawk Industries, Inc. (a) | 117,400 | 22,614,762 | |
| Molson Coors Brewing Co. Class B | 108,600 | 10,385,418 | |
| Moody's Corp. | 94,100 | 9,007,252 | |
| MSCI, Inc. Class A | 103,200 | 7,837,008 | |
| Philip Morris International, Inc. | 210,708 | 20,674,669 | |
| PriceSmart, Inc. | 95,700 | 8,281,878 | |
| ResMed, Inc. | 170,700 | 9,525,060 | |
| Reynolds American, Inc. | 363,200 | 18,014,720 | |
| Sherwin-Williams Co. | 32,600 | 9,366,306 | |
| SS&C Technologies Holdings, Inc. | 178,400 | 10,909,160 | |
| Visa, Inc. Class A | 424,260 | 32,769,842 | |
| TOTAL UNITED STATES OF AMERICA | 301,264,144 | ||
| TOTAL COMMON STOCKS | |||
| (Cost $1,493,495,241) | 1,615,713,816 | ||
| Money Market Funds - 8.3% | |||
| Fidelity Cash Central Fund, 0.38% (c) | 31,871,334 | 31,871,334 | |
| Fidelity Securities Lending Cash Central Fund, 0.42% (c)(d) | 106,690,874 | 106,690,874 | |
| TOTAL MONEY MARKET FUNDS | |||
| (Cost $138,562,208) | 138,562,208 | ||
| TOTAL INVESTMENT PORTFOLIO - 105.6% | |||
| (Cost $1,632,057,449) | 1,754,276,024 | ||
| NET OTHER ASSETS (LIABILITIES) - (5.6)% | (93,656,005) | ||
| NET ASSETS - 100% | $1,660,620,019 |
Categorizations in the Schedule of Investments are based on country or territory of incorporation.
Legend
(a) Non-income producing
(b) Security or a portion of the security is on loan at period end.
(c) Affiliated fund that is generally available only to investment companies and other accounts managed by Fidelity Investments. The rate quoted is the annualized seven-day yield of the fund at period end. A complete unaudited listing of the fund's holdings as of its most recent quarter end is available upon request. In addition, each Fidelity Central Fund's financial statements are available on the SEC's website or upon request.
(d) Investment made with cash collateral received from securities on loan.
Affiliated Central Funds
Information regarding fiscal year to date income earned by the Fund from investments in Fidelity Central Funds is as follows:
| Fund | Income earned |
| Fidelity Cash Central Fund | $72,393 |
| Fidelity Securities Lending Cash Central Fund | 330,325 |
| Total | $402,718 |
Investment Valuation
The following is a summary of the inputs used, as of April 30, 2016, involving the Fund's assets and liabilities carried at fair value. The inputs or methodology used for valuing securities may not be an indication of the risk associated with investing in those securities. For more information on valuation inputs, and their aggregation into the levels used below, please refer to the Investment Valuation section in the accompanying Notes to Financial Statements.
| Valuation Inputs at Reporting Date: | ||||
| Description | Total | Level 1 | Level 2 | Level 3 |
| Investments in Securities: | ||||
| Equities: | ||||
| Consumer Discretionary | $221,090,557 | $172,859,982 | $48,230,575 | $-- |
| Consumer Staples | 337,979,004 | 176,097,310 | 161,881,694 | -- |
| Energy | 7,198,891 | 7,198,891 | -- | -- |
| Financials | 227,120,303 | 108,732,079 | 118,388,224 | -- |
| Health Care | 313,799,816 | 150,169,108 | 163,630,708 | -- |
| Industrials | 191,271,169 | 148,750,991 | 42,520,178 | -- |
| Information Technology | 235,627,928 | 153,962,864 | 81,665,064 | -- |
| Materials | 76,381,781 | 76,381,781 | -- | -- |
| Telecommunication Services | 5,244,367 | 5,244,367 | -- | -- |
| Money Market Funds | 138,562,208 | 138,562,208 | -- | -- |
| Total Investments in Securities: | $1,754,276,024 | $1,137,959,581 | $616,316,443 | $-- |
The following is a summary of transfers between Level 1 and Level 2 for the period ended April 30, 2016. Transfers are assumed to have occurred at the beginning of the period, and are primarily attributable to the valuation techniques used for foreign equity securities, as discussed in the accompanying Notes to Financial Statements:
| Transfers | Total |
| Level 1 to Level 2 | $0 |
| Level 2 to Level 1 | $144,428,405 |
See accompanying notes which are an integral part of the financial statements.
Financial Statements
Statement of Assets and Liabilities
| April 30, 2016 (Unaudited) | ||
| Assets | ||
| Investment in securities, at value (including securities loaned of $103,770,133) — See accompanying schedule: Unaffiliated issuers (cost $1,493,495,241) | $1,615,713,816 | |
| Fidelity Central Funds (cost $138,562,208) | 138,562,208 | |
| Total Investments (cost $1,632,057,449) | $1,754,276,024 | |
| Foreign currency held at value (cost $11,880) | 11,898 | |
| Receivable for investments sold | 3,654,551 | |
| Receivable for fund shares sold | 4,651,062 | |
| Dividends receivable | 9,823,503 | |
| Distributions receivable from Fidelity Central Funds | 94,556 | |
| Prepaid expenses | 599 | |
| Other receivables | 7,870 | |
| Total assets | 1,772,520,063 | |
| Liabilities | ||
| Payable for investments purchased | $1,891,035 | |
| Payable for fund shares redeemed | 1,836,507 | |
| Accrued management fee | 985,763 | |
| Distribution and service plan fees payable | 103,976 | |
| Other affiliated payables | 304,114 | |
| Other payables and accrued expenses | 87,775 | |
| Collateral on securities loaned, at value | 106,690,874 | |
| Total liabilities | 111,900,044 | |
| Net Assets | $1,660,620,019 | |
| Net Assets consist of: | ||
| Paid in capital | $1,599,467,631 | |
| Undistributed net investment income | 11,086,000 | |
| Accumulated undistributed net realized gain (loss) on investments and foreign currency transactions | (72,316,667) | |
| Net unrealized appreciation (depreciation) on investments and assets and liabilities in foreign currencies | 122,383,055 | |
| Net Assets | $1,660,620,019 | |
| Calculation of Maximum Offering Price | ||
| Class A: | ||
| Net Asset Value and redemption price per share ($227,299,900 ÷ 20,745,349 shares) | $10.96 | |
| Maximum offering price per share (100/94.25 of $10.96) | $11.63 | |
| Class T: | ||
| Net Asset Value and redemption price per share ($28,247,384 ÷ 2,581,799 shares) | $10.94 | |
| Maximum offering price per share (100/96.50 of $10.94) | $11.34 | |
| Class B: | ||
| Net Asset Value and offering price per share ($543,488 ÷ 50,206 shares)(a) | $10.83 | |
| Class C: | ||
| Net Asset Value and offering price per share ($54,803,250 ÷ 5,077,799 shares)(a) | $10.79 | |
| International Growth: | ||
| Net Asset Value, offering price and redemption price per share ($989,531,658 ÷ 89,694,739 shares) | $11.03 | |
| Class I: | ||
| Net Asset Value, offering price and redemption price per share ($344,685,048 ÷ 31,300,215 shares) | $11.01 | |
| Class Z: | ||
| Net Asset Value, offering price and redemption price per share ($15,509,291 ÷ 1,406,850 shares) | $11.02 |
(a) Redemption price per share is equal to net asset value less any applicable contingent deferred sales charge.
See accompanying notes which are an integral part of the financial statements.
Statement of Operations
| Six months ended April 30, 2016 (Unaudited) | ||
| Investment Income | ||
| Dividends | $21,128,805 | |
| Income from Fidelity Central Funds | 402,718 | |
| Income before foreign taxes withheld | 21,531,523 | |
| Less foreign taxes withheld | (2,212,929) | |
| Total income | 19,318,594 | |
| Expenses | ||
| Management fee | ||
| Basic fee | $5,303,523 | |
| Performance adjustment | 109,270 | |
| Transfer agent fees | 1,418,766 | |
| Distribution and service plan fees | 585,143 | |
| Accounting and security lending fees | 345,576 | |
| Custodian fees and expenses | 79,671 | |
| Independent trustees' compensation | 3,216 | |
| Registration fees | 88,683 | |
| Audit | 42,540 | |
| Legal | 2,186 | |
| Miscellaneous | 4,732 | |
| Total expenses before reductions | 7,983,306 | |
| Expense reductions | (16,973) | 7,966,333 |
| Net investment income (loss) | 11,352,261 | |
| Realized and Unrealized Gain (Loss) | ||
| Net realized gain (loss) on: | ||
| Investment securities: | ||
| Unaffiliated issuers | (34,889,540) | |
| Foreign currency transactions | 296,655 | |
| Total net realized gain (loss) | (34,592,885) | |
| Change in net unrealized appreciation (depreciation) on: Investment securities (net of decrease in deferred foreign taxes of $4,737) | (7,895,661) | |
| Assets and liabilities in foreign currencies | 94,033 | |
| Total change in net unrealized appreciation (depreciation) | (7,801,628) | |
| Net gain (loss) | (42,394,513) | |
| Net increase (decrease) in net assets resulting from operations | $(31,042,252) |
See accompanying notes which are an integral part of the financial statements.
Statement of Changes in Net Assets
| Six months ended April 30, 2016 (Unaudited) | Year ended October 31, 2015 | |
| Increase (Decrease) in Net Assets | ||
| Operations | ||
| Net investment income (loss) | $11,352,261 | $10,205,219 |
| Net realized gain (loss) | (34,592,885) | (27,463,177) |
| Change in net unrealized appreciation (depreciation) | (7,801,628) | 41,450,250 |
| Net increase (decrease) in net assets resulting from operations | (31,042,252) | 24,192,292 |
| Distributions to shareholders from net investment income | (9,313,522) | (7,019,924) |
| Distributions to shareholders from net realized gain | (1,062,119) | – |
| Total distributions | (10,375,641) | (7,019,924) |
| Share transactions - net increase (decrease) | 228,113,558 | 519,861,476 |
| Redemption fees | 45,309 | 54,094 |
| Total increase (decrease) in net assets | 186,740,974 | 537,087,938 |
| Net Assets | ||
| Beginning of period | 1,473,879,045 | 936,791,107 |
| End of period (including undistributed net investment income of $11,086,000 and undistributed net investment income of $9,047,261, respectively) | $1,660,620,019 | $1,473,879,045 |
See accompanying notes which are an integral part of the financial statements.
Financial Highlights — Fidelity International Growth Fund Class A
| Six months ended (Unaudited) April 30, | Years ended October 31, | |||||
| 2016 | 2015 | 2014 | 2013 | 2012 | 2011 | |
| Selected Per–Share Data | ||||||
| Net asset value, beginning of period | $11.30 | $11.01 | $10.78 | $8.91 | $8.09 | $8.38 |
| Income from Investment Operations | ||||||
| Net investment income (loss)A | .07 | .07 | .09 | .08 | .08 | .08 |
| Net realized and unrealized gain (loss) | (.35) | .28 | .18 | 1.88 | .81 | (.31) |
| Total from investment operations | (.28) | .35 | .27 | 1.96 | .89 | (.23) |
| Distributions from net investment income | (.05) | (.06) | (.03) | (.08) | (.06) | (.05) |
| Distributions from net realized gain | (.01) | – | (.01) | (.01) | (.01) | (.01) |
| Total distributions | (.06) | (.06) | (.04) | (.09) | (.07) | (.06) |
| Redemption fees added to paid in capitalA,B | – | – | – | – | – | – |
| Net asset value, end of period | $10.96 | $11.30 | $11.01 | $10.78 | $8.91 | $8.09 |
| Total ReturnC,D,E | (2.51)% | 3.20% | 2.54% | 22.18% | 11.10% | (2.76)% |
| Ratios to Average Net AssetsF,G | ||||||
| Expenses before reductions | 1.26%H | 1.26% | 1.35% | 1.44% | 1.58% | 1.77% |
| Expenses net of fee waivers, if any | 1.26%H | 1.26% | 1.35% | 1.43% | 1.45% | 1.45% |
| Expenses net of all reductions | 1.26%H | 1.25% | 1.34% | 1.42% | 1.44% | 1.43% |
| Net investment income (loss) | 1.29%H | .66% | .84% | .80% | .99% | .92% |
| Supplemental Data | ||||||
| Net assets, end of period (000 omitted) | $227,300 | $184,878 | $119,017 | $74,595 | $21,874 | $6,352 |
| Portfolio turnover rateI | 35%H | 26% | 27% | 32% | 32% | 68% |
A Calculated based on average shares outstanding during the period.
B Amount represents less than $.005 per share.
C Total returns for periods of less than one year are not annualized.
D Total returns would have been lower if certain expenses had not been reduced during the applicable periods shown.
E Total returns do not include the effect of the sales charges.
F Fees and expenses of any underlying Fidelity Central Funds are not included in the Fund's expense ratio. The Fund indirectly bears its proportionate share of the expenses of any underlying Fidelity Central Funds.
G Expense ratios reflect operating expenses of the class. Expenses before reductions do not reflect amounts reimbursed by the investment adviser or reductions from brokerage service arrangements or reductions from other expense offset arrangements and do not represent the amount paid by the class during periods when reimbursements or reductions occur. Expenses net of fee waivers reflect expenses after reimbursement by the investment adviser but prior to reductions from brokerage service arrangements or other expense offset arrangements. Expenses net of all reductions represent the net expenses paid by the class.
H Annualized
I Amount does not include the portfolio activity of any underlying Fidelity Central Funds.
See accompanying notes which are an integral part of the financial statements.
Financial Highlights — Fidelity International Growth Fund Class T
| Six months ended (Unaudited) April 30, | Years ended October 31, | |||||
| 2016 | 2015 | 2014 | 2013 | 2012 | 2011 | |
| Selected Per–Share Data | ||||||
| Net asset value, beginning of period | $11.26 | $10.96 | $10.75 | $8.89 | $8.08 | $8.38 |
| Income from Investment Operations | ||||||
| Net investment income (loss)A | .05 | .04 | .06 | .05 | .06 | .06 |
| Net realized and unrealized gain (loss) | (.35) | .27 | .18 | 1.88 | .81 | (.31) |
| Total from investment operations | (.30) | .31 | .24 | 1.93 | .87 | (.25) |
| Distributions from net investment income | (.01) | (.01) | (.02) | (.07) | (.05) | (.04) |
| Distributions from net realized gain | (.01) | – | (.01) | (.01) | (.01) | (.01) |
| Total distributions | (.02) | (.01) | (.03) | (.07)B | (.06) | (.05) |
| Redemption fees added to paid in capitalA,C | – | – | – | – | – | – |
| Net asset value, end of period | $10.94 | $11.26 | $10.96 | $10.75 | $8.89 | $8.08 |
| Total ReturnD,E,F | (2.69)% | 2.85% | 2.21% | 21.91% | 10.82% | (3.03)% |
| Ratios to Average Net AssetsG,H | ||||||
| Expenses before reductions | 1.60%I | 1.58% | 1.65% | 1.69% | 1.85% | 2.03% |
| Expenses net of fee waivers, if any | 1.60%I | 1.58% | 1.65% | 1.69% | 1.70% | 1.70% |
| Expenses net of all reductions | 1.60%I | 1.58% | 1.65% | 1.68% | 1.69% | 1.68% |
| Net investment income (loss) | .95%I | .33% | .53% | .54% | .74% | .67% |
| Supplemental Data | ||||||
| Net assets, end of period (000 omitted) | $28,247 | $28,833 | $26,369 | $23,118 | $10,690 | $2,917 |
| Portfolio turnover rateJ | 35%I | 26% | 27% | 32% | 32% | 68% |
A Calculated based on average shares outstanding during the period.
B Total distributions of $0.07 per share is comprised of distributions from net investment income of $0.69 and distributions from net realized gain of $0.005 per share.
C Amount represents less than $.005 per share.
D Total returns for periods of less than one year are not annualized.
E Total returns would have been lower if certain expenses had not been reduced during the applicable periods shown.
F Total returns do not include the effect of the sales charges.
G Fees and expenses of any underlying Fidelity Central Funds are not included in the Fund's expense ratio. The Fund indirectly bears its proportionate share of the expenses of any underlying Fidelity Central Funds.
H Expense ratios reflect operating expenses of the class. Expenses before reductions do not reflect amounts reimbursed by the investment adviser or reductions from brokerage service arrangements or reductions from other expense offset arrangements and do not represent the amount paid by the class during periods when reimbursements or reductions occur. Expenses net of fee waivers reflect expenses after reimbursement by the investment adviser but prior to reductions from brokerage service arrangements or other expense offset arrangements. Expenses net of all reductions represent the net expenses paid by the class.
I Annualized
J Amount does not include the portfolio activity of any underlying Fidelity Central Funds.
See accompanying notes which are an integral part of the financial statements.
Financial Highlights — Fidelity International Growth Fund Class B
| Six months ended (Unaudited) April 30, | Years ended October 31, | |||||
| 2016 | 2015 | 2014 | 2013 | 2012 | 2011 | |
| Selected Per–Share Data | ||||||
| Net asset value, beginning of period | $11.16 | $10.91 | $10.73 | $8.88 | $8.06 | $8.36 |
| Income from Investment Operations | ||||||
| Net investment income (loss)A | .02 | (.02) | –B | –B | .02 | .01 |
| Net realized and unrealized gain (loss) | (.34) | .27 | .19 | 1.89 | .80 | (.30) |
| Total from investment operations | (.32) | .25 | .19 | 1.89 | .82 | (.29) |
| Distributions from net investment income | – | – | – | (.03) | – | (.01) |
| Distributions from net realized gain | (.01) | – | (.01) | (.01) | – | –B |
| Total distributions | (.01) | – | (.01) | (.04) | – | (.01) |
| Redemption fees added to paid in capitalA,B | – | – | – | – | – | – |
| Net asset value, end of period | $10.83 | $11.16 | $10.91 | $10.73 | $8.88 | $8.06 |
| Total ReturnC,D,E | (2.89)% | 2.29% | 1.76% | 21.35% | 10.17% | (3.47)% |
| Ratios to Average Net AssetsF,G | ||||||
| Expenses before reductions | 2.09%H | 2.07% | 2.14% | 2.19% | 2.35% | 2.55% |
| Expenses net of fee waivers, if any | 2.09%H | 2.07% | 2.14% | 2.18% | 2.20% | 2.20% |
| Expenses net of all reductions | 2.09%H | 2.06% | 2.14% | 2.17% | 2.19% | 2.18% |
| Net investment income (loss) | .45%H | (.15)% | .04% | .05% | .24% | .17% |
| Supplemental Data | ||||||
| Net assets, end of period (000 omitted) | $543 | $800 | $1,404 | $1,579 | $1,116 | $473 |
| Portfolio turnover rateI | 35%H | 26% | 27% | 32% | 32% | 68% |
A Calculated based on average shares outstanding during the period.
B Amount represents less than $.005 per share.
C Total returns for periods of less than one year are not annualized.
D Total returns would have been lower if certain expenses had not been reduced during the applicable periods shown.
E Total returns do not include the effect of the contingent deferred sales charge.
F Fees and expenses of any underlying Fidelity Central Funds are not included in the Fund's expense ratio. The Fund indirectly bears its proportionate share of the expenses of any underlying Fidelity Central Funds.
G Expense ratios reflect operating expenses of the class. Expenses before reductions do not reflect amounts reimbursed by the investment adviser or reductions from brokerage service arrangements or reductions from other expense offset arrangements and do not represent the amount paid by the class during periods when reimbursements or reductions occur. Expenses net of fee waivers reflect expenses after reimbursement by the investment adviser but prior to reductions from brokerage service arrangements or other expense offset arrangements. Expenses net of all reductions represent the net expenses paid by the class.
H Annualized
I Amount does not include the portfolio activity of any underlying Fidelity Central Funds.
See accompanying notes which are an integral part of the financial statements.
Financial Highlights — Fidelity International Growth Fund Class C
| Six months ended (Unaudited) April 30, | Years ended October 31, | |||||
| 2016 | 2015 | 2014 | 2013 | 2012 | 2011 | |
| Selected Per–Share Data | ||||||
| Net asset value, beginning of period | $11.12 | $10.87 | $10.69 | $8.84 | $8.03 | $8.34 |
| Income from Investment Operations | ||||||
| Net investment income (loss)A | .03 | (.02) | .01 | .01 | .02 | .01 |
| Net realized and unrealized gain (loss) | (.35) | .27 | .18 | 1.87 | .80 | (.31) |
| Total from investment operations | (.32) | .25 | .19 | 1.88 | .82 | (.30) |
| Distributions from net investment income | – | – | – | (.02) | (.01) | (.01) |
| Distributions from net realized gain | (.01) | – | (.01) | (.01) | (.01) | (.01) |
| Total distributions | (.01) | – | (.01) | (.03) | (.01)B | (.01)C |
| Redemption fees added to paid in capitalA,D | – | – | – | – | – | – |
| Net asset value, end of period | $10.79 | $11.12 | $10.87 | $10.69 | $8.84 | $8.03 |
| Total ReturnE,F,G | (2.90)% | 2.30% | 1.77% | 21.29% | 10.27% | (3.57)% |
| Ratios to Average Net AssetsH,I | ||||||
| Expenses before reductions | 2.05%J | 2.06% | 2.12% | 2.19% | 2.33% | 2.52% |
| Expenses net of fee waivers, if any | 2.05%J | 2.06% | 2.12% | 2.18% | 2.20% | 2.20% |
| Expenses net of all reductions | 2.05%J | 2.05% | 2.12% | 2.17% | 2.19% | 2.18% |
| Net investment income (loss) | .49%J | (.15)% | .06% | .05% | .24% | .17% |
| Supplemental Data | ||||||
| Net assets, end of period (000 omitted) | $54,803 | $52,378 | $32,737 | $17,196 | $5,648 | $2,767 |
| Portfolio turnover rateK | 35%J | 26% | 27% | 32% | 32% | 68% |
A Calculated based on average shares outstanding during the period.
B Total distributions of $.01 per share is comprised of distributions from net investment income of $.007 and distributions from net realized gain of $.006 per share.
C Total distributions of $.01 per share is comprised of distributions from net investment income of $.008 and distributions from net realized gain of $.005 per share.
D Amount represents less than $.005 per share.
E Total returns for periods of less than one year are not annualized.
F Total returns would have been lower if certain expenses had not been reduced during the applicable periods shown.
G Total returns do not include the effect of the contingent deferred sales charge.
H Fees and expenses of any underlying Fidelity Central Funds are not included in the Fund's expense ratio. The Fund indirectly bears its proportionate share of the expenses of any underlying Fidelity Central Funds.
I Expense ratios reflect operating expenses of the class. Expenses before reductions do not reflect amounts reimbursed by the investment adviser or reductions from brokerage service arrangements or reductions from other expense offset arrangements and do not represent the amount paid by the class during periods when reimbursements or reductions occur. Expenses net of fee waivers reflect expenses after reimbursement by the investment adviser but prior to reductions from brokerage service arrangements or other expense offset arrangements. Expenses net of all reductions represent the net expenses paid by the class.
J Annualized
K Amount does not include the portfolio activity of any underlying Fidelity Central Funds.
See accompanying notes which are an integral part of the financial statements.
Financial Highlights — Fidelity International Growth Fund
| Six months ended (Unaudited) April 30, | Years ended October 31, | |||||
| 2016 | 2015 | 2014 | 2013 | 2012 | 2011 | |
| Selected Per–Share Data | ||||||
| Net asset value, beginning of period | $11.38 | $11.10 | $10.84 | $8.95 | $8.12 | $8.40 |
| Income from Investment Operations | ||||||
| Net investment income (loss)A | .09 | .11 | .13 | .11 | .11 | .10 |
| Net realized and unrealized gain (loss) | (.35) | .26 | .19 | 1.88 | .81 | (.30) |
| Total from investment operations | (.26) | .37 | .32 | 1.99 | .92 | (.20) |
| Distributions from net investment income | (.08) | (.09) | (.05) | (.10) | (.08) | (.07) |
| Distributions from net realized gain | (.01) | – | (.01) | (.01) | (.01) | (.01) |
| Total distributions | (.09) | (.09) | (.06) | (.10)B | (.09) | (.08) |
| Redemption fees added to paid in capitalA,C | – | – | – | – | – | – |
| Net asset value, end of period | $11.03 | $11.38 | $11.10 | $10.84 | $8.95 | $8.12 |
| Total ReturnD,E | (2.34)% | 3.36% | 2.96% | 22.48% | 11.41% | (2.47)% |
| Ratios to Average Net AssetsF,G | ||||||
| Expenses before reductions | .96%H | .97% | 1.04% | 1.13% | 1.28% | 1.52% |
| Expenses net of fee waivers, if any | .96%H | .97% | 1.04% | 1.13% | 1.20% | 1.20% |
| Expenses net of all reductions | .96%H | .96% | 1.04% | 1.11% | 1.19% | 1.18% |
| Net investment income (loss) | 1.58%H | .94% | 1.14% | 1.11% | 1.24% | 1.17% |
| Supplemental Data | ||||||
| Net assets, end of period (000 omitted) | $989,532 | $938,348 | $635,607 | $430,914 | $149,526 | $53,437 |
| Portfolio turnover rateI | 35%H | 26% | 27% | 32% | 32% | 68% |
A Calculated based on average shares outstanding during the period.
B Total distributions of $.10 per share is comprised of distributions from net investment income of $.097 and distributions from net realized gain of $.005 per share.
C Amount represents less than $.005 per share.
D Total returns for periods of less than one year are not annualized.
E Total returns would have been lower if certain expenses had not been reduced during the applicable periods shown.
F Fees and expenses of any underlying Fidelity Central Funds are not included in the Fund's expense ratio. The Fund indirectly bears its proportionate share of the expenses of any underlying Fidelity Central Funds.
G Expense ratios reflect operating expenses of the class. Expenses before reductions do not reflect amounts reimbursed by the investment adviser or reductions from brokerage service arrangements or reductions from other expense offset arrangements and do not represent the amount paid by the class during periods when reimbursements or reductions occur. Expenses net of fee waivers reflect expenses after reimbursement by the investment adviser but prior to reductions from brokerage service arrangements or other expense offset arrangements. Expenses net of all reductions represent the net expenses paid by the class.
H Annualized
I Amount does not include the portfolio activity of any underlying Fidelity Central Funds.
See accompanying notes which are an integral part of the financial statements.
Financial Highlights — Fidelity International Growth Fund Class I
| Six months ended (Unaudited) April 30, | Years ended October 31, | |||||
| 2016 | 2015 | 2014 | 2013 | 2012 | 2011 | |
| Selected Per–Share Data | ||||||
| Net asset value, beginning of period | $11.36 | $11.08 | $10.84 | $8.94 | $8.12 | $8.40 |
| Income from Investment Operations | ||||||
| Net investment income (loss)A | .08 | .11 | .13 | .11 | .10 | .10 |
| Net realized and unrealized gain (loss) | (.34) | .27 | .18 | 1.90 | .81 | (.30) |
| Total from investment operations | (.26) | .38 | .31 | 2.01 | .91 | (.20) |
| Distributions from net investment income | (.08) | (.10) | (.06) | (.10) | (.08) | (.07) |
| Distributions from net realized gain | (.01) | – | (.01) | (.01) | (.01) | (.01) |
| Total distributions | (.09) | (.10) | (.07) | (.11) | (.09) | (.08) |
| Redemption fees added to paid in capitalA,B | – | – | – | – | – | – |
| Net asset value, end of period | $11.01 | $11.36 | $11.08 | $10.84 | $8.94 | $8.12 |
| Total ReturnC,D | (2.34)% | 3.41% | 2.84% | 22.66% | 11.28% | (2.47)% |
| Ratios to Average Net AssetsE,F | ||||||
| Expenses before reductions | .97%G | .98% | 1.04% | 1.11% | 1.27% | 1.50% |
| Expenses net of fee waivers, if any | .97%G | .98% | 1.04% | 1.11% | 1.20% | 1.20% |
| Expenses net of all reductions | .96%G | .97% | 1.04% | 1.09% | 1.19% | 1.18% |
| Net investment income (loss) | 1.58%G | .94% | 1.14% | 1.13% | 1.24% | 1.17% |
| Supplemental Data | ||||||
| Net assets, end of period (000 omitted) | $344,685 | $267,745 | $121,554 | $38,771 | $3,992 | $493 |
| Portfolio turnover rateH | 35%G | 26% | 27% | 32% | 32% | 68% |
A Calculated based on average shares outstanding during the period.
B Amount represents less than $.005 per share.
C Total returns for periods of less than one year are not annualized.
D Total returns would have been lower if certain expenses had not been reduced during the applicable periods shown.
E Fees and expenses of any underlying Fidelity Central Funds are not included in the Fund's expense ratio. The Fund indirectly bears its proportionate share of the expenses of any underlying Fidelity Central Funds.
F Expense ratios reflect operating expenses of the class. Expenses before reductions do not reflect amounts reimbursed by the investment adviser or reductions from brokerage service arrangements or reductions from other expense offset arrangements and do not represent the amount paid by the class during periods when reimbursements or reductions occur. Expenses net of fee waivers reflect expenses after reimbursement by the investment adviser but prior to reductions from brokerage service arrangements or other expense offset arrangements. Expenses net of all reductions represent the net expenses paid by the class.
G Annualized
H Amount does not include the portfolio activity of any underlying Fidelity Central Funds.
See accompanying notes which are an integral part of the financial statements.
Financial Highlights — Fidelity International Growth Fund Class Z
| Six months ended (Unaudited) April 30, | Years ended October 31, | |||
| April 30, | 2016 | 2015 | 2014 | 2013 A |
| Selected Per–Share Data | ||||
| Net asset value, beginning of period | $11.38 | $11.10 | $10.84 | $10.26 |
| Income from Investment Operations | ||||
| Net investment income (loss)B | .09 | .12 | .14 | .02 |
| Net realized and unrealized gain (loss) | (.35) | .27 | .19 | .56 |
| Total from investment operations | (.26) | .39 | .33 | .58 |
| Distributions from net investment income | (.09) | (.11) | (.06) | – |
| Distributions from net realized gain | (.01) | – | (.01) | – |
| Total distributions | (.10) | (.11) | (.07) | – |
| Redemption fees added to paid in capitalB,C | – | – | – | – |
| Net asset value, end of period | $11.02 | $11.38 | $11.10 | $10.84 |
| Total ReturnD,E | (2.29)% | 3.52% | 3.07% | 5.65% |
| Ratios to Average Net AssetsF,G | ||||
| Expenses before reductions | .83%H | .84% | .88% | .94%H |
| Expenses net of fee waivers, if any | .83%H | .84% | .88% | .94%H |
| Expenses net of all reductions | .83%H | .83% | .88% | .93%H |
| Net investment income (loss) | 1.71%H | 1.07% | 1.30% | .65%H |
| Supplemental Data | ||||
| Net assets, end of period (000 omitted) | $15,509 | $897 | $104 | $106 |
| Portfolio turnover rateI | 35%H | 26% | 27% | 32% |
A For the period August 13, 2013 (commencement of sale of shares) to October 31, 2013.
B Calculated based on average shares outstanding during the period.
C Amount represents less than $.005 per share.
D Total returns for periods of less than one year are not annualized.
E Total returns would have been lower if certain expenses had not been reduced during the applicable periods shown.
F Fees and expenses of any underlying Fidelity Central Funds are not included in the Fund's expense ratio. The Fund indirectly bears its proportionate share of the expenses of any underlying Fidelity Central Funds.
G Expense ratios reflect operating expenses of the class. Expenses before reductions do not reflect amounts reimbursed by the investment adviser or reductions from brokerage service arrangements or reductions from other expense offset arrangements and do not represent the amount paid by the class during periods when reimbursements or reductions occur. Expense ratios before reductions for start-up periods may not be representative of longer-term operating periods. Expenses net of fee waivers reflect expenses after reimbursement by the investment adviser but prior to reductions from brokerage service arrangements or other expense offset arrangements. Expenses net of all reductions represent the net expenses paid by the class.
H Annualized
I Amount does not include the portfolio activity of any underlying Fidelity Central Funds.
See accompanying notes which are an integral part of the financial statements.
Notes to Financial Statements (Unaudited)
For the period ended April 30, 2016
1. Organization.
Fidelity International Growth Fund (the Fund) is a fund of Fidelity Investment Trust (the Trust) and is authorized to issue an unlimited number of shares. The Trust is registered under the Investment Company Act of 1940, as amended (the 1940 Act), as an open-end management investment company organized as a Massachusetts business trust. The Fund offers Class A, Class T, Class C, International Growth, Class I and Class Z shares, each of which, along with Class B shares, has equal rights as to assets and voting privileges. Class B shares are closed to new accounts and additional purchases, except for exchanges and reinvestments. Each class has exclusive voting rights with respect to matters that affect that class. Class B shares will automatically convert to Class A shares after a maximum holding period of seven years from the initial date of purchase.
During the period, the Board of Trustees approved the conversion of all existing Class B shares into Class A shares, effective on or about July 1, 2016, regardless of the length of times shares have been held.
2. Investments in Fidelity Central Funds.
The Fund invests in Fidelity Central Funds, which are open-end investment companies generally available only to other investment companies and accounts managed by the investment adviser and its affiliates. The Fund's Schedule of Investments lists each of the Fidelity Central Funds held as of period end, if any, as an investment of the Fund, but does not include the underlying holdings of each Fidelity Central Fund. As an Investing Fund, the Fund indirectly bears its proportionate share of the expenses of the underlying Fidelity Central Funds.
The Money Market Central Funds seek preservation of capital and current income and are managed by Fidelity Investments Money Management, Inc. (FIMM), an affiliate of the investment adviser. Annualized expenses of the Money Market Central Funds as of their most recent shareholder report date are less than .005%.
A complete unaudited list of holdings for each Fidelity Central Fund is available upon request or at the Securities and Exchange Commission (the SEC) website at www.sec.gov. In addition, the financial statements of the Fidelity Central Funds are available on the SEC website or upon request.
3. Significant Accounting Policies.
The financial statements have been prepared in conformity with accounting principles generally accepted in the United States of America (GAAP), which require management to make certain estimates and assumptions at the date of the financial statements. Actual results could differ from those estimates. Subsequent events, if any, through the date that the financial statements were issued have been evaluated in the preparation of the financial statements. The following summarizes the significant accounting policies of the Fund:
Investment Valuation. Investments are valued as of 4:00 p.m. Eastern time on the last calendar day of the period. The Board of Trustees (the Board) has delegated the day to day responsibility for the valuation of the Fund's investments to the Fidelity Management & Research Company (FMR) Fair Value Committee (the Committee). In accordance with valuation policies and procedures approved by the Board, the Fund attempts to obtain prices from one or more third party pricing vendors or brokers to value its investments. When current market prices, quotations or currency exchange rates are not readily available or reliable, investments will be fair valued in good faith by the Committee, in accordance with procedures adopted by the Board. Factors used in determining fair value vary by investment type and may include market or investment specific events. The frequency with which these procedures are used cannot be predicted and they may be utilized to a significant extent. The Committee oversees the Fund's valuation policies and procedures and reports to the Board on the Committee's activities and fair value determinations. The Board monitors the appropriateness of the procedures used in valuing the Fund's investments and ratifies the fair value determinations of the Committee.
The Fund categorizes the inputs to valuation techniques used to value its investments into a disclosure hierarchy consisting of three levels as shown below:
- Level 1 – quoted prices in active markets for identical investments
- Level 2 – other significant observable inputs (including quoted prices for similar investments, interest rates, prepayment speeds, etc.)
- Level 3 – unobservable inputs (including the Fund's own assumptions based on the best information available)
Valuation techniques used to value the Fund's investments by major category are as follows:
Equity securities, including restricted securities, for which market quotations are readily available, are valued at the last reported sale price or official closing price as reported by a third party pricing vendor on the primary market or exchange on which they are traded and are categorized as Level 1 in the hierarchy. In the event there were no sales during the day or closing prices are not available, securities are valued at the last quoted bid price or may be valued using the last available price and are generally categorized as Level 2 in the hierarchy. For foreign equity securities, when market or security specific events arise, comparisons to the valuation of American Depositary Receipts (ADRs), futures contracts, Exchange-Traded Funds (ETFs) and certain indexes as well as quoted prices for similar securities may be used and would be categorized as Level 2 in the hierarchy. Utilizing these techniques may result in transfers between Level 1 and Level 2. For equity securities, including restricted securities, where observable inputs are limited, assumptions about market activity and risk are used and these securities may be categorized as Level 3 in the hierarchy.
Investments in open-end mutual funds, including the Fidelity Central Funds, are valued at their closing net asset value (NAV) each business day and are categorized as Level 1 in the hierarchy.
Changes in valuation techniques may result in transfers in or out of an assigned level within the disclosure hierarchy. The aggregate value of investments by input level as of April 30, 2016, including information on transfers between Levels 1 and 2, is included at the end of the Fund's Schedule of Investments.
Foreign Currency. The Fund may use foreign currency contracts to facilitate transactions in foreign-denominated securities. Gains and losses from these transactions may arise from changes in the value of the foreign currency or if the counterparties do not perform under the contracts' terms.
Foreign-denominated assets, including investment securities, and liabilities are translated into U.S. dollars at the exchange rates at period end. Purchases and sales of investment securities, income and dividends received and expenses denominated in foreign currencies are translated into U.S. dollars at the exchange rate in effect on the transaction date.
The effects of exchange rate fluctuations on investments are included with the net realized and unrealized gain (loss) on investment securities. Other foreign currency transactions resulting in realized and unrealized gain (loss) are disclosed separately.
Investment Transactions and Income. For financial reporting purposes, the Fund's investment holdings and NAV include trades executed through the end of the last business day of the period. The NAV per share for processing shareholder transactions is calculated as of the close of business of the New York Stock Exchange (NYSE), normally 4:00 p.m. Eastern time and includes trades executed through the end of the prior business day. Gains and losses on securities sold are determined on the basis of identified cost. Dividend income is recorded on the ex-dividend date, except for certain dividends from foreign securities where the ex-dividend date may have passed, which are recorded as soon as the Fund is informed of the ex-dividend date. Non-cash dividends included in dividend income, if any, are recorded at the fair market value of the securities received. Income and capital gain distributions from Fidelity Central Funds, if any, are recorded on the ex-dividend date. Distributions received on securities that represent a return of capital or capital gain are recorded as a reduction of cost of investments and/or as a realized gain. Subsequent to ex-dividend date the Fund determines the components of these distributions, based upon receipt of tax filings or other correspondence relating to the underlying investment. Investment income is recorded net of foreign taxes withheld where recovery of such taxes is uncertain.
Class Allocations and Expenses. Investment income, realized and unrealized capital gains and losses, common expenses of the Fund, and certain fund-level expense reductions, if any, are allocated daily on a pro-rata basis to each class based on the relative net assets of each class to the total net assets of the Fund. Each class differs with respect to transfer agent and distribution and service plan fees incurred. Certain expense reductions may also differ by class. For the reporting period, the allocated portion of income and expenses to each class as a percent of its average net assets may vary due to the timing of recording these transactions in relation to fluctuating net assets of the classes. Expenses directly attributable to a fund are charged to that fund. Expenses attributable to more than one fund are allocated among the respective funds on the basis of relative net assets or other appropriate methods. Expense estimates are accrued in the period to which they relate and adjustments are made when actual amounts are known.
Income Tax Information and Distributions to Shareholders. Each year, the Fund intends to qualify as a regulated investment company under Subchapter M of the Internal Revenue Code, including distributing substantially all of its taxable income and realized gains. As a result, no provision for U.S. Federal income taxes is required. The Fund files a U.S. federal tax return, in addition to state and local tax returns as required. The Fund's federal income tax returns are subject to examination by the Internal Revenue Service (IRS) for a period of three fiscal years after they are filed. State and local tax returns may be subject to examination for an additional fiscal year depending on the jurisdiction. Foreign taxes are provided for based on the Fund's understanding of the tax rules and rates that exist in the foreign markets in which it invests.
Distributions are declared and recorded on the ex-dividend date. Income dividends and capital gain distributions are declared separately for each class. Income and capital gain distributions are determined in accordance with income tax regulations, which may differ from GAAP.
Capital accounts within the financial statements are adjusted for permanent book-tax differences. These adjustments have no impact on net assets or the results of operations. Capital accounts are not adjusted for temporary book-tax differences which will reverse in a subsequent period.
Book-tax differences are primarily due to foreign currency transactions, certain foreign taxes, passive foreign investment companies (PFIC), partnerships, capital loss carryforwards and losses deferred due to wash sales.
The federal tax cost of investment securities and unrealized appreciation (depreciation) as of period end were as follows:
| Gross unrealized appreciation | $176,397,956 |
| Gross unrealized depreciation | (59,559,141) |
| Net unrealized appreciation (depreciation) on securities | $116,838,815 |
| Tax cost | $1,637,437,209 |
Capital loss carryforwards are only available to offset future capital gains of the Fund to the extent provided by regulations and may be limited. Under the Regulated Investment Company Modernization Act of 2010 (the Act), the Fund is permitted to carry forward capital losses incurred in taxable years beginning after December 22, 2010 for an unlimited period and such capital losses are required to be used prior to any losses that expire. The capital loss carryforward information presented below, including any applicable limitation, is estimated as of prior fiscal period end and is subject to adjustment.
| No expiration | |
| Short-term | $(26,434,969) |
| Long-term | (7,319,866) |
| Total no expiration | $(33,754,835) |
Short-Term Trading (Redemption) Fees. Shares held by investors in the Fund less than 30 days may have been subject to a redemption fee equal to 1.00% of the NAV of shares redeemed. All redemption fees, which reduce the proceeds of the shareholder redemption, are retained by the Fund and accounted for as an addition to paid in capital.
4. Purchases and Sales of Investments.
Purchases and sales of securities, other than short-term securities, aggregated $479,246,265 and $260,718,084, respectively.
5. Fees and Other Transactions with Affiliates.
Management Fee. Fidelity Management & Research Company (the investment adviser) and its affiliates provide the Fund with investment management related services for which the Fund pays a monthly management fee. The management fee is the sum of an individual fund fee rate that is based on an annual rate of .45% of the Fund's average net assets and an annualized group fee rate that averaged .25% during the period. The group fee rate is based upon the average net assets of all the mutual funds advised by the investment adviser, including any mutual funds previously advised by the investment adviser that are currently advised by Fidelity SelectCo, LLC, an affiliate of the investment adviser. The group fee rate decreases as assets under management increase and increases as assets under management decrease. In addition, the management fee is subject to a performance adjustment (up to a maximum of +/- .20% of the Fund's average net assets over a 36 month performance period). The upward or downward adjustment to the management fee is based on the relative investment performance of International Growth as compared to its benchmark index, the MSCI EAFE Growth Index, over the same 36 month performance period. For the reporting period, the total annualized management fee rate, including the performance adjustment, was .71% of the Fund's average net assets. The performance adjustment included in the management fee rate may be higher or lower than the maximum performance adjustment rate due to the difference between the average net assets for the reporting and performance periods.
Distribution and Service Plan Fees. In accordance with Rule 12b-1 of the 1940 Act, the Fund has adopted separate Distribution and Service Plans for each class of shares. Certain classes pay Fidelity Distributors Corporation (FDC), an affiliate of the investment adviser, separate Distribution and Service Fees, each of which is based on an annual percentage of each class' average net assets. In addition, FDC may pay financial intermediaries for selling shares of the Fund and providing shareholder support services. For the period, the Distribution and Service Fee rates, total fees and amounts retained by FDC were as follows:
| Distribution Fee | Service Fee | Total Fees | Retained by FDC | |
| Class A | -% | .25% | $249,157 | $357 |
| Class T | .25% | .25% | 69,243 | – |
| Class B | .75% | .25% | 3,364 | 2,523 |
| Class C | .75% | .25% | 263,379 | 98,751 |
| $585,143 | $101,631 |
Sales Load. FDC may receive a front-end sales charge of up to 5.75% for selling Class A shares and 3.50% for selling Class T shares, some of which is paid to financial intermediaries for selling shares of the Fund. Depending on the holding period, FDC may receive contingent deferred sales charges levied on Class A, Class T, Class B and Class C redemptions. The deferred sales charges range from 5.00% to 1.00% for Class B shares, 1.00% for Class C shares, 1.00% for certain purchases of Class A shares and .25% for certain purchases of Class T shares.
For the period, sales charge amounts retained by FDC were as follows:
| Retained by FDC | |
| Class A | $44,378 |
| Class T | 6,336 |
| Class B(a) | 6 |
| Class C(a) | 4,765 |
| $55,485 |
(a) When Class B and Class C shares are initially sold, FDC pays commissions from its own resources to financial intermediaries through which the sales are made.
Transfer Agent Fees. Fidelity Investments Institutional Operations Company, Inc., (FIIOC), an affiliate of the investment adviser, is the transfer, dividend disbursing and shareholder servicing agent for each class of the Fund. FIIOC receives account fees and asset-based fees that vary according to the account size and type of account of the shareholders of the respective classes of the Fund, except for Class Z. FIIOC receives an asset-based fee of Class Z's average net assets. FIIOC pays for typesetting, printing and mailing of shareholder reports, except proxy statements.
For the period, transfer agent fees for each class were as follows:
| Amount | % of Class-Level Average Net Assets(a) | |
| Class A | $220,276 | .22 |
| Class T | 43,164 | .31 |
| Class B | 1,028 | .31 |
| Class C | 69,895 | .27 |
| International Growth | 819,000 | .18 |
| Class I | 263,135 | .18 |
| Class Z | 2,268 | .05 |
| $1,418,766 |
(a) Annualized
Accounting and Security Lending Fees. Fidelity Service Company, Inc. (FSC), an affiliate of the investment adviser, maintains the Fund's accounting records. The accounting fee is based on the level of average net assets for each month. Under a separate contract, FSC administers the security lending program. The security lending fee is based on the number and duration of lending transactions.
Brokerage Commissions. The Fund placed a portion of its portfolio transactions with brokerage firms which are affiliates of the investment adviser. Brokerage commissions are included in net realized gain (loss) and change in net unrealized appreciation (depreciation) in the Statement of Operations. The commissions paid to these affiliated firms were $799 for the period.
Interfund Trades. The Fund may purchase from or sell securities to other Fidelity Funds under procedures adopted by the Board. The procedures have been designed to ensure these interfund trades are executed in accordance with Rule 17a-7 of the 1940 Act. Interfund trades are included within the respective purchases and sales amounts shown in the Purchases and Sales of Investments note.
6. Committed Line of Credit.
The Fund participates with other funds managed by the investment adviser or an affiliate in a $4.25 billion credit facility (the "line of credit") to be utilized for temporary or emergency purposes to fund shareholder redemptions or for other short-term liquidity purposes. The Fund has agreed to pay commitment fees on its pro-rata portion of the line of credit, which amounted to $1,311 and is reflected in Miscellaneous expenses on the Statement of Operations. During the period, the Fund did not borrow on this line of credit.
7. Security Lending.
The Fund lends portfolio securities through a lending agent from time to time in order to earn additional income. For equity securities, a lending agent is used and may loan securities to certain qualified borrowers, including Fidelity Capital Markets (FCM), a broker-dealer affiliated with the Fund. On the settlement date of the loan, the Fund receives collateral (in the form of U.S. Treasury obligations, letters of credit and/or cash) against the loaned securities and maintains collateral in an amount not less than 100% of the market value of the loaned securities during the period of the loan. The market value of the loaned securities is determined at the close of business of the Fund and any additional required collateral is delivered to the Fund on the next business day. The Fund or borrower may terminate the loan at any time, and if the borrower defaults on its obligation to return the securities loaned because of insolvency or other reasons, the Fund may apply collateral received from the borrower against the obligation. The Fund may experience delays and costs in recovering the securities loaned. Any cash collateral received is invested in the Fidelity Securities Lending Cash Central Fund. The value of loaned securities and cash collateral at period end are disclosed on the Fund's Statement of Assets and Liabilities. The value of securities loaned to FCM at period end was $10,140,516. Security lending income represents the income earned on investing cash collateral, less rebates paid to borrowers and any lending agent fees associated with the loan, plus any premium payments received for lending certain types of securities. Security lending income is presented in the Statement of Operations as a component of income from Fidelity Central Funds. Total security lending income during the period amounted to $330,325, including $34,892 from securities loaned to FCM.
8. Expense Reductions.
Commissions paid to certain brokers with whom the investment adviser, or its affiliates, places trades on behalf of the Fund include an amount in addition to trade execution, which may be rebated back to the Fund to offset certain expenses. This amount totaled $11,575 for the period. In addition, through arrangements with the Fund's custodian, credits realized as a result of certain uninvested cash balances were used to reduce the Fund's expenses. During the period, these credits reduced the Fund's custody expenses by $35.
In addition, during the period the investment adviser reimbursed and/or waived a portion of fund-level operating expenses in the amount of $5,363.
9. Distributions to Shareholders.
Distributions to shareholders of each class were as follows:
| Six months ended April 30, 2016 | Year ended October 31, 2015 | |
| From net investment income | ||
| Class A | $857,306 | $684,914 |
| Class T | 25,900 | 29,128 |
| International Growth | 6,508,406 | 5,239,951 |
| Class I | 1,913,593 | 1,064,923 |
| Class Z | 8,317 | 1,008 |
| Total | $9,313,522 | $7,019,924 |
| From net realized gain | ||
| Class A | $137,169 | $– |
| Class T | 20,720 | – |
| Class B | 561 | – |
| Class C | 39,156 | – |
| International Growth | 667,539 | – |
| Class I | 196,266 | – |
| Class Z | 708 | – |
| Total | $1,062,119 | $– |
10. Share Transactions.
Share transactions for each class were as follows and may contain automatic conversions between classes or exchanges between affiliated funds:
| Shares | Shares | Dollars | Dollars | |
| Six months ended April 30, 2016 | Year ended October 31, 2015 | Six months ended April 30, 2016 | Year ended October 31, 2015 | |
| Class A | ||||
| Shares sold | 6,246,540 | 9,298,452 | $67,129,589 | $105,707,223 |
| Reinvestment of distributions | 86,341 | 60,570 | 970,468 | 669,298 |
| Shares redeemed | (1,954,972) | (3,798,128) | (20,859,132) | (42,982,992) |
| Net increase (decrease) | 4,377,909 | 5,560,894 | $47,240,925 | $63,393,529 |
| Class T | ||||
| Shares sold | 366,792 | 1,158,910 | $3,936,696 | $13,286,739 |
| Reinvestment of distributions | 4,067 | 2,593 | 45,714 | 28,654 |
| Shares redeemed | (350,025) | (1,005,399) | (3,686,315) | (11,627,373) |
| Net increase (decrease) | 20,834 | 156,104 | $296,095 | $1,688,020 |
| Class B | ||||
| Shares sold | 1,881 | 30,282 | $19,678 | $347,009 |
| Reinvestment of distributions | 50 | – | 556 | – |
| Shares redeemed | (23,393) | (87,349) | (246,379) | (994,341) |
| Net increase (decrease) | (21,462) | (57,067) | $(226,145) | $(647,332) |
| Class C | ||||
| Shares sold | 819,268 | 2,689,800 | $8,736,707 | $30,433,427 |
| Reinvestment of distributions | 3,485 | – | 38,678 | – |
| Shares redeemed | (454,625) | (991,400) | (4,741,050) | (10,978,888) |
| Net increase (decrease) | 368,128 | 1,698,400 | $4,034,335 | $19,454,539 |
| International Growth | ||||
| Shares sold | 17,140,428 | 39,705,804 | $183,584,698 | $456,131,993 |
| Reinvestment of distributions | 515,203 | 387,169 | 5,821,794 | 4,301,448 |
| Shares redeemed | (10,385,791) | (14,942,156) | (110,850,155) | (169,380,325) |
| Net increase (decrease) | 7,269,840 | 25,150,817 | $78,556,337 | $291,053,116 |
| Class I | ||||
| Shares sold | 13,087,526 | 17,728,493 | $140,430,050 | $201,877,753 |
| Reinvestment of distributions | 177,277 | 92,582 | 1,999,688 | 1,026,733 |
| Shares redeemed | (5,525,257) | (5,227,430) | (58,460,124) | (58,733,231) |
| Net increase (decrease) | 7,739,546 | 12,593,645 | $83,969,614 | $144,171,255 |
| Class Z | ||||
| Shares sold | 1,378,158 | 88,007 | $14,776,889 | $956,120 |
| Reinvestment of distributions | 799 | 91 | 9,025 | 1,008 |
| Shares redeemed | (50,920) | (18,621) | (543,517) | (208,779) |
| Net increase (decrease) | 1,328,037 | 69,477 | $14,242,397 | $748,349 |
11. Other.
The Fund's organizational documents provide former and current trustees and officers with a limited indemnification against liabilities arising in connection with the performance of their duties to the Fund. In the normal course of business, the Fund may also enter into contracts that provide general indemnifications. The Fund's maximum exposure under these arrangements is unknown as this would be dependent on future claims that may be made against the Fund. The risk of material loss from such claims is considered remote.
Shareholder Expense Example
As a shareholder of the Fund, you incur two types of costs: (1) transaction costs, including sales charges (loads) on purchase payments or redemption proceeds, redemption fees and (2) ongoing costs, including management fees, distribution and/or service (12b-1) fees and other Fund expenses. This Example is intended to help you understand your ongoing costs (in dollars) of investing in the Fund and to compare these costs with the ongoing costs of investing in other mutual funds.
The Example is based on an investment of $1,000 invested at the beginning of the period and held for the entire period (November 1, 2015 to April 30, 2016).
Actual Expenses
The first line of the accompanying table for each class of the Fund provides information about actual account values and actual expenses. You may use the information in this line, together with the amount you invested, to estimate the expenses that you paid over the period. Simply divide your account value by $1,000.00 (for example, an $8,600 account value divided by $1,000.00 = 8.6), then multiply the result by the number in the first line for a class of the Fund under the heading entitled "Expenses Paid During Period" to estimate the expenses you paid on your account during this period. A small balance maintenance fee of $12.00 that is charged once a year may apply for certain accounts with a value of less than $2,000. This fee is not included in the table below. If it was, the estimate of expenses you paid during the period would be higher, and your ending account value lower, by this amount. In addition, the Fund, as a shareholder in the underlying Fidelity Central Funds, will indirectly bear its pro-rata share of the fees and expenses incurred by the underlying Fidelity Central Funds. These fees and expenses are not included in the Fund's annualized expense ratio used to calculate the expense estimate in the table below.
Hypothetical Example for Comparison Purposes
The second line of the accompanying table for each class of the Fund provides information about hypothetical account values and hypothetical expenses based on a Class' actual expense ratio and an assumed rate of return of 5% per year before expenses, which is not the Class' actual return. The hypothetical account values and expenses may not be used to estimate the actual ending account balance or expenses you paid for the period. You may use this information to compare the ongoing costs of investing in the Fund and other funds. To do so, compare this 5% hypothetical example with the 5% hypothetical examples that appear in the shareholder reports of the other funds. A small balance maintenance fee of $12.00 that is charged once a year may apply for certain accounts with a value of less than $2,000. This fee is not included in the table below. If it was, the estimate of expenses you paid during the period would be higher, and your ending account value lower, by this amount. In addition, the Fund, as a shareholder in the underlying Fidelity Central Funds, will indirectly bear its pro-rata share of the fees and expenses incurred by the underlying Fidelity Central Funds. These fees and expenses are not included in the Fund's annualized expense ratio used to calculate the expense estimate in the table below.
Please note that the expenses shown in the table are meant to highlight your ongoing costs only and do not reflect any transaction costs. Therefore, the second line of the table is useful in comparing ongoing costs only, and will not help you determine the relative total costs of owning different funds. In addition, if these transactional costs were included, your costs would have been higher.
| Annualized Expense Ratio-A | Beginning Account Value November 1, 2015 | Ending Account Value April 30, 2016 | Expenses Paid During Period-B November 1, 2015 to April 30, 2016 | |
| Class A | 1.26% | |||
| Actual | $1,000.00 | $974.90 | $6.19 | |
| Hypothetical-C | $1,000.00 | $1,018.60 | $6.32 | |
| Class T | 1.60% | |||
| Actual | $1,000.00 | $973.10 | $7.85 | |
| Hypothetical-C | $1,000.00 | $1,016.91 | $8.02 | |
| Class B | 2.09% | |||
| Actual | $1,000.00 | $971.10 | $10.24 | |
| Hypothetical-C | $1,000.00 | $1,014.47 | $10.47 | |
| Class C | 2.05% | |||
| Actual | $1,000.00 | $971.00 | $10.05 | |
| Hypothetical-C | $1,000.00 | $1,014.67 | $10.27 | |
| International Growth | .96% | |||
| Actual | $1,000.00 | $976.60 | $4.72 | |
| Hypothetical-C | $1,000.00 | $1,020.09 | $4.82 | |
| Class I | .97% | |||
| Actual | $1,000.00 | $976.60 | $4.77 | |
| Hypothetical-C | $1,000.00 | $1,020.04 | $4.87 | |
| Class Z | .83% | |||
| Actual | $1,000.00 | $977.10 | $4.08 | |
| Hypothetical-C | $1,000.00 | $1,020.74 | $4.17 |
A Annualized expense ratio reflects expenses net of applicable fee waivers.
B Expenses are equal to each Class' annualized expense ratio, multiplied by the average account value over the period, multiplied by 182/366 (to reflect the one-half year period).
C 5% return per year before expenses
![]()
AIGFI-SANN-0616
1.853345.108
Fidelity Advisor® International Small Cap Opportunities Fund - Semi-Annual Report April 30, 2016 Class I is a class of Fidelity® International Small Cap Opportunities Fund |
|
Contents
To view a fund's proxy voting guidelines and proxy voting record for the 12-month period ended June 30, visit http://www.fidelity.com/proxyvotingresults or visit the Securities and Exchange Commission's (SEC) web site at http://www.sec.gov.
You may also call 1-877-208-0098 to request a free copy of the proxy voting guidelines.
Standard & Poor's, S&P and S&P 500 are registered service marks of The McGraw-Hill Companies, Inc. and have been licensed for use by Fidelity Distributors Corporation.
Other third-party marks appearing herein are the property of their respective owners.
All other marks appearing herein are registered or unregistered trademarks or service marks of FMR LLC or an affiliated company. © 2016 FMR LLC. All rights reserved.
This report and the financial statements contained herein are submitted for the general information of the shareholders of the Fund. This report is not authorized for distribution to prospective investors in the Fund unless preceded or accompanied by an effective prospectus.
A fund files its complete schedule of portfolio holdings with the SEC for the first and third quarters of each fiscal year on Form N-Q. Forms N-Q are available on the SEC’s web site at http://www.sec.gov. A fund's Forms N-Q may be reviewed and copied at the SEC’s Public Reference Room in Washington, DC. Information regarding the operation of the SEC's Public Reference Room may be obtained by calling 1-800-SEC-0330.
For a complete list of a fund's portfolio holdings, view the most recent holdings listing, semiannual report, or annual report on Fidelity's web site at http://www.fidelity.com, http://www.advisor.fidelity.com, or http://www.401k.com, as applicable.
NOT FDIC INSURED •MAY LOSE VALUE •NO BANK GUARANTEE
Neither the Fund nor Fidelity Distributors Corporation is a bank.
Investment Summary (Unaudited)
Geographic Diversification (% of fund's net assets)
| As of April 30, 2016 | ||
| Japan | 25.1% | |
| United Kingdom | 20.5% | |
| United States of America* | 15.5% | |
| Germany | 6.6% | |
| Italy | 3.7% | |
| Sweden | 3.2% | |
| Netherlands | 2.5% | |
| France | 2.2% | |
| Canada | 2.0% | |
| Other | 18.7% | |

* Includes Short-Term investments and Net Other Assets (Liabilities).
Percentages are based on country or territory of incorporation and are adjusted for the effect of futures contracts, if applicable.
| As of October 31, 2015 | ||
| Japan | 26.0% | |
| United Kingdom | 21.7% | |
| United States of America* | 15.0% | |
| Germany | 5.7% | |
| Italy | 4.3% | |
| Sweden | 3.0% | |
| Netherlands | 2.8% | |
| Australia | 2.0% | |
| Canada | 1.9% | |
| Other | 17.6% | |

* Includes Short-Term investments and Net Other Assets (Liabilities).
Percentages are based on country or territory of incorporation and are adjusted for the effect of futures contracts, if applicable.
Asset Allocation as of April 30, 2016
| % of fund's net assets | % of fund's net assets 6 months ago | |
| Stocks | 92.2 | 91.8 |
| Short-Term Investments and Net Other Assets (Liabilities) | 7.8 | 8.2 |
Top Ten Stocks as of April 30, 2016
| % of fund's net assets | % of fund's net assets 6 months ago | |
| USS Co. Ltd. (Japan, Specialty Retail) | 2.0 | 2.0 |
| Spirax-Sarco Engineering PLC (United Kingdom, Machinery) | 1.8 | 1.6 |
| Berendsen PLC (United Kingdom, Commercial Services & Supplies) | 1.7 | 1.7 |
| CTS Eventim AG (Germany, Media) | 1.7 | 2.0 |
| Fagerhult AB (Sweden, Electrical Equipment) | 1.7 | 1.3 |
| Unite Group PLC (United Kingdom, Real Estate Management & Development) | 1.6 | 1.9 |
| CompuGroup Medical AG (Germany, Health Care Technology) | 1.6 | 1.0 |
| OBIC Co. Ltd. (Japan, IT Services) | 1.5 | 1.8 |
| Sartorius AG (non-vtg.) (Germany, Health Care Equipment & Supplies) | 1.4 | 1.6 |
| Azimut Holding SpA (Italy, Capital Markets) | 1.4 | 1.3 |
| 16.4 |
Market Sectors as of April 30, 2016
| % of fund's net assets | % of fund's net assets 6 months ago | |
| Consumer Discretionary | 20.6 | 20.5 |
| Industrials | 18.1 | 18.3 |
| Financials | 15.9 | 18.7 |
| Information Technology | 10.7 | 9.2 |
| Health Care | 10.3 | 8.5 |
| Consumer Staples | 8.5 | 8.5 |
| Materials | 6.7 | 6.7 |
| Energy | 1.4 | 1.4 |
Investments April 30, 2016 (Unaudited)
Showing Percentage of Net Assets
| Common Stocks - 90.8% | |||
| Shares | Value | ||
| Australia - 2.0% | |||
| Beacon Lighting Group Ltd. | 2,000,000 | $2,767,674 | |
| DuluxGroup Ltd. | 1,577,979 | 7,678,825 | |
| Imdex Ltd. (a) | 2,434,488 | 379,468 | |
| RCG Corp. Ltd. (b) | 6,779,148 | 7,061,699 | |
| TFS Corp. Ltd. (b) | 4,354,304 | 5,164,840 | |
| TOTAL AUSTRALIA | 23,052,506 | ||
| Austria - 1.1% | |||
| Andritz AG | 165,900 | 9,291,129 | |
| Zumtobel AG | 316,081 | 4,115,128 | |
| TOTAL AUSTRIA | 13,406,257 | ||
| Bailiwick of Jersey - 0.4% | |||
| Integrated Diagnostics Holdings PLC | 944,579 | 4,392,292 | |
| Belgium - 1.2% | |||
| Gimv NV | 56,688 | 3,148,164 | |
| KBC Ancora | 304,448 | 10,747,590 | |
| TOTAL BELGIUM | 13,895,754 | ||
| Bermuda - 0.3% | |||
| Vostok New Ventures Ltd. SDR (a) | 712,589 | 4,055,229 | |
| Canada - 2.0% | |||
| Cara Operations Ltd. | 282,000 | 7,295,545 | |
| McCoy Global, Inc. | 636,215 | 1,039,484 | |
| New Look Vision Group, Inc. | 197,200 | 4,880,099 | |
| Pason Systems, Inc. | 448,000 | 6,512,728 | |
| ShawCor Ltd. Class A | 135,600 | 3,663,697 | |
| Tesco Corp. | 40,447 | 382,629 | |
| TOTAL CANADA | 23,774,182 | ||
| Cayman Islands - 0.6% | |||
| 58.com, Inc. ADR (a) | 67,900 | 3,710,735 | |
| Value Partners Group Ltd. | 3,938,000 | 3,759,022 | |
| TOTAL CAYMAN ISLANDS | 7,469,757 | ||
| Denmark - 1.6% | |||
| Jyske Bank A/S (Reg.) | 213,127 | 8,725,494 | |
| Scandinavian Tobacco Group A/S | 200,000 | 3,181,685 | |
| Spar Nord Bank A/S | 796,369 | 6,493,770 | |
| TOTAL DENMARK | 18,400,949 | ||
| Finland - 0.6% | |||
| Tikkurila Oyj | 431,646 | 7,567,063 | |
| France - 2.2% | |||
| Elis SA | 380,597 | 6,988,095 | |
| Laurent-Perrier Group SA | 49,163 | 4,179,836 | |
| Vetoquinol SA | 118,184 | 4,898,823 | |
| Virbac SA (b) | 51,152 | 9,330,455 | |
| TOTAL FRANCE | 25,397,209 | ||
| Germany - 5.2% | |||
| alstria office REIT-AG | 448,700 | 6,293,853 | |
| CompuGroup Medical AG | 476,478 | 18,713,776 | |
| CTS Eventim AG | 568,280 | 19,905,189 | |
| Fielmann AG | 151,773 | 11,190,188 | |
| Nexus AG | 278,558 | 4,880,131 | |
| TOTAL GERMANY | 60,983,137 | ||
| Greece - 0.3% | |||
| Titan Cement Co. SA (Reg.) | 139,480 | 3,181,769 | |
| India - 0.5% | |||
| Jyothy Laboratories Ltd. | 1,189,354 | 5,450,307 | |
| Ireland - 1.3% | |||
| FBD Holdings PLC | 240,328 | 1,761,200 | |
| James Hardie Industries PLC: | |||
| CDI | 405,775 | 5,717,080 | |
| sponsored ADR | 564,575 | 7,915,342 | |
| TOTAL IRELAND | 15,393,622 | ||
| Isle of Man - 0.7% | |||
| Playtech Ltd. | 717,342 | 8,432,321 | |
| Israel - 2.0% | |||
| Azrieli Group | 165,005 | 6,553,478 | |
| Ituran Location & Control Ltd. | 383,208 | 7,970,726 | |
| Sarine Technologies Ltd. | 665,700 | 816,749 | |
| Strauss Group Ltd. | 484,244 | 7,673,617 | |
| TOTAL ISRAEL | 23,014,570 | ||
| Italy - 3.7% | |||
| Azimut Holding SpA | 641,097 | 16,135,257 | |
| Banco di Desio e della Brianza SpA | 1,070,000 | 3,016,451 | |
| Beni Stabili SpA SIIQ | 12,945,675 | 9,590,769 | |
| Interpump Group SpA | 1,027,943 | 14,795,470 | |
| TOTAL ITALY | 43,537,947 | ||
| Japan - 25.1% | |||
| Aoki Super Co. Ltd. | 273,000 | 3,225,856 | |
| Artnature, Inc. | 891,000 | 7,387,610 | |
| Asahi Co. Ltd. | 460,400 | 6,828,776 | |
| Autobacs Seven Co. Ltd. | 380,300 | 6,561,433 | |
| Azbil Corp. | 594,000 | 15,241,018 | |
| Broadleaf Co. Ltd. | 76,700 | 757,954 | |
| Central Automotive Products Ltd. (c) | 12,000 | 100,017 | |
| Century21 Real Estate Japan Ltd. (c) | 4,100 | 45,648 | |
| Coca-Cola Central Japan Co. Ltd. | 333,300 | 6,106,357 | |
| Daiichikosho Co. Ltd. | 221,300 | 9,277,286 | |
| Daikokutenbussan Co. Ltd. | 169,100 | 7,599,991 | |
| Funai Soken Holdings, Inc. | 210,000 | 3,186,088 | |
| GCA Savvian Group Corp. | 447,600 | 4,135,967 | |
| Glory Ltd. (d) | 277,100 | 9,075,383 | |
| Goldcrest Co. Ltd. | 522,130 | 7,476,255 | |
| Iwatsuka Confectionary Co. Ltd. | 50,400 | 2,283,383 | |
| Japan Digital Laboratory Co. | 459,100 | 6,210,344 | |
| Kobayashi Pharmaceutical Co. Ltd. | 132,000 | 10,514,151 | |
| Koshidaka Holdings Co. Ltd. | 166,900 | 3,281,884 | |
| Lasertec Corp. | 376,136 | 4,890,217 | |
| Medikit Co. Ltd. (c) | 126,700 | 4,417,152 | |
| Meiko Network Japan Co. Ltd. | 112,600 | 1,241,872 | |
| Miraial Co. Ltd. | 38,200 | 269,148 | |
| Nagaileben Co. Ltd. | 562,600 | 11,480,790 | |
| Nakano Refrigerators Co. Ltd. | 135,000 | 3,229,851 | |
| ND Software Co. Ltd. | 73,843 | 607,845 | |
| Nihon Parkerizing Co. Ltd. | 1,427,500 | 12,591,122 | |
| NS Tool Co. Ltd. (b) | 35,600 | 590,226 | |
| OBIC Co. Ltd. | 336,500 | 17,686,755 | |
| OSG Corp. | 715,000 | 13,287,288 | |
| Paramount Bed Holdings Co. Ltd. | 229,400 | 8,533,414 | |
| ProNexus, Inc. (d) | 569,600 | 5,760,400 | |
| San-Ai Oil Co. Ltd. | 630,000 | 4,415,294 | |
| Seven Bank Ltd. | 2,834,900 | 12,046,080 | |
| SHO-BOND Holdings Co. Ltd. | 263,700 | 11,410,078 | |
| Shoei Co. Ltd. | 309,426 | 4,683,769 | |
| SK Kaken Co. Ltd. | 75,000 | 6,153,866 | |
| Software Service, Inc. | 62,900 | 2,429,462 | |
| Techno Medica Co. Ltd. | 79,491 | 1,666,416 | |
| The Monogatari Corp. | 104,300 | 4,922,928 | |
| The Nippon Synthetic Chemical Industry Co. Ltd. | 391,000 | 2,359,434 | |
| TKC Corp. | 247,400 | 6,721,508 | |
| Tocalo Co. Ltd. | 117,000 | 2,104,645 | |
| Tsutsumi Jewelry Co. Ltd. | 139,000 | 2,903,454 | |
| USS Co. Ltd. | 1,498,300 | 23,700,626 | |
| Workman Co. Ltd. | 212,500 | 6,680,033 | |
| Yamada Consulting Group Co. Ltd. | 134,495 | 4,108,888 | |
| Yamato Kogyo Co. Ltd. | 99,100 | 2,326,325 | |
| TOTAL JAPAN | 292,514,287 | ||
| Korea (South) - 1.4% | |||
| BGFretail Co. Ltd. | 84,156 | 13,662,702 | |
| Leeno Industrial, Inc. | 57,500 | 2,150,588 | |
| TOTAL KOREA (SOUTH) | 15,813,290 | ||
| Mexico - 0.6% | |||
| Consorcio ARA S.A.B. de CV | 17,196,078 | 6,746,637 | |
| Netherlands - 2.5% | |||
| Aalberts Industries NV | 319,501 | 10,946,071 | |
| Heijmans NV (Certificaten Van Aandelen) (a) | 304,192 | 2,866,633 | |
| VastNed Retail NV | 337,390 | 14,854,328 | |
| TOTAL NETHERLANDS | 28,667,032 | ||
| Norway - 0.5% | |||
| Kongsberg Gruppen ASA | 320,500 | 5,373,610 | |
| Philippines - 0.4% | |||
| Jollibee Food Corp. | 1,026,090 | 5,008,829 | |
| South Africa - 0.6% | |||
| Clicks Group Ltd. | 899,913 | 6,572,695 | |
| Spain - 2.0% | |||
| Hispania Activos Inmobiliarios SA (a) | 210,543 | 3,085,853 | |
| Merlin Properties Socimi SA | 613,100 | 7,125,606 | |
| Prosegur Compania de Seguridad SA (Reg.) | 2,317,590 | 13,401,470 | |
| TOTAL SPAIN | 23,612,929 | ||
| Sweden - 3.2% | |||
| Fagerhult AB | 842,305 | 19,614,223 | |
| Intrum Justitia AB (b) | 273,334 | 9,809,520 | |
| Saab AB (B Shares) | 227,500 | 7,782,160 | |
| TOTAL SWEDEN | 37,205,903 | ||
| Switzerland - 0.3% | |||
| Tecan Group AG | 24,053 | 3,339,789 | |
| Taiwan - 0.3% | |||
| Addcn Technology Co. Ltd. | 516,900 | 3,968,399 | |
| United Kingdom - 20.5% | |||
| AA PLC | 1,441,400 | 5,867,599 | |
| Alliance Pharma PLC | 4,253,100 | 2,796,488 | |
| Bellway PLC | 439,872 | 15,727,333 | |
| Berendsen PLC | 1,173,163 | 20,227,172 | |
| Britvic PLC | 543,571 | 5,591,441 | |
| Dechra Pharmaceuticals PLC | 609,609 | 9,851,476 | |
| DP Poland PLC (a)(e) | 8,208,000 | 3,118,211 | |
| Elementis PLC | 3,262,010 | 10,290,411 | |
| Great Portland Estates PLC | 961,189 | 10,645,665 | |
| Hilton Food Group PLC | 222,288 | 1,828,602 | |
| Howden Joinery Group PLC | 1,639,800 | 11,836,209 | |
| Informa PLC | 1,613,965 | 15,434,713 | |
| InterContinental Hotel Group PLC ADR (b) | 216,931 | 8,707,610 | |
| ITE Group PLC | 2,882,634 | 6,539,069 | |
| JUST EAT Ltd. (a) | 819,470 | 4,591,909 | |
| Rightmove PLC | 166,747 | 9,399,723 | |
| Shaftesbury PLC | 1,092,673 | 14,528,688 | |
| Spectris PLC | 557,278 | 14,827,798 | |
| Spirax-Sarco Engineering PLC | 408,791 | 20,397,965 | |
| Taylor Wimpey PLC | 1,686,800 | 4,542,383 | |
| Ted Baker PLC | 233,700 | 8,144,078 | |
| Topps Tiles PLC | 2,473,300 | 4,914,853 | |
| Ultra Electronics Holdings PLC | 392,558 | 10,129,531 | |
| Unite Group PLC | 2,079,823 | 19,221,254 | |
| TOTAL UNITED KINGDOM | 239,160,181 | ||
| United States of America - 7.7% | |||
| ANSYS, Inc. (a) | 36,085 | 3,275,435 | |
| Autoliv, Inc. (b) | 65,200 | 7,985,044 | |
| Broadridge Financial Solutions, Inc. | 93,905 | 5,619,275 | |
| China Biologic Products, Inc. (a) | 110,380 | 12,914,460 | |
| Domino's Pizza, Inc. | 44,000 | 5,318,720 | |
| Energizer Holdings, Inc. | 54,409 | 2,366,247 | |
| Kennedy-Wilson Holdings, Inc. | 556,629 | 12,028,753 | |
| Martin Marietta Materials, Inc. | 34,720 | 5,875,666 | |
| Mohawk Industries, Inc. (a) | 42,600 | 8,206,038 | |
| PriceSmart, Inc. | 147,199 | 12,738,601 | |
| ResMed, Inc. | 86,095 | 4,804,101 | |
| SS&C Technologies Holdings, Inc. | 152,058 | 9,298,347 | |
| TOTAL UNITED STATES OF AMERICA | 90,430,687 | ||
| TOTAL COMMON STOCKS | |||
| (Cost $941,309,093) | 1,059,819,139 | ||
| Nonconvertible Preferred Stocks - 1.4% | |||
| Germany - 1.4% | |||
| Sartorius AG (non-vtg.) | |||
| (Cost $9,231,224) | 65,520 | 16,163,851 | |
| Money Market Funds - 8.5% | |||
| Fidelity Cash Central Fund, 0.38% (f) | 85,942,201 | 85,942,201 | |
| Fidelity Securities Lending Cash Central Fund, 0.42% (f)(g) | 13,328,610 | 13,328,610 | |
| TOTAL MONEY MARKET FUNDS | |||
| (Cost $99,270,811) | 99,270,811 | ||
| TOTAL INVESTMENT PORTFOLIO - 100.7% | |||
| (Cost $1,049,811,128) | 1,175,253,801 | ||
| NET OTHER ASSETS (LIABILITIES) - (0.7)% | (7,959,739) | ||
| NET ASSETS - 100% | $1,167,294,062 |
Categorizations in the Schedule of Investments are based on country or territory of incorporation.
Legend
(a) Non-income producing
(b) Security or a portion of the security is on loan at period end.
(c) Security or a portion of the security purchased on a delayed delivery or when-issued basis.
(d) A portion of the security sold on a delayed delivery basis.
(e) Affiliated company
(f) Affiliated fund that is generally available only to investment companies and other accounts managed by Fidelity Investments. The rate quoted is the annualized seven-day yield of the fund at period end. A complete unaudited listing of the fund's holdings as of its most recent quarter end is available upon request. In addition, each Fidelity Central Fund's financial statements are available on the SEC's website or upon request.
(g) Investment made with cash collateral received from securities on loan.
Affiliated Central Funds
Information regarding fiscal year to date income earned by the Fund from investments in Fidelity Central Funds is as follows:
| Fund | Income earned |
| Fidelity Cash Central Fund | $167,523 |
| Fidelity Securities Lending Cash Central Fund | 77,863 |
| Total | $245,386 |
Other Affiliated Issuers
An affiliated company is a company in which the Fund has ownership of at least 5% of the voting securities. Fiscal year to date transactions with companies which are or were affiliates are as follows:
| Affiliate | Value, beginning of period | Purchases | Sales Proceeds | Dividend Income | Value, end of period |
| DP Poland PLC | $2,507,081 | $321,456 | $-- | $-- | $3,118,211 |
| Total | $2,507,081 | $321,456 | $-- | $-- | $3,118,211 |
Investment Valuation
The following is a summary of the inputs used, as of April 30, 2016, involving the Fund's assets and liabilities carried at fair value. The inputs or methodology used for valuing securities may not be an indication of the risk associated with investing in those securities. For more information on valuation inputs, and their aggregation into the levels used below, please refer to the Investment Valuation section in the accompanying Notes to Financial Statements.
| Valuation Inputs at Reporting Date: | ||||
| Description | Total | Level 1 | Level 2 | Level 3 |
| Investments in Securities: | ||||
| Equities: | ||||
| Consumer Discretionary | $241,379,798 | $171,197,720 | $70,182,078 | $-- |
| Consumer Staples | 97,181,396 | 60,064,048 | 37,117,348 | -- |
| Energy | 16,013,832 | 11,598,538 | 4,415,294 | -- |
| Financials | 188,656,059 | 161,193,087 | 27,462,972 | -- |
| Health Care | 121,220,721 | 92,085,642 | 29,135,079 | -- |
| Industrials | 209,307,773 | 156,554,926 | 52,752,847 | -- |
| Information Technology | 125,022,200 | 73,245,256 | 51,776,944 | -- |
| Materials | 77,201,211 | 50,588,695 | 26,612,516 | -- |
| Money Market Funds | 99,270,811 | 99,270,811 | -- | -- |
| Total Investments in Securities: | $1,175,253,801 | $875,798,723 | $299,455,078 | $-- |
The following is a summary of transfers between Level 1 and Level 2 for the period ended April 30, 2016. Transfers are assumed to have occurred at the beginning of the period, and are primarily attributable to the valuation techniques used for foreign equity securities, as discussed in the accompanying Notes to Financial Statements:
| Transfers | Total |
| Level 1 to Level 2 | $3,963,761 |
| Level 2 to Level 1 | $28,474,370 |
See accompanying notes which are an integral part of the financial statements.
Financial Statements
Statement of Assets and Liabilities
| April 30, 2016 (Unaudited) | ||
| Assets | ||
| Investment in securities, at value (including securities loaned of $13,034,826) — See accompanying schedule: Unaffiliated issuers (cost $948,419,765) | $1,072,864,779 | |
| Fidelity Central Funds (cost $99,270,811) | 99,270,811 | |
| Other affiliated issuers (cost $2,120,552) | 3,118,211 | |
| Total Investments (cost $1,049,811,128) | $1,175,253,801 | |
| Receivable for investments sold | ||
| Regular delivery | 759,807 | |
| Delayed delivery | 139,587 | |
| Receivable for fund shares sold | 1,947,400 | |
| Dividends receivable | 5,382,395 | |
| Distributions receivable from Fidelity Central Funds | 62,435 | |
| Prepaid expenses | 498 | |
| Other receivables | 2,840 | |
| Total assets | 1,183,548,763 | |
| Liabilities | ||
| Payable to custodian bank | $27,592 | |
| Payable for investments purchased | ||
| Regular delivery | 62,835 | |
| Delayed delivery | 30,608 | |
| Payable for fund shares redeemed | 1,639,204 | |
| Accrued management fee | 826,592 | |
| Distribution and service plan fees payable | 30,380 | |
| Other affiliated payables | 242,791 | |
| Other payables and accrued expenses | 66,089 | |
| Collateral on securities loaned, at value | 13,328,610 | |
| Total liabilities | 16,254,701 | |
| Net Assets | $1,167,294,062 | |
| Net Assets consist of: | ||
| Paid in capital | $1,286,497,613 | |
| Undistributed net investment income | 3,446,654 | |
| Accumulated undistributed net realized gain (loss) on investments and foreign currency transactions | (248,244,637) | |
| Net unrealized appreciation (depreciation) on investments and assets and liabilities in foreign currencies | 125,594,432 | |
| Net Assets | $1,167,294,062 | |
| Calculation of Maximum Offering Price | ||
| Class A: | ||
| Net Asset Value and redemption price per share ($50,512,499 ÷ 3,421,332 shares) | $14.76 | |
| Maximum offering price per share (100/94.25 of $14.76) | $15.66 | |
| Class T: | ||
| Net Asset Value and redemption price per share ($13,820,005 ÷ 943,286 shares) | $14.65 | |
| Maximum offering price per share (100/96.50 of $14.65) | $15.18 | |
| Class B: | ||
| Net Asset Value and offering price per share ($354,955 ÷ 24,616 shares)(a) | $14.42 | |
| Class C: | ||
| Net Asset Value and offering price per share ($16,766,047 ÷ 1,174,289 shares)(a) | $14.28 | |
| International Small Cap Opportunities: | ||
| Net Asset Value, offering price and redemption price per share ($943,035,473 ÷ 63,201,820 shares) | $14.92 | |
| Class I: | ||
| Net Asset Value, offering price and redemption price per share ($142,805,083 ÷ 9,576,371 shares) | $14.91 |
(a) Redemption price per share is equal to net asset value less any applicable contingent deferred sales charge.
See accompanying notes which are an integral part of the financial statements.
Statement of Operations
| Six months ended April 30, 2016 (Unaudited) | ||
| Investment Income | ||
| Dividends | $10,624,721 | |
| Income from Fidelity Central Funds | 245,386 | |
| Income before foreign taxes withheld | 10,870,107 | |
| Less foreign taxes withheld | (928,950) | |
| Total income | 9,941,157 | |
| Expenses | ||
| Management fee | ||
| Basic fee | $4,515,535 | |
| Performance adjustment | 205,580 | |
| Transfer agent fees | 1,169,397 | |
| Distribution and service plan fees | 178,936 | |
| Accounting and security lending fees | 247,112 | |
| Custodian fees and expenses | 97,381 | |
| Independent trustees' compensation | 2,222 | |
| Registration fees | 58,793 | |
| Audit | 45,289 | |
| Legal | 1,350 | |
| Miscellaneous | 2,905 | |
| Total expenses before reductions | 6,524,500 | |
| Expense reductions | (4,405) | 6,520,095 |
| Net investment income (loss) | 3,421,062 | |
| Realized and Unrealized Gain (Loss) | ||
| Net realized gain (loss) on: | ||
| Investment securities: | ||
| Unaffiliated issuers | 13,404,515 | |
| Foreign currency transactions | 1,988 | |
| Total net realized gain (loss) | 13,406,503 | |
| Change in net unrealized appreciation (depreciation) on: Investment securities | (4,093,560) | |
| Assets and liabilities in foreign currencies | 188,590 | |
| Total change in net unrealized appreciation (depreciation) | (3,904,970) | |
| Net gain (loss) | 9,501,533 | |
| Net increase (decrease) in net assets resulting from operations | $12,922,595 |
See accompanying notes which are an integral part of the financial statements.
Statement of Changes in Net Assets
| Six months ended April 30, 2016 (Unaudited) | Year ended October 31, 2015 | |
| Increase (Decrease) in Net Assets | ||
| Operations | ||
| Net investment income (loss) | $3,421,062 | $4,880,273 |
| Net realized gain (loss) | 13,406,503 | 32,155,951 |
| Change in net unrealized appreciation (depreciation) | (3,904,970) | 15,708,708 |
| Net increase (decrease) in net assets resulting from operations | 12,922,595 | 52,744,932 |
| Distributions to shareholders from net investment income | (4,852,691) | (3,982,311) |
| Distributions to shareholders from net realized gain | (4,655,673) | (949,656) |
| Total distributions | (9,508,364) | (4,931,967) |
| Share transactions - net increase (decrease) | 206,876,426 | 250,623,581 |
| Redemption fees | 159,056 | 196,651 |
| Total increase (decrease) in net assets | 210,449,713 | 298,633,197 |
| Net Assets | ||
| Beginning of period | 956,844,349 | 658,211,152 |
| End of period (including undistributed net investment income of $3,446,654 and undistributed net investment income of $4,878,283, respectively) | $1,167,294,062 | $956,844,349 |
See accompanying notes which are an integral part of the financial statements.
Financial Highlights — Fidelity International Small Cap Opportunities Fund Class A
| Six months ended (Unaudited) April 30, | Years ended October 31, | |||||
| 2016 | 2015 | 2014 | 2013 | 2012 | 2011 | |
| Selected Per–Share Data | ||||||
| Net asset value, beginning of period | $14.75 | $13.65 | $13.68 | $10.78 | $9.75 | $9.82 |
| Income from Investment Operations | ||||||
| Net investment income (loss)A | .03 | .06 | .05 | .07 | .08 | .15B |
| Net realized and unrealized gain (loss) | .10 | 1.11 | .05 | 2.91 | 1.07 | (.07) |
| Total from investment operations | .13 | 1.17 | .10 | 2.98 | 1.15 | .08 |
| Distributions from net investment income | (.05) | (.05) | (.06) | (.08) | (.11) | (.11) |
| Distributions from net realized gain | (.07) | (.02) | (.08) | (.01) | (.01) | (.04) |
| Total distributions | (.12) | (.07) | (.13)C | (.08)D | (.12) | (.15) |
| Redemption fees added to paid in capitalA,E | – | – | – | – | – | – |
| Net asset value, end of period | $14.76 | $14.75 | $13.65 | $13.68 | $10.78 | $9.75 |
| Total ReturnF,G,H | .89% | 8.62% | .78% | 27.85% | 12.00% | .81% |
| Ratios to Average Net AssetsI,J | ||||||
| Expenses before reductions | 1.47%K | 1.52% | 1.63% | 1.70% | 1.75% | 1.34% |
| Expenses net of fee waivers, if any | 1.47%K | 1.52% | 1.63% | 1.65% | 1.65% | 1.33% |
| Expenses net of all reductions | 1.47%K | 1.51% | 1.63% | 1.64% | 1.64% | 1.32% |
| Net investment income (loss) | .40%K | .38% | .33% | .59% | .85% | 1.44%B |
| Supplemental Data | ||||||
| Net assets, end of period (000 omitted) | $50,512 | $42,289 | $25,041 | $22,052 | $18,194 | $18,686 |
| Portfolio turnover rateL | 19%K | 21% | 18% | 31% | 28% | 24% |
A Calculated based on average shares outstanding during the period.
B Net Investment income per share reflects a large, non-recurring dividend which amounted to $.06 per share. Excluding this non-recurring dividend, the ratio of net investment income (loss) to average net assets would have been .80%.
C Total distributions of $.13 per share is comprised of distributions from net investment income of $.055 and distributions from net realized gain of $.079 per share.
D Total distributions of $.08 per share is comprised of distributions from net investment income of $.077 and distributions from net realized gain of $.005 per share.
E Amount represents less than $.005 per share.
F Total returns for periods of less than one year are not annualized.
G Total returns would have been lower if certain expenses had not been reduced during the applicable periods shown.
H Total returns do not include the effect of the sales charges.
I Fees and expenses of any underlying Fidelity Central Funds are not included in the Fund's expense ratio. The Fund indirectly bears its proportionate share of the expenses of any underlying Fidelity Central Funds.
J Expense ratios reflect operating expenses of the class. Expenses before reductions do not reflect amounts reimbursed by the investment adviser or reductions from brokerage service arrangements or reductions from other expense offset arrangements and do not represent the amount paid by the class during periods when reimbursements or reductions occur. Expenses net of fee waivers reflect expenses after reimbursement by the investment adviser but prior to reductions from brokerage service arrangements or other expense offset arrangements. Expenses net of all reductions represent the net expenses paid by the class.
K Annualized
L Amount does not include the portfolio activity of any underlying Fidelity Central Funds.
See accompanying notes which are an integral part of the financial statements.
Financial Highlights — Fidelity International Small Cap Opportunities Fund Class T
| Six months ended (Unaudited) April 30, | Years ended October 31, | |||||
| 2016 | 2015 | 2014 | 2013 | 2012 | 2011 | |
| Selected Per–Share Data | ||||||
| Net asset value, beginning of period | $14.62 | $13.53 | $13.56 | $10.69 | $9.66 | $9.72 |
| Income from Investment Operations | ||||||
| Net investment income (loss)A | .01 | .01 | .01 | .04 | .06 | .12B |
| Net realized and unrealized gain (loss) | .10 | 1.11 | .06 | 2.89 | 1.06 | (.06) |
| Total from investment operations | .11 | 1.12 | .07 | 2.93 | 1.12 | .06 |
| Distributions from net investment income | (.01) | (.01) | (.02) | (.05) | (.08) | (.08) |
| Distributions from net realized gain | (.07) | (.02) | (.08) | (.01) | (.01) | (.04) |
| Total distributions | (.08) | (.03) | (.10) | (.06) | (.09) | (.12) |
| Redemption fees added to paid in capitalA,C | – | – | – | – | – | – |
| Net asset value, end of period | $14.65 | $14.62 | $13.53 | $13.56 | $10.69 | $9.66 |
| Total ReturnD,E,F | .75% | 8.27% | .55% | 27.53% | 11.72% | .60% |
| Ratios to Average Net AssetsG,H | ||||||
| Expenses before reductions | 1.79%I | 1.80% | 1.89% | 1.96% | 2.02% | 1.60% |
| Expenses net of fee waivers, if any | 1.78%I | 1.80% | 1.89% | 1.90% | 1.90% | 1.60% |
| Expenses net of all reductions | 1.78%I | 1.80% | 1.89% | 1.89% | 1.89% | 1.59% |
| Net investment income (loss) | .08%I | .10% | .07% | .34% | .60% | 1.17%B |
| Supplemental Data | ||||||
| Net assets, end of period (000 omitted) | $13,820 | $13,296 | $9,913 | $9,634 | $8,169 | $8,701 |
| Portfolio turnover rateJ | 19%I | 21% | 18% | 31% | 28% | 24% |
A Calculated based on average shares outstanding during the period.
B Net Investment income per share reflects a large, non-recurring dividend which amounted to $.06 per share. Excluding this non-recurring dividend, the ratio of net investment income (loss) to average net assets would have been .54%.
C Amount represents less than $.005 per share.
D Total returns for periods of less than one year are not annualized.
E Total returns would have been lower if certain expenses had not been reduced during the applicable periods shown.
F Total returns do not include the effect of the sales charges.
G Fees and expenses of any underlying Fidelity Central Funds are not included in the Fund's expense ratio. The Fund indirectly bears its proportionate share of the expenses of any underlying Fidelity Central Funds.
H Expense ratios reflect operating expenses of the class. Expenses before reductions do not reflect amounts reimbursed by the investment adviser or reductions from brokerage service arrangements or reductions from other expense offset arrangements and do not represent the amount paid by the class during periods when reimbursements or reductions occur. Expenses net of fee waivers reflect expenses after reimbursement by the investment adviser but prior to reductions from brokerage service arrangements or other expense offset arrangements. Expenses net of all reductions represent the net expenses paid by the class.
I Annualized
J Amount does not include the portfolio activity of any underlying Fidelity Central Funds.
See accompanying notes which are an integral part of the financial statements.
Financial Highlights — Fidelity International Small Cap Opportunities Fund Class B
| Six months ended (Unaudited) April 30, | Years ended October 31, | |||||
| 2016 | 2015 | 2014 | 2013 | 2012 | 2011 | |
| Selected Per–Share Data | ||||||
| Net asset value, beginning of period | $14.35 | $13.31 | $13.31 | $10.50 | $9.48 | $9.54 |
| Income from Investment Operations | ||||||
| Net investment income (loss)A | (.03) | (.06) | (.06) | (.02) | .01 | .07B |
| Net realized and unrealized gain (loss) | .10 | 1.10 | .06 | 2.84 | 1.05 | (.06) |
| Total from investment operations | .07 | 1.04 | – | 2.82 | 1.06 | .01 |
| Distributions from net investment income | – | – | – | –C | (.03) | (.06) |
| Distributions from net realized gain | – | – | – | (.01) | (.01) | (.02) |
| Total distributions | – | – | – | (.01) | (.04) | (.07)D |
| Redemption fees added to paid in capitalA,C | – | – | – | – | – | – |
| Net asset value, end of period | $14.42 | $14.35 | $13.31 | $13.31 | $10.50 | $9.48 |
| Total ReturnE,F,G | .49% | 7.81% | -% | 26.86% | 11.21% | .10% |
| Ratios to Average Net AssetsH,I | ||||||
| Expenses before reductions | 2.28%J | 2.30% | 2.38% | 2.46% | 2.50% | 2.09% |
| Expenses net of fee waivers, if any | 2.28%J | 2.30% | 2.38% | 2.40% | 2.40% | 2.09% |
| Expenses net of all reductions | 2.28%J | 2.29% | 2.38% | 2.39% | 2.39% | 2.07% |
| Net investment income (loss) | (.41)%J | (.39)% | (.43)% | (.16)% | .10% | .68%B |
| Supplemental Data | ||||||
| Net assets, end of period (000 omitted) | $355 | $604 | $744 | $1,410 | $1,966 | $2,293 |
| Portfolio turnover rateK | 19%J | 21% | 18% | 31% | 28% | 24% |
A Calculated based on average shares outstanding during the period.
B Net Investment income per share reflects a large, non-recurring dividend which amounted to $.06 per share. Excluding this non-recurring dividend, the ratio of net investment income (loss) to average net assets would have been .05%.
C Amount represents less than $.005 per share.
D Total distributions of $.07 per share is comprised of distributions from net investment income of $.058 and distributions from net realized gain of $.015 per share.
E Total returns for periods of less than one year are not annualized.
F Total returns would have been lower if certain expenses had not been reduced during the applicable periods shown.
G Total returns do not include the effect of the contingent deferred sales charge.
H Fees and expenses of any underlying Fidelity Central Funds are not included in the Fund's expense ratio. The Fund indirectly bears its proportionate share of the expenses of any underlying Fidelity Central Funds.
I Expense ratios reflect operating expenses of the class. Expenses before reductions do not reflect amounts reimbursed by the investment adviser or reductions from brokerage service arrangements or reductions from other expense offset arrangements and do not represent the amount paid by the class during periods when reimbursements or reductions occur. Expenses net of fee waivers reflect expenses after reimbursement by the investment adviser but prior to reductions from brokerage service arrangements or other expense offset arrangements. Expenses net of all reductions represent the net expenses paid by the class.
J Annualized
K Amount does not include the portfolio activity of any underlying Fidelity Central Funds.
See accompanying notes which are an integral part of the financial statements.
Financial Highlights — Fidelity International Small Cap Opportunities Fund Class C
| Six months ended (Unaudited) April 30, | Years ended October 31, | |||||
| 2016 | 2015 | 2014 | 2013 | 2012 | 2011 | |
| Selected Per–Share Data | ||||||
| Net asset value, beginning of period | $14.26 | $13.23 | $13.28 | $10.48 | $9.47 | $9.53 |
| Income from Investment Operations | ||||||
| Net investment income (loss)A | (.03) | (.05) | (.06) | (.02) | .01 | .07B |
| Net realized and unrealized gain (loss) | .10 | 1.08 | .06 | 2.84 | 1.04 | (.06) |
| Total from investment operations | .07 | 1.03 | – | 2.82 | 1.05 | .01 |
| Distributions from net investment income | – | – | – | (.01) | (.03) | (.06) |
| Distributions from net realized gain | (.05) | – | (.05) | (.01) | (.01) | (.02) |
| Total distributions | (.05) | – | (.05) | (.02) | (.04) | (.07)C |
| Redemption fees added to paid in capitalA,D | – | – | – | – | – | – |
| Net asset value, end of period | $14.28 | $14.26 | $13.23 | $13.28 | $10.48 | $9.47 |
| Total ReturnE,F,G | .51% | 7.79% | .03% | 26.91% | 11.13% | .10% |
| Ratios to Average Net AssetsH,I | ||||||
| Expenses before reductions | 2.27%J | 2.27% | 2.38% | 2.45% | 2.50% | 2.09% |
| Expenses net of fee waivers, if any | 2.27%J | 2.27% | 2.38% | 2.40% | 2.40% | 2.09% |
| Expenses net of all reductions | 2.27%J | 2.26% | 2.38% | 2.39% | 2.39% | 2.07% |
| Net investment income (loss) | (.40)%J | (.36)% | (.42)% | (.16)% | .10% | .68%B |
| Supplemental Data | ||||||
| Net assets, end of period (000 omitted) | $16,766 | $17,370 | $8,438 | $8,070 | $6,608 | $6,900 |
| Portfolio turnover rateK | 19%J | 21% | 18% | 31% | 28% | 24% |
A Calculated based on average shares outstanding during the period.
B Net Investment income per share reflects a large, non-recurring dividend which amounted to $.06 per share. Excluding this non-recurring dividend, the ratio of net investment income (loss) to average net assets would have been .05%.
C Total distributions of $.07 per share is comprised of distributions from net investment income of $.058 and distributions from net realized gain of $.015 per share.
D Amount represents less than $.005 per share.
E Total returns for periods of less than one year are not annualized.
F Total returns would have been lower if certain expenses had not been reduced during the applicable periods shown.
G Total returns do not include the effect of the contingent deferred sales charge.
H Fees and expenses of any underlying Fidelity Central Funds are not included in the Fund's expense ratio. The Fund indirectly bears its proportionate share of the expenses of any underlying Fidelity Central Funds.
I Expense ratios reflect operating expenses of the class. Expenses before reductions do not reflect amounts reimbursed by the investment adviser or reductions from brokerage service arrangements or reductions from other expense offset arrangements and do not represent the amount paid by the class during periods when reimbursements or reductions occur. Expenses net of fee waivers reflect expenses after reimbursement by the investment adviser but prior to reductions from brokerage service arrangements or other expense offset arrangements. Expenses net of all reductions represent the net expenses paid by the class.
J Annualized
K Amount does not include the portfolio activity of any underlying Fidelity Central Funds.
See accompanying notes which are an integral part of the financial statements.
Financial Highlights — Fidelity International Small Cap Opportunities Fund
| Six months ended (Unaudited) April 30, | Years ended October 31, | |||||
| 2016 | 2015 | 2014 | 2013 | 2012 | 2011 | |
| Selected Per–Share Data | ||||||
| Net asset value, beginning of period | $14.91 | $13.80 | $13.82 | $10.88 | $9.85 | $9.92 |
| Income from Investment Operations | ||||||
| Net investment income (loss)A | .05 | .10 | .09 | .10 | .11 | .17B |
| Net realized and unrealized gain (loss) | .11 | 1.12 | .06 | 2.95 | 1.07 | (.06) |
| Total from investment operations | .16 | 1.22 | .15 | 3.05 | 1.18 | .11 |
| Distributions from net investment income | (.08) | (.09) | (.09) | (.10) | (.14) | (.14) |
| Distributions from net realized gain | (.07) | (.02) | (.08) | (.01) | (.01) | (.04) |
| Total distributions | (.15) | (.11) | (.17) | (.11) | (.15) | (.18) |
| Redemption fees added to paid in capitalA,C | – | – | – | – | – | – |
| Net asset value, end of period | $14.92 | $14.91 | $13.80 | $13.82 | $10.88 | $9.85 |
| Total ReturnD,E | 1.03% | 8.92% | 1.11% | 28.24% | 12.21% | 1.10% |
| Ratios to Average Net AssetsF,G | ||||||
| Expenses before reductions | 1.19%H | 1.23% | 1.30% | 1.39% | 1.47% | 1.08% |
| Expenses net of fee waivers, if any | 1.19%H | 1.22% | 1.30% | 1.39% | 1.40% | 1.08% |
| Expenses net of all reductions | 1.19%H | 1.22% | 1.30% | 1.38% | 1.39% | 1.06% |
| Net investment income (loss) | .68%H | .68% | .65% | .85% | 1.10% | 1.69%B |
| Supplemental Data | ||||||
| Net assets, end of period (000 omitted) | $943,035 | $762,563 | $584,253 | $518,121 | $334,918 | $328,262 |
| Portfolio turnover rateI | 19%H | 21% | 18% | 31% | 28% | 24% |
A Calculated based on average shares outstanding during the period.
B Net Investment income per share reflects a large, non-recurring dividend which amounted to $.07 per share. Excluding this non-recurring dividend, the ratio of net investment income (loss) to average net assets would have been 1.06%.
C Amount represents less than $.005 per share.
D Total returns for periods of less than one year are not annualized.
E Total returns would have been lower if certain expenses had not been reduced during the applicable periods shown.
F Fees and expenses of any underlying Fidelity Central Funds are not included in the Fund's expense ratio. The Fund indirectly bears its proportionate share of the expenses of any underlying Fidelity Central Funds.
G Expense ratios reflect operating expenses of the class. Expenses before reductions do not reflect amounts reimbursed by the investment adviser or reductions from brokerage service arrangements or reductions from other expense offset arrangements and do not represent the amount paid by the class during periods when reimbursements or reductions occur. Expenses net of fee waivers reflect expenses after reimbursement by the investment adviser but prior to reductions from brokerage service arrangements or other expense offset arrangements. Expenses net of all reductions represent the net expenses paid by the class.
H Annualized
I Amount does not include the portfolio activity of any underlying Fidelity Central Funds.
See accompanying notes which are an integral part of the financial statements.
Financial Highlights — Fidelity International Small Cap Opportunities Fund Class I
| Six months ended (Unaudited) April 30, | Years ended October 31, | |||||
| 2016 | 2015 | 2014 | 2013 | 2012 | 2011 | |
| Selected Per–Share Data | ||||||
| Net asset value, beginning of period | $14.91 | $13.81 | $13.83 | $10.90 | $9.86 | $9.93 |
| Income from Investment Operations | ||||||
| Net investment income (loss)A | .05 | .10 | .08 | .11 | .11 | .18B |
| Net realized and unrealized gain (loss) | .10 | 1.13 | .07 | 2.93 | 1.08 | (.06) |
| Total from investment operations | .15 | 1.23 | .15 | 3.04 | 1.19 | .12 |
| Distributions from net investment income | (.08) | (.11) | (.09) | (.10) | (.14) | (.15) |
| Distributions from net realized gain | (.07) | (.02) | (.08) | (.01) | (.01) | (.04) |
| Total distributions | (.15) | (.13) | (.17) | (.11) | (.15) | (.19) |
| Redemption fees added to paid in capitalA,C | – | – | – | – | – | – |
| Net asset value, end of period | $14.91 | $14.91 | $13.81 | $13.83 | $10.90 | $9.86 |
| Total ReturnD,E | 1.02% | 8.98% | 1.11% | 28.11% | 12.32% | 1.13% |
| Ratios to Average Net AssetsF,G | ||||||
| Expenses before reductions | 1.17%H | 1.19% | 1.36% | 1.38% | 1.44% | 1.03% |
| Expenses net of fee waivers, if any | 1.17%H | 1.19% | 1.36% | 1.37% | 1.40% | 1.03% |
| Expenses net of all reductions | 1.17%H | 1.18% | 1.36% | 1.37% | 1.39% | 1.02% |
| Net investment income (loss) | .69%H | .71% | .60% | .87% | 1.10% | 1.74%B |
| Supplemental Data | ||||||
| Net assets, end of period (000 omitted) | $142,805 | $120,723 | $29,822 | $5,670 | $4,591 | $1,395 |
| Portfolio turnover rateI | 19%H | 21% | 18% | 31% | 28% | 24% |
A Calculated based on average shares outstanding during the period.
B Net Investment income per share reflects a large, non-recurring dividend which amounted to $.07 per share. Excluding this non-recurring dividend, the ratio of net investment income (loss) to average net assets would have been 1.11%.
C Amount represents less than $.005 per share.
D Total returns for periods of less than one year are not annualized.
E Total returns would have been lower if certain expenses had not been reduced during the applicable periods shown.
F Fees and expenses of any underlying Fidelity Central Funds are not included in the Fund's expense ratio. The Fund indirectly bears its proportionate share of the expenses of any underlying Fidelity Central Funds.
G Expense ratios reflect operating expenses of the class. Expenses before reductions do not reflect amounts reimbursed by the investment adviser or reductions from brokerage service arrangements or reductions from other expense offset arrangements and do not represent the amount paid by the class during periods when reimbursements or reductions occur. Expenses net of fee waivers reflect expenses after reimbursement by the investment adviser but prior to reductions from brokerage service arrangements or other expense offset arrangements. Expenses net of all reductions represent the net expenses paid by the class.
H Annualized
I Amount does not include the portfolio activity of any underlying Fidelity Central Funds.
See accompanying notes which are an integral part of the financial statements.
Notes to Financial Statements (Unaudited)
For the period ended April 30, 2016
1. Organization.
Fidelity International Small Cap Opportunities Fund (the Fund) is a fund of Fidelity Investment Trust (the Trust) and is authorized to issue an unlimited number of shares. The Trust is registered under the Investment Company Act of 1940, as amended (the 1940 Act), as an open-end management investment company organized as a Massachusetts business trust. The Fund offers Class A, Class T, Class C, International Small Cap Opportunities and Class I shares, each of which, along with Class B shares, has equal rights as to assets and voting privileges. Class B shares are closed to new accounts and additional purchases, except for exchanges and reinvestments. Each class has exclusive voting rights with respect to matters that affect that class. Class B shares will automatically convert to Class A shares after a maximum holding period of seven years from the initial date of purchase.
During the period, the Board of Trustees approved the conversion of all existing Class B shares into Class A shares, effective on or about July 1, 2016, regardless of the length of times shares have been held.
2. Investments in Fidelity Central Funds.
The Fund invests in Fidelity Central Funds, which are open-end investment companies generally available only to other investment companies and accounts managed by the investment adviser and its affiliates. The Fund's Schedule of Investments lists each of the Fidelity Central Funds held as of period end, if any, as an investment of the Fund, but does not include the underlying holdings of each Fidelity Central Fund. As an Investing Fund, the Fund indirectly bears its proportionate share of the expenses of the underlying Fidelity Central Funds.
The Money Market Central Funds seek preservation of capital and current income and are managed by Fidelity Investments Money Management, Inc. (FIMM), an affiliate of the investment adviser. Annualized expenses of the Money Market Central Funds as of their most recent shareholder report date are less than .005%.
A complete unaudited list of holdings for each Fidelity Central Fund is available upon request or at the Securities and Exchange Commission (the SEC) website at www.sec.gov. In addition, the financial statements of the Fidelity Central Funds are available on the SEC website or upon request.
3. Significant Accounting Policies.
The financial statements have been prepared in conformity with accounting principles generally accepted in the United States of America (GAAP), which require management to make certain estimates and assumptions at the date of the financial statements. Actual results could differ from those estimates. Subsequent events, if any, through the date that the financial statements were issued have been evaluated in the preparation of the financial statements. The following summarizes the significant accounting policies of the Fund:
Investment Valuation. Investments are valued as of 4:00 p.m. Eastern time on the last calendar day of the period. The Board of Trustees (the Board) has delegated the day to day responsibility for the valuation of the Fund's investments to the Fidelity Management & Research Company (FMR)Fair Value Committee (the Committee). In accordance with valuation policies and procedures approved by the Board, the Fund attempts to obtain prices from one or more third party pricing vendors or brokers to value its investments. When current market prices, quotations or currency exchange rates are not readily available or reliable, investments will be fair valued in good faith by the Committee, in accordance with procedures adopted by the Board. Factors used in determining fair value vary by investment type and may include market or investment specific events. The frequency with which these procedures are used cannot be predicted and they may be utilized to a significant extent. The Committee oversees the Fund's valuation policies and procedures and reports to the Board on the Committee's activities and fair value determinations. The Board monitors the appropriateness of the procedures used in valuing the Fund's investments and ratifies the fair value determinations of the Committee.
The Fund categorizes the inputs to valuation techniques used to value its investments into a disclosure hierarchy consisting of three levels as shown below:
- Level 1 – quoted prices in active markets for identical investments
- Level 2 – other significant observable inputs (including quoted prices for similar investments, interest rates, prepayment speeds, etc.)
- Level 3 – unobservable inputs (including the Fund's own assumptions based on the best information available)
Valuation techniques used to value the Fund's investments by major category are as follows:
Equity securities, including restricted securities, for which market quotations are readily available, are valued at the last reported sale price or official closing price as reported by a third party pricing vendor on the primary market or exchange on which they are traded and are categorized as Level 1 in the hierarchy. In the event there were no sales during the day or closing prices are not available, securities are valued at the last quoted bid price or may be valued using the last available price and are generally categorized as Level 2 in the hierarchy. For foreign equity securities, when market or security specific events arise, comparisons to the valuation of American Depositary Receipts (ADRs), futures contracts, Exchange-Traded Funds (ETFs) and certain indexes as well as quoted prices for similar securities may be used and would be categorized as Level 2 in the hierarchy. Utilizing these techniques may result in transfers between Level 1 and Level 2. For equity securities, including restricted securities, where observable inputs are limited, assumptions about market activity and risk are used and these securities may be categorized as Level 3 in the hierarchy.
Investments in open-end mutual funds, including the Fidelity Central Funds, are valued at their closing net asset value (NAV) each business day and are categorized as Level 1 in the hierarchy.
Changes in valuation techniques may result in transfers in or out of an assigned level within the disclosure hierarchy. The aggregate value of investments by input level as of April 30, 2016, including information on transfers between Levels 1 and 2 is included at the end of the Fund's Schedule of Investments.
Foreign Currency. The Fund may use foreign currency contracts to facilitate transactions in foreign-denominated securities. Gains and losses from these transactions may arise from changes in the value of the foreign currency or if the counterparties do not perform under the contracts' terms.
Foreign-denominated assets, including investment securities, and liabilities are translated into U.S. dollars at the exchange rates at period end. Purchases and sales of investment securities, income and dividends received and expenses denominated in foreign currencies are translated into U.S. dollars at the exchange rate in effect on the transaction date.
The effects of exchange rate fluctuations on investments are included with the net realized and unrealized gain (loss) on investment securities. Other foreign currency transactions resulting in realized and unrealized gain (loss) are disclosed separately.
Investment Transactions and Income. For financial reporting purposes, the Fund's investment holdings and NAV include trades executed through the end of the last business day of the period. The NAV per share for processing shareholder transactions is calculated as of the close of business of the New York Stock Exchange (NYSE), normally 4:00 p.m. Eastern time and includes trades executed through the end of the prior business day. Gains and losses on securities sold are determined on the basis of identified cost. Dividend income is recorded on the ex-dividend date, except for certain dividends from foreign securities where the ex-dividend date may have passed, which are recorded as soon as the Fund is informed of the ex-dividend date. Non-cash dividends included in dividend income, if any, are recorded at the fair market value of the securities received. Income and capital gain distributions from Fidelity Central Funds, if any, are recorded on the ex-dividend date. Distributions received on securities that represent a return of capital or capital gain are recorded as a reduction of cost of investments and/or as a realized gain. Subsequent to ex-dividend date the Fund determines the components of these distributions, based upon receipt of tax filings or other correspondence relating to the underlying investment. Investment income is recorded net of foreign taxes withheld where recovery of such taxes is uncertain.
Class Allocations and Expenses. Investment income, realized and unrealized capital gains and losses, common expenses of the Fund, and certain fund-level expense reductions, if any, are allocated daily on a pro-rata basis to each class based on the relative net assets of each class to the total net assets of the Fund. Each class differs with respect to transfer agent and distribution and service plan fees incurred. Certain expense reductions may also differ by class. For the reporting period, the allocated portion of income and expenses to each class as a percent of its average net assets may vary due to the timing of recording these transactions in relation to fluctuating net assets of the classes. Expenses directly attributable to a fund are charged to that fund. Expenses attributable to more than one fund are allocated among the respective funds on the basis of relative net assets or other appropriate methods. Expense estimates are accrued in the period to which they relate and adjustments are made when actual amounts are known.
Income Tax Information and Distributions to Shareholders. Each year, the Fund intends to qualify as a regulated investment company under Subchapter M of the Internal Revenue Code, including distributing substantially all of its taxable income and realized gains. As a result, no provision for U.S. Federal income taxes is required. The Fund files a U.S. federal tax return, in addition to state and local tax returns as required. The Fund's federal income tax returns are subject to examination by the Internal Revenue Service (IRS) for a period of three fiscal years after they are filed. State and local tax returns may be subject to examination for an additional fiscal year depending on the jurisdiction. Foreign taxes are provided for based on the Fund's understanding of the tax rules and rates that exist in the foreign markets in which it invests.
Distributions are declared and recorded on the ex-dividend date. Income dividends and capital gain distributions are declared separately for each class. Income and capital gain distributions are determined in accordance with income tax regulations, which may differ from GAAP.
Capital accounts within the financial statements are adjusted for permanent book-tax differences. These adjustments have no impact on net assets or the results of operations. Capital accounts are not adjusted for temporary book-tax differences which will reverse in a subsequent period.
Book-tax differences are primarily due to foreign currency transactions, partnerships, passive foreign investment companies (PFIC), capital loss carryforwards and losses deferred due to wash sales.
The federal tax cost of investment securities and unrealized appreciation (depreciation) as of period end were as follows:
| Gross unrealized appreciation | $176,851,154 |
| Gross unrealized depreciation | (57,863,025) |
| Net unrealized appreciation (depreciation) on securities | $118,988,129 |
| Tax cost | $1,056,265,672 |
Capital loss carryforwards are only available to offset future capital gains of the Fund to the extent provided by regulations and may be limited. Under the Regulated Investment Company Modernization Act of 2010 (the Act), the Fund is permitted to carry forward capital losses incurred in taxable years beginning after December 22, 2010 for an unlimited period and such capital losses are required to be used prior to any losses that expire. The capital loss carryforward information presented below, including any applicable limitation, is estimated as of prior fiscal period end and is subject to adjustment.
| Fiscal year of expiration |
| 2017 | $(252,792,060) |
Short-Term Trading (Redemption) Fees. Shares held by investors in the Fund less than 90 days may have been subject to a redemption fee equal to 2.00% of the NAV of shares redeemed. All redemption fees, which reduce the proceeds of the shareholder redemption, are retained by the Fund and accounted for as an addition to paid in capital.
4. Purchases and Sales of Investments.
Purchases and sales of securities, other than short-term securities, aggregated $281,152,699 and $93,148,449, respectively.
5. Fees and Other Transactions with Affiliates.
Management Fee. Fidelity Management & Research Company (the investment adviser) and its affiliates provide the Fund with investment management related services for which the Fund pays a monthly management fee. The management fee is the sum of an individual fund fee rate that is based on an annual rate of .60% of the Fund's average net assets and an annualized group fee rate that averaged .25% during the period. The group fee rate is based upon the average net assets of all the mutual funds advised by the investment adviser, including any mutual funds previously advised by the investment adviser that are currently advised by Fidelity SelectCo, LLC, an affiliate of the investment adviser. The group fee rate decreases as assets under management increase and increases as assets under management decrease. In addition, the management fee is subject to a performance adjustment (up to a maximum of +/- .20% of the Fund's average net assets over a 36 month performance period). The upward or downward adjustment to the management fee is based on the relative investment performance of International Small Cap Opportunities as compared to its benchmark index, the MSCI EAFE Small Cap Index, over the same 36 month performance period. For the reporting period, the total annualized management fee rate, including the performance adjustment, was .89% of the Fund's average net assets. The performance adjustment included in the management fee rate may be higher or lower than the maximum performance adjustment rate due to the difference between the average net assets for the reporting and performance periods.
Distribution and Service Plan Fees. In accordance with Rule 12b-1 of the 1940 Act, the Fund has adopted separate Distribution and Service Plans for each class of shares. Certain classes pay Fidelity Distributors Corporation (FDC), an affiliate of the investment adviser, separate Distribution and Service Fees, each of which is based on an annual percentage of each class' average net assets. In addition, FDC may pay financial intermediaries for selling shares of the Fund and providing shareholder support services. For the period, the Distribution and Service Fee rates, total fees and amounts retained by FDC were as follows:
| Distribution Fee | Service Fee | Total Fees | Retained by FDC | |
| Class A | -% | .25% | $58,445 | $2,292 |
| Class T | .25% | .25% | 33,578 | – |
| Class B | .75% | .25% | 2,413 | 1,810 |
| Class C | .75% | .25% | 84,500 | 22,481 |
| $178,936 | $26,583 |
Sales Load. FDC may receive a front-end sales charge of up to 5.75% for selling Class A shares and 3.50% for selling Class T shares, some of which is paid to financial intermediaries for selling shares of the Fund. Depending on the holding period, FDC may receive contingent deferred sales charges levied on Class A, Class T, Class B, and Class C redemptions. The deferred sales charges range from 5.00% to 1.00% for Class B shares, 1.00% for Class C shares, 1.00% for certain purchases of Class A shares and .25% for certain purchases of Class T shares.
For the period, sales charge amounts retained by FDC were as follows:
| Retained by FDC | |
| Class A | $12,019 |
| Class T | 3,054 |
| Class B(a) | 13 |
| Class C(a) | 2,125 |
| $17,211 |
(a) When Class B and Class C shares are initially sold, FDC pays commissions from its own resources to financial intermediaries through which the sales are made.
Transfer Agent Fees. Fidelity Investments Institutional Operations Company, Inc., (FIIOC), an affiliate of the investment adviser, is the transfer, dividend disbursing and shareholder servicing agent for each class of the Fund. FIIOC receives account fees and asset-based fees that vary according to the account size and type of account of the shareholders of the respective classes of the Fund. FIIOC pays for typesetting, printing and mailing of shareholder reports, except proxy statements.
For the period, transfer agent fees for each class were as follows:
| Amount | % of Class-Level Average Net Assets(a) | |
| Class A | $57,114 | .24 |
| Class T | 21,051 | .31 |
| Class B | 732 | .30 |
| Class C | 24,999 | .30 |
| International Small Cap Opportunities | 936,327 | .22 |
| Class I | 129,174 | .20 |
| $1,169,397 |
(a) Annualized
Accounting and Security Lending Fees. Fidelity Service Company, Inc. (FSC), an affiliate of the investment adviser, maintains the Fund's accounting records. The accounting fee is based on the level of average net assets for each month. Under a separate contract, FSC administers the security lending program. The security lending fee is based on the number and duration of lending transactions.
Brokerage Commissions. The Fund placed a portion of its portfolio transactions with brokerage firms which are affiliates of the investment adviser. Brokerage commissions are included in net realized gain (loss) and change in net unrealized appreciation (depreciation) in the Statement of Operations. The commissions paid to these affiliated firms were $611 for the period.
Interfund Trades. The Fund may purchase from or sell securities to other Fidelity Funds under procedures adopted by the Board. The procedures have been designed to ensure these interfund trades are executed in accordance with Rule 17a-7 of the 1940 Act. Interfund trades are included within the respective purchases and sales amounts shown in the Purchases and Sales of Investments note.
6. Committed Line of Credit.
The Fund participates with other funds managed by the investment adviser or an affiliate in a $4.25 billion credit facility (the "line of credit") to be utilized for temporary or emergency purposes to fund shareholder redemptions or for other short-term liquidity purposes. The Fund has agreed to pay commitment fees on its pro-rata portion of the line of credit, which amounted to $918 and is reflected in Miscellaneous expenses on the Statement of Operations. During the period, the Fund did not borrow on this line of credit.
7. Security Lending.
The Fund lends portfolio securities through a lending agent from time to time in order to earn additional income. For equity securities, a lending agent is used and may loan securities to certain qualified borrowers, including Fidelity Capital Markets (FCM), a broker-dealer affiliated with the Fund. On the settlement date of the loan, the Fund receives collateral (in the form of U.S. Treasury obligations, letters of credit and/or cash) against the loaned securities and maintains collateral in an amount not less than 100% of the market value of the loaned securities during the period of the loan. The market value of the loaned securities is determined at the close of business of the Fund and any additional required collateral is delivered to the Fund on the next business day. The Fund or borrower may terminate the loan at any time, and if the borrower defaults on its obligation to return the securities loaned because of insolvency or other reasons, the Fund may apply collateral received from the borrower against the obligation. The Fund may experience delays and costs in recovering the securities loaned. Any cash collateral received is invested in the Fidelity Securities Lending Cash Central Fund. The value of loaned securities and cash collateral at period end are disclosed on the Fund's Statement of Assets and Liabilities. At period end, there were no security loans outstanding with FCM. Security lending income represents the income earned on investing cash collateral, less rebates paid to borrowers and any lending agent fees associated with the loan, plus any premium payments received for lending certain types of securities. Security lending income is presented in the Statement of Operations as a component of income from Fidelity Central Funds. Total security lending income during the period amounted to $77,863, including $1,988 from securities loaned to FCM.
8. Expense Reductions.
Commissions paid to certain brokers with whom the investment adviser, or its affiliates, places trades on behalf of the Fund include an amount in addition to trade execution, which may be rebated back to the Fund to offset certain expenses. This amount totaled $705 for the period. Through arrangements with the Fund's custodian, credits realized as a result of certain uninvested cash balances were used to reduce the Fund's expenses. During the period, these credits reduced the Fund's expenses by $47.
In addition, during the period the investment adviser reimbursed and/or waived a portion of fund- level operating expenses in the amount of $3,653.
9. Distributions to Shareholders.
Distributions to shareholders of each class were as follows:
| Six months ended April 30, 2016 | Year ended October 31, 2015 | |
| From net investment income | ||
| Class A | $159,395 | $91,925 |
| Class T | 9,385 | 4,261 |
| International Small Cap Opportunities | 3,989,748 | 3,599,410 |
| Class I | 694,163 | 286,715 |
| Total | $4,852,691 | $3,982,311 |
| From net realized gain | ||
| Class A | $214,570 | $38,609 |
| Class T | 65,696 | 14,913 |
| Class C | 66,143 | – |
| International Small Cap Opportunities | 3,723,825 | 839,863 |
| Class I | 585,439 | 56,271 |
| Total | $4,655,673 | $949,656 |
10. Share Transactions.
Share transactions for each class were as follows and may contain automatic conversions between classes or exchanges between affiliated funds:
| Shares | Shares | Dollars | Dollars | |
| Six months ended April 30, 2016 | Year ended October 31, 2015 | Six months ended April 30, 2016 | Year ended October 31, 2015 | |
| Class A | ||||
| Shares sold | 950,569 | 1,605,762 | $13,701,055 | $23,674,805 |
| Reinvestment of distributions | 24,184 | 9,185 | 359,376 | 124,545 |
| Shares redeemed | (419,609) | (582,997) | (5,931,692) | (8,244,833) |
| Net increase (decrease) | 555,144 | 1,031,950 | $8,128,739 | $15,554,517 |
| Class T | ||||
| Shares sold | 160,496 | 309,765 | $2,280,756 | $4,543,322 |
| Reinvestment of distributions | 5,021 | 1,404 | 74,158 | 18,926 |
| Shares redeemed | (131,388) | (134,926) | (1,815,377) | (1,907,198) |
| Net increase (decrease) | 34,129 | 176,243 | $539,537 | $2,655,050 |
| Class B | ||||
| Shares sold | 3,601 | 9,791 | $51,565 | $136,845 |
| Shares redeemed | (21,080) | (23,615) | (295,529) | (329,326) |
| Net increase (decrease) | (17,479) | (13,824) | $(243,964) | $(192,481) |
| Class C | ||||
| Shares sold | 212,639 | 838,785 | $2,969,254 | $12,019,463 |
| Reinvestment of distributions | 4,483 | – | 64,648 | – |
| Shares redeemed | (260,791) | (258,762) | (3,487,650) | (3,578,649) |
| Net increase (decrease) | (43,669) | 580,023 | $(453,748) | $8,440,814 |
| International Small Cap Opportunities | ||||
| Shares sold | 21,099,085 | 18,903,102 | $306,137,737 | $282,906,392 |
| Reinvestment of distributions | 402,267 | 239,997 | 6,034,011 | 3,280,752 |
| Shares redeemed | (9,435,850) | (10,354,861) | (135,324,878) | (146,998,081) |
| Net increase (decrease) | 12,065,502 | 8,788,238 | $176,846,870 | $139,189,063 |
| Class I | ||||
| Shares sold | 2,990,658 | 7,108,830 | $43,408,539 | $102,023,907 |
| Reinvestment of distributions | 75,351 | 23,468 | 1,129,506 | 320,812 |
| Shares redeemed | (1,586,288) | (1,195,608) | (22,479,053) | (17,368,101) |
| Net increase (decrease) | 1,479,721 | 5,936,690 | $22,058,992 | $84,976,618 |
11. Other.
The Fund's organizational documents provide former and current trustees and officers with a limited indemnification against liabilities arising in connection with the performance of their duties to the Fund. In the normal course of business, the Fund may also enter into contracts that provide general indemnifications. The Fund's maximum exposure under these arrangements is unknown as this would be dependent on future claims that may be made against the Fund. The risk of material loss from such claims is considered remote.
Mutual funds managed by the investment adviser or its affiliates were the owners of record, in the aggregate, of approximately 22% of the total outstanding shares of the Fund.
Shareholder Expense Example
As a shareholder of the Fund, you incur two types of costs: (1) transaction costs, including sales charges (loads) on purchase payments or redemption proceeds, redemption fees and (2) ongoing costs, including management fees, distribution and/or service (12b-1) fees and other Fund expenses. This Example is intended to help you understand your ongoing costs (in dollars) of investing in the Fund and to compare these costs with the ongoing costs of investing in other mutual funds.
The Example is based on an investment of $1,000 invested at the beginning of the period and held for the entire period (November 1, 2015 to April 30, 2016).
Actual Expenses
The first line of the accompanying table for each class of the Fund provides information about actual account values and actual expenses. You may use the information in this line, together with the amount you invested, to estimate the expenses that you paid over the period. Simply divide your account value by $1,000.00 (for example, an $8,600 account value divided by $1,000.00 = 8.6), then multiply the result by the number in the first line for a class of the Fund under the heading entitled "Expenses Paid During Period" to estimate the expenses you paid on your account during this period. A small balance maintenance fee of $12.00 that is charged once a year may apply for certain accounts with a value of less than $2,000. This fee is not included in the table below. If it was, the estimate of expenses you paid during the period would be higher, and your ending account value lower, by this amount. In addition, the Fund, as a shareholder in the underlying Fidelity Central Funds, will indirectly bear its pro-rata share of the fees and expenses incurred by the underlying Fidelity Central Funds. These fees and expenses are not included in the Fund's annualized expense ratio used to calculate the expense estimate in the table below.
Hypothetical Example for Comparison Purposes
The second line of the accompanying table for each class of the Fund provides information about hypothetical account values and hypothetical expenses based on a Class' actual expense ratio and an assumed rate of return of 5% per year before expenses, which is not the Class' actual return. The hypothetical account values and expenses may not be used to estimate the actual ending account balance or expenses you paid for the period. You may use this information to compare the ongoing costs of investing in the Fund and other funds. To do so, compare this 5% hypothetical example with the 5% hypothetical examples that appear in the shareholder reports of the other funds. A small balance maintenance fee of $12.00 that is charged once a year may apply for certain accounts with a value of less than $2,000. This fee is not included in the table below. If it was, the estimate of expenses you paid during the period would be higher, and your ending account value lower, by this amount. In addition, the Fund, as a shareholder in the underlying Fidelity Central Funds, will indirectly bear its pro-rata share of the fees and expenses incurred by the underlying Fidelity Central Funds. These fees and expenses are not included in the Fund's annualized expense ratio used to calculate the expense estimate in the table below.
Please note that the expenses shown in the table are meant to highlight your ongoing costs only and do not reflect any transaction costs. Therefore, the second line of the table is useful in comparing ongoing costs only, and will not help you determine the relative total costs of owning different funds. In addition, if these transactional costs were included, your costs would have been higher.
| Annualized Expense Ratio-A | Beginning Account Value November 1, 2015 | Ending Account Value April 30, 2016 | Expenses Paid During Period-B November 1, 2015 to April 30, 2016 | |
| Class A | 1.47% | |||
| Actual | $1,000.00 | $1,008.90 | $7.34 | |
| Hypothetical-C | $1,000.00 | $1,017.55 | $7.37 | |
| Class T | 1.78% | |||
| Actual | $1,000.00 | $1,007.50 | $8.88 | |
| Hypothetical-C | $1,000.00 | $1,016.01 | $8.92 | |
| Class B | 2.28% | |||
| Actual | $1,000.00 | $1,004.90 | $11.37 | |
| Hypothetical-C | $1,000.00 | $1,013.53 | $11.41 | |
| Class C | 2.27% | |||
| Actual | $1,000.00 | $1,005.10 | $11.32 | |
| Hypothetical-C | $1,000.00 | $1,013.58 | $11.36 | |
| International Small Cap Opportunities | 1.19% | |||
| Actual | $1,000.00 | $1,010.30 | $5.95 | |
| Hypothetical-C | $1,000.00 | $1,018.95 | $5.97 | |
| Class I | 1.17% | |||
| Actual | $1,000.00 | $1,010.20 | $5.85 | |
| Hypothetical-C | $1,000.00 | $1,019.05 | $5.87 |
A Annualized expense ratio reflects expenses net of applicable fee waivers.
B Expenses are equal to each Class' annualized expense ratio, multiplied by the average account value over the period, multiplied by 182/366 (to reflect the one-half year period).
C 5% return per year before expenses
![]()
AILSI-SANN-0616
1.815085.110
Fidelity Advisor® International Discovery Fund - Semi-Annual Report April 30, 2016 Class A, Class T, Class B and Class C are classes of Fidelity® International Discovery Fund |
|
Contents
To view a fund's proxy voting guidelines and proxy voting record for the 12-month period ended June 30, visit http://www.fidelity.com/proxyvotingresults or visit the Securities and Exchange Commission's (SEC) web site at http://www.sec.gov.
You may also call 1-877-208-0098 to request a free copy of the proxy voting guidelines.
Standard & Poor's, S&P and S&P 500 are registered service marks of The McGraw-Hill Companies, Inc. and have been licensed for use by Fidelity Distributors Corporation.
Other third-party marks appearing herein are the property of their respective owners.
All other marks appearing herein are registered or unregistered trademarks or service marks of FMR LLC or an affiliated company. © 2016 FMR LLC. All rights reserved.
This report and the financial statements contained herein are submitted for the general information of the shareholders of the Fund. This report is not authorized for distribution to prospective investors in the Fund unless preceded or accompanied by an effective prospectus.
A fund files its complete schedule of portfolio holdings with the SEC for the first and third quarters of each fiscal year on Form N-Q. Forms N-Q are available on the SEC’s web site at http://www.sec.gov. A fund's Forms N-Q may be reviewed and copied at the SEC’s Public Reference Room in Washington, DC. Information regarding the operation of the SEC's Public Reference Room may be obtained by calling 1-800-SEC-0330.
For a complete list of a fund's portfolio holdings, view the most recent holdings listing, semiannual report, or annual report on Fidelity's web site at http://www.fidelity.com, http://www.advisor.fidelity.com, or http://www.401k.com, as applicable.
NOT FDIC INSURED •MAY LOSE VALUE •NO BANK GUARANTEE
Neither the Fund nor Fidelity Distributors Corporation is a bank.
Investment Summary (Unaudited)
Geographic Diversification (% of fund's net assets)
| As of April 30, 2016 | ||
| Japan | 17.3% | |
| United Kingdom | 14.5% | |
| France | 9.6% | |
| Germany | 8.0% | |
| United States of America* | 5.8% | |
| Switzerland | 4.3% | |
| Sweden | 4.1% | |
| Hong Kong | 3.3% | |
| Netherlands | 3.3% | |
| Other | 29.8% | |

* Includes Short-Term investments and Net Other Assets (Liabilities).
Percentages are based on country or territory of incorporation and are adjusted for the effect of futures contracts, if applicable.
| As of October 31, 2015 | ||
| United Kingdom | 19.1% | |
| Japan | 15.9% | |
| France | 9.6% | |
| United States of America* | 7.3% | |
| Germany | 5.5% | |
| Switzerland | 5.1% | |
| Netherlands | 4.0% | |
| Sweden | 3.1% | |
| Hong Kong | 3.0% | |
| Other | 27.4% | |

* Includes Short-Term investments and Net Other Assets (Liabilities).
Percentages are based on country or territory of incorporation and are adjusted for the effect of futures contracts, if applicable.
Asset Allocation as of April 30, 2016
| % of fund's net assets | % of fund's net assets 6 months ago | |
| Stocks and Equity Futures | 99.1 | 97.5 |
| Other Investments | 0.0 | 0.1 |
| Short-Term Investments and Net Other Assets (Liabilities) | 0.9 | 2.4 |
Top Ten Stocks as of April 30, 2016
| % of fund's net assets | % of fund's net assets 6 months ago | |
| Total SA (France, Oil, Gas & Consumable Fuels) | 2.2 | 2.0 |
| Unilever NV (Certificaten Van Aandelen) (Bearer) (Netherlands, Personal Products) | 1.7 | 1.6 |
| Statoil ASA (Norway, Oil, Gas & Consumable Fuels) | 1.6 | 0.0 |
| Anheuser-Busch InBev SA NV (Belgium, Beverages) | 1.5 | 1.4 |
| AIA Group Ltd. (Hong Kong, Insurance) | 1.5 | 1.3 |
| ORIX Corp. (Japan, Diversified Financial Services) | 1.4 | 0.9 |
| Techtronic Industries Co. Ltd. (Hong Kong, Household Durables) | 1.4 | 1.3 |
| VINCI SA (France, Construction & Engineering) | 1.4 | 0.9 |
| KDDI Corp. (Japan, Wireless Telecommunication Services) | 1.4 | 1.1 |
| Novo Nordisk A/S Series B (Denmark, Pharmaceuticals) | 1.3 | 1.2 |
| 15.4 |
Market Sectors as of April 30, 2016
| % of fund's net assets | % of fund's net assets 6 months ago | |
| Financials | 21.6 | 24.2 |
| Consumer Discretionary | 15.3 | 17.4 |
| Consumer Staples | 13.2 | 11.9 |
| Health Care | 12.5 | 12.8 |
| Industrials | 10.7 | 10.5 |
| Information Technology | 10.0 | 7.5 |
| Energy | 5.0 | 4.3 |
| Telecommunication Services | 4.8 | 4.9 |
| Materials | 3.6 | 2.3 |
| Utilities | 0.6 | 0.0 |
Percentages shown as 0.0% may reflect amounts less than 0.05%.
Investments April 30, 2016 (Unaudited)
Showing Percentage of Net Assets
| Common Stocks - 97.1% | |||
| Shares | Value (000s) | ||
| Australia - 2.5% | |||
| 1-Page Ltd. (a)(b) | 2,531,460 | $1,857 | |
| Ansell Ltd. (a) | 1,588,251 | 24,068 | |
| Australia & New Zealand Banking Group Ltd. | 2,945,060 | 53,983 | |
| Burson Group Ltd. | 7,454,296 | 28,226 | |
| Magellan Financial Group Ltd. | 1,204,177 | 19,685 | |
| Mantra Group Ltd. | 7,793,893 | 21,927 | |
| Ramsay Health Care Ltd. | 1,164,235 | 57,495 | |
| Spark Infrastructure Group unit | 31,636,214 | 49,793 | |
| TOTAL AUSTRALIA | 257,034 | ||
| Austria - 0.5% | |||
| Andritz AG | 444,500 | 24,894 | |
| Erste Group Bank AG | 995,900 | 28,646 | |
| TOTAL AUSTRIA | 53,540 | ||
| Bailiwick of Jersey - 1.2% | |||
| Integrated Diagnostics Holdings PLC | 4,932,400 | 22,936 | |
| Randgold Resources Ltd. sponsored ADR | 241,314 | 24,252 | |
| Regus PLC | 11,055,488 | 47,233 | |
| Wolseley PLC | 514,260 | 28,805 | |
| TOTAL BAILIWICK OF JERSEY | 123,226 | ||
| Belgium - 2.0% | |||
| Anheuser-Busch InBev SA NV | 1,203,427 | 148,960 | |
| KBC Groep NV | 857,319 | 48,131 | |
| TOTAL BELGIUM | 197,091 | ||
| Bermuda - 0.3% | |||
| PAX Global Technology Ltd. | 29,071,000 | 25,037 | |
| Canada - 2.2% | |||
| Alimentation Couche-Tard, Inc. Class B (sub. vtg.) | 781,500 | 34,257 | |
| Cenovus Energy, Inc. | 2,806,100 | 44,483 | |
| Constellation Software, Inc. | 156,500 | 61,161 | |
| Franco-Nevada Corp. | 297,300 | 20,859 | |
| PrairieSky Royalty Ltd. (b) | 1,734,473 | 36,522 | |
| Suncor Energy, Inc. | 676,200 | 19,849 | |
| TOTAL CANADA | 217,131 | ||
| Cayman Islands - 0.9% | |||
| Alibaba Group Holding Ltd. sponsored ADR (a) | 453,700 | 34,908 | |
| Ctrip.com International Ltd. ADR (a) | 294,500 | 12,843 | |
| Lee's Pharmaceutical Holdings Ltd. | 6,734,664 | 5,449 | |
| New Oriental Education & Technology Group, Inc. sponsored ADR | 830,000 | 32,503 | |
| TOTAL CAYMAN ISLANDS | 85,703 | ||
| China - 0.6% | |||
| Jiangsu Hengrui Medicine Co. Ltd. | 4,183,623 | 30,165 | |
| Kweichow Moutai Co. Ltd. | 663,582 | 25,748 | |
| TOTAL CHINA | 55,913 | ||
| Cyprus - 0.0% | |||
| SPDI Secure Property Development & Investment PLC (a) | 517,230 | 129 | |
| Denmark - 1.3% | |||
| Novo Nordisk A/S Series B | 2,371,645 | 132,419 | |
| Finland - 0.7% | |||
| Sampo Oyj (A Shares) | 1,653,500 | 72,193 | |
| France - 9.6% | |||
| Accor SA (b) | 1,684,918 | 74,636 | |
| ALTEN | 608,659 | 37,635 | |
| Altran Technologies SA | 2,384,000 | 35,365 | |
| Amundi SA | 516,400 | 23,765 | |
| Atos Origin SA | 444,123 | 39,530 | |
| AXA SA (b) | 4,402,300 | 111,156 | |
| Capgemini SA | 855,800 | 79,894 | |
| Cegedim SA (a) | 536,390 | 14,728 | |
| Havas SA | 4,815,644 | 40,297 | |
| Sanofi SA | 467,356 | 38,523 | |
| Sodexo SA | 431,200 | 43,543 | |
| SR Teleperformance SA | 290,100 | 26,043 | |
| Total SA | 4,385,111 | 221,630 | |
| Unibail-Rodamco | 156,500 | 41,933 | |
| VINCI SA (b) | 1,924,900 | 143,796 | |
| TOTAL FRANCE | 972,474 | ||
| Germany - 8.0% | |||
| Axel Springer Verlag AG | 625,002 | 34,896 | |
| Bayer AG | 345,100 | 39,812 | |
| Beiersdorf AG | 242,900 | 21,794 | |
| Continental AG | 297,600 | 65,359 | |
| Deutsche Boerse AG | 526,494 | 43,219 | |
| Deutsche Telekom AG | 3,241,500 | 56,899 | |
| Fresenius SE & Co. KGaA | 468,700 | 34,090 | |
| GEA Group AG | 878,941 | 40,750 | |
| KION Group AG | 1,369,149 | 74,593 | |
| LEG Immobilien AG | 314,266 | 29,080 | |
| Nexus AG | 614,500 | 10,766 | |
| ProSiebenSat.1 Media AG | 1,170,000 | 59,644 | |
| Rational AG | 104,405 | 53,002 | |
| SAP AG | 1,390,594 | 109,107 | |
| Siemens AG | 685,498 | 71,736 | |
| Symrise AG | 637,700 | 42,249 | |
| United Internet AG | 430,714 | 21,027 | |
| TOTAL GERMANY | 808,023 | ||
| Hong Kong - 3.3% | |||
| AIA Group Ltd. | 24,704,000 | 147,844 | |
| China Resources Beer Holdings Co. Ltd. | 16,944,000 | 37,233 | |
| Techtronic Industries Co. Ltd. | 38,444,000 | 144,114 | |
| TOTAL HONG KONG | 329,191 | ||
| India - 2.6% | |||
| Bharti Infratel Ltd. | 12,647,734 | 71,392 | |
| Dr Lal Pathlabs Ltd. | 798,016 | 11,835 | |
| HDFC Bank Ltd. sponsored ADR | 1,290,984 | 81,164 | |
| Housing Development Finance Corp. Ltd. | 6,148,295 | 100,746 | |
| TOTAL INDIA | 265,137 | ||
| Ireland - 2.7% | |||
| Cairn Homes PLC (a) | 17,549,270 | 22,506 | |
| CRH PLC | 1,051,000 | 30,587 | |
| Dalata Hotel Group PLC (a) | 5,686,103 | 28,706 | |
| Green REIT PLC | 9,492,200 | 15,673 | |
| Irish Continental Group PLC unit | 101,800 | 600 | |
| James Hardie Industries PLC CDI | 1,482,921 | 20,893 | |
| Kerry Group PLC Class A | 983,700 | 87,712 | |
| Ryanair Holdings PLC sponsored ADR | 809,300 | 65,513 | |
| TOTAL IRELAND | 272,190 | ||
| Isle of Man - 0.8% | |||
| Optimal Payments PLC (a) | 11,752,725 | 65,462 | |
| Playtech Ltd. | 1,386,935 | 16,303 | |
| TOTAL ISLE OF MAN | 81,765 | ||
| Israel - 1.9% | |||
| Frutarom Industries Ltd. | 1,032,000 | 52,892 | |
| Partner Communications Co. Ltd. (a) | 2,268,862 | 11,804 | |
| Teva Pharmaceutical Industries Ltd. sponsored ADR | 2,291,300 | 124,761 | |
| TOTAL ISRAEL | 189,457 | ||
| Italy - 1.6% | |||
| De Longhi SpA | 1,669,626 | 38,446 | |
| Intesa Sanpaolo SpA | 30,697,900 | 85,334 | |
| Mediaset SpA | 3,440,200 | 15,481 | |
| Telecom Italia SpA (a) | 25,339,200 | 24,743 | |
| TOTAL ITALY | 164,004 | ||
| Japan - 17.3% | |||
| ACOM Co. Ltd. (a) | 3,246,300 | 16,935 | |
| Aozora Bank Ltd. | 9,464,000 | 33,578 | |
| Asahi Group Holdings | 1,066,900 | 33,860 | |
| Astellas Pharma, Inc. | 6,953,700 | 93,754 | |
| Casio Computer Co. Ltd. (b) | 2,015,200 | 38,343 | |
| Daito Trust Construction Co. Ltd. | 209,500 | 29,630 | |
| Dentsu, Inc. | 1,274,300 | 64,746 | |
| Don Quijote Holdings Co. Ltd. | 1,338,100 | 47,604 | |
| Hoya Corp. | 1,793,800 | 68,692 | |
| Japan Exchange Group, Inc. | 1,920,700 | 28,605 | |
| Japan Tobacco, Inc. | 2,318,600 | 94,733 | |
| KDDI Corp. | 4,728,900 | 136,219 | |
| Keyence Corp. | 95,360 | 57,158 | |
| Misumi Group, Inc. | 3,181,300 | 43,933 | |
| Mitsubishi UFJ Financial Group, Inc. | 11,142,500 | 51,421 | |
| Monex Group, Inc. | 12,207,949 | 31,493 | |
| NEC Corp. | 8,879,000 | 21,609 | |
| Nidec Corp. | 324,300 | 23,763 | |
| Nintendo Co. Ltd. | 274,100 | 37,113 | |
| Nippon Telegraph & Telephone Corp. | 904,500 | 40,477 | |
| Olympus Corp. | 3,148,400 | 122,651 | |
| ORIX Corp. | 10,231,600 | 144,725 | |
| Seven & i Holdings Co. Ltd. | 1,034,700 | 42,218 | |
| Seven Bank Ltd. | 12,039,600 | 51,159 | |
| Shinsei Bank Ltd. | 14,227,000 | 19,940 | |
| Shionogi & Co. Ltd. | 856,200 | 43,702 | |
| Sony Corp. | 3,594,500 | 87,065 | |
| Sundrug Co. Ltd. | 622,500 | 44,232 | |
| Tsuruha Holdings, Inc. | 834,000 | 79,994 | |
| United Arrows Ltd. | 991,300 | 39,833 | |
| VT Holdings Co. Ltd. | 3,872,500 | 19,566 | |
| Welcia Holdings Co. Ltd. | 1,150,800 | 60,788 | |
| TOTAL JAPAN | 1,749,539 | ||
| Luxembourg - 0.9% | |||
| Eurofins Scientific SA | 120,139 | 44,578 | |
| Grand City Properties SA | 1,528,397 | 33,759 | |
| Senvion SA | 708,900 | 12,460 | |
| TOTAL LUXEMBOURG | 90,797 | ||
| Marshall Islands - 0.1% | |||
| Hoegh LNG Partners LP (c) | 715,655 | 12,896 | |
| Netherlands - 3.3% | |||
| AerCap Holdings NV (a) | 562,900 | 22,522 | |
| IMCD Group BV | 1,926,800 | 77,794 | |
| ING Groep NV (Certificaten Van Aandelen) | 4,956,300 | 60,696 | |
| Unilever NV (Certificaten Van Aandelen) (Bearer) | 3,814,100 | 167,553 | |
| TOTAL NETHERLANDS | 328,565 | ||
| New Zealand - 0.8% | |||
| EBOS Group Ltd. | 3,154,998 | 35,160 | |
| Ryman Healthcare Group Ltd. | 7,137,434 | 44,505 | |
| TOTAL NEW ZEALAND | 79,665 | ||
| Norway - 1.6% | |||
| Statoil ASA (b) | 9,044,100 | 159,188 | |
| Philippines - 0.3% | |||
| SM Investments Corp. | 1,641,730 | 32,950 | |
| Romania - 0.2% | |||
| Banca Transilvania SA | 31,143,575 | 21,373 | |
| South Africa - 1.3% | |||
| EOH Holdings Ltd. | 2,855,067 | 27,788 | |
| Naspers Ltd. Class N | 720,500 | 98,860 | |
| TOTAL SOUTH AFRICA | 126,648 | ||
| Spain - 2.5% | |||
| Amadeus IT Holding SA Class A | 1,717,100 | 78,135 | |
| Atresmedia Corporacion de Medios de Comunicacion SA | 1,719,200 | 22,383 | |
| Hispania Activos Inmobiliarios SA (a) | 1,085,200 | 15,905 | |
| Inditex SA | 2,288,877 | 73,476 | |
| Mediaset Espana Comunicacion SA | 2,931,000 | 38,059 | |
| Merlin Properties Socimi SA | 2,483,100 | 28,859 | |
| TOTAL SPAIN | 256,817 | ||
| Sweden - 4.1% | |||
| ASSA ABLOY AB (B Shares) | 3,682,800 | 77,229 | |
| Getinge AB (B Shares) | 2,461,330 | 52,044 | |
| HEXPOL AB (B Shares) (b) | 2,967,500 | 30,671 | |
| Indutrade AB (b) | 201,100 | 11,276 | |
| Nordea Bank AB | 5,749,200 | 55,806 | |
| Saab AB (B Shares) | 980,200 | 33,530 | |
| Sandvik AB (b) | 2,242,600 | 23,011 | |
| Svenska Cellulosa AB (SCA) (B Shares) | 3,034,500 | 95,564 | |
| Svenska Handelsbanken AB (A Shares) (b) | 2,567,100 | 34,246 | |
| TOTAL SWEDEN | 413,377 | ||
| Switzerland - 4.3% | |||
| GAM Holding Ltd. | 1,405,187 | 18,310 | |
| Julius Baer Group Ltd. | 949,640 | 40,698 | |
| Novartis AG | 1,375,538 | 104,682 | |
| Partners Group Holding AG | 247,326 | 101,839 | |
| Schindler Holding AG (participation certificate) | 181,273 | 33,012 | |
| Syngenta AG (Switzerland) | 175,928 | 70,423 | |
| UBS Group AG | 3,690,490 | 63,861 | |
| TOTAL SWITZERLAND | 432,825 | ||
| Taiwan - 0.1% | |||
| JHL Biotech, Inc. (a) | 4,953,560 | 13,395 | |
| United Kingdom - 14.5% | |||
| AA PLC | 3,830,868 | 15,595 | |
| Associated British Foods PLC | 772,200 | 34,571 | |
| B&M European Value Retail S.A. | 9,180,129 | 37,209 | |
| BAE Systems PLC | 4,147,100 | 28,933 | |
| BCA Marketplace PLC | 7,762,300 | 18,913 | |
| BHP Billiton PLC | 2,881,014 | 39,368 | |
| BT Group PLC | 6,133,600 | 39,758 | |
| Bunzl PLC | 2,075,300 | 61,829 | |
| Cineworld Group PLC | 2,055,200 | 15,555 | |
| CMC Markets PLC | 8,647,600 | 31,589 | |
| Compass Group PLC | 2,013,000 | 35,848 | |
| Countryside Properties PLC (a) | 3,408,200 | 11,578 | |
| Diploma PLC | 2,312,600 | 24,718 | |
| GlaxoSmithKline PLC | 3,812,600 | 81,485 | |
| Howden Joinery Group PLC | 10,913,100 | 78,772 | |
| Imperial Tobacco Group PLC | 1,848,336 | 100,425 | |
| ITV PLC | 9,444,600 | 31,078 | |
| Lloyds Banking Group PLC | 69,181,900 | 67,903 | |
| London Stock Exchange Group PLC | 473,136 | 18,756 | |
| McCarthy & Stone PLC | 4,009,500 | 13,592 | |
| Melrose Industries PLC | 1,586,476 | 8,653 | |
| Micro Focus International PLC | 3,609,242 | 80,634 | |
| Moneysupermarket.com Group PLC | 5,210,600 | 23,899 | |
| Persimmon PLC | 1,469,800 | 42,673 | |
| Reckitt Benckiser Group PLC | 900,800 | 87,755 | |
| Rex Bionics PLC (a)(c) | 1,297,286 | 692 | |
| Rio Tinto PLC | 1,185,200 | 39,759 | |
| SABMiller PLC | 719,300 | 43,985 | |
| Shawbrook Group PLC | 8,951,700 | 37,487 | |
| Softcat PLC | 1,526,900 | 7,117 | |
| Spirax-Sarco Engineering PLC | 539,500 | 26,920 | |
| St. James's Place Capital PLC | 5,394,300 | 68,336 | |
| Standard Chartered PLC (United Kingdom) | 5,296,810 | 42,729 | |
| Taylor Wimpey PLC | 11,716,900 | 31,552 | |
| Virgin Money Holdings Uk PLC | 5,874,500 | 31,338 | |
| Vodafone Group PLC | 30,823,796 | 99,309 | |
| Workspace Group PLC | 649,000 | 7,918 | |
| TOTAL UNITED KINGDOM | 1,468,231 | ||
| United States of America - 3.1% | |||
| Constellation Brands, Inc. Class A (sub. vtg.) | 520,000 | 81,151 | |
| Global Payments, Inc. | 465,000 | 33,564 | |
| McGraw Hill Financial, Inc. | 462,400 | 49,407 | |
| Molson Coors Brewing Co. Class B | 121,600 | 11,629 | |
| MSCI, Inc. Class A | 586,700 | 44,554 | |
| Visa, Inc. Class A | 1,147,700 | 88,648 | |
| TOTAL UNITED STATES OF AMERICA | 308,953 | ||
| TOTAL COMMON STOCKS | |||
| (Cost $8,697,817) | 9,796,876 | ||
| Nonconvertible Preferred Stocks - 0.2% | |||
| Cayman Islands - 0.2% | |||
| China Internet Plus Holdings Ltd. Series A-11 (d) | |||
| (Cost $18,833) | 5,958,244 | 23,003 | |
| Principal Amount (000s) | Value (000s) | ||
| Government Obligations - 0.1% | |||
| United States of America - 0.1% | |||
| U.S. Treasury Bills, yield at date of purchase 0.2% to 0.33% 5/5/16 to 7/28/16 (e) | |||
| (Cost $11,655) | 11,660 | 11,657 | |
| Shares | Value (000s) | ||
| Money Market Funds - 5.1% | |||
| Fidelity Cash Central Fund, 0.38% (f) | 199,763,053 | 199,763 | |
| Fidelity Securities Lending Cash Central Fund, 0.42% (f)(g) | 311,707,412 | 311,707 | |
| TOTAL MONEY MARKET FUNDS | |||
| (Cost $511,470) | 511,470 | ||
| TOTAL INVESTMENT PORTFOLIO - 102.5% | |||
| (Cost $9,239,775) | 10,343,006 | ||
| NET OTHER ASSETS (LIABILITIES) - (2.5)% | (248,078) | ||
| NET ASSETS - 100% | $10,094,928 |
| Futures Contracts | |||
| Expiration Date | Underlying Face Amount at Value (000s) | Unrealized Appreciation/(Depreciation) (000s) | |
| Purchased | |||
| Equity Index Contracts | |||
| 2,402 CME Nikkei 225 Contracts (Japan) | June 2016 | 179,021 | $(11,598) |
The face value of futures purchased as a percentage of Net Assets is 1.8%
Categorizations in the Schedule of Investments are based on country or territory of incorporation.
Legend
(a) Non-income producing
(b) Security or a portion of the security is on loan at period end.
(c) Affiliated company
(d) Restricted securities - Investment in securities not registered under the Securities Act of 1933 (excluding 144A issues). At the end of the period, the value of restricted securities (excluding 144A issues) amounted to $23,003,000 or 0.2% of net assets.
(e) Security or a portion of the security was pledged to cover margin requirements for futures contracts. At period end, the value of securities pledged amounted to $11,657,000.
(f) Affiliated fund that is generally available only to investment companies and other accounts managed by Fidelity Investments. The rate quoted is the annualized seven-day yield of the fund at period end. A complete unaudited listing of the fund's holdings as of its most recent quarter end is available upon request. In addition, each Fidelity Central Fund's financial statements are available on the SEC's website or upon request.
(g) Investment made with cash collateral received from securities on loan.
Additional information on each restricted holding is as follows:
| Security | Acquisition Date | Acquisition Cost (000s) |
| China Internet Plus Holdings Ltd. Series A-11 | 1/26/15 | $18,833 |
Affiliated Central Funds
Information regarding fiscal year to date income earned by the Fund from investments in Fidelity Central Funds is as follows:
| Fund | Income earned |
| (Amounts in thousands) | |
| Fidelity Cash Central Fund | $545 |
| Fidelity Securities Lending Cash Central Fund | 2,593 |
| Total | $3,138 |
Other Affiliated Issuers
An affiliated company is a company in which the Fund has ownership of at least 5% of the voting securities. Fiscal year to date transactions with companies which are or were affiliates are as follows:
| Affiliate (Amounts in thousands) | Value, beginning of period | Purchases | Sales Proceeds* | Dividend Income | Value, end of period |
| Hoegh LNG Partners LP | $11,465 | $-- | $-- | $832 | $12,896 |
| Rex Bionics PLC | 976 | -- | 4 | -- | 692 |
| Total | $12,441 | $-- | $4 | $832 | $13,588 |
* Includes the value of securities delivered through in-kind transactions, if applicable.
Investment Valuation
The following is a summary of the inputs used, as of April 30, 2016, involving the Fund's assets and liabilities carried at fair value. The inputs or methodology used for valuing securities may not be an indication of the risk associated with investing in those securities. For more information on valuation inputs, and their aggregation into the levels used below, please refer to the Investment Valuation section in the accompanying Notes to Financial Statements.
| Valuation Inputs at Reporting Date: | ||||
| Description | Total | Level 1 | Level 2 | Level 3 |
| (Amounts in thousands) | ||||
| Investments in Securities: | ||||
| Equities: | ||||
| Consumer Discretionary | $1,534,838 | $1,034,716 | $477,119 | $23,003 |
| Consumer Staples | 1,334,162 | 853,349 | 480,813 | -- |
| Energy | 494,568 | 113,750 | 380,818 | -- |
| Financials | 2,185,536 | 1,236,886 | 948,650 | -- |
| Health Care | 1,265,979 | 574,622 | 691,357 | -- |
| Industrials | 1,107,038 | 909,868 | 197,170 | -- |
| Information Technology | 982,951 | 693,397 | 289,554 | -- |
| Materials | 371,953 | 262,239 | 109,714 | -- |
| Telecommunication Services | 480,601 | 83,196 | 397,405 | -- |
| Utilities | 62,253 | 62,253 | -- | -- |
| Government Obligations | 11,657 | -- | 11,657 | -- |
| Money Market Funds | 511,470 | 511,470 | -- | -- |
| Total Investments in Securities: | $10,343,006 | $6,335,746 | $3,984,257 | $23,003 |
| Derivative Instruments: | ||||
| Liabilities | ||||
| Futures Contracts | $(11,598) | $(11,598) | $-- | $-- |
| Total Liabilities | $(11,598) | $(11,598) | $-- | $-- |
| Total Derivative Instruments: | $(11,598) | $(11,598) | $-- | $-- |
The following is a summary of transfers between Level 1 and Level 2 for the period ended April 30, 2016. Transfers are assumed to have occurred at the beginning of the period, and are primarily attributable to the valuation techniques used for foreign equity securities, as discussed in the accompanying Notes to Financial Statements:
| Transfers | Total (000s) |
| Level 1 to Level 2 | $123,459 |
| Level 2 to Level 1 | $733,107 |
Value of Derivative Instruments
The following table is a summary of the Fund's value of derivative instruments by primary risk exposure as of April 30, 2016. For additional information on derivative instruments, please refer to the Derivative Instruments section in the accompanying Notes to Financial Statements.
| Primary Risk Exposure / Derivative Type | Value (000s) | |
| Asset | Liability | |
| Equity Risk | ||
| Futures Contracts(a) | $0 | $(11,598) |
| Total Equity Risk | 0 | (11,598) |
| Total Value of Derivatives | $0 | $(11,598) |
(a) Reflects gross cumulative appreciation (depreciation) on futures contracts as presented in the Schedule of Investments. In the Statement of Assets and Liabilities, the period end daily variation margin is included in receivable or payable for daily variation margin for derivative instruments, and the net cumulative appreciation (depreciation) is included in net unrealized appreciation (depreciation).
See accompanying notes which are an integral part of the financial statements.
Financial Statements
Statement of Assets and Liabilities
| Amounts in thousands (except per-share amounts) | April 30, 2016 (Unaudited) | |
| Assets | ||
| Investment in securities, at value (including securities loaned of $292,726) — See accompanying schedule: Unaffiliated issuers (cost $8,709,825) | $9,817,948 | |
| Fidelity Central Funds (cost $511,470) | 511,470 | |
| Other affiliated issuers (cost $18,480) | 13,588 | |
| Total Investments (cost $9,239,775) | $10,343,006 | |
| Foreign currency held at value (cost $3,534) | 3,534 | |
| Receivable for investments sold | 83,114 | |
| Receivable for fund shares sold | 9,626 | |
| Dividends receivable | 48,955 | |
| Distributions receivable from Fidelity Central Funds | 957 | |
| Prepaid expenses | 9 | |
| Other receivables | 4,089 | |
| Total assets | 10,493,290 | |
| Liabilities | ||
| Payable to custodian bank | $705 | |
| Payable for investments purchased | 56,857 | |
| Payable for fund shares redeemed | 16,003 | |
| Accrued management fee | 6,281 | |
| Distribution and service plan fees payable | 100 | |
| Payable for daily variation margin for derivative instruments | 4,684 | |
| Other affiliated payables | 1,444 | |
| Other payables and accrued expenses | 581 | |
| Collateral on securities loaned, at value | 311,707 | |
| Total liabilities | 398,362 | |
| Net Assets | $10,094,928 | |
| Net Assets consist of: | ||
| Paid in capital | $9,352,158 | |
| Undistributed net investment income | 88,416 | |
| Accumulated undistributed net realized gain (loss) on investments and foreign currency transactions | (436,449) | |
| Net unrealized appreciation (depreciation) on investments and assets and liabilities in foreign currencies | 1,090,803 | |
| Net Assets | $10,094,928 | |
| Calculation of Maximum Offering Price | ||
| Class A: | ||
| Net Asset Value and redemption price per share ($260,942.4 ÷ 6,913.487 shares) | $37.74 | |
| Maximum offering price per share (100/94.25 of $37.74) | $40.04 | |
| Class T: | ||
| Net Asset Value and redemption price per share ($38,584.3 ÷ 1,028.093 shares) | $37.53 | |
| Maximum offering price per share (100/96.50 of $37.53) | $38.89 | |
| Class B: | ||
| Net Asset Value and offering price per share ($1,398.6 ÷ 37.492 shares)(a) | $37.30 | |
| Class C: | ||
| Net Asset Value and offering price per share ($32,708.8 ÷ 878.178 shares)(a) | $37.25 | |
| International Discovery: | ||
| Net Asset Value, offering price and redemption price per share ($6,797,488.8 ÷ 178,912.550 shares) | $37.99 | |
| Class K: | ||
| Net Asset Value, offering price and redemption price per share ($2,151,531.2 ÷ 56,751.079 shares) | $37.91 | |
| Class I: | ||
| Net Asset Value, offering price and redemption price per share ($781,184.7 ÷ 20,610.933 shares) | $37.90 | |
| Class Z: | ||
| Net Asset Value, offering price and redemption price per share ($31,088.8 ÷ 820.463 shares) | $37.89 |
(a) Redemption price per share is equal to net asset value less any applicable contingent deferred sales charge.
See accompanying notes which are an integral part of the financial statements.
Statement of Operations
| Amounts in thousands | Six months ended April 30, 2016 (Unaudited) | |
| Investment Income | ||
| Dividends (including $832 earned from other affiliated issuers) | $115,061 | |
| Special dividends | 37,704 | |
| Interest | 30 | |
| Income from Fidelity Central Funds | 3,138 | |
| Income before foreign taxes withheld | 155,933 | |
| Less foreign taxes withheld | (11,075) | |
| Total income | 144,858 | |
| Expenses | ||
| Management fee | ||
| Basic fee | $34,526 | |
| Performance adjustment | 6,890 | |
| Transfer agent fees | 8,001 | |
| Distribution and service plan fees | 600 | |
| Accounting and security lending fees | 905 | |
| Custodian fees and expenses | 660 | |
| Independent trustees' compensation | 23 | |
| Registration fees | 158 | |
| Audit | 78 | |
| Legal | 14 | |
| Miscellaneous | 35 | |
| Total expenses before reductions | 51,890 | |
| Expense reductions | (113) | 51,777 |
| Net investment income (loss) | 93,081 | |
| Realized and Unrealized Gain (Loss) | ||
| Net realized gain (loss) on: | ||
| Investment securities: | ||
| Unaffiliated issuers | (355,764) | |
| Other affiliated issuers | (19) | |
| Foreign currency transactions | 4,399 | |
| Futures contracts | (10,549) | |
| Total net realized gain (loss) | (361,933) | |
| Change in net unrealized appreciation (depreciation) on: Investment securities | (204,729) | |
| Assets and liabilities in foreign currencies | (1,103) | |
| Futures contracts | (20,801) | |
| Total change in net unrealized appreciation (depreciation) | (226,633) | |
| Net gain (loss) | (588,566) | |
| Net increase (decrease) in net assets resulting from operations | $(495,485) |
See accompanying notes which are an integral part of the financial statements.
Statement of Changes in Net Assets
| Amounts in thousands | Six months ended April 30, 2016 (Unaudited) | Year ended October 31, 2015 |
| Increase (Decrease) in Net Assets | ||
| Operations | ||
| Net investment income (loss) | $93,081 | $149,838 |
| Net realized gain (loss) | (361,933) | 245,770 |
| Change in net unrealized appreciation (depreciation) | (226,633) | 655 |
| Net increase (decrease) in net assets resulting from operations | (495,485) | 396,263 |
| Distributions to shareholders from net investment income | (113,434) | (74,589) |
| Distributions to shareholders from net realized gain | (1,362) | – |
| Total distributions | (114,796) | (74,589) |
| Share transactions - net increase (decrease) | (262,006) | (353,147) |
| Redemption fees | 42 | 95 |
| Total increase (decrease) in net assets | (872,245) | (31,378) |
| Net Assets | ||
| Beginning of period | 10,967,173 | 10,998,551 |
| End of period (including undistributed net investment income of $88,416 and undistributed net investment income of $108,769, respectively) | $10,094,928 | $10,967,173 |
See accompanying notes which are an integral part of the financial statements.
Financial Highlights — Fidelity International Discovery Fund Class A
| Six months ended (Unaudited) April 30, | Years ended October 31, | |||||
| 2016 | 2015 | 2014 | 2013 | 2012 | 2011 | |
| Selected Per–Share Data | ||||||
| Net asset value, beginning of period | $39.78 | $38.70 | $39.49 | $31.66 | $29.43 | $32.07 |
| Income from Investment Operations | ||||||
| Net investment income (loss)A | .27B | .40C | .53D | .34 | .41 | .42 |
| Net realized and unrealized gain (loss) | (2.04) | .79 | (.67) | 7.97 | 2.11 | (2.52) |
| Total from investment operations | (1.77) | 1.19 | (.14) | 8.31 | 2.52 | (2.10) |
| Distributions from net investment income | (.27) | (.11) | (.33) | (.45) | (.29) | (.38) |
| Distributions from net realized gain | (.01) | – | (.31) | (.03) | – | (.16) |
| Total distributions | (.27)E | (.11) | (.65)F | (.48) | (.29) | (.54) |
| Redemption fees added to paid in capitalA,G | – | – | – | – | – | – |
| Net asset value, end of period | $37.74 | $39.78 | $38.70 | $39.49 | $31.66 | $29.43 |
| Total ReturnH,I,J | (4.47)% | 3.09% | (.36)% | 26.59% | 8.70% | (6.71)% |
| Ratios to Average Net AssetsK,L | ||||||
| Expenses before reductions | 1.37%M | 1.33% | 1.28% | 1.35% | 1.34% | 1.30% |
| Expenses net of fee waivers, if any | 1.37%M | 1.33% | 1.28% | 1.35% | 1.34% | 1.29% |
| Expenses net of all reductions | 1.37%M | 1.32% | 1.28% | 1.33% | 1.31% | 1.25% |
| Net investment income (loss) | 1.45%B,M | 1.00%C | 1.35%D | .97% | 1.41% | 1.31% |
| Supplemental Data | ||||||
| Net assets, end of period (in millions) | $261 | $283 | $297 | $347 | $299 | $320 |
| Portfolio turnover rateN | 49%M,O | 60%O | 57% | 65% | 68% | 75% |
A Calculated based on average shares outstanding during the period.
B Net Investment income per share reflects a large, non-recurring dividend which amounted to $.14 per share. Excluding this non-recurring dividend, the ratio of net investment income (loss) to average net assets would have been .72%.
C Net Investment income per share reflects a large, non-recurring dividend which amounted to $.12 per share. Excluding this non-recurring dividend, the ratio of net investment income (loss) to average net assets would have been .69%.
D Net Investment income per share reflects a large, non-recurring dividend which amounted to $.22 per share. Excluding this non-recurring dividend, the ratio of net investment income (loss) to average net assets would have been .80%.
E Total distributions of $.27 per share is comprised of distributions from net investment income of $.269 and distributions from net realized gain of $.005 per share.
F Total distributions of $.65 per share is comprised of distributions from net investment income of $.334 and distributions from net realized gain of $.311 per share.
G Amount represents less than $.005 per share.
H Total returns for periods of less than one year are not annualized.
I Total returns would have been lower if certain expenses had not been reduced during the applicable periods shown.
J Total returns do not include the effect of the sales charges.
K Fees and expenses of any underlying Fidelity Central Funds are not included in the Fund's expense ratio. The Fund indirectly bears its proportionate share of the expenses of any underlying Fidelity Central Funds.
L Expense ratios reflect operating expenses of the class. Expenses before reductions do not reflect amounts reimbursed by the investment adviser or reductions from brokerage service arrangements or reductions from other expense offset arrangements and do not represent the amount paid by the class during periods when reimbursements or reductions occur. Expenses net of fee waivers reflect expenses after reimbursement by the investment adviser but prior to reductions from brokerage service arrangements or other expense offset arrangements. Expenses net of all reductions represent the net expenses paid by the class.
M Annualized
N Amount does not include the portfolio activity of any underlying Fidelity Central Funds.
O Portfolio turnover rate excludes securities received or delivered in-kind.
See accompanying notes which are an integral part of the financial statements.
Financial Highlights — Fidelity International Discovery Fund Class T
| Six months ended (Unaudited) April 30, | Years ended October 31, | |||||
| 2016 | 2015 | 2014 | 2013 | 2012 | 2011 | |
| Selected Per–Share Data | ||||||
| Net asset value, beginning of period | $39.51 | $38.43 | $39.23 | $31.42 | $29.18 | $31.81 |
| Income from Investment Operations | ||||||
| Net investment income (loss)A | .23B | .30C | .44D | .26 | .34 | .34 |
| Net realized and unrealized gain (loss) | (2.03) | .80 | (.68) | 7.92 | 2.09 | (2.51) |
| Total from investment operations | (1.80) | 1.10 | (.24) | 8.18 | 2.43 | (2.17) |
| Distributions from net investment income | (.17) | (.02) | (.25) | (.34) | (.19) | (.30) |
| Distributions from net realized gain | (.01) | – | (.31) | (.03) | – | (.16) |
| Total distributions | (.18) | (.02) | (.56) | (.37) | (.19) | (.46) |
| Redemption fees added to paid in capitalA,E | – | – | – | – | – | – |
| Net asset value, end of period | $37.53 | $39.51 | $38.43 | $39.23 | $31.42 | $29.18 |
| Total ReturnF,G,H | (4.59)% | 2.86% | (.60)% | 26.31% | 8.41% | (6.96)% |
| Ratios to Average Net AssetsI,J | ||||||
| Expenses before reductions | 1.61%K | 1.57% | 1.51% | 1.59% | 1.59% | 1.56% |
| Expenses net of fee waivers, if any | 1.61%K | 1.57% | 1.51% | 1.59% | 1.59% | 1.55% |
| Expenses net of all reductions | 1.61%K | 1.56% | 1.51% | 1.57% | 1.56% | 1.51% |
| Net investment income (loss) | 1.21%B,K | .76%C | 1.11%D | .73% | 1.16% | 1.05% |
| Supplemental Data | ||||||
| Net assets, end of period (in millions) | $39 | $43 | $49 | $53 | $46 | $61 |
| Portfolio turnover rateL | 49%K,M | 60%M | 57% | 65% | 68% | 75% |
A Calculated based on average shares outstanding during the period.
B Net Investment income per share reflects a large, non-recurring dividend which amounted to $.14 per share. Excluding this non-recurring dividend, the ratio of net investment income (loss) to average net assets would have been .48%.
C Net Investment income per share reflects a large, non-recurring dividend which amounted to $.12 per share. Excluding this non-recurring dividend, the ratio of net investment income (loss) to average net assets would have been .45%.
D Net Investment income per share reflects a large, non-recurring dividend which amounted to $.21 per share. Excluding this non-recurring dividend, the ratio of net investment income (loss) to average net assets would have been .56%.
E Amount represents less than $.005 per share.
F Total returns for periods of less than one year are not annualized.
G Total returns would have been lower if certain expenses had not been reduced during the applicable periods shown.
H Total returns do not include the effect of the sales charges.
I Fees and expenses of any underlying Fidelity Central Funds are not included in the Fund's expense ratio. The Fund indirectly bears its proportionate share of the expenses of any underlying Fidelity Central Funds.
J Expense ratios reflect operating expenses of the class. Expenses before reductions do not reflect amounts reimbursed by the investment adviser or reductions from brokerage service arrangements or reductions from other expense offset arrangements and do not represent the amount paid by the class during periods when reimbursements or reductions occur. Expenses net of fee waivers reflect expenses after reimbursement by the investment adviser but prior to reductions from brokerage service arrangements or other expense offset arrangements. Expenses net of all reductions represent the net expenses paid by the class.
K Annualized
L Amount does not include the portfolio activity of any underlying Fidelity Central Funds.
M Portfolio turnover rate excludes securities received or delivered in-kind.
See accompanying notes which are an integral part of the financial statements.
Financial Highlights — Fidelity International Discovery Fund Class B
| Six months ended (Unaudited) April 30, | Years ended October 31, | |||||
| 2016 | 2015 | 2014 | 2013 | 2012 | 2011 | |
| Selected Per–Share Data | ||||||
| Net asset value, beginning of period | $39.20 | $38.32 | $39.08 | $31.28 | $29.02 | $31.60 |
| Income from Investment Operations | ||||||
| Net investment income (loss)A | .13B | .08C | .22D | .08 | .19 | .17 |
| Net realized and unrealized gain (loss) | (2.03) | .80 | (.66) | 7.90 | 2.09 | (2.48) |
| Total from investment operations | (1.90) | .88 | (.44) | 7.98 | 2.28 | (2.31) |
| Distributions from net investment income | – | – | (.01) | (.15) | (.02) | (.12) |
| Distributions from net realized gain | – | – | (.31) | (.03) | – | (.16) |
| Total distributions | – | – | (.32) | (.18) | (.02) | (.27)E |
| Redemption fees added to paid in capitalA,F | – | – | – | – | – | – |
| Net asset value, end of period | $37.30 | $39.20 | $38.32 | $39.08 | $31.28 | $29.02 |
| Total ReturnG,H,I | (4.85)% | 2.30% | (1.12)% | 25.64% | 7.85% | (7.39)% |
| Ratios to Average Net AssetsJ,K | ||||||
| Expenses before reductions | 2.14%L | 2.12% | 2.06% | 2.10% | 2.09% | 2.06% |
| Expenses net of fee waivers, if any | 2.14%L | 2.12% | 2.06% | 2.10% | 2.09% | 2.06% |
| Expenses net of all reductions | 2.14%L | 2.11% | 2.05% | 2.08% | 2.06% | 2.02% |
| Net investment income (loss) | .68%B,L | .21%C | .57%D | .22% | .66% | .54% |
| Supplemental Data | ||||||
| Net assets, end of period (in millions) | $1 | $2 | $5 | $7 | $8 | $10 |
| Portfolio turnover rateM | 49%L,N | 60%N | 57% | 65% | 68% | 75% |
A Calculated based on average shares outstanding during the period.
B Net Investment income per share reflects a large, non-recurring dividend which amounted to $.14 per share. Excluding this non-recurring dividend, the ratio of net investment income (loss) to average net assets would have been (.05) %.
C Net Investment income per share reflects a large, non-recurring dividend which amounted to $.12 per share. Excluding this non-recurring dividend, the ratio of net investment income (loss) to average net assets would have been (.10) %.
D Net Investment income per share reflects a large, non-recurring dividend which amounted to $.21 per share. Excluding this non-recurring dividend, the ratio of net investment income (loss) to average net assets would have been .02%.
E Total distributions of $.27 per share is comprised of distributions from net investment income of $.115 and distributions from net realized gain of $.155 per share.
F Amount represents less than $.005 per share.
G Total returns for periods of less than one year are not annualized.
H Total returns would have been lower if certain expenses had not been reduced during the applicable periods shown.
I Total returns do not include the effect of the contingent deferred sales charge.
J Fees and expenses of any underlying Fidelity Central Funds are not included in the Fund's expense ratio. The Fund indirectly bears its proportionate share of the expenses of any underlying Fidelity Central Funds.
K Expense ratios reflect operating expenses of the class. Expenses before reductions do not reflect amounts reimbursed by the investment adviser or reductions from brokerage service arrangements or reductions from other expense offset arrangements and do not represent the amount paid by the class during periods when reimbursements or reductions occur. Expenses net of fee waivers reflect expenses after reimbursement by the investment adviser but prior to reductions from brokerage service arrangements or other expense offset arrangements. Expenses net of all reductions represent the net expenses paid by the class.
L Annualized
M Amount does not include the portfolio activity of any underlying Fidelity Central Funds.
N Portfolio turnover rate excludes securities received or delivered in-kind.
See accompanying notes which are an integral part of the financial statements.
Financial Highlights — Fidelity International Discovery Fund Class C
| Six months ended (Unaudited) April 30, | Years ended October 31, | |||||
| 2016 | 2015 | 2014 | 2013 | 2012 | 2011 | |
| Selected Per–Share Data | ||||||
| Net asset value, beginning of period | $39.14 | $38.25 | $39.07 | $31.32 | $29.08 | $31.68 |
| Income from Investment Operations | ||||||
| Net investment income (loss)A | .13B | .10C | .23D | .08 | .19 | .18 |
| Net realized and unrealized gain (loss) | (2.02) | .79 | (.66) | 7.90 | 2.09 | (2.49) |
| Total from investment operations | (1.89) | .89 | (.43) | 7.98 | 2.28 | (2.31) |
| Distributions from net investment income | – | – | (.08) | (.20) | (.04) | (.14) |
| Distributions from net realized gain | – | – | (.31) | (.03) | – | (.16) |
| Total distributions | – | – | (.39) | (.23) | (.04) | (.29)E |
| Redemption fees added to paid in capitalA,F | – | – | – | – | – | – |
| Net asset value, end of period | $37.25 | $39.14 | $38.25 | $39.07 | $31.32 | $29.08 |
| Total ReturnG,H,I | (4.83)% | 2.33% | (1.10)% | 25.65% | 7.86% | (7.37)% |
| Ratios to Average Net AssetsJ,K | ||||||
| Expenses before reductions | 2.12%L | 2.09% | 2.03% | 2.10% | 2.09% | 2.05% |
| Expenses net of fee waivers, if any | 2.12%L | 2.09% | 2.03% | 2.09% | 2.09% | 2.04% |
| Expenses net of all reductions | 2.12%L | 2.08% | 2.02% | 2.07% | 2.06% | 2.00% |
| Net investment income (loss) | .70%B,L | .24%C | .60%D | .23% | .66% | .56% |
| Supplemental Data | ||||||
| Net assets, end of period (in millions) | $33 | $32 | $35 | $36 | $30 | $33 |
| Portfolio turnover rateM | 49%L,N | 60%N | 57% | 65% | 68% | 75% |
A Calculated based on average shares outstanding during the period.
B Net Investment income per share reflects a large, non-recurring dividend which amounted to $.14 per share. Excluding this non-recurring dividend, the ratio of net investment income (loss) to average net assets would have been (.03) %.
C Net Investment income per share reflects a large, non-recurring dividend which amounted to $.12 per share. Excluding this non-recurring dividend, the ratio of net investment income (loss) to average net assets would have been (.06) %.
D Net Investment income per share reflects a large, non-recurring dividend which amounted to $.21 per share. Excluding this non-recurring dividend, the ratio of net investment income (loss) to average net assets would have been .05%.
E Total distributions of $.29 per share is comprised of distributions from net investment income of $.137 and distributions from net realized gain of $.155 per share.
F Amount represents less than $.005 per share.
G Total returns for periods of less than one year are not annualized.
H Total returns would have been lower if certain expenses had not been reduced during the applicable periods shown.
I Total returns do not include the effect of the contingent deferred sales charge.
J Fees and expenses of any underlying Fidelity Central Funds are not included in the Fund's expense ratio. The Fund indirectly bears its proportionate share of the expenses of any underlying Fidelity Central Funds.
K Expense ratios reflect operating expenses of the class. Expenses before reductions do not reflect amounts reimbursed by the investment adviser or reductions from brokerage service arrangements or reductions from other expense offset arrangements and do not represent the amount paid by the class during periods when reimbursements or reductions occur. Expenses net of fee waivers reflect expenses after reimbursement by the investment adviser but prior to reductions from brokerage service arrangements or other expense offset arrangements. Expenses net of all reductions represent the net expenses paid by the class.
L Annualized
M Amount does not include the portfolio activity of any underlying Fidelity Central Funds.
N Portfolio turnover rate excludes securities received or delivered in-kind.
See accompanying notes which are an integral part of the financial statements.
Financial Highlights — Fidelity International Discovery Fund
| Six months ended (Unaudited) April 30, | Years ended October 31, | |||||
| 2016 | 2015 | 2014 | 2013 | 2012 | 2011 | |
| Selected Per–Share Data | ||||||
| Net asset value, beginning of period | $40.12 | $39.03 | $39.82 | $31.91 | $29.69 | $32.34 |
| Income from Investment Operations | ||||||
| Net investment income (loss)A | .34B | .54C | .67D | .47 | .51 | .53 |
| Net realized and unrealized gain (loss) | (2.06) | .81 | (.68) | 8.02 | 2.12 | (2.54) |
| Total from investment operations | (1.72) | 1.35 | (.01) | 8.49 | 2.63 | (2.01) |
| Distributions from net investment income | (.41) | (.26) | (.47) | (.55) | (.41) | (.48) |
| Distributions from net realized gain | (.01) | – | (.31) | (.03) | – | (.16) |
| Total distributions | (.41)E | (.26) | (.78) | (.58) | (.41) | (.64) |
| Redemption fees added to paid in capitalA,F | – | – | – | – | – | – |
| Net asset value, end of period | $37.99 | $40.12 | $39.03 | $39.82 | $31.91 | $29.69 |
| Total ReturnG,H | (4.33)% | 3.47% | (.01)% | 27.03% | 9.03% | (6.39)% |
| Ratios to Average Net AssetsI,J | ||||||
| Expenses before reductions | 1.02%K | .99% | .93% | 1.00% | 1.01% | .97% |
| Expenses net of fee waivers, if any | 1.02%K | .99% | .93% | 1.00% | 1.01% | .96% |
| Expenses net of all reductions | 1.02%K | .98% | .93% | .98% | .98% | .92% |
| Net investment income (loss) | 1.80%B,K | 1.34%C | 1.69%D | 1.32% | 1.73% | 1.64% |
| Supplemental Data | ||||||
| Net assets, end of period (in millions) | $6,797 | $7,209 | $7,464 | $7,800 | $5,965 | $6,806 |
| Portfolio turnover rateL | 49%K,M | 60%M | 57% | 65% | 68% | 75% |
A Calculated based on average shares outstanding during the period.
B Net Investment income per share reflects a large, non-recurring dividend which amounted to $.14 per share. Excluding this non-recurring dividend, the ratio of net investment income (loss) to average net assets would have been 1.07%.
C Net Investment income per share reflects a large, non-recurring dividend which amounted to $.12 per share. Excluding this non-recurring dividend, the ratio of net investment income (loss) to average net assets would have been 1.03%.
D Net Investment income per share reflects a large, non-recurring dividend which amounted to $.22 per share. Excluding this non-recurring dividend, the ratio of net investment income (loss) to average net assets would have been 1.15%.
E Total distributions of $.41 per share is comprised of distributions from net investment income of $.409 and distributions from net realized gain of $.005 per share.
F Amount represents less than $.005 per share.
G Total returns for periods of less than one year are not annualized.
H Total returns would have been lower if certain expenses had not been reduced during the applicable periods shown.
I Fees and expenses of any underlying Fidelity Central Funds are not included in the Fund's expense ratio. The Fund indirectly bears its proportionate share of the expenses of any underlying Fidelity Central Funds.
J Expense ratios reflect operating expenses of the class. Expenses before reductions do not reflect amounts reimbursed by the investment adviser or reductions from brokerage service arrangements or reductions from other expense offset arrangements and do not represent the amount paid by the class during periods when reimbursements or reductions occur. Expenses net of fee waivers reflect expenses after reimbursement by the investment adviser but prior to reductions from brokerage service arrangements or other expense offset arrangements. Expenses net of all reductions represent the net expenses paid by the class.
K Annualized
L Amount does not include the portfolio activity of any underlying Fidelity Central Funds.
M Portfolio turnover rate excludes securities received or delivered in-kind.
See accompanying notes which are an integral part of the financial statements.
Financial Highlights — Fidelity International Discovery Fund Class K
| Six months ended (Unaudited) April 30, | Years ended October 31, | |||||
| 2016 | 2015 | 2014 | 2013 | 2012 | 2011 | |
| Selected Per–Share Data | ||||||
| Net asset value, beginning of period | $40.06 | $38.97 | $39.76 | $31.87 | $29.66 | $32.32 |
| Income from Investment Operations | ||||||
| Net investment income (loss)A | .36B | .59C | .72D | .52 | .57 | .58 |
| Net realized and unrealized gain (loss) | (2.04) | .81 | (.67) | 8.01 | 2.11 | (2.54) |
| Total from investment operations | (1.68) | 1.40 | .05 | 8.53 | 2.68 | (1.96) |
| Distributions from net investment income | (.46) | (.31) | (.53) | (.61) | (.47) | (.55) |
| Distributions from net realized gain | (.01) | – | (.31) | (.03) | – | (.16) |
| Total distributions | (.47) | (.31) | (.84) | (.64) | (.47) | (.70)E |
| Redemption fees added to paid in capitalA,F | – | – | – | – | – | – |
| Net asset value, end of period | $37.91 | $40.06 | $38.97 | $39.76 | $31.87 | $29.66 |
| Total ReturnG,H | (4.25)% | 3.61% | .13% | 27.23% | 9.24% | (6.24)% |
| Ratios to Average Net AssetsI,J | ||||||
| Expenses before reductions | .89%K | .86% | .80% | .85% | .83% | .80% |
| Expenses net of fee waivers, if any | .89%K | .86% | .80% | .85% | .83% | .79% |
| Expenses net of all reductions | .89%K | .85% | .79% | .83% | .80% | .75% |
| Net investment income (loss) | 1.94%B,K | 1.47%C | 1.83%D | 1.47% | 1.91% | 1.81% |
| Supplemental Data | ||||||
| Net assets, end of period (in millions) | $2,152 | $2,308 | $2,464 | $2,576 | $1,776 | $1,245 |
| Portfolio turnover rateL | 49%K,M | 60%M | 57% | 65% | 68% | 75% |
A Calculated based on average shares outstanding during the period.
B Net Investment income per share reflects a large, non-recurring dividend which amounted to $.14 per share. Excluding this non-recurring dividend, the ratio of net investment income (loss) to average net assets would have been 1.20%.
C Net Investment income per share reflects a large, non-recurring dividend which amounted to $.12 per share. Excluding this non-recurring dividend, the ratio of net investment income (loss) to average net assets would have been 1.16%.
D Net Investment income per share reflects a large, non-recurring dividend which amounted to $.22 per share. Excluding this non-recurring dividend, the ratio of net investment income (loss) to average net assets would have been 1.28%.
E Total distributions of $.70 per share is comprised of distributions from net investment income of $.548 and distributions from net realized gain of $.155 per share.
F Amount represents less than $.005 per share.
G Total returns for periods of less than one year are not annualized.
H Total returns would have been lower if certain expenses had not been reduced during the applicable periods shown.
I Fees and expenses of any underlying Fidelity Central Funds are not included in the Fund's expense ratio. The Fund indirectly bears its proportionate share of the expenses of any underlying Fidelity Central Funds.
J Expense ratios reflect operating expenses of the class. Expenses before reductions do not reflect amounts reimbursed by the investment adviser or reductions from brokerage service arrangements or reductions from other expense offset arrangements and do not represent the amount paid by the class during periods when reimbursements or reductions occur. Expenses net of fee waivers reflect expenses after reimbursement by the investment adviser but prior to reductions from brokerage service arrangements or other expense offset arrangements. Expenses net of all reductions represent the net expenses paid by the class.
K Annualized
L Amount does not include the portfolio activity of any underlying Fidelity Central Funds.
M Portfolio turnover rate excludes securities received or delivered in-kind.
See accompanying notes which are an integral part of the financial statements.
Financial Highlights — Fidelity International Discovery Fund Class I
| Six months ended (Unaudited) April 30, | Years ended October 31, | |||||
| 2016 | 2015 | 2014 | 2013 | 2012 | 2011 | |
| Selected Per–Share Data | ||||||
| Net asset value, beginning of period | $40.03 | $38.96 | $39.76 | $31.87 | $29.65 | $32.31 |
| Income from Investment Operations | ||||||
| Net investment income (loss)A | .34B | .53C | .67D | .47 | .52 | .54 |
| Net realized and unrealized gain (loss) | (2.05) | .80 | (.68) | 8.01 | 2.11 | (2.55) |
| Total from investment operations | (1.71) | 1.33 | (.01) | 8.48 | 2.63 | (2.01) |
| Distributions from net investment income | (.42) | (.26) | (.48) | (.56) | (.41) | (.50) |
| Distributions from net realized gain | (.01) | – | (.31) | (.03) | – | (.16) |
| Total distributions | (.42)E | (.26) | (.79) | (.59) | (.41) | (.65)F |
| Redemption fees added to paid in capitalA,G | – | – | – | – | – | – |
| Net asset value, end of period | $37.90 | $40.03 | $38.96 | $39.76 | $31.87 | $29.65 |
| Total ReturnH,I | (4.31)% | 3.44% | (.01)% | 27.03% | 9.07% | (6.39)% |
| Ratios to Average Net AssetsJ,K | ||||||
| Expenses before reductions | 1.03%L | 1.00% | .93% | 1.00% | 1.00% | .95% |
| Expenses net of fee waivers, if any | 1.03%L | .99% | .93% | 1.00% | 1.00% | .94% |
| Expenses net of all reductions | 1.03%L | .98% | .93% | .97% | .97% | .90% |
| Net investment income (loss) | 1.80%B,L | 1.33%C | 1.69%D | 1.33% | 1.75% | 1.66% |
| Supplemental Data | ||||||
| Net assets, end of period (in millions) | $781 | $1,061 | $650 | $476 | $294 | $278 |
| Portfolio turnover rateM | 49%L,N | 60%N | 57% | 65% | 68% | 75% |
A Calculated based on average shares outstanding during the period.
B Net Investment income per share reflects a large, non-recurring dividend which amounted to $.14 per share. Excluding this non-recurring dividend, the ratio of net investment income (loss) to average net assets would have been 1.06%.
C Net Investment income per share reflects a large, non-recurring dividend which amounted to $.12 per share. Excluding this non-recurring dividend, the ratio of net investment income (loss) to average net assets would have been 1.03%.
D Net Investment income per share reflects a large, non-recurring dividend which amounted to $.22 per share. Excluding this non-recurring dividend, the ratio of net investment income (loss) to average net assets would have been 1.14%.
E Total distributions of $.42 per share is comprised of distributions from net investment income of $.418 and distributions from net realized gain of $.005 per share.
F Total distributions of $.65 per share is comprised of distributions from net investment income of $.497 and distributions from net realized gain of $.155 per share.
G Amount represents less than $.005 per share.
H Total returns for periods of less than one year are not annualized.
I Total returns would have been lower if certain expenses had not been reduced during the applicable periods shown.
J Fees and expenses of any underlying Fidelity Central Funds are not included in the Fund's expense ratio. The Fund indirectly bears its proportionate share of the expenses of any underlying Fidelity Central Funds.
K Expense ratios reflect operating expenses of the class. Expenses before reductions do not reflect amounts reimbursed by the investment adviser or reductions from brokerage service arrangements or reductions from other expense offset arrangements and do not represent the amount paid by the class during periods when reimbursements or reductions occur. Expenses net of fee waivers reflect expenses after reimbursement by the investment adviser but prior to reductions from brokerage service arrangements or other expense offset arrangements. Expenses net of all reductions represent the net expenses paid by the class.
L Annualized
M Amount does not include the portfolio activity of any underlying Fidelity Central Funds.
N Portfolio turnover rate excludes securities received or delivered in-kind.
See accompanying notes which are an integral part of the financial statements.
Financial Highlights — Fidelity International Discovery Fund Class Z
| Six months ended (Unaudited) April 30, | Years ended October 31, | |||
| 2016 | 2015 | 2014 | 2013 A | |
| Selected Per–Share Data | ||||
| Net asset value, beginning of period | $40.03 | $38.96 | $39.77 | $37.22 |
| Income from Investment Operations | ||||
| Net investment income (loss)B | .36C | .59D | .72E | .07 |
| Net realized and unrealized gain (loss) | (2.03) | .80 | (.68) | 2.48 |
| Total from investment operations | (1.67) | 1.39 | .04 | 2.55 |
| Distributions from net investment income | (.46) | (.32) | (.54) | – |
| Distributions from net realized gain | (.01) | – | (.31) | – |
| Total distributions | (.47) | (.32) | (.85) | – |
| Redemption fees added to paid in capitalB,F | – | – | – | – |
| Net asset value, end of period | $37.89 | $40.03 | $38.96 | $39.77 |
| Total ReturnG,H | (4.24)% | 3.58% | .12% | 6.85% |
| Ratios to Average Net AssetsI,J | ||||
| Expenses before reductions | .89%K | .86% | .80% | .85%K |
| Expenses net of fee waivers, if any | .89%K | .86% | .80% | .85%K |
| Expenses net of all reductions | .89%K | .85% | .79% | .83%K |
| Net investment income (loss) | 1.94%C,K | 1.47%D | 1.83%E | .76%K |
| Supplemental Data | ||||
| Net assets, end of period (000 omitted) | $31,089 | $30,093 | $35,125 | $107 |
| Portfolio turnover rateL | 49%K,M | 60%M | 57% | 65% |
A For the period August 13, 2013 (commencement of sale of shares) to October 31, 2013.
B Calculated based on average shares outstanding during the period.
C Net Investment income per share reflects a large, non-recurring dividend which amounted to $.14 per share. Excluding this non-recurring dividend, the ratio of net investment income (loss) to average net assets would have been 1.20%.
D Net Investment income per share reflects a large, non-recurring dividend which amounted to $.12 per share. Excluding this non-recurring dividend, the ratio of net investment income (loss) to average net assets would have been 1.16%.
E Net Investment income per share reflects a large, non-recurring dividend which amounted to $.21 per share. Excluding this non-recurring dividend, the ratio of net investment income (loss) to average net assets would have been 1.28%.
F Amount represents less than $.005 per share.
G Total returns for periods of less than one year are not annualized.
H Total returns would have been lower if certain expenses had not been reduced during the applicable periods shown.
I Fees and expenses of any underlying Fidelity Central Funds are not included in the Fund's expense ratio. The Fund indirectly bears its proportionate share of the expenses of any underlying Fidelity Central Funds.
J Expense ratios reflect operating expenses of the class. Expenses before reductions do not reflect amounts reimbursed by the investment adviser or reductions from brokerage service arrangements or reductions from other expense offset arrangements and do not represent the amount paid by the class during periods when reimbursements or reductions occur. Expense ratios before reductions for start-up periods may not be representative of longer-term operating periods. Expenses net of fee waivers reflect expenses after reimbursement by the investment adviser but prior to reductions from brokerage service arrangements or other expense offset arrangements. Expenses net of all reductions represent the net expenses paid by the class.
K Annualized
L Amount does not include the portfolio activity of any underlying Fidelity Central Funds.
M Portfolio turnover rate excludes securities received or delivered in-kind.
See accompanying notes which are an integral part of the financial statements.
Notes to Financial Statements (Unaudited)
For the period ended April 30, 2016
(Amounts in thousands except percentages)
1. Organization.
Fidelity International Discovery Fund (the Fund) is a fund of Fidelity Investment Trust (the Trust) and is authorized to issue an unlimited number of shares. The Trust is registered under the Investment Company Act of 1940, as amended (the 1940 Act), as an open-end management investment company organized as a Massachusetts business trust. The Fund offers Class A, Class T, Class C, International Discovery, Class K, Class I and Class Z shares, each of which, along with Class B shares, has equal rights as to assets and voting privileges. Class B shares are closed to new accounts and additional purchases, except for exchanges and reinvestments. Each class has exclusive voting rights with respect to matters that affect that class. Class B shares will automatically convert to Class A shares after a maximum holding period of seven years from the initial date of purchase.
During the period, the Board of Trustees approved the conversion of all existing Class B shares into Class A shares, effective on or about July 1, 2016, regardless of the length of times shares have been held.
2. Investments in Fidelity Central Funds.
The Fund invests in Fidelity Central Funds, which are open-end investment companies generally available only to other investment companies and accounts managed by the investment adviser and its affiliates. The Fund's Schedule of Investments lists each of the Fidelity Central Funds held as of period end, if any, as an investment of the Fund, but does not include the underlying holdings of each Fidelity Central Fund. As an Investing Fund, the Fund indirectly bears its proportionate share of the expenses of the underlying Fidelity Central Funds.
The Money Market Central Funds seek preservation of capital and current income and are managed by Fidelity Investments Money Management, Inc. (FIMM), an affiliate of the investment adviser. Annualized expenses of the Money Market Central Funds as of their most recent shareholder report date are less than .005%.
A complete unaudited list of holdings for each Fidelity Central Fund is available upon request or at the Securities and Exchange Commission (the SEC) website at www.sec.gov. In addition, the financial statements of the Fidelity Central Funds are available on the SEC website or upon request.
3. Significant Accounting Policies.
The financial statements have been prepared in conformity with accounting principles generally accepted in the United States of America (GAAP), which require management to make certain estimates and assumptions at the date of the financial statements. Actual results could differ from those estimates. Subsequent events, if any, through the date that the financial statements were issued have been evaluated in the preparation of the financial statements. The following summarizes the significant accounting policies of the Fund:
Investment Valuation. Investments are valued as of 4:00 p.m. Eastern time on the last calendar day of the period. The Board of Trustees (the Board) has delegated the day to day responsibility for the valuation of the Fund's investments to the Fidelity Management & Research Company (FMR) Fair Value Committee (the Committee). In accordance with valuation policies and procedures approved by the Board, the Fund attempts to obtain prices from one or more third party pricing vendors or brokers to value its investments. When current market prices, quotations or currency exchange rates are not readily available or reliable, investments will be fair valued in good faith by the Committee, in accordance with procedures adopted by the Board. Factors used in determining fair value vary by investment type and may include market or investment specific events, changes in interest rates and credit quality. The frequency with which these procedures are used cannot be predicted and they may be utilized to a significant extent. The Committee oversees the Fund's valuation policies and procedures and reports to the Board on the Committee's activities and fair value determinations. The Board monitors the appropriateness of the procedures used in valuing the Fund's investments and ratifies the fair value determinations of the Committee.
The Fund categorizes the inputs to valuation techniques used to value its investments into a disclosure hierarchy consisting of three levels as shown below:
- Level 1 – quoted prices in active markets for identical investments
- Level 2 – other significant observable inputs (including quoted prices for similar investments, interest rates, prepayment speeds, etc.)
- Level 3 – unobservable inputs (including the Fund's own assumptions based on the best information available)
Valuation techniques used to value the Fund's investments by major category are as follows:
Equity securities, including restricted securities, for which market quotations are readily available, are valued at the last reported sale price or official closing price as reported by a third party pricing vendor on the primary market or exchange on which they are traded and are categorized as Level 1 in the hierarchy. In the event there were no sales during the day or closing prices are not available, securities are valued at the last quoted bid price or may be valued using the last available price and are generally categorized as Level 2 in the hierarchy. For foreign equity securities, when market or security specific events arise, comparisons to the valuation of American Depositary Receipts (ADRs), futures contracts, Exchange-Traded Funds (ETFs) and certain indexes as well as quoted prices for similar securities may be used and would be categorized as Level 2 in the hierarchy. Utilizing these techniques may result in transfers between Level 1 and Level 2. For equity securities, including restricted securities, where observable inputs are limited, assumptions about market activity and risk are used and these securities may be categorized as Level 3 in the hierarchy.
Debt securities, including restricted securities, are valued based on evaluated prices received from third party pricing vendors or from brokers who make markets in such securities. U.S. government and government agency obligations are valued by pricing vendors who utilize matrix pricing which considers yield or price of bonds of comparable quality, coupon, maturity and type or by broker-supplied prices. When independent prices are unavailable or unreliable, debt securities may be valued utilizing pricing methodologies which consider similar factors that would be used by third party pricing vendors. Debt securities are generally categorized as Level 2 in the hierarchy but may be Level 3 depending on the circumstances.
Futures contracts are valued at the settlement price established each day by the board of trade or exchange on which they are traded and are categorized as Level 1 in the hierarchy. Investments in open-end mutual funds, including the Fidelity Central Funds, are valued at their closing net asset value (NAV) each business day and are categorized as Level 1 in the hierarchy.
Changes in valuation techniques may result in transfers in or out of an assigned level within the disclosure hierarchy. The aggregate value of investments by input level as of April 30, 2016, including information on transfers between Levels 1 and 2, is included at the end of the Fund's Schedule of Investments.
Foreign Currency. The Fund may use foreign currency contracts to facilitate transactions in foreign-denominated securities. Gains and losses from these transactions may arise from changes in the value of the foreign currency or if the counterparties do not perform under the contracts' terms.
Foreign-denominated assets, including investment securities, and liabilities are translated into U.S. dollars at the exchange rates at period end. Purchases and sales of investment securities, income and dividends received and expenses denominated in foreign currencies are translated into U.S. dollars at the exchange rate in effect on the transaction date.
The effects of exchange rate fluctuations on investments are included with the net realized and unrealized gain (loss) on investment securities. Other foreign currency transactions resulting in realized and unrealized gain (loss) are disclosed separately.
Investment Transactions and Income. For financial reporting purposes, the Fund's investment holdings and NAV include trades executed through the end of the last business day of the period. The NAV per share for processing shareholder transactions is calculated as of the close of business of the New York Stock Exchange (NYSE), normally 4:00 p.m. Eastern time and includes trades executed through the end of the prior business day. Gains and losses on securities sold are determined on the basis of identified cost. Dividend income is recorded on the ex-dividend date, except for certain dividends from foreign securities where the ex-dividend date may have passed, which are recorded as soon as the Fund is informed of the ex-dividend date. Non-cash dividends included in dividend income, if any, are recorded at the fair market value of the securities received. Income and capital gain distributions from Fidelity Central Funds, if any, are recorded on the ex-dividend date. Distributions received on securities that represent a return of capital or capital gain are recorded as a reduction of cost of investments and/or as a realized gain. Subsequent to ex-dividend date the Fund determines the components of these distributions, based upon receipt of tax filings or other correspondence relating to the underlying investment. Large, non-recurring dividends recognized by the Fund are presented separately on the Statement of Operations as "Special Dividends" and the impact of these dividends is presented in the Financial Highlights. Interest income is accrued as earned and includes coupon interest and amortization of premium and accretion of discount on debt securities as applicable. Investment income is recorded net of foreign taxes withheld where recovery of such taxes is uncertain.
Class Allocations and Expenses. Investment income, realized and unrealized capital gains and losses, common expenses of the Fund, and certain fund-level expense reductions, if any, are allocated daily on a pro-rata basis to each class based on the relative net assets of each class to the total net assets of the Fund. Each class differs with respect to transfer agent and distribution and service plan fees incurred. Certain expense reductions may also differ by class. For the reporting period, the allocated portion of income and expenses to each class as a percent of its average net assets may vary due to the timing of recording these transactions in relation to fluctuating net assets of the classes. Expenses directly attributable to a fund are charged to that fund. Expenses attributable to more than one fund are allocated among the respective funds on the basis of relative net assets or other appropriate methods. Expense estimates are accrued in the period to which they relate and adjustments are made when actual amounts are known.
Deferred Trustee Compensation. Under a Deferred Compensation Plan (the Plan), independent Trustees may elect to defer receipt of a portion of their annual compensation. Deferred amounts are invested in a cross-section of Fidelity funds, are marked-to-market and remain in the Fund until distributed in accordance with the Plan. The investment of deferred amounts and the offsetting payable to the Trustees are included in the accompanying Statement of Assets and Liabilities.
Income Tax Information and Distributions to Shareholders. Each year, the Fund intends to qualify as a regulated investment company under Subchapter M of the Internal Revenue Code, including distributing substantially all of its taxable income and realized gains. As a result, no provision for U.S. Federal income taxes is required. The Fund files a U.S. federal tax return, in addition to state and local tax returns as required. The Fund's federal income tax returns are subject to examination by the Internal Revenue Service (IRS) for a period of three fiscal years after they are filed. State and local tax returns may be subject to examination for an additional fiscal year depending on the jurisdiction. Foreign taxes are provided for based on the Fund's understanding of the tax rules and rates that exist in the foreign markets in which it invests.
Distributions are declared and recorded on the ex-dividend date. Income dividends and capital gain distributions are declared separately for each class. Income and capital gain distributions are determined in accordance with income tax regulations, which may differ from GAAP.
Capital accounts within the financial statements are adjusted for permanent book-tax differences. These adjustments have no impact on net assets or the results of operations. Capital accounts are not adjusted for temporary book-tax differences which will reverse in a subsequent period.
Book-tax differences are primarily due to futures contracts, foreign currency transactions, passive foreign investment companies (PFIC), market discount, certain foreign taxes, redemptions in-kind, deferred trustees compensation, capital loss carryforwards and losses deferred due to wash sales.
The federal tax cost of investment securities and unrealized appreciation (depreciation) as of period end were as follows:
| Gross unrealized appreciation | $1,550,136 |
| Gross unrealized depreciation | (447,894) |
| Net unrealized appreciation (depreciation) on securities | $1,102,242 |
| Tax cost | $9,240,764 |
Capital loss carryforwards are only available to offset future capital gains of the Fund to the extent provided by regulations and may be limited. Under the Regulated Investment Company Modernization Act of 2010 (the Act), the Fund is permitted to carry forward capital losses incurred in taxable years beginning after December 22, 2010 for an unlimited period and such capital losses are required to be used prior to any losses that expire. The capital loss carryforward information presented below, including any applicable limitation, is estimated as of prior fiscal period end and is subject to adjustment.
| Fiscal year of expiration | |
| 2017 | $(49,248) |
Short-Term Trading (Redemption) Fees. Shares held by investors in the Fund less than 30 days may have been subject to a redemption fee equal to 1.00% of the NAV of shares redeemed. All redemption fees, which reduce the proceeds of the shareholder redemption, are retained by the Fund and accounted for as an addition to paid in capital.
Restricted Securities. The Fund may invest in securities that are subject to legal or contractual restrictions on resale. These securities generally may be resold in transactions exempt from registration or to the public if the securities are registered. Disposal of these securities may involve time-consuming negotiations and expense, and prompt sale at an acceptable price may be difficult. Information regarding restricted securities is included at the end of the Fund's Schedule of Investments.
4. Derivative Instruments.
Risk Exposures and the Use of Derivative Instruments. The Fund's investment objective allows the Fund to enter into various types of derivative contracts, including futures contracts. Derivatives are investments whose value is primarily derived from underlying assets, indices or reference rates and may be transacted on an exchange or over-the-counter (OTC). Derivatives may involve a future commitment to buy or sell a specified asset based on specified terms, to exchange future cash flows at periodic intervals based on a notional principal amount, or for one party to make one or more payments upon the occurrence of specified events in exchange for periodic payments from the other party.
The Fund used derivatives to increase returns and to manage exposure to certain risks as defined below. The success of any strategy involving derivatives depends on analysis of numerous economic factors, and if the strategies for investment do not work as intended, the Fund may not achieve its objectives.
The Fund's use of derivatives increased or decreased its exposure to the following risk:
| Equity Risk | Equity risk relates to the fluctuations in the value of financial instruments as a result of changes in market prices (other than those arising from interest rate risk or foreign exchange risk), whether caused by factors specific to an individual investment, its issuer, or all factors affecting all instruments traded in a market or market segment. |
The Fund is also exposed to additional risks from investing in derivatives, such as liquidity risk and counterparty credit risk. Liquidity risk is the risk that the Fund will be unable to close out the derivative in the open market in a timely manner. Counterparty credit risk is the risk that the counterparty will not be able to fulfill its obligation to the Fund. Counterparty credit risk related to exchange-traded futures contracts may be mitigated by the protection provided by the exchange on which they trade.
Investing in derivatives may involve greater risks than investing in the underlying assets directly and, to varying degrees, may involve risk of loss in excess of any initial investment and collateral received and amounts recognized in the Statement of Assets and Liabilities. In addition, there may be the risk that the change in value of the derivative contract does not correspond to the change in value of the underlying instrument.
Futures Contracts. A futures contract is an agreement between two parties to buy or sell a specified underlying instrument for a fixed price at a specified future date. The Fund used futures contracts to manage its exposure to the stock market.
Upon entering into a futures contract, a fund is required to deposit either cash or securities (initial margin) with a clearing broker in an amount equal to a certain percentage of the face value of the contract. Futures contracts are marked-to-market daily and subsequent daily payments (variation margin) are made or received by a fund depending on the daily fluctuations in the value of the futures contracts and are recorded as unrealized appreciation or (depreciation). This receivable and/or payable, if any, is included in daily variation margin for derivative instruments in the Statement of Assets and Liabilities. Realized gain or (loss) is recorded upon the expiration or closing of a futures contract.
Any open futures contracts at period end are presented in the Schedule of Investments under the caption "Futures Contracts". The underlying face amount at value reflects each contract's exposure to the underlying instrument or index at period end and is representative of volume of activity during the period. Securities deposited to meet initial margin requirements are identified in the Schedule of Investments.
During the period the Fund recognized net realized gain (loss) of $(10,549) and a change in net unrealized appreciation (depreciation) of $(20,801) related to its investment in futures contracts. These amounts are included in the Statement of Operations.
5. Purchases and Sales of Investments.
Purchases and sales of securities, other than short-term securities and in-kind transactions, aggregated $2,445,746 and $2,483,783, respectively.
Redemptions In-Kind. During the period, 1,487 shares of the Fund held by an unaffiliated entity were redeemed in-kind for cash and investments with a value of $55,670. The net realized gain of $10,064 on investments delivered through the in-kind redemption is included in the accompanying Statement of Operations. The amount of in-kind redemptions is included in share transactions in the accompanying Statement of Changes in Net Assets as well as Note 11: Share Transactions. The Fund recognized no gain or loss for federal income tax purposes.
6. Fees and Other Transactions with Affiliates.
Management Fee. Fidelity Management & Research Company (the investment adviser) and its affiliates provide the Fund with investment management related services for which the Fund pays a monthly management fee. The management fee is the sum of an individual fund fee rate that is based on an annual rate of .424% of the Fund's average net assets and an annualized group fee rate that averaged .25% during the period. The group fee rate is based upon the average net assets of all the mutual funds advised by the investment adviser, including any mutual funds previously advised by the investment adviser that are currently advised by Fidelity SelectCo, LLC, an affiliate of the investment adviser. The group fee rate decreases as assets under management increase and increases as assets under management decrease. In addition, the management fee is subject to a performance adjustment (up to a maximum of +/- .20% of the Fund's average net assets over a 36 month performance period). The upward or downward adjustment to the management fee is based on the relative investment performance of International Discovery as compared to its benchmark index, the MSCI EAFE Index, over the same 36 month performance period. For the reporting period, the total annualized management fee rate, including the performance adjustment, was .81% of the Fund's average net assets. The performance adjustment included in the management fee rate may be higher or lower than the maximum performance adjustment rate due to the difference between the average net assets for the reporting and performance periods.
Distribution and Service Plan Fees. In accordance with Rule 12b-1 of the 1940 Act, the Fund has adopted separate Distribution and Service Plans for each class of shares. Certain classes pay Fidelity Distributors Corporation (FDC), an affiliate of the investment adviser, separate Distribution and Service Fees, each of which is based on an annual percentage of each class' average net assets. In addition, FDC may pay financial intermediaries for selling shares of the Fund and providing shareholder support services. For the period, the Distribution and Service Fee rates, total fees and amounts retained by FDC were as follows:
| Distribution Fee | Service Fee | Total Fees | Retained by FDC | |
| Class A | -% | .25% | $331 | $– |
| Class T | .25% | .25% | 99 | – |
| Class B | .75% | .25% | 9 | 7 |
| Class C | .75% | .25% | 161 | 15 |
| $600 | $22 |
Sales Load. FDC may receive a front-end sales charge of up to 5.75% for selling Class A shares and 3.50% for selling Class T shares, some of which is paid to financial intermediaries for selling shares of the Fund. Depending on the holding period, FDC may receive contingent deferred sales charges levied on Class A, Class T, Class B, and Class C redemptions. The deferred sales charges range from 5.00% to 1.00% for Class B shares, 1.00% for Class C shares, 1.00% for certain purchases of Class A shares and .25% for certain purchases of Class T shares.
For the period, sales charge amounts retained by FDC were as follows:
| Retained by FDC | |
| Class A | $32 |
| Class T | 3 |
| Class B(a) | –(b) |
| Class C(a) | 1 |
| $36 |
(a) When Class B and Class C shares are initially sold, FDC pays commissions from its own resources to financial intermediaries through which the sales are made.
(b) In the amount of less than five hundred dollars.
Transfer Agent Fees. Fidelity Investments Institutional Operations Company, Inc., (FIIOC), an affiliate of the investment adviser, is the transfer, dividend disbursing and shareholder servicing agent for each class of the Fund. FIIOC receives account fees and asset-based fees that vary according to the account size and type of account of the shareholders of the respective classes of the Fund, except for Class K and Class Z. FIIOC receives an asset-based fee of Class K's and Class Z's average net assets. FIIOC pays for typesetting, printing and mailing of shareholder reports, except proxy statements.
For the period, transfer agent fees for each class were as follows:
| Amount | % of Class-Level Average Net Assets(a) | |
| Class A | $369 | .28 |
| Class T | 53 | .27 |
| Class B | 3 | .30 |
| Class C | 45 | .28 |
| International Discovery | 6,165 | .18 |
| Class K | 508 | .05 |
| Class I | 851 | .19 |
| Class Z | 7 | .05 |
| $8,001 |
(a) Annualized
Accounting and Security Lending Fees. Fidelity Service Company, Inc. (FSC), an affiliate of the investment adviser, maintains the Fund's accounting records. The accounting fee is based on the level of average net assets for each month. Under a separate contract, FSC administers the security lending program. The security lending fee is based on the number and duration of lending transactions.
Brokerage Commissions. The Fund placed a portion of its portfolio transactions with brokerage firms which are affiliates of the investment adviser. Brokerage commissions are included in net realized gain (loss) and change in net unrealized appreciation (depreciation) in the Statement of Operations. The commissions paid to these affiliated firms were $6 for the period.
Interfund Trades. The Fund may purchase from or sell securities to other Fidelity Funds under procedures adopted by the Board. The procedures have been designed to ensure these interfund trades are executed in accordance with Rule 17a-7 of the 1940 Act. Interfund trades are included within the respective purchases and sales amounts shown in the Purchases and Sales of Investments note.
7. Committed Line of Credit.
The Fund participates with other funds managed by the investment adviser or an affiliate in a $4.25 billion credit facility (the "line of credit") to be utilized for temporary or emergency purposes to fund shareholder redemptions or for other short-term liquidity purposes. The Fund has agreed to pay commitment fees on its pro-rata portion of the line of credit, which amounted to $9 and is reflected in Miscellaneous expenses on the Statement of Operations. During the period, the Fund did not borrow on this line of credit.
8. Security Lending.
The Fund lends portfolio securities through a lending agent from time to time in order to earn additional income. For equity securities, a lending agent is used and may loan securities to certain qualified borrowers, including Fidelity Capital Markets (FCM), a broker-dealer affiliated with the Fund. On the settlement date of the loan, the Fund receives collateral (in the form of U.S. Treasury obligations, letters of credit and/or cash) against the loaned securities and maintains collateral in an amount not less than 100% of the market value of the loaned securities during the period of the loan. The market value of the loaned securities is determined at the close of business of the Fund and any additional required collateral is delivered to the Fund on the next business day. The Fund or borrower may terminate the loan at any time, and if the borrower defaults on its obligation to return the securities loaned because of insolvency or other reasons, the Fund may apply collateral received from the borrower against the obligation. The Fund may experience delays and costs in recovering the securities loaned. Any cash collateral received is invested in the Fidelity Securities Lending Cash Central Fund. The value of loaned securities and cash collateral at period end are disclosed on the Fund's Statement of Assets and Liabilities. The value of securities loaned to FCM at period end was $75. Security lending income represents the income earned on investing cash collateral, less rebates paid to borrowers and any lending agent fees associated with the loan, plus any premium payments received for lending certain types of securities. Security lending income is presented in the Statement of Operations as a component of income from Fidelity Central Funds. Total security lending income during the period amounted to $2,593, including $5 from securities loaned to FCM.
9. Expense Reductions.
Commissions paid to certain brokers with whom the investment adviser, or its affiliates, places trades on behalf of the Fund include an amount in addition to trade execution, which may be rebated back to the Fund to offset certain expenses. This amount totaled $74 for the period.
In addition, during the period the investment adviser reimbursed and/or waived a portion of fund-level operating expenses in the amount of $39.
10. Distributions to Shareholders.
Distributions to shareholders of each class were as follows:
| Six months ended April 30, 2016 | Year ended October 31, 2015 | |
| From net investment income | ||
| Class A | $1,912 | $864 |
| Class T | 184 | 23 |
| International Discovery | 73,519 | 49,040 |
| Class K | 26,239 | 19,835 |
| Class I | 11,205 | 4,544 |
| Class Z | 375 | 283 |
| Total | $113,434 | $74,589 |
| From net realized gain | ||
| Class A | $36 | $– |
| Class T | 5 | – |
| International Discovery | 899 | – |
| Class K | 284 | – |
| Class I | 134 | – |
| Class Z | 4 | – |
| Total | $1,362 | $– |
11. Share Transactions.
Share transactions for each class were as follows and may contain automatic conversions between classes or exchanges between affiliated funds:
| Shares | Shares | Dollars | Dollars | |
| Six months ended April 30, 2016 | Year ended October 31, 2015 | Six months ended April 30, 2016 | Year ended October 31, 2015 | |
| Class A | ||||
| Shares sold | 543 | 1,331 | $20,433 | $53,289 |
| Reinvestment of distributions | 48 | 22 | 1,922 | 843 |
| Shares redeemed | (784) | (1,915) | (29,432) | (76,178) |
| Net increase (decrease) | (193) | (562) | $(7,077) | $(22,046) |
| Class T | ||||
| Shares sold | 76 | 178 | $2,881 | $7,105 |
| Reinvestment of distributions | 5 | 1 | 183 | 23 |
| Shares redeemed | (140) | (355) | (5,252) | (13,954) |
| Net increase (decrease) | (59) | (176) | $(2,188) | $(6,826) |
| Class B | ||||
| Shares sold | – | 1 | $15 | $53 |
| Shares redeemed | (20) | (64) | (758) | (2,536) |
| Net increase (decrease) | (20) | (63) | $(743) | $(2,483) |
| Class C | ||||
| Shares sold | 159 | 201 | $5,952 | $7,918 |
| Shares redeemed | (92) | (314) | (3,380) | (12,486) |
| Net increase (decrease) | 67 | (113) | $2,572 | $(4,568) |
| International Discovery | ||||
| Shares sold | 9,886 | 20,827 | $372,799 | $832,233 |
| Reinvestment of distributions | 1,781 | 1,199 | 70,961 | 46,913 |
| Shares redeemed | (12,452) | (33,573) | (467,188) | (1,345,593) |
| Net increase (decrease) | (785) | (11,547) | $(23,428) | $(466,447) |
| Class K | ||||
| Shares sold | 7,943 | 15,372 | $296,942 | $613,737 |
| Reinvestment of distributions | 667 | 508 | 26,523 | 19,835 |
| Shares redeemed | (9,474)(a) | (21,494)(b) | (358,588)(a) | (860,632)(b) |
| Net increase (decrease) | (864) | (5,614) | $(35,123) | $(227,060) |
| Class I | ||||
| Shares sold | 6,739 | 15,392 | $253,947 | $602,134 |
| Reinvestment of distributions | 52 | 33 | 2,069 | 1,286 |
| Shares redeemed | (12,681) | (5,606) | (454,709) | (221,504) |
| Net increase (decrease) | (5,890) | 9,819 | $(198,693) | $381,916 |
| Class Z | ||||
| Shares sold | 202 | 402 | $7,794 | $16,312 |
| Reinvestment of distributions | 10 | 7 | 379 | 283 |
| Shares redeemed | (144) | (559) | (5,499) | (22,228) |
| Net increase (decrease) | 68 | (150) | $2,674 | $(5,633) |
(a) Amount includes in-kind redemptions (see Note 5: Redemptions In-Kind).
(b) Amount includes in-kind redemptions.
12. Other.
The Fund's organizational documents provide former and current trustees and officers with a limited indemnification against liabilities arising in connection with the performance of their duties to the Fund. In the normal course of business, the Fund may also enter into contracts that provide general indemnifications. The Fund's maximum exposure under these arrangements is unknown as this would be dependent on future claims that may be made against the Fund. The risk of material loss from such claims is considered remote.
At the end of the period, Strategic Advisers International Fund was the owner of record of approximately 13% of the total outstanding shares of the Fund. Mutual funds managed by the investment adviser or its affiliates were the owners of record, in the aggregate, of approximately 20% of the total outstanding shares of the Fund.
Shareholder Expense Example
As a shareholder of the Fund, you incur two types of costs: (1) transaction costs, including sales charges (loads) on purchase payments or redemption proceeds, redemption fees and (2) ongoing costs, including management fees, distribution and/or service (12b-1) fees and other Fund expenses. This Example is intended to help you understand your ongoing costs (in dollars) of investing in the Fund and to compare these costs with the ongoing costs of investing in other mutual funds.
The Example is based on an investment of $1,000 invested at the beginning of the period and held for the entire period (November 1, 2015 to April 30, 2016).
Actual Expenses
The first line of the accompanying table for each class of the Fund provides information about actual account values and actual expenses. You may use the information in this line, together with the amount you invested, to estimate the expenses that you paid over the period. Simply divide your account value by $1,000.00 (for example, an $8,600 account value divided by $1,000.00 = 8.6), then multiply the result by the number in the first line for a class of the Fund under the heading entitled "Expenses Paid During Period" to estimate the expenses you paid on your account during this period. A small balance maintenance fee of $12.00 that is charged once a year may apply for certain accounts with a value of less than $2,000. This fee is not included in the table below. If it was, the estimate of expenses you paid during the period would be higher, and your ending account value lower, by this amount. In addition, the Fund, as a shareholder in the underlying Fidelity Central Funds, will indirectly bear its pro-rata share of the fees and expenses incurred by the underlying Fidelity Central Funds. These fees and expenses are not included in the Fund's annualized expense ratio used to calculate the expense estimate in the table below.
Hypothetical Example for Comparison Purposes
The second line of the accompanying table for each class of the Fund provides information about hypothetical account values and hypothetical expenses based on a Class' actual expense ratio and an assumed rate of return of 5% per year before expenses, which is not the Class' actual return. The hypothetical account values and expenses may not be used to estimate the actual ending account balance or expenses you paid for the period. You may use this information to compare the ongoing costs of investing in the Fund and other funds. To do so, compare this 5% hypothetical example with the 5% hypothetical examples that appear in the shareholder reports of the other funds. A small balance maintenance fee of $12.00 that is charged once a year may apply for certain accounts with a value of less than $2,000. This fee is not included in the table below. If it was, the estimate of expenses you paid during the period would be higher, and your ending account value lower, by this amount. In addition, the Fund, as a shareholder in the underlying Fidelity Central Funds, will indirectly bear its pro-rata share of the fees and expenses incurred by the underlying Fidelity Central Funds. These fees and expenses are not included in the Fund's annualized expense ratio used to calculate the expense estimate in the table below.
Please note that the expenses shown in the table are meant to highlight your ongoing costs only and do not reflect any transaction costs. Therefore, the second line of the table is useful in comparing ongoing costs only, and will not help you determine the relative total costs of owning different funds. In addition, if these transactional costs were included, your costs would have been higher.
| Annualized Expense Ratio-A | Beginning Account Value November 1, 2015 | Ending Account Value April 30, 2016 | Expenses Paid During Period-B November 1, 2015 to April 30, 2016 | |
| Class A | 1.37% | |||
| Actual | $1,000.00 | $955.30 | $6.66 | |
| Hypothetical-C | $1,000.00 | $1,018.05 | $6.87 | |
| Class T | 1.61% | |||
| Actual | $1,000.00 | $954.10 | $7.82 | |
| Hypothetical-C | $1,000.00 | $1,016.86 | $8.07 | |
| Class B | 2.14% | |||
| Actual | $1,000.00 | $951.50 | $10.38 | |
| Hypothetical-C | $1,000.00 | $1,014.22 | $10.72 | |
| Class C | 2.12% | |||
| Actual | $1,000.00 | $951.70 | $10.29 | |
| Hypothetical-C | $1,000.00 | $1,014.32 | $10.62 | |
| International Discovery | 1.02% | |||
| Actual | $1,000.00 | $956.70 | $4.96 | |
| Hypothetical-C | $1,000.00 | $1,019.79 | $5.12 | |
| Class K | .89% | |||
| Actual | $1,000.00 | $957.50 | $4.33 | |
| Hypothetical-C | $1,000.00 | $1,020.44 | $4.47 | |
| Class I | 1.03% | |||
| Actual | $1,000.00 | $956.90 | $5.01 | |
| Hypothetical-C | $1,000.00 | $1,019.74 | $5.17 | |
| Class Z | .89% | |||
| Actual | $1,000.00 | $957.60 | $4.33 | |
| Hypothetical-C | $1,000.00 | $1,020.44 | $4.47 |
A Annualized expense ratio reflects expenses net of applicable fee waivers.
B Expenses are equal to each Class' annualized expense ratio, multiplied by the average account value over the period, multiplied by 182/366 (to reflect the one-half year period).
C 5% return per year before expenses
![]()
AID-SANN-0616
1.806665.111
Fidelity® International Discovery Fund Semi-Annual Report April 30, 2016 |
|
Contents
To view a fund's proxy voting guidelines and proxy voting record for the 12-month period ended June 30, visit http://www.fidelity.com/proxyvotingresults or visit the Securities and Exchange Commission's (SEC) web site at http://www.sec.gov.
You may also call 1-800-544-8544 to request a free copy of the proxy voting guidelines.
Standard & Poor's, S&P and S&P 500 are registered service marks of The McGraw-Hill Companies, Inc. and have been licensed for use by Fidelity Distributors Corporation.
Other third-party marks appearing herein are the property of their respective owners.
All other marks appearing herein are registered or unregistered trademarks or service marks of FMR LLC or an affiliated company. © 2016 FMR LLC. All rights reserved.
This report and the financial statements contained herein are submitted for the general information of the shareholders of the Fund. This report is not authorized for distribution to prospective investors in the Fund unless preceded or accompanied by an effective prospectus.
A fund files its complete schedule of portfolio holdings with the SEC for the first and third quarters of each fiscal year on Form N-Q. Forms N-Q are available on the SEC’s web site at http://www.sec.gov. A fund's Forms N-Q may be reviewed and copied at the SEC’s Public Reference Room in Washington, DC. Information regarding the operation of the SEC's Public Reference Room may be obtained by calling 1-800-SEC-0330.
For a complete list of a fund's portfolio holdings, view the most recent holdings listing, semiannual report, or annual report on Fidelity's web site at http://www.fidelity.com, http://www.advisor.fidelity.com, or http://www.401k.com, as applicable.
NOT FDIC INSURED •MAY LOSE VALUE •NO BANK GUARANTEE
Neither the Fund nor Fidelity Distributors Corporation is a bank.
Investment Summary (Unaudited)
Geographic Diversification (% of fund's net assets)
| As of April 30, 2016 | ||
| Japan | 17.3% | |
| United Kingdom | 14.5% | |
| France | 9.6% | |
| Germany | 8.0% | |
| United States of America* | 5.8% | |
| Switzerland | 4.3% | |
| Sweden | 4.1% | |
| Hong Kong | 3.3% | |
| Netherlands | 3.3% | |
| Other | 29.8% | |

* Includes Short-Term investments and Net Other Assets (Liabilities).
Percentages are based on country or territory of incorporation and are adjusted for the effect of futures contracts, if applicable.
| As of October 31, 2015 | ||
| United Kingdom | 19.1% | |
| Japan | 15.9% | |
| France | 9.6% | |
| United States of America* | 7.3% | |
| Germany | 5.5% | |
| Switzerland | 5.1% | |
| Netherlands | 4.0% | |
| Sweden | 3.1% | |
| Hong Kong | 3.0% | |
| Other | 27.4% | |

* Includes Short-Term investments and Net Other Assets (Liabilities).
Percentages are based on country or territory of incorporation and are adjusted for the effect of futures contracts, if applicable.
Asset Allocation as of April 30, 2016
| % of fund's net assets | % of fund's net assets 6 months ago | |
| Stocks and Equity Futures | 99.1 | 97.5 |
| Other Investments | 0.0 | 0.1 |
| Short-Term Investments and Net Other Assets (Liabilities) | 0.9 | 2.4 |
Top Ten Stocks as of April 30, 2016
| % of fund's net assets | % of fund's net assets 6 months ago | |
| Total SA (France, Oil, Gas & Consumable Fuels) | 2.2 | 2.0 |
| Unilever NV (Certificaten Van Aandelen) (Bearer) (Netherlands, Personal Products) | 1.7 | 1.6 |
| Statoil ASA (Norway, Oil, Gas & Consumable Fuels) | 1.6 | 0.0 |
| Anheuser-Busch InBev SA NV (Belgium, Beverages) | 1.5 | 1.4 |
| AIA Group Ltd. (Hong Kong, Insurance) | 1.5 | 1.3 |
| ORIX Corp. (Japan, Diversified Financial Services) | 1.4 | 0.9 |
| Techtronic Industries Co. Ltd. (Hong Kong, Household Durables) | 1.4 | 1.3 |
| VINCI SA (France, Construction & Engineering) | 1.4 | 0.9 |
| KDDI Corp. (Japan, Wireless Telecommunication Services) | 1.4 | 1.1 |
| Novo Nordisk A/S Series B (Denmark, Pharmaceuticals) | 1.3 | 1.2 |
| 15.4 |
Market Sectors as of April 30, 2016
| % of fund's net assets | % of fund's net assets 6 months ago | |
| Financials | 21.6 | 24.2 |
| Consumer Discretionary | 15.3 | 17.4 |
| Consumer Staples | 13.2 | 11.9 |
| Health Care | 12.5 | 12.8 |
| Industrials | 10.7 | 10.5 |
| Information Technology | 10.0 | 7.5 |
| Energy | 5.0 | 4.3 |
| Telecommunication Services | 4.8 | 4.9 |
| Materials | 3.6 | 2.3 |
| Utilities | 0.6 | 0.0 |
Percentages shown as 0.0% may reflect amounts less than 0.05%.
Investments April 30, 2016 (Unaudited)
Showing Percentage of Net Assets
| Common Stocks - 97.1% | |||
| Shares | Value (000s) | ||
| Australia - 2.5% | |||
| 1-Page Ltd. (a)(b) | 2,531,460 | $1,857 | |
| Ansell Ltd. (a) | 1,588,251 | 24,068 | |
| Australia & New Zealand Banking Group Ltd. | 2,945,060 | 53,983 | |
| Burson Group Ltd. | 7,454,296 | 28,226 | |
| Magellan Financial Group Ltd. | 1,204,177 | 19,685 | |
| Mantra Group Ltd. | 7,793,893 | 21,927 | |
| Ramsay Health Care Ltd. | 1,164,235 | 57,495 | |
| Spark Infrastructure Group unit | 31,636,214 | 49,793 | |
| TOTAL AUSTRALIA | 257,034 | ||
| Austria - 0.5% | |||
| Andritz AG | 444,500 | 24,894 | |
| Erste Group Bank AG | 995,900 | 28,646 | |
| TOTAL AUSTRIA | 53,540 | ||
| Bailiwick of Jersey - 1.2% | |||
| Integrated Diagnostics Holdings PLC | 4,932,400 | 22,936 | |
| Randgold Resources Ltd. sponsored ADR | 241,314 | 24,252 | |
| Regus PLC | 11,055,488 | 47,233 | |
| Wolseley PLC | 514,260 | 28,805 | |
| TOTAL BAILIWICK OF JERSEY | 123,226 | ||
| Belgium - 2.0% | |||
| Anheuser-Busch InBev SA NV | 1,203,427 | 148,960 | |
| KBC Groep NV | 857,319 | 48,131 | |
| TOTAL BELGIUM | 197,091 | ||
| Bermuda - 0.3% | |||
| PAX Global Technology Ltd. | 29,071,000 | 25,037 | |
| Canada - 2.2% | |||
| Alimentation Couche-Tard, Inc. Class B (sub. vtg.) | 781,500 | 34,257 | |
| Cenovus Energy, Inc. | 2,806,100 | 44,483 | |
| Constellation Software, Inc. | 156,500 | 61,161 | |
| Franco-Nevada Corp. | 297,300 | 20,859 | |
| PrairieSky Royalty Ltd. (b) | 1,734,473 | 36,522 | |
| Suncor Energy, Inc. | 676,200 | 19,849 | |
| TOTAL CANADA | 217,131 | ||
| Cayman Islands - 0.9% | |||
| Alibaba Group Holding Ltd. sponsored ADR (a) | 453,700 | 34,908 | |
| Ctrip.com International Ltd. ADR (a) | 294,500 | 12,843 | |
| Lee's Pharmaceutical Holdings Ltd. | 6,734,664 | 5,449 | |
| New Oriental Education & Technology Group, Inc. sponsored ADR | 830,000 | 32,503 | |
| TOTAL CAYMAN ISLANDS | 85,703 | ||
| China - 0.6% | |||
| Jiangsu Hengrui Medicine Co. Ltd. | 4,183,623 | 30,165 | |
| Kweichow Moutai Co. Ltd. | 663,582 | 25,748 | |
| TOTAL CHINA | 55,913 | ||
| Cyprus - 0.0% | |||
| SPDI Secure Property Development & Investment PLC (a) | 517,230 | 129 | |
| Denmark - 1.3% | |||
| Novo Nordisk A/S Series B | 2,371,645 | 132,419 | |
| Finland - 0.7% | |||
| Sampo Oyj (A Shares) | 1,653,500 | 72,193 | |
| France - 9.6% | |||
| Accor SA (b) | 1,684,918 | 74,636 | |
| ALTEN | 608,659 | 37,635 | |
| Altran Technologies SA | 2,384,000 | 35,365 | |
| Amundi SA | 516,400 | 23,765 | |
| Atos Origin SA | 444,123 | 39,530 | |
| AXA SA (b) | 4,402,300 | 111,156 | |
| Capgemini SA | 855,800 | 79,894 | |
| Cegedim SA (a) | 536,390 | 14,728 | |
| Havas SA | 4,815,644 | 40,297 | |
| Sanofi SA | 467,356 | 38,523 | |
| Sodexo SA | 431,200 | 43,543 | |
| SR Teleperformance SA | 290,100 | 26,043 | |
| Total SA | 4,385,111 | 221,630 | |
| Unibail-Rodamco | 156,500 | 41,933 | |
| VINCI SA (b) | 1,924,900 | 143,796 | |
| TOTAL FRANCE | 972,474 | ||
| Germany - 8.0% | |||
| Axel Springer Verlag AG | 625,002 | 34,896 | |
| Bayer AG | 345,100 | 39,812 | |
| Beiersdorf AG | 242,900 | 21,794 | |
| Continental AG | 297,600 | 65,359 | |
| Deutsche Boerse AG | 526,494 | 43,219 | |
| Deutsche Telekom AG | 3,241,500 | 56,899 | |
| Fresenius SE & Co. KGaA | 468,700 | 34,090 | |
| GEA Group AG | 878,941 | 40,750 | |
| KION Group AG | 1,369,149 | 74,593 | |
| LEG Immobilien AG | 314,266 | 29,080 | |
| Nexus AG | 614,500 | 10,766 | |
| ProSiebenSat.1 Media AG | 1,170,000 | 59,644 | |
| Rational AG | 104,405 | 53,002 | |
| SAP AG | 1,390,594 | 109,107 | |
| Siemens AG | 685,498 | 71,736 | |
| Symrise AG | 637,700 | 42,249 | |
| United Internet AG | 430,714 | 21,027 | |
| TOTAL GERMANY | 808,023 | ||
| Hong Kong - 3.3% | |||
| AIA Group Ltd. | 24,704,000 | 147,844 | |
| China Resources Beer Holdings Co. Ltd. | 16,944,000 | 37,233 | |
| Techtronic Industries Co. Ltd. | 38,444,000 | 144,114 | |
| TOTAL HONG KONG | 329,191 | ||
| India - 2.6% | |||
| Bharti Infratel Ltd. | 12,647,734 | 71,392 | |
| Dr Lal Pathlabs Ltd. | 798,016 | 11,835 | |
| HDFC Bank Ltd. sponsored ADR | 1,290,984 | 81,164 | |
| Housing Development Finance Corp. Ltd. | 6,148,295 | 100,746 | |
| TOTAL INDIA | 265,137 | ||
| Ireland - 2.7% | |||
| Cairn Homes PLC (a) | 17,549,270 | 22,506 | |
| CRH PLC | 1,051,000 | 30,587 | |
| Dalata Hotel Group PLC (a) | 5,686,103 | 28,706 | |
| Green REIT PLC | 9,492,200 | 15,673 | |
| Irish Continental Group PLC unit | 101,800 | 600 | |
| James Hardie Industries PLC CDI | 1,482,921 | 20,893 | |
| Kerry Group PLC Class A | 983,700 | 87,712 | |
| Ryanair Holdings PLC sponsored ADR | 809,300 | 65,513 | |
| TOTAL IRELAND | 272,190 | ||
| Isle of Man - 0.8% | |||
| Optimal Payments PLC (a) | 11,752,725 | 65,462 | |
| Playtech Ltd. | 1,386,935 | 16,303 | |
| TOTAL ISLE OF MAN | 81,765 | ||
| Israel - 1.9% | |||
| Frutarom Industries Ltd. | 1,032,000 | 52,892 | |
| Partner Communications Co. Ltd. (a) | 2,268,862 | 11,804 | |
| Teva Pharmaceutical Industries Ltd. sponsored ADR | 2,291,300 | 124,761 | |
| TOTAL ISRAEL | 189,457 | ||
| Italy - 1.6% | |||
| De Longhi SpA | 1,669,626 | 38,446 | |
| Intesa Sanpaolo SpA | 30,697,900 | 85,334 | |
| Mediaset SpA | 3,440,200 | 15,481 | |
| Telecom Italia SpA (a) | 25,339,200 | 24,743 | |
| TOTAL ITALY | 164,004 | ||
| Japan - 17.3% | |||
| ACOM Co. Ltd. (a) | 3,246,300 | 16,935 | |
| Aozora Bank Ltd. | 9,464,000 | 33,578 | |
| Asahi Group Holdings | 1,066,900 | 33,860 | |
| Astellas Pharma, Inc. | 6,953,700 | 93,754 | |
| Casio Computer Co. Ltd. (b) | 2,015,200 | 38,343 | |
| Daito Trust Construction Co. Ltd. | 209,500 | 29,630 | |
| Dentsu, Inc. | 1,274,300 | 64,746 | |
| Don Quijote Holdings Co. Ltd. | 1,338,100 | 47,604 | |
| Hoya Corp. | 1,793,800 | 68,692 | |
| Japan Exchange Group, Inc. | 1,920,700 | 28,605 | |
| Japan Tobacco, Inc. | 2,318,600 | 94,733 | |
| KDDI Corp. | 4,728,900 | 136,219 | |
| Keyence Corp. | 95,360 | 57,158 | |
| Misumi Group, Inc. | 3,181,300 | 43,933 | |
| Mitsubishi UFJ Financial Group, Inc. | 11,142,500 | 51,421 | |
| Monex Group, Inc. | 12,207,949 | 31,493 | |
| NEC Corp. | 8,879,000 | 21,609 | |
| Nidec Corp. | 324,300 | 23,763 | |
| Nintendo Co. Ltd. | 274,100 | 37,113 | |
| Nippon Telegraph & Telephone Corp. | 904,500 | 40,477 | |
| Olympus Corp. | 3,148,400 | 122,651 | |
| ORIX Corp. | 10,231,600 | 144,725 | |
| Seven & i Holdings Co. Ltd. | 1,034,700 | 42,218 | |
| Seven Bank Ltd. | 12,039,600 | 51,159 | |
| Shinsei Bank Ltd. | 14,227,000 | 19,940 | |
| Shionogi & Co. Ltd. | 856,200 | 43,702 | |
| Sony Corp. | 3,594,500 | 87,065 | |
| Sundrug Co. Ltd. | 622,500 | 44,232 | |
| Tsuruha Holdings, Inc. | 834,000 | 79,994 | |
| United Arrows Ltd. | 991,300 | 39,833 | |
| VT Holdings Co. Ltd. | 3,872,500 | 19,566 | |
| Welcia Holdings Co. Ltd. | 1,150,800 | 60,788 | |
| TOTAL JAPAN | 1,749,539 | ||
| Luxembourg - 0.9% | |||
| Eurofins Scientific SA | 120,139 | 44,578 | |
| Grand City Properties SA | 1,528,397 | 33,759 | |
| Senvion SA | 708,900 | 12,460 | |
| TOTAL LUXEMBOURG | 90,797 | ||
| Marshall Islands - 0.1% | |||
| Hoegh LNG Partners LP (c) | 715,655 | 12,896 | |
| Netherlands - 3.3% | |||
| AerCap Holdings NV (a) | 562,900 | 22,522 | |
| IMCD Group BV | 1,926,800 | 77,794 | |
| ING Groep NV (Certificaten Van Aandelen) | 4,956,300 | 60,696 | |
| Unilever NV (Certificaten Van Aandelen) (Bearer) | 3,814,100 | 167,553 | |
| TOTAL NETHERLANDS | 328,565 | ||
| New Zealand - 0.8% | |||
| EBOS Group Ltd. | 3,154,998 | 35,160 | |
| Ryman Healthcare Group Ltd. | 7,137,434 | 44,505 | |
| TOTAL NEW ZEALAND | 79,665 | ||
| Norway - 1.6% | |||
| Statoil ASA (b) | 9,044,100 | 159,188 | |
| Philippines - 0.3% | |||
| SM Investments Corp. | 1,641,730 | 32,950 | |
| Romania - 0.2% | |||
| Banca Transilvania SA | 31,143,575 | 21,373 | |
| South Africa - 1.3% | |||
| EOH Holdings Ltd. | 2,855,067 | 27,788 | |
| Naspers Ltd. Class N | 720,500 | 98,860 | |
| TOTAL SOUTH AFRICA | 126,648 | ||
| Spain - 2.5% | |||
| Amadeus IT Holding SA Class A | 1,717,100 | 78,135 | |
| Atresmedia Corporacion de Medios de Comunicacion SA | 1,719,200 | 22,383 | |
| Hispania Activos Inmobiliarios SA (a) | 1,085,200 | 15,905 | |
| Inditex SA | 2,288,877 | 73,476 | |
| Mediaset Espana Comunicacion SA | 2,931,000 | 38,059 | |
| Merlin Properties Socimi SA | 2,483,100 | 28,859 | |
| TOTAL SPAIN | 256,817 | ||
| Sweden - 4.1% | |||
| ASSA ABLOY AB (B Shares) | 3,682,800 | 77,229 | |
| Getinge AB (B Shares) | 2,461,330 | 52,044 | |
| HEXPOL AB (B Shares) (b) | 2,967,500 | 30,671 | |
| Indutrade AB (b) | 201,100 | 11,276 | |
| Nordea Bank AB | 5,749,200 | 55,806 | |
| Saab AB (B Shares) | 980,200 | 33,530 | |
| Sandvik AB (b) | 2,242,600 | 23,011 | |
| Svenska Cellulosa AB (SCA) (B Shares) | 3,034,500 | 95,564 | |
| Svenska Handelsbanken AB (A Shares) (b) | 2,567,100 | 34,246 | |
| TOTAL SWEDEN | 413,377 | ||
| Switzerland - 4.3% | |||
| GAM Holding Ltd. | 1,405,187 | 18,310 | |
| Julius Baer Group Ltd. | 949,640 | 40,698 | |
| Novartis AG | 1,375,538 | 104,682 | |
| Partners Group Holding AG | 247,326 | 101,839 | |
| Schindler Holding AG (participation certificate) | 181,273 | 33,012 | |
| Syngenta AG (Switzerland) | 175,928 | 70,423 | |
| UBS Group AG | 3,690,490 | 63,861 | |
| TOTAL SWITZERLAND | 432,825 | ||
| Taiwan - 0.1% | |||
| JHL Biotech, Inc. (a) | 4,953,560 | 13,395 | |
| United Kingdom - 14.5% | |||
| AA PLC | 3,830,868 | 15,595 | |
| Associated British Foods PLC | 772,200 | 34,571 | |
| B&M European Value Retail S.A. | 9,180,129 | 37,209 | |
| BAE Systems PLC | 4,147,100 | 28,933 | |
| BCA Marketplace PLC | 7,762,300 | 18,913 | |
| BHP Billiton PLC | 2,881,014 | 39,368 | |
| BT Group PLC | 6,133,600 | 39,758 | |
| Bunzl PLC | 2,075,300 | 61,829 | |
| Cineworld Group PLC | 2,055,200 | 15,555 | |
| CMC Markets PLC | 8,647,600 | 31,589 | |
| Compass Group PLC | 2,013,000 | 35,848 | |
| Countryside Properties PLC (a) | 3,408,200 | 11,578 | |
| Diploma PLC | 2,312,600 | 24,718 | |
| GlaxoSmithKline PLC | 3,812,600 | 81,485 | |
| Howden Joinery Group PLC | 10,913,100 | 78,772 | |
| Imperial Tobacco Group PLC | 1,848,336 | 100,425 | |
| ITV PLC | 9,444,600 | 31,078 | |
| Lloyds Banking Group PLC | 69,181,900 | 67,903 | |
| London Stock Exchange Group PLC | 473,136 | 18,756 | |
| McCarthy & Stone PLC | 4,009,500 | 13,592 | |
| Melrose Industries PLC | 1,586,476 | 8,653 | |
| Micro Focus International PLC | 3,609,242 | 80,634 | |
| Moneysupermarket.com Group PLC | 5,210,600 | 23,899 | |
| Persimmon PLC | 1,469,800 | 42,673 | |
| Reckitt Benckiser Group PLC | 900,800 | 87,755 | |
| Rex Bionics PLC (a)(c) | 1,297,286 | 692 | |
| Rio Tinto PLC | 1,185,200 | 39,759 | |
| SABMiller PLC | 719,300 | 43,985 | |
| Shawbrook Group PLC | 8,951,700 | 37,487 | |
| Softcat PLC | 1,526,900 | 7,117 | |
| Spirax-Sarco Engineering PLC | 539,500 | 26,920 | |
| St. James's Place Capital PLC | 5,394,300 | 68,336 | |
| Standard Chartered PLC (United Kingdom) | 5,296,810 | 42,729 | |
| Taylor Wimpey PLC | 11,716,900 | 31,552 | |
| Virgin Money Holdings Uk PLC | 5,874,500 | 31,338 | |
| Vodafone Group PLC | 30,823,796 | 99,309 | |
| Workspace Group PLC | 649,000 | 7,918 | |
| TOTAL UNITED KINGDOM | 1,468,231 | ||
| United States of America - 3.1% | |||
| Constellation Brands, Inc. Class A (sub. vtg.) | 520,000 | 81,151 | |
| Global Payments, Inc. | 465,000 | 33,564 | |
| McGraw Hill Financial, Inc. | 462,400 | 49,407 | |
| Molson Coors Brewing Co. Class B | 121,600 | 11,629 | |
| MSCI, Inc. Class A | 586,700 | 44,554 | |
| Visa, Inc. Class A | 1,147,700 | 88,648 | |
| TOTAL UNITED STATES OF AMERICA | 308,953 | ||
| TOTAL COMMON STOCKS | |||
| (Cost $8,697,817) | 9,796,876 | ||
| Nonconvertible Preferred Stocks - 0.2% | |||
| Cayman Islands - 0.2% | |||
| China Internet Plus Holdings Ltd. Series A-11 (d) | |||
| (Cost $18,833) | 5,958,244 | 23,003 | |
| Principal Amount (000s) | Value (000s) | ||
| Government Obligations - 0.1% | |||
| United States of America - 0.1% | |||
| U.S. Treasury Bills, yield at date of purchase 0.2% to 0.33% 5/5/16 to 7/28/16 (e) | |||
| (Cost $11,655) | 11,660 | 11,657 | |
| Shares | Value (000s) | ||
| Money Market Funds - 5.1% | |||
| Fidelity Cash Central Fund, 0.38% (f) | 199,763,053 | 199,763 | |
| Fidelity Securities Lending Cash Central Fund, 0.42% (f)(g) | 311,707,412 | 311,707 | |
| TOTAL MONEY MARKET FUNDS | |||
| (Cost $511,470) | 511,470 | ||
| TOTAL INVESTMENT PORTFOLIO - 102.5% | |||
| (Cost $9,239,775) | 10,343,006 | ||
| NET OTHER ASSETS (LIABILITIES) - (2.5)% | (248,078) | ||
| NET ASSETS - 100% | $10,094,928 |
| Futures Contracts | |||
| Expiration Date | Underlying Face Amount at Value (000s) | Unrealized Appreciation/(Depreciation) (000s) | |
| Purchased | |||
| Equity Index Contracts | |||
| 2,402 CME Nikkei 225 Contracts (Japan) | June 2016 | 179,021 | $(11,598) |
The face value of futures purchased as a percentage of Net Assets is 1.8%
Categorizations in the Schedule of Investments are based on country or territory of incorporation.
Legend
(a) Non-income producing
(b) Security or a portion of the security is on loan at period end.
(c) Affiliated company
(d) Restricted securities - Investment in securities not registered under the Securities Act of 1933 (excluding 144A issues). At the end of the period, the value of restricted securities (excluding 144A issues) amounted to $23,003,000 or 0.2% of net assets.
(e) Security or a portion of the security was pledged to cover margin requirements for futures contracts. At period end, the value of securities pledged amounted to $11,657,000.
(f) Affiliated fund that is generally available only to investment companies and other accounts managed by Fidelity Investments. The rate quoted is the annualized seven-day yield of the fund at period end. A complete unaudited listing of the fund's holdings as of its most recent quarter end is available upon request. In addition, each Fidelity Central Fund's financial statements are available on the SEC's website or upon request.
(g) Investment made with cash collateral received from securities on loan.
Additional information on each restricted holding is as follows:
| Security | Acquisition Date | Acquisition Cost (000s) |
| China Internet Plus Holdings Ltd. Series A-11 | 1/26/15 | $18,833 |
Affiliated Central Funds
Information regarding fiscal year to date income earned by the Fund from investments in Fidelity Central Funds is as follows:
| Fund | Income earned |
| (Amounts in thousands) | |
| Fidelity Cash Central Fund | $545 |
| Fidelity Securities Lending Cash Central Fund | 2,593 |
| Total | $3,138 |
Other Affiliated Issuers
An affiliated company is a company in which the Fund has ownership of at least 5% of the voting securities. Fiscal year to date transactions with companies which are or were affiliates are as follows:
| Affiliate (Amounts in thousands) | Value, beginning of period | Purchases | Sales Proceeds* | Dividend Income | Value, end of period |
| Hoegh LNG Partners LP | $11,465 | $-- | $-- | $832 | $12,896 |
| Rex Bionics PLC | 976 | -- | 4 | -- | 692 |
| Total | $12,441 | $-- | $4 | $832 | $13,588 |
* Includes the value of securities delivered through in-kind transactions, if applicable.
Investment Valuation
The following is a summary of the inputs used, as of April 30, 2016, involving the Fund's assets and liabilities carried at fair value. The inputs or methodology used for valuing securities may not be an indication of the risk associated with investing in those securities. For more information on valuation inputs, and their aggregation into the levels used below, please refer to the Investment Valuation section in the accompanying Notes to Financial Statements.
| Valuation Inputs at Reporting Date: | ||||
| Description | Total | Level 1 | Level 2 | Level 3 |
| (Amounts in thousands) | ||||
| Investments in Securities: | ||||
| Equities: | ||||
| Consumer Discretionary | $1,534,838 | $1,034,716 | $477,119 | $23,003 |
| Consumer Staples | 1,334,162 | 853,349 | 480,813 | -- |
| Energy | 494,568 | 113,750 | 380,818 | -- |
| Financials | 2,185,536 | 1,236,886 | 948,650 | -- |
| Health Care | 1,265,979 | 574,622 | 691,357 | -- |
| Industrials | 1,107,038 | 909,868 | 197,170 | -- |
| Information Technology | 982,951 | 693,397 | 289,554 | -- |
| Materials | 371,953 | 262,239 | 109,714 | -- |
| Telecommunication Services | 480,601 | 83,196 | 397,405 | -- |
| Utilities | 62,253 | 62,253 | -- | -- |
| Government Obligations | 11,657 | -- | 11,657 | -- |
| Money Market Funds | 511,470 | 511,470 | -- | -- |
| Total Investments in Securities: | $10,343,006 | $6,335,746 | $3,984,257 | $23,003 |
| Derivative Instruments: | ||||
| Liabilities | ||||
| Futures Contracts | $(11,598) | $(11,598) | $-- | $-- |
| Total Liabilities | $(11,598) | $(11,598) | $-- | $-- |
| Total Derivative Instruments: | $(11,598) | $(11,598) | $-- | $-- |
The following is a summary of transfers between Level 1 and Level 2 for the period ended April 30, 2016. Transfers are assumed to have occurred at the beginning of the period, and are primarily attributable to the valuation techniques used for foreign equity securities, as discussed in the accompanying Notes to Financial Statements:
| Transfers | Total (000s) |
| Level 1 to Level 2 | $123,459 |
| Level 2 to Level 1 | $733,107 |
Value of Derivative Instruments
The following table is a summary of the Fund's value of derivative instruments by primary risk exposure as of April 30, 2016. For additional information on derivative instruments, please refer to the Derivative Instruments section in the accompanying Notes to Financial Statements.
| Primary Risk Exposure / Derivative Type | Value (000s) | |
| Asset | Liability | |
| Equity Risk | ||
| Futures Contracts(a) | $0 | $(11,598) |
| Total Equity Risk | 0 | (11,598) |
| Total Value of Derivatives | $0 | $(11,598) |
(a) Reflects gross cumulative appreciation (depreciation) on futures contracts as presented in the Schedule of Investments. In the Statement of Assets and Liabilities, the period end daily variation margin is included in receivable or payable for daily variation margin for derivative instruments, and the net cumulative appreciation (depreciation) is included in net unrealized appreciation (depreciation).
See accompanying notes which are an integral part of the financial statements.
Financial Statements
Statement of Assets and Liabilities
| Amounts in thousands (except per-share amounts) | April 30, 2016 (Unaudited) | |
| Assets | ||
| Investment in securities, at value (including securities loaned of $292,726) — See accompanying schedule: Unaffiliated issuers (cost $8,709,825) | $9,817,948 | |
| Fidelity Central Funds (cost $511,470) | 511,470 | |
| Other affiliated issuers (cost $18,480) | 13,588 | |
| Total Investments (cost $9,239,775) | $10,343,006 | |
| Foreign currency held at value (cost $3,534) | 3,534 | |
| Receivable for investments sold | 83,114 | |
| Receivable for fund shares sold | 9,626 | |
| Dividends receivable | 48,955 | |
| Distributions receivable from Fidelity Central Funds | 957 | |
| Prepaid expenses | 9 | |
| Other receivables | 4,089 | |
| Total assets | 10,493,290 | |
| Liabilities | ||
| Payable to custodian bank | $705 | |
| Payable for investments purchased | 56,857 | |
| Payable for fund shares redeemed | 16,003 | |
| Accrued management fee | 6,281 | |
| Distribution and service plan fees payable | 100 | |
| Payable for daily variation margin for derivative instruments | 4,684 | |
| Other affiliated payables | 1,444 | |
| Other payables and accrued expenses | 581 | |
| Collateral on securities loaned, at value | 311,707 | |
| Total liabilities | 398,362 | |
| Net Assets | $10,094,928 | |
| Net Assets consist of: | ||
| Paid in capital | $9,352,158 | |
| Undistributed net investment income | 88,416 | |
| Accumulated undistributed net realized gain (loss) on investments and foreign currency transactions | (436,449) | |
| Net unrealized appreciation (depreciation) on investments and assets and liabilities in foreign currencies | 1,090,803 | |
| Net Assets | $10,094,928 | |
| Calculation of Maximum Offering Price | ||
| Class A: | ||
| Net Asset Value and redemption price per share ($260,942.4 ÷ 6,913.487 shares) | $37.74 | |
| Maximum offering price per share (100/94.25 of $37.74) | $40.04 | |
| Class T: | ||
| Net Asset Value and redemption price per share ($38,584.3 ÷ 1,028.093 shares) | $37.53 | |
| Maximum offering price per share (100/96.50 of $37.53) | $38.89 | |
| Class B: | ||
| Net Asset Value and offering price per share ($1,398.6 ÷ 37.492 shares)(a) | $37.30 | |
| Class C: | ||
| Net Asset Value and offering price per share ($32,708.8 ÷ 878.178 shares)(a) | $37.25 | |
| International Discovery: | ||
| Net Asset Value, offering price and redemption price per share ($6,797,488.8 ÷ 178,912.550 shares) | $37.99 | |
| Class K: | ||
| Net Asset Value, offering price and redemption price per share ($2,151,531.2 ÷ 56,751.079 shares) | $37.91 | |
| Class I: | ||
| Net Asset Value, offering price and redemption price per share ($781,184.7 ÷ 20,610.933 shares) | $37.90 | |
| Class Z: | ||
| Net Asset Value, offering price and redemption price per share ($31,088.8 ÷ 820.463 shares) | $37.89 |
(a) Redemption price per share is equal to net asset value less any applicable contingent deferred sales charge.
See accompanying notes which are an integral part of the financial statements.
Statement of Operations
| Amounts in thousands | Six months ended April 30, 2016 (Unaudited) | |
| Investment Income | ||
| Dividends (including $832 earned from other affiliated issuers) | $115,061 | |
| Special dividends | 37,704 | |
| Interest | 30 | |
| Income from Fidelity Central Funds | 3,138 | |
| Income before foreign taxes withheld | 155,933 | |
| Less foreign taxes withheld | (11,075) | |
| Total income | 144,858 | |
| Expenses | ||
| Management fee | ||
| Basic fee | $34,526 | |
| Performance adjustment | 6,890 | |
| Transfer agent fees | 8,001 | |
| Distribution and service plan fees | 600 | |
| Accounting and security lending fees | 905 | |
| Custodian fees and expenses | 660 | |
| Independent trustees' compensation | 23 | |
| Registration fees | 158 | |
| Audit | 78 | |
| Legal | 14 | |
| Miscellaneous | 35 | |
| Total expenses before reductions | 51,890 | |
| Expense reductions | (113) | 51,777 |
| Net investment income (loss) | 93,081 | |
| Realized and Unrealized Gain (Loss) | ||
| Net realized gain (loss) on: | ||
| Investment securities: | ||
| Unaffiliated issuers | (355,764) | |
| Other affiliated issuers | (19) | |
| Foreign currency transactions | 4,399 | |
| Futures contracts | (10,549) | |
| Total net realized gain (loss) | (361,933) | |
| Change in net unrealized appreciation (depreciation) on: Investment securities | (204,729) | |
| Assets and liabilities in foreign currencies | (1,103) | |
| Futures contracts | (20,801) | |
| Total change in net unrealized appreciation (depreciation) | (226,633) | |
| Net gain (loss) | (588,566) | |
| Net increase (decrease) in net assets resulting from operations | $(495,485) |
See accompanying notes which are an integral part of the financial statements.
Statement of Changes in Net Assets
| Amounts in thousands | Six months ended April 30, 2016 (Unaudited) | Year ended October 31, 2015 |
| Increase (Decrease) in Net Assets | ||
| Operations | ||
| Net investment income (loss) | $93,081 | $149,838 |
| Net realized gain (loss) | (361,933) | 245,770 |
| Change in net unrealized appreciation (depreciation) | (226,633) | 655 |
| Net increase (decrease) in net assets resulting from operations | (495,485) | 396,263 |
| Distributions to shareholders from net investment income | (113,434) | (74,589) |
| Distributions to shareholders from net realized gain | (1,362) | – |
| Total distributions | (114,796) | (74,589) |
| Share transactions - net increase (decrease) | (262,006) | (353,147) |
| Redemption fees | 42 | 95 |
| Total increase (decrease) in net assets | (872,245) | (31,378) |
| Net Assets | ||
| Beginning of period | 10,967,173 | 10,998,551 |
| End of period (including undistributed net investment income of $88,416 and undistributed net investment income of $108,769, respectively) | $10,094,928 | $10,967,173 |
See accompanying notes which are an integral part of the financial statements.
Financial Highlights — Fidelity International Discovery Fund Class A
| Six months ended (Unaudited) April 30, | Years ended October 31, | |||||
| 2016 | 2015 | 2014 | 2013 | 2012 | 2011 | |
| Selected Per–Share Data | ||||||
| Net asset value, beginning of period | $39.78 | $38.70 | $39.49 | $31.66 | $29.43 | $32.07 |
| Income from Investment Operations | ||||||
| Net investment income (loss)A | .27B | .40C | .53D | .34 | .41 | .42 |
| Net realized and unrealized gain (loss) | (2.04) | .79 | (.67) | 7.97 | 2.11 | (2.52) |
| Total from investment operations | (1.77) | 1.19 | (.14) | 8.31 | 2.52 | (2.10) |
| Distributions from net investment income | (.27) | (.11) | (.33) | (.45) | (.29) | (.38) |
| Distributions from net realized gain | (.01) | – | (.31) | (.03) | – | (.16) |
| Total distributions | (.27)E | (.11) | (.65)F | (.48) | (.29) | (.54) |
| Redemption fees added to paid in capitalA,G | – | – | – | – | – | – |
| Net asset value, end of period | $37.74 | $39.78 | $38.70 | $39.49 | $31.66 | $29.43 |
| Total ReturnH,I,J | (4.47)% | 3.09% | (.36)% | 26.59% | 8.70% | (6.71)% |
| Ratios to Average Net AssetsK,L | ||||||
| Expenses before reductions | 1.37%M | 1.33% | 1.28% | 1.35% | 1.34% | 1.30% |
| Expenses net of fee waivers, if any | 1.37%M | 1.33% | 1.28% | 1.35% | 1.34% | 1.29% |
| Expenses net of all reductions | 1.37%M | 1.32% | 1.28% | 1.33% | 1.31% | 1.25% |
| Net investment income (loss) | 1.45%B,M | 1.00%C | 1.35%D | .97% | 1.41% | 1.31% |
| Supplemental Data | ||||||
| Net assets, end of period (in millions) | $261 | $283 | $297 | $347 | $299 | $320 |
| Portfolio turnover rateN | 49%M,O | 60%O | 57% | 65% | 68% | 75% |
A Calculated based on average shares outstanding during the period.
B Net Investment income per share reflects a large, non-recurring dividend which amounted to $.14 per share. Excluding this non-recurring dividend, the ratio of net investment income (loss) to average net assets would have been .72%.
C Net Investment income per share reflects a large, non-recurring dividend which amounted to $.12 per share. Excluding this non-recurring dividend, the ratio of net investment income (loss) to average net assets would have been .69%.
D Net Investment income per share reflects a large, non-recurring dividend which amounted to $.22 per share. Excluding this non-recurring dividend, the ratio of net investment income (loss) to average net assets would have been .80%.
E Total distributions of $.27 per share is comprised of distributions from net investment income of $.269 and distributions from net realized gain of $.005 per share.
F Total distributions of $.65 per share is comprised of distributions from net investment income of $.334 and distributions from net realized gain of $.311 per share.
G Amount represents less than $.005 per share.
H Total returns for periods of less than one year are not annualized.
I Total returns would have been lower if certain expenses had not been reduced during the applicable periods shown.
J Total returns do not include the effect of the sales charges.
K Fees and expenses of any underlying Fidelity Central Funds are not included in the Fund's expense ratio. The Fund indirectly bears its proportionate share of the expenses of any underlying Fidelity Central Funds.
L Expense ratios reflect operating expenses of the class. Expenses before reductions do not reflect amounts reimbursed by the investment adviser or reductions from brokerage service arrangements or reductions from other expense offset arrangements and do not represent the amount paid by the class during periods when reimbursements or reductions occur. Expenses net of fee waivers reflect expenses after reimbursement by the investment adviser but prior to reductions from brokerage service arrangements or other expense offset arrangements. Expenses net of all reductions represent the net expenses paid by the class.
M Annualized
N Amount does not include the portfolio activity of any underlying Fidelity Central Funds.
O Portfolio turnover rate excludes securities received or delivered in-kind.
See accompanying notes which are an integral part of the financial statements.
Financial Highlights — Fidelity International Discovery Fund Class T
| Six months ended (Unaudited) April 30, | Years ended October 31, | |||||
| 2016 | 2015 | 2014 | 2013 | 2012 | 2011 | |
| Selected Per–Share Data | ||||||
| Net asset value, beginning of period | $39.51 | $38.43 | $39.23 | $31.42 | $29.18 | $31.81 |
| Income from Investment Operations | ||||||
| Net investment income (loss)A | .23B | .30C | .44D | .26 | .34 | .34 |
| Net realized and unrealized gain (loss) | (2.03) | .80 | (.68) | 7.92 | 2.09 | (2.51) |
| Total from investment operations | (1.80) | 1.10 | (.24) | 8.18 | 2.43 | (2.17) |
| Distributions from net investment income | (.17) | (.02) | (.25) | (.34) | (.19) | (.30) |
| Distributions from net realized gain | (.01) | – | (.31) | (.03) | – | (.16) |
| Total distributions | (.18) | (.02) | (.56) | (.37) | (.19) | (.46) |
| Redemption fees added to paid in capitalA,E | – | – | – | – | – | – |
| Net asset value, end of period | $37.53 | $39.51 | $38.43 | $39.23 | $31.42 | $29.18 |
| Total ReturnF,G,H | (4.59)% | 2.86% | (.60)% | 26.31% | 8.41% | (6.96)% |
| Ratios to Average Net AssetsI,J | ||||||
| Expenses before reductions | 1.61%K | 1.57% | 1.51% | 1.59% | 1.59% | 1.56% |
| Expenses net of fee waivers, if any | 1.61%K | 1.57% | 1.51% | 1.59% | 1.59% | 1.55% |
| Expenses net of all reductions | 1.61%K | 1.56% | 1.51% | 1.57% | 1.56% | 1.51% |
| Net investment income (loss) | 1.21%B,K | .76%C | 1.11%D | .73% | 1.16% | 1.05% |
| Supplemental Data | ||||||
| Net assets, end of period (in millions) | $39 | $43 | $49 | $53 | $46 | $61 |
| Portfolio turnover rateL | 49%K,M | 60%M | 57% | 65% | 68% | 75% |
A Calculated based on average shares outstanding during the period.
B Net Investment income per share reflects a large, non-recurring dividend which amounted to $.14 per share. Excluding this non-recurring dividend, the ratio of net investment income (loss) to average net assets would have been .48%.
C Net Investment income per share reflects a large, non-recurring dividend which amounted to $.12 per share. Excluding this non-recurring dividend, the ratio of net investment income (loss) to average net assets would have been .45%.
D Net Investment income per share reflects a large, non-recurring dividend which amounted to $.21 per share. Excluding this non-recurring dividend, the ratio of net investment income (loss) to average net assets would have been .56%.
E Amount represents less than $.005 per share.
F Total returns for periods of less than one year are not annualized.
G Total returns would have been lower if certain expenses had not been reduced during the applicable periods shown.
H Total returns do not include the effect of the sales charges.
I Fees and expenses of any underlying Fidelity Central Funds are not included in the Fund's expense ratio. The Fund indirectly bears its proportionate share of the expenses of any underlying Fidelity Central Funds.
J Expense ratios reflect operating expenses of the class. Expenses before reductions do not reflect amounts reimbursed by the investment adviser or reductions from brokerage service arrangements or reductions from other expense offset arrangements and do not represent the amount paid by the class during periods when reimbursements or reductions occur. Expenses net of fee waivers reflect expenses after reimbursement by the investment adviser but prior to reductions from brokerage service arrangements or other expense offset arrangements. Expenses net of all reductions represent the net expenses paid by the class.
K Annualized
L Amount does not include the portfolio activity of any underlying Fidelity Central Funds.
M Portfolio turnover rate excludes securities received or delivered in-kind.
See accompanying notes which are an integral part of the financial statements.
Financial Highlights — Fidelity International Discovery Fund Class B
| Six months ended (Unaudited) April 30, | Years ended October 31, | |||||
| 2016 | 2015 | 2014 | 2013 | 2012 | 2011 | |
| Selected Per–Share Data | ||||||
| Net asset value, beginning of period | $39.20 | $38.32 | $39.08 | $31.28 | $29.02 | $31.60 |
| Income from Investment Operations | ||||||
| Net investment income (loss)A | .13B | .08C | .22D | .08 | .19 | .17 |
| Net realized and unrealized gain (loss) | (2.03) | .80 | (.66) | 7.90 | 2.09 | (2.48) |
| Total from investment operations | (1.90) | .88 | (.44) | 7.98 | 2.28 | (2.31) |
| Distributions from net investment income | – | – | (.01) | (.15) | (.02) | (.12) |
| Distributions from net realized gain | – | – | (.31) | (.03) | – | (.16) |
| Total distributions | – | – | (.32) | (.18) | (.02) | (.27)E |
| Redemption fees added to paid in capitalA,F | – | – | – | – | – | – |
| Net asset value, end of period | $37.30 | $39.20 | $38.32 | $39.08 | $31.28 | $29.02 |
| Total ReturnG,H,I | (4.85)% | 2.30% | (1.12)% | 25.64% | 7.85% | (7.39)% |
| Ratios to Average Net AssetsJ,K | ||||||
| Expenses before reductions | 2.14%L | 2.12% | 2.06% | 2.10% | 2.09% | 2.06% |
| Expenses net of fee waivers, if any | 2.14%L | 2.12% | 2.06% | 2.10% | 2.09% | 2.06% |
| Expenses net of all reductions | 2.14%L | 2.11% | 2.05% | 2.08% | 2.06% | 2.02% |
| Net investment income (loss) | .68%B,L | .21%C | .57%D | .22% | .66% | .54% |
| Supplemental Data | ||||||
| Net assets, end of period (in millions) | $1 | $2 | $5 | $7 | $8 | $10 |
| Portfolio turnover rateM | 49%L,N | 60%N | 57% | 65% | 68% | 75% |
A Calculated based on average shares outstanding during the period.
B Net Investment income per share reflects a large, non-recurring dividend which amounted to $.14 per share. Excluding this non-recurring dividend, the ratio of net investment income (loss) to average net assets would have been (.05) %.
C Net Investment income per share reflects a large, non-recurring dividend which amounted to $.12 per share. Excluding this non-recurring dividend, the ratio of net investment income (loss) to average net assets would have been (.10) %.
D Net Investment income per share reflects a large, non-recurring dividend which amounted to $.21 per share. Excluding this non-recurring dividend, the ratio of net investment income (loss) to average net assets would have been .02%.
E Total distributions of $.27 per share is comprised of distributions from net investment income of $.115 and distributions from net realized gain of $.155 per share.
F Amount represents less than $.005 per share.
G Total returns for periods of less than one year are not annualized.
H Total returns would have been lower if certain expenses had not been reduced during the applicable periods shown.
I Total returns do not include the effect of the contingent deferred sales charge.
J Fees and expenses of any underlying Fidelity Central Funds are not included in the Fund's expense ratio. The Fund indirectly bears its proportionate share of the expenses of any underlying Fidelity Central Funds.
K Expense ratios reflect operating expenses of the class. Expenses before reductions do not reflect amounts reimbursed by the investment adviser or reductions from brokerage service arrangements or reductions from other expense offset arrangements and do not represent the amount paid by the class during periods when reimbursements or reductions occur. Expenses net of fee waivers reflect expenses after reimbursement by the investment adviser but prior to reductions from brokerage service arrangements or other expense offset arrangements. Expenses net of all reductions represent the net expenses paid by the class.
L Annualized
M Amount does not include the portfolio activity of any underlying Fidelity Central Funds.
N Portfolio turnover rate excludes securities received or delivered in-kind.
See accompanying notes which are an integral part of the financial statements.
Financial Highlights — Fidelity International Discovery Fund Class C
| Six months ended (Unaudited) April 30, | Years ended October 31, | |||||
| 2016 | 2015 | 2014 | 2013 | 2012 | 2011 | |
| Selected Per–Share Data | ||||||
| Net asset value, beginning of period | $39.14 | $38.25 | $39.07 | $31.32 | $29.08 | $31.68 |
| Income from Investment Operations | ||||||
| Net investment income (loss)A | .13B | .10C | .23D | .08 | .19 | .18 |
| Net realized and unrealized gain (loss) | (2.02) | .79 | (.66) | 7.90 | 2.09 | (2.49) |
| Total from investment operations | (1.89) | .89 | (.43) | 7.98 | 2.28 | (2.31) |
| Distributions from net investment income | – | – | (.08) | (.20) | (.04) | (.14) |
| Distributions from net realized gain | – | – | (.31) | (.03) | – | (.16) |
| Total distributions | – | – | (.39) | (.23) | (.04) | (.29)E |
| Redemption fees added to paid in capitalA,F | – | – | – | – | – | – |
| Net asset value, end of period | $37.25 | $39.14 | $38.25 | $39.07 | $31.32 | $29.08 |
| Total ReturnG,H,I | (4.83)% | 2.33% | (1.10)% | 25.65% | 7.86% | (7.37)% |
| Ratios to Average Net AssetsJ,K | ||||||
| Expenses before reductions | 2.12%L | 2.09% | 2.03% | 2.10% | 2.09% | 2.05% |
| Expenses net of fee waivers, if any | 2.12%L | 2.09% | 2.03% | 2.09% | 2.09% | 2.04% |
| Expenses net of all reductions | 2.12%L | 2.08% | 2.02% | 2.07% | 2.06% | 2.00% |
| Net investment income (loss) | .70%B,L | .24%C | .60%D | .23% | .66% | .56% |
| Supplemental Data | ||||||
| Net assets, end of period (in millions) | $33 | $32 | $35 | $36 | $30 | $33 |
| Portfolio turnover rateM | 49%L,N | 60%N | 57% | 65% | 68% | 75% |
A Calculated based on average shares outstanding during the period.
B Net Investment income per share reflects a large, non-recurring dividend which amounted to $.14 per share. Excluding this non-recurring dividend, the ratio of net investment income (loss) to average net assets would have been (.03) %.
C Net Investment income per share reflects a large, non-recurring dividend which amounted to $.12 per share. Excluding this non-recurring dividend, the ratio of net investment income (loss) to average net assets would have been (.06) %.
D Net Investment income per share reflects a large, non-recurring dividend which amounted to $.21 per share. Excluding this non-recurring dividend, the ratio of net investment income (loss) to average net assets would have been .05%.
E Total distributions of $.29 per share is comprised of distributions from net investment income of $.137 and distributions from net realized gain of $.155 per share.
F Amount represents less than $.005 per share.
G Total returns for periods of less than one year are not annualized.
H Total returns would have been lower if certain expenses had not been reduced during the applicable periods shown.
I Total returns do not include the effect of the contingent deferred sales charge.
J Fees and expenses of any underlying Fidelity Central Funds are not included in the Fund's expense ratio. The Fund indirectly bears its proportionate share of the expenses of any underlying Fidelity Central Funds.
K Expense ratios reflect operating expenses of the class. Expenses before reductions do not reflect amounts reimbursed by the investment adviser or reductions from brokerage service arrangements or reductions from other expense offset arrangements and do not represent the amount paid by the class during periods when reimbursements or reductions occur. Expenses net of fee waivers reflect expenses after reimbursement by the investment adviser but prior to reductions from brokerage service arrangements or other expense offset arrangements. Expenses net of all reductions represent the net expenses paid by the class.
L Annualized
M Amount does not include the portfolio activity of any underlying Fidelity Central Funds.
N Portfolio turnover rate excludes securities received or delivered in-kind.
See accompanying notes which are an integral part of the financial statements.
Financial Highlights — Fidelity International Discovery Fund
| Six months ended (Unaudited) April 30, | Years ended October 31, | |||||
| 2016 | 2015 | 2014 | 2013 | 2012 | 2011 | |
| Selected Per–Share Data | ||||||
| Net asset value, beginning of period | $40.12 | $39.03 | $39.82 | $31.91 | $29.69 | $32.34 |
| Income from Investment Operations | ||||||
| Net investment income (loss)A | .34B | .54C | .67D | .47 | .51 | .53 |
| Net realized and unrealized gain (loss) | (2.06) | .81 | (.68) | 8.02 | 2.12 | (2.54) |
| Total from investment operations | (1.72) | 1.35 | (.01) | 8.49 | 2.63 | (2.01) |
| Distributions from net investment income | (.41) | (.26) | (.47) | (.55) | (.41) | (.48) |
| Distributions from net realized gain | (.01) | – | (.31) | (.03) | – | (.16) |
| Total distributions | (.41)E | (.26) | (.78) | (.58) | (.41) | (.64) |
| Redemption fees added to paid in capitalA,F | – | – | – | – | – | – |
| Net asset value, end of period | $37.99 | $40.12 | $39.03 | $39.82 | $31.91 | $29.69 |
| Total ReturnG,H | (4.33)% | 3.47% | (.01)% | 27.03% | 9.03% | (6.39)% |
| Ratios to Average Net AssetsI,J | ||||||
| Expenses before reductions | 1.02%K | .99% | .93% | 1.00% | 1.01% | .97% |
| Expenses net of fee waivers, if any | 1.02%K | .99% | .93% | 1.00% | 1.01% | .96% |
| Expenses net of all reductions | 1.02%K | .98% | .93% | .98% | .98% | .92% |
| Net investment income (loss) | 1.80%B,K | 1.34%C | 1.69%D | 1.32% | 1.73% | 1.64% |
| Supplemental Data | ||||||
| Net assets, end of period (in millions) | $6,797 | $7,209 | $7,464 | $7,800 | $5,965 | $6,806 |
| Portfolio turnover rateL | 49%K,M | 60%M | 57% | 65% | 68% | 75% |
A Calculated based on average shares outstanding during the period.
B Net Investment income per share reflects a large, non-recurring dividend which amounted to $.14 per share. Excluding this non-recurring dividend, the ratio of net investment income (loss) to average net assets would have been 1.07%.
C Net Investment income per share reflects a large, non-recurring dividend which amounted to $.12 per share. Excluding this non-recurring dividend, the ratio of net investment income (loss) to average net assets would have been 1.03%.
D Net Investment income per share reflects a large, non-recurring dividend which amounted to $.22 per share. Excluding this non-recurring dividend, the ratio of net investment income (loss) to average net assets would have been 1.15%.
E Total distributions of $.41 per share is comprised of distributions from net investment income of $.409 and distributions from net realized gain of $.005 per share.
F Amount represents less than $.005 per share.
G Total returns for periods of less than one year are not annualized.
H Total returns would have been lower if certain expenses had not been reduced during the applicable periods shown.
I Fees and expenses of any underlying Fidelity Central Funds are not included in the Fund's expense ratio. The Fund indirectly bears its proportionate share of the expenses of any underlying Fidelity Central Funds.
J Expense ratios reflect operating expenses of the class. Expenses before reductions do not reflect amounts reimbursed by the investment adviser or reductions from brokerage service arrangements or reductions from other expense offset arrangements and do not represent the amount paid by the class during periods when reimbursements or reductions occur. Expenses net of fee waivers reflect expenses after reimbursement by the investment adviser but prior to reductions from brokerage service arrangements or other expense offset arrangements. Expenses net of all reductions represent the net expenses paid by the class.
K Annualized
L Amount does not include the portfolio activity of any underlying Fidelity Central Funds.
M Portfolio turnover rate excludes securities received or delivered in-kind.
See accompanying notes which are an integral part of the financial statements.
Financial Highlights — Fidelity International Discovery Fund Class K
| Six months ended (Unaudited) April 30, | Years ended October 31, | |||||
| 2016 | 2015 | 2014 | 2013 | 2012 | 2011 | |
| Selected Per–Share Data | ||||||
| Net asset value, beginning of period | $40.06 | $38.97 | $39.76 | $31.87 | $29.66 | $32.32 |
| Income from Investment Operations | ||||||
| Net investment income (loss)A | .36B | .59C | .72D | .52 | .57 | .58 |
| Net realized and unrealized gain (loss) | (2.04) | .81 | (.67) | 8.01 | 2.11 | (2.54) |
| Total from investment operations | (1.68) | 1.40 | .05 | 8.53 | 2.68 | (1.96) |
| Distributions from net investment income | (.46) | (.31) | (.53) | (.61) | (.47) | (.55) |
| Distributions from net realized gain | (.01) | – | (.31) | (.03) | – | (.16) |
| Total distributions | (.47) | (.31) | (.84) | (.64) | (.47) | (.70)E |
| Redemption fees added to paid in capitalA,F | – | – | – | – | – | – |
| Net asset value, end of period | $37.91 | $40.06 | $38.97 | $39.76 | $31.87 | $29.66 |
| Total ReturnG,H | (4.25)% | 3.61% | .13% | 27.23% | 9.24% | (6.24)% |
| Ratios to Average Net AssetsI,J | ||||||
| Expenses before reductions | .89%K | .86% | .80% | .85% | .83% | .80% |
| Expenses net of fee waivers, if any | .89%K | .86% | .80% | .85% | .83% | .79% |
| Expenses net of all reductions | .89%K | .85% | .79% | .83% | .80% | .75% |
| Net investment income (loss) | 1.94%B,K | 1.47%C | 1.83%D | 1.47% | 1.91% | 1.81% |
| Supplemental Data | ||||||
| Net assets, end of period (in millions) | $2,152 | $2,308 | $2,464 | $2,576 | $1,776 | $1,245 |
| Portfolio turnover rateL | 49%K,M | 60%M | 57% | 65% | 68% | 75% |
A Calculated based on average shares outstanding during the period.
B Net Investment income per share reflects a large, non-recurring dividend which amounted to $.14 per share. Excluding this non-recurring dividend, the ratio of net investment income (loss) to average net assets would have been 1.20%.
C Net Investment income per share reflects a large, non-recurring dividend which amounted to $.12 per share. Excluding this non-recurring dividend, the ratio of net investment income (loss) to average net assets would have been 1.16%.
D Net Investment income per share reflects a large, non-recurring dividend which amounted to $.22 per share. Excluding this non-recurring dividend, the ratio of net investment income (loss) to average net assets would have been 1.28%.
E Total distributions of $.70 per share is comprised of distributions from net investment income of $.548 and distributions from net realized gain of $.155 per share.
F Amount represents less than $.005 per share.
G Total returns for periods of less than one year are not annualized.
H Total returns would have been lower if certain expenses had not been reduced during the applicable periods shown.
I Fees and expenses of any underlying Fidelity Central Funds are not included in the Fund's expense ratio. The Fund indirectly bears its proportionate share of the expenses of any underlying Fidelity Central Funds.
J Expense ratios reflect operating expenses of the class. Expenses before reductions do not reflect amounts reimbursed by the investment adviser or reductions from brokerage service arrangements or reductions from other expense offset arrangements and do not represent the amount paid by the class during periods when reimbursements or reductions occur. Expenses net of fee waivers reflect expenses after reimbursement by the investment adviser but prior to reductions from brokerage service arrangements or other expense offset arrangements. Expenses net of all reductions represent the net expenses paid by the class.
K Annualized
L Amount does not include the portfolio activity of any underlying Fidelity Central Funds.
M Portfolio turnover rate excludes securities received or delivered in-kind.
See accompanying notes which are an integral part of the financial statements.
Financial Highlights — Fidelity International Discovery Fund Class I
| Six months ended (Unaudited) April 30, | Years ended October 31, | |||||
| 2016 | 2015 | 2014 | 2013 | 2012 | 2011 | |
| Selected Per–Share Data | ||||||
| Net asset value, beginning of period | $40.03 | $38.96 | $39.76 | $31.87 | $29.65 | $32.31 |
| Income from Investment Operations | ||||||
| Net investment income (loss)A | .34B | .53C | .67D | .47 | .52 | .54 |
| Net realized and unrealized gain (loss) | (2.05) | .80 | (.68) | 8.01 | 2.11 | (2.55) |
| Total from investment operations | (1.71) | 1.33 | (.01) | 8.48 | 2.63 | (2.01) |
| Distributions from net investment income | (.42) | (.26) | (.48) | (.56) | (.41) | (.50) |
| Distributions from net realized gain | (.01) | – | (.31) | (.03) | – | (.16) |
| Total distributions | (.42)E | (.26) | (.79) | (.59) | (.41) | (.65)F |
| Redemption fees added to paid in capitalA,G | – | – | – | – | – | – |
| Net asset value, end of period | $37.90 | $40.03 | $38.96 | $39.76 | $31.87 | $29.65 |
| Total ReturnH,I | (4.31)% | 3.44% | (.01)% | 27.03% | 9.07% | (6.39)% |
| Ratios to Average Net AssetsJ,K | ||||||
| Expenses before reductions | 1.03%L | 1.00% | .93% | 1.00% | 1.00% | .95% |
| Expenses net of fee waivers, if any | 1.03%L | .99% | .93% | 1.00% | 1.00% | .94% |
| Expenses net of all reductions | 1.03%L | .98% | .93% | .97% | .97% | .90% |
| Net investment income (loss) | 1.80%B,L | 1.33%C | 1.69%D | 1.33% | 1.75% | 1.66% |
| Supplemental Data | ||||||
| Net assets, end of period (in millions) | $781 | $1,061 | $650 | $476 | $294 | $278 |
| Portfolio turnover rateM | 49%L,N | 60%N | 57% | 65% | 68% | 75% |
A Calculated based on average shares outstanding during the period.
B Net Investment income per share reflects a large, non-recurring dividend which amounted to $.14 per share. Excluding this non-recurring dividend, the ratio of net investment income (loss) to average net assets would have been 1.06%.
C Net Investment income per share reflects a large, non-recurring dividend which amounted to $.12 per share. Excluding this non-recurring dividend, the ratio of net investment income (loss) to average net assets would have been 1.03%.
D Net Investment income per share reflects a large, non-recurring dividend which amounted to $.22 per share. Excluding this non-recurring dividend, the ratio of net investment income (loss) to average net assets would have been 1.14%.
E Total distributions of $.42 per share is comprised of distributions from net investment income of $.418 and distributions from net realized gain of $.005 per share.
F Total distributions of $.65 per share is comprised of distributions from net investment income of $.497 and distributions from net realized gain of $.155 per share.
G Amount represents less than $.005 per share.
H Total returns for periods of less than one year are not annualized.
I Total returns would have been lower if certain expenses had not been reduced during the applicable periods shown.
J Fees and expenses of any underlying Fidelity Central Funds are not included in the Fund's expense ratio. The Fund indirectly bears its proportionate share of the expenses of any underlying Fidelity Central Funds.
K Expense ratios reflect operating expenses of the class. Expenses before reductions do not reflect amounts reimbursed by the investment adviser or reductions from brokerage service arrangements or reductions from other expense offset arrangements and do not represent the amount paid by the class during periods when reimbursements or reductions occur. Expenses net of fee waivers reflect expenses after reimbursement by the investment adviser but prior to reductions from brokerage service arrangements or other expense offset arrangements. Expenses net of all reductions represent the net expenses paid by the class.
L Annualized
M Amount does not include the portfolio activity of any underlying Fidelity Central Funds.
N Portfolio turnover rate excludes securities received or delivered in-kind.
See accompanying notes which are an integral part of the financial statements.
Financial Highlights — Fidelity International Discovery Fund Class Z
| Six months ended (Unaudited) April 30, | Years ended October 31, | |||
| 2016 | 2015 | 2014 | 2013 A | |
| Selected Per–Share Data | ||||
| Net asset value, beginning of period | $40.03 | $38.96 | $39.77 | $37.22 |
| Income from Investment Operations | ||||
| Net investment income (loss)B | .36C | .59D | .72E | .07 |
| Net realized and unrealized gain (loss) | (2.03) | .80 | (.68) | 2.48 |
| Total from investment operations | (1.67) | 1.39 | .04 | 2.55 |
| Distributions from net investment income | (.46) | (.32) | (.54) | – |
| Distributions from net realized gain | (.01) | – | (.31) | – |
| Total distributions | (.47) | (.32) | (.85) | – |
| Redemption fees added to paid in capitalB,F | – | – | – | – |
| Net asset value, end of period | $37.89 | $40.03 | $38.96 | $39.77 |
| Total ReturnG,H | (4.24)% | 3.58% | .12% | 6.85% |
| Ratios to Average Net AssetsI,J | ||||
| Expenses before reductions | .89%K | .86% | .80% | .85%K |
| Expenses net of fee waivers, if any | .89%K | .86% | .80% | .85%K |
| Expenses net of all reductions | .89%K | .85% | .79% | .83%K |
| Net investment income (loss) | 1.94%C,K | 1.47%D | 1.83%E | .76%K |
| Supplemental Data | ||||
| Net assets, end of period (000 omitted) | $31,089 | $30,093 | $35,125 | $107 |
| Portfolio turnover rateL | 49%K,M | 60%M | 57% | 65% |
A For the period August 13, 2013 (commencement of sale of shares) to October 31, 2013.
B Calculated based on average shares outstanding during the period.
C Net Investment income per share reflects a large, non-recurring dividend which amounted to $.14 per share. Excluding this non-recurring dividend, the ratio of net investment income (loss) to average net assets would have been 1.20%.
D Net Investment income per share reflects a large, non-recurring dividend which amounted to $.12 per share. Excluding this non-recurring dividend, the ratio of net investment income (loss) to average net assets would have been 1.16%.
E Net Investment income per share reflects a large, non-recurring dividend which amounted to $.21 per share. Excluding this non-recurring dividend, the ratio of net investment income (loss) to average net assets would have been 1.28%.
F Amount represents less than $.005 per share.
G Total returns for periods of less than one year are not annualized.
H Total returns would have been lower if certain expenses had not been reduced during the applicable periods shown.
I Fees and expenses of any underlying Fidelity Central Funds are not included in the Fund's expense ratio. The Fund indirectly bears its proportionate share of the expenses of any underlying Fidelity Central Funds.
J Expense ratios reflect operating expenses of the class. Expenses before reductions do not reflect amounts reimbursed by the investment adviser or reductions from brokerage service arrangements or reductions from other expense offset arrangements and do not represent the amount paid by the class during periods when reimbursements or reductions occur. Expense ratios before reductions for start-up periods may not be representative of longer-term operating periods. Expenses net of fee waivers reflect expenses after reimbursement by the investment adviser but prior to reductions from brokerage service arrangements or other expense offset arrangements. Expenses net of all reductions represent the net expenses paid by the class.
K Annualized
L Amount does not include the portfolio activity of any underlying Fidelity Central Funds.
M Portfolio turnover rate excludes securities received or delivered in-kind.
See accompanying notes which are an integral part of the financial statements.
Notes to Financial Statements (Unaudited)
For the period ended April 30, 2016
(Amounts in thousands except percentages)
1. Organization.
Fidelity International Discovery Fund (the Fund) is a fund of Fidelity Investment Trust (the Trust) and is authorized to issue an unlimited number of shares. The Trust is registered under the Investment Company Act of 1940, as amended (the 1940 Act), as an open-end management investment company organized as a Massachusetts business trust. The Fund offers Class A, Class T, Class C, International Discovery, Class K, Class I and Class Z shares, each of which, along with Class B shares, has equal rights as to assets and voting privileges. Class B shares are closed to new accounts and additional purchases, except for exchanges and reinvestments. Each class has exclusive voting rights with respect to matters that affect that class. Class B shares will automatically convert to Class A shares after a maximum holding period of seven years from the initial date of purchase.
During the period, the Board of Trustees approved the conversion of all existing Class B shares into Class A shares, effective on or about July 1, 2016, regardless of the length of times shares have been held.
2. Investments in Fidelity Central Funds.
The Fund invests in Fidelity Central Funds, which are open-end investment companies generally available only to other investment companies and accounts managed by the investment adviser and its affiliates. The Fund's Schedule of Investments lists each of the Fidelity Central Funds held as of period end, if any, as an investment of the Fund, but does not include the underlying holdings of each Fidelity Central Fund. As an Investing Fund, the Fund indirectly bears its proportionate share of the expenses of the underlying Fidelity Central Funds.
The Money Market Central Funds seek preservation of capital and current income and are managed by Fidelity Investments Money Management, Inc. (FIMM), an affiliate of the investment adviser. Annualized expenses of the Money Market Central Funds as of their most recent shareholder report date are less than .005%.
A complete unaudited list of holdings for each Fidelity Central Fund is available upon request or at the Securities and Exchange Commission (the SEC) website at www.sec.gov. In addition, the financial statements of the Fidelity Central Funds are available on the SEC website or upon request.
3. Significant Accounting Policies.
The financial statements have been prepared in conformity with accounting principles generally accepted in the United States of America (GAAP), which require management to make certain estimates and assumptions at the date of the financial statements. Actual results could differ from those estimates. Subsequent events, if any, through the date that the financial statements were issued have been evaluated in the preparation of the financial statements. The following summarizes the significant accounting policies of the Fund:
Investment Valuation. Investments are valued as of 4:00 p.m. Eastern time on the last calendar day of the period. The Board of Trustees (the Board) has delegated the day to day responsibility for the valuation of the Fund's investments to the Fidelity Management & Research Company (FMR) Fair Value Committee (the Committee). In accordance with valuation policies and procedures approved by the Board, the Fund attempts to obtain prices from one or more third party pricing vendors or brokers to value its investments. When current market prices, quotations or currency exchange rates are not readily available or reliable, investments will be fair valued in good faith by the Committee, in accordance with procedures adopted by the Board. Factors used in determining fair value vary by investment type and may include market or investment specific events, changes in interest rates and credit quality. The frequency with which these procedures are used cannot be predicted and they may be utilized to a significant extent. The Committee oversees the Fund's valuation policies and procedures and reports to the Board on the Committee's activities and fair value determinations. The Board monitors the appropriateness of the procedures used in valuing the Fund's investments and ratifies the fair value determinations of the Committee.
The Fund categorizes the inputs to valuation techniques used to value its investments into a disclosure hierarchy consisting of three levels as shown below:
- Level 1 – quoted prices in active markets for identical investments
- Level 2 – other significant observable inputs (including quoted prices for similar investments, interest rates, prepayment speeds, etc.)
- Level 3 – unobservable inputs (including the Fund's own assumptions based on the best information available)
Valuation techniques used to value the Fund's investments by major category are as follows:
Equity securities, including restricted securities, for which market quotations are readily available, are valued at the last reported sale price or official closing price as reported by a third party pricing vendor on the primary market or exchange on which they are traded and are categorized as Level 1 in the hierarchy. In the event there were no sales during the day or closing prices are not available, securities are valued at the last quoted bid price or may be valued using the last available price and are generally categorized as Level 2 in the hierarchy. For foreign equity securities, when market or security specific events arise, comparisons to the valuation of American Depositary Receipts (ADRs), futures contracts, Exchange-Traded Funds (ETFs) and certain indexes as well as quoted prices for similar securities may be used and would be categorized as Level 2 in the hierarchy. Utilizing these techniques may result in transfers between Level 1 and Level 2. For equity securities, including restricted securities, where observable inputs are limited, assumptions about market activity and risk are used and these securities may be categorized as Level 3 in the hierarchy.
Debt securities, including restricted securities, are valued based on evaluated prices received from third party pricing vendors or from brokers who make markets in such securities. U.S. government and government agency obligations are valued by pricing vendors who utilize matrix pricing which considers yield or price of bonds of comparable quality, coupon, maturity and type or by broker-supplied prices. When independent prices are unavailable or unreliable, debt securities may be valued utilizing pricing methodologies which consider similar factors that would be used by third party pricing vendors. Debt securities are generally categorized as Level 2 in the hierarchy but may be Level 3 depending on the circumstances.
Futures contracts are valued at the settlement price established each day by the board of trade or exchange on which they are traded and are categorized as Level 1 in the hierarchy. Investments in open-end mutual funds, including the Fidelity Central Funds, are valued at their closing net asset value (NAV) each business day and are categorized as Level 1 in the hierarchy.
Changes in valuation techniques may result in transfers in or out of an assigned level within the disclosure hierarchy. The aggregate value of investments by input level as of April 30, 2016, including information on transfers between Levels 1 and 2, is included at the end of the Fund's Schedule of Investments.
Foreign Currency. The Fund may use foreign currency contracts to facilitate transactions in foreign-denominated securities. Gains and losses from these transactions may arise from changes in the value of the foreign currency or if the counterparties do not perform under the contracts' terms.
Foreign-denominated assets, including investment securities, and liabilities are translated into U.S. dollars at the exchange rates at period end. Purchases and sales of investment securities, income and dividends received and expenses denominated in foreign currencies are translated into U.S. dollars at the exchange rate in effect on the transaction date.
The effects of exchange rate fluctuations on investments are included with the net realized and unrealized gain (loss) on investment securities. Other foreign currency transactions resulting in realized and unrealized gain (loss) are disclosed separately.
Investment Transactions and Income. For financial reporting purposes, the Fund's investment holdings and NAV include trades executed through the end of the last business day of the period. The NAV per share for processing shareholder transactions is calculated as of the close of business of the New York Stock Exchange (NYSE), normally 4:00 p.m. Eastern time and includes trades executed through the end of the prior business day. Gains and losses on securities sold are determined on the basis of identified cost. Dividend income is recorded on the ex-dividend date, except for certain dividends from foreign securities where the ex-dividend date may have passed, which are recorded as soon as the Fund is informed of the ex-dividend date. Non-cash dividends included in dividend income, if any, are recorded at the fair market value of the securities received. Income and capital gain distributions from Fidelity Central Funds, if any, are recorded on the ex-dividend date. Distributions received on securities that represent a return of capital or capital gain are recorded as a reduction of cost of investments and/or as a realized gain. Subsequent to ex-dividend date the Fund determines the components of these distributions, based upon receipt of tax filings or other correspondence relating to the underlying investment. Large, non-recurring dividends recognized by the Fund are presented separately on the Statement of Operations as "Special Dividends" and the impact of these dividends is presented in the Financial Highlights. Interest income is accrued as earned and includes coupon interest and amortization of premium and accretion of discount on debt securities as applicable. Investment income is recorded net of foreign taxes withheld where recovery of such taxes is uncertain.
Class Allocations and Expenses. Investment income, realized and unrealized capital gains and losses, common expenses of the Fund, and certain fund-level expense reductions, if any, are allocated daily on a pro-rata basis to each class based on the relative net assets of each class to the total net assets of the Fund. Each class differs with respect to transfer agent and distribution and service plan fees incurred. Certain expense reductions may also differ by class. For the reporting period, the allocated portion of income and expenses to each class as a percent of its average net assets may vary due to the timing of recording these transactions in relation to fluctuating net assets of the classes. Expenses directly attributable to a fund are charged to that fund. Expenses attributable to more than one fund are allocated among the respective funds on the basis of relative net assets or other appropriate methods. Expense estimates are accrued in the period to which they relate and adjustments are made when actual amounts are known.
Deferred Trustee Compensation. Under a Deferred Compensation Plan (the Plan), independent Trustees may elect to defer receipt of a portion of their annual compensation. Deferred amounts are invested in a cross-section of Fidelity funds, are marked-to-market and remain in the Fund until distributed in accordance with the Plan. The investment of deferred amounts and the offsetting payable to the Trustees are included in the accompanying Statement of Assets and Liabilities.
Income Tax Information and Distributions to Shareholders. Each year, the Fund intends to qualify as a regulated investment company under Subchapter M of the Internal Revenue Code, including distributing substantially all of its taxable income and realized gains. As a result, no provision for U.S. Federal income taxes is required. The Fund files a U.S. federal tax return, in addition to state and local tax returns as required. The Fund's federal income tax returns are subject to examination by the Internal Revenue Service (IRS) for a period of three fiscal years after they are filed. State and local tax returns may be subject to examination for an additional fiscal year depending on the jurisdiction. Foreign taxes are provided for based on the Fund's understanding of the tax rules and rates that exist in the foreign markets in which it invests.
Distributions are declared and recorded on the ex-dividend date. Income dividends and capital gain distributions are declared separately for each class. Income and capital gain distributions are determined in accordance with income tax regulations, which may differ from GAAP.
Capital accounts within the financial statements are adjusted for permanent book-tax differences. These adjustments have no impact on net assets or the results of operations. Capital accounts are not adjusted for temporary book-tax differences which will reverse in a subsequent period.
Book-tax differences are primarily due to futures contracts, foreign currency transactions, passive foreign investment companies (PFIC), market discount, certain foreign taxes, redemptions in-kind, deferred trustees compensation, capital loss carryforwards and losses deferred due to wash sales.
The federal tax cost of investment securities and unrealized appreciation (depreciation) as of period end were as follows:
| Gross unrealized appreciation | $1,550,136 |
| Gross unrealized depreciation | (447,894) |
| Net unrealized appreciation (depreciation) on securities | $1,102,242 |
| Tax cost | $9,240,764 |
Capital loss carryforwards are only available to offset future capital gains of the Fund to the extent provided by regulations and may be limited. Under the Regulated Investment Company Modernization Act of 2010 (the Act), the Fund is permitted to carry forward capital losses incurred in taxable years beginning after December 22, 2010 for an unlimited period and such capital losses are required to be used prior to any losses that expire. The capital loss carryforward information presented below, including any applicable limitation, is estimated as of prior fiscal period end and is subject to adjustment.
| Fiscal year of expiration | |
| 2017 | $(49,248) |
Short-Term Trading (Redemption) Fees. Shares held by investors in the Fund less than 30 days may have been subject to a redemption fee equal to 1.00% of the NAV of shares redeemed. All redemption fees, which reduce the proceeds of the shareholder redemption, are retained by the Fund and accounted for as an addition to paid in capital.
Restricted Securities. The Fund may invest in securities that are subject to legal or contractual restrictions on resale. These securities generally may be resold in transactions exempt from registration or to the public if the securities are registered. Disposal of these securities may involve time-consuming negotiations and expense, and prompt sale at an acceptable price may be difficult. Information regarding restricted securities is included at the end of the Fund's Schedule of Investments.
4. Derivative Instruments.
Risk Exposures and the Use of Derivative Instruments. The Fund's investment objective allows the Fund to enter into various types of derivative contracts, including futures contracts. Derivatives are investments whose value is primarily derived from underlying assets, indices or reference rates and may be transacted on an exchange or over-the-counter (OTC). Derivatives may involve a future commitment to buy or sell a specified asset based on specified terms, to exchange future cash flows at periodic intervals based on a notional principal amount, or for one party to make one or more payments upon the occurrence of specified events in exchange for periodic payments from the other party.
The Fund used derivatives to increase returns and to manage exposure to certain risks as defined below. The success of any strategy involving derivatives depends on analysis of numerous economic factors, and if the strategies for investment do not work as intended, the Fund may not achieve its objectives.
The Fund's use of derivatives increased or decreased its exposure to the following risk:
| Equity Risk | Equity risk relates to the fluctuations in the value of financial instruments as a result of changes in market prices (other than those arising from interest rate risk or foreign exchange risk), whether caused by factors specific to an individual investment, its issuer, or all factors affecting all instruments traded in a market or market segment. |
The Fund is also exposed to additional risks from investing in derivatives, such as liquidity risk and counterparty credit risk. Liquidity risk is the risk that the Fund will be unable to close out the derivative in the open market in a timely manner. Counterparty credit risk is the risk that the counterparty will not be able to fulfill its obligation to the Fund. Counterparty credit risk related to exchange-traded futures contracts may be mitigated by the protection provided by the exchange on which they trade.
Investing in derivatives may involve greater risks than investing in the underlying assets directly and, to varying degrees, may involve risk of loss in excess of any initial investment and collateral received and amounts recognized in the Statement of Assets and Liabilities. In addition, there may be the risk that the change in value of the derivative contract does not correspond to the change in value of the underlying instrument.
Futures Contracts. A futures contract is an agreement between two parties to buy or sell a specified underlying instrument for a fixed price at a specified future date. The Fund used futures contracts to manage its exposure to the stock market.
Upon entering into a futures contract, a fund is required to deposit either cash or securities (initial margin) with a clearing broker in an amount equal to a certain percentage of the face value of the contract. Futures contracts are marked-to-market daily and subsequent daily payments (variation margin) are made or received by a fund depending on the daily fluctuations in the value of the futures contracts and are recorded as unrealized appreciation or (depreciation). This receivable and/or payable, if any, is included in daily variation margin for derivative instruments in the Statement of Assets and Liabilities. Realized gain or (loss) is recorded upon the expiration or closing of a futures contract.
Any open futures contracts at period end are presented in the Schedule of Investments under the caption "Futures Contracts". The underlying face amount at value reflects each contract's exposure to the underlying instrument or index at period end and is representative of volume of activity during the period. Securities deposited to meet initial margin requirements are identified in the Schedule of Investments.
During the period the Fund recognized net realized gain (loss) of $(10,549) and a change in net unrealized appreciation (depreciation) of $(20,801) related to its investment in futures contracts. These amounts are included in the Statement of Operations.
5. Purchases and Sales of Investments.
Purchases and sales of securities, other than short-term securities and in-kind transactions, aggregated $2,445,746 and $2,483,783, respectively.
Redemptions In-Kind. During the period, 1,487 shares of the Fund held by an unaffiliated entity were redeemed in-kind for cash and investments with a value of $55,670. The net realized gain of $10,064 on investments delivered through the in-kind redemption is included in the accompanying Statement of Operations. The amount of in-kind redemptions is included in share transactions in the accompanying Statement of Changes in Net Assets as well as Note 11: Share Transactions. The Fund recognized no gain or loss for federal income tax purposes.
6. Fees and Other Transactions with Affiliates.
Management Fee. Fidelity Management & Research Company (the investment adviser) and its affiliates provide the Fund with investment management related services for which the Fund pays a monthly management fee. The management fee is the sum of an individual fund fee rate that is based on an annual rate of .424% of the Fund's average net assets and an annualized group fee rate that averaged .25% during the period. The group fee rate is based upon the average net assets of all the mutual funds advised by the investment adviser, including any mutual funds previously advised by the investment adviser that are currently advised by Fidelity SelectCo, LLC, an affiliate of the investment adviser. The group fee rate decreases as assets under management increase and increases as assets under management decrease. In addition, the management fee is subject to a performance adjustment (up to a maximum of +/- .20% of the Fund's average net assets over a 36 month performance period). The upward or downward adjustment to the management fee is based on the relative investment performance of International Discovery as compared to its benchmark index, the MSCI EAFE Index, over the same 36 month performance period. For the reporting period, the total annualized management fee rate, including the performance adjustment, was .81% of the Fund's average net assets. The performance adjustment included in the management fee rate may be higher or lower than the maximum performance adjustment rate due to the difference between the average net assets for the reporting and performance periods.
Distribution and Service Plan Fees. In accordance with Rule 12b-1 of the 1940 Act, the Fund has adopted separate Distribution and Service Plans for each class of shares. Certain classes pay Fidelity Distributors Corporation (FDC), an affiliate of the investment adviser, separate Distribution and Service Fees, each of which is based on an annual percentage of each class' average net assets. In addition, FDC may pay financial intermediaries for selling shares of the Fund and providing shareholder support services. For the period, the Distribution and Service Fee rates, total fees and amounts retained by FDC were as follows:
| Distribution Fee | Service Fee | Total Fees | Retained by FDC | |
| Class A | -% | .25% | $331 | $– |
| Class T | .25% | .25% | 99 | – |
| Class B | .75% | .25% | 9 | 7 |
| Class C | .75% | .25% | 161 | 15 |
| $600 | $22 |
Sales Load. FDC may receive a front-end sales charge of up to 5.75% for selling Class A shares and 3.50% for selling Class T shares, some of which is paid to financial intermediaries for selling shares of the Fund. Depending on the holding period, FDC may receive contingent deferred sales charges levied on Class A, Class T, Class B, and Class C redemptions. The deferred sales charges range from 5.00% to 1.00% for Class B shares, 1.00% for Class C shares, 1.00% for certain purchases of Class A shares and .25% for certain purchases of Class T shares.
For the period, sales charge amounts retained by FDC were as follows:
| Retained by FDC | |
| Class A | $32 |
| Class T | 3 |
| Class B(a) | –(b) |
| Class C(a) | 1 |
| $36 |
(a) When Class B and Class C shares are initially sold, FDC pays commissions from its own resources to financial intermediaries through which the sales are made.
(b) In the amount of less than five hundred dollars.
Transfer Agent Fees. Fidelity Investments Institutional Operations Company, Inc., (FIIOC), an affiliate of the investment adviser, is the transfer, dividend disbursing and shareholder servicing agent for each class of the Fund. FIIOC receives account fees and asset-based fees that vary according to the account size and type of account of the shareholders of the respective classes of the Fund, except for Class K and Class Z. FIIOC receives an asset-based fee of Class K's and Class Z's average net assets. FIIOC pays for typesetting, printing and mailing of shareholder reports, except proxy statements.
For the period, transfer agent fees for each class were as follows:
| Amount | % of Class-Level Average Net Assets(a) | |
| Class A | $369 | .28 |
| Class T | 53 | .27 |
| Class B | 3 | .30 |
| Class C | 45 | .28 |
| International Discovery | 6,165 | .18 |
| Class K | 508 | .05 |
| Class I | 851 | .19 |
| Class Z | 7 | .05 |
| $8,001 |
(a) Annualized
Accounting and Security Lending Fees. Fidelity Service Company, Inc. (FSC), an affiliate of the investment adviser, maintains the Fund's accounting records. The accounting fee is based on the level of average net assets for each month. Under a separate contract, FSC administers the security lending program. The security lending fee is based on the number and duration of lending transactions.
Brokerage Commissions. The Fund placed a portion of its portfolio transactions with brokerage firms which are affiliates of the investment adviser. Brokerage commissions are included in net realized gain (loss) and change in net unrealized appreciation (depreciation) in the Statement of Operations. The commissions paid to these affiliated firms were $6 for the period.
Interfund Trades. The Fund may purchase from or sell securities to other Fidelity Funds under procedures adopted by the Board. The procedures have been designed to ensure these interfund trades are executed in accordance with Rule 17a-7 of the 1940 Act. Interfund trades are included within the respective purchases and sales amounts shown in the Purchases and Sales of Investments note.
7. Committed Line of Credit.
The Fund participates with other funds managed by the investment adviser or an affiliate in a $4.25 billion credit facility (the "line of credit") to be utilized for temporary or emergency purposes to fund shareholder redemptions or for other short-term liquidity purposes. The Fund has agreed to pay commitment fees on its pro-rata portion of the line of credit, which amounted to $9 and is reflected in Miscellaneous expenses on the Statement of Operations. During the period, the Fund did not borrow on this line of credit.
8. Security Lending.
The Fund lends portfolio securities through a lending agent from time to time in order to earn additional income. For equity securities, a lending agent is used and may loan securities to certain qualified borrowers, including Fidelity Capital Markets (FCM), a broker-dealer affiliated with the Fund. On the settlement date of the loan, the Fund receives collateral (in the form of U.S. Treasury obligations, letters of credit and/or cash) against the loaned securities and maintains collateral in an amount not less than 100% of the market value of the loaned securities during the period of the loan. The market value of the loaned securities is determined at the close of business of the Fund and any additional required collateral is delivered to the Fund on the next business day. The Fund or borrower may terminate the loan at any time, and if the borrower defaults on its obligation to return the securities loaned because of insolvency or other reasons, the Fund may apply collateral received from the borrower against the obligation. The Fund may experience delays and costs in recovering the securities loaned. Any cash collateral received is invested in the Fidelity Securities Lending Cash Central Fund. The value of loaned securities and cash collateral at period end are disclosed on the Fund's Statement of Assets and Liabilities. The value of securities loaned to FCM at period end was $75. Security lending income represents the income earned on investing cash collateral, less rebates paid to borrowers and any lending agent fees associated with the loan, plus any premium payments received for lending certain types of securities. Security lending income is presented in the Statement of Operations as a component of income from Fidelity Central Funds. Total security lending income during the period amounted to $2,593, including $5 from securities loaned to FCM.
9. Expense Reductions.
Commissions paid to certain brokers with whom the investment adviser, or its affiliates, places trades on behalf of the Fund include an amount in addition to trade execution, which may be rebated back to the Fund to offset certain expenses. This amount totaled $74 for the period.
In addition, during the period the investment adviser reimbursed and/or waived a portion of fund-level operating expenses in the amount of $39.
10. Distributions to Shareholders.
Distributions to shareholders of each class were as follows:
| Six months ended April 30, 2016 | Year ended October 31, 2015 | |
| From net investment income | ||
| Class A | $1,912 | $864 |
| Class T | 184 | 23 |
| International Discovery | 73,519 | 49,040 |
| Class K | 26,239 | 19,835 |
| Class I | 11,205 | 4,544 |
| Class Z | 375 | 283 |
| Total | $113,434 | $74,589 |
| From net realized gain | ||
| Class A | $36 | $– |
| Class T | 5 | – |
| International Discovery | 899 | – |
| Class K | 284 | – |
| Class I | 134 | – |
| Class Z | 4 | – |
| Total | $1,362 | $– |
11. Share Transactions.
Share transactions for each class were as follows and may contain automatic conversions between classes or exchanges between affiliated funds:
| Shares | Shares | Dollars | Dollars | |
| Six months ended April 30, 2016 | Year ended October 31, 2015 | Six months ended April 30, 2016 | Year ended October 31, 2015 | |
| Class A | ||||
| Shares sold | 543 | 1,331 | $20,433 | $53,289 |
| Reinvestment of distributions | 48 | 22 | 1,922 | 843 |
| Shares redeemed | (784) | (1,915) | (29,432) | (76,178) |
| Net increase (decrease) | (193) | (562) | $(7,077) | $(22,046) |
| Class T | ||||
| Shares sold | 76 | 178 | $2,881 | $7,105 |
| Reinvestment of distributions | 5 | 1 | 183 | 23 |
| Shares redeemed | (140) | (355) | (5,252) | (13,954) |
| Net increase (decrease) | (59) | (176) | $(2,188) | $(6,826) |
| Class B | ||||
| Shares sold | – | 1 | $15 | $53 |
| Shares redeemed | (20) | (64) | (758) | (2,536) |
| Net increase (decrease) | (20) | (63) | $(743) | $(2,483) |
| Class C | ||||
| Shares sold | 159 | 201 | $5,952 | $7,918 |
| Shares redeemed | (92) | (314) | (3,380) | (12,486) |
| Net increase (decrease) | 67 | (113) | $2,572 | $(4,568) |
| International Discovery | ||||
| Shares sold | 9,886 | 20,827 | $372,799 | $832,233 |
| Reinvestment of distributions | 1,781 | 1,199 | 70,961 | 46,913 |
| Shares redeemed | (12,452) | (33,573) | (467,188) | (1,345,593) |
| Net increase (decrease) | (785) | (11,547) | $(23,428) | $(466,447) |
| Class K | ||||
| Shares sold | 7,943 | 15,372 | $296,942 | $613,737 |
| Reinvestment of distributions | 667 | 508 | 26,523 | 19,835 |
| Shares redeemed | (9,474)(a) | (21,494)(b) | (358,588)(a) | (860,632)(b) |
| Net increase (decrease) | (864) | (5,614) | $(35,123) | $(227,060) |
| Class I | ||||
| Shares sold | 6,739 | 15,392 | $253,947 | $602,134 |
| Reinvestment of distributions | 52 | 33 | 2,069 | 1,286 |
| Shares redeemed | (12,681) | (5,606) | (454,709) | (221,504) |
| Net increase (decrease) | (5,890) | 9,819 | $(198,693) | $381,916 |
| Class Z | ||||
| Shares sold | 202 | 402 | $7,794 | $16,312 |
| Reinvestment of distributions | 10 | 7 | 379 | 283 |
| Shares redeemed | (144) | (559) | (5,499) | (22,228) |
| Net increase (decrease) | 68 | (150) | $2,674 | $(5,633) |
(a) Amount includes in-kind redemptions (see Note 5: Redemptions In-Kind).
(b) Amount includes in-kind redemptions.
12. Other.
The Fund's organizational documents provide former and current trustees and officers with a limited indemnification against liabilities arising in connection with the performance of their duties to the Fund. In the normal course of business, the Fund may also enter into contracts that provide general indemnifications. The Fund's maximum exposure under these arrangements is unknown as this would be dependent on future claims that may be made against the Fund. The risk of material loss from such claims is considered remote.
At the end of the period, Strategic Advisers International Fund was the owner of record of approximately 13% of the total outstanding shares of the Fund. Mutual funds managed by the investment adviser or its affiliates were the owners of record, in the aggregate, of approximately 20% of the total outstanding shares of the Fund.
Shareholder Expense Example
As a shareholder of the Fund, you incur two types of costs: (1) transaction costs, including sales charges (loads) on purchase payments or redemption proceeds, redemption fees and (2) ongoing costs, including management fees, distribution and/or service (12b-1) fees and other Fund expenses. This Example is intended to help you understand your ongoing costs (in dollars) of investing in the Fund and to compare these costs with the ongoing costs of investing in other mutual funds.
The Example is based on an investment of $1,000 invested at the beginning of the period and held for the entire period (November 1, 2015 to April 30, 2016).
Actual Expenses
The first line of the accompanying table for each class of the Fund provides information about actual account values and actual expenses. You may use the information in this line, together with the amount you invested, to estimate the expenses that you paid over the period. Simply divide your account value by $1,000.00 (for example, an $8,600 account value divided by $1,000.00 = 8.6), then multiply the result by the number in the first line for a class of the Fund under the heading entitled "Expenses Paid During Period" to estimate the expenses you paid on your account during this period. A small balance maintenance fee of $12.00 that is charged once a year may apply for certain accounts with a value of less than $2,000. This fee is not included in the table below. If it was, the estimate of expenses you paid during the period would be higher, and your ending account value lower, by this amount. In addition, the Fund, as a shareholder in the underlying Fidelity Central Funds, will indirectly bear its pro-rata share of the fees and expenses incurred by the underlying Fidelity Central Funds. These fees and expenses are not included in the Fund's annualized expense ratio used to calculate the expense estimate in the table below.
Hypothetical Example for Comparison Purposes
The second line of the accompanying table for each class of the Fund provides information about hypothetical account values and hypothetical expenses based on a Class' actual expense ratio and an assumed rate of return of 5% per year before expenses, which is not the Class' actual return. The hypothetical account values and expenses may not be used to estimate the actual ending account balance or expenses you paid for the period. You may use this information to compare the ongoing costs of investing in the Fund and other funds. To do so, compare this 5% hypothetical example with the 5% hypothetical examples that appear in the shareholder reports of the other funds. A small balance maintenance fee of $12.00 that is charged once a year may apply for certain accounts with a value of less than $2,000. This fee is not included in the table below. If it was, the estimate of expenses you paid during the period would be higher, and your ending account value lower, by this amount. In addition, the Fund, as a shareholder in the underlying Fidelity Central Funds, will indirectly bear its pro-rata share of the fees and expenses incurred by the underlying Fidelity Central Funds. These fees and expenses are not included in the Fund's annualized expense ratio used to calculate the expense estimate in the table below.
Please note that the expenses shown in the table are meant to highlight your ongoing costs only and do not reflect any transaction costs. Therefore, the second line of the table is useful in comparing ongoing costs only, and will not help you determine the relative total costs of owning different funds. In addition, if these transactional costs were included, your costs would have been higher.
| Annualized Expense Ratio-A | Beginning Account Value November 1, 2015 | Ending Account Value April 30, 2016 | Expenses Paid During Period-B November 1, 2015 to April 30, 2016 | |
| Class A | 1.37% | |||
| Actual | $1,000.00 | $955.30 | $6.66 | |
| Hypothetical-C | $1,000.00 | $1,018.05 | $6.87 | |
| Class T | 1.61% | |||
| Actual | $1,000.00 | $954.10 | $7.82 | |
| Hypothetical-C | $1,000.00 | $1,016.86 | $8.07 | |
| Class B | 2.14% | |||
| Actual | $1,000.00 | $951.50 | $10.38 | |
| Hypothetical-C | $1,000.00 | $1,014.22 | $10.72 | |
| Class C | 2.12% | |||
| Actual | $1,000.00 | $951.70 | $10.29 | |
| Hypothetical-C | $1,000.00 | $1,014.32 | $10.62 | |
| International Discovery | 1.02% | |||
| Actual | $1,000.00 | $956.70 | $4.96 | |
| Hypothetical-C | $1,000.00 | $1,019.79 | $5.12 | |
| Class K | .89% | |||
| Actual | $1,000.00 | $957.50 | $4.33 | |
| Hypothetical-C | $1,000.00 | $1,020.44 | $4.47 | |
| Class I | 1.03% | |||
| Actual | $1,000.00 | $956.90 | $5.01 | |
| Hypothetical-C | $1,000.00 | $1,019.74 | $5.17 | |
| Class Z | .89% | |||
| Actual | $1,000.00 | $957.60 | $4.33 | |
| Hypothetical-C | $1,000.00 | $1,020.44 | $4.47 |
A Annualized expense ratio reflects expenses net of applicable fee waivers.
B Expenses are equal to each Class' annualized expense ratio, multiplied by the average account value over the period, multiplied by 182/366 (to reflect the one-half year period).
C 5% return per year before expenses
![]()
Corporate Headquarters
245 Summer St.
Boston, MA 02210
www.fidelity.com
IGI-SANN-0616
1.807261.111
Fidelity® Series Emerging Markets Fund Fidelity® Series International Growth Fund Fidelity® Series International Small Cap Fund Fidelity® Series International Value Fund Semi-Annual Report April 30, 2016 |
|
Contents
Fidelity® Series Emerging Markets Fund | |
Fidelity® Series International Growth Fund | |
Fidelity® Series International Small Cap Fund | |
Fidelity® Series International Value Fund | |
To view a fund's proxy voting guidelines and proxy voting record for the 12-month period ended June 30, visit http://www.fidelity.com/proxyvotingresults or visit the Securities and Exchange Commission's (SEC) web site at http://www.sec.gov.
You may also call 1-800-544-8544, or for Class F, call 1-800-835-5092, to request a free copy of the proxy voting guidelines.
Standard & Poor's, S&P and S&P 500 are registered service marks of The McGraw-Hill Companies, Inc. and have been licensed for use by Fidelity Distributors Corporation.
Other third-party marks appearing herein are the property of their respective owners.
All other marks appearing herein are registered or unregistered trademarks or service marks of FMR LLC or an affiliated company. © 2016 FMR LLC. All rights reserved.
This report and the financial statements contained herein are submitted for the general information of the shareholders of the Funds. This report is not authorized for distribution to prospective investors in the Funds unless preceded or accompanied by an effective prospectus.
A fund files its complete schedule of portfolio holdings with the SEC for the first and third quarters of each fiscal year on Form N-Q. Forms N-Q are available on the SEC’s web site at http://www.sec.gov. A fund's Forms N-Q may be reviewed and copied at the SEC’s Public Reference Room in Washington, DC. Information regarding the operation of the SEC's Public Reference Room may be obtained by calling 1-800-SEC-0330.
For a complete list of a fund's portfolio holdings, view the most recent holdings listing, semiannual report, or annual report on Fidelity's web site at http://www.fidelity.com, http://www.advisor.fidelity.com, or http://www.401k.com, as applicable.
NOT FDIC INSURED •MAY LOSE VALUE •NO BANK GUARANTEE
Neither the Funds nor Fidelity Distributors Corporation is a bank.
Fidelity® Series Emerging Markets Fund
Investment Summary (Unaudited)
Geographic Diversification (% of fund's net assets)
| As of April 30, 2016 | ||
| Korea (South) | 13.1% | |
| Cayman Islands | 10.2% | |
| India | 8.5% | |
| Brazil | 8.1% | |
| China | 8.1% | |
| Taiwan | 6.6% | |
| South Africa | 6.0% | |
| Hong Kong | 5.6% | |
| Mexico | 5.5% | |
| Other* | 28.3% | |
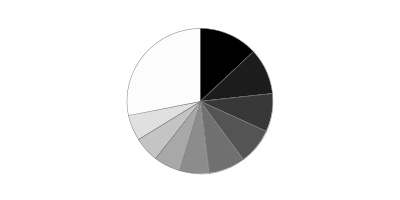
* Includes Short-Term investments and Net Other Assets (Liabilities).
Percentages are based on country or territory of incorporation and are adjusted for the effect of futures contracts, if applicable.
| As of October 31, 2015 | ||
| Korea (South) | 16.0% | |
| China | 10.1% | |
| India | 9.3% | |
| Cayman Islands | 9.2% | |
| Taiwan | 7.8% | |
| United States of America* | 6.9% | |
| Mexico | 5.8% | |
| Hong Kong | 5.8% | |
| South Africa | 5.2% | |
| Other | 23.9% | |
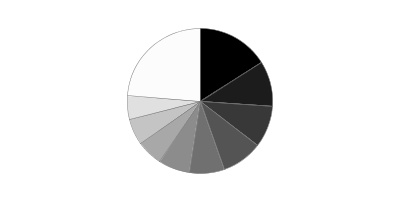
* Includes Short-Term investments and Net Other Assets (Liabilities).
Percentages are based on country or territory of incorporation and are adjusted for the effect of futures contracts, if applicable.
Asset Allocation as of April 30, 2016
| % of fund's net assets | % of fund's net assets 6 months ago | |
| Stocks and Equity Futures | 97.2 | 96.6 |
| Short-Term Investments and Net Other Assets (Liabilities) | 2.8 | 3.4 |
Top Ten Stocks as of April 30, 2016
| % of fund's net assets | % of fund's net assets 6 months ago | |
| Taiwan Semiconductor Manufacturing Co. Ltd. (Taiwan, Semiconductors & Semiconductor Equipment) | 3.2 | 3.4 |
| Naspers Ltd. Class N (South Africa, Media) | 2.8 | 2.0 |
| Tencent Holdings Ltd. (Cayman Islands, Internet Software & Services) | 2.2 | 2.9 |
| Alibaba Group Holding Ltd. sponsored ADR (Cayman Islands, Internet Software & Services) | 2.0 | 1.0 |
| China Mobile Ltd. (Hong Kong, Wireless Telecommunication Services) | 1.8 | 1.9 |
| Industrial & Commercial Bank of China Ltd. (H Shares) (China, Banks) | 1.8 | 2.2 |
| Samsung Electronics Co. Ltd. (Korea (South), Technology Hardware, Storage & Peripherals) | 1.5 | 2.4 |
| Grupo Financiero Banorte S.A.B. de CV Series O (Mexico, Banks) | 1.4 | 1.4 |
| Itau Unibanco Holding SA sponsored ADR (Brazil, Banks) | 1.3 | 0.7 |
| Lukoil PJSC sponsored ADR (Russia, Oil, Gas & Consumable Fuels) | 1.2 | 0.9 |
| 19.2 |
Market Sectors as of April 30, 2016
| % of fund's net assets | % of fund's net assets 6 months ago | |
| Financials | 25.6 | 26.6 |
| Information Technology | 19.2 | 18.1 |
| Consumer Discretionary | 10.9 | 9.2 |
| Consumer Staples | 8.0 | 8.0 |
| Energy | 7.7 | 7.0 |
| Materials | 7.0 | 5.9 |
| Industrials | 6.7 | 7.3 |
| Telecommunication Services | 5.5 | 5.9 |
| Utilities | 2.7 | 3.1 |
| Health Care | 2.6 | 2.5 |
Fidelity® Series Emerging Markets Fund
Investments April 30, 2016 (Unaudited)
Showing Percentage of Net Assets
| Common Stocks - 89.8% | |||
| Shares | Value | ||
| Argentina - 0.4% | |||
| Telecom Argentina SA Class B sponsored ADR | 1,225,573 | $22,942,727 | |
| YPF SA Class D sponsored ADR | 1,789,700 | 36,062,455 | |
| TOTAL ARGENTINA | 59,005,182 | ||
| Austria - 0.5% | |||
| Erste Group Bank AG | 2,251,140 | 64,751,016 | |
| Bermuda - 1.4% | |||
| AGTech Holdings Ltd. (a) | 32,412,000 | 7,510,464 | |
| Credicorp Ltd. (United States) | 356,140 | 51,789,879 | |
| GP Investments Ltd. Class A (depositary receipt) (a)(b) | 7,978,637 | 17,839,854 | |
| PAX Global Technology Ltd. | 35,103,000 | 30,231,430 | |
| Shangri-La Asia Ltd. | 74,510,000 | 91,024,757 | |
| TOTAL BERMUDA | 198,396,384 | ||
| Brazil - 3.6% | |||
| B2W Companhia Global do Varejo (a) | 9,293,794 | 37,021,146 | |
| BB Seguridade Participacoes SA | 10,427,200 | 90,954,714 | |
| BR Properties SA | 1,876,800 | 5,604,343 | |
| CCR SA | 9,393,000 | 44,189,501 | |
| Cielo SA | 7,361,025 | 71,700,033 | |
| Companhia de Saneamento de Minas Gerais | 4,484,270 | 28,032,799 | |
| Cosan SA Industria e Comercio | 3,579,900 | 33,142,114 | |
| Direcional Engenharia SA (b) | 14,063,000 | 25,147,183 | |
| Fibria Celulose SA | 2,655,900 | 23,460,418 | |
| FPC Par Corretora de Seguros (b) | 9,576,300 | 32,159,996 | |
| Minerva SA (a)(b) | 13,065,000 | 40,153,246 | |
| Smiles SA (b) | 6,617,500 | 76,772,043 | |
| TOTAL BRAZIL | 508,337,536 | ||
| British Virgin Islands - 0.2% | |||
| Mail.Ru Group Ltd. GDR (Reg. S) (a) | 1,498,401 | 30,342,620 | |
| Canada - 0.8% | |||
| Goldcorp, Inc. | 929,400 | 18,725,777 | |
| Pan American Silver Corp. | 4,616,300 | 72,337,421 | |
| Torex Gold Resources, Inc. (a) | 11,451,300 | 20,352,593 | |
| TOTAL CANADA | 111,415,791 | ||
| Cayman Islands - 10.0% | |||
| 51job, Inc. sponsored ADR (a)(c) | 897,400 | 26,742,520 | |
| 58.com, Inc. ADR (a)(c) | 2,764,820 | 151,097,413 | |
| AAC Technology Holdings, Inc. | 3,321,500 | 23,054,437 | |
| Alibaba Group Holding Ltd. sponsored ADR (a) | 3,723,000 | 286,447,620 | |
| Autohome, Inc. ADR Class A (a)(c) | 585,900 | 17,319,204 | |
| Bitauto Holdings Ltd. ADR (a) | 1,951,118 | 48,699,905 | |
| BizLink Holding, Inc. | 1,471,000 | 8,378,912 | |
| China State Construction International Holdings Ltd. | 30,250,000 | 47,120,574 | |
| CK Hutchison Holdings Ltd. | 2,585,270 | 30,929,195 | |
| Ctrip.com International Ltd. ADR (a) | 412,200 | 17,976,042 | |
| Haitian International Holdings Ltd. | 9,987,000 | 17,039,447 | |
| Himax Technologies, Inc. sponsored ADR (c) | 1,203,200 | 12,501,248 | |
| JD.com, Inc. sponsored ADR (a) | 4,221,100 | 107,891,316 | |
| Momo, Inc. ADR (a)(c) | 42 | 690 | |
| New Oriental Education & Technology Group, Inc. sponsored ADR | 907,500 | 35,537,700 | |
| Sino Biopharmaceutical Ltd. | 72,398,000 | 51,301,538 | |
| SouFun Holdings Ltd. ADR (c) | 5,558,200 | 31,626,158 | |
| Sunny Optical Technology Group Co. Ltd. | 7,486,000 | 23,088,736 | |
| Tencent Holdings Ltd. | 15,343,499 | 312,214,363 | |
| Uni-President China Holdings Ltd. | 112,252,000 | 104,536,758 | |
| Vipshop Holdings Ltd. ADR (a) | 3,672,100 | 50,087,444 | |
| TOTAL CAYMAN ISLANDS | 1,403,591,220 | ||
| Chile - 1.7% | |||
| Compania Cervecerias Unidas SA sponsored ADR | 2,762,340 | 61,931,663 | |
| CorpBanca SA | 3,366,286,545 | 30,637,577 | |
| Empresas CMPC SA | 9,984,850 | 22,578,977 | |
| Enersis Chile SA | 92,479,749 | 11,282,200 | |
| Enersis SA | 102,885,677 | 17,740,548 | |
| Inversiones La Construccion SA | 2,644,237 | 31,178,123 | |
| Vina Concha y Toro SA | 34,096,719 | 57,146,550 | |
| TOTAL CHILE | 232,495,638 | ||
| China - 8.1% | |||
| Anhui Conch Cement Co. Ltd. (H Shares) | 20,331,000 | 53,573,583 | |
| BBMG Corp. (H Shares) | 82,813,500 | 60,522,410 | |
| China Life Insurance Co. Ltd. (H Shares) | 37,711,900 | 86,871,519 | |
| China Longyuan Power Grid Corp. Ltd. (H Shares) | 46,382,910 | 32,089,954 | |
| China Pacific Insurance (Group) Co. Ltd. (H Shares) | 41,040,694 | 143,906,985 | |
| China Petroleum & Chemical Corp. (H Shares) | 60,810,000 | 42,851,878 | |
| China Suntien Green Energy Corp. Ltd. (H Shares) | 98,482,060 | 11,204,188 | |
| China Telecom Corp. Ltd. (H Shares) | 100,806,882 | 49,906,094 | |
| Industrial & Commercial Bank of China Ltd. (H Shares) | 463,735,400 | 248,284,356 | |
| Inner Mongoli Yili Industries Co. Ltd. | 18,714,979 | 43,448,249 | |
| Kweichow Moutai Co. Ltd. | 2,243,929 | 87,066,823 | |
| Maanshan Iron & Steel Ltd. (H Shares) (a) | 76,588,000 | 17,599,992 | |
| PetroChina Co. Ltd. (H Shares) | 45,254,000 | 33,109,192 | |
| PICC Property & Casualty Co. Ltd. (H Shares) | 35,104,500 | 63,857,813 | |
| Qingdao Haier Co. Ltd. | 49,166,637 | 63,261,496 | |
| Shanghai International Airport Co. Ltd. | 5,913,400 | 24,853,625 | |
| Zhengzhou Yutong Bus Co. Ltd. | 11,129,454 | 35,258,471 | |
| Zhuzhou CSR Times Electric Co. Ltd. (H Shares) | 5,932,500 | 33,754,392 | |
| TOTAL CHINA | 1,131,421,020 | ||
| Colombia - 0.3% | |||
| Bancolombia SA sponsored ADR | 1,199,211 | 46,397,474 | |
| Egypt - 0.1% | |||
| Citadel Capital Corp. (a) | 54,615,500 | 9,102,635 | |
| Global Telecom Holding GDR (a) | 4,474,041 | 7,382,168 | |
| TOTAL EGYPT | 16,484,803 | ||
| Greece - 0.4% | |||
| Titan Cement Co. SA (Reg.) | 2,498,700 | 56,999,479 | |
| Hong Kong - 5.6% | |||
| AIA Group Ltd. | 10,189,120 | 60,977,869 | |
| China Mobile Ltd. | 5,072,295 | 58,233,863 | |
| China Mobile Ltd. sponsored ADR | 3,494,370 | 200,996,162 | |
| China Resources Beer Holdings Co. Ltd. | 32,606,000 | 71,648,767 | |
| China Resources Power Holdings Co. Ltd. | 19,119,617 | 32,202,190 | |
| CNOOC Ltd. | 131,609,000 | 162,579,422 | |
| CNOOC Ltd. sponsored ADR | 16,626 | 2,052,147 | |
| Far East Horizon Ltd. | 130,942,750 | 103,939,387 | |
| Sinotruk Hong Kong Ltd. | 42,356,000 | 21,327,564 | |
| Techtronic Industries Co. Ltd. | 19,680,000 | 73,773,824 | |
| TOTAL HONG KONG | 787,731,195 | ||
| India - 8.5% | |||
| Adani Ports & Special Economic Zone | 13,886,403 | 49,796,256 | |
| Axis Bank Ltd. (a) | 6,364,422 | 45,262,030 | |
| Bharti Infratel Ltd. | 10,521,562 | 59,390,741 | |
| Coal India Ltd. | 18,137,268 | 78,651,121 | |
| Edelweiss Financial Services Ltd. | 18,456,472 | 16,129,321 | |
| Eicher Motors Ltd. (a) | 123,870 | 37,361,186 | |
| Grasim Industries Ltd. | 1,294,909 | 83,547,557 | |
| Housing Development Finance Corp. Ltd. | 749,032 | 12,273,658 | |
| ITC Ltd. | 16,045,827 | 78,495,329 | |
| JK Cement Ltd. | 3,237,991 | 28,918,686 | |
| Just Dial Ltd. | 1,453,341 | 18,519,702 | |
| Larsen & Toubro Ltd. (a) | 2,343,925 | 44,270,473 | |
| LIC Housing Finance Ltd. (a) | 5,398,323 | 37,570,582 | |
| Lupin Ltd. | 4,115,683 | 99,584,218 | |
| Oil & Natural Gas Corp. Ltd. | 13,762,074 | 45,009,982 | |
| Petronet LNG Ltd. | 7,718,773 | 30,625,025 | |
| Phoenix Mills Ltd. | 6,758,146 | 32,668,790 | |
| Power Grid Corp. of India Ltd. | 40,422,734 | 87,264,982 | |
| SREI Infrastructure Finance Ltd. (a)(b) | 42,943,661 | 38,434,045 | |
| State Bank of India (a) | 15,393,291 | 43,798,421 | |
| Sun Pharmaceutical Industries Ltd. | 9,047,458 | 110,502,784 | |
| Tata Consultancy Services Ltd. | 2,981,507 | 113,805,858 | |
| TOTAL INDIA | 1,191,880,747 | ||
| Indonesia - 0.8% | |||
| Link Net Tbk PT | 23,264,241 | 7,435,455 | |
| PT Bank Mandiri (Persero) Tbk | 51,996,600 | 37,797,611 | |
| PT Bank Rakyat Indonesia Tbk | 59,758,800 | 46,898,967 | |
| PT Kalbe Farma Tbk | 162,036,400 | 16,894,150 | |
| TOTAL INDONESIA | 109,026,183 | ||
| Israel - 0.5% | |||
| Bezeq The Israel Telecommunication Corp. Ltd. | 34,364,824 | 73,301,569 | |
| Japan - 0.2% | |||
| Rakuten, Inc. | 3,252,488 | 35,358,985 | |
| Korea (South) - 11.7% | |||
| AMOREPACIFIC Group, Inc. | 555,183 | 81,411,172 | |
| Daou Technology, Inc. | 1,492,078 | 30,475,157 | |
| Duk San Neolux Co. Ltd. (a) | 267,902 | 6,360,385 | |
| E-Mart Co. Ltd. | 331,274 | 53,059,357 | |
| EO Technics Co. Ltd. | 121,335 | 12,009,854 | |
| Fila Korea Ltd. (b) | 670,598 | 60,874,325 | |
| Hanon Systems | 3,478,090 | 31,269,188 | |
| Hyundai Glovis Co. Ltd. | 564,298 | 93,583,800 | |
| Hyundai Industrial Development & Construction Co. | 857,741 | 37,808,210 | |
| Hyundai Mobis | 703,525 | 159,965,315 | |
| InterPark INT Corp. | 1,189,034 | 20,289,886 | |
| Kakao Corp. | 219,868 | 19,287,088 | |
| KB Financial Group, Inc. | 2,766,445 | 84,181,636 | |
| KEPCO Plant Service & Engineering Co. Ltd. | 422,667 | 27,853,762 | |
| Korea Electric Power Corp. | 1,133,459 | 61,230,873 | |
| Korean Reinsurance Co. (b) | 6,399,415 | 74,290,021 | |
| KT Corp. | 664,566 | 17,704,288 | |
| KT Corp. sponsored ADR | 871,300 | 11,858,393 | |
| LG Chemical Ltd. | 313,189 | 81,189,808 | |
| NAVER Corp. | 50,816 | 30,028,090 | |
| NCSOFT Corp. | 215,349 | 43,044,424 | |
| Samsung Electronics Co. Ltd. | 197,530 | 214,654,985 | |
| Samsung Fire & Marine Insurance Co. Ltd. | 170,430 | 43,809,662 | |
| Samsung SDI Co. Ltd. | 388,324 | 38,640,047 | |
| Shinhan Financial Group Co. Ltd. | 4,168,123 | 151,991,108 | |
| SK Hynix, Inc. | 4,872,418 | 119,718,565 | |
| SK Telecom Co. Ltd. sponsored ADR | 1,222,600 | 24,452,000 | |
| Viatron Technologies, Inc. | 528,551 | 13,240,591 | |
| TOTAL KOREA (SOUTH) | 1,644,281,990 | ||
| Malaysia - 0.4% | |||
| Tenaga Nasional Bhd | 15,486,664 | 56,927,811 | |
| Mauritius - 0.1% | |||
| MakeMyTrip Ltd. (a)(c) | 897,300 | 16,474,428 | |
| Mexico - 5.5% | |||
| America Movil S.A.B. de CV Series L sponsored ADR (c) | 5,386,520 | 76,273,123 | |
| Banregio Grupo Financiero S.A.B. de CV | 3,672,471 | 22,007,525 | |
| CEMEX S.A.B. de CV sponsored ADR | 3,993,912 | 29,754,644 | |
| El Puerto de Liverpool S.A.B. de CV Class C | 5,200,400 | 59,114,381 | |
| Fibra Uno Administracion SA de CV | 33,984,500 | 80,908,657 | |
| Grupo Aeroportuario del Pacifico S.A.B. de CV Series B | 4,929,900 | 46,448,884 | |
| Grupo Comercial Chedraui S.A.B. de CV | 12,170,788 | 34,493,444 | |
| Grupo Financiero Banorte S.A.B. de CV Series O | 33,846,500 | 192,145,011 | |
| Infraestructura Energetica Nova S.A.B. de CV | 4,022,500 | 15,718,580 | |
| Macquarie Mexican (REIT) (b) | 71,857,048 | 98,902,035 | |
| Promotora y Operadora de Infraestructura S.A.B. de CV | 1,862,300 | 23,617,757 | |
| Tenedora Nemak SA de CV | 18,978,000 | 27,223,863 | |
| Wal-Mart de Mexico SA de CV Series V | 26,268,900 | 64,967,418 | |
| TOTAL MEXICO | 771,575,322 | ||
| Netherlands - 1.0% | |||
| Cnova NV (a)(c) | 1,583,573 | 5,542,506 | |
| Hangzhou Hikvision Digital Technology Co. Ltd. ELS (BNP Paribas Arbitrage Warrant Program) warrants 10/21/16 (a)(d) | 5,797,400 | 27,285,359 | |
| Yandex NV (a) | 5,245,480 | 107,374,976 | |
| TOTAL NETHERLANDS | 140,202,841 | ||
| Nigeria - 0.4% | |||
| Guaranty Trust Bank PLC GDR (Reg. S) | 3,406,217 | 11,921,760 | |
| Transnational Corp. of Nigeria PLC | 1,118,478,305 | 5,564,569 | |
| Zenith Bank PLC | 527,345,468 | 33,656,402 | |
| TOTAL NIGERIA | 51,142,731 | ||
| Pakistan - 0.4% | |||
| Habib Bank Ltd. | 28,820,300 | 51,958,770 | |
| Panama - 0.3% | |||
| Copa Holdings SA Class A | 645,900 | 41,176,125 | |
| Philippines - 1.4% | |||
| Alliance Global Group, Inc. | 162,411,350 | 50,068,344 | |
| Metro Pacific Investments Corp. | 136,833,756 | 16,873,303 | |
| Metropolitan Bank & Trust Co. | 36,796,507 | 63,563,648 | |
| Robinsons Land Corp. | 110,459,170 | 63,642,894 | |
| TOTAL PHILIPPINES | 194,148,189 | ||
| Romania - 0.2% | |||
| Banca Transilvania SA | 32,485,494 | 22,293,559 | |
| Russia - 5.0% | |||
| E.ON Russia JSC (a) | 451,634,400 | 18,400,759 | |
| Lukoil PJSC sponsored ADR | 4,091,900 | 173,435,182 | |
| Magnit OJSC GDR (Reg. S) | 1,533,200 | 53,048,720 | |
| MMC Norilsk Nickel PJSC sponsored ADR | 5,182,200 | 76,437,450 | |
| Mobile TeleSystems OJSC (a) | 10,103,640 | 39,504,895 | |
| Mobile TeleSystems OJSC sponsored ADR | 561,400 | 5,198,564 | |
| NOVATEK OAO GDR (Reg. S) | 883,300 | 84,796,800 | |
| Rosneft Oil Co. OJSC (a) | 16,583,500 | 89,865,429 | |
| Sberbank of Russia (a) | 19,392,840 | 37,023,355 | |
| Sberbank of Russia sponsored ADR | 11,894,231 | 95,344,156 | |
| Sistema JSFC (a) | 73,876,500 | 22,183,765 | |
| Sistema JSFC sponsored GDR | 832,100 | 6,115,935 | |
| TOTAL RUSSIA | 701,355,010 | ||
| Singapore - 1.0% | |||
| Ascendas Real Estate Investment Trust | 39,966,700 | 73,107,099 | |
| CapitaMall Trust | 16,210,900 | 24,951,900 | |
| First Resources Ltd. | 28,640,700 | 40,569,977 | |
| TOTAL SINGAPORE | 138,628,976 | ||
| South Africa - 6.0% | |||
| Alexander Forbes Group Holdings Ltd. (e) | 27,452,774 | 13,846,678 | |
| Aspen Pharmacare Holdings Ltd. (e) | 2,083,782 | 49,108,178 | |
| Barclays Africa Group Ltd. (f) | 7,617,767 | 77,219,844 | |
| Bidvest Group Ltd. | 2,390,145 | 60,660,093 | |
| Imperial Holdings Ltd. (e) | 4,965,600 | 51,985,274 | |
| JSE Ltd. | 2,056,792 | 23,841,608 | |
| Life Healthcare Group Holdings Ltd. (e) | 15,628,900 | 41,050,531 | |
| Naspers Ltd. Class N (e) | 2,904,300 | 398,499,278 | |
| Nedbank Group Ltd. | 2,363,200 | 30,230,500 | |
| Sasol Ltd. | 1,193,700 | 39,046,114 | |
| Shoprite Holdings Ltd. (e) | 1,792,709 | 21,563,763 | |
| Telkom SA Ltd. | 7,199,400 | 28,665,601 | |
| TOTAL SOUTH AFRICA | 835,717,462 | ||
| Spain - 0.4% | |||
| Banco Bilbao Vizcaya Argentaria SA | 7,359,800 | 50,575,112 | |
| Taiwan - 6.6% | |||
| Advanced Semiconductor Engineering, Inc. | 29,060,000 | 27,919,271 | |
| Advantech Co. Ltd. | 7,339,000 | 51,799,895 | |
| Boardtek Electronics Corp. | 10,592,000 | 15,214,339 | |
| Catcher Technology Co. Ltd. | 3,847,000 | 27,033,681 | |
| E.SUN Financial Holdings Co. Ltd. | 74,706,928 | 41,397,208 | |
| Hermes Microvision, Inc. | 438,000 | 13,491,317 | |
| Hon Hai Precision Industry Co. Ltd. (Foxconn) | 8,806,644 | 21,019,480 | |
| HTC Corp. | 6,577,000 | 16,776,919 | |
| Inotera Memories, Inc. (a) | 8,383,000 | 7,603,687 | |
| King's Town Bank | 27,933,000 | 19,456,165 | |
| Kingpak Technology, Inc. (a) | 1,591,000 | 15,514,503 | |
| Largan Precision Co. Ltd. | 517,000 | 36,330,681 | |
| MediaTek, Inc. | 1,398,000 | 9,953,874 | |
| Siliconware Precision Industries Co. Ltd. | 8,664,000 | 12,808,290 | |
| Taiwan Cement Corp. | 70,379,000 | 71,679,692 | |
| Taiwan Fertilizer Co. Ltd. | 16,134,000 | 21,901,244 | |
| Taiwan Semiconductor Manufacturing Co. Ltd. | 95,233,284 | 436,859,678 | |
| Taiwan Semiconductor Manufacturing Co. Ltd. sponsored ADR | 469,801 | 11,082,606 | |
| Universal Cement Corp. | 26,555,559 | 16,975,894 | |
| Vanguard International Semiconductor Corp. | 11,379,000 | 17,419,173 | |
| Wistron NeWeb Corp. | 5,660,000 | 14,718,138 | |
| Yuanta Financial Holding Co. Ltd. | 70,926,206 | 23,383,713 | |
| TOTAL TAIWAN | 930,339,448 | ||
| Thailand - 2.7% | |||
| Advanced Info Service PCL (For. Reg.) | 3,697,700 | 16,518,935 | |
| Airports of Thailand PCL (For. Reg.) | 4,310,900 | 48,392,692 | |
| Intouch Holdings PCL NVDR | 8,901,070 | 13,445,918 | |
| Jasmine Broadband Internet Infrastructure Fund | 77,457,700 | 20,850,584 | |
| Kasikornbank PCL (For. Reg.) | 22,019,704 | 105,306,145 | |
| PTT Global Chemical PCL (For. Reg.) | 14,802,000 | 26,492,698 | |
| PTT PCL (For. Reg.) | 7,662,400 | 66,705,888 | |
| Star Petroleum Refining PCL | 75,532,500 | 23,793,170 | |
| Thai Union Frozen Products PCL (For. Reg.) | 88,918,100 | 52,709,183 | |
| TOTAL THAILAND | 374,215,213 | ||
| Turkey - 1.4% | |||
| Aselsan A/S | 4,268,000 | 30,446,490 | |
| Enka Insaat ve Sanayi A/S | 13,589,000 | 23,603,481 | |
| Tupras Turkiye Petrol Rafinelleri A/S | 2,499,796 | 65,979,248 | |
| Turkiye Garanti Bankasi A/S | 16,056,500 | 49,425,398 | |
| Turkiye Halk Bankasi A/S | 7,730,000 | 29,698,892 | |
| TOTAL TURKEY | 199,153,509 | ||
| United Arab Emirates - 1.0% | |||
| DP World Ltd. | 2,154,355 | 40,717,310 | |
| Emaar Properties PJSC | 28,452,195 | 52,676,339 | |
| First Gulf Bank PJSC | 15,195,728 | 53,577,467 | |
| TOTAL UNITED ARAB EMIRATES | 146,971,116 | ||
| United Kingdom - 0.5% | |||
| Fresnillo PLC | 2,757,200 | 44,839,239 | |
| HSBC Holdings PLC (Hong Kong) | 3,251,120 | 21,641,191 | |
| TOTAL UNITED KINGDOM | 66,480,430 | ||
| United States of America - 0.7% | |||
| Cognizant Technology Solutions Corp. Class A (a) | 700,672 | 40,898,225 | |
| First Cash Financial Services, Inc. | 732,500 | 33,497,225 | |
| Micron Technology, Inc. (a) | 2,554,000 | 27,455,500 | |
| TOTAL UNITED STATES OF AMERICA | 101,850,950 | ||
| TOTAL COMMON STOCKS | |||
| (Cost $12,072,394,293) | 12,592,405,834 | ||
| Nonconvertible Preferred Stocks - 6.1% | |||
| Brazil - 4.5% | |||
| Ambev SA sponsored ADR | 27,895,500 | 155,935,845 | |
| Banco do Estado Rio Grande do Sul SA | 9,154,536 | 22,651,770 | |
| Companhia Paranaense de Energia-Copel: | |||
| (PN-B) | 165,000 | 1,358,189 | |
| (PN-B) sponsored ADR (c) | 3,758,539 | 31,083,118 | |
| Itau Unibanco Holding SA sponsored ADR | 19,418,486 | 185,058,172 | |
| Metalurgica Gerdau SA (PN) (b) | 40,120,622 | 33,946,648 | |
| Petroleo Brasileiro SA - Petrobras (PN) sponsored (non-vtg.) (a) | 12,664,800 | 74,722,320 | |
| Telefonica Brasil SA | 2,799,100 | 34,475,504 | |
| Vale SA (PN-A) sponsored ADR | 19,368,000 | 87,930,720 | |
| TOTAL BRAZIL | 627,162,286 | ||
| Cayman Islands - 0.2% | |||
| China Internet Plus Holdings Ltd. Series A-11 (g) | 7,577,282 | 29,253,613 | |
| Korea (South) - 1.4% | |||
| Hyundai Motor Co. Series 2 | 916,314 | 79,900,293 | |
| Samsung Electronics Co. Ltd. | 87,548 | 79,701,978 | |
| Samsung Fire & Marine Insurance Co. Ltd. | 209,341 | 34,260,534 | |
| TOTAL KOREA (SOUTH) | 193,862,805 | ||
| TOTAL NONCONVERTIBLE PREFERRED STOCKS | |||
| (Cost $898,151,611) | 850,278,704 | ||
| Principal Amount | Value | ||
| Government Obligations - 0.2% | |||
| United States of America - 0.2% | |||
| U.S. Treasury Bills, yield at date of purchase 0.2% to 0.33% 5/5/16 to 6/30/16 (Cost $25,736,603)(h) | 25,740,000 | 25,738,494 | |
| Shares | Value | ||
| Money Market Funds - 4.6% | |||
| Fidelity Cash Central Fund, 0.38% (i) | 584,729,400 | 584,729,400 | |
| Fidelity Securities Lending Cash Central Fund, 0.42% (i)(j) | 58,758,275 | 58,758,275 | |
| TOTAL MONEY MARKET FUNDS | |||
| (Cost $643,487,675) | 643,487,675 | ||
| TOTAL INVESTMENT PORTFOLIO - 100.7% | |||
| (Cost $13,639,770,182) | 14,111,910,707 | ||
| NET OTHER ASSETS (LIABILITIES) - (0.7)% | (97,079,738) | ||
| NET ASSETS - 100% | $14,014,830,969 |
| Futures Contracts | |||
| Expiration Date | Underlying Face Amount at Value | Unrealized Appreciation/(Depreciation) | |
| Purchased | |||
| Equity Index Contracts | |||
| 4,391 ICE E-mini MSCI Emerging Markets Index Contracts (United States) | June 2016 | 184,070,720 | $8,763,166 |
The face value of futures purchased as a percentage of Net Assets is 1.3%
For the period, the average monthly underlying face amount at value for futures contracts in the aggregate was $534,134,742.
Security Type Abbreviations
ELS – Equity-Linked Security
Categorizations in the Schedule of Investments are based on country or territory of incorporation.
Legend
(a) Non-income producing
(b) Affiliated company
(c) Security or a portion of the security is on loan at period end.
(d) Security exempt from registration under Rule 144A of the Securities Act of 1933. These securities may be resold in transactions exempt from registration, normally to qualified institutional buyers. At the end of the period, the value of these securities amounted to $27,285,359 or 0.2% of net assets.
(e) Security or a portion of the security purchased on a delayed delivery or when-issued basis.
(f) A portion of the security sold on a delayed delivery basis.
(g) Restricted securities - Investment in securities not registered under the Securities Act of 1933 (excluding 144A issues). At the end of the period, the value of restricted securities (excluding 144A issues) amounted to $29,253,613 or 0.2% of net assets.
(h) Security or a portion of the security was pledged to cover margin requirements for futures contracts. At period end, the value of securities pledged amounted to $10,827,688.
(i) Affiliated fund that is generally available only to investment companies and other accounts managed by Fidelity Investments. The rate quoted is the annualized seven-day yield of the fund at period end. A complete unaudited listing of the fund's holdings as of its most recent quarter end is available upon request. In addition, each Fidelity Central Fund's financial statements are available on the SEC's website or upon request.
(j) Investment made with cash collateral received from securities on loan.
Additional information on each restricted holding is as follows:
| Security | Acquisition Date | Acquisition Cost |
| China Internet Plus Holdings Ltd. Series A-11 | 1/26/15 | $23,950,652 |
Affiliated Central Funds
Information regarding fiscal year to date income earned by the Fund from investments in Fidelity Central Funds is as follows:
| Fund | Income earned |
| Fidelity Cash Central Fund | $1,456,017 |
| Fidelity Securities Lending Cash Central Fund | 360,621 |
| Total | $1,816,638 |
Other Affiliated Issuers
An affiliated company is a company in which the Fund has ownership of at least 5% of the voting securities. Fiscal year to date transactions with companies which are or were affiliates are as follows:
| Affiliate | Value, beginning of period | Purchases | Sales Proceeds | Dividend Income | Value, end of period |
| Aquarius Platinum Ltd. (Australia) | $15,805,131 | $-- | $-- | $-- | $-- |
| China Suntien Green Energy Corp. Ltd. (H Shares) | 18,471,705 | 1,521,804 | 1,744,817 | -- | -- |
| Direcional Engenharia SA | 12,974,783 | -- | 57,853 | -- | 25,147,183 |
| Fila Korea Ltd. | 57,918,933 | 4,383,793 | 3,491,849 | 112,515 | 60,874,325 |
| FPC Par Corretora de Seguros | 21,739,477 | 5,222,561 | -- | 911,382 | 32,159,996 |
| GP Investments Ltd. Class A (depositary receipt) | 17,741,993 | -- | 3,249,032 | -- | 17,839,854 |
| Korean Reinsurance Co. | 75,545,757 | 4,142,790 | 3,302,063 | 1,474,719 | 74,290,021 |
| Macquarie Mexican (REIT) | 99,884,761 | 29,605 | 139,726 | 3,682,854 | 98,902,035 |
| Metalurgica Gerdau SA (PN) | -- | 18,809,798 | -- | -- | 33,946,648 |
| Minerva SA | 40,386,125 | 2,654,775 | -- | -- | 40,153,246 |
| Smiles SA | 23,204,758 | 40,739,545 | 3,095,324 | 122,868 | 76,772,043 |
| SREI Infrastructure Finance Ltd. | 30,184,892 | -- | 1,109,273 | -- | 38,434,045 |
| Total | $413,858,315 | $77,504,671 | $16,189,937 | $6,304,338 | $498,519,396 |
Investment Valuation
The following is a summary of the inputs used, as of April 30, 2016, involving the Fund's assets and liabilities carried at fair value. The inputs or methodology used for valuing securities may not be an indication of the risk associated with investing in those securities. For more information on valuation inputs, and their aggregation into the levels used below, please refer to the Investment Valuation section in the accompanying Notes to Financial Statements.
| Valuation Inputs at Reporting Date: | ||||
| Description | Total | Level 1 | Level 2 | Level 3 |
| Investments in Securities: | ||||
| Equities: | ||||
| Consumer Discretionary | $1,554,244,286 | $1,324,833,107 | $200,157,566 | $29,253,613 |
| Consumer Staples | 1,102,186,264 | 926,000,739 | 176,185,525 | -- |
| Energy | 1,093,631,675 | 804,840,881 | 288,790,794 | -- |
| Financials | 3,557,539,370 | 2,389,780,671 | 1,167,758,699 | -- |
| Health Care | 368,441,399 | 317,139,861 | 51,301,538 | -- |
| Industrials | 945,399,064 | 795,227,892 | 150,171,172 | -- |
| Information Technology | 2,701,517,093 | 1,827,830,424 | 873,686,669 | -- |
| Materials | 956,125,315 | 683,882,294 | 272,243,021 | -- |
| Telecommunication Services | 775,985,700 | 610,636,560 | 165,349,140 | -- |
| Utilities | 387,614,372 | 262,091,355 | 125,523,017 | -- |
| Government Obligations | 25,738,494 | -- | 25,738,494 | -- |
| Money Market Funds | 643,487,675 | 643,487,675 | -- | -- |
| Total Investments in Securities: | $14,111,910,707 | $10,585,751,459 | $3,496,905,635 | $29,253,613 |
| Derivative Instruments: | ||||
| Assets | ||||
| Futures Contracts | $8,763,166 | $8,763,166 | $-- | $-- |
| Total Assets | $8,763,166 | $8,763,166 | $-- | $-- |
| Total Derivative Instruments: | $8,763,166 | $8,763,166 | $-- | $-- |
The following is a summary of transfers between Level 1 and Level 2 for the period ended April 30, 2016. Transfers are assumed to have occurred at the beginning of the period, and are primarily attributable to the valuation techniques used for foreign equity securities, as discussed in the accompanying Notes to Financial Statements:
| Transfers | Total |
| Level 1 to Level 2 | $47,857,785 |
| Level 2 to Level 1 | $1,800,154,125 |
Value of Derivative Instruments
The following table is a summary of the Fund's value of derivative instruments by primary risk exposure as of April 30, 2016. For additional information on derivative instruments, please refer to the Derivative Instruments section in the accompanying Notes to Financial Statements.
| Primary Risk Exposure / Derivative Type | Value | |
| Asset | Liability | |
| Equity Risk | ||
| Futures Contracts(a) | $8,763,166 | $0 |
| Total Value of Derivatives | $8,763,166 | $0 |
(a) Reflects gross cumulative appreciation (depreciation) on futures contracts as presented in the Schedule of Investments. In the Statement of Assets and Liabilities, the period end daily variation margin is included in receivable or payable for daily variation margin for derivative instruments, and the net cumulative appreciation (depreciation) is included in net unrealized appreciation (depreciation).
See accompanying notes which are an integral part of the financial statements.
Fidelity® Series Emerging Markets Fund
Financial Statements
Statement of Assets and Liabilities
| April 30, 2016 (Unaudited) | ||
| Assets | ||
| Investment in securities, at value (including securities loaned of $56,971,110) — See accompanying schedule: Unaffiliated issuers (cost $12,490,655,885) | $12,969,903,636 | |
| Fidelity Central Funds (cost $643,487,675) | 643,487,675 | |
| Other affiliated issuers (cost $505,626,622) | 498,519,396 | |
| Total Investments (cost $13,639,770,182) | $14,111,910,707 | |
| Cash | 604,339 | |
| Foreign currency held at value (cost $12,772,008) | 12,776,438 | |
| Receivable for investments sold | ||
| Regular delivery | 52,534,011 | |
| Delayed delivery | 345,048 | |
| Receivable for fund shares sold | 8,371,424 | |
| Dividends receivable | 14,038,078 | |
| Distributions receivable from Fidelity Central Funds | 276,830 | |
| Prepaid expenses | 6,189 | |
| Other receivables | 124,583 | |
| Total assets | 14,200,987,647 | |
| Liabilities | ||
| Payable for investments purchased | ||
| Regular delivery | $92,038,675 | |
| Delayed delivery | 13,204,805 | |
| Payable for fund shares redeemed | 9,004,678 | |
| Accrued management fee | 9,227,360 | |
| Payable for daily variation margin for derivative instruments | 1,063,568 | |
| Other affiliated payables | 1,002,368 | |
| Other payables and accrued expenses | 1,856,949 | |
| Collateral on securities loaned, at value | 58,758,275 | |
| Total liabilities | 186,156,678 | |
| Net Assets | $14,014,830,969 | |
| Net Assets consist of: | ||
| Paid in capital | $14,864,305,371 | |
| Undistributed net investment income | 24,560,825 | |
| Accumulated undistributed net realized gain (loss) on investments and foreign currency transactions | (1,355,050,896) | |
| Net unrealized appreciation (depreciation) on investments and assets and liabilities in foreign currencies | 481,015,669 | |
| Net Assets | $14,014,830,969 | |
| Series Emerging Markets: | ||
| Net Asset Value, offering price and redemption price per share ($6,475,887,207 ÷ 427,690,289 shares) | $15.14 | |
| Class F: | ||
| Net Asset Value, offering price and redemption price per share ($7,538,943,762 ÷ 496,514,606 shares) | $15.18 |
See accompanying notes which are an integral part of the financial statements.
Statement of Operations
| Six months ended April 30, 2016 (Unaudited) | ||
| Investment Income | ||
| Dividends (including $6,304,338 earned from other affiliated issuers) | $122,344,004 | |
| Interest | 36,358 | |
| Income from Fidelity Central Funds | 1,816,638 | |
| Income before foreign taxes withheld | 124,197,000 | |
| Less foreign taxes withheld | (12,424,894) | |
| Total income | 111,772,106 | |
| Expenses | ||
| Management fee | $49,296,461 | |
| Transfer agent fees | 4,745,994 | |
| Accounting and security lending fees | 943,583 | |
| Custodian fees and expenses | 3,329,030 | |
| Independent trustees' compensation | 26,033 | |
| Registration fees | 93,584 | |
| Audit | 87,360 | |
| Legal | 14,554 | |
| Miscellaneous | 38,125 | |
| Total expenses before reductions | 58,574,724 | |
| Expense reductions | (229,141) | 58,345,583 |
| Net investment income (loss) | 53,426,523 | |
| Realized and Unrealized Gain (Loss) | ||
| Net realized gain (loss) on: | ||
| Investment securities: | ||
| Unaffiliated issuers (net of foreign taxes of $138,525) | (338,062,284) | |
| Other affiliated issuers | (40,824,285) | |
| Foreign currency transactions | 995,629 | |
| Futures contracts | 20,896,544 | |
| Total net realized gain (loss) | (356,994,396) | |
| Change in net unrealized appreciation (depreciation) on: Investment securities (net of decrease in deferred foreign taxes of $720,334) | 481,544,250 | |
| Assets and liabilities in foreign currencies | 231,428 | |
| Futures contracts | 3,454,797 | |
| Total change in net unrealized appreciation (depreciation) | $485,230,475 | |
| Net gain (loss) | 128,236,079 | |
| Net increase (decrease) in net assets resulting from operations | $181,662,602 |
See accompanying notes which are an integral part of the financial statements.
Statement of Changes in Net Assets
| Six months ended April 30, 2016 (Unaudited) | Year ended October 31, 2015 | |
| Increase (Decrease) in Net Assets | ||
| Operations | ||
| Net investment income (loss) | $53,426,523 | $152,994,942 |
| Net realized gain (loss) | (356,994,396) | (735,166,832) |
| Change in net unrealized appreciation (depreciation) | 485,230,475 | (961,074,063) |
| Net increase (decrease) in net assets resulting from operations | 181,662,602 | (1,543,245,953) |
| Distributions to shareholders from net investment income | (158,339,864) | (89,825,646) |
| Share transactions - net increase (decrease) | 2,079,267,572 | 3,499,387,207 |
| Total increase (decrease) in net assets | 2,102,590,310 | 1,866,315,608 |
| Net Assets | ||
| Beginning of period | 11,912,240,659 | 10,045,925,051 |
| End of period (including undistributed net investment income of $24,560,825 and undistributed net investment income of $129,474,166, respectively) | $14,014,830,969 | $11,912,240,659 |
See accompanying notes which are an integral part of the financial statements.
Financial Highlights — Fidelity Series Emerging Markets
| Six months ended (Unaudited) April 30, | Years ended October 31, | |||||
| 2016 | 2015 | 2014 | 2013 | 2012 | 2011 | |
| Selected Per–Share Data | ||||||
| Net asset value, beginning of period | $15.31 | $17.77 | $17.56 | $16.25 | $16.06 | $18.85 |
| Income from Investment Operations | ||||||
| Net investment income (loss)A | .06 | .21B | .21 | .20 | .21 | .18 |
| Net realized and unrealized gain (loss) | (.05)C | (2.53) | .17 | 1.34 | .59 | (2.19) |
| Total from investment operations | .01 | (2.32) | .38 | 1.54 | .80 | (2.01) |
| Distributions from net investment income | (.18) | (.14) | (.17) | (.22) | (.09) | (.10) |
| Distributions from net realized gain | – | – | (.01) | (.01) | (.52) | (.68) |
| Total distributions | (.18) | (.14) | (.17)D | (.23) | (.61) | (.78) |
| Net asset value, end of period | $15.14 | $15.31 | $17.77 | $17.56 | $16.25 | $16.06 |
| Total ReturnE,F | .11% | (13.14)% | 2.20% | 9.59% | 5.40% | (11.26)% |
| Ratios to Average Net AssetsG,H | ||||||
| Expenses before reductions | 1.04%I | 1.04% | 1.06% | 1.09% | 1.10% | 1.12% |
| Expenses net of fee waivers, if any | 1.03%I | 1.04% | 1.06% | 1.09% | 1.10% | 1.12% |
| Expenses net of all reductions | 1.03%I | 1.03% | 1.06% | 1.06% | 1.07% | 1.07% |
| Net investment income (loss) | .78%I | 1.29%B | 1.18% | 1.22% | 1.37% | 1.00% |
| Supplemental Data | ||||||
| Net assets, end of period (000 omitted) | $6,475,887 | $5,571,493 | $4,837,497 | $3,623,928 | $3,182,644 | $3,384,616 |
| Portfolio turnover rateJ | 46%I | 64% | 93% | 79% | 80% | 104% |
A Calculated based on average shares outstanding during the period.
B Net Investment income per share reflects a large, non-recurring dividend which amounted to $.05 per share. Excluding this non-recurring dividend, the ratio of net investment income (loss) to average net assets would have been 1.00%.
C The amount shown for a share outstanding does not correspond with the aggregate net gain (loss) on investments for the period due to the timing of sales and repurchases of shares in relation to fluctuating market values of the investments of the Fund.
D Total distributions of $.17 per share is comprised of distributions from net investment income of $.166 and distributions from net realized gain of $.006 per share.
E Total returns for periods of less than one year are not annualized.
F Total returns would have been lower if certain expenses had not been reduced during the applicable periods shown.
G Fees and expenses of any underlying Fidelity Central Funds are not included in the Fund's expense ratio. The Fund indirectly bears its proportionate share of the expenses of any underlying Fidelity Central Funds.
H Expense ratios reflect operating expenses of the class. Expenses before reductions do not reflect amounts reimbursed by the investment adviser or reductions from brokerage service arrangements or reductions from other expense offset arrangements and do not represent the amount paid by the class during periods when reimbursements or reductions occur. Expenses net of fee waivers reflect expenses after reimbursement by the investment adviser but prior to reductions from brokerage service arrangements or other expense offset arrangements. Expenses net of all reductions represent the net expenses paid by the class.
I Annualized
J Amount does not include the portfolio activity of any underlying Fidelity Central Funds.
See accompanying notes which are an integral part of the financial statements.
Financial Highlights — Fidelity Series Emerging Markets Fund Class F
| Six months ended (Unaudited) April 30, | Years ended October 31, | |||||
| 2016 | 2015 | 2014 | 2013 | 2012 | 2011 | |
| Selected Per–Share Data | ||||||
| Net asset value, beginning of period | $15.36 | $17.83 | $17.62 | $16.30 | $16.11 | $18.90 |
| Income from Investment Operations | ||||||
| Net investment income (loss)A | .07 | .24B | .24 | .23 | .25 | .21 |
| Net realized and unrealized gain (loss) | (.04)C | (2.54) | .17 | 1.35 | .58 | (2.19) |
| Total from investment operations | .03 | (2.30) | .41 | 1.58 | .83 | (1.98) |
| Distributions from net investment income | (.21) | (.17) | (.19) | (.26) | (.12) | (.13) |
| Distributions from net realized gain | – | – | (.01) | (.01) | (.52) | (.68) |
| Total distributions | (.21) | (.17) | (.20) | (.26)D | (.64) | (.81) |
| Net asset value, end of period | $15.18 | $15.36 | $17.83 | $17.62 | $16.30 | $16.11 |
| Total ReturnE,F | .21% | (13.02)% | 2.35% | 9.84% | 5.60% | (11.07)% |
| Ratios to Average Net AssetsG,H | ||||||
| Expenses before reductions | .87%I | .88% | .89% | .90% | .90% | .91% |
| Expenses net of fee waivers, if any | .87%I | .88% | .89% | .90% | .90% | .91% |
| Expenses net of all reductions | .87%I | .87% | .89% | .88% | .87% | .86% |
| Net investment income (loss) | .94%I | 1.45%B | 1.35% | 1.40% | 1.57% | 1.21% |
| Supplemental Data | ||||||
| Net assets, end of period (000 omitted) | $7,538,944 | $6,340,748 | $5,208,429 | $3,490,320 | $2,570,780 | $1,471,427 |
| Portfolio turnover rateJ | 46%I | 64% | 93% | 79% | 80% | 104% |
A Calculated based on average shares outstanding during the period.
B Net Investment income per share reflects a large, non-recurring dividend which amounted to $.05 per share. Excluding this non-recurring dividend, the ratio of net investment income (loss) to average net assets would have been 1.17%.
C The amount shown for a share outstanding does not correspond with the aggregate net gain (loss) on investments for the period due to the timing of sales and repurchases of shares in relation to fluctuating market values of the investments of the Fund.
D Total distributions of $.26 per share is comprised of distributions from net investment income of $.255 and distributions from net realized gain of $.009 per share.
E Total returns for periods of less than one year are not annualized.
F Total returns would have been lower if certain expenses had not been reduced during the applicable periods shown.
G Fees and expenses of any underlying Fidelity Central Funds are not included in the Fund's expense ratio. The Fund indirectly bears its proportionate share of the expenses of any underlying Fidelity Central Funds.
H Expense ratios reflect operating expenses of the class. Expenses before reductions do not reflect amounts reimbursed by the investment adviser or reductions from brokerage service arrangements or reductions from other expense offset arrangements and do not represent the amount paid by the class during periods when reimbursements or reductions occur. Expenses net of fee waivers reflect expenses after reimbursement by the investment adviser but prior to reductions from brokerage service arrangements or other expense offset arrangements. Expenses net of all reductions represent the net expenses paid by the class.
I Annualized
J Amount does not include the portfolio activity of any underlying Fidelity Central Funds.
See accompanying notes which are an integral part of the financial statements.
Fidelity® Series International Growth Fund
Investment Summary (Unaudited)
Geographic Diversification (% of fund's net assets)
| As of April 30, 2016 | ||
| United States of America* | 22.1% | |
| Japan | 14.2% | |
| United Kingdom | 13.3% | |
| Switzerland | 12.8% | |
| Spain | 4.7% | |
| Belgium | 4.3% | |
| Australia | 4.0% | |
| Sweden | 3.8% | |
| Denmark | 3.1% | |
| Other | 17.7% | |

* Includes Short-Term investments and Net Other Assets (Liabilities).
Percentages are based on country or territory of incorporation and are adjusted for the effect of futures contracts, if applicable.
| As of October 31, 2015 | ||
| United States of America* | 17.2% | |
| United Kingdom | 14.7% | |
| Japan | 14.5% | |
| Switzerland | 13.8% | |
| Sweden | 5.5% | |
| Belgium | 4.3% | |
| Spain | 4.3% | |
| Australia | 3.4% | |
| Denmark | 3.1% | |
| Other | 19.2% | |

* Includes Short-Term investments and Net Other Assets (Liabilities).
Percentages are based on country or territory of incorporation and are adjusted for the effect of futures contracts, if applicable.
Asset Allocation as of April 30, 2016
| % of fund's net assets | % of fund's net assets 6 months ago | |
| Stocks | 95.7 | 98.0 |
| Short-Term Investments and Net Other Assets (Liabilities) | 4.3 | 2.0 |
Top Ten Stocks as of April 30, 2016
| % of fund's net assets | % of fund's net assets 6 months ago | |
| Nestle SA (Switzerland, Food Products) | 4.9 | 3.0 |
| Roche Holding AG (participation certificate) (Switzerland, Pharmaceuticals) | 3.5 | 3.6 |
| Anheuser-Busch InBev SA NV (Belgium, Beverages) | 3.3 | 2.7 |
| Reckitt Benckiser Group PLC (United Kingdom, Household Products) | 3.1 | 2.8 |
| Novartis AG (Switzerland, Pharmaceuticals) | 3.1 | 3.8 |
| CSL Ltd. (Australia, Biotechnology) | 2.9 | 2.2 |
| Novo Nordisk A/S Series B sponsored ADR (Denmark, Pharmaceuticals) | 2.6 | 2.4 |
| Inditex SA (Spain, Specialty Retail) | 2.6 | 2.6 |
| ASSA ABLOY AB (B Shares) (Sweden, Building Products) | 2.5 | 2.0 |
| InterContinental Hotel Group PLC ADR (United Kingdom, Hotels, Restaurants & Leisure) | 2.2 | 2.1 |
| 30.7 |
Market Sectors as of April 30, 2016
| % of fund's net assets | % of fund's net assets 6 months ago | |
| Consumer Staples | 20.3 | 15.9 |
| Health Care | 18.6 | 18.8 |
| Financials | 14.0 | 18.2 |
| Information Technology | 13.9 | 11.3 |
| Consumer Discretionary | 13.2 | 15.1 |
| Industrials | 10.7 | 12.1 |
| Materials | 4.3 | 6.0 |
| Energy | 0.4 | 0.4 |
| Telecommunication Services | 0.3 | 0.2 |
Fidelity® Series International Growth Fund
Investments April 30, 2016 (Unaudited)
Showing Percentage of Net Assets
| Common Stocks - 95.7% | |||
| Shares | Value | ||
| Australia - 4.0% | |||
| CSL Ltd. | 4,353,835 | $348,191,915 | |
| Sydney Airport unit | 7,532,050 | 39,000,831 | |
| Transurban Group unit | 10,438,207 | 91,906,878 | |
| TOTAL AUSTRALIA | 479,099,624 | ||
| Austria - 1.2% | |||
| Andritz AG | 2,497,198 | 139,854,064 | |
| Belgium - 4.3% | |||
| Anheuser-Busch InBev SA NV | 3,220,981 | 398,692,722 | |
| KBC Groep NV | 2,156,204 | 121,053,177 | |
| TOTAL BELGIUM | 519,745,899 | ||
| Canada - 0.4% | |||
| Pason Systems, Inc. | 3,587,269 | 52,149,348 | |
| Cayman Islands - 0.9% | |||
| 58.com, Inc. ADR (a) | 936,000 | 51,152,400 | |
| Alibaba Group Holding Ltd. sponsored ADR (a) | 728,100 | 56,020,014 | |
| TOTAL CAYMAN ISLANDS | 107,172,414 | ||
| Denmark - 3.1% | |||
| Jyske Bank A/S (Reg.) | 1,482,200 | 60,681,788 | |
| Novo Nordisk A/S Series B sponsored ADR | 5,714,281 | 318,799,737 | |
| TOTAL DENMARK | 379,481,525 | ||
| Finland - 0.3% | |||
| Tikkurila Oyj | 1,960,479 | 34,368,600 | |
| France - 1.0% | |||
| Essilor International SA | 953,262 | 123,397,766 | |
| Germany - 2.9% | |||
| Bayer AG | 1,099,100 | 126,796,339 | |
| SAP AG | 2,897,446 | 227,336,649 | |
| TOTAL GERMANY | 354,132,988 | ||
| Hong Kong - 1.9% | |||
| AIA Group Ltd. | 38,352,000 | 229,521,609 | |
| India - 0.5% | |||
| Housing Development Finance Corp. Ltd. | 3,893,267 | 63,795,176 | |
| Ireland - 2.9% | |||
| CRH PLC sponsored ADR | 6,210,505 | 180,787,801 | |
| James Hardie Industries PLC CDI | 12,129,270 | 170,892,748 | |
| TOTAL IRELAND | 351,680,549 | ||
| Isle of Man - 0.5% | |||
| Playtech Ltd. | 4,669,475 | 54,889,453 | |
| Israel - 0.3% | |||
| Azrieli Group | 1,019,186 | 40,478,851 | |
| Italy - 0.8% | |||
| Azimut Holding SpA | 1,613,606 | 40,611,557 | |
| Interpump Group SpA | 3,440,349 | 49,517,901 | |
| TOTAL ITALY | 90,129,458 | ||
| Japan - 14.2% | |||
| Astellas Pharma, Inc. | 17,563,100 | 236,796,147 | |
| Coca-Cola Central Japan Co. Ltd. | 1,622,500 | 29,725,667 | |
| DENSO Corp. | 5,162,300 | 196,225,071 | |
| East Japan Railway Co. | 1,325,700 | 116,629,890 | |
| Hoya Corp. | 2,307,800 | 88,375,530 | |
| Japan Tobacco, Inc. | 4,205,800 | 171,840,320 | |
| Keyence Corp. | 277,200 | 166,151,747 | |
| Mitsui Fudosan Co. Ltd. | 5,849,000 | 142,846,813 | |
| Nintendo Co. Ltd. | 462,000 | 62,555,273 | |
| Olympus Corp. | 2,034,800 | 79,268,940 | |
| OSG Corp. | 2,332,400 | 43,344,435 | |
| Seven Bank Ltd. | 23,173,500 | 98,469,020 | |
| Shinsei Bank Ltd. | 35,359,000 | 49,558,341 | |
| SHO-BOND Holdings Co. Ltd. (b) | 1,557,600 | 67,396,048 | |
| USS Co. Ltd. | 10,690,800 | 169,110,764 | |
| TOTAL JAPAN | 1,718,294,006 | ||
| Kenya - 0.3% | |||
| Safaricom Ltd. | 210,780,000 | 35,686,515 | |
| Korea (South) - 0.9% | |||
| BGFretail Co. Ltd. | 380,318 | 61,744,516 | |
| NAVER Corp. | 69,161 | 40,868,481 | |
| TOTAL KOREA (SOUTH) | 102,612,997 | ||
| Mexico - 0.6% | |||
| Fomento Economico Mexicano S.A.B. de CV sponsored ADR | 732,412 | 68,268,123 | |
| South Africa - 1.3% | |||
| Clicks Group Ltd. | 6,902,484 | 50,413,675 | |
| Naspers Ltd. Class N | 807,910 | 110,853,408 | |
| TOTAL SOUTH AFRICA | 161,267,083 | ||
| Spain - 4.7% | |||
| Amadeus IT Holding SA Class A | 3,528,800 | 160,575,528 | |
| Hispania Activos Inmobiliarios SA (a) | 1,884,200 | 27,616,041 | |
| Inditex SA | 9,658,471 | 310,051,182 | |
| Merlin Properties Socimi SA | 2,698,300 | 31,360,337 | |
| Prosegur Compania de Seguridad SA (Reg.) | 7,301,289 | 42,219,722 | |
| TOTAL SPAIN | 571,822,810 | ||
| Sweden - 3.8% | |||
| ASSA ABLOY AB (B Shares) (c) | 14,608,417 | 306,341,167 | |
| Intrum Justitia AB | 823,600 | 29,557,686 | |
| Svenska Handelsbanken AB (A Shares) (c) | 9,595,113 | 128,000,273 | |
| TOTAL SWEDEN | 463,899,126 | ||
| Switzerland - 12.8% | |||
| Nestle SA | 7,896,276 | 589,375,563 | |
| Novartis AG | 4,860,410 | 369,888,196 | |
| Roche Holding AG (participation certificate) | 1,656,612 | 419,138,121 | |
| Schindler Holding AG: | |||
| (participation certificate) | 748,219 | 136,259,626 | |
| (Reg.) | 154,309 | 28,358,883 | |
| TOTAL SWITZERLAND | 1,543,020,389 | ||
| Taiwan - 1.0% | |||
| Taiwan Semiconductor Manufacturing Co. Ltd. | 26,706,000 | 122,507,324 | |
| United Kingdom - 13.3% | |||
| Associated British Foods PLC | 2,937,900 | 131,528,714 | |
| Babcock International Group PLC | 2,678,361 | 37,080,291 | |
| BAE Systems PLC | 11,625,600 | 81,107,840 | |
| Berendsen PLC | 4,932,100 | 85,037,147 | |
| Howden Joinery Group PLC | 4,469,100 | 32,258,326 | |
| Informa PLC | 9,845,180 | 94,151,689 | |
| InterContinental Hotel Group PLC ADR (c) | 6,622,027 | 265,808,164 | |
| Lloyds Banking Group PLC | 53,016,300 | 52,036,083 | |
| Prudential PLC | 8,573,546 | 169,237,803 | |
| Reckitt Benckiser Group PLC | 3,858,587 | 375,899,280 | |
| Rightmove PLC | 520,970 | 29,367,687 | |
| SABMiller PLC | 2,713,836 | 165,948,704 | |
| Shaftesbury PLC | 3,385,400 | 45,013,853 | |
| Unite Group PLC | 4,544,258 | 41,997,004 | |
| TOTAL UNITED KINGDOM | 1,606,472,585 | ||
| United States of America - 17.8% | |||
| Alphabet, Inc. Class A | 214,294 | 151,694,437 | |
| Autoliv, Inc. (c) | 1,359,227 | 166,464,531 | |
| Berkshire Hathaway, Inc. Class B (a) | 937,150 | 136,336,582 | |
| China Biologic Products, Inc. (a) | 585,950 | 68,556,150 | |
| Domino's Pizza, Inc. | 620,440 | 74,998,787 | |
| Martin Marietta Materials, Inc. | 460,400 | 77,913,492 | |
| MasterCard, Inc. Class A | 2,451,410 | 237,762,256 | |
| McGraw Hill Financial, Inc. | 805,171 | 86,032,521 | |
| Mohawk Industries, Inc. (a) | 860,415 | 165,741,741 | |
| Molson Coors Brewing Co. Class B | 756,000 | 72,296,280 | |
| Moody's Corp. | 692,900 | 66,324,388 | |
| MSCI, Inc. Class A | 747,200 | 56,742,368 | |
| Philip Morris International, Inc. | 1,525,292 | 149,661,651 | |
| PriceSmart, Inc. | 663,475 | 57,417,127 | |
| ResMed, Inc. | 1,227,900 | 68,516,820 | |
| Reynolds American, Inc. | 2,650,500 | 131,464,800 | |
| Sherwin-Williams Co. | 233,100 | 66,971,961 | |
| SS&C Technologies Holdings, Inc. | 1,307,078 | 79,927,820 | |
| Visa, Inc. Class A | 3,018,296 | 233,133,183 | |
| TOTAL UNITED STATES OF AMERICA | 2,147,956,895 | ||
| TOTAL COMMON STOCKS | |||
| (Cost $9,075,439,847) | 11,561,705,177 | ||
| Money Market Funds - 6.1% | |||
| Fidelity Cash Central Fund, 0.38% (d) | 530,876,323 | 530,876,323 | |
| Fidelity Securities Lending Cash Central Fund, 0.42% (d)(e) | 210,135,124 | 210,135,124 | |
| TOTAL MONEY MARKET FUNDS | |||
| (Cost $741,011,447) | 741,011,447 | ||
| TOTAL INVESTMENT PORTFOLIO - 101.8% | |||
| (Cost $9,816,451,294) | 12,302,716,624 | ||
| NET OTHER ASSETS (LIABILITIES) - (1.8)% | (213,890,979) | ||
| NET ASSETS - 100% | $12,088,825,645 |
Categorizations in the Schedule of Investments are based on country or territory of incorporation.
Legend
(a) Non-income producing
(b) Affiliated company
(c) Security or a portion of the security is on loan at period end.
(d) Affiliated fund that is generally available only to investment companies and other accounts managed by Fidelity Investments. The rate quoted is the annualized seven-day yield of the fund at period end. A complete unaudited listing of the fund's holdings as of its most recent quarter end is available upon request. In addition, each Fidelity Central Fund's financial statements are available on the SEC's website or upon request.
(e) Investment made with cash collateral received from securities on loan.
Affiliated Central Funds
Information regarding fiscal year to date income earned by the Fund from investments in Fidelity Central Funds is as follows:
| Fund | Income earned |
| Fidelity Cash Central Fund | $723,242 |
| Fidelity Securities Lending Cash Central Fund | 1,389,622 |
| Total | $2,112,864 |
Other Affiliated Issuers
An affiliated company is a company in which the Fund has ownership of at least 5% of the voting securities. Fiscal year to date transactions with companies which are or were affiliates are as follows:
| Affiliate | Value, beginning of period | Purchases | Sales Proceeds | Dividend Income | Value, end of period |
| SHO-BOND Holdings Co. Ltd. | $61,860,089 | $-- | $-- | $314,471 | $67,396,048 |
| Total | $61,860,089 | $-- | $-- | $314,471 | $67,396,048 |
Investment Valuation
The following is a summary of the inputs used, as of April 30, 2016, involving the Fund's assets and liabilities carried at fair value. The inputs or methodology used for valuing securities may not be an indication of the risk associated with investing in those securities. For more information on valuation inputs, and their aggregation into the levels used below, please refer to the Investment Valuation section in the accompanying Notes to Financial Statements.
| Valuation Inputs at Reporting Date: | ||||
| Description | Total | Level 1 | Level 2 | Level 3 |
| Investments in Securities: | ||||
| Equities: | ||||
| Consumer Discretionary | $1,585,663,663 | $1,220,327,828 | $365,335,835 | $-- |
| Consumer Staples | 2,454,277,142 | 1,287,436,312 | 1,166,840,830 | -- |
| Energy | 52,149,348 | 52,149,348 | -- | -- |
| Financials | 1,687,713,585 | 818,043,643 | 869,669,942 | -- |
| Health Care | 2,247,725,661 | 1,054,258,727 | 1,193,466,934 | -- |
| Industrials | 1,293,612,409 | 985,134,196 | 308,478,213 | -- |
| Information Technology | 1,673,942,252 | 1,095,391,259 | 578,550,993 | -- |
| Materials | 530,934,602 | 530,934,602 | -- | -- |
| Telecommunication Services | 35,686,515 | 35,686,515 | -- | -- |
| Money Market Funds | 741,011,447 | 741,011,447 | -- | -- |
| Total Investments in Securities: | $12,302,716,624 | $7,820,373,877 | $4,482,342,747 | $-- |
The following is a summary of transfers between Level 1 and Level 2 for the period ended April 30, 2016. Transfers are assumed to have occurred at the beginning of the period, and are primarily attributable to the valuation techniques used for foreign equity securities, as discussed in the accompanying Notes to Financial Statements:
| Transfers | Total |
| Level 1 to Level 2 | $0 |
| Level 2 to Level 1 | $1,231,709,296 |
See accompanying notes which are an integral part of the financial statements.
Fidelity® Series International Growth Fund
Financial Statements
Statement of Assets and Liabilities
| April 30, 2016 (Unaudited) | ||
| Assets | ||
| Investment in securities, at value (including securities loaned of $210,601,382) — See accompanying schedule: Unaffiliated issuers (cost $9,028,395,411) | $11,494,309,129 | |
| Fidelity Central Funds (cost $741,011,447) | 741,011,447 | |
| Other affiliated issuers (cost $47,044,436) | 67,396,048 | |
| Total Investments (cost $9,816,451,294) | $12,302,716,624 | |
| Foreign currency held at value (cost $57) | 57 | |
| Receivable for investments sold | 26,440,400 | |
| Receivable for fund shares sold | 2,558,015 | |
| Dividends receivable | 81,560,728 | |
| Distributions receivable from Fidelity Central Funds | 385,012 | |
| Prepaid expenses | 9,634 | |
| Other receivables | 41,816 | |
| Total assets | 12,413,712,286 | |
| Liabilities | ||
| Payable for investments purchased | $30,141,592 | |
| Payable for fund shares redeemed | 75,984,851 | |
| Accrued management fee | 7,448,770 | |
| Other affiliated payables | 916,296 | |
| Other payables and accrued expenses | 260,008 | |
| Collateral on securities loaned, at value | 210,135,124 | |
| Total liabilities | 324,886,641 | |
| Net Assets | $12,088,825,645 | |
| Net Assets consist of: | ||
| Paid in capital | $9,443,480,197 | |
| Undistributed net investment income | 86,634,250 | |
| Accumulated undistributed net realized gain (loss) on investments and foreign currency transactions | 71,486,056 | |
| Net unrealized appreciation (depreciation) on investments and assets and liabilities in foreign currencies | 2,487,225,142 | |
| Net Assets | $12,088,825,645 | |
| Series International Growth: | ||
| Net Asset Value, offering price and redemption price per share ($5,557,529,096 ÷ 412,125,632 shares) | $13.49 | |
| Class F: | ||
| Net Asset Value, offering price and redemption price per share ($6,531,296,549 ÷ 483,196,610 shares) | $13.52 |
See accompanying notes which are an integral part of the financial statements.
Statement of Operations
| Six months ended April 30, 2016 (Unaudited) | ||
| Investment Income | ||
| Dividends (including $314,471 earned from other affiliated issuers) | $155,673,094 | |
| Income from Fidelity Central Funds | 2,112,864 | |
| Income before foreign taxes withheld | 157,785,958 | |
| Less foreign taxes withheld | (15,977,335) | |
| Total income | 141,808,623 | |
| Expenses | ||
| Management fee | ||
| Basic fee | $40,779,630 | |
| Performance adjustment | 1,604,226 | |
| Transfer agent fees | 4,501,874 | |
| Accounting and security lending fees | 939,448 | |
| Custodian fees and expenses | 535,236 | |
| Independent trustees' compensation | 25,359 | |
| Registration fees | 55,364 | |
| Audit | 49,726 | |
| Legal | 15,828 | |
| Miscellaneous | 38,606 | |
| Total expenses before reductions | 48,545,297 | |
| Expense reductions | (96,102) | 48,449,195 |
| Net investment income (loss) | 93,359,428 | |
| Realized and Unrealized Gain (Loss) | ||
| Net realized gain (loss) on: | ||
| Investment securities: | ||
| Unaffiliated issuers | 101,120,708 | |
| Foreign currency transactions | 974,874 | |
| Total net realized gain (loss) | 102,095,582 | |
| Change in net unrealized appreciation (depreciation) on: Investment securities | (419,489,278) | |
| Assets and liabilities in foreign currencies | 784,237 | |
| Total change in net unrealized appreciation (depreciation) | (418,705,041) | |
| Net gain (loss) | (316,609,459) | |
| Net increase (decrease) in net assets resulting from operations | $(223,250,031) |
See accompanying notes which are an integral part of the financial statements.
Statement of Changes in Net Assets
| Six months ended April 30, 2016 (Unaudited) | Year ended October 31, 2015 | |
| Increase (Decrease) in Net Assets | ||
| Operations | ||
| Net investment income (loss) | $93,359,428 | $144,455,176 |
| Net realized gain (loss) | 102,095,582 | 260,002,474 |
| Change in net unrealized appreciation (depreciation) | (418,705,041) | 72,057,794 |
| Net increase (decrease) in net assets resulting from operations | (223,250,031) | 476,515,444 |
| Distributions to shareholders from net investment income | (141,417,551) | (177,438,330) |
| Distributions to shareholders from net realized gain | (272,101,876) | (186,668,096) |
| Total distributions | (413,519,427) | (364,106,426) |
| Share transactions - net increase (decrease) | 717,608,157 | (731,969,049) |
| Total increase (decrease) in net assets | 80,838,699 | (619,560,031) |
| Net Assets | ||
| Beginning of period | 12,007,986,946 | 12,627,546,977 |
| End of period (including undistributed net investment income of $86,634,250 and undistributed net investment income of $134,692,373, respectively) | $12,088,825,645 | $12,007,986,946 |
See accompanying notes which are an integral part of the financial statements.
Financial Highlights — Fidelity Series International Growth
| Six months ended (Unaudited) April 30, | Years ended October 31, | |||||
| 2016 | 2015 | 2014 | 2013 | 2012 | 2011 | |
| Selected Per–Share Data | ||||||
| Net asset value, beginning of period | $14.28 | $14.17 | $13.95 | $11.55 | $10.53 | $10.89 |
| Income from Investment Operations | ||||||
| Net investment income (loss)A | .10 | .15 | .17 | .16 | .15 | .16 |
| Net realized and unrealized gain (loss) | (.41) | .36 | .20 | 2.43 | .99 | (.46) |
| Total from investment operations | (.31) | .51 | .37 | 2.59 | 1.14 | (.30) |
| Distributions from net investment income | (.16) | (.19) | (.10) | (.19) | (.12) | (.05) |
| Distributions from net realized gain | (.33) | (.21) | (.05) | – | (.01) | (.01) |
| Total distributions | (.48)B | (.40) | (.15) | (.19) | (.12)C | (.06) |
| Net asset value, end of period | $13.49 | $14.28 | $14.17 | $13.95 | $11.55 | $10.53 |
| Total ReturnD,E | (2.23)% | 3.65% | 2.66% | 22.72% | 11.00% | (2.77)% |
| Ratios to Average Net AssetsF,G | ||||||
| Expenses before reductions | .92%H | .92% | .97% | 1.04% | 1.05% | 1.00% |
| Expenses net of fee waivers, if any | .92%H | .91% | .97% | 1.04% | 1.05% | 1.00% |
| Expenses net of all reductions | .92%H | .91% | .97% | 1.02% | 1.04% | .98% |
| Net investment income (loss) | 1.51%H | 1.06% | 1.23% | 1.26% | 1.38% | 1.40% |
| Supplemental Data | ||||||
| Net assets, end of period (000 omitted) | $5,557,529 | $5,563,674 | $6,049,347 | $5,642,298 | $5,045,151 | $4,996,927 |
| Portfolio turnover rateI | 35%H | 24% | 33% | 41% | 27% | 23% |
A Calculated based on average shares outstanding during the period.
B Total distributions of $.48 per share is comprised of distributions from net investment income of $.156 and distributions from net realized gain of $.326 per share.
C Total distributions of $.12 per share is comprised of distributions from net investment income of $.115 and distributions from net realized gain of $.007 per share.
D Total returns for periods of less than one year are not annualized.
E Total returns would have been lower if certain expenses had not been reduced during the applicable periods shown.
F Fees and expenses of any underlying Fidelity Central Funds are not included in the Fund's expense ratio. The Fund indirectly bears its proportionate share of the expenses of any underlying Fidelity Central Funds.
G Expense ratios reflect operating expenses of the class. Expenses before reductions do not reflect amounts reimbursed by the investment adviser or reductions from brokerage service arrangements or reductions from other expense offset arrangements and do not represent the amount paid by the class during periods when reimbursements or reductions occur. Expenses net of fee waivers reflect expenses after reimbursement by the investment adviser but prior to reductions from brokerage service arrangements or other expense offset arrangements. Expenses net of all reductions represent the net expenses paid by the class.
H Annualized
I Amount does not include the portfolio activity of any underlying Fidelity Central Funds.
See accompanying notes which are an integral part of the financial statements.
Financial Highlights — Fidelity Series International Growth Fund Class F
| Six months ended (Unaudited) April 30, | Years ended October 31, | |||||
| 2016 | 2015 | 2014 | 2013 | 2012 | 2011 | |
| Selected Per–Share Data | ||||||
| Net asset value, beginning of period | $14.32 | $14.21 | $13.99 | $11.59 | $10.57 | $10.91 |
| Income from Investment Operations | ||||||
| Net investment income (loss)A | .11 | .18 | .20 | .18 | .17 | .18 |
| Net realized and unrealized gain (loss) | (.40) | .35 | .19 | 2.43 | 1.00 | (.45) |
| Total from investment operations | (.29) | .53 | .39 | 2.61 | 1.17 | (.27) |
| Distributions from net investment income | (.18) | (.21) | (.12) | (.21) | (.14) | (.06) |
| Distributions from net realized gain | (.33) | (.21) | (.05) | – | (.01) | (.01) |
| Total distributions | (.51) | (.42) | (.17) | (.21) | (.15) | (.07) |
| Net asset value, end of period | $13.52 | $14.32 | $14.21 | $13.99 | $11.59 | $10.57 |
| Total ReturnB,C | (2.12)% | 3.83% | 2.80% | 22.88% | 11.23% | (2.50)% |
| Ratios to Average Net AssetsD,E | ||||||
| Expenses before reductions | .75%F | .75% | .80% | .85% | .85% | .79% |
| Expenses net of fee waivers, if any | .75%F | .75% | .80% | .85% | .85% | .79% |
| Expenses net of all reductions | .75%F | .75% | .80% | .84% | .84% | .77% |
| Net investment income (loss) | 1.68%F | 1.23% | 1.40% | 1.44% | 1.58% | 1.62% |
| Supplemental Data | ||||||
| Net assets, end of period (000 omitted) | $6,531,297 | $6,444,313 | $6,578,200 | $5,536,085 | $4,064,357 | $2,165,942 |
| Portfolio turnover rateG | 35%F | 24% | 33% | 41% | 27% | 23% |
A Calculated based on average shares outstanding during the period.
B Total returns for periods of less than one year are not annualized.
C Total returns would have been lower if certain expenses had not been reduced during the applicable periods shown.
D Fees and expenses of any underlying Fidelity Central Funds are not included in the Fund's expense ratio. The Fund indirectly bears its proportionate share of the expenses of any underlying Fidelity Central Funds.
E Expense ratios reflect operating expenses of the class. Expenses before reductions do not reflect amounts reimbursed by the investment adviser or reductions from brokerage service arrangements or reductions from other expense offset arrangements and do not represent the amount paid by the class during periods when reimbursements or reductions occur. Expenses net of fee waivers reflect expenses after reimbursement by the investment adviser but prior to reductions from brokerage service arrangements or other expense offset arrangements. Expenses net of all reductions represent the net expenses paid by the class.
F Annualized
G Amount does not include the portfolio activity of any underlying Fidelity Central Funds.
See accompanying notes which are an integral part of the financial statements.
Fidelity® Series International Small Cap Fund
Investment Summary (Unaudited)
Geographic Diversification (% of fund's net assets)
| As of April 30, 2016 | ||
| Japan | 25.9% | |
| United Kingdom | 21.7% | |
| United States of America* | 10.4% | |
| Germany | 6.8% | |
| Italy | 3.7% | |
| Sweden | 3.4% | |
| Netherlands | 2.9% | |
| France | 2.4% | |
| Australia | 2.2% | |
| Other | 20.6% | |
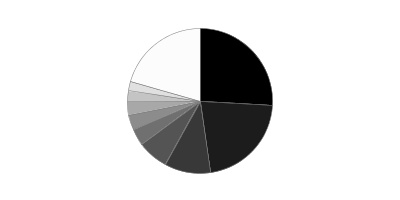
* Includes Short-Term investments and Net Other Assets (Liabilities).
Percentages are based on country or territory of incorporation and are adjusted for the effect of futures contracts, if applicable.
| As of October 31, 2015 | ||
| Japan | 25.0% | |
| United Kingdom | 23.0% | |
| United States of America* | 12.2% | |
| Germany | 6.5% | |
| Italy | 4.2% | |
| Netherlands | 3.3% | |
| Sweden | 3.1% | |
| Australia | 2.1% | |
| Spain | 1.9% | |
| Other | 18.7% | |

* Includes Short-Term investments and Net Other Assets (Liabilities).
Percentages are based on country or territory of incorporation and are adjusted for the effect of futures contracts, if applicable.
Asset Allocation as of April 30, 2016
| % of fund's net assets | % of fund's net assets 6 months ago | |
| Stocks | 97.6 | 95.5 |
| Short-Term Investments and Net Other Assets (Liabilities) | 2.4 | 4.5 |
Top Ten Stocks as of April 30, 2016
| % of fund's net assets | % of fund's net assets 6 months ago | |
| USS Co. Ltd. (Japan, Specialty Retail) | 2.0 | 2.2 |
| Berendsen PLC (United Kingdom, Commercial Services & Supplies) | 1.8 | 1.7 |
| Unite Group PLC (United Kingdom, Real Estate Management & Development) | 1.8 | 2.1 |
| Fagerhult AB (Sweden, Electrical Equipment) | 1.8 | 1.4 |
| Spirax-Sarco Engineering PLC (United Kingdom, Machinery) | 1.8 | 1.7 |
| CTS Eventim AG (Germany, Media) | 1.8 | 2.1 |
| CompuGroup Medical AG (Germany, Health Care Technology) | 1.6 | 1.4 |
| OBIC Co. Ltd. (Japan, IT Services) | 1.6 | 1.8 |
| Azimut Holding SpA (Italy, Capital Markets) | 1.4 | 1.3 |
| Bellway PLC (United Kingdom, Household Durables) | 1.4 | 1.6 |
| 17.0 |
Market Sectors as of April 30, 2016
| % of fund's net assets | % of fund's net assets 6 months ago | |
| Consumer Discretionary | 21.4 | 20.8 |
| Industrials | 18.4 | 18.8 |
| Financials | 18.0 | 19.9 |
| Information Technology | 11.5 | 9.9 |
| Health Care | 10.4 | 9.2 |
| Consumer Staples | 8.9 | 8.3 |
| Materials | 7.3 | 7.3 |
| Energy | 1.7 | 1.3 |
| Telecommunication Services | 0.0 | 0.0 |
Percentages shown as 0.0% may reflect amounts less than 0.05%.
Fidelity® Series International Small Cap Fund
Investments April 30, 2016 (Unaudited)
Showing Percentage of Net Assets
| Common Stocks - 96.2% | |||
| Shares | Value | ||
| Australia - 2.2% | |||
| Austal Ltd. | 800,423 | $949,419 | |
| Beacon Lighting Group Ltd. | 4,626,227 | 6,401,944 | |
| Credit Corp. Group Ltd. | 146,474 | 1,127,080 | |
| DuluxGroup Ltd. | 3,814,749 | 18,563,484 | |
| Imdex Ltd. (a) | 8,978,319 | 1,399,466 | |
| John Fairfax Holdings Ltd. | 2,411,382 | 1,457,628 | |
| Nanosonics Ltd. (a) | 258,591 | 436,496 | |
| RCG Corp. Ltd. (b) | 16,803,658 | 17,504,026 | |
| SAI Global Ltd. | 443,211 | 1,230,034 | |
| SomnoMed Ltd. (a) | 8,967 | 19,363 | |
| TFS Corp. Ltd. (b) | 11,522,378 | 13,667,223 | |
| TOTAL AUSTRALIA | 62,756,163 | ||
| Austria - 1.3% | |||
| Andritz AG | 411,024 | 23,019,151 | |
| IMMOFINANZ Immobilien Anlagen AG (a) | 1,200,900 | 2,831,311 | |
| Wienerberger AG | 48,600 | 960,231 | |
| Zumtobel AG | 732,919 | 9,542,033 | |
| TOTAL AUSTRIA | 36,352,726 | ||
| Bailiwick of Jersey - 0.4% | |||
| Integrated Diagnostics Holdings PLC | 2,383,432 | 11,082,959 | |
| Regus PLC | 256,500 | 1,095,871 | |
| TOTAL BAILIWICK OF JERSEY | 12,178,830 | ||
| Belgium - 1.2% | |||
| Gimv NV | 140,309 | 7,792,050 | |
| KBC Ancora | 730,073 | 25,772,958 | |
| Van de Velde | 10,143 | 711,256 | |
| TOTAL BELGIUM | 34,276,264 | ||
| Bermuda - 0.4% | |||
| APT Satellite Holdings Ltd. | 428,000 | 339,653 | |
| Vostok New Ventures Ltd. SDR (a) | 1,820,942 | 10,362,688 | |
| TOTAL BERMUDA | 10,702,341 | ||
| Canada - 2.2% | |||
| Cara Operations Ltd. | 670,000 | 17,333,386 | |
| McCoy Global, Inc. | 1,108,950 | 1,811,865 | |
| New Look Vision Group, Inc. | 504,100 | 12,474,938 | |
| Pason Systems, Inc. | 1,118,900 | 16,265,829 | |
| ShawCor Ltd. Class A | 366,300 | 9,896,844 | |
| Tesco Corp. | 199,093 | 1,883,420 | |
| Total Energy Services, Inc. | 71,400 | 750,591 | |
| Whitecap Resources, Inc. (b) | 148,100 | 1,110,720 | |
| ZCL Composites, Inc. | 145,700 | 956,857 | |
| TOTAL CANADA | 62,484,450 | ||
| Cayman Islands - 0.7% | |||
| 58.com, Inc. ADR (a) | 178,700 | 9,765,955 | |
| SITC International Holdings Co. Ltd. | 2,105,000 | 1,137,692 | |
| Value Partners Group Ltd. | 10,501,000 | 10,023,740 | |
| TOTAL CAYMAN ISLANDS | 20,927,387 | ||
| Denmark - 1.7% | |||
| Jyske Bank A/S (Reg.) | 531,719 | 21,768,763 | |
| NNIT A/S | 7,795 | 212,274 | |
| Scandinavian Tobacco Group A/S | 540,181 | 8,593,430 | |
| Spar Nord Bank A/S | 1,992,747 | 16,249,302 | |
| TOTAL DENMARK | 46,823,769 | ||
| Finland - 0.6% | |||
| Olvi PLC (A Shares) | 11,003 | 305,651 | |
| Tikkurila Oyj | 945,530 | 16,575,817 | |
| TOTAL FINLAND | 16,881,468 | ||
| France - 2.4% | |||
| Elis SA | 918,500 | 16,864,465 | |
| Ipsen SA | 11,800 | 714,088 | |
| Laurent-Perrier Group SA | 126,224 | 10,731,560 | |
| Parrot SA (a) | 86,900 | 1,747,305 | |
| Saft Groupe SA | 38,400 | 1,193,344 | |
| Vetoquinol SA | 286,927 | 11,893,357 | |
| Virbac SA (b) | 126,200 | 23,019,696 | |
| TOTAL FRANCE | 66,163,815 | ||
| Germany - 5.5% | |||
| alstria office REIT-AG | 1,096,129 | 15,375,251 | |
| CompuGroup Medical AG | 1,171,715 | 46,019,358 | |
| CTS Eventim AG | 1,405,124 | 49,217,390 | |
| Fielmann AG | 393,190 | 28,989,808 | |
| MLP AG | 570,092 | 2,222,076 | |
| Nexus AG | 519,508 | 9,101,398 | |
| SMA Solar Technology AG | 36,700 | 1,943,579 | |
| TOTAL GERMANY | 152,868,860 | ||
| Greece - 0.4% | |||
| Motor Oil (HELLAS) Corinth Refineries SA | 86,800 | 991,119 | |
| Mytilineos Holdings SA | 171,800 | 689,835 | |
| Titan Cement Co. SA (Reg.) | 429,199 | 9,790,739 | |
| TOTAL GREECE | 11,471,693 | ||
| India - 0.6% | |||
| Jyothy Laboratories Ltd. | 3,501,337 | 16,045,148 | |
| Torrent Pharmaceuticals Ltd. | 15,232 | 327,970 | |
| TOTAL INDIA | 16,373,118 | ||
| Ireland - 1.7% | |||
| FBD Holdings PLC | 1,298,400 | 9,515,091 | |
| James Hardie Industries PLC CDI | 2,676,486 | 37,709,775 | |
| United Drug PLC (United Kingdom) | 50,000 | 447,112 | |
| TOTAL IRELAND | 47,671,978 | ||
| Isle of Man - 0.7% | |||
| Playtech Ltd. | 1,702,703 | 20,015,192 | |
| Israel - 2.1% | |||
| Azrieli Group | 409,179 | 16,251,298 | |
| Ituran Location & Control Ltd. | 870,631 | 18,109,125 | |
| Ituran Location & Control Ltd. | 30,676 | 648,503 | |
| Sarine Technologies Ltd. | 5,183,800 | 6,360,018 | |
| Strauss Group Ltd. | 1,129,555 | 17,899,598 | |
| TOTAL ISRAEL | 59,268,542 | ||
| Italy - 3.7% | |||
| Astm SpA | 33,200 | 436,800 | |
| Azimut Holding SpA | 1,586,764 | 39,935,992 | |
| Banco di Desio e della Brianza SpA | 237,967 | 670,856 | |
| Beni Stabili SpA SIIQ | 34,816,820 | 25,793,949 | |
| Cerved Information Solutions SpA | 173,900 | 1,398,847 | |
| Interpump Group SpA | 2,518,666 | 36,251,861 | |
| TOTAL ITALY | 104,488,305 | ||
| Japan - 25.9% | |||
| Ain Holdings, Inc. | 22,300 | 1,083,289 | |
| Aoki Super Co. Ltd. | 70,000 | 827,143 | |
| Arcland Service Co. Ltd. | 24,800 | 694,728 | |
| Artnature, Inc. (c) | 2,073,600 | 17,192,983 | |
| Asahi Co. Ltd. | 1,064,900 | 15,794,882 | |
| Autobacs Seven Co. Ltd. | 928,700 | 16,023,148 | |
| Azbil Corp. | 1,373,700 | 35,246,778 | |
| Broadleaf Co. Ltd. | 266,200 | 2,630,606 | |
| Central Automotive Products Ltd. (d) | 28,000 | 233,374 | |
| Chugoku Marine Paints Ltd. | 152,000 | 1,076,803 | |
| Coca-Cola Central Japan Co. Ltd. | 817,800 | 14,982,835 | |
| Daiichikosho Co. Ltd. | 548,200 | 22,981,511 | |
| Daikokutenbussan Co. Ltd. | 567,600 | 25,510,083 | |
| GCA Savvian Group Corp. | 1,339,000 | 12,372,789 | |
| Glory Ltd. | 682,600 | 22,356,033 | |
| GMO Internet, Inc. | 134,600 | 1,580,410 | |
| Goldcrest Co. Ltd. | 1,371,210 | 19,634,029 | |
| Gulliver International Co. Ltd. (b) | 56,300 | 553,412 | |
| Iwatsuka Confectionary Co. Ltd. | 158,600 | 7,185,407 | |
| Japan Digital Laboratory Co. | 1,276,200 | 17,263,430 | |
| Kamigumi Co. Ltd. | 70,000 | 627,608 | |
| Kobayashi Pharmaceutical Co. Ltd. | 308,800 | 24,596,741 | |
| Konoike Transport Co. Ltd. | 88,500 | 1,031,428 | |
| Koshidaka Holdings Co. Ltd. | 384,200 | 7,554,823 | |
| Lasertec Corp. (b) | 942,200 | 12,249,724 | |
| Leopalace21 Corp. (a) | 432,100 | 2,592,829 | |
| Mandom Corp. | 25,600 | 1,158,661 | |
| Medikit Co. Ltd. | 294,400 | 10,263,691 | |
| Meiko Network Japan Co. Ltd. | 514,400 | 5,673,349 | |
| Miraial Co. Ltd. | 281,300 | 1,981,973 | |
| Mirait Holdings Corp. | 127,900 | 1,121,082 | |
| Mitsuboshi Belting Ltd. | 88,000 | 696,015 | |
| Nagaileben Co. Ltd. | 1,384,300 | 28,248,946 | |
| ND Software Co. Ltd. | 222,536 | 1,831,824 | |
| Nihon Parkerizing Co. Ltd. | 3,384,800 | 29,855,293 | |
| Nippon Kanzai Co. Ltd. | 64,600 | 988,397 | |
| Nitto Kohki Co. Ltd. | 33,900 | 667,214 | |
| NOF Corp. | 150,000 | 1,180,704 | |
| NS Tool Co. Ltd. | 2,000 | 33,159 | |
| OBIC Co. Ltd. | 843,400 | 44,329,893 | |
| OSG Corp. (b) | 1,901,500 | 35,336,753 | |
| Paramount Bed Holdings Co. Ltd. | 566,000 | 21,054,544 | |
| ProNexus, Inc. | 1,161,800 | 11,749,355 | |
| Sacs Bar Holdings, Inc. | 82,500 | 1,047,140 | |
| Sakai Moving Service Co. Ltd. | 11,100 | 269,054 | |
| San-A Co. Ltd. | 35,000 | 1,610,983 | |
| San-Ai Oil Co. Ltd. | 1,783,000 | 12,495,982 | |
| Sekisui Jushi Corp. | 64,100 | 889,768 | |
| Seven Bank Ltd. | 6,669,100 | 28,338,393 | |
| Shinko Plantech Co. Ltd. | 113,200 | 861,238 | |
| Shinsei Bank Ltd. | 1,654,000 | 2,318,207 | |
| SHO-BOND Holdings Co. Ltd. | 778,800 | 33,698,024 | |
| Shoei Co. Ltd. (c) | 732,000 | 11,080,255 | |
| SK Kaken Co. Ltd. | 179,000 | 14,687,226 | |
| Skylark Co. Ltd. | 63,200 | 803,408 | |
| Software Service, Inc. | 175,900 | 6,793,997 | |
| St. Marc Holdings Co. Ltd. | 46,800 | 1,266,017 | |
| Techno Medica Co. Ltd. | 283,000 | 5,932,695 | |
| The Monogatari Corp. | 39,000 | 1,840,788 | |
| The Nippon Synthetic Chemical Industry Co. Ltd. | 1,095,000 | 6,607,622 | |
| TKC Corp. | 684,400 | 18,594,179 | |
| Tocalo Co. Ltd. | 458,400 | 8,245,890 | |
| Toshiba Plant Systems & Services Corp. | 72,000 | 890,383 | |
| Tsutsumi Jewelry Co. Ltd. | 324,800 | 6,784,474 | |
| USS Co. Ltd. | 3,533,100 | 55,887,789 | |
| Welcia Holdings Co. Ltd. | 19,800 | 1,045,885 | |
| Workman Co. Ltd. | 510,700 | 16,054,083 | |
| Yamato Kogyo Co. Ltd. | 260,100 | 6,105,722 | |
| Yuasa Trading Co. Ltd. | 32,700 | 734,860 | |
| Yusen Logistics Co. Ltd. | 87,100 | 1,024,757 | |
| TOTAL JAPAN | 725,956,498 | ||
| Korea (South) - 1.4% | |||
| BGFretail Co. Ltd. | 200,923 | 32,619,790 | |
| iMarketKorea, Inc. | 50,788 | 751,397 | |
| Leeno Industrial, Inc. | 139,988 | 5,235,766 | |
| TOTAL KOREA (SOUTH) | 38,606,953 | ||
| Marshall Islands - 0.0% | |||
| StealthGas, Inc. (a) | 62,954 | 246,150 | |
| Mexico - 0.6% | |||
| Consorcio ARA S.A.B. de CV | 40,884,127 | 16,040,306 | |
| Netherlands - 2.9% | |||
| Aalberts Industries NV | 984,900 | 33,742,572 | |
| Arcadis NV | 52,300 | 895,597 | |
| BinckBank NV | 327,900 | 1,930,250 | |
| Heijmans NV (Certificaten Van Aandelen) (a)(b) | 779,571 | 7,346,491 | |
| Lucas Bols BV | 24,238 | 485,551 | |
| VastNed Retail NV | 816,249 | 35,937,135 | |
| TOTAL NETHERLANDS | 80,337,596 | ||
| New Zealand - 0.1% | |||
| Trade Maine Group Ltd. | 565,810 | 1,801,550 | |
| Norway - 0.6% | |||
| ABG Sundal Collier ASA | 1,789,200 | 1,248,819 | |
| Borregaard ASA | 186,800 | 1,397,778 | |
| Kongsberg Gruppen ASA | 811,148 | 13,599,978 | |
| Spectrum ASA | 274,300 | 902,768 | |
| TOTAL NORWAY | 17,149,343 | ||
| Philippines - 0.5% | |||
| Jollibee Food Corp. | 2,720,820 | 13,281,605 | |
| Singapore - 0.0% | |||
| Boustead Singapore Ltd. | 1,649,600 | 956,752 | |
| Hour Glass Ltd. | 400,200 | 223,185 | |
| TOTAL SINGAPORE | 1,179,937 | ||
| South Africa - 0.6% | |||
| Clicks Group Ltd. | 2,170,481 | 15,852,543 | |
| Spain - 2.2% | |||
| Baron de Ley SA (a) | 10,312 | 1,209,114 | |
| Hispania Activos Inmobiliarios SA (a) | 821,600 | 12,041,895 | |
| Merlin Properties Socimi SA | 1,512,900 | 17,583,313 | |
| Prosegur Compania de Seguridad SA (Reg.) (b) | 5,399,986 | 31,225,433 | |
| TOTAL SPAIN | 62,059,755 | ||
| Sweden - 3.4% | |||
| Addlife AB (a) | 400 | 5,056 | |
| Fagerhult AB (c) | 2,158,495 | 50,263,505 | |
| Intrum Justitia AB (b) | 636,603 | 22,846,663 | |
| Mekonomen AB | 66,100 | 1,679,159 | |
| Ratos AB (B Shares) (b) | 352,700 | 2,063,377 | |
| Saab AB (B Shares) | 521,300 | 17,832,265 | |
| Swedish Orphan Biovitrum AB (a) | 41,300 | 602,236 | |
| TOTAL SWEDEN | 95,292,261 | ||
| Switzerland - 0.1% | |||
| Vontobel Holdings AG | 48,343 | 2,091,353 | |
| Taiwan - 0.4% | |||
| Addcn Technology Co. Ltd. | 1,266,400 | 9,722,540 | |
| United Kingdom - 21.7% | |||
| AA PLC | 3,790,612 | 15,430,687 | |
| Alliance Pharma PLC | 10,836,996 | 7,125,515 | |
| BBA Aviation PLC | 315,000 | 921,445 | |
| BCA Marketplace PLC | 266,800 | 650,050 | |
| Bellway PLC | 1,084,900 | 38,789,884 | |
| Berendsen PLC | 2,990,609 | 51,562,794 | |
| Britvic PLC | 1,429,612 | 14,705,698 | |
| Cineworld Group PLC | 184,800 | 1,398,706 | |
| Countrywide PLC | 429,100 | 2,228,285 | |
| Dechra Pharmaceuticals PLC | 1,645,263 | 26,587,975 | |
| Elementis PLC | 7,625,382 | 24,055,204 | |
| Great Portland Estates PLC | 2,334,200 | 25,852,472 | |
| H&T Group PLC | 1,463,162 | 5,240,525 | |
| Hill & Smith Holdings PLC | 53,779 | 733,537 | |
| Hilton Food Group PLC | 911,038 | 7,494,449 | |
| Howden Joinery Group PLC | 4,207,600 | 30,370,798 | |
| Informa PLC | 4,050,785 | 38,738,576 | |
| InterContinental Hotel Group PLC ADR | 539,546 | 21,657,376 | |
| ITE Group PLC | 6,639,972 | 15,062,347 | |
| John David Group PLC | 79,600 | 1,452,681 | |
| JUST EAT Ltd. (a) | 2,018,325 | 11,309,705 | |
| Luxfer Holdings PLC sponsored ADR | 116,900 | 1,502,165 | |
| Mears Group PLC | 256,600 | 1,494,100 | |
| Mitie Group PLC | 319,700 | 1,267,323 | |
| PayPoint PLC | 85,500 | 1,053,146 | |
| Rightmove PLC | 391,500 | 22,069,312 | |
| Shaftesbury PLC | 2,585,255 | 34,374,753 | |
| Sinclair Pharma PLC (a) | 400,000 | 210,406 | |
| Spectris PLC | 1,324,616 | 35,244,775 | |
| Spirax-Sarco Engineering PLC | 1,006,228 | 50,209,039 | |
| Taylor Wimpey PLC | 5,180,800 | 13,951,373 | |
| Ted Baker PLC | 559,367 | 19,493,060 | |
| Topps Tiles PLC | 5,554,300 | 11,037,305 | |
| Ultra Electronics Holdings PLC | 969,010 | 25,004,246 | |
| Unite Group PLC | 5,504,163 | 50,868,229 | |
| TOTAL UNITED KINGDOM | 609,147,941 | ||
| United States of America - 8.0% | |||
| ANSYS, Inc. (a) | 87,715 | 7,961,891 | |
| Autoliv, Inc. | 161,500 | 19,778,905 | |
| Broadridge Financial Solutions, Inc. | 241,895 | 14,474,997 | |
| China Biologic Products, Inc. (a) | 261,508 | 30,596,436 | |
| Compass Minerals International, Inc. | 17,000 | 1,274,320 | |
| Domino's Pizza, Inc. | 118,000 | 14,263,840 | |
| Energizer Holdings, Inc. | 126,832 | 5,515,924 | |
| Kennedy-Wilson Holdings, Inc. | 1,300,188 | 28,097,063 | |
| Martin Marietta Materials, Inc. | 85,080 | 14,398,088 | |
| Mohawk Industries, Inc. (a) | 113,362 | 21,836,922 | |
| PriceSmart, Inc. | 356,261 | 30,830,827 | |
| ResMed, Inc. | 229,700 | 12,817,260 | |
| Resources Connection, Inc. | 73,500 | 1,085,595 | |
| SS&C Technologies Holdings, Inc. | 350,788 | 21,450,686 | |
| Utah Medical Products, Inc. | 7,500 | 501,750 | |
| TOTAL UNITED STATES OF AMERICA | 224,884,504 | ||
| TOTAL COMMON STOCKS | |||
| (Cost $2,092,289,626) | 2,695,355,736 | ||
| Nonconvertible Preferred Stocks - 1.4% | |||
| Brazil - 0.1% | |||
| Banco ABC Brasil SA | 600,000 | 2,067,311 | |
| Germany - 1.3% | |||
| Sartorius AG (non-vtg.) | 153,293 | 37,817,540 | |
| TOTAL NONCONVERTIBLE PREFERRED STOCKS | |||
| (Cost $18,883,357) | 39,884,851 | ||
| Money Market Funds - 4.3% | |||
| Fidelity Cash Central Fund, 0.38% (e) | 108,863,880 | 108,863,880 | |
| Fidelity Securities Lending Cash Central Fund, 0.42% (e)(f) | 11,555,294 | 11,555,294 | |
| TOTAL MONEY MARKET FUNDS | |||
| (Cost $120,419,174) | 120,419,174 | ||
| TOTAL INVESTMENT PORTFOLIO - 101.9% | |||
| (Cost $2,231,592,157) | 2,855,659,761 | ||
| NET OTHER ASSETS (LIABILITIES) - (1.9)% | (54,151,388) | ||
| NET ASSETS - 100% | $2,801,508,373 |
Categorizations in the Schedule of Investments are based on country or territory of incorporation.
Legend
(a) Non-income producing
(b) Security or a portion of the security is on loan at period end.
(c) Affiliated company
(d) Security or a portion of the security purchased on a delayed delivery or when-issued basis.
(e) Affiliated fund that is generally available only to investment companies and other accounts managed by Fidelity Investments. The rate quoted is the annualized seven-day yield of the fund at period end. A complete unaudited listing of the fund's holdings as of its most recent quarter end is available upon request. In addition, each Fidelity Central Fund's financial statements are available on the SEC's website or upon request.
(f) Investment made with cash collateral received from securities on loan.
Affiliated Central Funds
Information regarding fiscal year to date income earned by the Fund from investments in Fidelity Central Funds is as follows:
| Fund | Income earned |
| Fidelity Cash Central Fund | $230,909 |
| Fidelity Securities Lending Cash Central Fund | 195,878 |
| Total | $426,787 |
Other Affiliated Issuers
An affiliated company is a company in which the Fund has ownership of at least 5% of the voting securities. Fiscal year to date transactions with companies which are or were affiliates are as follows:
| Affiliate | Value, beginning of period | Purchases | Sales Proceeds | Dividend Income | Value, end of period |
| Artnature, Inc. | $17,350,955 | $2,368,860 | $-- | $210,401 | $17,192,983 |
| Cara Operations Ltd. | 15,755,782 | 1,659,870 | -- | 82,118 | -- |
| Fagerhult AB | 37,911,673 | -- | 1,273,126 | 787,067 | 50,263,505 |
| Shoei Co. Ltd. | 12,037,779 | 581,379 | -- | 40,749 | 11,080,255 |
| Total | $83,056,189 | $4,610,109 | $1,273,126 | $1,120,335 | $78,536,743 |
Investment Valuation
The following is a summary of the inputs used, as of April 30, 2016, involving the Fund's assets and liabilities carried at fair value. The inputs or methodology used for valuing securities may not be an indication of the risk associated with investing in those securities. For more information on valuation inputs, and their aggregation into the levels used below, please refer to the Investment Valuation section in the accompanying Notes to Financial Statements.
| Valuation Inputs at Reporting Date: | ||||
| Description | Total | Level 1 | Level 2 | Level 3 |
| Investments in Securities: | ||||
| Equities: | ||||
| Consumer Discretionary | $595,301,872 | $431,028,691 | $164,273,181 | $-- |
| Consumer Staples | 248,889,863 | 153,695,853 | 95,194,010 | -- |
| Energy | 49,130,135 | 34,781,796 | 14,348,339 | -- |
| Financials | 501,438,629 | 426,158,642 | 75,279,987 | -- |
| Health Care | 293,663,942 | 219,538,245 | 74,125,697 | -- |
| Industrials | 533,131,533 | 411,634,061 | 121,497,472 | -- |
| Information Technology | 313,576,324 | 179,699,331 | 133,876,993 | -- |
| Materials | 199,768,636 | 129,774,692 | 69,993,944 | -- |
| Telecommunication Services | 339,653 | -- | 339,653 | -- |
| Money Market Funds | 120,419,174 | 120,419,174 | -- | -- |
| Total Investments in Securities: | $2,855,659,761 | $2,106,730,485 | $748,929,276 | $-- |
See accompanying notes which are an integral part of the financial statements.
Fidelity® Series International Small Cap Fund
Financial Statements
Statement of Assets and Liabilities
| April 30, 2016 (Unaudited) | ||
| Assets | ||
| Investment in securities, at value (including securities loaned of $10,978,081) — See accompanying schedule: Unaffiliated issuers (cost $2,060,893,405) | $2,656,703,844 | |
| Fidelity Central Funds (cost $120,419,174) | 120,419,174 | |
| Other affiliated issuers (cost $50,279,578) | 78,536,743 | |
| Total Investments (cost $2,231,592,157) | $2,855,659,761 | |
| Cash | 18,741 | |
| Foreign currency held at value (cost $391,130) | 389,910 | |
| Receivable for investments sold | 2,829,883 | |
| Receivable for fund shares sold | 34,027 | |
| Dividends receivable | 14,532,671 | |
| Distributions receivable from Fidelity Central Funds | 113,705 | |
| Prepaid expenses | 2,175 | |
| Receivable from affiliate | 11,989 | |
| Other receivables | 2,360 | |
| Total assets | 2,873,595,222 | |
| Liabilities | ||
| Payable for investments purchased | ||
| Regular delivery | $6,820,399 | |
| Delayed delivery | 42,084 | |
| Payable for fund shares redeemed | 51,381,491 | |
| Accrued management fee | 1,913,089 | |
| Other affiliated payables | 280,637 | |
| Other payables and accrued expenses | 93,855 | |
| Collateral on securities loaned, at value | 11,555,294 | |
| Total liabilities | 72,086,849 | |
| Net Assets | $2,801,508,373 | |
| Net Assets consist of: | ||
| Paid in capital | $2,157,094,925 | |
| Undistributed net investment income | 11,508,438 | |
| Accumulated undistributed net realized gain (loss) on investments and foreign currency transactions | 8,450,273 | |
| Net unrealized appreciation (depreciation) on investments and assets and liabilities in foreign currencies | 624,454,737 | |
| Net Assets | $2,801,508,373 | |
| Series International Small Cap: | ||
| Net Asset Value, offering price and redemption price per share ($1,287,529,561 ÷ 85,462,889 shares) | $15.07 | |
| Class F: | ||
| Net Asset Value, offering price and redemption price per share ($1,513,978,812 ÷ 100,277,738 shares) | $15.10 |
See accompanying notes which are an integral part of the financial statements.
Statement of Operations
| Six months ended April 30, 2016 (Unaudited) | ||
| Investment Income | ||
| Dividends (including $1,120,335 earned from other affiliated issuers) | $27,371,167 | |
| Income from Fidelity Central Funds | 426,787 | |
| Income before foreign taxes withheld | 27,797,954 | |
| Less foreign taxes withheld | (2,395,837) | |
| Total income | 25,402,117 | |
| Expenses | ||
| Management fee | ||
| Basic fee | $11,492,109 | |
| Performance adjustment | 100,542 | |
| Transfer agent fees | 1,038,915 | |
| Accounting and security lending fees | 589,333 | |
| Custodian fees and expenses | 147,897 | |
| Independent trustees' compensation | 5,837 | |
| Registration fees | 13,660 | |
| Audit | 37,439 | |
| Legal | 3,771 | |
| Miscellaneous | 8,897 | |
| Total expenses before reductions | 13,438,400 | |
| Expense reductions | (13,260) | 13,425,140 |
| Net investment income (loss) | 11,976,977 | |
| Realized and Unrealized Gain (Loss) | ||
| Net realized gain (loss) on: | ||
| Investment securities: | ||
| Unaffiliated issuers | 39,882,855 | |
| Other affiliated issuers | 580,238 | |
| Foreign currency transactions | 18,023 | |
| Total net realized gain (loss) | 40,481,116 | |
| Change in net unrealized appreciation (depreciation) on: Investment securities | (33,582,429) | |
| Assets and liabilities in foreign currencies | 426,690 | |
| Total change in net unrealized appreciation (depreciation) | (33,155,739) | |
| Net gain (loss) | 7,325,377 | |
| Net increase (decrease) in net assets resulting from operations | $19,302,354 |
See accompanying notes which are an integral part of the financial statements.
Statement of Changes in Net Assets
| Six months ended April 30, 2016 (Unaudited) | Year ended October 31, 2015 | |
| Increase (Decrease) in Net Assets | ||
| Operations | ||
| Net investment income (loss) | $11,976,977 | $27,947,392 |
| Net realized gain (loss) | 40,481,116 | 147,303,806 |
| Change in net unrealized appreciation (depreciation) | (33,155,739) | 59,667,213 |
| Net increase (decrease) in net assets resulting from operations | 19,302,354 | 234,918,411 |
| Distributions to shareholders from net investment income | (27,359,738) | (28,569,877) |
| Distributions to shareholders from net realized gain | (162,604,163) | (36,994,296) |
| Total distributions | (189,963,901) | (65,564,173) |
| Share transactions - net increase (decrease) | 219,014,454 | (195,735,081) |
| Total increase (decrease) in net assets | 48,352,907 | (26,380,843) |
| Net Assets | ||
| Beginning of period | 2,753,155,466 | 2,779,536,309 |
| End of period (including undistributed net investment income of $11,508,438 and undistributed net investment income of $26,891,199, respectively) | $2,801,508,373 | $2,753,155,466 |
See accompanying notes which are an integral part of the financial statements.
Financial Highlights — Fidelity Series International Small Cap
| Six months ended (Unaudited) April 30, | Years ended October 31, | |||||
| 2016 | 2015 | 2014 | 2013 | 2012 | 2011 | |
| Selected Per–Share Data | ||||||
| Net asset value, beginning of period | $16.11 | $15.21 | $15.75 | $12.44 | $11.22 | $11.40 |
| Income from Investment Operations | ||||||
| Net investment income (loss)A | .06 | .14 | .14 | .15 | .15 | .17B |
| Net realized and unrealized gain (loss) | .01 | 1.10 | (.11) | 3.29 | 1.19 | (.19) |
| Total from investment operations | .07 | 1.24 | .03 | 3.44 | 1.34 | (.02) |
| Distributions from net investment income | (.15) | (.14) | (.13) | (.12) | (.11) | (.09) |
| Distributions from net realized gain | (.96) | (.20) | (.44) | (.01) | (.01) | (.07) |
| Total distributions | (1.11) | (.34) | (.57) | (.13) | (.12) | (.16) |
| Net asset value, end of period | $15.07 | $16.11 | $15.21 | $15.75 | $12.44 | $11.22 |
| Total ReturnC,D | .35% | 8.36% | .21% | 27.95% | 12.07% | (.23)% |
| Ratios to Average Net AssetsE,F | ||||||
| Expenses before reductions | 1.08%G | 1.10% | 1.18% | 1.23% | 1.22% | 1.14% |
| Expenses net of fee waivers, if any | 1.08%G | 1.10% | 1.18% | 1.23% | 1.22% | 1.14% |
| Expenses net of all reductions | 1.08%G | 1.10% | 1.18% | 1.22% | 1.22% | 1.13% |
| Net investment income (loss) | .79%G | .89% | .86% | 1.05% | 1.27% | 1.47%B |
| Supplemental Data | ||||||
| Net assets, end of period (000 omitted) | $1,287,530 | $1,276,570 | $1,330,809 | $1,163,381 | $1,040,585 | $1,107,242 |
| Portfolio turnover rateH | 20%G | 16% | 18% | 29% | 25% | 22% |
A Calculated based on average shares outstanding during the period.
B Net Investment income per share reflects a large, non-recurring dividend which amounted to $.06 per share. Excluding this non-recurring dividend, the ratio of net investment income (loss) to average net assets would have been 1.00%.
C Total returns for periods of less than one year are not annualized.
D Total returns would have been lower if certain expenses had not been reduced during the applicable periods shown.
E Fees and expenses of any underlying Fidelity Central Funds are not included in the Fund's expense ratio. The Fund indirectly bears its proportionate share of the expenses of any underlying Fidelity Central Funds.
F Expense ratios reflect operating expenses of the class. Expenses before reductions do not reflect amounts reimbursed by the investment adviser or reductions from brokerage service arrangements or reductions from other expense offset arrangements and do not represent the amount paid by the class during periods when reimbursements or reductions occur. Expenses net of fee waivers reflect expenses after reimbursement by the investment adviser but prior to reductions from brokerage service arrangements or other expense offset arrangements. Expenses net of all reductions represent the net expenses paid by the class.
G Annualized
H Amount does not include the portfolio activity of any underlying Fidelity Central Funds.
See accompanying notes which are an integral part of the financial statements.
Financial Highlights — Fidelity Series International Small Cap Fund Class F
| Six months ended (Unaudited) April 30, | Years ended October 31, | |||||
| 2016 | 2015 | 2014 | 2013 | 2012 | 2011 | |
| Selected Per–Share Data | ||||||
| Net asset value, beginning of period | $16.16 | $15.27 | $15.79 | $12.48 | $11.26 | $11.43 |
| Income from Investment Operations | ||||||
| Net investment income (loss)A | .07 | .17 | .16 | .17 | .17 | .20B |
| Net realized and unrealized gain (loss) | .01 | 1.10 | (.09) | 3.30 | 1.19 | (.20) |
| Total from investment operations | .08 | 1.27 | .07 | 3.47 | 1.36 | – |
| Distributions from net investment income | (.18) | (.17) | (.15) | (.15) | (.13) | (.10) |
| Distributions from net realized gain | (.96) | (.20) | (.44) | (.01) | (.01) | (.07) |
| Total distributions | (1.14) | (.38)C | (.59) | (.16) | (.14) | (.17) |
| Net asset value, end of period | $15.10 | $16.16 | $15.27 | $15.79 | $12.48 | $11.26 |
| Total ReturnD,E | .40% | 8.49% | .47% | 28.14% | 12.25% | (.03)% |
| Ratios to Average Net AssetsF,G | ||||||
| Expenses before reductions | .92%H | .94% | 1.01% | 1.04% | 1.02% | .93% |
| Expenses net of fee waivers, if any | .91%H | .93% | 1.01% | 1.04% | 1.02% | .93% |
| Expenses net of all reductions | .91%H | .93% | 1.01% | 1.03% | 1.01% | .92% |
| Net investment income (loss) | .96%H | 1.06% | 1.04% | 1.24% | 1.47% | 1.68%B |
| Supplemental Data | ||||||
| Net assets, end of period (000 omitted) | $1,513,979 | $1,476,586 | $1,448,727 | $1,141,808 | $836,468 | $480,498 |
| Portfolio turnover rateI | 20%H | 16% | 18% | 29% | 25% | 22% |
A Calculated based on average shares outstanding during the period.
B Net Investment income per share reflects a large, non-recurring dividend which amounted to $.06 per share. Excluding this non-recurring dividend, the ratio of net investment income (loss) to average net assets would have been 1.21%.
C Total distributions of $.38 per share is comprised of distributions from net investment income of $.172 and distributions from net realized gain of $.203 per share.
D Total returns for periods of less than one year are not annualized.
E Total returns would have been lower if certain expenses had not been reduced during the applicable periods shown.
F Fees and expenses of any underlying Fidelity Central Funds are not included in the Fund's expense ratio. The Fund indirectly bears its proportionate share of the expenses of any underlying Fidelity Central Funds.
G Expense ratios reflect operating expenses of the class. Expenses before reductions do not reflect amounts reimbursed by the investment adviser or reductions from brokerage service arrangements or reductions from other expense offset arrangements and do not represent the amount paid by the class during periods when reimbursements or reductions occur. Expenses net of fee waivers reflect expenses after reimbursement by the investment adviser but prior to reductions from brokerage service arrangements or other expense offset arrangements. Expenses net of all reductions represent the net expenses paid by the class.
H Annualized
I Amount does not include the portfolio activity of any underlying Fidelity Central Funds.
See accompanying notes which are an integral part of the financial statements.
Fidelity® Series International Value Fund
Investment Summary (Unaudited)
Geographic Diversification (% of fund's net assets)
| As of April 30, 2016 | ||
| United Kingdom | 20.8% | |
| Japan | 19.6% | |
| France | 17.9% | |
| Switzerland | 7.9% | |
| United States of America* | 6.2% | |
| Germany | 6.0% | |
| Netherlands | 3.8% | |
| Australia | 3.7% | |
| Italy | 3.1% | |
| Other | 11.0% | |

* Includes Short-Term investments and Net Other Assets (Liabilities).
Percentages are based on country or territory of incorporation and are adjusted for the effect of futures contracts, if applicable.
| As of October 31, 2015 | ||
| United Kingdom | 23.9% | |
| Japan | 20.7% | |
| France | 16.4% | |
| Switzerland | 8.3% | |
| Germany | 5.6% | |
| United States of America* | 4.9% | |
| Netherlands | 3.8% | |
| Australia | 3.1% | |
| Spain | 2.0% | |
| Other | 11.3% | |
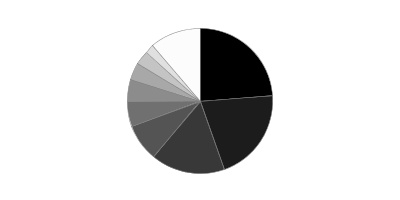
* Includes Short-Term investments and Net Other Assets (Liabilities).
Percentages are based on country or territory of incorporation and are adjusted for the effect of futures contracts, if applicable.
Asset Allocation as of April 30, 2016
| % of fund's net assets | % of fund's net assets 6 months ago | |
| Stocks | 99.1 | 98.7 |
| Short-Term Investments and Net Other Assets (Liabilities) | 0.9 | 1.3 |
Top Ten Stocks as of April 30, 2016
| % of fund's net assets | % of fund's net assets 6 months ago | |
| Total SA (France, Oil, Gas & Consumable Fuels) | 3.5 | 3.1 |
| Westpac Banking Corp. (Australia, Banks) | 2.3 | 1.5 |
| Toyota Motor Corp. (Japan, Automobiles) | 2.2 | 2.4 |
| Nestle SA (Switzerland, Food Products) | 2.2 | 2.7 |
| Sanofi SA (France, Pharmaceuticals) | 2.1 | 2.6 |
| Rio Tinto PLC (United Kingdom, Metals & Mining) | 2.1 | 1.7 |
| Vodafone Group PLC sponsored ADR (United Kingdom, Wireless Telecommunication Services) | 1.9 | 1.8 |
| Imperial Tobacco Group PLC (United Kingdom, Tobacco) | 1.8 | 1.8 |
| Novartis AG (Switzerland, Pharmaceuticals) | 1.8 | 2.5 |
| BASF AG (Germany, Chemicals) | 1.7 | 1.7 |
| 21.6 |
Market Sectors as of April 30, 2016
| % of fund's net assets | % of fund's net assets 6 months ago | |
| Financials | 24.3 | 26.7 |
| Consumer Discretionary | 13.8 | 14.5 |
| Health Care | 13.5 | 16.0 |
| Consumer Staples | 9.3 | 9.3 |
| Industrials | 9.0 | 8.2 |
| Energy | 8.2 | 6.7 |
| Telecommunication Services | 6.8 | 6.1 |
| Materials | 5.9 | 4.3 |
| Information Technology | 4.5 | 3.8 |
| Utilities | 3.8 | 3.1 |
Fidelity® Series International Value Fund
Investments April 30, 2016 (Unaudited)
Showing Percentage of Net Assets
| Common Stocks - 98.7% | |||
| Shares | Value | ||
| Australia - 3.7% | |||
| Ansell Ltd. (a) | 3,654,151 | $55,374,184 | |
| Macquarie Group Ltd. | 1,011,105 | 48,818,399 | |
| Transurban Group unit | 7,810,538 | 68,770,639 | |
| Westpac Banking Corp. | 11,749,427 | 275,800,911 | |
| TOTAL AUSTRALIA | 448,764,133 | ||
| Bailiwick of Jersey - 0.7% | |||
| Wolseley PLC | 1,599,040 | 89,565,539 | |
| Belgium - 0.5% | |||
| Anheuser-Busch InBev SA NV | 506,730 | 62,722,991 | |
| Canada - 1.1% | |||
| Imperial Oil Ltd. | 2,611,200 | 86,596,025 | |
| Potash Corp. of Saskatchewan, Inc. | 2,321,700 | 41,078,935 | |
| TOTAL CANADA | 127,674,960 | ||
| Finland - 1.1% | |||
| Sampo Oyj (A Shares) | 2,961,313 | 129,293,166 | |
| France - 17.9% | |||
| Atos Origin SA | 1,720,903 | 153,171,845 | |
| AXA SA (b) | 8,143,573 | 205,621,937 | |
| Bouygues SA (b) | 1,298,831 | 43,308,034 | |
| Capgemini SA | 1,691,105 | 157,874,674 | |
| Havas SA | 8,786,342 | 73,524,333 | |
| Orange SA | 6,434,800 | 106,907,321 | |
| Renault SA | 1,048,492 | 101,184,525 | |
| Sanofi SA (b) | 3,137,308 | 258,597,511 | |
| Societe Generale Series A | 3,338,500 | 131,360,527 | |
| SR Teleperformance SA | 616,000 | 55,299,503 | |
| Total SA | 8,326,349 | 420,820,213 | |
| Unibail-Rodamco | 534,300 | 143,161,250 | |
| VINCI SA (b) | 2,587,300 | 193,279,232 | |
| Vivendi SA (b) | 6,019,581 | 115,638,061 | |
| TOTAL FRANCE | 2,159,748,966 | ||
| Germany - 5.6% | |||
| Axel Springer Verlag AG (b) | 986,300 | 55,067,731 | |
| BASF AG | 2,566,118 | 212,000,756 | |
| Bayer AG | 611,314 | 70,523,498 | |
| Continental AG | 251,233 | 55,175,940 | |
| Fresenius SE & Co. KGaA | 1,945,100 | 141,474,079 | |
| GEA Group AG | 1,231,347 | 57,089,033 | |
| SAP AG | 1,131,022 | 88,741,171 | |
| TOTAL GERMANY | 680,072,208 | ||
| Hong Kong - 0.7% | |||
| Power Assets Holdings Ltd. | 9,256,050 | 88,062,893 | |
| Ireland - 1.2% | |||
| Allergan PLC (a) | 230,400 | 49,895,424 | |
| Medtronic PLC | 1,138,400 | 90,104,360 | |
| TOTAL IRELAND | 139,999,784 | ||
| Israel - 1.4% | |||
| Teva Pharmaceutical Industries Ltd. sponsored ADR | 3,167,492 | 172,469,939 | |
| Italy - 3.1% | |||
| Eni SpA | 10,159,700 | 165,978,297 | |
| Intesa Sanpaolo SpA | 31,229,500 | 86,811,777 | |
| Mediaset SpA | 12,572,300 | 56,575,935 | |
| Telecom Italia SpA (a) | 66,912,700 | 65,338,492 | |
| TOTAL ITALY | 374,704,501 | ||
| Japan - 19.6% | |||
| Astellas Pharma, Inc. | 8,800,600 | 118,654,917 | |
| Dentsu, Inc. | 2,298,800 | 116,799,749 | |
| East Japan Railway Co. | 888,000 | 78,122,760 | |
| Hoya Corp. | 3,146,500 | 120,492,939 | |
| Itochu Corp. | 9,030,000 | 114,758,698 | |
| Japan Tobacco, Inc. | 3,413,600 | 139,472,661 | |
| KDDI Corp. | 5,320,300 | 153,255,144 | |
| Makita Corp. | 1,333,500 | 84,121,726 | |
| Mitsubishi UFJ Financial Group, Inc. | 38,187,600 | 176,228,729 | |
| Nippon Prologis REIT, Inc. (c) | 24,546 | 58,857,329 | |
| Nippon Telegraph & Telephone Corp. | 4,478,400 | 200,409,884 | |
| OBIC Co. Ltd. | 1,398,600 | 73,511,724 | |
| Olympus Corp. | 2,623,700 | 102,210,496 | |
| ORIX Corp. | 7,545,600 | 106,732,027 | |
| Seven & i Holdings Co. Ltd. | 2,506,400 | 102,267,230 | |
| Seven Bank Ltd. | 18,455,700 | 78,422,107 | |
| Sony Corp. | 3,278,000 | 79,398,478 | |
| Sony Financial Holdings, Inc. | 4,736,000 | 58,550,863 | |
| Sumitomo Mitsui Financial Group, Inc. | 4,605,300 | 138,581,391 | |
| Toyota Motor Corp. | 5,351,100 | 271,245,903 | |
| TOTAL JAPAN | 2,372,094,755 | ||
| Luxembourg - 0.5% | |||
| RTL Group SA | 701,139 | 58,270,070 | |
| Netherlands - 3.8% | |||
| ING Groep NV (Certificaten Van Aandelen) | 12,157,434 | 148,883,702 | |
| Koninklijke KPN NV | 15,905,021 | 62,501,250 | |
| Mylan N.V. | 1,067,100 | 44,508,741 | |
| PostNL NV (a) | 5,580,449 | 24,409,392 | |
| RELX NV | 10,780,819 | 180,909,773 | |
| TOTAL NETHERLANDS | 461,212,858 | ||
| Spain - 2.2% | |||
| Iberdrola SA | 27,322,140 | 194,499,235 | |
| Mediaset Espana Comunicacion SA | 5,347,200 | 69,432,681 | |
| TOTAL SPAIN | 263,931,916 | ||
| Sweden - 1.6% | |||
| Nordea Bank AB | 14,553,933 | 141,272,167 | |
| Sandvik AB (b) | 5,099,900 | 52,329,790 | |
| TOTAL SWEDEN | 193,601,957 | ||
| Switzerland - 7.9% | |||
| Credit Suisse Group AG | 5,196,274 | 79,079,303 | |
| Lafargeholcim Ltd. (Reg.) | 1,434,140 | 72,611,466 | |
| Nestle SA | 3,620,669 | 270,245,601 | |
| Novartis AG | 2,853,378 | 217,148,520 | |
| Syngenta AG (Switzerland) | 343,627 | 137,551,098 | |
| UBS Group AG | 2,404,671 | 41,528,668 | |
| Zurich Insurance Group AG | 607,261 | 136,259,852 | |
| TOTAL SWITZERLAND | 954,424,508 | ||
| United Kingdom - 20.8% | |||
| AstraZeneca PLC (United Kingdom) | 3,375,132 | 193,640,054 | |
| Aviva PLC | 17,390,272 | 110,175,863 | |
| BAE Systems PLC | 14,261,350 | 99,496,568 | |
| Barclays PLC | 44,086,029 | 110,689,381 | |
| Bunzl PLC | 4,503,905 | 134,184,159 | |
| Compass Group PLC | 7,774,317 | 138,448,060 | |
| HSBC Holdings PLC sponsored ADR (b) | 5,721,911 | 190,711,294 | |
| Imperial Tobacco Group PLC | 4,077,198 | 221,525,840 | |
| Informa PLC | 11,160,888 | 106,734,103 | |
| ITV PLC | 39,444,485 | 129,792,465 | |
| Lloyds Banking Group PLC | 189,929,700 | 186,418,093 | |
| Micro Focus International PLC | 3,419,700 | 76,399,461 | |
| National Grid PLC | 12,376,215 | 176,591,339 | |
| Prudential PLC | 2,692,269 | 53,144,135 | |
| Rio Tinto PLC | 7,361,637 | 246,955,656 | |
| Royal Dutch Shell PLC Class B (United Kingdom) | 4,220,161 | 110,799,762 | |
| Vodafone Group PLC sponsored ADR | 6,858,766 | 224,555,999 | |
| TOTAL UNITED KINGDOM | 2,510,262,232 | ||
| United States of America - 5.3% | |||
| Altria Group, Inc. | 1,170,800 | 73,420,868 | |
| Chevron Corp. | 961,000 | 98,194,980 | |
| ConocoPhillips Co. | 2,340,700 | 111,862,053 | |
| Constellation Brands, Inc. Class A (sub. vtg.) | 897,100 | 140,001,426 | |
| Edgewell Personal Care Co. (a) | 579,800 | 47,584,186 | |
| McGraw Hill Financial, Inc. | 891,800 | 95,288,830 | |
| Molson Coors Brewing Co. Class B | 741,400 | 70,900,082 | |
| TOTAL UNITED STATES OF AMERICA | 637,252,425 | ||
| TOTAL COMMON STOCKS | |||
| (Cost $11,567,475,960) | 11,924,129,801 | ||
| Nonconvertible Preferred Stocks - 0.4% | |||
| Germany - 0.4% | |||
| Volkswagen AG | |||
| (Cost $65,583,102) | 324,190 | 46,939,980 | |
| Money Market Funds - 4.8% | |||
| Fidelity Cash Central Fund, 0.38% (d) | 113,846,623 | 113,846,623 | |
| Fidelity Securities Lending Cash Central Fund, 0.42% (d)(e) | 461,878,371 | 461,878,371 | |
| TOTAL MONEY MARKET FUNDS | |||
| (Cost $575,724,994) | 575,724,994 | ||
| TOTAL INVESTMENT PORTFOLIO - 103.9% | |||
| (Cost $12,208,784,056) | 12,546,794,775 | ||
| NET OTHER ASSETS (LIABILITIES) - (3.9)% | (470,893,232) | ||
| NET ASSETS - 100% | $12,075,901,543 |
Categorizations in the Schedule of Investments are based on country or territory of incorporation.
Legend
(a) Non-income producing
(b) Security or a portion of the security is on loan at period end.
(c) Security or a portion of the security purchased on a delayed delivery or when-issued basis.
(d) Affiliated fund that is generally available only to investment companies and other accounts managed by Fidelity Investments. The rate quoted is the annualized seven-day yield of the fund at period end. A complete unaudited listing of the fund's holdings as of its most recent quarter end is available upon request. In addition, each Fidelity Central Fund's financial statements are available on the SEC's website or upon request.
(e) Investment made with cash collateral received from securities on loan.
Affiliated Central Funds
Information regarding fiscal year to date income earned by the Fund from investments in Fidelity Central Funds is as follows:
| Fund | Income earned |
| Fidelity Cash Central Fund | $194,241 |
| Fidelity Securities Lending Cash Central Fund | 4,948,001 |
| Total | $5,142,242 |
Investment Valuation
The following is a summary of the inputs used, as of April 30, 2016, involving the Fund's assets and liabilities carried at fair value. The inputs or methodology used for valuing securities may not be an indication of the risk associated with investing in those securities. For more information on valuation inputs, and their aggregation into the levels used below, please refer to the Investment Valuation section in the accompanying Notes to Financial Statements.
| Valuation Inputs at Reporting Date: | ||||
| Description | Total | Level 1 | Level 2 | Level 3 |
| Investments in Securities: | ||||
| Equities: | ||||
| Consumer Discretionary | $1,655,137,787 | $933,607,536 | $721,530,251 | $-- |
| Consumer Staples | 1,128,140,885 | 616,155,393 | 511,985,492 | -- |
| Energy | 994,251,330 | 296,653,058 | 697,598,272 | -- |
| Financials | 2,931,691,701 | 938,957,476 | 1,992,734,225 | -- |
| Health Care | 1,635,094,662 | 624,350,225 | 1,010,744,437 | -- |
| Industrials | 1,094,735,073 | 628,669,782 | 466,065,291 | -- |
| Information Technology | 549,698,875 | 234,274,135 | 315,424,740 | -- |
| Materials | 710,197,911 | 463,242,255 | 246,955,656 | -- |
| Telecommunication Services | 812,968,090 | 224,555,999 | 588,412,091 | -- |
| Utilities | 459,153,467 | -- | 459,153,467 | -- |
| Money Market Funds | 575,724,994 | 575,724,994 | -- | -- |
| Total Investments in Securities: | $12,546,794,775 | $5,536,190,853 | $7,010,603,922 | $-- |
The following is a summary of transfers between Level 1 and Level 2 for the period ended April 30, 2016. Transfers are assumed to have occurred at the beginning of the period, and are primarily attributable to the valuation techniques used for foreign equity securities, as discussed in the accompanying Notes to Financial Statements:
| Transfers | Total |
| Level 1 to Level 2 | $397,019,332 |
| Level 2 to Level 1 | $699,911,923 |
See accompanying notes which are an integral part of the financial statements.
Fidelity® Series International Value Fund
Financial Statements
Statement of Assets and Liabilities
| April 30, 2016 (Unaudited) | ||
| Assets | ||
| Investment in securities, at value (including securities loaned of $432,959,827) — See accompanying schedule: Unaffiliated issuers (cost $11,633,059,062) | $11,971,069,781 | |
| Fidelity Central Funds (cost $575,724,994) | 575,724,994 | |
| Total Investments (cost $12,208,784,056) | $12,546,794,775 | |
| Foreign currency held at value (cost $2,645,199) | 2,650,734 | |
| Receivable for investments sold | 18,214,211 | |
| Receivable for fund shares sold | 392,925 | |
| Dividends receivable | 94,419,891 | |
| Distributions receivable from Fidelity Central Funds | 1,800,938 | |
| Prepaid expenses | 9,672 | |
| Other receivables | 98,802 | |
| Total assets | 12,664,381,948 | |
| Liabilities | ||
| Payable for investments purchased | ||
| Regular delivery | $29,254,302 | |
| Delayed delivery | 3,269,666 | |
| Payable for fund shares redeemed | 85,706,104 | |
| Accrued management fee | 7,224,262 | |
| Other affiliated payables | 904,330 | |
| Other payables and accrued expenses | 243,370 | |
| Collateral on securities loaned, at value | 461,878,371 | |
| Total liabilities | 588,480,405 | |
| Net Assets | $12,075,901,543 | |
| Net Assets consist of: | ||
| Paid in capital | $12,155,596,342 | |
| Undistributed net investment income | 147,308,003 | |
| Accumulated undistributed net realized gain (loss) on investments and foreign currency transactions | (566,897,173) | |
| Net unrealized appreciation (depreciation) on investments and assets and liabilities in foreign currencies | 339,894,371 | |
| Net Assets | $12,075,901,543 | |
| Series International Value: | ||
| Net Asset Value, offering price and redemption price per share ($5,553,587,245 ÷ 594,861,092 shares) | $9.34 | |
| Class F: | ||
| Net Asset Value, offering price and redemption price per share ($6,522,314,298 ÷ 697,018,350 shares) | $9.36 |
See accompanying notes which are an integral part of the financial statements.
Statement of Operations
| Six months ended April 30, 2016 (Unaudited) | ||
| Investment Income | ||
| Dividends | $234,221,023 | |
| Income from Fidelity Central Funds | 5,142,242 | |
| Income before foreign taxes withheld | 239,363,265 | |
| Less foreign taxes withheld | (18,338,722) | |
| Total income | 221,024,543 | |
| Expenses | ||
| Management fee | ||
| Basic fee | $40,580,804 | |
| Performance adjustment | 4,968,827 | |
| Transfer agent fees | 4,478,892 | |
| Accounting and security lending fees | 927,895 | |
| Custodian fees and expenses | 425,572 | |
| Independent trustees' compensation | 25,275 | |
| Registration fees | 73,273 | |
| Audit | 36,246 | |
| Legal | 15,543 | |
| Interest | 629 | |
| Miscellaneous | 38,479 | |
| Total expenses before reductions | 51,571,435 | |
| Expense reductions | (207,019) | 51,364,416 |
| Net investment income (loss) | 169,660,127 | |
| Realized and Unrealized Gain (Loss) | ||
| Net realized gain (loss) on: | ||
| Investment securities: | ||
| Unaffiliated issuers | (203,283,539) | |
| Foreign currency transactions | 4,657,234 | |
| Total net realized gain (loss) | (198,626,305) | |
| Change in net unrealized appreciation (depreciation) on: Investment securities | (388,688,118) | |
| Assets and liabilities in foreign currencies | (261,122) | |
| Total change in net unrealized appreciation (depreciation) | (388,949,240) | |
| Net gain (loss) | (587,575,545) | |
| Net increase (decrease) in net assets resulting from operations | $(417,915,418) |
See accompanying notes which are an integral part of the financial statements.
Statement of Changes in Net Assets
| Six months ended April 30, 2016 (Unaudited) | Year ended October 31, 2015 | |
| Increase (Decrease) in Net Assets | ||
| Operations | ||
| Net investment income (loss) | $169,660,127 | $274,484,451 |
| Net realized gain (loss) | (198,626,305) | (309,998,752) |
| Change in net unrealized appreciation (depreciation) | (388,949,240) | (7,266,459) |
| Net increase (decrease) in net assets resulting from operations | (417,915,418) | (42,780,760) |
| Distributions to shareholders from net investment income | (256,925,581) | (519,162,017) |
| Distributions to shareholders from net realized gain | – | (371,264,934) |
| Total distributions | (256,925,581) | (890,426,951) |
| Share transactions - net increase (decrease) | 757,690,188 | 487,487,592 |
| Total increase (decrease) in net assets | 82,849,189 | (445,720,119) |
| Net Assets | ||
| Beginning of period | 11,993,052,354 | 12,438,772,473 |
| End of period (including undistributed net investment income of $147,308,003 and undistributed net investment income of $234,573,457, respectively) | $12,075,901,543 | $11,993,052,354 |
See accompanying notes which are an integral part of the financial statements.
Financial Highlights — Fidelity Series International Value
| Six months ended (Unaudited) April 30, | Years ended October 31, | |||||
| 2016 | 2015 | 2014 | 2013 | 2012 | 2011 | |
| Selected Per–Share Data | ||||||
| Net asset value, beginning of period | $9.91 | $10.73 | $11.14 | $9.16 | $8.59 | $9.91 |
| Income from Investment Operations | ||||||
| Net investment income (loss)A | .13 | .22 | .45B | .26 | .29 | .30 |
| Net realized and unrealized gain (loss) | (.50) | (.28) | (.59) | 2.03 | .50 | (1.45) |
| Total from investment operations | (.37) | (.06) | (.14) | 2.29 | .79 | (1.15) |
| Distributions from net investment income | (.20) | (.44) | (.24) | (.26) | (.22) | (.13) |
| Distributions from net realized gain | – | (.32) | (.04) | (.06) | – | (.04) |
| Total distributions | (.20) | (.76) | (.27)C | (.31)D | (.22) | (.17) |
| Net asset value, end of period | $9.34 | $9.91 | $10.73 | $11.14 | $9.16 | $8.59 |
| Total ReturnE,F | (3.77)% | (.65)% | (1.25)% | 25.78% | 9.56% | (11.84)% |
| Ratios to Average Net AssetsG,H | ||||||
| Expenses before reductions | .98%I | .89% | .82% | .88% | .90% | .95% |
| Expenses net of fee waivers, if any | .98%I | .89% | .82% | .88% | .90% | .95% |
| Expenses net of all reductions | .97%I | .88% | .81% | .85% | .87% | .93% |
| Net investment income (loss) | 2.83%I | 2.12% | 4.05%B | 2.58% | 3.35% | 3.05% |
| Supplemental Data | ||||||
| Net assets, end of period (000 omitted) | $5,553,587 | $5,556,957 | $5,971,189 | $5,710,397 | $5,107,633 | $4,503,487 |
| Portfolio turnover rateJ | 25%I | 44% | 70% | 80% | 63% | 78% |
A Calculated based on average shares outstanding during the period.
B Net Investment income per share reflects a large, non-recurring dividend which amounted to $.18 per share. Excluding this non-recurring dividend, the ratio of net investment income (loss) to average net assets would have been 2.46%.
C Total distributions of $.27 per share is comprised of distributions from net investment income of $.237 and distributions from net realized gain of $.036 per share.
D Total distributions of $.31 per share is comprised of distributions from net investment income of $.256 and distributions from net realized gain of $.057 per share.
E Total returns for periods of less than one year are not annualized.
F Total returns would have been lower if certain expenses had not been reduced during the applicable periods shown.
G Fees and expenses of any underlying Fidelity Central Funds are not included in the Fund's expense ratio. The Fund indirectly bears its proportionate share of the expenses of any underlying Fidelity Central Funds.
H Expense ratios reflect operating expenses of the class. Expenses before reductions do not reflect amounts reimbursed by the investment adviser or reductions from brokerage service arrangements or reductions from other expense offset arrangements and do not represent the amount paid by the class during periods when reimbursements or reductions occur. Expenses net of fee waivers reflect expenses after reimbursement by the investment adviser but prior to reductions from brokerage service arrangements or other expense offset arrangements. Expenses net of all reductions represent the net expenses paid by the class.
I Annualized
J Amount does not include the portfolio activity of any underlying Fidelity Central Funds.
See accompanying notes which are an integral part of the financial statements.
Financial Highlights — Fidelity Series International Value Fund Class F
| Six months ended (Unaudited) April 30, | Years ended October 31, | |||||
| 2016 | 2015 | 2014 | 2013 | 2012 | 2011 | |
| Selected Per–Share Data | ||||||
| Net asset value, beginning of period | $9.94 | $10.76 | $11.18 | $9.19 | $8.62 | $9.93 |
| Income from Investment Operations | ||||||
| Net investment income (loss)A | .14 | .23 | .47B | .28 | .30 | .31 |
| Net realized and unrealized gain (loss) | (.50) | (.27) | (.60) | 2.04 | .51 | (1.44) |
| Total from investment operations | (.36) | (.04) | (.13) | 2.32 | .81 | (1.13) |
| Distributions from net investment income | (.22) | (.46) | (.25) | (.27) | (.24) | (.14) |
| Distributions from net realized gain | – | (.32) | (.04) | (.06) | – | (.04) |
| Total distributions | (.22) | (.78) | (.29) | (.33) | (.24) | (.18) |
| Net asset value, end of period | $9.36 | $9.94 | $10.76 | $11.18 | $9.19 | $8.62 |
| Total ReturnC,D | (3.68)% | (.46)% | (1.18)% | 26.05% | 9.77% | (11.61)% |
| Ratios to Average Net AssetsE,F | ||||||
| Expenses before reductions | .81%G | .73% | .65% | .69% | .70% | .74% |
| Expenses net of fee waivers, if any | .81%G | .73% | .65% | .69% | .70% | .74% |
| Expenses net of all reductions | .81%G | .72% | .64% | .67% | .67% | .72% |
| Net investment income (loss) | 3.00%G | 2.28% | 4.22%B | 2.76% | 3.55% | 3.26% |
| Supplemental Data | ||||||
| Net assets, end of period (000 omitted) | $6,522,314 | $6,436,096 | $6,467,583 | $5,601,176 | $4,114,635 | $1,955,967 |
| Portfolio turnover rateH | 25%G | 44% | 70% | 80% | 63% | 78% |
A Calculated based on average shares outstanding during the period.
B Net Investment income per share reflects a large, non-recurring dividend which amounted to $.18 per share. Excluding this non-recurring dividend, the ratio of net investment income (loss) to average net assets would have been 2.64%.
C Total returns for periods of less than one year are not annualized.
D Total returns would have been lower if certain expenses had not been reduced during the applicable periods shown.
E Fees and expenses of any underlying Fidelity Central Funds are not included in the Fund's expense ratio. The Fund indirectly bears its proportionate share of the expenses of any underlying Fidelity Central Funds.
F Expense ratios reflect operating expenses of the class. Expenses before reductions do not reflect amounts reimbursed by the investment adviser or reductions from brokerage service arrangements or reductions from other expense offset arrangements and do not represent the amount paid by the class during periods when reimbursements or reductions occur. Expenses net of fee waivers reflect expenses after reimbursement by the investment adviser but prior to reductions from brokerage service arrangements or other expense offset arrangements. Expenses net of all reductions represent the net expenses paid by the class.
G Annualized
H Amount does not include the portfolio activity of any underlying Fidelity Central Funds.
See accompanying notes which are an integral part of the financial statements.
Notes to Financial Statements (Unaudited)
For the period ended April 30, 2016
1. Organization.
Fidelity Series Emerging Markets Fund, Fidelity Series International Growth Fund, Fidelity Series International Small Cap Fund and Fidelity Series International Value Fund (the Funds) are funds of Fidelity Investment Trust (the Trust). The Trust is registered under the Investment Company Act of 1940, as amended (the 1940 Act), as an open-end management investment company organized as a Massachusetts business trust. Each Fund is authorized to issue an unlimited number of shares. Shares of the Funds are only available for purchase by mutual funds for which Fidelity Management & Research Company (FMR) or an affiliate serves as an investment manager. Fidelity Series Emerging Markets Fund offers Series Emerging Markets shares and Class F shares. Fidelity Series International Growth Fund offers Series International Growth shares and Class F shares. Fidelity Series International Small Cap Fund offers Series International Small Cap shares and Class F shares. Fidelity Series International Value Fund offers Series International Value shares and Class F shares. All classes have equal rights as to assets and voting privileges. Each class has exclusive voting rights with respect to matters that affect that class. The Funds' investments in emerging markets can be subject to social, economic, regulatory, and political uncertainties and can be extremely volatile.
2. Investments in Fidelity Central Funds.
The Funds invest in Fidelity Central Funds, which are open-end investment companies generally available only to other investment companies and accounts managed by the investment adviser and its affiliates. The Funds' Schedules of Investments list each of the Fidelity Central Funds held as of period end, if any, as an investment of each Fund, but do not include the underlying holdings of each Fidelity Central Fund. As an Investing Fund, each Fund indirectly bears its proportionate share of the expenses of the underlying Fidelity Central Funds.
The Money Market Central Funds seek preservation of capital and current income and are managed by Fidelity Investments Money Management, Inc. (FIMM), an affiliate of the investment adviser. Annualized expenses of the Money Market Central Funds as of their most recent shareholder report date are less than .005%.
A complete unaudited list of holdings for each Fidelity Central Fund is available upon request or at the Securities and Exchange Commission (the SEC) website at www.sec.gov. In addition, the financial statements of the Fidelity Central Funds are available on the SEC website or upon request.
3. Significant Accounting Policies.
The financial statements have been prepared in conformity with accounting principles generally accepted in the United States of America (GAAP), which require management to make certain estimates and assumptions at the date of the financial statements. Actual results could differ from those estimates. Subsequent events, if any, through the date that the financial statements were issued have been evaluated in the preparation of the financial statements. The following summarizes the significant accounting policies of the Funds:
Investment Valuation. Investments are valued as of 4:00 p.m. Eastern time on the last calendar day of the period. The Board of Trustees (the Board) has delegated the day to day responsibility for the valuation of each Fund's investments to the FMR Fair Value Committee (the Committee). In accordance with valuation policies and procedures approved by the Board, each Fund attempts to obtain prices from one or more third party pricing vendors or brokers to value its investments. When current market prices, quotations or currency exchange rates are not readily available or reliable, investments will be fair valued in good faith by the Committee, in accordance with procedures adopted by the Board. Factors used in determining fair value vary by investment type and may include market or investment specific events, changes in interest rates and credit quality. The frequency with which these procedures are used cannot be predicted and they may be utilized to a significant extent. The Committee oversees each Fund's valuation policies and procedures and reports to the Board on the Committee's activities and fair value determinations. The Board monitors the appropriateness of the procedures used in valuing each Fund's investments and ratifies the fair value determinations of the Committee.
Each Fund categorizes the inputs to valuation techniques used to value its investments into a disclosure hierarchy consisting of three levels as shown below:
- Level 1 – quoted prices in active markets for identical investments
- Level 2 – other significant observable inputs (including quoted prices for similar investments, interest rates, prepayment speeds, etc.)
- Level 3 – unobservable inputs (including the Fund's own assumptions based on the best information available)
Valuation techniques used to value each Fund's investments by major category are as follows:
Equity securities, including restricted securities, for which market quotations are readily available, are valued at the last reported sale price or official closing price as reported by a third party pricing vendor on the primary market or exchange on which they are traded and are categorized as Level 1 in the hierarchy. In the event there were no sales during the day or closing prices are not available, securities are valued at the last quoted bid price or may be valued using the last available price and are generally categorized as Level 2 in the hierarchy. For foreign equity securities, when market or security specific events arise, comparisons to the valuation of American Depositary Receipts (ADRs), futures contracts, Exchange-Traded Funds (ETFs) and certain indexes as well as quoted prices for similar securities may be used and would be categorized as Level 2 in the hierarchy. Utilizing these techniques may result in transfers between Level 1 and Level 2. For equity securities, including restricted securities, where observable inputs are limited, assumptions about market activity and risk are used and these securities may be categorized as Level 3 in the hierarchy.
Debt securities, including restricted securities, are valued based on evaluated prices received from third party pricing vendors or from brokers who make markets in such securities. U.S. government and government agency obligations are valued by pricing vendors who utilize matrix pricing which considers yield or price of bonds of comparable quality, coupon, maturity and type or by broker-supplied prices. When independent prices are unavailable or unreliable, debt securities may be valued utilizing pricing methodologies which consider similar factors that would be used by third party pricing vendors. Debt securities are generally categorized as Level 2 in the hierarchy but may be Level 3 depending on the circumstances.
Futures contracts are valued at the settlement price established each day by the board of trade or exchange on which they are traded and are categorized as Level 1 in the hierarchy. Investments in open-end mutual funds, including the Fidelity Central Funds, are valued at their closing net asset value (NAV) each business day and are categorized as Level 1 in the hierarchy.
Changes in valuation techniques may result in transfers in or out of an assigned level within the disclosure hierarchy. The aggregate value of investments by input level as of April 30, 2016, including information on transfers between Levels 1 and 2 is included at the end of each applicable Fund's Schedule of Investments.
Foreign Currency. The Funds may use foreign currency contracts to facilitate transactions in foreign-denominated securities. Gains and losses from these transactions may arise from changes in the value of the foreign currency or if the counterparties do not perform under the contracts' terms.
Foreign-denominated assets, including investment securities, and liabilities are translated into U.S. dollars at the exchange rates at period end. Purchases and sales of investment securities, income and dividends received and expenses denominated in foreign currencies are translated into U.S. dollars at the exchange rate in effect on the transaction date.
The effects of exchange rate fluctuations on investments are included with the net realized and unrealized gain (loss) on investment securities. Other foreign currency transactions resulting in realized and unrealized gain (loss) are disclosed separately.
Investment Transactions and Income. For financial reporting purposes, the Funds' investment holdings and NAV include trades executed through the end of the last business day of the period. The NAV per share for processing shareholder transactions is calculated as of the close of business of the New York Stock Exchange (NYSE), normally 4:00 p.m. Eastern time and includes trades executed through the end of the prior business day. Gains and losses on securities sold are determined on the basis of identified cost and may include proceeds received from litigation. Dividend income is recorded on the ex-dividend date, except for certain dividends from foreign securities where the ex-dividend date may have passed, which are recorded as soon as the Funds are informed of the ex-dividend date. Non-cash dividends included in dividend income, if any, are recorded at the fair market value of the securities received. Income and capital gain distributions from Fidelity Central Funds, if any, are recorded on the ex-dividend date. Distributions received on securities that represent a return of capital or capital gain are recorded as a reduction of cost of investments and/or as a realized gain. Subsequent to ex-dividend date the Funds determine the components of these distributions, based upon receipt of tax filings or other correspondence relating to the underlying investment. Interest income is accrued as earned and includes coupon interest and amortization of premium and accretion of discount on debt securities as applicable. Investment income is recorded net of foreign taxes withheld where recovery of such taxes is uncertain.
Class Allocations and Expenses. Investment income, realized and unrealized capital gains and losses, common expenses of each Fund, and certain fund-level expense reductions, if any, are allocated daily on a pro-rata basis to each class based on the relative net assets of each class to the total net assets of each Fund. Each class differs with respect to transfer agent fees incurred. Certain expense reductions may also differ by class. For the reporting period, the allocated portion of income and expenses to each class as a percent of its average net assets may vary due to the timing of recording these transactions in relation to fluctuating net assets of the classes. Expenses directly attributable to a fund are charged to that fund. Expenses attributable to more than one fund are allocated among the respective funds on the basis of relative net assets or other appropriate methods. Expense estimates are accrued in the period to which they relate and adjustments are made when actual amounts are known.
Income Tax Information and Distributions to Shareholders. Each year, each Fund intends to qualify as a regulated investment company under Subchapter M of the Internal Revenue Code, including distributing substantially all of its taxable income and realized gains. As a result, no provision for U.S. Federal income taxes is required. Each Fund files a U.S. federal tax return, in addition to state and local tax returns as required. Each Fund's federal income tax returns are subject to examination by the Internal Revenue Service (IRS) for a period of three fiscal years after they are filed. State and local tax returns may be subject to examination for an additional fiscal year depending on the jurisdiction. Foreign taxes are provided for based on each Fund's understanding of the tax rules and rates that exist in the foreign markets in which it invests. Fidelity Series Emerging Markets Fund and Fidelity Series International Small Cap Fund are subject to a tax imposed on capital gains by certain countries in which they invest. An estimated deferred tax liability for net unrealized appreciation on the applicable securities is included in Other payables and accrued expenses on each applicable Fund's Statement of Assets & Liabilities.
Distributions are declared and recorded on the ex-dividend date. Income dividends and capital gain distributions are declared separately for each class. Income and capital gain distributions are determined in accordance with income tax regulations, which may differ from GAAP.
Capital accounts within the financial statements are adjusted for permanent book-tax differences. These adjustments have no impact on net assets or the results of operations. Capital accounts are not adjusted for temporary book-tax differences which will reverse in a subsequent period.
Book-tax differences are primarily due to futures contracts, foreign currency transactions, certain foreign taxes, passive foreign investment companies (PFIC), partnerships, capital loss carryforwards and losses deferred due to wash sales.
The federal tax cost of investment securities and unrealized appreciation (depreciation) as of period end were as follows for each Fund:
| Tax cost | Gross unrealized appreciation | Gross unrealized depreciation | Net unrealized appreciation (depreciation) on securities | |
| Fidelity Series Emerging Markets Fund | $13,719,882,067 | $1,586,207,581 | $(1,194,178,941) | $392,028,640 |
| Fidelity Series International Growth Fund | 9,834,297,742 | 2,749,295,896 | (280,877,014) | 2,468,418,882 |
| Fidelity Series International Small Cap Fund | 2,255,577,900 | 737,064,840 | (136,982,979) | 600,081,861 |
| Fidelity Series International Value Fund | 12,256,072,103 | 1,353,605,625 | (1,062,882,953) | 290,722,672 |
Capital loss carryforwards are only available to offset future capital gains of the Funds to the extent provided by regulations and may be limited. Under the Regulated Investment Company Modernization Act of 2010 (the Act), the Funds are permitted to carry forward capital losses incurred in taxable years beginning after December 22, 2010 for an unlimited period and such capital losses are required to be used prior to any losses that expire. The capital loss carryforward information presented below, including any applicable limitation, is estimated as of prior fiscal period end and is subject to adjustment.
| No expiration | ||||
| Short-term | Long-term | Total no expiration | Total capital loss carryforward | |
| Fidelity Series Emerging Markets Fund | $(786,915,902) | $(121,276,901) | $(908,192,803) | $(908,192,803) |
| Fidelity Series International Value Fund | (269,639,939) | (48,434,788) | (318,074,727) | (318,074,727) |
Delayed Delivery Transactions and When-Issued Securities. During the period, the Funds transacted in securities on a delayed delivery or when-issued basis. Payment and delivery may take place after the customary settlement period for that security. The price of the underlying securities and the date when the securities will be delivered and paid for are fixed at the time the transaction is negotiated. The securities purchased on a delayed delivery or when-issued basis are identified as such in each applicable Fund's Schedule of Investments. The Funds may receive compensation for interest forgone in the purchase of a delayed delivery or when-issued security. With respect to purchase commitments, each applicable Fund identifies securities as segregated in its records with a value at least equal to the amount of the commitment. Losses may arise due to changes in the value of the underlying securities or if the counterparty does not perform under the contract's terms, or if the issuer does not issue the securities due to political, economic, or other factors.
Restricted Securities. The Funds may invest in securities that are subject to legal or contractual restrictions on resale. These securities generally may be resold in transactions exempt from registration or to the public if the securities are registered. Disposal of these securities may involve time-consuming negotiations and expense, and prompt sale at an acceptable price may be difficult. Information regarding restricted securities is included at the end of each applicable Fund's Schedule of Investments.
4. Derivative Instruments.
Risk Exposures and the Use of Derivative Instruments. The Funds' investment objective allows the Funds to enter into various types of derivative contracts, including futures contracts. Derivatives are investments whose value is primarily derived from underlying assets, indices or reference rates and may be transacted on an exchange or over-the-counter (OTC). Derivatives may involve a future commitment to buy or sell a specified asset based on specified terms, to exchange future cash flows at periodic intervals based on a notional principal amount, or for one party to make one or more payments upon the occurrence of specified events in exchange for periodic payments from the other party.
The Funds used derivatives to increase returns and to manage exposure to certain risks as defined below. The success of any strategy involving derivatives depends on analysis of numerous economic factors, and if the strategies for investment do not work as intended, the Funds may not achieve their objectives.
The Funds' use of derivatives increased or decreased their exposure to the following risk:
| Equity Risk | Equity risk relates to the fluctuations in the value of financial instruments as a result of changes in market prices (other than those arising from interest rate risk or foreign exchange risk), whether caused by factors specific to an individual investment, its issuer, or all factors affecting all instruments traded in a market or market segment. |
The Funds are also exposed to additional risks from investing in derivatives, such as liquidity risk and counterparty credit risk. Liquidity risk is the risk that the Funds will be unable to close out the derivative in the open market in a timely manner. Counterparty credit risk is the risk that the counterparty will not be able to fulfill its obligation to the Funds. Counterparty credit risk related to exchange-traded futures contracts may be mitigated by the protection provided by the exchange on which they trade.
Investing in derivatives may involve greater risks than investing in the underlying assets directly and, to varying degrees, may involve risk of loss in excess of any initial investment and collateral received and amounts recognized in the Statement of Assets and Liabilities. In addition, there may be the risk that the change in value of the derivative contract does not correspond to the change in value of the underlying instrument.
Futures Contracts. A futures contract is an agreement between two parties to buy or sell a specified underlying instrument for a fixed price at a specified future date. The Funds used futures contracts to manage their exposure to the stock market.
Upon entering into a futures contract, a fund is required to deposit either cash or securities (initial margin) with a clearing broker in an amount equal to a certain percentage of the face value of the contract. Futures contracts are marked-to-market daily and subsequent daily payments (variation margin) are made or received by a fund depending on the daily fluctuations in the value of the futures contracts and are recorded as unrealized appreciation or (depreciation). This receivable and/or payable, if any, is included in daily variation margin for derivative instruments in the Statement of Assets and Liabilities. Realized gain or (loss) is recorded upon the expiration or closing of a futures contract. The net realized gain (loss) and change in net unrealized appreciation (depreciation) on futures contracts during the period is included in the Statement of Operations.
Any open futures contracts at period end are presented in the Schedule of Investments under the caption "Futures Contracts". The underlying face amount at value reflects each contract's exposure to the underlying instrument or index at period end. Securities deposited to meet initial margin requirements are identified in the Schedule of Investments.
During the period, Fidelity Series Emerging Markets Fund recognized net realized gain (loss) of $20,896,544 and a change in net unrealized appreciation (depreciation) of $3,454,797 related to its investment in futures contracts. These amounts are included in the Statement of Operations.
5. Purchases and Sales of Investments.
Purchases and sales of securities, other than short-term securities, are noted in the table below.
| Purchases ($) | Sales ($) | |
| Fidelity Series Emerging Markets Fund | 4,895,901,728 | 2,676,191,211 |
| Fidelity Series International Growth Fund | 2,114,081,165 | 2,003,664,599 |
| Fidelity Series International Small Cap Fund | 360,321,364 | 261,581,371 |
| Fidelity Series International Value Fund | 2,189,272,122 | 1,467,439,948 |
6. Fees and Other Transactions with Affiliates.
Management Fee. Fidelity Management & Research Company (the investment adviser) and its affiliates provide the Funds with investment management related services for which the Funds pay a monthly management fee. The management fee is the sum of an individual fund fee rate and an annualized group fee rate. The individual fund fee rate is applied to each Fund's average net assets. The group fee rate is based upon the average net assets of all the mutual funds advised by the investment adviser, including any mutual funds previously advised by the investment adviser that are currently advised by Fidelity SelectCo, LLC, an affiliate of the investment adviser. The group fee rate decreases as assets under management increase and increases as assets under management decrease. In addition, the management fee for Fidelity Series International Growth Fund, Fidelity Series International Small Cap Fund, and Fidelity Series International Value Fund is subject to a performance adjustment (up to a maximum of +/- .20% of each applicable Fund's average net assets over a 36 month performance period.) The upward or downward adjustment to the management fee is based on each funds's relative investment performance of the asset-weighted return of all classes as compared to its benchmark index over the same 36 month performance period. For the reporting period, each Fund's annualized management fee rate expressed as a percentage of each Fund's average net assets, including the performance adjustment, if applicable was as follows. The performance adjustment included in the management fee rate may be higher or lower than the maximum performance adjustment rate due to the difference between the average net asset for the reporting and performance periods.
| Individual Rate | Group Rate | Total | |
| Fidelity Series Emerging Markets Fund | .55% | .25% | .80% |
| Fidelity Series International Growth Fund | .45% | .25% | .73% |
| Fidelity Series International Small Cap Fund | .60% | .25% | .86% |
| Fidelity Series International Value Fund | .45% | .25% | .78% |
| Performance Benchmark | |
| Fidelity Series International Growth Fund | MSCI EAFE Growth Index |
| Fidelity Series International Small Cap Fund | MSCI EAFE Small Cap Index |
| Fidelity Series International Value Fund | MSCI EAFE Value Index |
Transfer Agent Fees. Fidelity Investments Institutional Operations Company, Inc., (FIIOC), an affiliate of the investment adviser, is the transfer, dividend disbursing and shareholder servicing agent for each class of the Funds. FIIOC receives account fees and asset-based fees that vary according to the account size and type of account of the shareholders of the respective classes of each Fund, except for Class F. FIIOC receives no fees for providing transfer agency services to Class F. FIIOC pays for typesetting, printing and mailing of shareholder reports, except proxy statements. For the period, transfer agent fees for each applicable class were as follows:
| Amount | % of Class-Level Average Net Assets(a) | |
| Fidelity Series Emerging Markets Fund | ||
| Series Emerging Markets | $4,745,994 | .16 |
| Fidelity Series International Growth Fund | ||
| Series International Growth | 4,501,874 | .17 |
| Fidelity Series International Small Cap Fund | ||
| Series International Small Cap | 1,038,915 | .17 |
| Fidelity Series International Value Fund | ||
| Series International Value | 4,478,892 | .17 |
(a) Annualized
Accounting and Security Lending Fees. Fidelity Service Company, Inc. (FSC), an affiliate of the investment adviser, maintains each Fund's accounting records. The accounting fee is based on the level of average net assets for each month. Under a separate contract, FSC administers the security lending program. The security lending fee is based on the number and duration of lending transactions.
Brokerage Commissions. Certain Funds placed a portion of their portfolio transactions with brokerage firms which are affiliates of the investment adviser. Brokerage commissions are included in net realized gain (loss) and change in net unrealized appreciation (depreciation) in the Statement of Operations. The commissions paid to these affiliated firms were as follows:
| Amount | |
| Fidelity Series Emerging Markets Fund | $35,256 |
| Fidelity Series International Growth Fund | 4,162 |
| Fidelity Series International Small Cap Fund | 1,039 |
| Fidelity Series International Value Fund | 2,942 |
Interfund Lending Program. Pursuant to an Exemptive Order issued by the SEC, the Funds, along with other registered investment companies having management contracts with FMR or other affiliated entities of FMR, may participate in an interfund lending program. This program provides an alternative credit facility allowing the funds to borrow from, or lend money to, other participating affiliated funds. At period end, there were no interfund loans outstanding. Each applicable fund's activity in this program during the period for which loans were outstanding was as follows:
| Borrower or Lender | Average Loan Balance | Weighted Average Interest Rate | Interest Expense | |
| Fidelity Series International Value Fund | Borrower | $18,296,500 | .62% | $629 |
Interfund Trades. The Funds may purchase from or sell securities to other Fidelity Funds under procedures adopted by the Board. The procedures have been designed to ensure these interfund trades are executed in accordance with Rule 17a-7 of the 1940 Act. Interfund trades are included within the respective purchases and sales amounts shown in the Purchases and Sales of Investments note.
Other. During the period, the investment adviser reimbursed Fidelity Series International Small Cap Fund for certain losses in the amount of $11,989.
7. Committed Line of Credit.
Certain Funds participate with other funds managed by the investment adviser or an affiliate in a $4.25 billion credit facility (the "line of credit") to be utilized for temporary or emergency purposes to fund shareholder redemptions or for other short-term liquidity purposes. The participating funds have agreed to pay commitment fees on their pro-rata portion of the line of credit, which are reflected in Miscellaneous expenses on the Statement of Operations, and are as follows:
| Fidelity Series Emerging Markets Fund | $10,481 |
| Fidelity Series International Growth Fund | 10,253 |
| Fidelity Series International Small Cap Fund | 2,363 |
| Fidelity Series International Value Fund | 10,226 |
During the period, the Funds did not borrow on this line of credit.
8. Security Lending.
Certain Funds lend portfolio securities through a lending agent from time to time in order to earn additional income. For equity securities, a lending agent is used and may loan securities to certain qualified borrowers, including Fidelity Capital Markets (FCM), a broker-dealer affiliated with the Funds. On the settlement date of the loan, each applicable Fund receives collateral (in the form of U.S. Treasury obligations, letters of credit and/or cash) against the loaned securities and maintains collateral in an amount not less than 100% of the market value of the loaned securities during the period of the loan. The market value of the loaned securities is determined at the close of business of the Funds and any additional required collateral is delivered to the Funds on the next business day. The Funds or borrower may terminate the loan at any time, and if the borrower defaults on its obligation to return the securities loaned because of insolvency or other reasons, the Funds may apply collateral received from the borrower against the obligation. The Funds may experience delays and costs in recovering the securities loaned. Any cash collateral received is invested in the Fidelity Securities Lending Cash Central Fund. The value of loaned securities and cash collateral at period end are disclosed on each applicable Fund's Statement of Assets and Liabilities. Security lending income represents the income earned on investing cash collateral, less rebates paid to borrowers and any lending agent fees associated with the loan, plus any premium payments received for lending certain types of securities. Security lending income is presented on each applicable Fund's Statement of Operations as a component of income from Fidelity Central Funds. FCM security lending activity was as follows:
| Total Security Lending Income | Security Lending Income From Securities Loaned to FCM | Value of Securities Loaned to FCM at Period End | |
| Fidelity Series Emerging Markets Fund | $360,621 | $3,620 | $4,578,743 |
| Fidelity Series International Growth Fund | 1,389,622 | 104,950 | 55,944,296 |
| Fidelity Series International Small Cap Fund | 195,878 | 178 | – |
| Fidelity Series International Value Fund | 4,948,001 | 926 | – |
9. Expense Reductions.
Commissions paid to certain brokers with whom the investment adviser, or its affiliates, places trades on behalf of Certain Funds include an amount in addition to trade execution, which may be rebated back to the Funds to offset certain expenses. In addition, through arrangements with each applicable Fund's custodian credits realized as a result of certain uninvested cash balances were used to reduce the Fund's expenses. All of the applicable expense reductions are noted in the table below.
| Brokerage Service reduction | Custody Expense reduction | |
| Fidelity Series Emerging Markets Fund | $185,144 | $694 |
| Fidelity Series International Growth Fund | 53,948 | – |
| Fidelity Series International Small Cap Fund | 3,447 | 20 |
| Fidelity Series International Value Fund | 164,999 | 2 |
In addition, during the period the investment adviser reimbursed and/or waived a portion of fund-level operating expenses as follows:
| Fund-Level Amount | |
| Fidelity Series Emerging Markets Fund | $43,303 |
| Fidelity Series International Growth Fund | 42,154 |
| Fidelity Series International Small Cap Fund | 9,793 |
| Fidelity Series International Value Fund | 42,018 |
10. Distributions to Shareholders.
Distributions to shareholders of each class were as follows:
| Six months ended April 30, 2016 | Year ended October 31, 2015 | |
| Fidelity Series Emerging Markets Fund | ||
| From net investment income | ||
| Series Emerging Markets | $69,080,205 | $39,027,374 |
| Class F | 89,259,659 | 50,798,272 |
| Total | $158,339,864 | $89,825,646 |
| Fidelity Series International Growth Fund | ||
| From net investment income | ||
| Series International Growth | $60,262,280 | $78,746,368 |
| Class F | 81,155,271 | 98,691,962 |
| Total | $141,417,551 | $177,438,330 |
| From net realized gain | ||
| Series International Growth | $125,932,714 | $88,907,190 |
| Class F | 146,169,162 | 97,760,906 |
| Total | $272,101,876 | $186,668,096 |
| Fidelity Series International Small Cap Fund | ||
| From net investment income | ||
| Series International Small Cap | $11,493,851 | $12,140,821 |
| Class F | 15,865,887 | 16,429,056 |
| Total | $27,359,738 | $28,569,877 |
| From net realized gain | ||
| Series International Small Cap | $75,296,455 | $17,604,190 |
| Class F | 87,307,708 | 19,390,106 |
| Total | $162,604,163 | $36,994,296 |
| Fidelity Series International Value Fund | ||
| From net investment income | ||
| Series International Value | $113,519,073 | $241,458,154 |
| Class F | 143,406,508 | 277,703,863 |
| Total | $256,925,581 | $519,162,017 |
| From net realized gain | ||
| Series International Value | $– | $176,811,463 |
| Class F | – | 194,453,471 |
| Total | $– | $371,264,934 |
11. Share Transactions.
Transactions for each class of shares were as follows:
| Shares | Shares | Dollars | Dollars | |
| Six months ended April 30, 2016 | Year ended October 31, 2015 | Six months ended April 30, 2016 | Year ended October 31, 2015 | |
| Fidelity Series Emerging Markets Fund | ||||
| Series Emerging Markets | ||||
| Shares sold | 76,236,195 | 123,959,808 | $1,068,329,235 | $2,044,867,266 |
| Reinvestment of distributions | 4,686,581 | 2,286,314 | 69,080,205 | 39,027,374 |
| Shares redeemed | (17,245,589) | (34,411,277) | (245,146,879) | (566,233,556) |
| Net increase (decrease) | 63,677,187 | 91,834,845 | $892,262,561 | $1,517,661,084 |
| Class F | ||||
| Shares sold | 96,828,930 | 153,928,469 | $1,365,080,361 | $2,538,996,172 |
| Reinvestment of distributions | 6,043,308 | 2,968,923 | 89,259,659 | 50,798,272 |
| Shares redeemed | (19,169,777) | (36,125,669) | (267,335,009) | (608,068,321) |
| Net increase (decrease) | 83,702,461 | 120,771,723 | $1,187,005,011 | $1,981,726,123 |
| Fidelity Series International Growth Fund | ||||
| Series International Growth | ||||
| Shares sold | 38,643,587 | 25,324,796 | $499,897,418 | $359,926,491 |
| Reinvestment of distributions | 13,492,391 | 12,078,787 | 186,194,994 | 167,653,558 |
| Shares redeemed | (29,722,304) | (74,712,848) | (400,731,625) | (1,062,121,684) |
| Net increase (decrease) | 22,413,674 | (37,309,265) | $285,360,787 | $(534,541,635) |
| Class F | ||||
| Shares sold | 56,070,970 | 48,332,641 | $731,007,294 | $686,631,779 |
| Reinvestment of distributions | 16,448,946 | 14,123,139 | 227,324,433 | 196,452,868 |
| Shares redeemed | (39,268,279) | (75,307,908) | (526,084,357) | (1,080,512,061) |
| Net increase (decrease) | 33,251,637 | (12,852,128) | $432,247,370 | $(197,427,414) |
| Fidelity Series International Small Cap Fund | ||||
| Series International Small Cap | ||||
| Shares sold | 6,981,233 | 6,213,162 | $100,448,556 | $98,321,887 |
| Reinvestment of distributions | 5,687,438 | 2,000,337 | $86,790,306 | $29,745,011 |
| Shares redeemed | (6,452,710) | (16,436,223) | (97,719,250) | (261,823,586) |
| Net increase (decrease) | 6,215,961 | (8,222,724) | $89,519,612 | $(133,756,688) |
| Class F | ||||
| Shares sold | 10,606,003 | 11,766,506 | $153,880,675 | $186,255,220 |
| Reinvestment of distributions | 6,752,199 | 2,405,585 | 103,173,595 | 35,819,162 |
| Shares redeemed | (8,475,983) | (17,677,411) | (127,559,428) | (284,052,775) |
| Net increase (decrease) | 8,882,219 | (3,505,320) | $129,494,842 | $(61,978,393) |
| Fidelity Series International Value Fund | ||||
| Series International Value | ||||
| Shares sold | 59,889,162 | 51,219,354 | $541,704,322 | $514,770,315 |
| Reinvestment of distributions | 11,715,075 | 41,826,962 | 113,519,073 | 418,269,617 |
| Shares redeemed | (37,333,911) | (89,083,944) | (350,219,219) | (900,543,214) |
| Net increase (decrease) | 34,270,326 | 3,962,372 | $305,004,176 | $32,496,718 |
| Class F | ||||
| Shares sold | 85,707,853 | 89,487,681 | $780,449,370 | $902,577,936 |
| Reinvestment of distributions | 14,784,176 | 47,121,490 | 143,406,508 | 472,157,334 |
| Shares redeemed | (50,649,179) | (90,319,635) | (471,169,866) | (919,744,396) |
| Net increase (decrease) | 49,842,850 | 46,289,536 | $452,686,012 | $454,990,874 |
12. Other.
The Funds' organizational documents provide former and current trustees and officers with a limited indemnification against liabilities arising in connection with the performance of their duties to the Funds. In the normal course of business, the Funds may also enter into contracts that provide general indemnifications. The Funds' maximum exposure under these arrangements is unknown as this would be dependent on future claims that may be made against the Funds. The risk of material loss from such claims is considered remote.
At the end of the period, mutual funds managed by the investment adviser or its affiliates were the owners of record of all of the outstanding shares of the Funds.
Shareholder Expense Example
As a shareholder of the Fund, you incur two types of costs: (1) transaction costs, and (2) ongoing costs, including management fees and other Fund expenses. This Example is intended to help you understand your ongoing costs (in dollars) of investing in the Fund and to compare these costs with the ongoing costs of investing in other mutual funds.
The Example is based on an investment of $1,000 invested at the beginning of the period and held for the entire period (November 1, 2015 to April 30, 2016).
Actual Expenses
The first line of the accompanying table for each class of the Fund provides information about actual account values and actual expenses. You may use the information in this line, together with the amount you invested, to estimate the expenses that you paid over the period. Simply divide your account value by $1,000.00 (for example, an $8,600 account value divided by $1,000.00 = 8.6), then multiply the result by the number in the first line for a class of the Fund under the heading entitled "Expenses Paid During Period" to estimate the expenses you paid on your account during this period. In addition, the Fund, as a shareholder in the underlying Fidelity Central Funds, will indirectly bear its pro-rata share of the fees and expenses incurred by the underlying Fidelity Central Funds. These fees and expenses are not included in the Fund's annualized expense ratio used to calculate the expense estimate in the table below.
Hypothetical Example for Comparison Purposes
The second line of the accompanying table for each class of the Fund provides information about hypothetical account values and hypothetical expenses based on a Class' actual expense ratio and an assumed rate of return of 5% per year before expenses, which is not the Class' actual return. The hypothetical account values and expenses may not be used to estimate the actual ending account balance or expenses you paid for the period. You may use this information to compare the ongoing costs of investing in the Fund and other funds. To do so, compare this 5% hypothetical example with the 5% hypothetical examples that appear in the shareholder reports of the other funds. In addition, the Fund, as a shareholder in the underlying Fidelity Central Funds, will indirectly bear its pro-rata share of the fees and expenses incurred by the underlying Fidelity Central Funds. These fees and expenses are not included in the Fund's annualized expense ratio used to calculate the expense estimate in the table below.
Please note that the expenses shown in the table are meant to highlight your ongoing costs only and do not reflect any transaction costs. Therefore, the second line of the table is useful in comparing ongoing costs only, and will not help you determine the relative total costs of owning different funds.
| Annualized Expense Ratio-A | Beginning Account Value November 1, 2015 | Ending Account Value April 30, 2016 | Expenses Paid During Period-B November 1, 2015 to April 30, 2016 | |
| Fidelity Series Emerging Markets Fund | ||||
| Series Emerging Markets | 1.03% | |||
| Actual | $1,000.00 | $1,001.10 | $5.12 | |
| Hypothetical-C | $1,000.00 | $1,019.74 | $5.17 | |
| Class F | .87% | |||
| Actual | $1,000.00 | $1,002.10 | $4.33 | |
| Hypothetical-C | $1,000.00 | $1,020.54 | $4.37 | |
| Fidelity Series International Growth Fund | ||||
| Series International Growth | .92% | |||
| Actual | $1,000.00 | $977.70 | $4.52 | |
| Hypothetical-C | $1,000.00 | $1,020.29 | $4.62 | |
| Class F | .75% | |||
| Actual | $1,000.00 | $978.80 | $3.69 | |
| Hypothetical-C | $1,000.00 | $1,021.13 | $3.77 | |
| Fidelity Series International Small Cap Fund | ||||
| Series International Small Cap | 1.08% | |||
| Actual | $1,000.00 | $1,003.50 | $5.38 | |
| Hypothetical-C | $1,000.00 | $1,019.49 | $5.42 | |
| Class F | .91% | |||
| Actual | $1,000.00 | $1,004.00 | $4.53 | |
| Hypothetical-C | $1,000.00 | $1,020.34 | $4.57 | |
| Fidelity Series International Value Fund | ||||
| Series International Value | .98% | |||
| Actual | $1,000.00 | $962.30 | $4.78 | |
| Hypothetical-C | $1,000.00 | $1,019.99 | $4.92 | |
| Class F | .81% | |||
| Actual | $1,000.00 | $963.20 | $3.95 | |
| Hypothetical-C | $1,000.00 | $1,020.84 | $4.07 | |
A Annualized expense ratio reflects expenses net of applicable fee waivers.
B Expenses are equal to each Class' annualized expense ratio, multiplied by the average account value over the period, multiplied by 182/ 366 (to reflect the one-half year period).
C 5% return per year before expenses
![]()
GSV-S-SANN-0616
1.907946.106
Fidelity Advisor® Total Emerging Markets Fund - Semi-Annual Report April 30, 2016 Class A, Class T and Class C are classes of Fidelity® Total Emerging Markets Fund |
|
Contents
To view a fund's proxy voting guidelines and proxy voting record for the 12-month period ended June 30, visit http://www.fidelity.com/proxyvotingresults or visit the Securities and Exchange Commission's (SEC) web site at http://www.sec.gov.
You may also call 1-877-208-0098 to request a free copy of the proxy voting guidelines.
Standard & Poor's, S&P and S&P 500 are registered service marks of The McGraw-Hill Companies, Inc. and have been licensed for use by Fidelity Distributors Corporation.
Other third-party marks appearing herein are the property of their respective owners.
All other marks appearing herein are registered or unregistered trademarks or service marks of FMR LLC or an affiliated company. © 2016 FMR LLC. All rights reserved.
This report and the financial statements contained herein are submitted for the general information of the shareholders of the Fund. This report is not authorized for distribution to prospective investors in the Fund unless preceded or accompanied by an effective prospectus.
A fund files its complete schedule of portfolio holdings with the SEC for the first and third quarters of each fiscal year on Form N-Q. Forms N-Q are available on the SEC’s web site at http://www.sec.gov. A fund's Forms N-Q may be reviewed and copied at the SEC’s Public Reference Room in Washington, DC. Information regarding the operation of the SEC's Public Reference Room may be obtained by calling 1-800-SEC-0330.
For a complete list of a fund's portfolio holdings, view the most recent holdings listing, semiannual report, or annual report on Fidelity's web site at http://www.fidelity.com, http://www.advisor.fidelity.com, or http://www.401k.com, as applicable.
NOT FDIC INSURED •MAY LOSE VALUE •NO BANK GUARANTEE
Neither the Fund nor Fidelity Distributors Corporation is a bank.
Investment Summary (Unaudited)
Top Five Stocks as of April 30, 2016
| % of fund's net assets | % of fund's net assets 6 months ago | |
| Taiwan Semiconductor Manufacturing Co. Ltd. (Taiwan, Semiconductors & Semiconductor Equipment) | 2.1 | 2.0 |
| Naspers Ltd. Class N (South Africa, Media) | 2.0 | 1.2 |
| Tencent Holdings Ltd. (Cayman Islands, Internet Software & Services) | 1.5 | 1.7 |
| Alibaba Group Holding Ltd. sponsored ADR (Cayman Islands, Internet Software & Services) | 1.4 | 0.6 |
| China Mobile Ltd. (Hong Kong, Wireless Telecommuncation Services) | 1.2 | 1.1 |
| 8.2 |
Top Five Market Sectors as of April 30, 2016
| % of fund's net assets | % of fund's net assets 6 months ago | |
| Financials | 18.8 | 17.5 |
| Energy | 16.8 | 14.9 |
| Information Technology | 13.0 | 10.9 |
| Consumer Discretionary | 7.4 | 5.7 |
| Consumer Staples | 5.8 | 5.7 |
Top Five Countries as of April 30, 2016
| (excluding cash equivalents) | % of fund's net assets | % of fund's net assets 6 months ago |
| Korea (South) | 8.7 | 9.3 |
| Cayman Islands | 6.9 | 7.0 |
| Brazil | 6.1 | 5.2 |
| Mexico | 6.0 | 6.2 |
| India | 5.5 | 5.3 |
Percentages are adjusted for the effect of futures contracts, if applicable.
Asset Allocation (% of fund's net assets)
| As of April 30, 2016 | ||
| Stocks and Equity Futures | 67.5% | |
| Bonds | 28.8% | |
| Other Investments | 0.3% | |
| Short-Term Investments and Net Other Assets (Liabilities) | 3.4% | |

| As of October 31, 2015 | ||
| Stocks and Equity Futures | 55.3% | |
| Bonds | 40.8% | |
| Other Investments | 0.6% | |
| Short-Term Investments and Net Other Assets (Liabilities) | 3.3% | |

Investments April 30, 2016 (Unaudited)
Showing Percentage of Net Assets
| Common Stocks - 60.3% | |||
| Shares | Value | ||
| Argentina - 0.3% | |||
| Telecom Argentina SA Class B sponsored ADR | 4,334 | $81,132 | |
| YPF SA Class D sponsored ADR | 6,200 | 124,930 | |
| TOTAL ARGENTINA | 206,062 | ||
| Austria - 0.3% | |||
| Erste Group Bank AG | 7,805 | 224,500 | |
| Bermuda - 1.0% | |||
| AGTech Holdings Ltd. (a) | 112,000 | 25,952 | |
| Credicorp Ltd. (United States) | 1,290 | 187,592 | |
| GP Investments Ltd. Class A (depositary receipt) (a) | 22,922 | 51,253 | |
| PAX Global Technology Ltd. | 115,460 | 99,437 | |
| Shangri-La Asia Ltd. | 262,000 | 320,071 | |
| TOTAL BERMUDA | 684,305 | ||
| Brazil - 2.6% | |||
| B2W Companhia Global do Varejo (a) | 32,040 | 127,629 | |
| BB Seguridade Participacoes SA | 36,310 | 316,726 | |
| BR Properties SA | 6,700 | 20,007 | |
| CCR SA | 32,700 | 153,838 | |
| Cielo SA | 25,436 | 247,759 | |
| Companhia de Saneamento de Minas Gerais | 15,706 | 98,184 | |
| Cosan SA Industria e Comercio | 12,521 | 115,917 | |
| Direcional Engenharia SA | 42,000 | 75,104 | |
| Fibria Celulose SA | 6,700 | 59,183 | |
| FPC Par Corretora de Seguros | 33,600 | 112,839 | |
| Minerva SA (a) | 47,700 | 146,599 | |
| Smiles SA | 29,700 | 344,561 | |
| TOTAL BRAZIL | 1,818,346 | ||
| British Virgin Islands - 0.1% | |||
| Mail.Ru Group Ltd. GDR (Reg. S) (a) | 5,080 | 102,870 | |
| Canada - 0.6% | |||
| Goldcorp, Inc. | 3,600 | 72,534 | |
| Pan American Silver Corp. | 17,700 | 277,359 | |
| Torex Gold Resources, Inc. (a) | 44,300 | 78,735 | |
| TOTAL CANADA | 428,628 | ||
| Cayman Islands - 6.7% | |||
| 51job, Inc. sponsored ADR (a) | 3,100 | 92,380 | |
| 58.com, Inc. ADR (a) | 10,050 | 549,233 | |
| AAC Technology Holdings, Inc. | 11,000 | 76,351 | |
| Alibaba Group Holding Ltd. sponsored ADR (a) | 12,700 | 977,138 | |
| Autohome, Inc. ADR Class A (a) | 2,000 | 59,120 | |
| Bitauto Holdings Ltd. ADR (a) | 6,700 | 167,232 | |
| BizLink Holding, Inc. | 5,000 | 28,480 | |
| China State Construction International Holdings Ltd. | 84,000 | 130,847 | |
| CK Hutchison Holdings Ltd. | 8,770 | 104,921 | |
| Ctrip.com International Ltd. ADR (a) | 1,400 | 61,054 | |
| Haitian International Holdings Ltd. | 34,000 | 58,010 | |
| Himax Technologies, Inc. sponsored ADR | 4,100 | 42,599 | |
| JD.com, Inc. sponsored ADR (a) | 13,600 | 347,616 | |
| New Oriental Education & Technology Group, Inc. sponsored ADR | 3,100 | 121,396 | |
| Sino Biopharmaceutical Ltd. | 248,000 | 175,734 | |
| SouFun Holdings Ltd. ADR | 19,000 | 108,110 | |
| Sunny Optical Technology Group Co. Ltd. | 25,000 | 77,106 | |
| Tencent Holdings Ltd. | 51,750 | 1,053,025 | |
| Uni-President China Holdings Ltd. | 404,600 | 376,791 | |
| Vipshop Holdings Ltd. ADR (a) | 12,600 | 171,864 | |
| TOTAL CAYMAN ISLANDS | 4,779,007 | ||
| Chile - 1.0% | |||
| Compania Cervecerias Unidas SA sponsored ADR | 7,700 | 172,634 | |
| CorpBanca SA | 11,730,819 | 106,766 | |
| Empresas CMPC SA | 25,201 | 56,988 | |
| Enersis Chile SA | 316,233 | 38,579 | |
| Enersis SA | 352,800 | 60,833 | |
| Inversiones La Construccion SA | 9,283 | 109,456 | |
| Vina Concha y Toro SA | 93,580 | 156,841 | |
| TOTAL CHILE | 702,097 | ||
| China - 5.4% | |||
| Anhui Conch Cement Co. Ltd. (H Shares) | 78,000 | 205,535 | |
| BBMG Corp. (H Shares) | 224,500 | 164,071 | |
| China Life Insurance Co. Ltd. (H Shares) | 127,034 | 292,630 | |
| China Longyuan Power Grid Corp. Ltd. (H Shares) | 155,860 | 107,832 | |
| China Pacific Insurance (Group) Co. Ltd. (H Shares) | 138,106 | 484,261 | |
| China Petroleum & Chemical Corp. (H Shares) | 204,000 | 143,756 | |
| China Suntien Green Energy Corp. Ltd. (H Shares) | 328,690 | 37,395 | |
| China Telecom Corp. Ltd. (H Shares) | 334,449 | 165,574 | |
| Industrial & Commercial Bank of China Ltd. (H Shares) | 1,540,660 | 824,871 | |
| Inner Mongoli Yili Industries Co. Ltd. | 67,371 | 156,407 | |
| Kweichow Moutai Co. Ltd. | 8,040 | 311,961 | |
| Maanshan Iron & Steel Ltd. (H Shares) (a) | 296,000 | 68,021 | |
| PetroChina Co. Ltd. (H Shares) | 152,000 | 111,208 | |
| PICC Property & Casualty Co. Ltd. (H Shares) | 117,800 | 214,287 | |
| Qingdao Haier Co. Ltd. | 185,774 | 239,031 | |
| Shanghai International Airport Co. Ltd. | 19,900 | 83,638 | |
| Zhengzhou Yutong Bus Co. Ltd. | 37,500 | 118,801 | |
| Zhuzhou CSR Times Electric Co. Ltd. (H Shares) | 20,000 | 113,795 | |
| TOTAL CHINA | 3,843,074 | ||
| Colombia - 0.2% | |||
| Bancolombia SA sponsored ADR | 4,155 | 160,757 | |
| Egypt - 0.1% | |||
| Citadel Capital Corp. (a) | 141,500 | 23,583 | |
| Global Telecom Holding GDR (a) | 17,460 | 28,809 | |
| TOTAL EGYPT | 52,392 | ||
| Greece - 0.3% | |||
| Titan Cement Co. SA (Reg.) | 9,700 | 221,273 | |
| Hong Kong - 3.7% | |||
| AIA Group Ltd. | 34,320 | 205,392 | |
| China Mobile Ltd. | 16,610 | 190,696 | |
| China Mobile Ltd. sponsored ADR | 12,112 | 696,682 | |
| China Resources Beer Holdings Co. Ltd. | 104,000 | 228,531 | |
| China Resources Power Holdings Co. Ltd. | 64,189 | 108,110 | |
| CNOOC Ltd. | 441,000 | 544,777 | |
| CNOOC Ltd. sponsored ADR | 44 | 5,431 | |
| Far East Horizon Ltd. | 438,980 | 348,452 | |
| Sinotruk Hong Kong Ltd. | 154,000 | 77,544 | |
| Techtronic Industries Co. Ltd. | 55,000 | 206,177 | |
| TOTAL HONG KONG | 2,611,792 | ||
| India - 5.5% | |||
| Adani Ports & Special Economic Zone | 46,861 | 168,042 | |
| Axis Bank Ltd. (a) | 21,528 | 153,101 | |
| Bharti Infratel Ltd. | 36,476 | 205,895 | |
| Coal India Ltd. | 60,713 | 263,278 | |
| Edelweiss Financial Services Ltd. | 75,572 | 66,043 | |
| Eicher Motors Ltd. (a) | 468 | 141,156 | |
| Grasim Industries Ltd. | 3,510 | 226,465 | |
| Housing Development Finance Corp. Ltd. | 2,631 | 43,112 | |
| ITC Ltd. | 40,866 | 199,914 | |
| JK Cement Ltd. | 12,525 | 111,862 | |
| Just Dial Ltd. | 4,157 | 52,972 | |
| Larsen & Toubro Ltd. (a) | 7,910 | 149,399 | |
| LIC Housing Finance Ltd. (a) | 18,430 | 128,267 | |
| Lupin Ltd. | 14,104 | 341,264 | |
| Oil & Natural Gas Corp. Ltd. | 46,067 | 150,666 | |
| Petronet LNG Ltd. | 25,887 | 102,709 | |
| Phoenix Mills Ltd. | 23,725 | 114,686 | |
| Power Grid Corp. of India Ltd. | 140,906 | 304,189 | |
| SREI Infrastructure Finance Ltd. (a) | 116,223 | 104,018 | |
| State Bank of India (a) | 54,040 | 153,760 | |
| Sun Pharmaceutical Industries Ltd. | 31,005 | 378,685 | |
| Tata Consultancy Services Ltd. | 10,234 | 390,638 | |
| TOTAL INDIA | 3,950,121 | ||
| Indonesia - 0.5% | |||
| Link Net Tbk PT | 86,000 | 27,486 | |
| PT Bank Mandiri (Persero) Tbk | 176,150 | 128,048 | |
| PT Bank Rakyat Indonesia Tbk | 207,300 | 162,690 | |
| PT Kalbe Farma Tbk | 555,300 | 57,896 | |
| TOTAL INDONESIA | 376,120 | ||
| Israel - 0.4% | |||
| Bezeq The Israel Telecommunication Corp. Ltd. | 119,655 | 255,229 | |
| Japan - 0.2% | |||
| Rakuten, Inc. | 10,832 | 117,759 | |
| Korea (South) - 7.8% | |||
| AMOREPACIFIC Group, Inc. | 2,000 | 293,277 | |
| Daou Technology, Inc. | 5,064 | 103,430 | |
| Duk San Neolux Co. Ltd. (a) | 1,826 | 43,352 | |
| E-Mart Co. Ltd. | 1,187 | 190,119 | |
| EO Technics Co. Ltd. | 442 | 43,750 | |
| Fila Korea Ltd. | 2,435 | 221,040 | |
| Hanon Systems | 11,898 | 106,967 | |
| Hyundai Glovis Co. Ltd. | 2,043 | 338,813 | |
| Hyundai Industrial Development & Construction Co. | 3,241 | 142,859 | |
| Hyundai Mobis | 1,845 | 419,510 | |
| InterPark INT Corp. | 4,011 | 68,444 | |
| Kakao Corp. | 742 | 65,089 | |
| KB Financial Group, Inc. | 9,312 | 283,360 | |
| KEPCO Plant Service & Engineering Co. Ltd. | 1,426 | 93,973 | |
| Korea Electric Power Corp. | 3,805 | 205,551 | |
| Korean Reinsurance Co. | 21,509 | 249,695 | |
| KT Corp. | 2,253 | 60,021 | |
| KT Corp. sponsored ADR | 3,052 | 41,538 | |
| LG Chemical Ltd. | 1,202 | 311,601 | |
| NAVER Corp. | 171 | 101,047 | |
| NCSOFT Corp. | 726 | 145,114 | |
| Samsung Electronics Co. Ltd. | 648 | 704,179 | |
| Samsung Fire & Marine Insurance Co. Ltd. | 568 | 146,007 | |
| Samsung SDI Co. Ltd. | 1,310 | 130,351 | |
| Shinhan Financial Group Co. Ltd. | 14,142 | 515,690 | |
| SK Hynix, Inc. | 16,437 | 403,868 | |
| SK Telecom Co. Ltd. sponsored ADR | 4,250 | 85,000 | |
| Viatron Technologies, Inc. | 2,018 | 50,552 | |
| TOTAL KOREA (SOUTH) | 5,564,197 | ||
| Malaysia - 0.3% | |||
| Tenaga Nasional Bhd | 53,179 | 195,482 | |
| Mauritius - 0.1% | |||
| MakeMyTrip Ltd. (a) | 3,100 | 56,916 | |
| Mexico - 3.8% | |||
| America Movil S.A.B. de CV Series L sponsored ADR | 17,863 | 252,940 | |
| Banregio Grupo Financiero S.A.B. de CV | 9,480 | 56,810 | |
| CEMEX S.A.B. de CV sponsored ADR | 15,288 | 113,896 | |
| El Puerto de Liverpool S.A.B. de CV Class C | 19,700 | 223,935 | |
| Fibra Uno Administracion SA de CV | 119,360 | 284,167 | |
| Grupo Aeroportuario del Pacifico S.A.B. de CV Series B | 17,100 | 161,114 | |
| Grupo Comercial Chedraui S.A.B. de CV | 44,076 | 124,917 | |
| Grupo Financiero Banorte S.A.B. de CV Series O | 117,969 | 669,705 | |
| Infraestructura Energetica Nova S.A.B. de CV | 14,000 | 54,707 | |
| Macquarie Mexican (REIT) | 252,670 | 347,768 | |
| Promotora y Operadora de Infraestructura S.A.B. de CV | 6,200 | 78,629 | |
| Tenedora Nemak SA de CV | 64,900 | 93,099 | |
| Wal-Mart de Mexico SA de CV Series V | 94,100 | 232,725 | |
| TOTAL MEXICO | 2,694,412 | ||
| Netherlands - 0.7% | |||
| Cnova NV (a) | 5,550 | 19,425 | |
| Hangzhou Hikvision Digital Technology Co. Ltd. ELS (BNP Paribas Arbitrage Warrant Program) warrants 10/21/16 (a)(b) | 15,500 | 72,950 | |
| Yandex NV (a) | 19,517 | 399,513 | |
| TOTAL NETHERLANDS | 491,888 | ||
| Nigeria - 0.2% | |||
| Guaranty Trust Bank PLC GDR (Reg. S) | 11,980 | 41,930 | |
| Transnational Corp. of Nigeria PLC | 3,901,713 | 19,412 | |
| Zenith Bank PLC | 1,851,312 | 118,155 | |
| TOTAL NIGERIA | 179,497 | ||
| Pakistan - 0.2% | |||
| Habib Bank Ltd. | 96,700 | 174,336 | |
| Panama - 0.2% | |||
| Copa Holdings SA Class A | 2,200 | 140,250 | |
| Philippines - 0.9% | |||
| Alliance Global Group, Inc. | 547,150 | 168,676 | |
| Metro Pacific Investments Corp. | 459,100 | 56,613 | |
| Metropolitan Bank & Trust Co. | 124,721 | 215,448 | |
| Robinsons Land Corp. | 363,980 | 209,713 | |
| TOTAL PHILIPPINES | 650,450 | ||
| Romania - 0.1% | |||
| Banca Transilvania SA | 89,698 | 61,556 | |
| Russia - 3.4% | |||
| E.ON Russia JSC (a) | 1,584,700 | 64,565 | |
| Lukoil PJSC sponsored ADR | 13,700 | 580,675 | |
| Magnit OJSC GDR (Reg. S) | 5,500 | 190,300 | |
| MMC Norilsk Nickel PJSC sponsored ADR | 19,900 | 293,525 | |
| Mobile TeleSystems OJSC (a) | 33,812 | 132,204 | |
| Mobile TeleSystems OJSC sponsored ADR | 1,940 | 17,964 | |
| NOVATEK OAO GDR (Reg. S) | 3,000 | 288,000 | |
| Rosneft Oil Co. OJSC (a) | 55,500 | 300,753 | |
| Sberbank of Russia (a) | 67,580 | 129,019 | |
| Sberbank of Russia sponsored ADR | 39,884 | 319,710 | |
| Sistema JSFC (a) | 240,200 | 72,128 | |
| Sistema JSFC sponsored GDR | 2,860 | 21,021 | |
| TOTAL RUSSIA | 2,409,864 | ||
| Singapore - 0.7% | |||
| Ascendas Real Estate Investment Trust | 135,310 | 247,509 | |
| CapitaMall Trust | 54,800 | 84,348 | |
| First Resources Ltd. | 103,200 | 146,184 | |
| TOTAL SINGAPORE | 478,041 | ||
| South Africa - 4.2% | |||
| Alexander Forbes Group Holdings Ltd. (c) | 126,689 | 63,900 | |
| Aspen Pharmacare Holdings Ltd. | 7,141 | 168,291 | |
| Barclays Africa Group Ltd. (d) | 25,640 | 259,908 | |
| Bidvest Group Ltd. | 8,056 | 204,455 | |
| Imperial Holdings Ltd. | 18,800 | 196,819 | |
| JSE Ltd. | 6,910 | 80,098 | |
| Life Healthcare Group Holdings Ltd. | 53,600 | 140,785 | |
| Naspers Ltd. Class N | 10,554 | 1,448,115 | |
| Nedbank Group Ltd. | 8,080 | 103,361 | |
| Sasol Ltd. | 4,000 | 130,841 | |
| Shoprite Holdings Ltd. (c) | 9,551 | 114,885 | |
| Telkom SA Ltd. | 23,762 | 94,612 | |
| TOTAL SOUTH AFRICA | 3,006,070 | ||
| Spain - 0.2% | |||
| Banco Bilbao Vizcaya Argentaria SA | 25,681 | 176,475 | |
| Taiwan - 4.4% | |||
| Advanced Semiconductor Engineering, Inc. | 98,000 | 94,153 | |
| Advantech Co. Ltd. | 25,000 | 176,454 | |
| Boardtek Electronics Corp. | 36,000 | 51,710 | |
| Catcher Technology Co. Ltd. | 13,000 | 91,354 | |
| E.SUN Financial Holdings Co. Ltd. | 252,546 | 139,943 | |
| Hermes Microvision, Inc. | 1,000 | 30,802 | |
| Hon Hai Precision Industry Co. Ltd. (Foxconn) | 29,555 | 70,541 | |
| HTC Corp. | 22,000 | 56,119 | |
| Inotera Memories, Inc. (a) | 29,000 | 26,304 | |
| King's Town Bank | 96,600 | 67,285 | |
| Kingpak Technology, Inc. (a) | 5,000 | 48,757 | |
| Largan Precision Co. Ltd. | 1,833 | 128,809 | |
| MediaTek, Inc. | 5,000 | 35,600 | |
| Siliconware Precision Industries Co. Ltd. | 25,000 | 36,958 | |
| Taiwan Cement Corp. | 270,000 | 274,990 | |
| Taiwan Fertilizer Co. Ltd. | 44,000 | 59,728 | |
| Taiwan Semiconductor Manufacturing Co. Ltd. | 324,000 | 1,486,264 | |
| Taiwan Semiconductor Manufacturing Co. Ltd. sponsored ADR | 1,642 | 38,735 | |
| Universal Cement Corp. | 66,654 | 42,609 | |
| Vanguard International Semiconductor Corp. | 38,000 | 58,171 | |
| Wistron NeWeb Corp. | 19,000 | 49,407 | |
| Yuanta Financial Holding Co. Ltd. | 247,231 | 81,510 | |
| TOTAL TAIWAN | 3,146,203 | ||
| Thailand - 1.8% | |||
| Advanced Info Service PCL (For. Reg.) | 12,640 | 56,467 | |
| Airports of Thailand PCL (For. Reg.) | 14,500 | 162,772 | |
| Intouch Holdings PCL NVDR | 30,250 | 45,696 | |
| Jasmine Broadband Internet Infrastructure Fund | 223,390 | 60,134 | |
| Kasikornbank PCL (For. Reg.) | 74,080 | 354,277 | |
| PTT Global Chemical PCL (For. Reg.) | 50,600 | 90,564 | |
| PTT PCL (For. Reg.) | 25,700 | 223,734 | |
| Star Petroleum Refining PCL | 253,300 | 79,791 | |
| Thai Union Frozen Products PCL (For. Reg.) | 321,800 | 190,758 | |
| TOTAL THAILAND | 1,264,193 | ||
| Turkey - 0.9% | |||
| Aselsan A/S | 14,000 | 99,871 | |
| Enka Insaat ve Sanayi A/S | 46,000 | 79,900 | |
| Tupras Turkiye Petrol Rafinelleri A/S | 7,900 | 208,511 | |
| Turkiye Garanti Bankasi A/S | 53,674 | 165,220 | |
| Turkiye Halk Bankasi A/S | 25,980 | 99,816 | |
| TOTAL TURKEY | 653,318 | ||
| United Arab Emirates - 0.7% | |||
| DP World Ltd. | 7,270 | 137,403 | |
| Emaar Properties PJSC | 95,651 | 177,088 | |
| First Gulf Bank PJSC | 53,346 | 188,089 | |
| TOTAL UNITED ARAB EMIRATES | 502,580 | ||
| United Kingdom - 0.3% | |||
| Fresnillo PLC | 10,600 | 172,384 | |
| HSBC Holdings PLC (Hong Kong) | 10,995 | 73,189 | |
| TOTAL UNITED KINGDOM | 245,573 | ||
| United States of America - 0.5% | |||
| Cognizant Technology Solutions Corp. Class A (a) | 2,420 | 141,255 | |
| First Cash Financial Services, Inc. | 2,549 | 116,566 | |
| Micron Technology, Inc. (a) | 8,700 | 93,525 | |
| TOTAL UNITED STATES OF AMERICA | 351,346 | ||
| TOTAL COMMON STOCKS | |||
| (Cost $40,006,021) | 42,976,979 | ||
| Nonconvertible Preferred Stocks - 4.0% | |||
| Brazil - 3.1% | |||
| Ambev SA sponsored ADR | 100,500 | 561,795 | |
| Banco do Estado Rio Grande do Sul SA | 25,820 | 63,888 | |
| Companhia Paranaense de Energia-Copel: | |||
| (PN-B) | 615 | 5,062 | |
| (PN-B) sponsored ADR | 13,122 | 108,519 | |
| Itau Unibanco Holding SA sponsored ADR | 67,638 | 644,590 | |
| Metalurgica Gerdau SA (PN) | 100,570 | 85,094 | |
| Petroleo Brasileiro SA - Petrobras (PN) sponsored (non-vtg.) (a) | 44,106 | 260,225 | |
| Telefonica Brasil SA | 9,537 | 117,464 | |
| Vale SA (PN-A) sponsored ADR | 74,300 | 337,322 | |
| TOTAL BRAZIL | 2,183,959 | ||
| Korea (South) - 0.9% | |||
| Hyundai Motor Co. Series 2 | 3,119 | 271,969 | |
| Samsung Electronics Co. Ltd. | 295 | 268,562 | |
| Samsung Fire & Marine Insurance Co. Ltd. | 717 | 117,343 | |
| TOTAL KOREA (SOUTH) | 657,874 | ||
| TOTAL NONCONVERTIBLE PREFERRED STOCKS | |||
| (Cost $2,875,342) | 2,841,833 | ||
| Principal Amount | Value | ||
| Nonconvertible Bonds - 14.6% | |||
| Azerbaijan - 1.3% | |||
| International Bank of Azerbaijan OJSC 5.625% 6/11/19 (Reg. S) | 200,000 | 188,600 | |
| Southern Gas Corridor CJSC 6.875% 3/24/26 (b) | 200,000 | 205,550 | |
| State Oil Co. of Azerbaijan Republic: | |||
| 4.75% 3/13/23 (Reg. S) | 325,000 | 292,050 | |
| 6.95% 3/18/30 (Reg. S) | 275,000 | 261,938 | |
| TOTAL AZERBAIJAN | 948,138 | ||
| Canada - 0.0% | |||
| Pacific Rubiales Energy Corp. 5.125% 3/28/23 (b)(e) | 100,000 | 14,750 | |
| Colombia - 0.1% | |||
| Ecopetrol SA 7.375% 9/18/43 | 100,000 | 92,813 | |
| Georgia - 0.7% | |||
| Georgian Oil & Gas Corp.: | |||
| 6.75% 4/26/21 (b) | 250,000 | 251,300 | |
| 6.875% 5/16/17 (b) | 250,000 | 251,855 | |
| TOTAL GEORGIA | 503,155 | ||
| Indonesia - 2.2% | |||
| PT Pertamina Persero: | |||
| 4.875% 5/3/22 (b) | 275,000 | 283,452 | |
| 5.25% 5/23/21 (b) | 200,000 | 210,232 | |
| 5.625% 5/20/43 (b) | 200,000 | 184,581 | |
| 6% 5/3/42 (b) | 400,000 | 383,910 | |
| 6.5% 5/27/41 (b) | 475,000 | 484,377 | |
| TOTAL INDONESIA | 1,546,552 | ||
| Ireland - 0.2% | |||
| Vnesheconombank Via VEB Finance PLC 6.8% 11/22/25 (b) | 100,000 | 104,625 | |
| Kazakhstan - 0.9% | |||
| Kazagro National Management Holding JSC 4.625% 5/24/23 (b) | 400,000 | 334,024 | |
| KazMunaiGaz Finance Sub BV 9.125% 7/2/18 (b) | 300,000 | 328,500 | |
| TOTAL KAZAKHSTAN | 662,524 | ||
| Luxembourg - 2.0% | |||
| Petrobras International Finance Co. Ltd.: | |||
| 3.5% 2/6/17 | 200,000 | 198,030 | |
| 5.375% 1/27/21 | 530,000 | 471,038 | |
| 8.375% 12/10/18 | 300,000 | 309,000 | |
| RSHB Capital SA 5.1% 7/25/18 (b) | 400,000 | 411,280 | |
| TOTAL LUXEMBOURG | 1,389,348 | ||
| Mexico - 2.2% | |||
| Pemex Project Funding Master Trust 6.625% 6/15/35 | 350,000 | 355,250 | |
| Petroleos Mexicanos: | |||
| 6.5% 6/2/41 | 425,000 | 424,150 | |
| 6.625% (b)(f) | 850,000 | 809,625 | |
| TOTAL MEXICO | 1,589,025 | ||
| Netherlands - 0.7% | |||
| Petrobras Global Finance BV: | |||
| 6.85% 6/5/2115 | 215,000 | 159,100 | |
| 7.25% 3/17/44 | 400,000 | 324,000 | |
| TOTAL NETHERLANDS | 483,100 | ||
| South Africa - 0.4% | |||
| Eskom Holdings SOC Ltd. 6.75% 8/6/23 (b) | 300,000 | 282,375 | |
| Trinidad & Tobago - 0.8% | |||
| Petroleum Co. of Trinidad & Tobago Ltd.: | |||
| 6% 5/8/22 (b) | 262,708 | 246,158 | |
| 9.75% 8/14/19 (b) | 300,000 | 312,900 | |
| TOTAL TRINIDAD & TOBAGO | 559,058 | ||
| Turkey - 0.3% | |||
| Turk Sise ve Cam Fabrikalari A/S 4.25% 5/9/20 (Reg. S) | 200,000 | 199,498 | |
| United Arab Emirates - 0.1% | |||
| DP World Ltd. 6.85% 7/2/37 (Reg. S) | 100,000 | 103,686 | |
| United Kingdom - 0.8% | |||
| Biz Finance PLC 9.625% 4/27/22 (b) | 600,000 | 555,120 | |
| Venezuela - 1.9% | |||
| Petroleos de Venezuela SA: | |||
| 5.25% 4/12/17 | 300,000 | 164,250 | |
| 5.5% 4/12/37 | 500,000 | 176,200 | |
| 6% 11/15/26 (Reg. S) | 1,200,000 | 410,280 | |
| 8.5% 11/2/17 (b) | 166,667 | 97,500 | |
| 9% 11/17/21 (Reg. S) | 550,000 | 216,425 | |
| 12.75% 2/17/22 (b) | 600,000 | 279,000 | |
| TOTAL VENEZUELA | 1,343,655 | ||
| TOTAL NONCONVERTIBLE BONDS | |||
| (Cost $11,036,167) | 10,377,422 | ||
| Government Obligations - 14.6% | |||
| Angola - 0.3% | |||
| Angola Republic 9.5% 11/12/25 (b) | 200,000 | 195,260 | |
| Argentina - 1.4% | |||
| Argentine Republic: | |||
| 6.25% 4/22/19 (b) | 150,000 | 155,550 | |
| 6.875% 4/22/21 (b) | 170,000 | 175,100 | |
| 7.5% 4/22/26 (b) | 185,000 | 187,775 | |
| 7.625% 4/22/46 (b) | 150,000 | 147,525 | |
| 8.28% 12/31/33 | 315,459 | 330,443 | |
| TOTAL ARGENTINA | 996,393 | ||
| Armenia - 0.5% | |||
| Republic of Armenia 6% 9/30/20 (b) | 325,000 | 324,220 | |
| Barbados - 0.3% | |||
| Barbados Government 7% 8/4/22 (b) | 250,000 | 245,750 | |
| Brazil - 0.4% | |||
| Brazilian Federative Republic: | |||
| 5% 1/27/45 | 200,000 | 161,500 | |
| 12.25% 3/6/30 | 100,000 | 155,500 | |
| TOTAL BRAZIL | 317,000 | ||
| Cameroon - 0.3% | |||
| Cameroon Republic 9.5% 11/19/25 (b) | 200,000 | 195,760 | |
| Colombia - 0.6% | |||
| Colombian Republic: | |||
| 6.125% 1/18/41 | 100,000 | 107,250 | |
| 7.375% 9/18/37 | 250,000 | 301,875 | |
| TOTAL COLOMBIA | 409,125 | ||
| Congo - 0.3% | |||
| Congo Republic 4% 6/30/29 (g) | 292,600 | 209,958 | |
| Costa Rica - 0.5% | |||
| Costa Rican Republic: | |||
| 4.375% 4/30/25 (b) | 225,000 | 200,250 | |
| 7.158% 3/12/45 (b) | 200,000 | 186,500 | |
| TOTAL COSTA RICA | 386,750 | ||
| Croatia - 0.7% | |||
| Croatia Republic 6% 1/26/24 (b) | 450,000 | 492,188 | |
| Dominican Republic - 0.6% | |||
| Dominican Republic 6.6% 1/28/24 (b) | 375,000 | 401,250 | |
| Ecuador - 0.2% | |||
| Ecuador Republic 7.95% 6/20/24 (b) | 200,000 | 173,500 | |
| El Salvador - 0.2% | |||
| El Salvador Republic 7.625% 2/1/41 (b) | 150,000 | 131,625 | |
| Ethiopia - 0.3% | |||
| Federal Democratic Republic of Ethiopia 6.625% 12/11/24 (b) | 200,000 | 181,500 | |
| Gabon - 0.2% | |||
| Gabonese Republic 6.375% 12/12/24 (b) | 200,000 | 174,724 | |
| Ghana - 0.5% | |||
| Ghana Republic: | |||
| 7.875% 8/7/23 (Reg.S) | 200,000 | 159,540 | |
| 10.75% 10/14/30 (b) | 200,000 | 196,760 | |
| TOTAL GHANA | 356,300 | ||
| Iraq - 0.2% | |||
| Republic of Iraq 5.8% 1/15/28 (Reg. S) | 250,000 | 177,525 | |
| Ivory Coast - 0.3% | |||
| Ivory Coast 5.375% 7/23/24 (b) | 200,000 | 184,500 | |
| Jamaica - 0.2% | |||
| Jamaican Government 8% 6/24/19 | 150,000 | 163,313 | |
| Jordan - 0.3% | |||
| Jordanian Kingdom 6.125% 1/29/26 (b) | 200,000 | 211,250 | |
| Kenya - 0.3% | |||
| Republic of Kenya 6.875% 6/24/24 (b) | 200,000 | 188,020 | |
| Lebanon - 0.2% | |||
| Lebanese Republic 6.1% 10/4/22 | 150,000 | 148,782 | |
| Mongolia - 0.2% | |||
| Mongolian People's Republic 5.125% 12/5/22 (Reg. S) | 200,000 | 157,796 | |
| Mozambique - 0.2% | |||
| Mozambique Republic 10.5% 1/18/23 (b) | 200,000 | 163,000 | |
| Pakistan - 0.3% | |||
| Islamic Republic of Pakistan 7.25% 4/15/19 (b) | 200,000 | 209,715 | |
| Russia - 1.7% | |||
| Russian Federation: | |||
| 5% 4/29/20 (b) | 225,000 | 237,915 | |
| 5.625% 4/4/42 (b) | 200,000 | 210,354 | |
| 12.75% 6/24/28 (Reg. S) | 425,000 | 730,159 | |
| TOTAL RUSSIA | 1,178,428 | ||
| Senegal - 0.3% | |||
| Republic of Senegal 8.75% 5/13/21 (b) | 200,000 | 217,040 | |
| Tanzania - 0.2% | |||
| United Republic of Tanzania 6.8921% 3/9/20 (h) | 177,778 | 180,445 | |
| Turkey - 1.0% | |||
| Turkish Republic: | |||
| 6.875% 3/17/36 | 100,000 | 119,125 | |
| 7% 6/5/20 | 250,000 | 284,243 | |
| 11.875% 1/15/30 | 165,000 | 284,460 | |
| TOTAL TURKEY | 687,828 | ||
| Ukraine - 0.2% | |||
| Ukraine Government 0% 5/31/40 (b)(h) | 430,000 | 134,285 | |
| United States of America - 0.4% | |||
| U.S. Treasury Bills, yield at date of purchase 0.29% to 0.32% 5/19/16 to 6/23/16 (i) | 280,000 | 279,951 | |
| Venezuela - 1.1% | |||
| Venezuelan Republic: | |||
| 7% 3/31/38 | 650,000 | 232,375 | |
| 9% 5/7/23 (Reg. S) | 300,000 | 114,375 | |
| 9.25% 9/15/27 | 650,000 | 277,063 | |
| 12.75% 8/23/22 | 325,000 | 150,719 | |
| TOTAL VENEZUELA | 774,532 | ||
| Zambia - 0.2% | |||
| Republic of Zambia 8.97% 7/30/27 (b) | 200,000 | 165,000 | |
| TOTAL GOVERNMENT OBLIGATIONS | |||
| (Cost $10,810,800) | 10,412,713 | ||
| Preferred Securities - 0.3% | |||
| Cayman Islands - 0.2% | |||
| Banco Do Brasil SA 9% (b)(f)(h) | 200,000 | 150,139 | |
| Colombia - 0.1% | |||
| Colombia Telecomunicacines SA 8.5% (b)(f)(h) | 100,000 | 89,739 | |
| TOTAL PREFERRED SECURITIES | |||
| (Cost $228,131) | 239,878 | ||
| Shares | Value | ||
| Money Market Funds - 6.0% | |||
| Fidelity Cash Central Fund, 0.38% (j) | |||
| (Cost $4,255,911) | 4,255,911 | 4,255,911 | |
| TOTAL INVESTMENT PORTFOLIO - 99.8% | |||
| (Cost $69,212,372) | 71,104,736 | ||
| NET OTHER ASSETS (LIABILITIES) - 0.2% | 139,079 | ||
| NET ASSETS - 100% | $71,243,815 |
| Futures Contracts | |||
| Expiration Date | Underlying Face Amount at Value | Unrealized Appreciation/(Depreciation) | |
| Purchased | |||
| Equity Index Contracts | |||
| 54 ICE E-mini MSCI Emerging Markets Index Contracts (United States) | June 2016 | 2,263,680 | $(20,655) |
The face value of futures purchased as a percentage of Net Assets is 3.2%
For the period, the average monthly underlying face amount at value for futures contracts in the aggregate was $1,146,512.
Security Type Abbreviations
ELS – Equity-Linked Security
Categorizations in the Schedule of Investments are based on country or territory of incorporation.
Legend
(a) Non-income producing
(b) Security exempt from registration under Rule 144A of the Securities Act of 1933. These securities may be resold in transactions exempt from registration, normally to qualified institutional buyers. At the end of the period, the value of these securities amounted to $12,030,258 or 16.9% of net assets.
(c) Security or a portion of the security purchased on a delayed delivery or when-issued basis.
(d) A portion of the security sold on a delayed delivery basis.
(e) Non-income producing - Security is in default.
(f) Security is perpetual in nature with no stated maturity date.
(g) Security initially issued at one coupon which converts to a higher coupon at a specified date. The rate shown is the rate at period end.
(h) Coupon rates for floating and adjustable rate securities reflect the rates in effect at period end.
(i) Security or a portion of the security was pledged to cover margin requirements for futures contracts. At period end, the value of securities pledged amounted to $129,976.
(j) Affiliated fund that is generally available only to investment companies and other accounts managed by Fidelity Investments. The rate quoted is the annualized seven-day yield of the fund at period end. A complete unaudited listing of the fund's holdings as of its most recent quarter end is available upon request. In addition, each Fidelity Central Fund's financial statements are available on the SEC's website or upon request.
Affiliated Central Funds
Information regarding fiscal year to date income earned by the Fund from investments in Fidelity Central Funds is as follows:
| Fund | Income earned |
| Fidelity Cash Central Fund | $3,649 |
| Total | $3,649 |
Investment Valuation
The following is a summary of the inputs used, as of April 30, 2016, involving the Fund's assets and liabilities carried at fair value. The inputs or methodology used for valuing securities may not be an indication of the risk associated with investing in those securities. For more information on valuation inputs, and their aggregation into the levels used below, please refer to the Investment Valuation section in the accompanying Notes to Financial Statements.
| Valuation Inputs at Reporting Date: | ||||
| Description | Total | Level 1 | Level 2 | Level 3 |
| Investments in Securities: | ||||
| Equities: | ||||
| Consumer Discretionary | $5,258,501 | $4,614,494 | $644,007 | $-- |
| Consumer Staples | 3,794,638 | 3,189,316 | 605,322 | -- |
| Energy | 3,672,597 | 2,704,620 | 967,977 | -- |
| Financials | 12,054,266 | 8,140,422 | 3,913,844 | -- |
| Health Care | 1,262,655 | 1,086,921 | 175,734 | -- |
| Industrials | 3,229,566 | 2,744,449 | 485,117 | -- |
| Information Technology | 9,198,494 | 6,249,248 | 2,949,246 | -- |
| Materials | 3,367,091 | 2,481,726 | 885,365 | -- |
| Telecommunication Services | 2,648,558 | 2,100,063 | 548,495 | -- |
| Utilities | 1,332,446 | 910,953 | 421,493 | -- |
| Corporate Bonds | 10,377,422 | -- | 10,377,422 | -- |
| Government Obligations | 10,412,713 | -- | 10,412,713 | -- |
| Preferred Securities | 239,878 | -- | 239,878 | -- |
| Money Market Funds | 4,255,911 | 4,255,911 | -- | -- |
| Total Investments in Securities: | $71,104,736 | $38,478,123 | $32,626,613 | $-- |
| Derivative Instruments: | ||||
| Liabilities | ||||
| Futures Contracts | $(20,655) | $(20,655) | $-- | $-- |
| Total Liabilities | $(20,655) | $(20,655) | $-- | $-- |
| Total Derivative Instruments: | $(20,655) | $(20,655) | $-- | $-- |
The following is a summary of transfers between Level 1 and Level 2 for the period ended April 30, 2016. Transfers are assumed to have occurred at the beginning of the period, and are primarily attributable to the valuation techniques used for foreign equity securities, as discussed in the accompanying Notes to Financial Statements:
| Transfers | Total |
| Level 1 to Level 2 | $162,341 |
| Level 2 to Level 1 | $5,630,433 |
Value of Derivative Instruments
The following table is a summary of the Fund's value of derivative instruments by primary risk exposure as of April 30, 2016. For additional information on derivative instruments, please refer to the Derivative Instruments section in the accompanying Notes to Financial Statements.
| Primary Risk Exposure / Derivative Type | Value | |
| Asset | Liability | |
| Equity Risk | ||
| Futures Contracts(a) | $0 | $(20,655) |
| Total Equity Risk | 0 | (20,655) |
| Total Value of Derivatives | $0 | $(20,655) |
(a) Reflects gross cumulative appreciation (depreciation) on futures contracts as presented in the Schedule of Investments. In the Statement of Assets and Liabilities, the period end daily variation margin is included in receivable or payable for daily variation margin for derivative instruments, and the net cumulative appreciation (depreciation) is included in net unrealized appreciation (depreciation).
Other Information
The composition of credit quality ratings as a percentage of Total Net Assets is as follows (Unaudited):
| BBB | 6.6% |
| BB | 8.2% |
| B | 8.4% |
| CCC,CC,C | 3.8% |
| Not Rated | 2.1% |
| Equities | 64.3% |
| Short-Term Investments and Net Other Assets | 6.6% |
| 100.0% |
We have used ratings from Moody's Investors Service, Inc. Where Moody's® ratings are not available, we have used S&P® ratings. All ratings are as of the date indicated and do not reflect subsequent changes.
See accompanying notes which are an integral part of the financial statements.
Financial Statements
Statement of Assets and Liabilities
| April 30, 2016 (Unaudited) | ||
| Assets | ||
| Investment in securities, at value — See accompanying schedule: Unaffiliated issuers (cost $64,956,461) | $66,848,825 | |
| Fidelity Central Funds (cost $4,255,911) | 4,255,911 | |
| Total Investments (cost $69,212,372) | $71,104,736 | |
| Cash | 96,849 | |
| Foreign currency held at value (cost $84,060) | 84,095 | |
| Receivable for investments sold | ||
| Regular delivery | 196,038 | |
| Delayed delivery | 5,021 | |
| Receivable for fund shares sold | 584,193 | |
| Dividends receivable | 41,415 | |
| Interest receivable | 448,185 | |
| Distributions receivable from Fidelity Central Funds | 735 | |
| Prepaid expenses | 57 | |
| Receivable from investment adviser for expense reductions | 24,578 | |
| Other receivables | 85,356 | |
| Total assets | 72,671,258 | |
| Liabilities | ||
| Payable for investments purchased | ||
| Regular delivery | $1,039,039 | |
| Delayed delivery | 31,664 | |
| Payable for fund shares redeemed | 182,047 | |
| Accrued management fee | 44,979 | |
| Distribution and service plan fees payable | 9,024 | |
| Payable for daily variation margin for derivative instruments | 12,354 | |
| Other affiliated payables | 17,432 | |
| Other payables and accrued expenses | 90,904 | |
| Total liabilities | 1,427,443 | |
| Net Assets | $71,243,815 | |
| Net Assets consist of: | ||
| Paid in capital | $72,223,458 | |
| Undistributed net investment income | 796,595 | |
| Accumulated undistributed net realized gain (loss) on investments and foreign currency transactions | (3,645,165) | |
| Net unrealized appreciation (depreciation) on investments and assets and liabilities in foreign currencies | 1,868,927 | |
| Net Assets | $71,243,815 | |
| Calculation of Maximum Offering Price | ||
| Class A: | ||
| Net Asset Value and redemption price per share ($9,739,977 ÷ 946,836 shares) | $10.29 | |
| Maximum offering price per share (100/94.25 of $10.29) | $10.92 | |
| Class T: | ||
| Net Asset Value and redemption price per share ($2,602,344 ÷ 252,697 shares) | $10.30 | |
| Maximum offering price per share (100/96.50 of $10.30) | $10.67 | |
| Class C: | ||
| Net Asset Value and offering price per share ($7,363,066 ÷ 717,907 shares)(a) | $10.26 | |
| Total Emerging Markets: | ||
| Net Asset Value, offering price and redemption price per share ($47,144,250 ÷ 4,583,390 shares) | $10.29 | |
| Class I: | ||
| Net Asset Value, offering price and redemption price per share ($4,394,178 ÷ 427,606 shares) | $10.28 |
(a) Redemption price per share is equal to net asset value less any applicable contingent deferred sales charge.
See accompanying notes which are an integral part of the financial statements.
Statement of Operations
| Six months ended April 30, 2016 (Unaudited) | ||
| Investment Income | ||
| Dividends | $389,416 | |
| Interest | 1,118,515 | |
| Income from Fidelity Central Funds | 3,649 | |
| Income before foreign taxes withheld | 1,511,580 | |
| Less foreign taxes withheld | (41,195) | |
| Total income | 1,470,385 | |
| Expenses | ||
| Management fee | $257,316 | |
| Transfer agent fees | 89,622 | |
| Distribution and service plan fees | 53,784 | |
| Accounting fees and expenses | 16,678 | |
| Custodian fees and expenses | 115,562 | |
| Independent trustees' compensation | 139 | |
| Registration fees | 30,565 | |
| Audit | 58,674 | |
| Legal | 74 | |
| Miscellaneous | 1,246 | |
| Total expenses before reductions | 623,660 | |
| Expense reductions | (119,256) | 504,404 |
| Net investment income (loss) | 965,981 | |
| Realized and Unrealized Gain (Loss) | ||
| Net realized gain (loss) on: | ||
| Investment securities: | ||
| Unaffiliated issuers | (1,705,939) | |
| Foreign currency transactions | 27,019 | |
| Futures contracts | (199,083) | |
| Total net realized gain (loss) | (1,878,003) | |
| Change in net unrealized appreciation (depreciation) on: Investment securities (net of decrease in deferred foreign taxes of $2,203) | 2,049,760 | |
| Assets and liabilities in foreign currencies | 175 | |
| Futures contracts | (42,773) | |
| Total change in net unrealized appreciation (depreciation) | 2,007,162 | |
| Net gain (loss) | 129,159 | |
| Net increase (decrease) in net assets resulting from operations | $1,095,140 |
See accompanying notes which are an integral part of the financial statements.
Statement of Changes in Net Assets
| Six months ended April 30, 2016 (Unaudited) | Year ended October 31, 2015 | |
| Increase (Decrease) in Net Assets | ||
| Operations | ||
| Net investment income (loss) | $965,981 | $1,845,806 |
| Net realized gain (loss) | (1,878,003) | (1,339,969) |
| Change in net unrealized appreciation (depreciation) | 2,007,162 | (7,213,595) |
| Net increase (decrease) in net assets resulting from operations | 1,095,140 | (6,707,758) |
| Distributions to shareholders from net investment income | (1,715,467) | (1,198,750) |
| Distributions to shareholders from net realized gain | – | (136,019) |
| Total distributions | (1,715,467) | (1,334,769) |
| Share transactions - net increase (decrease) | 6,358,083 | (6,024,786) |
| Redemption fees | 13,218 | 16,471 |
| Total increase (decrease) in net assets | 5,750,974 | (14,050,842) |
| Net Assets | ||
| Beginning of period | 65,492,841 | 79,543,683 |
| End of period (including undistributed net investment income of $796,595 and undistributed net investment income of $1,546,081, respectively) | $71,243,815 | $65,492,841 |
See accompanying notes which are an integral part of the financial statements.
Financial Highlights — Fidelity Total Emerging Markets Fund Class A
| Six months ended (Unaudited) April 30, | Years ended October 31, | ||||
| 2016 | 2015 | 2014 | 2013 | 2012 A | |
| Selected Per–Share Data | |||||
| Net asset value, beginning of period | $10.35 | $11.56 | $11.37 | $10.86 | $10.00 |
| Income from Investment Operations | |||||
| Net investment income (loss)B | .14 | .28 | .18 | .18 | .20 |
| Net realized and unrealized gain (loss) | .04 | (1.30) | .19 | .48 | .68 |
| Total from investment operations | .18 | (1.02) | .37 | .66 | .88 |
| Distributions from net investment income | (.24) | (.17) | (.18) | (.15) | (.02) |
| Distributions from net realized gain | – | (.02) | – | (.01) | – |
| Total distributions | (.24) | (.19) | (.18) | (.16) | (.02) |
| Redemption fees added to paid in capitalB | –C | –C | –C | .01 | –C |
| Net asset value, end of period | $10.29 | $10.35 | $11.56 | $11.37 | $10.86 |
| Total ReturnD,E,F | 1.84% | (8.92)% | 3.30% | 6.23% | 8.80% |
| Ratios to Average Net AssetsG,H | |||||
| Expenses before reductions | 2.00%I | 1.93% | 1.98% | 1.89% | 1.87% |
| Expenses net of fee waivers, if any | 1.65%I | 1.65% | 1.65% | 1.65% | 1.65% |
| Expenses net of all reductions | 1.65%I | 1.64% | 1.65% | 1.62% | 1.62% |
| Net investment income (loss) | 2.91%I | 2.58% | 1.61% | 1.61% | 1.92% |
| Supplemental Data | |||||
| Net assets, end of period (000 omitted) | $9,740 | $10,164 | $13,627 | $18,837 | $7,675 |
| Portfolio turnover rateJ | 93%I | 80% | 102% | 120% | 70% |
A For the period November 1, 2011 (commencement of operations) to October 31, 2012.
B Calculated based on average shares outstanding during the period.
C Amount represents less than $.005 per share.
D Total returns for periods of less than one year are not annualized.
E Total returns would have been lower if certain expenses had not been reduced during the applicable periods shown.
F Total returns do not include the effect of the sales charges.
G Fees and expenses of any underlying Fidelity Central Funds are not included in the Fund's expense ratio. The Fund indirectly bears its proportionate share of the expenses of any underlying Fidelity Central Funds.
H Expense ratios reflect operating expenses of the class. Expenses before reductions do not reflect amounts reimbursed by the investment adviser or reductions from brokerage service arrangements or reductions from other expense offset arrangements and do not represent the amount paid by the class during periods when reimbursements or reductions occur. Expense ratios before reductions for start-up periods may not be representative of longer-term operating periods. Expenses net of fee waivers reflect expenses after reimbursement by the investment adviser but prior to reductions from brokerage service arrangements or other expense offset arrangements. Expenses net of all reductions represent the net expenses paid by the class.
I Annualized
J Amount does not include the portfolio activity of any underlying Fidelity Central Funds.
See accompanying notes which are an integral part of the financial statements.
Financial Highlights — Fidelity Total Emerging Markets Fund Class T
| Six months ended (Unaudited) April 30, | Years ended October 31, | ||||
| 2016 | 2015 | 2014 | 2013 | 2012 A | |
| Selected Per–Share Data | |||||
| Net asset value, beginning of period | $10.33 | $11.54 | $11.34 | $10.84 | $10.00 |
| Income from Investment Operations | |||||
| Net investment income (loss)B | .13 | .25 | .15 | .15 | .17 |
| Net realized and unrealized gain (loss) | .04 | (1.30) | .19 | .48 | .68 |
| Total from investment operations | .17 | (1.05) | .34 | .63 | .85 |
| Distributions from net investment income | (.20) | (.14) | (.14) | (.12) | (.01) |
| Distributions from net realized gain | – | (.02) | – | (.01) | – |
| Total distributions | (.20) | (.16) | (.14) | (.14)C | (.01) |
| Redemption fees added to paid in capitalB | –D | –D | –D | .01 | –D |
| Net asset value, end of period | $10.30 | $10.33 | $11.54 | $11.34 | $10.84 |
| Total ReturnE,F,G | 1.74% | (9.18)% | 3.04% | 5.93% | 8.56% |
| Ratios to Average Net AssetsH,I | |||||
| Expenses before reductions | 2.33%J | 2.27% | 2.32% | 2.13% | 2.10% |
| Expenses net of fee waivers, if any | 1.90%J | 1.90% | 1.90% | 1.90% | 1.90% |
| Expenses net of all reductions | 1.90%J | 1.89% | 1.90% | 1.88% | 1.87% |
| Net investment income (loss) | 2.66%J | 2.33% | 1.36% | 1.36% | 1.67% |
| Supplemental Data | |||||
| Net assets, end of period (000 omitted) | $2,602 | $3,331 | $5,277 | $5,967 | $5,823 |
| Portfolio turnover rateK | 93%J | 80% | 102% | 120% | 70% |
A For the period November 1, 2011 (commencement of operations) to October 31, 2012.
B Calculated based on average shares outstanding during the period.
C Total distributions of $.14 per share is comprised of distributions from net investment income of $.124 and distributions from net realized gain of $.014 per share.
D Amount represents less than $.005 per share.
E Total returns for periods of less than one year are not annualized.
F Total returns would have been lower if certain expenses had not been reduced during the applicable periods shown.
G Total returns do not include the effect of the sales charges.
H Fees and expenses of any underlying Fidelity Central Funds are not included in the Fund's expense ratio. The Fund indirectly bears its proportionate share of the expenses of any underlying Fidelity Central Funds.
I Expense ratios reflect operating expenses of the class. Expenses before reductions do not reflect amounts reimbursed by the investment adviser or reductions from brokerage service arrangements or reductions from other expense offset arrangements and do not represent the amount paid by the class during periods when reimbursements or reductions occur. Expense ratios before reductions for start-up periods may not be representative of longer-term operating periods. Expenses net of fee waivers reflect expenses after reimbursement by the investment adviser but prior to reductions from brokerage service arrangements or other expense offset arrangements. Expenses net of all reductions represent the net expenses paid by the class.
J Annualized
K Amount does not include the portfolio activity of any underlying Fidelity Central Funds.
See accompanying notes which are an integral part of the financial statements.
Financial Highlights — Fidelity Total Emerging Markets Fund Class C
| Six months ended (Unaudited) April 30, | Years ended October 31, | ||||
| 2016 | 2015 | 2014 | 2013 | 2012 A | |
| Selected Per–Share Data | |||||
| Net asset value, beginning of period | $10.25 | $11.47 | $11.29 | $10.80 | $10.00 |
| Income from Investment Operations | |||||
| Net investment income (loss)B | .11 | .20 | .10 | .09 | .12 |
| Net realized and unrealized gain (loss) | .05 | (1.30) | .19 | .47 | .69 |
| Total from investment operations | .16 | (1.10) | .29 | .56 | .81 |
| Distributions from net investment income | (.15) | (.10) | (.11) | (.07) | (.01) |
| Distributions from net realized gain | – | (.02) | – | (.01) | – |
| Total distributions | (.15) | (.12) | (.11) | (.08) | (.01) |
| Redemption fees added to paid in capitalB | –C | –C | –C | .01 | –C |
| Net asset value, end of period | $10.26 | $10.25 | $11.47 | $11.29 | $10.80 |
| Total ReturnD,E,F | 1.56% | (9.68)% | 2.56% | 5.31% | 8.07% |
| Ratios to Average Net AssetsG,H | |||||
| Expenses before reductions | 2.74%I | 2.68% | 2.72% | 2.65% | 2.63% |
| Expenses net of fee waivers, if any | 2.40%I | 2.40% | 2.40% | 2.40% | 2.40% |
| Expenses net of all reductions | 2.40%I | 2.39% | 2.40% | 2.37% | 2.37% |
| Net investment income (loss) | 2.16%I | 1.83% | .86% | .86% | 1.17% |
| Supplemental Data | |||||
| Net assets, end of period (000 omitted) | $7,363 | $7,736 | $10,104 | $7,436 | $5,824 |
| Portfolio turnover rateJ | 93%I | 80% | 102% | 120% | 70% |
A For the period November 1, 2011 (commencement of operations) to October 31, 2012.
B Calculated based on average shares outstanding during the period.
C Amount represents less than $.005 per share.
D Total returns for periods of less than one year are not annualized.
E Total returns would have been lower if certain expenses had not been reduced during the applicable periods shown.
F Total returns do not include the effect of the contingent deferred sales charge.
G Fees and expenses of any underlying Fidelity Central Funds are not included in the Fund's expense ratio. The Fund indirectly bears its proportionate share of the expenses of any underlying Fidelity Central Funds.
H Expense ratios reflect operating expenses of the class. Expenses before reductions do not reflect amounts reimbursed by the investment adviser or reductions from brokerage service arrangements or reductions from other expense offset arrangements and do not represent the amount paid by the class during periods when reimbursements or reductions occur. Expense ratios before reductions for start-up periods may not be representative of longer-term operating periods. Expenses net of fee waivers reflect expenses after reimbursement by the investment adviser but prior to reductions from brokerage service arrangements or other expense offset arrangements. Expenses net of all reductions represent the net expenses paid by the class.
I Annualized
J Amount does not include the portfolio activity of any underlying Fidelity Central Funds.
See accompanying notes which are an integral part of the financial statements.
Financial Highlights — Fidelity Total Emerging Markets Fund
| Six months ended (Unaudited) April 30, | Years ended October 31, | ||||
| 2016 | 2015 | 2014 | 2013 | 2012 A | |
| Selected Per–Share Data | |||||
| Net asset value, beginning of period | $10.38 | $11.60 | $11.40 | $10.89 | $10.00 |
| Income from Investment Operations | |||||
| Net investment income (loss)B | .15 | .31 | .21 | .21 | .22 |
| Net realized and unrealized gain (loss) | .05 | (1.31) | .19 | .47 | .69 |
| Total from investment operations | .20 | (1.00) | .40 | .68 | .91 |
| Distributions from net investment income | (.29) | (.20) | (.20) | (.17) | (.02) |
| Distributions from net realized gain | – | (.02) | – | (.01) | – |
| Total distributions | (.29) | (.22) | (.20) | (.18) | (.02) |
| Redemption fees added to paid in capitalB | –C | –C | –C | .01 | –C |
| Net asset value, end of period | $10.29 | $10.38 | $11.60 | $11.40 | $10.89 |
| Total ReturnD,E | 2.03% | (8.74)% | 3.56% | 6.44% | 9.15% |
| Ratios to Average Net AssetsF,G | |||||
| Expenses before reductions | 1.78%H | 1.72% | 1.73% | 1.56% | 1.60% |
| Expenses net of fee waivers, if any | 1.40%H | 1.40% | 1.40% | 1.40% | 1.40% |
| Expenses net of all reductions | 1.40%H | 1.39% | 1.40% | 1.38% | 1.38% |
| Net investment income (loss) | 3.16%H | 2.83% | 1.86% | 1.85% | 2.16% |
| Supplemental Data | |||||
| Net assets, end of period (000 omitted) | $47,144 | $37,918 | $45,763 | $49,959 | $81,416 |
| Portfolio turnover rateI | 93%H | 80% | 102% | 120% | 70% |
A For the period November 1, 2011 (commencement of operations) to October 31, 2012.
B Calculated based on average shares outstanding during the period.
C Amount represents less than $.005 per share.
D Total returns for periods of less than one year are not annualized.
E Total returns would have been lower if certain expenses had not been reduced during the applicable periods shown.
F Fees and expenses of any underlying Fidelity Central Funds are not included in the Fund's expense ratio. The Fund indirectly bears its proportionate share of the expenses of any underlying Fidelity Central Funds.
G Expense ratios reflect operating expenses of the class. Expenses before reductions do not reflect amounts reimbursed by the investment adviser or reductions from brokerage service arrangements or reductions from other expense offset arrangements and do not represent the amount paid by the class during periods when reimbursements or reductions occur. Expense ratios before reductions for start-up periods may not be representative of longer-term operating periods. Expenses net of fee waivers reflect expenses after reimbursement by the investment adviser but prior to reductions from brokerage service arrangements or other expense offset arrangements. Expenses net of all reductions represent the net expenses paid by the class.
H Annualized
I Amount does not include the portfolio activity of any underlying Fidelity Central Funds.
See accompanying notes which are an integral part of the financial statements.
Financial Highlights — Fidelity Total Emerging Markets Fund Class I
| Six months ended (Unaudited) April 30, | Years ended October 31, | ||||
| 2016 | 2015 | 2014 | 2013 | 2012 A | |
| Selected Per–Share Data | |||||
| Net asset value, beginning of period | $10.37 | $11.59 | $11.40 | $10.89 | $10.00 |
| Income from Investment Operations | |||||
| Net investment income (loss)B | .15 | .31 | .21 | .20 | .22 |
| Net realized and unrealized gain (loss) | .05 | (1.31) | .18 | .48 | .69 |
| Total from investment operations | .20 | (1.00) | .39 | .68 | .91 |
| Distributions from net investment income | (.29) | (.20) | (.20) | (.17) | (.02) |
| Distributions from net realized gain | – | (.02) | – | (.01) | – |
| Total distributions | (.29) | (.22) | (.20) | (.18) | (.02) |
| Redemption fees added to paid in capitalB | –C | –C | –C | .01 | –C |
| Net asset value, end of period | $10.28 | $10.37 | $11.59 | $11.40 | $10.89 |
| Total ReturnD,E | 2.06% | (8.74)% | 3.51% | 6.44% | 9.15% |
| Ratios to Average Net AssetsF,G | |||||
| Expenses before reductions | 1.66%H | 1.58% | 1.71% | 1.63% | 1.62% |
| Expenses net of fee waivers, if any | 1.40%H | 1.40% | 1.40% | 1.40% | 1.40% |
| Expenses net of all reductions | 1.40%H | 1.39% | 1.40% | 1.37% | 1.37% |
| Net investment income (loss) | 3.16%H | 2.83% | 1.86% | 1.86% | 2.17% |
| Supplemental Data | |||||
| Net assets, end of period (000 omitted) | $4,394 | $6,343 | $4,773 | $5,354 | $2,287 |
| Portfolio turnover rateI | 93%H | 80% | 102% | 120% | 70% |
A For the period November 1, 2011 (commencement of operations) to October 31, 2012.
B Calculated based on average shares outstanding during the period.
C Amount represents less than $.005 per share.
D Total returns for periods of less than one year are not annualized.
E Total returns would have been lower if certain expenses had not been reduced during the applicable periods shown.
F Fees and expenses of any underlying Fidelity Central Funds are not included in the Fund's expense ratio. The Fund indirectly bears its proportionate share of the expenses of any underlying Fidelity Central Funds.
G Expense ratios reflect operating expenses of the class. Expenses before reductions do not reflect amounts reimbursed by the investment adviser or reductions from brokerage service arrangements or reductions from other expense offset arrangements and do not represent the amount paid by the class during periods when reimbursements or reductions occur. Expense ratios before reductions for start-up periods may not be representative of longer-term operating periods. Expenses net of fee waivers reflect expenses after reimbursement by the investment adviser but prior to reductions from brokerage service arrangements or other expense offset arrangements. Expenses net of all reductions represent the net expenses paid by the class.
H Annualized
I Amount does not include the portfolio activity of any underlying Fidelity Central Funds.
See accompanying notes which are an integral part of the financial statements.
Notes to Financial Statements (Unaudited)
For the period ended April 30, 2016
1. Organization.
Fidelity Total Emerging Markets Fund (the Fund) is a fund of Fidelity Investment Trust (the Trust) and is authorized to issue an unlimited number of shares. The Trust is registered under the Investment Company Act of 1940, as amended (the 1940 Act), as an open-end management investment company organized as a Massachusetts business trust. The Fund offers Class A, Class T, Class C, Total Emerging Markets and Class I shares, each of which has equal rights as to assets and voting privileges. Each class has exclusive voting rights with respect to matters that affect that class. The Fund's investments in emerging markets can be subject to social, economic, regulatory, and political uncertainties and can be extremely volatile.
2. Investments in Fidelity Central Funds.
The Fund invests in Fidelity Central Funds, which are open-end investment companies generally available only to other investment companies and accounts managed by the investment adviser and its affiliates. The Fund's Schedule of Investments lists each of the Fidelity Central Funds held as of period end, if any, as an investment of the Fund, but does not include the underlying holdings of each Fidelity Central Fund. As an Investing Fund, the Fund indirectly bears its proportionate share of the expenses of the underlying Fidelity Central Funds.
The Money Market Central Funds seek preservation of capital and current income and are managed by Fidelity Investments Money Management, Inc. (FIMM), an affiliate of the investment adviser. Annualized expenses of the Money Market Central Funds as of their most recent shareholder report date are less than .005%.
A complete unaudited list of holdings for each Fidelity Central Fund is available upon request or at the Securities and Exchange Commission (the SEC) website at www.sec.gov. In addition, the financial statements of the Fidelity Central Funds are available on the SEC website or upon request.
3. Significant Accounting Policies.
The financial statements have been prepared in conformity with accounting principles generally accepted in the United States of America (GAAP), which require management to make certain estimates and assumptions at the date of the financial statements. Actual results could differ from those estimates. Subsequent events, if any, through the date that the financial statements were issued have been evaluated in the preparation of the financial statements. The following summarizes the significant accounting policies of the Fund:
Investment Valuation. Investments are valued as of 4:00 p.m. Eastern time on the last calendar day of the period. The Board of Trustees (the Board) has delegated the day to day responsibility for the valuation of the Fund's investments to the Fidelity Management & Research Company (FMR) Fair Value Committee (the Committee). In accordance with valuation policies and procedures approved by the Board, the Fund attempts to obtain prices from one or more third party pricing vendors or brokers to value its investments. When current market prices, quotations or currency exchange rates are not readily available or reliable, investments will be fair valued in good faith by the Committee, in accordance with procedures adopted by the Board. Factors used in determining fair value vary by investment type and may include market or investment specific events, changes in interest rates and credit quality. The frequency with which these procedures are used cannot be predicted and they may be utilized to a significant extent. The Committee oversees the Fund's valuation policies and procedures and reports to the Board on the Committee's activities and fair value determinations. The Board monitors the appropriateness of the procedures used in valuing the Fund's investments and ratifies the fair value determinations of the Committee.
The Fund categorizes the inputs to valuation techniques used to value its investments into a disclosure hierarchy consisting of three levels as shown below:
- Level 1 – quoted prices in active markets for identical investments
- Level 2 – other significant observable inputs (including quoted prices for similar investments, interest rates, prepayment speeds, etc.)
- Level 3 – unobservable inputs (including the Fund's own assumptions based on the best information available)
Valuation techniques used to value the Fund's investments by major category are as follows:
Equity securities, including restricted securities, for which market quotations are readily available, are valued at the last reported sale price or official closing price as reported by a third party pricing vendor on the primary market or exchange on which they are traded and are categorized as Level 1 in the hierarchy. In the event there were no sales during the day or closing prices are not available, securities are valued at the last quoted bid price or may be valued using the last available price and are generally categorized as Level 2 in the hierarchy. For foreign equity securities, when market or security specific events arise, comparisons to the valuation of American Depositary Receipts (ADRs), futures contracts, Exchange-Traded Funds (ETFs) and certain indexes as well as quoted prices for similar securities may be used and would be categorized as Level 2 in the hierarchy. Utilizing these techniques may result in transfers between Level 1 and Level 2. For equity securities, including restricted securities, where observable inputs are limited, assumptions about market activity and risk are used and these securities may be categorized as Level 3 in the hierarchy.
Debt securities, including restricted securities, are valued based on evaluated prices received from third party pricing vendors or from brokers who make markets in such securities. Corporate bonds, foreign government and government agency obligations, preferred securities and U.S. government and government agency obligations are valued by pricing vendors who utilize matrix pricing which considers yield or price of bonds of comparable quality, coupon, maturity and type or by broker-supplied prices. When independent prices are unavailable or unreliable, debt securities may be valued utilizing pricing methodologies which consider similar factors that would be used by third party pricing vendors. Debt securities are generally categorized as Level 2 in the hierarchy but may be Level 3 depending on the circumstances.
Futures contracts are valued at the settlement price established each day by the board of trade or exchange on which they are traded and are categorized as Level 1 in the hierarchy. Investments in open-end mutual funds, including the Fidelity Central Funds, are valued at their closing net asset value (NAV) each business day and are categorized as Level 1 in the hierarchy.
Changes in valuation techniques may result in transfers in or out of an assigned level within the disclosure hierarchy. The aggregate value of investments by input level as of April 30, 2016, including information on transfers between Levels 1 and 2, is included at the end of the Fund's Schedule of Investments.
Foreign Currency. The Fund may use foreign currency contracts to facilitate transactions in foreign-denominated securities. Gains and losses from these transactions may arise from changes in the value of the foreign currency or if the counterparties do not perform under the contracts' terms.
Foreign-denominated assets, including investment securities, and liabilities are translated into U.S. dollars at the exchange rates at period end. Purchases and sales of investment securities, income and dividends received and expenses denominated in foreign currencies are translated into U.S. dollars at the exchange rate in effect on the transaction date.
The effects of exchange rate fluctuations on investments are included with the net realized and unrealized gain (loss) on investment securities. Other foreign currency transactions resulting in realized and unrealized gain (loss) are disclosed separately.
Investment Transactions and Income. For financial reporting purposes, the Fund's investment holdings and NAV include trades executed through the end of the last business day of the period. The NAV per share for processing shareholder transactions is calculated as of the close of business of the New York Stock Exchange (NYSE), normally 4:00 p.m. Eastern time and includes trades executed through the end of the prior business day. Gains and losses on securities sold are determined on the basis of identified cost. Dividend income is recorded on the ex-dividend date, except for certain dividends from foreign securities where the ex-dividend date may have passed, which are recorded as soon as the Fund is informed of the ex-dividend date. Non-cash dividends included in dividend income, if any, are recorded at the fair market value of the securities received. Income and capital gain distributions from Fidelity Central Funds, if any, are recorded on the ex-dividend date. Distributions received on securities that represent a return of capital or capital gain are recorded as a reduction of cost of investments and/or as a realized gain. Subsequent to ex-dividend date the Fund determines the components of these distributions, based upon receipt of tax filings or other correspondence relating to the underlying investment. Interest income is accrued as earned and includes coupon interest and amortization of premium and accretion of discount on debt securities as applicable. Investment income is recorded net of foreign taxes withheld where recovery of such taxes is uncertain. Debt obligations may be placed on non-accrual status and related interest income may be reduced by ceasing current accruals and writing off interest receivables when the collection of all or a portion of interest has become doubtful based on consistently applied procedures. A debt obligation is removed from non-accrual status when the issuer resumes interest payments or when collectability of interest is reasonably assured.
Class Allocations and Expenses. Investment income, realized and unrealized capital gains and losses, common expenses of the Fund, and certain fund-level expense reductions, if any, are allocated daily on a pro-rata basis to each class based on the relative net assets of each class to the total net assets of the Fund. Each class differs with respect to transfer agent and distribution and service plan fees incurred. Certain expense reductions may also differ by class. For the reporting period, the allocated portion of income and expenses to each class as a percent of its average net assets may vary due to the timing of recording these transactions in relation to fluctuating net assets of the classes. Expenses directly attributable to a fund are charged to that fund. Expenses attributable to more than one fund are allocated among the respective funds on the basis of relative net assets or other appropriate methods. Expense estimates are accrued in the period to which they relate and adjustments are made when actual amounts are known.
Income Tax Information and Distributions to Shareholders. Each year, the Fund intends to qualify as a regulated investment company under Subchapter M of the Internal Revenue Code, including distributing substantially all of its taxable income and realized gains. As a result, no provision for U.S. Federal income taxes is required. The Fund files a U.S. federal tax return, in addition to state and local tax returns as required. The Fund's federal income tax returns are subject to examination by the Internal Revenue Service (IRS) for a period of three fiscal years after they are filed. State and local tax returns may be subject to examination for an additional fiscal year depending on the jurisdiction. Foreign taxes are provided for based on the Fund's understanding of the tax rules and rates that exist in the foreign markets in which it invests. The Fund is subject to a tax imposed on capital gains by certain countries in which it invests. An estimated deferred tax liability for net unrealized appreciation on the applicable securities is included in Other payables and accrued expenses on the Statement of Assets & Liabilities.
Distributions are declared and recorded on the ex-dividend date. Income dividends and capital gain distributions are declared separately for each class. Income and capital gain distributions are determined in accordance with income tax regulations, which may differ from GAAP.
Capital accounts within the financial statements are adjusted for permanent book-tax differences. These adjustments have no impact on net assets or the results of operations. Capital accounts are not adjusted for temporary book-tax differences which will reverse in a subsequent period.
Book-tax differences are primarily due to foreign currency transactions, futures contracts, certain foreign taxes, market discount, passive foreign investment companies (PFIC), capital loss carryforward and losses deferred due to wash sales.
The federal tax cost of investment securities and unrealized appreciation (depreciation) as of period end were as follows:
| Gross unrealized appreciation | $6,261,932 |
| Gross unrealized depreciation | (4,885,266) |
| Net unrealized appreciation (depreciation) on securities | $1,376,666 |
| Tax cost | $69,728,070 |
Capital loss carryforwards are only available to offset future capital gains of the Fund to the extent provided by regulations and may be limited. Under the Regulated Investment Company Modernization Act of 2010 (the Act), the Fund is permitted to carry forward capital losses incurred in taxable years beginning after December 22, 2010 for an unlimited period and such capital losses are required to be used prior to any losses that expire. The capital loss carryforward information presented below, including any applicable limitation, is estimated as of prior fiscal period end and is subject to adjustment.
| No expiration | |
| Short-term | $(1,367,584) |
Short-Term Trading (Redemption) Fees. Shares held by investors in the Fund less than 90 days may have been subject to a redemption fee equal to 1.50% of the NAV of shares redeemed. All redemption fees, which reduce the proceeds of the shareholder redemption, are retained by the Fund and accounted for as an addition to paid in capital.
Delayed Delivery Transactions and When-Issued Securities. During the period, the Fund transacted in securities on a delayed delivery or when-issued basis. Payment and delivery may take place after the customary settlement period for that security. The price of the underlying securities and the date when the securities will be delivered and paid for are fixed at the time the transaction is negotiated. The securities purchased on a delayed delivery or when-issued basis are identified as such in the Fund's Schedule of Investments. The Fund may receive compensation for interest forgone in the purchase of a delayed delivery or when-issued security. With respect to purchase commitments, the Fund identifies securities as segregated in its records with a value at least equal to the amount of the commitment. Losses may arise due to changes in the value of the underlying securities or if the counterparty does not perform under the contract's terms, or if the issuer does not issue the securities due to political, economic, or other factors.
Restricted Securities. The Fund may invest in securities that are subject to legal or contractual restrictions on resale. These securities generally may be resold in transactions exempt from registration or to the public if the securities are registered. Disposal of these securities may involve time-consuming negotiations and expense, and prompt sale at an acceptable price may be difficult. Information regarding restricted securities is included at the end of the Fund's Schedule of Investments.
4. Derivative Instruments.
Risk Exposures and the Use of Derivative Instruments. The Fund's investment objective allows the Fund to enter into various types of derivative contracts, including futures contracts. Derivatives are investments whose value is primarily derived from underlying assets, indices or reference rates and may be transacted on an exchange or over-the-counter (OTC). Derivatives may involve a future commitment to buy or sell a specified asset based on specified terms, to exchange future cash flows at periodic intervals based on a notional principal amount, or for one party to make one or more payments upon the occurrence of specified events in exchange for periodic payments from the other party.
The Fund used derivatives to increase returns and to manage exposure to certain risks as defined below. The success of any strategy involving derivatives depends on analysis of numerous economic factors, and if the strategies for investment do not work as intended, the Fund may not achieve its objectives.
The Fund's use of derivatives increased or decreased its exposure to the following risk:
| Equity Risk | Equity risk relates to the fluctuations in the value of financial instruments as a result of changes in market prices (other than those arising from interest rate risk or foreign exchange risk), whether caused by factors specific to an individual investment, its issuer, or all factors affecting all instruments traded in a market or market segment. |
The Fund is also exposed to additional risks from investing in derivatives, such as liquidity risk and counterparty credit risk. Liquidity risk is the risk that the Fund will be unable to close out the derivative in the open market in a timely manner. Counterparty credit risk is the risk that the counterparty will not be able to fulfill its obligation to the Fund. Counterparty credit risk related to exchange-traded futures contracts may be mitigated by the protection provided by the exchange on which they trade.
Investing in derivatives may involve greater risks than investing in the underlying assets directly and, to varying degrees, may involve risk of loss in excess of any initial investment and collateral received and amounts recognized in the Statement of Assets and Liabilities. In addition, there may be the risk that the change in value of the derivative contract does not correspond to the change in value of the underlying instrument.
Futures Contracts. A futures contract is an agreement between two parties to buy or sell a specified underlying instrument for a fixed price at a specified future date. The Fund used futures contracts to manage its exposure to the stock market.
Upon entering into a futures contract, a fund is required to deposit either cash or securities (initial margin) with a clearing broker in an amount equal to a certain percentage of the face value of the contract. Futures contracts are marked-to-market daily and subsequent daily payments (variation margin) are made or received by a fund depending on the daily fluctuations in the value of the futures contracts and are recorded as unrealized appreciation or (depreciation). This receivable and/or payable, if any, is included in daily variation margin for derivative instruments in the Statement of Assets and Liabilities. Realized gain or (loss) is recorded upon the expiration or closing of a futures contract. The net realized gain (loss) and change in net unrealized appreciation (depreciation) on futures contracts during the period is included in the Statement of Operations.
Any open futures contracts at period end are presented in the Schedule of Investments under the caption "Futures Contracts". The underlying face amount at value reflects each contract's exposure to the underlying instrument or index at period end. Securities deposited to meet initial margin requirements are identified in the Schedule of Investments.
During the period the Fund recognized net realized gain (loss) of $(199,083) and a change in net unrealized appreciation (depreciation) of $(42,773) related to its investment in futures contracts. These amounts are included in the Statement of Operations.
5. Purchases and Sales of Investments.
Purchases and sales of securities, other than short-term securities, aggregated $32,470,293 and $28,900,560, respectively.
6. Fees and Other Transactions with Affiliates.
Management Fee. Fidelity Management & Research Company (the investment adviser) and its affiliates provide the Fund with investment management related services for which the Fund pays a monthly management fee. The management fee is the sum of an individual fund fee rate that is based on an annual rate of .55% of the Fund's average net assets and an annualized group fee rate that averaged .25% during the period. The group fee rate is based upon the average net assets of all the mutual funds advised by the investment adviser, including any mutual funds previously advised by the investment adviser that are currently advised by Fidelity SelectCo, LLC, an affiliate of the investment adviser. The group fee rate decreases as assets under management increase and increases as assets under management decrease. For the reporting period, the total annualized management fee rate was .80% of the Fund's average net assets.
Distribution and Service Plan Fees. In accordance with Rule 12b-1 of the 1940 Act, the Fund has adopted separate Distribution and Service Plans for each class of shares. Certain classes pay Fidelity Distributors Corporation (FDC), an affiliate of the investment adviser, separate Distribution and Service Fees, each of which is based on an annual percentage of each class' average net assets. In addition, FDC may pay financial intermediaries for selling shares of the Fund and providing shareholder support services. For the period, the Distribution and Service Fee rates, total fees and amounts retained by FDC were as follows:
| Distribution Fee | Service Fee | Total Fees | Retained by FDC | |
| Class A | -% | .25% | $10,947 | $913 |
| Class T | .25% | .25% | 7,126 | 878 |
| Class C | .75% | .25% | 35,711 | 9,487 |
| $53,784 | $11,278 |
Sales Load. FDC may receive a front-end sales charge of up to 5.75% for selling Class A shares and 3.50% for selling Class T shares, some of which is paid to financial intermediaries for selling shares of the Fund. Depending on the holding period, FDC may receive contingent deferred sales charges levied on Class A, Class T, and Class C redemptions. The deferred sales charges are 1.00% for Class C shares, 1.00% for certain purchases of Class A shares and .25% for certain purchases of Class T shares.
For the period, sales charge amounts retained by FDC were as follows:
| Retained by FDC | |
| Class A | $3,031 |
| Class T | 1,228 |
| Class C(a) | 182 |
| $4,441 |
(a) When Class C shares are initially sold, FDC pays commissions from its own resources to financial intermediaries through which the sales are made.
Transfer Agent Fees. Fidelity Investments Institutional Operations Company, Inc., (FIIOC), an affiliate of the investment adviser, is the transfer, dividend disbursing and shareholder servicing agent for each class of the Fund. FIIOC receives account fees and asset-based fees that vary according to the account size and type of account of the shareholders of the respective classes of the Fund. FIIOC pays for typesetting, printing and mailing of shareholder reports, except proxy statements.
For the period, transfer agent fees for each class were as follows:
| Amount | % of Class-Level Average Net Assets(a) | |
| Class A | $11,430 | .26 |
| Class T | 4,831 | .34 |
| Class C | 9,178 | .26 |
| Total Emerging Markets | 59,330 | .29 |
| Class I | 4,853 | .18 |
| $89,622 |
(a) Annualized
Accounting Fees. Fidelity Service Company, Inc. (FSC), an affiliate of the investment adviser, maintains the Fund's accounting records. The fee is based on the level of average net assets for each month.
Brokerage Commissions. The Fund placed a portion of its portfolio transactions with brokerage firms which are affiliates of the investment adviser. Brokerage commissions are included in net realized gain (loss) and change in net unrealized appreciation (depreciation) in the Statement of Operations. The commissions paid to these affiliated firms were $230 for the period.
Interfund Trades. The Fund may purchase from or sell securities to other Fidelity Funds under procedures adopted by the Board. The procedures have been designed to ensure these interfund trades are executed in accordance with Rule 17a-7 of the 1940 Act. Interfund trades are included within the respective purchases and sales amounts shown in the Purchases and Sales of Investments note.
7. Committed Line of Credit.
The Fund participates with other funds managed by the investment adviser or an affiliate in a $4.25 billion credit facility (the "line of credit") to be utilized for temporary or emergency purposes to fund shareholder redemptions or for other short-term liquidity purposes. The Fund has agreed to pay commitment fees on its pro-rata portion of the line of credit, which amounted to $57 and is reflected in Miscellaneous expenses on the Statement of Operations. During the period, the Fund did not borrow on this line of credit.
8. Expense Reductions.
The investment adviser contractually agreed to reimburse each class to the extent annual operating expenses exceeded certain levels of average net assets as noted in the table below. This reimbursement will remain in place through December 31, 2016. Some expenses, for example interest expense, including commitment fees, are excluded from this reimbursement.
The following classes were in reimbursement during the period:
| Expense Limitations | Reimbursement | |
| Class A | 1.65% | $15,535 |
| Class T | 1.90% | 6,044 |
| Class C | 2.40% | 12,340 |
| Total Emerging Markets | 1.40% | 77,877 |
| Class I | 1.40% | 7,037 |
| $118,833 |
In addition, through arrangements with the Fund's custodian, credits realized as a result of certain uninvested cash balances were used to reduce the Fund's expenses. During the period, these credits reduced the Fund's custody expenses by $190.
In addition, during the period the investment adviser reimbursed and/or waived a portion of fund-level operating expenses in the amount of $233.
9. Distributions to Shareholders.
Distributions to shareholders of each class were as follows:
| Six months ended April 30, 2016 | Year ended October 31, 2015 | |
| From net investment income | ||
| Class A | $214,855 | $211,944 |
| Class T | 63,597 | 63,689 |
| Class C | 107,081 | 88,937 |
| Total Emerging Markets | 1,155,874 | 751,293 |
| Class I | 174,060 | 82,887 |
| Total | $1,715,467 | $1,198,750 |
| From net realized gain | ||
| Class A | $– | $24,934 |
| Class T | – | 9,098 |
| Class C | – | 18,150 |
| Total Emerging Markets | – | 75,507 |
| Class I | – | 8,330 |
| Total | $– | $136,019 |
10. Share Transactions.
Share transactions for each class were as follows and may contain automatic conversions between classes or exchanges between affiliated funds:
| Shares | Shares | Dollars | Dollars | |
| Six months ended April 30, 2016 | Year ended October 31, 2015 | Six months ended April 30, 2016 | Year ended October 31, 2015 | |
| Class A | ||||
| Shares sold | 231,549 | 251,231 | $2,286,170 | $2,772,246 |
| Reinvestment of distributions | 21,375 | 21,174 | 212,465 | 232,918 |
| Shares redeemed | (288,585) | (469,131) | (2,888,428) | (4,963,727) |
| Net increase (decrease) | (35,661) | (196,726) | $(389,793) | $(1,958,563) |
| Class T | ||||
| Shares sold | 39,364 | 45,171 | $384,188 | $491,646 |
| Reinvestment of distributions | 6,356 | 6,566 | 63,302 | 72,226 |
| Shares redeemed | (115,507) | (186,633) | (1,138,165) | (1,964,687) |
| Net increase (decrease) | (69,787) | (134,896) | $(690,675) | $(1,400,815) |
| Class C | ||||
| Shares sold | 117,585 | 198,104 | $1,158,004 | $2,115,228 |
| Reinvestment of distributions | 10,753 | 9,691 | 106,882 | 106,316 |
| Shares redeemed | (164,784) | (334,580) | (1,599,463) | (3,520,139) |
| Net increase (decrease) | (36,446) | (126,785) | $(334,577) | $(1,298,595) |
| Total Emerging Markets | ||||
| Shares sold | 1,869,299 | 1,772,167 | $18,595,164 | $18,534,579 |
| Reinvestment of distributions | 112,410 | 70,595 | 1,116,229 | 777,256 |
| Shares redeemed | (1,051,095) | (2,136,425) | (10,173,118) | (22,904,245) |
| Net increase (decrease) | 930,614 | (293,663) | $9,538,275 | $(3,592,410) |
| Class I | ||||
| Shares sold | 163,149 | 421,240 | $1,629,549 | $4,563,340 |
| Reinvestment of distributions | 14,612 | 8,237 | 144,954 | 90,609 |
| Shares redeemed | (361,612) | (229,844) | (3,539,650) | (2,428,352) |
| Net increase (decrease) | (183,851) | 199,633 | $(1,765,147) | $2,225,597 |
11. Other.
The Fund's organizational documents provide former and current trustees and officers with a limited indemnification against liabilities arising in connection with the performance of their duties to the Fund. In the normal course of business, the Fund may also enter into contracts that provide general indemnifications. The Fund's maximum exposure under these arrangements is unknown as this would be dependent on future claims that may be made against the Fund. The risk of material loss from such claims is considered remote.
Shareholder Expense Example
As a shareholder of the Fund, you incur two types of costs: (1) transaction costs, including sales charges (loads) on purchase payments or redemption proceeds, redemption fees and (2) ongoing costs, including management fees, distribution and/or service (12b-1) fees and other Fund expenses. This Example is intended to help you understand your ongoing costs (in dollars) of investing in the Fund and to compare these costs with the ongoing costs of investing in other mutual funds.
The Example is based on an investment of $1,000 invested at the beginning of the period and held for the entire period (November 1, 2015 to April 30, 2016).
Actual Expenses
The first line of the accompanying table for each class of the Fund provides information about actual account values and actual expenses. You may use the information in this line, together with the amount you invested, to estimate the expenses that you paid over the period. Simply divide your account value by $1,000.00 (for example, an $8,600 account value divided by $1,000.00 = 8.6), then multiply the result by the number in the first line for a class of the Fund under the heading entitled "Expenses Paid During Period" to estimate the expenses you paid on your account during this period. A small balance maintenance fee of $12.00 that is charged once a year may apply for certain accounts with a value of less than $2,000. This fee is not included in the table below. If it was, the estimate of expenses you paid during the period would be higher, and your ending account value lower, by this amount. In addition, the Fund, as a shareholder in the underlying Fidelity Central Funds, will indirectly bear its pro-rata share of the fees and expenses incurred by the underlying Fidelity Central Funds. These fees and expenses are not included in the Fund's annualized expense ratio used to calculate the expense estimate in the table below.
Hypothetical Example for Comparison Purposes
The second line of the accompanying table for each class of the Fund provides information about hypothetical account values and hypothetical expenses based on a Class' actual expense ratio and an assumed rate of return of 5% per year before expenses, which is not the Class' actual return. The hypothetical account values and expenses may not be used to estimate the actual ending account balance or expenses you paid for the period. You may use this information to compare the ongoing costs of investing in the Fund and other funds. To do so, compare this 5% hypothetical example with the 5% hypothetical examples that appear in the shareholder reports of the other funds. A small balance maintenance fee of $12.00 that is charged once a year may apply for certain accounts with a value of less than $2,000. This fee is not included in the table below. If it was, the estimate of expenses you paid during the period would be higher, and your ending account value lower, by this amount. In addition, the Fund, as a shareholder in the underlying Fidelity Central Funds, will indirectly bear its pro-rata share of the fees and expenses incurred by the underlying Fidelity Central Funds. These fees and expenses are not included in the Fund's annualized expense ratio used to calculate the expense estimate in the table below.
Please note that the expenses shown in the table are meant to highlight your ongoing costs only and do not reflect any transaction costs. Therefore, the second line of the table is useful in comparing ongoing costs only, and will not help you determine the relative total costs of owning different funds. In addition, if these transactional costs were included, your costs would have been higher.
| Annualized Expense Ratio-A | Beginning Account Value November 1, 2015 | Ending Account Value April 30, 2016 | Expenses Paid During Period-B November 1, 2015 to April 30, 2016 | |
| Class A | 1.65% | |||
| Actual | $1,000.00 | $1,018.40 | $8.28 | |
| Hypothetical-C | $1,000.00 | $1,016.66 | $8.27 | |
| Class T | 1.90% | |||
| Actual | $1,000.00 | $1,017.40 | $9.53 | |
| Hypothetical-C | $1,000.00 | $1,015.42 | $9.52 | |
| Class C | 2.40% | |||
| Actual | $1,000.00 | $1,015.60 | $12.03 | |
| Hypothetical-C | $1,000.00 | $1,012.93 | $12.01 | |
| Total Emerging Markets | 1.40% | |||
| Actual | $1,000.00 | $1,020.30 | $7.03 | |
| Hypothetical-C | $1,000.00 | $1,017.90 | $7.02 | |
| Class I | 1.40% | |||
| Actual | $1,000.00 | $1,020.60 | $7.03 | |
| Hypothetical-C | $1,000.00 | $1,017.90 | $7.02 |
A Annualized expense ratio reflects expenses net of applicable fee waivers.
B Expenses are equal to each Class' annualized expense ratio, multiplied by the average account value over the period, multiplied by 182/366 (to reflect the one-half year period).
C 5% return per year before expenses
![]()
ATEK-SANN-0616
1.931271.104
Fidelity Advisor® Total International Equity Fund - Semi-Annual Report April 30, 2016 Class A, Class T, Class B and Class C are classes of Fidelity® Total International Equity Fund |
|
Contents
To view a fund's proxy voting guidelines and proxy voting record for the 12-month period ended June 30, visit http://www.fidelity.com/proxyvotingresults or visit the Securities and Exchange Commission's (SEC) web site at http://www.sec.gov.
You may also call 1-877-208-0098 to request a free copy of the proxy voting guidelines.
Standard & Poor's, S&P and S&P 500 are registered service marks of The McGraw-Hill Companies, Inc. and have been licensed for use by Fidelity Distributors Corporation.
Other third-party marks appearing herein are the property of their respective owners.
All other marks appearing herein are registered or unregistered trademarks or service marks of FMR LLC or an affiliated company. © 2016 FMR LLC. All rights reserved.
This report and the financial statements contained herein are submitted for the general information of the shareholders of the Fund. This report is not authorized for distribution to prospective investors in the Fund unless preceded or accompanied by an effective prospectus.
A fund files its complete schedule of portfolio holdings with the SEC for the first and third quarters of each fiscal year on Form N-Q. Forms N-Q are available on the SEC’s web site at http://www.sec.gov. A fund's Forms N-Q may be reviewed and copied at the SEC’s Public Reference Room in Washington, DC. Information regarding the operation of the SEC's Public Reference Room may be obtained by calling 1-800-SEC-0330.
For a complete list of a fund's portfolio holdings, view the most recent holdings listing, semiannual report, or annual report on Fidelity's web site at http://www.fidelity.com, http://www.advisor.fidelity.com, or http://www.401k.com, as applicable.
NOT FDIC INSURED •MAY LOSE VALUE •NO BANK GUARANTEE
Neither the Fund nor Fidelity Distributors Corporation is a bank.
Investment Summary (Unaudited)
Geographic Diversification (% of fund's net assets)
| As of April 30, 2016 | ||
| Japan | 13.7% | |
| United Kingdom | 13.5% | |
| United States of America* | 12.7% | |
| Switzerland | 7.7% | |
| France | 7.0% | |
| Germany | 3.8% | |
| India | 3.3% | |
| Australia | 3.2% | |
| Spain | 2.8% | |
| Other | 32.3% | |

* Includes Short-Term investments and Net Other Assets (Liabilities).
Percentages are based on country or territory of incorporation and are adjusted for the effect of futures contracts, if applicable.
| As of October 31, 2015 | ||
| United Kingdom | 15.7% | |
| Japan | 14.0% | |
| United States of America* | 10.2% | |
| Switzerland | 8.4% | |
| France | 6.6% | |
| Germany | 3.8% | |
| Sweden | 2.9% | |
| Australia | 2.7% | |
| India | 2.6% | |
| Other | 33.1% | |
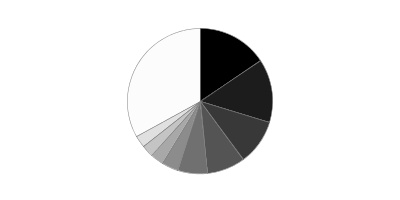
* Includes Short-Term investments and Net Other Assets (Liabilities).
Percentages are based on country or territory of incorporation and are adjusted for the effect of futures contracts, if applicable.
Asset Allocation as of April 30, 2016
| % of fund's net assets | % of fund's net assets 6 months ago | |
| Stocks | 98.5 | 99.0 |
| Short-Term Investments and Net Other Assets (Liabilities) | 1.5 | 1.0 |
Top Ten Stocks as of April 30, 2016
| % of fund's net assets | % of fund's net assets 6 months ago | |
| Nestle SA (Switzerland, Food Products) | 2.6 | 2.1 |
| Novartis AG (Switzerland, Pharmaceuticals) | 1.8 | 2.3 |
| Anheuser-Busch InBev SA NV (Belgium, Beverages) | 1.5 | 1.2 |
| Roche Holding AG (participation certificate) (Switzerland, Pharmaceuticals) | 1.3 | 1.3 |
| Total SA (France, Oil, Gas & Consumable Fuels) | 1.2 | 1.2 |
| Taiwan Semiconductor Manufacturing Co. Ltd. (Taiwan, Semiconductors & Semiconductor Equipment) | 1.2 | 1.1 |
| Reckitt Benckiser Group PLC (United Kingdom, Household Products) | 1.1 | 1.0 |
| CSL Ltd. (Australia, Biotechnology) | 1.1 | 0.8 |
| Novo Nordisk A/S Series B sponsored ADR (Denmark, Pharmaceuticals) | 1.1 | 1.0 |
| Astellas Pharma, Inc. (Japan, Pharmaceuticals) | 1.1 | 1.1 |
| 14.0 |
Market Sectors as of April 30, 2016
| % of fund's net assets | % of fund's net assets 6 months ago | |
| Financials | 19.3 | 22.0 |
| Health Care | 14.1 | 14.7 |
| Consumer Discretionary | 13.8 | 16.1 |
| Consumer Staples | 13.7 | 11.4 |
| Information Technology | 12.4 | 11.3 |
| Industrials | 11.3 | 11.1 |
| Materials | 5.2 | 4.9 |
| Energy | 3.6 | 2.9 |
| Telecommunication Services | 2.9 | 2.7 |
| Utilities | 2.2 | 1.9 |
Investments April 30, 2016 (Unaudited)
Showing Percentage of Net Assets
| Common Stocks - 97.4% | |||
| Shares | Value | ||
| Argentina - 0.2% | |||
| Banco Macro SA sponsored ADR | 5,400 | $338,202 | |
| Grupo Financiero Galicia SA sponsored ADR | 11,900 | 338,793 | |
| TOTAL ARGENTINA | 676,995 | ||
| Australia - 3.2% | |||
| Amcor Ltd. (a) | 31,664 | 370,766 | |
| Ansell Ltd. (a) | 33,670 | 510,228 | |
| Beacon Lighting Group Ltd. | 28,000 | 38,747 | |
| CSL Ltd. | 42,420 | 3,392,481 | |
| DuluxGroup Ltd. | 22,765 | 110,780 | |
| Imdex Ltd. (a) | 134,227 | 20,922 | |
| Macquarie Group Ltd. | 9,698 | 468,241 | |
| RCG Corp. Ltd. | 97,518 | 101,583 | |
| Sydney Airport unit | 140,091 | 725,389 | |
| TFS Corp. Ltd. | 64,586 | 76,608 | |
| Transurban Group unit | 173,855 | 1,530,768 | |
| Westpac Banking Corp. | 108,726 | 2,552,187 | |
| TOTAL AUSTRALIA | 9,898,700 | ||
| Austria - 0.5% | |||
| Andritz AG | 25,972 | 1,454,546 | |
| Zumtobel AG | 4,500 | 58,586 | |
| TOTAL AUSTRIA | 1,513,132 | ||
| Bailiwick of Jersey - 0.3% | |||
| Integrated Diagnostics Holdings PLC | 14,600 | 67,890 | |
| Wolseley PLC | 15,116 | 846,678 | |
| TOTAL BAILIWICK OF JERSEY | 914,568 | ||
| Belgium - 1.9% | |||
| Anheuser-Busch InBev SA NV | 38,071 | 4,712,425 | |
| Gimv NV | 819 | 45,483 | |
| KBC Ancora | 4,281 | 151,127 | |
| KBC Groep NV | 21,007 | 1,179,371 | |
| TOTAL BELGIUM | 6,088,406 | ||
| Bermuda - 0.7% | |||
| Axalta Coating Systems (a) | 11,500 | 327,405 | |
| China Gas Holdings Ltd. | 278,000 | 401,358 | |
| China Resource Gas Group Ltd. | 142,000 | 401,837 | |
| Credicorp Ltd. (United States) | 4,200 | 610,764 | |
| Markit Ltd. (a) | 8,000 | 279,120 | |
| Vostok New Ventures Ltd. SDR (a) | 13,260 | 75,461 | |
| TOTAL BERMUDA | 2,095,945 | ||
| Brazil - 1.1% | |||
| BB Seguridade Participacoes SA | 55,700 | 485,862 | |
| Cielo SA | 60,036 | 584,780 | |
| Kroton Educacional SA | 140,300 | 522,160 | |
| Qualicorp SA | 90,800 | 393,376 | |
| Smiles SA | 30,300 | 351,521 | |
| Ultrapar Participacoes SA | 25,600 | 539,057 | |
| Weg SA | 102,500 | 452,410 | |
| TOTAL BRAZIL | 3,329,166 | ||
| British Virgin Islands - 0.1% | |||
| Mail.Ru Group Ltd. GDR (Reg. S) (a) | 14,800 | 299,700 | |
| Canada - 0.7% | |||
| Cara Operations Ltd. | 4,100 | 106,070 | |
| Constellation Software, Inc. | 100 | 39,080 | |
| Imperial Oil Ltd. | 24,900 | 825,766 | |
| McCoy Global, Inc. | 15,800 | 25,815 | |
| New Look Vision Group, Inc. | 3,000 | 74,241 | |
| Pason Systems, Inc. | 43,100 | 626,559 | |
| Potash Corp. of Saskatchewan, Inc. | 21,900 | 387,487 | |
| ShawCor Ltd. Class A | 1,900 | 51,335 | |
| Tesco Corp. | 5,500 | 52,030 | |
| TOTAL CANADA | 2,188,383 | ||
| Cayman Islands - 2.5% | |||
| 58.com, Inc. ADR (a) | 9,700 | 530,105 | |
| Alibaba Group Holding Ltd. sponsored ADR (a) | 21,800 | 1,677,292 | |
| Baidu.com, Inc. sponsored ADR (a) | 5,000 | 971,500 | |
| ENN Energy Holdings Ltd. | 62,000 | 302,414 | |
| Fu Shou Yuan International Group Ltd. | 482,000 | 338,167 | |
| International Housewares Retail Co. Ltd. | 300,000 | 49,032 | |
| New Oriental Education & Technology Group, Inc. sponsored ADR | 9,900 | 387,684 | |
| Shenzhou International Group Holdings Ltd. | 79,000 | 408,393 | |
| Sino Biopharmaceutical Ltd. | 516,000 | 365,640 | |
| TAL Education Group ADR (a) | 6,200 | 358,732 | |
| Tencent Holdings Ltd. | 122,900 | 2,500,808 | |
| Value Partners Group Ltd. | 55,000 | 52,500 | |
| TOTAL CAYMAN ISLANDS | 7,942,267 | ||
| China - 0.6% | |||
| China Pacific Insurance (Group) Co. Ltd. (H Shares) | 132,200 | 463,552 | |
| Inner Mongoli Yili Industries Co. Ltd. | 139,000 | 322,699 | |
| Jiangsu Hengrui Medicine Co. Ltd. | 45,830 | 330,449 | |
| Kweichow Moutai Co. Ltd. | 10,340 | 401,203 | |
| Shanghai International Airport Co. Ltd. | 72,800 | 305,974 | |
| TOTAL CHINA | 1,823,877 | ||
| Denmark - 1.3% | |||
| Jyske Bank A/S (Reg.) | 15,654 | 640,880 | |
| Novo Nordisk A/S Series B sponsored ADR | 60,760 | 3,389,800 | |
| Scandinavian Tobacco Group A/S | 3,000 | 47,725 | |
| Spar Nord Bank A/S | 11,631 | 94,842 | |
| TOTAL DENMARK | 4,173,247 | ||
| Finland - 0.5% | |||
| Sampo Oyj (A Shares) | 27,653 | 1,207,351 | |
| Tikkurila Oyj | 26,280 | 460,707 | |
| TOTAL FINLAND | 1,668,058 | ||
| France - 7.0% | |||
| Atos Origin SA | 16,004 | 1,424,463 | |
| AXA SA | 75,806 | 1,914,071 | |
| Bouygues SA (b) | 12,277 | 409,363 | |
| Capgemini SA | 15,802 | 1,475,210 | |
| Dassault Systemes SA | 4,500 | 351,931 | |
| Elis SA | 5,500 | 100,985 | |
| Essilor International SA | 9,145 | 1,183,801 | |
| Havas SA | 80,986 | 677,693 | |
| Laurent-Perrier Group SA | 759 | 64,530 | |
| Orange SA | 59,500 | 988,529 | |
| Renault SA | 9,911 | 956,459 | |
| Sanofi SA | 29,328 | 2,417,406 | |
| Societe Generale Series A | 31,200 | 1,227,632 | |
| SR Teleperformance SA | 5,700 | 511,700 | |
| Total SA | 77,133 | 3,898,362 | |
| Unibail-Rodamco | 5,000 | 1,339,709 | |
| Vetoquinol SA | 1,700 | 70,466 | |
| VINCI SA | 24,100 | 1,800,344 | |
| Virbac SA | 730 | 133,157 | |
| Vivendi SA (b) | 57,152 | 1,097,908 | |
| TOTAL FRANCE | 22,043,719 | ||
| Germany - 3.6% | |||
| adidas AG | 2,800 | 361,011 | |
| alstria office REIT-AG | 6,200 | 86,967 | |
| Axel Springer Verlag AG | 9,300 | 519,244 | |
| BASF AG | 23,970 | 1,980,290 | |
| Bayer AG | 16,012 | 1,847,205 | |
| CompuGroup Medical AG | 7,646 | 300,298 | |
| Continental AG | 2,383 | 523,356 | |
| CTS Eventim AG | 7,980 | 279,516 | |
| Fielmann AG | 2,458 | 181,228 | |
| Fresenius SE & Co. KGaA | 18,300 | 1,331,024 | |
| GEA Group AG | 11,615 | 538,507 | |
| Nexus AG | 4,000 | 70,077 | |
| SAP AG | 37,730 | 2,960,335 | |
| Wirecard AG (b) | 8,800 | 380,033 | |
| TOTAL GERMANY | 11,359,091 | ||
| Greece - 0.0% | |||
| Titan Cement Co. SA (Reg.) | 1,844 | 42,065 | |
| Hong Kong - 1.4% | |||
| AIA Group Ltd. | 429,800 | 2,572,184 | |
| Guangdong Investment Ltd. | 334,000 | 471,629 | |
| Power Assets Holdings Ltd. | 87,500 | 832,483 | |
| Techtronic Industries Co. Ltd. | 96,500 | 361,747 | |
| TOTAL HONG KONG | 4,238,043 | ||
| India - 3.3% | |||
| Adani Ports & Special Economic Zone | 130,670 | 468,579 | |
| Amara Raja Batteries Ltd. | 25,033 | 360,220 | |
| Asian Paints India Ltd. | 32,877 | 428,747 | |
| Bharti Infratel Ltd. | 65,320 | 368,710 | |
| Colgate-Palmolive (India) | 28,645 | 362,604 | |
| GlaxoSmithKline Consumer Healthcare Ltd. (a) | 4,231 | 375,650 | |
| HCL Technologies Ltd. | 38,811 | 438,384 | |
| HDFC Bank Ltd. (a) | 19,066 | 387,551 | |
| Hindustan Unilever Ltd. | 39,555 | 516,816 | |
| Housing Development Finance Corp. Ltd. | 87,831 | 1,439,201 | |
| IndusInd Bank Ltd. | 23,402 | 369,515 | |
| Infosys Ltd. | 54,376 | 987,776 | |
| ITC Ltd. | 117,362 | 574,129 | |
| Jyothy Laboratories Ltd. | 16,417 | 75,232 | |
| LIC Housing Finance Ltd. (a) | 52,804 | 367,499 | |
| Lupin Ltd. | 15,964 | 386,269 | |
| Maruti Suzuki India Ltd. (a) | 8,151 | 465,637 | |
| Power Grid Corp. of India Ltd. | 160,535 | 346,564 | |
| Sun Pharmaceutical Industries Ltd. | 44,169 | 539,466 | |
| Tata Consultancy Services Ltd. | 18,951 | 723,371 | |
| Titan Co. Ltd. | 55,471 | 297,207 | |
| TOTAL INDIA | 10,279,127 | ||
| Indonesia - 0.9% | |||
| PT ACE Hardware Indonesia Tbk | 4,792,900 | 336,172 | |
| PT Bank Central Asia Tbk | 537,100 | 531,480 | |
| PT Bank Rakyat Indonesia Tbk | 575,000 | 451,263 | |
| PT Kalbe Farma Tbk | 3,267,100 | 340,633 | |
| PT Matahari Department Store Tbk | 279,100 | 402,100 | |
| PT Surya Citra Media Tbk | 1,553,000 | 376,827 | |
| PT Tower Bersama Infrastructure Tbk (a) | 621,800 | 279,357 | |
| TOTAL INDONESIA | 2,717,832 | ||
| Ireland - 1.6% | |||
| Allergan PLC (a) | 2,200 | 476,432 | |
| CRH PLC sponsored ADR | 59,929 | 1,744,533 | |
| FBD Holdings PLC | 5,372 | 39,368 | |
| James Hardie Industries PLC: | |||
| CDI | 23,978 | 337,833 | |
| sponsored ADR | 112,225 | 1,573,395 | |
| Medtronic PLC | 10,600 | 838,990 | |
| TOTAL IRELAND | 5,010,551 | ||
| Isle of Man - 0.3% | |||
| Playtech Ltd. | 76,677 | 901,334 | |
| Israel - 1.1% | |||
| Azrieli Group | 11,796 | 468,500 | |
| Check Point Software Technologies Ltd. (a) | 4,000 | 331,480 | |
| Frutarom Industries Ltd. | 6,900 | 353,638 | |
| Ituran Location & Control Ltd. | 5,661 | 117,749 | |
| Strauss Group Ltd. | 6,859 | 108,692 | |
| Teva Pharmaceutical Industries Ltd. sponsored ADR | 35,509 | 1,933,465 | |
| TOTAL ISRAEL | 3,313,524 | ||
| Italy - 1.6% | |||
| Azimut Holding SpA | 22,914 | 576,704 | |
| Banco di Desio e della Brianza SpA | 19,000 | 53,563 | |
| Beni Stabili SpA SIIQ | 190,326 | 141,003 | |
| Eni SpA | 94,900 | 1,550,375 | |
| Interpump Group SpA | 49,391 | 710,898 | |
| Intesa Sanpaolo SpA | 297,500 | 826,991 | |
| Mediaset SpA | 121,000 | 544,506 | |
| Telecom Italia SpA (a) | 638,800 | 623,771 | |
| TOTAL ITALY | 5,027,811 | ||
| Japan - 13.7% | |||
| Aoki Super Co. Ltd. | 6,000 | 70,898 | |
| Artnature, Inc. | 12,300 | 101,984 | |
| Asahi Co. Ltd. | 6,600 | 97,893 | |
| Astellas Pharma, Inc. | 245,800 | 3,314,022 | |
| Autobacs Seven Co. Ltd. | 5,800 | 100,069 | |
| Azbil Corp. | 8,200 | 210,398 | |
| Broadleaf Co. Ltd. | 2,700 | 26,682 | |
| Central Automotive Products Ltd. | 8,000 | 66,678 | |
| Century21 Real Estate Japan Ltd. (c) | 2,500 | 27,834 | |
| Coca-Cola Central Japan Co. Ltd. | 18,700 | 342,601 | |
| Daiichikosho Co. Ltd. | 3,300 | 138,342 | |
| Daikokutenbussan Co. Ltd. | 5,000 | 224,719 | |
| DENSO Corp. | 48,600 | 1,847,343 | |
| Dentsu, Inc. | 21,800 | 1,107,636 | |
| East Japan Railway Co. | 20,600 | 1,812,307 | |
| Funai Soken Holdings, Inc. | 3,000 | 45,516 | |
| GCA Savvian Group Corp. | 6,800 | 62,834 | |
| Glory Ltd. | 3,900 | 127,730 | |
| Goldcrest Co. Ltd. | 7,960 | 113,977 | |
| Hokuriku Electrical Construction Co. Ltd. | 5,000 | 36,583 | |
| Hoya Corp. | 50,700 | 1,941,520 | |
| Hub Co. Ltd. | 2,500 | 40,088 | |
| Itochu Corp. | 85,300 | 1,084,044 | |
| Iwatsuka Confectionary Co. Ltd. | 800 | 36,244 | |
| Japan Digital Laboratory Co. | 6,100 | 82,516 | |
| Japan Tobacco, Inc. | 70,800 | 2,892,742 | |
| KDDI Corp. | 49,800 | 1,434,526 | |
| Keyence Corp. | 2,621 | 1,571,009 | |
| Kobayashi Pharmaceutical Co. Ltd. | 2,000 | 159,305 | |
| Koshidaka Holdings Co. Ltd. | 4,000 | 78,655 | |
| Lasertec Corp. | 6,300 | 81,908 | |
| Makita Corp. | 12,700 | 801,159 | |
| Medikit Co. Ltd. | 2,200 | 76,699 | |
| Meiko Network Japan Co. Ltd. | 2,700 | 29,778 | |
| Mitsubishi UFJ Financial Group, Inc. | 357,000 | 1,647,489 | |
| Mitsui Fudosan Co. Ltd. | 54,000 | 1,318,811 | |
| Nagaileben Co. Ltd. | 8,600 | 175,497 | |
| Nakano Refrigerators Co. Ltd. | 2,000 | 47,850 | |
| ND Software Co. Ltd. | 6,000 | 49,390 | |
| Nihon Parkerizing Co. Ltd. | 20,200 | 178,172 | |
| Nintendo Co. Ltd. | 4,400 | 595,765 | |
| Nippon Prologis REIT, Inc. (c) | 241 | 577,879 | |
| Nippon Telegraph & Telephone Corp. | 41,900 | 1,875,039 | |
| NS Tool Co. Ltd. | 3,800 | 63,002 | |
| OBIC Co. Ltd. | 17,800 | 935,585 | |
| Olympus Corp. | 43,600 | 1,698,509 | |
| ORIX Corp. | 71,100 | 1,005,705 | |
| OSG Corp. | 33,500 | 622,551 | |
| Paramount Bed Holdings Co. Ltd. | 3,400 | 126,476 | |
| ProNexus, Inc. | 8,000 | 80,904 | |
| San-Ai Oil Co. Ltd. | 11,000 | 77,092 | |
| Seven & i Holdings Co. Ltd. | 23,200 | 946,617 | |
| Seven Bank Ltd. | 398,800 | 1,694,584 | |
| Shinsei Bank Ltd. | 334,000 | 468,127 | |
| SHO-BOND Holdings Co. Ltd. | 22,100 | 956,249 | |
| Shoei Co. Ltd. | 5,800 | 87,794 | |
| SK Kaken Co. Ltd. | 1,100 | 90,257 | |
| Software Service, Inc. | 1,600 | 61,799 | |
| Sony Corp. | 31,300 | 758,137 | |
| Sony Financial Holdings, Inc. | 44,000 | 543,969 | |
| Sumitomo Mitsui Financial Group, Inc. | 42,600 | 1,281,907 | |
| Techno Medica Co. Ltd. | 1,800 | 37,734 | |
| The Monogatari Corp. | 1,500 | 70,800 | |
| The Nippon Synthetic Chemical Industry Co. Ltd. | 6,000 | 36,206 | |
| TKC Corp. | 3,300 | 89,656 | |
| Tocalo Co. Ltd. | 2,800 | 50,368 | |
| Toyota Motor Corp. | 50,000 | 2,534,487 | |
| Tsutsumi Jewelry Co. Ltd. | 2,200 | 45,954 | |
| USS Co. Ltd. | 110,600 | 1,749,509 | |
| Workman Co. Ltd. | 3,800 | 119,455 | |
| Yamada Consulting Group Co. Ltd. | 2,000 | 61,101 | |
| Yamato Kogyo Co. Ltd. | 1,700 | 39,907 | |
| TOTAL JAPAN | 42,986,572 | ||
| Kenya - 0.2% | |||
| Safaricom Ltd. | 4,376,100 | 740,904 | |
| Korea (South) - 1.6% | |||
| AMOREPACIFIC Corp. | 1,718 | 611,068 | |
| AMOREPACIFIC Group, Inc. | 3,162 | 463,671 | |
| BGFretail Co. Ltd. | 4,710 | 764,667 | |
| Coway Co. Ltd. | 4,513 | 388,401 | |
| KT&G Corp. | 5,617 | 603,043 | |
| Leeno Industrial, Inc. | 959 | 35,868 | |
| LG Chemical Ltd. | 2,168 | 562,023 | |
| LG Household & Health Care Ltd. | 620 | 544,954 | |
| NAVER Corp. | 1,801 | 1,064,243 | |
| TOTAL KOREA (SOUTH) | 5,037,938 | ||
| Luxembourg - 0.3% | |||
| Eurofins Scientific SA | 1,000 | 371,053 | |
| RTL Group SA | 6,427 | 534,133 | |
| TOTAL LUXEMBOURG | 905,186 | ||
| Mexico - 2.2% | |||
| Banregio Grupo Financiero S.A.B. de CV | 64,200 | 384,723 | |
| Consorcio ARA S.A.B. de CV | 254,355 | 99,793 | |
| El Puerto de Liverpool S.A.B. de CV Class C | 31,300 | 355,796 | |
| Fomento Economico Mexicano S.A.B. de CV: | |||
| unit | 71,500 | 665,269 | |
| sponsored ADR | 7,333 | 683,509 | |
| Gruma S.A.B. de CV Series B | 26,400 | 385,658 | |
| Grupo Aeroportuario del Pacifico S.A.B. de CV Series B | 45,000 | 423,984 | |
| Grupo Aeroportuario del Sureste S.A.B. de CV Series B | 28,135 | 432,066 | |
| Grupo Aeroportuario Norte S.A.B. de CV | 65,200 | 377,300 | |
| Grupo Financiero Banorte S.A.B. de CV Series O | 106,900 | 606,866 | |
| Grupo GICSA SA de CV (a) | 272,500 | 214,140 | |
| Infraestructura Energetica Nova S.A.B. de CV | 84,400 | 329,807 | |
| Kimberly-Clark de Mexico SA de CV Series A | 173,200 | 409,930 | |
| Megacable Holdings S.A.B. de CV unit | 81,200 | 374,977 | |
| Promotora y Operadora de Infraestructura S.A.B. de CV | 27,700 | 351,292 | |
| Tenedora Nemak SA de CV | 233,700 | 335,242 | |
| Wal-Mart de Mexico SA de CV Series V | 167,600 | 414,503 | |
| TOTAL MEXICO | 6,844,855 | ||
| Netherlands - 1.6% | |||
| Aalberts Industries NV | 6,100 | 208,985 | |
| Heijmans NV (Certificaten Van Aandelen) (a) | 4,481 | 42,228 | |
| ING Groep NV (Certificaten Van Aandelen) | 113,576 | 1,390,887 | |
| Koninklijke KPN NV | 150,029 | 589,562 | |
| Mylan N.V. | 9,800 | 408,758 | |
| PostNL NV (a) | 74,300 | 324,995 | |
| RELX NV | 100,780 | 1,691,160 | |
| VastNed Retail NV | 5,035 | 221,677 | |
| TOTAL NETHERLANDS | 4,878,252 | ||
| Norway - 0.0% | |||
| Kongsberg Gruppen ASA | 4,500 | 75,449 | |
| Philippines - 0.9% | |||
| Ayala Corp. | 26,950 | 441,766 | |
| Ayala Land, Inc. | 590,400 | 434,939 | |
| D&L Industries, Inc. | 1,653,900 | 316,469 | |
| GT Capital Holdings, Inc. | 12,985 | 377,389 | |
| International Container Terminal Services, Inc. | 241,940 | 334,349 | |
| Jollibee Food Corp. | 16,980 | 82,887 | |
| SM Investments Corp. | 20,420 | 409,833 | |
| SM Prime Holdings, Inc. | 859,600 | 413,946 | |
| TOTAL PHILIPPINES | 2,811,578 | ||
| Russia - 0.3% | |||
| Magnit OJSC (a) | 3,350 | 465,579 | |
| NOVATEK OAO GDR (Reg. S) | 5,300 | 508,800 | |
| TOTAL RUSSIA | 974,379 | ||
| South Africa - 2.0% | |||
| Aspen Pharmacare Holdings Ltd. | 23,800 | 560,891 | |
| Bidvest Group Ltd. | 20,132 | 510,935 | |
| Clicks Group Ltd. | 60,693 | 443,283 | |
| Discovery Ltd. | 48,767 | 435,829 | |
| FirstRand Ltd. | 169,400 | 544,427 | |
| Mondi Ltd. | 21,100 | 405,362 | |
| Mr Price Group Ltd. | 33,900 | 430,631 | |
| Naspers Ltd. Class N | 17,300 | 2,373,735 | |
| Sanlam Ltd. | 107,700 | 522,035 | |
| TOTAL SOUTH AFRICA | 6,227,128 | ||
| Spain - 2.8% | |||
| Amadeus IT Holding SA Class A | 42,900 | 1,952,134 | |
| Hispania Activos Inmobiliarios SA (a) | 38,400 | 562,815 | |
| Iberdrola SA | 254,372 | 1,810,808 | |
| Inditex SA | 91,236 | 2,928,810 | |
| Mediaset Espana Comunicacion SA | 49,300 | 640,154 | |
| Merlin Properties Socimi SA | 36,100 | 419,564 | |
| Prosegur Compania de Seguridad SA (Reg.) | 106,676 | 616,854 | |
| TOTAL SPAIN | 8,931,139 | ||
| Sweden - 2.4% | |||
| ASSA ABLOY AB (B Shares) | 136,700 | 2,866,624 | |
| Fagerhult AB | 49,855 | 1,160,942 | |
| Intrum Justitia AB | 11,563 | 414,978 | |
| Nordea Bank AB | 138,267 | 1,342,131 | |
| Saab AB (B Shares) | 3,000 | 102,622 | |
| Sandvik AB (b) | 48,200 | 494,578 | |
| Svenska Handelsbanken AB (A Shares) (b) | 87,445 | 1,166,530 | |
| TOTAL SWEDEN | 7,548,405 | ||
| Switzerland - 7.7% | |||
| Credit Suisse Group AG | 48,674 | 740,743 | |
| Lafargeholcim Ltd. (Reg.) | 13,560 | 686,552 | |
| Nestle SA | 107,904 | 8,053,917 | |
| Novartis AG | 72,031 | 5,481,722 | |
| Roche Holding AG (participation certificate) | 15,701 | 3,972,498 | |
| Schindler Holding AG: | |||
| (participation certificate) | 7,634 | 1,390,243 | |
| (Reg.) | 2,251 | 413,688 | |
| Sika AG | 90 | 383,061 | |
| Syngenta AG (Switzerland) | 3,219 | 1,288,540 | |
| Tecan Group AG | 600 | 83,311 | |
| UBS Group AG | 22,589 | 390,112 | |
| Zurich Insurance Group AG | 5,646 | 1,266,874 | |
| TOTAL SWITZERLAND | 24,151,261 | ||
| Taiwan - 1.6% | |||
| Addcn Technology Co. Ltd. | 8,500 | 65,257 | |
| Advantech Co. Ltd. | 48,000 | 338,792 | |
| ECLAT Textile Co. Ltd. | 34,643 | 395,194 | |
| Largan Precision Co. Ltd. | 5,870 | 412,497 | |
| Taiwan Semiconductor Manufacturing Co. Ltd. | 835,035 | 3,830,521 | |
| TOTAL TAIWAN | 5,042,261 | ||
| Thailand - 0.4% | |||
| Airports of Thailand PCL (For. Reg.) | 37,800 | 424,330 | |
| Bangkok Dusit Medical Services PCL (For. Reg.) | 527,200 | 359,317 | |
| Thai Beverage PCL | 612,400 | 339,248 | |
| TOTAL THAILAND | 1,122,895 | ||
| Turkey - 0.5% | |||
| Bim Birlesik Magazalar A/S JSC | 19,000 | 418,299 | |
| Koc Holding A/S | 83,000 | 433,985 | |
| Tofas Turk Otomobil Fabrikasi A/S | 44,054 | 348,590 | |
| Tupras Turkiye Petrol Rafinelleri A/S | 15,000 | 395,908 | |
| TOTAL TURKEY | 1,596,782 | ||
| United Arab Emirates - 0.1% | |||
| DP World Ltd. | 20,486 | 387,185 | |
| United Kingdom - 13.5% | |||
| AA PLC | 21,973 | 89,447 | |
| Alliance Pharma PLC | 64,414 | 42,353 | |
| Associated British Foods PLC | 28,900 | 1,293,842 | |
| AstraZeneca PLC (United Kingdom) | 31,527 | 1,808,786 | |
| Aviva PLC | 160,179 | 1,014,812 | |
| Babcock International Group PLC | 28,323 | 392,115 | |
| BAE Systems PLC | 249,621 | 1,741,520 | |
| Barclays PLC | 406,095 | 1,019,607 | |
| Bellway PLC | 6,328 | 226,253 | |
| Berendsen PLC | 67,555 | 1,164,754 | |
| British American Tobacco PLC (United Kingdom) | 5,700 | 347,541 | |
| Britvic PLC | 8,417 | 86,581 | |
| Bunzl PLC | 42,632 | 1,270,129 | |
| Compass Group PLC | 72,807 | 1,296,575 | |
| Dechra Pharmaceuticals PLC | 9,600 | 155,139 | |
| DP Poland PLC (a) | 200,000 | 75,980 | |
| Elementis PLC | 47,708 | 150,501 | |
| Great Portland Estates PLC | 13,972 | 154,747 | |
| Hikma Pharmaceuticals PLC | 13,118 | 422,449 | |
| Hilton Food Group PLC | 5,400 | 44,422 | |
| Howden Joinery Group PLC | 67,400 | 486,499 | |
| HSBC Holdings PLC sponsored ADR | 53,617 | 1,787,055 | |
| Imperial Tobacco Group PLC | 38,114 | 2,070,843 | |
| Informa PLC | 223,214 | 2,134,646 | |
| InterContinental Hotel Group PLC ADR | 69,496 | 2,789,569 | |
| ITE Group PLC | 41,200 | 93,460 | |
| ITV PLC | 374,619 | 1,232,687 | |
| JUST EAT Ltd. (a) | 12,540 | 70,268 | |
| Lloyds Banking Group PLC | 2,277,100 | 2,234,999 | |
| Micro Focus International PLC | 36,100 | 806,510 | |
| National Grid PLC | 115,665 | 1,650,378 | |
| NMC Health PLC | 22,600 | 345,740 | |
| Prudential PLC | 122,580 | 2,419,672 | |
| Reckitt Benckiser Group PLC | 36,651 | 3,570,500 | |
| Rightmove PLC | 7,800 | 439,695 | |
| Rio Tinto PLC | 69,603 | 2,334,923 | |
| Royal Dutch Shell PLC Class B (United Kingdom) | 39,530 | 1,037,855 | |
| Shaftesbury PLC | 41,837 | 556,284 | |
| Spectris PLC | 7,970 | 212,062 | |
| Spirax-Sarco Engineering PLC | 5,699 | 284,370 | |
| Taylor Wimpey PLC | 29,400 | 79,171 | |
| Ted Baker PLC | 3,375 | 117,613 | |
| Topps Tiles PLC | 33,400 | 66,371 | |
| Ultra Electronics Holdings PLC | 5,901 | 152,269 | |
| Unite Group PLC | 66,977 | 618,986 | |
| Vodafone Group PLC sponsored ADR | 63,826 | 2,089,663 | |
| TOTAL UNITED KINGDOM | 42,479,641 | ||
| United States of America - 11.2% | |||
| A.O. Smith Corp. | 4,200 | 324,324 | |
| Alphabet, Inc.: | |||
| Class A | 2,030 | 1,436,996 | |
| Class C | 406 | 281,362 | |
| Altria Group, Inc. | 11,100 | 696,081 | |
| Amazon.com, Inc. (a) | 600 | 395,754 | |
| Amphenol Corp. Class A | 5,400 | 301,482 | |
| ANSYS, Inc. (a) | 500 | 45,385 | |
| Autoliv, Inc. | 13,654 | 1,672,205 | |
| Berkshire Hathaway, Inc. Class B (a) | 9,016 | 1,311,648 | |
| Broadridge Financial Solutions, Inc. | 1,340 | 80,186 | |
| Chevron Corp. | 9,000 | 919,620 | |
| China Biologic Products, Inc. (a) | 10,200 | 1,193,400 | |
| ConocoPhillips Co. | 22,200 | 1,060,938 | |
| Constellation Brands, Inc. Class A (sub. vtg.) | 8,300 | 1,295,298 | |
| Danaher Corp. | 3,200 | 309,600 | |
| Domino's Pizza, Inc. | 6,800 | 821,984 | |
| Ecolab, Inc. | 2,800 | 321,944 | |
| Edgewell Personal Care Co. (a) | 5,400 | 443,178 | |
| Energizer Holdings, Inc. | 1,000 | 43,490 | |
| Facebook, Inc. Class A (a) | 2,800 | 329,224 | |
| Gartner, Inc. Class A (a) | 3,400 | 296,378 | |
| International Flavors & Fragrances, Inc. | 3,100 | 370,357 | |
| Kennedy-Wilson Holdings, Inc. | 7,773 | 167,975 | |
| Martin Marietta Materials, Inc. | 4,970 | 841,073 | |
| MasterCard, Inc. Class A | 26,000 | 2,521,740 | |
| McGraw Hill Financial, Inc. | 19,800 | 2,115,630 | |
| MercadoLibre, Inc. | 3,100 | 387,159 | |
| Mettler-Toledo International, Inc. (a) | 1,000 | 357,950 | |
| Mohawk Industries, Inc. (a) | 8,665 | 1,669,139 | |
| Molson Coors Brewing Co. Class B | 14,800 | 1,415,324 | |
| Moody's Corp. | 9,900 | 947,628 | |
| MSCI, Inc. Class A | 12,200 | 926,468 | |
| NIKE, Inc. Class B | 5,600 | 330,064 | |
| Philip Morris International, Inc. | 18,500 | 1,815,220 | |
| PPG Industries, Inc. | 2,900 | 320,131 | |
| PriceSmart, Inc. | 8,885 | 768,908 | |
| ResMed, Inc. | 12,720 | 709,776 | |
| Reynolds American, Inc. | 24,900 | 1,235,040 | |
| Sherwin-Williams Co. | 2,300 | 660,813 | |
| SS&C Technologies Holdings, Inc. | 14,054 | 859,402 | |
| The Walt Disney Co. | 3,000 | 309,780 | |
| TransDigm Group, Inc. (a) | 1,500 | 341,805 | |
| Visa, Inc. Class A | 32,877 | 2,539,419 | |
| TOTAL UNITED STATES OF AMERICA | 35,191,278 | ||
| TOTAL COMMON STOCKS | |||
| (Cost $262,015,051) | 305,478,629 | ||
| Nonconvertible Preferred Stocks - 1.1% | |||
| Brazil - 0.9% | |||
| Ambev SA sponsored ADR | 152,100 | 850,239 | |
| Banco Bradesco SA (PN) | 113,850 | 857,372 | |
| Itau Unibanco Holding SA | 94,300 | 901,255 | |
| TOTAL BRAZIL | 2,608,866 | ||
| Germany - 0.2% | |||
| Sartorius AG (non-vtg.) | 900 | 222,031 | |
| Volkswagen AG | 2,990 | 432,927 | |
| TOTAL GERMANY | 654,958 | ||
| TOTAL NONCONVERTIBLE PREFERRED STOCKS | |||
| (Cost $3,142,197) | 3,263,824 | ||
| Money Market Funds - 2.2% | |||
| Fidelity Cash Central Fund, 0.38% (d) | 3,860,982 | 3,860,982 | |
| Fidelity Securities Lending Cash Central Fund, 0.42% (d)(e) | 3,158,800 | 3,158,800 | |
| TOTAL MONEY MARKET FUNDS | |||
| (Cost $7,019,782) | 7,019,782 | ||
| TOTAL INVESTMENT PORTFOLIO - 100.7% | |||
| (Cost $272,177,030) | 315,762,235 | ||
| NET OTHER ASSETS (LIABILITIES) - (0.7)% | (2,185,787) | ||
| NET ASSETS - 100% | $313,576,448 |
Categorizations in the Schedule of Investments are based on country or territory of incorporation.
Legend
(a) Non-income producing
(b) Security or a portion of the security is on loan at period end.
(c) Security or a portion of the security purchased on a delayed delivery or when-issued basis.
(d) Affiliated fund that is generally available only to investment companies and other accounts managed by Fidelity Investments. The rate quoted is the annualized seven-day yield of the fund at period end. A complete unaudited listing of the fund's holdings as of its most recent quarter end is available upon request. In addition, each Fidelity Central Fund's financial statements are available on the SEC's website or upon request.
(e) Investment made with cash collateral received from securities on loan.
Affiliated Central Funds
Information regarding fiscal year to date income earned by the Fund from investments in Fidelity Central Funds is as follows:
| Fund | Income earned |
| Fidelity Cash Central Fund | $6,565 |
| Fidelity Securities Lending Cash Central Fund | 41,244 |
| Total | $47,809 |
Investment Valuation
The following is a summary of the inputs used, as of April 30, 2016, involving the Fund's assets and liabilities carried at fair value. The inputs or methodology used for valuing securities may not be an indication of the risk associated with investing in those securities. For more information on valuation inputs, and their aggregation into the levels used below, please refer to the Investment Valuation section in the accompanying Notes to Financial Statements.
| Valuation Inputs at Reporting Date: | ||||
| Description | Total | Level 1 | Level 2 | Level 3 |
| Investments in Securities: | ||||
| Equities: | ||||
| Consumer Discretionary | $44,289,186 | $31,864,746 | $12,424,440 | $-- |
| Consumer Staples | 43,532,195 | 26,785,127 | 16,747,068 | -- |
| Energy | 11,569,512 | 5,005,828 | 6,563,684 | -- |
| Financials | 59,479,309 | 30,876,288 | 28,603,021 | -- |
| Health Care | 44,295,373 | 22,767,675 | 21,527,698 | -- |
| Industrials | 34,242,642 | 25,865,080 | 8,377,562 | -- |
| Information Technology | 38,595,430 | 23,298,008 | 15,297,422 | -- |
| Materials | 17,201,467 | 14,479,937 | 2,721,530 | -- |
| Telecommunication Services | 8,990,061 | 3,478,634 | 5,511,427 | -- |
| Utilities | 6,547,278 | 676,371 | 5,870,907 | -- |
| Money Market Funds | 7,019,782 | 7,019,782 | -- | -- |
| Total Investments in Securities: | $315,762,235 | $192,117,476 | $123,644,759 | $-- |
The following is a summary of transfers between Level 1 and Level 2 for the period ended April 30, 2016. Transfers are assumed to have occurred at the beginning of the period, and are primarily attributable to the valuation techniques used for foreign equity securities, as discussed in the accompanying Notes to Financial Statements:
| Transfers | Total |
| Level 1 to Level 2 | $4,099,814 |
| Level 2 to Level 1 | $34,866,774 |
See accompanying notes which are an integral part of the financial statements.
Financial Statements
Statement of Assets and Liabilities
| April 30, 2016 (Unaudited) | ||
| Assets | ||
| Investment in securities, at value (including securities loaned of $2,961,201) — See accompanying schedule: Unaffiliated issuers (cost $265,157,248) | $308,742,453 | |
| Fidelity Central Funds (cost $7,019,782) | 7,019,782 | |
| Total Investments (cost $272,177,030) | $315,762,235 | |
| Foreign currency held at value (cost $18,143) | 17,488 | |
| Receivable for investments sold | 433,383 | |
| Receivable for fund shares sold | 52,780 | |
| Dividends receivable | 1,829,196 | |
| Distributions receivable from Fidelity Central Funds | 23,163 | |
| Prepaid expenses | 265 | |
| Receivable from investment adviser for expense reductions | 56 | |
| Other receivables | 24,958 | |
| Total assets | 318,143,524 | |
| Liabilities | ||
| Payable to custodian bank | $71,380 | |
| Payable for investments purchased | ||
| Regular delivery | 521,035 | |
| Delayed delivery | 44,749 | |
| Payable for fund shares redeemed | 436,104 | |
| Accrued management fee | 199,146 | |
| Distribution and service plan fees payable | 10,041 | |
| Other affiliated payables | 47,252 | |
| Other payables and accrued expenses | 78,569 | |
| Collateral on securities loaned, at value | 3,158,800 | |
| Total liabilities | 4,567,076 | |
| Net Assets | $313,576,448 | |
| Net Assets consist of: | ||
| Paid in capital | $303,103,887 | |
| Undistributed net investment income | 1,912,194 | |
| Accumulated undistributed net realized gain (loss) on investments and foreign currency transactions | (35,054,648) | |
| Net unrealized appreciation (depreciation) on investments and assets and liabilities in foreign currencies | 43,615,015 | |
| Net Assets | $313,576,448 | |
| Calculation of Maximum Offering Price | ||
| Class A: | ||
| Net Asset Value and redemption price per share ($8,818,273 ÷ 1,166,002 shares) | $7.56 | |
| Maximum offering price per share (100/94.25 of $7.56) | $8.02 | |
| Class T: | ||
| Net Asset Value and redemption price per share ($13,627,834 ÷ 1,793,896 shares) | $7.60 | |
| Maximum offering price per share (100/96.50 of $7.60) | $7.88 | |
| Class B: | ||
| Net Asset Value and offering price per share ($93,240 ÷ 12,203 shares)(a) | $7.64 | |
| Class C: | ||
| Net Asset Value and offering price per share ($3,077,150 ÷ 406,220 shares)(a) | $7.58 | |
| Total International Equity: | ||
| Net Asset Value, offering price and redemption price per share ($284,995,679 ÷ 37,639,906 shares) | $7.57 | |
| Class I: | ||
| Net Asset Value, offering price and redemption price per share ($2,964,272 ÷ 393,120 shares) | $7.54 |
(a) Redemption price per share is equal to net asset value less any applicable contingent deferred sales charge.
See accompanying notes which are an integral part of the financial statements.
Statement of Operations
| Six months ended April 30, 2016 (Unaudited) | ||
| Investment Income | ||
| Dividends | $4,405,366 | |
| Income from Fidelity Central Funds | 47,809 | |
| Income before foreign taxes withheld | 4,453,175 | |
| Less foreign taxes withheld | (400,599) | |
| Total income | 4,052,576 | |
| Expenses | ||
| Management fee | ||
| Basic fee | $1,101,234 | |
| Performance adjustment | 185,483 | |
| Transfer agent fees | 204,427 | |
| Distribution and service plan fees | 59,906 | |
| Accounting and security lending fees | 81,700 | |
| Custodian fees and expenses | 112,889 | |
| Independent trustees' compensation | 693 | |
| Registration fees | 33,115 | |
| Audit | 63,656 | |
| Legal | 868 | |
| Miscellaneous | 1,090 | |
| Total expenses before reductions | 1,845,061 | |
| Expense reductions | (13,581) | 1,831,480 |
| Net investment income (loss) | 2,221,096 | |
| Realized and Unrealized Gain (Loss) | ||
| Net realized gain (loss) on: | ||
| Investment securities: | ||
| Unaffiliated issuers | (5,285,836) | |
| Foreign currency transactions | 74,152 | |
| Total net realized gain (loss) | (5,211,684) | |
| Change in net unrealized appreciation (depreciation) on: Investment securities (net of decrease in deferred foreign taxes of $30,538) | (4,718,985) | |
| Assets and liabilities in foreign currencies | 3,044 | |
| Total change in net unrealized appreciation (depreciation) | (4,715,941) | |
| Net gain (loss) | (9,927,625) | |
| Net increase (decrease) in net assets resulting from operations | $(7,706,529) |
See accompanying notes which are an integral part of the financial statements.
Statement of Changes in Net Assets
| Six months ended April 30, 2016 (Unaudited) | Year ended October 31, 2015 | |
| Increase (Decrease) in Net Assets | ||
| Operations | ||
| Net investment income (loss) | $2,221,096 | $4,170,618 |
| Net realized gain (loss) | (5,211,684) | (5,852,740) |
| Change in net unrealized appreciation (depreciation) | (4,715,941) | (558,579) |
| Net increase (decrease) in net assets resulting from operations | (7,706,529) | (2,240,701) |
| Distributions to shareholders from net investment income | (3,869,339) | (5,482,469) |
| Distributions to shareholders from net realized gain | – | (1,726,810) |
| Total distributions | (3,869,339) | (7,209,279) |
| Share transactions - net increase (decrease) | (11,041,483) | (4,678,824) |
| Redemption fees | 426 | 1,289 |
| Total increase (decrease) in net assets | (22,616,925) | (14,127,515) |
| Net Assets | ||
| Beginning of period | 336,193,373 | 350,320,888 |
| End of period (including undistributed net investment income of $1,912,194 and undistributed net investment income of $3,560,437, respectively) | $313,576,448 | $336,193,373 |
See accompanying notes which are an integral part of the financial statements.
Financial Highlights — Fidelity Total International Equity Fund Class A
| Six months ended (Unaudited) April 30, | Years ended October 31, | |||||
| 2016 | 2015 | 2014 | 2013 | 2012 | 2011 | |
| Selected Per–Share Data | ||||||
| Net asset value, beginning of period | $7.79 | $8.00 | $8.27 | $7.31 | $6.67 | $7.36 |
| Income from Investment Operations | ||||||
| Net investment income (loss)A | .04 | .07 | .13 | .09 | .13 | .11 |
| Net realized and unrealized gain (loss) | (.21) | (.14) | (.12) | 1.24 | .59 | (.69) |
| Total from investment operations | (.17) | (.07) | .01 | 1.33 | .72 | (.58) |
| Distributions from net investment income | (.06) | (.10) | (.10) | (.13) | (.08) | (.09) |
| Distributions from net realized gain | – | (.04) | (.18) | (.25) | – | (.02) |
| Total distributions | (.06) | (.14) | (.28) | (.37)B | (.08) | (.11) |
| Redemption fees added to paid in capitalA,C | – | – | – | – | – | – |
| Net asset value, end of period | $7.56 | $7.79 | $8.00 | $8.27 | $7.31 | $6.67 |
| Total ReturnD,E,F | (2.18)% | (.89)% | .19% | 19.00% | 10.88% | (8.03)% |
| Ratios to Average Net AssetsG,H | ||||||
| Expenses before reductions | 1.53%I | 1.48% | 1.44% | 1.50% | 1.57% | 1.73% |
| Expenses net of fee waivers, if any | 1.45%I | 1.45% | 1.44% | 1.45% | 1.45% | 1.45% |
| Expenses net of all reductions | 1.45%I | 1.44% | 1.44% | 1.43% | 1.42% | 1.42% |
| Net investment income (loss) | 1.12%I | .86% | 1.63% | 1.21% | 1.88% | 1.44% |
| Supplemental Data | ||||||
| Net assets, end of period (000 omitted) | $8,818 | $9,163 | $9,164 | $9,034 | $5,767 | $4,307 |
| Portfolio turnover rateJ | 43%I | 53% | 85% | 89% | 110% | 75% |
A Calculated based on average shares outstanding during the period.
B Total distributions of $.37 per share is comprised of distributions from net investment income of $.126 and distributions from net realized gain of $.245 per share.
C Amount represents less than $.005 per share.
D Total returns for periods of less than one year are not annualized.
E Total returns would have been lower if certain expenses had not been reduced during the applicable periods shown.
F Total returns do not include the effect of the sales charges.
G Fees and expenses of any underlying Fidelity Central Funds are not included in the Fund's expense ratio. The Fund indirectly bears its proportionate share of the expenses of any underlying Fidelity Central Funds.
H Expense ratios reflect operating expenses of the class. Expenses before reductions do not reflect amounts reimbursed by the investment adviser or reductions from brokerage service arrangements or reductions from other expense offset arrangements and do not represent the amount paid by the class during periods when reimbursements or reductions occur. Expenses net of fee waivers reflect expenses after reimbursement by the investment adviser but prior to reductions from brokerage service arrangements or other expense offset arrangements. Expenses net of all reductions represent the net expenses paid by the class.
I Annualized
J Amount does not include the portfolio activity of any underlying Fidelity Central Funds.
See accompanying notes which are an integral part of the financial statements.
Financial Highlights — Fidelity Total International Equity Fund Class T
| Six months ended (Unaudited) April 30, | Years ended October 31, | |||||
| 2016 | 2015 | 2014 | 2013 | 2012 | 2011 | |
| Selected Per–Share Data | ||||||
| Net asset value, beginning of period | $7.81 | $8.04 | $8.32 | $7.37 | $6.73 | $7.41 |
| Income from Investment Operations | ||||||
| Net investment income (loss)A | .03 | .05 | .11 | .07 | .11 | .09 |
| Net realized and unrealized gain (loss) | (.20) | (.15) | (.12) | 1.25 | .59 | (.68) |
| Total from investment operations | (.17) | (.10) | (.01) | 1.32 | .70 | (.59) |
| Distributions from net investment income | (.04) | (.09) | (.09) | (.13) | (.06) | (.07) |
| Distributions from net realized gain | – | (.04) | (.18) | (.25) | – | (.02) |
| Total distributions | (.04) | (.13) | (.27) | (.37)B | (.06) | (.09) |
| Redemption fees added to paid in capitalA,C | – | – | – | – | – | – |
| Net asset value, end of period | $7.60 | $7.81 | $8.04 | $8.32 | $7.37 | $6.73 |
| Total ReturnD,E,F | (2.15)% | (1.26)% | (.06)% | 18.73% | 10.52% | (8.08)% |
| Ratios to Average Net AssetsG,H | ||||||
| Expenses before reductions | 1.75%I | 1.70% | 1.68% | 1.75% | 1.84% | 2.02% |
| Expenses net of fee waivers, if any | 1.70%I | 1.70% | 1.68% | 1.70% | 1.70% | 1.70% |
| Expenses net of all reductions | 1.70%I | 1.69% | 1.68% | 1.67% | 1.67% | 1.67% |
| Net investment income (loss) | .87%I | .61% | 1.38% | .96% | 1.63% | 1.19% |
| Supplemental Data | ||||||
| Net assets, end of period (000 omitted) | $13,628 | $13,962 | $10,282 | $7,909 | $2,348 | $997 |
| Portfolio turnover rateJ | 43%I | 53% | 85% | 89% | 110% | 75% |
A Calculated based on average shares outstanding during the period.
B Total distributions of $.37 per share is comprised of distributions from net investment income of $.128 and distributions from net realized gain of $.245 per share.
C Amount represents less than $.005 per share.
D Total returns for periods of less than one year are not annualized.
E Total returns would have been lower if certain expenses had not been reduced during the applicable periods shown.
F Total returns do not include the effect of the sales charges.
G Fees and expenses of any underlying Fidelity Central Funds are not included in the Fund's expense ratio. The Fund indirectly bears its proportionate share of the expenses of any underlying Fidelity Central Funds.
H Expense ratios reflect operating expenses of the class. Expenses before reductions do not reflect amounts reimbursed by the investment adviser or reductions from brokerage service arrangements or reductions from other expense offset arrangements and do not represent the amount paid by the class during periods when reimbursements or reductions occur. Expenses net of fee waivers reflect expenses after reimbursement by the investment adviser but prior to reductions from brokerage service arrangements or other expense offset arrangements. Expenses net of all reductions represent the net expenses paid by the class.
I Annualized
J Amount does not include the portfolio activity of any underlying Fidelity Central Funds.
See accompanying notes which are an integral part of the financial statements.
Financial Highlights — Fidelity Total International Equity Fund Class B
| Six months ended (Unaudited) April 30, | Years ended October 31, | |||||
| 2016 | 2015 | 2014 | 2013 | 2012 | 2011 | |
| Selected Per–Share Data | ||||||
| Net asset value, beginning of period | $7.84 | $8.05 | $8.31 | $7.33 | $6.68 | $7.37 |
| Income from Investment Operations | ||||||
| Net investment income (loss)A | .01 | .01 | .07 | .04 | .08 | .05 |
| Net realized and unrealized gain (loss) | (.21) | (.14) | (.12) | 1.24 | .59 | (.68) |
| Total from investment operations | (.20) | (.13) | (.05) | 1.28 | .67 | (.63) |
| Distributions from net investment income | – | (.04) | (.03) | (.05) | (.02) | (.04) |
| Distributions from net realized gain | – | (.04) | (.18) | (.25) | – | (.02) |
| Total distributions | – | (.08) | (.21) | (.30) | (.02) | (.06) |
| Redemption fees added to paid in capitalA,B | – | – | – | – | – | – |
| Net asset value, end of period | $7.64 | $7.84 | $8.05 | $8.31 | $7.33 | $6.68 |
| Total ReturnC,D,E | (2.55)% | (1.62)% | (.56)% | 18.05% | 10.05% | (8.66)% |
| Ratios to Average Net AssetsF,G | ||||||
| Expenses before reductions | 2.30%H | 2.26% | 2.22% | 2.26% | 2.34% | 2.51% |
| Expenses net of fee waivers, if any | 2.20%H | 2.20% | 2.20% | 2.20% | 2.20% | 2.20% |
| Expenses net of all reductions | 2.20%H | 2.19% | 2.20% | 2.18% | 2.17% | 2.17% |
| Net investment income (loss) | .37%H | .11% | .87% | .46% | 1.13% | .69% |
| Supplemental Data | ||||||
| Net assets, end of period (000 omitted) | $93 | $120 | $168 | $192 | $220 | $254 |
| Portfolio turnover rateI | 43%H | 53% | 85% | 89% | 110% | 75% |
A Calculated based on average shares outstanding during the period.
B Amount represents less than $.005 per share.
C Total returns for periods of less than one year are not annualized.
D Total returns would have been lower if certain expenses had not been reduced during the applicable periods shown.
E Total returns do not include the effect of the contingent deferred sales charge.
F Fees and expenses of any underlying Fidelity Central Funds are not included in the Fund's expense ratio. The Fund indirectly bears its proportionate share of the expenses of any underlying Fidelity Central Funds.
G Expense ratios reflect operating expenses of the class. Expenses before reductions do not reflect amounts reimbursed by the investment adviser or reductions from brokerage service arrangements or reductions from other expense offset arrangements and do not represent the amount paid by the class during periods when reimbursements or reductions occur. Expenses net of fee waivers reflect expenses after reimbursement by the investment adviser but prior to reductions from brokerage service arrangements or other expense offset arrangements. Expenses net of all reductions represent the net expenses paid by the class.
H Annualized
I Amount does not include the portfolio activity of any underlying Fidelity Central Funds.
See accompanying notes which are an integral part of the financial statements.
Financial Highlights — Fidelity Total International Equity Fund Class C
| Six months ended (Unaudited) April 30, | Years ended October 31, | |||||
| 2016 | 2015 | 2014 | 2013 | 2012 | 2011 | |
| Selected Per–Share Data | ||||||
| Net asset value, beginning of period | $7.77 | $8.00 | $8.28 | $7.31 | $6.67 | $7.36 |
| Income from Investment Operations | ||||||
| Net investment income (loss)A | .01 | .01 | .07 | .04 | .08 | .05 |
| Net realized and unrealized gain (loss) | (.20) | (.15) | (.12) | 1.25 | .58 | (.69) |
| Total from investment operations | (.19) | (.14) | (.05) | 1.29 | .66 | (.64) |
| Distributions from net investment income | – | (.05) | (.05) | (.08) | (.02) | (.03) |
| Distributions from net realized gain | – | (.04) | (.18) | (.25) | – | (.02) |
| Total distributions | – | (.09) | (.23) | (.32)B | (.02) | (.05) |
| Redemption fees added to paid in capitalA,C | – | – | – | – | – | – |
| Net asset value, end of period | $7.58 | $7.77 | $8.00 | $8.28 | $7.31 | $6.67 |
| Total ReturnD,E,F | (2.45)% | (1.73)% | (.57)% | 18.30% | 9.98% | (8.72)% |
| Ratios to Average Net AssetsG,H | ||||||
| Expenses before reductions | 2.31%I | 2.26% | 2.22% | 2.26% | 2.31% | 2.51% |
| Expenses net of fee waivers, if any | 2.20%I | 2.20% | 2.20% | 2.20% | 2.20% | 2.20% |
| Expenses net of all reductions | 2.20%I | 2.19% | 2.20% | 2.18% | 2.17% | 2.17% |
| Net investment income (loss) | .37%I | .11% | .87% | .46% | 1.13% | .69% |
| Supplemental Data | ||||||
| Net assets, end of period (000 omitted) | $3,077 | $3,311 | $4,028 | $3,584 | $2,737 | $1,396 |
| Portfolio turnover rateJ | 43%I | 53% | 85% | 89% | 110% | 75% |
A Calculated based on average shares outstanding during the period.
B Total distributions of $.32 per share is comprised of distributions from net investment income of $.075 and distributions from net realized gain of $.245 per share.
C Amount represents less than $.005 per share.
D Total returns for periods of less than one year are not annualized.
E Total returns would have been lower if certain expenses had not been reduced during the applicable periods shown.
F Total returns do not include the effect of the contingent deferred sales charge.
G Fees and expenses of any underlying Fidelity Central Funds are not included in the Fund's expense ratio. The Fund indirectly bears its proportionate share of the expenses of any underlying Fidelity Central Funds.
H Expense ratios reflect operating expenses of the class. Expenses before reductions do not reflect amounts reimbursed by the investment adviser or reductions from brokerage service arrangements or reductions from other expense offset arrangements and do not represent the amount paid by the class during periods when reimbursements or reductions occur. Expenses net of fee waivers reflect expenses after reimbursement by the investment adviser but prior to reductions from brokerage service arrangements or other expense offset arrangements. Expenses net of all reductions represent the net expenses paid by the class.
I Annualized
J Amount does not include the portfolio activity of any underlying Fidelity Central Funds.
See accompanying notes which are an integral part of the financial statements.
Financial Highlights — Fidelity Total International Equity Fund
| Six months ended (Unaudited) April 30, | Years ended October 31, | |||||
| 2016 | 2015 | 2014 | 2013 | 2012 | 2011 | |
| Selected Per–Share Data | ||||||
| Net asset value, beginning of period | $7.82 | $8.03 | $8.29 | $7.32 | $6.69 | $7.37 |
| Income from Investment Operations | ||||||
| Net investment income (loss)A | .05 | .10 | .16 | .12 | .15 | .12 |
| Net realized and unrealized gain (loss) | (.20) | (.14) | (.12) | 1.24 | .58 | (.68) |
| Total from investment operations | (.15) | (.04) | .04 | 1.36 | .73 | (.56) |
| Distributions from net investment income | (.10) | (.13) | (.12) | (.15) | (.10) | (.10) |
| Distributions from net realized gain | – | (.04) | (.18) | (.25) | – | (.02) |
| Total distributions | (.10) | (.17) | (.30) | (.39)B | (.10) | (.12) |
| Redemption fees added to paid in capitalA,C | – | – | – | – | – | – |
| Net asset value, end of period | $7.57 | $7.82 | $8.03 | $8.29 | $7.32 | $6.69 |
| Total ReturnD,E | (2.00)% | (.51)% | .55% | 19.48% | 11.03% | (7.70)% |
| Ratios to Average Net AssetsF,G | ||||||
| Expenses before reductions | 1.12%H | 1.07% | 1.04% | 1.09% | 1.16% | 1.42% |
| Expenses net of fee waivers, if any | 1.12%H | 1.07% | 1.04% | 1.09% | 1.16% | 1.20% |
| Expenses net of all reductions | 1.12%H | 1.06% | 1.04% | 1.07% | 1.13% | 1.17% |
| Net investment income (loss) | 1.46%H | 1.24% | 2.03% | 1.57% | 2.16% | 1.69% |
| Supplemental Data | ||||||
| Net assets, end of period (000 omitted) | $284,996 | $307,035 | $324,438 | $324,395 | $281,979 | $131,338 |
| Portfolio turnover rateI | 43%H | 53% | 85% | 89% | 110% | 75% |
A Calculated based on average shares outstanding during the period.
B Total distributions of $.39 per share is comprised of distributions from net investment income of $.148 and distributions from net realized gain of $.245 per share.
C Amount represents less than $.005 per share.
D Total returns for periods of less than one year are not annualized.
E Total returns would have been lower if certain expenses had not been reduced during the applicable periods shown.
F Fees and expenses of any underlying Fidelity Central Funds are not included in the Fund's expense ratio. The Fund indirectly bears its proportionate share of the expenses of any underlying Fidelity Central Funds.
G Expense ratios reflect operating expenses of the class. Expenses before reductions do not reflect amounts reimbursed by the investment adviser or reductions from brokerage service arrangements or reductions from other expense offset arrangements and do not represent the amount paid by the class during periods when reimbursements or reductions occur. Expenses net of fee waivers reflect expenses after reimbursement by the investment adviser but prior to reductions from brokerage service arrangements or other expense offset arrangements. Expenses net of all reductions represent the net expenses paid by the class.
H Annualized
I Amount does not include the portfolio activity of any underlying Fidelity Central Funds.
See accompanying notes which are an integral part of the financial statements.
Financial Highlights — Fidelity Total International Equity Fund Class I
| Six months ended (Unaudited) April 30, | Years ended October 31, | |||||
| 2016 | 2015 | 2014 | 2013 | 2012 | 2011 | |
| Selected Per–Share Data | ||||||
| Net asset value, beginning of period | $7.78 | $7.99 | $8.26 | $7.30 | $6.67 | $7.35 |
| Income from Investment Operations | ||||||
| Net investment income (loss)A | .05 | .09 | .15 | .11 | .14 | .12 |
| Net realized and unrealized gain (loss) | (.20) | (.14) | (.12) | 1.24 | .59 | (.68) |
| Total from investment operations | (.15) | (.05) | .03 | 1.35 | .73 | (.56) |
| Distributions from net investment income | (.09) | (.12) | (.12) | (.15) | (.10) | (.10) |
| Distributions from net realized gain | – | (.04) | (.18) | (.25) | – | (.02) |
| Total distributions | (.09) | (.16) | (.30) | (.39)B | (.10) | (.12) |
| Redemption fees added to paid in capitalA,C | – | – | – | – | – | – |
| Net asset value, end of period | $7.54 | $7.78 | $7.99 | $8.26 | $7.30 | $6.67 |
| Total ReturnD,E | (1.99)% | (.64)% | .37% | 19.40% | 11.06% | (7.72)% |
| Ratios to Average Net AssetsF,G | ||||||
| Expenses before reductions | 1.24%H | 1.17% | 1.15% | 1.21% | 1.27% | 1.48% |
| Expenses net of fee waivers, if any | 1.20%H | 1.17% | 1.15% | 1.20% | 1.20% | 1.20% |
| Expenses net of all reductions | 1.20%H | 1.16% | 1.15% | 1.18% | 1.17% | 1.17% |
| Net investment income (loss) | 1.37%H | 1.14% | 1.91% | 1.46% | 2.13% | 1.69% |
| Supplemental Data | ||||||
| Net assets, end of period (000 omitted) | $2,964 | $2,602 | $2,240 | $2,372 | $1,514 | $197 |
| Portfolio turnover rateI | 43%H | 53% | 85% | 89% | 110% | 75% |
A Calculated based on average shares outstanding during the period.
B Total distributions of $.39 per share is comprised of distributions from net investment income of $.148 and distributions from net realized gain of $.245 per share.
C Amount represents less than $.005 per share.
D Total returns for periods of less than one year are not annualized.
E Total returns would have been lower if certain expenses had not been reduced during the applicable periods shown.
F Fees and expenses of any underlying Fidelity Central Funds are not included in the Fund's expense ratio. The Fund indirectly bears its proportionate share of the expenses of any underlying Fidelity Central Funds.
G Expense ratios reflect operating expenses of the class. Expenses before reductions do not reflect amounts reimbursed by the investment adviser or reductions from brokerage service arrangements or reductions from other expense offset arrangements and do not represent the amount paid by the class during periods when reimbursements or reductions occur. Expenses net of fee waivers reflect expenses after reimbursement by the investment adviser but prior to reductions from brokerage service arrangements or other expense offset arrangements. Expenses net of all reductions represent the net expenses paid by the class.
H Annualized
I Amount does not include the portfolio activity of any underlying Fidelity Central Funds.
See accompanying notes which are an integral part of the financial statements.
Notes to Financial Statements (Unaudited)
For the period ended April 30, 2016
1. Organization.
Fidelity Total International Equity Fund (the Fund) is a fund of Fidelity Investment Trust (the Trust) and is authorized to issue an unlimited number of shares. The Trust is registered under the Investment Company Act of 1940, as amended (the 1940 Act), as an open-end management investment company organized as a Massachusetts business trust. The Fund offers Class A, Class T, Class C, Total International Equity and Class I shares, each of which, along with Class B shares, has equal rights as to assets and voting privileges. Class B shares are closed to new accounts and additional purchases, except for exchanges and reinvestments. Each class has exclusive voting rights with respect to matters that affect that class. Class B shares will automatically convert to Class A shares after a maximum holding period of seven years from the initial date of purchase. The Fund's investments in emerging markets can be subject to social, economic, regulatory, and political uncertainties and can be extremely volatile.
During the period, the Board of Trustees approved the conversion of all existing Class B shares into Class A shares, effective on or about July 1, 2016, regardless of the length of times shares have been held.
2. Investments in Fidelity Central Funds.
The Fund invests in Fidelity Central Funds, which are open-end investment companies generally available only to other investment companies and accounts managed by the investment adviser and its affiliates. The Fund's Schedule of Investments lists each of the Fidelity Central Funds held as of period end, if any, as an investment of the Fund, but does not include the underlying holdings of each Fidelity Central Fund. As an Investing Fund, the Fund indirectly bears its proportionate share of the expenses of the underlying Fidelity Central Funds.
The Money Market Central Funds seek preservation of capital and current income and are managed by Fidelity Investments Money Management, Inc. (FIMM), an affiliate of the investment adviser. Annualized expenses of the Money Market Central Funds as of their most recent shareholder report date are less than .005%.
A complete unaudited list of holdings for each Fidelity Central Fund is available upon request or at the Securities and Exchange Commission (the SEC) website at www.sec.gov. In addition, the financial statements of the Fidelity Central Funds are available on the SEC website or upon request.
3. Significant Accounting Policies.
The financial statements have been prepared in conformity with accounting principles generally accepted in the United States of America (GAAP), which require management to make certain estimates and assumptions at the date of the financial statements. Actual results could differ from those estimates. Subsequent events, if any, through the date that the financial statements were issued have been evaluated in the preparation of the financial statements. The following summarizes the significant accounting policies of the Fund:
Investment Valuation. Investments are valued as of 4:00 p.m. Eastern time on the last calendar day of the period. The Board of Trustees (the Board) has delegated the day to day responsibility for the valuation of the Fund's investments to the Fidelity Management & Research Company (FMR) Fair Value Committee (the Committee). In accordance with valuation policies and procedures approved by the Board, the Fund attempts to obtain prices from one or more third party pricing vendors or brokers to value its investments. When current market prices, quotations or currency exchange rates are not readily available or reliable, investments will be fair valued in good faith by the Committee, in accordance with procedures adopted by the Board. Factors used in determining fair value vary by investment type and may include market or investment specific events. The frequency with which these procedures are used cannot be predicted and they may be utilized to a significant extent. The Committee oversees the Fund's valuation policies and procedures and reports to the Board on the Committee's activities and fair value determinations. The Board monitors the appropriateness of the procedures used in valuing the Fund's investments and ratifies the fair value determinations of the Committee.
The Fund categorizes the inputs to valuation techniques used to value its investments into a disclosure hierarchy consisting of three levels as shown below:
- Level 1 – quoted prices in active markets for identical investments
- Level 2 – other significant observable inputs (including quoted prices for similar investments, interest rates, prepayment speeds, etc.)
- Level 3 – unobservable inputs (including the Fund's own assumptions based on the best information available)
Valuation techniques used to value the Fund's investments by major category are as follows:
Equity securities, including restricted securities, for which market quotations are readily available, are valued at the last reported sale price or official closing price as reported by a third party pricing vendor on the primary market or exchange on which they are traded and are categorized as Level 1 in the hierarchy. In the event there were no sales during the day or closing prices are not available, securities are valued at the last quoted bid price or may be valued using the last available price and are generally categorized as Level 2 in the hierarchy. For foreign equity securities, when market or security specific events arise, comparisons to the valuation of American Depositary Receipts (ADRs), futures contracts, Exchange-Traded Funds (ETFs) and certain indexes as well as quoted prices for similar securities may be used and would be categorized as Level 2 in the hierarchy. Utilizing these techniques may result in transfers between Level 1 and Level 2. For equity securities, including restricted securities, where observable inputs are limited, assumptions about market activity and risk are used and these securities may be categorized as Level 3 in the hierarchy.
Investments in open-end mutual funds, including the Fidelity Central Funds, are valued at their closing net asset value (NAV) each business day and are categorized as Level 1 in the hierarchy.
Changes in valuation techniques may result in transfers in or out of an assigned level within the disclosure hierarchy. The aggregate value of investments by input level as of April 30, 2016, including information on transfers between Levels 1 and 2 is included at the end of the Fund's Schedule of Investments.
Foreign Currency. The Fund may use foreign currency contracts to facilitate transactions in foreign-denominated securities. Gains and losses from these transactions may arise from changes in the value of the foreign currency or if the counterparties do not perform under the contracts' terms.
Foreign-denominated assets, including investment securities, and liabilities are translated into U.S. dollars at the exchange rates at period end. Purchases and sales of investment securities, income and dividends received and expenses denominated in foreign currencies are translated into U.S. dollars at the exchange rate in effect on the transaction date.
The effects of exchange rate fluctuations on investments are included with the net realized and unrealized gain (loss) on investment securities. Other foreign currency transactions resulting in realized and unrealized gain (loss) are disclosed separately.
Investment Transactions and Income. For financial reporting purposes, the Fund's investment holdings and NAV include trades executed through the end of the last business day of the period. The NAV per share for processing shareholder transactions is calculated as of the close of business of the New York Stock Exchange (NYSE), normally 4:00 p.m. Eastern time and includes trades executed through the end of the prior business day. Gains and losses on securities sold are determined on the basis of identified cost. Dividend income is recorded on the ex-dividend date, except for certain dividends from foreign securities where the ex-dividend date may have passed, which are recorded as soon as the Fund is informed of the ex-dividend date. Non-cash dividends included in dividend income, if any, are recorded at the fair market value of the securities received. Income and capital gain distributions from Fidelity Central Funds, if any, are recorded on the ex-dividend date. Distributions received on securities that represent a return of capital or capital gain are recorded as a reduction of cost of investments and/or as a realized gain. Subsequent to ex-dividend date the Fund determines the components of these distributions, based upon receipt of tax filings or other correspondence relating to the underlying investment. Interest income is accrued as earned and includes coupon interest and amortization of premium and accretion of discount on debt securities as applicable. Investment income is recorded net of foreign taxes withheld where recovery of such taxes is uncertain.
Class Allocations and Expenses. Investment income, realized and unrealized capital gains and losses, common expenses of the Fund, and certain fund-level expense reductions, if any, are allocated daily on a pro-rata basis to each class based on the relative net assets of each class to the total net assets of the Fund. Each class differs with respect to transfer agent and distribution and service plan fees incurred. Certain expense reductions may also differ by class. For the reporting period, the allocated portion of income and expenses to each class as a percent of its average net assets may vary due to the timing of recording these transactions in relation to fluctuating net assets of the classes. Expenses directly attributable to a fund are charged to that fund. Expenses attributable to more than one fund are allocated among the respective funds on the basis of relative net assets or other appropriate methods. Expense estimates are accrued in the period to which they relate and adjustments are made when actual amounts are known.
Income Tax Information and Distributions to Shareholders. Each year, the Fund intends to qualify as a regulated investment company under Subchapter M of the Internal Revenue Code, including distributing substantially all of its taxable income and realized gains. As a result, no provision for U.S. Federal income taxes is required. The Fund files a U.S. federal tax return, in addition to state and local tax returns as required. The Fund's federal income tax returns are subject to examination by the Internal Revenue Service (IRS) for a period of three fiscal years after they are filed. State and local tax returns may be subject to examination for an additional fiscal year depending on the jurisdiction. Foreign taxes are provided for based on the Fund's understanding of the tax rules and rates that exist in the foreign markets in which it invests. The Fund is subject to a tax imposed on capital gains by certain countries in which it invests.
Distributions are declared and recorded on the ex-dividend date. Income dividends and capital gain distributions are declared separately for each class. Income and capital gain distributions are determined in accordance with income tax regulations, which may differ from GAAP.
Capital accounts within the financial statements are adjusted for permanent book-tax differences. These adjustments have no impact on net assets or the results of operations. Capital accounts are not adjusted for temporary book-tax differences which will reverse in a subsequent period.
Book-tax differences are primarily due to foreign currency transactions, partnerships, certain foreign taxes, passive foreign investment companies (PFIC), capital loss carryforwards and losses deferred due to wash sales.
The federal tax cost of investment securities and unrealized appreciation (depreciation) as of period end were as follows:
| Gross unrealized appreciation | $ 56,805,584 |
| Gross unrealized depreciation | (15,433,463) |
| Net unrealized appreciation (depreciation) on securities | $41,372,121 |
| Tax cost | $274,390,114 |
Capital loss carryforwards are only available to offset future capital gains of the Fund to the extent provided by regulations and may be limited. Under the Regulated Investment Company Modernization Act of 2010 (the Act), the Fund is permitted to carry forward capital losses incurred in taxable years beginning after December 22, 2010 for an unlimited period and such capital losses are required to be used prior to any losses that expire. The capital loss carryforward information presented below, including any applicable limitation, is estimated as of prior fiscal period end and is subject to adjustment.
| Fiscal year of expiration | |
| 2017 | $(13,607,298) |
| 2019 | (8,855,997) |
| Total with expiration | $(22,463,295) |
| No expiration | |
| Short-term | (5,613,592) |
| Total capital loss carryforward | $(28,076,887) |
Due to large subscriptions in a prior period, $22,463,295 of capital losses that will be available to offset future capital gains of the Fund will be limited to approximately $4,535,766 per year.
Short-Term Trading (Redemption) Fees. Shares held by investors in the Fund less than 30 days may have been subject to a redemption fee equal to 1.00% of the NAV of shares redeemed. All redemption fees, which reduce the proceeds of the shareholder redemption, are retained by the Fund and accounted for as an addition to paid in capital.
Delayed Delivery Transactions and When-Issued Securities. During the period, the Fund transacted in securities on a delayed delivery or when-issued basis. Payment and delivery may take place after the customary settlement period for that security. The price of the underlying securities and the date when the securities will be delivered and paid for are fixed at the time the transaction is negotiated. The securities purchased on a delayed delivery or when-issued basis are identified as such in the Fund's Schedule of Investments. With respect to purchase commitments, the Fund identifies securities as segregated in its records with a value at least equal to the amount of the commitment. Losses may arise due to changes in the value of the underlying securities or if the counterparty does not perform under the contract's terms, or if the issuer does not issue the securities due to political, economic, or other factors.
4. Purchases and Sales of Investments.
Purchases and sales of securities, other than short-term securities, aggregated $67,742,727 and $81,527,820, respectively.
5. Fees and Other Transactions with Affiliates.
Management Fee. Fidelity Management & Research Company (the investment adviser) and its affiliates provide the Fund with investment management related services for which the Fund pays a monthly management fee. The management fee is the sum of an individual fund fee rate that is based on an annual rate of .45% of the Fund's average net assets and an annualized group fee rate that averaged .25% during the period. The group fee rate is based upon the average net assets of all the mutual funds advised by the investment adviser, including any mutual funds previously advised by the investment adviser that are currently advised by Fidelity SelectCo, LLC, an affiliate of the investment adviser. The group fee rate decreases as assets under management increase and increases as assets under management decrease. In addition, the management fee is subject to a performance adjustment (up to a maximum of +/- .20% of the Fund's average net assets over a 36 month performance period). The upward or downward adjustment to the management fee is based on the relative investment performance of Total International Equity as compared to its benchmark index, the MSCI All Country World ex USA Index, over the same 36 month performance period. For the reporting period, the total annualized management fee rate, including the performance adjustment, was .82% of the Fund's average net assets. The performance adjustment included in the management fee rate may be higher or lower than the maximum performance adjustment rate due to the difference between the average net assets for the reporting and performance periods.
Distribution and Service Plan Fees. In accordance with Rule 12b-1 of the 1940 Act, the Fund has adopted separate Distribution and Service Plans for each class of shares. Certain classes pay Fidelity Distributors Corporation (FDC), an affiliate of the investment adviser, separate Distribution and Service Fees, each of which is based on an annual percentage of each class' average net assets. In addition, FDC may pay financial intermediaries for selling shares of the Fund and providing shareholder support services. For the period, the Distribution and Service Fee rates, total fees and amounts retained by FDC were as follows:
| Distribution Fee | Service Fee | Total Fees | Retained by FDC | |
| Class A | -% | .25% | $10,969 | $810 |
| Class T | .25% | .25% | 32,951 | 57 |
| Class B | .75% | .25% | 515 | 386 |
| Class C | .75% | .25% | 15,471 | 2,767 |
| $59,906 | $4,020 |
Sales Load. FDC may receive a front-end sales charge of up to 5.75% for selling Class A shares and 3.50% for selling Class T shares, some of which is paid to financial intermediaries for selling shares of the Fund. Depending on the holding period, FDC may receive contingent deferred sales charges levied on Class A, Class T, Class B, and Class C redemptions. The deferred sales charges range from 5.00% to 1.00% for Class B shares, 1.00% for Class C shares, 1.00% for certain purchases of Class A shares and .25% for certain purchases of Class T shares.
For the period, sales charge amounts retained by FDC were as follows:
| Retained by FDC | |
| Class A | $1,356 |
| Class T | 488 |
| Class B(a) | – |
| Class C(a) | 295 |
| $2,139 |
(a) When Class B and Class C shares are initially sold, FDC pays commissions from its own resources to financial intermediaries through which the sales are made.
Transfer Agent Fees. Fidelity Investments Institutional Operations Company, Inc., (FIIOC), an affiliate of the investment adviser, is the transfer, dividend disbursing and shareholder servicing agent for each class of the Fund. FIIOC receives account fees and asset-based fees that vary according to the account size and type of account of the shareholders of the respective classes of the Fund. FIIOC pays for typesetting, printing and mailing of shareholder reports, except proxy statements.
For the period, transfer agent fees for each class were as follows:
| Amount | % of Class-Level Average Net Assets(a) | |
| Class A | $12,141 | .28 |
| Class T | 16,142 | .24 |
| Class B | 152 | .30 |
| Class C | 4,828 | .31 |
| Total International Equity | 168,031 | .12 |
| Class I | 3,133 | .24 |
| $204,427 |
(a) Annualized
Accounting and Security Lending Fees. Fidelity Service Company, Inc. (FSC), an affiliate of the investment adviser, maintains the Fund's accounting records. The accounting fee is based on the level of average net assets for each month. Under a separate contract, FSC administers the security lending program. The security lending fee is based on the number and duration of lending transactions.
Brokerage Commissions. The Fund placed a portion of its portfolio transactions with brokerage firms which are affiliates of the investment adviser. Brokerage commissions are included in net realized gain (loss) and change in net unrealized appreciation (depreciation) in the Statement of Operations. The commissions paid to these affiliated firms were $330 for the period.
Interfund Trades. The Fund may purchase from or sell securities to other Fidelity Funds under procedures adopted by the Board. The procedures have been designed to ensure these interfund trades are executed in accordance with Rule 17a-7 of the 1940 Act. Interfund trades are included within the respective purchases and sales amounts shown in the Purchases and Sales of Investments note.
6. Committed Line of Credit.
The Fund participates with other funds managed by the investment adviser or an affiliate in a $4.25 billion credit facility (the "line of credit") to be utilized for temporary or emergency purposes to fund shareholder redemptions or for other short-term liquidity purposes. The Fund has agreed to pay commitment fees on its pro-rata portion of the line of credit, which amounted to $282 and is reflected in Miscellaneous expenses on the Statement of Operations. During the period, the Fund did not borrow on this line of credit.
7. Security Lending.
The Fund lends portfolio securities through a lending agent from time to time in order to earn additional income. For equity securities, a lending agent is used and may loan securities to certain qualified borrowers, including Fidelity Capital Markets (FCM), a broker-dealer affiliated with the Fund. On the settlement date of the loan, the Fund receives collateral (in the form of U.S. Treasury obligations, letters of credit and/or cash) against the loaned securities and maintains collateral in an amount not less than 100% of the market value of the loaned securities during the period of the loan. The market value of the loaned securities is determined at the close of business of the Fund and any additional required collateral is delivered to the Fund on the next business day. The Fund or borrower may terminate the loan at any time, and if the borrower defaults on its obligation to return the securities loaned because of insolvency or other reasons, the Fund may apply collateral received from the borrower against the obligation. The Fund may experience delays and costs in recovering the securities loaned. Any cash collateral received is invested in the Fidelity Securities Lending Cash Central Fund. The value of loaned securities and cash collateral at period end are disclosed on the Fund's Statement of Assets and Liabilities. Security lending income represents the income earned on investing cash collateral, less rebates paid to borrowers and any lending agent fees associated with the loan, plus any premium payments received for lending certain types of securities. Security lending income is presented in the Statement of Operations as a component of income from Fidelity Central Funds. Total security lending income during the period amounted to $41,244. During the period, there were no securities loaned to FCM.
8. Expense Reductions.
The investment adviser contractually agreed to reimburse each class to the extent annual operating expenses exceeded certain levels of average net assets as noted in the table below. This reimbursement will remain in place through December 31, 2016. Some expenses, for example interest expense, including commitment fees, are excluded from this reimbursement.
The following classes were in reimbursement during the period:
| Expense Limitations | Reimbursement | |
| Class A | 1.45% | $3,471 |
| Class T | 1.70% | 3,118 |
| Class B | 2.20% | 49 |
| Class C | 2.20% | 1,763 |
| Class I | 1.20% | 563 |
| $8,964 |
Commissions paid to certain brokers with whom the investment adviser, or its affiliates, places trades on behalf of the Fund include an amount in addition to trade execution, which may be rebated back to the Fund to offset certain expenses. This amount totaled $3,442 for the period.
In addition, during the period the investment adviser reimbursed and/or waived a portion of fund-level operating expenses in the amount of $1,175.
9. Distributions to Shareholders.
Distributions to shareholders of each class were as follows:
| Six months ended April 30, 2016 | Year ended October 31, 2015 | |
| From net investment income | ||
| Class A | $72,361 | $113,499 |
| Class T | 77,358 | 118,041 |
| Class B | – | 852 |
| Class C | – | 26,493 |
| Total International Equity | 3,691,251 | 5,189,901 |
| Class I | 28,369 | 33,683 |
| Total | $3,869,339 | $5,482,469 |
| From net realized gain | ||
| Class A | $– | $45,400 |
| Class T | – | 52,463 |
| Class B | – | 832 |
| Class C | – | 19,994 |
| Total International Equity | – | 1,596,893 |
| Class I | – | 11,228 |
| Total | $– | $1,726,810 |
10. Share Transactions.
Share transactions for each class were as follows and may contain automatic conversions between classes or exchanges between affiliated funds:
| Shares | Shares | Dollars | Dollars | |
| Six months ended April 30, 2016 | Year ended October 31, 2015 | Six months ended April 30, 2016 | Year ended October 31, 2015 | |
| Class A | ||||
| Shares sold | 125,145 | 302,437 | $923,609 | $2,413,258 |
| Reinvestment of distributions | 9,322 | 20,115 | 71,782 | 158,306 |
| Shares redeemed | (145,056) | (290,995) | (1,062,034) | (2,277,557) |
| Net increase (decrease) | (10,589) | 31,557 | $(66,643) | $294,007 |
| Class T | ||||
| Shares sold | 242,570 | 824,018 | $1,805,986 | $6,637,966 |
| Reinvestment of distributions | 9,988 | 21,537 | 77,308 | 170,355 |
| Shares redeemed | (245,478) | (337,655) | (1,795,924) | (2,691,540) |
| Net increase (decrease) | 7,080 | 507,900 | $87,370 | $4,116,781 |
| Class B | ||||
| Shares sold | 1,079 | 2,293 | $7,667 | $19,363 |
| Reinvestment of distributions | – | 210 | – | 1,675 |
| Shares redeemed | (4,239) | (7,999) | (31,696) | (62,934) |
| Net increase (decrease) | (3,160) | (5,496) | $(24,029) | $(41,896) |
| Class C | ||||
| Shares sold | 40,022 | 142,460 | $294,781 | $1,136,553 |
| Reinvestment of distributions | – | 4,767 | – | 37,661 |
| Shares redeemed | (60,109) | (224,769) | (446,353) | (1,823,746) |
| Net increase (decrease) | (20,087) | (77,542) | $(151,572) | $(649,532) |
| Total International Equity | ||||
| Shares sold | 2,536,155 | 6,834,390 | $18,902,576 | $54,586,662 |
| Reinvestment of distributions | 471,692 | 851,193 | 3,632,026 | 6,698,889 |
| Shares redeemed | (4,642,011) | (8,793,992) | (33,862,381) | (70,164,751) |
| Net increase (decrease) | (1,634,164) | (1,108,409) | $(11,327,779) | $(8,879,200) |
| Class I | ||||
| Shares sold | 102,309 | 149,022 | $761,726 | $1,222,878 |
| Reinvestment of distributions | 3,671 | 5,728 | 28,160 | 44,910 |
| Shares redeemed | (47,313) | (100,501) | (348,716) | (786,772) |
| Net increase (decrease) | 58,667 | 54,249 | $441,170 | $481,016 |
11. Other.
The Fund's organizational documents provide former and current trustees and officers with a limited indemnification against liabilities arising in connection with the performance of their duties to the Fund. In the normal course of business, the Fund may also enter into contracts that provide general indemnifications. The Fund's maximum exposure under these arrangements is unknown as this would be dependent on future claims that may be made against the Fund. The risk of material loss from such claims is considered remote.
At the end of the period, a shareholder of record owned approximately 71% of the total outstanding shares of the Fund.
Shareholder Expense Example
As a shareholder of the Fund, you incur two types of costs: (1) transaction costs, including sales charges (loads) on purchase payments or redemption proceeds, redemption fees and (2) ongoing costs, including management fees, distribution and/or service (12b-1) fees and other Fund expenses. This Example is intended to help you understand your ongoing costs (in dollars) of investing in the Fund and to compare these costs with the ongoing costs of investing in other mutual funds.
The Example is based on an investment of $1,000 invested at the beginning of the period and held for the entire period (November 1, 2015 to April 30, 2016).
Actual Expenses
The first line of the accompanying table for each class of the Fund provides information about actual account values and actual expenses. You may use the information in this line, together with the amount you invested, to estimate the expenses that you paid over the period. Simply divide your account value by $1,000.00 (for example, an $8,600 account value divided by $1,000.00 = 8.6), then multiply the result by the number in the first line for a class of the Fund under the heading entitled "Expenses Paid During Period" to estimate the expenses you paid on your account during this period. A small balance maintenance fee of $12.00 that is charged once a year may apply for certain accounts with a value of less than $2,000. This fee is not included in the table below. If it was, the estimate of expenses you paid during the period would be higher, and your ending account value lower, by this amount. In addition, the Fund, as a shareholder in the underlying Fidelity Central Funds, will indirectly bear its pro-rata share of the fees and expenses incurred by the underlying Fidelity Central Funds. These fees and expenses are not included in the Fund's annualized expense ratio used to calculate the expense estimate in the table below.
Hypothetical Example for Comparison Purposes
The second line of the accompanying table for each class of the Fund provides information about hypothetical account values and hypothetical expenses based on a Class' actual expense ratio and an assumed rate of return of 5% per year before expenses, which is not the Class' actual return. The hypothetical account values and expenses may not be used to estimate the actual ending account balance or expenses you paid for the period. You may use this information to compare the ongoing costs of investing in the Fund and other funds. To do so, compare this 5% hypothetical example with the 5% hypothetical examples that appear in the shareholder reports of the other funds. A small balance maintenance fee of $12.00 that is charged once a year may apply for certain accounts with a value of less than $2,000. This fee is not included in the table below. If it was, the estimate of expenses you paid during the period would be higher, and your ending account value lower, by this amount. In addition, the Fund, as a shareholder in the underlying Fidelity Central Funds, will indirectly bear its pro-rata share of the fees and expenses incurred by the underlying Fidelity Central Funds. These fees and expenses are not included in the Fund's annualized expense ratio used to calculate the expense estimate in the table below.
Please note that the expenses shown in the table are meant to highlight your ongoing costs only and do not reflect any transaction costs. Therefore, the second line of the table is useful in comparing ongoing costs only, and will not help you determine the relative total costs of owning different funds. In addition, if these transactional costs were included, your costs would have been higher.
| Annualized Expense Ratio-A | Beginning Account Value November 1, 2015 | Ending Account Value April 30, 2016 | Expenses Paid During Period-B November 1, 2015 to April 30, 2016 | |
| Class A | 1.45% | |||
| Actual | $1,000.00 | $978.20 | $7.13 | |
| Hypothetical-C | $1,000.00 | $1,017.65 | $7.27 | |
| Class T | 1.70% | |||
| Actual | $1,000.00 | $978.50 | $8.36 | |
| Hypothetical-C | $1,000.00 | $1,016.41 | $8.52 | |
| Class B | 2.20% | |||
| Actual | $1,000.00 | $974.50 | $10.80 | |
| Hypothetical-C | $1,000.00 | $1,013.92 | $11.02 | |
| Class C | 2.20% | |||
| Actual | $1,000.00 | $975.50 | $10.81 | |
| Hypothetical-C | $1,000.00 | $1,013.92 | $11.02 | |
| Total International Equity | 1.12% | |||
| Actual | $1,000.00 | $980.00 | $5.51 | |
| Hypothetical-C | $1,000.00 | $1,019.29 | $5.62 | |
| Class I | 1.20% | |||
| Actual | $1,000.00 | $980.10 | $5.91 | |
| Hypothetical-C | $1,000.00 | $1,018.90 | $6.02 |
A Annualized expense ratio reflects expenses net of applicable fee waivers.
B Expenses are equal to each Class' annualized expense ratio, multiplied by the average account value over the period, multiplied by 182/366 (to reflect the one-half year period).
C 5% return per year before expenses
![]()
ATIE-SANN-0616
1.853367.108
Item 2.
Code of Ethics
Not applicable.
Item 3.
Audit Committee Financial Expert
Not applicable.
Item 4.
Principal Accountant Fees and Services
Not applicable.
Item 5.
Audit Committee of Listed Registrants
Not applicable.
Item 6.
Investments
(a)
Not applicable.
(b)
Not applicable
Item 7.
Disclosure of Proxy Voting Policies and Procedures for Closed-End Management Investment Companies
Not applicable.
Item 8.
Portfolio Managers of Closed-End Management Investment Companies
Not applicable.
Item 9.
Purchase of Equity Securities by Closed-End Management Investment Company and Affiliated Purchasers
Not applicable.
Item 10.
Submission of Matters to a Vote of Security Holders
There were no material changes to the procedures by which shareholders may recommend nominees to the Fidelity Investment Trust’s Board of Trustees.
Item 11.
Controls and Procedures
(a)(i) The President and Treasurer and the Chief Financial Officer have concluded that the Fidelity Investment Trust’s (the “Trust”) disclosure controls and procedures (as defined in Rule 30a-3(c) under the Investment Company Act) provide reasonable assurances that material information relating to the Trust is made known to them by the appropriate persons, based on their evaluation of these controls and procedures as of a date within 90 days of the filing date of this report.
(a)(ii) There was no change in the Trust’s internal control over financial reporting (as defined in Rule 30a-3(d) under the Investment Company Act) that occurred during the second fiscal quarter of the period covered by this report that has materially affected, or is reasonably likely to materially affect, the Trust’s internal control over financial reporting.
Item 12.
Exhibits
(a) | (1) | Not applicable. |
(a) | (2) | Certification pursuant to Rule 30a-2(a) under the Investment Company Act of 1940 (17 CFR 270.30a-2(a)) is filed and attached hereto as Exhibit 99.CERT. |
(a) | (3) | Not applicable. |
(b) | Certification pursuant to Rule 30a-2(b) under the Investment Company Act of 1940 (17 CFR 270.30a-2(b)) is furnished and attached hereto as Exhibit 99.906CERT. |
SIGNATURES
Pursuant to the requirements of the Securities Exchange Act of 1934 and the Investment Company Act of 1940, the registrant has duly caused this report to be signed on its behalf by the undersigned, thereunto duly authorized.
Fidelity Investment Trust
By: | /s/Stacie M. Smith |
Stacie M. Smith | |
President and Treasurer | |
Date: | June 24, 2016 |
Pursuant to the requirements of the Securities Exchange Act of 1934 and the Investment Company Act of 1940, this report has been signed below by the following persons on behalf of the registrant and in the capacities and on the dates indicated.
By: | /s/Stacie M. Smith |
Stacie M. Smith | |
President and Treasurer | |
Date: | June 24, 2016 |
By: | /s/Howard J. Galligan III |
Howard J. Galligan III | |
Chief Financial Officer | |
Date: | June 24, 2016 |