UNITED STATES
SECURITIES AND EXCHANGE COMMISSION
Washington, D.C. 20549
FORM N-CSR
CERTIFIED SHAREHOLDER REPORT OF REGISTERED
MANAGEMENT INVESTMENT COMPANIES
Investment Company Act file number 811-4008
Fidelity Investment Trust
(Exact name of registrant as specified in charter)
245 Summer St., Boston, MA 02210
(Address of principal executive offices) (Zip code)
Marc Bryant, Secretary
245 Summer St.
Boston, Massachusetts 02210
(Name and address of agent for service)
Registrant's telephone number, including area code:
617-563-7000
Date of fiscal year end: | October 31 |
Date of reporting period: | April 30, 2018 |
Item 1.
Reports to Stockholders
Fidelity Advisor® International Small Cap Fund - Semi-Annual Report April 30, 2018 Class A, Class M, Class C and Class I are classes of Fidelity® International Small Cap Fund |
 |
Contents
To view a fund's proxy voting guidelines and proxy voting record for the 12-month period ended June 30, visit http://www.fidelity.com/proxyvotingresults or visit the Securities and Exchange Commission's (SEC) web site at http://www.sec.gov.
You may also call 1-877-208-0098 to request a free copy of the proxy voting guidelines.
Standard & Poor's, S&P and S&P 500 are registered service marks of The McGraw-Hill Companies, Inc. and have been licensed for use by Fidelity Distributors Corporation.
Other third-party marks appearing herein are the property of their respective owners.
All other marks appearing herein are registered or unregistered trademarks or service marks of FMR LLC or an affiliated company. © 2018 FMR LLC. All rights reserved.
This report and the financial statements contained herein are submitted for the general information of the shareholders of the Fund. This report is not authorized for distribution to prospective investors in the Fund unless preceded or accompanied by an effective prospectus.
A fund files its complete schedule of portfolio holdings with the SEC for the first and third quarters of each fiscal year on Form N-Q. Forms N-Q are available on the SEC’s web site at http://www.sec.gov. A fund's Forms N-Q may be reviewed and copied at the SEC’s Public Reference Room in Washington, DC. Information regarding the operation of the SEC's Public Reference Room may be obtained by calling 1-800-SEC-0330.
For a complete list of a fund's portfolio holdings, view the most recent holdings listing, semiannual report, or annual report on Fidelity's web site at http://www.fidelity.com, http://www.institutional.fidelity.com, or http://www.401k.com, as applicable.
NOT FDIC INSURED •MAY LOSE VALUE •NO BANK GUARANTEE
Neither the Fund nor Fidelity Distributors Corporation is a bank.
Investment Summary (Unaudited)
Geographic Diversification (% of fund's net assets)
| As of April 30, 2018 | ||
| Japan | 20.9% | |
| United Kingdom | 16.6% | |
| Canada | 6.1% | |
| United States of America* | 5.7% | |
| Australia | 5.4% | |
| Taiwan | 4.2% | |
| France | 3.6% | |
| Cayman Islands | 3.3% | |
| Netherlands | 2.8% | |
| Other | 31.4% | |
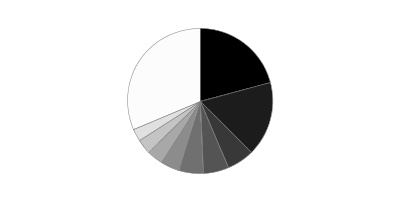
* Includes Short-Term investments and Net Other Assets (Liabilities).
Percentages are based on country or territory of incorporation and are adjusted for the effect of futures contracts, if applicable.
Asset Allocation as of April 30, 2018
| % of fund's net assets | |
| Stocks | 94.3 |
| Short-Term Investments and Net Other Assets (Liabilities) | 5.7 |
Top Ten Stocks as of April 30, 2018
| % of fund's net assets | |
| LivaNova PLC (United Kingdom, Health Care Equipment & Supplies) | 1.1 |
| S Foods, Inc. (Japan, Food Products) | 1.1 |
| Cineworld Group PLC (United Kingdom, Media) | 1.0 |
| PALTAC Corp. (Japan, Distributors) | 0.9 |
| Inghams Group Ltd. (Australia, Food Products) | 0.9 |
| Ship Healthcare Holdings, Inc. (Japan, Health Care Providers & Services) | 0.9 |
| Yamada Consulting Group Co. Ltd. (Japan, Professional Services) | 0.9 |
| JSR Corp. (Japan, Chemicals) | 0.8 |
| Paramount Bed Holdings Co. Ltd. (Japan, Health Care Equipment & Supplies) | 0.8 |
| Iida Group Holdings Co. Ltd. (Japan, Household Durables) | 0.8 |
| 9.2 |
Top Market Sectors as of April 30, 2018
| % of fund's net assets | |
| Industrials | 18.5 |
| Consumer Discretionary | 16.1 |
| Financials | 13.2 |
| Information Technology | 9.8 |
| Consumer Staples | 9.4 |
| Materials | 9.1 |
| Health Care | 7.8 |
| Real Estate | 5.4 |
| Energy | 4.2 |
| Utilities | 0.8 |
Schedule of Investments April 30, 2018 (Unaudited)
Showing Percentage of Net Assets
| Common Stocks - 93.7% | |||
| Shares | Value | ||
| Australia - 5.4% | |||
| Aub Group Ltd. | 842,699 | $8,910,490 | |
| Austal Ltd. | 3,090,176 | 4,100,048 | |
| Challenger Ltd. | 733,703 | 5,931,965 | |
| GUD Holdings Ltd. | 1,620,164 | 15,392,023 | |
| Hansen Technologies Ltd. | 1,184,292 | 3,816,380 | |
| Imdex Ltd. (a) | 14,676,164 | 13,685,594 | |
| Inghams Group Ltd. (b) | 7,044,815 | 19,877,203 | |
| Nanosonics Ltd. (a)(b) | 4,155,779 | 7,483,669 | |
| Pact Group Holdings Ltd. (c) | 3,120,432 | 13,286,704 | |
| Reckon Ltd. (a) | 5,088,250 | 4,892,901 | |
| Servcorp Ltd. | 2,706,893 | 9,725,561 | |
| Sigma Healthcare Ltd. | 14,870,654 | 8,640,981 | |
| SomnoMed Ltd. (a)(b) | 2,282,021 | 4,974,448 | |
| TOTAL AUSTRALIA | 120,717,967 | ||
| Austria - 1.8% | |||
| Andritz AG | 209,932 | 11,296,579 | |
| IMMOFINANZ Immobilien Anlagen AG | 5,519,743 | 14,491,105 | |
| Wienerberger AG | 576,900 | 14,560,287 | |
| TOTAL AUSTRIA | 40,347,971 | ||
| Belgium - 0.6% | |||
| Barco NV | 108,083 | 13,991,855 | |
| Bermuda - 1.8% | |||
| BW Offshore Ltd. (a) | 1,659,938 | 9,083,589 | |
| China Resource Gas Group Ltd. | 3,290,000 | 12,099,326 | |
| Hiscox Ltd. | 618,899 | 12,686,850 | |
| Petra Diamonds Ltd. (a) | 7,913,909 | 7,457,681 | |
| TOTAL BERMUDA | 41,327,446 | ||
| Brazil - 1.5% | |||
| Estacio Participacoes SA | 1,545,300 | 14,071,440 | |
| Notre Dame Intermedica Participacoes SA | 1,328,700 | 7,737,349 | |
| Sul America SA unit | 1,935,600 | 11,945,556 | |
| TOTAL BRAZIL | 33,754,345 | ||
| Canada - 6.1% | |||
| AutoCanada, Inc. (b) | 730,984 | 12,422,657 | |
| Dorel Industries, Inc. Class B (sub. vtg.) | 426,803 | 9,224,489 | |
| Genesis Land Development Corp. (d) | 2,185,422 | 6,212,695 | |
| Lassonde Industries, Inc. Class A (sub. vtg.) | 77,369 | 16,769,359 | |
| McCoy Global, Inc. (a) | 1,341,170 | 1,337,044 | |
| North West Co., Inc. | 748,800 | 16,102,160 | |
| Open Text Corp. | 349,096 | 12,324,874 | |
| Pinnacle Renewable Holds, Inc. | 945,625 | 10,524,539 | |
| Total Energy Services, Inc. | 623,400 | 6,612,958 | |
| TransForce, Inc. | 540,500 | 15,647,327 | |
| Western Forest Products, Inc. | 7,585,700 | 16,365,426 | |
| Whitecap Resources, Inc. (b) | 1,978,553 | 14,331,199 | |
| TOTAL CANADA | 137,874,727 | ||
| Cayman Islands - 3.3% | |||
| AMVIG Holdings Ltd. | 28,280,000 | 7,270,414 | |
| Best Pacific International Holdings Ltd. (b) | 16,978,000 | 6,686,902 | |
| China High Precision Automation Group Ltd. (a)(e) | 712,000 | 1 | |
| China Metal Recycling (Holdings) Ltd. (a)(e) | 436,800 | 1 | |
| Haitian International Holdings Ltd. | 2,433,000 | 6,474,948 | |
| Pico Far East Holdings Ltd. | 21,568,000 | 8,763,952 | |
| Precision Tsugami China Corp. Ltd. | 4,446,000 | 6,127,043 | |
| SITC International Holdings Co. Ltd. | 16,426,000 | 17,501,016 | |
| Value Partners Group Ltd. | 10,559,000 | 9,987,812 | |
| Xingda International Holdings Ltd. | 32,357,629 | 11,557,423 | |
| TOTAL CAYMAN ISLANDS | 74,369,512 | ||
| China - 1.2% | |||
| Qingdao Port International Co. Ltd. (c) | 18,171,000 | 14,928,770 | |
| Weifu High-Technology Co. Ltd. (B Shares) | 5,354,604 | 11,556,558 | |
| TOTAL CHINA | 26,485,328 | ||
| Denmark - 1.6% | |||
| Jyske Bank A/S (Reg.) | 173,403 | 10,424,360 | |
| Scandinavian Tobacco Group A/S (c) | 861,172 | 14,404,744 | |
| Spar Nord Bank A/S | 1,000,200 | 11,461,520 | |
| TOTAL DENMARK | 36,290,624 | ||
| Finland - 2.5% | |||
| Amer Group PLC (A Shares) | 462,945 | 14,199,931 | |
| Asiakastieto Group Oyj (c) | 434,223 | 16,517,582 | |
| Cramo Oyj (B Shares) | 385,210 | 9,061,699 | |
| Olvi PLC (A Shares) | 312,038 | 10,475,515 | |
| Tikkurila Oyj (b) | 309,646 | 5,601,449 | |
| TOTAL FINLAND | 55,856,176 | ||
| France - 3.6% | |||
| Altarea SCA | 59,530 | 15,168,458 | |
| Elis SA | 445,600 | 10,665,272 | |
| Maisons du Monde SA (c) | 219,360 | 8,921,803 | |
| Rexel SA | 637,600 | 9,894,060 | |
| The Vicat Group | 172,356 | 12,706,770 | |
| Thermador Groupe SA | 69,583 | 10,041,397 | |
| Wendel SA | 86,635 | 13,098,477 | |
| TOTAL FRANCE | 80,496,237 | ||
| Germany - 1.0% | |||
| Bertrandt AG | 108,700 | 12,174,933 | |
| SHW Group | 230,249 | 9,842,924 | |
| TOTAL GERMANY | 22,017,857 | ||
| Greece - 0.8% | |||
| Mytilineos Holdings SA | 1,410,316 | 17,030,976 | |
| Hong Kong - 2.2% | |||
| Dah Sing Banking Group Ltd. | 6,806,000 | 16,161,988 | |
| Far East Horizon Ltd. | 7,833,000 | 7,772,590 | |
| Magnificent Hotel Investment Ltd. | 250,688,000 | 6,808,440 | |
| Sino Land Ltd. | 7,485,251 | 12,920,859 | |
| Techtronic Industries Co. Ltd. | 1,109,500 | 6,499,664 | |
| TOTAL HONG KONG | 50,163,541 | ||
| India - 0.5% | |||
| PC Jeweller Ltd. | 299,199 | 647,763 | |
| Torrent Pharmaceuticals Ltd. | 521,957 | 11,099,383 | |
| TOTAL INDIA | 11,747,146 | ||
| Indonesia - 0.6% | |||
| PT ACE Hardware Indonesia Tbk | 78,180,500 | 7,261,444 | |
| PT Media Nusantara Citra Tbk | 66,452,500 | 6,286,841 | |
| TOTAL INDONESIA | 13,548,285 | ||
| Ireland - 1.3% | |||
| Mincon Group PLC | 7,189,744 | 11,113,389 | |
| Origin Enterprises PLC | 920,300 | 5,934,632 | |
| United Drug PLC (United Kingdom) | 889,849 | 11,209,254 | |
| TOTAL IRELAND | 28,257,275 | ||
| Isle of Man - 0.8% | |||
| Playtech Ltd. | 1,588,474 | 17,726,624 | |
| Israel - 0.7% | |||
| Frutarom Industries Ltd. | 159,889 | 15,349,380 | |
| Italy - 0.8% | |||
| Banca Generali SpA | 372,000 | 12,093,196 | |
| Banco di Desio e della Brianza SpA | 2,225,581 | 6,369,640 | |
| TOTAL ITALY | 18,462,836 | ||
| Japan - 20.9% | |||
| A/S One Corp. | 167,200 | 11,379,144 | |
| Aeon Delight Co. Ltd. | 391,100 | 13,719,983 | |
| Arc Land Sakamoto Co. Ltd. | 786,500 | 12,424,858 | |
| Aucnet, Inc. | 845,500 | 10,974,794 | |
| Broadleaf Co. Ltd. | 1,874,000 | 8,948,299 | |
| Central Automotive Products Ltd. | 339,100 | 5,288,744 | |
| Daiwa Industries Ltd. | 902,900 | 9,886,309 | |
| Dexerials Corp. | 1,321,000 | 12,458,388 | |
| Funai Soken Holdings, Inc. | 297,180 | 6,964,647 | |
| GMO Internet, Inc. | 562,400 | 10,366,228 | |
| Iida Group Holdings Co. Ltd. | 938,051 | 18,371,453 | |
| Isuzu Motors Ltd. | 836,400 | 12,807,662 | |
| Japan Meat Co. Ltd. | 682,900 | 12,218,738 | |
| JSR Corp. | 1,008,000 | 19,040,615 | |
| Kirindo Holdings Co. Ltd. (d) | 636,109 | 17,310,870 | |
| Kotobuki Spirits Co. Ltd. | 141,500 | 6,743,643 | |
| Meitec Corp. | 187,900 | 10,330,031 | |
| Mitani Shoji Co. Ltd. | 274,300 | 13,047,567 | |
| Morinaga & Co. Ltd. | 298,300 | 14,543,899 | |
| Nihon Parkerizing Co. Ltd. | 852,600 | 13,531,476 | |
| Nitori Holdings Co. Ltd. | 31,100 | 5,257,300 | |
| Otsuka Corp. | 139,600 | 6,512,623 | |
| PALTAC Corp. | 423,300 | 21,219,210 | |
| Paramount Bed Holdings Co. Ltd. | 370,700 | 18,446,835 | |
| Renesas Electronics Corp. (a)(b) | 1,345,600 | 14,130,523 | |
| Ricoh Leasing Co. Ltd. | 179,300 | 5,994,708 | |
| S Foods, Inc. | 562,900 | 23,711,622 | |
| San-Ai Oil Co. Ltd. | 797,600 | 12,578,324 | |
| Shinsei Bank Ltd. | 862,000 | 13,467,764 | |
| Ship Healthcare Holdings, Inc. | 563,000 | 19,595,820 | |
| Taiheiyo Cement Corp. | 319,400 | 12,110,437 | |
| TKC Corp. | 253,300 | 10,137,098 | |
| Toshiba Plant Systems & Services Corp. | 814,800 | 17,038,353 | |
| Tsuruha Holdings, Inc. | 79,200 | 11,396,048 | |
| VT Holdings Co. Ltd. | 1,557,200 | 7,107,966 | |
| Welcia Holdings Co. Ltd. | 182,900 | 9,419,383 | |
| Yamada Consulting Group Co. Ltd. (b) | 681,580 | 19,389,991 | |
| TOTAL JAPAN | 467,871,353 | ||
| Korea (South) - 0.9% | |||
| Hyundai Fire & Marine Insurance Co. Ltd. | 371,155 | 13,256,464 | |
| NS Shopping Co. Ltd. | 527,567 | 6,896,784 | |
| TOTAL KOREA (SOUTH) | 20,153,248 | ||
| Mexico - 1.0% | |||
| Credito Real S.A.B. de CV | 6,791,300 | 9,964,323 | |
| Genomma Lab Internacional SA de CV (a) | 13,330,400 | 12,965,422 | |
| TOTAL MEXICO | 22,929,745 | ||
| Netherlands - 2.8% | |||
| Amsterdam Commodities NV | 409,155 | 10,919,512 | |
| Arcadis NV | 609,889 | 12,034,442 | |
| Arcadis NV rights (a)(f) | 591,025 | 335,449 | |
| Basic-Fit NV (a)(c) | 301,600 | 9,087,093 | |
| BinckBank NV | 1,260,658 | 7,353,050 | |
| Philips Lighting NV (c) | 393,600 | 11,996,859 | |
| RHI Magnesita NV | 178,110 | 10,668,248 | |
| TOTAL NETHERLANDS | 62,394,653 | ||
| New Zealand - 0.9% | |||
| Air New Zealand Ltd. | 4,896,856 | 11,266,549 | |
| EBOS Group Ltd. | 752,917 | 9,418,998 | |
| TOTAL NEW ZEALAND | 20,685,547 | ||
| Norway - 0.8% | |||
| ABG Sundal Collier ASA | 9,132,540 | 7,194,652 | |
| Ekornes A/S | 714,399 | 9,920,353 | |
| TOTAL NORWAY | 17,115,005 | ||
| Philippines - 0.3% | |||
| Century Pacific Food, Inc. | 22,658,800 | 7,241,940 | |
| Romania - 0.6% | |||
| Banca Transilvania SA | 20,050,864 | 13,327,062 | |
| Singapore - 1.5% | |||
| Boustead Singapore Ltd. | 8,703,269 | 5,289,441 | |
| Hour Glass Ltd. | 8,112,100 | 3,972,547 | |
| Mapletree Industrial (REIT) | 8,115,894 | 12,386,912 | |
| Wing Tai Holdings Ltd. | 7,995,300 | 12,250,164 | |
| TOTAL SINGAPORE | 33,899,064 | ||
| South Africa - 0.6% | |||
| Clicks Group Ltd. | 740,718 | 12,664,000 | |
| Spain - 0.5% | |||
| Hispania Activos Inmobiliarios SA | 583,585 | 12,403,376 | |
| Sweden - 1.7% | |||
| AddTech AB (B Shares) | 423,019 | 8,821,098 | |
| Coor Service Management Holding AB | 631,700 | 4,393,293 | |
| Granges AB | 1,034,787 | 14,535,102 | |
| Victoria Park AB | 2,748,800 | 11,316,455 | |
| TOTAL SWEDEN | 39,065,948 | ||
| Switzerland - 0.6% | |||
| Vontobel Holdings AG | 202,029 | 13,373,464 | |
| Taiwan - 4.2% | |||
| King's Town Bank | 9,032,000 | 10,799,437 | |
| Lumax International Corp. Ltd. | 4,466,600 | 8,940,627 | |
| Makalot Industrial Co. Ltd. | 3,031,540 | 14,568,597 | |
| Sporton International, Inc. | 1,268,000 | 7,022,129 | |
| Test Research, Inc. | 5,526,000 | 10,111,298 | |
| Tripod Technology Corp. | 3,836,000 | 11,582,948 | |
| United Microelectronics Corp. | 25,269,000 | 13,602,734 | |
| Yageo Corp. | 537,457 | 11,245,669 | |
| Yung Chi Paint & Varnish Manufacturing Co. Ltd. | 2,243,000 | 6,052,776 | |
| TOTAL TAIWAN | 93,926,215 | ||
| Thailand - 1.4% | |||
| Delta Electronics PCL (For. Reg.) | 3,327,600 | 7,080,667 | |
| Star Petroleum Refining PCL | 28,176,000 | 13,971,387 | |
| TISCO Financial Group PCL | 3,439,000 | 9,643,752 | |
| TOTAL THAILAND | 30,695,806 | ||
| Turkey - 0.3% | |||
| Aygaz A/S | 1,821,000 | 6,042,953 | |
| United Kingdom - 16.6% | |||
| AEW UK REIT PLC (b) | 4,299,768 | 5,765,584 | |
| Alliance Pharma PLC | 9,361,865 | 10,439,668 | |
| Bond International Software PLC (a)(e) | 899,666 | 12 | |
| Cineworld Group PLC | 6,230,280 | 22,335,098 | |
| Close Brothers Group PLC | 445,123 | 9,412,621 | |
| Countrywide PLC (a) | 6,406,807 | 9,508,231 | |
| Diploma PLC | 566,151 | 9,399,806 | |
| Elementis PLC | 3,115,800 | 12,165,084 | |
| Essentra PLC | 1,774,555 | 10,773,762 | |
| Indivior PLC (a) | 1,927,100 | 12,020,918 | |
| Informa PLC | 1,727,149 | 17,571,691 | |
| ITE Group PLC | 3,929,619 | 8,223,058 | |
| James Fisher and Sons PLC | 333,700 | 7,690,436 | |
| Jardine Lloyd Thompson Group PLC | 430,740 | 7,246,457 | |
| John Wood Group PLC | 2,157,400 | 16,887,947 | |
| LivaNova PLC (a) | 283,200 | 25,142,488 | |
| Luxfer Holdings PLC sponsored | 1,220,309 | 17,084,326 | |
| McColl's Retail Group PLC | 4,684,981 | 15,157,061 | |
| Mears Group PLC | 2,690,912 | 12,113,972 | |
| Melrose Industries PLC | 4,250,368 | 13,341,378 | |
| Micro Focus International PLC | 1,023,440 | 17,647,311 | |
| Moneysupermarket.com Group PLC | 3,813,400 | 15,733,974 | |
| PayPoint PLC | 769,511 | 9,100,124 | |
| Sabre Insurance Group PLC (a)(c) | 2,480,615 | 8,742,560 | |
| Sinclair Pharma PLC (a)(b) | 20,361,055 | 4,204,660 | |
| Spectris PLC | 293,956 | 10,886,140 | |
| Ten Entertainment Group PLC (d) | 3,787,019 | 13,086,109 | |
| The Weir Group PLC | 407,670 | 11,988,071 | |
| Topps Tiles PLC | 5,671,810 | 5,387,783 | |
| Tullett Prebon PLC | 2,313,614 | 15,008,438 | |
| Ultra Electronics Holdings PLC | 386,697 | 7,495,710 | |
| Volution Group PLC | 3,689,700 | 10,006,832 | |
| TOTAL UNITED KINGDOM | 371,567,310 | ||
| TOTAL COMMON STOCKS | |||
| (Cost $1,765,281,979) | 2,101,172,797 | ||
| Nonconvertible Preferred Stocks - 0.6% | |||
| Brazil - 0.6% | |||
| Alpargatas SA (PN) | 813,000 | 3,622,668 | |
| Banco ABC Brasil SA | 1,960,322 | 10,497,728 | |
| TOTAL NON CONVERTIBLE PREFERRED STOCKS | |||
| (Cost $10,494,161) | 14,120,396 | ||
| Money Market Funds - 6.0% | |||
| Fidelity Cash Central Fund, 1.74% (g) | 111,941,625 | 111,964,014 | |
| Fidelity Securities Lending Cash Central Fund 1.74% (g)(h) | 22,190,121 | 22,192,340 | |
| TOTAL MONEY MARKET FUNDS | |||
| (Cost $134,147,862) | 134,156,354 | ||
| TOTAL INVESTMENT IN SECURITIES - 100.3% | |||
| (Cost $1,909,924,002) | 2,249,449,547 | ||
| NET OTHER ASSETS (LIABILITIES) - (0.3)% | (6,102,325) | ||
| NET ASSETS - 100% | $2,243,347,222 |
Categorizations in the Schedule of Investments are based on country or territory of incorporation.
Legend
(a) Non-income producing
(b) Security or a portion of the security is on loan at period end.
(c) Security exempt from registration under Rule 144A of the Securities Act of 1933. These securities may be resold in transactions exempt from registration, normally to qualified institutional buyers. At the end of the period, the value of these securities amounted to $97,886,115 or 4.4% of net assets.
(d) Affiliated company
(e) Level 3 security
(f) Security or a portion of the security purchased on a delayed delivery or when-issued basis.
(g) Affiliated fund that is generally available only to investment companies and other accounts managed by Fidelity Investments. The rate quoted is the annualized seven-day yield of the fund at period end. A complete unaudited listing of the fund's holdings as of its most recent quarter end is available upon request. In addition, each Fidelity Central Fund's financial statements are available on the SEC's website or upon request.
(h) Investment made with cash collateral received from securities on loan.
Affiliated Central Funds
Information regarding fiscal year to date income earned by the Fund from investments in Fidelity Central Funds is as follows:
| Fund | Income earned |
| Fidelity Cash Central Fund | $599,997 |
| Fidelity Securities Lending Cash Central Fund | 127,675 |
| Total | $727,672 |
Amounts in the income column in the above table include any capital gain distributions from underlying funds, which are presented in the corresponding line-item in the Statement of Operations if applicable.
Other Affiliated Issuers
An affiliated company is a company in which the Fund has ownership of at least 5% of the voting securities. Fiscal year to date transactions with companies which are or were affiliates are as follows:
| Affiliate | Value, beginning of period | Purchases | Sales Proceeds | Dividend Income | Realized Gain (loss) | Change in Unrealized appreciation (depreciation) | Value, end of period |
| Genesis Land Development Corp. | $6,005,072 | $437,434 | $-- | $340,481 | $-- | $(229,811) | $6,212,695 |
| Kirindo Holdings Co. Ltd. | 8,403,137 | 145,984 | -- | 93,640 | -- | 8,761,749 | 17,310,870 |
| Ten Entertainment Group PLC | 10,172,260 | 863,195 | -- | 141,686 | -- | 2,050,654 | 13,086,109 |
| Total | $24,580,469 | $1,446,613 | $-- | $575,807 | $-- | $10,582,592 | $36,609,674 |
Investment Valuation
The following is a summary of the inputs used, as of April 30, 2018, involving the Fund's assets and liabilities carried at fair value. The inputs or methodology used for valuing securities may not be an indication of the risk associated with investing in those securities. For more information on valuation inputs, and their aggregation into the levels used below, please refer to the Investment Valuation section in the accompanying Notes to Financial Statements.
| Valuation Inputs at Reporting Date: | ||||
| Description | Total | Level 1 | Level 2 | Level 3 |
| Investments in Securities: | ||||
| Equities: | ||||
| Consumer Discretionary | $365,019,852 | $265,017,698 | $100,002,154 | $-- |
| Consumer Staples | 210,485,585 | 170,702,442 | 39,783,143 | -- |
| Energy | 93,017,423 | 79,046,036 | 13,971,387 | -- |
| Financials | 296,531,668 | 227,323,634 | 69,208,034 | -- |
| Health Care | 174,759,037 | 142,560,556 | 32,198,481 | -- |
| Industrials | 411,585,167 | 341,201,145 | 70,384,022 | -- |
| Information Technology | 218,441,576 | 138,461,655 | 79,979,908 | 13 |
| Materials | 205,161,206 | 164,865,717 | 40,295,488 | 1 |
| Real Estate | 122,149,400 | 74,865,904 | 47,283,496 | -- |
| Utilities | 18,142,279 | 6,042,953 | 12,099,326 | -- |
| Money Market Funds | 134,156,354 | 134,156,354 | -- | -- |
| Total Investments in Securities: | $2,249,449,547 | $1,744,244,094 | $505,205,439 | $14 |
The following is a summary of transfers between Level 1 and Level 2 for the period ended April 30, 2018. Transfers are assumed to have occurred at the beginning of the period, and are primarily attributable to the valuation techniques used for foreign equity securities, as discussed in the accompanying Notes to Financial Statements:
| Transfers | Total |
| Level 1 to Level 2 | $384,514,688 |
| Level 2 to Level 1 | $347,514,101 |
See accompanying notes which are an integral part of the financial statements.
Financial Statements
Statement of Assets and Liabilities
| April 30, 2018 (Unaudited) | ||
| Assets | ||
| Investment in securities, at value (including securities loaned of $20,752,949) — See accompanying schedule: Unaffiliated issuers (cost $1,753,971,568) | $2,078,683,519 | |
| Fidelity Central Funds (cost $134,147,862) | 134,156,354 | |
| Other affiliated issuers (cost $21,804,572) | 36,609,674 | |
| Total Investment in Securities (cost $1,909,924,002) | $2,249,449,547 | |
| Foreign currency held at value (cost $1,048,881) | 1,048,844 | |
| Receivable for investments sold | 12,247,269 | |
| Receivable for fund shares sold | 7,639,547 | |
| Dividends receivable | 11,929,766 | |
| Distributions receivable from Fidelity Central Funds | 174,267 | |
| Prepaid expenses | 748 | |
| Other receivables | 39,244 | |
| Total assets | 2,282,529,232 | |
| Liabilities | ||
| Payable for investments purchased | ||
| Regular delivery | $12,803,668 | |
| Delayed delivery | 336,269 | |
| Payable for fund shares redeemed | 1,417,926 | |
| Accrued management fee | 1,742,160 | |
| Distribution and service plan fees payable | 63,997 | |
| Other affiliated payables | 402,173 | |
| Other payables and accrued expenses | 221,477 | |
| Collateral on securities loaned | 22,194,340 | |
| Total liabilities | 39,182,010 | |
| Net Assets | $2,243,347,222 | |
| Net Assets consist of: | ||
| Paid in capital | $1,868,463,199 | |
| Undistributed net investment income | 12,989,640 | |
| Accumulated undistributed net realized gain (loss) on investments and foreign currency transactions | 22,511,385 | |
| Net unrealized appreciation (depreciation) on investments and assets and liabilities in foreign currencies | 339,382,998 | |
| Net Assets | $2,243,347,222 | |
| Calculation of Maximum Offering Price | ||
| Class A: | ||
| Net Asset Value and redemption price per share ($81,091,775 ÷ 2,736,547 shares) | $29.63 | |
| Maximum offering price per share (100/94.25 of $29.63) | $31.44 | |
| Class M: | ||
| Net Asset Value and redemption price per share ($21,053,093 ÷ 713,895 shares) | $29.49 | |
| Maximum offering price per share (100/96.50 of $29.49) | $30.56 | |
| Class C: | ||
| Net Asset Value and offering price per share ($47,467,944 ÷ 1,661,085 shares)(a) | $28.58 | |
| International Small Cap: | ||
| Net Asset Value, offering price and redemption price per share ($1,567,588,848 ÷ 51,956,328 shares) | $30.17 | |
| Class I: | ||
| Net Asset Value, offering price and redemption price per share ($526,145,562 ÷ 17,329,194 shares) | $30.36 |
(a) Redemption price per share is equal to net asset value less any applicable contingent deferred sales charge.
See accompanying notes which are an integral part of the financial statements.
Statement of Operations
| Six months ended April 30, 2018 (Unaudited) | ||
| Investment Income | ||
| Dividends (including $575,807 earned from other affiliated issuers) | $28,295,201 | |
| Income from Fidelity Central Funds | 727,672 | |
| Income before foreign taxes withheld | 29,022,873 | |
| Less foreign taxes withheld | (2,782,322) | |
| Total income | 26,240,551 | |
| Expenses | ||
| Management fee | ||
| Basic fee | $8,488,393 | |
| Performance adjustment | 1,123,615 | |
| Transfer agent fees | 1,790,193 | |
| Distribution and service plan fees | 335,115 | |
| Accounting and security lending fees | 445,735 | |
| Custodian fees and expenses | 275,592 | |
| Independent trustees' fees and expenses | 3,832 | |
| Registration fees | 143,461 | |
| Audit | 39,330 | |
| Legal | 3,626 | |
| Miscellaneous | 5,452 | |
| Total expenses before reductions | 12,654,344 | |
| Expense reductions | (92,528) | 12,561,816 |
| Net investment income (loss) | 13,678,735 | |
| Realized and Unrealized Gain (Loss) | ||
| Net realized gain (loss) on: | ||
| Investment securities: | ||
| Unaffiliated issuers (net of foreign taxes of $131) | 38,623,604 | |
| Fidelity Central Funds | (251) | |
| Foreign currency transactions | (135,559) | |
| Total net realized gain (loss) | 38,487,794 | |
| Change in net unrealized appreciation (depreciation) on: | ||
| Investment securities: | ||
| Unaffiliated issuers | 21,111,397 | |
| Fidelity Central Funds | (295) | |
| Other affiliated issuers | 10,582,592 | |
| Assets and liabilities in foreign currencies | (52,418) | |
| Total change in net unrealized appreciation (depreciation) | 31,641,276 | |
| Net gain (loss) | 70,129,070 | |
| Net increase (decrease) in net assets resulting from operations | $83,807,805 |
See accompanying notes which are an integral part of the financial statements.
Statement of Changes in Net Assets
| Six months ended April 30, 2018 (Unaudited) | Year ended October 31, 2017 | |
| Increase (Decrease) in Net Assets | ||
| Operations | ||
| Net investment income (loss) | $13,678,735 | $18,356,208 |
| Net realized gain (loss) | 38,487,794 | 41,195,813 |
| Change in net unrealized appreciation (depreciation) | 31,641,276 | 258,657,737 |
| Net increase (decrease) in net assets resulting from operations | 83,807,805 | 318,209,758 |
| Distributions to shareholders from net investment income | (17,238,176) | (14,393,212) |
| Distributions to shareholders from net realized gain | (44,315,078) | (12,478,859) |
| Total distributions | (61,553,254) | (26,872,071) |
| Share transactions - net increase (decrease) | 457,511,255 | 480,792,049 |
| Redemption fees | 48,167 | 258,237 |
| Total increase (decrease) in net assets | 479,813,973 | 772,387,973 |
| Net Assets | ||
| Beginning of period | 1,763,533,249 | 991,145,276 |
| End of period | $2,243,347,222 | $1,763,533,249 |
| Other Information | ||
| Undistributed net investment income end of period | $12,989,640 | $16,549,081 |
See accompanying notes which are an integral part of the financial statements.
Financial Highlights
Fidelity International Small Cap Fund Class A
| Six months ended (Unaudited) April 30, | Years endedOctober 31, | |||||
| 2018 | 2017 | 2016 | 2015 | 2014 | 2013 | |
| Selected Per–Share Data | ||||||
| Net asset value, beginning of period | $29.24 | $23.81 | $22.69 | $24.98 | $26.34 | $19.74 |
| Income from Investment Operations | ||||||
| Net investment income (loss)A | .16 | .29 | .34 | .27 | .17 | .06 |
| Net realized and unrealized gain (loss) | 1.20 | 5.70 | 1.64 | 1.05 | (.89) | 6.94 |
| Total from investment operations | 1.36 | 5.99 | 1.98 | 1.32 | (.72) | 7.00 |
| Distributions from net investment income | (.23) | (.28) | (.25) | (.16) | (.05) | (.07) |
| Distributions from net realized gain | (.74) | (.29) | (.62) | (3.45) | (.60) | (.33) |
| Total distributions | (.97) | (.57) | (.87) | (3.61) | (.65) | (.40) |
| Redemption fees added to paid in capitalA | –B | .01 | .01 | –B | .01 | –B |
| Net asset value, end of period | $29.63 | $29.24 | $23.81 | $22.69 | $24.98 | $26.34 |
| Total ReturnC,D,E | 4.79% | 25.83% | 9.11% | 6.21% | (2.79)% | 36.18% |
| Ratios to Average Net AssetsF,G | ||||||
| Expenses before reductions | 1.51%H | 1.55% | 1.61% | 1.59% | 1.50% | 1.61% |
| Expenses net of fee waivers, if any | 1.51%H | 1.55% | 1.61% | 1.58% | 1.50% | 1.61% |
| Expenses net of all reductions | 1.50%H | 1.55% | 1.61% | 1.58% | 1.50% | 1.60% |
| Net investment income (loss) | 1.10%H | 1.11% | 1.50% | 1.18% | .65% | .25% |
| Supplemental Data | ||||||
| Net assets, end of period (000 omitted) | $81,092 | $63,459 | $36,480 | $28,238 | $24,572 | $24,020 |
| Portfolio turnover rateI | 21%H | 22% | 29% | 36% | 102% | 54% |
A Calculated based on average shares outstanding during the period.
B Amount represents less than $.005 per share.
C Total returns for periods of less than one year are not annualized.
D Total returns would have been lower if certain expenses had not been reduced during the applicable periods shown.
E Total returns do not include the effect of the sales charges.
F Fees and expenses of any underlying Fidelity Central Funds are not included in the Fund's expense ratio. The Fund indirectly bears its proportionate share of the expenses of any underlying Fidelity Central Funds.
G Expense ratios reflect operating expenses of the class. Expenses before reductions do not reflect amounts reimbursed by the investment adviser or reductions from brokerage service arrangements or reductions from other expense offset arrangements and do not represent the amount paid by the class during periods when reimbursements or reductions occur. Expenses net of fee waivers reflect expenses after reimbursement by the investment adviser but prior to reductions from brokerage service arrangements or other expense offset arrangements. Expenses net of all reductions represent the net expenses paid by the class.
H Annualized
I Amount does not include the portfolio activity of any underlying Fidelity Central Funds.
See accompanying notes which are an integral part of the financial statements.
Fidelity International Small Cap Fund Class M
| Six months ended (Unaudited) April 30, | Years endedOctober 31, | |||||
| 2018 | 2017 | 2016 | 2015 | 2014 | 2013 | |
| Selected Per–Share Data | ||||||
| Net asset value, beginning of period | $29.07 | $23.65 | $22.55 | $24.81 | $26.17 | $19.59 |
| Income from Investment Operations | ||||||
| Net investment income (loss)A | .12 | .21 | .27 | .21 | .10 | –B |
| Net realized and unrealized gain (loss) | 1.19 | 5.69 | 1.63 | 1.04 | (.87) | 6.90 |
| Total from investment operations | 1.31 | 5.90 | 1.90 | 1.25 | (.77) | 6.90 |
| Distributions from net investment income | (.15) | (.19) | (.19) | (.06) | – | – |
| Distributions from net realized gain | (.74) | (.29) | (.62) | (3.45) | (.60) | (.32) |
| Total distributions | (.89) | (.48) | (.81) | (3.51) | (.60) | (.32) |
| Redemption fees added to paid in capitalA | –B | –B | .01 | –B | .01 | –B |
| Net asset value, end of period | $29.49 | $29.07 | $23.65 | $22.55 | $24.81 | $26.17 |
| Total ReturnC,D,E | 4.63% | 25.47% | 8.79% | 5.90% | (3.00)% | 35.80% |
| Ratios to Average Net AssetsF,G | ||||||
| Expenses before reductions | 1.78%H | 1.84% | 1.90% | 1.87% | 1.77% | 1.87% |
| Expenses net of fee waivers, if any | 1.78%H | 1.84% | 1.90% | 1.86% | 1.77% | 1.87% |
| Expenses net of all reductions | 1.77%H | 1.84% | 1.90% | 1.86% | 1.76% | 1.85% |
| Net investment income (loss) | .82%H | .82% | 1.21% | .90% | .38% | (.01)% |
| Supplemental Data | ||||||
| Net assets, end of period (000 omitted) | $21,053 | $18,148 | $13,331 | $12,400 | $12,296 | $13,530 |
| Portfolio turnover rateI | 21%H | 22% | 29% | 36% | 102% | 54% |
A Calculated based on average shares outstanding during the period.
B Amount represents less than $.005 per share.
C Total returns for periods of less than one year are not annualized.
D Total returns would have been lower if certain expenses had not been reduced during the applicable periods shown.
E Total returns do not include the effect of the sales charges.
F Fees and expenses of any underlying Fidelity Central Funds are not included in the Fund's expense ratio. The Fund indirectly bears its proportionate share of the expenses of any underlying Fidelity Central Funds.
G Expense ratios reflect operating expenses of the class. Expenses before reductions do not reflect amounts reimbursed by the investment adviser or reductions from brokerage service arrangements or reductions from other expense offset arrangements and do not represent the amount paid by the class during periods when reimbursements or reductions occur. Expenses net of fee waivers reflect expenses after reimbursement by the investment adviser but prior to reductions from brokerage service arrangements or other expense offset arrangements. Expenses net of all reductions represent the net expenses paid by the class.
H Annualized
I Amount does not include the portfolio activity of any underlying Fidelity Central Funds.
See accompanying notes which are an integral part of the financial statements.
Fidelity International Small Cap Fund Class C
| Six months ended (Unaudited) April 30, | Years endedOctober 31, | |||||
| 2018 | 2017 | 2016 | 2015 | 2014 | 2013 | |
| Selected Per–Share Data | ||||||
| Net asset value, beginning of period | $28.21 | $22.97 | $21.96 | $24.27 | $25.68 | $19.18 |
| Income from Investment Operations | ||||||
| Net investment income (loss)A | .05 | .08 | .16 | .09 | (.02) | (.11) |
| Net realized and unrealized gain (loss) | 1.16 | 5.53 | 1.59 | 1.02 | (.85) | 6.79 |
| Total from investment operations | 1.21 | 5.61 | 1.75 | 1.11 | (.87) | 6.68 |
| Distributions from net investment income | (.10) | (.08) | (.13) | – | – | – |
| Distributions from net realized gain | (.74) | (.29) | (.62) | (3.42) | (.55) | (.18) |
| Total distributions | (.84) | (.37) | (.75) | (3.42) | (.55) | (.18) |
| Redemption fees added to paid in capitalA | –B | –B | .01 | –B | .01 | –B |
| Net asset value, end of period | $28.58 | $28.21 | $22.97 | $21.96 | $24.27 | $25.68 |
| Total ReturnC,D,E | 4.41% | 24.85% | 8.26% | 5.37% | (3.43)% | 35.15% |
| Ratios to Average Net AssetsF,G | ||||||
| Expenses before reductions | 2.26%H | 2.33% | 2.40% | 2.36% | 2.23% | 2.33% |
| Expenses net of fee waivers, if any | 2.26%H | 2.33% | 2.40% | 2.35% | 2.22% | 2.33% |
| Expenses net of all reductions | 2.25%H | 2.32% | 2.39% | 2.35% | 2.22% | 2.32% |
| Net investment income (loss) | .35%H | .33% | .71% | .41% | (.07)% | (.47)% |
| Supplemental Data | ||||||
| Net assets, end of period (000 omitted) | $47,468 | $26,005 | $12,187 | $11,359 | $12,576 | $13,426 |
| Portfolio turnover rateI | 21%H | 22% | 29% | 36% | 102% | 54% |
A Calculated based on average shares outstanding during the period.
B Amount represents less than $.005 per share.
C Total returns for periods of less than one year are not annualized.
D Total returns would have been lower if certain expenses had not been reduced during the applicable periods shown.
E Total returns do not include the effect of the contingent deferred sales charge.
F Fees and expenses of any underlying Fidelity Central Funds are not included in the Fund's expense ratio. The Fund indirectly bears its proportionate share of the expenses of any underlying Fidelity Central Funds.
G Expense ratios reflect operating expenses of the class. Expenses before reductions do not reflect amounts reimbursed by the investment adviser or reductions from brokerage service arrangements or reductions from other expense offset arrangements and do not represent the amount paid by the class during periods when reimbursements or reductions occur. Expenses net of fee waivers reflect expenses after reimbursement by the investment adviser but prior to reductions from brokerage service arrangements or other expense offset arrangements. Expenses net of all reductions represent the net expenses paid by the class.
H Annualized
I Amount does not include the portfolio activity of any underlying Fidelity Central Funds.
See accompanying notes which are an integral part of the financial statements.
Fidelity International Small Cap Fund
| Six months ended (Unaudited) April 30, | Years endedOctober 31, | |||||
| 2018 | 2017 | 2016 | 2015 | 2014 | 2013 | |
| Selected Per–Share Data | ||||||
| Net asset value, beginning of period | $29.77 | $24.23 | $23.06 | $25.34 | $26.67 | $19.99 |
| Income from Investment Operations | ||||||
| Net investment income (loss)A | .21 | .37 | .40 | .34 | .25 | .12 |
| Net realized and unrealized gain (loss) | 1.22 | 5.79 | 1.67 | 1.07 | (.90) | 7.02 |
| Total from investment operations | 1.43 | 6.16 | 2.07 | 1.41 | (.65) | 7.14 |
| Distributions from net investment income | (.29) | (.34) | (.29) | (.24) | (.09) | (.14) |
| Distributions from net realized gain | (.74) | (.29) | (.62) | (3.45) | (.60) | (.33) |
| Total distributions | (1.03) | (.63) | (.91) | (3.69) | (.69) | (.46)B |
| Redemption fees added to paid in capitalA | –C | .01 | .01 | –C | .01 | –C |
| Net asset value, end of period | $30.17 | $29.77 | $24.23 | $23.06 | $25.34 | $26.67 |
| Total ReturnD,E | 4.96% | 26.18% | 9.39% | 6.53% | (2.48)% | 36.56% |
| Ratios to Average Net AssetsF,G | ||||||
| Expenses before reductions | 1.21%H | 1.25% | 1.34% | 1.31% | 1.21% | 1.33% |
| Expenses net of fee waivers, if any | 1.21%H | 1.25% | 1.34% | 1.31% | 1.20% | 1.32% |
| Expenses net of all reductions | 1.20%H | 1.24% | 1.33% | 1.31% | 1.20% | 1.31% |
| Net investment income (loss) | 1.39%H | 1.41% | 1.77% | 1.45% | .95% | .53% |
| Supplemental Data | ||||||
| Net assets, end of period (000 omitted) | $1,567,589 | $1,418,452 | $906,420 | $811,534 | $842,031 | $1,029,629 |
| Portfolio turnover rateI | 21%H | 22% | 29% | 36% | 102% | 54% |
A Calculated based on average shares outstanding during the period.
B Total distributions of $.46 per share is comprised of distributions from net investment income of $.136 and distributions from net realized gain of $.327 per share.
C Amount represents less than $.005 per share.
D Total returns for periods of less than one year are not annualized.
E Total returns would have been lower if certain expenses had not been reduced during the applicable periods shown.
F Fees and expenses of any underlying Fidelity Central Funds are not included in the Fund's expense ratio. The Fund indirectly bears its proportionate share of the expenses of any underlying Fidelity Central Funds.
G Expense ratios reflect operating expenses of the class. Expenses before reductions do not reflect amounts reimbursed by the investment adviser or reductions from brokerage service arrangements or reductions from other expense offset arrangements and do not represent the amount paid by the class during periods when reimbursements or reductions occur. Expenses net of fee waivers reflect expenses after reimbursement by the investment adviser but prior to reductions from brokerage service arrangements or other expense offset arrangements. Expenses net of all reductions represent the net expenses paid by the class.
H Annualized
I Amount does not include the portfolio activity of any underlying Fidelity Central Funds.
See accompanying notes which are an integral part of the financial statements.
Fidelity International Small Cap Fund Class I
| Six months ended (Unaudited) April 30, | Years endedOctober 31, | |||||
| 2018 | 2017 | 2016 | 2015 | 2014 | 2013 | |
| Selected Per–Share Data | ||||||
| Net asset value, beginning of period | $29.97 | $24.42 | $23.24 | $25.34 | $26.67 | $20.00 |
| Income from Investment Operations | ||||||
| Net investment income (loss)A | .21 | .38 | .41 | .36 | .29 | .16 |
| Net realized and unrealized gain (loss) | 1.22 | 5.82 | 1.69 | 1.07 | (.90) | 7.00 |
| Total from investment operations | 1.43 | 6.20 | 2.10 | 1.43 | (.61) | 7.16 |
| Distributions from net investment income | (.30) | (.37) | (.31) | (.08) | (.13) | (.16) |
| Distributions from net realized gain | (.74) | (.29) | (.62) | (3.45) | (.60) | (.33) |
| Total distributions | (1.04) | (.66) | (.93) | (3.53) | (.73) | (.49) |
| Redemption fees added to paid in capitalA | –B | .01 | .01 | –B | .01 | –B |
| Net asset value, end of period | $30.36 | $29.97 | $24.42 | $23.24 | $25.34 | $26.67 |
| Total ReturnC,D | 4.93% | 26.17% | 9.43% | 6.60% | (2.35)% | 36.68% |
| Ratios to Average Net AssetsE,F | ||||||
| Expenses before reductions | 1.23%G | 1.28% | 1.31% | 1.24% | 1.08% | 1.20% |
| Expenses net of fee waivers, if any | 1.23%G | 1.28% | 1.31% | 1.23% | 1.08% | 1.20% |
| Expenses net of all reductions | 1.22%G | 1.27% | 1.31% | 1.23% | 1.08% | 1.18% |
| Net investment income (loss) | 1.38%G | 1.39% | 1.80% | 1.53% | 1.07% | .66% |
| Supplemental Data | ||||||
| Net assets, end of period (000 omitted) | $526,146 | $237,469 | $22,727 | $10,070 | $8,092 | $67,038 |
| Portfolio turnover rateH | 21%G | 22% | 29% | 36% | 102% | 54% |
A Calculated based on average shares outstanding during the period.
B Amount represents less than $.005 per share.
C Total returns for periods of less than one year are not annualized.
D Total returns would have been lower if certain expenses had not been reduced during the applicable periods shown.
E Fees and expenses of any underlying Fidelity Central Funds are not included in the Fund's expense ratio. The Fund indirectly bears its proportionate share of the expenses of any underlying Fidelity Central Funds.
F Expense ratios reflect operating expenses of the class. Expenses before reductions do not reflect amounts reimbursed by the investment adviser or reductions from brokerage service arrangements or reductions from other expense offset arrangements and do not represent the amount paid by the class during periods when reimbursements or reductions occur. Expenses net of fee waivers reflect expenses after reimbursement by the investment adviser but prior to reductions from brokerage service arrangements or other expense offset arrangements. Expenses net of all reductions represent the net expenses paid by the class.
G Annualized
H Amount does not include the portfolio activity of any underlying Fidelity Central Funds.
See accompanying notes which are an integral part of the financial statements.
Notes to Financial Statements (Unaudited)
For the period ended April 30, 2018
1. Organization.
Fidelity International Small Cap Fund (the Fund) is a fund of Fidelity Investment Trust (the Trust) and is authorized to issue an unlimited number of shares. The Trust is registered under the Investment Company Act of 1940, as amended (the 1940 Act), as an open-end management investment company organized as a Massachusetts business trust. The Fund offers Class A, Class M, Class C, International Small Cap and Class I shares, each of which has equal rights as to assets and voting privileges. Each class has exclusive voting rights with respect to matters that affect that class. The Fund's investments in emerging markets can be subject to social, economic, regulatory, and political uncertainties and can be extremely volatile.
2. Investments in Fidelity Central Funds.
The Fund invests in Fidelity Central Funds, which are open-end investment companies generally available only to other investment companies and accounts managed by the investment adviser and its affiliates. The Fund's Schedule of Investments lists each of the Fidelity Central Funds held as of period end, if any, as an investment of the Fund, but does not include the underlying holdings of each Fidelity Central Fund. As an Investing Fund, the Fund indirectly bears its proportionate share of the expenses of the underlying Fidelity Central Funds.
The Money Market Central Funds seek preservation of capital and current income and are managed by Fidelity Investments Money Management, Inc. (FIMM), an affiliate of the investment adviser. Annualized expenses of the Money Market Central Funds as of their most recent shareholder report date are less than .005%.
A complete unaudited list of holdings for each Fidelity Central Fund is available upon request or at the Securities and Exchange Commission (the SEC) website at www.sec.gov. In addition, the financial statements of the Fidelity Central Funds are available on the SEC website or upon request.
3. Significant Accounting Policies.
The Fund is an investment company and applies the accounting and reporting guidance of the Financial Accounting Standards Board (FASB) Accounting Standards Codification Topic 946 Financial Services – Investments Companies. The financial statements have been prepared in conformity with accounting principles generally accepted in the United States of America (GAAP), which require management to make certain estimates and assumptions at the date of the financial statements. Actual results could differ from those estimates. Subsequent events, if any, through the date that the financial statements were issued have been evaluated in the preparation of the financial statements. The following summarizes the significant accounting policies of the Fund:
Investment Valuation. Investments are valued as of 4:00 p.m. Eastern time on the last calendar day of the period. The Board of Trustees (the Board) has delegated the day to day responsibility for the valuation of the Fund's investments to the Fair Value Committee (the Committee) established by the Fund's investment adviser. In accordance with valuation policies and procedures approved by the Board, the Fund attempts to obtain prices from one or more third party pricing vendors or brokers to value its investments. When current market prices, quotations or currency exchange rates are not readily available or reliable, investments will be fair valued in good faith by the Committee, in accordance with procedures adopted by the Board. Factors used in determining fair value vary by investment type and may include market or investment specific events. The frequency with which these procedures are used cannot be predicted and they may be utilized to a significant extent. The Committee oversees the Fund's valuation policies and procedures and reports to the Board on the Committee's activities and fair value determinations. The Board monitors the appropriateness of the procedures used in valuing the Fund's investments and ratifies the fair value determinations of the Committee.
The Fund categorizes the inputs to valuation techniques used to value its investments into a disclosure hierarchy consisting of three levels as shown below:
- Level 1 – quoted prices in active markets for identical investments
- Level 2 – other significant observable inputs (including quoted prices for similar investments, interest rates, prepayment speeds, etc.)
- Level 3 – unobservable inputs (including the Fund's own assumptions based on the best information available)
Valuation techniques used to value the Fund's investments by major category are as follows:
Equity securities, including restricted securities, for which market quotations are readily available, are valued at the last reported sale price or official closing price as reported by a third party pricing vendor on the primary market or exchange on which they are traded and are categorized as Level 1 in the hierarchy. In the event there were no sales during the day or closing prices are not available, securities are valued at the last quoted bid price or may be valued using the last available price and are generally categorized as Level 2 in the hierarchy. For foreign equity securities, when market or security specific events arise, comparisons to the valuation of American Depositary Receipts (ADRs), futures contracts, Exchange-Traded Funds (ETFs) and certain indexes as well as quoted prices for similar securities may be used and would be categorized as Level 2 in the hierarchy. Utilizing these techniques may result in transfers between Level 1 and Level 2. For equity securities, including restricted securities, where observable inputs are limited, assumptions about market activity and risk are used and these securities may be categorized as Level 3 in the hierarchy.
Investments in open-end mutual funds, including the Fidelity Central Funds, are valued at their closing net asset value (NAV) each business day and are categorized as Level 1 in the hierarchy.
Changes in valuation techniques may result in transfers in or out of an assigned level within the disclosure hierarchy. The aggregate value of investments by input level as of April 30, 2018, including information on transfers between Levels 1 and 2, is included at the end of the Fund's Schedule of Investments.
Foreign Currency. The Fund may use foreign currency contracts to facilitate transactions in foreign-denominated securities. Gains and losses from these transactions may arise from changes in the value of the foreign currency or if the counterparties do not perform under the contracts' terms.
Foreign-denominated assets, including investment securities, and liabilities are translated into U.S. dollars at the exchange rates at period end. Purchases and sales of investment securities, income and dividends received and expenses denominated in foreign currencies are translated into U.S. dollars at the exchange rate in effect on the transaction date.
The effects of exchange rate fluctuations on investments are included with the net realized and unrealized gain (loss) on investment securities. Other foreign currency transactions resulting in realized and unrealized gain (loss) are disclosed separately.
Investment Transactions and Income. For financial reporting purposes, the Fund's investment holdings and NAV include trades executed through the end of the last business day of the period. The NAV per share for processing shareholder transactions is calculated as of the close of business of the New York Stock Exchange (NYSE), normally 4:00 p.m. Eastern time and includes trades executed through the end of the prior business day. Gains and losses on securities sold are determined on the basis of identified cost and include proceeds received from litigation. Dividend income is recorded on the ex-dividend date, except for certain dividends from foreign securities where the ex-dividend date may have passed, which are recorded as soon as the Fund is informed of the ex-dividend date. Non-cash dividends included in dividend income, if any, are recorded at the fair market value of the securities received. Income and capital gain distributions from Fidelity Central Funds, if any, are recorded on the ex-dividend date. Certain distributions received by the Fund represent a return of capital or capital gain. The Fund determines the components of these distributions subsequent to the ex-dividend date, based upon receipt of tax filings or other correspondence relating to the underlying investment. These distributions are recorded as a reduction of cost of investments and/or as a realized gain. Investment income is recorded net of foreign taxes withheld where recovery of such taxes is uncertain.
Class Allocations and Expenses. Investment income, realized and unrealized capital gains and losses, common expenses of the Fund, and certain fund-level expense reductions, if any, are allocated daily on a pro-rata basis to each class based on the relative net assets of each class to the total net assets of the Fund. Each class differs with respect to transfer agent and distribution and service plan fees incurred. Certain expense reductions may also differ by class. For the reporting period, the allocated portion of income and expenses to each class as a percent of its average net assets may vary due to the timing of recording these transactions in relation to fluctuating net assets of the classes. Expenses directly attributable to a fund are charged to that fund. Expenses attributable to more than one fund are allocated among the respective funds on the basis of relative net assets or other appropriate methods. Expense estimates are accrued in the period to which they relate and adjustments are made when actual amounts are known.
Income Tax Information and Distributions to Shareholders. Each year, the Fund intends to qualify as a regulated investment company under Subchapter M of the Internal Revenue Code, including distributing substantially all of its taxable income and realized gains. As a result, no provision for U.S. Federal income taxes is required. The Fund files a U.S. federal tax return, in addition to state and local tax returns as required. The Fund's federal income tax returns are subject to examination by the Internal Revenue Service (IRS) for a period of three fiscal years after they are filed. State and local tax returns may be subject to examination for an additional fiscal year depending on the jurisdiction. Foreign taxes are provided for based on the Fund's understanding of the tax rules and rates that exist in the foreign markets in which it invests. The Fund is subject to a tax imposed on capital gains by certain countries in which it invests.
Distributions are declared and recorded on the ex-dividend date. Income and capital gain distributions are declared separately for each class. Income and capital gain distributions are determined in accordance with income tax regulations, which may differ from GAAP.
Capital accounts within the financial statements are adjusted for permanent book-tax differences. These adjustments have no impact on net assets or the results of operations. Capital accounts are not adjusted for temporary book-tax differences which will reverse in a subsequent period.
Book-tax differences are primarily due to foreign currency transactions, certain foreign taxes, passive foreign investment companies (PFIC) and losses deferred due to wash sales.
As of period end, the cost and unrealized appreciation (depreciation) in securities, and derivatives if applicable, for federal income tax purposes on an unconsolidated basis were as follows:
| Gross unrealized appreciation | $433,001,918 |
| Gross unrealized depreciation | (109,690,634) |
| Net unrealized appreciation (depreciation) | $323,311,284 |
| Tax cost | $1,926,138,263 |
Short-Term Trading (Redemption) Fees. Shares held by investors in the Fund less than 90 days may have been subject to a redemption fee equal to 2.00% of the NAV of shares redeemed. All redemption fees, which reduce the proceeds of the shareholder redemption, are retained by the Fund and accounted for as an addition to paid in capital. In November 2017, the Board of Trustees approved the elimination of these redemption fees effective December 18, 2017.
Delayed Delivery Transactions and When-Issued Securities. During the period, the Fund transacted in securities on a delayed delivery or when-issued basis. Payment and delivery may take place after the customary settlement period for that security. The price of the underlying securities and the date when the securities will be delivered and paid for are fixed at the time the transaction is negotiated. The securities purchased on a delayed delivery or when-issued basis are identified as such in the Fund's Schedule of Investments. Losses may arise due to changes in the value of the underlying securities or if the counterparty does not perform under the contract's terms, or if the issuer does not issue the securities due to political, economic, or other factors.
Restricted Securities. The Fund may invest in securities that are subject to legal or contractual restrictions on resale. These securities generally may be resold in transactions exempt from registration or to the public if the securities are registered. Disposal of these securities may involve time-consuming negotiations and expense, and prompt sale at an acceptable price may be difficult. Information regarding restricted securities is included at the end of the Fund's Schedule of Investments.
4. Purchases and Sales of Investments.
Purchases and sales of securities, other than short-term securities, aggregated $580,554,158 and $206,606,890, respectively.
5. Fees and Other Transactions with Affiliates.
Management Fee. Fidelity Management & Research Company (the investment adviser) and its affiliates provide the Fund with investment management related services for which the Fund pays a monthly management fee. The management fee is the sum of an individual fund fee rate that is based on an annual rate of .60% of the Fund's average net assets and an annualized group fee rate that averaged .24% during the period. The group fee rate is based upon the average net assets of all the mutual funds advised by the investment adviser, including any mutual funds previously advised by the investment adviser that are currently advised by Fidelity SelectCo, LLC, an affiliate of the investment adviser. The group fee rate decreases as assets under management increase and increases as assets under management decrease. In addition, the management fee is subject to a performance adjustment (up to a maximum of +/- .20% of the Fund's average net assets over a 36 month performance period). The upward or downward adjustment to the management fee is based on the relative investment performance of International Small Cap as compared to its benchmark index, the MSCI ACWI (All Country World Index) ex USA Small Cap Index effective April 1, 2014 (the MSCI EAFE Small Cap Index prior to April 1, 2014), over the same 36 month performance period. For the reporting period, the total annualized management fee rate, including the performance adjustment, was .95% of the Fund's average net assets. The performance adjustment included in the management fee rate may be higher or lower than the maximum performance adjustment rate due to the difference between the average net assets for the reporting and performance periods.
Distribution and Service Plan Fees. In accordance with Rule 12b-1 of the 1940 Act, the Fund has adopted separate Distribution and Service Plans for each class of shares. Certain classes pay Fidelity Distributors Corporation (FDC), an affiliate of the investment adviser, separate Distribution and Service Fees, each of which is based on an annual percentage of each class' average net assets. In addition, FDC may pay financial intermediaries for selling shares of the Fund and providing shareholder support services. For the period, the Distribution and Service Fee rates, total fees and amounts retained by FDC were as follows:
| Distribution Fee | Service Fee | Total Fees | Retained by FDC | |
| Class A | -% | .25% | $92,671 | $3,791 |
| Class M | .25% | .25% | 51,263 | 461 |
| Class C | .75% | .25% | 191,181 | 81,355 |
| $335,115 | $ 85,607 |
Sales Load. FDC may receive a front-end sales charge of up to 5.75% for selling Class A shares and 3.50% for selling Class M shares, some of which is paid to financial intermediaries for selling shares of the Fund. Depending on the holding period, FDC may receive contingent deferred sales charges levied on Class A, Class M and Class C redemptions. The deferred sales charges are 1.00% for Class C shares, 1.00% for certain purchases of Class A shares and .25% for certain purchases of Class M shares.
For the period, sales charge amounts retained by FDC were as follows:
| Retained by FDC | |
| Class A | $45,891 |
| Class M | 3,905 |
| Class C(a) | 4,863 |
| $54,659 |
(a) When Class C shares are initially sold, FDC pays commissions from its own resources to financial intermediaries through which the sales are made.
Transfer Agent Fees. Fidelity Investments Institutional Operations Company, Inc., (FIIOC), an affiliate of the investment adviser, is the transfer, dividend disbursing and shareholder servicing agent for each class of the Fund. FIIOC receives account fees and asset-based fees that vary according to the account size and type of account of the shareholders of the respective classes of the Fund. FIIOC pays for typesetting, printing and mailing of shareholder reports, except proxy statements.
For the period, transfer agent fees for each class were as follows:
| Amount | % of Class-Level Average Net Assets(a) | |
| Class A | $79,920 | .22 |
| Class M | 24,713 | .24 |
| Class C | 41,921 | .22 |
| International Small Cap | 1,305,374 | .17 |
| Class I | 338,265 | .19 |
| $1,790,193 |
(a) Annualized
Accounting and Security Lending Fees. Fidelity Service Company, Inc. (FSC), an affiliate of the investment adviser, maintains the Fund's accounting records. The accounting fee is based on the level of average net assets for each month. Under a separate contract, FSC administers the security lending program. The security lending fee is based on the number and duration of lending transactions. For the period, the fees were equivalent to an annualized rate of .04%.
Brokerage Commissions. The Fund placed a portion of its portfolio transactions with brokerage firms which are affiliates of the investment adviser. Brokerage commissions are included in net realized gain (loss) and change in net unrealized appreciation (depreciation) in the Statement of Operations. The commissions paid to these affiliated firms were $733 for the period.
Interfund Trades. The Fund may purchase from or sell securities to other Fidelity Funds under procedures adopted by the Board. The procedures have been designed to ensure these interfund trades are executed in accordance with Rule 17a-7 of the 1940 Act. Interfund trades are included within the respective purchases and sales amounts shown in the Purchases and Sales of Investments note.
6. Committed Line of Credit.
The Fund participates with other funds managed by the investment adviser or an affiliate in a $4.25 billion credit facility (the "line of credit") to be utilized for temporary or emergency purposes to fund shareholder redemptions or for other short-term liquidity purposes. The Fund has agreed to pay commitment fees on its pro-rata portion of the line of credit, which amounted to $2,743 and is reflected in Miscellaneous expenses on the Statement of Operations. During the period, the Fund did not borrow on this line of credit.
7. Security Lending.
The Fund lends portfolio securities through a lending agent from time to time in order to earn additional income. For equity securities, a lending agent is used and may loan securities to certain qualified borrowers, including Fidelity Capital Markets (FCM), a broker-dealer affiliated with the Fund. On the settlement date of the loan, the Fund receives collateral (in the form of U.S. Treasury obligations, letters of credit and/or cash) against the loaned securities and maintains collateral in an amount not less than 100% of the market value of the loaned securities during the period of the loan. The market value of the loaned securities is determined at the close of business of the Fund and any additional required collateral is delivered to the Fund on the next business day. The Fund or borrower may terminate the loan at any time, and if the borrower defaults on its obligation to return the securities loaned because of insolvency or other reasons, the Fund may apply collateral received from the borrower against the obligation. The Fund may experience delays and costs in recovering the securities loaned. Any cash collateral received is invested in the Fidelity Securities Lending Cash Central Fund. The value of loaned securities and cash collateral at period end are disclosed on the Fund's Statement of Assets and Liabilities. The value of securities loaned to FCM at period end was $2,383. Security lending income represents the income earned on investing cash collateral, less rebates paid to borrowers and any lending agent fees associated with the loan, plus any premium payments received for lending certain types of securities. Security lending income is presented in the Statement of Operations as a component of income from Fidelity Central Funds. Total security lending income during the period amounted to $127,675, including $46 from securities loaned to FCM.
8. Expense Reductions.
Commissions paid to certain brokers with whom the investment adviser, or its affiliates, places trades on behalf of the Fund include an amount in addition to trade execution, which may be rebated back to the Fund to offset certain expenses. This amount totaled $83,238 for the period. In addition, through arrangements with the Fund's custodian, credits realized as a result of certain uninvested cash balances were used to reduce the Fund's expenses. During the period, these credits reduced the Fund's custody expenses by $174.
In addition, during the period the investment adviser reimbursed and/or waived a portion of fund-level operating expenses in the amount of $9,116.
9. Distributions to Shareholders.
Distributions to shareholders of each class were as follows:
| Six months ended April 30, 2018 | Year ended October 31, 2017 | |
| From net investment income | ||
| Class A | $511,661 | $440,395 |
| Class M | 100,106 | 105,144 |
| Class C | 105,745 | 42,573 |
| International Small Cap | 13,927,531 | 13,342,577 |
| Class I | 2,593,133 | 462,523 |
| Total | $17,238,176 | $14,393,212 |
| From net realized gain | ||
| Class A | $1,639,043 | $461,138 |
| Class M | 488,601 | 163,369 |
| Class C | 748,093 | 151,895 |
| International Small Cap | 35,152,700 | 11,341,189 |
| Class I | 6,286,641 | 361,268 |
| Total | $44,315,078 | $12,478,859 |
10. Share Transactions.
Share transactions for each class were as follows and may contain automatic conversions between classes or exchanges between affiliated funds:
| Shares | Shares | Dollars | Dollars | |
| Six months ended April 30, 2018 | Year ended October 31, 2017 | Six months ended April 30, 2018 | Year ended October 31, 2017 | |
| Class A | ||||
| Shares sold | 958,071 | 1,346,483 | $28,483,183 | $35,353,222 |
| Reinvestment of distributions | 72,621 | 38,390 | 2,060,979 | 881,445 |
| Shares redeemed | (464,388) | (746,471) | (13,725,103) | (18,879,894) |
| Net increase (decrease) | 566,304 | 638,402 | $16,819,059 | $17,354,773 |
| Class M | ||||
| Shares sold | 168,813 | 165,476 | $4,987,396 | $4,273,457 |
| Reinvestment of distributions | 20,707 | 11,602 | 585,586 | 265,460 |
| Shares redeemed | (100,002) | (116,364) | (2,955,222) | (2,968,272) |
| Net increase (decrease) | 89,518 | 60,714 | $2,617,760 | $1,570,645 |
| Class C | ||||
| Shares sold | 851,231 | 554,853 | $24,484,610 | $14,330,189 |
| Reinvestment of distributions | 30,679 | 8,175 | 842,145 | 182,379 |
| Shares redeemed | (142,683) | (171,623) | (4,122,291) | (4,225,035) |
| Net increase (decrease) | 739,227 | 391,405 | $21,204,464 | $10,287,533 |
| International Small Cap | ||||
| Shares sold | 10,898,239 | 20,105,455 | $330,067,344 | $528,374,537 |
| Reinvestment of distributions | 1,616,727 | 1,029,746 | 46,674,910 | 24,013,687 |
| Shares redeemed | (8,200,708) | (10,901,622) | (246,043,950) | (292,534,899) |
| Net increase (decrease) | 4,314,258 | 10,233,579 | $130,698,304 | $259,853,325 |
| Class I | ||||
| Shares sold | 10,535,023 | 7,788,345 | $320,978,937 | $213,872,926 |
| Reinvestment of distributions | 286,614 | 29,052 | 8,326,151 | 682,131 |
| Shares redeemed | (1,416,324) | (824,089) | (43,133,420) | (22,829,284) |
| Net increase (decrease) | 9,405,313 | 6,993,308 | $286,171,668 | $191,725,773 |
11. Other.
The Fund's organizational documents provide former and current trustees and officers with a limited indemnification against liabilities arising in connection with the performance of their duties to the Fund. In the normal course of business, the Fund may also enter into contracts that provide general indemnifications. The Fund's maximum exposure under these arrangements is unknown as this would be dependent on future claims that may be made against the Fund. The risk of material loss from such claims is considered remote.
Shareholder Expense Example
As a shareholder of the Fund, you incur two types of costs: (1) transaction costs, including sales charges (loads) on purchase payments or redemption proceeds, redemption fees and (2) ongoing costs, including management fees, distribution and/or service (12b-1) fees and other Fund expenses. This Example is intended to help you understand your ongoing costs (in dollars) of investing in the Fund and to compare these costs with the ongoing costs of investing in other mutual funds.
The Example is based on an investment of $1,000 invested at the beginning of the period and held for the entire period (November 1, 2017 to April 30, 2018).
Actual Expenses
The first line of the accompanying table for each class of the Fund provides information about actual account values and actual expenses. You may use the information in this line, together with the amount you invested, to estimate the expenses that you paid over the period. Simply divide your account value by $1,000.00 (for example, an $8,600 account value divided by $1,000.00 = 8.6), then multiply the result by the number in the first line for a class of the Fund under the heading entitled "Expenses Paid During Period" to estimate the expenses you paid on your account during this period. A small balance maintenance fee of $12.00 that is charged once a year may apply for certain accounts with a value of less than $2,000. This fee is not included in the table below. If it was, the estimate of expenses you paid during the period would be higher, and your ending account value lower, by this amount. In addition, the Fund, as a shareholder in the underlying Fidelity Central Funds, will indirectly bear its pro-rata share of the fees and expenses incurred by the underlying Fidelity Central Funds. These fees and expenses are not included in the Fund's annualized expense ratio used to calculate the expense estimate in the table below.
Hypothetical Example for Comparison Purposes
The second line of the accompanying table for each class of the Fund provides information about hypothetical account values and hypothetical expenses based on a Class' actual expense ratio and an assumed rate of return of 5% per year before expenses, which is not the Class' actual return. The hypothetical account values and expenses may not be used to estimate the actual ending account balance or expenses you paid for the period. You may use this information to compare the ongoing costs of investing in the Fund and other funds. To do so, compare this 5% hypothetical example with the 5% hypothetical examples that appear in the shareholder reports of the other funds. A small balance maintenance fee of $12.00 that is charged once a year may apply for certain accounts with a value of less than $2,000. This fee is not included in the table below. If it was, the estimate of expenses you paid during the period would be higher, and your ending account value lower, by this amount. In addition, the Fund, as a shareholder in the underlying Fidelity Central Funds, will indirectly bear its pro-rata share of the fees and expenses incurred by the underlying Fidelity Central Funds. These fees and expenses are not included in the Fund's annualized expense ratio used to calculate the expense estimate in the table below.
Please note that the expenses shown in the table are meant to highlight your ongoing costs only and do not reflect any transaction costs. Therefore, the second line of the table is useful in comparing ongoing costs only, and will not help you determine the relative total costs of owning different funds. In addition, if these transactional costs were included, your costs would have been higher.
| Annualized Expense Ratio-A | Beginning Account Value November 1, 2017 | Ending Account Value April 30, 2018 | Expenses Paid During Period-B November 1, 2017 to April 30, 2018 | |
| Class A | 1.51% | |||
| Actual | $1,000.00 | $1,047.90 | $7.67 | |
| Hypothetical-C | $1,000.00 | $1,017.31 | $7.55 | |
| Class M | 1.78% | |||
| Actual | $1,000.00 | $1,046.30 | $9.03 | |
| Hypothetical-C | $1,000.00 | $1,015.97 | $8.90 | |
| Class C | 2.26% | |||
| Actual | $1,000.00 | $1,044.10 | $11.45 | |
| Hypothetical-C | $1,000.00 | $1,013.59 | $11.28 | |
| International Small Cap | 1.21% | |||
| Actual | $1,000.00 | $1,049.60 | $6.15 | |
| Hypothetical-C | $1,000.00 | $1,018.79 | $6.06 | |
| Class I | 1.23% | |||
| Actual | $1,000.00 | $1,049.30 | $6.25 | |
| Hypothetical-C | $1,000.00 | $1,018.70 | $6.16 |
A Annualized expense ratio reflects expenses net of applicable fee waivers.
B Expenses are equal to each Class' annualized expense ratio, multiplied by the average account value over the period, multiplied by 181/365 (to reflect the one-half year period).
C 5% return per year before expenses
![]()
AISC-SANN-0618
1.800644.114
Fidelity® International Small Cap Fund Semi-Annual Report April 30, 2018 |
|
Contents
To view a fund's proxy voting guidelines and proxy voting record for the 12-month period ended June 30, visit http://www.fidelity.com/proxyvotingresults or visit the Securities and Exchange Commission's (SEC) web site at http://www.sec.gov.
You may also call 1-800-544-8544 to request a free copy of the proxy voting guidelines.
Standard & Poor's, S&P and S&P 500 are registered service marks of The McGraw-Hill Companies, Inc. and have been licensed for use by Fidelity Distributors Corporation.
Other third-party marks appearing herein are the property of their respective owners.
All other marks appearing herein are registered or unregistered trademarks or service marks of FMR LLC or an affiliated company. © 2018 FMR LLC. All rights reserved.
This report and the financial statements contained herein are submitted for the general information of the shareholders of the Fund. This report is not authorized for distribution to prospective investors in the Fund unless preceded or accompanied by an effective prospectus.
A fund files its complete schedule of portfolio holdings with the SEC for the first and third quarters of each fiscal year on Form N-Q. Forms N-Q are available on the SEC’s web site at http://www.sec.gov. A fund's Forms N-Q may be reviewed and copied at the SEC’s Public Reference Room in Washington, DC. Information regarding the operation of the SEC's Public Reference Room may be obtained by calling 1-800-SEC-0330.
For a complete list of a fund's portfolio holdings, view the most recent holdings listing, semiannual report, or annual report on Fidelity's web site at http://www.fidelity.com, http://www.institutional.fidelity.com, or http://www.401k.com, as applicable.
NOT FDIC INSURED •MAY LOSE VALUE •NO BANK GUARANTEE
Neither the Fund nor Fidelity Distributors Corporation is a bank.
Investment Summary (Unaudited)
Geographic Diversification (% of fund's net assets)
| As of April 30, 2018 | ||
| Japan | 20.9% | |
| United Kingdom | 16.6% | |
| Canada | 6.1% | |
| United States of America* | 5.7% | |
| Australia | 5.4% | |
| Taiwan | 4.2% | |
| France | 3.6% | |
| Cayman Islands | 3.3% | |
| Netherlands | 2.8% | |
| Other | 31.4% | |

* Includes Short-Term investments and Net Other Assets (Liabilities).
Percentages are based on country or territory of incorporation and are adjusted for the effect of futures contracts, if applicable.
Asset Allocation as of April 30, 2018
| % of fund's net assets | |
| Stocks | 94.3 |
| Short-Term Investments and Net Other Assets (Liabilities) | 5.7 |
Top Ten Stocks as of April 30, 2018
| % of fund's net assets | |
| LivaNova PLC (United Kingdom, Health Care Equipment & Supplies) | 1.1 |
| S Foods, Inc. (Japan, Food Products) | 1.1 |
| Cineworld Group PLC (United Kingdom, Media) | 1.0 |
| PALTAC Corp. (Japan, Distributors) | 0.9 |
| Inghams Group Ltd. (Australia, Food Products) | 0.9 |
| Ship Healthcare Holdings, Inc. (Japan, Health Care Providers & Services) | 0.9 |
| Yamada Consulting Group Co. Ltd. (Japan, Professional Services) | 0.9 |
| JSR Corp. (Japan, Chemicals) | 0.8 |
| Paramount Bed Holdings Co. Ltd. (Japan, Health Care Equipment & Supplies) | 0.8 |
| Iida Group Holdings Co. Ltd. (Japan, Household Durables) | 0.8 |
| 9.2 |
Top Market Sectors as of April 30, 2018
| % of fund's net assets | |
| Industrials | 18.5 |
| Consumer Discretionary | 16.1 |
| Financials | 13.2 |
| Information Technology | 9.8 |
| Consumer Staples | 9.4 |
| Materials | 9.1 |
| Health Care | 7.8 |
| Real Estate | 5.4 |
| Energy | 4.2 |
| Utilities | 0.8 |
Schedule of Investments April 30, 2018 (Unaudited)
Showing Percentage of Net Assets
| Common Stocks - 93.7% | |||
| Shares | Value | ||
| Australia - 5.4% | |||
| Aub Group Ltd. | 842,699 | $8,910,490 | |
| Austal Ltd. | 3,090,176 | 4,100,048 | |
| Challenger Ltd. | 733,703 | 5,931,965 | |
| GUD Holdings Ltd. | 1,620,164 | 15,392,023 | |
| Hansen Technologies Ltd. | 1,184,292 | 3,816,380 | |
| Imdex Ltd. (a) | 14,676,164 | 13,685,594 | |
| Inghams Group Ltd. (b) | 7,044,815 | 19,877,203 | |
| Nanosonics Ltd. (a)(b) | 4,155,779 | 7,483,669 | |
| Pact Group Holdings Ltd. (c) | 3,120,432 | 13,286,704 | |
| Reckon Ltd. (a) | 5,088,250 | 4,892,901 | |
| Servcorp Ltd. | 2,706,893 | 9,725,561 | |
| Sigma Healthcare Ltd. | 14,870,654 | 8,640,981 | |
| SomnoMed Ltd. (a)(b) | 2,282,021 | 4,974,448 | |
| TOTAL AUSTRALIA | 120,717,967 | ||
| Austria - 1.8% | |||
| Andritz AG | 209,932 | 11,296,579 | |
| IMMOFINANZ Immobilien Anlagen AG | 5,519,743 | 14,491,105 | |
| Wienerberger AG | 576,900 | 14,560,287 | |
| TOTAL AUSTRIA | 40,347,971 | ||
| Belgium - 0.6% | |||
| Barco NV | 108,083 | 13,991,855 | |
| Bermuda - 1.8% | |||
| BW Offshore Ltd. (a) | 1,659,938 | 9,083,589 | |
| China Resource Gas Group Ltd. | 3,290,000 | 12,099,326 | |
| Hiscox Ltd. | 618,899 | 12,686,850 | |
| Petra Diamonds Ltd. (a) | 7,913,909 | 7,457,681 | |
| TOTAL BERMUDA | 41,327,446 | ||
| Brazil - 1.5% | |||
| Estacio Participacoes SA | 1,545,300 | 14,071,440 | |
| Notre Dame Intermedica Participacoes SA | 1,328,700 | 7,737,349 | |
| Sul America SA unit | 1,935,600 | 11,945,556 | |
| TOTAL BRAZIL | 33,754,345 | ||
| Canada - 6.1% | |||
| AutoCanada, Inc. (b) | 730,984 | 12,422,657 | |
| Dorel Industries, Inc. Class B (sub. vtg.) | 426,803 | 9,224,489 | |
| Genesis Land Development Corp. (d) | 2,185,422 | 6,212,695 | |
| Lassonde Industries, Inc. Class A (sub. vtg.) | 77,369 | 16,769,359 | |
| McCoy Global, Inc. (a) | 1,341,170 | 1,337,044 | |
| North West Co., Inc. | 748,800 | 16,102,160 | |
| Open Text Corp. | 349,096 | 12,324,874 | |
| Pinnacle Renewable Holds, Inc. | 945,625 | 10,524,539 | |
| Total Energy Services, Inc. | 623,400 | 6,612,958 | |
| TransForce, Inc. | 540,500 | 15,647,327 | |
| Western Forest Products, Inc. | 7,585,700 | 16,365,426 | |
| Whitecap Resources, Inc. (b) | 1,978,553 | 14,331,199 | |
| TOTAL CANADA | 137,874,727 | ||
| Cayman Islands - 3.3% | |||
| AMVIG Holdings Ltd. | 28,280,000 | 7,270,414 | |
| Best Pacific International Holdings Ltd. (b) | 16,978,000 | 6,686,902 | |
| China High Precision Automation Group Ltd. (a)(e) | 712,000 | 1 | |
| China Metal Recycling (Holdings) Ltd. (a)(e) | 436,800 | 1 | |
| Haitian International Holdings Ltd. | 2,433,000 | 6,474,948 | |
| Pico Far East Holdings Ltd. | 21,568,000 | 8,763,952 | |
| Precision Tsugami China Corp. Ltd. | 4,446,000 | 6,127,043 | |
| SITC International Holdings Co. Ltd. | 16,426,000 | 17,501,016 | |
| Value Partners Group Ltd. | 10,559,000 | 9,987,812 | |
| Xingda International Holdings Ltd. | 32,357,629 | 11,557,423 | |
| TOTAL CAYMAN ISLANDS | 74,369,512 | ||
| China - 1.2% | |||
| Qingdao Port International Co. Ltd. (c) | 18,171,000 | 14,928,770 | |
| Weifu High-Technology Co. Ltd. (B Shares) | 5,354,604 | 11,556,558 | |
| TOTAL CHINA | 26,485,328 | ||
| Denmark - 1.6% | |||
| Jyske Bank A/S (Reg.) | 173,403 | 10,424,360 | |
| Scandinavian Tobacco Group A/S (c) | 861,172 | 14,404,744 | |
| Spar Nord Bank A/S | 1,000,200 | 11,461,520 | |
| TOTAL DENMARK | 36,290,624 | ||
| Finland - 2.5% | |||
| Amer Group PLC (A Shares) | 462,945 | 14,199,931 | |
| Asiakastieto Group Oyj (c) | 434,223 | 16,517,582 | |
| Cramo Oyj (B Shares) | 385,210 | 9,061,699 | |
| Olvi PLC (A Shares) | 312,038 | 10,475,515 | |
| Tikkurila Oyj (b) | 309,646 | 5,601,449 | |
| TOTAL FINLAND | 55,856,176 | ||
| France - 3.6% | |||
| Altarea SCA | 59,530 | 15,168,458 | |
| Elis SA | 445,600 | 10,665,272 | |
| Maisons du Monde SA (c) | 219,360 | 8,921,803 | |
| Rexel SA | 637,600 | 9,894,060 | |
| The Vicat Group | 172,356 | 12,706,770 | |
| Thermador Groupe SA | 69,583 | 10,041,397 | |
| Wendel SA | 86,635 | 13,098,477 | |
| TOTAL FRANCE | 80,496,237 | ||
| Germany - 1.0% | |||
| Bertrandt AG | 108,700 | 12,174,933 | |
| SHW Group | 230,249 | 9,842,924 | |
| TOTAL GERMANY | 22,017,857 | ||
| Greece - 0.8% | |||
| Mytilineos Holdings SA | 1,410,316 | 17,030,976 | |
| Hong Kong - 2.2% | |||
| Dah Sing Banking Group Ltd. | 6,806,000 | 16,161,988 | |
| Far East Horizon Ltd. | 7,833,000 | 7,772,590 | |
| Magnificent Hotel Investment Ltd. | 250,688,000 | 6,808,440 | |
| Sino Land Ltd. | 7,485,251 | 12,920,859 | |
| Techtronic Industries Co. Ltd. | 1,109,500 | 6,499,664 | |
| TOTAL HONG KONG | 50,163,541 | ||
| India - 0.5% | |||
| PC Jeweller Ltd. | 299,199 | 647,763 | |
| Torrent Pharmaceuticals Ltd. | 521,957 | 11,099,383 | |
| TOTAL INDIA | 11,747,146 | ||
| Indonesia - 0.6% | |||
| PT ACE Hardware Indonesia Tbk | 78,180,500 | 7,261,444 | |
| PT Media Nusantara Citra Tbk | 66,452,500 | 6,286,841 | |
| TOTAL INDONESIA | 13,548,285 | ||
| Ireland - 1.3% | |||
| Mincon Group PLC | 7,189,744 | 11,113,389 | |
| Origin Enterprises PLC | 920,300 | 5,934,632 | |
| United Drug PLC (United Kingdom) | 889,849 | 11,209,254 | |
| TOTAL IRELAND | 28,257,275 | ||
| Isle of Man - 0.8% | |||
| Playtech Ltd. | 1,588,474 | 17,726,624 | |
| Israel - 0.7% | |||
| Frutarom Industries Ltd. | 159,889 | 15,349,380 | |
| Italy - 0.8% | |||
| Banca Generali SpA | 372,000 | 12,093,196 | |
| Banco di Desio e della Brianza SpA | 2,225,581 | 6,369,640 | |
| TOTAL ITALY | 18,462,836 | ||
| Japan - 20.9% | |||
| A/S One Corp. | 167,200 | 11,379,144 | |
| Aeon Delight Co. Ltd. | 391,100 | 13,719,983 | |
| Arc Land Sakamoto Co. Ltd. | 786,500 | 12,424,858 | |
| Aucnet, Inc. | 845,500 | 10,974,794 | |
| Broadleaf Co. Ltd. | 1,874,000 | 8,948,299 | |
| Central Automotive Products Ltd. | 339,100 | 5,288,744 | |
| Daiwa Industries Ltd. | 902,900 | 9,886,309 | |
| Dexerials Corp. | 1,321,000 | 12,458,388 | |
| Funai Soken Holdings, Inc. | 297,180 | 6,964,647 | |
| GMO Internet, Inc. | 562,400 | 10,366,228 | |
| Iida Group Holdings Co. Ltd. | 938,051 | 18,371,453 | |
| Isuzu Motors Ltd. | 836,400 | 12,807,662 | |
| Japan Meat Co. Ltd. | 682,900 | 12,218,738 | |
| JSR Corp. | 1,008,000 | 19,040,615 | |
| Kirindo Holdings Co. Ltd. (d) | 636,109 | 17,310,870 | |
| Kotobuki Spirits Co. Ltd. | 141,500 | 6,743,643 | |
| Meitec Corp. | 187,900 | 10,330,031 | |
| Mitani Shoji Co. Ltd. | 274,300 | 13,047,567 | |
| Morinaga & Co. Ltd. | 298,300 | 14,543,899 | |
| Nihon Parkerizing Co. Ltd. | 852,600 | 13,531,476 | |
| Nitori Holdings Co. Ltd. | 31,100 | 5,257,300 | |
| Otsuka Corp. | 139,600 | 6,512,623 | |
| PALTAC Corp. | 423,300 | 21,219,210 | |
| Paramount Bed Holdings Co. Ltd. | 370,700 | 18,446,835 | |
| Renesas Electronics Corp. (a)(b) | 1,345,600 | 14,130,523 | |
| Ricoh Leasing Co. Ltd. | 179,300 | 5,994,708 | |
| S Foods, Inc. | 562,900 | 23,711,622 | |
| San-Ai Oil Co. Ltd. | 797,600 | 12,578,324 | |
| Shinsei Bank Ltd. | 862,000 | 13,467,764 | |
| Ship Healthcare Holdings, Inc. | 563,000 | 19,595,820 | |
| Taiheiyo Cement Corp. | 319,400 | 12,110,437 | |
| TKC Corp. | 253,300 | 10,137,098 | |
| Toshiba Plant Systems & Services Corp. | 814,800 | 17,038,353 | |
| Tsuruha Holdings, Inc. | 79,200 | 11,396,048 | |
| VT Holdings Co. Ltd. | 1,557,200 | 7,107,966 | |
| Welcia Holdings Co. Ltd. | 182,900 | 9,419,383 | |
| Yamada Consulting Group Co. Ltd. (b) | 681,580 | 19,389,991 | |
| TOTAL JAPAN | 467,871,353 | ||
| Korea (South) - 0.9% | |||
| Hyundai Fire & Marine Insurance Co. Ltd. | 371,155 | 13,256,464 | |
| NS Shopping Co. Ltd. | 527,567 | 6,896,784 | |
| TOTAL KOREA (SOUTH) | 20,153,248 | ||
| Mexico - 1.0% | |||
| Credito Real S.A.B. de CV | 6,791,300 | 9,964,323 | |
| Genomma Lab Internacional SA de CV (a) | 13,330,400 | 12,965,422 | |
| TOTAL MEXICO | 22,929,745 | ||
| Netherlands - 2.8% | |||
| Amsterdam Commodities NV | 409,155 | 10,919,512 | |
| Arcadis NV | 609,889 | 12,034,442 | |
| Arcadis NV rights (a)(f) | 591,025 | 335,449 | |
| Basic-Fit NV (a)(c) | 301,600 | 9,087,093 | |
| BinckBank NV | 1,260,658 | 7,353,050 | |
| Philips Lighting NV (c) | 393,600 | 11,996,859 | |
| RHI Magnesita NV | 178,110 | 10,668,248 | |
| TOTAL NETHERLANDS | 62,394,653 | ||
| New Zealand - 0.9% | |||
| Air New Zealand Ltd. | 4,896,856 | 11,266,549 | |
| EBOS Group Ltd. | 752,917 | 9,418,998 | |
| TOTAL NEW ZEALAND | 20,685,547 | ||
| Norway - 0.8% | |||
| ABG Sundal Collier ASA | 9,132,540 | 7,194,652 | |
| Ekornes A/S | 714,399 | 9,920,353 | |
| TOTAL NORWAY | 17,115,005 | ||
| Philippines - 0.3% | |||
| Century Pacific Food, Inc. | 22,658,800 | 7,241,940 | |
| Romania - 0.6% | |||
| Banca Transilvania SA | 20,050,864 | 13,327,062 | |
| Singapore - 1.5% | |||
| Boustead Singapore Ltd. | 8,703,269 | 5,289,441 | |
| Hour Glass Ltd. | 8,112,100 | 3,972,547 | |
| Mapletree Industrial (REIT) | 8,115,894 | 12,386,912 | |
| Wing Tai Holdings Ltd. | 7,995,300 | 12,250,164 | |
| TOTAL SINGAPORE | 33,899,064 | ||
| South Africa - 0.6% | |||
| Clicks Group Ltd. | 740,718 | 12,664,000 | |
| Spain - 0.5% | |||
| Hispania Activos Inmobiliarios SA | 583,585 | 12,403,376 | |
| Sweden - 1.7% | |||
| AddTech AB (B Shares) | 423,019 | 8,821,098 | |
| Coor Service Management Holding AB | 631,700 | 4,393,293 | |
| Granges AB | 1,034,787 | 14,535,102 | |
| Victoria Park AB | 2,748,800 | 11,316,455 | |
| TOTAL SWEDEN | 39,065,948 | ||
| Switzerland - 0.6% | |||
| Vontobel Holdings AG | 202,029 | 13,373,464 | |
| Taiwan - 4.2% | |||
| King's Town Bank | 9,032,000 | 10,799,437 | |
| Lumax International Corp. Ltd. | 4,466,600 | 8,940,627 | |
| Makalot Industrial Co. Ltd. | 3,031,540 | 14,568,597 | |
| Sporton International, Inc. | 1,268,000 | 7,022,129 | |
| Test Research, Inc. | 5,526,000 | 10,111,298 | |
| Tripod Technology Corp. | 3,836,000 | 11,582,948 | |
| United Microelectronics Corp. | 25,269,000 | 13,602,734 | |
| Yageo Corp. | 537,457 | 11,245,669 | |
| Yung Chi Paint & Varnish Manufacturing Co. Ltd. | 2,243,000 | 6,052,776 | |
| TOTAL TAIWAN | 93,926,215 | ||
| Thailand - 1.4% | |||
| Delta Electronics PCL (For. Reg.) | 3,327,600 | 7,080,667 | |
| Star Petroleum Refining PCL | 28,176,000 | 13,971,387 | |
| TISCO Financial Group PCL | 3,439,000 | 9,643,752 | |
| TOTAL THAILAND | 30,695,806 | ||
| Turkey - 0.3% | |||
| Aygaz A/S | 1,821,000 | 6,042,953 | |
| United Kingdom - 16.6% | |||
| AEW UK REIT PLC (b) | 4,299,768 | 5,765,584 | |
| Alliance Pharma PLC | 9,361,865 | 10,439,668 | |
| Bond International Software PLC (a)(e) | 899,666 | 12 | |
| Cineworld Group PLC | 6,230,280 | 22,335,098 | |
| Close Brothers Group PLC | 445,123 | 9,412,621 | |
| Countrywide PLC (a) | 6,406,807 | 9,508,231 | |
| Diploma PLC | 566,151 | 9,399,806 | |
| Elementis PLC | 3,115,800 | 12,165,084 | |
| Essentra PLC | 1,774,555 | 10,773,762 | |
| Indivior PLC (a) | 1,927,100 | 12,020,918 | |
| Informa PLC | 1,727,149 | 17,571,691 | |
| ITE Group PLC | 3,929,619 | 8,223,058 | |
| James Fisher and Sons PLC | 333,700 | 7,690,436 | |
| Jardine Lloyd Thompson Group PLC | 430,740 | 7,246,457 | |
| John Wood Group PLC | 2,157,400 | 16,887,947 | |
| LivaNova PLC (a) | 283,200 | 25,142,488 | |
| Luxfer Holdings PLC sponsored | 1,220,309 | 17,084,326 | |
| McColl's Retail Group PLC | 4,684,981 | 15,157,061 | |
| Mears Group PLC | 2,690,912 | 12,113,972 | |
| Melrose Industries PLC | 4,250,368 | 13,341,378 | |
| Micro Focus International PLC | 1,023,440 | 17,647,311 | |
| Moneysupermarket.com Group PLC | 3,813,400 | 15,733,974 | |
| PayPoint PLC | 769,511 | 9,100,124 | |
| Sabre Insurance Group PLC (a)(c) | 2,480,615 | 8,742,560 | |
| Sinclair Pharma PLC (a)(b) | 20,361,055 | 4,204,660 | |
| Spectris PLC | 293,956 | 10,886,140 | |
| Ten Entertainment Group PLC (d) | 3,787,019 | 13,086,109 | |
| The Weir Group PLC | 407,670 | 11,988,071 | |
| Topps Tiles PLC | 5,671,810 | 5,387,783 | |
| Tullett Prebon PLC | 2,313,614 | 15,008,438 | |
| Ultra Electronics Holdings PLC | 386,697 | 7,495,710 | |
| Volution Group PLC | 3,689,700 | 10,006,832 | |
| TOTAL UNITED KINGDOM | 371,567,310 | ||
| TOTAL COMMON STOCKS | |||
| (Cost $1,765,281,979) | 2,101,172,797 | ||
| Nonconvertible Preferred Stocks - 0.6% | |||
| Brazil - 0.6% | |||
| Alpargatas SA (PN) | 813,000 | 3,622,668 | |
| Banco ABC Brasil SA | 1,960,322 | 10,497,728 | |
| TOTAL NON CONVERTIBLE PREFERRED STOCKS | |||
| (Cost $10,494,161) | 14,120,396 | ||
| Money Market Funds - 6.0% | |||
| Fidelity Cash Central Fund, 1.74% (g) | 111,941,625 | 111,964,014 | |
| Fidelity Securities Lending Cash Central Fund 1.74% (g)(h) | 22,190,121 | 22,192,340 | |
| TOTAL MONEY MARKET FUNDS | |||
| (Cost $134,147,862) | 134,156,354 | ||
| TOTAL INVESTMENT IN SECURITIES - 100.3% | |||
| (Cost $1,909,924,002) | 2,249,449,547 | ||
| NET OTHER ASSETS (LIABILITIES) - (0.3)% | (6,102,325) | ||
| NET ASSETS - 100% | $2,243,347,222 |
Categorizations in the Schedule of Investments are based on country or territory of incorporation.
Legend
(a) Non-income producing
(b) Security or a portion of the security is on loan at period end.
(c) Security exempt from registration under Rule 144A of the Securities Act of 1933. These securities may be resold in transactions exempt from registration, normally to qualified institutional buyers. At the end of the period, the value of these securities amounted to $97,886,115 or 4.4% of net assets.
(d) Affiliated company
(e) Level 3 security
(f) Security or a portion of the security purchased on a delayed delivery or when-issued basis.
(g) Affiliated fund that is generally available only to investment companies and other accounts managed by Fidelity Investments. The rate quoted is the annualized seven-day yield of the fund at period end. A complete unaudited listing of the fund's holdings as of its most recent quarter end is available upon request. In addition, each Fidelity Central Fund's financial statements are available on the SEC's website or upon request.
(h) Investment made with cash collateral received from securities on loan.
Affiliated Central Funds
Information regarding fiscal year to date income earned by the Fund from investments in Fidelity Central Funds is as follows:
| Fund | Income earned |
| Fidelity Cash Central Fund | $599,997 |
| Fidelity Securities Lending Cash Central Fund | 127,675 |
| Total | $727,672 |
Amounts in the income column in the above table include any capital gain distributions from underlying funds, which are presented in the corresponding line-item in the Statement of Operations if applicable.
Other Affiliated Issuers
An affiliated company is a company in which the Fund has ownership of at least 5% of the voting securities. Fiscal year to date transactions with companies which are or were affiliates are as follows:
| Affiliate | Value, beginning of period | Purchases | Sales Proceeds | Dividend Income | Realized Gain (loss) | Change in Unrealized appreciation (depreciation) | Value, end of period |
| Genesis Land Development Corp. | $6,005,072 | $437,434 | $-- | $340,481 | $-- | $(229,811) | $6,212,695 |
| Kirindo Holdings Co. Ltd. | 8,403,137 | 145,984 | -- | 93,640 | -- | 8,761,749 | 17,310,870 |
| Ten Entertainment Group PLC | 10,172,260 | 863,195 | -- | 141,686 | -- | 2,050,654 | 13,086,109 |
| Total | $24,580,469 | $1,446,613 | $-- | $575,807 | $-- | $10,582,592 | $36,609,674 |
Investment Valuation
The following is a summary of the inputs used, as of April 30, 2018, involving the Fund's assets and liabilities carried at fair value. The inputs or methodology used for valuing securities may not be an indication of the risk associated with investing in those securities. For more information on valuation inputs, and their aggregation into the levels used below, please refer to the Investment Valuation section in the accompanying Notes to Financial Statements.
| Valuation Inputs at Reporting Date: | ||||
| Description | Total | Level 1 | Level 2 | Level 3 |
| Investments in Securities: | ||||
| Equities: | ||||
| Consumer Discretionary | $365,019,852 | $265,017,698 | $100,002,154 | $-- |
| Consumer Staples | 210,485,585 | 170,702,442 | 39,783,143 | -- |
| Energy | 93,017,423 | 79,046,036 | 13,971,387 | -- |
| Financials | 296,531,668 | 227,323,634 | 69,208,034 | -- |
| Health Care | 174,759,037 | 142,560,556 | 32,198,481 | -- |
| Industrials | 411,585,167 | 341,201,145 | 70,384,022 | -- |
| Information Technology | 218,441,576 | 138,461,655 | 79,979,908 | 13 |
| Materials | 205,161,206 | 164,865,717 | 40,295,488 | 1 |
| Real Estate | 122,149,400 | 74,865,904 | 47,283,496 | -- |
| Utilities | 18,142,279 | 6,042,953 | 12,099,326 | -- |
| Money Market Funds | 134,156,354 | 134,156,354 | -- | -- |
| Total Investments in Securities: | $2,249,449,547 | $1,744,244,094 | $505,205,439 | $14 |
The following is a summary of transfers between Level 1 and Level 2 for the period ended April 30, 2018. Transfers are assumed to have occurred at the beginning of the period, and are primarily attributable to the valuation techniques used for foreign equity securities, as discussed in the accompanying Notes to Financial Statements:
| Transfers | Total |
| Level 1 to Level 2 | $384,514,688 |
| Level 2 to Level 1 | $347,514,101 |
See accompanying notes which are an integral part of the financial statements.
Financial Statements
Statement of Assets and Liabilities
| April 30, 2018 (Unaudited) | ||
| Assets | ||
| Investment in securities, at value (including securities loaned of $20,752,949) — See accompanying schedule: Unaffiliated issuers (cost $1,753,971,568) | $2,078,683,519 | |
| Fidelity Central Funds (cost $134,147,862) | 134,156,354 | |
| Other affiliated issuers (cost $21,804,572) | 36,609,674 | |
| Total Investment in Securities (cost $1,909,924,002) | $2,249,449,547 | |
| Foreign currency held at value (cost $1,048,881) | 1,048,844 | |
| Receivable for investments sold | 12,247,269 | |
| Receivable for fund shares sold | 7,639,547 | |
| Dividends receivable | 11,929,766 | |
| Distributions receivable from Fidelity Central Funds | 174,267 | |
| Prepaid expenses | 748 | |
| Other receivables | 39,244 | |
| Total assets | 2,282,529,232 | |
| Liabilities | ||
| Payable for investments purchased | ||
| Regular delivery | $12,803,668 | |
| Delayed delivery | 336,269 | |
| Payable for fund shares redeemed | 1,417,926 | |
| Accrued management fee | 1,742,160 | |
| Distribution and service plan fees payable | 63,997 | |
| Other affiliated payables | 402,173 | |
| Other payables and accrued expenses | 221,477 | |
| Collateral on securities loaned | 22,194,340 | |
| Total liabilities | 39,182,010 | |
| Net Assets | $2,243,347,222 | |
| Net Assets consist of: | ||
| Paid in capital | $1,868,463,199 | |
| Undistributed net investment income | 12,989,640 | |
| Accumulated undistributed net realized gain (loss) on investments and foreign currency transactions | 22,511,385 | |
| Net unrealized appreciation (depreciation) on investments and assets and liabilities in foreign currencies | 339,382,998 | |
| Net Assets | $2,243,347,222 | |
| Calculation of Maximum Offering Price | ||
| Class A: | ||
| Net Asset Value and redemption price per share ($81,091,775 ÷ 2,736,547 shares) | $29.63 | |
| Maximum offering price per share (100/94.25 of $29.63) | $31.44 | |
| Class M: | ||
| Net Asset Value and redemption price per share ($21,053,093 ÷ 713,895 shares) | $29.49 | |
| Maximum offering price per share (100/96.50 of $29.49) | $30.56 | |
| Class C: | ||
| Net Asset Value and offering price per share ($47,467,944 ÷ 1,661,085 shares)(a) | $28.58 | |
| International Small Cap: | ||
| Net Asset Value, offering price and redemption price per share ($1,567,588,848 ÷ 51,956,328 shares) | $30.17 | |
| Class I: | ||
| Net Asset Value, offering price and redemption price per share ($526,145,562 ÷ 17,329,194 shares) | $30.36 |
(a) Redemption price per share is equal to net asset value less any applicable contingent deferred sales charge.
See accompanying notes which are an integral part of the financial statements.
Statement of Operations
| Six months ended April 30, 2018 (Unaudited) | ||
| Investment Income | ||
| Dividends (including $575,807 earned from other affiliated issuers) | $28,295,201 | |
| Income from Fidelity Central Funds | 727,672 | |
| Income before foreign taxes withheld | 29,022,873 | |
| Less foreign taxes withheld | (2,782,322) | |
| Total income | 26,240,551 | |
| Expenses | ||
| Management fee | ||
| Basic fee | $8,488,393 | |
| Performance adjustment | 1,123,615 | |
| Transfer agent fees | 1,790,193 | |
| Distribution and service plan fees | 335,115 | |
| Accounting and security lending fees | 445,735 | |
| Custodian fees and expenses | 275,592 | |
| Independent trustees' fees and expenses | 3,832 | |
| Registration fees | 143,461 | |
| Audit | 39,330 | |
| Legal | 3,626 | |
| Miscellaneous | 5,452 | |
| Total expenses before reductions | 12,654,344 | |
| Expense reductions | (92,528) | 12,561,816 |
| Net investment income (loss) | 13,678,735 | |
| Realized and Unrealized Gain (Loss) | ||
| Net realized gain (loss) on: | ||
| Investment securities: | ||
| Unaffiliated issuers (net of foreign taxes of $131) | 38,623,604 | |
| Fidelity Central Funds | (251) | |
| Foreign currency transactions | (135,559) | |
| Total net realized gain (loss) | 38,487,794 | |
| Change in net unrealized appreciation (depreciation) on: | ||
| Investment securities: | ||
| Unaffiliated issuers | 21,111,397 | |
| Fidelity Central Funds | (295) | |
| Other affiliated issuers | 10,582,592 | |
| Assets and liabilities in foreign currencies | (52,418) | |
| Total change in net unrealized appreciation (depreciation) | 31,641,276 | |
| Net gain (loss) | 70,129,070 | |
| Net increase (decrease) in net assets resulting from operations | $83,807,805 |
See accompanying notes which are an integral part of the financial statements.
Statement of Changes in Net Assets
| Six months ended April 30, 2018 (Unaudited) | Year ended October 31, 2017 | |
| Increase (Decrease) in Net Assets | ||
| Operations | ||
| Net investment income (loss) | $13,678,735 | $18,356,208 |
| Net realized gain (loss) | 38,487,794 | 41,195,813 |
| Change in net unrealized appreciation (depreciation) | 31,641,276 | 258,657,737 |
| Net increase (decrease) in net assets resulting from operations | 83,807,805 | 318,209,758 |
| Distributions to shareholders from net investment income | (17,238,176) | (14,393,212) |
| Distributions to shareholders from net realized gain | (44,315,078) | (12,478,859) |
| Total distributions | (61,553,254) | (26,872,071) |
| Share transactions - net increase (decrease) | 457,511,255 | 480,792,049 |
| Redemption fees | 48,167 | 258,237 |
| Total increase (decrease) in net assets | 479,813,973 | 772,387,973 |
| Net Assets | ||
| Beginning of period | 1,763,533,249 | 991,145,276 |
| End of period | $2,243,347,222 | $1,763,533,249 |
| Other Information | ||
| Undistributed net investment income end of period | $12,989,640 | $16,549,081 |
See accompanying notes which are an integral part of the financial statements.
Financial Highlights
Fidelity International Small Cap Fund Class A
| Six months ended (Unaudited) April 30, | Years endedOctober 31, | |||||
| 2018 | 2017 | 2016 | 2015 | 2014 | 2013 | |
| Selected Per–Share Data | ||||||
| Net asset value, beginning of period | $29.24 | $23.81 | $22.69 | $24.98 | $26.34 | $19.74 |
| Income from Investment Operations | ||||||
| Net investment income (loss)A | .16 | .29 | .34 | .27 | .17 | .06 |
| Net realized and unrealized gain (loss) | 1.20 | 5.70 | 1.64 | 1.05 | (.89) | 6.94 |
| Total from investment operations | 1.36 | 5.99 | 1.98 | 1.32 | (.72) | 7.00 |
| Distributions from net investment income | (.23) | (.28) | (.25) | (.16) | (.05) | (.07) |
| Distributions from net realized gain | (.74) | (.29) | (.62) | (3.45) | (.60) | (.33) |
| Total distributions | (.97) | (.57) | (.87) | (3.61) | (.65) | (.40) |
| Redemption fees added to paid in capitalA | –B | .01 | .01 | –B | .01 | –B |
| Net asset value, end of period | $29.63 | $29.24 | $23.81 | $22.69 | $24.98 | $26.34 |
| Total ReturnC,D,E | 4.79% | 25.83% | 9.11% | 6.21% | (2.79)% | 36.18% |
| Ratios to Average Net AssetsF,G | ||||||
| Expenses before reductions | 1.51%H | 1.55% | 1.61% | 1.59% | 1.50% | 1.61% |
| Expenses net of fee waivers, if any | 1.51%H | 1.55% | 1.61% | 1.58% | 1.50% | 1.61% |
| Expenses net of all reductions | 1.50%H | 1.55% | 1.61% | 1.58% | 1.50% | 1.60% |
| Net investment income (loss) | 1.10%H | 1.11% | 1.50% | 1.18% | .65% | .25% |
| Supplemental Data | ||||||
| Net assets, end of period (000 omitted) | $81,092 | $63,459 | $36,480 | $28,238 | $24,572 | $24,020 |
| Portfolio turnover rateI | 21%H | 22% | 29% | 36% | 102% | 54% |
A Calculated based on average shares outstanding during the period.
B Amount represents less than $.005 per share.
C Total returns for periods of less than one year are not annualized.
D Total returns would have been lower if certain expenses had not been reduced during the applicable periods shown.
E Total returns do not include the effect of the sales charges.
F Fees and expenses of any underlying Fidelity Central Funds are not included in the Fund's expense ratio. The Fund indirectly bears its proportionate share of the expenses of any underlying Fidelity Central Funds.
G Expense ratios reflect operating expenses of the class. Expenses before reductions do not reflect amounts reimbursed by the investment adviser or reductions from brokerage service arrangements or reductions from other expense offset arrangements and do not represent the amount paid by the class during periods when reimbursements or reductions occur. Expenses net of fee waivers reflect expenses after reimbursement by the investment adviser but prior to reductions from brokerage service arrangements or other expense offset arrangements. Expenses net of all reductions represent the net expenses paid by the class.
H Annualized
I Amount does not include the portfolio activity of any underlying Fidelity Central Funds.
See accompanying notes which are an integral part of the financial statements.
Fidelity International Small Cap Fund Class M
| Six months ended (Unaudited) April 30, | Years endedOctober 31, | |||||
| 2018 | 2017 | 2016 | 2015 | 2014 | 2013 | |
| Selected Per–Share Data | ||||||
| Net asset value, beginning of period | $29.07 | $23.65 | $22.55 | $24.81 | $26.17 | $19.59 |
| Income from Investment Operations | ||||||
| Net investment income (loss)A | .12 | .21 | .27 | .21 | .10 | –B |
| Net realized and unrealized gain (loss) | 1.19 | 5.69 | 1.63 | 1.04 | (.87) | 6.90 |
| Total from investment operations | 1.31 | 5.90 | 1.90 | 1.25 | (.77) | 6.90 |
| Distributions from net investment income | (.15) | (.19) | (.19) | (.06) | – | – |
| Distributions from net realized gain | (.74) | (.29) | (.62) | (3.45) | (.60) | (.32) |
| Total distributions | (.89) | (.48) | (.81) | (3.51) | (.60) | (.32) |
| Redemption fees added to paid in capitalA | –B | –B | .01 | –B | .01 | –B |
| Net asset value, end of period | $29.49 | $29.07 | $23.65 | $22.55 | $24.81 | $26.17 |
| Total ReturnC,D,E | 4.63% | 25.47% | 8.79% | 5.90% | (3.00)% | 35.80% |
| Ratios to Average Net AssetsF,G | ||||||
| Expenses before reductions | 1.78%H | 1.84% | 1.90% | 1.87% | 1.77% | 1.87% |
| Expenses net of fee waivers, if any | 1.78%H | 1.84% | 1.90% | 1.86% | 1.77% | 1.87% |
| Expenses net of all reductions | 1.77%H | 1.84% | 1.90% | 1.86% | 1.76% | 1.85% |
| Net investment income (loss) | .82%H | .82% | 1.21% | .90% | .38% | (.01)% |
| Supplemental Data | ||||||
| Net assets, end of period (000 omitted) | $21,053 | $18,148 | $13,331 | $12,400 | $12,296 | $13,530 |
| Portfolio turnover rateI | 21%H | 22% | 29% | 36% | 102% | 54% |
A Calculated based on average shares outstanding during the period.
B Amount represents less than $.005 per share.
C Total returns for periods of less than one year are not annualized.
D Total returns would have been lower if certain expenses had not been reduced during the applicable periods shown.
E Total returns do not include the effect of the sales charges.
F Fees and expenses of any underlying Fidelity Central Funds are not included in the Fund's expense ratio. The Fund indirectly bears its proportionate share of the expenses of any underlying Fidelity Central Funds.
G Expense ratios reflect operating expenses of the class. Expenses before reductions do not reflect amounts reimbursed by the investment adviser or reductions from brokerage service arrangements or reductions from other expense offset arrangements and do not represent the amount paid by the class during periods when reimbursements or reductions occur. Expenses net of fee waivers reflect expenses after reimbursement by the investment adviser but prior to reductions from brokerage service arrangements or other expense offset arrangements. Expenses net of all reductions represent the net expenses paid by the class.
H Annualized
I Amount does not include the portfolio activity of any underlying Fidelity Central Funds.
See accompanying notes which are an integral part of the financial statements.
Fidelity International Small Cap Fund Class C
| Six months ended (Unaudited) April 30, | Years endedOctober 31, | |||||
| 2018 | 2017 | 2016 | 2015 | 2014 | 2013 | |
| Selected Per–Share Data | ||||||
| Net asset value, beginning of period | $28.21 | $22.97 | $21.96 | $24.27 | $25.68 | $19.18 |
| Income from Investment Operations | ||||||
| Net investment income (loss)A | .05 | .08 | .16 | .09 | (.02) | (.11) |
| Net realized and unrealized gain (loss) | 1.16 | 5.53 | 1.59 | 1.02 | (.85) | 6.79 |
| Total from investment operations | 1.21 | 5.61 | 1.75 | 1.11 | (.87) | 6.68 |
| Distributions from net investment income | (.10) | (.08) | (.13) | – | – | – |
| Distributions from net realized gain | (.74) | (.29) | (.62) | (3.42) | (.55) | (.18) |
| Total distributions | (.84) | (.37) | (.75) | (3.42) | (.55) | (.18) |
| Redemption fees added to paid in capitalA | –B | –B | .01 | –B | .01 | –B |
| Net asset value, end of period | $28.58 | $28.21 | $22.97 | $21.96 | $24.27 | $25.68 |
| Total ReturnC,D,E | 4.41% | 24.85% | 8.26% | 5.37% | (3.43)% | 35.15% |
| Ratios to Average Net AssetsF,G | ||||||
| Expenses before reductions | 2.26%H | 2.33% | 2.40% | 2.36% | 2.23% | 2.33% |
| Expenses net of fee waivers, if any | 2.26%H | 2.33% | 2.40% | 2.35% | 2.22% | 2.33% |
| Expenses net of all reductions | 2.25%H | 2.32% | 2.39% | 2.35% | 2.22% | 2.32% |
| Net investment income (loss) | .35%H | .33% | .71% | .41% | (.07)% | (.47)% |
| Supplemental Data | ||||||
| Net assets, end of period (000 omitted) | $47,468 | $26,005 | $12,187 | $11,359 | $12,576 | $13,426 |
| Portfolio turnover rateI | 21%H | 22% | 29% | 36% | 102% | 54% |
A Calculated based on average shares outstanding during the period.
B Amount represents less than $.005 per share.
C Total returns for periods of less than one year are not annualized.
D Total returns would have been lower if certain expenses had not been reduced during the applicable periods shown.
E Total returns do not include the effect of the contingent deferred sales charge.
F Fees and expenses of any underlying Fidelity Central Funds are not included in the Fund's expense ratio. The Fund indirectly bears its proportionate share of the expenses of any underlying Fidelity Central Funds.
G Expense ratios reflect operating expenses of the class. Expenses before reductions do not reflect amounts reimbursed by the investment adviser or reductions from brokerage service arrangements or reductions from other expense offset arrangements and do not represent the amount paid by the class during periods when reimbursements or reductions occur. Expenses net of fee waivers reflect expenses after reimbursement by the investment adviser but prior to reductions from brokerage service arrangements or other expense offset arrangements. Expenses net of all reductions represent the net expenses paid by the class.
H Annualized
I Amount does not include the portfolio activity of any underlying Fidelity Central Funds.
See accompanying notes which are an integral part of the financial statements.
Fidelity International Small Cap Fund
| Six months ended (Unaudited) April 30, | Years endedOctober 31, | |||||
| 2018 | 2017 | 2016 | 2015 | 2014 | 2013 | |
| Selected Per–Share Data | ||||||
| Net asset value, beginning of period | $29.77 | $24.23 | $23.06 | $25.34 | $26.67 | $19.99 |
| Income from Investment Operations | ||||||
| Net investment income (loss)A | .21 | .37 | .40 | .34 | .25 | .12 |
| Net realized and unrealized gain (loss) | 1.22 | 5.79 | 1.67 | 1.07 | (.90) | 7.02 |
| Total from investment operations | 1.43 | 6.16 | 2.07 | 1.41 | (.65) | 7.14 |
| Distributions from net investment income | (.29) | (.34) | (.29) | (.24) | (.09) | (.14) |
| Distributions from net realized gain | (.74) | (.29) | (.62) | (3.45) | (.60) | (.33) |
| Total distributions | (1.03) | (.63) | (.91) | (3.69) | (.69) | (.46)B |
| Redemption fees added to paid in capitalA | –C | .01 | .01 | –C | .01 | –C |
| Net asset value, end of period | $30.17 | $29.77 | $24.23 | $23.06 | $25.34 | $26.67 |
| Total ReturnD,E | 4.96% | 26.18% | 9.39% | 6.53% | (2.48)% | 36.56% |
| Ratios to Average Net AssetsF,G | ||||||
| Expenses before reductions | 1.21%H | 1.25% | 1.34% | 1.31% | 1.21% | 1.33% |
| Expenses net of fee waivers, if any | 1.21%H | 1.25% | 1.34% | 1.31% | 1.20% | 1.32% |
| Expenses net of all reductions | 1.20%H | 1.24% | 1.33% | 1.31% | 1.20% | 1.31% |
| Net investment income (loss) | 1.39%H | 1.41% | 1.77% | 1.45% | .95% | .53% |
| Supplemental Data | ||||||
| Net assets, end of period (000 omitted) | $1,567,589 | $1,418,452 | $906,420 | $811,534 | $842,031 | $1,029,629 |
| Portfolio turnover rateI | 21%H | 22% | 29% | 36% | 102% | 54% |
A Calculated based on average shares outstanding during the period.
B Total distributions of $.46 per share is comprised of distributions from net investment income of $.136 and distributions from net realized gain of $.327 per share.
C Amount represents less than $.005 per share.
D Total returns for periods of less than one year are not annualized.
E Total returns would have been lower if certain expenses had not been reduced during the applicable periods shown.
F Fees and expenses of any underlying Fidelity Central Funds are not included in the Fund's expense ratio. The Fund indirectly bears its proportionate share of the expenses of any underlying Fidelity Central Funds.
G Expense ratios reflect operating expenses of the class. Expenses before reductions do not reflect amounts reimbursed by the investment adviser or reductions from brokerage service arrangements or reductions from other expense offset arrangements and do not represent the amount paid by the class during periods when reimbursements or reductions occur. Expenses net of fee waivers reflect expenses after reimbursement by the investment adviser but prior to reductions from brokerage service arrangements or other expense offset arrangements. Expenses net of all reductions represent the net expenses paid by the class.
H Annualized
I Amount does not include the portfolio activity of any underlying Fidelity Central Funds.
See accompanying notes which are an integral part of the financial statements.
Fidelity International Small Cap Fund Class I
| Six months ended (Unaudited) April 30, | Years endedOctober 31, | |||||
| 2018 | 2017 | 2016 | 2015 | 2014 | 2013 | |
| Selected Per–Share Data | ||||||
| Net asset value, beginning of period | $29.97 | $24.42 | $23.24 | $25.34 | $26.67 | $20.00 |
| Income from Investment Operations | ||||||
| Net investment income (loss)A | .21 | .38 | .41 | .36 | .29 | .16 |
| Net realized and unrealized gain (loss) | 1.22 | 5.82 | 1.69 | 1.07 | (.90) | 7.00 |
| Total from investment operations | 1.43 | 6.20 | 2.10 | 1.43 | (.61) | 7.16 |
| Distributions from net investment income | (.30) | (.37) | (.31) | (.08) | (.13) | (.16) |
| Distributions from net realized gain | (.74) | (.29) | (.62) | (3.45) | (.60) | (.33) |
| Total distributions | (1.04) | (.66) | (.93) | (3.53) | (.73) | (.49) |
| Redemption fees added to paid in capitalA | –B | .01 | .01 | –B | .01 | –B |
| Net asset value, end of period | $30.36 | $29.97 | $24.42 | $23.24 | $25.34 | $26.67 |
| Total ReturnC,D | 4.93% | 26.17% | 9.43% | 6.60% | (2.35)% | 36.68% |
| Ratios to Average Net AssetsE,F | ||||||
| Expenses before reductions | 1.23%G | 1.28% | 1.31% | 1.24% | 1.08% | 1.20% |
| Expenses net of fee waivers, if any | 1.23%G | 1.28% | 1.31% | 1.23% | 1.08% | 1.20% |
| Expenses net of all reductions | 1.22%G | 1.27% | 1.31% | 1.23% | 1.08% | 1.18% |
| Net investment income (loss) | 1.38%G | 1.39% | 1.80% | 1.53% | 1.07% | .66% |
| Supplemental Data | ||||||
| Net assets, end of period (000 omitted) | $526,146 | $237,469 | $22,727 | $10,070 | $8,092 | $67,038 |
| Portfolio turnover rateH | 21%G | 22% | 29% | 36% | 102% | 54% |
A Calculated based on average shares outstanding during the period.
B Amount represents less than $.005 per share.
C Total returns for periods of less than one year are not annualized.
D Total returns would have been lower if certain expenses had not been reduced during the applicable periods shown.
E Fees and expenses of any underlying Fidelity Central Funds are not included in the Fund's expense ratio. The Fund indirectly bears its proportionate share of the expenses of any underlying Fidelity Central Funds.
F Expense ratios reflect operating expenses of the class. Expenses before reductions do not reflect amounts reimbursed by the investment adviser or reductions from brokerage service arrangements or reductions from other expense offset arrangements and do not represent the amount paid by the class during periods when reimbursements or reductions occur. Expenses net of fee waivers reflect expenses after reimbursement by the investment adviser but prior to reductions from brokerage service arrangements or other expense offset arrangements. Expenses net of all reductions represent the net expenses paid by the class.
G Annualized
H Amount does not include the portfolio activity of any underlying Fidelity Central Funds.
See accompanying notes which are an integral part of the financial statements.
Notes to Financial Statements (Unaudited)
For the period ended April 30, 2018
1. Organization.
Fidelity International Small Cap Fund (the Fund) is a fund of Fidelity Investment Trust (the Trust) and is authorized to issue an unlimited number of shares. The Trust is registered under the Investment Company Act of 1940, as amended (the 1940 Act), as an open-end management investment company organized as a Massachusetts business trust. The Fund offers Class A, Class M, Class C, International Small Cap and Class I shares, each of which has equal rights as to assets and voting privileges. Each class has exclusive voting rights with respect to matters that affect that class. The Fund's investments in emerging markets can be subject to social, economic, regulatory, and political uncertainties and can be extremely volatile.
2. Investments in Fidelity Central Funds.
The Fund invests in Fidelity Central Funds, which are open-end investment companies generally available only to other investment companies and accounts managed by the investment adviser and its affiliates. The Fund's Schedule of Investments lists each of the Fidelity Central Funds held as of period end, if any, as an investment of the Fund, but does not include the underlying holdings of each Fidelity Central Fund. As an Investing Fund, the Fund indirectly bears its proportionate share of the expenses of the underlying Fidelity Central Funds.
The Money Market Central Funds seek preservation of capital and current income and are managed by Fidelity Investments Money Management, Inc. (FIMM), an affiliate of the investment adviser. Annualized expenses of the Money Market Central Funds as of their most recent shareholder report date are less than .005%.
A complete unaudited list of holdings for each Fidelity Central Fund is available upon request or at the Securities and Exchange Commission (the SEC) website at www.sec.gov. In addition, the financial statements of the Fidelity Central Funds are available on the SEC website or upon request.
3. Significant Accounting Policies.
The Fund is an investment company and applies the accounting and reporting guidance of the Financial Accounting Standards Board (FASB) Accounting Standards Codification Topic 946 Financial Services – Investments Companies. The financial statements have been prepared in conformity with accounting principles generally accepted in the United States of America (GAAP), which require management to make certain estimates and assumptions at the date of the financial statements. Actual results could differ from those estimates. Subsequent events, if any, through the date that the financial statements were issued have been evaluated in the preparation of the financial statements. The following summarizes the significant accounting policies of the Fund:
Investment Valuation. Investments are valued as of 4:00 p.m. Eastern time on the last calendar day of the period. The Board of Trustees (the Board) has delegated the day to day responsibility for the valuation of the Fund's investments to the Fair Value Committee (the Committee) established by the Fund's investment adviser. In accordance with valuation policies and procedures approved by the Board, the Fund attempts to obtain prices from one or more third party pricing vendors or brokers to value its investments. When current market prices, quotations or currency exchange rates are not readily available or reliable, investments will be fair valued in good faith by the Committee, in accordance with procedures adopted by the Board. Factors used in determining fair value vary by investment type and may include market or investment specific events. The frequency with which these procedures are used cannot be predicted and they may be utilized to a significant extent. The Committee oversees the Fund's valuation policies and procedures and reports to the Board on the Committee's activities and fair value determinations. The Board monitors the appropriateness of the procedures used in valuing the Fund's investments and ratifies the fair value determinations of the Committee.
The Fund categorizes the inputs to valuation techniques used to value its investments into a disclosure hierarchy consisting of three levels as shown below:
- Level 1 – quoted prices in active markets for identical investments
- Level 2 – other significant observable inputs (including quoted prices for similar investments, interest rates, prepayment speeds, etc.)
- Level 3 – unobservable inputs (including the Fund's own assumptions based on the best information available)
Valuation techniques used to value the Fund's investments by major category are as follows:
Equity securities, including restricted securities, for which market quotations are readily available, are valued at the last reported sale price or official closing price as reported by a third party pricing vendor on the primary market or exchange on which they are traded and are categorized as Level 1 in the hierarchy. In the event there were no sales during the day or closing prices are not available, securities are valued at the last quoted bid price or may be valued using the last available price and are generally categorized as Level 2 in the hierarchy. For foreign equity securities, when market or security specific events arise, comparisons to the valuation of American Depositary Receipts (ADRs), futures contracts, Exchange-Traded Funds (ETFs) and certain indexes as well as quoted prices for similar securities may be used and would be categorized as Level 2 in the hierarchy. Utilizing these techniques may result in transfers between Level 1 and Level 2. For equity securities, including restricted securities, where observable inputs are limited, assumptions about market activity and risk are used and these securities may be categorized as Level 3 in the hierarchy.
Investments in open-end mutual funds, including the Fidelity Central Funds, are valued at their closing net asset value (NAV) each business day and are categorized as Level 1 in the hierarchy.
Changes in valuation techniques may result in transfers in or out of an assigned level within the disclosure hierarchy. The aggregate value of investments by input level as of April 30, 2018, including information on transfers between Levels 1 and 2, is included at the end of the Fund's Schedule of Investments.
Foreign Currency. The Fund may use foreign currency contracts to facilitate transactions in foreign-denominated securities. Gains and losses from these transactions may arise from changes in the value of the foreign currency or if the counterparties do not perform under the contracts' terms.
Foreign-denominated assets, including investment securities, and liabilities are translated into U.S. dollars at the exchange rates at period end. Purchases and sales of investment securities, income and dividends received and expenses denominated in foreign currencies are translated into U.S. dollars at the exchange rate in effect on the transaction date.
The effects of exchange rate fluctuations on investments are included with the net realized and unrealized gain (loss) on investment securities. Other foreign currency transactions resulting in realized and unrealized gain (loss) are disclosed separately.
Investment Transactions and Income. For financial reporting purposes, the Fund's investment holdings and NAV include trades executed through the end of the last business day of the period. The NAV per share for processing shareholder transactions is calculated as of the close of business of the New York Stock Exchange (NYSE), normally 4:00 p.m. Eastern time and includes trades executed through the end of the prior business day. Gains and losses on securities sold are determined on the basis of identified cost and include proceeds received from litigation. Dividend income is recorded on the ex-dividend date, except for certain dividends from foreign securities where the ex-dividend date may have passed, which are recorded as soon as the Fund is informed of the ex-dividend date. Non-cash dividends included in dividend income, if any, are recorded at the fair market value of the securities received. Income and capital gain distributions from Fidelity Central Funds, if any, are recorded on the ex-dividend date. Certain distributions received by the Fund represent a return of capital or capital gain. The Fund determines the components of these distributions subsequent to the ex-dividend date, based upon receipt of tax filings or other correspondence relating to the underlying investment. These distributions are recorded as a reduction of cost of investments and/or as a realized gain. Investment income is recorded net of foreign taxes withheld where recovery of such taxes is uncertain.
Class Allocations and Expenses. Investment income, realized and unrealized capital gains and losses, common expenses of the Fund, and certain fund-level expense reductions, if any, are allocated daily on a pro-rata basis to each class based on the relative net assets of each class to the total net assets of the Fund. Each class differs with respect to transfer agent and distribution and service plan fees incurred. Certain expense reductions may also differ by class. For the reporting period, the allocated portion of income and expenses to each class as a percent of its average net assets may vary due to the timing of recording these transactions in relation to fluctuating net assets of the classes. Expenses directly attributable to a fund are charged to that fund. Expenses attributable to more than one fund are allocated among the respective funds on the basis of relative net assets or other appropriate methods. Expense estimates are accrued in the period to which they relate and adjustments are made when actual amounts are known.
Income Tax Information and Distributions to Shareholders. Each year, the Fund intends to qualify as a regulated investment company under Subchapter M of the Internal Revenue Code, including distributing substantially all of its taxable income and realized gains. As a result, no provision for U.S. Federal income taxes is required. The Fund files a U.S. federal tax return, in addition to state and local tax returns as required. The Fund's federal income tax returns are subject to examination by the Internal Revenue Service (IRS) for a period of three fiscal years after they are filed. State and local tax returns may be subject to examination for an additional fiscal year depending on the jurisdiction. Foreign taxes are provided for based on the Fund's understanding of the tax rules and rates that exist in the foreign markets in which it invests. The Fund is subject to a tax imposed on capital gains by certain countries in which it invests.
Distributions are declared and recorded on the ex-dividend date. Income and capital gain distributions are declared separately for each class. Income and capital gain distributions are determined in accordance with income tax regulations, which may differ from GAAP.
Capital accounts within the financial statements are adjusted for permanent book-tax differences. These adjustments have no impact on net assets or the results of operations. Capital accounts are not adjusted for temporary book-tax differences which will reverse in a subsequent period.
Book-tax differences are primarily due to foreign currency transactions, certain foreign taxes, passive foreign investment companies (PFIC) and losses deferred due to wash sales.
As of period end, the cost and unrealized appreciation (depreciation) in securities, and derivatives if applicable, for federal income tax purposes on an unconsolidated basis were as follows:
| Gross unrealized appreciation | $433,001,918 |
| Gross unrealized depreciation | (109,690,634) |
| Net unrealized appreciation (depreciation) | $323,311,284 |
| Tax cost | $1,926,138,263 |
Short-Term Trading (Redemption) Fees. Shares held by investors in the Fund less than 90 days may have been subject to a redemption fee equal to 2.00% of the NAV of shares redeemed. All redemption fees, which reduce the proceeds of the shareholder redemption, are retained by the Fund and accounted for as an addition to paid in capital. In November 2017, the Board of Trustees approved the elimination of these redemption fees effective December 18, 2017.
Delayed Delivery Transactions and When-Issued Securities. During the period, the Fund transacted in securities on a delayed delivery or when-issued basis. Payment and delivery may take place after the customary settlement period for that security. The price of the underlying securities and the date when the securities will be delivered and paid for are fixed at the time the transaction is negotiated. The securities purchased on a delayed delivery or when-issued basis are identified as such in the Fund's Schedule of Investments. Losses may arise due to changes in the value of the underlying securities or if the counterparty does not perform under the contract's terms, or if the issuer does not issue the securities due to political, economic, or other factors.
Restricted Securities. The Fund may invest in securities that are subject to legal or contractual restrictions on resale. These securities generally may be resold in transactions exempt from registration or to the public if the securities are registered. Disposal of these securities may involve time-consuming negotiations and expense, and prompt sale at an acceptable price may be difficult. Information regarding restricted securities is included at the end of the Fund's Schedule of Investments.
4. Purchases and Sales of Investments.
Purchases and sales of securities, other than short-term securities, aggregated $580,554,158 and $206,606,890, respectively.
5. Fees and Other Transactions with Affiliates.
Management Fee. Fidelity Management & Research Company (the investment adviser) and its affiliates provide the Fund with investment management related services for which the Fund pays a monthly management fee. The management fee is the sum of an individual fund fee rate that is based on an annual rate of .60% of the Fund's average net assets and an annualized group fee rate that averaged .24% during the period. The group fee rate is based upon the average net assets of all the mutual funds advised by the investment adviser, including any mutual funds previously advised by the investment adviser that are currently advised by Fidelity SelectCo, LLC, an affiliate of the investment adviser. The group fee rate decreases as assets under management increase and increases as assets under management decrease. In addition, the management fee is subject to a performance adjustment (up to a maximum of +/- .20% of the Fund's average net assets over a 36 month performance period). The upward or downward adjustment to the management fee is based on the relative investment performance of International Small Cap as compared to its benchmark index, the MSCI ACWI (All Country World Index) ex USA Small Cap Index effective April 1, 2014 (the MSCI EAFE Small Cap Index prior to April 1, 2014), over the same 36 month performance period. For the reporting period, the total annualized management fee rate, including the performance adjustment, was .95% of the Fund's average net assets. The performance adjustment included in the management fee rate may be higher or lower than the maximum performance adjustment rate due to the difference between the average net assets for the reporting and performance periods.
Distribution and Service Plan Fees. In accordance with Rule 12b-1 of the 1940 Act, the Fund has adopted separate Distribution and Service Plans for each class of shares. Certain classes pay Fidelity Distributors Corporation (FDC), an affiliate of the investment adviser, separate Distribution and Service Fees, each of which is based on an annual percentage of each class' average net assets. In addition, FDC may pay financial intermediaries for selling shares of the Fund and providing shareholder support services. For the period, the Distribution and Service Fee rates, total fees and amounts retained by FDC were as follows:
| Distribution Fee | Service Fee | Total Fees | Retained by FDC | |
| Class A | -% | .25% | $92,671 | $3,791 |
| Class M | .25% | .25% | 51,263 | 461 |
| Class C | .75% | .25% | 191,181 | 81,355 |
| $335,115 | $ 85,607 |
Sales Load. FDC may receive a front-end sales charge of up to 5.75% for selling Class A shares and 3.50% for selling Class M shares, some of which is paid to financial intermediaries for selling shares of the Fund. Depending on the holding period, FDC may receive contingent deferred sales charges levied on Class A, Class M and Class C redemptions. The deferred sales charges are 1.00% for Class C shares, 1.00% for certain purchases of Class A shares and .25% for certain purchases of Class M shares.
For the period, sales charge amounts retained by FDC were as follows:
| Retained by FDC | |
| Class A | $45,891 |
| Class M | 3,905 |
| Class C(a) | 4,863 |
| $54,659 |
(a) When Class C shares are initially sold, FDC pays commissions from its own resources to financial intermediaries through which the sales are made.
Transfer Agent Fees. Fidelity Investments Institutional Operations Company, Inc., (FIIOC), an affiliate of the investment adviser, is the transfer, dividend disbursing and shareholder servicing agent for each class of the Fund. FIIOC receives account fees and asset-based fees that vary according to the account size and type of account of the shareholders of the respective classes of the Fund. FIIOC pays for typesetting, printing and mailing of shareholder reports, except proxy statements.
For the period, transfer agent fees for each class were as follows:
| Amount | % of Class-Level Average Net Assets(a) | |
| Class A | $79,920 | .22 |
| Class M | 24,713 | .24 |
| Class C | 41,921 | .22 |
| International Small Cap | 1,305,374 | .17 |
| Class I | 338,265 | .19 |
| $1,790,193 |
(a) Annualized
Accounting and Security Lending Fees. Fidelity Service Company, Inc. (FSC), an affiliate of the investment adviser, maintains the Fund's accounting records. The accounting fee is based on the level of average net assets for each month. Under a separate contract, FSC administers the security lending program. The security lending fee is based on the number and duration of lending transactions. For the period, the fees were equivalent to an annualized rate of .04%.
Brokerage Commissions. The Fund placed a portion of its portfolio transactions with brokerage firms which are affiliates of the investment adviser. Brokerage commissions are included in net realized gain (loss) and change in net unrealized appreciation (depreciation) in the Statement of Operations. The commissions paid to these affiliated firms were $733 for the period.
Interfund Trades. The Fund may purchase from or sell securities to other Fidelity Funds under procedures adopted by the Board. The procedures have been designed to ensure these interfund trades are executed in accordance with Rule 17a-7 of the 1940 Act. Interfund trades are included within the respective purchases and sales amounts shown in the Purchases and Sales of Investments note.
6. Committed Line of Credit.
The Fund participates with other funds managed by the investment adviser or an affiliate in a $4.25 billion credit facility (the "line of credit") to be utilized for temporary or emergency purposes to fund shareholder redemptions or for other short-term liquidity purposes. The Fund has agreed to pay commitment fees on its pro-rata portion of the line of credit, which amounted to $2,743 and is reflected in Miscellaneous expenses on the Statement of Operations. During the period, the Fund did not borrow on this line of credit.
7. Security Lending.
The Fund lends portfolio securities through a lending agent from time to time in order to earn additional income. For equity securities, a lending agent is used and may loan securities to certain qualified borrowers, including Fidelity Capital Markets (FCM), a broker-dealer affiliated with the Fund. On the settlement date of the loan, the Fund receives collateral (in the form of U.S. Treasury obligations, letters of credit and/or cash) against the loaned securities and maintains collateral in an amount not less than 100% of the market value of the loaned securities during the period of the loan. The market value of the loaned securities is determined at the close of business of the Fund and any additional required collateral is delivered to the Fund on the next business day. The Fund or borrower may terminate the loan at any time, and if the borrower defaults on its obligation to return the securities loaned because of insolvency or other reasons, the Fund may apply collateral received from the borrower against the obligation. The Fund may experience delays and costs in recovering the securities loaned. Any cash collateral received is invested in the Fidelity Securities Lending Cash Central Fund. The value of loaned securities and cash collateral at period end are disclosed on the Fund's Statement of Assets and Liabilities. The value of securities loaned to FCM at period end was $2,383. Security lending income represents the income earned on investing cash collateral, less rebates paid to borrowers and any lending agent fees associated with the loan, plus any premium payments received for lending certain types of securities. Security lending income is presented in the Statement of Operations as a component of income from Fidelity Central Funds. Total security lending income during the period amounted to $127,675, including $46 from securities loaned to FCM.
8. Expense Reductions.
Commissions paid to certain brokers with whom the investment adviser, or its affiliates, places trades on behalf of the Fund include an amount in addition to trade execution, which may be rebated back to the Fund to offset certain expenses. This amount totaled $83,238 for the period. In addition, through arrangements with the Fund's custodian, credits realized as a result of certain uninvested cash balances were used to reduce the Fund's expenses. During the period, these credits reduced the Fund's custody expenses by $174.
In addition, during the period the investment adviser reimbursed and/or waived a portion of fund-level operating expenses in the amount of $9,116.
9. Distributions to Shareholders.
Distributions to shareholders of each class were as follows:
| Six months ended April 30, 2018 | Year ended October 31, 2017 | |
| From net investment income | ||
| Class A | $511,661 | $440,395 |
| Class M | 100,106 | 105,144 |
| Class C | 105,745 | 42,573 |
| International Small Cap | 13,927,531 | 13,342,577 |
| Class I | 2,593,133 | 462,523 |
| Total | $17,238,176 | $14,393,212 |
| From net realized gain | ||
| Class A | $1,639,043 | $461,138 |
| Class M | 488,601 | 163,369 |
| Class C | 748,093 | 151,895 |
| International Small Cap | 35,152,700 | 11,341,189 |
| Class I | 6,286,641 | 361,268 |
| Total | $44,315,078 | $12,478,859 |
10. Share Transactions.
Share transactions for each class were as follows and may contain automatic conversions between classes or exchanges between affiliated funds:
| Shares | Shares | Dollars | Dollars | |
| Six months ended April 30, 2018 | Year ended October 31, 2017 | Six months ended April 30, 2018 | Year ended October 31, 2017 | |
| Class A | ||||
| Shares sold | 958,071 | 1,346,483 | $28,483,183 | $35,353,222 |
| Reinvestment of distributions | 72,621 | 38,390 | 2,060,979 | 881,445 |
| Shares redeemed | (464,388) | (746,471) | (13,725,103) | (18,879,894) |
| Net increase (decrease) | 566,304 | 638,402 | $16,819,059 | $17,354,773 |
| Class M | ||||
| Shares sold | 168,813 | 165,476 | $4,987,396 | $4,273,457 |
| Reinvestment of distributions | 20,707 | 11,602 | 585,586 | 265,460 |
| Shares redeemed | (100,002) | (116,364) | (2,955,222) | (2,968,272) |
| Net increase (decrease) | 89,518 | 60,714 | $2,617,760 | $1,570,645 |
| Class C | ||||
| Shares sold | 851,231 | 554,853 | $24,484,610 | $14,330,189 |
| Reinvestment of distributions | 30,679 | 8,175 | 842,145 | 182,379 |
| Shares redeemed | (142,683) | (171,623) | (4,122,291) | (4,225,035) |
| Net increase (decrease) | 739,227 | 391,405 | $21,204,464 | $10,287,533 |
| International Small Cap | ||||
| Shares sold | 10,898,239 | 20,105,455 | $330,067,344 | $528,374,537 |
| Reinvestment of distributions | 1,616,727 | 1,029,746 | 46,674,910 | 24,013,687 |
| Shares redeemed | (8,200,708) | (10,901,622) | (246,043,950) | (292,534,899) |
| Net increase (decrease) | 4,314,258 | 10,233,579 | $130,698,304 | $259,853,325 |
| Class I | ||||
| Shares sold | 10,535,023 | 7,788,345 | $320,978,937 | $213,872,926 |
| Reinvestment of distributions | 286,614 | 29,052 | 8,326,151 | 682,131 |
| Shares redeemed | (1,416,324) | (824,089) | (43,133,420) | (22,829,284) |
| Net increase (decrease) | 9,405,313 | 6,993,308 | $286,171,668 | $191,725,773 |
11. Other.
The Fund's organizational documents provide former and current trustees and officers with a limited indemnification against liabilities arising in connection with the performance of their duties to the Fund. In the normal course of business, the Fund may also enter into contracts that provide general indemnifications. The Fund's maximum exposure under these arrangements is unknown as this would be dependent on future claims that may be made against the Fund. The risk of material loss from such claims is considered remote.
Shareholder Expense Example
As a shareholder of the Fund, you incur two types of costs: (1) transaction costs, including sales charges (loads) on purchase payments or redemption proceeds, redemption fees and (2) ongoing costs, including management fees, distribution and/or service (12b-1) fees and other Fund expenses. This Example is intended to help you understand your ongoing costs (in dollars) of investing in the Fund and to compare these costs with the ongoing costs of investing in other mutual funds.
The Example is based on an investment of $1,000 invested at the beginning of the period and held for the entire period (November 1, 2017 to April 30, 2018).
Actual Expenses
The first line of the accompanying table for each class of the Fund provides information about actual account values and actual expenses. You may use the information in this line, together with the amount you invested, to estimate the expenses that you paid over the period. Simply divide your account value by $1,000.00 (for example, an $8,600 account value divided by $1,000.00 = 8.6), then multiply the result by the number in the first line for a class of the Fund under the heading entitled "Expenses Paid During Period" to estimate the expenses you paid on your account during this period. A small balance maintenance fee of $12.00 that is charged once a year may apply for certain accounts with a value of less than $2,000. This fee is not included in the table below. If it was, the estimate of expenses you paid during the period would be higher, and your ending account value lower, by this amount. In addition, the Fund, as a shareholder in the underlying Fidelity Central Funds, will indirectly bear its pro-rata share of the fees and expenses incurred by the underlying Fidelity Central Funds. These fees and expenses are not included in the Fund's annualized expense ratio used to calculate the expense estimate in the table below.
Hypothetical Example for Comparison Purposes
The second line of the accompanying table for each class of the Fund provides information about hypothetical account values and hypothetical expenses based on a Class' actual expense ratio and an assumed rate of return of 5% per year before expenses, which is not the Class' actual return. The hypothetical account values and expenses may not be used to estimate the actual ending account balance or expenses you paid for the period. You may use this information to compare the ongoing costs of investing in the Fund and other funds. To do so, compare this 5% hypothetical example with the 5% hypothetical examples that appear in the shareholder reports of the other funds. A small balance maintenance fee of $12.00 that is charged once a year may apply for certain accounts with a value of less than $2,000. This fee is not included in the table below. If it was, the estimate of expenses you paid during the period would be higher, and your ending account value lower, by this amount. In addition, the Fund, as a shareholder in the underlying Fidelity Central Funds, will indirectly bear its pro-rata share of the fees and expenses incurred by the underlying Fidelity Central Funds. These fees and expenses are not included in the Fund's annualized expense ratio used to calculate the expense estimate in the table below.
Please note that the expenses shown in the table are meant to highlight your ongoing costs only and do not reflect any transaction costs. Therefore, the second line of the table is useful in comparing ongoing costs only, and will not help you determine the relative total costs of owning different funds. In addition, if these transactional costs were included, your costs would have been higher.
| Annualized Expense Ratio-A | Beginning Account Value November 1, 2017 | Ending Account Value April 30, 2018 | Expenses Paid During Period-B November 1, 2017 to April 30, 2018 | |
| Class A | 1.51% | |||
| Actual | $1,000.00 | $1,047.90 | $7.67 | |
| Hypothetical-C | $1,000.00 | $1,017.31 | $7.55 | |
| Class M | 1.78% | |||
| Actual | $1,000.00 | $1,046.30 | $9.03 | |
| Hypothetical-C | $1,000.00 | $1,015.97 | $8.90 | |
| Class C | 2.26% | |||
| Actual | $1,000.00 | $1,044.10 | $11.45 | |
| Hypothetical-C | $1,000.00 | $1,013.59 | $11.28 | |
| International Small Cap | 1.21% | |||
| Actual | $1,000.00 | $1,049.60 | $6.15 | |
| Hypothetical-C | $1,000.00 | $1,018.79 | $6.06 | |
| Class I | 1.23% | |||
| Actual | $1,000.00 | $1,049.30 | $6.25 | |
| Hypothetical-C | $1,000.00 | $1,018.70 | $6.16 |
A Annualized expense ratio reflects expenses net of applicable fee waivers.
B Expenses are equal to each Class' annualized expense ratio, multiplied by the average account value over the period, multiplied by 181/365 (to reflect the one-half year period).
C 5% return per year before expenses
![]()
Corporate Headquarters
245 Summer St.
Boston, MA 02210
www.fidelity.com
ISC-SANN-0618
1.800662.114
Fidelity Advisor® International Small Cap Opportunities Fund - Semi-Annual Report April 30, 2018 Class A, Class M, Class C and Class I are classes of Fidelity® International Small Cap Opportunities Fund |
|
Contents
To view a fund's proxy voting guidelines and proxy voting record for the 12-month period ended June 30, visit http://www.fidelity.com/proxyvotingresults or visit the Securities and Exchange Commission's (SEC) web site at http://www.sec.gov.
You may also call 1-877-208-0098 to request a free copy of the proxy voting guidelines.
Standard & Poor's, S&P and S&P 500 are registered service marks of The McGraw-Hill Companies, Inc. and have been licensed for use by Fidelity Distributors Corporation.
Other third-party marks appearing herein are the property of their respective owners.
All other marks appearing herein are registered or unregistered trademarks or service marks of FMR LLC or an affiliated company. © 2018 FMR LLC. All rights reserved.
This report and the financial statements contained herein are submitted for the general information of the shareholders of the Fund. This report is not authorized for distribution to prospective investors in the Fund unless preceded or accompanied by an effective prospectus.
A fund files its complete schedule of portfolio holdings with the SEC for the first and third quarters of each fiscal year on Form N-Q. Forms N-Q are available on the SEC’s web site at http://www.sec.gov. A fund's Forms N-Q may be reviewed and copied at the SEC’s Public Reference Room in Washington, DC. Information regarding the operation of the SEC's Public Reference Room may be obtained by calling 1-800-SEC-0330.
For a complete list of a fund's portfolio holdings, view the most recent holdings listing, semiannual report, or annual report on Fidelity's web site at http://www.fidelity.com, http://www.institutional.fidelity.com, or http://www.401k.com, as applicable.
NOT FDIC INSURED •MAY LOSE VALUE •NO BANK GUARANTEE
Neither the Fund nor Fidelity Distributors Corporation is a bank.
Investment Summary (Unaudited)
Geographic Diversification (% of fund's net assets)
| As of April 30, 2018 | ||
| Japan | 34.1% | |
| United Kingdom | 15.7% | |
| United States of America* | 11.1% | |
| Germany | 6.0% | |
| Sweden | 4.4% | |
| France | 2.7% | |
| Spain | 2.6% | |
| Italy | 2.3% | |
| Denmark | 2.3% | |
| Other | 18.8% | |

* Includes Short-Term investments and Net Other Assets (Liabilities).
Percentages are based on country or territory of incorporation and are adjusted for the effect of futures contracts, if applicable.
Asset Allocation as of April 30, 2018
| % of fund's net assets | |
| Stocks | 91.0 |
| Investment Companies | 3.6 |
| Short-Term Investments and Net Other Assets (Liabilities) | 5.4 |
Top Ten Stocks as of April 30, 2018
| % of fund's net assets | |
| Azbil Corp. (Japan, Electronic Equipment & Components) | 2.2 |
| Spectris PLC (United Kingdom, Electronic Equipment & Components) | 2.2 |
| Dechra Pharmaceuticals PLC (United Kingdom, Pharmaceuticals) | 2.1 |
| Spirax-Sarco Engineering PLC (United Kingdom, Machinery) | 1.9 |
| OBIC Co. Ltd. (Japan, IT Services) | 1.8 |
| SHO-BOND Holdings Co. Ltd. (Japan, Construction & Engineering) | 1.7 |
| Nihon Parkerizing Co. Ltd. (Japan, Chemicals) | 1.6 |
| OSG Corp. (Japan, Machinery) | 1.6 |
| CompuGroup Medical AG (Germany, Health Care Technology) | 1.6 |
| Interpump Group SpA (Italy, Machinery) | 1.6 |
| 18.3 |
Top Market Sectors as of April 30, 2018
| % of fund's net assets | |
| Industrials | 22.5 |
| Consumer Discretionary | 14.9 |
| Information Technology | 13.1 |
| Health Care | 12.3 |
| Consumer Staples | 8.7 |
| Materials | 7.0 |
| Financials | 5.2 |
| Real Estate | 5.1 |
| Energy | 2.2 |
Schedule of Investments April 30, 2018 (Unaudited)
Showing Percentage of Net Assets
| Common Stocks - 89.6% | |||
| Shares | Value | ||
| Australia - 2.0% | |||
| Accent Group Ltd. (a) | 3,598,268 | $3,381,076 | |
| Adelaide Brighton Ltd. (a) | 1,381,857 | 6,666,923 | |
| Beacon Lighting Group Ltd. | 2,785,250 | 3,084,755 | |
| DuluxGroup Ltd. | 1,822,063 | 10,593,767 | |
| Imdex Ltd. (b) | 4,040,102 | 3,767,415 | |
| Quintis Ltd. (a)(b)(c) | 2,011,191 | 15 | |
| TOTAL AUSTRALIA | 27,493,951 | ||
| Austria - 0.7% | |||
| Andritz AG | 172,500 | 9,282,338 | |
| Bailiwick of Jersey - 0.5% | |||
| Integrated Diagnostics Holdings PLC | 1,483,779 | 7,047,950 | |
| Belgium - 1.3% | |||
| KBC Ancora | 297,848 | 18,073,983 | |
| Bermuda - 0.4% | |||
| Vostok New Ventures Ltd. (depositary receipt) (b) | 701,789 | 5,882,536 | |
| Canada - 1.2% | |||
| McCoy Global, Inc. (b) | 636,715 | 634,756 | |
| New Look Vision Group, Inc. | 207,200 | 5,244,753 | |
| Pason Systems, Inc. | 340,800 | 4,764,485 | |
| PrairieSky Royalty Ltd. | 107,800 | 2,390,331 | |
| ShawCor Ltd. Class A | 164,900 | 3,190,246 | |
| TOTAL CANADA | 16,224,571 | ||
| Cayman Islands - 0.7% | |||
| 58.com, Inc. ADR (b) | 56,600 | 4,946,274 | |
| Value Partners Group Ltd. | 4,314,000 | 4,080,635 | |
| TOTAL CAYMAN ISLANDS | 9,026,909 | ||
| Denmark - 2.3% | |||
| Jyske Bank A/S (Reg.) | 183,127 | 11,008,931 | |
| Scandinavian Tobacco Group A/S (d) | 296,306 | 4,956,283 | |
| SimCorp A/S | 74,800 | 5,445,996 | |
| Spar Nord Bank A/S | 831,369 | 9,526,847 | |
| TOTAL DENMARK | 30,938,057 | ||
| Finland - 0.5% | |||
| Tikkurila Oyj (a) | 401,746 | 7,267,524 | |
| France - 2.7% | |||
| Elis SA | 752,442 | 18,009,422 | |
| Laurent-Perrier Group SA | 51,163 | 6,456,474 | |
| Vetoquinol SA | 110,184 | 6,998,861 | |
| Virbac SA (b) | 32,652 | 5,094,428 | |
| TOTAL FRANCE | 36,559,185 | ||
| Germany - 4.6% | |||
| CompuGroup Medical AG | 411,921 | 21,509,124 | |
| CTS Eventim AG | 391,593 | 18,366,959 | |
| Fielmann AG | 68,873 | 5,663,947 | |
| Nexus AG | 291,358 | 9,746,077 | |
| WashTec AG | 84,774 | 8,179,609 | |
| TOTAL GERMANY | 63,465,716 | ||
| Greece - 0.3% | |||
| Motor Oil (HELLAS) Corinth Refineries SA | 156,800 | 3,745,376 | |
| India - 0.2% | |||
| Jyothy Laboratories Ltd. | 500,746 | 2,728,118 | |
| Ireland - 1.3% | |||
| FBD Holdings PLC | 240,328 | 3,410,086 | |
| James Hardie Industries PLC CDI | 848,891 | 14,990,943 | |
| TOTAL IRELAND | 18,401,029 | ||
| Isle of Man - 0.9% | |||
| Playtech Ltd. | 1,070,331 | 11,944,391 | |
| Israel - 2.0% | |||
| Azrieli Group | 59,105 | 2,711,412 | |
| Ituran Location & Control Ltd. | 454,908 | 14,261,366 | |
| Strauss Group Ltd. | 508,344 | 10,484,829 | |
| TOTAL ISRAEL | 27,457,607 | ||
| Italy - 2.3% | |||
| Azimut Holding SpA | 218,197 | 4,592,713 | |
| Beni Stabili SpA SIIQ | 6,504,975 | 6,162,567 | |
| Interpump Group SpA | 672,443 | 21,421,672 | |
| TOTAL ITALY | 32,176,952 | ||
| Japan - 34.1% | |||
| Ai Holdings Corp. | 202,400 | 5,419,180 | |
| Aoki Super Co. Ltd. | 330,000 | 3,933,315 | |
| Artnature, Inc. | 524,100 | 3,595,637 | |
| Asahi Co. Ltd. | 213,700 | 2,623,357 | |
| Aucnet, Inc. | 184,870 | 2,399,657 | |
| Azbil Corp. | 650,700 | 30,356,476 | |
| Broadleaf Co. Ltd. | 734,600 | 3,507,695 | |
| Central Automotive Products Ltd. | 135,400 | 2,111,754 | |
| Century21 Real Estate Japan Ltd. | 66,500 | 821,821 | |
| Coca-Cola West Co. Ltd. | 137,475 | 5,923,045 | |
| Daiichikosho Co. Ltd. | 272,300 | 14,322,402 | |
| Daikokutenbussan Co. Ltd. | 190,900 | 9,866,310 | |
| Funai Soken Holdings, Inc. | 383,550 | 8,988,795 | |
| GCA Savvian Group Corp. | 555,461 | 4,933,705 | |
| Goldcrest Co. Ltd. | 574,130 | 12,221,007 | |
| Iwatsuka Confectionary Co. Ltd. | 21,400 | 1,023,802 | |
| Kobayashi Pharmaceutical Co. Ltd. | 199,900 | 16,877,763 | |
| Koshidaka Holdings Co. Ltd. | 215,400 | 13,083,205 | |
| Kusuri No Aoki Holdings Co. Ltd. | 132,800 | 9,123,015 | |
| Lasertec Corp. | 511,872 | 17,090,494 | |
| Medikit Co. Ltd. | 107,800 | 5,926,436 | |
| Miroku Jyoho Service Co., Ltd. | 169,800 | 4,846,103 | |
| Misumi Group, Inc. | 481,400 | 13,342,865 | |
| Mitsuboshi Belting Ltd. | 48,000 | 549,287 | |
| Nabtesco Corp. | 400,500 | 14,489,366 | |
| Nagaileben Co. Ltd. | 613,100 | 16,247,262 | |
| Nakano Refrigerators Co. Ltd. | 141,500 | 6,653,037 | |
| ND Software Co. Ltd. | 97,942 | 923,694 | |
| Nihon Parkerizing Co. Ltd. | 1,393,000 | 22,108,077 | |
| NS Tool Co. Ltd. (a) | 156,800 | 4,274,277 | |
| OBIC Co. Ltd. | 295,300 | 24,770,408 | |
| OSG Corp. | 990,200 | 21,992,367 | |
| Paramount Bed Holdings Co. Ltd. | 338,100 | 16,824,588 | |
| ProNexus, Inc. | 472,400 | 6,118,902 | |
| San-Ai Oil Co. Ltd. | 926,200 | 14,606,374 | |
| SHO-BOND Holdings Co. Ltd. | 302,800 | 22,934,358 | |
| Shoei Co. Ltd. | 377,426 | 14,034,364 | |
| SK Kaken Co. Ltd. | 85,000 | 8,669,502 | |
| Software Service, Inc. | 70,000 | 4,924,076 | |
| Techno Medica Co. Ltd. | 80,791 | 1,544,577 | |
| The Monogatari Corp. | 63,400 | 6,912,989 | |
| TKC Corp. | 193,600 | 7,747,896 | |
| Tocalo Co. Ltd. | 468,000 | 5,835,016 | |
| USS Co. Ltd. | 966,500 | 20,343,181 | |
| Welcia Holdings Co. Ltd. | 191,700 | 9,872,585 | |
| Workman Co. Ltd. | 229,500 | 9,153,128 | |
| Yamada Consulting Group Co. Ltd. | 397,800 | 11,316,850 | |
| Yamato Kogyo Co. Ltd. | 141,400 | 4,203,714 | |
| TOTAL JAPAN | 469,387,714 | ||
| Korea (South) - 0.9% | |||
| BGF Retail Co. Ltd. | 53,748 | 9,585,982 | |
| Leeno Industrial, Inc. | 57,128 | 3,056,642 | |
| TOTAL KOREA (SOUTH) | 12,642,624 | ||
| Mexico - 0.2% | |||
| Consorcio ARA S.A.B. de CV | 8,852,578 | 3,341,837 | |
| Netherlands - 2.0% | |||
| Aalberts Industries NV | 319,501 | 15,757,273 | |
| Takeaway.com Holding BV (b)(d) | 99,887 | 5,814,055 | |
| VastNed Retail NV | 114,002 | 5,706,372 | |
| TOTAL NETHERLANDS | 27,277,700 | ||
| Norway - 1.1% | |||
| Kongsberg Gruppen ASA | 383,800 | 9,424,803 | |
| Skandiabanken ASA (d) | 623,200 | 5,632,051 | |
| TOTAL NORWAY | 15,056,854 | ||
| Philippines - 0.5% | |||
| Jollibee Food Corp. | 1,309,740 | 7,208,797 | |
| South Africa - 1.1% | |||
| Clicks Group Ltd. | 902,329 | 15,427,051 | |
| Spain - 2.6% | |||
| Hispania Activos Inmobiliarios SA | 366,631 | 7,792,287 | |
| Merlin Properties Socimi SA | 545,300 | 8,428,855 | |
| Prosegur Compania de Seguridad SA (Reg.) | 2,547,090 | 19,316,438 | |
| TOTAL SPAIN | 35,537,580 | ||
| Sweden - 4.4% | |||
| Addlife AB | 175,200 | 3,671,404 | |
| AddTech AB (B Shares) | 598,543 | 12,481,252 | |
| Fagerhult AB (a) | 1,435,439 | 14,671,340 | |
| Lagercrantz Group AB (B Shares) | 904,775 | 8,513,925 | |
| Loomis AB (B Shares) | 298,500 | 10,915,099 | |
| Saab AB (B Shares) (a) | 254,700 | 10,456,584 | |
| TOTAL SWEDEN | 60,709,604 | ||
| Switzerland - 0.6% | |||
| Tecan Group AG | 38,822 | 8,579,231 | |
| Taiwan - 0.4% | |||
| Addcn Technology Co. Ltd. | 638,435 | 5,518,905 | |
| United Kingdom - 15.7% | |||
| Alliance Pharma PLC | 4,048,400 | 4,514,480 | |
| Ascential PLC | 2,119,951 | 12,298,713 | |
| Avon Rubber PLC | 283,500 | 5,249,460 | |
| Cineworld Group PLC | 1,468,300 | 5,263,748 | |
| Dechra Pharmaceuticals PLC | 751,609 | 28,372,574 | |
| DP Poland PLC (b) | 7,057,200 | 2,963,272 | |
| Elementis PLC | 3,644,910 | 14,230,899 | |
| Great Portland Estates PLC | 1,101,542 | 10,576,021 | |
| Hilton Food Group PLC | 312,888 | 3,816,471 | |
| Howden Joinery Group PLC | 830,300 | 5,449,034 | |
| Informa PLC | 1,684,956 | 17,142,427 | |
| InterContinental Hotel Group PLC ADR (a) | 72,195 | 4,594,490 | |
| ITE Group PLC | 3,255,234 | 6,811,851 | |
| Rightmove PLC | 192,147 | 12,075,739 | |
| Shaftesbury PLC | 1,129,573 | 15,721,891 | |
| Spectris PLC | 812,778 | 30,099,795 | |
| Spirax-Sarco Engineering PLC | 331,991 | 26,349,049 | |
| Topps Tiles PLC | 3,398,115 | 3,227,948 | |
| Ultra Electronics Holdings PLC | 371,558 | 7,202,257 | |
| TOTAL UNITED KINGDOM | 215,960,119 | ||
| United States of America - 2.1% | |||
| Autoliv, Inc. (a) | 44,300 | 5,938,415 | |
| Martin Marietta Materials, Inc. | 23,820 | 4,639,421 | |
| Mohawk Industries, Inc. (b) | 14,300 | 3,001,284 | |
| PriceSmart, Inc. | 104,074 | 9,116,882 | |
| ResMed, Inc. | 68,095 | 6,444,511 | |
| TOTAL UNITED STATES OF AMERICA | 29,140,513 | ||
| TOTAL COMMON STOCKS | |||
| (Cost $894,247,029) | 1,233,504,722 | ||
| Nonconvertible Preferred Stocks - 1.4% | |||
| Germany - 1.4% | |||
| Sartorius AG (non-vtg.) | |||
| (Cost $3,757,135) | 125,880 | 19,427,222 | |
| Investment Companies - 3.6% | |||
| United States of America - 3.6% | |||
| iShares MSCI EAFE Small-Cap ETF | |||
| (Cost $49,870,027) | 750,000 | 49,215,004 | |
| Money Market Funds - 5.5% | |||
| Fidelity Cash Central Fund, 1.74% (e) | 69,289,707 | 69,303,565 | |
| Fidelity Securities Lending Cash Central Fund 1.74% (e)(f) | 6,630,648 | 6,631,311 | |
| TOTAL MONEY MARKET FUNDS | |||
| (Cost $75,934,876) | 75,934,876 | ||
| TOTAL INVESTMENT IN SECURITIES - 100.1% | |||
| (Cost $1,023,809,067) | 1,378,081,824 | ||
| NET OTHER ASSETS (LIABILITIES) - (0.1)% | (1,826,131) | ||
| NET ASSETS - 100% | $1,376,255,693 |
Security Type Abbreviations
ETF – Exchange-Traded Fund
Categorizations in the Schedule of Investments are based on country or territory of incorporation.
Legend
(a) Security or a portion of the security is on loan at period end.
(b) Non-income producing
(c) Level 3 security
(d) Security exempt from registration under Rule 144A of the Securities Act of 1933. These securities may be resold in transactions exempt from registration, normally to qualified institutional buyers. At the end of the period, the value of these securities amounted to $16,402,389 or 1.2% of net assets.
(e) Affiliated fund that is generally available only to investment companies and other accounts managed by Fidelity Investments. The rate quoted is the annualized seven-day yield of the fund at period end. A complete unaudited listing of the fund's holdings as of its most recent quarter end is available upon request. In addition, each Fidelity Central Fund's financial statements are available on the SEC's website or upon request.
(f) Investment made with cash collateral received from securities on loan.
Affiliated Central Funds
Information regarding fiscal year to date income earned by the Fund from investments in Fidelity Central Funds is as follows:
| Fund | Income earned |
| Fidelity Cash Central Fund | $302,467 |
| Fidelity Securities Lending Cash Central Fund | 47,593 |
| Total | $350,060 |
Amounts in the income column in the above table include any capital gain distributions from underlying funds, which are presented in the corresponding line-item in the Statement of Operations if applicable.
Investment Valuation
The following is a summary of the inputs used, as of April 30, 2018, involving the Fund's assets and liabilities carried at fair value. The inputs or methodology used for valuing securities may not be an indication of the risk associated with investing in those securities. For more information on valuation inputs, and their aggregation into the levels used below, please refer to the Investment Valuation section in the accompanying Notes to Financial Statements.
| Valuation Inputs at Reporting Date: | ||||
| Description | Total | Level 1 | Level 2 | Level 3 |
| Investments in Securities: | ||||
| Equities: | ||||
| Consumer Discretionary | $207,877,098 | $194,202,470 | $13,674,628 | $-- |
| Consumer Staples | 117,831,279 | 99,676,110 | 18,155,169 | -- |
| Energy | 29,331,568 | 29,331,568 | -- | -- |
| Financials | 72,097,770 | 68,017,135 | 4,080,635 | -- |
| Health Care | 167,796,495 | 167,796,495 | -- | -- |
| Industrials | 310,660,750 | 310,660,750 | -- | -- |
| Information Technology | 180,056,551 | 174,537,646 | 5,518,905 | -- |
| Materials | 97,138,200 | 61,119,137 | 36,019,048 | 15 |
| Real Estate | 70,142,233 | 70,142,233 | -- | -- |
| Investment Companies | 49,215,004 | 49,215,004 | -- | -- |
| Money Market Funds | 75,934,876 | 75,934,876 | -- | -- |
| Total Investments in Securities: | $1,378,081,824 | $1,300,633,424 | $77,448,385 | $15 |
The following is a summary of transfers between Level 1 and Level 2 for the period ended April 30, 2018. Transfers are assumed to have occurred at the beginning of the period, and are primarily attributable to the valuation techniques used for foreign equity securities, as discussed in the accompanying Notes to Financial Statements:
| Transfers | Total |
| Level 1 to Level 2 | $70,382,372 |
| Level 2 to Level 1 | $378,633,854 |
The following is a reconciliation of Investments in Securities for which Level 3 inputs were used in determining value:
| Investments in Securities: | |
| Industrials | |
| Beginning Balance | $16,532,055 |
| Net Realized Gain (Loss) on Investment Securities | (2,430,489) |
| Net Unrealized Gain (Loss) on Investment Securities | (2,765,043) |
| Cost of Purchases | -- |
| Proceeds of Sales | (11,336,523) |
| Amortization/Accretion | -- |
| Transfers into Level 3 | -- |
| Transfers out of Level 3 | -- |
| Ending Balance | $-- |
| The change in unrealized gain (loss) for the period attributable to Level 3 securities held at April 30, 2018 | $-- |
| Other Investments in Securities | |
| Beginning Balance | $454,083 |
| Net Realized Gain (Loss) on Investment Securities | -- |
| Net Unrealized Gain (Loss) on Investment Securities | (454,068) |
| Cost of Purchases | -- |
| Proceeds of Sales | -- |
| Amortization/Accretion | -- |
| Transfers into Level 3 | -- |
| Transfers out of Level 3 | -- |
| Ending Balance | $15 |
| The change in unrealized gain (loss) for the period attributable to Level 3 securities held at April 30, 2018 | $(454,068) |
The information used in the above reconciliations represents fiscal year to date activity for any Investments in Securities identified as using Level 3 inputs at either the beginning or the end of the current fiscal period. Transfers in or out of Level 3 represent the beginning value of any Security or Instrument where a change in the pricing level occurred from the beginning to the end of the period. The cost of purchases and the proceeds of sales may include securities received or delivered through corporate actions or exchanges. Realized and unrealized gains (losses) disclosed in the reconciliation are included in Net Gain (Loss) on the Fund’s Statement of Operations.
See accompanying notes which are an integral part of the financial statements.
Financial Statements
Statement of Assets and Liabilities
| April 30, 2018 (Unaudited) | ||
| Assets | ||
| Investment in securities, at value (including securities loaned of $6,282,542) — See accompanying schedule: Unaffiliated issuers (cost $947,874,191) | $1,302,146,948 | |
| Fidelity Central Funds (cost $75,934,876) | 75,934,876 | |
| Total Investment in Securities (cost $1,023,809,067) | $1,378,081,824 | |
| Cash | 617,117 | |
| Foreign currency held at value (cost $205,283) | 205,283 | |
| Receivable for investments sold | 1,379,104 | |
| Receivable for fund shares sold | 3,483,149 | |
| Dividends receivable | 4,638,833 | |
| Distributions receivable from Fidelity Central Funds | 134,955 | |
| Prepaid expenses | 577 | |
| Other receivables | 11,646 | |
| Total assets | 1,388,552,488 | |
| Liabilities | ||
| Payable for investments purchased | $3,306,748 | |
| Payable for fund shares redeemed | 1,035,282 | |
| Accrued management fee | 962,819 | |
| Distribution and service plan fees payable | 32,086 | |
| Other affiliated payables | 250,527 | |
| Other payables and accrued expenses | 77,923 | |
| Collateral on securities loaned | 6,631,410 | |
| Total liabilities | 12,296,795 | |
| Net Assets | $1,376,255,693 | |
| Net Assets consist of: | ||
| Paid in capital | $1,017,676,784 | |
| Undistributed net investment income | 4,021,965 | |
| Accumulated undistributed net realized gain (loss) on investments and foreign currency transactions | 299,450 | |
| Net unrealized appreciation (depreciation) on investments and assets and liabilities in foreign currencies | 354,257,494 | |
| Net Assets | $1,376,255,693 | |
| Calculation of Maximum Offering Price | ||
| Class A: | ||
| Net Asset Value and redemption price per share ($47,943,710 ÷ 2,418,186 shares) | $19.83 | |
| Maximum offering price per share (100/94.25 of $19.83) | $21.04 | |
| Class M: | ||
| Net Asset Value and redemption price per share ($16,439,337 ÷ 835,674 shares) | $19.67 | |
| Maximum offering price per share (100/96.50 of $19.67) | $20.38 | |
| Class C: | ||
| Net Asset Value and offering price per share ($18,856,420 ÷ 983,768 shares)(a) | $19.17 | |
| International Small Cap Opportunities: | ||
| Net Asset Value, offering price and redemption price per share ($1,085,916,823 ÷ 54,202,073 shares) | $20.03 | |
| Class I: | ||
| Net Asset Value, offering price and redemption price per share ($207,099,403 ÷ 10,351,587 shares) | $20.01 |
(a) Redemption price per share is equal to net asset value less any applicable contingent deferred sales charge.
See accompanying notes which are an integral part of the financial statements.
Statement of Operations
| Six months ended April 30, 2018 (Unaudited) | ||
| Investment Income | ||
| Dividends | $12,407,928 | |
| Income from Fidelity Central Funds | 350,060 | |
| Income before foreign taxes withheld | 12,757,988 | |
| Less foreign taxes withheld | (1,178,760) | |
| Total income | 11,579,228 | |
| Expenses | ||
| Management fee | ||
| Basic fee | $5,138,300 | |
| Performance adjustment | 52,938 | |
| Transfer agent fees | 1,147,372 | |
| Distribution and service plan fees | 177,941 | |
| Accounting and security lending fees | 280,100 | |
| Custodian fees and expenses | 89,089 | |
| Independent trustees' fees and expenses | 2,353 | |
| Registration fees | 48,751 | |
| Audit | 34,413 | |
| Legal | 3,114 | |
| Miscellaneous | 3,771 | |
| Total expenses before reductions | 6,978,142 | |
| Expense reductions | (14,755) | 6,963,387 |
| Net investment income (loss) | 4,615,841 | |
| Realized and Unrealized Gain (Loss) | ||
| Net realized gain (loss) on: | ||
| Investment securities: | ||
| Unaffiliated issuers | 17,909,964 | |
| Fidelity Central Funds | (873) | |
| Foreign currency transactions | 60,790 | |
| Total net realized gain (loss) | 17,969,881 | |
| Change in net unrealized appreciation (depreciation) on: | ||
| Investment securities: | ||
| Unaffiliated issuers | 81,117,208 | |
| Fidelity Central Funds | 647 | |
| Assets and liabilities in foreign currencies | (15,683) | |
| Total change in net unrealized appreciation (depreciation) | 81,102,172 | |
| Net gain (loss) | 99,072,053 | |
| Net increase (decrease) in net assets resulting from operations | $103,687,894 |
See accompanying notes which are an integral part of the financial statements.
Statement of Changes in Net Assets
| Six months ended April 30, 2018 (Unaudited) | Year ended October 31, 2017 | |
| Increase (Decrease) in Net Assets | ||
| Operations | ||
| Net investment income (loss) | $4,615,841 | $9,131,889 |
| Net realized gain (loss) | 17,969,881 | 41,561,179 |
| Change in net unrealized appreciation (depreciation) | 81,102,172 | 187,420,991 |
| Net increase (decrease) in net assets resulting from operations | 103,687,894 | 238,114,059 |
| Distributions to shareholders from net investment income | (8,651,810) | (10,624,038) |
| Distributions to shareholders from net realized gain | (14,636,693) | (2,566,511) |
| Total distributions | (23,288,503) | (13,190,549) |
| Share transactions - net increase (decrease) | 143,787,396 | (108,646,188) |
| Redemption fees | 15,029 | 188,947 |
| Total increase (decrease) in net assets | 224,201,816 | 116,466,269 |
| Net Assets | ||
| Beginning of period | 1,152,053,877 | 1,035,587,608 |
| End of period | $1,376,255,693 | $1,152,053,877 |
| Other Information | ||
| Undistributed net investment income end of period | $4,021,965 | $8,057,934 |
See accompanying notes which are an integral part of the financial statements.
Financial Highlights
Fidelity International Small Cap Opportunities Fund Class A
| Six months ended (Unaudited) April 30, | Years endedOctober 31, | |||||
| 2018 | 2017 | 2016 | 2015 | 2014 | 2013 | |
| Selected Per–Share Data | ||||||
| Net asset value, beginning of period | $18.47 | $14.82 | $14.75 | $13.65 | $13.68 | $10.78 |
| Income from Investment Operations | ||||||
| Net investment income (loss)A | .05 | .10 | .09 | .06 | .05 | .07 |
| Net realized and unrealized gain (loss) | 1.65 | 3.71 | .10 | 1.11 | .05 | 2.91 |
| Total from investment operations | 1.70 | 3.81 | .19 | 1.17 | .10 | 2.98 |
| Distributions from net investment income | (.09) | (.12) | (.05) | (.05) | (.06) | (.08) |
| Distributions from net realized gain | (.24) | (.04) | (.07) | (.02) | (.08) | (.01) |
| Total distributions | (.34)B | (.16) | (.12) | (.07) | (.13)C | (.08)D |
| Redemption fees added to paid in capitalA,E | – | – | – | – | – | – |
| Net asset value, end of period | $19.83 | $18.47 | $14.82 | $14.75 | $13.65 | $13.68 |
| Total ReturnF,G,H | 9.30% | 26.00% | 1.30% | 8.62% | .78% | 27.85% |
| Ratios to Average Net AssetsI,J | ||||||
| Expenses before reductions | 1.40%K | 1.43% | 1.45% | 1.52% | 1.63% | 1.70% |
| Expenses net of fee waivers, if any | 1.40%K | 1.43% | 1.45% | 1.52% | 1.63% | 1.65% |
| Expenses net of all reductions | 1.40%K | 1.43% | 1.45% | 1.51% | 1.63% | 1.64% |
| Net investment income (loss) | .50%K | .61% | .62% | .38% | .33% | .59% |
| Supplemental Data | ||||||
| Net assets, end of period (000 omitted) | $47,944 | $41,324 | $45,151 | $42,289 | $25,041 | $22,052 |
| Portfolio turnover rateL | 18 %K | 11% | 24% | 21% | 18% | 31% |
A Calculated based on average shares outstanding during the period.
B Total distributions of $.34 per share is comprised of distributions from net investment income of $.093 and distributions from net realized gain of $.243 per share.
C Total distributions of $.13 per share is comprised of distributions from net investment income of $.055 and net realized gain of $.079 per share.
D Total distributions of $.08 per share is comprised of distributions from net investment income of $.077 and distributions from net realized gain of $.005 per share.
E Amount represents less than $.005 per share.
F Total returns for periods of less than one year are not annualized.
G Total returns would have been lower if certain expenses had not been reduced during the applicable periods shown.
H Total returns do not include the effect of the sales charges.
I Fees and expenses of any underlying Fidelity Central Funds are not included in the Fund's expense ratio. The Fund indirectly bears its proportionate share of the expenses of any underlying Fidelity Central Funds.
J Expense ratios reflect operating expenses of the class. Expenses before reductions do not reflect amounts reimbursed by the investment adviser or reductions from brokerage service arrangements or reductions from other expense offset arrangements and do not represent the amount paid by the class during periods when reimbursements or reductions occur. Expenses net of fee waivers reflect expenses after reimbursement by the investment adviser but prior to reductions from brokerage service arrangements or other expense offset arrangements. Expenses net of all reductions represent the net expenses paid by the class.
K Annualized
L Amount does not include the portfolio activity of any underlying Fidelity Central Funds.
See accompanying notes which are an integral part of the financial statements.
Fidelity International Small Cap Opportunities Fund Class M
| Six months ended (Unaudited) April 30, | Years endedOctober 31, | |||||
| 2018 | 2017 | 2016 | 2015 | 2014 | 2013 | |
| Selected Per–Share Data | ||||||
| Net asset value, beginning of period | $18.32 | $14.68 | $14.62 | $13.53 | $13.56 | $10.69 |
| Income from Investment Operations | ||||||
| Net investment income (loss)A | .02 | .05 | .04 | .01 | .01 | .04 |
| Net realized and unrealized gain (loss) | 1.63 | 3.69 | .10 | 1.11 | .06 | 2.89 |
| Total from investment operations | 1.65 | 3.74 | .14 | 1.12 | .07 | 2.93 |
| Distributions from net investment income | (.06) | (.06) | (.01) | (.01) | (.02) | (.05) |
| Distributions from net realized gain | (.24) | (.04) | (.07) | (.02) | (.08) | (.01) |
| Total distributions | (.30) | (.10) | (.08) | (.03) | (.10) | (.06) |
| Redemption fees added to paid in capitalA,B | – | – | – | – | – | – |
| Net asset value, end of period | $19.67 | $18.32 | $14.68 | $14.62 | $13.53 | $13.56 |
| Total ReturnC,D,E | 9.13% | 25.63% | .95% | 8.27% | .55% | 27.53% |
| Ratios to Average Net AssetsF,G | ||||||
| Expenses before reductions | 1.68%H | 1.73% | 1.77% | 1.80% | 1.89% | 1.96% |
| Expenses net of fee waivers, if any | 1.68%H | 1.73% | 1.77% | 1.80% | 1.89% | 1.90% |
| Expenses net of all reductions | 1.68%H | 1.73% | 1.77% | 1.80% | 1.89% | 1.89% |
| Net investment income (loss) | .21%H | .31% | .30% | .10% | .07% | .34% |
| Supplemental Data | ||||||
| Net assets, end of period (000 omitted) | $16,439 | $14,422 | $12,308 | $13,296 | $9,913 | $9,634 |
| Portfolio turnover rateI | 18%H | 11% | 24% | 21% | 18% | 31% |
A Calculated based on average shares outstanding during the period.
B Amount represents less than $.005 per share.
C Total returns for periods of less than one year are not annualized.
D Total returns would have been lower if certain expenses had not been reduced during the applicable periods shown.
E Total returns do not include the effect of the sales charges.
F Fees and expenses of any underlying Fidelity Central Funds are not included in the Fund's expense ratio. The Fund indirectly bears its proportionate share of the expenses of any underlying Fidelity Central Funds.
G Expense ratios reflect operating expenses of the class. Expenses before reductions do not reflect amounts reimbursed by the investment adviser or reductions from brokerage service arrangements or reductions from other expense offset arrangements and do not represent the amount paid by the class during periods when reimbursements or reductions occur. Expenses net of fee waivers reflect expenses after reimbursement by the investment adviser but prior to reductions from brokerage service arrangements or other expense offset arrangements. Expenses net of all reductions represent the net expenses paid by the class.
H Annualized
I Amount does not include the portfolio activity of any underlying Fidelity Central Funds.
See accompanying notes which are an integral part of the financial statements.
Fidelity International Small Cap Opportunities Fund Class C
| Six months ended (Unaudited) April 30, | Years endedOctober 31, | |||||
| 2018 | 2017 | 2016 | 2015 | 2014 | 2013 | |
| Selected Per–Share Data | ||||||
| Net asset value, beginning of period | $17.84 | $14.27 | $14.26 | $13.23 | $13.28 | $10.48 |
| Income from Investment Operations | ||||||
| Net investment income (loss)A | (.03) | (.03) | (.03) | (.05) | (.06) | (.02) |
| Net realized and unrealized gain (loss) | 1.60 | 3.60 | .09 | 1.08 | .06 | 2.84 |
| Total from investment operations | 1.57 | 3.57 | .06 | 1.03 | – | 2.82 |
| Distributions from net investment income | – | – | – | – | – | (.01) |
| Distributions from net realized gain | (.24) | – | (.05) | – | (.05) | (.01) |
| Total distributions | (.24) | – | (.05) | – | (.05) | (.02) |
| Redemption fees added to paid in capitalA,B | – | – | – | – | – | – |
| Net asset value, end of period | $19.17 | $17.84 | $14.27 | $14.26 | $13.23 | $13.28 |
| Total ReturnC,D,E | 8.90% | 25.02% | .44% | 7.79% | .03% | 26.91% |
| Ratios to Average Net AssetsF,G | ||||||
| Expenses before reductions | 2.16%H | 2.22% | 2.26% | 2.27% | 2.38% | 2.45% |
| Expenses net of fee waivers, if any | 2.16%H | 2.22% | 2.26% | 2.27% | 2.38% | 2.40% |
| Expenses net of all reductions | 2.16%H | 2.21% | 2.25% | 2.26% | 2.38% | 2.39% |
| Net investment income (loss) | (.27)%H | (.17)% | (.19)% | (.36)% | (.42)% | (.16)% |
| Supplemental Data | ||||||
| Net assets, end of period (000 omitted) | $18,856 | $14,547 | $12,625 | $17,370 | $8,438 | $8,070 |
| Portfolio turnover rateI | 18%H | 11% | 24% | 21% | 18% | 31% |
A Calculated based on average shares outstanding during the period.
B Amount represents less than $.005 per share.
C Total returns for periods of less than one year are not annualized.
D Total returns would have been lower if certain expenses had not been reduced during the applicable periods shown.
E Total returns do not include the effect of the contingent deferred sales charge.
F Fees and expenses of any underlying Fidelity Central Funds are not included in the Fund's expense ratio. The Fund indirectly bears its proportionate share of the expenses of any underlying Fidelity Central Funds.
G Expense ratios reflect operating expenses of the class. Expenses before reductions do not reflect amounts reimbursed by the investment adviser or reductions from brokerage service arrangements or reductions from other expense offset arrangements and do not represent the amount paid by the class during periods when reimbursements or reductions occur. Expenses net of fee waivers reflect expenses after reimbursement by the investment adviser but prior to reductions from brokerage service arrangements or other expense offset arrangements. Expenses net of all reductions represent the net expenses paid by the class.
H Annualized
I Amount does not include the portfolio activity of any underlying Fidelity Central Funds.
See accompanying notes which are an integral part of the financial statements.
Fidelity International Small Cap Opportunities Fund
| Six months ended (Unaudited) April 30, | Years endedOctober 31, | |||||
| 2018 | 2017 | 2016 | 2015 | 2014 | 2013 | |
| Selected Per–Share Data | ||||||
| Net asset value, beginning of period | $18.69 | $15.00 | $14.91 | $13.80 | $13.82 | $10.88 |
| Income from Investment Operations | ||||||
| Net investment income (loss)A | .08 | .15 | .13 | .10 | .09 | .10 |
| Net realized and unrealized gain (loss) | 1.65 | 3.75 | .11 | 1.12 | .06 | 2.95 |
| Total from investment operations | 1.73 | 3.90 | .24 | 1.22 | .15 | 3.05 |
| Distributions from net investment income | (.15) | (.17) | (.08) | (.09) | (.09) | (.10) |
| Distributions from net realized gain | (.24) | (.04) | (.07) | (.02) | (.08) | (.01) |
| Total distributions | (.39) | (.21) | (.15) | (.11) | (.17) | (.11) |
| Redemption fees added to paid in capitalA,B | – | – | – | – | – | – |
| Net asset value, end of period | $20.03 | $18.69 | $15.00 | $14.91 | $13.80 | $13.82 |
| Total ReturnC,D | 9.40% | 26.39% | 1.58% | 8.92% | 1.11% | 28.24% |
| Ratios to Average Net AssetsE,F | ||||||
| Expenses before reductions | 1.10%G | 1.13% | 1.17% | 1.23% | 1.30% | 1.39% |
| Expenses net of fee waivers, if any | 1.10%G | 1.13% | 1.17% | 1.22% | 1.30% | 1.39% |
| Expenses net of all reductions | 1.10%G | 1.13% | 1.16% | 1.22% | 1.30% | 1.38% |
| Net investment income (loss) | .79%G | .91% | .90% | .68% | .65% | .85% |
| Supplemental Data | ||||||
| Net assets, end of period (000 omitted) | $1,085,917 | $916,882 | $809,952 | $762,563 | $584,253 | $518,121 |
| Portfolio turnover rateH | 18 %G | 11% | 24% | 21% | 18% | 31% |
A Calculated based on average shares outstanding during the period.
B Amount represents less than $.005 per share.
C Total returns for periods of less than one year are not annualized.
D Total returns would have been lower if certain expenses had not been reduced during the applicable periods shown.
E Fees and expenses of any underlying Fidelity Central Funds are not included in the Fund's expense ratio. The Fund indirectly bears its proportionate share of the expenses of any underlying Fidelity Central Funds.
F Expense ratios reflect operating expenses of the class. Expenses before reductions do not reflect amounts reimbursed by the investment adviser or reductions from brokerage service arrangements or reductions from other expense offset arrangements and do not represent the amount paid by the class during periods when reimbursements or reductions occur. Expenses net of fee waivers reflect expenses after reimbursement by the investment adviser but prior to reductions from brokerage service arrangements or other expense offset arrangements. Expenses net of all reductions represent the net expenses paid by the class.
G Annualized
H Amount does not include the portfolio activity of any underlying Fidelity Central Funds.
See accompanying notes which are an integral part of the financial statements.
Fidelity International Small Cap Opportunities Fund Class I
| Six months ended (Unaudited) April 30, | Years endedOctober 31, | |||||
| 2018 | 2017 | 2016 | 2015 | 2014 | 2013 | |
| Selected Per–Share Data | ||||||
| Net asset value, beginning of period | $18.66 | $14.99 | $14.91 | $13.81 | $13.83 | $10.90 |
| Income from Investment Operations | ||||||
| Net investment income (loss)A | .08 | .15 | .13 | .10 | .08 | .11 |
| Net realized and unrealized gain (loss) | 1.66 | 3.74 | .10 | 1.13 | .07 | 2.93 |
| Total from investment operations | 1.74 | 3.89 | .23 | 1.23 | .15 | 3.04 |
| Distributions from net investment income | (.15) | (.18) | (.08) | (.11) | (.09) | (.10) |
| Distributions from net realized gain | (.24) | (.04) | (.07) | (.02) | (.08) | (.01) |
| Total distributions | (.39) | (.22) | (.15) | (.13) | (.17) | (.11) |
| Redemption fees added to paid in capitalA,B | – | – | – | – | – | – |
| Net asset value, end of period | $20.01 | $18.66 | $14.99 | $14.91 | $13.81 | $13.83 |
| Total ReturnC,D | 9.46% | 26.34% | 1.56% | 8.98% | 1.11% | 28.11% |
| Ratios to Average Net AssetsE,F | ||||||
| Expenses before reductions | 1.13%G | 1.14% | 1.16% | 1.19% | 1.36% | 1.38% |
| Expenses net of fee waivers, if any | 1.13%G | 1.14% | 1.16% | 1.19% | 1.36% | 1.37% |
| Expenses net of all reductions | 1.13%G | 1.14% | 1.16% | 1.18% | 1.36% | 1.37% |
| Net investment income (loss) | .76%G | .90% | .91% | .71% | .60% | .87% |
| Supplemental Data | ||||||
| Net assets, end of period (000 omitted) | $207,099 | $164,878 | $155,551 | $120,723 | $29,822 | $5,670 |
| Portfolio turnover rateH | 18 %G | 11% | 24% | 21% | 18% | 31% |
A Calculated based on average shares outstanding during the period.
B Amount represents less than $.005 per share.
C Total returns for periods of less than one year are not annualized.
D Total returns would have been lower if certain expenses had not been reduced during the applicable periods shown.
E Fees and expenses of any underlying Fidelity Central Funds are not included in the Fund's expense ratio. The Fund indirectly bears its proportionate share of the expenses of any underlying Fidelity Central Funds.
F Expense ratios reflect operating expenses of the class. Expenses before reductions do not reflect amounts reimbursed by the investment adviser or reductions from brokerage service arrangements or reductions from other expense offset arrangements and do not represent the amount paid by the class during periods when reimbursements or reductions occur. Expenses net of fee waivers reflect expenses after reimbursement by the investment adviser but prior to reductions from brokerage service arrangements or other expense offset arrangements. Expenses net of all reductions represent the net expenses paid by the class.
G Annualized
H Amount does not include the portfolio activity of any underlying Fidelity Central Funds.
See accompanying notes which are an integral part of the financial statements.
Notes to Financial Statements (Unaudited)
For the period ended April 30, 2018
1. Organization.
Fidelity International Small Cap Opportunities Fund (the Fund) is a fund of Fidelity Investment Trust (the Trust) and is authorized to issue an unlimited number of shares. The Trust is registered under the Investment Company Act of 1940, as amended (the 1940 Act), as an open-end management investment company organized as a Massachusetts business trust. The Fund offers Class A, Class M, Class C, International Small Cap Opportunities and Class I shares, each of which has equal rights as to assets and voting privileges. Each class has exclusive voting rights with respect to matters that affect that class
2. Investments in Fidelity Central Funds.
The Fund invests in Fidelity Central Funds, which are open-end investment companies generally available only to other investment companies and accounts managed by the investment adviser and its affiliates. The Fund's Schedule of Investments lists each of the Fidelity Central Funds held as of period end, if any, as an investment of the Fund, but does not include the underlying holdings of each Fidelity Central Fund. As an Investing Fund, the Fund indirectly bears its proportionate share of the expenses of the underlying Fidelity Central Funds.
The Money Market Central Funds seek preservation of capital and current income and are managed by Fidelity Investments Money Management, Inc. (FIMM), an affiliate of the investment adviser. Annualized expenses of the Money Market Central Funds as of their most recent shareholder report date are less than .005%.
A complete unaudited list of holdings for each Fidelity Central Fund is available upon request or at the Securities and Exchange Commission (the SEC) website at www.sec.gov. In addition, the financial statements of the Fidelity Central Funds are available on the SEC website or upon request.
3. Significant Accounting Policies.
The Fund is an investment company and applies the accounting and reporting guidance of the Financial Accounting Standards Board (FASB) Accounting Standards Codification Topic 946 Financial Services – Investments Companies. The financial statements have been prepared in conformity with accounting principles generally accepted in the United States of America (GAAP), which require management to make certain estimates and assumptions at the date of the financial statements. Actual results could differ from those estimates. Subsequent events, if any, through the date that the financial statements were issued have been evaluated in the preparation of the financial statements. The following summarizes the significant accounting policies of the Fund:
Investment Valuation. Investments are valued as of 4:00 p.m. Eastern time on the last calendar day of the period. The Board of Trustees (the Board) has delegated the day to day responsibility for the valuation of the Fund's investments to the Fair Value Committee (the Committee) established by the Fund's investment adviser. In accordance with valuation policies and procedures approved by the Board, the Fund attempts to obtain prices from one or more third party pricing vendors or brokers to value its investments. When current market prices, quotations or currency exchange rates are not readily available or reliable, investments will be fair valued in good faith by the Committee, in accordance with procedures adopted by the Board. Factors used in determining fair value vary by investment type and may include market or investment specific events. The frequency with which these procedures are used cannot be predicted and they may be utilized to a significant extent. The Committee oversees the Fund's valuation policies and procedures and reports to the Board on the Committee's activities and fair value determinations. The Board monitors the appropriateness of the procedures used in valuing the Fund's investments and ratifies the fair value determinations of the Committee.
The Fund categorizes the inputs to valuation techniques used to value its investments into a disclosure hierarchy consisting of three levels as shown below:
- Level 1 – quoted prices in active markets for identical investments
- Level 2 – other significant observable inputs (including quoted prices for similar investments, interest rates, prepayment speeds, etc.)
- Level 3 – unobservable inputs (including the Fund's own assumptions based on the best information available)
Valuation techniques used to value the Fund's investments by major category are as follows:
Equity securities, including restricted securities, for which market quotations are readily available, are valued at the last reported sale price or official closing price as reported by a third party pricing vendor on the primary market or exchange on which they are traded and are categorized as Level 1 in the hierarchy. In the event there were no sales during the day or closing prices are not available, securities are valued at the last quoted bid price or may be valued using the last available price and are generally categorized as Level 2 in the hierarchy. For foreign equity securities, when market or security specific events arise, comparisons to the valuation of American Depositary Receipts (ADRs), futures contracts, Exchange-Traded Funds (ETFs) and certain indexes as well as quoted prices for similar securities may be used and would be categorized as Level 2 in the hierarchy. Utilizing these techniques may result in transfers between Level 1 and Level 2. For equity securities, including restricted securities, where observable inputs are limited, assumptions about market activity and risk are used and these securities may be categorized as Level 3 in the hierarchy.
ETFs are valued at their last sale price or official closing price as reported by a third party pricing vendor on the primary market or exchange on which they are traded and are categorized as Level 1 in the hierarchy. In the event there were no sales during the day but the exchange reports a closing bid level, ETFs are valued at the closing bid and would be categorized as Level 1 in the hierarchy. In the event there was no closing bid, ETFs may be valued by another method that the Board believes reflects fair value in accordance with the Board's fair value pricing policies and may be categorized as Level 2 in the hierarchy.
Investments in open-end mutual funds, including Fidelity Central Funds, are valued at their closing net asset value (NAV) each business day and are categorized as Level 1 in the hierarchy
Changes in valuation techniques may result in transfers in or out of an assigned level within the disclosure hierarchy. The aggregate value of investments by input level as of April 30, 2018 including information on transfers between Levels 1 and 2, as well as a roll forward of Level 3 investments, is included at the end of the Fund's Schedule of Investments.
Foreign Currency. The Fund may use foreign currency contracts to facilitate transactions in foreign-denominated securities. Gains and losses from these transactions may arise from changes in the value of the foreign currency or if the counterparties do not perform under the contracts' terms.
Foreign-denominated assets, including investment securities, and liabilities are translated into U.S. dollars at the exchange rates at period end. Purchases and sales of investment securities, income and dividends received and expenses denominated in foreign currencies are translated into U.S. dollars at the exchange rate in effect on the transaction date.
The effects of exchange rate fluctuations on investments are included with the net realized and unrealized gain (loss) on investment securities. Other foreign currency transactions resulting in realized and unrealized gain (loss) are disclosed separately.
Investment Transactions and Income. For financial reporting purposes, the Fund's investment holdings and NAV include trades executed through the end of the last business day of the period. The NAV per share for processing shareholder transactions is calculated as of the close of business of the New York Stock Exchange (NYSE, normally 4:00 p.m. Eastern time and includes trades executed through the end of the prior business day. Gains and losses on securities sold are determined on the basis of identified cost. Dividend income is recorded on the ex-dividend date, except for certain dividends from foreign securities where the ex-dividend date may have passed, which are recorded as soon as the Fund is informed of the ex-dividend date. Non-cash dividends included in dividend income, if any, are recorded at the fair market value of the securities received. Income and capital gain distributions from Fidelity Central Funds, if any, are recorded on the ex-dividend date. Certain distributions received by the Fund represent a return of capital or capital gain. The Fund determines the components of these distributions subsequent to the ex-dividend date, based upon receipt of tax filings or other correspondence relating to the underlying investment. These distributions are recorded as a reduction of cost of investments and/or as a realized gain. Investment income is recorded net of foreign taxes withheld where recovery of such taxes is uncertain.
Class Allocations and Expenses. Investment income, realized and unrealized capital gains and losses, common expenses of the Fund, and certain fund-level expense reductions, if any, are allocated daily on a pro-rata basis to each class based on the relative net assets of each class to the total net assets of the Fund. Each class differs with respect to transfer agent and distribution and service plan fees incurred. Certain expense reductions may also differ by class. For the reporting period, the allocated portion of income and expenses to each class as a percent of its average net assets may vary due to the timing of recording these transactions in relation to fluctuating net assets of the classes. Expenses directly attributable to a fund are charged to that fund. Expenses attributable to more than one fund are allocated among the respective funds on the basis of relative net assets or other appropriate methods. Expense estimates are accrued in the period to which they relate and adjustments are made when actual amounts are known.
Income Tax Information and Distributions to Shareholders. Each year, the Fund intends to qualify as a regulated investment company under Subchapter M of the Internal Revenue Code, including distributing substantially all of its taxable income and realized gains. As a result, no provision for U.S. Federal income taxes is required. The Fund files a U.S. federal tax return, in addition to state and local tax returns as required. The Fund's federal income tax returns are subject to examination by the Internal Revenue Service (IRS) for a period of three fiscal years after they are filed. State and local tax returns may be subject to examination for an additional fiscal year depending on the jurisdiction. Foreign taxes are provided for based on the Fund's understanding of the tax rules and rates that exist in the foreign markets in which it invests.
Distributions are declared and recorded on the ex-dividend date. Income and capital gain distributions are declared separately for each class. Income and capital gain distributions are determined in accordance with income tax regulations, which may differ from GAAP.
Capital accounts within the financial statements are adjusted for permanent book-tax differences. These adjustments have no impact on net assets or the results of operations. Capital accounts are not adjusted for temporary book-tax differences which will reverse in a subsequent period.
Book-tax differences are primarily due to foreign currency transactions, passive foreign investment companies (PFIC), capital loss carryforwards and losses deferred due to wash sales.
As of period end, the cost and unrealized appreciation (depreciation) in securities, and derivatives if applicable, for federal income tax purposes were as follows:
| Gross unrealized appreciation | $376,331,513 |
| Gross unrealized depreciation | (39,485,669) |
| Net unrealized appreciation (depreciation) | $336,845,844 |
| Tax cost | $1,041,235,980 |
Short-Term Trading (Redemption) Fees. Shares held by investors in the Fund less than 90 days may have been subject to a redemption fee equal to 2.00% of the NAV of shares redeemed. All redemption fees, which reduce the proceeds of the shareholder redemption, are retained by the Fund and accounted for as an addition to paid in capital. In November 2017, the Board of Trustees approved the elimination of these redemption fees effective December 18, 2017.
Restricted Securities. The Fund may invest in securities that are subject to legal or contractual restrictions on resale. These securities generally may be resold in transactions exempt from registration or to the public if the securities are registered. Disposal of these securities may involve time-consuming negotiations and expense, and prompt sale at an acceptable price may be difficult. Information regarding restricted securities is included at the end of the Fund's Schedule of Investments.
4. Purchases and Sales of Investments.
Purchases and sales of securities, other than short-term securities, aggregated $207,522,983 and $106,237,190, respectively.
5. Fees and Other Transactions with Affiliates.
Management Fee. Fidelity Management & Research Company (the investment adviser) and its affiliates provide the Fund with investment management related services for which the Fund pays a monthly management fee. The management fee is the sum of an individual fund fee rate that is based on an annual rate of .60% of the Fund's average net assets and an annualized group fee rate that averaged .24% during the period. The group fee rate is based upon the average net assets of all the mutual funds advised by the investment adviser, including any mutual funds previously advised by the investment adviser that are currently advised by Fidelity SelectCo, LLC, an affiliate of the investment adviser. The group fee rate decreases as assets under management increase and increases as assets under management decrease. In addition, the management fee is subject to a performance adjustment (up to a maximum of +/- .20% of the Fund's average net assets over a 36 month performance period). The upward or downward adjustment to the management fee is based on the relative investment performance of Investment Small Cap Opportunities as compared to its benchmark index, the MSCI EAFE Small Cap Index, over the same 36 month performance period. For the reporting period, the total annualized management fee rate, including the performance adjustment, was .85% of the Fund's average net assets. The performance adjustment included in the management fee rate may be higher or lower than the maximum performance adjustment rate due to the difference between the average net assets for the reporting and performance periods.
Distribution and Service Plan Fees. In accordance with Rule 12b-1 of the 1940 Act, the Fund has adopted separate Distribution and Service Plans for each class of shares. Certain classes pay Fidelity Distributors Corporation (FDC), an affiliate of the investment adviser, separate Distribution and Service Fees, each of which is based on an annual percentage of each class' average net assets. In addition, FDC may pay financial intermediaries for selling shares of the Fund and providing shareholder support services. For the period, the Distribution and Service Fee rates, total fees and amounts retained by FDC were as follows:
| Distribution Fee | Service Fee | Total Fees | Retained by FDC | |
| Class A | -% | .25% | $57,260 | $2,059 |
| Class M | .25% | .25% | 38,884 | 424 |
| Class C | .75% | .25% | 81,797 | 10,683 |
| $177,941 | $13,166 |
Sales Load. FDC may receive a front-end sales charge of up to 5.75% for selling Class A shares and 3.50% for selling Class M shares, some of which is paid to financial intermediaries for selling shares of the Fund. Depending on the holding period, FDC may receive contingent deferred sales charges levied on Class A, Class M and Class C redemptions. The deferred sales charges are 1.00% for Class C shares, 1.00% for certain purchases of Class A shares and .25% for certain purchases of Class M shares.
For the period, sales charge amounts retained by FDC were as follows:
| Retained by FDC | |
| Class A | $16,475 |
| Class M | 3,035 |
| Class C(a) | 2,039 |
| $21,549 |
(a) When Class C shares are initially sold, FDC pays commissions from its own resources to financial intermediaries through which the sales are made.
Transfer Agent Fees. Fidelity Investments Institutional Operations Company, Inc., (FIIOC), an affiliate of the investment adviser, is the transfer, dividend disbursing and shareholder servicing agent for each class of the Fund. FIIOC receives account fees and asset-based fees that vary according to the account size and type of account of the shareholders of the respective classes of the Fund. FIIOC pays for typesetting, printing and mailing of shareholder reports, except proxy statements.
For the period, transfer agent fees for each class were as follows:
| Amount | % of Class-Level Average Net Assets(a) | |
| Class A | $51,362 | .22 |
| Class M | 20,063 | .26 |
| Class C | 19,716 | .24 |
| International Small Cap Opportunities | 863,924 | .18 |
| Class I | 192,307 | .21 |
| $1,147,372 |
(a) Annualized
Accounting and Security Lending Fees. Fidelity Service Company, Inc. (FSC), an affiliate of the investment adviser, maintains the Fund's accounting records. The accounting fee is based on the level of average net assets for each month. Under a separate contract, FSC administers the security lending program. The security lending fee is based on the number and duration of lending transactions. For the period, the fees were equivalent to an annualized rate of .05%.
Brokerage Commissions. The Fund placed a portion of its portfolio transactions with brokerage firms which are affiliates of the investment adviser. Brokerage commissions are included in net realized gain (loss) and change in net unrealized appreciation (depreciation) in the Statement of Operations. The commissions paid to these affiliated firms were $159 for the period.
Interfund Trades. The Fund may purchase from or sell securities to other Fidelity Funds under procedures adopted by the Board. The procedures have been designed to ensure these interfund trades are executed in accordance with Rule 17a-7 of the 1940 Act. Interfund trades are included within the respective purchases and sales amounts shown in the Purchases and Sales of Investments note.
6. Committed Line of Credit.
The Fund participates with other funds managed by the investment adviser or an affiliate in a $4.25 billion credit facility (the "line of credit") to be utilized for temporary or emergency purposes to fund shareholder redemptions or for other short-term liquidity purposes. The Fund has agreed to pay commitment fees on its pro-rata portion of the line of credit, which amounted to $1,688 and is reflected in Miscellaneous expenses on the Statement of Operations. During the period, the Fund did not borrow on this line of credit.
7. Security Lending.
The Fund lends portfolio securities through a lending agent from time to time in order to earn additional income. For equity securities, a lending agent is used and may loan securities to certain qualified borrowers, including Fidelity Capital Markets (FCM), a broker-dealer affiliated with the Fund. On the settlement date of the loan, the Fund receives collateral (in the form of U.S. Treasury obligations, letters of credit and/or cash) against the loaned securities and maintains collateral in an amount not less than 100% of the market value of the loaned securities during the period of the loan. The market value of the loaned securities is determined at the close of business of the Fund and any additional required collateral is delivered to the Fund on the next business day. The Fund or borrower may terminate the loan at any time, and if the borrower defaults on its obligation to return the securities loaned because of insolvency or other reasons, the Fund may apply collateral received from the borrower against the obligation. The Fund may experience delays and costs in recovering the securities loaned. Any cash collateral received is invested in the Fidelity Securities Lending Cash Central Fund. The value of loaned securities and cash collateral at period end are disclosed on the Fund's Statement of Assets and Liabilities. Security lending income represents the income earned on investing cash collateral, less rebates paid to borrowers and any lending agent fees associated with the loan, plus any premium payments received for lending certain types of securities. Security lending income is presented in the Statement of Operations as a component of income from Fidelity Central Funds. Total security lending income during the period amounted to $47,593. During the period, there were no securities loaned to FCM.
8. Expense Reductions.
Commissions paid to certain brokers with whom the investment adviser, or its affiliates, places trades on behalf of the Fund include an amount in addition to trade execution, which may be rebated back to the Fund to offset certain expenses. This amount totaled $8,932 for the period. Through arrangements with the Fund's custodian, credits realized as a result of certain uninvested cash balances were used to reduce the Fund's expenses. During the period, these credits reduced the Fund's custody expenses by $51
In addition, during the period the investment adviser reimbursed and/or waived a portion of fund-level operating expenses in the amount of $5,772.
9. Distributions to Shareholders.
Distributions to shareholders of each class were as follows:
| Six months ended April 30, 2018 | Year ended October 31, 2017 | |
| From net investment income | ||
| Class A | $209,705 | $345,589 |
| Class M | 47,051 | 44,101 |
| Class C | 147 | – |
| International Small Cap Opportunities | 7,035,349 | 8,436,166 |
| Class I | 1,359,558 | 1,798,182 |
| Total | $8,651,810 | $10,624,038 |
| From net realized gain | ||
| Class A | $547,128 | $117,149 |
| Class M | 190,555 | 32,073 |
| Class C | 199,614 | – |
| International Small Cap Opportunities | 11,470,004 | 2,008,611 |
| Class I | 2,229,392 | 408,678 |
| Total | $14,636,693 | $2,566,511 |
10. Share Transactions.
Share transactions for each class were as follows and may contain automatic conversions between classes or exchanges between affiliated funds:
| Shares | Shares | Dollars | Dollars | |
| Six months ended April 30, 2018 | Year ended October 31, 2017 | Six months ended April 30, 2018 | Year ended October 31, 2017 | |
| Class A | ||||
| Shares sold | 386,093 | 617,618 | $7,547,784 | $9,892,785 |
| Reinvestment of distributions | 39,412 | 30,743 | 734,649 | 441,465 |
| Shares redeemed | (244,782) | (1,457,378) | (4,777,637) | (22,890,236) |
| Net increase (decrease) | 180,723 | (809,017) | $3,504,796 | $(12,555,986) |
| Class M | ||||
| Shares sold | 104,554 | 184,978 | $2,036,462 | $3,117,188 |
| Reinvestment of distributions | 12,748 | 5,229 | 235,975 | 74,674 |
| Shares redeemed | (68,799) | (241,247) | (1,328,243) | (3,797,029) |
| Net increase (decrease) | 48,503 | (51,040) | $944,194 | $(605,167) |
| Class C | ||||
| Shares sold | 223,222 | 166,898 | $4,286,533 | $2,711,727 |
| Reinvestment of distributions | 10,900 | – | 196,970 | – |
| Shares redeemed | (65,635) | (236,034) | (1,240,734) | (3,599,444) |
| Net increase (decrease) | 168,487 | (69,136) | $3,242,769 | $(887,717) |
| International Small Cap Opportunities | ||||
| Shares sold | 10,821,942 | 8,291,089 | $216,594,490 | $139,007,305 |
| Reinvestment of distributions | 814,355 | 594,332 | 15,335,912 | 8,611,863 |
| Shares redeemed | (6,499,270) | (13,816,436) | (125,749,475) | (218,659,907) |
| Net increase (decrease) | 5,137,027 | (4,931,015) | $106,180,927 | $(71,040,739) |
| Class I | ||||
| Shares sold | 3,505,992 | 4,860,065 | $69,277,197 | $80,212,539 |
| Reinvestment of distributions | 153,156 | 138,286 | 2,881,165 | 2,000,992 |
| Shares redeemed | (2,142,000) | (6,539,728) | (42,243,652) | (105,770,110) |
| Net increase (decrease) | 1,517,148 | (1,541,377) | $29,914,710 | $(23,556,579) |
11. Other.
The Fund's organizational documents provide former and current trustees and officers with a limited indemnification against liabilities arising in connection with the performance of their duties to the Fund. In the normal course of business, the Fund may also enter into contracts that provide general indemnifications. The Fund's maximum exposure under these arrangements is unknown as this would be dependent on future claims that may be made against the Fund. The risk of material loss from such claims is considered remote.
Shareholder Expense Example
As a shareholder of the Fund, you incur two types of costs: (1) transaction costs, including sales charges (loads) on purchase payments or redemption proceeds, redemption fees and (2) ongoing costs, including management fees, distribution and/or service (12b-1) fees and other Fund expenses. This Example is intended to help you understand your ongoing costs (in dollars) of investing in the Fund and to compare these costs with the ongoing costs of investing in other mutual funds.
The Example is based on an investment of $1,000 invested at the beginning of the period and held for the entire period (November 1, 2017 to April 30, 2018).
Actual Expenses
The first line of the accompanying table for each class of the Fund provides information about actual account values and actual expenses. You may use the information in this line, together with the amount you invested, to estimate the expenses that you paid over the period. Simply divide your account value by $1,000.00 (for example, an $8,600 account value divided by $1,000.00 = 8.6), then multiply the result by the number in the first line for a class of the Fund under the heading entitled "Expenses Paid During Period" to estimate the expenses you paid on your account during this period. A small balance maintenance fee of $12.00 that is charged once a year may apply for certain accounts with a value of less than $2,000. This fee is not included in the table below. If it was, the estimate of expenses you paid during the period would be higher, and your ending account value lower, by this amount. In addition, the Fund, as a shareholder in the underlying Fidelity Central Funds, will indirectly bear its pro-rata share of the fees and expenses incurred by the underlying Fidelity Central Funds. These fees and expenses are not included in the Fund's annualized expense ratio used to calculate the expense estimate in the table below.
Hypothetical Example for Comparison Purposes
The second line of the accompanying table for each class of the Fund provides information about hypothetical account values and hypothetical expenses based on a Class' actual expense ratio and an assumed rate of return of 5% per year before expenses, which is not the Class' actual return. The hypothetical account values and expenses may not be used to estimate the actual ending account balance or expenses you paid for the period. You may use this information to compare the ongoing costs of investing in the Fund and other funds. To do so, compare this 5% hypothetical example with the 5% hypothetical examples that appear in the shareholder reports of the other funds. A small balance maintenance fee of $12.00 that is charged once a year may apply for certain accounts with a value of less than $2,000. This fee is not included in the table below. If it was, the estimate of expenses you paid during the period would be higher, and your ending account value lower, by this amount. In addition, the Fund, as a shareholder in the underlying Fidelity Central Funds, will indirectly bear its pro-rata share of the fees and expenses incurred by the underlying Fidelity Central Funds. These fees and expenses are not included in the Fund's annualized expense ratio used to calculate the expense estimate in the table below.
Please note that the expenses shown in the table are meant to highlight your ongoing costs only and do not reflect any transaction costs. Therefore, the second line of the table is useful in comparing ongoing costs only, and will not help you determine the relative total costs of owning different funds. In addition, if these transactional costs were included, your costs would have been higher.
| Annualized Expense Ratio-A | Beginning Account Value November 1, 2017 | Ending Account Value April 30, 2018 | Expenses Paid During Period-B November 1, 2017 to April 30, 2018 | |
| Class A | 1.40% | |||
| Actual | $1,000.00 | $1,093.00 | $7.27 | |
| Hypothetical-C | $1,000.00 | $1,017.85 | $7.00 | |
| Class M | 1.68% | |||
| Actual | $1,000.00 | $1,091.30 | $8.71 | |
| Hypothetical-C | $1,000.00 | $1,016.46 | $8.40 | |
| Class C | 2.16% | |||
| Actual | $1,000.00 | $1,089.00 | $11.19 | |
| Hypothetical-C | $1,000.00 | $1,014.08 | $10.79 | |
| International Small Cap Opportunities | 1.10% | |||
| Actual | $1,000.00 | $1,094.00 | $5.71 | |
| Hypothetical-C | $1,000.00 | $1,019.34 | $5.51 | |
| Class I | 1.13% | |||
| Actual | $1,000.00 | $1,094.60 | $5.87 | |
| Hypothetical-C | $1,000.00 | $1,019.19 | $5.66 |
A Annualized expense ratio reflects expenses net of applicable fee waivers.
B Expenses are equal to each Class' annualized expense ratio, multiplied by the average account value over the period, multiplied by 181/365 (to reflect the one-half year period).
C 5% return per year before expenses
![]()
AILS-SANN-0618
1.815094.112
Fidelity® International Small Cap Opportunities Fund Semi-Annual Report April 30, 2018 |
|
Contents
To view a fund's proxy voting guidelines and proxy voting record for the 12-month period ended June 30, visit http://www.fidelity.com/proxyvotingresults or visit the Securities and Exchange Commission's (SEC) web site at http://www.sec.gov.
You may also call 1-800-544-8544 to request a free copy of the proxy voting guidelines.
Standard & Poor's, S&P and S&P 500 are registered service marks of The McGraw-Hill Companies, Inc. and have been licensed for use by Fidelity Distributors Corporation.
Other third-party marks appearing herein are the property of their respective owners.
All other marks appearing herein are registered or unregistered trademarks or service marks of FMR LLC or an affiliated company. © 2018 FMR LLC. All rights reserved.
This report and the financial statements contained herein are submitted for the general information of the shareholders of the Fund. This report is not authorized for distribution to prospective investors in the Fund unless preceded or accompanied by an effective prospectus.
A fund files its complete schedule of portfolio holdings with the SEC for the first and third quarters of each fiscal year on Form N-Q. Forms N-Q are available on the SEC’s web site at http://www.sec.gov. A fund's Forms N-Q may be reviewed and copied at the SEC’s Public Reference Room in Washington, DC. Information regarding the operation of the SEC's Public Reference Room may be obtained by calling 1-800-SEC-0330.
For a complete list of a fund's portfolio holdings, view the most recent holdings listing, semiannual report, or annual report on Fidelity's web site at http://www.fidelity.com, http://www.institutional.fidelity.com, or http://www.401k.com, as applicable.
NOT FDIC INSURED •MAY LOSE VALUE •NO BANK GUARANTEE
Neither the Fund nor Fidelity Distributors Corporation is a bank.
Investment Summary (Unaudited)
Geographic Diversification (% of fund's net assets)
| As of April 30, 2018 | ||
| Japan | 34.1% | |
| United Kingdom | 15.7% | |
| United States of America* | 11.1% | |
| Germany | 6.0% | |
| Sweden | 4.4% | |
| France | 2.7% | |
| Spain | 2.6% | |
| Italy | 2.3% | |
| Denmark | 2.3% | |
| Other | 18.8% | |
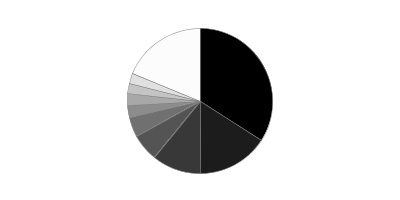
* Includes Short-Term investments and Net Other Assets (Liabilities).
Percentages are based on country or territory of incorporation and are adjusted for the effect of futures contracts, if applicable.
Asset Allocation as of April 30, 2018
| % of fund's net assets | |
| Stocks | 91.0 |
| Investment Companies | 3.6 |
| Short-Term Investments and Net Other Assets (Liabilities) | 5.4 |
Top Ten Stocks as of April 30, 2018
| % of fund's net assets | |
| Azbil Corp. (Japan, Electronic Equipment & Components) | 2.2 |
| Spectris PLC (United Kingdom, Electronic Equipment & Components) | 2.2 |
| Dechra Pharmaceuticals PLC (United Kingdom, Pharmaceuticals) | 2.1 |
| Spirax-Sarco Engineering PLC (United Kingdom, Machinery) | 1.9 |
| OBIC Co. Ltd. (Japan, IT Services) | 1.8 |
| SHO-BOND Holdings Co. Ltd. (Japan, Construction & Engineering) | 1.7 |
| Nihon Parkerizing Co. Ltd. (Japan, Chemicals) | 1.6 |
| OSG Corp. (Japan, Machinery) | 1.6 |
| CompuGroup Medical AG (Germany, Health Care Technology) | 1.6 |
| Interpump Group SpA (Italy, Machinery) | 1.6 |
| 18.3 |
Top Market Sectors as of April 30, 2018
| % of fund's net assets | |
| Industrials | 22.5 |
| Consumer Discretionary | 14.9 |
| Information Technology | 13.1 |
| Health Care | 12.3 |
| Consumer Staples | 8.7 |
| Materials | 7.0 |
| Financials | 5.2 |
| Real Estate | 5.1 |
| Energy | 2.2 |
Schedule of Investments April 30, 2018 (Unaudited)
Showing Percentage of Net Assets
| Common Stocks - 89.6% | |||
| Shares | Value | ||
| Australia - 2.0% | |||
| Accent Group Ltd. (a) | 3,598,268 | $3,381,076 | |
| Adelaide Brighton Ltd. (a) | 1,381,857 | 6,666,923 | |
| Beacon Lighting Group Ltd. | 2,785,250 | 3,084,755 | |
| DuluxGroup Ltd. | 1,822,063 | 10,593,767 | |
| Imdex Ltd. (b) | 4,040,102 | 3,767,415 | |
| Quintis Ltd. (a)(b)(c) | 2,011,191 | 15 | |
| TOTAL AUSTRALIA | 27,493,951 | ||
| Austria - 0.7% | |||
| Andritz AG | 172,500 | 9,282,338 | |
| Bailiwick of Jersey - 0.5% | |||
| Integrated Diagnostics Holdings PLC | 1,483,779 | 7,047,950 | |
| Belgium - 1.3% | |||
| KBC Ancora | 297,848 | 18,073,983 | |
| Bermuda - 0.4% | |||
| Vostok New Ventures Ltd. (depositary receipt) (b) | 701,789 | 5,882,536 | |
| Canada - 1.2% | |||
| McCoy Global, Inc. (b) | 636,715 | 634,756 | |
| New Look Vision Group, Inc. | 207,200 | 5,244,753 | |
| Pason Systems, Inc. | 340,800 | 4,764,485 | |
| PrairieSky Royalty Ltd. | 107,800 | 2,390,331 | |
| ShawCor Ltd. Class A | 164,900 | 3,190,246 | |
| TOTAL CANADA | 16,224,571 | ||
| Cayman Islands - 0.7% | |||
| 58.com, Inc. ADR (b) | 56,600 | 4,946,274 | |
| Value Partners Group Ltd. | 4,314,000 | 4,080,635 | |
| TOTAL CAYMAN ISLANDS | 9,026,909 | ||
| Denmark - 2.3% | |||
| Jyske Bank A/S (Reg.) | 183,127 | 11,008,931 | |
| Scandinavian Tobacco Group A/S (d) | 296,306 | 4,956,283 | |
| SimCorp A/S | 74,800 | 5,445,996 | |
| Spar Nord Bank A/S | 831,369 | 9,526,847 | |
| TOTAL DENMARK | 30,938,057 | ||
| Finland - 0.5% | |||
| Tikkurila Oyj (a) | 401,746 | 7,267,524 | |
| France - 2.7% | |||
| Elis SA | 752,442 | 18,009,422 | |
| Laurent-Perrier Group SA | 51,163 | 6,456,474 | |
| Vetoquinol SA | 110,184 | 6,998,861 | |
| Virbac SA (b) | 32,652 | 5,094,428 | |
| TOTAL FRANCE | 36,559,185 | ||
| Germany - 4.6% | |||
| CompuGroup Medical AG | 411,921 | 21,509,124 | |
| CTS Eventim AG | 391,593 | 18,366,959 | |
| Fielmann AG | 68,873 | 5,663,947 | |
| Nexus AG | 291,358 | 9,746,077 | |
| WashTec AG | 84,774 | 8,179,609 | |
| TOTAL GERMANY | 63,465,716 | ||
| Greece - 0.3% | |||
| Motor Oil (HELLAS) Corinth Refineries SA | 156,800 | 3,745,376 | |
| India - 0.2% | |||
| Jyothy Laboratories Ltd. | 500,746 | 2,728,118 | |
| Ireland - 1.3% | |||
| FBD Holdings PLC | 240,328 | 3,410,086 | |
| James Hardie Industries PLC CDI | 848,891 | 14,990,943 | |
| TOTAL IRELAND | 18,401,029 | ||
| Isle of Man - 0.9% | |||
| Playtech Ltd. | 1,070,331 | 11,944,391 | |
| Israel - 2.0% | |||
| Azrieli Group | 59,105 | 2,711,412 | |
| Ituran Location & Control Ltd. | 454,908 | 14,261,366 | |
| Strauss Group Ltd. | 508,344 | 10,484,829 | |
| TOTAL ISRAEL | 27,457,607 | ||
| Italy - 2.3% | |||
| Azimut Holding SpA | 218,197 | 4,592,713 | |
| Beni Stabili SpA SIIQ | 6,504,975 | 6,162,567 | |
| Interpump Group SpA | 672,443 | 21,421,672 | |
| TOTAL ITALY | 32,176,952 | ||
| Japan - 34.1% | |||
| Ai Holdings Corp. | 202,400 | 5,419,180 | |
| Aoki Super Co. Ltd. | 330,000 | 3,933,315 | |
| Artnature, Inc. | 524,100 | 3,595,637 | |
| Asahi Co. Ltd. | 213,700 | 2,623,357 | |
| Aucnet, Inc. | 184,870 | 2,399,657 | |
| Azbil Corp. | 650,700 | 30,356,476 | |
| Broadleaf Co. Ltd. | 734,600 | 3,507,695 | |
| Central Automotive Products Ltd. | 135,400 | 2,111,754 | |
| Century21 Real Estate Japan Ltd. | 66,500 | 821,821 | |
| Coca-Cola West Co. Ltd. | 137,475 | 5,923,045 | |
| Daiichikosho Co. Ltd. | 272,300 | 14,322,402 | |
| Daikokutenbussan Co. Ltd. | 190,900 | 9,866,310 | |
| Funai Soken Holdings, Inc. | 383,550 | 8,988,795 | |
| GCA Savvian Group Corp. | 555,461 | 4,933,705 | |
| Goldcrest Co. Ltd. | 574,130 | 12,221,007 | |
| Iwatsuka Confectionary Co. Ltd. | 21,400 | 1,023,802 | |
| Kobayashi Pharmaceutical Co. Ltd. | 199,900 | 16,877,763 | |
| Koshidaka Holdings Co. Ltd. | 215,400 | 13,083,205 | |
| Kusuri No Aoki Holdings Co. Ltd. | 132,800 | 9,123,015 | |
| Lasertec Corp. | 511,872 | 17,090,494 | |
| Medikit Co. Ltd. | 107,800 | 5,926,436 | |
| Miroku Jyoho Service Co., Ltd. | 169,800 | 4,846,103 | |
| Misumi Group, Inc. | 481,400 | 13,342,865 | |
| Mitsuboshi Belting Ltd. | 48,000 | 549,287 | |
| Nabtesco Corp. | 400,500 | 14,489,366 | |
| Nagaileben Co. Ltd. | 613,100 | 16,247,262 | |
| Nakano Refrigerators Co. Ltd. | 141,500 | 6,653,037 | |
| ND Software Co. Ltd. | 97,942 | 923,694 | |
| Nihon Parkerizing Co. Ltd. | 1,393,000 | 22,108,077 | |
| NS Tool Co. Ltd. (a) | 156,800 | 4,274,277 | |
| OBIC Co. Ltd. | 295,300 | 24,770,408 | |
| OSG Corp. | 990,200 | 21,992,367 | |
| Paramount Bed Holdings Co. Ltd. | 338,100 | 16,824,588 | |
| ProNexus, Inc. | 472,400 | 6,118,902 | |
| San-Ai Oil Co. Ltd. | 926,200 | 14,606,374 | |
| SHO-BOND Holdings Co. Ltd. | 302,800 | 22,934,358 | |
| Shoei Co. Ltd. | 377,426 | 14,034,364 | |
| SK Kaken Co. Ltd. | 85,000 | 8,669,502 | |
| Software Service, Inc. | 70,000 | 4,924,076 | |
| Techno Medica Co. Ltd. | 80,791 | 1,544,577 | |
| The Monogatari Corp. | 63,400 | 6,912,989 | |
| TKC Corp. | 193,600 | 7,747,896 | |
| Tocalo Co. Ltd. | 468,000 | 5,835,016 | |
| USS Co. Ltd. | 966,500 | 20,343,181 | |
| Welcia Holdings Co. Ltd. | 191,700 | 9,872,585 | |
| Workman Co. Ltd. | 229,500 | 9,153,128 | |
| Yamada Consulting Group Co. Ltd. | 397,800 | 11,316,850 | |
| Yamato Kogyo Co. Ltd. | 141,400 | 4,203,714 | |
| TOTAL JAPAN | 469,387,714 | ||
| Korea (South) - 0.9% | |||
| BGF Retail Co. Ltd. | 53,748 | 9,585,982 | |
| Leeno Industrial, Inc. | 57,128 | 3,056,642 | |
| TOTAL KOREA (SOUTH) | 12,642,624 | ||
| Mexico - 0.2% | |||
| Consorcio ARA S.A.B. de CV | 8,852,578 | 3,341,837 | |
| Netherlands - 2.0% | |||
| Aalberts Industries NV | 319,501 | 15,757,273 | |
| Takeaway.com Holding BV (b)(d) | 99,887 | 5,814,055 | |
| VastNed Retail NV | 114,002 | 5,706,372 | |
| TOTAL NETHERLANDS | 27,277,700 | ||
| Norway - 1.1% | |||
| Kongsberg Gruppen ASA | 383,800 | 9,424,803 | |
| Skandiabanken ASA (d) | 623,200 | 5,632,051 | |
| TOTAL NORWAY | 15,056,854 | ||
| Philippines - 0.5% | |||
| Jollibee Food Corp. | 1,309,740 | 7,208,797 | |
| South Africa - 1.1% | |||
| Clicks Group Ltd. | 902,329 | 15,427,051 | |
| Spain - 2.6% | |||
| Hispania Activos Inmobiliarios SA | 366,631 | 7,792,287 | |
| Merlin Properties Socimi SA | 545,300 | 8,428,855 | |
| Prosegur Compania de Seguridad SA (Reg.) | 2,547,090 | 19,316,438 | |
| TOTAL SPAIN | 35,537,580 | ||
| Sweden - 4.4% | |||
| Addlife AB | 175,200 | 3,671,404 | |
| AddTech AB (B Shares) | 598,543 | 12,481,252 | |
| Fagerhult AB (a) | 1,435,439 | 14,671,340 | |
| Lagercrantz Group AB (B Shares) | 904,775 | 8,513,925 | |
| Loomis AB (B Shares) | 298,500 | 10,915,099 | |
| Saab AB (B Shares) (a) | 254,700 | 10,456,584 | |
| TOTAL SWEDEN | 60,709,604 | ||
| Switzerland - 0.6% | |||
| Tecan Group AG | 38,822 | 8,579,231 | |
| Taiwan - 0.4% | |||
| Addcn Technology Co. Ltd. | 638,435 | 5,518,905 | |
| United Kingdom - 15.7% | |||
| Alliance Pharma PLC | 4,048,400 | 4,514,480 | |
| Ascential PLC | 2,119,951 | 12,298,713 | |
| Avon Rubber PLC | 283,500 | 5,249,460 | |
| Cineworld Group PLC | 1,468,300 | 5,263,748 | |
| Dechra Pharmaceuticals PLC | 751,609 | 28,372,574 | |
| DP Poland PLC (b) | 7,057,200 | 2,963,272 | |
| Elementis PLC | 3,644,910 | 14,230,899 | |
| Great Portland Estates PLC | 1,101,542 | 10,576,021 | |
| Hilton Food Group PLC | 312,888 | 3,816,471 | |
| Howden Joinery Group PLC | 830,300 | 5,449,034 | |
| Informa PLC | 1,684,956 | 17,142,427 | |
| InterContinental Hotel Group PLC ADR (a) | 72,195 | 4,594,490 | |
| ITE Group PLC | 3,255,234 | 6,811,851 | |
| Rightmove PLC | 192,147 | 12,075,739 | |
| Shaftesbury PLC | 1,129,573 | 15,721,891 | |
| Spectris PLC | 812,778 | 30,099,795 | |
| Spirax-Sarco Engineering PLC | 331,991 | 26,349,049 | |
| Topps Tiles PLC | 3,398,115 | 3,227,948 | |
| Ultra Electronics Holdings PLC | 371,558 | 7,202,257 | |
| TOTAL UNITED KINGDOM | 215,960,119 | ||
| United States of America - 2.1% | |||
| Autoliv, Inc. (a) | 44,300 | 5,938,415 | |
| Martin Marietta Materials, Inc. | 23,820 | 4,639,421 | |
| Mohawk Industries, Inc. (b) | 14,300 | 3,001,284 | |
| PriceSmart, Inc. | 104,074 | 9,116,882 | |
| ResMed, Inc. | 68,095 | 6,444,511 | |
| TOTAL UNITED STATES OF AMERICA | 29,140,513 | ||
| TOTAL COMMON STOCKS | |||
| (Cost $894,247,029) | 1,233,504,722 | ||
| Nonconvertible Preferred Stocks - 1.4% | |||
| Germany - 1.4% | |||
| Sartorius AG (non-vtg.) | |||
| (Cost $3,757,135) | 125,880 | 19,427,222 | |
| Investment Companies - 3.6% | |||
| United States of America - 3.6% | |||
| iShares MSCI EAFE Small-Cap ETF | |||
| (Cost $49,870,027) | 750,000 | 49,215,004 | |
| Money Market Funds - 5.5% | |||
| Fidelity Cash Central Fund, 1.74% (e) | 69,289,707 | 69,303,565 | |
| Fidelity Securities Lending Cash Central Fund 1.74% (e)(f) | 6,630,648 | 6,631,311 | |
| TOTAL MONEY MARKET FUNDS | |||
| (Cost $75,934,876) | 75,934,876 | ||
| TOTAL INVESTMENT IN SECURITIES - 100.1% | |||
| (Cost $1,023,809,067) | 1,378,081,824 | ||
| NET OTHER ASSETS (LIABILITIES) - (0.1)% | (1,826,131) | ||
| NET ASSETS - 100% | $1,376,255,693 |
Security Type Abbreviations
ETF – Exchange-Traded Fund
Categorizations in the Schedule of Investments are based on country or territory of incorporation.
Legend
(a) Security or a portion of the security is on loan at period end.
(b) Non-income producing
(c) Level 3 security
(d) Security exempt from registration under Rule 144A of the Securities Act of 1933. These securities may be resold in transactions exempt from registration, normally to qualified institutional buyers. At the end of the period, the value of these securities amounted to $16,402,389 or 1.2% of net assets.
(e) Affiliated fund that is generally available only to investment companies and other accounts managed by Fidelity Investments. The rate quoted is the annualized seven-day yield of the fund at period end. A complete unaudited listing of the fund's holdings as of its most recent quarter end is available upon request. In addition, each Fidelity Central Fund's financial statements are available on the SEC's website or upon request.
(f) Investment made with cash collateral received from securities on loan.
Affiliated Central Funds
Information regarding fiscal year to date income earned by the Fund from investments in Fidelity Central Funds is as follows:
| Fund | Income earned |
| Fidelity Cash Central Fund | $302,467 |
| Fidelity Securities Lending Cash Central Fund | 47,593 |
| Total | $350,060 |
Amounts in the income column in the above table include any capital gain distributions from underlying funds, which are presented in the corresponding line-item in the Statement of Operations if applicable.
Investment Valuation
The following is a summary of the inputs used, as of April 30, 2018, involving the Fund's assets and liabilities carried at fair value. The inputs or methodology used for valuing securities may not be an indication of the risk associated with investing in those securities. For more information on valuation inputs, and their aggregation into the levels used below, please refer to the Investment Valuation section in the accompanying Notes to Financial Statements.
| Valuation Inputs at Reporting Date: | ||||
| Description | Total | Level 1 | Level 2 | Level 3 |
| Investments in Securities: | ||||
| Equities: | ||||
| Consumer Discretionary | $207,877,098 | $194,202,470 | $13,674,628 | $-- |
| Consumer Staples | 117,831,279 | 99,676,110 | 18,155,169 | -- |
| Energy | 29,331,568 | 29,331,568 | -- | -- |
| Financials | 72,097,770 | 68,017,135 | 4,080,635 | -- |
| Health Care | 167,796,495 | 167,796,495 | -- | -- |
| Industrials | 310,660,750 | 310,660,750 | -- | -- |
| Information Technology | 180,056,551 | 174,537,646 | 5,518,905 | -- |
| Materials | 97,138,200 | 61,119,137 | 36,019,048 | 15 |
| Real Estate | 70,142,233 | 70,142,233 | -- | -- |
| Investment Companies | 49,215,004 | 49,215,004 | -- | -- |
| Money Market Funds | 75,934,876 | 75,934,876 | -- | -- |
| Total Investments in Securities: | $1,378,081,824 | $1,300,633,424 | $77,448,385 | $15 |
The following is a summary of transfers between Level 1 and Level 2 for the period ended April 30, 2018. Transfers are assumed to have occurred at the beginning of the period, and are primarily attributable to the valuation techniques used for foreign equity securities, as discussed in the accompanying Notes to Financial Statements:
| Transfers | Total |
| Level 1 to Level 2 | $70,382,372 |
| Level 2 to Level 1 | $378,633,854 |
The following is a reconciliation of Investments in Securities for which Level 3 inputs were used in determining value:
| Investments in Securities: | |
| Industrials | |
| Beginning Balance | $16,532,055 |
| Net Realized Gain (Loss) on Investment Securities | (2,430,489) |
| Net Unrealized Gain (Loss) on Investment Securities | (2,765,043) |
| Cost of Purchases | -- |
| Proceeds of Sales | (11,336,523) |
| Amortization/Accretion | -- |
| Transfers into Level 3 | -- |
| Transfers out of Level 3 | -- |
| Ending Balance | $-- |
| The change in unrealized gain (loss) for the period attributable to Level 3 securities held at April 30, 2018 | $-- |
| Other Investments in Securities | |
| Beginning Balance | $454,083 |
| Net Realized Gain (Loss) on Investment Securities | -- |
| Net Unrealized Gain (Loss) on Investment Securities | (454,068) |
| Cost of Purchases | -- |
| Proceeds of Sales | -- |
| Amortization/Accretion | -- |
| Transfers into Level 3 | -- |
| Transfers out of Level 3 | -- |
| Ending Balance | $15 |
| The change in unrealized gain (loss) for the period attributable to Level 3 securities held at April 30, 2018 | $(454,068) |
The information used in the above reconciliations represents fiscal year to date activity for any Investments in Securities identified as using Level 3 inputs at either the beginning or the end of the current fiscal period. Transfers in or out of Level 3 represent the beginning value of any Security or Instrument where a change in the pricing level occurred from the beginning to the end of the period. The cost of purchases and the proceeds of sales may include securities received or delivered through corporate actions or exchanges. Realized and unrealized gains (losses) disclosed in the reconciliation are included in Net Gain (Loss) on the Fund’s Statement of Operations.
See accompanying notes which are an integral part of the financial statements.
Financial Statements
Statement of Assets and Liabilities
| April 30, 2018 (Unaudited) | ||
| Assets | ||
| Investment in securities, at value (including securities loaned of $6,282,542) — See accompanying schedule: Unaffiliated issuers (cost $947,874,191) | $1,302,146,948 | |
| Fidelity Central Funds (cost $75,934,876) | 75,934,876 | |
| Total Investment in Securities (cost $1,023,809,067) | $1,378,081,824 | |
| Cash | 617,117 | |
| Foreign currency held at value (cost $205,283) | 205,283 | |
| Receivable for investments sold | 1,379,104 | |
| Receivable for fund shares sold | 3,483,149 | |
| Dividends receivable | 4,638,833 | |
| Distributions receivable from Fidelity Central Funds | 134,955 | |
| Prepaid expenses | 577 | |
| Other receivables | 11,646 | |
| Total assets | 1,388,552,488 | |
| Liabilities | ||
| Payable for investments purchased | $3,306,748 | |
| Payable for fund shares redeemed | 1,035,282 | |
| Accrued management fee | 962,819 | |
| Distribution and service plan fees payable | 32,086 | |
| Other affiliated payables | 250,527 | |
| Other payables and accrued expenses | 77,923 | |
| Collateral on securities loaned | 6,631,410 | |
| Total liabilities | 12,296,795 | |
| Net Assets | $1,376,255,693 | |
| Net Assets consist of: | ||
| Paid in capital | $1,017,676,784 | |
| Undistributed net investment income | 4,021,965 | |
| Accumulated undistributed net realized gain (loss) on investments and foreign currency transactions | 299,450 | |
| Net unrealized appreciation (depreciation) on investments and assets and liabilities in foreign currencies | 354,257,494 | |
| Net Assets | $1,376,255,693 | |
| Calculation of Maximum Offering Price | ||
| Class A: | ||
| Net Asset Value and redemption price per share ($47,943,710 ÷ 2,418,186 shares) | $19.83 | |
| Maximum offering price per share (100/94.25 of $19.83) | $21.04 | |
| Class M: | ||
| Net Asset Value and redemption price per share ($16,439,337 ÷ 835,674 shares) | $19.67 | |
| Maximum offering price per share (100/96.50 of $19.67) | $20.38 | |
| Class C: | ||
| Net Asset Value and offering price per share ($18,856,420 ÷ 983,768 shares)(a) | $19.17 | |
| International Small Cap Opportunities: | ||
| Net Asset Value, offering price and redemption price per share ($1,085,916,823 ÷ 54,202,073 shares) | $20.03 | |
| Class I: | ||
| Net Asset Value, offering price and redemption price per share ($207,099,403 ÷ 10,351,587 shares) | $20.01 |
(a) Redemption price per share is equal to net asset value less any applicable contingent deferred sales charge.
See accompanying notes which are an integral part of the financial statements.
Statement of Operations
| Six months ended April 30, 2018 (Unaudited) | ||
| Investment Income | ||
| Dividends | $12,407,928 | |
| Income from Fidelity Central Funds | 350,060 | |
| Income before foreign taxes withheld | 12,757,988 | |
| Less foreign taxes withheld | (1,178,760) | |
| Total income | 11,579,228 | |
| Expenses | ||
| Management fee | ||
| Basic fee | $5,138,300 | |
| Performance adjustment | 52,938 | |
| Transfer agent fees | 1,147,372 | |
| Distribution and service plan fees | 177,941 | |
| Accounting and security lending fees | 280,100 | |
| Custodian fees and expenses | 89,089 | |
| Independent trustees' fees and expenses | 2,353 | |
| Registration fees | 48,751 | |
| Audit | 34,413 | |
| Legal | 3,114 | |
| Miscellaneous | 3,771 | |
| Total expenses before reductions | 6,978,142 | |
| Expense reductions | (14,755) | 6,963,387 |
| Net investment income (loss) | 4,615,841 | |
| Realized and Unrealized Gain (Loss) | ||
| Net realized gain (loss) on: | ||
| Investment securities: | ||
| Unaffiliated issuers | 17,909,964 | |
| Fidelity Central Funds | (873) | |
| Foreign currency transactions | 60,790 | |
| Total net realized gain (loss) | 17,969,881 | |
| Change in net unrealized appreciation (depreciation) on: | ||
| Investment securities: | ||
| Unaffiliated issuers | 81,117,208 | |
| Fidelity Central Funds | 647 | |
| Assets and liabilities in foreign currencies | (15,683) | |
| Total change in net unrealized appreciation (depreciation) | 81,102,172 | |
| Net gain (loss) | 99,072,053 | |
| Net increase (decrease) in net assets resulting from operations | $103,687,894 |
See accompanying notes which are an integral part of the financial statements.
Statement of Changes in Net Assets
| Six months ended April 30, 2018 (Unaudited) | Year ended October 31, 2017 | |
| Increase (Decrease) in Net Assets | ||
| Operations | ||
| Net investment income (loss) | $4,615,841 | $9,131,889 |
| Net realized gain (loss) | 17,969,881 | 41,561,179 |
| Change in net unrealized appreciation (depreciation) | 81,102,172 | 187,420,991 |
| Net increase (decrease) in net assets resulting from operations | 103,687,894 | 238,114,059 |
| Distributions to shareholders from net investment income | (8,651,810) | (10,624,038) |
| Distributions to shareholders from net realized gain | (14,636,693) | (2,566,511) |
| Total distributions | (23,288,503) | (13,190,549) |
| Share transactions - net increase (decrease) | 143,787,396 | (108,646,188) |
| Redemption fees | 15,029 | 188,947 |
| Total increase (decrease) in net assets | 224,201,816 | 116,466,269 |
| Net Assets | ||
| Beginning of period | 1,152,053,877 | 1,035,587,608 |
| End of period | $1,376,255,693 | $1,152,053,877 |
| Other Information | ||
| Undistributed net investment income end of period | $4,021,965 | $8,057,934 |
See accompanying notes which are an integral part of the financial statements.
Financial Highlights
Fidelity International Small Cap Opportunities Fund Class A
| Six months ended (Unaudited) April 30, | Years endedOctober 31, | |||||
| 2018 | 2017 | 2016 | 2015 | 2014 | 2013 | |
| Selected Per–Share Data | ||||||
| Net asset value, beginning of period | $18.47 | $14.82 | $14.75 | $13.65 | $13.68 | $10.78 |
| Income from Investment Operations | ||||||
| Net investment income (loss)A | .05 | .10 | .09 | .06 | .05 | .07 |
| Net realized and unrealized gain (loss) | 1.65 | 3.71 | .10 | 1.11 | .05 | 2.91 |
| Total from investment operations | 1.70 | 3.81 | .19 | 1.17 | .10 | 2.98 |
| Distributions from net investment income | (.09) | (.12) | (.05) | (.05) | (.06) | (.08) |
| Distributions from net realized gain | (.24) | (.04) | (.07) | (.02) | (.08) | (.01) |
| Total distributions | (.34)B | (.16) | (.12) | (.07) | (.13)C | (.08)D |
| Redemption fees added to paid in capitalA,E | – | – | – | – | – | – |
| Net asset value, end of period | $19.83 | $18.47 | $14.82 | $14.75 | $13.65 | $13.68 |
| Total ReturnF,G,H | 9.30% | 26.00% | 1.30% | 8.62% | .78% | 27.85% |
| Ratios to Average Net AssetsI,J | ||||||
| Expenses before reductions | 1.40%K | 1.43% | 1.45% | 1.52% | 1.63% | 1.70% |
| Expenses net of fee waivers, if any | 1.40%K | 1.43% | 1.45% | 1.52% | 1.63% | 1.65% |
| Expenses net of all reductions | 1.40%K | 1.43% | 1.45% | 1.51% | 1.63% | 1.64% |
| Net investment income (loss) | .50%K | .61% | .62% | .38% | .33% | .59% |
| Supplemental Data | ||||||
| Net assets, end of period (000 omitted) | $47,944 | $41,324 | $45,151 | $42,289 | $25,041 | $22,052 |
| Portfolio turnover rateL | 18 %K | 11% | 24% | 21% | 18% | 31% |
A Calculated based on average shares outstanding during the period.
B Total distributions of $.34 per share is comprised of distributions from net investment income of $.093 and distributions from net realized gain of $.243 per share.
C Total distributions of $.13 per share is comprised of distributions from net investment income of $.055 and net realized gain of $.079 per share.
D Total distributions of $.08 per share is comprised of distributions from net investment income of $.077 and distributions from net realized gain of $.005 per share.
E Amount represents less than $.005 per share.
F Total returns for periods of less than one year are not annualized.
G Total returns would have been lower if certain expenses had not been reduced during the applicable periods shown.
H Total returns do not include the effect of the sales charges.
I Fees and expenses of any underlying Fidelity Central Funds are not included in the Fund's expense ratio. The Fund indirectly bears its proportionate share of the expenses of any underlying Fidelity Central Funds.
J Expense ratios reflect operating expenses of the class. Expenses before reductions do not reflect amounts reimbursed by the investment adviser or reductions from brokerage service arrangements or reductions from other expense offset arrangements and do not represent the amount paid by the class during periods when reimbursements or reductions occur. Expenses net of fee waivers reflect expenses after reimbursement by the investment adviser but prior to reductions from brokerage service arrangements or other expense offset arrangements. Expenses net of all reductions represent the net expenses paid by the class.
K Annualized
L Amount does not include the portfolio activity of any underlying Fidelity Central Funds.
See accompanying notes which are an integral part of the financial statements.
Fidelity International Small Cap Opportunities Fund Class M
| Six months ended (Unaudited) April 30, | Years endedOctober 31, | |||||
| 2018 | 2017 | 2016 | 2015 | 2014 | 2013 | |
| Selected Per–Share Data | ||||||
| Net asset value, beginning of period | $18.32 | $14.68 | $14.62 | $13.53 | $13.56 | $10.69 |
| Income from Investment Operations | ||||||
| Net investment income (loss)A | .02 | .05 | .04 | .01 | .01 | .04 |
| Net realized and unrealized gain (loss) | 1.63 | 3.69 | .10 | 1.11 | .06 | 2.89 |
| Total from investment operations | 1.65 | 3.74 | .14 | 1.12 | .07 | 2.93 |
| Distributions from net investment income | (.06) | (.06) | (.01) | (.01) | (.02) | (.05) |
| Distributions from net realized gain | (.24) | (.04) | (.07) | (.02) | (.08) | (.01) |
| Total distributions | (.30) | (.10) | (.08) | (.03) | (.10) | (.06) |
| Redemption fees added to paid in capitalA,B | – | – | – | – | – | – |
| Net asset value, end of period | $19.67 | $18.32 | $14.68 | $14.62 | $13.53 | $13.56 |
| Total ReturnC,D,E | 9.13% | 25.63% | .95% | 8.27% | .55% | 27.53% |
| Ratios to Average Net AssetsF,G | ||||||
| Expenses before reductions | 1.68%H | 1.73% | 1.77% | 1.80% | 1.89% | 1.96% |
| Expenses net of fee waivers, if any | 1.68%H | 1.73% | 1.77% | 1.80% | 1.89% | 1.90% |
| Expenses net of all reductions | 1.68%H | 1.73% | 1.77% | 1.80% | 1.89% | 1.89% |
| Net investment income (loss) | .21%H | .31% | .30% | .10% | .07% | .34% |
| Supplemental Data | ||||||
| Net assets, end of period (000 omitted) | $16,439 | $14,422 | $12,308 | $13,296 | $9,913 | $9,634 |
| Portfolio turnover rateI | 18%H | 11% | 24% | 21% | 18% | 31% |
A Calculated based on average shares outstanding during the period.
B Amount represents less than $.005 per share.
C Total returns for periods of less than one year are not annualized.
D Total returns would have been lower if certain expenses had not been reduced during the applicable periods shown.
E Total returns do not include the effect of the sales charges.
F Fees and expenses of any underlying Fidelity Central Funds are not included in the Fund's expense ratio. The Fund indirectly bears its proportionate share of the expenses of any underlying Fidelity Central Funds.
G Expense ratios reflect operating expenses of the class. Expenses before reductions do not reflect amounts reimbursed by the investment adviser or reductions from brokerage service arrangements or reductions from other expense offset arrangements and do not represent the amount paid by the class during periods when reimbursements or reductions occur. Expenses net of fee waivers reflect expenses after reimbursement by the investment adviser but prior to reductions from brokerage service arrangements or other expense offset arrangements. Expenses net of all reductions represent the net expenses paid by the class.
H Annualized
I Amount does not include the portfolio activity of any underlying Fidelity Central Funds.
See accompanying notes which are an integral part of the financial statements.
Fidelity International Small Cap Opportunities Fund Class C
| Six months ended (Unaudited) April 30, | Years endedOctober 31, | |||||
| 2018 | 2017 | 2016 | 2015 | 2014 | 2013 | |
| Selected Per–Share Data | ||||||
| Net asset value, beginning of period | $17.84 | $14.27 | $14.26 | $13.23 | $13.28 | $10.48 |
| Income from Investment Operations | ||||||
| Net investment income (loss)A | (.03) | (.03) | (.03) | (.05) | (.06) | (.02) |
| Net realized and unrealized gain (loss) | 1.60 | 3.60 | .09 | 1.08 | .06 | 2.84 |
| Total from investment operations | 1.57 | 3.57 | .06 | 1.03 | – | 2.82 |
| Distributions from net investment income | – | – | – | – | – | (.01) |
| Distributions from net realized gain | (.24) | – | (.05) | – | (.05) | (.01) |
| Total distributions | (.24) | – | (.05) | – | (.05) | (.02) |
| Redemption fees added to paid in capitalA,B | – | – | – | – | – | – |
| Net asset value, end of period | $19.17 | $17.84 | $14.27 | $14.26 | $13.23 | $13.28 |
| Total ReturnC,D,E | 8.90% | 25.02% | .44% | 7.79% | .03% | 26.91% |
| Ratios to Average Net AssetsF,G | ||||||
| Expenses before reductions | 2.16%H | 2.22% | 2.26% | 2.27% | 2.38% | 2.45% |
| Expenses net of fee waivers, if any | 2.16%H | 2.22% | 2.26% | 2.27% | 2.38% | 2.40% |
| Expenses net of all reductions | 2.16%H | 2.21% | 2.25% | 2.26% | 2.38% | 2.39% |
| Net investment income (loss) | (.27)%H | (.17)% | (.19)% | (.36)% | (.42)% | (.16)% |
| Supplemental Data | ||||||
| Net assets, end of period (000 omitted) | $18,856 | $14,547 | $12,625 | $17,370 | $8,438 | $8,070 |
| Portfolio turnover rateI | 18%H | 11% | 24% | 21% | 18% | 31% |
A Calculated based on average shares outstanding during the period.
B Amount represents less than $.005 per share.
C Total returns for periods of less than one year are not annualized.
D Total returns would have been lower if certain expenses had not been reduced during the applicable periods shown.
E Total returns do not include the effect of the contingent deferred sales charge.
F Fees and expenses of any underlying Fidelity Central Funds are not included in the Fund's expense ratio. The Fund indirectly bears its proportionate share of the expenses of any underlying Fidelity Central Funds.
G Expense ratios reflect operating expenses of the class. Expenses before reductions do not reflect amounts reimbursed by the investment adviser or reductions from brokerage service arrangements or reductions from other expense offset arrangements and do not represent the amount paid by the class during periods when reimbursements or reductions occur. Expenses net of fee waivers reflect expenses after reimbursement by the investment adviser but prior to reductions from brokerage service arrangements or other expense offset arrangements. Expenses net of all reductions represent the net expenses paid by the class.
H Annualized
I Amount does not include the portfolio activity of any underlying Fidelity Central Funds.
See accompanying notes which are an integral part of the financial statements.
Fidelity International Small Cap Opportunities Fund
| Six months ended (Unaudited) April 30, | Years endedOctober 31, | |||||
| 2018 | 2017 | 2016 | 2015 | 2014 | 2013 | |
| Selected Per–Share Data | ||||||
| Net asset value, beginning of period | $18.69 | $15.00 | $14.91 | $13.80 | $13.82 | $10.88 |
| Income from Investment Operations | ||||||
| Net investment income (loss)A | .08 | .15 | .13 | .10 | .09 | .10 |
| Net realized and unrealized gain (loss) | 1.65 | 3.75 | .11 | 1.12 | .06 | 2.95 |
| Total from investment operations | 1.73 | 3.90 | .24 | 1.22 | .15 | 3.05 |
| Distributions from net investment income | (.15) | (.17) | (.08) | (.09) | (.09) | (.10) |
| Distributions from net realized gain | (.24) | (.04) | (.07) | (.02) | (.08) | (.01) |
| Total distributions | (.39) | (.21) | (.15) | (.11) | (.17) | (.11) |
| Redemption fees added to paid in capitalA,B | – | – | – | – | – | – |
| Net asset value, end of period | $20.03 | $18.69 | $15.00 | $14.91 | $13.80 | $13.82 |
| Total ReturnC,D | 9.40% | 26.39% | 1.58% | 8.92% | 1.11% | 28.24% |
| Ratios to Average Net AssetsE,F | ||||||
| Expenses before reductions | 1.10%G | 1.13% | 1.17% | 1.23% | 1.30% | 1.39% |
| Expenses net of fee waivers, if any | 1.10%G | 1.13% | 1.17% | 1.22% | 1.30% | 1.39% |
| Expenses net of all reductions | 1.10%G | 1.13% | 1.16% | 1.22% | 1.30% | 1.38% |
| Net investment income (loss) | .79%G | .91% | .90% | .68% | .65% | .85% |
| Supplemental Data | ||||||
| Net assets, end of period (000 omitted) | $1,085,917 | $916,882 | $809,952 | $762,563 | $584,253 | $518,121 |
| Portfolio turnover rateH | 18 %G | 11% | 24% | 21% | 18% | 31% |
A Calculated based on average shares outstanding during the period.
B Amount represents less than $.005 per share.
C Total returns for periods of less than one year are not annualized.
D Total returns would have been lower if certain expenses had not been reduced during the applicable periods shown.
E Fees and expenses of any underlying Fidelity Central Funds are not included in the Fund's expense ratio. The Fund indirectly bears its proportionate share of the expenses of any underlying Fidelity Central Funds.
F Expense ratios reflect operating expenses of the class. Expenses before reductions do not reflect amounts reimbursed by the investment adviser or reductions from brokerage service arrangements or reductions from other expense offset arrangements and do not represent the amount paid by the class during periods when reimbursements or reductions occur. Expenses net of fee waivers reflect expenses after reimbursement by the investment adviser but prior to reductions from brokerage service arrangements or other expense offset arrangements. Expenses net of all reductions represent the net expenses paid by the class.
G Annualized
H Amount does not include the portfolio activity of any underlying Fidelity Central Funds.
See accompanying notes which are an integral part of the financial statements.
Fidelity International Small Cap Opportunities Fund Class I
| Six months ended (Unaudited) April 30, | Years endedOctober 31, | |||||
| 2018 | 2017 | 2016 | 2015 | 2014 | 2013 | |
| Selected Per–Share Data | ||||||
| Net asset value, beginning of period | $18.66 | $14.99 | $14.91 | $13.81 | $13.83 | $10.90 |
| Income from Investment Operations | ||||||
| Net investment income (loss)A | .08 | .15 | .13 | .10 | .08 | .11 |
| Net realized and unrealized gain (loss) | 1.66 | 3.74 | .10 | 1.13 | .07 | 2.93 |
| Total from investment operations | 1.74 | 3.89 | .23 | 1.23 | .15 | 3.04 |
| Distributions from net investment income | (.15) | (.18) | (.08) | (.11) | (.09) | (.10) |
| Distributions from net realized gain | (.24) | (.04) | (.07) | (.02) | (.08) | (.01) |
| Total distributions | (.39) | (.22) | (.15) | (.13) | (.17) | (.11) |
| Redemption fees added to paid in capitalA,B | – | – | – | – | – | – |
| Net asset value, end of period | $20.01 | $18.66 | $14.99 | $14.91 | $13.81 | $13.83 |
| Total ReturnC,D | 9.46% | 26.34% | 1.56% | 8.98% | 1.11% | 28.11% |
| Ratios to Average Net AssetsE,F | ||||||
| Expenses before reductions | 1.13%G | 1.14% | 1.16% | 1.19% | 1.36% | 1.38% |
| Expenses net of fee waivers, if any | 1.13%G | 1.14% | 1.16% | 1.19% | 1.36% | 1.37% |
| Expenses net of all reductions | 1.13%G | 1.14% | 1.16% | 1.18% | 1.36% | 1.37% |
| Net investment income (loss) | .76%G | .90% | .91% | .71% | .60% | .87% |
| Supplemental Data | ||||||
| Net assets, end of period (000 omitted) | $207,099 | $164,878 | $155,551 | $120,723 | $29,822 | $5,670 |
| Portfolio turnover rateH | 18 %G | 11% | 24% | 21% | 18% | 31% |
A Calculated based on average shares outstanding during the period.
B Amount represents less than $.005 per share.
C Total returns for periods of less than one year are not annualized.
D Total returns would have been lower if certain expenses had not been reduced during the applicable periods shown.
E Fees and expenses of any underlying Fidelity Central Funds are not included in the Fund's expense ratio. The Fund indirectly bears its proportionate share of the expenses of any underlying Fidelity Central Funds.
F Expense ratios reflect operating expenses of the class. Expenses before reductions do not reflect amounts reimbursed by the investment adviser or reductions from brokerage service arrangements or reductions from other expense offset arrangements and do not represent the amount paid by the class during periods when reimbursements or reductions occur. Expenses net of fee waivers reflect expenses after reimbursement by the investment adviser but prior to reductions from brokerage service arrangements or other expense offset arrangements. Expenses net of all reductions represent the net expenses paid by the class.
G Annualized
H Amount does not include the portfolio activity of any underlying Fidelity Central Funds.
See accompanying notes which are an integral part of the financial statements.
Notes to Financial Statements (Unaudited)
For the period ended April 30, 2018
1. Organization.
Fidelity International Small Cap Opportunities Fund (the Fund) is a fund of Fidelity Investment Trust (the Trust) and is authorized to issue an unlimited number of shares. The Trust is registered under the Investment Company Act of 1940, as amended (the 1940 Act), as an open-end management investment company organized as a Massachusetts business trust. The Fund offers Class A, Class M, Class C, International Small Cap Opportunities and Class I shares, each of which has equal rights as to assets and voting privileges. Each class has exclusive voting rights with respect to matters that affect that class
2. Investments in Fidelity Central Funds.
The Fund invests in Fidelity Central Funds, which are open-end investment companies generally available only to other investment companies and accounts managed by the investment adviser and its affiliates. The Fund's Schedule of Investments lists each of the Fidelity Central Funds held as of period end, if any, as an investment of the Fund, but does not include the underlying holdings of each Fidelity Central Fund. As an Investing Fund, the Fund indirectly bears its proportionate share of the expenses of the underlying Fidelity Central Funds.
The Money Market Central Funds seek preservation of capital and current income and are managed by Fidelity Investments Money Management, Inc. (FIMM), an affiliate of the investment adviser. Annualized expenses of the Money Market Central Funds as of their most recent shareholder report date are less than .005%.
A complete unaudited list of holdings for each Fidelity Central Fund is available upon request or at the Securities and Exchange Commission (the SEC) website at www.sec.gov. In addition, the financial statements of the Fidelity Central Funds are available on the SEC website or upon request.
3. Significant Accounting Policies.
The Fund is an investment company and applies the accounting and reporting guidance of the Financial Accounting Standards Board (FASB) Accounting Standards Codification Topic 946 Financial Services – Investments Companies. The financial statements have been prepared in conformity with accounting principles generally accepted in the United States of America (GAAP), which require management to make certain estimates and assumptions at the date of the financial statements. Actual results could differ from those estimates. Subsequent events, if any, through the date that the financial statements were issued have been evaluated in the preparation of the financial statements. The following summarizes the significant accounting policies of the Fund:
Investment Valuation. Investments are valued as of 4:00 p.m. Eastern time on the last calendar day of the period. The Board of Trustees (the Board) has delegated the day to day responsibility for the valuation of the Fund's investments to the Fair Value Committee (the Committee) established by the Fund's investment adviser. In accordance with valuation policies and procedures approved by the Board, the Fund attempts to obtain prices from one or more third party pricing vendors or brokers to value its investments. When current market prices, quotations or currency exchange rates are not readily available or reliable, investments will be fair valued in good faith by the Committee, in accordance with procedures adopted by the Board. Factors used in determining fair value vary by investment type and may include market or investment specific events. The frequency with which these procedures are used cannot be predicted and they may be utilized to a significant extent. The Committee oversees the Fund's valuation policies and procedures and reports to the Board on the Committee's activities and fair value determinations. The Board monitors the appropriateness of the procedures used in valuing the Fund's investments and ratifies the fair value determinations of the Committee.
The Fund categorizes the inputs to valuation techniques used to value its investments into a disclosure hierarchy consisting of three levels as shown below:
- Level 1 – quoted prices in active markets for identical investments
- Level 2 – other significant observable inputs (including quoted prices for similar investments, interest rates, prepayment speeds, etc.)
- Level 3 – unobservable inputs (including the Fund's own assumptions based on the best information available)
Valuation techniques used to value the Fund's investments by major category are as follows:
Equity securities, including restricted securities, for which market quotations are readily available, are valued at the last reported sale price or official closing price as reported by a third party pricing vendor on the primary market or exchange on which they are traded and are categorized as Level 1 in the hierarchy. In the event there were no sales during the day or closing prices are not available, securities are valued at the last quoted bid price or may be valued using the last available price and are generally categorized as Level 2 in the hierarchy. For foreign equity securities, when market or security specific events arise, comparisons to the valuation of American Depositary Receipts (ADRs), futures contracts, Exchange-Traded Funds (ETFs) and certain indexes as well as quoted prices for similar securities may be used and would be categorized as Level 2 in the hierarchy. Utilizing these techniques may result in transfers between Level 1 and Level 2. For equity securities, including restricted securities, where observable inputs are limited, assumptions about market activity and risk are used and these securities may be categorized as Level 3 in the hierarchy.
ETFs are valued at their last sale price or official closing price as reported by a third party pricing vendor on the primary market or exchange on which they are traded and are categorized as Level 1 in the hierarchy. In the event there were no sales during the day but the exchange reports a closing bid level, ETFs are valued at the closing bid and would be categorized as Level 1 in the hierarchy. In the event there was no closing bid, ETFs may be valued by another method that the Board believes reflects fair value in accordance with the Board's fair value pricing policies and may be categorized as Level 2 in the hierarchy.
Investments in open-end mutual funds, including Fidelity Central Funds, are valued at their closing net asset value (NAV) each business day and are categorized as Level 1 in the hierarchy
Changes in valuation techniques may result in transfers in or out of an assigned level within the disclosure hierarchy. The aggregate value of investments by input level as of April 30, 2018 including information on transfers between Levels 1 and 2, as well as a roll forward of Level 3 investments, is included at the end of the Fund's Schedule of Investments.
Foreign Currency. The Fund may use foreign currency contracts to facilitate transactions in foreign-denominated securities. Gains and losses from these transactions may arise from changes in the value of the foreign currency or if the counterparties do not perform under the contracts' terms.
Foreign-denominated assets, including investment securities, and liabilities are translated into U.S. dollars at the exchange rates at period end. Purchases and sales of investment securities, income and dividends received and expenses denominated in foreign currencies are translated into U.S. dollars at the exchange rate in effect on the transaction date.
The effects of exchange rate fluctuations on investments are included with the net realized and unrealized gain (loss) on investment securities. Other foreign currency transactions resulting in realized and unrealized gain (loss) are disclosed separately.
Investment Transactions and Income. For financial reporting purposes, the Fund's investment holdings and NAV include trades executed through the end of the last business day of the period. The NAV per share for processing shareholder transactions is calculated as of the close of business of the New York Stock Exchange (NYSE, normally 4:00 p.m. Eastern time and includes trades executed through the end of the prior business day. Gains and losses on securities sold are determined on the basis of identified cost. Dividend income is recorded on the ex-dividend date, except for certain dividends from foreign securities where the ex-dividend date may have passed, which are recorded as soon as the Fund is informed of the ex-dividend date. Non-cash dividends included in dividend income, if any, are recorded at the fair market value of the securities received. Income and capital gain distributions from Fidelity Central Funds, if any, are recorded on the ex-dividend date. Certain distributions received by the Fund represent a return of capital or capital gain. The Fund determines the components of these distributions subsequent to the ex-dividend date, based upon receipt of tax filings or other correspondence relating to the underlying investment. These distributions are recorded as a reduction of cost of investments and/or as a realized gain. Investment income is recorded net of foreign taxes withheld where recovery of such taxes is uncertain.
Class Allocations and Expenses. Investment income, realized and unrealized capital gains and losses, common expenses of the Fund, and certain fund-level expense reductions, if any, are allocated daily on a pro-rata basis to each class based on the relative net assets of each class to the total net assets of the Fund. Each class differs with respect to transfer agent and distribution and service plan fees incurred. Certain expense reductions may also differ by class. For the reporting period, the allocated portion of income and expenses to each class as a percent of its average net assets may vary due to the timing of recording these transactions in relation to fluctuating net assets of the classes. Expenses directly attributable to a fund are charged to that fund. Expenses attributable to more than one fund are allocated among the respective funds on the basis of relative net assets or other appropriate methods. Expense estimates are accrued in the period to which they relate and adjustments are made when actual amounts are known.
Income Tax Information and Distributions to Shareholders. Each year, the Fund intends to qualify as a regulated investment company under Subchapter M of the Internal Revenue Code, including distributing substantially all of its taxable income and realized gains. As a result, no provision for U.S. Federal income taxes is required. The Fund files a U.S. federal tax return, in addition to state and local tax returns as required. The Fund's federal income tax returns are subject to examination by the Internal Revenue Service (IRS) for a period of three fiscal years after they are filed. State and local tax returns may be subject to examination for an additional fiscal year depending on the jurisdiction. Foreign taxes are provided for based on the Fund's understanding of the tax rules and rates that exist in the foreign markets in which it invests.
Distributions are declared and recorded on the ex-dividend date. Income and capital gain distributions are declared separately for each class. Income and capital gain distributions are determined in accordance with income tax regulations, which may differ from GAAP.
Capital accounts within the financial statements are adjusted for permanent book-tax differences. These adjustments have no impact on net assets or the results of operations. Capital accounts are not adjusted for temporary book-tax differences which will reverse in a subsequent period.
Book-tax differences are primarily due to foreign currency transactions, passive foreign investment companies (PFIC), capital loss carryforwards and losses deferred due to wash sales.
As of period end, the cost and unrealized appreciation (depreciation) in securities, and derivatives if applicable, for federal income tax purposes were as follows:
| Gross unrealized appreciation | $376,331,513 |
| Gross unrealized depreciation | (39,485,669) |
| Net unrealized appreciation (depreciation) | $336,845,844 |
| Tax cost | $1,041,235,980 |
Short-Term Trading (Redemption) Fees. Shares held by investors in the Fund less than 90 days may have been subject to a redemption fee equal to 2.00% of the NAV of shares redeemed. All redemption fees, which reduce the proceeds of the shareholder redemption, are retained by the Fund and accounted for as an addition to paid in capital. In November 2017, the Board of Trustees approved the elimination of these redemption fees effective December 18, 2017.
Restricted Securities. The Fund may invest in securities that are subject to legal or contractual restrictions on resale. These securities generally may be resold in transactions exempt from registration or to the public if the securities are registered. Disposal of these securities may involve time-consuming negotiations and expense, and prompt sale at an acceptable price may be difficult. Information regarding restricted securities is included at the end of the Fund's Schedule of Investments.
4. Purchases and Sales of Investments.
Purchases and sales of securities, other than short-term securities, aggregated $207,522,983 and $106,237,190, respectively.
5. Fees and Other Transactions with Affiliates.
Management Fee. Fidelity Management & Research Company (the investment adviser) and its affiliates provide the Fund with investment management related services for which the Fund pays a monthly management fee. The management fee is the sum of an individual fund fee rate that is based on an annual rate of .60% of the Fund's average net assets and an annualized group fee rate that averaged .24% during the period. The group fee rate is based upon the average net assets of all the mutual funds advised by the investment adviser, including any mutual funds previously advised by the investment adviser that are currently advised by Fidelity SelectCo, LLC, an affiliate of the investment adviser. The group fee rate decreases as assets under management increase and increases as assets under management decrease. In addition, the management fee is subject to a performance adjustment (up to a maximum of +/- .20% of the Fund's average net assets over a 36 month performance period). The upward or downward adjustment to the management fee is based on the relative investment performance of Investment Small Cap Opportunities as compared to its benchmark index, the MSCI EAFE Small Cap Index, over the same 36 month performance period. For the reporting period, the total annualized management fee rate, including the performance adjustment, was .85% of the Fund's average net assets. The performance adjustment included in the management fee rate may be higher or lower than the maximum performance adjustment rate due to the difference between the average net assets for the reporting and performance periods.
Distribution and Service Plan Fees. In accordance with Rule 12b-1 of the 1940 Act, the Fund has adopted separate Distribution and Service Plans for each class of shares. Certain classes pay Fidelity Distributors Corporation (FDC), an affiliate of the investment adviser, separate Distribution and Service Fees, each of which is based on an annual percentage of each class' average net assets. In addition, FDC may pay financial intermediaries for selling shares of the Fund and providing shareholder support services. For the period, the Distribution and Service Fee rates, total fees and amounts retained by FDC were as follows:
| Distribution Fee | Service Fee | Total Fees | Retained by FDC | |
| Class A | -% | .25% | $57,260 | $2,059 |
| Class M | .25% | .25% | 38,884 | 424 |
| Class C | .75% | .25% | 81,797 | 10,683 |
| $177,941 | $13,166 |
Sales Load. FDC may receive a front-end sales charge of up to 5.75% for selling Class A shares and 3.50% for selling Class M shares, some of which is paid to financial intermediaries for selling shares of the Fund. Depending on the holding period, FDC may receive contingent deferred sales charges levied on Class A, Class M and Class C redemptions. The deferred sales charges are 1.00% for Class C shares, 1.00% for certain purchases of Class A shares and .25% for certain purchases of Class M shares.
For the period, sales charge amounts retained by FDC were as follows:
| Retained by FDC | |
| Class A | $16,475 |
| Class M | 3,035 |
| Class C(a) | 2,039 |
| $21,549 |
(a) When Class C shares are initially sold, FDC pays commissions from its own resources to financial intermediaries through which the sales are made.
Transfer Agent Fees. Fidelity Investments Institutional Operations Company, Inc., (FIIOC), an affiliate of the investment adviser, is the transfer, dividend disbursing and shareholder servicing agent for each class of the Fund. FIIOC receives account fees and asset-based fees that vary according to the account size and type of account of the shareholders of the respective classes of the Fund. FIIOC pays for typesetting, printing and mailing of shareholder reports, except proxy statements.
For the period, transfer agent fees for each class were as follows:
| Amount | % of Class-Level Average Net Assets(a) | |
| Class A | $51,362 | .22 |
| Class M | 20,063 | .26 |
| Class C | 19,716 | .24 |
| International Small Cap Opportunities | 863,924 | .18 |
| Class I | 192,307 | .21 |
| $1,147,372 |
(a) Annualized
Accounting and Security Lending Fees. Fidelity Service Company, Inc. (FSC), an affiliate of the investment adviser, maintains the Fund's accounting records. The accounting fee is based on the level of average net assets for each month. Under a separate contract, FSC administers the security lending program. The security lending fee is based on the number and duration of lending transactions. For the period, the fees were equivalent to an annualized rate of .05%.
Brokerage Commissions. The Fund placed a portion of its portfolio transactions with brokerage firms which are affiliates of the investment adviser. Brokerage commissions are included in net realized gain (loss) and change in net unrealized appreciation (depreciation) in the Statement of Operations. The commissions paid to these affiliated firms were $159 for the period.
Interfund Trades. The Fund may purchase from or sell securities to other Fidelity Funds under procedures adopted by the Board. The procedures have been designed to ensure these interfund trades are executed in accordance with Rule 17a-7 of the 1940 Act. Interfund trades are included within the respective purchases and sales amounts shown in the Purchases and Sales of Investments note.
6. Committed Line of Credit.
The Fund participates with other funds managed by the investment adviser or an affiliate in a $4.25 billion credit facility (the "line of credit") to be utilized for temporary or emergency purposes to fund shareholder redemptions or for other short-term liquidity purposes. The Fund has agreed to pay commitment fees on its pro-rata portion of the line of credit, which amounted to $1,688 and is reflected in Miscellaneous expenses on the Statement of Operations. During the period, the Fund did not borrow on this line of credit.
7. Security Lending.
The Fund lends portfolio securities through a lending agent from time to time in order to earn additional income. For equity securities, a lending agent is used and may loan securities to certain qualified borrowers, including Fidelity Capital Markets (FCM), a broker-dealer affiliated with the Fund. On the settlement date of the loan, the Fund receives collateral (in the form of U.S. Treasury obligations, letters of credit and/or cash) against the loaned securities and maintains collateral in an amount not less than 100% of the market value of the loaned securities during the period of the loan. The market value of the loaned securities is determined at the close of business of the Fund and any additional required collateral is delivered to the Fund on the next business day. The Fund or borrower may terminate the loan at any time, and if the borrower defaults on its obligation to return the securities loaned because of insolvency or other reasons, the Fund may apply collateral received from the borrower against the obligation. The Fund may experience delays and costs in recovering the securities loaned. Any cash collateral received is invested in the Fidelity Securities Lending Cash Central Fund. The value of loaned securities and cash collateral at period end are disclosed on the Fund's Statement of Assets and Liabilities. Security lending income represents the income earned on investing cash collateral, less rebates paid to borrowers and any lending agent fees associated with the loan, plus any premium payments received for lending certain types of securities. Security lending income is presented in the Statement of Operations as a component of income from Fidelity Central Funds. Total security lending income during the period amounted to $47,593. During the period, there were no securities loaned to FCM.
8. Expense Reductions.
Commissions paid to certain brokers with whom the investment adviser, or its affiliates, places trades on behalf of the Fund include an amount in addition to trade execution, which may be rebated back to the Fund to offset certain expenses. This amount totaled $8,932 for the period. Through arrangements with the Fund's custodian, credits realized as a result of certain uninvested cash balances were used to reduce the Fund's expenses. During the period, these credits reduced the Fund's custody expenses by $51
In addition, during the period the investment adviser reimbursed and/or waived a portion of fund-level operating expenses in the amount of $5,772.
9. Distributions to Shareholders.
Distributions to shareholders of each class were as follows:
| Six months ended April 30, 2018 | Year ended October 31, 2017 | |
| From net investment income | ||
| Class A | $209,705 | $345,589 |
| Class M | 47,051 | 44,101 |
| Class C | 147 | – |
| International Small Cap Opportunities | 7,035,349 | 8,436,166 |
| Class I | 1,359,558 | 1,798,182 |
| Total | $8,651,810 | $10,624,038 |
| From net realized gain | ||
| Class A | $547,128 | $117,149 |
| Class M | 190,555 | 32,073 |
| Class C | 199,614 | – |
| International Small Cap Opportunities | 11,470,004 | 2,008,611 |
| Class I | 2,229,392 | 408,678 |
| Total | $14,636,693 | $2,566,511 |
10. Share Transactions.
Share transactions for each class were as follows and may contain automatic conversions between classes or exchanges between affiliated funds:
| Shares | Shares | Dollars | Dollars | |
| Six months ended April 30, 2018 | Year ended October 31, 2017 | Six months ended April 30, 2018 | Year ended October 31, 2017 | |
| Class A | ||||
| Shares sold | 386,093 | 617,618 | $7,547,784 | $9,892,785 |
| Reinvestment of distributions | 39,412 | 30,743 | 734,649 | 441,465 |
| Shares redeemed | (244,782) | (1,457,378) | (4,777,637) | (22,890,236) |
| Net increase (decrease) | 180,723 | (809,017) | $3,504,796 | $(12,555,986) |
| Class M | ||||
| Shares sold | 104,554 | 184,978 | $2,036,462 | $3,117,188 |
| Reinvestment of distributions | 12,748 | 5,229 | 235,975 | 74,674 |
| Shares redeemed | (68,799) | (241,247) | (1,328,243) | (3,797,029) |
| Net increase (decrease) | 48,503 | (51,040) | $944,194 | $(605,167) |
| Class C | ||||
| Shares sold | 223,222 | 166,898 | $4,286,533 | $2,711,727 |
| Reinvestment of distributions | 10,900 | – | 196,970 | – |
| Shares redeemed | (65,635) | (236,034) | (1,240,734) | (3,599,444) |
| Net increase (decrease) | 168,487 | (69,136) | $3,242,769 | $(887,717) |
| International Small Cap Opportunities | ||||
| Shares sold | 10,821,942 | 8,291,089 | $216,594,490 | $139,007,305 |
| Reinvestment of distributions | 814,355 | 594,332 | 15,335,912 | 8,611,863 |
| Shares redeemed | (6,499,270) | (13,816,436) | (125,749,475) | (218,659,907) |
| Net increase (decrease) | 5,137,027 | (4,931,015) | $106,180,927 | $(71,040,739) |
| Class I | ||||
| Shares sold | 3,505,992 | 4,860,065 | $69,277,197 | $80,212,539 |
| Reinvestment of distributions | 153,156 | 138,286 | 2,881,165 | 2,000,992 |
| Shares redeemed | (2,142,000) | (6,539,728) | (42,243,652) | (105,770,110) |
| Net increase (decrease) | 1,517,148 | (1,541,377) | $29,914,710 | $(23,556,579) |
11. Other.
The Fund's organizational documents provide former and current trustees and officers with a limited indemnification against liabilities arising in connection with the performance of their duties to the Fund. In the normal course of business, the Fund may also enter into contracts that provide general indemnifications. The Fund's maximum exposure under these arrangements is unknown as this would be dependent on future claims that may be made against the Fund. The risk of material loss from such claims is considered remote.
Shareholder Expense Example
As a shareholder of the Fund, you incur two types of costs: (1) transaction costs, including sales charges (loads) on purchase payments or redemption proceeds, redemption fees and (2) ongoing costs, including management fees, distribution and/or service (12b-1) fees and other Fund expenses. This Example is intended to help you understand your ongoing costs (in dollars) of investing in the Fund and to compare these costs with the ongoing costs of investing in other mutual funds.
The Example is based on an investment of $1,000 invested at the beginning of the period and held for the entire period (November 1, 2017 to April 30, 2018).
Actual Expenses
The first line of the accompanying table for each class of the Fund provides information about actual account values and actual expenses. You may use the information in this line, together with the amount you invested, to estimate the expenses that you paid over the period. Simply divide your account value by $1,000.00 (for example, an $8,600 account value divided by $1,000.00 = 8.6), then multiply the result by the number in the first line for a class of the Fund under the heading entitled "Expenses Paid During Period" to estimate the expenses you paid on your account during this period. A small balance maintenance fee of $12.00 that is charged once a year may apply for certain accounts with a value of less than $2,000. This fee is not included in the table below. If it was, the estimate of expenses you paid during the period would be higher, and your ending account value lower, by this amount. In addition, the Fund, as a shareholder in the underlying Fidelity Central Funds, will indirectly bear its pro-rata share of the fees and expenses incurred by the underlying Fidelity Central Funds. These fees and expenses are not included in the Fund's annualized expense ratio used to calculate the expense estimate in the table below.
Hypothetical Example for Comparison Purposes
The second line of the accompanying table for each class of the Fund provides information about hypothetical account values and hypothetical expenses based on a Class' actual expense ratio and an assumed rate of return of 5% per year before expenses, which is not the Class' actual return. The hypothetical account values and expenses may not be used to estimate the actual ending account balance or expenses you paid for the period. You may use this information to compare the ongoing costs of investing in the Fund and other funds. To do so, compare this 5% hypothetical example with the 5% hypothetical examples that appear in the shareholder reports of the other funds. A small balance maintenance fee of $12.00 that is charged once a year may apply for certain accounts with a value of less than $2,000. This fee is not included in the table below. If it was, the estimate of expenses you paid during the period would be higher, and your ending account value lower, by this amount. In addition, the Fund, as a shareholder in the underlying Fidelity Central Funds, will indirectly bear its pro-rata share of the fees and expenses incurred by the underlying Fidelity Central Funds. These fees and expenses are not included in the Fund's annualized expense ratio used to calculate the expense estimate in the table below.
Please note that the expenses shown in the table are meant to highlight your ongoing costs only and do not reflect any transaction costs. Therefore, the second line of the table is useful in comparing ongoing costs only, and will not help you determine the relative total costs of owning different funds. In addition, if these transactional costs were included, your costs would have been higher.
| Annualized Expense Ratio-A | Beginning Account Value November 1, 2017 | Ending Account Value April 30, 2018 | Expenses Paid During Period-B November 1, 2017 to April 30, 2018 | |
| Class A | 1.40% | |||
| Actual | $1,000.00 | $1,093.00 | $7.27 | |
| Hypothetical-C | $1,000.00 | $1,017.85 | $7.00 | |
| Class M | 1.68% | |||
| Actual | $1,000.00 | $1,091.30 | $8.71 | |
| Hypothetical-C | $1,000.00 | $1,016.46 | $8.40 | |
| Class C | 2.16% | |||
| Actual | $1,000.00 | $1,089.00 | $11.19 | |
| Hypothetical-C | $1,000.00 | $1,014.08 | $10.79 | |
| International Small Cap Opportunities | 1.10% | |||
| Actual | $1,000.00 | $1,094.00 | $5.71 | |
| Hypothetical-C | $1,000.00 | $1,019.34 | $5.51 | |
| Class I | 1.13% | |||
| Actual | $1,000.00 | $1,094.60 | $5.87 | |
| Hypothetical-C | $1,000.00 | $1,019.19 | $5.66 |
A Annualized expense ratio reflects expenses net of applicable fee waivers.
B Expenses are equal to each Class' annualized expense ratio, multiplied by the average account value over the period, multiplied by 181/365 (to reflect the one-half year period).
C 5% return per year before expenses
![]()
Corporate Headquarters
245 Summer St.
Boston, MA 02210
www.fidelity.com
ILS-SANN-0618
1.815078.112
Fidelity Advisor® International Value Fund - Semi-Annual Report April 30, 2018 Class A, Class M, Class C and Class I are classes of Fidelity® International Value Fund |
|
Contents
To view a fund's proxy voting guidelines and proxy voting record for the 12-month period ended June 30, visit http://www.fidelity.com/proxyvotingresults or visit the Securities and Exchange Commission's (SEC) web site at http://www.sec.gov.
You may also call 1-877-208-0098 to request a free copy of the proxy voting guidelines.
Standard & Poor's, S&P and S&P 500 are registered service marks of The McGraw-Hill Companies, Inc. and have been licensed for use by Fidelity Distributors Corporation.
Other third-party marks appearing herein are the property of their respective owners.
All other marks appearing herein are registered or unregistered trademarks or service marks of FMR LLC or an affiliated company. © 2018 FMR LLC. All rights reserved.
This report and the financial statements contained herein are submitted for the general information of the shareholders of the Fund. This report is not authorized for distribution to prospective investors in the Fund unless preceded or accompanied by an effective prospectus.
A fund files its complete schedule of portfolio holdings with the SEC for the first and third quarters of each fiscal year on Form N-Q. Forms N-Q are available on the SEC’s web site at http://www.sec.gov. A fund's Forms N-Q may be reviewed and copied at the SEC’s Public Reference Room in Washington, DC. Information regarding the operation of the SEC's Public Reference Room may be obtained by calling 1-800-SEC-0330.
For a complete list of a fund's portfolio holdings, view the most recent holdings listing, semiannual report, or annual report on Fidelity's web site at http://www.fidelity.com, http://www.institutional.fidelity.com, or http://www.401k.com, as applicable.
NOT FDIC INSURED •MAY LOSE VALUE •NO BANK GUARANTEE
Neither the Fund nor Fidelity Distributors Corporation is a bank.
Investment Summary (Unaudited)
Geographic Diversification (% of fund's net assets)
| As of April 30, 2018 | ||
| Japan | 22.3% | |
| United Kingdom | 16.8% | |
| France | 15.4% | |
| Germany | 9.3% | |
| Switzerland | 8.5% | |
| Spain | 4.2% | |
| Australia | 3.6% | |
| Sweden | 3.4% | |
| Netherlands | 3.1% | |
| Other* | 13.4% | |

* Includes Short-Term investments and Net Other Assets (Liabilities).
Percentages are based on country or territory of incorporation and are adjusted for the effect of futures contracts, if applicable.
Asset Allocation as of April 30, 2018
| % of fund's net assets | |
| Stocks | 99.2 |
| Short-Term Investments and Net Other Assets (Liabilities) | 0.8 |
Top Ten Stocks as of April 30, 2018
| % of fund's net assets | |
| Total SA (France, Oil, Gas & Consumable Fuels) | 3.1 |
| Novartis AG (Switzerland, Pharmaceuticals) | 2.7 |
| BP PLC (United Kingdom, Oil, Gas & Consumable Fuels) | 2.4 |
| Banco Santander SA (Spain) (Spain, Banks) | 2.3 |
| Royal Dutch Shell PLC Class B sponsored ADR (United Kingdom, Oil, Gas & Consumable Fuels) | 2.0 |
| Mitsubishi UFJ Financial Group, Inc. (Japan, Banks) | 1.8 |
| BASF AG (Germany, Chemicals) | 1.8 |
| Commonwealth Bank of Australia (Australia, Banks) | 1.7 |
| Sanofi SA (France, Pharmaceuticals) | 1.7 |
| Honda Motor Co. Ltd. (Japan, Automobiles) | 1.6 |
| 21.1 |
Top Market Sectors as of April 30, 2018
| % of fund's net assets | |
| Financials | 39.4 |
| Industrials | 12.3 |
| Energy | 10.7 |
| Health Care | 9.1 |
| Consumer Discretionary | 7.6 |
| Materials | 7.2 |
| Information Technology | 4.7 |
| Consumer Staples | 4.0 |
| Telecommunication Services | 2.4 |
| Real Estate | 1.8 |
Schedule of Investments April 30, 2018 (Unaudited)
Showing Percentage of Net Assets
| Common Stocks - 98.0% | |||
| Shares | Value | ||
| Australia - 3.6% | |||
| Commonwealth Bank of Australia | 161,596 | $8,701,045 | |
| Insurance Australia Group Ltd. | 611,235 | 3,618,462 | |
| Macquarie Group Ltd. | 51,561 | 4,199,039 | |
| Magellan Financial Group Ltd. | 97,596 | 1,705,048 | |
| TOTAL AUSTRALIA | 18,223,594 | ||
| Austria - 1.0% | |||
| Erste Group Bank AG | 101,700 | 4,986,205 | |
| Bailiwick of Jersey - 0.6% | |||
| Wolseley PLC | 42,845 | 3,291,347 | |
| Belgium - 1.3% | |||
| KBC Groep NV | 78,227 | 6,839,405 | |
| Canada - 0.4% | |||
| Nutrien Ltd. | 48,080 | 2,188,774 | |
| Finland - 0.9% | |||
| Sampo Oyj (A Shares) | 85,034 | 4,595,246 | |
| France - 15.4% | |||
| Accor SA | 49,800 | 2,818,691 | |
| Atos Origin SA | 37,457 | 5,061,581 | |
| AXA SA | 283,221 | 8,099,740 | |
| Bouygues SA (a) | 68,227 | 3,481,017 | |
| Capgemini SA | 33,893 | 4,665,927 | |
| Compagnie de St. Gobain | 51,000 | 2,678,753 | |
| Natixis SA | 547,000 | 4,499,716 | |
| Sanofi SA | 107,421 | 8,492,954 | |
| Societe Generale Series A | 141,500 | 7,744,123 | |
| SR Teleperformance SA | 25,000 | 4,012,251 | |
| Total SA (a) | 249,811 | 15,701,056 | |
| VINCI SA (a) | 69,200 | 6,918,872 | |
| Vivendi SA | 159,792 | 4,224,000 | |
| TOTAL FRANCE | 78,398,681 | ||
| Germany - 8.5% | |||
| BASF AG | 89,929 | 9,356,526 | |
| Brenntag AG | 44,600 | 2,559,378 | |
| Deutsche Post AG | 80,112 | 3,477,217 | |
| Deutsche Telekom AG | 369,300 | 6,464,087 | |
| Fresenius SE & Co. KGaA | 27,300 | 2,088,160 | |
| Hannover Reuck SE | 31,600 | 4,449,475 | |
| HeidelbergCement Finance AG | 25,800 | 2,531,743 | |
| Linde AG | 15,400 | 3,422,785 | |
| SAP SE | 28,531 | 3,169,956 | |
| Vonovia SE | 111,565 | 5,605,944 | |
| TOTAL GERMANY | 43,125,271 | ||
| Hong Kong - 0.4% | |||
| AIA Group Ltd. | 231,600 | 2,069,856 | |
| India - 0.1% | |||
| PC Jeweller Ltd. | 121,614 | 263,293 | |
| Indonesia - 0.3% | |||
| PT Bank Rakyat Indonesia Tbk | 6,527,200 | 1,504,967 | |
| Ireland - 0.8% | |||
| Allergan PLC | 6,480 | 995,652 | |
| CRH PLC | 91,785 | 3,259,415 | |
| TOTAL IRELAND | 4,255,067 | ||
| Italy - 2.9% | |||
| Assicurazioni Generali SpA | 188,800 | 3,816,634 | |
| Intesa Sanpaolo SpA | 2,001,900 | 7,615,143 | |
| Mediobanca SpA | 280,743 | 3,412,289 | |
| TOTAL ITALY | 14,844,066 | ||
| Japan - 22.3% | |||
| AEON Financial Service Co. Ltd. | 88,400 | 2,074,958 | |
| East Japan Railway Co. | 30,100 | 2,888,300 | |
| Honda Motor Co. Ltd. | 236,200 | 8,121,964 | |
| Hoya Corp. | 49,500 | 2,654,308 | |
| Idemitsu Kosan Co. Ltd. | 58,300 | 2,285,177 | |
| Itochu Corp. | 325,400 | 6,530,622 | |
| Japan Tobacco, Inc. | 107,400 | 2,884,926 | |
| Kao Corp. | 47,000 | 3,377,104 | |
| Makita Corp. | 80,400 | 3,618,441 | |
| Mitsubishi UFJ Financial Group, Inc. | 1,412,100 | 9,462,967 | |
| Mitsui Fudosan Co. Ltd. | 142,400 | 3,662,254 | |
| Nintendo Co. Ltd. | 6,000 | 2,521,059 | |
| Nomura Holdings, Inc. | 591,900 | 3,409,081 | |
| OBIC Co. Ltd. | 49,600 | 4,160,556 | |
| Olympus Corp. | 62,400 | 2,331,723 | |
| Oracle Corp. Japan | 30,200 | 2,486,279 | |
| ORIX Corp. | 340,800 | 5,997,980 | |
| Panasonic Corp. | 247,100 | 3,658,847 | |
| Recruit Holdings Co. Ltd. | 128,900 | 2,979,604 | |
| Shin-Etsu Chemical Co. Ltd. | 43,100 | 4,338,781 | |
| Shinsei Bank Ltd. | 184,600 | 2,884,164 | |
| SoftBank Corp. | 52,300 | 3,996,176 | |
| Sony Corp. | 65,400 | 3,054,580 | |
| Sony Financial Holdings, Inc. | 194,300 | 3,552,924 | |
| Subaru Corp. | 107,300 | 3,611,020 | |
| Sumitomo Mitsui Financial Group, Inc. | 148,400 | 6,185,055 | |
| T&D Holdings, Inc. | 203,800 | 3,465,644 | |
| Taiheiyo Cement Corp. | 66,600 | 2,525,220 | |
| Tokio Marine Holdings, Inc. | 111,400 | 5,270,406 | |
| TOTAL JAPAN | 113,990,120 | ||
| Netherlands - 3.1% | |||
| ING Groep NV (Certificaten Van Aandelen) | 404,590 | 6,817,553 | |
| Koninklijke Philips Electronics NV | 66,600 | 2,818,927 | |
| RELX NV | 130,274 | 2,771,172 | |
| Wolters Kluwer NV | 64,755 | 3,505,623 | |
| TOTAL NETHERLANDS | 15,913,275 | ||
| Norway - 1.4% | |||
| Statoil ASA (a) | 280,776 | 7,180,203 | |
| Portugal - 0.7% | |||
| Galp Energia SGPS SA Class B | 174,989 | 3,363,106 | |
| Spain - 3.8% | |||
| Banco Santander SA (Spain) | 1,829,021 | 11,867,484 | |
| CaixaBank SA | 918,497 | 4,466,535 | |
| Masmovil Ibercom SA (b) | 10,585 | 1,528,781 | |
| Unicaja Banco SA | 790,500 | 1,432,866 | |
| TOTAL SPAIN | 19,295,666 | ||
| Sweden - 3.4% | |||
| Alfa Laval AB (a) | 117,500 | 2,921,180 | |
| Investor AB (B Shares) | 79,769 | 3,489,862 | |
| Nordea Bank AB | 628,200 | 6,412,100 | |
| Swedbank AB (A Shares) | 197,742 | 4,312,018 | |
| TOTAL SWEDEN | 17,135,160 | ||
| Switzerland - 8.5% | |||
| Credit Suisse Group AG | 316,761 | 5,342,568 | |
| Lafargeholcim Ltd. (Reg.) | 51,790 | 2,893,133 | |
| Nestle SA (Reg. S) | 88,219 | 6,834,334 | |
| Novartis AG | 180,618 | 13,902,947 | |
| UBS Group AG | 475,758 | 7,992,734 | |
| Zurich Insurance Group AG | 20,650 | 6,596,344 | |
| TOTAL SWITZERLAND | 43,562,060 | ||
| United Kingdom - 16.8% | |||
| AstraZeneca PLC (United Kingdom) | 78,217 | 5,475,376 | |
| Aviva PLC | 795,186 | 5,777,561 | |
| BAE Systems PLC | 484,367 | 4,063,949 | |
| BHP Billiton PLC | 308,244 | 6,572,511 | |
| BP PLC | 1,616,622 | 12,008,213 | |
| British American Tobacco PLC (United Kingdom) | 50,263 | 2,756,800 | |
| Bunzl PLC | 113,256 | 3,291,461 | |
| Compass Group PLC | 134,810 | 2,895,250 | |
| GlaxoSmithKline PLC | 162,276 | 3,254,797 | |
| HSBC Holdings PLC sponsored ADR (a) | 104,511 | 5,252,723 | |
| Imperial Tobacco Group PLC | 123,674 | 4,434,474 | |
| Informa PLC | 362,172 | 3,684,670 | |
| Liberty Global PLC Class A (b) | 80,800 | 2,435,312 | |
| Micro Focus International PLC | 110,204 | 1,900,262 | |
| Royal Dutch Shell PLC Class B sponsored ADR (a) | 142,200 | 10,298,124 | |
| Standard Chartered PLC (United Kingdom) | 401,299 | 4,237,432 | |
| Standard Life PLC | 828,794 | 4,168,076 | |
| The Weir Group PLC | 100,800 | 2,964,156 | |
| TOTAL UNITED KINGDOM | 85,471,147 | ||
| United States of America - 1.8% | |||
| Amgen, Inc. | 14,100 | 2,460,168 | |
| ConocoPhillips Co. | 56,600 | 3,707,300 | |
| S&P Global, Inc. | 15,700 | 2,961,020 | |
| TOTAL UNITED STATES OF AMERICA | 9,128,488 | ||
| TOTAL COMMON STOCKS | |||
| (Cost $481,827,536) | 499,624,997 | ||
| Nonconvertible Preferred Stocks - 1.2% | |||
| Germany - 0.8% | |||
| Porsche Automobil Holding SE (Germany) | 44,100 | 3,770,465 | |
| Spain - 0.4% | |||
| Grifols SA Class B | 105,400 | 2,172,543 | |
| TOTAL NONCONVERTIBLE PREFERRED STOCKS | |||
| (Cost $5,659,290) | 5,943,008 | ||
| Money Market Funds - 3.5% | |||
| Fidelity Cash Central Fund, 1.74% (c) | 1,388,297 | 1,388,574 | |
| Fidelity Securities Lending Cash Central Fund 1.74% (c)(d) | 16,605,019 | 16,606,680 | |
| TOTAL MONEY MARKET FUNDS | |||
| (Cost $17,996,204) | 17,995,254 | ||
| TOTAL INVESTMENT IN SECURITIES - 102.7% | |||
| (Cost $505,483,030) | 523,563,259 | ||
| NET OTHER ASSETS (LIABILITIES) - (2.7)% | (13,561,848) | ||
| NET ASSETS - 100% | $510,001,411 |
Categorizations in the Schedule of Investments are based on country or territory of incorporation.
Legend
(a) Security or a portion of the security is on loan at period end.
(b) Non-income producing
(c) Affiliated fund that is generally available only to investment companies and other accounts managed by Fidelity Investments. The rate quoted is the annualized seven-day yield of the fund at period end. A complete unaudited listing of the fund's holdings as of its most recent quarter end is available upon request. In addition, each Fidelity Central Fund's financial statements are available on the SEC's website or upon request.
(d) Investment made with cash collateral received from securities on loan.
Affiliated Central Funds
Information regarding fiscal year to date income earned by the Fund from investments in Fidelity Central Funds is as follows:
| Fund | Income earned |
| Fidelity Cash Central Fund | $27,982 |
| Fidelity Securities Lending Cash Central Fund | 135,870 |
| Total | $163,852 |
Amounts in the income column in the above table include any capital gain distributions from underlying funds, which are presented in the corresponding line-item in the Statement of Operations if applicable.
Investment Valuation
The following is a summary of the inputs used, as of April 30, 2018, involving the Fund's assets and liabilities carried at fair value. The inputs or methodology used for valuing securities may not be an indication of the risk associated with investing in those securities. For more information on valuation inputs, and their aggregation into the levels used below, please refer to the Investment Valuation section in the accompanying Notes to Financial Statements.
| Valuation Inputs at Reporting Date: | ||||
| Description | Total | Level 1 | Level 2 | Level 3 |
| Investments in Securities: | ||||
| Equities: | ||||
| Consumer Discretionary | $38,538,092 | $23,439,408 | $15,098,684 | $-- |
| Consumer Staples | 20,287,638 | 10,696,504 | 9,591,134 | -- |
| Energy | 54,543,179 | 19,653,707 | 34,889,472 | -- |
| Financials | 201,286,448 | 107,971,361 | 93,315,087 | -- |
| Health Care | 46,647,555 | 10,530,011 | 36,117,544 | -- |
| Industrials | 61,953,343 | 47,493,305 | 14,460,038 | -- |
| Information Technology | 23,965,620 | 16,374,343 | 7,591,277 | -- |
| Materials | 37,088,888 | 17,900,436 | 19,188,452 | -- |
| Real Estate | 9,268,198 | 9,268,198 | -- | -- |
| Telecommunication Services | 11,989,044 | 1,528,781 | 10,460,263 | -- |
| Money Market Funds | 17,995,254 | 17,995,254 | -- | -- |
| Total Investments in Securities: | $523,563,259 | $282,851,308 | $240,711,951 | $-- |
The following is a summary of transfers between Level 1 and Level 2 for the period ended April 30, 2018. Transfers are assumed to have occurred at the beginning of the period, and are primarily attributable to the valuation techniques used for foreign equity securities, as discussed in the accompanying Notes to Financial Statements:
| Transfers | Total |
| Level 1 to Level 2 | $40,634,663 |
| Level 2 to Level 1 | $55,635,630 |
See accompanying notes which are an integral part of the financial statements.
Financial Statements
Statement of Assets and Liabilities
| April 30, 2018 (Unaudited) | ||
| Assets | ||
| Investment in securities, at value (including securities loaned of $15,999,366) — See accompanying schedule: Unaffiliated issuers (cost $487,486,826) | $505,568,005 | |
| Fidelity Central Funds (cost $17,996,204) | 17,995,254 | |
| Total Investment in Securities (cost $505,483,030) | $523,563,259 | |
| Cash | 49,019 | |
| Foreign currency held at value (cost $111,775) | 111,268 | |
| Receivable for investments sold | 43 | |
| Receivable for fund shares sold | 79,400 | |
| Dividends receivable | 3,295,051 | |
| Distributions receivable from Fidelity Central Funds | 33,176 | |
| Prepaid expenses | 184 | |
| Other receivables | 49,475 | |
| Total assets | 527,180,875 | |
| Liabilities | ||
| Payable for fund shares redeemed | $132,277 | |
| Accrued management fee | 281,856 | |
| Distribution and service plan fees payable | 8,641 | |
| Other affiliated payables | 95,712 | |
| Other payables and accrued expenses | 51,466 | |
| Collateral on securities loaned | 16,609,512 | |
| Total liabilities | 17,179,464 | |
| Net Assets | $510,001,411 | |
| Net Assets consist of: | ||
| Paid in capital | $510,879,634 | |
| Undistributed net investment income | 5,128,885 | |
| Accumulated undistributed net realized gain (loss) on investments and foreign currency transactions | (24,033,566) | |
| Net unrealized appreciation (depreciation) on investments and assets and liabilities in foreign currencies | 18,026,458 | |
| Net Assets | $510,001,411 | |
| Calculation of Maximum Offering Price | ||
| Class A: | ||
| Net Asset Value and redemption price per share ($8,724,675 ÷ 962,249 shares) | $9.07 | |
| Maximum offering price per share (100/94.25 of $9.07) | $9.62 | |
| Class M: | ||
| Net Asset Value and redemption price per share ($4,305,274 ÷ 475,184 shares) | $9.06 | |
| Maximum offering price per share (100/96.50 of $9.06) | $9.39 | |
| Class C: | ||
| Net Asset Value and offering price per share ($6,052,620 ÷ 669,045 shares)(a) | $9.05 | |
| International Value: | ||
| Net Asset Value, offering price and redemption price per share ($483,498,635 ÷ 53,369,856 shares) | $9.06 | |
| Class I: | ||
| Net Asset Value, offering price and redemption price per share ($7,420,207 ÷ 817,842 shares) | $9.07 |
(a) Redemption price per share is equal to net asset value less any applicable contingent deferred sales charge.
See accompanying notes which are an integral part of the financial statements.
Statement of Operations
| Six months ended April 30, 2018 (Unaudited) | ||
| Investment Income | ||
| Dividends | $8,930,901 | |
| Income from Fidelity Central Funds | 163,852 | |
| Income before foreign taxes withheld | 9,094,753 | |
| Less foreign taxes withheld | (821,910) | |
| Total income | 8,272,843 | |
| Expenses | ||
| Management fee | ||
| Basic fee | $1,867,466 | |
| Performance adjustment | (82,606) | |
| Transfer agent fees | 444,006 | |
| Distribution and service plan fees | 50,263 | |
| Accounting and security lending fees | 138,893 | |
| Custodian fees and expenses | 47,212 | |
| Independent trustees' fees and expenses | 998 | |
| Registration fees | 74,754 | |
| Audit | 33,244 | |
| Legal | 1,005 | |
| Interest | 1,357 | |
| Miscellaneous | 1,394 | |
| Total expenses before reductions | 2,577,986 | |
| Expense reductions | (84,818) | 2,493,168 |
| Net investment income (loss) | 5,779,675 | |
| Realized and Unrealized Gain (Loss) | ||
| Net realized gain (loss) on: | ||
| Investment securities: | ||
| Unaffiliated issuers | 18,442,253 | |
| Fidelity Central Funds | (1,882) | |
| Foreign currency transactions | 78,186 | |
| Total net realized gain (loss) | 18,518,557 | |
| Change in net unrealized appreciation (depreciation) on: | ||
| Investment securities: | ||
| Unaffiliated issuers | (17,266,041) | |
| Fidelity Central Funds | (937) | |
| Assets and liabilities in foreign currencies | (41,611) | |
| Total change in net unrealized appreciation (depreciation) | (17,308,589) | |
| Net gain (loss) | 1,209,968 | |
| Net increase (decrease) in net assets resulting from operations | $6,989,643 |
See accompanying notes which are an integral part of the financial statements.
Statement of Changes in Net Assets
| Six months ended April 30, 2018 (Unaudited) | Year ended October 31, 2017 | |
| Increase (Decrease) in Net Assets | ||
| Operations | ||
| Net investment income (loss) | $5,779,675 | $8,130,796 |
| Net realized gain (loss) | 18,518,557 | 518,118 |
| Change in net unrealized appreciation (depreciation) | (17,308,589) | 54,057,696 |
| Net increase (decrease) in net assets resulting from operations | 6,989,643 | 62,706,610 |
| Distributions to shareholders from net investment income | (8,139,842) | (8,124,122) |
| Distributions to shareholders from net realized gain | (850,252) | (457,331) |
| Total distributions | (8,990,094) | (8,581,453) |
| Share transactions - net increase (decrease) | 129,194,756 | 1,925,222 |
| Redemption fees | 12,458 | 1,612 |
| Total increase (decrease) in net assets | 127,206,763 | 56,051,991 |
| Net Assets | ||
| Beginning of period | 382,794,648 | 326,742,657 |
| End of period | $510,001,411 | $382,794,648 |
| Other Information | ||
| Undistributed net investment income end of period | $5,128,885 | $7,489,052 |
See accompanying notes which are an integral part of the financial statements.
Financial Highlights
Fidelity International Value Fund Class A
| Six months ended (Unaudited) April 30, | Years endedOctober 31, | |||||
| 2018 | 2017 | 2016 | 2015 | 2014 | 2013 | |
| Selected Per–Share Data | ||||||
| Net asset value, beginning of period | $9.08 | $7.78 | $8.27 | $8.62 | $8.96 | $7.39 |
| Income from Investment Operations | ||||||
| Net investment income (loss)A | .08 | .17 | .17 | .13 | .31B | .17 |
| Net realized and unrealized gain (loss) | .03 | 1.31 | (.57) | (.20) | (.47) | 1.64 |
| Total from investment operations | .11 | 1.48 | (.40) | (.07) | (.16) | 1.81 |
| Distributions from net investment income | (.10) | (.17) | (.09) | (.28) | (.17) | (.20) |
| Distributions from net realized gain | (.01) | (.01) | – | – | (.01) | (.04) |
| Total distributions | (.12)C | (.18) | (.09) | (.28) | (.18) | (.24) |
| Redemption fees added to paid in capitalA,D | – | – | – | – | – | – |
| Net asset value, end of period | $9.07 | $9.08 | $7.78 | $8.27 | $8.62 | $8.96 |
| Total ReturnE,F,G | 1.19% | 19.36% | (4.91)% | (.81)% | (1.76)% | 25.24% |
| Ratios to Average Net AssetsH,I | ||||||
| Expenses before reductions | 1.26%J | 1.33% | 1.40% | 1.37% | 1.32% | 1.39% |
| Expenses net of fee waivers, if any | 1.26%J | 1.33% | 1.40% | 1.37% | 1.32% | 1.39% |
| Expenses net of all reductions | 1.23%J | 1.32% | 1.39% | 1.36% | 1.32% | 1.36% |
| Net investment income (loss) | 1.83%J | 2.01% | 2.19% | 1.58% | 3.44%B | 2.08% |
| Supplemental Data | ||||||
| Net assets, end of period (000 omitted) | $8,725 | $8,151 | $7,717 | $8,956 | $6,296 | $6,191 |
| Portfolio turnover rateK | 66%J | 50% | 47% | 44% | 69% | 79% |
A Calculated based on average shares outstanding during the period.
B Net Investment income per share reflects a large, non-recurring dividend which amounted to $.14 per share. Excluding this non-recurring dividend, the ratio of net investment income (loss) to average net assets would have been 1.90%.
C Total distributions of $.12 per share is comprised of distributions from net investment income of $.102 and distributions from net realized gain of $.014 per share.
D Amount represents less than $.005 per share.
E Total returns for periods of less than one year are not annualized.
F Total returns would have been lower if certain expenses had not been reduced during the applicable periods shown.
G Total returns do not include the effect of the sales charges.
H Fees and expenses of any underlying Fidelity Central Funds are not included in the Fund's expense ratio. The Fund indirectly bears its proportionate share of the expenses of any underlying Fidelity Central Funds.
I Expense ratios reflect operating expenses of the class. Expenses before reductions do not reflect amounts reimbursed by the investment adviser or reductions from brokerage service arrangements or reductions from other expense offset arrangements and do not represent the amount paid by the class during periods when reimbursements or reductions occur. Expenses net of fee waivers reflect expenses after reimbursement by the investment adviser but prior to reductions from brokerage service arrangements or other expense offset arrangements. Expenses net of all reductions represent the net expenses paid by the class.
J Annualized
K Amount does not include the portfolio activity of any underlying Fidelity Central Funds.
See accompanying notes which are an integral part of the financial statements.
Fidelity International Value Fund Class M
| Six months ended (Unaudited) April 30, | Years endedOctober 31, | |||||
| 2018 | 2017 | 2016 | 2015 | 2014 | 2013 | |
| Selected Per–Share Data | ||||||
| Net asset value, beginning of period | $9.06 | $7.76 | $8.25 | $8.60 | $8.94 | $7.38 |
| Income from Investment Operations | ||||||
| Net investment income (loss)A | .07 | .14 | .15 | .11 | .28B | .15 |
| Net realized and unrealized gain (loss) | .02 | 1.31 | (.58) | (.20) | (.46) | 1.64 |
| Total from investment operations | .09 | 1.45 | (.43) | (.09) | (.18) | 1.79 |
| Distributions from net investment income | (.08) | (.14) | (.06) | (.26) | (.15) | (.19) |
| Distributions from net realized gain | (.01) | (.01) | – | – | (.01) | (.04) |
| Total distributions | (.09) | (.15) | (.06) | (.26) | (.16) | (.23) |
| Redemption fees added to paid in capitalA,C | – | – | – | – | – | – |
| Net asset value, end of period | $9.06 | $9.06 | $7.76 | $8.25 | $8.60 | $8.94 |
| Total ReturnD,E,F | 1.00% | 19.04% | (5.24)% | (1.09)% | (1.99)% | 24.86% |
| Ratios to Average Net AssetsG,H | ||||||
| Expenses before reductions | 1.59%I | 1.64% | 1.70% | 1.66% | 1.59% | 1.66% |
| Expenses net of fee waivers, if any | 1.59%I | 1.64% | 1.70% | 1.66% | 1.59% | 1.65% |
| Expenses net of all reductions | 1.56%I | 1.63% | 1.69% | 1.65% | 1.59% | 1.63% |
| Net investment income (loss) | 1.50%I | 1.70% | 1.89% | 1.29% | 3.17%B | 1.81% |
| Supplemental Data | ||||||
| Net assets, end of period (000 omitted) | $4,305 | $4,181 | $3,703 | $4,086 | $3,604 | $3,758 |
| Portfolio turnover rateJ | 66%I | 50% | 47% | 44% | 69% | 79% |
A Calculated based on average shares outstanding during the period.
B Net Investment income per share reflects a large, non-recurring dividend which amounted to $.14 per share. Excluding this non-recurring dividend, the ratio of net investment income (loss) to average net assets would have been 1.64%.
C Amount represents less than $.005 per share.
D Total returns for periods of less than one year are not annualized.
E Total returns would have been lower if certain expenses had not been reduced during the applicable periods shown.
F Total returns do not include the effect of the sales charges.
G Fees and expenses of any underlying Fidelity Central Funds are not included in the Fund's expense ratio. The Fund indirectly bears its proportionate share of the expenses of any underlying Fidelity Central Funds.
H Expense ratios reflect operating expenses of the class. Expenses before reductions do not reflect amounts reimbursed by the investment adviser or reductions from brokerage service arrangements or reductions from other expense offset arrangements and do not represent the amount paid by the class during periods when reimbursements or reductions occur. Expenses net of fee waivers reflect expenses after reimbursement by the investment adviser but prior to reductions from brokerage service arrangements or other expense offset arrangements. Expenses net of all reductions represent the net expenses paid by the class.
I Annualized
J Amount does not include the portfolio activity of any underlying Fidelity Central Funds.
See accompanying notes which are an integral part of the financial statements.
Fidelity International Value Fund Class C
| Six months ended (Unaudited) April 30, | Years endedOctober 31, | |||||
| 2018 | 2017 | 2016 | 2015 | 2014 | 2013 | |
| Selected Per–Share Data | ||||||
| Net asset value, beginning of period | $9.04 | $7.75 | $8.23 | $8.59 | $8.93 | $7.38 |
| Income from Investment Operations | ||||||
| Net investment income (loss)A | .05 | .10 | .11 | .07 | .24B | .11 |
| Net realized and unrealized gain (loss) | .02 | 1.31 | (.57) | (.20) | (.45) | 1.63 |
| Total from investment operations | .07 | 1.41 | (.46) | (.13) | (.21) | 1.74 |
| Distributions from net investment income | (.04) | (.11) | (.02) | (.23) | (.11) | (.15) |
| Distributions from net realized gain | (.01) | (.01) | – | – | (.01) | (.04) |
| Total distributions | (.06)C | (.12) | (.02) | (.23) | (.13)D | (.19) |
| Redemption fees added to paid in capitalA,E | – | – | – | – | – | – |
| Net asset value, end of period | $9.05 | $9.04 | $7.75 | $8.23 | $8.59 | $8.93 |
| Total ReturnF,G,H | .74% | 18.41% | (5.61)% | (1.58)% | (2.43)% | 24.17% |
| Ratios to Average Net AssetsI,J | ||||||
| Expenses before reductions | 2.08%K | 2.12% | 2.17% | 2.15% | 2.07% | 2.14% |
| Expenses net of fee waivers, if any | 2.08%K | 2.12% | 2.17% | 2.14% | 2.07% | 2.14% |
| Expenses net of all reductions | 2.05%K | 2.11% | 2.17% | 2.14% | 2.07% | 2.11% |
| Net investment income (loss) | 1.02%K | 1.22% | 1.42% | .81% | 2.69%B | 1.33% |
| Supplemental Data | ||||||
| Net assets, end of period (000 omitted) | $6,053 | $5,171 | $4,168 | $4,502 | $3,647 | $3,231 |
| Portfolio turnover rateL | 66%K | 50% | 47% | 44% | 69% | 79% |
A Calculated based on average shares outstanding during the period.
B Net Investment income per share reflects a large, non-recurring dividend which amounted to $.14 per share. Excluding this non-recurring dividend, the ratio of net investment income (loss) to average net assets would have been 1.15%.
C Total distributions of $.06 per share is comprised of distributions from net investment income of $.042 and distributions from net realized gain of $.014 per share.
D Total distributions of $.13 per share is comprised of distributions from net investment income of $.111 and distributions from net realized gain of $.014 per share.
E Amount represents less than $.005 per share.
F Total returns for periods of less than one year are not annualized.
G Total returns would have been lower if certain expenses had not been reduced during the applicable periods shown.
H Total returns do not include the effect of the contingent deferred sales charge.
I Fees and expenses of any underlying Fidelity Central Funds are not included in the Fund's expense ratio. The Fund indirectly bears its proportionate share of the expenses of any underlying Fidelity Central Funds.
J Expense ratios reflect operating expenses of the class. Expenses before reductions do not reflect amounts reimbursed by the investment adviser or reductions from brokerage service arrangements or reductions from other expense offset arrangements and do not represent the amount paid by the class during periods when reimbursements or reductions occur. Expenses net of fee waivers reflect expenses after reimbursement by the investment adviser but prior to reductions from brokerage service arrangements or other expense offset arrangements. Expenses net of all reductions represent the net expenses paid by the class.
K Annualized
L Amount does not include the portfolio activity of any underlying Fidelity Central Funds.
See accompanying notes which are an integral part of the financial statements.
Fidelity International Value Fund
| Six months ended (Unaudited) April 30, | Years endedOctober 31, | |||||
| 2018 | 2017 | 2016 | 2015 | 2014 | 2013 | |
| Selected Per–Share Data | ||||||
| Net asset value, beginning of period | $9.09 | $7.79 | $8.29 | $8.64 | $8.97 | $7.40 |
| Income from Investment Operations | ||||||
| Net investment income (loss)A | .10 | .20 | .20 | .16 | .34B | .19 |
| Net realized and unrealized gain (loss) | .02 | 1.31 | (.58) | (.19) | (.46) | 1.65 |
| Total from investment operations | .12 | 1.51 | (.38) | (.03) | (.12) | 1.84 |
| Distributions from net investment income | (.14) | (.20) | (.12) | (.32) | (.20) | (.22) |
| Distributions from net realized gain | (.01) | (.01) | – | – | (.01) | (.04) |
| Total distributions | (.15) | (.21) | (.12) | (.32) | (.21) | (.27)C |
| Redemption fees added to paid in capitalA,D | – | – | – | – | – | – |
| Net asset value, end of period | $9.06 | $9.09 | $7.79 | $8.29 | $8.64 | $8.97 |
| Total ReturnE,F | 1.35% | 19.83% | (4.69)% | (.41)% | (1.34)% | 25.57% |
| Ratios to Average Net AssetsG,H | ||||||
| Expenses before reductions | .93%I | .97% | 1.03% | 1.02% | .96% | 1.05% |
| Expenses net of fee waivers, if any | .93%I | .97% | 1.03% | 1.02% | .96% | 1.05% |
| Expenses net of all reductions | .90%I | .96% | 1.03% | 1.01% | .95% | 1.02% |
| Net investment income (loss) | 2.16%I | 2.36% | 2.56% | 1.93% | 3.80%B | 2.41% |
| Supplemental Data | ||||||
| Net assets, end of period (000 omitted) | $483,499 | $359,770 | $309,199 | $267,567 | $192,789 | $181,568 |
| Portfolio turnover rateJ | 66%I | 50% | 47% | 44% | 69% | 79% |
A Calculated based on average shares outstanding during the period.
B Net Investment income per share reflects a large, non-recurring dividend which amounted to $.14 per share. Excluding this non-recurring dividend, the ratio of net investment income (loss) to average net assets would have been 2.27%.
C Total distributions of $.27 per share is comprised of distributions from net investment income of $.223 and distributions from net realized gain of $.042 per share.
D Amount represents less than $.005 per share.
E Total returns for periods of less than one year are not annualized.
F Total returns would have been lower if certain expenses had not been reduced during the applicable periods shown.
G Fees and expenses of any underlying Fidelity Central Funds are not included in the Fund's expense ratio. The Fund indirectly bears its proportionate share of the expenses of any underlying Fidelity Central Funds.
H Expense ratios reflect operating expenses of the class. Expenses before reductions do not reflect amounts reimbursed by the investment adviser or reductions from brokerage service arrangements or reductions from other expense offset arrangements and do not represent the amount paid by the class during periods when reimbursements or reductions occur. Expenses net of fee waivers reflect expenses after reimbursement by the investment adviser but prior to reductions from brokerage service arrangements or other expense offset arrangements. Expenses net of all reductions represent the net expenses paid by the class.
I Annualized
J Amount does not include the portfolio activity of any underlying Fidelity Central Funds.
See accompanying notes which are an integral part of the financial statements.
Fidelity International Value Fund Class I
| Six months ended (Unaudited) April 30, | Years endedOctober 31, | |||||
| 2018 | 2017 | 2016 | 2015 | 2014 | 2013 | |
| Selected Per–Share Data | ||||||
| Net asset value, beginning of period | $9.10 | $7.80 | $8.29 | $8.65 | $8.98 | $7.41 |
| Income from Investment Operations | ||||||
| Net investment income (loss)A | .09 | .19 | .19 | .15 | .33B | .19 |
| Net realized and unrealized gain (loss) | .02 | 1.31 | (.58) | (.19) | (.45) | 1.65 |
| Total from investment operations | .11 | 1.50 | (.39) | (.04) | (.12) | 1.84 |
| Distributions from net investment income | (.13) | (.19) | (.10) | (.32) | (.19) | (.23) |
| Distributions from net realized gain | (.01) | (.01) | – | – | (.01) | (.04) |
| Total distributions | (.14) | (.20) | (.10) | (.32) | (.21)C | (.27) |
| Redemption fees added to paid in capitalA,D | – | – | – | – | – | – |
| Net asset value, end of period | $9.07 | $9.10 | $7.80 | $8.29 | $8.65 | $8.98 |
| Total ReturnE,F | 1.23% | 19.68% | (4.81)% | (.53)% | (1.41)% | 25.64% |
| Ratios to Average Net AssetsG,H | ||||||
| Expenses before reductions | 1.01%I | 1.10% | 1.17% | 1.14% | 1.05% | 1.07% |
| Expenses net of fee waivers, if any | 1.01%I | 1.10% | 1.17% | 1.14% | 1.05% | 1.07% |
| Expenses net of all reductions | .98%I | 1.09% | 1.16% | 1.13% | 1.04% | 1.04% |
| Net investment income (loss) | 2.08%I | 2.23% | 2.42% | 1.81% | 3.71%B | 2.39% |
| Supplemental Data | ||||||
| Net assets, end of period (000 omitted) | $7,420 | $5,523 | $1,955 | $1,969 | $1,310 | $239 |
| Portfolio turnover rateJ | 66%I | 50% | 47% | 44% | 69% | 79% |
A Calculated based on average shares outstanding during the period.
B Net Investment income per share reflects a large, non-recurring dividend which amounted to $.14 per share. Excluding this non-recurring dividend, the ratio of net investment income (loss) to average net assets would have been 2.18%.
C Total distributions of $.21 per share is comprised of distributions from net investment income of $.191 and distributions from net realized gain of $.014 per share.
D Amount represents less than $.005 per share.
E Total returns for periods of less than one year are not annualized.
F Total returns would have been lower if certain expenses had not been reduced during the applicable periods shown.
G Fees and expenses of any underlying Fidelity Central Funds are not included in the Fund's expense ratio. The Fund indirectly bears its proportionate share of the expenses of any underlying Fidelity Central Funds.
H Expense ratios reflect operating expenses of the class. Expenses before reductions do not reflect amounts reimbursed by the investment adviser or reductions from brokerage service arrangements or reductions from other expense offset arrangements and do not represent the amount paid by the class during periods when reimbursements or reductions occur. Expenses net of fee waivers reflect expenses after reimbursement by the investment adviser but prior to reductions from brokerage service arrangements or other expense offset arrangements. Expenses net of all reductions represent the net expenses paid by the class.
I Annualized
J Amount does not include the portfolio activity of any underlying Fidelity Central Funds.
See accompanying notes which are an integral part of the financial statements.
Notes to Financial Statements (Unaudited)
For the period ended April 30, 2018
1. Organization.
Fidelity International Value Fund (the Fund) is a fund of Fidelity Investment Trust (the Trust) and is authorized to issue an unlimited number of shares. The Trust is registered under the Investment Company Act of 1940, as amended (the 1940 Act), as an open-end management investment company organized as a Massachusetts business trust. The Fund offers Class A, Class M, Class C, International Value, and Class I shares, each of which has equal rights as to assets and voting privileges. Each class has exclusive voting rights with respect to matters that affect that class.
2. Investments in Fidelity Central Funds.
The Fund invests in Fidelity Central Funds, which are open-end investment companies generally available only to other investment companies and accounts managed by the investment adviser and its affiliates. The Fund's Schedule of Investments lists each of the Fidelity Central Funds held as of period end, if any, as an investment of the Fund, but does not include the underlying holdings of each Fidelity Central Fund. As an Investing Fund, the Fund indirectly bears its proportionate share of the expenses of the underlying Fidelity Central Funds.
The Money Market Central Funds seek preservation of capital and current income and are managed by Fidelity Investments Money Management, Inc. (FIMM), an affiliate of the investment adviser. Annualized expenses of the Money Market Central Funds as of their most recent shareholder report date are less than .005%.
A complete unaudited list of holdings for each Fidelity Central Fund is available upon request or at the Securities and Exchange Commission (the SEC) website at www.sec.gov. In addition, the financial statements of the Fidelity Central Funds are available on the SEC website or upon request.
3. Significant Accounting Policies.
The Fund is an investment company and applies the accounting and reporting guidance of the Financial Accounting Standards Board (FASB) Accounting Standards Codification Topic 946 Financial Services – Investments Companies. The financial statements have been prepared in conformity with accounting principles generally accepted in the United States of America (GAAP), which require management to make certain estimates and assumptions at the date of the financial statements. Actual results could differ from those estimates. Subsequent events, if any, through the date that the financial statements were issued have been evaluated in the preparation of the financial statements. The following summarizes the significant accounting policies of the Fund:
Investment Valuation. Investments are valued as of 4:00 p.m. Eastern time on the last calendar day of the period. The Board of Trustees (the Board) has delegated the day to day responsibility for the valuation of the Fund's investments to the Fair Value Committee (the Committee) established by the Fund's investment adviser. In accordance with valuation policies and procedures approved by the Board, the Fund attempts to obtain prices from one or more third party pricing vendors or brokers to value its investments. When current market prices, quotations or currency exchange rates are not readily available or reliable, investments will be fair valued in good faith by the Committee, in accordance with procedures adopted by the Board. Factors used in determining fair value vary by investment type and may include market or investment specific events. The frequency with which these procedures are used cannot be predicted and they may be utilized to a significant extent. The Committee oversees the Fund's valuation policies and procedures and reports to the Board on the Committee's activities and fair value determinations. The Board monitors the appropriateness of the procedures used in valuing the Fund's investments and ratifies the fair value determinations of the Committee.
The Fund categorizes the inputs to valuation techniques used to value its investments into a disclosure hierarchy consisting of three levels as shown below:
- Level 1 – quoted prices in active markets for identical investments
- Level 2 – other significant observable inputs (including quoted prices for similar investments, interest rates, prepayment speeds, etc.)
- Level 3 – unobservable inputs (including the Fund's own assumptions based on the best information available)
Valuation techniques used to value the Fund's investments by major category are as follows:
Equity securities, including restricted securities, for which market quotations are readily available, are valued at the last reported sale price or official closing price as reported by a third party pricing vendor on the primary market or exchange on which they are traded and are categorized as Level 1 in the hierarchy. In the event there were no sales during the day or closing prices are not available, securities are valued at the last quoted bid price or may be valued using the last available price and are generally categorized as Level 2 in the hierarchy. For foreign equity securities, when market or security specific events arise, comparisons to the valuation of American Depositary Receipts (ADRs), futures contracts, Exchange-Traded Funds (ETFs) and certain indexes as well as quoted prices for similar securities may be used and would be categorized as Level 2 in the hierarchy. Utilizing these techniques may result in transfers between Level 1 and Level 2. For equity securities, including restricted securities, where observable inputs are limited, assumptions about market activity and risk are used and these securities may be categorized as Level 3 in the hierarchy.
Investments in open-end mutual funds, including the Fidelity Central Funds, are valued at their closing net asset value (NAV) each business day and are categorized as Level 1 in the hierarchy.
Changes in valuation techniques may result in transfers in or out of an assigned level within the disclosure hierarchy. The aggregate value of investments by input level as of April 30, 2018, including information on transfers between Levels 1 and 2, is included at the end of the Fund's Schedule of Investments.
Foreign Currency. The Fund may use foreign currency contracts to facilitate transactions in foreign-denominated securities. Gains and losses from these transactions may arise from changes in the value of the foreign currency or if the counterparties do not perform under the contracts' terms.
Foreign-denominated assets, including investment securities, and liabilities are translated into U.S. dollars at the exchange rates at period end. Purchases and sales of investment securities, income and dividends received and expenses denominated in foreign currencies are translated into U.S. dollars at the exchange rate in effect on the transaction date.
The effects of exchange rate fluctuations on investments are included with the net realized and unrealized gain (loss) on investment securities. Other foreign currency transactions resulting in realized and unrealized gain (loss) are disclosed separately.
Investment Transactions and Income. For financial reporting purposes, the Fund's investment holdings and NAV include trades executed through the end of the last business day of the period. The NAV per share for processing shareholder transactions is calculated as of the close of business of the New York Stock Exchange (NYSE), normally 4:00 p.m. Eastern time and includes trades executed through the end of the prior business day. Gains and losses on securities sold are determined on the basis of identified cost. Dividend income is recorded on the ex-dividend date, except for certain dividends from foreign securities where the ex-dividend date may have passed, which are recorded as soon as the Fund is informed of the ex-dividend date. Non-cash dividends included in dividend income, if any, are recorded at the fair market value of the securities received. Income and capital gain distributions from Fidelity Central Funds, if any, are recorded on the ex-dividend date. Certain distributions received by the Fund represent a return of capital or capital gain. The Fund determines the components of these distributions subsequent to the ex-dividend date, based upon receipt of tax filings or other correspondence relating to the underlying investment. These distributions are recorded as a reduction of cost of investments and/or as a realized gain. Investment income is recorded net of foreign taxes withheld where recovery of such taxes is uncertain.
Class Allocations and Expenses. Investment income, realized and unrealized capital gains and losses, common expenses of the Fund, and certain fund-level expense reductions, if any, are allocated daily on a pro-rata basis to each class based on the relative net assets of each class to the total net assets of the Fund. Each class differs with respect to transfer agent and distribution and service plan fees incurred. Certain expense reductions may also differ by class. For the reporting period, the allocated portion of income and expenses to each class as a percent of its average net assets may vary due to the timing of recording these transactions in relation to fluctuating net assets of the classes. Expenses directly attributable to a fund are charged to that fund. Expenses attributable to more than one fund are allocated among the respective funds on the basis of relative net assets or other appropriate methods. Expense estimates are accrued in the period to which they relate and adjustments are made when actual amounts are known.
Income Tax Information and Distributions to Shareholders. Each year, the Fund intends to qualify as a regulated investment company under Subchapter M of the Internal Revenue Code, including distributing substantially all of its taxable income and realized gains. As a result, no provision for U.S. Federal income taxes is required. The Fund files a U.S. federal tax return, in addition to state and local tax returns as required. The Fund's federal income tax returns are subject to examination by the Internal Revenue Service (IRS) for a period of three fiscal years after they are filed. State and local tax returns may be subject to examination for an additional fiscal year depending on the jurisdiction. Foreign taxes are provided for based on the Fund's understanding of the tax rules and rates that exist in the foreign markets in which it invests.
Distributions are declared and recorded on the ex-dividend date. Income and capital gain distributions are declared separately for each class. Income and capital gain distributions are determined in accordance with income tax regulations, which may differ from GAAP.
Capital accounts within the financial statements are adjusted for permanent book-tax differences. These adjustments have no impact on net assets or the results of operations. Capital accounts are not adjusted for temporary book-tax differences which will reverse in a subsequent period.
Book-tax differences are primarily due to foreign currency transactions, passive foreign investment companies (PFIC), partnerships, capital loss carryforwards, expiring capital loss carryforwards and losses deferred due to wash sales.
As of period end, the cost and unrealized appreciation (depreciation) in securities, and derivatives if applicable, for federal income tax purposes were as follows:
| Gross unrealized appreciation | $40,661,933 |
| Gross unrealized depreciation | (23,476,011) |
| Net unrealized appreciation (depreciation) | $17,185,922 |
| Tax cost | $506,377,337 |
Capital loss carryforwards are only available to offset future capital gains of the Fund to the extent provided by regulations and may be limited. Under the Regulated Investment Company Modernization Act of 2010 (the Act), the Fund is permitted to carry forward capital losses incurred in taxable years beginning after December 22, 2010 for an unlimited period and such capital losses are required to be used prior to any losses that expire. The capital loss carryforward information presented below, including any applicable limitation, is estimated as of prior fiscal period end and is subject to adjustment.
| Fiscal year of expiration | |
| 2018 | $(3,571,319) |
| 2019 | (31,368,797) |
| Total with expiration | $(34,940,116) |
| No expiration | |
| Short-term | $(1,634,534) |
| Long-term | (3,963,871) |
| Total no expiration | $(5,598,405) |
| Total capital loss carryforward | $(40,538,521) |
Short-Term Trading (Redemption) Fees. Shares held by investors in the Fund less than 30 days may have been subject to a redemption fee equal to 1.00% of the NAV of shares redeemed. All redemption fees, which reduce the proceeds of the shareholder redemption, are retained by the Fund and accounted for as an addition to paid in capital. In November 2017, the Board of Trustees approved the elimination of these redemption fees effective December 18, 2017.
4. Purchases and Sales of Investments.
Purchases and sales of securities other than short-term securities aggregated $297,485,811 and $171,311,209, respectively.
5. Fees and Other Transactions with Affiliates.
Management Fee. Fidelity Management & Research Company (the investment adviser) and its affiliates provide the Fund with investment management related services for which the Fund pays a monthly management fee. The management fee is the sum of an individual fund fee rate that is based on an annual rate of .45% of the Fund's average net assets and an annualized group fee rate that averaged .24% during the period. The group fee rate is based upon the average net assets of all the mutual funds advised by the investment adviser, including any mutual funds previously advised by the investment adviser that are currently advised by Fidelity SelectCo, LLC, an affiliate of the investment adviser. The group fee rate decreases as assets under management increase and increases as assets under management decrease. In addition, the management fee is subject to a performance adjustment (up to a maximum of +/- .20% of the Fund's average net assets over a 36 month performance period). The upward or downward adjustment to the management fee is based on the relative investment performance of International Value as compared to its benchmark index, the MSCI EAFE Value Index, over the same 36 month performance period. For the reporting period, the total annualized management fee rate, including the performance adjustment, was .66% of the Fund's average net assets. The performance adjustment included in the management fee rate may be higher or lower than the maximum performance adjustment rate due to the difference between the average net assets for the reporting and performance periods.
Distribution and Service Plan Fees. In accordance with Rule 12b-1 of the 1940 Act, the Fund has adopted separate Distribution and Service Plans for each class of shares. Certain classes pay Fidelity Distributors Corporation (FDC), an affiliate of the investment adviser, separate Distribution and Service Fees, each of which is based on an annual percentage of each class' average net assets. In addition, FDC may pay financial intermediaries for selling shares of the Fund and providing shareholder support services. For the period, the Distribution and Service Fee rates, total fees and amounts retained by FDC were as follows:
| Distribution Fee | Service Fee | Total Fees | Retained by FDC | |
| Class A | -% | .25% | $10,550 | $301 |
| Class M | .25% | .25% | 10,730 | 159 |
| Class C | .75% | .25% | 28,983 | 4,218 |
| $50,263 | $4,678 |
Sales Load. FDC may receive a front-end sales charge of up to 5.75% for selling Class A shares and 3.50% for selling Class M shares, some of which is paid to financial intermediaries for selling shares of the Fund. Depending on the holding period, FDC may receive contingent deferred sales charges levied on Class A, Class M and Class C redemptions. The deferred sales charges are 1.00% for Class C shares, 1.00% for certain purchases of Class A shares and .25% for certain purchases of Class M shares.
For the period, sales charge amounts retained by FDC were as follows:
| Retained by FDC | |
| Class A | $3,040 |
| Class M | 836 |
| Class C(a) | 81 |
| $3,957 |
(a) When Class C shares are initially sold, FDC pays commissions from its own resources to financial intermediaries through which the sales are made.
Transfer Agent Fees. Fidelity Investments Institutional Operations Company, Inc., (FIIOC), an affiliate of the investment adviser, is the transfer, dividend disbursing and shareholder servicing agent for each class of the Fund. FIIOC receives account fees and asset-based fees that vary according to the account size and type of account of the shareholders of the respective classes of the Fund. FIIOC pays for typesetting, printing and mailing of shareholder reports, except proxy statements.
For the period, transfer agent fees for each class were as follows:
| Amount | % of Class-Level Average Net Assets(a) | |
| Class A | $10,247 | .24 |
| Class M | 6,929 | .32 |
| Class C | 8,819 | .30 |
| International Value | 410,246 | .16 |
| Class I | 7,765 | .24 |
| $444,006 |
(a) Annualized
Accounting and Security Lending Fees. Fidelity Service Company, Inc. (FSC), an affiliate of the investment adviser, maintains the Fund's accounting records. The accounting fee is based on the level of average net assets for each month. Under a separate contract, FSC administers the security lending program. The security lending fee is based on the number and duration of lending transactions. For the period, the fees were equivalent to an annualized rate of .05%.
Brokerage Commissions. The Fund placed a portion of its portfolio transactions with brokerage firms which are affiliates of the investment adviser. Brokerage commissions are included in net realized gain (loss) and change in net unrealized appreciation (depreciation) in the Statement of Operations. The commissions paid to these affiliated firms were $443 for the period.
Interfund Lending Program. Pursuant to an Exemptive Order issued by the SEC, the Fund, along with other registered investment companies having management contracts with Fidelity Management & Research Company (FMR) or other affiliated entities of FMR, may participate in an interfund lending program. This program provides an alternative credit facility allowing the funds to borrow from, or lend money to, other participating affiliated funds. The Fund's activity in this program during the period for which loans were outstanding was as follows:
| Borrower or Lender | Average Loan Balance | Weighted Average Interest Rate | Interest Expense |
| Borrower | $3,180,778 | 1.71% | $1,357 |
Interfund Trades. The Fund may purchase from or sell securities to other Fidelity Funds under procedures adopted by the Board. The procedures have been designed to ensure these interfund trades are executed in accordance with Rule 17a-7 of the 1940 Act. Interfund trades are included within the respective purchases and sales amounts shown in the Purchases and Sales of Investments note.
6. Committed Line of Credit.
The Fund participates with other funds managed by the investment adviser or an affiliate in a $4.25 billion credit facility (the "line of credit") to be utilized for temporary or emergency purposes to fund shareholder redemptions or for other short-term liquidity purposes. The Fund has agreed to pay commitment fees on its pro-rata portion of the line of credit, which amounted to $715 and is reflected in Miscellaneous expenses on the Statement of Operations. During the period, the Fund did not borrow on this line of credit.
7. Security Lending.
The Fund lends portfolio securities through a lending agent from time to time in order to earn additional income. For equity securities, a lending agent is used and may loan securities to certain qualified borrowers, including Fidelity Capital Markets (FCM), a broker-dealer affiliated with the Fund. On the settlement date of the loan, the Fund receives collateral (in the form of U.S. Treasury obligations, letters of credit and/or cash) against the loaned securities and maintains collateral in an amount not less than 100% of the market value of the loaned securities during the period of the loan. The market value of the loaned securities is determined at the close of business of the Fund and any additional required collateral is delivered to the Fund on the next business day. The Fund or borrower may terminate the loan at any time, and if the borrower defaults on its obligation to return the securities loaned because of insolvency or other reasons, the Fund may apply collateral received from the borrower against the obligation. The Fund may experience delays and costs in recovering the securities loaned. Any cash collateral received is invested in the Fidelity Securities Lending Cash Central Fund. The value of loaned securities and cash collateral at period end are disclosed on the Fund's Statement of Assets and Liabilities. Security lending income represents the income earned on investing cash collateral, less rebates paid to borrowers and any lending agent fees associated with the loan, plus any premium payments received for lending certain types of securities. Security lending income is presented in the Statement of Operations as a component of income from Fidelity Central Funds. Total security lending income during the period amounted to $135,870. During the period, there were no securities loaned to FCM.
8. Expense Reductions.
Commissions paid to certain brokers with whom the investment adviser, or its affiliates, places trades on behalf of the Fund include an amount in addition to trade execution, which may be rebated back to the Fund to offset certain expenses. This amount totaled $82,067 for the period.
In addition, during the period the investment adviser reimbursed and/or waived a portion of fund-level operating expenses in the amount of $2,751.
9. Distributions to Shareholders.
Distributions to shareholders of each class were as follows:
| Six months ended April 30, 2018 | Year ended October 31, 2017 | |
| From net investment income | ||
| Class A | $90,911 | $160,715 |
| Class M | 34,628 | 64,948 |
| Class C | 24,561 | 57,557 |
| International Value | 7,910,177 | 7,786,373 |
| Class I | 79,565 | 54,529 |
| Total | $8,139,842 | $8,124,122 |
| From net realized gain | ||
| Class A | $12,478 | $10,650 |
| Class M | 6,464 | 5,031 |
| Class C | 8,187 | 5,917 |
| International Value | 814,283 | 432,576 |
| Class I | 8,840 | 3,157 |
| Total | $850,252 | $457,331 |
10. Share Transactions.
Share transactions for each class were as follows and may contain automatic conversions between classes or exchanges between affiliated funds:
| Shares | Shares | Dollars | Dollars | |
| Six months ended April 30, 2018 | Year ended October 31, 2017 | Six months ended April 30, 2018 | Year ended October 31, 2017 | |
| Class A | ||||
| Shares sold | 158,011 | 276,572 | $1,449,873 | $2,327,962 |
| Reinvestment of distributions | 11,240 | 21,396 | 100,489 | 166,672 |
| Shares redeemed | (104,549) | (392,253) | (961,228) | (3,202,452) |
| Net increase (decrease) | 64,702 | (94,285) | $589,134 | $(707,818) |
| Class M | ||||
| Shares sold | 46,893 | 101,768 | $431,698 | $836,059 |
| Reinvestment of distributions | 4,596 | 8,935 | 41,092 | 69,695 |
| Shares redeemed | (37,669) | (126,227) | (346,946) | (1,023,584) |
| Net increase (decrease) | 13,820 | (15,524) | $125,844 | $(117,830) |
| Class C | ||||
| Shares sold | 135,788 | 120,429 | $1,268,337 | $1,017,626 |
| Reinvestment of distributions | 3,587 | 7,631 | 32,067 | 59,598 |
| Shares redeemed | (42,523) | (94,013) | (386,160) | (768,940) |
| Net increase (decrease) | 96,852 | 34,047 | $914,244 | $308,284 |
| International Value | ||||
| Shares sold | 20,171,767 | 2,636,526 | $183,649,326 | $22,208,337 |
| Reinvestment of distributions | 477,419 | 1,033,790 | 4,258,580 | 8,032,545 |
| Shares redeemed | (6,852,996) | (3,774,158) | (62,278,032) | (30,751,436) |
| Net increase (decrease) | 13,796,190 | (103,842) | $125,629,874 | $(510,554) |
| Class I | ||||
| Shares sold | 304,438 | 426,959 | $2,794,610 | $3,538,590 |
| Reinvestment of distributions | 9,287 | 6,933 | 82,930 | 54,005 |
| Shares redeemed | (102,822) | (77,592) | (941,880) | (639,455) |
| Net increase (decrease) | 210,903 | 356,300 | $1,935,660 | $2,953,140 |
11. Other.
The Fund's organizational documents provide former and current trustees and officers with a limited indemnification against liabilities arising in connection with the performance of their duties to the Fund. In the normal course of business, the Fund may also enter into contracts that provide general indemnifications. The Fund's maximum exposure under these arrangements is unknown as this would be dependent on future claims that may be made against the Fund. The risk of material loss from such claims is considered remote.
At the end of the period, Strategic Advisers Fidelity International Fund, VIP FundsManager 50% Portfolio and VIP FundsManager 60% Portfolio were the owners of record of approximately 45%, 11% and 13%, respectively, of the total outstanding shares of the Fund. Mutual funds managed by the investment adviser or its affiliates were the owners of record, in the aggregate, of approximately 75% of the total outstanding shares of the Fund.
Shareholder Expense Example
As a shareholder of the Fund, you incur two types of costs: (1) transaction costs, including sales charges (loads) on purchase payments or redemption proceeds, redemption fees and (2) ongoing costs, including management fees, distribution and/or service (12b-1) fees and other Fund expenses. This Example is intended to help you understand your ongoing costs (in dollars) of investing in the Fund and to compare these costs with the ongoing costs of investing in other mutual funds.
The Example is based on an investment of $1,000 invested at the beginning of the period and held for the entire period (November 1, 2017 to April 30, 2018).
Actual Expenses
The first line of the accompanying table for each class of the Fund provides information about actual account values and actual expenses. You may use the information in this line, together with the amount you invested, to estimate the expenses that you paid over the period. Simply divide your account value by $1,000.00 (for example, an $8,600 account value divided by $1,000.00 = 8.6), then multiply the result by the number in the first line for a class of the Fund under the heading entitled "Expenses Paid During Period" to estimate the expenses you paid on your account during this period. A small balance maintenance fee of $12.00 that is charged once a year may apply for certain accounts with a value of less than $2,000. This fee is not included in the table below. If it was, the estimate of expenses you paid during the period would be higher, and your ending account value lower, by this amount. In addition, the Fund, as a shareholder in the underlying Fidelity Central Funds, will indirectly bear its pro-rata share of the fees and expenses incurred by the underlying Fidelity Central Funds. These fees and expenses are not included in the Fund's annualized expense ratio used to calculate the expense estimate in the table below.
Hypothetical Example for Comparison Purposes
The second line of the accompanying table for each class of the Fund provides information about hypothetical account values and hypothetical expenses based on a Class' actual expense ratio and an assumed rate of return of 5% per year before expenses, which is not the Class' actual return. The hypothetical account values and expenses may not be used to estimate the actual ending account balance or expenses you paid for the period. You may use this information to compare the ongoing costs of investing in the Fund and other funds. To do so, compare this 5% hypothetical example with the 5% hypothetical examples that appear in the shareholder reports of the other funds. A small balance maintenance fee of $12.00 that is charged once a year may apply for certain accounts with a value of less than $2,000. This fee is not included in the table below. If it was, the estimate of expenses you paid during the period would be higher, and your ending account value lower, by this amount. In addition, the Fund, as a shareholder in the underlying Fidelity Central Funds, will indirectly bear its pro-rata share of the fees and expenses incurred by the underlying Fidelity Central Funds. These fees and expenses are not included in the Fund's annualized expense ratio used to calculate the expense estimate in the table below.
Please note that the expenses shown in the table are meant to highlight your ongoing costs only and do not reflect any transaction costs. Therefore, the second line of the table is useful in comparing ongoing costs only, and will not help you determine the relative total costs of owning different funds. In addition, if these transactional costs were included, your costs would have been higher.
| Annualized Expense Ratio-A | Beginning Account Value November 1, 2017 | Ending Account Value April 30, 2018 | Expenses Paid During Period-B November 1, 2017 to April 30, 2018 | |
| Class A | 1.26% | |||
| Actual | $1,000.00 | $1,011.90 | $6.29 | |
| Hypothetical-C | $1,000.00 | $1,018.55 | $6.31 | |
| Class M | 1.59% | |||
| Actual | $1,000.00 | $1,010.00 | $7.92 | |
| Hypothetical-C | $1,000.00 | $1,016.91 | $7.95 | |
| Class C | 2.08% | |||
| Actual | $1,000.00 | $1,007.40 | $10.35 | |
| Hypothetical-C | $1,000.00 | $1,014.48 | $10.39 | |
| International Value | .93% | |||
| Actual | $1,000.00 | $1,013.50 | $4.64 | |
| Hypothetical-C | $1,000.00 | $1,020.18 | $4.66 | |
| Class I | 1.01% | |||
| Actual | $1,000.00 | $1,012.30 | $5.04 | |
| Hypothetical-C | $1,000.00 | $1,019.79 | $5.06 |
A Annualized expense ratio reflects expenses net of applicable fee waivers.
B Expenses are equal to each Class' annualized expense ratio, multiplied by the average account value over the period, multiplied by 181/365 (to reflect the one-half year period).
C 5% return per year before expenses
![]()
AFIV-SANN-0618
1.827501.111
Fidelity® International Value Fund Semi-Annual Report April 30, 2018 |
|
Contents
To view a fund's proxy voting guidelines and proxy voting record for the 12-month period ended June 30, visit http://www.fidelity.com/proxyvotingresults or visit the Securities and Exchange Commission's (SEC) web site at http://www.sec.gov.
You may also call 1-800-544-8544 to request a free copy of the proxy voting guidelines.
Standard & Poor's, S&P and S&P 500 are registered service marks of The McGraw-Hill Companies, Inc. and have been licensed for use by Fidelity Distributors Corporation.
Other third-party marks appearing herein are the property of their respective owners.
All other marks appearing herein are registered or unregistered trademarks or service marks of FMR LLC or an affiliated company. © 2018 FMR LLC. All rights reserved.
This report and the financial statements contained herein are submitted for the general information of the shareholders of the Fund. This report is not authorized for distribution to prospective investors in the Fund unless preceded or accompanied by an effective prospectus.
A fund files its complete schedule of portfolio holdings with the SEC for the first and third quarters of each fiscal year on Form N-Q. Forms N-Q are available on the SEC’s web site at http://www.sec.gov. A fund's Forms N-Q may be reviewed and copied at the SEC’s Public Reference Room in Washington, DC. Information regarding the operation of the SEC's Public Reference Room may be obtained by calling 1-800-SEC-0330.
For a complete list of a fund's portfolio holdings, view the most recent holdings listing, semiannual report, or annual report on Fidelity's web site at http://www.fidelity.com, http://www.institutional.fidelity.com, or http://www.401k.com, as applicable.
NOT FDIC INSURED •MAY LOSE VALUE •NO BANK GUARANTEE
Neither the Fund nor Fidelity Distributors Corporation is a bank.
Investment Summary (Unaudited)
Geographic Diversification (% of fund's net assets)
| As of April 30, 2018 | ||
| Japan | 22.3% | |
| United Kingdom | 16.8% | |
| France | 15.4% | |
| Germany | 9.3% | |
| Switzerland | 8.5% | |
| Spain | 4.2% | |
| Australia | 3.6% | |
| Sweden | 3.4% | |
| Netherlands | 3.1% | |
| Other* | 13.4% | |
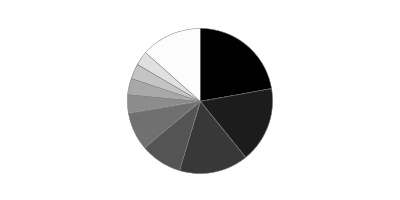
* Includes Short-Term investments and Net Other Assets (Liabilities).
Percentages are based on country or territory of incorporation and are adjusted for the effect of futures contracts, if applicable.
Asset Allocation as of April 30, 2018
| % of fund's net assets | |
| Stocks | 99.2 |
| Short-Term Investments and Net Other Assets (Liabilities) | 0.8 |
Top Ten Stocks as of April 30, 2018
| % of fund's net assets | |
| Total SA (France, Oil, Gas & Consumable Fuels) | 3.1 |
| Novartis AG (Switzerland, Pharmaceuticals) | 2.7 |
| BP PLC (United Kingdom, Oil, Gas & Consumable Fuels) | 2.4 |
| Banco Santander SA (Spain) (Spain, Banks) | 2.3 |
| Royal Dutch Shell PLC Class B sponsored ADR (United Kingdom, Oil, Gas & Consumable Fuels) | 2.0 |
| Mitsubishi UFJ Financial Group, Inc. (Japan, Banks) | 1.8 |
| BASF AG (Germany, Chemicals) | 1.8 |
| Commonwealth Bank of Australia (Australia, Banks) | 1.7 |
| Sanofi SA (France, Pharmaceuticals) | 1.7 |
| Honda Motor Co. Ltd. (Japan, Automobiles) | 1.6 |
| 21.1 |
Top Market Sectors as of April 30, 2018
| % of fund's net assets | |
| Financials | 39.4 |
| Industrials | 12.3 |
| Energy | 10.7 |
| Health Care | 9.1 |
| Consumer Discretionary | 7.6 |
| Materials | 7.2 |
| Information Technology | 4.7 |
| Consumer Staples | 4.0 |
| Telecommunication Services | 2.4 |
| Real Estate | 1.8 |
Schedule of Investments April 30, 2018 (Unaudited)
Showing Percentage of Net Assets
| Common Stocks - 98.0% | |||
| Shares | Value | ||
| Australia - 3.6% | |||
| Commonwealth Bank of Australia | 161,596 | $8,701,045 | |
| Insurance Australia Group Ltd. | 611,235 | 3,618,462 | |
| Macquarie Group Ltd. | 51,561 | 4,199,039 | |
| Magellan Financial Group Ltd. | 97,596 | 1,705,048 | |
| TOTAL AUSTRALIA | 18,223,594 | ||
| Austria - 1.0% | |||
| Erste Group Bank AG | 101,700 | 4,986,205 | |
| Bailiwick of Jersey - 0.6% | |||
| Wolseley PLC | 42,845 | 3,291,347 | |
| Belgium - 1.3% | |||
| KBC Groep NV | 78,227 | 6,839,405 | |
| Canada - 0.4% | |||
| Nutrien Ltd. | 48,080 | 2,188,774 | |
| Finland - 0.9% | |||
| Sampo Oyj (A Shares) | 85,034 | 4,595,246 | |
| France - 15.4% | |||
| Accor SA | 49,800 | 2,818,691 | |
| Atos Origin SA | 37,457 | 5,061,581 | |
| AXA SA | 283,221 | 8,099,740 | |
| Bouygues SA (a) | 68,227 | 3,481,017 | |
| Capgemini SA | 33,893 | 4,665,927 | |
| Compagnie de St. Gobain | 51,000 | 2,678,753 | |
| Natixis SA | 547,000 | 4,499,716 | |
| Sanofi SA | 107,421 | 8,492,954 | |
| Societe Generale Series A | 141,500 | 7,744,123 | |
| SR Teleperformance SA | 25,000 | 4,012,251 | |
| Total SA (a) | 249,811 | 15,701,056 | |
| VINCI SA (a) | 69,200 | 6,918,872 | |
| Vivendi SA | 159,792 | 4,224,000 | |
| TOTAL FRANCE | 78,398,681 | ||
| Germany - 8.5% | |||
| BASF AG | 89,929 | 9,356,526 | |
| Brenntag AG | 44,600 | 2,559,378 | |
| Deutsche Post AG | 80,112 | 3,477,217 | |
| Deutsche Telekom AG | 369,300 | 6,464,087 | |
| Fresenius SE & Co. KGaA | 27,300 | 2,088,160 | |
| Hannover Reuck SE | 31,600 | 4,449,475 | |
| HeidelbergCement Finance AG | 25,800 | 2,531,743 | |
| Linde AG | 15,400 | 3,422,785 | |
| SAP SE | 28,531 | 3,169,956 | |
| Vonovia SE | 111,565 | 5,605,944 | |
| TOTAL GERMANY | 43,125,271 | ||
| Hong Kong - 0.4% | |||
| AIA Group Ltd. | 231,600 | 2,069,856 | |
| India - 0.1% | |||
| PC Jeweller Ltd. | 121,614 | 263,293 | |
| Indonesia - 0.3% | |||
| PT Bank Rakyat Indonesia Tbk | 6,527,200 | 1,504,967 | |
| Ireland - 0.8% | |||
| Allergan PLC | 6,480 | 995,652 | |
| CRH PLC | 91,785 | 3,259,415 | |
| TOTAL IRELAND | 4,255,067 | ||
| Italy - 2.9% | |||
| Assicurazioni Generali SpA | 188,800 | 3,816,634 | |
| Intesa Sanpaolo SpA | 2,001,900 | 7,615,143 | |
| Mediobanca SpA | 280,743 | 3,412,289 | |
| TOTAL ITALY | 14,844,066 | ||
| Japan - 22.3% | |||
| AEON Financial Service Co. Ltd. | 88,400 | 2,074,958 | |
| East Japan Railway Co. | 30,100 | 2,888,300 | |
| Honda Motor Co. Ltd. | 236,200 | 8,121,964 | |
| Hoya Corp. | 49,500 | 2,654,308 | |
| Idemitsu Kosan Co. Ltd. | 58,300 | 2,285,177 | |
| Itochu Corp. | 325,400 | 6,530,622 | |
| Japan Tobacco, Inc. | 107,400 | 2,884,926 | |
| Kao Corp. | 47,000 | 3,377,104 | |
| Makita Corp. | 80,400 | 3,618,441 | |
| Mitsubishi UFJ Financial Group, Inc. | 1,412,100 | 9,462,967 | |
| Mitsui Fudosan Co. Ltd. | 142,400 | 3,662,254 | |
| Nintendo Co. Ltd. | 6,000 | 2,521,059 | |
| Nomura Holdings, Inc. | 591,900 | 3,409,081 | |
| OBIC Co. Ltd. | 49,600 | 4,160,556 | |
| Olympus Corp. | 62,400 | 2,331,723 | |
| Oracle Corp. Japan | 30,200 | 2,486,279 | |
| ORIX Corp. | 340,800 | 5,997,980 | |
| Panasonic Corp. | 247,100 | 3,658,847 | |
| Recruit Holdings Co. Ltd. | 128,900 | 2,979,604 | |
| Shin-Etsu Chemical Co. Ltd. | 43,100 | 4,338,781 | |
| Shinsei Bank Ltd. | 184,600 | 2,884,164 | |
| SoftBank Corp. | 52,300 | 3,996,176 | |
| Sony Corp. | 65,400 | 3,054,580 | |
| Sony Financial Holdings, Inc. | 194,300 | 3,552,924 | |
| Subaru Corp. | 107,300 | 3,611,020 | |
| Sumitomo Mitsui Financial Group, Inc. | 148,400 | 6,185,055 | |
| T&D Holdings, Inc. | 203,800 | 3,465,644 | |
| Taiheiyo Cement Corp. | 66,600 | 2,525,220 | |
| Tokio Marine Holdings, Inc. | 111,400 | 5,270,406 | |
| TOTAL JAPAN | 113,990,120 | ||
| Netherlands - 3.1% | |||
| ING Groep NV (Certificaten Van Aandelen) | 404,590 | 6,817,553 | |
| Koninklijke Philips Electronics NV | 66,600 | 2,818,927 | |
| RELX NV | 130,274 | 2,771,172 | |
| Wolters Kluwer NV | 64,755 | 3,505,623 | |
| TOTAL NETHERLANDS | 15,913,275 | ||
| Norway - 1.4% | |||
| Statoil ASA (a) | 280,776 | 7,180,203 | |
| Portugal - 0.7% | |||
| Galp Energia SGPS SA Class B | 174,989 | 3,363,106 | |
| Spain - 3.8% | |||
| Banco Santander SA (Spain) | 1,829,021 | 11,867,484 | |
| CaixaBank SA | 918,497 | 4,466,535 | |
| Masmovil Ibercom SA (b) | 10,585 | 1,528,781 | |
| Unicaja Banco SA | 790,500 | 1,432,866 | |
| TOTAL SPAIN | 19,295,666 | ||
| Sweden - 3.4% | |||
| Alfa Laval AB (a) | 117,500 | 2,921,180 | |
| Investor AB (B Shares) | 79,769 | 3,489,862 | |
| Nordea Bank AB | 628,200 | 6,412,100 | |
| Swedbank AB (A Shares) | 197,742 | 4,312,018 | |
| TOTAL SWEDEN | 17,135,160 | ||
| Switzerland - 8.5% | |||
| Credit Suisse Group AG | 316,761 | 5,342,568 | |
| Lafargeholcim Ltd. (Reg.) | 51,790 | 2,893,133 | |
| Nestle SA (Reg. S) | 88,219 | 6,834,334 | |
| Novartis AG | 180,618 | 13,902,947 | |
| UBS Group AG | 475,758 | 7,992,734 | |
| Zurich Insurance Group AG | 20,650 | 6,596,344 | |
| TOTAL SWITZERLAND | 43,562,060 | ||
| United Kingdom - 16.8% | |||
| AstraZeneca PLC (United Kingdom) | 78,217 | 5,475,376 | |
| Aviva PLC | 795,186 | 5,777,561 | |
| BAE Systems PLC | 484,367 | 4,063,949 | |
| BHP Billiton PLC | 308,244 | 6,572,511 | |
| BP PLC | 1,616,622 | 12,008,213 | |
| British American Tobacco PLC (United Kingdom) | 50,263 | 2,756,800 | |
| Bunzl PLC | 113,256 | 3,291,461 | |
| Compass Group PLC | 134,810 | 2,895,250 | |
| GlaxoSmithKline PLC | 162,276 | 3,254,797 | |
| HSBC Holdings PLC sponsored ADR (a) | 104,511 | 5,252,723 | |
| Imperial Tobacco Group PLC | 123,674 | 4,434,474 | |
| Informa PLC | 362,172 | 3,684,670 | |
| Liberty Global PLC Class A (b) | 80,800 | 2,435,312 | |
| Micro Focus International PLC | 110,204 | 1,900,262 | |
| Royal Dutch Shell PLC Class B sponsored ADR (a) | 142,200 | 10,298,124 | |
| Standard Chartered PLC (United Kingdom) | 401,299 | 4,237,432 | |
| Standard Life PLC | 828,794 | 4,168,076 | |
| The Weir Group PLC | 100,800 | 2,964,156 | |
| TOTAL UNITED KINGDOM | 85,471,147 | ||
| United States of America - 1.8% | |||
| Amgen, Inc. | 14,100 | 2,460,168 | |
| ConocoPhillips Co. | 56,600 | 3,707,300 | |
| S&P Global, Inc. | 15,700 | 2,961,020 | |
| TOTAL UNITED STATES OF AMERICA | 9,128,488 | ||
| TOTAL COMMON STOCKS | |||
| (Cost $481,827,536) | 499,624,997 | ||
| Nonconvertible Preferred Stocks - 1.2% | |||
| Germany - 0.8% | |||
| Porsche Automobil Holding SE (Germany) | 44,100 | 3,770,465 | |
| Spain - 0.4% | |||
| Grifols SA Class B | 105,400 | 2,172,543 | |
| TOTAL NONCONVERTIBLE PREFERRED STOCKS | |||
| (Cost $5,659,290) | 5,943,008 | ||
| Money Market Funds - 3.5% | |||
| Fidelity Cash Central Fund, 1.74% (c) | 1,388,297 | 1,388,574 | |
| Fidelity Securities Lending Cash Central Fund 1.74% (c)(d) | 16,605,019 | 16,606,680 | |
| TOTAL MONEY MARKET FUNDS | |||
| (Cost $17,996,204) | 17,995,254 | ||
| TOTAL INVESTMENT IN SECURITIES - 102.7% | |||
| (Cost $505,483,030) | 523,563,259 | ||
| NET OTHER ASSETS (LIABILITIES) - (2.7)% | (13,561,848) | ||
| NET ASSETS - 100% | $510,001,411 |
Categorizations in the Schedule of Investments are based on country or territory of incorporation.
Legend
(a) Security or a portion of the security is on loan at period end.
(b) Non-income producing
(c) Affiliated fund that is generally available only to investment companies and other accounts managed by Fidelity Investments. The rate quoted is the annualized seven-day yield of the fund at period end. A complete unaudited listing of the fund's holdings as of its most recent quarter end is available upon request. In addition, each Fidelity Central Fund's financial statements are available on the SEC's website or upon request.
(d) Investment made with cash collateral received from securities on loan.
Affiliated Central Funds
Information regarding fiscal year to date income earned by the Fund from investments in Fidelity Central Funds is as follows:
| Fund | Income earned |
| Fidelity Cash Central Fund | $27,982 |
| Fidelity Securities Lending Cash Central Fund | 135,870 |
| Total | $163,852 |
Amounts in the income column in the above table include any capital gain distributions from underlying funds, which are presented in the corresponding line-item in the Statement of Operations if applicable.
Investment Valuation
The following is a summary of the inputs used, as of April 30, 2018, involving the Fund's assets and liabilities carried at fair value. The inputs or methodology used for valuing securities may not be an indication of the risk associated with investing in those securities. For more information on valuation inputs, and their aggregation into the levels used below, please refer to the Investment Valuation section in the accompanying Notes to Financial Statements.
| Valuation Inputs at Reporting Date: | ||||
| Description | Total | Level 1 | Level 2 | Level 3 |
| Investments in Securities: | ||||
| Equities: | ||||
| Consumer Discretionary | $38,538,092 | $23,439,408 | $15,098,684 | $-- |
| Consumer Staples | 20,287,638 | 10,696,504 | 9,591,134 | -- |
| Energy | 54,543,179 | 19,653,707 | 34,889,472 | -- |
| Financials | 201,286,448 | 107,971,361 | 93,315,087 | -- |
| Health Care | 46,647,555 | 10,530,011 | 36,117,544 | -- |
| Industrials | 61,953,343 | 47,493,305 | 14,460,038 | -- |
| Information Technology | 23,965,620 | 16,374,343 | 7,591,277 | -- |
| Materials | 37,088,888 | 17,900,436 | 19,188,452 | -- |
| Real Estate | 9,268,198 | 9,268,198 | -- | -- |
| Telecommunication Services | 11,989,044 | 1,528,781 | 10,460,263 | -- |
| Money Market Funds | 17,995,254 | 17,995,254 | -- | -- |
| Total Investments in Securities: | $523,563,259 | $282,851,308 | $240,711,951 | $-- |
The following is a summary of transfers between Level 1 and Level 2 for the period ended April 30, 2018. Transfers are assumed to have occurred at the beginning of the period, and are primarily attributable to the valuation techniques used for foreign equity securities, as discussed in the accompanying Notes to Financial Statements:
| Transfers | Total |
| Level 1 to Level 2 | $40,634,663 |
| Level 2 to Level 1 | $55,635,630 |
See accompanying notes which are an integral part of the financial statements.
Financial Statements
Statement of Assets and Liabilities
| April 30, 2018 (Unaudited) | ||
| Assets | ||
| Investment in securities, at value (including securities loaned of $15,999,366) — See accompanying schedule: Unaffiliated issuers (cost $487,486,826) | $505,568,005 | |
| Fidelity Central Funds (cost $17,996,204) | 17,995,254 | |
| Total Investment in Securities (cost $505,483,030) | $523,563,259 | |
| Cash | 49,019 | |
| Foreign currency held at value (cost $111,775) | 111,268 | |
| Receivable for investments sold | 43 | |
| Receivable for fund shares sold | 79,400 | |
| Dividends receivable | 3,295,051 | |
| Distributions receivable from Fidelity Central Funds | 33,176 | |
| Prepaid expenses | 184 | |
| Other receivables | 49,475 | |
| Total assets | 527,180,875 | |
| Liabilities | ||
| Payable for fund shares redeemed | $132,277 | |
| Accrued management fee | 281,856 | |
| Distribution and service plan fees payable | 8,641 | |
| Other affiliated payables | 95,712 | |
| Other payables and accrued expenses | 51,466 | |
| Collateral on securities loaned | 16,609,512 | |
| Total liabilities | 17,179,464 | |
| Net Assets | $510,001,411 | |
| Net Assets consist of: | ||
| Paid in capital | $510,879,634 | |
| Undistributed net investment income | 5,128,885 | |
| Accumulated undistributed net realized gain (loss) on investments and foreign currency transactions | (24,033,566) | |
| Net unrealized appreciation (depreciation) on investments and assets and liabilities in foreign currencies | 18,026,458 | |
| Net Assets | $510,001,411 | |
| Calculation of Maximum Offering Price | ||
| Class A: | ||
| Net Asset Value and redemption price per share ($8,724,675 ÷ 962,249 shares) | $9.07 | |
| Maximum offering price per share (100/94.25 of $9.07) | $9.62 | |
| Class M: | ||
| Net Asset Value and redemption price per share ($4,305,274 ÷ 475,184 shares) | $9.06 | |
| Maximum offering price per share (100/96.50 of $9.06) | $9.39 | |
| Class C: | ||
| Net Asset Value and offering price per share ($6,052,620 ÷ 669,045 shares)(a) | $9.05 | |
| International Value: | ||
| Net Asset Value, offering price and redemption price per share ($483,498,635 ÷ 53,369,856 shares) | $9.06 | |
| Class I: | ||
| Net Asset Value, offering price and redemption price per share ($7,420,207 ÷ 817,842 shares) | $9.07 |
(a) Redemption price per share is equal to net asset value less any applicable contingent deferred sales charge.
See accompanying notes which are an integral part of the financial statements.
Statement of Operations
| Six months ended April 30, 2018 (Unaudited) | ||
| Investment Income | ||
| Dividends | $8,930,901 | |
| Income from Fidelity Central Funds | 163,852 | |
| Income before foreign taxes withheld | 9,094,753 | |
| Less foreign taxes withheld | (821,910) | |
| Total income | 8,272,843 | |
| Expenses | ||
| Management fee | ||
| Basic fee | $1,867,466 | |
| Performance adjustment | (82,606) | |
| Transfer agent fees | 444,006 | |
| Distribution and service plan fees | 50,263 | |
| Accounting and security lending fees | 138,893 | |
| Custodian fees and expenses | 47,212 | |
| Independent trustees' fees and expenses | 998 | |
| Registration fees | 74,754 | |
| Audit | 33,244 | |
| Legal | 1,005 | |
| Interest | 1,357 | |
| Miscellaneous | 1,394 | |
| Total expenses before reductions | 2,577,986 | |
| Expense reductions | (84,818) | 2,493,168 |
| Net investment income (loss) | 5,779,675 | |
| Realized and Unrealized Gain (Loss) | ||
| Net realized gain (loss) on: | ||
| Investment securities: | ||
| Unaffiliated issuers | 18,442,253 | |
| Fidelity Central Funds | (1,882) | |
| Foreign currency transactions | 78,186 | |
| Total net realized gain (loss) | 18,518,557 | |
| Change in net unrealized appreciation (depreciation) on: | ||
| Investment securities: | ||
| Unaffiliated issuers | (17,266,041) | |
| Fidelity Central Funds | (937) | |
| Assets and liabilities in foreign currencies | (41,611) | |
| Total change in net unrealized appreciation (depreciation) | (17,308,589) | |
| Net gain (loss) | 1,209,968 | |
| Net increase (decrease) in net assets resulting from operations | $6,989,643 |
See accompanying notes which are an integral part of the financial statements.
Statement of Changes in Net Assets
| Six months ended April 30, 2018 (Unaudited) | Year ended October 31, 2017 | |
| Increase (Decrease) in Net Assets | ||
| Operations | ||
| Net investment income (loss) | $5,779,675 | $8,130,796 |
| Net realized gain (loss) | 18,518,557 | 518,118 |
| Change in net unrealized appreciation (depreciation) | (17,308,589) | 54,057,696 |
| Net increase (decrease) in net assets resulting from operations | 6,989,643 | 62,706,610 |
| Distributions to shareholders from net investment income | (8,139,842) | (8,124,122) |
| Distributions to shareholders from net realized gain | (850,252) | (457,331) |
| Total distributions | (8,990,094) | (8,581,453) |
| Share transactions - net increase (decrease) | 129,194,756 | 1,925,222 |
| Redemption fees | 12,458 | 1,612 |
| Total increase (decrease) in net assets | 127,206,763 | 56,051,991 |
| Net Assets | ||
| Beginning of period | 382,794,648 | 326,742,657 |
| End of period | $510,001,411 | $382,794,648 |
| Other Information | ||
| Undistributed net investment income end of period | $5,128,885 | $7,489,052 |
See accompanying notes which are an integral part of the financial statements.
Financial Highlights
Fidelity International Value Fund Class A
| Six months ended (Unaudited) April 30, | Years endedOctober 31, | |||||
| 2018 | 2017 | 2016 | 2015 | 2014 | 2013 | |
| Selected Per–Share Data | ||||||
| Net asset value, beginning of period | $9.08 | $7.78 | $8.27 | $8.62 | $8.96 | $7.39 |
| Income from Investment Operations | ||||||
| Net investment income (loss)A | .08 | .17 | .17 | .13 | .31B | .17 |
| Net realized and unrealized gain (loss) | .03 | 1.31 | (.57) | (.20) | (.47) | 1.64 |
| Total from investment operations | .11 | 1.48 | (.40) | (.07) | (.16) | 1.81 |
| Distributions from net investment income | (.10) | (.17) | (.09) | (.28) | (.17) | (.20) |
| Distributions from net realized gain | (.01) | (.01) | – | – | (.01) | (.04) |
| Total distributions | (.12)C | (.18) | (.09) | (.28) | (.18) | (.24) |
| Redemption fees added to paid in capitalA,D | – | – | – | – | – | – |
| Net asset value, end of period | $9.07 | $9.08 | $7.78 | $8.27 | $8.62 | $8.96 |
| Total ReturnE,F,G | 1.19% | 19.36% | (4.91)% | (.81)% | (1.76)% | 25.24% |
| Ratios to Average Net AssetsH,I | ||||||
| Expenses before reductions | 1.26%J | 1.33% | 1.40% | 1.37% | 1.32% | 1.39% |
| Expenses net of fee waivers, if any | 1.26%J | 1.33% | 1.40% | 1.37% | 1.32% | 1.39% |
| Expenses net of all reductions | 1.23%J | 1.32% | 1.39% | 1.36% | 1.32% | 1.36% |
| Net investment income (loss) | 1.83%J | 2.01% | 2.19% | 1.58% | 3.44%B | 2.08% |
| Supplemental Data | ||||||
| Net assets, end of period (000 omitted) | $8,725 | $8,151 | $7,717 | $8,956 | $6,296 | $6,191 |
| Portfolio turnover rateK | 66%J | 50% | 47% | 44% | 69% | 79% |
A Calculated based on average shares outstanding during the period.
B Net Investment income per share reflects a large, non-recurring dividend which amounted to $.14 per share. Excluding this non-recurring dividend, the ratio of net investment income (loss) to average net assets would have been 1.90%.
C Total distributions of $.12 per share is comprised of distributions from net investment income of $.102 and distributions from net realized gain of $.014 per share.
D Amount represents less than $.005 per share.
E Total returns for periods of less than one year are not annualized.
F Total returns would have been lower if certain expenses had not been reduced during the applicable periods shown.
G Total returns do not include the effect of the sales charges.
H Fees and expenses of any underlying Fidelity Central Funds are not included in the Fund's expense ratio. The Fund indirectly bears its proportionate share of the expenses of any underlying Fidelity Central Funds.
I Expense ratios reflect operating expenses of the class. Expenses before reductions do not reflect amounts reimbursed by the investment adviser or reductions from brokerage service arrangements or reductions from other expense offset arrangements and do not represent the amount paid by the class during periods when reimbursements or reductions occur. Expenses net of fee waivers reflect expenses after reimbursement by the investment adviser but prior to reductions from brokerage service arrangements or other expense offset arrangements. Expenses net of all reductions represent the net expenses paid by the class.
J Annualized
K Amount does not include the portfolio activity of any underlying Fidelity Central Funds.
See accompanying notes which are an integral part of the financial statements.
Fidelity International Value Fund Class M
| Six months ended (Unaudited) April 30, | Years endedOctober 31, | |||||
| 2018 | 2017 | 2016 | 2015 | 2014 | 2013 | |
| Selected Per–Share Data | ||||||
| Net asset value, beginning of period | $9.06 | $7.76 | $8.25 | $8.60 | $8.94 | $7.38 |
| Income from Investment Operations | ||||||
| Net investment income (loss)A | .07 | .14 | .15 | .11 | .28B | .15 |
| Net realized and unrealized gain (loss) | .02 | 1.31 | (.58) | (.20) | (.46) | 1.64 |
| Total from investment operations | .09 | 1.45 | (.43) | (.09) | (.18) | 1.79 |
| Distributions from net investment income | (.08) | (.14) | (.06) | (.26) | (.15) | (.19) |
| Distributions from net realized gain | (.01) | (.01) | – | – | (.01) | (.04) |
| Total distributions | (.09) | (.15) | (.06) | (.26) | (.16) | (.23) |
| Redemption fees added to paid in capitalA,C | – | – | – | – | – | – |
| Net asset value, end of period | $9.06 | $9.06 | $7.76 | $8.25 | $8.60 | $8.94 |
| Total ReturnD,E,F | 1.00% | 19.04% | (5.24)% | (1.09)% | (1.99)% | 24.86% |
| Ratios to Average Net AssetsG,H | ||||||
| Expenses before reductions | 1.59%I | 1.64% | 1.70% | 1.66% | 1.59% | 1.66% |
| Expenses net of fee waivers, if any | 1.59%I | 1.64% | 1.70% | 1.66% | 1.59% | 1.65% |
| Expenses net of all reductions | 1.56%I | 1.63% | 1.69% | 1.65% | 1.59% | 1.63% |
| Net investment income (loss) | 1.50%I | 1.70% | 1.89% | 1.29% | 3.17%B | 1.81% |
| Supplemental Data | ||||||
| Net assets, end of period (000 omitted) | $4,305 | $4,181 | $3,703 | $4,086 | $3,604 | $3,758 |
| Portfolio turnover rateJ | 66%I | 50% | 47% | 44% | 69% | 79% |
A Calculated based on average shares outstanding during the period.
B Net Investment income per share reflects a large, non-recurring dividend which amounted to $.14 per share. Excluding this non-recurring dividend, the ratio of net investment income (loss) to average net assets would have been 1.64%.
C Amount represents less than $.005 per share.
D Total returns for periods of less than one year are not annualized.
E Total returns would have been lower if certain expenses had not been reduced during the applicable periods shown.
F Total returns do not include the effect of the sales charges.
G Fees and expenses of any underlying Fidelity Central Funds are not included in the Fund's expense ratio. The Fund indirectly bears its proportionate share of the expenses of any underlying Fidelity Central Funds.
H Expense ratios reflect operating expenses of the class. Expenses before reductions do not reflect amounts reimbursed by the investment adviser or reductions from brokerage service arrangements or reductions from other expense offset arrangements and do not represent the amount paid by the class during periods when reimbursements or reductions occur. Expenses net of fee waivers reflect expenses after reimbursement by the investment adviser but prior to reductions from brokerage service arrangements or other expense offset arrangements. Expenses net of all reductions represent the net expenses paid by the class.
I Annualized
J Amount does not include the portfolio activity of any underlying Fidelity Central Funds.
See accompanying notes which are an integral part of the financial statements.
Fidelity International Value Fund Class C
| Six months ended (Unaudited) April 30, | Years endedOctober 31, | |||||
| 2018 | 2017 | 2016 | 2015 | 2014 | 2013 | |
| Selected Per–Share Data | ||||||
| Net asset value, beginning of period | $9.04 | $7.75 | $8.23 | $8.59 | $8.93 | $7.38 |
| Income from Investment Operations | ||||||
| Net investment income (loss)A | .05 | .10 | .11 | .07 | .24B | .11 |
| Net realized and unrealized gain (loss) | .02 | 1.31 | (.57) | (.20) | (.45) | 1.63 |
| Total from investment operations | .07 | 1.41 | (.46) | (.13) | (.21) | 1.74 |
| Distributions from net investment income | (.04) | (.11) | (.02) | (.23) | (.11) | (.15) |
| Distributions from net realized gain | (.01) | (.01) | – | – | (.01) | (.04) |
| Total distributions | (.06)C | (.12) | (.02) | (.23) | (.13)D | (.19) |
| Redemption fees added to paid in capitalA,E | – | – | – | – | – | – |
| Net asset value, end of period | $9.05 | $9.04 | $7.75 | $8.23 | $8.59 | $8.93 |
| Total ReturnF,G,H | .74% | 18.41% | (5.61)% | (1.58)% | (2.43)% | 24.17% |
| Ratios to Average Net AssetsI,J | ||||||
| Expenses before reductions | 2.08%K | 2.12% | 2.17% | 2.15% | 2.07% | 2.14% |
| Expenses net of fee waivers, if any | 2.08%K | 2.12% | 2.17% | 2.14% | 2.07% | 2.14% |
| Expenses net of all reductions | 2.05%K | 2.11% | 2.17% | 2.14% | 2.07% | 2.11% |
| Net investment income (loss) | 1.02%K | 1.22% | 1.42% | .81% | 2.69%B | 1.33% |
| Supplemental Data | ||||||
| Net assets, end of period (000 omitted) | $6,053 | $5,171 | $4,168 | $4,502 | $3,647 | $3,231 |
| Portfolio turnover rateL | 66%K | 50% | 47% | 44% | 69% | 79% |
A Calculated based on average shares outstanding during the period.
B Net Investment income per share reflects a large, non-recurring dividend which amounted to $.14 per share. Excluding this non-recurring dividend, the ratio of net investment income (loss) to average net assets would have been 1.15%.
C Total distributions of $.06 per share is comprised of distributions from net investment income of $.042 and distributions from net realized gain of $.014 per share.
D Total distributions of $.13 per share is comprised of distributions from net investment income of $.111 and distributions from net realized gain of $.014 per share.
E Amount represents less than $.005 per share.
F Total returns for periods of less than one year are not annualized.
G Total returns would have been lower if certain expenses had not been reduced during the applicable periods shown.
H Total returns do not include the effect of the contingent deferred sales charge.
I Fees and expenses of any underlying Fidelity Central Funds are not included in the Fund's expense ratio. The Fund indirectly bears its proportionate share of the expenses of any underlying Fidelity Central Funds.
J Expense ratios reflect operating expenses of the class. Expenses before reductions do not reflect amounts reimbursed by the investment adviser or reductions from brokerage service arrangements or reductions from other expense offset arrangements and do not represent the amount paid by the class during periods when reimbursements or reductions occur. Expenses net of fee waivers reflect expenses after reimbursement by the investment adviser but prior to reductions from brokerage service arrangements or other expense offset arrangements. Expenses net of all reductions represent the net expenses paid by the class.
K Annualized
L Amount does not include the portfolio activity of any underlying Fidelity Central Funds.
See accompanying notes which are an integral part of the financial statements.
Fidelity International Value Fund
| Six months ended (Unaudited) April 30, | Years endedOctober 31, | |||||
| 2018 | 2017 | 2016 | 2015 | 2014 | 2013 | |
| Selected Per–Share Data | ||||||
| Net asset value, beginning of period | $9.09 | $7.79 | $8.29 | $8.64 | $8.97 | $7.40 |
| Income from Investment Operations | ||||||
| Net investment income (loss)A | .10 | .20 | .20 | .16 | .34B | .19 |
| Net realized and unrealized gain (loss) | .02 | 1.31 | (.58) | (.19) | (.46) | 1.65 |
| Total from investment operations | .12 | 1.51 | (.38) | (.03) | (.12) | 1.84 |
| Distributions from net investment income | (.14) | (.20) | (.12) | (.32) | (.20) | (.22) |
| Distributions from net realized gain | (.01) | (.01) | – | – | (.01) | (.04) |
| Total distributions | (.15) | (.21) | (.12) | (.32) | (.21) | (.27)C |
| Redemption fees added to paid in capitalA,D | – | – | – | – | – | – |
| Net asset value, end of period | $9.06 | $9.09 | $7.79 | $8.29 | $8.64 | $8.97 |
| Total ReturnE,F | 1.35% | 19.83% | (4.69)% | (.41)% | (1.34)% | 25.57% |
| Ratios to Average Net AssetsG,H | ||||||
| Expenses before reductions | .93%I | .97% | 1.03% | 1.02% | .96% | 1.05% |
| Expenses net of fee waivers, if any | .93%I | .97% | 1.03% | 1.02% | .96% | 1.05% |
| Expenses net of all reductions | .90%I | .96% | 1.03% | 1.01% | .95% | 1.02% |
| Net investment income (loss) | 2.16%I | 2.36% | 2.56% | 1.93% | 3.80%B | 2.41% |
| Supplemental Data | ||||||
| Net assets, end of period (000 omitted) | $483,499 | $359,770 | $309,199 | $267,567 | $192,789 | $181,568 |
| Portfolio turnover rateJ | 66%I | 50% | 47% | 44% | 69% | 79% |
A Calculated based on average shares outstanding during the period.
B Net Investment income per share reflects a large, non-recurring dividend which amounted to $.14 per share. Excluding this non-recurring dividend, the ratio of net investment income (loss) to average net assets would have been 2.27%.
C Total distributions of $.27 per share is comprised of distributions from net investment income of $.223 and distributions from net realized gain of $.042 per share.
D Amount represents less than $.005 per share.
E Total returns for periods of less than one year are not annualized.
F Total returns would have been lower if certain expenses had not been reduced during the applicable periods shown.
G Fees and expenses of any underlying Fidelity Central Funds are not included in the Fund's expense ratio. The Fund indirectly bears its proportionate share of the expenses of any underlying Fidelity Central Funds.
H Expense ratios reflect operating expenses of the class. Expenses before reductions do not reflect amounts reimbursed by the investment adviser or reductions from brokerage service arrangements or reductions from other expense offset arrangements and do not represent the amount paid by the class during periods when reimbursements or reductions occur. Expenses net of fee waivers reflect expenses after reimbursement by the investment adviser but prior to reductions from brokerage service arrangements or other expense offset arrangements. Expenses net of all reductions represent the net expenses paid by the class.
I Annualized
J Amount does not include the portfolio activity of any underlying Fidelity Central Funds.
See accompanying notes which are an integral part of the financial statements.
Fidelity International Value Fund Class I
| Six months ended (Unaudited) April 30, | Years endedOctober 31, | |||||
| 2018 | 2017 | 2016 | 2015 | 2014 | 2013 | |
| Selected Per–Share Data | ||||||
| Net asset value, beginning of period | $9.10 | $7.80 | $8.29 | $8.65 | $8.98 | $7.41 |
| Income from Investment Operations | ||||||
| Net investment income (loss)A | .09 | .19 | .19 | .15 | .33B | .19 |
| Net realized and unrealized gain (loss) | .02 | 1.31 | (.58) | (.19) | (.45) | 1.65 |
| Total from investment operations | .11 | 1.50 | (.39) | (.04) | (.12) | 1.84 |
| Distributions from net investment income | (.13) | (.19) | (.10) | (.32) | (.19) | (.23) |
| Distributions from net realized gain | (.01) | (.01) | – | – | (.01) | (.04) |
| Total distributions | (.14) | (.20) | (.10) | (.32) | (.21)C | (.27) |
| Redemption fees added to paid in capitalA,D | – | – | – | – | – | – |
| Net asset value, end of period | $9.07 | $9.10 | $7.80 | $8.29 | $8.65 | $8.98 |
| Total ReturnE,F | 1.23% | 19.68% | (4.81)% | (.53)% | (1.41)% | 25.64% |
| Ratios to Average Net AssetsG,H | ||||||
| Expenses before reductions | 1.01%I | 1.10% | 1.17% | 1.14% | 1.05% | 1.07% |
| Expenses net of fee waivers, if any | 1.01%I | 1.10% | 1.17% | 1.14% | 1.05% | 1.07% |
| Expenses net of all reductions | .98%I | 1.09% | 1.16% | 1.13% | 1.04% | 1.04% |
| Net investment income (loss) | 2.08%I | 2.23% | 2.42% | 1.81% | 3.71%B | 2.39% |
| Supplemental Data | ||||||
| Net assets, end of period (000 omitted) | $7,420 | $5,523 | $1,955 | $1,969 | $1,310 | $239 |
| Portfolio turnover rateJ | 66%I | 50% | 47% | 44% | 69% | 79% |
A Calculated based on average shares outstanding during the period.
B Net Investment income per share reflects a large, non-recurring dividend which amounted to $.14 per share. Excluding this non-recurring dividend, the ratio of net investment income (loss) to average net assets would have been 2.18%.
C Total distributions of $.21 per share is comprised of distributions from net investment income of $.191 and distributions from net realized gain of $.014 per share.
D Amount represents less than $.005 per share.
E Total returns for periods of less than one year are not annualized.
F Total returns would have been lower if certain expenses had not been reduced during the applicable periods shown.
G Fees and expenses of any underlying Fidelity Central Funds are not included in the Fund's expense ratio. The Fund indirectly bears its proportionate share of the expenses of any underlying Fidelity Central Funds.
H Expense ratios reflect operating expenses of the class. Expenses before reductions do not reflect amounts reimbursed by the investment adviser or reductions from brokerage service arrangements or reductions from other expense offset arrangements and do not represent the amount paid by the class during periods when reimbursements or reductions occur. Expenses net of fee waivers reflect expenses after reimbursement by the investment adviser but prior to reductions from brokerage service arrangements or other expense offset arrangements. Expenses net of all reductions represent the net expenses paid by the class.
I Annualized
J Amount does not include the portfolio activity of any underlying Fidelity Central Funds.
See accompanying notes which are an integral part of the financial statements.
Notes to Financial Statements (Unaudited)
For the period ended April 30, 2018
1. Organization.
Fidelity International Value Fund (the Fund) is a fund of Fidelity Investment Trust (the Trust) and is authorized to issue an unlimited number of shares. The Trust is registered under the Investment Company Act of 1940, as amended (the 1940 Act), as an open-end management investment company organized as a Massachusetts business trust. The Fund offers Class A, Class M, Class C, International Value, and Class I shares, each of which has equal rights as to assets and voting privileges. Each class has exclusive voting rights with respect to matters that affect that class.
2. Investments in Fidelity Central Funds.
The Fund invests in Fidelity Central Funds, which are open-end investment companies generally available only to other investment companies and accounts managed by the investment adviser and its affiliates. The Fund's Schedule of Investments lists each of the Fidelity Central Funds held as of period end, if any, as an investment of the Fund, but does not include the underlying holdings of each Fidelity Central Fund. As an Investing Fund, the Fund indirectly bears its proportionate share of the expenses of the underlying Fidelity Central Funds.
The Money Market Central Funds seek preservation of capital and current income and are managed by Fidelity Investments Money Management, Inc. (FIMM), an affiliate of the investment adviser. Annualized expenses of the Money Market Central Funds as of their most recent shareholder report date are less than .005%.
A complete unaudited list of holdings for each Fidelity Central Fund is available upon request or at the Securities and Exchange Commission (the SEC) website at www.sec.gov. In addition, the financial statements of the Fidelity Central Funds are available on the SEC website or upon request.
3. Significant Accounting Policies.
The Fund is an investment company and applies the accounting and reporting guidance of the Financial Accounting Standards Board (FASB) Accounting Standards Codification Topic 946 Financial Services – Investments Companies. The financial statements have been prepared in conformity with accounting principles generally accepted in the United States of America (GAAP), which require management to make certain estimates and assumptions at the date of the financial statements. Actual results could differ from those estimates. Subsequent events, if any, through the date that the financial statements were issued have been evaluated in the preparation of the financial statements. The following summarizes the significant accounting policies of the Fund:
Investment Valuation. Investments are valued as of 4:00 p.m. Eastern time on the last calendar day of the period. The Board of Trustees (the Board) has delegated the day to day responsibility for the valuation of the Fund's investments to the Fair Value Committee (the Committee) established by the Fund's investment adviser. In accordance with valuation policies and procedures approved by the Board, the Fund attempts to obtain prices from one or more third party pricing vendors or brokers to value its investments. When current market prices, quotations or currency exchange rates are not readily available or reliable, investments will be fair valued in good faith by the Committee, in accordance with procedures adopted by the Board. Factors used in determining fair value vary by investment type and may include market or investment specific events. The frequency with which these procedures are used cannot be predicted and they may be utilized to a significant extent. The Committee oversees the Fund's valuation policies and procedures and reports to the Board on the Committee's activities and fair value determinations. The Board monitors the appropriateness of the procedures used in valuing the Fund's investments and ratifies the fair value determinations of the Committee.
The Fund categorizes the inputs to valuation techniques used to value its investments into a disclosure hierarchy consisting of three levels as shown below:
- Level 1 – quoted prices in active markets for identical investments
- Level 2 – other significant observable inputs (including quoted prices for similar investments, interest rates, prepayment speeds, etc.)
- Level 3 – unobservable inputs (including the Fund's own assumptions based on the best information available)
Valuation techniques used to value the Fund's investments by major category are as follows:
Equity securities, including restricted securities, for which market quotations are readily available, are valued at the last reported sale price or official closing price as reported by a third party pricing vendor on the primary market or exchange on which they are traded and are categorized as Level 1 in the hierarchy. In the event there were no sales during the day or closing prices are not available, securities are valued at the last quoted bid price or may be valued using the last available price and are generally categorized as Level 2 in the hierarchy. For foreign equity securities, when market or security specific events arise, comparisons to the valuation of American Depositary Receipts (ADRs), futures contracts, Exchange-Traded Funds (ETFs) and certain indexes as well as quoted prices for similar securities may be used and would be categorized as Level 2 in the hierarchy. Utilizing these techniques may result in transfers between Level 1 and Level 2. For equity securities, including restricted securities, where observable inputs are limited, assumptions about market activity and risk are used and these securities may be categorized as Level 3 in the hierarchy.
Investments in open-end mutual funds, including the Fidelity Central Funds, are valued at their closing net asset value (NAV) each business day and are categorized as Level 1 in the hierarchy.
Changes in valuation techniques may result in transfers in or out of an assigned level within the disclosure hierarchy. The aggregate value of investments by input level as of April 30, 2018, including information on transfers between Levels 1 and 2, is included at the end of the Fund's Schedule of Investments.
Foreign Currency. The Fund may use foreign currency contracts to facilitate transactions in foreign-denominated securities. Gains and losses from these transactions may arise from changes in the value of the foreign currency or if the counterparties do not perform under the contracts' terms.
Foreign-denominated assets, including investment securities, and liabilities are translated into U.S. dollars at the exchange rates at period end. Purchases and sales of investment securities, income and dividends received and expenses denominated in foreign currencies are translated into U.S. dollars at the exchange rate in effect on the transaction date.
The effects of exchange rate fluctuations on investments are included with the net realized and unrealized gain (loss) on investment securities. Other foreign currency transactions resulting in realized and unrealized gain (loss) are disclosed separately.
Investment Transactions and Income. For financial reporting purposes, the Fund's investment holdings and NAV include trades executed through the end of the last business day of the period. The NAV per share for processing shareholder transactions is calculated as of the close of business of the New York Stock Exchange (NYSE), normally 4:00 p.m. Eastern time and includes trades executed through the end of the prior business day. Gains and losses on securities sold are determined on the basis of identified cost. Dividend income is recorded on the ex-dividend date, except for certain dividends from foreign securities where the ex-dividend date may have passed, which are recorded as soon as the Fund is informed of the ex-dividend date. Non-cash dividends included in dividend income, if any, are recorded at the fair market value of the securities received. Income and capital gain distributions from Fidelity Central Funds, if any, are recorded on the ex-dividend date. Certain distributions received by the Fund represent a return of capital or capital gain. The Fund determines the components of these distributions subsequent to the ex-dividend date, based upon receipt of tax filings or other correspondence relating to the underlying investment. These distributions are recorded as a reduction of cost of investments and/or as a realized gain. Investment income is recorded net of foreign taxes withheld where recovery of such taxes is uncertain.
Class Allocations and Expenses. Investment income, realized and unrealized capital gains and losses, common expenses of the Fund, and certain fund-level expense reductions, if any, are allocated daily on a pro-rata basis to each class based on the relative net assets of each class to the total net assets of the Fund. Each class differs with respect to transfer agent and distribution and service plan fees incurred. Certain expense reductions may also differ by class. For the reporting period, the allocated portion of income and expenses to each class as a percent of its average net assets may vary due to the timing of recording these transactions in relation to fluctuating net assets of the classes. Expenses directly attributable to a fund are charged to that fund. Expenses attributable to more than one fund are allocated among the respective funds on the basis of relative net assets or other appropriate methods. Expense estimates are accrued in the period to which they relate and adjustments are made when actual amounts are known.
Income Tax Information and Distributions to Shareholders. Each year, the Fund intends to qualify as a regulated investment company under Subchapter M of the Internal Revenue Code, including distributing substantially all of its taxable income and realized gains. As a result, no provision for U.S. Federal income taxes is required. The Fund files a U.S. federal tax return, in addition to state and local tax returns as required. The Fund's federal income tax returns are subject to examination by the Internal Revenue Service (IRS) for a period of three fiscal years after they are filed. State and local tax returns may be subject to examination for an additional fiscal year depending on the jurisdiction. Foreign taxes are provided for based on the Fund's understanding of the tax rules and rates that exist in the foreign markets in which it invests.
Distributions are declared and recorded on the ex-dividend date. Income and capital gain distributions are declared separately for each class. Income and capital gain distributions are determined in accordance with income tax regulations, which may differ from GAAP.
Capital accounts within the financial statements are adjusted for permanent book-tax differences. These adjustments have no impact on net assets or the results of operations. Capital accounts are not adjusted for temporary book-tax differences which will reverse in a subsequent period.
Book-tax differences are primarily due to foreign currency transactions, passive foreign investment companies (PFIC), partnerships, capital loss carryforwards, expiring capital loss carryforwards and losses deferred due to wash sales.
As of period end, the cost and unrealized appreciation (depreciation) in securities, and derivatives if applicable, for federal income tax purposes were as follows:
| Gross unrealized appreciation | $40,661,933 |
| Gross unrealized depreciation | (23,476,011) |
| Net unrealized appreciation (depreciation) | $17,185,922 |
| Tax cost | $506,377,337 |
Capital loss carryforwards are only available to offset future capital gains of the Fund to the extent provided by regulations and may be limited. Under the Regulated Investment Company Modernization Act of 2010 (the Act), the Fund is permitted to carry forward capital losses incurred in taxable years beginning after December 22, 2010 for an unlimited period and such capital losses are required to be used prior to any losses that expire. The capital loss carryforward information presented below, including any applicable limitation, is estimated as of prior fiscal period end and is subject to adjustment.
| Fiscal year of expiration | |
| 2018 | $(3,571,319) |
| 2019 | (31,368,797) |
| Total with expiration | $(34,940,116) |
| No expiration | |
| Short-term | $(1,634,534) |
| Long-term | (3,963,871) |
| Total no expiration | $(5,598,405) |
| Total capital loss carryforward | $(40,538,521) |
Short-Term Trading (Redemption) Fees. Shares held by investors in the Fund less than 30 days may have been subject to a redemption fee equal to 1.00% of the NAV of shares redeemed. All redemption fees, which reduce the proceeds of the shareholder redemption, are retained by the Fund and accounted for as an addition to paid in capital. In November 2017, the Board of Trustees approved the elimination of these redemption fees effective December 18, 2017.
4. Purchases and Sales of Investments.
Purchases and sales of securities other than short-term securities aggregated $297,485,811 and $171,311,209, respectively.
5. Fees and Other Transactions with Affiliates.
Management Fee. Fidelity Management & Research Company (the investment adviser) and its affiliates provide the Fund with investment management related services for which the Fund pays a monthly management fee. The management fee is the sum of an individual fund fee rate that is based on an annual rate of .45% of the Fund's average net assets and an annualized group fee rate that averaged .24% during the period. The group fee rate is based upon the average net assets of all the mutual funds advised by the investment adviser, including any mutual funds previously advised by the investment adviser that are currently advised by Fidelity SelectCo, LLC, an affiliate of the investment adviser. The group fee rate decreases as assets under management increase and increases as assets under management decrease. In addition, the management fee is subject to a performance adjustment (up to a maximum of +/- .20% of the Fund's average net assets over a 36 month performance period). The upward or downward adjustment to the management fee is based on the relative investment performance of International Value as compared to its benchmark index, the MSCI EAFE Value Index, over the same 36 month performance period. For the reporting period, the total annualized management fee rate, including the performance adjustment, was .66% of the Fund's average net assets. The performance adjustment included in the management fee rate may be higher or lower than the maximum performance adjustment rate due to the difference between the average net assets for the reporting and performance periods.
Distribution and Service Plan Fees. In accordance with Rule 12b-1 of the 1940 Act, the Fund has adopted separate Distribution and Service Plans for each class of shares. Certain classes pay Fidelity Distributors Corporation (FDC), an affiliate of the investment adviser, separate Distribution and Service Fees, each of which is based on an annual percentage of each class' average net assets. In addition, FDC may pay financial intermediaries for selling shares of the Fund and providing shareholder support services. For the period, the Distribution and Service Fee rates, total fees and amounts retained by FDC were as follows:
| Distribution Fee | Service Fee | Total Fees | Retained by FDC | |
| Class A | -% | .25% | $10,550 | $301 |
| Class M | .25% | .25% | 10,730 | 159 |
| Class C | .75% | .25% | 28,983 | 4,218 |
| $50,263 | $4,678 |
Sales Load. FDC may receive a front-end sales charge of up to 5.75% for selling Class A shares and 3.50% for selling Class M shares, some of which is paid to financial intermediaries for selling shares of the Fund. Depending on the holding period, FDC may receive contingent deferred sales charges levied on Class A, Class M and Class C redemptions. The deferred sales charges are 1.00% for Class C shares, 1.00% for certain purchases of Class A shares and .25% for certain purchases of Class M shares.
For the period, sales charge amounts retained by FDC were as follows:
| Retained by FDC | |
| Class A | $3,040 |
| Class M | 836 |
| Class C(a) | 81 |
| $3,957 |
(a) When Class C shares are initially sold, FDC pays commissions from its own resources to financial intermediaries through which the sales are made.
Transfer Agent Fees. Fidelity Investments Institutional Operations Company, Inc., (FIIOC), an affiliate of the investment adviser, is the transfer, dividend disbursing and shareholder servicing agent for each class of the Fund. FIIOC receives account fees and asset-based fees that vary according to the account size and type of account of the shareholders of the respective classes of the Fund. FIIOC pays for typesetting, printing and mailing of shareholder reports, except proxy statements.
For the period, transfer agent fees for each class were as follows:
| Amount | % of Class-Level Average Net Assets(a) | |
| Class A | $10,247 | .24 |
| Class M | 6,929 | .32 |
| Class C | 8,819 | .30 |
| International Value | 410,246 | .16 |
| Class I | 7,765 | .24 |
| $444,006 |
(a) Annualized
Accounting and Security Lending Fees. Fidelity Service Company, Inc. (FSC), an affiliate of the investment adviser, maintains the Fund's accounting records. The accounting fee is based on the level of average net assets for each month. Under a separate contract, FSC administers the security lending program. The security lending fee is based on the number and duration of lending transactions. For the period, the fees were equivalent to an annualized rate of .05%.
Brokerage Commissions. The Fund placed a portion of its portfolio transactions with brokerage firms which are affiliates of the investment adviser. Brokerage commissions are included in net realized gain (loss) and change in net unrealized appreciation (depreciation) in the Statement of Operations. The commissions paid to these affiliated firms were $443 for the period.
Interfund Lending Program. Pursuant to an Exemptive Order issued by the SEC, the Fund, along with other registered investment companies having management contracts with Fidelity Management & Research Company (FMR) or other affiliated entities of FMR, may participate in an interfund lending program. This program provides an alternative credit facility allowing the funds to borrow from, or lend money to, other participating affiliated funds. The Fund's activity in this program during the period for which loans were outstanding was as follows:
| Borrower or Lender | Average Loan Balance | Weighted Average Interest Rate | Interest Expense |
| Borrower | $3,180,778 | 1.71% | $1,357 |
Interfund Trades. The Fund may purchase from or sell securities to other Fidelity Funds under procedures adopted by the Board. The procedures have been designed to ensure these interfund trades are executed in accordance with Rule 17a-7 of the 1940 Act. Interfund trades are included within the respective purchases and sales amounts shown in the Purchases and Sales of Investments note.
6. Committed Line of Credit.
The Fund participates with other funds managed by the investment adviser or an affiliate in a $4.25 billion credit facility (the "line of credit") to be utilized for temporary or emergency purposes to fund shareholder redemptions or for other short-term liquidity purposes. The Fund has agreed to pay commitment fees on its pro-rata portion of the line of credit, which amounted to $715 and is reflected in Miscellaneous expenses on the Statement of Operations. During the period, the Fund did not borrow on this line of credit.
7. Security Lending.
The Fund lends portfolio securities through a lending agent from time to time in order to earn additional income. For equity securities, a lending agent is used and may loan securities to certain qualified borrowers, including Fidelity Capital Markets (FCM), a broker-dealer affiliated with the Fund. On the settlement date of the loan, the Fund receives collateral (in the form of U.S. Treasury obligations, letters of credit and/or cash) against the loaned securities and maintains collateral in an amount not less than 100% of the market value of the loaned securities during the period of the loan. The market value of the loaned securities is determined at the close of business of the Fund and any additional required collateral is delivered to the Fund on the next business day. The Fund or borrower may terminate the loan at any time, and if the borrower defaults on its obligation to return the securities loaned because of insolvency or other reasons, the Fund may apply collateral received from the borrower against the obligation. The Fund may experience delays and costs in recovering the securities loaned. Any cash collateral received is invested in the Fidelity Securities Lending Cash Central Fund. The value of loaned securities and cash collateral at period end are disclosed on the Fund's Statement of Assets and Liabilities. Security lending income represents the income earned on investing cash collateral, less rebates paid to borrowers and any lending agent fees associated with the loan, plus any premium payments received for lending certain types of securities. Security lending income is presented in the Statement of Operations as a component of income from Fidelity Central Funds. Total security lending income during the period amounted to $135,870. During the period, there were no securities loaned to FCM.
8. Expense Reductions.
Commissions paid to certain brokers with whom the investment adviser, or its affiliates, places trades on behalf of the Fund include an amount in addition to trade execution, which may be rebated back to the Fund to offset certain expenses. This amount totaled $82,067 for the period.
In addition, during the period the investment adviser reimbursed and/or waived a portion of fund-level operating expenses in the amount of $2,751.
9. Distributions to Shareholders.
Distributions to shareholders of each class were as follows:
| Six months ended April 30, 2018 | Year ended October 31, 2017 | |
| From net investment income | ||
| Class A | $90,911 | $160,715 |
| Class M | 34,628 | 64,948 |
| Class C | 24,561 | 57,557 |
| International Value | 7,910,177 | 7,786,373 |
| Class I | 79,565 | 54,529 |
| Total | $8,139,842 | $8,124,122 |
| From net realized gain | ||
| Class A | $12,478 | $10,650 |
| Class M | 6,464 | 5,031 |
| Class C | 8,187 | 5,917 |
| International Value | 814,283 | 432,576 |
| Class I | 8,840 | 3,157 |
| Total | $850,252 | $457,331 |
10. Share Transactions.
Share transactions for each class were as follows and may contain automatic conversions between classes or exchanges between affiliated funds:
| Shares | Shares | Dollars | Dollars | |
| Six months ended April 30, 2018 | Year ended October 31, 2017 | Six months ended April 30, 2018 | Year ended October 31, 2017 | |
| Class A | ||||
| Shares sold | 158,011 | 276,572 | $1,449,873 | $2,327,962 |
| Reinvestment of distributions | 11,240 | 21,396 | 100,489 | 166,672 |
| Shares redeemed | (104,549) | (392,253) | (961,228) | (3,202,452) |
| Net increase (decrease) | 64,702 | (94,285) | $589,134 | $(707,818) |
| Class M | ||||
| Shares sold | 46,893 | 101,768 | $431,698 | $836,059 |
| Reinvestment of distributions | 4,596 | 8,935 | 41,092 | 69,695 |
| Shares redeemed | (37,669) | (126,227) | (346,946) | (1,023,584) |
| Net increase (decrease) | 13,820 | (15,524) | $125,844 | $(117,830) |
| Class C | ||||
| Shares sold | 135,788 | 120,429 | $1,268,337 | $1,017,626 |
| Reinvestment of distributions | 3,587 | 7,631 | 32,067 | 59,598 |
| Shares redeemed | (42,523) | (94,013) | (386,160) | (768,940) |
| Net increase (decrease) | 96,852 | 34,047 | $914,244 | $308,284 |
| International Value | ||||
| Shares sold | 20,171,767 | 2,636,526 | $183,649,326 | $22,208,337 |
| Reinvestment of distributions | 477,419 | 1,033,790 | 4,258,580 | 8,032,545 |
| Shares redeemed | (6,852,996) | (3,774,158) | (62,278,032) | (30,751,436) |
| Net increase (decrease) | 13,796,190 | (103,842) | $125,629,874 | $(510,554) |
| Class I | ||||
| Shares sold | 304,438 | 426,959 | $2,794,610 | $3,538,590 |
| Reinvestment of distributions | 9,287 | 6,933 | 82,930 | 54,005 |
| Shares redeemed | (102,822) | (77,592) | (941,880) | (639,455) |
| Net increase (decrease) | 210,903 | 356,300 | $1,935,660 | $2,953,140 |
11. Other.
The Fund's organizational documents provide former and current trustees and officers with a limited indemnification against liabilities arising in connection with the performance of their duties to the Fund. In the normal course of business, the Fund may also enter into contracts that provide general indemnifications. The Fund's maximum exposure under these arrangements is unknown as this would be dependent on future claims that may be made against the Fund. The risk of material loss from such claims is considered remote.
At the end of the period, Strategic Advisers Fidelity International Fund, VIP FundsManager 50% Portfolio and VIP FundsManager 60% Portfolio were the owners of record of approximately 45%, 11% and 13%, respectively, of the total outstanding shares of the Fund. Mutual funds managed by the investment adviser or its affiliates were the owners of record, in the aggregate, of approximately 75% of the total outstanding shares of the Fund.
Shareholder Expense Example
As a shareholder of the Fund, you incur two types of costs: (1) transaction costs, including sales charges (loads) on purchase payments or redemption proceeds, redemption fees and (2) ongoing costs, including management fees, distribution and/or service (12b-1) fees and other Fund expenses. This Example is intended to help you understand your ongoing costs (in dollars) of investing in the Fund and to compare these costs with the ongoing costs of investing in other mutual funds.
The Example is based on an investment of $1,000 invested at the beginning of the period and held for the entire period (November 1, 2017 to April 30, 2018).
Actual Expenses
The first line of the accompanying table for each class of the Fund provides information about actual account values and actual expenses. You may use the information in this line, together with the amount you invested, to estimate the expenses that you paid over the period. Simply divide your account value by $1,000.00 (for example, an $8,600 account value divided by $1,000.00 = 8.6), then multiply the result by the number in the first line for a class of the Fund under the heading entitled "Expenses Paid During Period" to estimate the expenses you paid on your account during this period. A small balance maintenance fee of $12.00 that is charged once a year may apply for certain accounts with a value of less than $2,000. This fee is not included in the table below. If it was, the estimate of expenses you paid during the period would be higher, and your ending account value lower, by this amount. In addition, the Fund, as a shareholder in the underlying Fidelity Central Funds, will indirectly bear its pro-rata share of the fees and expenses incurred by the underlying Fidelity Central Funds. These fees and expenses are not included in the Fund's annualized expense ratio used to calculate the expense estimate in the table below.
Hypothetical Example for Comparison Purposes
The second line of the accompanying table for each class of the Fund provides information about hypothetical account values and hypothetical expenses based on a Class' actual expense ratio and an assumed rate of return of 5% per year before expenses, which is not the Class' actual return. The hypothetical account values and expenses may not be used to estimate the actual ending account balance or expenses you paid for the period. You may use this information to compare the ongoing costs of investing in the Fund and other funds. To do so, compare this 5% hypothetical example with the 5% hypothetical examples that appear in the shareholder reports of the other funds. A small balance maintenance fee of $12.00 that is charged once a year may apply for certain accounts with a value of less than $2,000. This fee is not included in the table below. If it was, the estimate of expenses you paid during the period would be higher, and your ending account value lower, by this amount. In addition, the Fund, as a shareholder in the underlying Fidelity Central Funds, will indirectly bear its pro-rata share of the fees and expenses incurred by the underlying Fidelity Central Funds. These fees and expenses are not included in the Fund's annualized expense ratio used to calculate the expense estimate in the table below.
Please note that the expenses shown in the table are meant to highlight your ongoing costs only and do not reflect any transaction costs. Therefore, the second line of the table is useful in comparing ongoing costs only, and will not help you determine the relative total costs of owning different funds. In addition, if these transactional costs were included, your costs would have been higher.
| Annualized Expense Ratio-A | Beginning Account Value November 1, 2017 | Ending Account Value April 30, 2018 | Expenses Paid During Period-B November 1, 2017 to April 30, 2018 | |
| Class A | 1.26% | |||
| Actual | $1,000.00 | $1,011.90 | $6.29 | |
| Hypothetical-C | $1,000.00 | $1,018.55 | $6.31 | |
| Class M | 1.59% | |||
| Actual | $1,000.00 | $1,010.00 | $7.92 | |
| Hypothetical-C | $1,000.00 | $1,016.91 | $7.95 | |
| Class C | 2.08% | |||
| Actual | $1,000.00 | $1,007.40 | $10.35 | |
| Hypothetical-C | $1,000.00 | $1,014.48 | $10.39 | |
| International Value | .93% | |||
| Actual | $1,000.00 | $1,013.50 | $4.64 | |
| Hypothetical-C | $1,000.00 | $1,020.18 | $4.66 | |
| Class I | 1.01% | |||
| Actual | $1,000.00 | $1,012.30 | $5.04 | |
| Hypothetical-C | $1,000.00 | $1,019.79 | $5.06 |
A Annualized expense ratio reflects expenses net of applicable fee waivers.
B Expenses are equal to each Class' annualized expense ratio, multiplied by the average account value over the period, multiplied by 181/365 (to reflect the one-half year period).
C 5% return per year before expenses
![]()
Corporate Headquarters
245 Summer St.
Boston, MA 02210
www.fidelity.com
FIV-SANN-0618
1.827485.111
Fidelity Advisor® International Discovery Fund - Semi-Annual Report April 30, 2018 Class A, Class M, Class C, Class I and Class Z are classes of Fidelity® International Discovery Fund |
|
Contents
To view a fund's proxy voting guidelines and proxy voting record for the 12-month period ended June 30, visit http://www.fidelity.com/proxyvotingresults or visit the Securities and Exchange Commission's (SEC) web site at http://www.sec.gov.
You may also call 1-877-208-0098 to request a free copy of the proxy voting guidelines.
Standard & Poor's, S&P and S&P 500 are registered service marks of The McGraw-Hill Companies, Inc. and have been licensed for use by Fidelity Distributors Corporation.
Other third-party marks appearing herein are the property of their respective owners.
All other marks appearing herein are registered or unregistered trademarks or service marks of FMR LLC or an affiliated company. © 2018 FMR LLC. All rights reserved.
This report and the financial statements contained herein are submitted for the general information of the shareholders of the Fund. This report is not authorized for distribution to prospective investors in the Fund unless preceded or accompanied by an effective prospectus.
A fund files its complete schedule of portfolio holdings with the SEC for the first and third quarters of each fiscal year on Form N-Q. Forms N-Q are available on the SEC’s web site at http://www.sec.gov. A fund's Forms N-Q may be reviewed and copied at the SEC’s Public Reference Room in Washington, DC. Information regarding the operation of the SEC's Public Reference Room may be obtained by calling 1-800-SEC-0330.
For a complete list of a fund's portfolio holdings, view the most recent holdings listing, semiannual report, or annual report on Fidelity's web site at http://www.fidelity.com, http://www.institutional.fidelity.com, or http://www.401k.com, as applicable.
NOT FDIC INSURED •MAY LOSE VALUE •NO BANK GUARANTEE
Neither the Fund nor Fidelity Distributors Corporation is a bank.
Investment Summary (Unaudited)
Geographic Diversification (% of fund's net assets)
| As of April 30, 2018 | ||
| Japan | 19.1% | |
| United Kingdom | 11.5% | |
| France | 10.4% | |
| Germany | 7.5% | |
| Switzerland | 6.4% | |
| Netherlands | 5.2% | |
| Spain | 4.3% | |
| Ireland | 3.7% | |
| India | 3.7% | |
| Other* | 28.2% | |

* Includes Short-Term Investments and Net Other Assets (Liabilities).
Percentages are based on country or territory of incorporation and are adjusted for the effect of futures contracts, if applicable.
Asset Allocation as of April 30, 2018
| % of fund's net assets | |
| Stocks and Equity Futures | 96.5 |
| Short-Term Investments and Net Other Assets (Liabilities) | 3.5 |
Top Ten Stocks as of April 30, 2018
| % of fund's net assets | |
| Total SA (France, Oil, Gas & Consumable Fuels) | 2.5 |
| Statoil ASA (Norway, Oil, Gas & Consumable Fuels) | 2.1 |
| SAP SE (Germany, Software) | 1.5 |
| AstraZeneca PLC (United Kingdom) (United Kingdom, Pharmaceuticals) | 1.4 |
| CaixaBank SA (Spain, Banks) | 1.4 |
| Roche Holding AG (participation certificate) (Switzerland, Pharmaceuticals) | 1.4 |
| ORIX Corp. (Japan, Diversified Financial Services) | 1.3 |
| Unilever NV (Certificaten Van Aandelen) (Bearer) (Netherlands, Personal Products) | 1.3 |
| Housing Development Finance Corp. Ltd. (India, Thrifts & Mortgage Finance) | 1.2 |
| VINCI SA (France, Construction & Engineering) | 1.2 |
| 15.3 |
Top Market Sectors as of April 30, 2018
| % of fund's net assets | |
| Financials | 22.3 |
| Industrials | 13.9 |
| Consumer Discretionary | 11.9 |
| Health Care | 10.0 |
| Information Technology | 9.6 |
| Consumer Staples | 8.5 |
| Materials | 7.1 |
| Energy | 6.1 |
| Real Estate | 1.9 |
| Telecommunication Services | 1.5 |
Schedule of Investments April 30, 2018 (Unaudited)
Showing Percentage of Net Assets
| Common Stocks - 92.1% | |||
| Shares | Value (000s) | ||
| Australia - 1.5% | |||
| Bapcor Ltd. (a) | 8,531,892 | $37,643 | |
| Blue Sky Alternative Investments Ltd. | 3,175,826 | 7,320 | |
| BWX Ltd. (a) | 2,157,954 | 8,187 | |
| Inghams Group Ltd. (a) | 7,320,478 | 20,655 | |
| Link Administration Holdings Ltd. | 3,223,548 | 20,058 | |
| Magellan Financial Group Ltd. | 1,200,134 | 20,967 | |
| National Storage (REIT) unit | 11,386,057 | 13,670 | |
| Rio Tinto Ltd. | 185,386 | 11,033 | |
| Spark Infrastructure Group unit | 14,202,580 | 25,042 | |
| TOTAL AUSTRALIA | 164,575 | ||
| Austria - 1.4% | |||
| Erste Group Bank AG | 1,736,200 | 85,123 | |
| Wienerberger AG | 2,643,500 | 66,719 | |
| TOTAL AUSTRIA | 151,842 | ||
| Bailiwick of Jersey - 1.1% | |||
| Glencore Xstrata PLC | 24,686,927 | 119,191 | |
| Belgium - 1.7% | |||
| Anheuser-Busch InBev SA NV (a) | 407,427 | 40,699 | |
| KBC Groep NV | 1,370,241 | 119,800 | |
| Telenet Group Holding NV (b) | 453,400 | 26,588 | |
| TOTAL BELGIUM | 187,087 | ||
| Bermuda - 0.4% | |||
| Hiscox Ltd. | 2,360,300 | 48,384 | |
| Brazil - 0.0% | |||
| Itausa-Investimentos Itau SA | 391,494 | 1,509 | |
| Canada - 2.0% | |||
| Alimentation Couche-Tard, Inc. Class B (sub. vtg.) | 698,400 | 30,194 | |
| Cenovus Energy, Inc. | 3,278,900 | 32,841 | |
| Constellation Software, Inc. | 73,200 | 52,316 | |
| PrairieSky Royalty Ltd. (a) | 2,359,273 | 52,314 | |
| Suncor Energy, Inc. | 1,427,200 | 54,578 | |
| TOTAL CANADA | 222,243 | ||
| Cayman Islands - 1.3% | |||
| Alibaba Group Holding Ltd. sponsored ADR (b) | 447,200 | 79,843 | |
| China Literature Ltd. (b)(c) | 3,275,200 | 26,382 | |
| New Oriental Education & Technology Group, Inc. sponsored ADR | 255,000 | 22,909 | |
| Ping An Healthcare and Technology Co. Ltd. (b) | 453,000 | 3,163 | |
| Zai Lab Ltd. ADR (a) | 388,800 | 7,259 | |
| TOTAL CAYMAN ISLANDS | 139,556 | ||
| China - 1.4% | |||
| Jiangsu Yanghe Brewery Joint-Stock Co. Ltd. Class A | 2,538,600 | 44,731 | |
| Kweichow Moutai Co. Ltd. (A Shares) | 474,382 | 49,397 | |
| Qingdao Port International Co. Ltd. (c) | 11,117,000 | 9,133 | |
| Shanghai International Airport Co. Ltd. (A Shares) | 5,665,100 | 44,495 | |
| TOTAL CHINA | 147,756 | ||
| Denmark - 0.6% | |||
| Novo Nordisk A/S Series B | 930,645 | 43,766 | |
| Novozymes A/S Series B | 391,900 | 18,424 | |
| TOTAL DENMARK | 62,190 | ||
| Finland - 0.5% | |||
| Sampo Oyj (A Shares) | 895,600 | 48,398 | |
| France - 10.4% | |||
| Accor SA | 950,500 | 53,799 | |
| ALTEN | 335,159 | 33,310 | |
| Altran Technologies SA (a) | 1,487,300 | 22,990 | |
| Amundi SA (c) | 546,458 | 46,510 | |
| Atos Origin SA | 243,414 | 32,893 | |
| BNP Paribas SA | 945,800 | 73,075 | |
| Capgemini SA | 487,000 | 67,044 | |
| Cegedim SA (b) | 581,063 | 24,700 | |
| Elis SA | 1,195,800 | 28,621 | |
| Kaufman & Broad SA | 144,863 | 7,638 | |
| LVMH Moet Hennessy - Louis Vuitton SA | 240,539 | 83,710 | |
| Rexel SA | 2,126,400 | 32,997 | |
| Sartorius Stedim Biotech | 305,000 | 28,508 | |
| SMCP S.A.S. (c) | 642,504 | 16,406 | |
| Societe Generale Series A | 2,222,100 | 121,613 | |
| Thales SA | 437,100 | 55,423 | |
| Total SA (a) | 4,305,010 | 270,571 | |
| VINCI SA (a) | 1,308,500 | 130,829 | |
| TOTAL FRANCE | 1,130,637 | ||
| Germany - 7.5% | |||
| adidas AG | 447,307 | 110,140 | |
| Aumann AG (c) | 133,451 | 8,074 | |
| Deutsche Borse AG | 163,981 | 22,054 | |
| Deutsche Post AG | 2,231,918 | 96,875 | |
| Fresenius SE & Co. KGaA | 901,300 | 68,940 | |
| Henkel AG & Co. KGaA | 321,600 | 38,351 | |
| JOST Werke AG (c) | 219,700 | 9,273 | |
| Linde AG | 286,300 | 63,633 | |
| MTU Aero Engines Holdings AG | 381,500 | 65,880 | |
| Muenchener Rueckversicherungs AG | 122,300 | 28,054 | |
| Nexus AG | 602,505 | 20,154 | |
| Rational AG | 36,605 | 22,964 | |
| Rheinmetall AG | 302,400 | 39,677 | |
| SAP SE | 1,507,211 | 167,460 | |
| Scout24 AG (c) | 458,900 | 23,796 | |
| Wirecard AG | 221,900 | 30,307 | |
| TOTAL GERMANY | 815,632 | ||
| Hong Kong - 1.5% | |||
| AIA Group Ltd. | 11,175,600 | 99,879 | |
| Techtronic Industries Co. Ltd. | 10,247,000 | 60,029 | |
| TOTAL HONG KONG | 159,908 | ||
| India - 3.7% | |||
| Avenue Supermarts Ltd. (b)(c) | 595,148 | 13,270 | |
| Bandhan Bank Ltd. (c) | 444,600 | 3,416 | |
| Bharti Infratel Ltd. | 3,348,609 | 15,760 | |
| HDFC Bank Ltd. | 1,783,391 | 53,751 | |
| HDFC Bank Ltd. sponsored ADR | 696,184 | 66,701 | |
| Housing Development Finance Corp. Ltd. | 4,738,215 | 134,058 | |
| Kajaria Ceramics Ltd. | 2,444,763 | 20,017 | |
| Kotak Mahindra Bank Ltd. (b) | 1,211,049 | 22,022 | |
| Petronet LNG Ltd. | 6,098,248 | 20,763 | |
| PNB Housing Finance Ltd. (c) | 838,105 | 17,591 | |
| PVR Ltd. (b) | 442,801 | 9,576 | |
| Sunteck Realty Ltd. (b) | 3,638,783 | 23,470 | |
| TOTAL INDIA | 400,395 | ||
| Indonesia - 0.4% | |||
| PT Bank Central Asia Tbk | 6,980,000 | 11,037 | |
| PT Bank Rakyat Indonesia Tbk | 157,115,200 | 36,226 | |
| TOTAL INDONESIA | 47,263 | ||
| Ireland - 3.7% | |||
| Cairn Homes PLC (b) | 20,159,470 | 43,723 | |
| CRH PLC | 2,180,712 | 77,440 | |
| Dalata Hotel Group PLC (b) | 3,827,700 | 30,507 | |
| DCC PLC (United Kingdom) | 353,400 | 34,057 | |
| Glenveagh Properties PLC (c) | 13,703,776 | 18,303 | |
| Green REIT PLC | 9,492,200 | 17,401 | |
| James Hardie Industries PLC CDI | 2,420,296 | 42,741 | |
| Kerry Group PLC Class A | 561,500 | 57,297 | |
| Ryanair Holdings PLC sponsored ADR (b) | 342,366 | 37,650 | |
| United Drug PLC (United Kingdom) | 3,798,200 | 47,845 | |
| TOTAL IRELAND | 406,964 | ||
| Israel - 0.6% | |||
| Frutarom Industries Ltd. | 694,000 | 66,624 | |
| Italy - 1.2% | |||
| Intesa Sanpaolo SpA | 24,317,500 | 92,503 | |
| Prada SpA | 7,015,800 | 35,598 | |
| TOTAL ITALY | 128,101 | ||
| Japan - 15.6% | |||
| AEON Financial Service Co. Ltd. | 1,577,400 | 37,025 | |
| Daito Trust Construction Co. Ltd. | 164,500 | 27,469 | |
| Hoya Corp. | 1,580,200 | 84,734 | |
| Keyence Corp. | 138,020 | 84,552 | |
| Komatsu Ltd. | 1,514,600 | 51,631 | |
| Minebea Mitsumi, Inc. | 3,071,200 | 61,722 | |
| Misumi Group, Inc. | 1,135,000 | 31,459 | |
| Mitsubishi UFJ Financial Group, Inc. | 13,190,300 | 88,393 | |
| Monex Group, Inc. (a) | 4,390,349 | 25,060 | |
| Morinaga & Co. Ltd. | 576,300 | 28,098 | |
| Nidec Corp. | 347,200 | 54,437 | |
| Nintendo Co. Ltd. | 105,200 | 44,203 | |
| Nitori Holdings Co. Ltd. | 491,400 | 83,069 | |
| ORIX Corp. | 8,418,200 | 148,158 | |
| Panasonic Corp. | 6,196,200 | 91,748 | |
| Recruit Holdings Co. Ltd. | 948,400 | 21,923 | |
| Relo Group, Inc. | 2,584,400 | 58,298 | |
| Renesas Electronics Corp. (a)(b) | 5,075,700 | 53,301 | |
| SMC Corp. | 226,600 | 86,478 | |
| SMS Co., Ltd. | 813,800 | 30,893 | |
| SoftBank Corp. | 817,600 | 62,472 | |
| Sony Corp. | 2,396,700 | 111,941 | |
| Start Today Co. Ltd. | 1,761,000 | 50,903 | |
| Sundrug Co. Ltd. | 838,200 | 43,167 | |
| Taiheiyo Cement Corp. | 1,345,000 | 50,997 | |
| Tateru, Inc. (a) | 1,173,700 | 19,991 | |
| Tsuruha Holdings, Inc. | 469,600 | 67,571 | |
| VT Holdings Co. Ltd. | 3,859,500 | 17,617 | |
| Welcia Holdings Co. Ltd. | 1,669,400 | 85,974 | |
| TOTAL JAPAN | 1,703,284 | ||
| Korea (South) - 0.3% | |||
| Hyundai Fire & Marine Insurance Co. Ltd. | 331,774 | 11,850 | |
| KB Financial Group, Inc. | 437,375 | 24,783 | |
| TOTAL KOREA (SOUTH) | 36,633 | ||
| Netherlands - 5.2% | |||
| ASML Holding NV (Netherlands) | 468,600 | 89,126 | |
| Basic-Fit NV (b)(c) | 577,200 | 17,391 | |
| IMCD Group BV | 926,545 | 57,120 | |
| ING Groep NV (Certificaten Van Aandelen) | 4,812,900 | 81,100 | |
| Instone Real Estate Group BV (b)(c) | 1,011,300 | 24,232 | |
| Koninklijke Philips Electronics NV | 2,573,226 | 108,915 | |
| NIBC Holding NV (b)(c) | 3,004,124 | 29,947 | |
| Philips Lighting NV (c) | 195,000 | 5,944 | |
| Unilever NV (Certificaten Van Aandelen) (Bearer) | 2,511,232 | 143,965 | |
| Van Lanschot NV (Bearer) | 222,900 | 6,891 | |
| TOTAL NETHERLANDS | 564,631 | ||
| New Zealand - 1.1% | |||
| EBOS Group Ltd. | 3,144,406 | 39,337 | |
| Fisher & Paykel Healthcare Corp. | 3,635,018 | 32,609 | |
| Ryman Healthcare Group Ltd. | 6,157,798 | 45,926 | |
| TOTAL NEW ZEALAND | 117,872 | ||
| Norway - 2.1% | |||
| Statoil ASA | 8,895,913 | 227,493 | |
| Philippines - 0.3% | |||
| SM Investments Corp. | 1,901,955 | 34,446 | |
| South Africa - 1.6% | |||
| Clicks Group Ltd. | 2,101,458 | 35,928 | |
| FirstRand Ltd. | 5,177,700 | 27,729 | |
| Naspers Ltd. Class N | 222,400 | 54,181 | |
| PSG Group Ltd. | 1,687,000 | 30,353 | |
| Remgro Ltd. | 1,457,600 | 26,242 | |
| TOTAL SOUTH AFRICA | 174,433 | ||
| Spain - 4.3% | |||
| Aedas Homes SAU (c) | 405,465 | 14,444 | |
| Amadeus IT Holding SA Class A | 791,500 | 58,018 | |
| CaixaBank SA | 31,380,333 | 152,599 | |
| Grifols SA ADR | 2,895,358 | 58,834 | |
| Masmovil Ibercom SA (b) | 483,879 | 69,886 | |
| Neinor Homes SLU (b)(c) | 737,500 | 14,303 | |
| Prosegur Cash SA (c) | 19,504,100 | 56,999 | |
| Zardoya Otis SA | 4,123,773 | 42,179 | |
| TOTAL SPAIN | 467,262 | ||
| Sweden - 2.5% | |||
| ASSA ABLOY AB (B Shares) (a) | 3,327,600 | 69,998 | |
| Essity AB Class B (a) | 2,674,100 | 68,100 | |
| HEXPOL AB (B Shares) (a) | 1,866,400 | 19,396 | |
| Indutrade AB | 1,700,600 | 40,278 | |
| Saab AB (B Shares) (a) | 764,400 | 31,382 | |
| Svenska Cellulosa AB (SCA) (B Shares) | 3,967,200 | 44,091 | |
| TOTAL SWEDEN | 273,245 | ||
| Switzerland - 6.4% | |||
| Credit Suisse Group AG | 6,506,687 | 109,743 | |
| Forbo Holding AG (Reg.) | 20,060 | 28,177 | |
| Julius Baer Group Ltd. | 836,630 | 49,653 | |
| Kaba Holding AG (B Shares) (Reg.) | 41,260 | 32,059 | |
| Lonza Group AG | 260,791 | 64,264 | |
| Partners Group Holding AG | 75,626 | 55,441 | |
| Roche Holding AG (participation certificate) | 683,328 | 151,827 | |
| Schindler Holding AG (participation certificate) | 164,075 | 34,040 | |
| Swatch Group AG (Bearer) | 238,640 | 115,226 | |
| UBS Group AG | 3,586,740 | 60,696 | |
| TOTAL SWITZERLAND | 701,126 | ||
| Taiwan - 0.3% | |||
| United Microelectronics Corp. | 62,100,000 | 33,429 | |
| United Kingdom - 11.5% | |||
| Anglo American PLC (United Kingdom) | 1,379,900 | 32,474 | |
| Antofagasta PLC | 2,486,800 | 33,291 | |
| AstraZeneca PLC (United Kingdom) | 2,182,762 | 152,799 | |
| Barclays PLC | 58,904 | 168 | |
| BCA Marketplace PLC | 7,736,200 | 20,300 | |
| BHP Billiton PLC | 3,424,439 | 73,017 | |
| British American Tobacco PLC: | |||
| (United Kingdom) | 1,445,432 | 79,278 | |
| sponsored ADR | 421,600 | 23,028 | |
| Bunzl PLC | 2,012,418 | 58,485 | |
| Clipper Logistics PLC | 2,271,300 | 14,102 | |
| CMC Markets PLC (c) | 206,570 | 539 | |
| Compass Group PLC | 2,344,943 | 50,361 | |
| Conviviality PLC (d) | 5,464,968 | 3,807 | |
| Countryside Properties PLC (c) | 53,784 | 266 | |
| Cranswick PLC | 1,364,288 | 54,731 | |
| Dechra Pharmaceuticals PLC | 239,376 | 9,036 | |
| Hastings Group Holdings PLC (c) | 2,038,137 | 7,744 | |
| Indivior PLC (b) | 3,936,900 | 24,558 | |
| JTC PLC (b)(c) | 3,870,300 | 16,331 | |
| LivaNova PLC (b) | 693,902 | 61,605 | |
| London Stock Exchange Group PLC | 914,236 | 54,121 | |
| Melrose Industries PLC | 23,361,453 | 73,329 | |
| Micro Focus International PLC | 3,060,205 | 52,768 | |
| NCC Group Ltd. | 9,120,600 | 24,686 | |
| Reckitt Benckiser Group PLC | 422,519 | 33,146 | |
| Rex Bionics PLC (b)(d)(e) | 1,292,931 | 31 | |
| Rio Tinto PLC | 918,990 | 50,090 | |
| Senior Engineering Group PLC | 7,108,200 | 28,907 | |
| St. James's Place Capital PLC | 2,337,909 | 36,579 | |
| Standard Chartered PLC (United Kingdom) | 8,953,861 | 94,546 | |
| The Weir Group PLC | 1,804,000 | 53,049 | |
| Zpg PLC | 8,356,009 | 41,298 | |
| TOTAL UNITED KINGDOM | 1,258,470 | ||
| TOTAL COMMON STOCKS | |||
| (Cost $8,032,417) | 10,040,579 | ||
| Preferred Stocks - 0.9% | |||
| Convertible Preferred Stocks - 0.3% | |||
| Cayman Islands - 0.3% | |||
| China Internet Plus Holdings Ltd. Series A-11 (b)(d)(f) | 5,958,244 | 33,301 | |
| Nonconvertible Preferred Stocks - 0.6% | |||
| Brazil - 0.6% | |||
| Itausa-Investimentos Itau SA (PN) | 16,504,700 | 64,121 | |
| TOTAL PREFERRED STOCKS | |||
| (Cost $76,821) | 97,422 | ||
| Principal Amount (000s) | Value (000s) | ||
| Government Obligations - 0.1% | |||
| United States of America - 0.1% | |||
| U.S. Treasury Bills, yield at date of purchase 1.48% to 1.79% 5/10/18 to 7/19/18(g) | |||
| (Cost $10,765) | 10,790 | 10,765 | |
| Shares | Value (000s) | ||
| Money Market Funds - 7.6% | |||
| Fidelity Cash Central Fund, 1.74% (h) | 664,231,102 | 664,364 | |
| Fidelity Securities Lending Cash Central Fund 1.74% (h)(i) | 170,618,463 | 170,636 | |
| TOTAL MONEY MARKET FUNDS | |||
| (Cost $835,000) | 835,000 | ||
| TOTAL INVESTMENT IN SECURITIES - 100.7% | |||
| (Cost $8,955,003) | 10,983,766 | ||
| NET OTHER ASSETS (LIABILITIES) - (0.7)% | (78,311) | ||
| NET ASSETS - 100% | $10,905,455 |
| Futures Contracts | |||||
| Number of contracts | Expiration Date | Notional Amount (000s) | Value (000s) | Unrealized Appreciation/(Depreciation) (000s) | |
| Purchased | |||||
| Equity Index Contracts | |||||
| TSE TOPIX Index Contracts (Japan) | 2,383 | June 2018 | $386,376 | $8,626 | $8,626 |
The notional amount of futures purchased as a percentage of Net Assets is 3.5%
Categorizations in the Schedule of Investments are based on country or territory of incorporation.
Legend
(a) Security or a portion of the security is on loan at period end.
(b) Non-income producing
(c) Security exempt from registration under Rule 144A of the Securities Act of 1933. These securities may be resold in transactions exempt from registration, normally to qualified institutional buyers. At the end of the period, the value of these securities amounted to $380,294,000 or 3.5% of net assets.
(d) Level 3 security
(e) Affiliated company
(f) Restricted securities - Investment in securities not registered under the Securities Act of 1933 (excluding 144A issues). At the end of the period, the value of restricted securities (excluding 144A issues) amounted to $33,301,000 or 0.3% of net assets.
(g) Security or a portion of the security was pledged to cover margin requirements for futures contracts. At period end, the value of securities pledged amounted to $10,353,000.
(h) Affiliated fund that is generally available only to investment companies and other accounts managed by Fidelity Investments. The rate quoted is the annualized seven-day yield of the fund at period end. A complete unaudited listing of the fund's holdings as of its most recent quarter end is available upon request. In addition, each Fidelity Central Fund's financial statements are available on the SEC's website or upon request.
(i) Investment made with cash collateral received from securities on loan.
Additional information on each restricted holding is as follows:
| Security | Acquisition Date | Acquisition Cost (000s) |
| China Internet Plus Holdings Ltd. Series A-11 | 1/26/15 | $18,833 |
Affiliated Central Funds
Information regarding fiscal year to date income earned by the Fund from investments in Fidelity Central Funds is as follows:
| Fund | Income earned |
| (Amounts in thousands) | |
| Fidelity Cash Central Fund | $2,770 |
| Fidelity Securities Lending Cash Central Fund | 1,662 |
| Total | $4,432 |
Amounts in the income column in the above table include any capital gain distributions from underlying funds, which are presented in the corresponding line-item in the Statement of Operations if applicable.
Other Affiliated Issuers
An affiliated company is a company in which the Fund has ownership of at least 5% of the voting securities. Fiscal year to date transactions with companies which are or were affiliates are as follows:
| Affiliate (Amounts in thousands) | Value, beginning of period | Purchases | Sales Proceeds*,** | Dividend Income | Realized Gain (loss) | Change in Unrealized appreciation (depreciation) | Value, end of period |
| Rex Bionics PLC | $30 | $-- | $0 | $-- | $(13) | $14 | $31 |
| Total | $30 | $-- | $0 | $-- | $(13) | $14 | $31 |
* Values shown as $0 may reflect amounts less than $500.
** Includes the value of securities delivered through in-kind transactions, if applicable.
Investment Valuation
The following is a summary of the inputs used, as of April 30, 2018, involving the Fund's assets and liabilities carried at fair value. The inputs or methodology used for valuing securities may not be an indication of the risk associated with investing in those securities. For more information on valuation inputs, and their aggregation into the levels used below, please refer to the Investment Valuation section in the accompanying Notes to Financial Statements.
| Valuation Inputs at Reporting Date: | ||||
| Description | Total | Level 1 | Level 2 | Level 3 |
| (Amounts in thousands) | ||||
| Investments in Securities: | ||||
| Equities: | ||||
| Consumer Discretionary | $1,275,975 | $718,596 | $524,078 | $33,301 |
| Consumer Staples | 956,304 | 537,210 | 415,287 | 3,807 |
| Energy | 658,560 | 139,733 | 518,827 | -- |
| Financials | 2,456,802 | 1,223,602 | 1,233,200 | -- |
| Health Care | 1,078,810 | 618,309 | 460,470 | 31 |
| Industrials | 1,503,716 | 1,116,290 | 387,426 | -- |
| Information Technology | 1,048,235 | 730,317 | 317,918 | -- |
| Materials | 769,161 | 496,416 | 272,745 | -- |
| Real Estate | 217,278 | 180,138 | 37,140 | -- |
| Telecommunication Services | 148,118 | 69,886 | 78,232 | -- |
| Utilities | 25,042 | -- | 25,042 | -- |
| Government Obligations | 10,765 | -- | 10,765 | -- |
| Money Market Funds | 835,000 | 835,000 | -- | -- |
| Total Investments in Securities: | $10,983,766 | $6,665,497 | $4,281,130 | $37,139 |
| Derivative Instruments: | ||||
| Assets | ||||
| Futures Contracts | $8,626 | $8,626 | $-- | $-- |
| Total Assets | $8,626 | $8,626 | $-- | $-- |
| Total Derivative Instruments: | $8,626 | $8,626 | $-- | $-- |
The following is a summary of transfers between Level 1 and Level 2 for the period ended April 30, 2018. Transfers are assumed to have occurred at the beginning of the period, and are primarily attributable to the valuation techniques used for foreign equity securities, as discussed in the accompanying Notes to Financial Statements:
| Transfers | Total (000s) |
| Level 1 to Level 2 | $1,245,829 |
| Level 2 to Level 1 | $1,276,764 |
Value of Derivative Instruments
The following table is a summary of the Fund's value of derivative instruments by primary risk exposure as of April 30, 2018. For additional information on derivative instruments, please refer to the Derivative Instruments section in the accompanying Notes to Financial Statements.
| Primary Risk Exposure / Derivative Type | Value | |
| Asset | Liability | |
| (Amounts in thousands) | ||
| Equity Risk | ||
| Futures Contracts(a) | $8,626 | $0 |
| Total Equity Risk | 8,626 | 0 |
| Total Value of Derivatives | $8,626 | $0 |
(a) Reflects gross cumulative appreciation (depreciation) on futures contracts as presented in the Schedule of Investments. In the Statement of Assets and Liabilities, the period end daily variation margin is included in receivable or payable for daily variation margin on futures contracts, and the net cumulative appreciation (depreciation) is included in net unrealized appreciation (depreciation).
See accompanying notes which are an integral part of the financial statements.
Financial Statements
Statement of Assets and Liabilities
| Amounts in thousands (except per-share amounts) | April 30, 2018 (Unaudited) | |
| Assets | ||
| Investment in securities, at value (including securities loaned of $161,920) — See accompanying schedule: Unaffiliated issuers (cost $8,116,075) | $10,148,735 | |
| Fidelity Central Funds (cost $835,000) | 835,000 | |
| Other affiliated issuers (cost $3,928) | 31 | |
| Total Investment in Securities (cost $8,955,003) | $10,983,766 | |
| Foreign currency held at value (cost $4,142) | 4,139 | |
| Receivable for investments sold | 59,253 | |
| Receivable for fund shares sold | 6,177 | |
| Dividends receivable | 45,857 | |
| Distributions receivable from Fidelity Central Funds | 1,344 | |
| Prepaid expenses | 5 | |
| Other receivables | 4,900 | |
| Total assets | 11,105,441 | |
| Liabilities | ||
| Payable for investments purchased | $10,074 | |
| Payable for fund shares redeemed | 8,876 | |
| Accrued management fee | 6,488 | |
| Distribution and service plan fees payable | 85 | |
| Payable for daily variation margin on futures contracts | 1,526 | |
| Other affiliated payables | 1,377 | |
| Other payables and accrued expenses | 916 | |
| Collateral on securities loaned | 170,644 | |
| Total liabilities | 199,986 | |
| Net Assets | $10,905,455 | |
| Net Assets consist of: | ||
| Paid in capital | $8,492,109 | |
| Undistributed net investment income | 49,889 | |
| Accumulated undistributed net realized gain (loss) on investments and foreign currency transactions | 327,767 | |
| Net unrealized appreciation (depreciation) on investments and assets and liabilities in foreign currencies | 2,035,690 | |
| Net Assets | $10,905,455 | |
| Calculation of Maximum Offering Price | ||
| Class A: | ||
| Net Asset Value and redemption price per share ($234,013 ÷ 5,187.7 shares) | $45.11 | |
| Maximum offering price per share (100/94.25 of $45.11) | $47.86 | |
| Class M: | ||
| Net Asset Value and redemption price per share ($34,441 ÷ 768.0 shares) | $44.85 | |
| Maximum offering price per share (100/96.50 of $44.85) | $46.48 | |
| Class C: | ||
| Net Asset Value and offering price per share ($26,394 ÷ 592.8 shares)(a) | $44.52 | |
| International Discovery: | ||
| Net Asset Value, offering price and redemption price per share ($7,418,045 ÷ 163,378.1 shares) | $45.40 | |
| Class K: | ||
| Net Asset Value, offering price and redemption price per share ($2,422,704 ÷ 53,487.8 shares) | $45.29 | |
| Class I: | ||
| Net Asset Value, offering price and redemption price per share ($644,863 ÷ 14,238.4 shares) | $45.29 | |
| Class Z: | ||
| Net Asset Value, offering price and redemption price per share ($124,995 ÷ 2,761.6 shares) | $45.26 |
(a) Redemption price per share is equal to net asset value less any applicable contingent deferred sales charge.
See accompanying notes which are an integral part of the financial statements.
Statement of Operations
| Amounts in thousands | Six months ended April 30, 2018 (Unaudited) | |
| Investment Income | ||
| Dividends | $112,360 | |
| Interest | 39 | |
| Income from Fidelity Central Funds | 4,432 | |
| Income before foreign taxes withheld | 116,831 | |
| Less foreign taxes withheld | (11,116) | |
| Total income | 105,715 | |
| Expenses | ||
| Management fee | ||
| Basic fee | $36,336 | |
| Performance adjustment | 3,816 | |
| Transfer agent fees | 7,339 | |
| Distribution and service plan fees | 532 | |
| Accounting and security lending fees | 916 | |
| Custodian fees and expenses | 815 | |
| Independent trustees' fees and expenses | 22 | |
| Registration fees | 154 | |
| Audit | 48 | |
| Legal | 20 | |
| Miscellaneous | 34 | |
| Total expenses before reductions | 50,032 | |
| Expense reductions | (1,924) | 48,108 |
| Net investment income (loss) | 57,607 | |
| Realized and Unrealized Gain (Loss) | ||
| Net realized gain (loss) on: | ||
| Investment securities: | ||
| Unaffiliated issuers | 353,971 | |
| Fidelity Central Funds | 10 | |
| Other affiliated issuers | (13) | |
| Foreign currency transactions | (761) | |
| Futures contracts | 12,352 | |
| Total net realized gain (loss) | 365,559 | |
| Change in net unrealized appreciation (depreciation) on: | ||
| Investment securities: | ||
| Unaffiliated issuers | (245,049) | |
| Fidelity Central Funds | 8 | |
| Other affiliated issuers | 14 | |
| Assets and liabilities in foreign currencies | 98 | |
| Futures contracts | (8,214) | |
| Total change in net unrealized appreciation (depreciation) | (253,143) | |
| Net gain (loss) | 112,416 | |
| Net increase (decrease) in net assets resulting from operations | $170,023 |
See accompanying notes which are an integral part of the financial statements.
Statement of Changes in Net Assets
| Amounts in thousands | Six months ended April 30, 2018 (Unaudited) | Year ended October 31, 2017 |
| Increase (Decrease) in Net Assets | ||
| Operations | ||
| Net investment income (loss) | $57,607 | $118,923 |
| Net realized gain (loss) | 365,559 | 1,030,476 |
| Change in net unrealized appreciation (depreciation) | (253,143) | 1,102,421 |
| Net increase (decrease) in net assets resulting from operations | 170,023 | 2,251,820 |
| Distributions to shareholders from net investment income | (116,164) | (150,174) |
| Distributions to shareholders from net realized gain | (419,777) | (11,939) |
| Total distributions | (535,941) | (162,113) |
| Share transactions - net increase (decrease) | 622,111 | (822,002) |
| Redemption fees | – | 9 |
| Total increase (decrease) in net assets | 256,193 | 1,267,714 |
| Net Assets | ||
| Beginning of period | 10,649,262 | 9,381,548 |
| End of period | $10,905,455 | $10,649,262 |
| Other Information | ||
| Undistributed net investment income end of period | $49,889 | $108,446 |
See accompanying notes which are an integral part of the financial statements.
Financial Highlights
Fidelity International Discovery Fund Class A
| Six months ended (Unaudited) April 30, | Years endedOctober 31, | |||||
| 2018 | 2017 | 2016 | 2015 | 2014 | 2013 | |
| Selected Per–Share Data | ||||||
| Net asset value, beginning of period | $46.66 | $37.60 | $39.78 | $38.70 | $39.49 | $31.66 |
| Income from Investment Operations | ||||||
| Net investment income (loss)A | .16 | .36 | .47B | .40C | .53D | .34 |
| Net realized and unrealized gain (loss) | .46 | 9.22 | (2.38) | .79 | (.67) | 7.97 |
| Total from investment operations | .62 | 9.58 | (1.91) | 1.19 | (.14) | 8.31 |
| Distributions from net investment income | (.34) | (.47) | (.27) | (.11) | (.33) | (.45) |
| Distributions from net realized gain | (1.83) | (.05) | (.01) | – | (.31) | (.03) |
| Total distributions | (2.17) | (.52) | (.27)E | (.11) | (.65)F | (.48) |
| Redemption fees added to paid in capitalA | – | –G | –G | –G | –G | –G |
| Net asset value, end of period | $45.11 | $46.66 | $37.60 | $39.78 | $38.70 | $39.49 |
| Total ReturnH,I,J | 1.40% | 25.87% | (4.83)% | 3.09% | (.36)% | 26.59% |
| Ratios to Average Net AssetsK,L | ||||||
| Expenses before reductions | 1.26%M | 1.29% | 1.35% | 1.33% | 1.28% | 1.35% |
| Expenses net of fee waivers, if any | 1.26%M | 1.29% | 1.35% | 1.33% | 1.28% | 1.35% |
| Expenses net of all reductions | 1.23%M | 1.27% | 1.34% | 1.32% | 1.28% | 1.33% |
| Net investment income (loss) | .70%M | .88% | 1.26%B | 1.00%C | 1.35%D | .97% |
| Supplemental Data | ||||||
| Net assets, end of period (in millions) | $234 | $248 | $236 | $283 | $297 | $347 |
| Portfolio turnover rateN | 49%M,O | 42% | 50%O | 60%O | 57% | 65% |
A Calculated based on average shares outstanding during the period.
B Net Investment income per share reflects a large, non-recurring dividend which amounted to $.14 per share. Excluding this non-recurring dividend, the ratio of net investment income (loss) to average net assets would have been .88%.
C Net Investment income per share reflects a large, non-recurring dividend which amounted to $.12 per share. Excluding this non-recurring dividend, the ratio of net investment income (loss) to average net assets would have been .69%.
D Net Investment income per share reflects a large, non-recurring dividend which amounted to $.22 per share. Excluding this non-recurring dividend, the ratio of net investment income (loss) to average net assets would have been .80%.
E Total distributions of $.27 per share is comprised of distributions from net investment income of $.269 and distributions from net realized gain of $.005 per share.
F Total distributions of $.65 per share is comprised of distributions from net investment income of $.334 and distributions from net realized gain of $.311 per share.
G Amount represents less than $.005 per share.
H Total returns for periods of less than one year are not annualized.
I Total returns would have been lower if certain expenses had not been reduced during the applicable periods shown.
J Total returns do not include the effect of the sales charges.
K Fees and expenses of any underlying Fidelity Central Funds are not included in the Fund's expense ratio. The Fund indirectly bears its proportionate share of the expenses of any underlying Fidelity Central Funds.
L Expense ratios reflect operating expenses of the class. Expenses before reductions do not reflect amounts reimbursed by the investment adviser or reductions from brokerage service arrangements or reductions from other expense offset arrangements and do not represent the amount paid by the class during periods when reimbursements or reductions occur. Expenses net of fee waivers reflect expenses after reimbursement by the investment adviser but prior to reductions from brokerage service arrangements or other expense offset arrangements. Expenses net of all reductions represent the net expenses paid by the class.
M Annualized
N Amount does not include the portfolio activity of any underlying Fidelity Central Funds.
O Portfolio turnover rate excludes securities received or delivered in-kind.
See accompanying notes which are an integral part of the financial statements.
Fidelity International Discovery Fund Class M
| Six months ended (Unaudited) April 30, | Years endedOctober 31, | |||||
| 2018 | 2017 | 2016 | 2015 | 2014 | 2013 | |
| Selected Per–Share Data | ||||||
| Net asset value, beginning of period | $46.35 | $37.34 | $39.51 | $38.43 | $39.23 | $31.42 |
| Income from Investment Operations | ||||||
| Net investment income (loss)A | .11 | .26 | .38B | .30C | .44D | .26 |
| Net realized and unrealized gain (loss) | .46 | 9.17 | (2.37) | .80 | (.68) | 7.92 |
| Total from investment operations | .57 | 9.43 | (1.99) | 1.10 | (.24) | 8.18 |
| Distributions from net investment income | (.24) | (.37) | (.17) | (.02) | (.25) | (.34) |
| Distributions from net realized gain | (1.83) | (.05) | (.01) | – | (.31) | (.03) |
| Total distributions | (2.07) | (.42) | (.18) | (.02) | (.56) | (.37) |
| Redemption fees added to paid in capitalA | – | –E | –E | –E | –E | –E |
| Net asset value, end of period | $44.85 | $46.35 | $37.34 | $39.51 | $38.43 | $39.23 |
| Total ReturnF,G,H | 1.30% | 25.57% | (5.07)% | 2.86% | (.60)% | 26.31% |
| Ratios to Average Net AssetsI,J | ||||||
| Expenses before reductions | 1.50%K | 1.53% | 1.58% | 1.57% | 1.51% | 1.59% |
| Expenses net of fee waivers, if any | 1.50%K | 1.52% | 1.58% | 1.57% | 1.51% | 1.59% |
| Expenses net of all reductions | 1.47%K | 1.51% | 1.57% | 1.56% | 1.51% | 1.57% |
| Net investment income (loss) | .46%K | .64% | 1.02%B | .76%C | 1.11%D | .73% |
| Supplemental Data | ||||||
| Net assets, end of period (in millions) | $34 | $35 | $35 | $43 | $49 | $53 |
| Portfolio turnover rateL | 49%K,M | 42% | 50%M | 60%M | 57% | 65% |
A Calculated based on average shares outstanding during the period.
B Net Investment income per share reflects a large, non-recurring dividend which amounted to $.14 per share. Excluding this non-recurring dividend, the ratio of net investment income (loss) to average net assets would have been .64%.
C Net Investment income per share reflects a large, non-recurring dividend which amounted to $.12 per share. Excluding this non-recurring dividend, the ratio of net investment income (loss) to average net assets would have been .45%.
D Net Investment income per share reflects a large, non-recurring dividend which amounted to $.21 per share. Excluding this non-recurring dividend, the ratio of net investment income (loss) to average net assets would have been .56%.
E Amount represents less than $.005 per share.
F Total returns for periods of less than one year are not annualized.
G Total returns would have been lower if certain expenses had not been reduced during the applicable periods shown.
H Total returns do not include the effect of the sales charges.
I Fees and expenses of any underlying Fidelity Central Funds are not included in the Fund's expense ratio. The Fund indirectly bears its proportionate share of the expenses of any underlying Fidelity Central Funds.
J Expense ratios reflect operating expenses of the class. Expenses before reductions do not reflect amounts reimbursed by the investment adviser or reductions from brokerage service arrangements or reductions from other expense offset arrangements and do not represent the amount paid by the class during periods when reimbursements or reductions occur. Expenses net of fee waivers reflect expenses after reimbursement by the investment adviser but prior to reductions from brokerage service arrangements or other expense offset arrangements. Expenses net of all reductions represent the net expenses paid by the class.
K Annualized
L Amount does not include the portfolio activity of any underlying Fidelity Central Funds.
M Portfolio turnover rate excludes securities received or delivered in-kind.
See accompanying notes which are an integral part of the financial statements.
Fidelity International Discovery Fund Class C
| Six months ended (Unaudited) April 30, | Years endedOctober 31, | |||||
| 2018 | 2017 | 2016 | 2015 | 2014 | 2013 | |
| Selected Per–Share Data | ||||||
| Net asset value, beginning of period | $45.94 | $36.96 | $39.14 | $38.25 | $39.07 | $31.32 |
| Income from Investment Operations | ||||||
| Net investment income (loss)A | (.02) | .04 | .19B | .10C | .23D | .08 |
| Net realized and unrealized gain (loss) | .45 | 9.12 | (2.37) | .79 | (.66) | 7.90 |
| Total from investment operations | .43 | 9.16 | (2.18) | .89 | (.43) | 7.98 |
| Distributions from net investment income | (.02) | (.13) | – | – | (.08) | (.20) |
| Distributions from net realized gain | (1.83) | (.05) | – | – | (.31) | (.03) |
| Total distributions | (1.85) | (.18) | – | – | (.39) | (.23) |
| Redemption fees added to paid in capitalA | – | –E | –E | –E | –E | –E |
| Net asset value, end of period | $44.52 | $45.94 | $36.96 | $39.14 | $38.25 | $39.07 |
| Total ReturnF,G,H | .99% | 24.93% | (5.57)% | 2.33% | (1.10)% | 25.65% |
| Ratios to Average Net AssetsI,J | ||||||
| Expenses before reductions | 2.04%K | 2.05% | 2.10% | 2.09% | 2.03% | 2.10% |
| Expenses net of fee waivers, if any | 2.04%K | 2.05% | 2.10% | 2.09% | 2.03% | 2.09% |
| Expenses net of all reductions | 2.01%K | 2.04% | 2.09% | 2.08% | 2.02% | 2.07% |
| Net investment income (loss) | (.08)%K | .11% | .50%B | .24%C | .60%D | .23% |
| Supplemental Data | ||||||
| Net assets, end of period (in millions) | $26 | $28 | $26 | $32 | $35 | $36 |
| Portfolio turnover rateL | 49%K,M | 42% | 50%M | 60%M | 57% | 65% |
A Calculated based on average shares outstanding during the period.
B Net Investment income per share reflects a large, non-recurring dividend which amounted to $.14 per share. Excluding this non-recurring dividend, the ratio of net investment income (loss) to average net assets would have been .13%.
C Net Investment income per share reflects a large, non-recurring dividend which amounted to $.12 per share. Excluding this non-recurring dividend, the ratio of net investment income (loss) to average net assets would have been (.06)%.
D Net Investment income per share reflects a large, non-recurring dividend which amounted to $.21 per share. Excluding this non-recurring dividend, the ratio of net investment income (loss) to average net assets would have been .05%.
E Amount represents less than $.005 per share.
F Total returns for periods of less than one year are not annualized.
G Total returns would have been lower if certain expenses had not been reduced during the applicable periods shown.
H Total returns do not include the effect of the contingent deferred sales charge.
I Fees and expenses of any underlying Fidelity Central Funds are not included in the Fund's expense ratio. The Fund indirectly bears its proportionate share of the expenses of any underlying Fidelity Central Funds.
J Expense ratios reflect operating expenses of the class. Expenses before reductions do not reflect amounts reimbursed by the investment adviser or reductions from brokerage service arrangements or reductions from other expense offset arrangements and do not represent the amount paid by the class during periods when reimbursements or reductions occur. Expenses net of fee waivers reflect expenses after reimbursement by the investment adviser but prior to reductions from brokerage service arrangements or other expense offset arrangements. Expenses net of all reductions represent the net expenses paid by the class.
K Annualized
L Amount does not include the portfolio activity of any underlying Fidelity Central Funds.
M Portfolio turnover rate excludes securities received or delivered in-kind.
See accompanying notes which are an integral part of the financial statements.
Fidelity International Discovery Fund
| Six months ended (Unaudited) April 30, | Years endedOctober 31, | |||||
| 2018 | 2017 | 2016 | 2015 | 2014 | 2013 | |
| Selected Per–Share Data | ||||||
| Net asset value, beginning of period | $47.04 | $37.91 | $40.12 | $39.03 | $39.82 | $31.91 |
| Income from Investment Operations | ||||||
| Net investment income (loss)A | .24 | .50 | .61B | .54C | .67D | .47 |
| Net realized and unrealized gain (loss) | .45 | 9.29 | (2.41) | .81 | (.68) | 8.02 |
| Total from investment operations | .69 | 9.79 | (1.80) | 1.35 | (.01) | 8.49 |
| Distributions from net investment income | (.50) | (.61) | (.41) | (.26) | (.47) | (.55) |
| Distributions from net realized gain | (1.83) | (.05) | (.01) | – | (.31) | (.03) |
| Total distributions | (2.33) | (.66) | (.41)E | (.26) | (.78) | (.58) |
| Redemption fees added to paid in capitalA | – | –F | –F | –F | –F | –F |
| Net asset value, end of period | $45.40 | $47.04 | $37.91 | $40.12 | $39.03 | $39.82 |
| Total ReturnG,H | 1.56% | 26.33% | (4.53)% | 3.47% | (.01)% | 27.03% |
| Ratios to Average Net AssetsI,J | ||||||
| Expenses before reductions | .93%K | .94% | 1.00% | .99% | .93% | 1.00% |
| Expenses net of fee waivers, if any | .93%K | .94% | 1.00% | .99% | .93% | 1.00% |
| Expenses net of all reductions | .89%K | .92% | .99% | .98% | .93% | .98% |
| Net investment income (loss) | 1.04%K | 1.22% | 1.61%B | 1.34%C | 1.69%D | 1.32% |
| Supplemental Data | ||||||
| Net assets, end of period (in millions) | $7,418 | $7,351 | $6,421 | $7,209 | $7,464 | $7,800 |
| Portfolio turnover rateL | 49%K,M | 42% | 50%M | 60%M | 57% | 65% |
A Calculated based on average shares outstanding during the period.
B Net Investment Investment income per share reflects a large, non-recurring dividend which amounted to $.14 per share. Excluding this non-recurring dividend, the ratio of net investment income (loss) to average net assets would have been 1.23%.
C Net Investment income per share reflects a large, non-recurring dividend which amounted to $.12 per share. Excluding this non-recurring dividend, the ratio of net investment income (loss) to average net assets would have been 1.03%.
D Net Investment income per share reflects a large, non-recurring dividend which amounted to $.22 per share. Excluding this non-recurring dividend, the ratio of net investment income (loss) to average net assets would have been 1.15%.
E Total distributions of $.41 per share is comprised of distributions from net investment income of $.409 and distributions from net realized gain of $.005 per share.
F Amount represents less than $.005 per share.
G Total returns for periods of less than one year are not annualized.
H Total returns would have been lower if certain expenses had not been reduced during the applicable periods shown.
I Fees and expenses of any underlying Fidelity Central Funds are not included in the Fund's expense ratio. The Fund indirectly bears its proportionate share of the expenses of any underlying Fidelity Central Funds.
J Expense ratios reflect operating expenses of the class. Expenses before reductions do not reflect amounts reimbursed by the investment adviser or reductions from brokerage service arrangements or reductions from other expense offset arrangements and do not represent the amount paid by the class during periods when reimbursements or reductions occur. Expenses net of fee waivers reflect expenses after reimbursement by the investment adviser but prior to reductions from brokerage service arrangements or other expense offset arrangements. Expenses net of all reductions represent the net expenses paid by the class.
K Annualized
L Amount does not include the portfolio activity of any underlying Fidelity Central Funds.
M Portfolio turnover rate excludes securities received or delivered in-kind.
See accompanying notes which are an integral part of the financial statements.
Fidelity International Discovery Fund Class K
| Six months ended (Unaudited) April 30, | Years endedOctober 31, | |||||
| 2018 | 2017 | 2016 | 2015 | 2014 | 2013 | |
| Selected Per–Share Data | ||||||
| Net asset value, beginning of period | $46.96 | $37.86 | $40.06 | $38.97 | $39.76 | $31.87 |
| Income from Investment Operations | ||||||
| Net investment income (loss)A | .27 | .55 | .66B | .59C | .72D | .52 |
| Net realized and unrealized gain (loss) | .45 | 9.26 | (2.39) | .81 | (.67) | 8.01 |
| Total from investment operations | .72 | 9.81 | (1.73) | 1.40 | .05 | 8.53 |
| Distributions from net investment income | (.55) | (.66) | (.46) | (.31) | (.53) | (.61) |
| Distributions from net realized gain | (1.83) | (.05) | (.01) | – | (.31) | (.03) |
| Total distributions | (2.39)E | (.71) | (.47) | (.31) | (.84) | (.64) |
| Redemption fees added to paid in capitalA | – | –F | –F | –F | –F | –F |
| Net asset value, end of period | $45.29 | $46.96 | $37.86 | $40.06 | $38.97 | $39.76 |
| Total ReturnG,H | 1.61% | 26.47% | (4.38)% | 3.61% | .13% | 27.23% |
| Ratios to Average Net AssetsI,J | ||||||
| Expenses before reductions | .82%K | .82% | .86% | .86% | .80% | .85% |
| Expenses net of fee waivers, if any | .82%K | .82% | .86% | .86% | .80% | .85% |
| Expenses net of all reductions | .78%K | .80% | .85% | .85% | .79% | .83% |
| Net investment income (loss) | 1.15%K | 1.35% | 1.74%B | 1.47%C | 1.83%D | 1.47% |
| Supplemental Data | ||||||
| Net assets, end of period (in millions) | $2,423 | $2,228 | $1,880 | $2,308 | $2,464 | $2,576 |
| Portfolio turnover rateL | 49%K,M | 42% | 50%M | 60%M | 57% | 65% |
A Calculated based on average shares outstanding during the period.
B Net Investment income per share reflects a large, non-recurring dividend which amounted to $.14 per share. Excluding this non-recurring dividend, the ratio of net investment income (loss) to average net assets would have been 1.36%.
C Net Investment income per share reflects a large, non-recurring dividend which amounted to $.12 per share. Excluding this non-recurring dividend, the ratio of net investment income (loss) to average net assets would have been 1.16%.
D Net Investment income per share reflects a large, non-recurring dividend which amounted to $.22 per share. Excluding this non-recurring dividend, the ratio of net investment income (loss) to average net assets would have been 1.28%.
E Total distributions of $2.39 per share is comprised of distributions from net investment income of $.554 and distributions from net realized gain of $1.832 per share.
F Amount represents less than $.005 per share.
G Total returns for periods of less than one year are not annualized.
H Total returns would have been lower if certain expenses had not been reduced during the applicable periods shown.
I Fees and expenses of any underlying Fidelity Central Funds are not included in the Fund's expense ratio. The Fund indirectly bears its proportionate share of the expenses of any underlying Fidelity Central Funds.
J Expense ratios reflect operating expenses of the class. Expenses before reductions do not reflect amounts reimbursed by the investment adviser or reductions from brokerage service arrangements or reductions from other expense offset arrangements and do not represent the amount paid by the class during periods when reimbursements or reductions occur. Expenses net of fee waivers reflect expenses after reimbursement by the investment adviser but prior to reductions from brokerage service arrangements or other expense offset arrangements. Expenses net of all reductions represent the net expenses paid by the class.
K Annualized
L Amount does not include the portfolio activity of any underlying Fidelity Central Funds.
M Portfolio turnover rate excludes securities received or delivered in-kind.
See accompanying notes which are an integral part of the financial statements.
Fidelity International Discovery Fund Class I
| Six months ended (Unaudited) April 30, | Years endedOctober 31, | |||||
| 2018 | 2017 | 2016 | 2015 | 2014 | 2013 | |
| Selected Per–Share Data | ||||||
| Net asset value, beginning of period | $46.92 | $37.82 | $40.03 | $38.96 | $39.76 | $31.87 |
| Income from Investment Operations | ||||||
| Net investment income (loss)A | .23 | .49 | .61B | .53C | .67D | .47 |
| Net realized and unrealized gain (loss) | .46 | 9.27 | (2.40) | .80 | (.68) | 8.01 |
| Total from investment operations | .69 | 9.76 | (1.79) | 1.33 | (.01) | 8.48 |
| Distributions from net investment income | (.49) | (.61) | (.42) | (.26) | (.48) | (.56) |
| Distributions from net realized gain | (1.83) | (.05) | (.01) | – | (.31) | (.03) |
| Total distributions | (2.32) | (.66) | (.42)E | (.26) | (.79) | (.59) |
| Redemption fees added to paid in capitalA | – | –F | –F | –F | –F | –F |
| Net asset value, end of period | $45.29 | $46.92 | $37.82 | $40.03 | $38.96 | $39.76 |
| Total ReturnG,H | 1.56% | 26.29% | (4.52)% | 3.44% | (.01)% | 27.03% |
| Ratios to Average Net AssetsI,J | ||||||
| Expenses before reductions | .95%K | .96% | 1.00% | 1.00% | .93% | 1.00% |
| Expenses net of fee waivers, if any | .95%K | .96% | 1.00% | .99% | .93% | 1.00% |
| Expenses net of all reductions | .92%K | .94% | .99% | .98% | .93% | .97% |
| Net investment income (loss) | 1.01%K | 1.21% | 1.60%B | 1.33%C | 1.69%D | 1.33% |
| Supplemental Data | ||||||
| Net assets, end of period (in millions) | $645 | $658 | $745 | $1,061 | $650 | $476 |
| Portfolio turnover rateL | 49%K,M | 42% | 50%M | 60%M | 57% | 65% |
A Calculated based on average shares outstanding during the period.
B Net Investment income per share reflects a large, non-recurring dividend which amounted to $.14 per share. Excluding this non-recurring dividend, the ratio of net investment income (loss) to average net assets would have been 1.22%.
C Net Investment income per share reflects a large, non-recurring dividend which amounted to $.12 per share. Excluding this non-recurring dividend, the ratio of net investment income (loss) to average net assets would have been 1.03%.
D Net Investment income per share reflects a large, non-recurring dividend which amounted to $.22 per share. Excluding this non-recurring dividend, the ratio of net investment income (loss) to average net assets would have been 1.14%.
E Total distributions of $.42 per share is comprised of distributions from net investment income of $.418 and distributions from net realized gain of $.005 per share.
F Amount represents less than $.005 per share.
G Total returns for periods of less than one year are not annualized.
H Total returns would have been lower if certain expenses had not been reduced during the applicable periods shown.
I Fees and expenses of any underlying Fidelity Central Funds are not included in the Fund's expense ratio. The Fund indirectly bears its proportionate share of the expenses of any underlying Fidelity Central Funds.
J Expense ratios reflect operating expenses of the class. Expenses before reductions do not reflect amounts reimbursed by the investment adviser or reductions from brokerage service arrangements or reductions from other expense offset arrangements and do not represent the amount paid by the class during periods when reimbursements or reductions occur. Expenses net of fee waivers reflect expenses after reimbursement by the investment adviser but prior to reductions from brokerage service arrangements or other expense offset arrangements. Expenses net of all reductions represent the net expenses paid by the class.
K Annualized
L Amount does not include the portfolio activity of any underlying Fidelity Central Funds.
M Portfolio turnover rate excludes securities received or delivered in-kind.
See accompanying notes which are an integral part of the financial statements.
Fidelity International Discovery Fund Class Z
| Six months ended (Unaudited) April 30, | Years endedOctober 31, | |||||
| 2018 | 2017 | 2016 | 2015 | 2014 | 2013 A | |
| Selected Per–Share Data | ||||||
| Net asset value, beginning of period | $46.92 | $37.84 | $40.03 | $38.96 | $39.77 | $37.22 |
| Income from Investment Operations | ||||||
| Net investment income (loss)B | .26 | .56 | .66C | .59D | .72E | .07 |
| Net realized and unrealized gain (loss) | .47 | 9.24 | (2.38) | .80 | (.68) | 2.48 |
| Total from investment operations | .73 | 9.80 | (1.72) | 1.39 | .04 | 2.55 |
| Distributions from net investment income | (.56) | (.67) | (.46) | (.32) | (.54) | – |
| Distributions from net realized gain | (1.83) | (.05) | (.01) | – | (.31) | – |
| Total distributions | (2.39) | (.72) | (.47) | (.32) | (.85) | – |
| Redemption fees added to paid in capitalB | – | –F | –F | –F | –F | –F |
| Net asset value, end of period | $45.26 | $46.92 | $37.84 | $40.03 | $38.96 | $39.77 |
| Total ReturnG,H | 1.64% | 26.44% | (4.36)% | 3.58% | .12% | 6.85% |
| Ratios to Average Net AssetsI,J | ||||||
| Expenses before reductions | .82%K | .82% | .86% | .86% | .80% | .85%K |
| Expenses net of fee waivers, if any | .82%K | .82% | .86% | .86% | .80% | .85%K |
| Expenses net of all reductions | .78%K | .80% | .85% | .85% | .79% | .83%K |
| Net investment income (loss) | 1.15%K | 1.35% | 1.74%C | 1.47%D | 1.83%E | .76%K |
| Supplemental Data | ||||||
| Net assets, end of period (in millions) | $125 | $101 | $38 | $30 | $35 | $– |
| Portfolio turnover rateL | 49%K,M | 42% | 50%M | 60%M | 57% | 65% |
A For the period August 13, 2013 (commencement of sale of shares) to October 31, 2013.
B Calculated based on average shares outstanding during the period.
C Net Investment income per share reflects a large, non-recurring dividend which amounted to $.14 per share. Excluding this non-recurring dividend, the ratio of net investment income (loss) to average net assets would have been 1.36%.
D Net Investment income per share reflects a large, non-recurring dividend which amounted to $.12 per share. Excluding this non-recurring dividend, the ratio of net investment income (loss) to average net assets would have been 1.16%.
E Net Investment income per share reflects a large, non-recurring dividend which amounted to $.21 per share. Excluding this non-recurring dividend, the ratio of net investment income (loss) to average net assets would have been 1.28%.
F Amount represents less than $.005 per share.
G Total returns for periods of less than one year are not annualized.
H Total returns would have been lower if certain expenses had not been reduced during the applicable periods shown.
I Fees and expenses of any underlying Fidelity Central Funds are not included in the Fund's expense ratio. The Fund indirectly bears its proportionate share of the expenses of any underlying Fidelity Central Funds.
J Expense ratios reflect operating expenses of the class. Expenses before reductions do not reflect amounts reimbursed by the investment adviser or reductions from brokerage service arrangements or reductions from other expense offset arrangements and do not represent the amount paid by the class during periods when reimbursements or reductions occur. Expense ratios before reductions for start-up periods may not be representative of longer-term operating periods. Expenses net of fee waivers reflect expenses after reimbursement by the investment adviser but prior to reductions from brokerage service arrangements or other expense offset arrangements. Expenses net of all reductions represent the net expenses paid by the class.
K Annualized
L Amount does not include the portfolio activity of any underlying Fidelity Central Funds.
M Portfolio turnover rate excludes securities received or delivered in-kind.
See accompanying notes which are an integral part of the financial statements.
Notes to Financial Statements (Unaudited)
For the period ended April 30, 2018
(Amounts in thousands except percentages)
1. Organization.
Fidelity International Discovery Fund (the Fund) is a fund of Fidelity Investment Trust (the Trust) and is authorized to issue an unlimited number of shares. The Trust is registered under the Investment Company Act of 1940, as amended (the 1940 Act), as an open-end management investment company organized as a Massachusetts business trust. The Fund offers Class A, Class M, Class C, International Discovery, Class K, Class I and Class Z shares, each of which has equal rights as to assets and voting privileges. Each class has exclusive voting rights with respect to matters that affect that class.
2. Investments in Fidelity Central Funds.
The Fund invests in Fidelity Central Funds, which are open-end investment companies generally available only to other investment companies and accounts managed by the investment adviser and its affiliates. The Fund's Schedule of Investments lists each of the Fidelity Central Funds held as of period end, if any, as an investment of the Fund, but does not include the underlying holdings of each Fidelity Central Fund. As an Investing Fund, the Fund indirectly bears its proportionate share of the expenses of the underlying Fidelity Central Funds.
The Money Market Central Funds seek preservation of capital and current income and are managed by Fidelity Investments Money Management, Inc. (FIMM), an affiliate of the investment adviser. Annualized expenses of the Money Market Central Funds as of their most recent shareholder report date are less than .005%.
A complete unaudited list of holdings for each Fidelity Central Fund is available upon request or at the Securities and Exchange Commission (the SEC) website at www.sec.gov. In addition, the financial statements of the Fidelity Central Funds are available on the SEC website or upon request.
3. Significant Accounting Policies.
The Fund is an investment company and applies the accounting and reporting guidance of the Financial Accounting Standards Board (FASB) Accounting Standards Codification Topic 946 Financial Services – Investments Companies. The financial statements have been prepared in conformity with accounting principles generally accepted in the United States of America (GAAP), which require management to make certain estimates and assumptions at the date of the financial statements. Actual results could differ from those estimates. Subsequent events, if any, through the date that the financial statements were issued have been evaluated in the preparation of the financial statements. The following summarizes the significant accounting policies of the Fund:
Investment Valuation. Investments are valued as of 4:00 p.m. Eastern time on the last calendar day of the period. The Board of Trustees (the Board) has delegated the day to day responsibility for the valuation of the Fund's investments to the Fair Value Committee (the Committee) established by the Fund's investment adviser. In accordance with valuation policies and procedures approved by the Board, the Fund attempts to obtain prices from one or more third party pricing vendors or brokers to value its investments. When current market prices, quotations or currency exchange rates are not readily available or reliable, investments will be fair valued in good faith by the Committee, in accordance with procedures adopted by the Board. Factors used in determining fair value vary by investment type and may include market or investment specific events, changes in interest rates and credit quality. The frequency with which these procedures are used cannot be predicted and they may be utilized to a significant extent. The Committee oversees the Fund's valuation policies and procedures and reports to the Board on the Committee's activities and fair value determinations. The Board monitors the appropriateness of the procedures used in valuing the Fund's investments and ratifies the fair value determinations of the Committee.
The Fund categorizes the inputs to valuation techniques used to value its investments into a disclosure hierarchy consisting of three levels as shown below:
- Level 1 – quoted prices in active markets for identical investments
- Level 2 – other significant observable inputs (including quoted prices for similar investments, interest rates, prepayment speeds, etc.)
- Level 3 – unobservable inputs (including the Fund's own assumptions based on the best information available)
Valuation techniques used to value the Fund's investments by major category are as follows:
Equity securities, including restricted securities, for which market quotations are readily available, are valued at the last reported sale price or official closing price as reported by a third party pricing vendor on the primary market or exchange on which they are traded and are categorized as Level 1 in the hierarchy. In the event there were no sales during the day or closing prices are not available, securities are valued at the last quoted bid price or may be valued using the last available price and are generally categorized as Level 2 in the hierarchy. For foreign equity securities, when market or security specific events arise, comparisons to the valuation of American Depositary Receipts (ADRs), futures contracts, Exchange-Traded Funds (ETFs) and certain indexes as well as quoted prices for similar securities may be used and would be categorized as Level 2 in the hierarchy. Utilizing these techniques may result in transfers between Level 1 and Level 2. For equity securities, including restricted securities, where observable inputs are limited, assumptions about market activity and risk are used and these securities may be categorized as Level 3 in the hierarchy.
Debt securities, including restricted securities, are valued based on evaluated prices received from third party pricing vendors or from brokers who make markets in such securities. U.S. government and government agency obligations are valued by pricing vendors who utilize matrix pricing which considers yield or price of bonds of comparable quality, coupon, maturity and type or by broker-supplied prices. When independent prices are unavailable or unreliable, debt securities may be valued utilizing pricing methodologies which consider similar factors that would be used by third party pricing vendors. Debt securities are generally categorized as Level 2 in the hierarchy but may be Level 3 depending on the circumstances.
Futures contracts are valued at the settlement price established each day by the board of trade or exchange on which they are traded and are categorized as Level 1 in the hierarchy. Investments in open-end mutual funds, including the Fidelity Central Funds, are valued at their closing net asset value (NAV) each business day and are categorized as Level 1 in the hierarchy.
Changes in valuation techniques may result in transfers in or out of an assigned level within the disclosure hierarchy. The aggregate value of investments by input level as of April 30, 2018, including information on transfers between Levels 1 and 2, is included at the end of the Fund's Schedule of Investments.
Foreign Currency. The Fund may use foreign currency contracts to facilitate transactions in foreign-denominated securities. Gains and losses from these transactions may arise from changes in the value of the foreign currency or if the counterparties do not perform under the contracts' terms.
Foreign-denominated assets, including investment securities, and liabilities are translated into U.S. dollars at the exchange rates at period end. Purchases and sales of investment securities, income and dividends received and expenses denominated in foreign currencies are translated into U.S. dollars at the exchange rate in effect on the transaction date.
The effects of exchange rate fluctuations on investments are included with the net realized and unrealized gain (loss) on investment securities. Other foreign currency transactions resulting in realized and unrealized gain (loss) are disclosed separately.
Investment Transactions and Income. For financial reporting purposes, the Fund's investment holdings and NAV include trades executed through the end of the last business day of the period. The NAV per share for processing shareholder transactions is calculated as of the close of business of the New York Stock Exchange (NYSE), normally 4:00 p.m. Eastern time and includes trades executed through the end of the prior business day. Gains and losses on securities sold are determined on the basis of identified cost and includes proceeds received from litigation. Dividend income is recorded on the ex-dividend date, except for certain dividends from foreign securities where the ex-dividend date may have passed, which are recorded as soon as the Fund is informed of the ex-dividend date. Non-cash dividends included in dividend income, if any, are recorded at the fair market value of the securities received. Income and capital gain distributions from Fidelity Central Funds, if any, are recorded on the ex-dividend date. Certain distributions received by the Fund represent a return of capital or capital gain. The Fund determines the components of these distributions subsequent to the ex-dividend date, based upon receipt of tax filings or other correspondence relating to the underlying investment. These distributions are recorded as a reduction of cost of investments and/or as a realized gain. Interest income is accrued as earned and includes coupon interest and amortization of premium and accretion of discount on debt securities as applicable. Investment income is recorded net of foreign taxes withheld where recovery of such taxes is uncertain.
Class Allocations and Expenses. Investment income, realized and unrealized capital gains and losses, common expenses of the Fund, and certain fund-level expense reductions, if any, are allocated daily on a pro-rata basis to each class based on the relative net assets of each class to the total net assets of the Fund. Each class differs with respect to transfer agent and distribution and service plan fees incurred. Certain expense reductions may also differ by class. For the reporting period, the allocated portion of income and expenses to each class as a percent of its average net assets may vary due to the timing of recording these transactions in relation to fluctuating net assets of the classes. Expenses directly attributable to a fund are charged to that fund. Expenses attributable to more than one fund are allocated among the respective funds on the basis of relative net assets or other appropriate methods. Expense estimates are accrued in the period to which they relate and adjustments are made when actual amounts are known.
Deferred Trustee Compensation. Under a Deferred Compensation Plan (the Plan), certain independent Trustees have elected to defer receipt of a portion of their annual compensation. Deferred amounts are invested in a cross-section of Fidelity funds, are marked-to-market and remain in the Fund until distributed in accordance with the Plan. The investment of deferred amounts and the offsetting payable to the Trustees are included in the accompanying Statement of Assets and Liabilities.
Income Tax Information and Distributions to Shareholders. Each year, the Fund intends to qualify as a regulated investment company under Subchapter M of the Internal Revenue Code, including distributing substantially all of its taxable income and realized gains. As a result, no provision for U.S. Federal income taxes is required. The Fund files a U.S. federal tax return, in addition to state and local tax returns as required. The Fund's federal income tax returns are subject to examination by the Internal Revenue Service (IRS) for a period of three fiscal years after they are filed. State and local tax returns may be subject to examination for an additional fiscal year depending on the jurisdiction. Foreign taxes are provided for based on the Fund's understanding of the tax rules and rates that exist in the foreign markets in which it invests.
Distributions are declared and recorded on the ex-dividend date. Income and capital gain distributions are declared separately for each class. Income and capital gain distributions are determined in accordance with income tax regulations, which may differ from GAAP.
Capital accounts within the financial statements are adjusted for permanent book-tax differences. These adjustments have no impact on net assets or the results of operations. Capital accounts are not adjusted for temporary book-tax differences which will reverse in a subsequent period.
Book-tax differences are primarily due to foreign currency transactions, passive foreign investment companies (PFIC), market discount, deferred trustees compensation and losses deferred due to wash sales.
As of period end, the cost and unrealized appreciation (depreciation) in securities, and derivatives if applicable, for federal income tax purposes were as follows:
| Gross unrealized appreciation | $2,282,333 |
| Gross unrealized depreciation | (277,823) |
| Net unrealized appreciation (depreciation) | $2,004,510 |
| Tax cost | $8,987,882 |
Restricted Securities. The Fund may invest in securities that are subject to legal or contractual restrictions on resale. These securities generally may be resold in transactions exempt from registration or to the public if the securities are registered. Disposal of these securities may involve time-consuming negotiations and expense, and prompt sale at an acceptable price may be difficult. Information regarding restricted securities is included at the end of the Fund's Schedule of Investments.
4. Derivative Instruments.
Risk Exposures and the Use of Derivative Instruments. The Fund's investment objective allows the Fund to enter into various types of derivative contracts, including futures contracts. Derivatives are investments whose value is primarily derived from underlying assets, indices or reference rates and may be transacted on an exchange or over-the-counter (OTC). Derivatives may involve a future commitment to buy or sell a specified asset based on specified terms, to exchange future cash flows at periodic intervals based on a notional principal amount, or for one party to make one or more payments upon the occurrence of specified events in exchange for periodic payments from the other party.
The Fund used derivatives to increase returns and to manage exposure to certain risks as defined below. The success of any strategy involving derivatives depends on analysis of numerous economic factors, and if the strategies for investment do not work as intended, the Fund may not achieve its objectives.
The Fund's use of derivatives increased or decreased its exposure to the following risk:
| Equity Risk | Equity risk relates to the fluctuations in the value of financial instruments as a result of changes in market prices (other than those arising from interest rate risk or foreign exchange risk), whether caused by factors specific to an individual investment, its issuer, or all factors affecting all instruments traded in a market or market segment. |
The Fund is also exposed to additional risks from investing in derivatives, such as liquidity risk and counterparty credit risk. Liquidity risk is the risk that the Fund will be unable to close out the derivative in the open market in a timely manner. Counterparty credit risk is the risk that the counterparty will not be able to fulfill its obligation to the Fund. Counterparty credit risk related to exchange-traded futures contracts may be mitigated by the protection provided by the exchange on which they trade.
Investing in derivatives may involve greater risks than investing in the underlying assets directly and, to varying degrees, may involve risk of loss in excess of any initial investment and collateral received and amounts recognized in the Statement of Assets and Liabilities. In addition, there may be the risk that the change in value of the derivative contract does not correspond to the change in value of the underlying instrument.
Futures Contracts. A futures contract is an agreement between two parties to buy or sell a specified underlying instrument for a fixed price at a specified future date. The Fund used futures contracts to manage its exposure to the stock market.
Upon entering into a futures contract, a fund is required to deposit either cash or securities (initial margin) with a clearing broker in an amount equal to a certain percentage of the face value of the contract. Futures contracts are marked-to-market daily and subsequent daily payments (variation margin) are made or received by a fund depending on the daily fluctuations in the value of the futures contracts and are recorded as unrealized appreciation or (depreciation). This receivable and/or payable, if any, is included in daily variation margin on futures contracts in the Statement of Assets and Liabilities. Realized gain or (loss) is recorded upon the expiration or closing of a futures contract. The net realized gain (loss) and change in net unrealized appreciation (depreciation) on futures contracts during the period is presented in the Statement of Operations.
Any open futures contracts at period end are presented in the Schedule of Investments under the caption "Futures Contracts". The notional amount at value reflects each contract's exposure to the underlying instrument or index at period end and is representative of volume of activity during the period. Securities deposited to meet initial margin requirements are identified in the Schedule of Investments.
5. Purchases and Sales of Investments.
Purchases and sales of securities, other than short-term securities and in-kind transactions, aggregated $2,572,165 and $2,693,181, respectively.
Redemptions In-Kind. During the period, 760 shares of the Fund held by unaffiliated entities were redeemed in-kind for investments and cash with a value of $34,857. The net realized gain of $9,586 on investments delivered through the in-kind redemptions is included in the accompanying Statement of Operations. The amount of the redemptions is included in share transactions activity shown in the accompanying Statement of Changes in Net Assets as well as the Notes to Financial Statements. The Fund recognized no gain or loss for federal income tax purposes.
6. Fees and Other Transactions with Affiliates.
Management Fee. Fidelity Management & Research Company (the investment adviser) and its affiliates provide the Fund with investment management related services for which the Fund pays a monthly management fee. The management fee is the sum of an individual fund fee rate that is based on an annual rate of .424% of the Fund's average net assets and an annualized group fee rate that averaged .24% during the period. The group fee rate is based upon the average net assets of all the mutual funds advised by the investment adviser, including any mutual funds previously advised by the investment adviser that are currently advised by Fidelity SelectCo, LLC, an affiliate of the investment adviser. The group fee rate decreases as assets under management increase and increases as assets under management decrease. In addition, the management fee is subject to a performance adjustment (up to a maximum of +/- .20% of the Fund's average net assets over a 36 month performance period). The upward or downward adjustment to the management fee is based on the relative investment performance of International Discovery as compared to its benchmark index, the MSCI EAFE Index, over the same 36 month performance period. For the reporting period, the total annualized management fee rate, including the performance adjustment, was .73% of the Fund's average net assets. The performance adjustment included in the management fee rate may be higher or lower than the maximum performance adjustment rate due to the difference between the average net assets for the reporting and performance periods.
Distribution and Service Plan Fees. In accordance with Rule 12b-1 of the 1940 Act, the Fund has adopted separate Distribution and Service Plans for each class of shares. Certain classes pay Fidelity Distributors Corporation (FDC), an affiliate of the investment adviser, separate Distribution and Service Fees, each of which is based on an annual percentage of each class' average net assets. In addition, FDC may pay financial intermediaries for selling shares of the Fund and providing shareholder support services. For the period, the Distribution and Service Fee rates, total fees and amounts retained by FDC were as follows:
| Distribution Fee | Service Fee | Total Fees | Retained by FDC | |
| Class A | -% | .25% | $304 | $8 |
| Class M | .25% | .25% | 88 | 1 |
| Class C | .75% | .25% | 140 | 12 |
| $532 | $21 |
Sales Load. FDC may receive a front-end sales charge of up to 5.75% for selling Class A shares and 3.50% for selling Class M shares, some of which is paid to financial intermediaries for selling shares of the Fund. Depending on the holding period, FDC may receive contingent deferred sales charges levied on Class A, Class M and Class C redemptions. The deferred sales charges are 1.00% for Class C shares, 1.00% for certain purchases of Class A shares and .25% for certain purchases of Class M shares.
For the period, sales charge amounts retained by FDC were as follows:
| Retained by FDC | |
| Class A | $26 |
| Class M | 2 |
| Class C(a) | 2 |
| $30 |
(a) When Class C shares are initially sold, FDC pays commissions from its own resources to financial intermediaries through which the sales are made.
Transfer Agent Fees. Fidelity Investments Institutional Operations Company, Inc., (FIIOC), an affiliate of the investment adviser, is the transfer, dividend disbursing and shareholder servicing agent for each class of the Fund. FIIOC receives account fees and asset-based fees that vary according to the account size and type of account of the shareholders of the respective classes of the Fund, except for Class K and Class Z. FIIOC receives an asset-based fee of Class K's and Class Z's average net assets. FIIOC pays for typesetting, printing and mailing of shareholder reports, except proxy statements.
For the period, transfer agent fees for each class were as follows:
| Amount | % of Class-Level Average Net Assets(a) | |
| Class A | $297 | .24 |
| Class M | 41 | .23 |
| Class C | 38 | .27 |
| International Discovery | 5,806 | .15 |
| Class K | 533 | .05 |
| Class I | 599 | .18 |
| Class Z | 25 | .05 |
| $7,339 |
(a) Annualized
Accounting and Security Lending Fees. Fidelity Service Company, Inc. (FSC), an affiliate of the investment adviser, maintains the Fund's accounting records. The accounting fee is based on the level of average net assets for each month. Under a separate contract, FSC administers the security lending program. The security lending fee is based on the number and duration of lending transactions. For the period, the fees were equivalent to an annualized rate of .02%.
Brokerage Commissions. The Fund placed a portion of its portfolio transactions with brokerage firms which are affiliates of the investment adviser. Brokerage commissions are included in net realized gain (loss) and change in net unrealized appreciation (depreciation) in the Statement of Operations. The commissions paid to these affiliated firms were $14 for the period.
Interfund Trades. The Fund may purchase from or sell securities to other Fidelity Funds under procedures adopted by the Board. The procedures have been designed to ensure these interfund trades are executed in accordance with Rule 17a-7 of the 1940 Act. Interfund trades are included within the respective purchases and sales amounts shown in the Purchases and Sales of Investments note.
7. Committed Line of Credit.
The Fund participates with other funds managed by the investment adviser or an affiliate in a $4.25 billion credit facility (the "line of credit") to be utilized for temporary or emergency purposes to fund shareholder redemptions or for other short-term liquidity purposes. The Fund has agreed to pay commitment fees on its pro-rata portion of the line of credit, which amounted to $16 and is reflected in Miscellaneous expenses on the Statement of Operations. During the period, the Fund did not borrow on this line of credit.
8. Security Lending.
The Fund lends portfolio securities through a lending agent from time to time in order to earn additional income. For equity securities, a lending agent is used and may loan securities to certain qualified borrowers, including Fidelity Capital Markets (FCM), a broker-dealer affiliated with the Fund. On the settlement date of the loan, the Fund receives collateral (in the form of U.S. Treasury obligations, letters of credit and/or cash) against the loaned securities and maintains collateral in an amount not less than 100% of the market value of the loaned securities during the period of the loan. The market value of the loaned securities is determined at the close of business of the Fund and any additional required collateral is delivered to the Fund on the next business day. The Fund or borrower may terminate the loan at any time, and if the borrower defaults on its obligation to return the securities loaned because of insolvency or other reasons, the Fund may apply collateral received from the borrower against the obligation. The Fund may experience delays and costs in recovering the securities loaned. Any cash collateral received is invested in the Fidelity Securities Lending Cash Central Fund. The value of loaned securities and cash collateral at period end are disclosed on the Fund's Statement of Assets and Liabilities. At period end, there were no security loans outstanding with FCM. Security lending income represents the income earned on investing cash collateral, less rebates paid to borrowers and any lending agent fees associated with the loan, plus any premium payments received for lending certain types of securities. Security lending income is presented in the Statement of Operations as a component of income from Fidelity Central Funds. Total security lending income during the period amounted to $1,662, including less than five hundred dollars from securities loaned to FCM.
9. Expense Reductions.
Commissions paid to certain brokers with whom the investment adviser, or its affiliates, places trades on behalf of the Fund include an amount in addition to trade execution, which may be rebated back to the Fund to offset certain expenses. This amount totaled $1,870 for the period. In addition, through arrangements with the Fund's custodian, credits realized as a result of certain uninvested cash balances were used to reduce the Fund's expenses. During the period, these credits reduced the Fund's custody expenses by less than five hundred dollars.
In addition, during the period the investment adviser reimbursed and/or waived a portion of fund-level operating expenses in the amount of $54.
10. Distributions to Shareholders.
Distributions to shareholders of each class were as follows:
| Six months ended April 30, 2018 | Year ended October 31, 2017 | |
| From net investment income | ||
| Class A | $1,762 | $2,894 |
| Class M | 180 | 333 |
| Class C | 13 | 92 |
| International Discovery | 79,321 | 102,284 |
| Class K | 26,857 | 32,411 |
| Class I | 6,835 | 11,493 |
| Class Z | 1,196 | 667 |
| Total | $116,164 | $150,174 |
| From net realized gain | ||
| Class A | $9,495 | $302 |
| Class M | 1,377 | 44 |
| Class C | 1,119 | 33 |
| International Discovery | 289,470 | 8,190 |
| Class K | 88,812 | 2,392 |
| Class I | 25,555 | 929 |
| Class Z | 3,949 | 49 |
| Total | $419,777 | $11,939 |
11. Share Transactions.
Share transactions for each class were as follows and may contain automatic conversions between classes or exchanges between affiliated funds:
| Shares | Shares | Dollars | Dollars | |
| Six months ended April 30, 2018 | Year ended October 31, 2017 | Six months ended April 30, 2018 | Year ended October 31, 2017 | |
| Class A | ||||
| Shares sold | 399 | 712 | $18,387 | $29,106 |
| Reinvestment of distributions | 252 | 87 | 11,177 | 3,152 |
| Shares redeemed | (769) | (1,774) | (35,245) | (71,253) |
| Net increase (decrease) | (118) | (975) | $(5,681) | $(38,995) |
| Class M | ||||
| Shares sold | 62 | 80 | $2,857 | $3,246 |
| Reinvestment of distributions | 35 | 10 | 1,549 | 365 |
| Shares redeemed | (81) | (274) | (3,729) | (10,830) |
| Net increase (decrease) | 16 | (184) | $677 | $(7,219) |
| Class C | ||||
| Shares sold | 38 | 83 | $1,702 | $3,499 |
| Reinvestment of distributions | 25 | 3 | 1,083 | 116 |
| Shares redeemed | (88) | (174) | (3,994) | (6,878) |
| Net increase (decrease) | (25) | (88) | $(1,209) | $(3,263) |
| International Discovery | ||||
| Shares sold | 9,874 | 19,989 | $457,393 | $812,564 |
| Reinvestment of distributions | 7,869 | 2,884 | 351,491 | 105,223 |
| Shares redeemed | (10,645) | (35,967) | (491,376) | (1,442,640) |
| Net increase (decrease) | 7,098 | (13,094) | $317,508 | $(524,853) |
| Class K | ||||
| Shares sold | 9,665 | 10,877 | $445,759 | $448,875 |
| Reinvestment of distributions | 2,597 | 957 | 115,669 | 34,802 |
| Shares redeemed | (6,230)(a) | (14,039) | (287,754)(a) | (560,342) |
| Net increase (decrease) | 6,032 | (2,205) | $273,674 | $(76,665) |
| Class I | ||||
| Shares sold | 1,311 | 3,202 | $60,349 | $130,302 |
| Reinvestment of distributions | 224 | 82 | 9,992 | 2,985 |
| Shares redeemed | (1,328) | (8,961) | (60,918) | (349,072) |
| Net increase (decrease) | 207 | (5,677) | $9,423 | $(215,785) |
| Class Z | ||||
| Shares sold | 763 | 1,483 | $35,035 | $58,502 |
| Reinvestment of distributions | 67 | 20 | 2,993 | 716 |
| Shares redeemed | (223) | (351) | (10,309) | (14,440) |
| Net increase (decrease) | 607 | 1,152 | $27,719 | $44,778 |
(a) Amount includes in-kind redemptions (see the Redemptions In-Kind note for additional details).
12. Other.
The Fund's organizational documents provide former and current trustees and officers with a limited indemnification against liabilities arising in connection with the performance of their duties to the Fund. In the normal course of business, the Fund may also enter into contracts that provide general indemnifications. The Fund's maximum exposure under these arrangements is unknown as this would be dependent on future claims that may be made against the Fund. The risk of material loss from such claims is considered remote.
At the end of the period, Strategic Advisers International Fund was the owner of record of approximately 11% of the total outstanding shares of the Fund.
Shareholder Expense Example
As a shareholder of the Fund, you incur two types of costs: (1) transaction costs, including sales charges (loads) on purchase payments or redemption proceeds, redemption fees and (2) ongoing costs, including management fees, distribution and/or service (12b-1) fees and other Fund expenses. This Example is intended to help you understand your ongoing costs (in dollars) of investing in the Fund and to compare these costs with the ongoing costs of investing in other mutual funds.
The Example is based on an investment of $1,000 invested at the beginning of the period and held for the entire period (November 1, 2017 to April 30, 2018).
Actual Expenses
The first line of the accompanying table for each class of the Fund provides information about actual account values and actual expenses. You may use the information in this line, together with the amount you invested, to estimate the expenses that you paid over the period. Simply divide your account value by $1,000.00 (for example, an $8,600 account value divided by $1,000.00 = 8.6), then multiply the result by the number in the first line for a class of the Fund under the heading entitled "Expenses Paid During Period" to estimate the expenses you paid on your account during this period. A small balance maintenance fee of $12.00 that is charged once a year may apply for certain accounts with a value of less than $2,000. This fee is not included in the table below. If it was, the estimate of expenses you paid during the period would be higher, and your ending account value lower, by this amount. In addition, the Fund, as a shareholder in the underlying Fidelity Central Funds, will indirectly bear its pro-rata share of the fees and expenses incurred by the underlying Fidelity Central Funds. These fees and expenses are not included in the Fund's annualized expense ratio used to calculate the expense estimate in the table below.
Hypothetical Example for Comparison Purposes
The second line of the accompanying table for each class of the Fund provides information about hypothetical account values and hypothetical expenses based on a Class' actual expense ratio and an assumed rate of return of 5% per year before expenses, which is not the Class' actual return. The hypothetical account values and expenses may not be used to estimate the actual ending account balance or expenses you paid for the period. You may use this information to compare the ongoing costs of investing in the Fund and other funds. To do so, compare this 5% hypothetical example with the 5% hypothetical examples that appear in the shareholder reports of the other funds. A small balance maintenance fee of $12.00 that is charged once a year may apply for certain accounts with a value of less than $2,000. This fee is not included in the table below. If it was, the estimate of expenses you paid during the period would be higher, and your ending account value lower, by this amount. In addition, the Fund, as a shareholder in the underlying Fidelity Central Funds, will indirectly bear its pro-rata share of the fees and expenses incurred by the underlying Fidelity Central Funds. These fees and expenses are not included in the Fund's annualized expense ratio used to calculate the expense estimate in the table below.
Please note that the expenses shown in the table are meant to highlight your ongoing costs only and do not reflect any transaction costs. Therefore, the second line of the table is useful in comparing ongoing costs only, and will not help you determine the relative total costs of owning different funds. In addition, if these transactional costs were included, your costs would have been higher.
| Annualized Expense Ratio-A | Beginning Account Value November 1, 2017 | Ending Account Value April 30, 2018 | Expenses Paid During Period-B November 1, 2017 to April 30, 2018 | |
| Class A | 1.26% | |||
| Actual | $1,000.00 | $1,014.00 | $6.29 | |
| Hypothetical-C | $1,000.00 | $1,018.55 | $6.31 | |
| Class M | 1.50% | |||
| Actual | $1,000.00 | $1,013.00 | $7.49 | |
| Hypothetical-C | $1,000.00 | $1,017.36 | $7.50 | |
| Class C | 2.04% | |||
| Actual | $1,000.00 | $1,009.90 | $10.17 | |
| Hypothetical-C | $1,000.00 | $1,014.68 | $10.19 | |
| International Discovery | .93% | |||
| Actual | $1,000.00 | $1,015.60 | $4.65 | |
| Hypothetical-C | $1,000.00 | $1,020.18 | $4.66 | |
| Class K | .82% | |||
| Actual | $1,000.00 | $1,016.10 | $4.10 | |
| Hypothetical-C | $1,000.00 | $1,020.73 | $4.11 | |
| Class I | .95% | |||
| Actual | $1,000.00 | $1,015.60 | $4.75 | |
| Hypothetical-C | $1,000.00 | $1,020.08 | $4.76 | |
| Class Z | .82% | |||
| Actual | $1,000.00 | $1,016.40 | $4.10 | |
| Hypothetical-C | $1,000.00 | $1,020.73 | $4.11 |
A Annualized expense ratio reflects expenses net of applicable fee waivers.
B Expenses are equal to each Class' annualized expense ratio, multiplied by the average account value over the period, multiplied by 181/365 (to reflect the one-half year period).
C 5% return per year before expenses
![]()
AID-SANN-0618
1.806665.113
Fidelity® International Discovery Fund Semi-Annual Report April 30, 2018 |
|
Contents
To view a fund's proxy voting guidelines and proxy voting record for the 12-month period ended June 30, visit http://www.fidelity.com/proxyvotingresults or visit the Securities and Exchange Commission's (SEC) web site at http://www.sec.gov.
You may also call 1-800-835-5092 to request a free copy of the proxy voting guidelines.
Standard & Poor's, S&P and S&P 500 are registered service marks of The McGraw-Hill Companies, Inc. and have been licensed for use by Fidelity Distributors Corporation.
Other third-party marks appearing herein are the property of their respective owners.
All other marks appearing herein are registered or unregistered trademarks or service marks of FMR LLC or an affiliated company. © 2018 FMR LLC. All rights reserved.
This report and the financial statements contained herein are submitted for the general information of the shareholders of the Fund. This report is not authorized for distribution to prospective investors in the Fund unless preceded or accompanied by an effective prospectus.
A fund files its complete schedule of portfolio holdings with the SEC for the first and third quarters of each fiscal year on Form N-Q. Forms N-Q are available on the SEC’s web site at http://www.sec.gov. A fund's Forms N-Q may be reviewed and copied at the SEC’s Public Reference Room in Washington, DC. Information regarding the operation of the SEC's Public Reference Room may be obtained by calling 1-800-SEC-0330.
For a complete list of a fund's portfolio holdings, view the most recent holdings listing, semiannual report, or annual report on Fidelity's web site at http://www.fidelity.com, http://www.institutional.fidelity.com, or http://www.401k.com, as applicable.
NOT FDIC INSURED •MAY LOSE VALUE •NO BANK GUARANTEE
Neither the Fund nor Fidelity Distributors Corporation is a bank.
Investment Summary (Unaudited)
Geographic Diversification (% of fund's net assets)
| As of April 30, 2018 | ||
| Japan | 19.1% | |
| United Kingdom | 11.5% | |
| France | 10.4% | |
| Germany | 7.5% | |
| Switzerland | 6.4% | |
| Netherlands | 5.2% | |
| Spain | 4.3% | |
| Ireland | 3.7% | |
| India | 3.7% | |
| Other* | 28.2% | |

* Includes Short-Term Investments and Net Other Assets (Liabilities).
Percentages are based on country or territory of incorporation and are adjusted for the effect of futures contracts, if applicable.
Asset Allocation as of April 30, 2018
| % of fund's net assets | |
| Stocks and Equity Futures | 96.5 |
| Short-Term Investments and Net Other Assets (Liabilities) | 3.5 |
Top Ten Stocks as of April 30, 2018
| % of fund's net assets | |
| Total SA (France, Oil, Gas & Consumable Fuels) | 2.5 |
| Statoil ASA (Norway, Oil, Gas & Consumable Fuels) | 2.1 |
| SAP SE (Germany, Software) | 1.5 |
| AstraZeneca PLC (United Kingdom) (United Kingdom, Pharmaceuticals) | 1.4 |
| CaixaBank SA (Spain, Banks) | 1.4 |
| Roche Holding AG (participation certificate) (Switzerland, Pharmaceuticals) | 1.4 |
| ORIX Corp. (Japan, Diversified Financial Services) | 1.3 |
| Unilever NV (Certificaten Van Aandelen) (Bearer) (Netherlands, Personal Products) | 1.3 |
| Housing Development Finance Corp. Ltd. (India, Thrifts & Mortgage Finance) | 1.2 |
| VINCI SA (France, Construction & Engineering) | 1.2 |
| 15.3 |
Top Market Sectors as of April 30, 2018
| % of fund's net assets | |
| Financials | 22.3 |
| Industrials | 13.9 |
| Consumer Discretionary | 11.9 |
| Health Care | 10.0 |
| Information Technology | 9.6 |
| Consumer Staples | 8.5 |
| Materials | 7.1 |
| Energy | 6.1 |
| Real Estate | 1.9 |
| Telecommunication Services | 1.5 |
Schedule of Investments April 30, 2018 (Unaudited)
Showing Percentage of Net Assets
| Common Stocks - 92.1% | |||
| Shares | Value (000s) | ||
| Australia - 1.5% | |||
| Bapcor Ltd. (a) | 8,531,892 | $37,643 | |
| Blue Sky Alternative Investments Ltd. | 3,175,826 | 7,320 | |
| BWX Ltd. (a) | 2,157,954 | 8,187 | |
| Inghams Group Ltd. (a) | 7,320,478 | 20,655 | |
| Link Administration Holdings Ltd. | 3,223,548 | 20,058 | |
| Magellan Financial Group Ltd. | 1,200,134 | 20,967 | |
| National Storage (REIT) unit | 11,386,057 | 13,670 | |
| Rio Tinto Ltd. | 185,386 | 11,033 | |
| Spark Infrastructure Group unit | 14,202,580 | 25,042 | |
| TOTAL AUSTRALIA | 164,575 | ||
| Austria - 1.4% | |||
| Erste Group Bank AG | 1,736,200 | 85,123 | |
| Wienerberger AG | 2,643,500 | 66,719 | |
| TOTAL AUSTRIA | 151,842 | ||
| Bailiwick of Jersey - 1.1% | |||
| Glencore Xstrata PLC | 24,686,927 | 119,191 | |
| Belgium - 1.7% | |||
| Anheuser-Busch InBev SA NV (a) | 407,427 | 40,699 | |
| KBC Groep NV | 1,370,241 | 119,800 | |
| Telenet Group Holding NV (b) | 453,400 | 26,588 | |
| TOTAL BELGIUM | 187,087 | ||
| Bermuda - 0.4% | |||
| Hiscox Ltd. | 2,360,300 | 48,384 | |
| Brazil - 0.0% | |||
| Itausa-Investimentos Itau SA | 391,494 | 1,509 | |
| Canada - 2.0% | |||
| Alimentation Couche-Tard, Inc. Class B (sub. vtg.) | 698,400 | 30,194 | |
| Cenovus Energy, Inc. | 3,278,900 | 32,841 | |
| Constellation Software, Inc. | 73,200 | 52,316 | |
| PrairieSky Royalty Ltd. (a) | 2,359,273 | 52,314 | |
| Suncor Energy, Inc. | 1,427,200 | 54,578 | |
| TOTAL CANADA | 222,243 | ||
| Cayman Islands - 1.3% | |||
| Alibaba Group Holding Ltd. sponsored ADR (b) | 447,200 | 79,843 | |
| China Literature Ltd. (b)(c) | 3,275,200 | 26,382 | |
| New Oriental Education & Technology Group, Inc. sponsored ADR | 255,000 | 22,909 | |
| Ping An Healthcare and Technology Co. Ltd. (b) | 453,000 | 3,163 | |
| Zai Lab Ltd. ADR (a) | 388,800 | 7,259 | |
| TOTAL CAYMAN ISLANDS | 139,556 | ||
| China - 1.4% | |||
| Jiangsu Yanghe Brewery Joint-Stock Co. Ltd. Class A | 2,538,600 | 44,731 | |
| Kweichow Moutai Co. Ltd. (A Shares) | 474,382 | 49,397 | |
| Qingdao Port International Co. Ltd. (c) | 11,117,000 | 9,133 | |
| Shanghai International Airport Co. Ltd. (A Shares) | 5,665,100 | 44,495 | |
| TOTAL CHINA | 147,756 | ||
| Denmark - 0.6% | |||
| Novo Nordisk A/S Series B | 930,645 | 43,766 | |
| Novozymes A/S Series B | 391,900 | 18,424 | |
| TOTAL DENMARK | 62,190 | ||
| Finland - 0.5% | |||
| Sampo Oyj (A Shares) | 895,600 | 48,398 | |
| France - 10.4% | |||
| Accor SA | 950,500 | 53,799 | |
| ALTEN | 335,159 | 33,310 | |
| Altran Technologies SA (a) | 1,487,300 | 22,990 | |
| Amundi SA (c) | 546,458 | 46,510 | |
| Atos Origin SA | 243,414 | 32,893 | |
| BNP Paribas SA | 945,800 | 73,075 | |
| Capgemini SA | 487,000 | 67,044 | |
| Cegedim SA (b) | 581,063 | 24,700 | |
| Elis SA | 1,195,800 | 28,621 | |
| Kaufman & Broad SA | 144,863 | 7,638 | |
| LVMH Moet Hennessy - Louis Vuitton SA | 240,539 | 83,710 | |
| Rexel SA | 2,126,400 | 32,997 | |
| Sartorius Stedim Biotech | 305,000 | 28,508 | |
| SMCP S.A.S. (c) | 642,504 | 16,406 | |
| Societe Generale Series A | 2,222,100 | 121,613 | |
| Thales SA | 437,100 | 55,423 | |
| Total SA (a) | 4,305,010 | 270,571 | |
| VINCI SA (a) | 1,308,500 | 130,829 | |
| TOTAL FRANCE | 1,130,637 | ||
| Germany - 7.5% | |||
| adidas AG | 447,307 | 110,140 | |
| Aumann AG (c) | 133,451 | 8,074 | |
| Deutsche Borse AG | 163,981 | 22,054 | |
| Deutsche Post AG | 2,231,918 | 96,875 | |
| Fresenius SE & Co. KGaA | 901,300 | 68,940 | |
| Henkel AG & Co. KGaA | 321,600 | 38,351 | |
| JOST Werke AG (c) | 219,700 | 9,273 | |
| Linde AG | 286,300 | 63,633 | |
| MTU Aero Engines Holdings AG | 381,500 | 65,880 | |
| Muenchener Rueckversicherungs AG | 122,300 | 28,054 | |
| Nexus AG | 602,505 | 20,154 | |
| Rational AG | 36,605 | 22,964 | |
| Rheinmetall AG | 302,400 | 39,677 | |
| SAP SE | 1,507,211 | 167,460 | |
| Scout24 AG (c) | 458,900 | 23,796 | |
| Wirecard AG | 221,900 | 30,307 | |
| TOTAL GERMANY | 815,632 | ||
| Hong Kong - 1.5% | |||
| AIA Group Ltd. | 11,175,600 | 99,879 | |
| Techtronic Industries Co. Ltd. | 10,247,000 | 60,029 | |
| TOTAL HONG KONG | 159,908 | ||
| India - 3.7% | |||
| Avenue Supermarts Ltd. (b)(c) | 595,148 | 13,270 | |
| Bandhan Bank Ltd. (c) | 444,600 | 3,416 | |
| Bharti Infratel Ltd. | 3,348,609 | 15,760 | |
| HDFC Bank Ltd. | 1,783,391 | 53,751 | |
| HDFC Bank Ltd. sponsored ADR | 696,184 | 66,701 | |
| Housing Development Finance Corp. Ltd. | 4,738,215 | 134,058 | |
| Kajaria Ceramics Ltd. | 2,444,763 | 20,017 | |
| Kotak Mahindra Bank Ltd. (b) | 1,211,049 | 22,022 | |
| Petronet LNG Ltd. | 6,098,248 | 20,763 | |
| PNB Housing Finance Ltd. (c) | 838,105 | 17,591 | |
| PVR Ltd. (b) | 442,801 | 9,576 | |
| Sunteck Realty Ltd. (b) | 3,638,783 | 23,470 | |
| TOTAL INDIA | 400,395 | ||
| Indonesia - 0.4% | |||
| PT Bank Central Asia Tbk | 6,980,000 | 11,037 | |
| PT Bank Rakyat Indonesia Tbk | 157,115,200 | 36,226 | |
| TOTAL INDONESIA | 47,263 | ||
| Ireland - 3.7% | |||
| Cairn Homes PLC (b) | 20,159,470 | 43,723 | |
| CRH PLC | 2,180,712 | 77,440 | |
| Dalata Hotel Group PLC (b) | 3,827,700 | 30,507 | |
| DCC PLC (United Kingdom) | 353,400 | 34,057 | |
| Glenveagh Properties PLC (c) | 13,703,776 | 18,303 | |
| Green REIT PLC | 9,492,200 | 17,401 | |
| James Hardie Industries PLC CDI | 2,420,296 | 42,741 | |
| Kerry Group PLC Class A | 561,500 | 57,297 | |
| Ryanair Holdings PLC sponsored ADR (b) | 342,366 | 37,650 | |
| United Drug PLC (United Kingdom) | 3,798,200 | 47,845 | |
| TOTAL IRELAND | 406,964 | ||
| Israel - 0.6% | |||
| Frutarom Industries Ltd. | 694,000 | 66,624 | |
| Italy - 1.2% | |||
| Intesa Sanpaolo SpA | 24,317,500 | 92,503 | |
| Prada SpA | 7,015,800 | 35,598 | |
| TOTAL ITALY | 128,101 | ||
| Japan - 15.6% | |||
| AEON Financial Service Co. Ltd. | 1,577,400 | 37,025 | |
| Daito Trust Construction Co. Ltd. | 164,500 | 27,469 | |
| Hoya Corp. | 1,580,200 | 84,734 | |
| Keyence Corp. | 138,020 | 84,552 | |
| Komatsu Ltd. | 1,514,600 | 51,631 | |
| Minebea Mitsumi, Inc. | 3,071,200 | 61,722 | |
| Misumi Group, Inc. | 1,135,000 | 31,459 | |
| Mitsubishi UFJ Financial Group, Inc. | 13,190,300 | 88,393 | |
| Monex Group, Inc. (a) | 4,390,349 | 25,060 | |
| Morinaga & Co. Ltd. | 576,300 | 28,098 | |
| Nidec Corp. | 347,200 | 54,437 | |
| Nintendo Co. Ltd. | 105,200 | 44,203 | |
| Nitori Holdings Co. Ltd. | 491,400 | 83,069 | |
| ORIX Corp. | 8,418,200 | 148,158 | |
| Panasonic Corp. | 6,196,200 | 91,748 | |
| Recruit Holdings Co. Ltd. | 948,400 | 21,923 | |
| Relo Group, Inc. | 2,584,400 | 58,298 | |
| Renesas Electronics Corp. (a)(b) | 5,075,700 | 53,301 | |
| SMC Corp. | 226,600 | 86,478 | |
| SMS Co., Ltd. | 813,800 | 30,893 | |
| SoftBank Corp. | 817,600 | 62,472 | |
| Sony Corp. | 2,396,700 | 111,941 | |
| Start Today Co. Ltd. | 1,761,000 | 50,903 | |
| Sundrug Co. Ltd. | 838,200 | 43,167 | |
| Taiheiyo Cement Corp. | 1,345,000 | 50,997 | |
| Tateru, Inc. (a) | 1,173,700 | 19,991 | |
| Tsuruha Holdings, Inc. | 469,600 | 67,571 | |
| VT Holdings Co. Ltd. | 3,859,500 | 17,617 | |
| Welcia Holdings Co. Ltd. | 1,669,400 | 85,974 | |
| TOTAL JAPAN | 1,703,284 | ||
| Korea (South) - 0.3% | |||
| Hyundai Fire & Marine Insurance Co. Ltd. | 331,774 | 11,850 | |
| KB Financial Group, Inc. | 437,375 | 24,783 | |
| TOTAL KOREA (SOUTH) | 36,633 | ||
| Netherlands - 5.2% | |||
| ASML Holding NV (Netherlands) | 468,600 | 89,126 | |
| Basic-Fit NV (b)(c) | 577,200 | 17,391 | |
| IMCD Group BV | 926,545 | 57,120 | |
| ING Groep NV (Certificaten Van Aandelen) | 4,812,900 | 81,100 | |
| Instone Real Estate Group BV (b)(c) | 1,011,300 | 24,232 | |
| Koninklijke Philips Electronics NV | 2,573,226 | 108,915 | |
| NIBC Holding NV (b)(c) | 3,004,124 | 29,947 | |
| Philips Lighting NV (c) | 195,000 | 5,944 | |
| Unilever NV (Certificaten Van Aandelen) (Bearer) | 2,511,232 | 143,965 | |
| Van Lanschot NV (Bearer) | 222,900 | 6,891 | |
| TOTAL NETHERLANDS | 564,631 | ||
| New Zealand - 1.1% | |||
| EBOS Group Ltd. | 3,144,406 | 39,337 | |
| Fisher & Paykel Healthcare Corp. | 3,635,018 | 32,609 | |
| Ryman Healthcare Group Ltd. | 6,157,798 | 45,926 | |
| TOTAL NEW ZEALAND | 117,872 | ||
| Norway - 2.1% | |||
| Statoil ASA | 8,895,913 | 227,493 | |
| Philippines - 0.3% | |||
| SM Investments Corp. | 1,901,955 | 34,446 | |
| South Africa - 1.6% | |||
| Clicks Group Ltd. | 2,101,458 | 35,928 | |
| FirstRand Ltd. | 5,177,700 | 27,729 | |
| Naspers Ltd. Class N | 222,400 | 54,181 | |
| PSG Group Ltd. | 1,687,000 | 30,353 | |
| Remgro Ltd. | 1,457,600 | 26,242 | |
| TOTAL SOUTH AFRICA | 174,433 | ||
| Spain - 4.3% | |||
| Aedas Homes SAU (c) | 405,465 | 14,444 | |
| Amadeus IT Holding SA Class A | 791,500 | 58,018 | |
| CaixaBank SA | 31,380,333 | 152,599 | |
| Grifols SA ADR | 2,895,358 | 58,834 | |
| Masmovil Ibercom SA (b) | 483,879 | 69,886 | |
| Neinor Homes SLU (b)(c) | 737,500 | 14,303 | |
| Prosegur Cash SA (c) | 19,504,100 | 56,999 | |
| Zardoya Otis SA | 4,123,773 | 42,179 | |
| TOTAL SPAIN | 467,262 | ||
| Sweden - 2.5% | |||
| ASSA ABLOY AB (B Shares) (a) | 3,327,600 | 69,998 | |
| Essity AB Class B (a) | 2,674,100 | 68,100 | |
| HEXPOL AB (B Shares) (a) | 1,866,400 | 19,396 | |
| Indutrade AB | 1,700,600 | 40,278 | |
| Saab AB (B Shares) (a) | 764,400 | 31,382 | |
| Svenska Cellulosa AB (SCA) (B Shares) | 3,967,200 | 44,091 | |
| TOTAL SWEDEN | 273,245 | ||
| Switzerland - 6.4% | |||
| Credit Suisse Group AG | 6,506,687 | 109,743 | |
| Forbo Holding AG (Reg.) | 20,060 | 28,177 | |
| Julius Baer Group Ltd. | 836,630 | 49,653 | |
| Kaba Holding AG (B Shares) (Reg.) | 41,260 | 32,059 | |
| Lonza Group AG | 260,791 | 64,264 | |
| Partners Group Holding AG | 75,626 | 55,441 | |
| Roche Holding AG (participation certificate) | 683,328 | 151,827 | |
| Schindler Holding AG (participation certificate) | 164,075 | 34,040 | |
| Swatch Group AG (Bearer) | 238,640 | 115,226 | |
| UBS Group AG | 3,586,740 | 60,696 | |
| TOTAL SWITZERLAND | 701,126 | ||
| Taiwan - 0.3% | |||
| United Microelectronics Corp. | 62,100,000 | 33,429 | |
| United Kingdom - 11.5% | |||
| Anglo American PLC (United Kingdom) | 1,379,900 | 32,474 | |
| Antofagasta PLC | 2,486,800 | 33,291 | |
| AstraZeneca PLC (United Kingdom) | 2,182,762 | 152,799 | |
| Barclays PLC | 58,904 | 168 | |
| BCA Marketplace PLC | 7,736,200 | 20,300 | |
| BHP Billiton PLC | 3,424,439 | 73,017 | |
| British American Tobacco PLC: | |||
| (United Kingdom) | 1,445,432 | 79,278 | |
| sponsored ADR | 421,600 | 23,028 | |
| Bunzl PLC | 2,012,418 | 58,485 | |
| Clipper Logistics PLC | 2,271,300 | 14,102 | |
| CMC Markets PLC (c) | 206,570 | 539 | |
| Compass Group PLC | 2,344,943 | 50,361 | |
| Conviviality PLC (d) | 5,464,968 | 3,807 | |
| Countryside Properties PLC (c) | 53,784 | 266 | |
| Cranswick PLC | 1,364,288 | 54,731 | |
| Dechra Pharmaceuticals PLC | 239,376 | 9,036 | |
| Hastings Group Holdings PLC (c) | 2,038,137 | 7,744 | |
| Indivior PLC (b) | 3,936,900 | 24,558 | |
| JTC PLC (b)(c) | 3,870,300 | 16,331 | |
| LivaNova PLC (b) | 693,902 | 61,605 | |
| London Stock Exchange Group PLC | 914,236 | 54,121 | |
| Melrose Industries PLC | 23,361,453 | 73,329 | |
| Micro Focus International PLC | 3,060,205 | 52,768 | |
| NCC Group Ltd. | 9,120,600 | 24,686 | |
| Reckitt Benckiser Group PLC | 422,519 | 33,146 | |
| Rex Bionics PLC (b)(d)(e) | 1,292,931 | 31 | |
| Rio Tinto PLC | 918,990 | 50,090 | |
| Senior Engineering Group PLC | 7,108,200 | 28,907 | |
| St. James's Place Capital PLC | 2,337,909 | 36,579 | |
| Standard Chartered PLC (United Kingdom) | 8,953,861 | 94,546 | |
| The Weir Group PLC | 1,804,000 | 53,049 | |
| Zpg PLC | 8,356,009 | 41,298 | |
| TOTAL UNITED KINGDOM | 1,258,470 | ||
| TOTAL COMMON STOCKS | |||
| (Cost $8,032,417) | 10,040,579 | ||
| Preferred Stocks - 0.9% | |||
| Convertible Preferred Stocks - 0.3% | |||
| Cayman Islands - 0.3% | |||
| China Internet Plus Holdings Ltd. Series A-11 (b)(d)(f) | 5,958,244 | 33,301 | |
| Nonconvertible Preferred Stocks - 0.6% | |||
| Brazil - 0.6% | |||
| Itausa-Investimentos Itau SA (PN) | 16,504,700 | 64,121 | |
| TOTAL PREFERRED STOCKS | |||
| (Cost $76,821) | 97,422 | ||
| Principal Amount (000s) | Value (000s) | ||
| Government Obligations - 0.1% | |||
| United States of America - 0.1% | |||
| U.S. Treasury Bills, yield at date of purchase 1.48% to 1.79% 5/10/18 to 7/19/18(g) | |||
| (Cost $10,765) | 10,790 | 10,765 | |
| Shares | Value (000s) | ||
| Money Market Funds - 7.6% | |||
| Fidelity Cash Central Fund, 1.74% (h) | 664,231,102 | 664,364 | |
| Fidelity Securities Lending Cash Central Fund 1.74% (h)(i) | 170,618,463 | 170,636 | |
| TOTAL MONEY MARKET FUNDS | |||
| (Cost $835,000) | 835,000 | ||
| TOTAL INVESTMENT IN SECURITIES - 100.7% | |||
| (Cost $8,955,003) | 10,983,766 | ||
| NET OTHER ASSETS (LIABILITIES) - (0.7)% | (78,311) | ||
| NET ASSETS - 100% | $10,905,455 |
| Futures Contracts | |||||
| Number of contracts | Expiration Date | Notional Amount (000s) | Value (000s) | Unrealized Appreciation/(Depreciation) (000s) | |
| Purchased | |||||
| Equity Index Contracts | |||||
| TSE TOPIX Index Contracts (Japan) | 2,383 | June 2018 | $386,376 | $8,626 | $8,626 |
The notional amount of futures purchased as a percentage of Net Assets is 3.5%
Categorizations in the Schedule of Investments are based on country or territory of incorporation.
Legend
(a) Security or a portion of the security is on loan at period end.
(b) Non-income producing
(c) Security exempt from registration under Rule 144A of the Securities Act of 1933. These securities may be resold in transactions exempt from registration, normally to qualified institutional buyers. At the end of the period, the value of these securities amounted to $380,294,000 or 3.5% of net assets.
(d) Level 3 security
(e) Affiliated company
(f) Restricted securities - Investment in securities not registered under the Securities Act of 1933 (excluding 144A issues). At the end of the period, the value of restricted securities (excluding 144A issues) amounted to $33,301,000 or 0.3% of net assets.
(g) Security or a portion of the security was pledged to cover margin requirements for futures contracts. At period end, the value of securities pledged amounted to $10,353,000.
(h) Affiliated fund that is generally available only to investment companies and other accounts managed by Fidelity Investments. The rate quoted is the annualized seven-day yield of the fund at period end. A complete unaudited listing of the fund's holdings as of its most recent quarter end is available upon request. In addition, each Fidelity Central Fund's financial statements are available on the SEC's website or upon request.
(i) Investment made with cash collateral received from securities on loan.
Additional information on each restricted holding is as follows:
| Security | Acquisition Date | Acquisition Cost (000s) |
| China Internet Plus Holdings Ltd. Series A-11 | 1/26/15 | $18,833 |
Affiliated Central Funds
Information regarding fiscal year to date income earned by the Fund from investments in Fidelity Central Funds is as follows:
| Fund | Income earned |
| (Amounts in thousands) | |
| Fidelity Cash Central Fund | $2,770 |
| Fidelity Securities Lending Cash Central Fund | 1,662 |
| Total | $4,432 |
Amounts in the income column in the above table include any capital gain distributions from underlying funds, which are presented in the corresponding line-item in the Statement of Operations if applicable.
Other Affiliated Issuers
An affiliated company is a company in which the Fund has ownership of at least 5% of the voting securities. Fiscal year to date transactions with companies which are or were affiliates are as follows:
| Affiliate (Amounts in thousands) | Value, beginning of period | Purchases | Sales Proceeds*,** | Dividend Income | Realized Gain (loss) | Change in Unrealized appreciation (depreciation) | Value, end of period |
| Rex Bionics PLC | $30 | $-- | $0 | $-- | $(13) | $14 | $31 |
| Total | $30 | $-- | $0 | $-- | $(13) | $14 | $31 |
* Values shown as $0 may reflect amounts less than $500.
** Includes the value of securities delivered through in-kind transactions, if applicable.
Investment Valuation
The following is a summary of the inputs used, as of April 30, 2018, involving the Fund's assets and liabilities carried at fair value. The inputs or methodology used for valuing securities may not be an indication of the risk associated with investing in those securities. For more information on valuation inputs, and their aggregation into the levels used below, please refer to the Investment Valuation section in the accompanying Notes to Financial Statements.
| Valuation Inputs at Reporting Date: | ||||
| Description | Total | Level 1 | Level 2 | Level 3 |
| (Amounts in thousands) | ||||
| Investments in Securities: | ||||
| Equities: | ||||
| Consumer Discretionary | $1,275,975 | $718,596 | $524,078 | $33,301 |
| Consumer Staples | 956,304 | 537,210 | 415,287 | 3,807 |
| Energy | 658,560 | 139,733 | 518,827 | -- |
| Financials | 2,456,802 | 1,223,602 | 1,233,200 | -- |
| Health Care | 1,078,810 | 618,309 | 460,470 | 31 |
| Industrials | 1,503,716 | 1,116,290 | 387,426 | -- |
| Information Technology | 1,048,235 | 730,317 | 317,918 | -- |
| Materials | 769,161 | 496,416 | 272,745 | -- |
| Real Estate | 217,278 | 180,138 | 37,140 | -- |
| Telecommunication Services | 148,118 | 69,886 | 78,232 | -- |
| Utilities | 25,042 | -- | 25,042 | -- |
| Government Obligations | 10,765 | -- | 10,765 | -- |
| Money Market Funds | 835,000 | 835,000 | -- | -- |
| Total Investments in Securities: | $10,983,766 | $6,665,497 | $4,281,130 | $37,139 |
| Derivative Instruments: | ||||
| Assets | ||||
| Futures Contracts | $8,626 | $8,626 | $-- | $-- |
| Total Assets | $8,626 | $8,626 | $-- | $-- |
| Total Derivative Instruments: | $8,626 | $8,626 | $-- | $-- |
The following is a summary of transfers between Level 1 and Level 2 for the period ended April 30, 2018. Transfers are assumed to have occurred at the beginning of the period, and are primarily attributable to the valuation techniques used for foreign equity securities, as discussed in the accompanying Notes to Financial Statements:
| Transfers | Total (000s) |
| Level 1 to Level 2 | $1,245,829 |
| Level 2 to Level 1 | $1,276,764 |
Value of Derivative Instruments
The following table is a summary of the Fund's value of derivative instruments by primary risk exposure as of April 30, 2018. For additional information on derivative instruments, please refer to the Derivative Instruments section in the accompanying Notes to Financial Statements.
| Primary Risk Exposure / Derivative Type | Value | |
| Asset | Liability | |
| (Amounts in thousands) | ||
| Equity Risk | ||
| Futures Contracts(a) | $8,626 | $0 |
| Total Equity Risk | 8,626 | 0 |
| Total Value of Derivatives | $8,626 | $0 |
(a) Reflects gross cumulative appreciation (depreciation) on futures contracts as presented in the Schedule of Investments. In the Statement of Assets and Liabilities, the period end daily variation margin is included in receivable or payable for daily variation margin on futures contracts, and the net cumulative appreciation (depreciation) is included in net unrealized appreciation (depreciation).
See accompanying notes which are an integral part of the financial statements.
Financial Statements
Statement of Assets and Liabilities
| Amounts in thousands (except per-share amounts) | April 30, 2018 (Unaudited) | |
| Assets | ||
| Investment in securities, at value (including securities loaned of $161,920) — See accompanying schedule: Unaffiliated issuers (cost $8,116,075) | $10,148,735 | |
| Fidelity Central Funds (cost $835,000) | 835,000 | |
| Other affiliated issuers (cost $3,928) | 31 | |
| Total Investment in Securities (cost $8,955,003) | $10,983,766 | |
| Foreign currency held at value (cost $4,142) | 4,139 | |
| Receivable for investments sold | 59,253 | |
| Receivable for fund shares sold | 6,177 | |
| Dividends receivable | 45,857 | |
| Distributions receivable from Fidelity Central Funds | 1,344 | |
| Prepaid expenses | 5 | |
| Other receivables | 4,900 | |
| Total assets | 11,105,441 | |
| Liabilities | ||
| Payable for investments purchased | $10,074 | |
| Payable for fund shares redeemed | 8,876 | |
| Accrued management fee | 6,488 | |
| Distribution and service plan fees payable | 85 | |
| Payable for daily variation margin on futures contracts | 1,526 | |
| Other affiliated payables | 1,377 | |
| Other payables and accrued expenses | 916 | |
| Collateral on securities loaned | 170,644 | |
| Total liabilities | 199,986 | |
| Net Assets | $10,905,455 | |
| Net Assets consist of: | ||
| Paid in capital | $8,492,109 | |
| Undistributed net investment income | 49,889 | |
| Accumulated undistributed net realized gain (loss) on investments and foreign currency transactions | 327,767 | |
| Net unrealized appreciation (depreciation) on investments and assets and liabilities in foreign currencies | 2,035,690 | |
| Net Assets | $10,905,455 | |
| Calculation of Maximum Offering Price | ||
| Class A: | ||
| Net Asset Value and redemption price per share ($234,013 ÷ 5,187.7 shares) | $45.11 | |
| Maximum offering price per share (100/94.25 of $45.11) | $47.86 | |
| Class M: | ||
| Net Asset Value and redemption price per share ($34,441 ÷ 768.0 shares) | $44.85 | |
| Maximum offering price per share (100/96.50 of $44.85) | $46.48 | |
| Class C: | ||
| Net Asset Value and offering price per share ($26,394 ÷ 592.8 shares)(a) | $44.52 | |
| International Discovery: | ||
| Net Asset Value, offering price and redemption price per share ($7,418,045 ÷ 163,378.1 shares) | $45.40 | |
| Class K: | ||
| Net Asset Value, offering price and redemption price per share ($2,422,704 ÷ 53,487.8 shares) | $45.29 | |
| Class I: | ||
| Net Asset Value, offering price and redemption price per share ($644,863 ÷ 14,238.4 shares) | $45.29 | |
| Class Z: | ||
| Net Asset Value, offering price and redemption price per share ($124,995 ÷ 2,761.6 shares) | $45.26 |
(a) Redemption price per share is equal to net asset value less any applicable contingent deferred sales charge.
See accompanying notes which are an integral part of the financial statements.
Statement of Operations
| Amounts in thousands | Six months ended April 30, 2018 (Unaudited) | |
| Investment Income | ||
| Dividends | $112,360 | |
| Interest | 39 | |
| Income from Fidelity Central Funds | 4,432 | |
| Income before foreign taxes withheld | 116,831 | |
| Less foreign taxes withheld | (11,116) | |
| Total income | 105,715 | |
| Expenses | ||
| Management fee | ||
| Basic fee | $36,336 | |
| Performance adjustment | 3,816 | |
| Transfer agent fees | 7,339 | |
| Distribution and service plan fees | 532 | |
| Accounting and security lending fees | 916 | |
| Custodian fees and expenses | 815 | |
| Independent trustees' fees and expenses | 22 | |
| Registration fees | 154 | |
| Audit | 48 | |
| Legal | 20 | |
| Miscellaneous | 34 | |
| Total expenses before reductions | 50,032 | |
| Expense reductions | (1,924) | 48,108 |
| Net investment income (loss) | 57,607 | |
| Realized and Unrealized Gain (Loss) | ||
| Net realized gain (loss) on: | ||
| Investment securities: | ||
| Unaffiliated issuers | 353,971 | |
| Fidelity Central Funds | 10 | |
| Other affiliated issuers | (13) | |
| Foreign currency transactions | (761) | |
| Futures contracts | 12,352 | |
| Total net realized gain (loss) | 365,559 | |
| Change in net unrealized appreciation (depreciation) on: | ||
| Investment securities: | ||
| Unaffiliated issuers | (245,049) | |
| Fidelity Central Funds | 8 | |
| Other affiliated issuers | 14 | |
| Assets and liabilities in foreign currencies | 98 | |
| Futures contracts | (8,214) | |
| Total change in net unrealized appreciation (depreciation) | (253,143) | |
| Net gain (loss) | 112,416 | |
| Net increase (decrease) in net assets resulting from operations | $170,023 |
See accompanying notes which are an integral part of the financial statements.
Statement of Changes in Net Assets
| Amounts in thousands | Six months ended April 30, 2018 (Unaudited) | Year ended October 31, 2017 |
| Increase (Decrease) in Net Assets | ||
| Operations | ||
| Net investment income (loss) | $57,607 | $118,923 |
| Net realized gain (loss) | 365,559 | 1,030,476 |
| Change in net unrealized appreciation (depreciation) | (253,143) | 1,102,421 |
| Net increase (decrease) in net assets resulting from operations | 170,023 | 2,251,820 |
| Distributions to shareholders from net investment income | (116,164) | (150,174) |
| Distributions to shareholders from net realized gain | (419,777) | (11,939) |
| Total distributions | (535,941) | (162,113) |
| Share transactions - net increase (decrease) | 622,111 | (822,002) |
| Redemption fees | – | 9 |
| Total increase (decrease) in net assets | 256,193 | 1,267,714 |
| Net Assets | ||
| Beginning of period | 10,649,262 | 9,381,548 |
| End of period | $10,905,455 | $10,649,262 |
| Other Information | ||
| Undistributed net investment income end of period | $49,889 | $108,446 |
See accompanying notes which are an integral part of the financial statements.
Financial Highlights
Fidelity International Discovery Fund Class A
| Six months ended (Unaudited) April 30, | Years endedOctober 31, | |||||
| 2018 | 2017 | 2016 | 2015 | 2014 | 2013 | |
| Selected Per–Share Data | ||||||
| Net asset value, beginning of period | $46.66 | $37.60 | $39.78 | $38.70 | $39.49 | $31.66 |
| Income from Investment Operations | ||||||
| Net investment income (loss)A | .16 | .36 | .47B | .40C | .53D | .34 |
| Net realized and unrealized gain (loss) | .46 | 9.22 | (2.38) | .79 | (.67) | 7.97 |
| Total from investment operations | .62 | 9.58 | (1.91) | 1.19 | (.14) | 8.31 |
| Distributions from net investment income | (.34) | (.47) | (.27) | (.11) | (.33) | (.45) |
| Distributions from net realized gain | (1.83) | (.05) | (.01) | – | (.31) | (.03) |
| Total distributions | (2.17) | (.52) | (.27)E | (.11) | (.65)F | (.48) |
| Redemption fees added to paid in capitalA | – | –G | –G | –G | –G | –G |
| Net asset value, end of period | $45.11 | $46.66 | $37.60 | $39.78 | $38.70 | $39.49 |
| Total ReturnH,I,J | 1.40% | 25.87% | (4.83)% | 3.09% | (.36)% | 26.59% |
| Ratios to Average Net AssetsK,L | ||||||
| Expenses before reductions | 1.26%M | 1.29% | 1.35% | 1.33% | 1.28% | 1.35% |
| Expenses net of fee waivers, if any | 1.26%M | 1.29% | 1.35% | 1.33% | 1.28% | 1.35% |
| Expenses net of all reductions | 1.23%M | 1.27% | 1.34% | 1.32% | 1.28% | 1.33% |
| Net investment income (loss) | .70%M | .88% | 1.26%B | 1.00%C | 1.35%D | .97% |
| Supplemental Data | ||||||
| Net assets, end of period (in millions) | $234 | $248 | $236 | $283 | $297 | $347 |
| Portfolio turnover rateN | 49%M,O | 42% | 50%O | 60%O | 57% | 65% |
A Calculated based on average shares outstanding during the period.
B Net Investment income per share reflects a large, non-recurring dividend which amounted to $.14 per share. Excluding this non-recurring dividend, the ratio of net investment income (loss) to average net assets would have been .88%.
C Net Investment income per share reflects a large, non-recurring dividend which amounted to $.12 per share. Excluding this non-recurring dividend, the ratio of net investment income (loss) to average net assets would have been .69%.
D Net Investment income per share reflects a large, non-recurring dividend which amounted to $.22 per share. Excluding this non-recurring dividend, the ratio of net investment income (loss) to average net assets would have been .80%.
E Total distributions of $.27 per share is comprised of distributions from net investment income of $.269 and distributions from net realized gain of $.005 per share.
F Total distributions of $.65 per share is comprised of distributions from net investment income of $.334 and distributions from net realized gain of $.311 per share.
G Amount represents less than $.005 per share.
H Total returns for periods of less than one year are not annualized.
I Total returns would have been lower if certain expenses had not been reduced during the applicable periods shown.
J Total returns do not include the effect of the sales charges.
K Fees and expenses of any underlying Fidelity Central Funds are not included in the Fund's expense ratio. The Fund indirectly bears its proportionate share of the expenses of any underlying Fidelity Central Funds.
L Expense ratios reflect operating expenses of the class. Expenses before reductions do not reflect amounts reimbursed by the investment adviser or reductions from brokerage service arrangements or reductions from other expense offset arrangements and do not represent the amount paid by the class during periods when reimbursements or reductions occur. Expenses net of fee waivers reflect expenses after reimbursement by the investment adviser but prior to reductions from brokerage service arrangements or other expense offset arrangements. Expenses net of all reductions represent the net expenses paid by the class.
M Annualized
N Amount does not include the portfolio activity of any underlying Fidelity Central Funds.
O Portfolio turnover rate excludes securities received or delivered in-kind.
See accompanying notes which are an integral part of the financial statements.
Fidelity International Discovery Fund Class M
| Six months ended (Unaudited) April 30, | Years endedOctober 31, | |||||
| 2018 | 2017 | 2016 | 2015 | 2014 | 2013 | |
| Selected Per–Share Data | ||||||
| Net asset value, beginning of period | $46.35 | $37.34 | $39.51 | $38.43 | $39.23 | $31.42 |
| Income from Investment Operations | ||||||
| Net investment income (loss)A | .11 | .26 | .38B | .30C | .44D | .26 |
| Net realized and unrealized gain (loss) | .46 | 9.17 | (2.37) | .80 | (.68) | 7.92 |
| Total from investment operations | .57 | 9.43 | (1.99) | 1.10 | (.24) | 8.18 |
| Distributions from net investment income | (.24) | (.37) | (.17) | (.02) | (.25) | (.34) |
| Distributions from net realized gain | (1.83) | (.05) | (.01) | – | (.31) | (.03) |
| Total distributions | (2.07) | (.42) | (.18) | (.02) | (.56) | (.37) |
| Redemption fees added to paid in capitalA | – | –E | –E | –E | –E | –E |
| Net asset value, end of period | $44.85 | $46.35 | $37.34 | $39.51 | $38.43 | $39.23 |
| Total ReturnF,G,H | 1.30% | 25.57% | (5.07)% | 2.86% | (.60)% | 26.31% |
| Ratios to Average Net AssetsI,J | ||||||
| Expenses before reductions | 1.50%K | 1.53% | 1.58% | 1.57% | 1.51% | 1.59% |
| Expenses net of fee waivers, if any | 1.50%K | 1.52% | 1.58% | 1.57% | 1.51% | 1.59% |
| Expenses net of all reductions | 1.47%K | 1.51% | 1.57% | 1.56% | 1.51% | 1.57% |
| Net investment income (loss) | .46%K | .64% | 1.02%B | .76%C | 1.11%D | .73% |
| Supplemental Data | ||||||
| Net assets, end of period (in millions) | $34 | $35 | $35 | $43 | $49 | $53 |
| Portfolio turnover rateL | 49%K,M | 42% | 50%M | 60%M | 57% | 65% |
A Calculated based on average shares outstanding during the period.
B Net Investment income per share reflects a large, non-recurring dividend which amounted to $.14 per share. Excluding this non-recurring dividend, the ratio of net investment income (loss) to average net assets would have been .64%.
C Net Investment income per share reflects a large, non-recurring dividend which amounted to $.12 per share. Excluding this non-recurring dividend, the ratio of net investment income (loss) to average net assets would have been .45%.
D Net Investment income per share reflects a large, non-recurring dividend which amounted to $.21 per share. Excluding this non-recurring dividend, the ratio of net investment income (loss) to average net assets would have been .56%.
E Amount represents less than $.005 per share.
F Total returns for periods of less than one year are not annualized.
G Total returns would have been lower if certain expenses had not been reduced during the applicable periods shown.
H Total returns do not include the effect of the sales charges.
I Fees and expenses of any underlying Fidelity Central Funds are not included in the Fund's expense ratio. The Fund indirectly bears its proportionate share of the expenses of any underlying Fidelity Central Funds.
J Expense ratios reflect operating expenses of the class. Expenses before reductions do not reflect amounts reimbursed by the investment adviser or reductions from brokerage service arrangements or reductions from other expense offset arrangements and do not represent the amount paid by the class during periods when reimbursements or reductions occur. Expenses net of fee waivers reflect expenses after reimbursement by the investment adviser but prior to reductions from brokerage service arrangements or other expense offset arrangements. Expenses net of all reductions represent the net expenses paid by the class.
K Annualized
L Amount does not include the portfolio activity of any underlying Fidelity Central Funds.
M Portfolio turnover rate excludes securities received or delivered in-kind.
See accompanying notes which are an integral part of the financial statements.
Fidelity International Discovery Fund Class C
| Six months ended (Unaudited) April 30, | Years endedOctober 31, | |||||
| 2018 | 2017 | 2016 | 2015 | 2014 | 2013 | |
| Selected Per–Share Data | ||||||
| Net asset value, beginning of period | $45.94 | $36.96 | $39.14 | $38.25 | $39.07 | $31.32 |
| Income from Investment Operations | ||||||
| Net investment income (loss)A | (.02) | .04 | .19B | .10C | .23D | .08 |
| Net realized and unrealized gain (loss) | .45 | 9.12 | (2.37) | .79 | (.66) | 7.90 |
| Total from investment operations | .43 | 9.16 | (2.18) | .89 | (.43) | 7.98 |
| Distributions from net investment income | (.02) | (.13) | – | – | (.08) | (.20) |
| Distributions from net realized gain | (1.83) | (.05) | – | – | (.31) | (.03) |
| Total distributions | (1.85) | (.18) | – | – | (.39) | (.23) |
| Redemption fees added to paid in capitalA | – | –E | –E | –E | –E | –E |
| Net asset value, end of period | $44.52 | $45.94 | $36.96 | $39.14 | $38.25 | $39.07 |
| Total ReturnF,G,H | .99% | 24.93% | (5.57)% | 2.33% | (1.10)% | 25.65% |
| Ratios to Average Net AssetsI,J | ||||||
| Expenses before reductions | 2.04%K | 2.05% | 2.10% | 2.09% | 2.03% | 2.10% |
| Expenses net of fee waivers, if any | 2.04%K | 2.05% | 2.10% | 2.09% | 2.03% | 2.09% |
| Expenses net of all reductions | 2.01%K | 2.04% | 2.09% | 2.08% | 2.02% | 2.07% |
| Net investment income (loss) | (.08)%K | .11% | .50%B | .24%C | .60%D | .23% |
| Supplemental Data | ||||||
| Net assets, end of period (in millions) | $26 | $28 | $26 | $32 | $35 | $36 |
| Portfolio turnover rateL | 49%K,M | 42% | 50%M | 60%M | 57% | 65% |
A Calculated based on average shares outstanding during the period.
B Net Investment income per share reflects a large, non-recurring dividend which amounted to $.14 per share. Excluding this non-recurring dividend, the ratio of net investment income (loss) to average net assets would have been .13%.
C Net Investment income per share reflects a large, non-recurring dividend which amounted to $.12 per share. Excluding this non-recurring dividend, the ratio of net investment income (loss) to average net assets would have been (.06)%.
D Net Investment income per share reflects a large, non-recurring dividend which amounted to $.21 per share. Excluding this non-recurring dividend, the ratio of net investment income (loss) to average net assets would have been .05%.
E Amount represents less than $.005 per share.
F Total returns for periods of less than one year are not annualized.
G Total returns would have been lower if certain expenses had not been reduced during the applicable periods shown.
H Total returns do not include the effect of the contingent deferred sales charge.
I Fees and expenses of any underlying Fidelity Central Funds are not included in the Fund's expense ratio. The Fund indirectly bears its proportionate share of the expenses of any underlying Fidelity Central Funds.
J Expense ratios reflect operating expenses of the class. Expenses before reductions do not reflect amounts reimbursed by the investment adviser or reductions from brokerage service arrangements or reductions from other expense offset arrangements and do not represent the amount paid by the class during periods when reimbursements or reductions occur. Expenses net of fee waivers reflect expenses after reimbursement by the investment adviser but prior to reductions from brokerage service arrangements or other expense offset arrangements. Expenses net of all reductions represent the net expenses paid by the class.
K Annualized
L Amount does not include the portfolio activity of any underlying Fidelity Central Funds.
M Portfolio turnover rate excludes securities received or delivered in-kind.
See accompanying notes which are an integral part of the financial statements.
Fidelity International Discovery Fund
| Six months ended (Unaudited) April 30, | Years endedOctober 31, | |||||
| 2018 | 2017 | 2016 | 2015 | 2014 | 2013 | |
| Selected Per–Share Data | ||||||
| Net asset value, beginning of period | $47.04 | $37.91 | $40.12 | $39.03 | $39.82 | $31.91 |
| Income from Investment Operations | ||||||
| Net investment income (loss)A | .24 | .50 | .61B | .54C | .67D | .47 |
| Net realized and unrealized gain (loss) | .45 | 9.29 | (2.41) | .81 | (.68) | 8.02 |
| Total from investment operations | .69 | 9.79 | (1.80) | 1.35 | (.01) | 8.49 |
| Distributions from net investment income | (.50) | (.61) | (.41) | (.26) | (.47) | (.55) |
| Distributions from net realized gain | (1.83) | (.05) | (.01) | – | (.31) | (.03) |
| Total distributions | (2.33) | (.66) | (.41)E | (.26) | (.78) | (.58) |
| Redemption fees added to paid in capitalA | – | –F | –F | –F | –F | –F |
| Net asset value, end of period | $45.40 | $47.04 | $37.91 | $40.12 | $39.03 | $39.82 |
| Total ReturnG,H | 1.56% | 26.33% | (4.53)% | 3.47% | (.01)% | 27.03% |
| Ratios to Average Net AssetsI,J | ||||||
| Expenses before reductions | .93%K | .94% | 1.00% | .99% | .93% | 1.00% |
| Expenses net of fee waivers, if any | .93%K | .94% | 1.00% | .99% | .93% | 1.00% |
| Expenses net of all reductions | .89%K | .92% | .99% | .98% | .93% | .98% |
| Net investment income (loss) | 1.04%K | 1.22% | 1.61%B | 1.34%C | 1.69%D | 1.32% |
| Supplemental Data | ||||||
| Net assets, end of period (in millions) | $7,418 | $7,351 | $6,421 | $7,209 | $7,464 | $7,800 |
| Portfolio turnover rateL | 49%K,M | 42% | 50%M | 60%M | 57% | 65% |
A Calculated based on average shares outstanding during the period.
B Net Investment Investment income per share reflects a large, non-recurring dividend which amounted to $.14 per share. Excluding this non-recurring dividend, the ratio of net investment income (loss) to average net assets would have been 1.23%.
C Net Investment income per share reflects a large, non-recurring dividend which amounted to $.12 per share. Excluding this non-recurring dividend, the ratio of net investment income (loss) to average net assets would have been 1.03%.
D Net Investment income per share reflects a large, non-recurring dividend which amounted to $.22 per share. Excluding this non-recurring dividend, the ratio of net investment income (loss) to average net assets would have been 1.15%.
E Total distributions of $.41 per share is comprised of distributions from net investment income of $.409 and distributions from net realized gain of $.005 per share.
F Amount represents less than $.005 per share.
G Total returns for periods of less than one year are not annualized.
H Total returns would have been lower if certain expenses had not been reduced during the applicable periods shown.
I Fees and expenses of any underlying Fidelity Central Funds are not included in the Fund's expense ratio. The Fund indirectly bears its proportionate share of the expenses of any underlying Fidelity Central Funds.
J Expense ratios reflect operating expenses of the class. Expenses before reductions do not reflect amounts reimbursed by the investment adviser or reductions from brokerage service arrangements or reductions from other expense offset arrangements and do not represent the amount paid by the class during periods when reimbursements or reductions occur. Expenses net of fee waivers reflect expenses after reimbursement by the investment adviser but prior to reductions from brokerage service arrangements or other expense offset arrangements. Expenses net of all reductions represent the net expenses paid by the class.
K Annualized
L Amount does not include the portfolio activity of any underlying Fidelity Central Funds.
M Portfolio turnover rate excludes securities received or delivered in-kind.
See accompanying notes which are an integral part of the financial statements.
Fidelity International Discovery Fund Class K
| Six months ended (Unaudited) April 30, | Years endedOctober 31, | |||||
| 2018 | 2017 | 2016 | 2015 | 2014 | 2013 | |
| Selected Per–Share Data | ||||||
| Net asset value, beginning of period | $46.96 | $37.86 | $40.06 | $38.97 | $39.76 | $31.87 |
| Income from Investment Operations | ||||||
| Net investment income (loss)A | .27 | .55 | .66B | .59C | .72D | .52 |
| Net realized and unrealized gain (loss) | .45 | 9.26 | (2.39) | .81 | (.67) | 8.01 |
| Total from investment operations | .72 | 9.81 | (1.73) | 1.40 | .05 | 8.53 |
| Distributions from net investment income | (.55) | (.66) | (.46) | (.31) | (.53) | (.61) |
| Distributions from net realized gain | (1.83) | (.05) | (.01) | – | (.31) | (.03) |
| Total distributions | (2.39)E | (.71) | (.47) | (.31) | (.84) | (.64) |
| Redemption fees added to paid in capitalA | – | –F | –F | –F | –F | –F |
| Net asset value, end of period | $45.29 | $46.96 | $37.86 | $40.06 | $38.97 | $39.76 |
| Total ReturnG,H | 1.61% | 26.47% | (4.38)% | 3.61% | .13% | 27.23% |
| Ratios to Average Net AssetsI,J | ||||||
| Expenses before reductions | .82%K | .82% | .86% | .86% | .80% | .85% |
| Expenses net of fee waivers, if any | .82%K | .82% | .86% | .86% | .80% | .85% |
| Expenses net of all reductions | .78%K | .80% | .85% | .85% | .79% | .83% |
| Net investment income (loss) | 1.15%K | 1.35% | 1.74%B | 1.47%C | 1.83%D | 1.47% |
| Supplemental Data | ||||||
| Net assets, end of period (in millions) | $2,423 | $2,228 | $1,880 | $2,308 | $2,464 | $2,576 |
| Portfolio turnover rateL | 49%K,M | 42% | 50%M | 60%M | 57% | 65% |
A Calculated based on average shares outstanding during the period.
B Net Investment income per share reflects a large, non-recurring dividend which amounted to $.14 per share. Excluding this non-recurring dividend, the ratio of net investment income (loss) to average net assets would have been 1.36%.
C Net Investment income per share reflects a large, non-recurring dividend which amounted to $.12 per share. Excluding this non-recurring dividend, the ratio of net investment income (loss) to average net assets would have been 1.16%.
D Net Investment income per share reflects a large, non-recurring dividend which amounted to $.22 per share. Excluding this non-recurring dividend, the ratio of net investment income (loss) to average net assets would have been 1.28%.
E Total distributions of $2.39 per share is comprised of distributions from net investment income of $.554 and distributions from net realized gain of $1.832 per share.
F Amount represents less than $.005 per share.
G Total returns for periods of less than one year are not annualized.
H Total returns would have been lower if certain expenses had not been reduced during the applicable periods shown.
I Fees and expenses of any underlying Fidelity Central Funds are not included in the Fund's expense ratio. The Fund indirectly bears its proportionate share of the expenses of any underlying Fidelity Central Funds.
J Expense ratios reflect operating expenses of the class. Expenses before reductions do not reflect amounts reimbursed by the investment adviser or reductions from brokerage service arrangements or reductions from other expense offset arrangements and do not represent the amount paid by the class during periods when reimbursements or reductions occur. Expenses net of fee waivers reflect expenses after reimbursement by the investment adviser but prior to reductions from brokerage service arrangements or other expense offset arrangements. Expenses net of all reductions represent the net expenses paid by the class.
K Annualized
L Amount does not include the portfolio activity of any underlying Fidelity Central Funds.
M Portfolio turnover rate excludes securities received or delivered in-kind.
See accompanying notes which are an integral part of the financial statements.
Fidelity International Discovery Fund Class I
| Six months ended (Unaudited) April 30, | Years endedOctober 31, | |||||
| 2018 | 2017 | 2016 | 2015 | 2014 | 2013 | |
| Selected Per–Share Data | ||||||
| Net asset value, beginning of period | $46.92 | $37.82 | $40.03 | $38.96 | $39.76 | $31.87 |
| Income from Investment Operations | ||||||
| Net investment income (loss)A | .23 | .49 | .61B | .53C | .67D | .47 |
| Net realized and unrealized gain (loss) | .46 | 9.27 | (2.40) | .80 | (.68) | 8.01 |
| Total from investment operations | .69 | 9.76 | (1.79) | 1.33 | (.01) | 8.48 |
| Distributions from net investment income | (.49) | (.61) | (.42) | (.26) | (.48) | (.56) |
| Distributions from net realized gain | (1.83) | (.05) | (.01) | – | (.31) | (.03) |
| Total distributions | (2.32) | (.66) | (.42)E | (.26) | (.79) | (.59) |
| Redemption fees added to paid in capitalA | – | –F | –F | –F | –F | –F |
| Net asset value, end of period | $45.29 | $46.92 | $37.82 | $40.03 | $38.96 | $39.76 |
| Total ReturnG,H | 1.56% | 26.29% | (4.52)% | 3.44% | (.01)% | 27.03% |
| Ratios to Average Net AssetsI,J | ||||||
| Expenses before reductions | .95%K | .96% | 1.00% | 1.00% | .93% | 1.00% |
| Expenses net of fee waivers, if any | .95%K | .96% | 1.00% | .99% | .93% | 1.00% |
| Expenses net of all reductions | .92%K | .94% | .99% | .98% | .93% | .97% |
| Net investment income (loss) | 1.01%K | 1.21% | 1.60%B | 1.33%C | 1.69%D | 1.33% |
| Supplemental Data | ||||||
| Net assets, end of period (in millions) | $645 | $658 | $745 | $1,061 | $650 | $476 |
| Portfolio turnover rateL | 49%K,M | 42% | 50%M | 60%M | 57% | 65% |
A Calculated based on average shares outstanding during the period.
B Net Investment income per share reflects a large, non-recurring dividend which amounted to $.14 per share. Excluding this non-recurring dividend, the ratio of net investment income (loss) to average net assets would have been 1.22%.
C Net Investment income per share reflects a large, non-recurring dividend which amounted to $.12 per share. Excluding this non-recurring dividend, the ratio of net investment income (loss) to average net assets would have been 1.03%.
D Net Investment income per share reflects a large, non-recurring dividend which amounted to $.22 per share. Excluding this non-recurring dividend, the ratio of net investment income (loss) to average net assets would have been 1.14%.
E Total distributions of $.42 per share is comprised of distributions from net investment income of $.418 and distributions from net realized gain of $.005 per share.
F Amount represents less than $.005 per share.
G Total returns for periods of less than one year are not annualized.
H Total returns would have been lower if certain expenses had not been reduced during the applicable periods shown.
I Fees and expenses of any underlying Fidelity Central Funds are not included in the Fund's expense ratio. The Fund indirectly bears its proportionate share of the expenses of any underlying Fidelity Central Funds.
J Expense ratios reflect operating expenses of the class. Expenses before reductions do not reflect amounts reimbursed by the investment adviser or reductions from brokerage service arrangements or reductions from other expense offset arrangements and do not represent the amount paid by the class during periods when reimbursements or reductions occur. Expenses net of fee waivers reflect expenses after reimbursement by the investment adviser but prior to reductions from brokerage service arrangements or other expense offset arrangements. Expenses net of all reductions represent the net expenses paid by the class.
K Annualized
L Amount does not include the portfolio activity of any underlying Fidelity Central Funds.
M Portfolio turnover rate excludes securities received or delivered in-kind.
See accompanying notes which are an integral part of the financial statements.
Fidelity International Discovery Fund Class Z
| Six months ended (Unaudited) April 30, | Years endedOctober 31, | |||||
| 2018 | 2017 | 2016 | 2015 | 2014 | 2013 A | |
| Selected Per–Share Data | ||||||
| Net asset value, beginning of period | $46.92 | $37.84 | $40.03 | $38.96 | $39.77 | $37.22 |
| Income from Investment Operations | ||||||
| Net investment income (loss)B | .26 | .56 | .66C | .59D | .72E | .07 |
| Net realized and unrealized gain (loss) | .47 | 9.24 | (2.38) | .80 | (.68) | 2.48 |
| Total from investment operations | .73 | 9.80 | (1.72) | 1.39 | .04 | 2.55 |
| Distributions from net investment income | (.56) | (.67) | (.46) | (.32) | (.54) | – |
| Distributions from net realized gain | (1.83) | (.05) | (.01) | – | (.31) | – |
| Total distributions | (2.39) | (.72) | (.47) | (.32) | (.85) | – |
| Redemption fees added to paid in capitalB | – | –F | –F | –F | –F | –F |
| Net asset value, end of period | $45.26 | $46.92 | $37.84 | $40.03 | $38.96 | $39.77 |
| Total ReturnG,H | 1.64% | 26.44% | (4.36)% | 3.58% | .12% | 6.85% |
| Ratios to Average Net AssetsI,J | ||||||
| Expenses before reductions | .82%K | .82% | .86% | .86% | .80% | .85%K |
| Expenses net of fee waivers, if any | .82%K | .82% | .86% | .86% | .80% | .85%K |
| Expenses net of all reductions | .78%K | .80% | .85% | .85% | .79% | .83%K |
| Net investment income (loss) | 1.15%K | 1.35% | 1.74%C | 1.47%D | 1.83%E | .76%K |
| Supplemental Data | ||||||
| Net assets, end of period (in millions) | $125 | $101 | $38 | $30 | $35 | $– |
| Portfolio turnover rateL | 49%K,M | 42% | 50%M | 60%M | 57% | 65% |
A For the period August 13, 2013 (commencement of sale of shares) to October 31, 2013.
B Calculated based on average shares outstanding during the period.
C Net Investment income per share reflects a large, non-recurring dividend which amounted to $.14 per share. Excluding this non-recurring dividend, the ratio of net investment income (loss) to average net assets would have been 1.36%.
D Net Investment income per share reflects a large, non-recurring dividend which amounted to $.12 per share. Excluding this non-recurring dividend, the ratio of net investment income (loss) to average net assets would have been 1.16%.
E Net Investment income per share reflects a large, non-recurring dividend which amounted to $.21 per share. Excluding this non-recurring dividend, the ratio of net investment income (loss) to average net assets would have been 1.28%.
F Amount represents less than $.005 per share.
G Total returns for periods of less than one year are not annualized.
H Total returns would have been lower if certain expenses had not been reduced during the applicable periods shown.
I Fees and expenses of any underlying Fidelity Central Funds are not included in the Fund's expense ratio. The Fund indirectly bears its proportionate share of the expenses of any underlying Fidelity Central Funds.
J Expense ratios reflect operating expenses of the class. Expenses before reductions do not reflect amounts reimbursed by the investment adviser or reductions from brokerage service arrangements or reductions from other expense offset arrangements and do not represent the amount paid by the class during periods when reimbursements or reductions occur. Expense ratios before reductions for start-up periods may not be representative of longer-term operating periods. Expenses net of fee waivers reflect expenses after reimbursement by the investment adviser but prior to reductions from brokerage service arrangements or other expense offset arrangements. Expenses net of all reductions represent the net expenses paid by the class.
K Annualized
L Amount does not include the portfolio activity of any underlying Fidelity Central Funds.
M Portfolio turnover rate excludes securities received or delivered in-kind.
See accompanying notes which are an integral part of the financial statements.
Notes to Financial Statements (Unaudited)
For the period ended April 30, 2018
(Amounts in thousands except percentages)
1. Organization.
Fidelity International Discovery Fund (the Fund) is a fund of Fidelity Investment Trust (the Trust) and is authorized to issue an unlimited number of shares. The Trust is registered under the Investment Company Act of 1940, as amended (the 1940 Act), as an open-end management investment company organized as a Massachusetts business trust. The Fund offers Class A, Class M, Class C, International Discovery, Class K, Class I and Class Z shares, each of which has equal rights as to assets and voting privileges. Each class has exclusive voting rights with respect to matters that affect that class.
2. Investments in Fidelity Central Funds.
The Fund invests in Fidelity Central Funds, which are open-end investment companies generally available only to other investment companies and accounts managed by the investment adviser and its affiliates. The Fund's Schedule of Investments lists each of the Fidelity Central Funds held as of period end, if any, as an investment of the Fund, but does not include the underlying holdings of each Fidelity Central Fund. As an Investing Fund, the Fund indirectly bears its proportionate share of the expenses of the underlying Fidelity Central Funds.
The Money Market Central Funds seek preservation of capital and current income and are managed by Fidelity Investments Money Management, Inc. (FIMM), an affiliate of the investment adviser. Annualized expenses of the Money Market Central Funds as of their most recent shareholder report date are less than .005%.
A complete unaudited list of holdings for each Fidelity Central Fund is available upon request or at the Securities and Exchange Commission (the SEC) website at www.sec.gov. In addition, the financial statements of the Fidelity Central Funds are available on the SEC website or upon request.
3. Significant Accounting Policies.
The Fund is an investment company and applies the accounting and reporting guidance of the Financial Accounting Standards Board (FASB) Accounting Standards Codification Topic 946 Financial Services – Investments Companies. The financial statements have been prepared in conformity with accounting principles generally accepted in the United States of America (GAAP), which require management to make certain estimates and assumptions at the date of the financial statements. Actual results could differ from those estimates. Subsequent events, if any, through the date that the financial statements were issued have been evaluated in the preparation of the financial statements. The following summarizes the significant accounting policies of the Fund:
Investment Valuation. Investments are valued as of 4:00 p.m. Eastern time on the last calendar day of the period. The Board of Trustees (the Board) has delegated the day to day responsibility for the valuation of the Fund's investments to the Fair Value Committee (the Committee) established by the Fund's investment adviser. In accordance with valuation policies and procedures approved by the Board, the Fund attempts to obtain prices from one or more third party pricing vendors or brokers to value its investments. When current market prices, quotations or currency exchange rates are not readily available or reliable, investments will be fair valued in good faith by the Committee, in accordance with procedures adopted by the Board. Factors used in determining fair value vary by investment type and may include market or investment specific events, changes in interest rates and credit quality. The frequency with which these procedures are used cannot be predicted and they may be utilized to a significant extent. The Committee oversees the Fund's valuation policies and procedures and reports to the Board on the Committee's activities and fair value determinations. The Board monitors the appropriateness of the procedures used in valuing the Fund's investments and ratifies the fair value determinations of the Committee.
The Fund categorizes the inputs to valuation techniques used to value its investments into a disclosure hierarchy consisting of three levels as shown below:
- Level 1 – quoted prices in active markets for identical investments
- Level 2 – other significant observable inputs (including quoted prices for similar investments, interest rates, prepayment speeds, etc.)
- Level 3 – unobservable inputs (including the Fund's own assumptions based on the best information available)
Valuation techniques used to value the Fund's investments by major category are as follows:
Equity securities, including restricted securities, for which market quotations are readily available, are valued at the last reported sale price or official closing price as reported by a third party pricing vendor on the primary market or exchange on which they are traded and are categorized as Level 1 in the hierarchy. In the event there were no sales during the day or closing prices are not available, securities are valued at the last quoted bid price or may be valued using the last available price and are generally categorized as Level 2 in the hierarchy. For foreign equity securities, when market or security specific events arise, comparisons to the valuation of American Depositary Receipts (ADRs), futures contracts, Exchange-Traded Funds (ETFs) and certain indexes as well as quoted prices for similar securities may be used and would be categorized as Level 2 in the hierarchy. Utilizing these techniques may result in transfers between Level 1 and Level 2. For equity securities, including restricted securities, where observable inputs are limited, assumptions about market activity and risk are used and these securities may be categorized as Level 3 in the hierarchy.
Debt securities, including restricted securities, are valued based on evaluated prices received from third party pricing vendors or from brokers who make markets in such securities. U.S. government and government agency obligations are valued by pricing vendors who utilize matrix pricing which considers yield or price of bonds of comparable quality, coupon, maturity and type or by broker-supplied prices. When independent prices are unavailable or unreliable, debt securities may be valued utilizing pricing methodologies which consider similar factors that would be used by third party pricing vendors. Debt securities are generally categorized as Level 2 in the hierarchy but may be Level 3 depending on the circumstances.
Futures contracts are valued at the settlement price established each day by the board of trade or exchange on which they are traded and are categorized as Level 1 in the hierarchy. Investments in open-end mutual funds, including the Fidelity Central Funds, are valued at their closing net asset value (NAV) each business day and are categorized as Level 1 in the hierarchy.
Changes in valuation techniques may result in transfers in or out of an assigned level within the disclosure hierarchy. The aggregate value of investments by input level as of April 30, 2018, including information on transfers between Levels 1 and 2, is included at the end of the Fund's Schedule of Investments.
Foreign Currency. The Fund may use foreign currency contracts to facilitate transactions in foreign-denominated securities. Gains and losses from these transactions may arise from changes in the value of the foreign currency or if the counterparties do not perform under the contracts' terms.
Foreign-denominated assets, including investment securities, and liabilities are translated into U.S. dollars at the exchange rates at period end. Purchases and sales of investment securities, income and dividends received and expenses denominated in foreign currencies are translated into U.S. dollars at the exchange rate in effect on the transaction date.
The effects of exchange rate fluctuations on investments are included with the net realized and unrealized gain (loss) on investment securities. Other foreign currency transactions resulting in realized and unrealized gain (loss) are disclosed separately.
Investment Transactions and Income. For financial reporting purposes, the Fund's investment holdings and NAV include trades executed through the end of the last business day of the period. The NAV per share for processing shareholder transactions is calculated as of the close of business of the New York Stock Exchange (NYSE), normally 4:00 p.m. Eastern time and includes trades executed through the end of the prior business day. Gains and losses on securities sold are determined on the basis of identified cost and includes proceeds received from litigation. Dividend income is recorded on the ex-dividend date, except for certain dividends from foreign securities where the ex-dividend date may have passed, which are recorded as soon as the Fund is informed of the ex-dividend date. Non-cash dividends included in dividend income, if any, are recorded at the fair market value of the securities received. Income and capital gain distributions from Fidelity Central Funds, if any, are recorded on the ex-dividend date. Certain distributions received by the Fund represent a return of capital or capital gain. The Fund determines the components of these distributions subsequent to the ex-dividend date, based upon receipt of tax filings or other correspondence relating to the underlying investment. These distributions are recorded as a reduction of cost of investments and/or as a realized gain. Interest income is accrued as earned and includes coupon interest and amortization of premium and accretion of discount on debt securities as applicable. Investment income is recorded net of foreign taxes withheld where recovery of such taxes is uncertain.
Class Allocations and Expenses. Investment income, realized and unrealized capital gains and losses, common expenses of the Fund, and certain fund-level expense reductions, if any, are allocated daily on a pro-rata basis to each class based on the relative net assets of each class to the total net assets of the Fund. Each class differs with respect to transfer agent and distribution and service plan fees incurred. Certain expense reductions may also differ by class. For the reporting period, the allocated portion of income and expenses to each class as a percent of its average net assets may vary due to the timing of recording these transactions in relation to fluctuating net assets of the classes. Expenses directly attributable to a fund are charged to that fund. Expenses attributable to more than one fund are allocated among the respective funds on the basis of relative net assets or other appropriate methods. Expense estimates are accrued in the period to which they relate and adjustments are made when actual amounts are known.
Deferred Trustee Compensation. Under a Deferred Compensation Plan (the Plan), certain independent Trustees have elected to defer receipt of a portion of their annual compensation. Deferred amounts are invested in a cross-section of Fidelity funds, are marked-to-market and remain in the Fund until distributed in accordance with the Plan. The investment of deferred amounts and the offsetting payable to the Trustees are included in the accompanying Statement of Assets and Liabilities.
Income Tax Information and Distributions to Shareholders. Each year, the Fund intends to qualify as a regulated investment company under Subchapter M of the Internal Revenue Code, including distributing substantially all of its taxable income and realized gains. As a result, no provision for U.S. Federal income taxes is required. The Fund files a U.S. federal tax return, in addition to state and local tax returns as required. The Fund's federal income tax returns are subject to examination by the Internal Revenue Service (IRS) for a period of three fiscal years after they are filed. State and local tax returns may be subject to examination for an additional fiscal year depending on the jurisdiction. Foreign taxes are provided for based on the Fund's understanding of the tax rules and rates that exist in the foreign markets in which it invests.
Distributions are declared and recorded on the ex-dividend date. Income and capital gain distributions are declared separately for each class. Income and capital gain distributions are determined in accordance with income tax regulations, which may differ from GAAP.
Capital accounts within the financial statements are adjusted for permanent book-tax differences. These adjustments have no impact on net assets or the results of operations. Capital accounts are not adjusted for temporary book-tax differences which will reverse in a subsequent period.
Book-tax differences are primarily due to foreign currency transactions, passive foreign investment companies (PFIC), market discount, deferred trustees compensation and losses deferred due to wash sales.
As of period end, the cost and unrealized appreciation (depreciation) in securities, and derivatives if applicable, for federal income tax purposes were as follows:
| Gross unrealized appreciation | $2,282,333 |
| Gross unrealized depreciation | (277,823) |
| Net unrealized appreciation (depreciation) | $2,004,510 |
| Tax cost | $8,987,882 |
Restricted Securities. The Fund may invest in securities that are subject to legal or contractual restrictions on resale. These securities generally may be resold in transactions exempt from registration or to the public if the securities are registered. Disposal of these securities may involve time-consuming negotiations and expense, and prompt sale at an acceptable price may be difficult. Information regarding restricted securities is included at the end of the Fund's Schedule of Investments.
4. Derivative Instruments.
Risk Exposures and the Use of Derivative Instruments. The Fund's investment objective allows the Fund to enter into various types of derivative contracts, including futures contracts. Derivatives are investments whose value is primarily derived from underlying assets, indices or reference rates and may be transacted on an exchange or over-the-counter (OTC). Derivatives may involve a future commitment to buy or sell a specified asset based on specified terms, to exchange future cash flows at periodic intervals based on a notional principal amount, or for one party to make one or more payments upon the occurrence of specified events in exchange for periodic payments from the other party.
The Fund used derivatives to increase returns and to manage exposure to certain risks as defined below. The success of any strategy involving derivatives depends on analysis of numerous economic factors, and if the strategies for investment do not work as intended, the Fund may not achieve its objectives.
The Fund's use of derivatives increased or decreased its exposure to the following risk:
| Equity Risk | Equity risk relates to the fluctuations in the value of financial instruments as a result of changes in market prices (other than those arising from interest rate risk or foreign exchange risk), whether caused by factors specific to an individual investment, its issuer, or all factors affecting all instruments traded in a market or market segment. |
The Fund is also exposed to additional risks from investing in derivatives, such as liquidity risk and counterparty credit risk. Liquidity risk is the risk that the Fund will be unable to close out the derivative in the open market in a timely manner. Counterparty credit risk is the risk that the counterparty will not be able to fulfill its obligation to the Fund. Counterparty credit risk related to exchange-traded futures contracts may be mitigated by the protection provided by the exchange on which they trade.
Investing in derivatives may involve greater risks than investing in the underlying assets directly and, to varying degrees, may involve risk of loss in excess of any initial investment and collateral received and amounts recognized in the Statement of Assets and Liabilities. In addition, there may be the risk that the change in value of the derivative contract does not correspond to the change in value of the underlying instrument.
Futures Contracts. A futures contract is an agreement between two parties to buy or sell a specified underlying instrument for a fixed price at a specified future date. The Fund used futures contracts to manage its exposure to the stock market.
Upon entering into a futures contract, a fund is required to deposit either cash or securities (initial margin) with a clearing broker in an amount equal to a certain percentage of the face value of the contract. Futures contracts are marked-to-market daily and subsequent daily payments (variation margin) are made or received by a fund depending on the daily fluctuations in the value of the futures contracts and are recorded as unrealized appreciation or (depreciation). This receivable and/or payable, if any, is included in daily variation margin on futures contracts in the Statement of Assets and Liabilities. Realized gain or (loss) is recorded upon the expiration or closing of a futures contract. The net realized gain (loss) and change in net unrealized appreciation (depreciation) on futures contracts during the period is presented in the Statement of Operations.
Any open futures contracts at period end are presented in the Schedule of Investments under the caption "Futures Contracts". The notional amount at value reflects each contract's exposure to the underlying instrument or index at period end and is representative of volume of activity during the period. Securities deposited to meet initial margin requirements are identified in the Schedule of Investments.
5. Purchases and Sales of Investments.
Purchases and sales of securities, other than short-term securities and in-kind transactions, aggregated $2,572,165 and $2,693,181, respectively.
Redemptions In-Kind. During the period, 760 shares of the Fund held by unaffiliated entities were redeemed in-kind for investments and cash with a value of $34,857. The net realized gain of $9,586 on investments delivered through the in-kind redemptions is included in the accompanying Statement of Operations. The amount of the redemptions is included in share transactions activity shown in the accompanying Statement of Changes in Net Assets as well as the Notes to Financial Statements. The Fund recognized no gain or loss for federal income tax purposes.
6. Fees and Other Transactions with Affiliates.
Management Fee. Fidelity Management & Research Company (the investment adviser) and its affiliates provide the Fund with investment management related services for which the Fund pays a monthly management fee. The management fee is the sum of an individual fund fee rate that is based on an annual rate of .424% of the Fund's average net assets and an annualized group fee rate that averaged .24% during the period. The group fee rate is based upon the average net assets of all the mutual funds advised by the investment adviser, including any mutual funds previously advised by the investment adviser that are currently advised by Fidelity SelectCo, LLC, an affiliate of the investment adviser. The group fee rate decreases as assets under management increase and increases as assets under management decrease. In addition, the management fee is subject to a performance adjustment (up to a maximum of +/- .20% of the Fund's average net assets over a 36 month performance period). The upward or downward adjustment to the management fee is based on the relative investment performance of International Discovery as compared to its benchmark index, the MSCI EAFE Index, over the same 36 month performance period. For the reporting period, the total annualized management fee rate, including the performance adjustment, was .73% of the Fund's average net assets. The performance adjustment included in the management fee rate may be higher or lower than the maximum performance adjustment rate due to the difference between the average net assets for the reporting and performance periods.
Distribution and Service Plan Fees. In accordance with Rule 12b-1 of the 1940 Act, the Fund has adopted separate Distribution and Service Plans for each class of shares. Certain classes pay Fidelity Distributors Corporation (FDC), an affiliate of the investment adviser, separate Distribution and Service Fees, each of which is based on an annual percentage of each class' average net assets. In addition, FDC may pay financial intermediaries for selling shares of the Fund and providing shareholder support services. For the period, the Distribution and Service Fee rates, total fees and amounts retained by FDC were as follows:
| Distribution Fee | Service Fee | Total Fees | Retained by FDC | |
| Class A | -% | .25% | $304 | $8 |
| Class M | .25% | .25% | 88 | 1 |
| Class C | .75% | .25% | 140 | 12 |
| $532 | $21 |
Sales Load. FDC may receive a front-end sales charge of up to 5.75% for selling Class A shares and 3.50% for selling Class M shares, some of which is paid to financial intermediaries for selling shares of the Fund. Depending on the holding period, FDC may receive contingent deferred sales charges levied on Class A, Class M and Class C redemptions. The deferred sales charges are 1.00% for Class C shares, 1.00% for certain purchases of Class A shares and .25% for certain purchases of Class M shares.
For the period, sales charge amounts retained by FDC were as follows:
| Retained by FDC | |
| Class A | $26 |
| Class M | 2 |
| Class C(a) | 2 |
| $30 |
(a) When Class C shares are initially sold, FDC pays commissions from its own resources to financial intermediaries through which the sales are made.
Transfer Agent Fees. Fidelity Investments Institutional Operations Company, Inc., (FIIOC), an affiliate of the investment adviser, is the transfer, dividend disbursing and shareholder servicing agent for each class of the Fund. FIIOC receives account fees and asset-based fees that vary according to the account size and type of account of the shareholders of the respective classes of the Fund, except for Class K and Class Z. FIIOC receives an asset-based fee of Class K's and Class Z's average net assets. FIIOC pays for typesetting, printing and mailing of shareholder reports, except proxy statements.
For the period, transfer agent fees for each class were as follows:
| Amount | % of Class-Level Average Net Assets(a) | |
| Class A | $297 | .24 |
| Class M | 41 | .23 |
| Class C | 38 | .27 |
| International Discovery | 5,806 | .15 |
| Class K | 533 | .05 |
| Class I | 599 | .18 |
| Class Z | 25 | .05 |
| $7,339 |
(a) Annualized
Accounting and Security Lending Fees. Fidelity Service Company, Inc. (FSC), an affiliate of the investment adviser, maintains the Fund's accounting records. The accounting fee is based on the level of average net assets for each month. Under a separate contract, FSC administers the security lending program. The security lending fee is based on the number and duration of lending transactions. For the period, the fees were equivalent to an annualized rate of .02%.
Brokerage Commissions. The Fund placed a portion of its portfolio transactions with brokerage firms which are affiliates of the investment adviser. Brokerage commissions are included in net realized gain (loss) and change in net unrealized appreciation (depreciation) in the Statement of Operations. The commissions paid to these affiliated firms were $14 for the period.
Interfund Trades. The Fund may purchase from or sell securities to other Fidelity Funds under procedures adopted by the Board. The procedures have been designed to ensure these interfund trades are executed in accordance with Rule 17a-7 of the 1940 Act. Interfund trades are included within the respective purchases and sales amounts shown in the Purchases and Sales of Investments note.
7. Committed Line of Credit.
The Fund participates with other funds managed by the investment adviser or an affiliate in a $4.25 billion credit facility (the "line of credit") to be utilized for temporary or emergency purposes to fund shareholder redemptions or for other short-term liquidity purposes. The Fund has agreed to pay commitment fees on its pro-rata portion of the line of credit, which amounted to $16 and is reflected in Miscellaneous expenses on the Statement of Operations. During the period, the Fund did not borrow on this line of credit.
8. Security Lending.
The Fund lends portfolio securities through a lending agent from time to time in order to earn additional income. For equity securities, a lending agent is used and may loan securities to certain qualified borrowers, including Fidelity Capital Markets (FCM), a broker-dealer affiliated with the Fund. On the settlement date of the loan, the Fund receives collateral (in the form of U.S. Treasury obligations, letters of credit and/or cash) against the loaned securities and maintains collateral in an amount not less than 100% of the market value of the loaned securities during the period of the loan. The market value of the loaned securities is determined at the close of business of the Fund and any additional required collateral is delivered to the Fund on the next business day. The Fund or borrower may terminate the loan at any time, and if the borrower defaults on its obligation to return the securities loaned because of insolvency or other reasons, the Fund may apply collateral received from the borrower against the obligation. The Fund may experience delays and costs in recovering the securities loaned. Any cash collateral received is invested in the Fidelity Securities Lending Cash Central Fund. The value of loaned securities and cash collateral at period end are disclosed on the Fund's Statement of Assets and Liabilities. At period end, there were no security loans outstanding with FCM. Security lending income represents the income earned on investing cash collateral, less rebates paid to borrowers and any lending agent fees associated with the loan, plus any premium payments received for lending certain types of securities. Security lending income is presented in the Statement of Operations as a component of income from Fidelity Central Funds. Total security lending income during the period amounted to $1,662, including less than five hundred dollars from securities loaned to FCM.
9. Expense Reductions.
Commissions paid to certain brokers with whom the investment adviser, or its affiliates, places trades on behalf of the Fund include an amount in addition to trade execution, which may be rebated back to the Fund to offset certain expenses. This amount totaled $1,870 for the period. In addition, through arrangements with the Fund's custodian, credits realized as a result of certain uninvested cash balances were used to reduce the Fund's expenses. During the period, these credits reduced the Fund's custody expenses by less than five hundred dollars.
In addition, during the period the investment adviser reimbursed and/or waived a portion of fund-level operating expenses in the amount of $54.
10. Distributions to Shareholders.
Distributions to shareholders of each class were as follows:
| Six months ended April 30, 2018 | Year ended October 31, 2017 | |
| From net investment income | ||
| Class A | $1,762 | $2,894 |
| Class M | 180 | 333 |
| Class C | 13 | 92 |
| International Discovery | 79,321 | 102,284 |
| Class K | 26,857 | 32,411 |
| Class I | 6,835 | 11,493 |
| Class Z | 1,196 | 667 |
| Total | $116,164 | $150,174 |
| From net realized gain | ||
| Class A | $9,495 | $302 |
| Class M | 1,377 | 44 |
| Class C | 1,119 | 33 |
| International Discovery | 289,470 | 8,190 |
| Class K | 88,812 | 2,392 |
| Class I | 25,555 | 929 |
| Class Z | 3,949 | 49 |
| Total | $419,777 | $11,939 |
11. Share Transactions.
Share transactions for each class were as follows and may contain automatic conversions between classes or exchanges between affiliated funds:
| Shares | Shares | Dollars | Dollars | |
| Six months ended April 30, 2018 | Year ended October 31, 2017 | Six months ended April 30, 2018 | Year ended October 31, 2017 | |
| Class A | ||||
| Shares sold | 399 | 712 | $18,387 | $29,106 |
| Reinvestment of distributions | 252 | 87 | 11,177 | 3,152 |
| Shares redeemed | (769) | (1,774) | (35,245) | (71,253) |
| Net increase (decrease) | (118) | (975) | $(5,681) | $(38,995) |
| Class M | ||||
| Shares sold | 62 | 80 | $2,857 | $3,246 |
| Reinvestment of distributions | 35 | 10 | 1,549 | 365 |
| Shares redeemed | (81) | (274) | (3,729) | (10,830) |
| Net increase (decrease) | 16 | (184) | $677 | $(7,219) |
| Class C | ||||
| Shares sold | 38 | 83 | $1,702 | $3,499 |
| Reinvestment of distributions | 25 | 3 | 1,083 | 116 |
| Shares redeemed | (88) | (174) | (3,994) | (6,878) |
| Net increase (decrease) | (25) | (88) | $(1,209) | $(3,263) |
| International Discovery | ||||
| Shares sold | 9,874 | 19,989 | $457,393 | $812,564 |
| Reinvestment of distributions | 7,869 | 2,884 | 351,491 | 105,223 |
| Shares redeemed | (10,645) | (35,967) | (491,376) | (1,442,640) |
| Net increase (decrease) | 7,098 | (13,094) | $317,508 | $(524,853) |
| Class K | ||||
| Shares sold | 9,665 | 10,877 | $445,759 | $448,875 |
| Reinvestment of distributions | 2,597 | 957 | 115,669 | 34,802 |
| Shares redeemed | (6,230)(a) | (14,039) | (287,754)(a) | (560,342) |
| Net increase (decrease) | 6,032 | (2,205) | $273,674 | $(76,665) |
| Class I | ||||
| Shares sold | 1,311 | 3,202 | $60,349 | $130,302 |
| Reinvestment of distributions | 224 | 82 | 9,992 | 2,985 |
| Shares redeemed | (1,328) | (8,961) | (60,918) | (349,072) |
| Net increase (decrease) | 207 | (5,677) | $9,423 | $(215,785) |
| Class Z | ||||
| Shares sold | 763 | 1,483 | $35,035 | $58,502 |
| Reinvestment of distributions | 67 | 20 | 2,993 | 716 |
| Shares redeemed | (223) | (351) | (10,309) | (14,440) |
| Net increase (decrease) | 607 | 1,152 | $27,719 | $44,778 |
(a) Amount includes in-kind redemptions (see the Redemptions In-Kind note for additional details).
12. Other.
The Fund's organizational documents provide former and current trustees and officers with a limited indemnification against liabilities arising in connection with the performance of their duties to the Fund. In the normal course of business, the Fund may also enter into contracts that provide general indemnifications. The Fund's maximum exposure under these arrangements is unknown as this would be dependent on future claims that may be made against the Fund. The risk of material loss from such claims is considered remote.
At the end of the period, Strategic Advisers International Fund was the owner of record of approximately 11% of the total outstanding shares of the Fund.
Shareholder Expense Example
As a shareholder of the Fund, you incur two types of costs: (1) transaction costs, including sales charges (loads) on purchase payments or redemption proceeds, redemption fees and (2) ongoing costs, including management fees, distribution and/or service (12b-1) fees and other Fund expenses. This Example is intended to help you understand your ongoing costs (in dollars) of investing in the Fund and to compare these costs with the ongoing costs of investing in other mutual funds.
The Example is based on an investment of $1,000 invested at the beginning of the period and held for the entire period (November 1, 2017 to April 30, 2018).
Actual Expenses
The first line of the accompanying table for each class of the Fund provides information about actual account values and actual expenses. You may use the information in this line, together with the amount you invested, to estimate the expenses that you paid over the period. Simply divide your account value by $1,000.00 (for example, an $8,600 account value divided by $1,000.00 = 8.6), then multiply the result by the number in the first line for a class of the Fund under the heading entitled "Expenses Paid During Period" to estimate the expenses you paid on your account during this period. A small balance maintenance fee of $12.00 that is charged once a year may apply for certain accounts with a value of less than $2,000. This fee is not included in the table below. If it was, the estimate of expenses you paid during the period would be higher, and your ending account value lower, by this amount. In addition, the Fund, as a shareholder in the underlying Fidelity Central Funds, will indirectly bear its pro-rata share of the fees and expenses incurred by the underlying Fidelity Central Funds. These fees and expenses are not included in the Fund's annualized expense ratio used to calculate the expense estimate in the table below.
Hypothetical Example for Comparison Purposes
The second line of the accompanying table for each class of the Fund provides information about hypothetical account values and hypothetical expenses based on a Class' actual expense ratio and an assumed rate of return of 5% per year before expenses, which is not the Class' actual return. The hypothetical account values and expenses may not be used to estimate the actual ending account balance or expenses you paid for the period. You may use this information to compare the ongoing costs of investing in the Fund and other funds. To do so, compare this 5% hypothetical example with the 5% hypothetical examples that appear in the shareholder reports of the other funds. A small balance maintenance fee of $12.00 that is charged once a year may apply for certain accounts with a value of less than $2,000. This fee is not included in the table below. If it was, the estimate of expenses you paid during the period would be higher, and your ending account value lower, by this amount. In addition, the Fund, as a shareholder in the underlying Fidelity Central Funds, will indirectly bear its pro-rata share of the fees and expenses incurred by the underlying Fidelity Central Funds. These fees and expenses are not included in the Fund's annualized expense ratio used to calculate the expense estimate in the table below.
Please note that the expenses shown in the table are meant to highlight your ongoing costs only and do not reflect any transaction costs. Therefore, the second line of the table is useful in comparing ongoing costs only, and will not help you determine the relative total costs of owning different funds. In addition, if these transactional costs were included, your costs would have been higher.
| Annualized Expense Ratio-A | Beginning Account Value November 1, 2017 | Ending Account Value April 30, 2018 | Expenses Paid During Period-B November 1, 2017 to April 30, 2018 | |
| Class A | 1.26% | |||
| Actual | $1,000.00 | $1,014.00 | $6.29 | |
| Hypothetical-C | $1,000.00 | $1,018.55 | $6.31 | |
| Class M | 1.50% | |||
| Actual | $1,000.00 | $1,013.00 | $7.49 | |
| Hypothetical-C | $1,000.00 | $1,017.36 | $7.50 | |
| Class C | 2.04% | |||
| Actual | $1,000.00 | $1,009.90 | $10.17 | |
| Hypothetical-C | $1,000.00 | $1,014.68 | $10.19 | |
| International Discovery | .93% | |||
| Actual | $1,000.00 | $1,015.60 | $4.65 | |
| Hypothetical-C | $1,000.00 | $1,020.18 | $4.66 | |
| Class K | .82% | |||
| Actual | $1,000.00 | $1,016.10 | $4.10 | |
| Hypothetical-C | $1,000.00 | $1,020.73 | $4.11 | |
| Class I | .95% | |||
| Actual | $1,000.00 | $1,015.60 | $4.75 | |
| Hypothetical-C | $1,000.00 | $1,020.08 | $4.76 | |
| Class Z | .82% | |||
| Actual | $1,000.00 | $1,016.40 | $4.10 | |
| Hypothetical-C | $1,000.00 | $1,020.73 | $4.11 |
A Annualized expense ratio reflects expenses net of applicable fee waivers.
B Expenses are equal to each Class' annualized expense ratio, multiplied by the average account value over the period, multiplied by 181/365 (to reflect the one-half year period).
C 5% return per year before expenses
![]()
Corporate Headquarters
245 Summer St.
Boston, MA 02210
www.fidelity.com
IGI-K-SANN-0618
1.863311.109
Fidelity® International Discovery Fund Semi-Annual Report April 30, 2018 |
|
Contents
To view a fund's proxy voting guidelines and proxy voting record for the 12-month period ended June 30, visit http://www.fidelity.com/proxyvotingresults or visit the Securities and Exchange Commission's (SEC) web site at http://www.sec.gov.
You may also call 1-800-544-8544 to request a free copy of the proxy voting guidelines.
Standard & Poor's, S&P and S&P 500 are registered service marks of The McGraw-Hill Companies, Inc. and have been licensed for use by Fidelity Distributors Corporation.
Other third-party marks appearing herein are the property of their respective owners.
All other marks appearing herein are registered or unregistered trademarks or service marks of FMR LLC or an affiliated company. © 2018 FMR LLC. All rights reserved.
This report and the financial statements contained herein are submitted for the general information of the shareholders of the Fund. This report is not authorized for distribution to prospective investors in the Fund unless preceded or accompanied by an effective prospectus.
A fund files its complete schedule of portfolio holdings with the SEC for the first and third quarters of each fiscal year on Form N-Q. Forms N-Q are available on the SEC’s web site at http://www.sec.gov. A fund's Forms N-Q may be reviewed and copied at the SEC’s Public Reference Room in Washington, DC. Information regarding the operation of the SEC's Public Reference Room may be obtained by calling 1-800-SEC-0330.
For a complete list of a fund's portfolio holdings, view the most recent holdings listing, semiannual report, or annual report on Fidelity's web site at http://www.fidelity.com, http://www.institutional.fidelity.com, or http://www.401k.com, as applicable.
NOT FDIC INSURED •MAY LOSE VALUE •NO BANK GUARANTEE
Neither the Fund nor Fidelity Distributors Corporation is a bank.
Investment Summary (Unaudited)
Geographic Diversification (% of fund's net assets)
| As of April 30, 2018 | ||
| Japan | 19.1% | |
| United Kingdom | 11.5% | |
| France | 10.4% | |
| Germany | 7.5% | |
| Switzerland | 6.4% | |
| Netherlands | 5.2% | |
| Spain | 4.3% | |
| Ireland | 3.7% | |
| India | 3.7% | |
| Other* | 28.2% | |
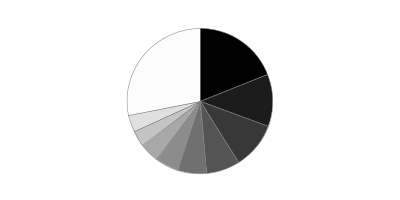
* Includes Short-Term Investments and Net Other Assets (Liabilities).
Percentages are based on country or territory of incorporation and are adjusted for the effect of futures contracts, if applicable.
Asset Allocation as of April 30, 2018
| % of fund's net assets | |
| Stocks and Equity Futures | 96.5 |
| Short-Term Investments and Net Other Assets (Liabilities) | 3.5 |
Top Ten Stocks as of April 30, 2018
| % of fund's net assets | |
| Total SA (France, Oil, Gas & Consumable Fuels) | 2.5 |
| Statoil ASA (Norway, Oil, Gas & Consumable Fuels) | 2.1 |
| SAP SE (Germany, Software) | 1.5 |
| AstraZeneca PLC (United Kingdom) (United Kingdom, Pharmaceuticals) | 1.4 |
| CaixaBank SA (Spain, Banks) | 1.4 |
| Roche Holding AG (participation certificate) (Switzerland, Pharmaceuticals) | 1.4 |
| ORIX Corp. (Japan, Diversified Financial Services) | 1.3 |
| Unilever NV (Certificaten Van Aandelen) (Bearer) (Netherlands, Personal Products) | 1.3 |
| Housing Development Finance Corp. Ltd. (India, Thrifts & Mortgage Finance) | 1.2 |
| VINCI SA (France, Construction & Engineering) | 1.2 |
| 15.3 |
Top Market Sectors as of April 30, 2018
| % of fund's net assets | |
| Financials | 22.3 |
| Industrials | 13.9 |
| Consumer Discretionary | 11.9 |
| Health Care | 10.0 |
| Information Technology | 9.6 |
| Consumer Staples | 8.5 |
| Materials | 7.1 |
| Energy | 6.1 |
| Real Estate | 1.9 |
| Telecommunication Services | 1.5 |
Schedule of Investments April 30, 2018 (Unaudited)
Showing Percentage of Net Assets
| Common Stocks - 92.1% | |||
| Shares | Value (000s) | ||
| Australia - 1.5% | |||
| Bapcor Ltd. (a) | 8,531,892 | $37,643 | |
| Blue Sky Alternative Investments Ltd. | 3,175,826 | 7,320 | |
| BWX Ltd. (a) | 2,157,954 | 8,187 | |
| Inghams Group Ltd. (a) | 7,320,478 | 20,655 | |
| Link Administration Holdings Ltd. | 3,223,548 | 20,058 | |
| Magellan Financial Group Ltd. | 1,200,134 | 20,967 | |
| National Storage (REIT) unit | 11,386,057 | 13,670 | |
| Rio Tinto Ltd. | 185,386 | 11,033 | |
| Spark Infrastructure Group unit | 14,202,580 | 25,042 | |
| TOTAL AUSTRALIA | 164,575 | ||
| Austria - 1.4% | |||
| Erste Group Bank AG | 1,736,200 | 85,123 | |
| Wienerberger AG | 2,643,500 | 66,719 | |
| TOTAL AUSTRIA | 151,842 | ||
| Bailiwick of Jersey - 1.1% | |||
| Glencore Xstrata PLC | 24,686,927 | 119,191 | |
| Belgium - 1.7% | |||
| Anheuser-Busch InBev SA NV (a) | 407,427 | 40,699 | |
| KBC Groep NV | 1,370,241 | 119,800 | |
| Telenet Group Holding NV (b) | 453,400 | 26,588 | |
| TOTAL BELGIUM | 187,087 | ||
| Bermuda - 0.4% | |||
| Hiscox Ltd. | 2,360,300 | 48,384 | |
| Brazil - 0.0% | |||
| Itausa-Investimentos Itau SA | 391,494 | 1,509 | |
| Canada - 2.0% | |||
| Alimentation Couche-Tard, Inc. Class B (sub. vtg.) | 698,400 | 30,194 | |
| Cenovus Energy, Inc. | 3,278,900 | 32,841 | |
| Constellation Software, Inc. | 73,200 | 52,316 | |
| PrairieSky Royalty Ltd. (a) | 2,359,273 | 52,314 | |
| Suncor Energy, Inc. | 1,427,200 | 54,578 | |
| TOTAL CANADA | 222,243 | ||
| Cayman Islands - 1.3% | |||
| Alibaba Group Holding Ltd. sponsored ADR (b) | 447,200 | 79,843 | |
| China Literature Ltd. (b)(c) | 3,275,200 | 26,382 | |
| New Oriental Education & Technology Group, Inc. sponsored ADR | 255,000 | 22,909 | |
| Ping An Healthcare and Technology Co. Ltd. (b) | 453,000 | 3,163 | |
| Zai Lab Ltd. ADR (a) | 388,800 | 7,259 | |
| TOTAL CAYMAN ISLANDS | 139,556 | ||
| China - 1.4% | |||
| Jiangsu Yanghe Brewery Joint-Stock Co. Ltd. Class A | 2,538,600 | 44,731 | |
| Kweichow Moutai Co. Ltd. (A Shares) | 474,382 | 49,397 | |
| Qingdao Port International Co. Ltd. (c) | 11,117,000 | 9,133 | |
| Shanghai International Airport Co. Ltd. (A Shares) | 5,665,100 | 44,495 | |
| TOTAL CHINA | 147,756 | ||
| Denmark - 0.6% | |||
| Novo Nordisk A/S Series B | 930,645 | 43,766 | |
| Novozymes A/S Series B | 391,900 | 18,424 | |
| TOTAL DENMARK | 62,190 | ||
| Finland - 0.5% | |||
| Sampo Oyj (A Shares) | 895,600 | 48,398 | |
| France - 10.4% | |||
| Accor SA | 950,500 | 53,799 | |
| ALTEN | 335,159 | 33,310 | |
| Altran Technologies SA (a) | 1,487,300 | 22,990 | |
| Amundi SA (c) | 546,458 | 46,510 | |
| Atos Origin SA | 243,414 | 32,893 | |
| BNP Paribas SA | 945,800 | 73,075 | |
| Capgemini SA | 487,000 | 67,044 | |
| Cegedim SA (b) | 581,063 | 24,700 | |
| Elis SA | 1,195,800 | 28,621 | |
| Kaufman & Broad SA | 144,863 | 7,638 | |
| LVMH Moet Hennessy - Louis Vuitton SA | 240,539 | 83,710 | |
| Rexel SA | 2,126,400 | 32,997 | |
| Sartorius Stedim Biotech | 305,000 | 28,508 | |
| SMCP S.A.S. (c) | 642,504 | 16,406 | |
| Societe Generale Series A | 2,222,100 | 121,613 | |
| Thales SA | 437,100 | 55,423 | |
| Total SA (a) | 4,305,010 | 270,571 | |
| VINCI SA (a) | 1,308,500 | 130,829 | |
| TOTAL FRANCE | 1,130,637 | ||
| Germany - 7.5% | |||
| adidas AG | 447,307 | 110,140 | |
| Aumann AG (c) | 133,451 | 8,074 | |
| Deutsche Borse AG | 163,981 | 22,054 | |
| Deutsche Post AG | 2,231,918 | 96,875 | |
| Fresenius SE & Co. KGaA | 901,300 | 68,940 | |
| Henkel AG & Co. KGaA | 321,600 | 38,351 | |
| JOST Werke AG (c) | 219,700 | 9,273 | |
| Linde AG | 286,300 | 63,633 | |
| MTU Aero Engines Holdings AG | 381,500 | 65,880 | |
| Muenchener Rueckversicherungs AG | 122,300 | 28,054 | |
| Nexus AG | 602,505 | 20,154 | |
| Rational AG | 36,605 | 22,964 | |
| Rheinmetall AG | 302,400 | 39,677 | |
| SAP SE | 1,507,211 | 167,460 | |
| Scout24 AG (c) | 458,900 | 23,796 | |
| Wirecard AG | 221,900 | 30,307 | |
| TOTAL GERMANY | 815,632 | ||
| Hong Kong - 1.5% | |||
| AIA Group Ltd. | 11,175,600 | 99,879 | |
| Techtronic Industries Co. Ltd. | 10,247,000 | 60,029 | |
| TOTAL HONG KONG | 159,908 | ||
| India - 3.7% | |||
| Avenue Supermarts Ltd. (b)(c) | 595,148 | 13,270 | |
| Bandhan Bank Ltd. (c) | 444,600 | 3,416 | |
| Bharti Infratel Ltd. | 3,348,609 | 15,760 | |
| HDFC Bank Ltd. | 1,783,391 | 53,751 | |
| HDFC Bank Ltd. sponsored ADR | 696,184 | 66,701 | |
| Housing Development Finance Corp. Ltd. | 4,738,215 | 134,058 | |
| Kajaria Ceramics Ltd. | 2,444,763 | 20,017 | |
| Kotak Mahindra Bank Ltd. (b) | 1,211,049 | 22,022 | |
| Petronet LNG Ltd. | 6,098,248 | 20,763 | |
| PNB Housing Finance Ltd. (c) | 838,105 | 17,591 | |
| PVR Ltd. (b) | 442,801 | 9,576 | |
| Sunteck Realty Ltd. (b) | 3,638,783 | 23,470 | |
| TOTAL INDIA | 400,395 | ||
| Indonesia - 0.4% | |||
| PT Bank Central Asia Tbk | 6,980,000 | 11,037 | |
| PT Bank Rakyat Indonesia Tbk | 157,115,200 | 36,226 | |
| TOTAL INDONESIA | 47,263 | ||
| Ireland - 3.7% | |||
| Cairn Homes PLC (b) | 20,159,470 | 43,723 | |
| CRH PLC | 2,180,712 | 77,440 | |
| Dalata Hotel Group PLC (b) | 3,827,700 | 30,507 | |
| DCC PLC (United Kingdom) | 353,400 | 34,057 | |
| Glenveagh Properties PLC (c) | 13,703,776 | 18,303 | |
| Green REIT PLC | 9,492,200 | 17,401 | |
| James Hardie Industries PLC CDI | 2,420,296 | 42,741 | |
| Kerry Group PLC Class A | 561,500 | 57,297 | |
| Ryanair Holdings PLC sponsored ADR (b) | 342,366 | 37,650 | |
| United Drug PLC (United Kingdom) | 3,798,200 | 47,845 | |
| TOTAL IRELAND | 406,964 | ||
| Israel - 0.6% | |||
| Frutarom Industries Ltd. | 694,000 | 66,624 | |
| Italy - 1.2% | |||
| Intesa Sanpaolo SpA | 24,317,500 | 92,503 | |
| Prada SpA | 7,015,800 | 35,598 | |
| TOTAL ITALY | 128,101 | ||
| Japan - 15.6% | |||
| AEON Financial Service Co. Ltd. | 1,577,400 | 37,025 | |
| Daito Trust Construction Co. Ltd. | 164,500 | 27,469 | |
| Hoya Corp. | 1,580,200 | 84,734 | |
| Keyence Corp. | 138,020 | 84,552 | |
| Komatsu Ltd. | 1,514,600 | 51,631 | |
| Minebea Mitsumi, Inc. | 3,071,200 | 61,722 | |
| Misumi Group, Inc. | 1,135,000 | 31,459 | |
| Mitsubishi UFJ Financial Group, Inc. | 13,190,300 | 88,393 | |
| Monex Group, Inc. (a) | 4,390,349 | 25,060 | |
| Morinaga & Co. Ltd. | 576,300 | 28,098 | |
| Nidec Corp. | 347,200 | 54,437 | |
| Nintendo Co. Ltd. | 105,200 | 44,203 | |
| Nitori Holdings Co. Ltd. | 491,400 | 83,069 | |
| ORIX Corp. | 8,418,200 | 148,158 | |
| Panasonic Corp. | 6,196,200 | 91,748 | |
| Recruit Holdings Co. Ltd. | 948,400 | 21,923 | |
| Relo Group, Inc. | 2,584,400 | 58,298 | |
| Renesas Electronics Corp. (a)(b) | 5,075,700 | 53,301 | |
| SMC Corp. | 226,600 | 86,478 | |
| SMS Co., Ltd. | 813,800 | 30,893 | |
| SoftBank Corp. | 817,600 | 62,472 | |
| Sony Corp. | 2,396,700 | 111,941 | |
| Start Today Co. Ltd. | 1,761,000 | 50,903 | |
| Sundrug Co. Ltd. | 838,200 | 43,167 | |
| Taiheiyo Cement Corp. | 1,345,000 | 50,997 | |
| Tateru, Inc. (a) | 1,173,700 | 19,991 | |
| Tsuruha Holdings, Inc. | 469,600 | 67,571 | |
| VT Holdings Co. Ltd. | 3,859,500 | 17,617 | |
| Welcia Holdings Co. Ltd. | 1,669,400 | 85,974 | |
| TOTAL JAPAN | 1,703,284 | ||
| Korea (South) - 0.3% | |||
| Hyundai Fire & Marine Insurance Co. Ltd. | 331,774 | 11,850 | |
| KB Financial Group, Inc. | 437,375 | 24,783 | |
| TOTAL KOREA (SOUTH) | 36,633 | ||
| Netherlands - 5.2% | |||
| ASML Holding NV (Netherlands) | 468,600 | 89,126 | |
| Basic-Fit NV (b)(c) | 577,200 | 17,391 | |
| IMCD Group BV | 926,545 | 57,120 | |
| ING Groep NV (Certificaten Van Aandelen) | 4,812,900 | 81,100 | |
| Instone Real Estate Group BV (b)(c) | 1,011,300 | 24,232 | |
| Koninklijke Philips Electronics NV | 2,573,226 | 108,915 | |
| NIBC Holding NV (b)(c) | 3,004,124 | 29,947 | |
| Philips Lighting NV (c) | 195,000 | 5,944 | |
| Unilever NV (Certificaten Van Aandelen) (Bearer) | 2,511,232 | 143,965 | |
| Van Lanschot NV (Bearer) | 222,900 | 6,891 | |
| TOTAL NETHERLANDS | 564,631 | ||
| New Zealand - 1.1% | |||
| EBOS Group Ltd. | 3,144,406 | 39,337 | |
| Fisher & Paykel Healthcare Corp. | 3,635,018 | 32,609 | |
| Ryman Healthcare Group Ltd. | 6,157,798 | 45,926 | |
| TOTAL NEW ZEALAND | 117,872 | ||
| Norway - 2.1% | |||
| Statoil ASA | 8,895,913 | 227,493 | |
| Philippines - 0.3% | |||
| SM Investments Corp. | 1,901,955 | 34,446 | |
| South Africa - 1.6% | |||
| Clicks Group Ltd. | 2,101,458 | 35,928 | |
| FirstRand Ltd. | 5,177,700 | 27,729 | |
| Naspers Ltd. Class N | 222,400 | 54,181 | |
| PSG Group Ltd. | 1,687,000 | 30,353 | |
| Remgro Ltd. | 1,457,600 | 26,242 | |
| TOTAL SOUTH AFRICA | 174,433 | ||
| Spain - 4.3% | |||
| Aedas Homes SAU (c) | 405,465 | 14,444 | |
| Amadeus IT Holding SA Class A | 791,500 | 58,018 | |
| CaixaBank SA | 31,380,333 | 152,599 | |
| Grifols SA ADR | 2,895,358 | 58,834 | |
| Masmovil Ibercom SA (b) | 483,879 | 69,886 | |
| Neinor Homes SLU (b)(c) | 737,500 | 14,303 | |
| Prosegur Cash SA (c) | 19,504,100 | 56,999 | |
| Zardoya Otis SA | 4,123,773 | 42,179 | |
| TOTAL SPAIN | 467,262 | ||
| Sweden - 2.5% | |||
| ASSA ABLOY AB (B Shares) (a) | 3,327,600 | 69,998 | |
| Essity AB Class B (a) | 2,674,100 | 68,100 | |
| HEXPOL AB (B Shares) (a) | 1,866,400 | 19,396 | |
| Indutrade AB | 1,700,600 | 40,278 | |
| Saab AB (B Shares) (a) | 764,400 | 31,382 | |
| Svenska Cellulosa AB (SCA) (B Shares) | 3,967,200 | 44,091 | |
| TOTAL SWEDEN | 273,245 | ||
| Switzerland - 6.4% | |||
| Credit Suisse Group AG | 6,506,687 | 109,743 | |
| Forbo Holding AG (Reg.) | 20,060 | 28,177 | |
| Julius Baer Group Ltd. | 836,630 | 49,653 | |
| Kaba Holding AG (B Shares) (Reg.) | 41,260 | 32,059 | |
| Lonza Group AG | 260,791 | 64,264 | |
| Partners Group Holding AG | 75,626 | 55,441 | |
| Roche Holding AG (participation certificate) | 683,328 | 151,827 | |
| Schindler Holding AG (participation certificate) | 164,075 | 34,040 | |
| Swatch Group AG (Bearer) | 238,640 | 115,226 | |
| UBS Group AG | 3,586,740 | 60,696 | |
| TOTAL SWITZERLAND | 701,126 | ||
| Taiwan - 0.3% | |||
| United Microelectronics Corp. | 62,100,000 | 33,429 | |
| United Kingdom - 11.5% | |||
| Anglo American PLC (United Kingdom) | 1,379,900 | 32,474 | |
| Antofagasta PLC | 2,486,800 | 33,291 | |
| AstraZeneca PLC (United Kingdom) | 2,182,762 | 152,799 | |
| Barclays PLC | 58,904 | 168 | |
| BCA Marketplace PLC | 7,736,200 | 20,300 | |
| BHP Billiton PLC | 3,424,439 | 73,017 | |
| British American Tobacco PLC: | |||
| (United Kingdom) | 1,445,432 | 79,278 | |
| sponsored ADR | 421,600 | 23,028 | |
| Bunzl PLC | 2,012,418 | 58,485 | |
| Clipper Logistics PLC | 2,271,300 | 14,102 | |
| CMC Markets PLC (c) | 206,570 | 539 | |
| Compass Group PLC | 2,344,943 | 50,361 | |
| Conviviality PLC (d) | 5,464,968 | 3,807 | |
| Countryside Properties PLC (c) | 53,784 | 266 | |
| Cranswick PLC | 1,364,288 | 54,731 | |
| Dechra Pharmaceuticals PLC | 239,376 | 9,036 | |
| Hastings Group Holdings PLC (c) | 2,038,137 | 7,744 | |
| Indivior PLC (b) | 3,936,900 | 24,558 | |
| JTC PLC (b)(c) | 3,870,300 | 16,331 | |
| LivaNova PLC (b) | 693,902 | 61,605 | |
| London Stock Exchange Group PLC | 914,236 | 54,121 | |
| Melrose Industries PLC | 23,361,453 | 73,329 | |
| Micro Focus International PLC | 3,060,205 | 52,768 | |
| NCC Group Ltd. | 9,120,600 | 24,686 | |
| Reckitt Benckiser Group PLC | 422,519 | 33,146 | |
| Rex Bionics PLC (b)(d)(e) | 1,292,931 | 31 | |
| Rio Tinto PLC | 918,990 | 50,090 | |
| Senior Engineering Group PLC | 7,108,200 | 28,907 | |
| St. James's Place Capital PLC | 2,337,909 | 36,579 | |
| Standard Chartered PLC (United Kingdom) | 8,953,861 | 94,546 | |
| The Weir Group PLC | 1,804,000 | 53,049 | |
| Zpg PLC | 8,356,009 | 41,298 | |
| TOTAL UNITED KINGDOM | 1,258,470 | ||
| TOTAL COMMON STOCKS | |||
| (Cost $8,032,417) | 10,040,579 | ||
| Preferred Stocks - 0.9% | |||
| Convertible Preferred Stocks - 0.3% | |||
| Cayman Islands - 0.3% | |||
| China Internet Plus Holdings Ltd. Series A-11 (b)(d)(f) | 5,958,244 | 33,301 | |
| Nonconvertible Preferred Stocks - 0.6% | |||
| Brazil - 0.6% | |||
| Itausa-Investimentos Itau SA (PN) | 16,504,700 | 64,121 | |
| TOTAL PREFERRED STOCKS | |||
| (Cost $76,821) | 97,422 | ||
| Principal Amount (000s) | Value (000s) | ||
| Government Obligations - 0.1% | |||
| United States of America - 0.1% | |||
| U.S. Treasury Bills, yield at date of purchase 1.48% to 1.79% 5/10/18 to 7/19/18(g) | |||
| (Cost $10,765) | 10,790 | 10,765 | |
| Shares | Value (000s) | ||
| Money Market Funds - 7.6% | |||
| Fidelity Cash Central Fund, 1.74% (h) | 664,231,102 | 664,364 | |
| Fidelity Securities Lending Cash Central Fund 1.74% (h)(i) | 170,618,463 | 170,636 | |
| TOTAL MONEY MARKET FUNDS | |||
| (Cost $835,000) | 835,000 | ||
| TOTAL INVESTMENT IN SECURITIES - 100.7% | |||
| (Cost $8,955,003) | 10,983,766 | ||
| NET OTHER ASSETS (LIABILITIES) - (0.7)% | (78,311) | ||
| NET ASSETS - 100% | $10,905,455 |
| Futures Contracts | |||||
| Number of contracts | Expiration Date | Notional Amount (000s) | Value (000s) | Unrealized Appreciation/(Depreciation) (000s) | |
| Purchased | |||||
| Equity Index Contracts | |||||
| TSE TOPIX Index Contracts (Japan) | 2,383 | June 2018 | $386,376 | $8,626 | $8,626 |
The notional amount of futures purchased as a percentage of Net Assets is 3.5%
Categorizations in the Schedule of Investments are based on country or territory of incorporation.
Legend
(a) Security or a portion of the security is on loan at period end.
(b) Non-income producing
(c) Security exempt from registration under Rule 144A of the Securities Act of 1933. These securities may be resold in transactions exempt from registration, normally to qualified institutional buyers. At the end of the period, the value of these securities amounted to $380,294,000 or 3.5% of net assets.
(d) Level 3 security
(e) Affiliated company
(f) Restricted securities - Investment in securities not registered under the Securities Act of 1933 (excluding 144A issues). At the end of the period, the value of restricted securities (excluding 144A issues) amounted to $33,301,000 or 0.3% of net assets.
(g) Security or a portion of the security was pledged to cover margin requirements for futures contracts. At period end, the value of securities pledged amounted to $10,353,000.
(h) Affiliated fund that is generally available only to investment companies and other accounts managed by Fidelity Investments. The rate quoted is the annualized seven-day yield of the fund at period end. A complete unaudited listing of the fund's holdings as of its most recent quarter end is available upon request. In addition, each Fidelity Central Fund's financial statements are available on the SEC's website or upon request.
(i) Investment made with cash collateral received from securities on loan.
Additional information on each restricted holding is as follows:
| Security | Acquisition Date | Acquisition Cost (000s) |
| China Internet Plus Holdings Ltd. Series A-11 | 1/26/15 | $18,833 |
Affiliated Central Funds
Information regarding fiscal year to date income earned by the Fund from investments in Fidelity Central Funds is as follows:
| Fund | Income earned |
| (Amounts in thousands) | |
| Fidelity Cash Central Fund | $2,770 |
| Fidelity Securities Lending Cash Central Fund | 1,662 |
| Total | $4,432 |
Amounts in the income column in the above table include any capital gain distributions from underlying funds, which are presented in the corresponding line-item in the Statement of Operations if applicable.
Other Affiliated Issuers
An affiliated company is a company in which the Fund has ownership of at least 5% of the voting securities. Fiscal year to date transactions with companies which are or were affiliates are as follows:
| Affiliate (Amounts in thousands) | Value, beginning of period | Purchases | Sales Proceeds*,** | Dividend Income | Realized Gain (loss) | Change in Unrealized appreciation (depreciation) | Value, end of period |
| Rex Bionics PLC | $30 | $-- | $0 | $-- | $(13) | $14 | $31 |
| Total | $30 | $-- | $0 | $-- | $(13) | $14 | $31 |
* Values shown as $0 may reflect amounts less than $500.
** Includes the value of securities delivered through in-kind transactions, if applicable.
Investment Valuation
The following is a summary of the inputs used, as of April 30, 2018, involving the Fund's assets and liabilities carried at fair value. The inputs or methodology used for valuing securities may not be an indication of the risk associated with investing in those securities. For more information on valuation inputs, and their aggregation into the levels used below, please refer to the Investment Valuation section in the accompanying Notes to Financial Statements.
| Valuation Inputs at Reporting Date: | ||||
| Description | Total | Level 1 | Level 2 | Level 3 |
| (Amounts in thousands) | ||||
| Investments in Securities: | ||||
| Equities: | ||||
| Consumer Discretionary | $1,275,975 | $718,596 | $524,078 | $33,301 |
| Consumer Staples | 956,304 | 537,210 | 415,287 | 3,807 |
| Energy | 658,560 | 139,733 | 518,827 | -- |
| Financials | 2,456,802 | 1,223,602 | 1,233,200 | -- |
| Health Care | 1,078,810 | 618,309 | 460,470 | 31 |
| Industrials | 1,503,716 | 1,116,290 | 387,426 | -- |
| Information Technology | 1,048,235 | 730,317 | 317,918 | -- |
| Materials | 769,161 | 496,416 | 272,745 | -- |
| Real Estate | 217,278 | 180,138 | 37,140 | -- |
| Telecommunication Services | 148,118 | 69,886 | 78,232 | -- |
| Utilities | 25,042 | -- | 25,042 | -- |
| Government Obligations | 10,765 | -- | 10,765 | -- |
| Money Market Funds | 835,000 | 835,000 | -- | -- |
| Total Investments in Securities: | $10,983,766 | $6,665,497 | $4,281,130 | $37,139 |
| Derivative Instruments: | ||||
| Assets | ||||
| Futures Contracts | $8,626 | $8,626 | $-- | $-- |
| Total Assets | $8,626 | $8,626 | $-- | $-- |
| Total Derivative Instruments: | $8,626 | $8,626 | $-- | $-- |
The following is a summary of transfers between Level 1 and Level 2 for the period ended April 30, 2018. Transfers are assumed to have occurred at the beginning of the period, and are primarily attributable to the valuation techniques used for foreign equity securities, as discussed in the accompanying Notes to Financial Statements:
| Transfers | Total (000s) |
| Level 1 to Level 2 | $1,245,829 |
| Level 2 to Level 1 | $1,276,764 |
Value of Derivative Instruments
The following table is a summary of the Fund's value of derivative instruments by primary risk exposure as of April 30, 2018. For additional information on derivative instruments, please refer to the Derivative Instruments section in the accompanying Notes to Financial Statements.
| Primary Risk Exposure / Derivative Type | Value | |
| Asset | Liability | |
| (Amounts in thousands) | ||
| Equity Risk | ||
| Futures Contracts(a) | $8,626 | $0 |
| Total Equity Risk | 8,626 | 0 |
| Total Value of Derivatives | $8,626 | $0 |
(a) Reflects gross cumulative appreciation (depreciation) on futures contracts as presented in the Schedule of Investments. In the Statement of Assets and Liabilities, the period end daily variation margin is included in receivable or payable for daily variation margin on futures contracts, and the net cumulative appreciation (depreciation) is included in net unrealized appreciation (depreciation).
See accompanying notes which are an integral part of the financial statements.
Financial Statements
Statement of Assets and Liabilities
| Amounts in thousands (except per-share amounts) | April 30, 2018 (Unaudited) | |
| Assets | ||
| Investment in securities, at value (including securities loaned of $161,920) — See accompanying schedule: Unaffiliated issuers (cost $8,116,075) | $10,148,735 | |
| Fidelity Central Funds (cost $835,000) | 835,000 | |
| Other affiliated issuers (cost $3,928) | 31 | |
| Total Investment in Securities (cost $8,955,003) | $10,983,766 | |
| Foreign currency held at value (cost $4,142) | 4,139 | |
| Receivable for investments sold | 59,253 | |
| Receivable for fund shares sold | 6,177 | |
| Dividends receivable | 45,857 | |
| Distributions receivable from Fidelity Central Funds | 1,344 | |
| Prepaid expenses | 5 | |
| Other receivables | 4,900 | |
| Total assets | 11,105,441 | |
| Liabilities | ||
| Payable for investments purchased | $10,074 | |
| Payable for fund shares redeemed | 8,876 | |
| Accrued management fee | 6,488 | |
| Distribution and service plan fees payable | 85 | |
| Payable for daily variation margin on futures contracts | 1,526 | |
| Other affiliated payables | 1,377 | |
| Other payables and accrued expenses | 916 | |
| Collateral on securities loaned | 170,644 | |
| Total liabilities | 199,986 | |
| Net Assets | $10,905,455 | |
| Net Assets consist of: | ||
| Paid in capital | $8,492,109 | |
| Undistributed net investment income | 49,889 | |
| Accumulated undistributed net realized gain (loss) on investments and foreign currency transactions | 327,767 | |
| Net unrealized appreciation (depreciation) on investments and assets and liabilities in foreign currencies | 2,035,690 | |
| Net Assets | $10,905,455 | |
| Calculation of Maximum Offering Price | ||
| Class A: | ||
| Net Asset Value and redemption price per share ($234,013 ÷ 5,187.7 shares) | $45.11 | |
| Maximum offering price per share (100/94.25 of $45.11) | $47.86 | |
| Class M: | ||
| Net Asset Value and redemption price per share ($34,441 ÷ 768.0 shares) | $44.85 | |
| Maximum offering price per share (100/96.50 of $44.85) | $46.48 | |
| Class C: | ||
| Net Asset Value and offering price per share ($26,394 ÷ 592.8 shares)(a) | $44.52 | |
| International Discovery: | ||
| Net Asset Value, offering price and redemption price per share ($7,418,045 ÷ 163,378.1 shares) | $45.40 | |
| Class K: | ||
| Net Asset Value, offering price and redemption price per share ($2,422,704 ÷ 53,487.8 shares) | $45.29 | |
| Class I: | ||
| Net Asset Value, offering price and redemption price per share ($644,863 ÷ 14,238.4 shares) | $45.29 | |
| Class Z: | ||
| Net Asset Value, offering price and redemption price per share ($124,995 ÷ 2,761.6 shares) | $45.26 |
(a) Redemption price per share is equal to net asset value less any applicable contingent deferred sales charge.
See accompanying notes which are an integral part of the financial statements.
Statement of Operations
| Amounts in thousands | Six months ended April 30, 2018 (Unaudited) | |
| Investment Income | ||
| Dividends | $112,360 | |
| Interest | 39 | |
| Income from Fidelity Central Funds | 4,432 | |
| Income before foreign taxes withheld | 116,831 | |
| Less foreign taxes withheld | (11,116) | |
| Total income | 105,715 | |
| Expenses | ||
| Management fee | ||
| Basic fee | $36,336 | |
| Performance adjustment | 3,816 | |
| Transfer agent fees | 7,339 | |
| Distribution and service plan fees | 532 | |
| Accounting and security lending fees | 916 | |
| Custodian fees and expenses | 815 | |
| Independent trustees' fees and expenses | 22 | |
| Registration fees | 154 | |
| Audit | 48 | |
| Legal | 20 | |
| Miscellaneous | 34 | |
| Total expenses before reductions | 50,032 | |
| Expense reductions | (1,924) | 48,108 |
| Net investment income (loss) | 57,607 | |
| Realized and Unrealized Gain (Loss) | ||
| Net realized gain (loss) on: | ||
| Investment securities: | ||
| Unaffiliated issuers | 353,971 | |
| Fidelity Central Funds | 10 | |
| Other affiliated issuers | (13) | |
| Foreign currency transactions | (761) | |
| Futures contracts | 12,352 | |
| Total net realized gain (loss) | 365,559 | |
| Change in net unrealized appreciation (depreciation) on: | ||
| Investment securities: | ||
| Unaffiliated issuers | (245,049) | |
| Fidelity Central Funds | 8 | |
| Other affiliated issuers | 14 | |
| Assets and liabilities in foreign currencies | 98 | |
| Futures contracts | (8,214) | |
| Total change in net unrealized appreciation (depreciation) | (253,143) | |
| Net gain (loss) | 112,416 | |
| Net increase (decrease) in net assets resulting from operations | $170,023 |
See accompanying notes which are an integral part of the financial statements.
Statement of Changes in Net Assets
| Amounts in thousands | Six months ended April 30, 2018 (Unaudited) | Year ended October 31, 2017 |
| Increase (Decrease) in Net Assets | ||
| Operations | ||
| Net investment income (loss) | $57,607 | $118,923 |
| Net realized gain (loss) | 365,559 | 1,030,476 |
| Change in net unrealized appreciation (depreciation) | (253,143) | 1,102,421 |
| Net increase (decrease) in net assets resulting from operations | 170,023 | 2,251,820 |
| Distributions to shareholders from net investment income | (116,164) | (150,174) |
| Distributions to shareholders from net realized gain | (419,777) | (11,939) |
| Total distributions | (535,941) | (162,113) |
| Share transactions - net increase (decrease) | 622,111 | (822,002) |
| Redemption fees | – | 9 |
| Total increase (decrease) in net assets | 256,193 | 1,267,714 |
| Net Assets | ||
| Beginning of period | 10,649,262 | 9,381,548 |
| End of period | $10,905,455 | $10,649,262 |
| Other Information | ||
| Undistributed net investment income end of period | $49,889 | $108,446 |
See accompanying notes which are an integral part of the financial statements.
Financial Highlights
Fidelity International Discovery Fund Class A
| Six months ended (Unaudited) April 30, | Years endedOctober 31, | |||||
| 2018 | 2017 | 2016 | 2015 | 2014 | 2013 | |
| Selected Per–Share Data | ||||||
| Net asset value, beginning of period | $46.66 | $37.60 | $39.78 | $38.70 | $39.49 | $31.66 |
| Income from Investment Operations | ||||||
| Net investment income (loss)A | .16 | .36 | .47B | .40C | .53D | .34 |
| Net realized and unrealized gain (loss) | .46 | 9.22 | (2.38) | .79 | (.67) | 7.97 |
| Total from investment operations | .62 | 9.58 | (1.91) | 1.19 | (.14) | 8.31 |
| Distributions from net investment income | (.34) | (.47) | (.27) | (.11) | (.33) | (.45) |
| Distributions from net realized gain | (1.83) | (.05) | (.01) | – | (.31) | (.03) |
| Total distributions | (2.17) | (.52) | (.27)E | (.11) | (.65)F | (.48) |
| Redemption fees added to paid in capitalA | – | –G | –G | –G | –G | –G |
| Net asset value, end of period | $45.11 | $46.66 | $37.60 | $39.78 | $38.70 | $39.49 |
| Total ReturnH,I,J | 1.40% | 25.87% | (4.83)% | 3.09% | (.36)% | 26.59% |
| Ratios to Average Net AssetsK,L | ||||||
| Expenses before reductions | 1.26%M | 1.29% | 1.35% | 1.33% | 1.28% | 1.35% |
| Expenses net of fee waivers, if any | 1.26%M | 1.29% | 1.35% | 1.33% | 1.28% | 1.35% |
| Expenses net of all reductions | 1.23%M | 1.27% | 1.34% | 1.32% | 1.28% | 1.33% |
| Net investment income (loss) | .70%M | .88% | 1.26%B | 1.00%C | 1.35%D | .97% |
| Supplemental Data | ||||||
| Net assets, end of period (in millions) | $234 | $248 | $236 | $283 | $297 | $347 |
| Portfolio turnover rateN | 49%M,O | 42% | 50%O | 60%O | 57% | 65% |
A Calculated based on average shares outstanding during the period.
B Net Investment income per share reflects a large, non-recurring dividend which amounted to $.14 per share. Excluding this non-recurring dividend, the ratio of net investment income (loss) to average net assets would have been .88%.
C Net Investment income per share reflects a large, non-recurring dividend which amounted to $.12 per share. Excluding this non-recurring dividend, the ratio of net investment income (loss) to average net assets would have been .69%.
D Net Investment income per share reflects a large, non-recurring dividend which amounted to $.22 per share. Excluding this non-recurring dividend, the ratio of net investment income (loss) to average net assets would have been .80%.
E Total distributions of $.27 per share is comprised of distributions from net investment income of $.269 and distributions from net realized gain of $.005 per share.
F Total distributions of $.65 per share is comprised of distributions from net investment income of $.334 and distributions from net realized gain of $.311 per share.
G Amount represents less than $.005 per share.
H Total returns for periods of less than one year are not annualized.
I Total returns would have been lower if certain expenses had not been reduced during the applicable periods shown.
J Total returns do not include the effect of the sales charges.
K Fees and expenses of any underlying Fidelity Central Funds are not included in the Fund's expense ratio. The Fund indirectly bears its proportionate share of the expenses of any underlying Fidelity Central Funds.
L Expense ratios reflect operating expenses of the class. Expenses before reductions do not reflect amounts reimbursed by the investment adviser or reductions from brokerage service arrangements or reductions from other expense offset arrangements and do not represent the amount paid by the class during periods when reimbursements or reductions occur. Expenses net of fee waivers reflect expenses after reimbursement by the investment adviser but prior to reductions from brokerage service arrangements or other expense offset arrangements. Expenses net of all reductions represent the net expenses paid by the class.
M Annualized
N Amount does not include the portfolio activity of any underlying Fidelity Central Funds.
O Portfolio turnover rate excludes securities received or delivered in-kind.
See accompanying notes which are an integral part of the financial statements.
Fidelity International Discovery Fund Class M
| Six months ended (Unaudited) April 30, | Years endedOctober 31, | |||||
| 2018 | 2017 | 2016 | 2015 | 2014 | 2013 | |
| Selected Per–Share Data | ||||||
| Net asset value, beginning of period | $46.35 | $37.34 | $39.51 | $38.43 | $39.23 | $31.42 |
| Income from Investment Operations | ||||||
| Net investment income (loss)A | .11 | .26 | .38B | .30C | .44D | .26 |
| Net realized and unrealized gain (loss) | .46 | 9.17 | (2.37) | .80 | (.68) | 7.92 |
| Total from investment operations | .57 | 9.43 | (1.99) | 1.10 | (.24) | 8.18 |
| Distributions from net investment income | (.24) | (.37) | (.17) | (.02) | (.25) | (.34) |
| Distributions from net realized gain | (1.83) | (.05) | (.01) | – | (.31) | (.03) |
| Total distributions | (2.07) | (.42) | (.18) | (.02) | (.56) | (.37) |
| Redemption fees added to paid in capitalA | – | –E | –E | –E | –E | –E |
| Net asset value, end of period | $44.85 | $46.35 | $37.34 | $39.51 | $38.43 | $39.23 |
| Total ReturnF,G,H | 1.30% | 25.57% | (5.07)% | 2.86% | (.60)% | 26.31% |
| Ratios to Average Net AssetsI,J | ||||||
| Expenses before reductions | 1.50%K | 1.53% | 1.58% | 1.57% | 1.51% | 1.59% |
| Expenses net of fee waivers, if any | 1.50%K | 1.52% | 1.58% | 1.57% | 1.51% | 1.59% |
| Expenses net of all reductions | 1.47%K | 1.51% | 1.57% | 1.56% | 1.51% | 1.57% |
| Net investment income (loss) | .46%K | .64% | 1.02%B | .76%C | 1.11%D | .73% |
| Supplemental Data | ||||||
| Net assets, end of period (in millions) | $34 | $35 | $35 | $43 | $49 | $53 |
| Portfolio turnover rateL | 49%K,M | 42% | 50%M | 60%M | 57% | 65% |
A Calculated based on average shares outstanding during the period.
B Net Investment income per share reflects a large, non-recurring dividend which amounted to $.14 per share. Excluding this non-recurring dividend, the ratio of net investment income (loss) to average net assets would have been .64%.
C Net Investment income per share reflects a large, non-recurring dividend which amounted to $.12 per share. Excluding this non-recurring dividend, the ratio of net investment income (loss) to average net assets would have been .45%.
D Net Investment income per share reflects a large, non-recurring dividend which amounted to $.21 per share. Excluding this non-recurring dividend, the ratio of net investment income (loss) to average net assets would have been .56%.
E Amount represents less than $.005 per share.
F Total returns for periods of less than one year are not annualized.
G Total returns would have been lower if certain expenses had not been reduced during the applicable periods shown.
H Total returns do not include the effect of the sales charges.
I Fees and expenses of any underlying Fidelity Central Funds are not included in the Fund's expense ratio. The Fund indirectly bears its proportionate share of the expenses of any underlying Fidelity Central Funds.
J Expense ratios reflect operating expenses of the class. Expenses before reductions do not reflect amounts reimbursed by the investment adviser or reductions from brokerage service arrangements or reductions from other expense offset arrangements and do not represent the amount paid by the class during periods when reimbursements or reductions occur. Expenses net of fee waivers reflect expenses after reimbursement by the investment adviser but prior to reductions from brokerage service arrangements or other expense offset arrangements. Expenses net of all reductions represent the net expenses paid by the class.
K Annualized
L Amount does not include the portfolio activity of any underlying Fidelity Central Funds.
M Portfolio turnover rate excludes securities received or delivered in-kind.
See accompanying notes which are an integral part of the financial statements.
Fidelity International Discovery Fund Class C
| Six months ended (Unaudited) April 30, | Years endedOctober 31, | |||||
| 2018 | 2017 | 2016 | 2015 | 2014 | 2013 | |
| Selected Per–Share Data | ||||||
| Net asset value, beginning of period | $45.94 | $36.96 | $39.14 | $38.25 | $39.07 | $31.32 |
| Income from Investment Operations | ||||||
| Net investment income (loss)A | (.02) | .04 | .19B | .10C | .23D | .08 |
| Net realized and unrealized gain (loss) | .45 | 9.12 | (2.37) | .79 | (.66) | 7.90 |
| Total from investment operations | .43 | 9.16 | (2.18) | .89 | (.43) | 7.98 |
| Distributions from net investment income | (.02) | (.13) | – | – | (.08) | (.20) |
| Distributions from net realized gain | (1.83) | (.05) | – | – | (.31) | (.03) |
| Total distributions | (1.85) | (.18) | – | – | (.39) | (.23) |
| Redemption fees added to paid in capitalA | – | –E | –E | –E | –E | –E |
| Net asset value, end of period | $44.52 | $45.94 | $36.96 | $39.14 | $38.25 | $39.07 |
| Total ReturnF,G,H | .99% | 24.93% | (5.57)% | 2.33% | (1.10)% | 25.65% |
| Ratios to Average Net AssetsI,J | ||||||
| Expenses before reductions | 2.04%K | 2.05% | 2.10% | 2.09% | 2.03% | 2.10% |
| Expenses net of fee waivers, if any | 2.04%K | 2.05% | 2.10% | 2.09% | 2.03% | 2.09% |
| Expenses net of all reductions | 2.01%K | 2.04% | 2.09% | 2.08% | 2.02% | 2.07% |
| Net investment income (loss) | (.08)%K | .11% | .50%B | .24%C | .60%D | .23% |
| Supplemental Data | ||||||
| Net assets, end of period (in millions) | $26 | $28 | $26 | $32 | $35 | $36 |
| Portfolio turnover rateL | 49%K,M | 42% | 50%M | 60%M | 57% | 65% |
A Calculated based on average shares outstanding during the period.
B Net Investment income per share reflects a large, non-recurring dividend which amounted to $.14 per share. Excluding this non-recurring dividend, the ratio of net investment income (loss) to average net assets would have been .13%.
C Net Investment income per share reflects a large, non-recurring dividend which amounted to $.12 per share. Excluding this non-recurring dividend, the ratio of net investment income (loss) to average net assets would have been (.06)%.
D Net Investment income per share reflects a large, non-recurring dividend which amounted to $.21 per share. Excluding this non-recurring dividend, the ratio of net investment income (loss) to average net assets would have been .05%.
E Amount represents less than $.005 per share.
F Total returns for periods of less than one year are not annualized.
G Total returns would have been lower if certain expenses had not been reduced during the applicable periods shown.
H Total returns do not include the effect of the contingent deferred sales charge.
I Fees and expenses of any underlying Fidelity Central Funds are not included in the Fund's expense ratio. The Fund indirectly bears its proportionate share of the expenses of any underlying Fidelity Central Funds.
J Expense ratios reflect operating expenses of the class. Expenses before reductions do not reflect amounts reimbursed by the investment adviser or reductions from brokerage service arrangements or reductions from other expense offset arrangements and do not represent the amount paid by the class during periods when reimbursements or reductions occur. Expenses net of fee waivers reflect expenses after reimbursement by the investment adviser but prior to reductions from brokerage service arrangements or other expense offset arrangements. Expenses net of all reductions represent the net expenses paid by the class.
K Annualized
L Amount does not include the portfolio activity of any underlying Fidelity Central Funds.
M Portfolio turnover rate excludes securities received or delivered in-kind.
See accompanying notes which are an integral part of the financial statements.
Fidelity International Discovery Fund
| Six months ended (Unaudited) April 30, | Years endedOctober 31, | |||||
| 2018 | 2017 | 2016 | 2015 | 2014 | 2013 | |
| Selected Per–Share Data | ||||||
| Net asset value, beginning of period | $47.04 | $37.91 | $40.12 | $39.03 | $39.82 | $31.91 |
| Income from Investment Operations | ||||||
| Net investment income (loss)A | .24 | .50 | .61B | .54C | .67D | .47 |
| Net realized and unrealized gain (loss) | .45 | 9.29 | (2.41) | .81 | (.68) | 8.02 |
| Total from investment operations | .69 | 9.79 | (1.80) | 1.35 | (.01) | 8.49 |
| Distributions from net investment income | (.50) | (.61) | (.41) | (.26) | (.47) | (.55) |
| Distributions from net realized gain | (1.83) | (.05) | (.01) | – | (.31) | (.03) |
| Total distributions | (2.33) | (.66) | (.41)E | (.26) | (.78) | (.58) |
| Redemption fees added to paid in capitalA | – | –F | –F | –F | –F | –F |
| Net asset value, end of period | $45.40 | $47.04 | $37.91 | $40.12 | $39.03 | $39.82 |
| Total ReturnG,H | 1.56% | 26.33% | (4.53)% | 3.47% | (.01)% | 27.03% |
| Ratios to Average Net AssetsI,J | ||||||
| Expenses before reductions | .93%K | .94% | 1.00% | .99% | .93% | 1.00% |
| Expenses net of fee waivers, if any | .93%K | .94% | 1.00% | .99% | .93% | 1.00% |
| Expenses net of all reductions | .89%K | .92% | .99% | .98% | .93% | .98% |
| Net investment income (loss) | 1.04%K | 1.22% | 1.61%B | 1.34%C | 1.69%D | 1.32% |
| Supplemental Data | ||||||
| Net assets, end of period (in millions) | $7,418 | $7,351 | $6,421 | $7,209 | $7,464 | $7,800 |
| Portfolio turnover rateL | 49%K,M | 42% | 50%M | 60%M | 57% | 65% |
A Calculated based on average shares outstanding during the period.
B Net Investment Investment income per share reflects a large, non-recurring dividend which amounted to $.14 per share. Excluding this non-recurring dividend, the ratio of net investment income (loss) to average net assets would have been 1.23%.
C Net Investment income per share reflects a large, non-recurring dividend which amounted to $.12 per share. Excluding this non-recurring dividend, the ratio of net investment income (loss) to average net assets would have been 1.03%.
D Net Investment income per share reflects a large, non-recurring dividend which amounted to $.22 per share. Excluding this non-recurring dividend, the ratio of net investment income (loss) to average net assets would have been 1.15%.
E Total distributions of $.41 per share is comprised of distributions from net investment income of $.409 and distributions from net realized gain of $.005 per share.
F Amount represents less than $.005 per share.
G Total returns for periods of less than one year are not annualized.
H Total returns would have been lower if certain expenses had not been reduced during the applicable periods shown.
I Fees and expenses of any underlying Fidelity Central Funds are not included in the Fund's expense ratio. The Fund indirectly bears its proportionate share of the expenses of any underlying Fidelity Central Funds.
J Expense ratios reflect operating expenses of the class. Expenses before reductions do not reflect amounts reimbursed by the investment adviser or reductions from brokerage service arrangements or reductions from other expense offset arrangements and do not represent the amount paid by the class during periods when reimbursements or reductions occur. Expenses net of fee waivers reflect expenses after reimbursement by the investment adviser but prior to reductions from brokerage service arrangements or other expense offset arrangements. Expenses net of all reductions represent the net expenses paid by the class.
K Annualized
L Amount does not include the portfolio activity of any underlying Fidelity Central Funds.
M Portfolio turnover rate excludes securities received or delivered in-kind.
See accompanying notes which are an integral part of the financial statements.
Fidelity International Discovery Fund Class K
| Six months ended (Unaudited) April 30, | Years endedOctober 31, | |||||
| 2018 | 2017 | 2016 | 2015 | 2014 | 2013 | |
| Selected Per–Share Data | ||||||
| Net asset value, beginning of period | $46.96 | $37.86 | $40.06 | $38.97 | $39.76 | $31.87 |
| Income from Investment Operations | ||||||
| Net investment income (loss)A | .27 | .55 | .66B | .59C | .72D | .52 |
| Net realized and unrealized gain (loss) | .45 | 9.26 | (2.39) | .81 | (.67) | 8.01 |
| Total from investment operations | .72 | 9.81 | (1.73) | 1.40 | .05 | 8.53 |
| Distributions from net investment income | (.55) | (.66) | (.46) | (.31) | (.53) | (.61) |
| Distributions from net realized gain | (1.83) | (.05) | (.01) | – | (.31) | (.03) |
| Total distributions | (2.39)E | (.71) | (.47) | (.31) | (.84) | (.64) |
| Redemption fees added to paid in capitalA | – | –F | –F | –F | –F | –F |
| Net asset value, end of period | $45.29 | $46.96 | $37.86 | $40.06 | $38.97 | $39.76 |
| Total ReturnG,H | 1.61% | 26.47% | (4.38)% | 3.61% | .13% | 27.23% |
| Ratios to Average Net AssetsI,J | ||||||
| Expenses before reductions | .82%K | .82% | .86% | .86% | .80% | .85% |
| Expenses net of fee waivers, if any | .82%K | .82% | .86% | .86% | .80% | .85% |
| Expenses net of all reductions | .78%K | .80% | .85% | .85% | .79% | .83% |
| Net investment income (loss) | 1.15%K | 1.35% | 1.74%B | 1.47%C | 1.83%D | 1.47% |
| Supplemental Data | ||||||
| Net assets, end of period (in millions) | $2,423 | $2,228 | $1,880 | $2,308 | $2,464 | $2,576 |
| Portfolio turnover rateL | 49%K,M | 42% | 50%M | 60%M | 57% | 65% |
A Calculated based on average shares outstanding during the period.
B Net Investment income per share reflects a large, non-recurring dividend which amounted to $.14 per share. Excluding this non-recurring dividend, the ratio of net investment income (loss) to average net assets would have been 1.36%.
C Net Investment income per share reflects a large, non-recurring dividend which amounted to $.12 per share. Excluding this non-recurring dividend, the ratio of net investment income (loss) to average net assets would have been 1.16%.
D Net Investment income per share reflects a large, non-recurring dividend which amounted to $.22 per share. Excluding this non-recurring dividend, the ratio of net investment income (loss) to average net assets would have been 1.28%.
E Total distributions of $2.39 per share is comprised of distributions from net investment income of $.554 and distributions from net realized gain of $1.832 per share.
F Amount represents less than $.005 per share.
G Total returns for periods of less than one year are not annualized.
H Total returns would have been lower if certain expenses had not been reduced during the applicable periods shown.
I Fees and expenses of any underlying Fidelity Central Funds are not included in the Fund's expense ratio. The Fund indirectly bears its proportionate share of the expenses of any underlying Fidelity Central Funds.
J Expense ratios reflect operating expenses of the class. Expenses before reductions do not reflect amounts reimbursed by the investment adviser or reductions from brokerage service arrangements or reductions from other expense offset arrangements and do not represent the amount paid by the class during periods when reimbursements or reductions occur. Expenses net of fee waivers reflect expenses after reimbursement by the investment adviser but prior to reductions from brokerage service arrangements or other expense offset arrangements. Expenses net of all reductions represent the net expenses paid by the class.
K Annualized
L Amount does not include the portfolio activity of any underlying Fidelity Central Funds.
M Portfolio turnover rate excludes securities received or delivered in-kind.
See accompanying notes which are an integral part of the financial statements.
Fidelity International Discovery Fund Class I
| Six months ended (Unaudited) April 30, | Years endedOctober 31, | |||||
| 2018 | 2017 | 2016 | 2015 | 2014 | 2013 | |
| Selected Per–Share Data | ||||||
| Net asset value, beginning of period | $46.92 | $37.82 | $40.03 | $38.96 | $39.76 | $31.87 |
| Income from Investment Operations | ||||||
| Net investment income (loss)A | .23 | .49 | .61B | .53C | .67D | .47 |
| Net realized and unrealized gain (loss) | .46 | 9.27 | (2.40) | .80 | (.68) | 8.01 |
| Total from investment operations | .69 | 9.76 | (1.79) | 1.33 | (.01) | 8.48 |
| Distributions from net investment income | (.49) | (.61) | (.42) | (.26) | (.48) | (.56) |
| Distributions from net realized gain | (1.83) | (.05) | (.01) | – | (.31) | (.03) |
| Total distributions | (2.32) | (.66) | (.42)E | (.26) | (.79) | (.59) |
| Redemption fees added to paid in capitalA | – | –F | –F | –F | –F | –F |
| Net asset value, end of period | $45.29 | $46.92 | $37.82 | $40.03 | $38.96 | $39.76 |
| Total ReturnG,H | 1.56% | 26.29% | (4.52)% | 3.44% | (.01)% | 27.03% |
| Ratios to Average Net AssetsI,J | ||||||
| Expenses before reductions | .95%K | .96% | 1.00% | 1.00% | .93% | 1.00% |
| Expenses net of fee waivers, if any | .95%K | .96% | 1.00% | .99% | .93% | 1.00% |
| Expenses net of all reductions | .92%K | .94% | .99% | .98% | .93% | .97% |
| Net investment income (loss) | 1.01%K | 1.21% | 1.60%B | 1.33%C | 1.69%D | 1.33% |
| Supplemental Data | ||||||
| Net assets, end of period (in millions) | $645 | $658 | $745 | $1,061 | $650 | $476 |
| Portfolio turnover rateL | 49%K,M | 42% | 50%M | 60%M | 57% | 65% |
A Calculated based on average shares outstanding during the period.
B Net Investment income per share reflects a large, non-recurring dividend which amounted to $.14 per share. Excluding this non-recurring dividend, the ratio of net investment income (loss) to average net assets would have been 1.22%.
C Net Investment income per share reflects a large, non-recurring dividend which amounted to $.12 per share. Excluding this non-recurring dividend, the ratio of net investment income (loss) to average net assets would have been 1.03%.
D Net Investment income per share reflects a large, non-recurring dividend which amounted to $.22 per share. Excluding this non-recurring dividend, the ratio of net investment income (loss) to average net assets would have been 1.14%.
E Total distributions of $.42 per share is comprised of distributions from net investment income of $.418 and distributions from net realized gain of $.005 per share.
F Amount represents less than $.005 per share.
G Total returns for periods of less than one year are not annualized.
H Total returns would have been lower if certain expenses had not been reduced during the applicable periods shown.
I Fees and expenses of any underlying Fidelity Central Funds are not included in the Fund's expense ratio. The Fund indirectly bears its proportionate share of the expenses of any underlying Fidelity Central Funds.
J Expense ratios reflect operating expenses of the class. Expenses before reductions do not reflect amounts reimbursed by the investment adviser or reductions from brokerage service arrangements or reductions from other expense offset arrangements and do not represent the amount paid by the class during periods when reimbursements or reductions occur. Expenses net of fee waivers reflect expenses after reimbursement by the investment adviser but prior to reductions from brokerage service arrangements or other expense offset arrangements. Expenses net of all reductions represent the net expenses paid by the class.
K Annualized
L Amount does not include the portfolio activity of any underlying Fidelity Central Funds.
M Portfolio turnover rate excludes securities received or delivered in-kind.
See accompanying notes which are an integral part of the financial statements.
Fidelity International Discovery Fund Class Z
| Six months ended (Unaudited) April 30, | Years endedOctober 31, | |||||
| 2018 | 2017 | 2016 | 2015 | 2014 | 2013 A | |
| Selected Per–Share Data | ||||||
| Net asset value, beginning of period | $46.92 | $37.84 | $40.03 | $38.96 | $39.77 | $37.22 |
| Income from Investment Operations | ||||||
| Net investment income (loss)B | .26 | .56 | .66C | .59D | .72E | .07 |
| Net realized and unrealized gain (loss) | .47 | 9.24 | (2.38) | .80 | (.68) | 2.48 |
| Total from investment operations | .73 | 9.80 | (1.72) | 1.39 | .04 | 2.55 |
| Distributions from net investment income | (.56) | (.67) | (.46) | (.32) | (.54) | – |
| Distributions from net realized gain | (1.83) | (.05) | (.01) | – | (.31) | – |
| Total distributions | (2.39) | (.72) | (.47) | (.32) | (.85) | – |
| Redemption fees added to paid in capitalB | – | –F | –F | –F | –F | –F |
| Net asset value, end of period | $45.26 | $46.92 | $37.84 | $40.03 | $38.96 | $39.77 |
| Total ReturnG,H | 1.64% | 26.44% | (4.36)% | 3.58% | .12% | 6.85% |
| Ratios to Average Net AssetsI,J | ||||||
| Expenses before reductions | .82%K | .82% | .86% | .86% | .80% | .85%K |
| Expenses net of fee waivers, if any | .82%K | .82% | .86% | .86% | .80% | .85%K |
| Expenses net of all reductions | .78%K | .80% | .85% | .85% | .79% | .83%K |
| Net investment income (loss) | 1.15%K | 1.35% | 1.74%C | 1.47%D | 1.83%E | .76%K |
| Supplemental Data | ||||||
| Net assets, end of period (in millions) | $125 | $101 | $38 | $30 | $35 | $– |
| Portfolio turnover rateL | 49%K,M | 42% | 50%M | 60%M | 57% | 65% |
A For the period August 13, 2013 (commencement of sale of shares) to October 31, 2013.
B Calculated based on average shares outstanding during the period.
C Net Investment income per share reflects a large, non-recurring dividend which amounted to $.14 per share. Excluding this non-recurring dividend, the ratio of net investment income (loss) to average net assets would have been 1.36%.
D Net Investment income per share reflects a large, non-recurring dividend which amounted to $.12 per share. Excluding this non-recurring dividend, the ratio of net investment income (loss) to average net assets would have been 1.16%.
E Net Investment income per share reflects a large, non-recurring dividend which amounted to $.21 per share. Excluding this non-recurring dividend, the ratio of net investment income (loss) to average net assets would have been 1.28%.
F Amount represents less than $.005 per share.
G Total returns for periods of less than one year are not annualized.
H Total returns would have been lower if certain expenses had not been reduced during the applicable periods shown.
I Fees and expenses of any underlying Fidelity Central Funds are not included in the Fund's expense ratio. The Fund indirectly bears its proportionate share of the expenses of any underlying Fidelity Central Funds.
J Expense ratios reflect operating expenses of the class. Expenses before reductions do not reflect amounts reimbursed by the investment adviser or reductions from brokerage service arrangements or reductions from other expense offset arrangements and do not represent the amount paid by the class during periods when reimbursements or reductions occur. Expense ratios before reductions for start-up periods may not be representative of longer-term operating periods. Expenses net of fee waivers reflect expenses after reimbursement by the investment adviser but prior to reductions from brokerage service arrangements or other expense offset arrangements. Expenses net of all reductions represent the net expenses paid by the class.
K Annualized
L Amount does not include the portfolio activity of any underlying Fidelity Central Funds.
M Portfolio turnover rate excludes securities received or delivered in-kind.
See accompanying notes which are an integral part of the financial statements.
Notes to Financial Statements (Unaudited)
For the period ended April 30, 2018
(Amounts in thousands except percentages)
1. Organization.
Fidelity International Discovery Fund (the Fund) is a fund of Fidelity Investment Trust (the Trust) and is authorized to issue an unlimited number of shares. The Trust is registered under the Investment Company Act of 1940, as amended (the 1940 Act), as an open-end management investment company organized as a Massachusetts business trust. The Fund offers Class A, Class M, Class C, International Discovery, Class K, Class I and Class Z shares, each of which has equal rights as to assets and voting privileges. Each class has exclusive voting rights with respect to matters that affect that class.
2. Investments in Fidelity Central Funds.
The Fund invests in Fidelity Central Funds, which are open-end investment companies generally available only to other investment companies and accounts managed by the investment adviser and its affiliates. The Fund's Schedule of Investments lists each of the Fidelity Central Funds held as of period end, if any, as an investment of the Fund, but does not include the underlying holdings of each Fidelity Central Fund. As an Investing Fund, the Fund indirectly bears its proportionate share of the expenses of the underlying Fidelity Central Funds.
The Money Market Central Funds seek preservation of capital and current income and are managed by Fidelity Investments Money Management, Inc. (FIMM), an affiliate of the investment adviser. Annualized expenses of the Money Market Central Funds as of their most recent shareholder report date are less than .005%.
A complete unaudited list of holdings for each Fidelity Central Fund is available upon request or at the Securities and Exchange Commission (the SEC) website at www.sec.gov. In addition, the financial statements of the Fidelity Central Funds are available on the SEC website or upon request.
3. Significant Accounting Policies.
The Fund is an investment company and applies the accounting and reporting guidance of the Financial Accounting Standards Board (FASB) Accounting Standards Codification Topic 946 Financial Services – Investments Companies. The financial statements have been prepared in conformity with accounting principles generally accepted in the United States of America (GAAP), which require management to make certain estimates and assumptions at the date of the financial statements. Actual results could differ from those estimates. Subsequent events, if any, through the date that the financial statements were issued have been evaluated in the preparation of the financial statements. The following summarizes the significant accounting policies of the Fund:
Investment Valuation. Investments are valued as of 4:00 p.m. Eastern time on the last calendar day of the period. The Board of Trustees (the Board) has delegated the day to day responsibility for the valuation of the Fund's investments to the Fair Value Committee (the Committee) established by the Fund's investment adviser. In accordance with valuation policies and procedures approved by the Board, the Fund attempts to obtain prices from one or more third party pricing vendors or brokers to value its investments. When current market prices, quotations or currency exchange rates are not readily available or reliable, investments will be fair valued in good faith by the Committee, in accordance with procedures adopted by the Board. Factors used in determining fair value vary by investment type and may include market or investment specific events, changes in interest rates and credit quality. The frequency with which these procedures are used cannot be predicted and they may be utilized to a significant extent. The Committee oversees the Fund's valuation policies and procedures and reports to the Board on the Committee's activities and fair value determinations. The Board monitors the appropriateness of the procedures used in valuing the Fund's investments and ratifies the fair value determinations of the Committee.
The Fund categorizes the inputs to valuation techniques used to value its investments into a disclosure hierarchy consisting of three levels as shown below:
- Level 1 – quoted prices in active markets for identical investments
- Level 2 – other significant observable inputs (including quoted prices for similar investments, interest rates, prepayment speeds, etc.)
- Level 3 – unobservable inputs (including the Fund's own assumptions based on the best information available)
Valuation techniques used to value the Fund's investments by major category are as follows:
Equity securities, including restricted securities, for which market quotations are readily available, are valued at the last reported sale price or official closing price as reported by a third party pricing vendor on the primary market or exchange on which they are traded and are categorized as Level 1 in the hierarchy. In the event there were no sales during the day or closing prices are not available, securities are valued at the last quoted bid price or may be valued using the last available price and are generally categorized as Level 2 in the hierarchy. For foreign equity securities, when market or security specific events arise, comparisons to the valuation of American Depositary Receipts (ADRs), futures contracts, Exchange-Traded Funds (ETFs) and certain indexes as well as quoted prices for similar securities may be used and would be categorized as Level 2 in the hierarchy. Utilizing these techniques may result in transfers between Level 1 and Level 2. For equity securities, including restricted securities, where observable inputs are limited, assumptions about market activity and risk are used and these securities may be categorized as Level 3 in the hierarchy.
Debt securities, including restricted securities, are valued based on evaluated prices received from third party pricing vendors or from brokers who make markets in such securities. U.S. government and government agency obligations are valued by pricing vendors who utilize matrix pricing which considers yield or price of bonds of comparable quality, coupon, maturity and type or by broker-supplied prices. When independent prices are unavailable or unreliable, debt securities may be valued utilizing pricing methodologies which consider similar factors that would be used by third party pricing vendors. Debt securities are generally categorized as Level 2 in the hierarchy but may be Level 3 depending on the circumstances.
Futures contracts are valued at the settlement price established each day by the board of trade or exchange on which they are traded and are categorized as Level 1 in the hierarchy. Investments in open-end mutual funds, including the Fidelity Central Funds, are valued at their closing net asset value (NAV) each business day and are categorized as Level 1 in the hierarchy.
Changes in valuation techniques may result in transfers in or out of an assigned level within the disclosure hierarchy. The aggregate value of investments by input level as of April 30, 2018, including information on transfers between Levels 1 and 2, is included at the end of the Fund's Schedule of Investments.
Foreign Currency. The Fund may use foreign currency contracts to facilitate transactions in foreign-denominated securities. Gains and losses from these transactions may arise from changes in the value of the foreign currency or if the counterparties do not perform under the contracts' terms.
Foreign-denominated assets, including investment securities, and liabilities are translated into U.S. dollars at the exchange rates at period end. Purchases and sales of investment securities, income and dividends received and expenses denominated in foreign currencies are translated into U.S. dollars at the exchange rate in effect on the transaction date.
The effects of exchange rate fluctuations on investments are included with the net realized and unrealized gain (loss) on investment securities. Other foreign currency transactions resulting in realized and unrealized gain (loss) are disclosed separately.
Investment Transactions and Income. For financial reporting purposes, the Fund's investment holdings and NAV include trades executed through the end of the last business day of the period. The NAV per share for processing shareholder transactions is calculated as of the close of business of the New York Stock Exchange (NYSE), normally 4:00 p.m. Eastern time and includes trades executed through the end of the prior business day. Gains and losses on securities sold are determined on the basis of identified cost and includes proceeds received from litigation. Dividend income is recorded on the ex-dividend date, except for certain dividends from foreign securities where the ex-dividend date may have passed, which are recorded as soon as the Fund is informed of the ex-dividend date. Non-cash dividends included in dividend income, if any, are recorded at the fair market value of the securities received. Income and capital gain distributions from Fidelity Central Funds, if any, are recorded on the ex-dividend date. Certain distributions received by the Fund represent a return of capital or capital gain. The Fund determines the components of these distributions subsequent to the ex-dividend date, based upon receipt of tax filings or other correspondence relating to the underlying investment. These distributions are recorded as a reduction of cost of investments and/or as a realized gain. Interest income is accrued as earned and includes coupon interest and amortization of premium and accretion of discount on debt securities as applicable. Investment income is recorded net of foreign taxes withheld where recovery of such taxes is uncertain.
Class Allocations and Expenses. Investment income, realized and unrealized capital gains and losses, common expenses of the Fund, and certain fund-level expense reductions, if any, are allocated daily on a pro-rata basis to each class based on the relative net assets of each class to the total net assets of the Fund. Each class differs with respect to transfer agent and distribution and service plan fees incurred. Certain expense reductions may also differ by class. For the reporting period, the allocated portion of income and expenses to each class as a percent of its average net assets may vary due to the timing of recording these transactions in relation to fluctuating net assets of the classes. Expenses directly attributable to a fund are charged to that fund. Expenses attributable to more than one fund are allocated among the respective funds on the basis of relative net assets or other appropriate methods. Expense estimates are accrued in the period to which they relate and adjustments are made when actual amounts are known.
Deferred Trustee Compensation. Under a Deferred Compensation Plan (the Plan), certain independent Trustees have elected to defer receipt of a portion of their annual compensation. Deferred amounts are invested in a cross-section of Fidelity funds, are marked-to-market and remain in the Fund until distributed in accordance with the Plan. The investment of deferred amounts and the offsetting payable to the Trustees are included in the accompanying Statement of Assets and Liabilities.
Income Tax Information and Distributions to Shareholders. Each year, the Fund intends to qualify as a regulated investment company under Subchapter M of the Internal Revenue Code, including distributing substantially all of its taxable income and realized gains. As a result, no provision for U.S. Federal income taxes is required. The Fund files a U.S. federal tax return, in addition to state and local tax returns as required. The Fund's federal income tax returns are subject to examination by the Internal Revenue Service (IRS) for a period of three fiscal years after they are filed. State and local tax returns may be subject to examination for an additional fiscal year depending on the jurisdiction. Foreign taxes are provided for based on the Fund's understanding of the tax rules and rates that exist in the foreign markets in which it invests.
Distributions are declared and recorded on the ex-dividend date. Income and capital gain distributions are declared separately for each class. Income and capital gain distributions are determined in accordance with income tax regulations, which may differ from GAAP.
Capital accounts within the financial statements are adjusted for permanent book-tax differences. These adjustments have no impact on net assets or the results of operations. Capital accounts are not adjusted for temporary book-tax differences which will reverse in a subsequent period.
Book-tax differences are primarily due to foreign currency transactions, passive foreign investment companies (PFIC), market discount, deferred trustees compensation and losses deferred due to wash sales.
As of period end, the cost and unrealized appreciation (depreciation) in securities, and derivatives if applicable, for federal income tax purposes were as follows:
| Gross unrealized appreciation | $2,282,333 |
| Gross unrealized depreciation | (277,823) |
| Net unrealized appreciation (depreciation) | $2,004,510 |
| Tax cost | $8,987,882 |
Restricted Securities. The Fund may invest in securities that are subject to legal or contractual restrictions on resale. These securities generally may be resold in transactions exempt from registration or to the public if the securities are registered. Disposal of these securities may involve time-consuming negotiations and expense, and prompt sale at an acceptable price may be difficult. Information regarding restricted securities is included at the end of the Fund's Schedule of Investments.
4. Derivative Instruments.
Risk Exposures and the Use of Derivative Instruments. The Fund's investment objective allows the Fund to enter into various types of derivative contracts, including futures contracts. Derivatives are investments whose value is primarily derived from underlying assets, indices or reference rates and may be transacted on an exchange or over-the-counter (OTC). Derivatives may involve a future commitment to buy or sell a specified asset based on specified terms, to exchange future cash flows at periodic intervals based on a notional principal amount, or for one party to make one or more payments upon the occurrence of specified events in exchange for periodic payments from the other party.
The Fund used derivatives to increase returns and to manage exposure to certain risks as defined below. The success of any strategy involving derivatives depends on analysis of numerous economic factors, and if the strategies for investment do not work as intended, the Fund may not achieve its objectives.
The Fund's use of derivatives increased or decreased its exposure to the following risk:
| Equity Risk | Equity risk relates to the fluctuations in the value of financial instruments as a result of changes in market prices (other than those arising from interest rate risk or foreign exchange risk), whether caused by factors specific to an individual investment, its issuer, or all factors affecting all instruments traded in a market or market segment. |
The Fund is also exposed to additional risks from investing in derivatives, such as liquidity risk and counterparty credit risk. Liquidity risk is the risk that the Fund will be unable to close out the derivative in the open market in a timely manner. Counterparty credit risk is the risk that the counterparty will not be able to fulfill its obligation to the Fund. Counterparty credit risk related to exchange-traded futures contracts may be mitigated by the protection provided by the exchange on which they trade.
Investing in derivatives may involve greater risks than investing in the underlying assets directly and, to varying degrees, may involve risk of loss in excess of any initial investment and collateral received and amounts recognized in the Statement of Assets and Liabilities. In addition, there may be the risk that the change in value of the derivative contract does not correspond to the change in value of the underlying instrument.
Futures Contracts. A futures contract is an agreement between two parties to buy or sell a specified underlying instrument for a fixed price at a specified future date. The Fund used futures contracts to manage its exposure to the stock market.
Upon entering into a futures contract, a fund is required to deposit either cash or securities (initial margin) with a clearing broker in an amount equal to a certain percentage of the face value of the contract. Futures contracts are marked-to-market daily and subsequent daily payments (variation margin) are made or received by a fund depending on the daily fluctuations in the value of the futures contracts and are recorded as unrealized appreciation or (depreciation). This receivable and/or payable, if any, is included in daily variation margin on futures contracts in the Statement of Assets and Liabilities. Realized gain or (loss) is recorded upon the expiration or closing of a futures contract. The net realized gain (loss) and change in net unrealized appreciation (depreciation) on futures contracts during the period is presented in the Statement of Operations.
Any open futures contracts at period end are presented in the Schedule of Investments under the caption "Futures Contracts". The notional amount at value reflects each contract's exposure to the underlying instrument or index at period end and is representative of volume of activity during the period. Securities deposited to meet initial margin requirements are identified in the Schedule of Investments.
5. Purchases and Sales of Investments.
Purchases and sales of securities, other than short-term securities and in-kind transactions, aggregated $2,572,165 and $2,693,181, respectively.
Redemptions In-Kind. During the period, 760 shares of the Fund held by unaffiliated entities were redeemed in-kind for investments and cash with a value of $34,857. The net realized gain of $9,586 on investments delivered through the in-kind redemptions is included in the accompanying Statement of Operations. The amount of the redemptions is included in share transactions activity shown in the accompanying Statement of Changes in Net Assets as well as the Notes to Financial Statements. The Fund recognized no gain or loss for federal income tax purposes.
6. Fees and Other Transactions with Affiliates.
Management Fee. Fidelity Management & Research Company (the investment adviser) and its affiliates provide the Fund with investment management related services for which the Fund pays a monthly management fee. The management fee is the sum of an individual fund fee rate that is based on an annual rate of .424% of the Fund's average net assets and an annualized group fee rate that averaged .24% during the period. The group fee rate is based upon the average net assets of all the mutual funds advised by the investment adviser, including any mutual funds previously advised by the investment adviser that are currently advised by Fidelity SelectCo, LLC, an affiliate of the investment adviser. The group fee rate decreases as assets under management increase and increases as assets under management decrease. In addition, the management fee is subject to a performance adjustment (up to a maximum of +/- .20% of the Fund's average net assets over a 36 month performance period). The upward or downward adjustment to the management fee is based on the relative investment performance of International Discovery as compared to its benchmark index, the MSCI EAFE Index, over the same 36 month performance period. For the reporting period, the total annualized management fee rate, including the performance adjustment, was .73% of the Fund's average net assets. The performance adjustment included in the management fee rate may be higher or lower than the maximum performance adjustment rate due to the difference between the average net assets for the reporting and performance periods.
Distribution and Service Plan Fees. In accordance with Rule 12b-1 of the 1940 Act, the Fund has adopted separate Distribution and Service Plans for each class of shares. Certain classes pay Fidelity Distributors Corporation (FDC), an affiliate of the investment adviser, separate Distribution and Service Fees, each of which is based on an annual percentage of each class' average net assets. In addition, FDC may pay financial intermediaries for selling shares of the Fund and providing shareholder support services. For the period, the Distribution and Service Fee rates, total fees and amounts retained by FDC were as follows:
| Distribution Fee | Service Fee | Total Fees | Retained by FDC | |
| Class A | -% | .25% | $304 | $8 |
| Class M | .25% | .25% | 88 | 1 |
| Class C | .75% | .25% | 140 | 12 |
| $532 | $21 |
Sales Load. FDC may receive a front-end sales charge of up to 5.75% for selling Class A shares and 3.50% for selling Class M shares, some of which is paid to financial intermediaries for selling shares of the Fund. Depending on the holding period, FDC may receive contingent deferred sales charges levied on Class A, Class M and Class C redemptions. The deferred sales charges are 1.00% for Class C shares, 1.00% for certain purchases of Class A shares and .25% for certain purchases of Class M shares.
For the period, sales charge amounts retained by FDC were as follows:
| Retained by FDC | |
| Class A | $26 |
| Class M | 2 |
| Class C(a) | 2 |
| $30 |
(a) When Class C shares are initially sold, FDC pays commissions from its own resources to financial intermediaries through which the sales are made.
Transfer Agent Fees. Fidelity Investments Institutional Operations Company, Inc., (FIIOC), an affiliate of the investment adviser, is the transfer, dividend disbursing and shareholder servicing agent for each class of the Fund. FIIOC receives account fees and asset-based fees that vary according to the account size and type of account of the shareholders of the respective classes of the Fund, except for Class K and Class Z. FIIOC receives an asset-based fee of Class K's and Class Z's average net assets. FIIOC pays for typesetting, printing and mailing of shareholder reports, except proxy statements.
For the period, transfer agent fees for each class were as follows:
| Amount | % of Class-Level Average Net Assets(a) | |
| Class A | $297 | .24 |
| Class M | 41 | .23 |
| Class C | 38 | .27 |
| International Discovery | 5,806 | .15 |
| Class K | 533 | .05 |
| Class I | 599 | .18 |
| Class Z | 25 | .05 |
| $7,339 |
(a) Annualized
Accounting and Security Lending Fees. Fidelity Service Company, Inc. (FSC), an affiliate of the investment adviser, maintains the Fund's accounting records. The accounting fee is based on the level of average net assets for each month. Under a separate contract, FSC administers the security lending program. The security lending fee is based on the number and duration of lending transactions. For the period, the fees were equivalent to an annualized rate of .02%.
Brokerage Commissions. The Fund placed a portion of its portfolio transactions with brokerage firms which are affiliates of the investment adviser. Brokerage commissions are included in net realized gain (loss) and change in net unrealized appreciation (depreciation) in the Statement of Operations. The commissions paid to these affiliated firms were $14 for the period.
Interfund Trades. The Fund may purchase from or sell securities to other Fidelity Funds under procedures adopted by the Board. The procedures have been designed to ensure these interfund trades are executed in accordance with Rule 17a-7 of the 1940 Act. Interfund trades are included within the respective purchases and sales amounts shown in the Purchases and Sales of Investments note.
7. Committed Line of Credit.
The Fund participates with other funds managed by the investment adviser or an affiliate in a $4.25 billion credit facility (the "line of credit") to be utilized for temporary or emergency purposes to fund shareholder redemptions or for other short-term liquidity purposes. The Fund has agreed to pay commitment fees on its pro-rata portion of the line of credit, which amounted to $16 and is reflected in Miscellaneous expenses on the Statement of Operations. During the period, the Fund did not borrow on this line of credit.
8. Security Lending.
The Fund lends portfolio securities through a lending agent from time to time in order to earn additional income. For equity securities, a lending agent is used and may loan securities to certain qualified borrowers, including Fidelity Capital Markets (FCM), a broker-dealer affiliated with the Fund. On the settlement date of the loan, the Fund receives collateral (in the form of U.S. Treasury obligations, letters of credit and/or cash) against the loaned securities and maintains collateral in an amount not less than 100% of the market value of the loaned securities during the period of the loan. The market value of the loaned securities is determined at the close of business of the Fund and any additional required collateral is delivered to the Fund on the next business day. The Fund or borrower may terminate the loan at any time, and if the borrower defaults on its obligation to return the securities loaned because of insolvency or other reasons, the Fund may apply collateral received from the borrower against the obligation. The Fund may experience delays and costs in recovering the securities loaned. Any cash collateral received is invested in the Fidelity Securities Lending Cash Central Fund. The value of loaned securities and cash collateral at period end are disclosed on the Fund's Statement of Assets and Liabilities. At period end, there were no security loans outstanding with FCM. Security lending income represents the income earned on investing cash collateral, less rebates paid to borrowers and any lending agent fees associated with the loan, plus any premium payments received for lending certain types of securities. Security lending income is presented in the Statement of Operations as a component of income from Fidelity Central Funds. Total security lending income during the period amounted to $1,662, including less than five hundred dollars from securities loaned to FCM.
9. Expense Reductions.
Commissions paid to certain brokers with whom the investment adviser, or its affiliates, places trades on behalf of the Fund include an amount in addition to trade execution, which may be rebated back to the Fund to offset certain expenses. This amount totaled $1,870 for the period. In addition, through arrangements with the Fund's custodian, credits realized as a result of certain uninvested cash balances were used to reduce the Fund's expenses. During the period, these credits reduced the Fund's custody expenses by less than five hundred dollars.
In addition, during the period the investment adviser reimbursed and/or waived a portion of fund-level operating expenses in the amount of $54.
10. Distributions to Shareholders.
Distributions to shareholders of each class were as follows:
| Six months ended April 30, 2018 | Year ended October 31, 2017 | |
| From net investment income | ||
| Class A | $1,762 | $2,894 |
| Class M | 180 | 333 |
| Class C | 13 | 92 |
| International Discovery | 79,321 | 102,284 |
| Class K | 26,857 | 32,411 |
| Class I | 6,835 | 11,493 |
| Class Z | 1,196 | 667 |
| Total | $116,164 | $150,174 |
| From net realized gain | ||
| Class A | $9,495 | $302 |
| Class M | 1,377 | 44 |
| Class C | 1,119 | 33 |
| International Discovery | 289,470 | 8,190 |
| Class K | 88,812 | 2,392 |
| Class I | 25,555 | 929 |
| Class Z | 3,949 | 49 |
| Total | $419,777 | $11,939 |
11. Share Transactions.
Share transactions for each class were as follows and may contain automatic conversions between classes or exchanges between affiliated funds:
| Shares | Shares | Dollars | Dollars | |
| Six months ended April 30, 2018 | Year ended October 31, 2017 | Six months ended April 30, 2018 | Year ended October 31, 2017 | |
| Class A | ||||
| Shares sold | 399 | 712 | $18,387 | $29,106 |
| Reinvestment of distributions | 252 | 87 | 11,177 | 3,152 |
| Shares redeemed | (769) | (1,774) | (35,245) | (71,253) |
| Net increase (decrease) | (118) | (975) | $(5,681) | $(38,995) |
| Class M | ||||
| Shares sold | 62 | 80 | $2,857 | $3,246 |
| Reinvestment of distributions | 35 | 10 | 1,549 | 365 |
| Shares redeemed | (81) | (274) | (3,729) | (10,830) |
| Net increase (decrease) | 16 | (184) | $677 | $(7,219) |
| Class C | ||||
| Shares sold | 38 | 83 | $1,702 | $3,499 |
| Reinvestment of distributions | 25 | 3 | 1,083 | 116 |
| Shares redeemed | (88) | (174) | (3,994) | (6,878) |
| Net increase (decrease) | (25) | (88) | $(1,209) | $(3,263) |
| International Discovery | ||||
| Shares sold | 9,874 | 19,989 | $457,393 | $812,564 |
| Reinvestment of distributions | 7,869 | 2,884 | 351,491 | 105,223 |
| Shares redeemed | (10,645) | (35,967) | (491,376) | (1,442,640) |
| Net increase (decrease) | 7,098 | (13,094) | $317,508 | $(524,853) |
| Class K | ||||
| Shares sold | 9,665 | 10,877 | $445,759 | $448,875 |
| Reinvestment of distributions | 2,597 | 957 | 115,669 | 34,802 |
| Shares redeemed | (6,230)(a) | (14,039) | (287,754)(a) | (560,342) |
| Net increase (decrease) | 6,032 | (2,205) | $273,674 | $(76,665) |
| Class I | ||||
| Shares sold | 1,311 | 3,202 | $60,349 | $130,302 |
| Reinvestment of distributions | 224 | 82 | 9,992 | 2,985 |
| Shares redeemed | (1,328) | (8,961) | (60,918) | (349,072) |
| Net increase (decrease) | 207 | (5,677) | $9,423 | $(215,785) |
| Class Z | ||||
| Shares sold | 763 | 1,483 | $35,035 | $58,502 |
| Reinvestment of distributions | 67 | 20 | 2,993 | 716 |
| Shares redeemed | (223) | (351) | (10,309) | (14,440) |
| Net increase (decrease) | 607 | 1,152 | $27,719 | $44,778 |
(a) Amount includes in-kind redemptions (see the Redemptions In-Kind note for additional details).
12. Other.
The Fund's organizational documents provide former and current trustees and officers with a limited indemnification against liabilities arising in connection with the performance of their duties to the Fund. In the normal course of business, the Fund may also enter into contracts that provide general indemnifications. The Fund's maximum exposure under these arrangements is unknown as this would be dependent on future claims that may be made against the Fund. The risk of material loss from such claims is considered remote.
At the end of the period, Strategic Advisers International Fund was the owner of record of approximately 11% of the total outstanding shares of the Fund.
Shareholder Expense Example
As a shareholder of the Fund, you incur two types of costs: (1) transaction costs, including sales charges (loads) on purchase payments or redemption proceeds, redemption fees and (2) ongoing costs, including management fees, distribution and/or service (12b-1) fees and other Fund expenses. This Example is intended to help you understand your ongoing costs (in dollars) of investing in the Fund and to compare these costs with the ongoing costs of investing in other mutual funds.
The Example is based on an investment of $1,000 invested at the beginning of the period and held for the entire period (November 1, 2017 to April 30, 2018).
Actual Expenses
The first line of the accompanying table for each class of the Fund provides information about actual account values and actual expenses. You may use the information in this line, together with the amount you invested, to estimate the expenses that you paid over the period. Simply divide your account value by $1,000.00 (for example, an $8,600 account value divided by $1,000.00 = 8.6), then multiply the result by the number in the first line for a class of the Fund under the heading entitled "Expenses Paid During Period" to estimate the expenses you paid on your account during this period. A small balance maintenance fee of $12.00 that is charged once a year may apply for certain accounts with a value of less than $2,000. This fee is not included in the table below. If it was, the estimate of expenses you paid during the period would be higher, and your ending account value lower, by this amount. In addition, the Fund, as a shareholder in the underlying Fidelity Central Funds, will indirectly bear its pro-rata share of the fees and expenses incurred by the underlying Fidelity Central Funds. These fees and expenses are not included in the Fund's annualized expense ratio used to calculate the expense estimate in the table below.
Hypothetical Example for Comparison Purposes
The second line of the accompanying table for each class of the Fund provides information about hypothetical account values and hypothetical expenses based on a Class' actual expense ratio and an assumed rate of return of 5% per year before expenses, which is not the Class' actual return. The hypothetical account values and expenses may not be used to estimate the actual ending account balance or expenses you paid for the period. You may use this information to compare the ongoing costs of investing in the Fund and other funds. To do so, compare this 5% hypothetical example with the 5% hypothetical examples that appear in the shareholder reports of the other funds. A small balance maintenance fee of $12.00 that is charged once a year may apply for certain accounts with a value of less than $2,000. This fee is not included in the table below. If it was, the estimate of expenses you paid during the period would be higher, and your ending account value lower, by this amount. In addition, the Fund, as a shareholder in the underlying Fidelity Central Funds, will indirectly bear its pro-rata share of the fees and expenses incurred by the underlying Fidelity Central Funds. These fees and expenses are not included in the Fund's annualized expense ratio used to calculate the expense estimate in the table below.
Please note that the expenses shown in the table are meant to highlight your ongoing costs only and do not reflect any transaction costs. Therefore, the second line of the table is useful in comparing ongoing costs only, and will not help you determine the relative total costs of owning different funds. In addition, if these transactional costs were included, your costs would have been higher.
| Annualized Expense Ratio-A | Beginning Account Value November 1, 2017 | Ending Account Value April 30, 2018 | Expenses Paid During Period-B November 1, 2017 to April 30, 2018 | |
| Class A | 1.26% | |||
| Actual | $1,000.00 | $1,014.00 | $6.29 | |
| Hypothetical-C | $1,000.00 | $1,018.55 | $6.31 | |
| Class M | 1.50% | |||
| Actual | $1,000.00 | $1,013.00 | $7.49 | |
| Hypothetical-C | $1,000.00 | $1,017.36 | $7.50 | |
| Class C | 2.04% | |||
| Actual | $1,000.00 | $1,009.90 | $10.17 | |
| Hypothetical-C | $1,000.00 | $1,014.68 | $10.19 | |
| International Discovery | .93% | |||
| Actual | $1,000.00 | $1,015.60 | $4.65 | |
| Hypothetical-C | $1,000.00 | $1,020.18 | $4.66 | |
| Class K | .82% | |||
| Actual | $1,000.00 | $1,016.10 | $4.10 | |
| Hypothetical-C | $1,000.00 | $1,020.73 | $4.11 | |
| Class I | .95% | |||
| Actual | $1,000.00 | $1,015.60 | $4.75 | |
| Hypothetical-C | $1,000.00 | $1,020.08 | $4.76 | |
| Class Z | .82% | |||
| Actual | $1,000.00 | $1,016.40 | $4.10 | |
| Hypothetical-C | $1,000.00 | $1,020.73 | $4.11 |
A Annualized expense ratio reflects expenses net of applicable fee waivers.
B Expenses are equal to each Class' annualized expense ratio, multiplied by the average account value over the period, multiplied by 181/365 (to reflect the one-half year period).
C 5% return per year before expenses
![]()
Corporate Headquarters
245 Summer St.
Boston, MA 02210
www.fidelity.com
IGI-SANN-0618
1.807261.113
Fidelity's Broadly Diversified International Equity Funds Fidelity® Diversified International Fund Fidelity® International Capital Appreciation Fund Fidelity® Overseas Fund Fidelity® Worldwide Fund Semi-Annual Report April 30, 2018 |
|
Contents
Fidelity® Diversified International Fund | |
Fidelity® International Capital Appreciation Fund | |
Fidelity® Overseas Fund | |
Fidelity® Worldwide Fund | |
To view a fund's proxy voting guidelines and proxy voting record for the 12-month period ended June 30, visit http://www.fidelity.com/proxyvotingresults or visit the Securities and Exchange Commission's (SEC) web site at http://www.sec.gov.
You may also call 1-800-544-8544 to request a free copy of the proxy voting guidelines.
Standard & Poor's, S&P and S&P 500 are registered service marks of The McGraw-Hill Companies, Inc. and have been licensed for use by Fidelity Distributors Corporation.
Other third-party marks appearing herein are the property of their respective owners.
All other marks appearing herein are registered or unregistered trademarks or service marks of FMR LLC or an affiliated company. © 2018 FMR LLC. All rights reserved.
This report and the financial statements contained herein are submitted for the general information of the shareholders of the Funds. This report is not authorized for distribution to prospective investors in the Funds unless preceded or accompanied by an effective prospectus.
A fund files its complete schedule of portfolio holdings with the SEC for the first and third quarters of each fiscal year on Form N-Q. Forms N-Q are available on the SEC’s web site at http://www.sec.gov. A fund's Forms N-Q may be reviewed and copied at the SEC’s Public Reference Room in Washington, DC. Information regarding the operation of the SEC's Public Reference Room may be obtained by calling 1-800-SEC-0330.
For a complete list of a fund's portfolio holdings, view the most recent holdings listing, semiannual report, or annual report on Fidelity's web site at http://www.fidelity.com, http://www.institutional.fidelity.com, or http://www.401k.com, as applicable.
NOT FDIC INSURED •MAY LOSE VALUE •NO BANK GUARANTEE
Neither the Funds nor Fidelity Distributors Corporation is a bank.
Fidelity® Diversified International Fund
Investment Summary (Unaudited)
Geographic Diversification (% of fund's net assets)
| As of April 30, 2018 | ||
| Japan | 17.1% | |
| United Kingdom | 15.0% | |
| United States of America* | 9.3% | |
| France | 7.6% | |
| Germany | 7.4% | |
| Netherlands | 5.4% | |
| India | 4.2% | |
| Switzerland | 4.1% | |
| Canada | 3.4% | |
| Other | 26.5% | |

* Includes Short-Term investments and Net Other Assets (Liabilities).
Percentages are based on country or territory of incorporation and are adjusted for the effect of futures contracts, if applicable.
Asset Allocation as of April 30, 2018
| % of fund's net assets | |
| Stocks | 96.3 |
| Short-Term Investments and Net Other Assets (Liabilities) | 3.7 |
Top Ten Stocks as of April 30, 2018
| % of fund's net assets | |
| Prudential PLC (United Kingdom, Insurance) | 1.6 |
| ORIX Corp. (Japan, Diversified Financial Services) | 1.6 |
| British American Tobacco PLC sponsored ADR (United Kingdom, Tobacco) | 1.4 |
| Keyence Corp. (Japan, Electronic Equipment & Components) | 1.4 |
| Statoil ASA (Norway, Oil, Gas & Consumable Fuels) | 1.4 |
| Unilever NV (Certificaten Van Aandelen) (Bearer) (Netherlands, Personal Products) | 1.3 |
| AIA Group Ltd. (Hong Kong, Insurance) | 1.2 |
| Wolseley PLC (Bailiwick of Jersey, Trading Companies & Distributors) | 1.2 |
| SAP SE (Germany, Software) | 1.2 |
| HDFC Bank Ltd. (India, Banks) | 1.1 |
| 13.4 |
Top Market Sectors as of April 30, 2018
| % of fund's net assets | |
| Financials | 25.9 |
| Industrials | 15.8 |
| Information Technology | 11.8 |
| Consumer Staples | 10.8 |
| Consumer Discretionary | 10.7 |
| Health Care | 9.8 |
| Materials | 5.5 |
| Energy | 4.7 |
| Telecommunication Services | 1.0 |
| Utilities | 0.2 |
Fidelity® Diversified International Fund
Schedule of Investments April 30, 2018 (Unaudited)
Showing Percentage of Net Assets
| Common Stocks - 95.4% | |||
| Shares | Value | ||
| Australia - 1.0% | |||
| Amcor Ltd. | 4,821,629 | $49,686,764 | |
| Bapcor Ltd. | 758,759 | 3,347,635 | |
| CSL Ltd. | 493,899 | 63,263,054 | |
| Link Administration Holdings Ltd. | 1,147,262 | 7,138,659 | |
| Magellan Financial Group Ltd. | 2,777,540 | 48,524,932 | |
| Technology One Ltd. | 527,524 | 1,959,473 | |
| TOTAL AUSTRALIA | 173,920,517 | ||
| Austria - 0.1% | |||
| Andritz AG | 366,300 | 19,710,843 | |
| Bailiwick of Jersey - 2.4% | |||
| Glencore Xstrata PLC | 16,288,761 | 78,643,554 | |
| Shire PLC | 1,937,787 | 103,187,022 | |
| Wolseley PLC | 2,712,825 | 208,398,838 | |
| WPP PLC | 1,108,809 | 19,027,306 | |
| TOTAL BAILIWICK OF JERSEY | 409,256,720 | ||
| Belgium - 1.2% | |||
| KBC Groep NV | 1,993,688 | 174,308,621 | |
| Umicore SA | 478,648 | 26,738,989 | |
| TOTAL BELGIUM | 201,047,610 | ||
| Bermuda - 1.2% | |||
| Credicorp Ltd. (United States) | 334,900 | 77,860,901 | |
| Hiscox Ltd. | 3,462,400 | 70,975,956 | |
| IHS Markit Ltd. (a) | 1,084,000 | 53,256,920 | |
| TOTAL BERMUDA | 202,093,777 | ||
| Canada - 3.4% | |||
| Alimentation Couche-Tard, Inc. Class B (sub. vtg.) | 3,842,181 | 166,111,973 | |
| CCL Industries, Inc. Class B | 347,400 | 16,851,180 | |
| Cenovus Energy, Inc. | 9,098,300 | 91,128,267 | |
| Constellation Software, Inc. | 53,024 | 37,895,878 | |
| Fairfax India Holdings Corp. (a) | 4,410,200 | 77,178,500 | |
| PrairieSky Royalty Ltd. (b) | 721,298 | 15,993,889 | |
| Suncor Energy, Inc. | 4,814,200 | 184,101,577 | |
| TOTAL CANADA | 589,261,264 | ||
| Cayman Islands - 1.2% | |||
| Alibaba Group Holding Ltd. sponsored ADR (a) | 481,100 | 85,895,594 | |
| ENN Energy Holdings Ltd. | 2,995,000 | 28,007,837 | |
| JD.com, Inc. sponsored ADR (a) | 1,251,092 | 45,677,369 | |
| NetEase, Inc. ADR | 145,900 | 37,506,513 | |
| Zai Lab Ltd. ADR | 556,327 | 10,386,625 | |
| TOTAL CAYMAN ISLANDS | 207,473,938 | ||
| China - 0.7% | |||
| Hangzhou Hikvision Digital Technology Co. Ltd. Class A | 1,389,310 | 8,414,887 | |
| Kweichow Moutai Co. Ltd. (A Shares) | 484,010 | 50,399,489 | |
| Shanghai International Airport Co. Ltd. (A Shares) | 5,833,200 | 45,814,792 | |
| Tonghua Dongbao Pharmaceutical Co. Ltd. Class A | 4,621,300 | 20,905,647 | |
| TOTAL CHINA | 125,534,815 | ||
| Curacao - 0.3% | |||
| Schlumberger Ltd. | 748,800 | 51,337,728 | |
| Denmark - 0.3% | |||
| NNIT A/S (c) | 356,425 | 9,901,818 | |
| Novozymes A/S Series B | 860,800 | 40,468,682 | |
| SimCorp A/S | 25,785 | 1,877,340 | |
| TOTAL DENMARK | 52,247,840 | ||
| Finland - 0.4% | |||
| Sampo Oyj (A Shares) | 1,309,900 | 70,787,127 | |
| France - 7.6% | |||
| Aeroports de Paris | 235,600 | 51,894,726 | |
| Amundi SA (c) | 1,735,613 | 147,720,883 | |
| BNP Paribas SA | 2,286,500 | 176,660,130 | |
| Capgemini SA | 510,700 | 70,306,231 | |
| Compagnie de St. Gobain | 1,601,800 | 84,133,844 | |
| Eiffage SA | 304,000 | 36,233,797 | |
| Elis SA | 1,911,900 | 45,760,623 | |
| Iliad SA | 82,686 | 16,570,375 | |
| Kering SA (b) | 135,100 | 78,245,186 | |
| LVMH Moet Hennessy - Louis Vuitton SA (b) | 456,221 | 158,770,450 | |
| Maisons du Monde SA (c) | 781,800 | 31,797,345 | |
| Sanofi SA (b) | 2,008,821 | 158,822,056 | |
| Societe Generale Series A | 1,742,200 | 95,348,493 | |
| SR Teleperformance SA | 170,600 | 27,379,601 | |
| Thales SA | 203,500 | 25,803,393 | |
| VINCI SA (b) | 1,242,900 | 124,269,742 | |
| TOTAL FRANCE | 1,329,716,875 | ||
| Germany - 6.7% | |||
| adidas AG | 570,517 | 140,478,196 | |
| Aumann AG (c) | 311,300 | 18,833,887 | |
| Axel Springer Verlag AG | 734,700 | 60,198,129 | |
| Bayer AG | 1,418,662 | 169,557,930 | |
| Brenntag AG | 139,700 | 8,016,706 | |
| Deutsche Borse AG | 315,800 | 42,471,656 | |
| Deutsche Post AG | 2,333,932 | 101,303,035 | |
| Fresenius SE & Co. KGaA | 1,573,800 | 120,378,993 | |
| Hannover Reuck SE | 374,600 | 52,745,988 | |
| Linde AG | 451,900 | 100,438,743 | |
| Morphosys AG sponsored ADR | 714,900 | 18,716,082 | |
| Rational AG | 29,539 | 18,531,239 | |
| SAP SE | 1,844,444 | 204,928,207 | |
| Scout24 AG (c) | 716,300 | 37,143,267 | |
| Symrise AG | 815,600 | 66,088,035 | |
| TOTAL GERMANY | 1,159,830,093 | ||
| Hong Kong - 1.6% | |||
| AIA Group Ltd. | 23,996,000 | 214,457,053 | |
| Techtronic Industries Co. Ltd. | 10,345,000 | 60,602,994 | |
| TOTAL HONG KONG | 275,060,047 | ||
| Hungary - 0.0% | |||
| OTP Bank PLC | 209,900 | 9,170,420 | |
| India - 4.2% | |||
| Adani Ports & Special Economic Zone Ltd. | 5,899,236 | 36,086,139 | |
| Axis Bank Ltd. | 5,377,605 | 41,689,657 | |
| Future Retail Ltd. | 623,777 | 5,636,203 | |
| Godrej Consumer Products Ltd. | 832,727 | 13,954,171 | |
| HDFC Bank Ltd. | 6,420,497 | 193,512,573 | |
| Housing Development Finance Corp. Ltd. | 6,630,847 | 187,606,708 | |
| ICICI Bank Ltd. | 9,472,506 | 40,482,586 | |
| Kajaria Ceramics Ltd. | 1,306,007 | 10,693,327 | |
| Kotak Mahindra Bank Ltd. (a) | 2,387,505 | 43,414,139 | |
| LIC Housing Finance Ltd. | 3,114,373 | 25,498,183 | |
| Motherson Sumi Systems Ltd. | 1,881,915 | 9,970,933 | |
| PC Jeweller Ltd. | 927,631 | 2,008,313 | |
| Reliance Industries Ltd. | 8,261,612 | 119,284,455 | |
| TOTAL INDIA | 729,837,387 | ||
| Indonesia - 0.9% | |||
| PT Bank Central Asia Tbk | 44,925,500 | 71,039,922 | |
| PT Bank Rakyat Indonesia Tbk | 358,339,600 | 82,621,817 | |
| TOTAL INDONESIA | 153,661,739 | ||
| Ireland - 3.3% | |||
| Allergan PLC | 211,600 | 32,512,340 | |
| CRH PLC | 2,322,800 | 82,438,695 | |
| DCC PLC (United Kingdom) | 659,189 | 63,525,385 | |
| Kerry Group PLC Class A | 887,000 | 90,511,432 | |
| Kingspan Group PLC (Ireland) | 1,669,300 | 75,594,251 | |
| Paddy Power Betfair PLC (Ireland) | 554,700 | 54,894,676 | |
| Ryanair Holdings PLC sponsored ADR (a) | 1,563,399 | 171,926,988 | |
| TOTAL IRELAND | 571,403,767 | ||
| Israel - 0.6% | |||
| Check Point Software Technologies Ltd. (a) | 840,000 | 81,068,400 | |
| Frutarom Industries Ltd. | 134,449 | 12,907,134 | |
| SodaStream International Ltd. (a) | 186,660 | 17,637,503 | |
| TOTAL ISRAEL | 111,613,037 | ||
| Italy - 1.0% | |||
| Buzzi Unicem SpA | 256,200 | 6,484,754 | |
| Intesa Sanpaolo SpA | 34,394,200 | 130,834,076 | |
| Prada SpA | 9,035,500 | 45,845,273 | |
| TOTAL ITALY | 183,164,103 | ||
| Japan - 17.1% | |||
| Bandai Namco Holdings, Inc. | 312,400 | 10,616,228 | |
| Bridgestone Corp. | 2,224,600 | 93,383,547 | |
| Daikin Industries Ltd. | 966,700 | 113,232,652 | |
| East Japan Railway Co. | 484,900 | 46,529,464 | |
| GMO Internet, Inc. | 253,600 | 4,674,387 | |
| Hoya Corp. | 3,371,100 | 180,766,449 | |
| Itochu Corp. | 1,564,400 | 31,396,758 | |
| Kao Corp. | 1,066,400 | 76,624,332 | |
| Keyence Corp. | 397,720 | 243,645,338 | |
| Minebea Mitsumi, Inc. | 6,453,100 | 129,687,712 | |
| Misumi Group, Inc. | 1,921,700 | 53,263,364 | |
| Mitsubishi UFJ Financial Group, Inc. | 24,726,300 | 165,699,427 | |
| Morinaga & Co. Ltd. | 1,112,700 | 54,250,741 | |
| Nabtesco Corp. | 678,900 | 24,561,375 | |
| Nidec Corp. | 566,000 | 88,741,676 | |
| Nintendo Co. Ltd. | 41,500 | 17,437,326 | |
| Nissan Chemical Industries Co. Ltd. | 121,500 | 5,418,153 | |
| Nitori Holdings Co. Ltd. | 841,700 | 142,285,181 | |
| Olympus Corp. | 1,609,200 | 60,131,559 | |
| ORIX Corp. | 15,434,200 | 271,637,402 | |
| Outsourcing, Inc. | 1,570,400 | 26,489,367 | |
| PALTAC Corp. | 637,800 | 31,971,679 | |
| Panasonic Corp. | 3,601,600 | 53,329,432 | |
| Recruit Holdings Co. Ltd. | 5,450,800 | 125,998,643 | |
| Renesas Electronics Corp. (a)(b) | 8,742,300 | 91,805,346 | |
| Seria Co. Ltd. | 394,900 | 19,362,093 | |
| Shin-Etsu Chemical Co. Ltd. | 515,800 | 51,924,433 | |
| Shiseido Co. Ltd. | 274,300 | 17,845,057 | |
| SMC Corp. | 212,500 | 81,096,780 | |
| SoftBank Corp. | 1,520,100 | 116,148,880 | |
| Sohgo Security Services Co., Ltd. | 403,200 | 19,953,458 | |
| Sony Corp. | 2,374,200 | 110,889,664 | |
| Start Today Co. Ltd. | 1,235,400 | 35,710,428 | |
| Subaru Corp. | 1,350,200 | 45,438,948 | |
| Sundrug Co. Ltd. | 630,900 | 32,491,465 | |
| Tsubaki Nakashima Co. Ltd. | 601,600 | 14,231,043 | |
| Tsuruha Holdings, Inc. | 1,223,400 | 176,034,413 | |
| Welcia Holdings Co. Ltd. | 1,985,800 | 102,269,063 | |
| TOTAL JAPAN | 2,966,973,263 | ||
| Korea (South) - 0.3% | |||
| LG Chemical Ltd. | 147,738 | 49,663,310 | |
| Liberia - 0.1% | |||
| Royal Caribbean Cruises Ltd. | 86,500 | 9,358,435 | |
| Luxembourg - 1.0% | |||
| B&M European Value Retail S.A. | 27,227,388 | 151,922,430 | |
| Eurofins Scientific SA | 2,838 | 1,534,686 | |
| Samsonite International SA | 3,760,200 | 16,961,113 | |
| TOTAL LUXEMBOURG | 170,418,229 | ||
| Netherlands - 5.4% | |||
| ASML Holding NV | 757,000 | 142,656,650 | |
| ING Groep NV (Certificaten Van Aandelen) | 7,083,100 | 119,353,931 | |
| Koninklijke Philips Electronics NV (d) | 2,525,900 | 106,911,824 | |
| LyondellBasell Industries NV Class A | 815,600 | 86,233,388 | |
| Philips Lighting NV (c) | 534,800 | 16,300,610 | |
| RELX NV | 5,237,910 | 111,420,162 | |
| Unilever NV (Certificaten Van Aandelen) (Bearer) | 3,892,957 | 223,177,730 | |
| Wolters Kluwer NV | 1,939,900 | 105,019,800 | |
| Yandex NV Series A (a) | 878,400 | 29,303,424 | |
| TOTAL NETHERLANDS | 940,377,519 | ||
| New Zealand - 0.2% | |||
| Ryman Healthcare Group Ltd. | 4,972,797 | 37,087,916 | |
| Norway - 1.6% | |||
| Schibsted ASA (A Shares) | 1,290,100 | 37,727,018 | |
| Statoil ASA | 9,486,900 | 242,605,734 | |
| TOTAL NORWAY | 280,332,752 | ||
| South Africa - 0.8% | |||
| Capitec Bank Holdings Ltd. | 165,800 | 11,803,968 | |
| Naspers Ltd. Class N | 523,179 | 127,456,639 | |
| TOTAL SOUTH AFRICA | 139,260,607 | ||
| Spain - 2.3% | |||
| Aedas Homes SAU (c) | 479,525 | 17,082,695 | |
| Amadeus IT Holding SA Class A | 2,075,900 | 152,166,210 | |
| CaixaBank SA | 24,610,800 | 119,679,223 | |
| Masmovil Ibercom SA (a) | 252,704 | 36,497,776 | |
| Neinor Homes SLU (a)(c) | 941,400 | 18,257,564 | |
| Prosegur Cash SA (c) | 19,390,474 | 56,666,566 | |
| TOTAL SPAIN | 400,350,034 | ||
| Sweden - 2.3% | |||
| Alfa Laval AB | 887,100 | 22,054,287 | |
| ASSA ABLOY AB (B Shares) (b) | 4,647,400 | 97,760,111 | |
| Coor Service Management Holding AB | 4,332,800 | 30,133,387 | |
| Essity AB Class B | 2,764,200 | 70,394,112 | |
| HEXPOL AB (B Shares) | 2,907,700 | 30,217,115 | |
| Indutrade AB | 662,000 | 15,679,375 | |
| Nordea Bank AB | 13,563,600 | 138,445,018 | |
| TOTAL SWEDEN | 404,683,405 | ||
| Switzerland - 4.1% | |||
| Credit Suisse Group AG | 7,488,621 | 126,304,896 | |
| Julius Baer Group Ltd. | 1,122,840 | 66,638,726 | |
| Lonza Group AG | 234,910 | 57,885,996 | |
| Roche Holding AG (participation certificate) | 707,129 | 157,115,202 | |
| Sika AG | 16,601 | 121,115,267 | |
| Swatch Group AG (Bearer) | 130,180 | 62,856,842 | |
| TE Connectivity Ltd. | 174,200 | 15,982,850 | |
| UBS Group AG | 6,442,107 | 109,015,272 | |
| TOTAL SWITZERLAND | 716,915,051 | ||
| Taiwan - 1.3% | |||
| Taiwan Semiconductor Manufacturing Co. Ltd. sponsored ADR | 4,063,400 | 156,237,730 | |
| Tripod Technology Corp. | 4,764,000 | 14,385,079 | |
| United Microelectronics Corp. | 96,782,000 | 52,099,401 | |
| TOTAL TAIWAN | 222,722,210 | ||
| Thailand - 0.2% | |||
| Kasikornbank PCL (For. Reg.) | 6,269,900 | 39,739,053 | |
| United Kingdom - 15.0% | |||
| Admiral Group PLC | 1,636,100 | 44,890,708 | |
| Aon PLC | 210,000 | 29,918,700 | |
| Ascential PLC | 6,044,532 | 35,066,832 | |
| Ashtead Group PLC | 1,284,900 | 35,962,181 | |
| AstraZeneca PLC (United Kingdom) | 1,766,355 | 123,649,043 | |
| Beazley PLC | 2,149,300 | 17,502,138 | |
| British American Tobacco PLC sponsored ADR | 4,515,800 | 246,652,996 | |
| Bunzl PLC | 3,159,670 | 91,826,763 | |
| Coca-Cola European Partners PLC | 1,115,500 | 43,727,600 | |
| Compass Group PLC | 4,190,288 | 89,992,805 | |
| Cranswick PLC | 398,946 | 16,004,532 | |
| DS Smith PLC | 4,025,000 | 28,947,320 | |
| Essentra PLC | 2,898,548 | 17,597,801 | |
| Halma PLC | 1,899,156 | 31,976,168 | |
| Hastings Group Holdings PLC (c) | 13,493,282 | 51,270,316 | |
| Imperial Tobacco Group PLC | 1,447,233 | 51,892,206 | |
| Indivior PLC (a) | 12,419,900 | 77,473,197 | |
| Informa PLC | 2,818,468 | 28,674,567 | |
| ITV PLC | 4,325,900 | 9,031,465 | |
| John Wood Group PLC | 4,352,500 | 34,071,005 | |
| LivaNova PLC (a) | 272,400 | 24,183,672 | |
| Lloyds Banking Group PLC | 139,927,600 | 124,108,476 | |
| London Stock Exchange Group PLC | 1,903,500 | 112,683,584 | |
| Melrose Industries PLC | 42,547,312 | 133,550,737 | |
| Micro Focus International PLC | 4,182,495 | 72,119,314 | |
| Prudential PLC | 11,063,856 | 284,496,641 | |
| Reckitt Benckiser Group PLC | 2,108,987 | 165,445,981 | |
| Spectris PLC | 1,694,100 | 62,737,995 | |
| St. James's Place Capital PLC | 9,395,400 | 147,002,266 | |
| Standard Chartered PLC (United Kingdom) | 8,139,416 | 85,946,446 | |
| Standard Life PLC | 15,620,302 | 78,555,828 | |
| Tesco PLC | 37,967,019 | 122,972,851 | |
| The Weir Group PLC | 2,871,100 | 84,428,463 | |
| TOTAL UNITED KINGDOM | 2,604,360,597 | ||
| United States of America - 5.6% | |||
| Alphabet, Inc. Class C (a) | 103,003 | 104,788,042 | |
| Amgen, Inc. | 590,600 | 103,047,888 | |
| Becton, Dickinson & Co. | 118,100 | 27,383,847 | |
| Boston Scientific Corp. (a) | 299,100 | 8,590,152 | |
| Citigroup, Inc. | 1,106,700 | 75,554,409 | |
| Coty, Inc. Class A | 4,749,300 | 82,400,355 | |
| DocuSign, Inc. | 50,000 | 1,931,500 | |
| DowDuPont, Inc. | 789,600 | 49,934,304 | |
| FleetCor Technologies, Inc. (a) | 73,900 | 15,317,992 | |
| MasterCard, Inc. Class A | 793,400 | 141,439,418 | |
| nLIGHT, Inc. (a) | 21,400 | 533,502 | |
| Oceaneering International, Inc. | 1,011,100 | 21,475,764 | |
| Quintiles Transnational Holdings, Inc. (a) | 184,200 | 17,638,992 | |
| S&P Global, Inc. | 686,700 | 129,511,620 | |
| Smartsheet, Inc. | 40,300 | 777,790 | |
| Valero Energy Corp. | 491,600 | 54,533,188 | |
| Visa, Inc. Class A | 1,071,300 | 135,926,544 | |
| TOTAL UNITED STATES OF AMERICA | 970,785,307 | ||
| TOTAL COMMON STOCKS | |||
| (Cost $12,288,182,954) | 16,579,157,335 | ||
| Nonconvertible Preferred Stocks - 0.9% | |||
| Brazil - 0.2% | |||
| Itau Unibanco Holding SA | 1,554,050 | 22,628,480 | |
| Germany - 0.7% | |||
| Henkel AG & Co. KGaA | 600,900 | 76,483,177 | |
| Jungheinrich AG | 364,600 | 15,427,795 | |
| Sartorius AG (non-vtg.) | 204,084 | 31,496,545 | |
| TOTAL GERMANY | 123,407,517 | ||
| TOTAL NONCONVERTIBLE PREFERRED STOCKS | |||
| (Cost $80,660,531) | 146,035,997 | ||
| Money Market Funds - 4.3% | |||
| Fidelity Cash Central Fund, 1.74% (e) | 582,997,922 | 583,114,522 | |
| Fidelity Securities Lending Cash Central Fund 1.74% (e)(f) | 171,000,265 | 171,017,365 | |
| TOTAL MONEY MARKET FUNDS | |||
| (Cost $754,109,153) | 754,131,887 | ||
| TOTAL INVESTMENT IN SECURITIES - 100.6% | |||
| (Cost $13,122,952,638) | 17,479,325,219 | ||
| NET OTHER ASSETS (LIABILITIES) - (0.6)% | (98,292,360) | ||
| NET ASSETS - 100% | $17,381,032,859 |
Categorizations in the Schedule of Investments are based on country or territory of incorporation.
Legend
(a) Non-income producing
(b) Security or a portion of the security is on loan at period end.
(c) Security exempt from registration under Rule 144A of the Securities Act of 1933. These securities may be resold in transactions exempt from registration, normally to qualified institutional buyers. At the end of the period, the value of these securities amounted to $404,974,951 or 2.3% of net assets.
(d) Security or a portion of the security purchased on a delayed delivery or when-issued basis.
(e) Affiliated fund that is generally available only to investment companies and other accounts managed by Fidelity Investments. The rate quoted is the annualized seven-day yield of the fund at period end. A complete unaudited listing of the fund's holdings as of its most recent quarter end is available upon request. In addition, each Fidelity Central Fund's financial statements are available on the SEC's website or upon request.
(f) Investment made with cash collateral received from securities on loan.
Affiliated Central Funds
Information regarding fiscal year to date income earned by the Fund from investments in Fidelity Central Funds is as follows:
| Fund | Income earned |
| Fidelity Cash Central Fund | $2,724,434 |
| Fidelity Securities Lending Cash Central Fund | 2,026,468 |
| Total | $4,750,902 |
Amounts in the income column in the above table include any capital gain distributions from underlying funds, which are presented in the corresponding line-item in the Statement of Operations if applicable.
Investment Valuation
The following is a summary of the inputs used, as of April 30, 2018, involving the Fund's assets and liabilities carried at fair value. The inputs or methodology used for valuing securities may not be an indication of the risk associated with investing in those securities. For more information on valuation inputs, and their aggregation into the levels used below, please refer to the Investment Valuation section in the accompanying Notes to Financial Statements.
| Valuation Inputs at Reporting Date: | ||||
| Description | Total | Level 1 | Level 2 | Level 3 |
| Investments in Securities: | ||||
| Equities: | ||||
| Consumer Discretionary | $1,864,430,421 | $1,250,584,466 | $613,845,955 | $-- |
| Consumer Staples | 1,880,177,178 | 1,304,226,956 | 575,950,222 | -- |
| Energy | 814,531,607 | 452,641,418 | 361,890,189 | -- |
| Financials | 4,503,963,415 | 2,228,637,279 | 2,275,326,136 | -- |
| Health Care | 1,722,528,535 | 819,116,757 | 903,411,778 | -- |
| Industrials | 2,725,613,429 | 2,407,446,394 | 318,167,035 | -- |
| Information Technology | 2,077,843,563 | 1,699,361,217 | 378,482,346 | -- |
| Materials | 921,797,621 | 749,203,480 | 172,594,141 | -- |
| Real Estate | 17,082,695 | 17,082,695 | -- | -- |
| Telecommunication Services | 169,217,031 | 53,068,151 | 116,148,880 | -- |
| Utilities | 28,007,837 | -- | 28,007,837 | -- |
| Money Market Funds | 754,131,887 | 754,131,887 | -- | -- |
| Total Investments in Securities: | $17,479,325,219 | $11,735,500,700 | $5,743,824,519 | $-- |
The following is a summary of transfers between Level 1 and Level 2 for the period ended April 30, 2018. Transfers are assumed to have occurred at the beginning of the period, and are primarily attributable to the valuation techniques used for foreign equity securities, as discussed in the accompanying Notes to Financial Statements:
| Transfers | Total |
| Level 1 to Level 2 | $2,014,158,079 |
| Level 2 to Level 1 | $2,689,090,135 |
See accompanying notes which are an integral part of the financial statements.
Fidelity® Diversified International Fund
Financial Statements
Statement of Assets and Liabilities
| April 30, 2018 (Unaudited) | ||
| Assets | ||
| Investment in securities, at value (including securities loaned of $163,887,454) — See accompanying schedule: Unaffiliated issuers (cost $12,368,843,485) | $16,725,193,332 | |
| Fidelity Central Funds (cost $754,109,153) | 754,131,887 | |
| Total Investment in Securities (cost $13,122,952,638) | $17,479,325,219 | |
| Cash | 2,788,363 | |
| Receivable for investments sold | 65,652,414 | |
| Receivable for fund shares sold | 14,259,577 | |
| Dividends receivable | 103,483,589 | |
| Distributions receivable from Fidelity Central Funds | 1,478,817 | |
| Prepaid expenses | 10,439 | |
| Other receivables | 2,635,387 | |
| Total assets | 17,669,633,805 | |
| Liabilities | ||
| Payable for investments purchased | ||
| Regular delivery | $73,729,604 | |
| Delayed delivery | 2,364,856 | |
| Payable for fund shares redeemed | 23,226,269 | |
| Accrued management fee | 9,247,840 | |
| Other affiliated payables | 1,931,056 | |
| Other payables and accrued expenses | 7,089,131 | |
| Collateral on securities loaned | 171,012,190 | |
| Total liabilities | 288,600,946 | |
| Net Assets | $17,381,032,859 | |
| Net Assets consist of: | ||
| Paid in capital | $11,827,989,828 | |
| Undistributed net investment income | 82,108,287 | |
| Accumulated undistributed net realized gain (loss) on investments and foreign currency transactions | 1,119,187,772 | |
| Net unrealized appreciation (depreciation) on investments and assets and liabilities in foreign currencies | 4,351,746,972 | |
| Net Assets | $17,381,032,859 | |
| Diversified International: | ||
| Net Asset Value, offering price and redemption price per share ($10,747,537,561 ÷ 271,193,810 shares) | $39.63 | |
| Class K: | ||
| Net Asset Value, offering price and redemption price per share ($6,633,495,298 ÷ 167,674,278 shares) | $39.56 |
See accompanying notes which are an integral part of the financial statements.
Statement of Operations
| Six months ended April 30, 2018 (Unaudited) | ||
| Investment Income | ||
| Dividends | $176,567,388 | |
| Income from Fidelity Central Funds | 4,750,902 | |
| Income before foreign taxes withheld | 181,318,290 | |
| Less foreign taxes withheld | (15,370,481) | |
| Total income | 165,947,809 | |
| Expenses | ||
| Management fee | ||
| Basic fee | $62,124,910 | |
| Performance adjustment | (1,276,686) | |
| Transfer agent fees | 10,781,284 | |
| Accounting and security lending fees | 1,070,298 | |
| Custodian fees and expenses | 1,107,433 | |
| Independent trustees' fees and expenses | 37,634 | |
| Registration fees | 76,940 | |
| Audit | 64,072 | |
| Legal | 38,471 | |
| Miscellaneous | 64,809 | |
| Total expenses before reductions | 74,089,165 | |
| Expense reductions | (1,380,498) | 72,708,667 |
| Net investment income (loss) | 93,239,142 | |
| Realized and Unrealized Gain (Loss) | ||
| Net realized gain (loss) on: | ||
| Investment securities: | ||
| Unaffiliated issuers | 1,362,078,187 | |
| Fidelity Central Funds | 29,332 | |
| Foreign currency transactions | (426,366) | |
| Total net realized gain (loss) | 1,361,681,153 | |
| Change in net unrealized appreciation (depreciation) on: | ||
| Investment securities: | ||
| Unaffiliated issuers (net of increase in deferred foreign taxes of $1,538,682) | (1,251,376,425) | |
| Fidelity Central Funds | (20,419) | |
| Assets and liabilities in foreign currencies | 306,194 | |
| Total change in net unrealized appreciation (depreciation) | (1,251,090,650) | |
| Net gain (loss) | 110,590,503 | |
| Net increase (decrease) in net assets resulting from operations | $203,829,645 |
See accompanying notes which are an integral part of the financial statements.
Statement of Changes in Net Assets
| Six months ended April 30, 2018 (Unaudited) | Year ended October 31, 2017 | |
| Increase (Decrease) in Net Assets | ||
| Operations | ||
| Net investment income (loss) | $93,239,142 | $220,004,102 |
| Net realized gain (loss) | 1,361,681,153 | 1,655,511,842 |
| Change in net unrealized appreciation (depreciation) | (1,251,090,650) | 1,955,253,295 |
| Net increase (decrease) in net assets resulting from operations | 203,829,645 | 3,830,769,239 |
| Distributions to shareholders from net investment income | (209,711,405) | (223,211,879) |
| Distributions to shareholders from net realized gain | (782,565,744) | (38,126,771) |
| Total distributions | (992,277,149) | (261,338,650) |
| Share transactions - net increase (decrease) | (1,678,892,929) | (3,320,742,656) |
| Redemption fees | – | 26,003 |
| Total increase (decrease) in net assets | (2,467,340,433) | 248,713,936 |
| Net Assets | ||
| Beginning of period | 19,848,373,292 | 19,599,659,356 |
| End of period | $17,381,032,859 | $19,848,373,292 |
| Other Information | ||
| Undistributed net investment income end of period | $82,108,287 | $198,580,550 |
See accompanying notes which are an integral part of the financial statements.
Financial Highlights
Fidelity Diversified International Fund
| Six months ended (Unaudited) April 30, | Years endedOctober 31, | |||||
| 2018 | 2017 | 2016 | 2015 | 2014 | 2013 | |
| Selected Per–Share Data | ||||||
| Net asset value, beginning of period | $41.39 | $34.28 | $36.07 | $36.22 | $35.89 | $29.07 |
| Income from Investment Operations | ||||||
| Net investment income (loss)A | .19 | .41 | .39 | .36 | .60B | .44 |
| Net realized and unrealized gain (loss) | .17 | 7.15 | (1.71) | .80 | .28 | 6.90 |
| Total from investment operations | .36 | 7.56 | (1.32) | 1.16 | .88 | 7.34 |
| Distributions from net investment income | (.43) | (.38) | (.33)C | (.40) | (.32) | (.46) |
| Distributions from net realized gain | (1.69) | (.07) | (.14)C | (.92) | (.23) | (.07) |
| Total distributions | (2.12) | (.45) | (.47) | (1.31)D | (.55) | (.52)E |
| Redemption fees added to paid in capitalA | – | –F | –F | –F | –F | –F |
| Net asset value, end of period | $39.63 | $41.39 | $34.28 | $36.07 | $36.22 | $35.89 |
| Total ReturnG,H | .91% | 22.38% | (3.70)% | 3.29% | 2.48% | 25.66% |
| Ratios to Average Net AssetsI,J | ||||||
| Expenses before reductions | .84%K | .94% | 1.05% | 1.00% | .93% | .94% |
| Expenses net of fee waivers, if any | .84%K | .94% | 1.05% | .99% | .93% | .94% |
| Expenses net of all reductions | .82%K | .93% | 1.05% | .99% | .92% | .92% |
| Net investment income (loss) | .95%K | 1.10% | 1.15% | .98% | 1.65%B | 1.38% |
| Supplemental Data | ||||||
| Net assets, end of period (000 omitted) | $10,747,538 | $11,349,633 | $10,990,703 | $13,059,983 | $13,781,306 | $14,432,586 |
| Portfolio turnover rateL | 34%K,M | 37%M | 24%M | 31%M | 39%M | 52% |
A Calculated based on average shares outstanding during the period.
B Net Investment income per share reflects a large, non-recurring dividend which amounted to $.18 per share. Excluding this non-recurring dividend, the ratio of net investment income (loss) to average net assets would have been 1.16%.
C The amounts shown reflect certain reclassifications related to book to tax differences that were made in the year shown.
D Total distributions of $1.31 per share is comprised of distributions from net investment income of $.397 and distributions from net realized gain of $.917 per share.
E Total distributions of $.52 per share is comprised of distributions from net investment income of $.456 and distributions from net realized gain of $.068 per share.
F Amount represents less than $.005 per share.
G Total returns for periods of less than one year are not annualized.
H Total returns would have been lower if certain expenses had not been reduced during the applicable periods shown.
I Fees and expenses of any underlying Fidelity Central Funds are not included in the Fund's expense ratio. The Fund indirectly bears its proportionate share of the expenses of any underlying Fidelity Central Funds.
J Expense ratios reflect operating expenses of the class. Expenses before reductions do not reflect amounts reimbursed by the investment adviser or reductions from brokerage service arrangements or reductions from other expense offset arrangements and do not represent the amount paid by the class during periods when reimbursements or reductions occur. Expenses net of fee waivers reflect expenses after reimbursement by the investment adviser but prior to reductions from brokerage service arrangements or other expense offset arrangements. Expenses net of all reductions represent the net expenses paid by the class.
K Annualized
L Amount does not include the portfolio activity of any underlying Fidelity Central Funds.
M Portfolio turnover rate excludes securities received or delivered in-kind.
See accompanying notes which are an integral part of the financial statements.
Fidelity Diversified International Fund Class K
| Six months ended (Unaudited) April 30, | Years endedOctober 31, | |||||
| 2018 | 2017 | 2016 | 2015 | 2014 | 2013 | |
| Selected Per–Share Data | ||||||
| Net asset value, beginning of period | $41.35 | $34.25 | $36.04 | $36.20 | $35.87 | $29.06 |
| Income from Investment Operations | ||||||
| Net investment income (loss)A | .22 | .45 | .44 | .40 | .65B | .49 |
| Net realized and unrealized gain (loss) | .16 | 7.15 | (1.71) | .80 | .28 | 6.90 |
| Total from investment operations | .38 | 7.60 | (1.27) | 1.20 | .93 | 7.39 |
| Distributions from net investment income | (.48) | (.43) | (.38)C | (.45) | (.37) | (.51) |
| Distributions from net realized gain | (1.69) | (.07) | (.14)C | (.92) | (.23) | (.07) |
| Total distributions | (2.17) | (.50) | (.52) | (1.36)D | (.60) | (.58) |
| Redemption fees added to paid in capitalA | – | –E | –E | –E | –E | –E |
| Net asset value, end of period | $39.56 | $41.35 | $34.25 | $36.04 | $36.20 | $35.87 |
| Total ReturnF,G | .95% | 22.55% | (3.57)% | 3.40% | 2.63% | 25.86% |
| Ratios to Average Net AssetsH,I | ||||||
| Expenses before reductions | .72%J | .82% | .92% | .87% | .80% | .80% |
| Expenses net of fee waivers, if any | .72%J | .81% | .92% | .87% | .80% | .80% |
| Expenses net of all reductions | .71%J | .81% | .92% | .86% | .79% | .78% |
| Net investment income (loss) | 1.07%J | 1.22% | 1.28% | 1.10% | 1.78%B | 1.52% |
| Supplemental Data | ||||||
| Net assets, end of period (000 omitted) | $6,633,495 | $8,498,740 | $8,608,956 | $10,143,540 | $11,134,431 | $11,541,599 |
| Portfolio turnover rateK | 34%J,L | 37%L | 24%L | 31%L | 39%L | 52% |
A Calculated based on average shares outstanding during the period.
B Net Investment income per share reflects a large, non-recurring dividend which amounted to $.18 per share. Excluding this non-recurring dividend, the ratio of net investment income (loss) to average net assets would have been 1.29%.
C The amounts shown reflect certain reclassifications related to book to tax differences that were made in the year shown.
D Total distributions of $1.36 per share is comprised of distributions from net investment income of $.446 and distributions from net realized gain of $.917 per share.
E Amount represents less than $.005 per share.
F Total returns for periods of less than one year are not annualized.
G Total returns would have been lower if certain expenses had not been reduced during the applicable periods shown.
H Fees and expenses of any underlying Fidelity Central Funds are not included in the Fund's expense ratio. The Fund indirectly bears its proportionate share of the expenses of any underlying Fidelity Central Funds.
I Expense ratios reflect operating expenses of the class. Expenses before reductions do not reflect amounts reimbursed by the investment adviser or reductions from brokerage service arrangements or reductions from other expense offset arrangements and do not represent the amount paid by the class during periods when reimbursements or reductions occur. Expenses net of fee waivers reflect expenses after reimbursement by the investment adviser but prior to reductions from brokerage service arrangements or other expense offset arrangements. Expenses net of all reductions represent the net expenses paid by the class.
J Annualized
K Amount does not include the portfolio activity of any underlying Fidelity Central Funds.
L Portfolio turnover rate excludes securities received or delivered in-kind.
See accompanying notes which are an integral part of the financial statements.
Notes to Financial Statements (Unaudited)
For the period ended April 30, 2018
1. Organization.
Fidelity Diversified International Fund (the Fund) is a fund of Fidelity Investment Trust (the Trust) and is authorized to issue an unlimited number of shares. The Trust is registered under the Investment Company Act of 1940, as amended (the 1940 Act), as an open-end management investment company organized as a Massachusetts business trust. The Fund offers Diversified International and Class K shares, each of which has equal rights as to assets and voting privileges. Each class has exclusive voting rights with respect to matters that affect that class. The Fund's investments in emerging markets can be subject to social, economic, regulatory, and political uncertainties and can be extremely volatile.
2. Investments in Fidelity Central Funds.
The Fund invests in Fidelity Central Funds, which are open-end investment companies generally available only to other investment companies and accounts managed by the investment adviser and its affiliates. The Fund's Schedule of Investments lists each of the Fidelity Central Funds held as of period end, if any, as an investment of the Fund, but does not include the underlying holdings of each Fidelity Central Fund. As an Investing Fund, the Fund indirectly bears its proportionate share of the expenses of the underlying Fidelity Central Funds.
The Money Market Central Funds seek preservation of capital and current income and are managed by Fidelity Investments Money Management, Inc. (FIMM), an affiliate of the investment adviser. Annualized expenses of the Money Market Central Funds as of their most recent shareholder report date are less than .005%.
A complete unaudited list of holdings for each Fidelity Central Fund is available upon request or at the Securities and Exchange Commission (the SEC) website at www.sec.gov. In addition, the financial statements of the Fidelity Central Funds are available on the SEC website or upon request.
3. Significant Accounting Policies.
The Fund is an investment company and applies the accounting and reporting guidance of the Financial Accounting Standards Board (FASB) Accounting Standards Codification Topic 946 Financial Services – Investments Companies. The financial statements have been prepared in conformity with accounting principles generally accepted in the United States of America (GAAP), which require management to make certain estimates and assumptions at the date of the financial statements. Actual results could differ from those estimates. Subsequent events, if any, through the date that the financial statements were issued have been evaluated in the preparation of the financial statements. The following summarizes the significant accounting policies of the Fund:
Investment Valuation. Investments are valued as of 4:00 p.m. Eastern time on the last calendar day of the period. The Board of Trustees (the Board) has delegated the day to day responsibility for the valuation of the Fund's investments to the Fair Value Committee (the Committee) established by the Fund's investment adviser. In accordance with valuation policies and procedures approved by the Board, the Fund attempts to obtain prices from one or more third party pricing vendors or brokers to value its investments. When current market prices, quotations or currency exchange rates are not readily available or reliable, investments will be fair valued in good faith by the Committee, in accordance with procedures adopted by the Board. Factors used in determining fair value vary by investment type and may include market or investment specific events. The frequency with which these procedures are used cannot be predicted and they may be utilized to a significant extent. The Committee oversees the Fund's valuation policies and procedures and reports to the Board on the Committee's activities and fair value determinations. The Board monitors the appropriateness of the procedures used in valuing the Fund's investments and ratifies the fair value determinations of the Committee.
The Fund categorizes the inputs to valuation techniques used to value its investments into a disclosure hierarchy consisting of three levels as shown below:
- Level 1 – quoted prices in active markets for identical investments
- Level 2 – other significant observable inputs (including quoted prices for similar investments, interest rates, prepayment speeds, etc.)
- Level 3 – unobservable inputs (including the Fund's own assumptions based on the best information available)
Valuation techniques used to value the Fund's investments by major category are as follows:
Equity securities, including restricted securities, for which market quotations are readily available, are valued at the last reported sale price or official closing price as reported by a third party pricing vendor on the primary market or exchange on which they are traded and are categorized as Level 1 in the hierarchy. In the event there were no sales during the day or closing prices are not available, securities are valued at the last quoted bid price or may be valued using the last available price and are generally categorized as Level 2 in the hierarchy. For foreign equity securities, when market or security specific events arise, comparisons to the valuation of American Depositary Receipts (ADRs), futures contracts, Exchange-Traded Funds (ETFs) and certain indexes as well as quoted prices for similar securities may be used and would be categorized as Level 2 in the hierarchy. Utilizing these techniques may result in transfers between Level 1 and Level 2. For equity securities, including restricted securities, where observable inputs are limited, assumptions about market activity and risk are used and these securities may be categorized as Level 3 in the hierarchy.
Investments in open-end mutual funds, including the Fidelity Central Funds, are valued at their closing net asset value (NAV) each business day and are categorized as Level 1 in the hierarchy.
Changes in valuation techniques may result in transfers in or out of an assigned level within the disclosure hierarchy. The aggregate value of investments by input level as of April 30, 2018, including information on transfers between Levels 1 and 2 is included at the end of the Fund's Schedule of Investments.
Foreign Currency. The Fund may use foreign currency contracts to facilitate transactions in foreign-denominated securities. Gains and losses from these transactions may arise from changes in the value of the foreign currency or if the counterparties do not perform under the contracts' terms.
Foreign-denominated assets, including investment securities, and liabilities are translated into U.S. dollars at the exchange rates at period end. Purchases and sales of investment securities, income and dividends received and expenses denominated in foreign currencies are translated into U.S. dollars at the exchange rate in effect on the transaction date.
The effects of exchange rate fluctuations on investments are included with the net realized and unrealized gain (loss) on investment securities. Other foreign currency transactions resulting in realized and unrealized gain (loss) are disclosed separately.
Investment Transactions and Income. For financial reporting purposes, the Fund's investment holdings and NAV include trades executed through the end of the last business day of the period. The NAV per share for processing shareholder transactions is calculated as of the close of business of the New York Stock Exchange (NYSE), normally 4:00 p.m. Eastern time and includes trades executed through the end of the prior business day. Gains and losses on securities sold are determined on the basis of identified cost and includes proceeds received from litigation. Dividend income is recorded on the ex-dividend date, except for certain dividends from foreign securities where the ex-dividend date may have passed, which are recorded as soon as the Fund is informed of the ex-dividend date. Non-cash dividends included in dividend income, if any, are recorded at the fair market value of the securities received. Income and capital gain distributions from Fidelity Central Funds, if any, are recorded on the ex-dividend date. Certain distributions received by the Fund represent a return of capital or capital gain. The Fund determines the components of these distributions subsequent to the ex-dividend date, based upon receipt of tax filings or other correspondence relating to the underlying investment. These distributions are recorded as a reduction of cost of investments and/or as a realized gain. Investment income is recorded net of foreign taxes withheld where recovery of such taxes is uncertain.
Class Allocations and Expenses. Investment income, realized and unrealized capital gains and losses, common expenses of the Fund, and certain fund-level expense reductions, if any, are allocated daily on a pro-rata basis to each class based on the relative net assets of each class to the total net assets of the Fund. Each class differs with respect to transfer agent fees incurred. Certain expense reductions may also differ by class. For the reporting period, the allocated portion of income and expenses to each class as a percent of its average net assets may vary due to the timing of recording these transactions in relation to fluctuating net assets of the classes. Expenses directly attributable to a fund are charged to that fund. Expenses attributable to more than one fund are allocated among the respective funds on the basis of relative net assets or other appropriate methods. Expense estimates are accrued in the period to which they relate and adjustments are made when actual amounts are known.
Deferred Trustee Compensation. Under a Deferred Compensation Plan (the Plan), certain independent Trustees have elected to defer receipt of a portion of their annual compensation. Deferred amounts are invested in a cross-section of Fidelity funds, are marked-to-market and remain in the Fund until distributed in accordance with the Plan. The investment of deferred amounts and the offsetting payable to the Trustees are included in the accompanying Statement of Assets and Liabilities.
Income Tax Information and Distributions to Shareholders. Each year, the Fund intends to qualify as a regulated investment company under Subchapter M of the Internal Revenue Code, including distributing substantially all of its taxable income and realized gains. As a result, no provision for U.S. Federal income taxes is required. The Fund files a U.S. federal tax return, in addition to state and local tax returns as required. The Fund's federal income tax returns are subject to examination by the Internal Revenue Service (IRS) for a period of three fiscal years after they are filed. State and local tax returns may be subject to examination for an additional fiscal year depending on the jurisdiction. Foreign taxes are provided for based on the Fund's understanding of the tax rules and rates that exist in the foreign markets in which it invests. The Fund is subject to a tax imposed on capital gains by certain countries in which it invests. An estimated deferred tax liability for net unrealized appreciation on the applicable securities is included in Other payables and accrued expenses on the Statement of Assets & Liabilities.
Distributions are declared and recorded on the ex-dividend date. Income and capital gain distributions are declared separately for each class. Income and capital gain distributions are determined in accordance with income tax regulations, which may differ from GAAP.
Capital accounts within the financial statements are adjusted for permanent book-tax differences. These adjustments have no impact on net assets or the results of operations. Capital accounts are not adjusted for temporary book-tax differences which will reverse in a subsequent period.
Book-tax differences are primarily due to foreign currency transactions, passive foreign investment companies (PFIC), redemptions in kind, deferred trustees compensation, capital loss carryforwards and losses deferred due to wash sales.
As of period end, the cost and unrealized appreciation (depreciation) in securities, and derivatives if applicable, for federal income tax purposes were as follows:
| Gross unrealized appreciation | $4,572,292,511 |
| Gross unrealized depreciation | (417,873,212) |
| Net unrealized appreciation (depreciation) | $4,154,419,299 |
| Tax cost | $13,324,905,920 |
Delayed Delivery Transactions and When-Issued Securities. During the period, the Fund transacted in securities on a delayed delivery or when-issued basis. Payment and delivery may take place after the customary settlement period for that security. The price of the underlying securities and the date when the securities will be delivered and paid for are fixed at the time the transaction is negotiated. The securities purchased on a delayed delivery or when-issued basis are identified as such in the Fund's Schedule of Investments. Losses may arise due to changes in the value of the underlying securities or if the counterparty does not perform under the contract's terms, or if the issuer does not issue the securities due to political, economic, or other factors.
Restricted Securities. The Fund may invest in securities that are subject to legal or contractual restrictions on resale. These securities generally may be resold in transactions exempt from registration or to the public if the securities are registered. Disposal of these securities may involve time-consuming negotiations and expense, and prompt sale at an acceptable price may be difficult. Information regarding restricted securities is included at the end of the Fund's Schedule of Investments.
4. Purchases and Sales of Investments.
Purchases and sales of securities, other than short-term securities and in-kind transactions, aggregated $3,124,596,570 and $4,036,479,910, respectively.
Redemptions In-Kind. During the period, 41,282,842 shares of the Fund held by unaffiliated entities were redeemed in-kind for investments and cash with a value of $1,673,294,063. The net realized gain of $617,019,956 on investments delivered through the in-kind redemptions is included in the accompanying Statement of Operations. The amount of the redemptions is included in share transactions activity shown in the accompanying Statement of Changes in Net Assets as well as the Notes to Financial Statements. The Fund recognized no gain or loss for federal income tax purposes.
Prior Fiscal Year Redemptions In-Kind. During the prior period, 42,309,077 shares of the Fund held by an unaffiliated entity were redeemed in-kind for investments and cash with a value of $1,506,770,841. The Fund had a net realized gain of $488,334,715 on investments delivered through the in-kind redemptions. The amount of the redemptions is included in share transactions activity shown in the accompanying Statement of Changes in Net Assets as well as the Notes to Financial Statements. The Fund recognized no gain or loss for federal income tax purposes.
5. Fees and Other Transactions with Affiliates.
Management Fee. Fidelity Management & Research Company (the investment adviser) and its affiliates provide the Fund with investment management related services for which the Fund pays a monthly management fee. The management fee is the sum of an individual fund fee rate that is based on an annual rate of .424% of the Fund's average net assets and an annualized group fee rate that averaged .24% during the period. The group fee rate is based upon the average net assets of all the mutual funds advised by the investment adviser, including any mutual funds previously advised by the investment adviser that are currently advised by Fidelity SelectCo, LLC, an affiliate of the investment adviser. The group fee rate decreases as assets under management increase and increases as assets under management decrease. In addition, the management fee is subject to a performance adjustment (up to a maximum of +/- .20% of the Fund's average net assets over a 36 month performance period). The upward or downward adjustment to the management fee is based on the relative investment performance of Diversified International as compared to its benchmark index, the MSCI EAFE Index, over the same 36 month performance period. For the reporting period, the total annualized management fee rate, including the performance adjustment, was .65% of the Fund's average net assets. The performance adjustment included in the management fee rate may be higher or lower than the maximum performance adjustment rate due to the difference between the average net assets for the reporting and performance periods.
Transfer Agent Fees. Fidelity Investments Institutional Operations Company, Inc., (FIIOC), an affiliate of the investment adviser, is the transfer, dividend disbursing and shareholder servicing agent for each class of the Fund. FIIOC receives account fees and asset-based fees that vary according to the account size and type of account of the shareholders of Diversified International. FIIOC receives an asset-based fee of Class K's average net assets. FIIOC pays for typesetting, printing and mailing of shareholder reports, except proxy statements.
For the period, transfer agent fees for each class were as follows:
| Amount | % of Class-Level Average Net Assets(a) | |
| Diversified International | $9,103,534 | .16 |
| Class K | 1,677,750 | .05 |
| $10,781,284 |
(a) Annualized
Accounting and Security Lending Fees. Fidelity Service Company, Inc. (FSC), an affiliate of the investment adviser, maintains the Fund's accounting records. The accounting fee is based on the level of average net assets for each month. Under a separate contract, FSC administers the security lending program. The security lending fee is based on the number and duration of lending transactions. For the period, the fees were equivalent to an annualized rate of .01%.
Brokerage Commissions. The Fund placed a portion of its portfolio transactions with brokerage firms which are affiliates of the investment adviser. Brokerage commissions are included in net realized gain (loss) and change in net unrealized appreciation (depreciation) in the Statement of Operations. The commissions paid to these affiliated firms were $19,129 for the period.
Interfund Trades. The Fund may purchase from or sell securities to other Fidelity Funds under procedures adopted by the Board. The procedures have been designed to ensure these interfund trades are executed in accordance with Rule 17a-7 of the 1940 Act. Interfund trades are included within the respective purchases and sales amounts shown in the Purchases and Sales of Investments note.
Prior Fiscal Year Redemptions In-Kind. During the prior period, 6,219,500 shares of the Fund held by an affiliated entity were redeemed in-kind for investments and cash, including accrued interest, with a value of $252,875,067. The Fund had a net realized gain of $95,146,213 on investments delivered through in-kind redemptions. The amount of the in-kind redemptions is included in share transactions in the accompanying Statement of Changes in Net Assets as well as the Notes to Financial Statements. The Fund recognized no gain or loss for federal income tax purposes.
6. Committed Line of Credit.
The Fund participates with other funds managed by the investment adviser or an affiliate in a $4.25 billion credit facility (the "line of credit") to be utilized for temporary or emergency purposes to fund shareholder redemptions or for other short-term liquidity purposes. The Fund has agreed to pay commitment fees on its pro-rata portion of the line of credit, which amounted to $27,372 and is reflected in Miscellaneous expenses on the Statement of Operations. During the period, the Fund did not borrow on this line of credit.
7. Security Lending.
The Fund lends portfolio securities through a lending agent from time to time in order to earn additional income. For equity securities, a lending agent is used and may loan securities to certain qualified borrowers, including Fidelity Capital Markets (FCM), a broker-dealer affiliated with the Fund. On the settlement date of the loan, the Fund receives collateral (in the form of U.S. Treasury obligations, letters of credit and/or cash) against the loaned securities and maintains collateral in an amount not less than 100% of the market value of the loaned securities during the period of the loan. The market value of the loaned securities is determined at the close of business of the Fund and any additional required collateral is delivered to the Fund on the next business day. The Fund or borrower may terminate the loan at any time, and if the borrower defaults on its obligation to return the securities loaned because of insolvency or other reasons, the Fund may apply collateral received from the borrower against the obligation. The Fund may experience delays and costs in recovering the securities loaned. Any cash collateral received is invested in the Fidelity Securities Lending Cash Central Fund. The value of loaned securities and cash collateral at period end are disclosed on the Fund's Statement of Assets and Liabilities. Security lending income represents the income earned on investing cash collateral, less rebates paid to borrowers and any lending agent fees associated with the loan, plus any premium payments received for lending certain types of securities. Security lending income is presented in the Statement of Operations as a component of income from Fidelity Central Funds. Total security lending income during the period amounted to $2,026,468. During the period, there were no securities loaned to FCM.
8. Expense Reductions.
Commissions paid to certain brokers with whom the investment adviser, or its affiliates, places trades on behalf of the Fund include an amount in addition to trade execution, which may be rebated back to the Fund to offset certain expenses. This amount totaled $1,282,915 for the period. In addition, through arrangements with the Fund's custodian, credits realized as a result of certain uninvested cash balances were used to reduce the Fund's expenses. During the period, these credits reduced the Fund's expenses by $2,069.
In addition, during the period the investment adviser reimbursed and/or waived a portion of fund-level operating expenses in the amount of $95,514.
9. Distributions to Shareholders.
Distributions to shareholders of each class were as follows:
| Six months ended April 30, 2018 | Year ended October 31, 2017 | |
| From net investment income | ||
| Diversified International | $118,100,193 | $117,261,561 |
| Class K | 91,611,212 | 105,950,318 |
| Total | $209,711,405 | $223,211,879 |
| From net realized gain | ||
| Diversified International | $460,399,805 | $21,125,448 |
| Class K | 322,165,939 | 17,001,323 |
| Total | $782,565,744 | $38,126,771 |
10. Share Transactions.
Share transactions for each class were as follows and may contain automatic conversions between classes or exchanges between affiliated funds:
| Shares | Shares | Dollars | Dollars | |
| Six months ended April 30, 2018 | Year ended October 31, 2017 | Six months ended April 30, 2018 | Year ended October 31, 2017 | |
| Diversified International | ||||
| Shares sold | 13,800,112 | 29,659,523 | $559,474,048 | $1,086,343,758 |
| Reinvestment of distributions | 13,661,964 | 3,851,054 | 537,871,482 | 128,009,018 |
| Shares redeemed | (30,453,746)(a) | (79,920,304)(b) | (1,232,324,010)(a) | (2,857,242,109)(b) |
| Net increase (decrease) | (2,991,670) | (46,409,727) | $(134,978,480) | $(1,642,889,333) |
| Class K | ||||
| Shares sold | 17,845,469 | 40,529,599 | $722,789,417 | $1,505,583,540 |
| Reinvestment of distributions | 10,532,806 | 3,707,830 | 413,728,634 | 122,951,641 |
| Shares redeemed | (66,255,185)(a) | (90,053,301)(b) | (2,680,432,500)(a) | (3,306,388,504)(b) |
| Net increase (decrease) | (37,876,910) | (45,815,872) | $(1,543,914,449) | $(1,677,853,323) |
(a) Amount includes in-kind redemptions (see the Redemptions In-Kind note for additional details).
(b) Amount includes in-kind redemptions (see the prior Redemptions In-Kind note for additional details).
11. Other.
The Fund's organizational documents provide former and current trustees and officers with a limited indemnification against liabilities arising in connection with the performance of their duties to the Fund. In the normal course of business, the Fund may also enter into contracts that provide general indemnifications. The Fund's maximum exposure under these arrangements is unknown as this would be dependent on future claims that may be made against the Fund. The risk of material loss from such claims is considered remote.
Fidelity® International Capital Appreciation Fund
Investment Summary (Unaudited)
Geographic Diversification (% of fund's net assets)
| As of April 30, 2018 | ||
| United States of America* | 15.7% | |
| France | 8.7% | |
| United Kingdom | 8.0% | |
| Japan | 7.6% | |
| Germany | 6.3% | |
| Cayman Islands | 6.2% | |
| India | 4.7% | |
| China | 4.4% | |
| Netherlands | 4.4% | |
| Other | 34.0% | |

* Includes Short-Term investments and Net Other Assets (Liabilities).
Percentages are based on country or territory of incorporation and are adjusted for the effect of futures contracts, if applicable.
Asset Allocation as of April 30, 2018
| % of fund's net assets | |
| Stocks | 99.0 |
| Short-Term Investments and Net Other Assets (Liabilities) | 1.0 |
Top Ten Stocks as of April 30, 2018
| % of fund's net assets | |
| Tencent Holdings Ltd. (Cayman Islands, Internet Software & Services) | 1.8 |
| Alibaba Group Holding Ltd. sponsored ADR (Cayman Islands, Internet Software & Services) | 1.5 |
| Taiwan Semiconductor Manufacturing Co. Ltd. sponsored ADR (Taiwan, Semiconductors & Semiconductor Equipment) | 1.4 |
| AIA Group Ltd. (Hong Kong, Insurance) | 1.0 |
| Naspers Ltd. Class N (South Africa, Media) | 1.0 |
| LVMH Moet Hennessy - Louis Vuitton SA (France, Textiles, Apparel & Luxury Goods) | 1.0 |
| Allianz SE (Germany, Insurance) | 1.0 |
| Prudential PLC (United Kingdom, Insurance) | 0.8 |
| ASML Holding NV (Netherlands) (Netherlands, Semiconductors & Semiconductor Equipment) | 0.8 |
| Keyence Corp. (Japan, Electronic Equipment & Components) | 0.8 |
| 11.1 |
Top Market Sectors as of April 30, 2018
| % of fund's net assets | |
| Financials | 21.4 |
| Industrials | 20.2 |
| Information Technology | 19.9 |
| Consumer Discretionary | 15.7 |
| Materials | 6.5 |
| Consumer Staples | 6.4 |
| Health Care | 4.0 |
| Real Estate | 2.7 |
| Utilities | 1.0 |
| Energy | 0.7 |
Fidelity® International Capital Appreciation Fund
Schedule of Investments April 30, 2018 (Unaudited)
Showing Percentage of Net Assets
| Common Stocks - 97.7% | |||
| Shares | Value | ||
| Argentina - 0.5% | |||
| Banco Macro SA sponsored ADR | 120,167 | $11,646,586 | |
| Australia - 2.9% | |||
| Amcor Ltd. | 1,173,699 | 12,094,938 | |
| Aristocrat Leisure Ltd. | 709,429 | 14,231,555�� | |
| Challenger Ltd. | 1,461,101 | 11,812,955 | |
| CSL Ltd. | 141,676 | 18,147,144 | |
| realestate.com.au Ltd. | 198,116 | 11,994,292 | |
| TOTAL AUSTRALIA | 68,280,884 | ||
| Bailiwick of Jersey - 0.6% | |||
| Wolseley PLC | 182,354 | 14,008,409 | |
| Belgium - 1.7% | |||
| Ageas | 226,500 | 12,158,026 | |
| KBC Groep NV | 155,508 | 13,596,102 | |
| Umicore SA | 238,027 | 13,297,039 | |
| TOTAL BELGIUM | 39,051,167 | ||
| Bermuda - 1.1% | |||
| Credicorp Ltd. (United States) | 58,452 | 13,589,505 | |
| Hiscox Ltd. | 570,312 | 11,690,862 | |
| TOTAL BERMUDA | 25,280,367 | ||
| Brazil - 1.6% | |||
| BM&F BOVESPA SA | 1,813,800 | 13,099,206 | |
| CVC Brasil Operadora e Agencia de Viagens SA | 659,300 | 10,913,681 | |
| Equatorial Energia SA | 618,000 | 12,551,581 | |
| Itausa-Investimentos Itau SA | 68,231 | 262,936 | |
| TOTAL BRAZIL | 36,827,404 | ||
| Canada - 3.7% | |||
| Brookfield Asset Management, Inc. Class A | 375,514 | 14,883,685 | |
| Canadian National Railway Co. | 233,284 | 18,018,439 | |
| Canadian Pacific Railway Ltd. | 78,411 | 14,307,511 | |
| CCL Industries, Inc. Class B | 254,532 | 12,346,472 | |
| Constellation Software, Inc. | 18,809 | 13,442,660 | |
| Waste Connection, Inc. (Canada) | 162,659 | 11,756,498 | |
| TOTAL CANADA | 84,755,265 | ||
| Cayman Islands - 6.2% | |||
| Alibaba Group Holding Ltd. sponsored ADR (a) | 190,245 | 33,966,342 | |
| JD.com, Inc. sponsored ADR (a) | 390,417 | 14,254,125 | |
| Melco Crown Entertainment Ltd. sponsored ADR | 395,283 | 12,336,782 | |
| New Oriental Education & Technology Group, Inc. sponsored ADR | 142,167 | 12,772,283 | |
| Sands China Ltd. | 2,426,000 | 14,020,780 | |
| Shenzhou International Group Holdings Ltd. | 1,211,000 | 13,219,562 | |
| Tencent Holdings Ltd. | 856,000 | 42,083,463 | |
| TOTAL CAYMAN ISLANDS | 142,653,337 | ||
| Chile - 0.5% | |||
| Banco Santander Chile sponsored ADR | 345,115 | 11,399,148 | |
| China - 4.4% | |||
| China International Travel Service Corp. Ltd. (A Shares) | 1,439,100 | 11,764,962 | |
| Hangzhou Hikvision Digital Technology Co. Ltd. Class A | 1,857,800 | 11,252,476 | |
| Inner Mongoli Yili Industries Co. Ltd. (A Shares) | 2,954,100 | 12,231,227 | |
| Jiangsu Yanghe Brewery Joint-Stock Co. Ltd. Class A | 711,139 | 12,530,520 | |
| Kweichow Moutai Co. Ltd. (A Shares) | 113,400 | 11,808,231 | |
| Midea Group Co. Ltd. Class A | 1,476,600 | 12,005,572 | |
| Ping An Insurance (Group) Co. of China Ltd. (H Shares) | 1,793,500 | 17,525,006 | |
| Shanghai International Airport Co. Ltd. (A Shares) | 1,647,200 | 12,937,346 | |
| TOTAL CHINA | 102,055,340 | ||
| Denmark - 0.6% | |||
| DSV de Sammensluttede Vognmaend A/S | 170,400 | 13,541,521 | |
| Finland - 0.6% | |||
| Sampo Oyj (A Shares) | 260,700 | 14,088,254 | |
| France - 8.7% | |||
| Aeroports de Paris | 54,042 | 11,903,628 | |
| Capgemini SA | 103,000 | 14,179,639 | |
| Dassault Systemes SA | 96,226 | 12,462,720 | |
| Eiffage SA | 111,234 | 13,257,994 | |
| Kering SA (b) | 28,715 | 16,630,722 | |
| Legrand SA | 178,249 | 13,883,850 | |
| LVMH Moet Hennessy - Louis Vuitton SA (b) | 65,079 | 22,648,283 | |
| Orpea | 95,565 | 12,273,247 | |
| Pernod Ricard SA | 92,885 | 15,428,698 | |
| Rubis | 155,828 | 12,137,474 | |
| Safran SA | 123,500 | 14,485,337 | |
| SR Teleperformance SA | 80,894 | 12,982,681 | |
| Thales SA | 100,733 | 12,772,743 | |
| VINCI SA (b) | 171,914 | 17,188,598 | |
| TOTAL FRANCE | 202,235,614 | ||
| Germany - 6.3% | |||
| adidas AG | 64,282 | 15,828,134 | |
| Allianz SE | 94,895 | 22,444,935 | |
| CTS Eventim AG | 244,660 | 11,475,333 | |
| Deutsche Borse AG | 107,700 | 14,484,476 | |
| Deutsche Wohnen AG (Bearer) | 294,400 | 13,914,953 | |
| Hannover Reuck SE | 85,100 | 11,982,604 | |
| Infineon Technologies AG | 559,200 | 14,318,717 | |
| Symrise AG | 164,200 | 13,305,119 | |
| Vonovia SE | 286,800 | 14,411,194 | |
| Wirecard AG | 104,111 | 14,219,435 | |
| TOTAL GERMANY | 146,384,900 | ||
| Hong Kong - 2.2% | |||
| AIA Group Ltd. | 2,636,200 | 23,560,247 | |
| Galaxy Entertainment Group Ltd. | 1,593,000 | 13,942,943 | |
| Techtronic Industries Co. Ltd. | 2,201,500 | 12,896,809 | |
| TOTAL HONG KONG | 50,399,999 | ||
| India - 4.7% | |||
| Adani Ports & Special Economic Zone Ltd. | 2,039,306 | 12,474,612 | |
| Eicher Motors Ltd. | 28,009 | 13,086,544 | |
| HDFC Bank Ltd. | 393,382 | 11,856,460 | |
| Housing Development Finance Corp. Ltd. | 584,735 | 16,543,921 | |
| IndusInd Bank Ltd. | 423,271 | 12,040,328 | |
| Kotak Mahindra Bank Ltd. (a) | 693,894 | 12,617,695 | |
| Maruti Suzuki India Ltd. | 97,356 | 12,870,745 | |
| Reliance Industries Ltd. | 1,153,437 | 16,653,784 | |
| TOTAL INDIA | 108,144,089 | ||
| Indonesia - 1.1% | |||
| PT Bank Central Asia Tbk | 8,788,200 | 13,896,630 | |
| PT Bank Rakyat Indonesia Tbk | 53,551,700 | 12,347,334 | |
| TOTAL INDONESIA | 26,243,964 | ||
| Ireland - 2.2% | |||
| Accenture PLC Class A | 79,275 | 11,986,380 | |
| DCC PLC (United Kingdom) | 138,300 | 13,327,833 | |
| Kerry Group PLC Class A | 135,400 | 13,816,514 | |
| Kingspan Group PLC (Ireland) | 273,708 | 12,394,867 | |
| TOTAL IRELAND | 51,525,594 | ||
| Israel - 0.5% | |||
| Frutarom Industries Ltd. | 124,000 | 11,904,028 | |
| Italy - 0.5% | |||
| Pirelli & C. S.p.A. (c) | 1,353,100 | 11,771,362 | |
| Japan - 7.6% | |||
| Daikin Industries Ltd. | 133,200 | 15,602,141 | |
| Kansai Paint Co. Ltd. | 479,200 | 10,800,849 | |
| Kao Corp. | 217,000 | 15,592,161 | |
| Keyence Corp. | 30,220 | 18,512,929 | |
| Makita Corp. | 288,200 | 12,970,582 | |
| Misumi Group, Inc. | 453,600 | 12,572,338 | |
| Nidec Corp. | 98,300 | 15,412,203 | |
| Nissan Chemical Industries Co. Ltd. | 277,000 | 12,352,497 | |
| Nitori Holdings Co. Ltd. | 71,500 | 12,086,718 | |
| Recruit Holdings Co. Ltd. | 595,900 | 13,774,600 | |
| Relo Group, Inc. | 490,100 | 11,055,494 | |
| Sundrug Co. Ltd. | 257,800 | 13,276,747 | |
| Tsuruha Holdings, Inc. | 81,100 | 11,669,438 | |
| TOTAL JAPAN | 175,678,697 | ||
| Kenya - 0.5% | |||
| Safaricom Ltd. | 41,255,800 | 11,619,904 | |
| Korea (South) - 1.2% | |||
| LG Chemical Ltd. | 40,847 | 13,731,046 | |
| LG Household & Health Care Ltd. | 11,508 | 14,721,815 | |
| TOTAL KOREA (SOUTH) | 28,452,861 | ||
| Luxembourg - 0.6% | |||
| Eurofins Scientific SA | 23,503 | 12,709,559 | |
| Mexico - 0.5% | |||
| Grupo Aeroportuario del Sureste S.A.B. de CV Series B | 697,950 | 12,551,647 | |
| Netherlands - 4.4% | |||
| ASML Holding NV (Netherlands) | 98,560 | 18,745,816 | |
| Ferrari NV | 108,800 | 13,408,031 | |
| Heineken NV (Bearer) | 145,000 | 15,286,405 | |
| Interxion Holding N.V. (a) | 187,333 | 12,180,392 | |
| RELX NV | 781,312 | 16,619,970 | |
| Wolters Kluwer NV | 249,300 | 13,496,281 | |
| Yandex NV Series A (a) | 344,600 | 11,495,856 | |
| TOTAL NETHERLANDS | 101,232,751 | ||
| Philippines - 1.6% | |||
| Ayala Land, Inc. | 15,962,300 | 12,562,216 | |
| SM Investments Corp. | 695,279 | 12,591,973 | |
| SM Prime Holdings, Inc. | 18,458,200 | 12,182,691 | |
| TOTAL PHILIPPINES | 37,336,880 | ||
| South Africa - 2.6% | |||
| Capitec Bank Holdings Ltd. | 169,321 | 12,054,642 | |
| FirstRand Ltd. | 2,472,700 | 13,242,611 | |
| Naspers Ltd. Class N | 95,157 | 23,182,107 | |
| Sanlam Ltd. | 1,876,000 | 11,850,730 | |
| TOTAL SOUTH AFRICA | 60,330,090 | ||
| Spain - 0.6% | |||
| Amadeus IT Holding SA Class A | 201,200 | 14,748,226 | |
| Sweden - 0.5% | |||
| Hexagon AB (B Shares) | 215,000 | 12,472,806 | |
| Switzerland - 2.9% | |||
| Givaudan SA | 5,858 | 13,116,955 | |
| Julius Baer Group Ltd. | 215,990 | 12,818,655 | |
| Lonza Group AG | 57,580 | 14,188,735 | |
| Partners Group Holding AG | 17,637 | 12,929,647 | |
| Sika AG | 1,786 | 13,030,050 | |
| TOTAL SWITZERLAND | 66,084,042 | ||
| Taiwan - 1.4% | |||
| Taiwan Semiconductor Manufacturing Co. Ltd. sponsored ADR | 838,762 | 32,250,399 | |
| United Kingdom - 8.0% | |||
| Ashtead Group PLC | 458,800 | 12,841,037 | |
| Beazley PLC | 1,390,600 | 11,323,907 | |
| Bunzl PLC | 428,642 | 12,457,253 | |
| Compass Group PLC | 717,188 | 15,402,703 | |
| Croda International PLC | 200,600 | 12,319,766 | |
| Halma PLC | 721,300 | 12,144,558 | |
| Hargreaves Lansdown PLC | 520,200 | 12,815,671 | |
| InterContinental Hotel Group PLC | 215,727 | 13,628,934 | |
| Intertek Group PLC | 196,400 | 13,251,514 | |
| London Stock Exchange Group PLC | 235,600 | 13,947,072 | |
| Prudential PLC | 752,363 | 19,346,307 | |
| Rentokil Initial PLC | 2,979,100 | 12,591,074 | |
| Rightmove PLC | 180,738 | 11,358,725 | |
| St. James's Place Capital PLC | 794,200 | 12,426,209 | |
| TOTAL UNITED KINGDOM | 185,854,730 | ||
| United States of America - 14.7% | |||
| A.O. Smith Corp. | 188,992 | 11,594,659 | |
| Adobe Systems, Inc. (a) | 51,780 | 11,474,448 | |
| Alphabet, Inc. Class A (a) | 11,459 | 11,671,908 | |
| Amazon.com, Inc. (a) | 7,100 | 11,119,523 | |
| Amphenol Corp. Class A | 140,528 | 11,763,599 | |
| Cintas Corp. | 66,211 | 11,275,733 | |
| Constellation Brands, Inc. Class A (sub. vtg.) | 52,339 | 12,201,791 | |
| Danaher Corp. | 116,330 | 11,670,226 | |
| Facebook, Inc. Class A (a) | 66,127 | 11,373,844 | |
| Fiserv, Inc. (a) | 162,959 | 11,547,275 | |
| Global Payments, Inc. | 105,204 | 11,893,312 | |
| HEICO Corp. Class A | 157,470 | 11,361,461 | |
| Hilton Worldwide Holdings, Inc. | 150,106 | 11,834,357 | |
| Intuit, Inc. | 66,261 | 12,244,370 | |
| Marriott International, Inc. Class A | 88,216 | 12,057,363 | |
| MasterCard, Inc. Class A | 66,933 | 11,932,146 | |
| Mettler-Toledo International, Inc. (a) | 20,763 | 11,625,827 | |
| Microsoft Corp. | 125,900 | 11,774,168 | |
| Moody's Corp. | 70,492 | 11,433,802 | |
| MSCI, Inc. | 78,464 | 11,756,261 | |
| Northrop Grumman Corp. | 36,728 | 11,827,885 | |
| NVIDIA Corp. | 54,900 | 12,347,010 | |
| PayPal Holdings, Inc. (a) | 159,400 | 11,892,834 | |
| S&P Global, Inc. | 62,145 | 11,720,547 | |
| Sherwin-Williams Co. | 31,134 | 11,446,726 | |
| The Booking Holdings, Inc. (a) | 5,664 | 12,336,192 | |
| TransDigm Group, Inc. | 38,038 | 12,193,842 | |
| UnitedHealth Group, Inc. | 49,561 | 11,716,220 | |
| Visa, Inc. Class A | 95,126 | 12,069,587 | |
| TOTAL UNITED STATES OF AMERICA | 341,156,916 | ||
| TOTAL COMMON STOCKS | |||
| (Cost $1,839,964,818) | 2,264,676,740 | ||
| Nonconvertible Preferred Stocks - 1.3% | |||
| Brazil - 1.3% | |||
| Itau Unibanco Holding SA sponsored ADR | 1,106,293 | 16,074,437 | |
| Itausa-Investimentos Itau SA (PN) | 3,304,900 | 12,839,601 | |
| TOTAL NONCONVERTIBLE PREFERRED STOCKS | |||
| (Cost $25,105,549) | 28,914,038 | ||
| Money Market Funds - 1.8% | |||
| Fidelity Cash Central Fund, 1.74% (d) | 16,621,524 | 16,624,848 | |
| Fidelity Securities Lending Cash Central Fund 1.74% (d)(e) | 25,193,377 | 25,195,896 | |
| TOTAL MONEY MARKET FUNDS | |||
| (Cost $41,820,744) | 41,820,744 | ||
| TOTAL INVESTMENT IN SECURITIES - 100.8% | |||
| (Cost $1,906,891,111) | 2,335,411,522 | ||
| NET OTHER ASSETS (LIABILITIES) - (0.8)% | (17,769,265) | ||
| NET ASSETS - 100% | $2,317,642,257 |
Categorizations in the Schedule of Investments are based on country or territory of incorporation.
Legend
(a) Non-income producing
(b) Security or a portion of the security is on loan at period end.
(c) Security exempt from registration under Rule 144A of the Securities Act of 1933. These securities may be resold in transactions exempt from registration, normally to qualified institutional buyers. At the end of the period, the value of these securities amounted to $11,771,362 or 0.5% of net assets.
(d) Affiliated fund that is generally available only to investment companies and other accounts managed by Fidelity Investments. The rate quoted is the annualized seven-day yield of the fund at period end. A complete unaudited listing of the fund's holdings as of its most recent quarter end is available upon request. In addition, each Fidelity Central Fund's financial statements are available on the SEC's website or upon request.
(e) Investment made with cash collateral received from securities on loan.
Affiliated Central Funds
Information regarding fiscal year to date income earned by the Fund from investments in Fidelity Central Funds is as follows:
| Fund | Income earned |
| Fidelity Cash Central Fund | $139,374 |
| Fidelity Securities Lending Cash Central Fund | 92,827 |
| Total | $232,201 |
Amounts in the income column in the above table include any capital gain distributions from underlying funds, which are presented in the corresponding line-item in the Statement of Operations if applicable.
Investment Valuation
The following is a summary of the inputs used, as of April 30, 2018, involving the Fund's assets and liabilities carried at fair value. The inputs or methodology used for valuing securities may not be an indication of the risk associated with investing in those securities. For more information on valuation inputs, and their aggregation into the levels used below, please refer to the Investment Valuation section in the accompanying Notes to Financial Statements.
| Valuation Inputs at Reporting Date: | ||||
| Description | Total | Level 1 | Level 2 | Level 3 |
| Investments in Securities: | ||||
| Equities: | ||||
| Consumer Discretionary | $358,639,561 | $207,856,243 | $150,783,318 | $-- |
| Consumer Staples | 148,563,547 | 111,993,569 | 36,569,978 | -- |
| Energy | 16,653,784 | -- | 16,653,784 | -- |
| Financials | 494,107,000 | 255,664,068 | 238,442,932 | -- |
| Health Care | 92,330,958 | 74,183,814 | 18,147,144 | -- |
| Industrials | 467,314,604 | 384,550,194 | 82,764,410 | -- |
| Information Technology | 465,800,332 | 386,151,384 | 79,648,948 | -- |
| Materials | 149,745,485 | 137,650,547 | 12,094,938 | -- |
| Real Estate | 64,126,548 | 39,381,641 | 24,744,907 | -- |
| Telecommunication Services | 11,619,904 | 11,619,904 | -- | -- |
| Utilities | 24,689,055 | 24,689,055 | -- | -- |
| Money Market Funds | 41,820,744 | 41,820,744 | -- | -- |
| Total Investments in Securities: | $2,335,411,522 | $1,675,561,163 | $659,850,359 | $-- |
The following is a summary of transfers between Level 1 and Level 2 for the period ended April 30, 2018. Transfers are assumed to have occurred at the beginning of the period, and are primarily attributable to the valuation techniques used for foreign equity securities, as discussed in the accompanying Notes to Financial Statements:
| Transfers | Total |
| Level 1 to Level 2 | $236,251,474 |
| Level 2 to Level 1 | $166,494,120 |
See accompanying notes which are an integral part of the financial statements.
Fidelity® International Capital Appreciation Fund
Financial Statements
Statement of Assets and Liabilities
| April 30, 2018 (Unaudited) | ||
| Assets | ||
| Investment in securities, at value (including securities loaned of $23,473,585) — See accompanying schedule: Unaffiliated issuers (cost $1,865,070,367) | $2,293,590,778 | |
| Fidelity Central Funds (cost $41,820,744) | 41,820,744 | |
| Total Investment in Securities (cost $1,906,891,111) | $2,335,411,522 | |
| Receivable for investments sold | 44,318,514 | |
| Receivable for fund shares sold | 3,895,572 | |
| Dividends receivable | 6,934,639 | |
| Distributions receivable from Fidelity Central Funds | 96,182 | |
| Prepaid expenses | 1,027 | |
| Other receivables | 1,494,441 | |
| Total assets | 2,392,151,897 | |
| Liabilities | ||
| Payable to custodian bank | $300,110 | |
| Payable for investments purchased | 44,557,558 | |
| Payable for fund shares redeemed | 1,730,708 | |
| Accrued management fee | 1,626,433 | |
| Other affiliated payables | 410,375 | |
| Other payables and accrued expenses | 688,375 | |
| Collateral on securities loaned | 25,196,081 | |
| Total liabilities | 74,509,640 | |
| Net Assets | $2,317,642,257 | |
| Net Assets consist of: | ||
| Paid in capital | $1,805,365,533 | |
| Undistributed net investment income | 3,551,512 | |
| Accumulated undistributed net realized gain (loss) on investments and foreign currency transactions | 80,828,867 | |
| Net unrealized appreciation (depreciation) on investments and assets and liabilities in foreign currencies | 427,896,345 | |
| Net Assets, for 110,647,610 shares outstanding | $2,317,642,257 | |
| Net Asset Value, offering price and redemption price per share ($2,317,642,257 ÷ 110,647,610 shares) | $20.95 |
See accompanying notes which are an integral part of the financial statements.
Statement of Operations
| Six months ended April 30, 2018 (Unaudited) | ||
| Investment Income | ||
| Dividends | $16,315,226 | |
| Income from Fidelity Central Funds | 232,201 | |
| Income before foreign taxes withheld | 16,547,427 | |
| Less foreign taxes withheld | (1,361,784) | |
| Total income | 15,185,643 | |
| Expenses | ||
| Management fee | ||
| Basic fee | $7,817,204 | |
| Performance adjustment | 1,630,450 | |
| Transfer agent fees | 1,891,098 | |
| Accounting and security lending fees | 496,619 | |
| Custodian fees and expenses | 265,811 | |
| Independent trustees' fees and expenses | 4,374 | |
| Registration fees | 56,823 | |
| Audit | 36,211 | |
| Legal | 4,279 | |
| Interest | 5,404 | |
| Miscellaneous | 6,867 | |
| Total expenses before reductions | 12,215,140 | |
| Expense reductions | (563,257) | 11,651,883 |
| Net investment income (loss) | 3,533,760 | |
| Realized and Unrealized Gain (Loss) | ||
| Net realized gain (loss) on: | ||
| Investment securities: | ||
| Unaffiliated issuers (net of foreign taxes of $535,844) | 84,176,160 | |
| Fidelity Central Funds | (185) | |
| Foreign currency transactions | 16,866 | |
| Total net realized gain (loss) | 84,192,841 | |
| Change in net unrealized appreciation (depreciation) on: | ||
| Investment securities: | ||
| Unaffiliated issuers (net of decrease in deferred foreign taxes of $2,533,010) | (31,495,871) | |
| Assets and liabilities in foreign currencies | (58,331) | |
| Total change in net unrealized appreciation (depreciation) | (31,554,202) | |
| Net gain (loss) | 52,638,639 | |
| Net increase (decrease) in net assets resulting from operations | $56,172,399 |
See accompanying notes which are an integral part of the financial statements.
Statement of Changes in Net Assets
| Six months ended April 30, 2018 (Unaudited) | Year ended October 31, 2017 | |
| Increase (Decrease) in Net Assets | ||
| Operations | ||
| Net investment income (loss) | $3,533,760 | $9,178,583 |
| Net realized gain (loss) | 84,192,841 | 143,871,997 |
| Change in net unrealized appreciation (depreciation) | (31,554,202) | 278,001,565 |
| Net increase (decrease) in net assets resulting from operations | 56,172,399 | 431,052,145 |
| Distributions to shareholders from net investment income | (6,966,086) | (11,269,814) |
| Distributions to shareholders from net realized gain | (63,502,432) | – |
| Total distributions | (70,468,518) | (11,269,814) |
| Share transactions | ||
| Proceeds from sales of shares | 395,437,130 | 565,638,950 |
| Reinvestment of distributions | 55,055,872 | 8,894,166 |
| Cost of shares redeemed | (230,585,943) | (665,201,653) |
| Net increase (decrease) in net assets resulting from share transactions | 219,907,059 | (90,668,537) |
| Redemption fees | – | 5,994 |
| Total increase (decrease) in net assets | 205,610,940 | 329,119,788 |
| Net Assets | ||
| Beginning of period | 2,112,031,317 | 1,782,911,529 |
| End of period | $2,317,642,257 | $2,112,031,317 |
| Other Information | ||
| Undistributed net investment income end of period | $3,551,512 | $6,983,838 |
| Shares | ||
| Sold | 18,560,800 | 30,558,983 |
| Issued in reinvestment of distributions | 2,667,436 | 557,628 |
| Redeemed | (10,851,884) | (36,901,606) |
| Net increase (decrease) | 10,376,352 | (5,784,995) |
See accompanying notes which are an integral part of the financial statements.
Financial Highlights
Fidelity International Capital Appreciation Fund
| Six months ended (Unaudited) April 30, | Years endedOctober 31, | |||||
| 2018 | 2017 | 2016 | 2015 | 2014 | 2013 | |
| Selected Per–Share Data | ||||||
| Net asset value, beginning of period | $21.06 | $16.81 | $16.98 | $17.22 | $16.28 | $13.12 |
| Income from Investment Operations | ||||||
| Net investment income (loss)A | .03 | .09 | .12 | .11 | .13 | .13 |
| Net realized and unrealized gain (loss) | .56 | 4.27 | (.03) | .56 | .93 | 3.16 |
| Total from investment operations | .59 | 4.36 | .09 | .67 | 1.06 | 3.29 |
| Distributions from net investment income | (.07) | (.11) | (.07) | (.09) | (.12) | (.13) |
| Distributions from net realized gain | (.63) | – | (.19) | (.81) | – | – |
| Total distributions | (.70) | (.11) | (.26) | (.91)B | (.12) | (.13) |
| Redemption fees added to paid in capitalA | – | –C | –C | –C | –C | –C |
| Net asset value, end of period | $20.95 | $21.06 | $16.81 | $16.98 | $17.22 | $16.28 |
| Total ReturnD,E | 2.84% | 26.13% | .53% | 3.96% | 6.55% | 25.24% |
| Ratios to Average Net AssetsF,G | ||||||
| Expenses before reductions | 1.08%H | 1.12% | 1.14% | 1.13% | 1.14% | 1.17% |
| Expenses net of fee waivers, if any | 1.08%H | 1.12% | 1.14% | 1.13% | 1.14% | 1.17% |
| Expenses net of all reductions | 1.03%H | 1.10% | 1.12% | 1.11% | 1.14% | 1.12% |
| Net investment income (loss) | .31%H | .50% | .69% | .64% | .74% | .87% |
| Supplemental Data | ||||||
| Net assets, end of period (000 omitted) | $2,317,642 | $2,112,031 | $1,782,912 | $1,379,660 | $1,145,744 | $939,945 |
| Portfolio turnover rateI | 161%H,J | 178%J | 167% | 187% | 178% | 136% |
A Calculated based on average shares outstanding during the period.
B Total distributions of $.91 per share is comprised of distributions from net investment income of $.092 and distributions from net realized gain of $.813 per share.
C Amount represents less than $.005 per share.
D Total returns for periods of less than one year are not annualized.
E Total returns would have been lower if certain expenses had not been reduced during the applicable periods shown.
F Fees and expenses of any underlying Fidelity Central Funds are not included in the Fund's expense ratio. The Fund indirectly bears its proportionate share of the expenses of any underlying Fidelity Central Funds.
G Expense ratios reflect operating expenses of the Fund. Expenses before reductions do not reflect amounts reimbursed by the investment adviser or reductions from brokerage service arrangements or reductions from other expense offset arrangements and do not represent the amount paid by the Fund during periods when reimbursements or reductions occur. Expenses net of fee waivers reflect expenses after reimbursement by the investment adviser but prior to reductions from brokerage service arrangements or other expense offset arrangements. Expenses net of all reductions represent the net expenses paid by the Fund.
H Annualized
I Amount does not include the portfolio activity of any underlying Fidelity Central Funds.
J Portfolio turnover rate excludes securities received or delivered in-kind.
See accompanying notes which are an integral part of the financial statements.
Notes to Financial Statements (Unaudited)
For the period ended April 30, 2018
1. Organization.
Fidelity International Capital Appreciation Fund (the Fund) is a fund of Fidelity Investment Trust (the Trust) and is authorized to issue an unlimited number of shares. Share transactions on the Statement of Changes in Net Assets may contain exchanges between affiliated funds. The Trust is registered under the Investment Company Act of 1940, as amended (the 1940 Act), as an open-end management investment company organized as a Massachusetts business trust. The Fund's investments in emerging markets can be subject to social, economic, regulatory, and political uncertainties and can be extremely volatile.
2. Investments in Fidelity Central Funds.
The Fund invests in Fidelity Central Funds, which are open-end investment companies generally available only to other investment companies and accounts managed by the investment adviser and its affiliates. The Fund's Schedule of Investments lists each of the Fidelity Central Funds held as of period end, if any, as an investment of the Fund, but does not include the underlying holdings of each Fidelity Central Fund. As an Investing Fund, the Fund indirectly bears its proportionate share of the expenses of the underlying Fidelity Central Funds.
The Money Market Central Funds seek preservation of capital and current income and are managed by Fidelity Investments Money Management, Inc. (FIMM), an affiliate of the investment adviser. Annualized expenses of the Money Market Central Funds as of their most recent shareholder report date are less than .005%.
A complete unaudited list of holdings for each Fidelity Central Fund is available upon request or at the Securities and Exchange Commission (the SEC) website at www.sec.gov. In addition, the financial statements of the Fidelity Central Funds are available on the SEC website or upon request.
3. Significant Accounting Policies.
The Fund is an investment company and applies the accounting and reporting guidance of the Financial Accounting Standards Board (FASB) Accounting Standards Codification Topic 946 Financial Services – Investments Companies. The financial statements have been prepared in conformity with accounting principles generally accepted in the United States of America (GAAP), which require management to make certain estimates and assumptions at the date of the financial statements. Actual results could differ from those estimates. Subsequent events, if any, through the date that the financial statements were issued have been evaluated in the preparation of the financial statements. The following summarizes the significant accounting policies of the Fund:
Investment Valuation. Investments are valued as of 4:00 p.m. Eastern time on the last calendar day of the period. The Board of Trustees (the Board) has delegated the day to day responsibility for the valuation of the Fund's investments to the Fair Value Committee (the Committee) established by the Fund's investment adviser. In accordance with valuation policies and procedures approved by the Board, the Fund attempts to obtain prices from one or more third party pricing vendors or brokers to value its investments. When current market prices, quotations or currency exchange rates are not readily available or reliable, investments will be fair valued in good faith by the Committee, in accordance with procedures adopted by the Board. Factors used in determining fair value vary by investment type and may include market or investment specific events. The frequency with which these procedures are used cannot be predicted and they may be utilized to a significant extent. The Committee oversees the Fund's valuation policies and procedures and reports to the Board on the Committee's activities and fair value determinations. The Board monitors the appropriateness of the procedures used in valuing the Fund's investments and ratifies the fair value determinations of the Committee.
The Fund categorizes the inputs to valuation techniques used to value its investments into a disclosure hierarchy consisting of three levels as shown below:
- Level 1 – quoted prices in active markets for identical investments
- Level 2 – other significant observable inputs (including quoted prices for similar investments, interest rates, prepayment speeds, etc.)
- Level 3 – unobservable inputs (including the Fund's own assumptions based on the best information available)
Valuation techniques used to value the Fund's investments by major category are as follows:
Equity securities, including restricted securities, for which market quotations are readily available, are valued at the last reported sale price or official closing price as reported by a third party pricing vendor on the primary market or exchange on which they are traded and are categorized as Level 1 in the hierarchy. In the event there were no sales during the day or closing prices are not available, securities are valued at the last quoted bid price or may be valued using the last available price and are generally categorized as Level 2 in the hierarchy. For foreign equity securities, when market or security specific events arise, comparisons to the valuation of American Depositary Receipts (ADRs), futures contracts, Exchange-Traded Funds (ETFs) and certain indexes as well as quoted prices for similar securities may be used and would be categorized as Level 2 in the hierarchy. Utilizing these techniques may result in transfers between Level 1 and Level 2. For equity securities, including restricted securities, where observable inputs are limited, assumptions about market activity and risk are used and these securities may be categorized as Level 3 in the hierarchy.
Investments in open-end mutual funds, including the Fidelity Central Funds, are valued at their closing net asset value (NAV) each business day and are categorized as Level 1 in the hierarchy.
Changes in valuation techniques may result in transfers in or out of an assigned level within the disclosure hierarchy. The aggregate value of investments by input level as of April 30, 2018, including information on transfers between Levels 1 and 2 is included at the end of the Fund's Schedule of Investments.
Foreign Currency. The Fund may use foreign currency contracts to facilitate transactions in foreign-denominated securities. Gains and losses from these transactions may arise from changes in the value of the foreign currency or if the counterparties do not perform under the contracts' terms.
Foreign-denominated assets, including investment securities, and liabilities are translated into U.S. dollars at the exchange rates at period end. Purchases and sales of investment securities, income and dividends received and expenses denominated in foreign currencies are translated into U.S. dollars at the exchange rate in effect on the transaction date.
The effects of exchange rate fluctuations on investments are included with the net realized and unrealized gain (loss) on investment securities. Other foreign currency transactions resulting in realized and unrealized gain (loss) are disclosed separately.
Investment Transactions and Income. For financial reporting purposes, the Fund's investment holdings and NAV include trades executed through the end of the last business day of the period. The NAV per share for processing shareholder transactions is calculated as of the close of business of the New York Stock Exchange (NYSE), normally 4:00 p.m. Eastern time and includes trades executed through the end of the prior business day. Gains and losses on securities sold are determined on the basis of identified cost and includes proceeds received from litigation. Dividend income is recorded on the ex-dividend date, except for certain dividends from foreign securities where the ex-dividend date may have passed, which are recorded as soon as the Fund is informed of the ex-dividend date. Non-cash dividends included in dividend income, if any, are recorded at the fair market value of the securities received. Income and capital gain distributions from Fidelity Central Funds, if any, are recorded on the ex-dividend date. Certain distributions received by the Fund represent a return of capital or capital gain. The Fund determines the components of these distributions subsequent to the ex-dividend date, based upon receipt of tax filings or other correspondence relating to the underlying investment. These distributions are recorded as a reduction of cost of investments and/or as a realized gain. Investment income is recorded net of foreign taxes withheld where recovery of such taxes is uncertain.
Expenses. Expenses directly attributable to a fund are charged to that fund. Expenses attributable to more than one fund are allocated among the respective funds on the basis of relative net assets or other appropriate methods. Expense estimates are accrued in the period to which they relate and adjustments are made when actual amounts are known.
Income Tax Information and Distributions to Shareholders. Each year, the Fund intends to qualify as a regulated investment company under Subchapter M of the Internal Revenue Code, including distributing substantially all of its taxable income and realized gains. As a result, no provision for U.S. Federal income taxes is required. The Fund files a U.S. federal tax return, in addition to state and local tax returns as required. The Fund's federal income tax returns are subject to examination by the Internal Revenue Service (IRS) for a period of three fiscal years after they are filed. State and local tax returns may be subject to examination for an additional fiscal year depending on the jurisdiction. Foreign taxes are provided for based on the Fund's understanding of the tax rules and rates that exist in the foreign markets in which it invests. The Fund is subject to a tax imposed on capital gains by certain countries in which it invests. An estimated deferred tax liability for net unrealized appreciation on the applicable securities is included in Other payables and accrued expenses on the Statement of Assets & Liabilities.
Distributions are declared and recorded on the ex-dividend date. Income and capital gain distributions are determined in accordance with income tax regulations, which may differ from GAAP.
Capital accounts within the financial statements are adjusted for permanent book-tax differences. These adjustments have no impact on net assets or the results of operations. Capital accounts are not adjusted for temporary book-tax differences which will reverse in a subsequent period.
Book-tax differences are primarily due to foreign currency transactions, certain foreign taxes, passive foreign investment companies (PFIC), redemptions in kind, deferred trustees compensation, capital loss carryforwards and losses deferred due to wash sales.
As of period end, the cost and unrealized appreciation (depreciation) in securities, and derivatives if applicable, for federal income tax purposes were as follows:
| Gross unrealized appreciation | $459,305,979 |
| Gross unrealized depreciation | (34,098,124) |
| Net unrealized appreciation (depreciation) | $425,207,855 |
| Tax cost | $1,910,203,667 |
Restricted Securities. The Fund may invest in securities that are subject to legal or contractual restrictions on resale. These securities generally may be resold in transactions exempt from registration or to the public if the securities are registered. Disposal of these securities may involve time-consuming negotiations and expense, and prompt sale at an acceptable price may be difficult. Information regarding restricted securities is included at the end of the Fund's Schedule of Investments.
4. Purchases and Sales of Investments.
Purchases and sales of securities, other than short-term securities and in-kind transactions, aggregated $1,977,281,940 and $1,798,731,000, respectively.
Redemptions In-Kind. During the period, 1,386,625 shares of the Fund held by unaffiliated entities were redeemed in-kind for investments and cash with a value of $29,374,572. The net realized gain of $8,546,160 on investments delivered through the in-kind redemptions is included in the accompanying Statement of Operations. The amount of the redemptions is included in share transactions activity shown in the accompanying Statement of Changes in Net Assets. The Fund recognized no gain or loss for federal income tax purposes.
5. Fees and Other Transactions with Affiliates.
Management Fee. Fidelity Management & Research Company (the investment adviser) and its affiliates provide the Fund with investment management related services for which the Fund pays a monthly management fee. The management fee is the sum of an individual fund fee rate that is based on an annual rate of .45% of the Fund's average net assets and an annualized group fee rate that averaged .24% during the period. The group fee rate is based upon the average net assets of all the mutual funds advised by the investment adviser, including any mutual funds previously advised by the investment adviser that are currently advised by Fidelity SelectCo, LLC, an affiliate of the investment adviser. The group fee rate decreases as assets under management increase and increases as assets under management decrease. In addition, the management fee is subject to a performance adjustment (up to a maximum of +/- .20% of the Fund's average net assets over a 36 month performance period). The upward or downward adjustment to the management fee is based on the Fund's relative investment performance as compared to its benchmark index, the MSCI All Country World ex USA Index, over the same 36 month performance period. For the reporting period, the total annualized management fee rate, including the performance adjustment, was .83% of the Fund's average net assets. The performance adjustment included in the management fee rate may be higher or lower than the maximum performance adjustment rate due to the difference between the average net assets for the reporting and performance periods.
Transfer Agent Fees. Fidelity Investments Institutional Operations Company, Inc. (FIIOC), an affiliate of the investment adviser, is the Fund's transfer, dividend disbursing and shareholder servicing agent. FIIOC receives account fees and asset-based fees that vary according to account size and type of account. FIIOC pays for typesetting, printing and mailing of shareholder reports, except proxy statements. For the period, the transfer agent fees were equivalent to an annualized rate of .17% of average net assets.
Accounting and Security Lending Fees. Fidelity Service Company, Inc. (FSC), an affiliate of the investment adviser, maintains the Fund's accounting records. The accounting fee is based on the level of average net assets for each month. Under a separate contract, FSC administers the security lending program. The security lending fee is based on the number and duration of lending transactions. For the period, the fees were equivalent to an annualized rate of .04%.
Brokerage Commissions. The Fund placed a portion of its portfolio transactions with brokerage firms which are affiliates of the investment adviser. Brokerage commissions are included in net realized gain (loss) and change in net unrealized appreciation (depreciation) in the Statement of Operations. The commissions paid to these affiliated firms were $8,798 for the period.
Interfund Lending Program. Pursuant to an Exemptive Order issued by the SEC, the Fund, along with other registered investment companies having management contracts with Fidelity Management & Research Company (FMR) or other affiliated entities of FMR, may participate in an interfund lending program. This program provides an alternative credit facility allowing the funds to borrow from, or lend money to, other participating affiliated funds. At period end, there were no interfund loans outstanding. The Fund's activity in this program during the period for which loans were outstanding was as follows:
| Borrower or Lender | Average Loan Balance | Weighted Average Interest Rate | Interest Expense |
| Borrower | $7,545,643 | 1.84% | $5,404 |
Interfund Trades. The Fund may purchase from or sell securities to other Fidelity Funds under procedures adopted by the Board. The procedures have been designed to ensure these interfund trades are executed in accordance with Rule 17a-7 of the 1940 Act. Interfund trades are included within the respective purchases and sales amounts shown in the Purchases and Sales of Investments note.
Prior Fiscal Year Redemptions In-Kind. During the prior period, 8,315,551 shares of the Fund held by an affiliated entity were redeemed in-kind for investments and cash with a value of $165,479,456. The Fund had a net realized gain of $45,376,740 on investments delivered through in-kind redemptions. The amount of the in-kind redemptions is included in share transactions in the accompanying Statement of Changes in Net Assets. The Fund recognized no gain or loss for federal income tax purposes.
6. Committed Line of Credit.
The Fund participates with other funds managed by the investment adviser or an affiliate in a $4.25 billion credit facility (the "line of credit") to be utilized for temporary or emergency purposes to fund shareholder redemptions or for other short-term liquidity purposes. The Fund has agreed to pay commitment fees on its pro-rata portion of the line of credit, which amounted to $3,156 and is reflected in Miscellaneous expenses on the Statement of Operations. During the period, the Fund did not borrow on this line of credit.
7. Security Lending.
The Fund lends portfolio securities through a lending agent from time to time in order to earn additional income. For equity securities, a lending agent is used and may loan securities to certain qualified borrowers, including Fidelity Capital Markets (FCM), a broker-dealer affiliated with the Fund. On the settlement date of the loan, the Fund receives collateral (in the form of U.S. Treasury obligations, letters of credit and/or cash) against the loaned securities and maintains collateral in an amount not less than 100% of the market value of the loaned securities during the period of the loan. The market value of the loaned securities is determined at the close of business of the Fund and any additional required collateral is delivered to the Fund on the next business day. The Fund or borrower may terminate the loan at any time, and if the borrower defaults on its obligation to return the securities loaned because of insolvency or other reasons, the Fund may apply collateral received from the borrower against the obligation. The Fund may experience delays and costs in recovering the securities loaned. Any cash collateral received is invested in the Fidelity Securities Lending Cash Central Fund. The value of loaned securities and cash collateral at period end are disclosed on the Fund's Statement of Assets and Liabilities. Security lending income represents the income earned on investing cash collateral, less rebates paid to borrowers and any lending agent fees associated with the loan, plus any premium payments received for lending certain types of securities. Security lending income is presented in the Statement of Operations as a component of income from Fidelity Central Funds. Total security lending income during the period amounted to $92,827. During the period, there were no securities loaned to FCM.
8. Expense Reductions.
Commissions paid to certain brokers with whom the investment adviser, or its affiliates, places trades on behalf of the Fund include an amount in addition to trade execution, which may be rebated back to the Fund to offset certain expenses. This amount totaled $552,458 for the period.
In addition, during the period the investment adviser reimbursed and/or waived a portion of operating expenses in the amount of $10,799.
9. Other.
The Fund's organizational documents provide former and current trustees and officers with a limited indemnification against liabilities arising in connection with the performance of their duties to the Fund. In the normal course of business, the Fund may also enter into contracts that provide general indemnifications. The Fund's maximum exposure under these arrangements is unknown as this would be dependent on future claims that may be made against the Fund. The risk of material loss from such claims is considered remote.
At the end of the period, Strategic Advisers Fidelity International Fund was the owner of record of approximately 21% of the total outstanding shares of the Fund. Mutual funds managed by the investment adviser or its affiliates were the owners of record, in the aggregate, of approximately 24% of the total outstanding shares of the Fund.
Fidelity® Overseas Fund
Investment Summary (Unaudited)
Geographic Diversification (% of fund's net assets)
| As of April 30, 2018 | ||
| United Kingdom | 20.4% | |
| Japan | 18.3% | |
| France | 10.4% | |
| Germany | 8.7% | |
| Switzerland | 5.8% | |
| Netherlands | 5.0% | |
| United States of America* | 4.0% | |
| Sweden | 3.8% | |
| Ireland | 3.8% | |
| Other | 19.8% | |

* Includes Short-Term investments and Net Other Assets (Liabilities).
Percentages are based on country or territory of incorporation and are adjusted for the effect of futures contracts, if applicable.
Asset Allocation as of April 30, 2018
| % of fund's net assets | |
| Stocks | 99.6 |
| Short-Term Investments and Net Other Assets (Liabilities) | 0.4 |
Top Ten Stocks as of April 30, 2018
| % of fund's net assets | |
| Roche Holding AG (participation certificate) (Switzerland, Pharmaceuticals) | 1.6 |
| Unilever NV (NY Reg.) (Netherlands, Personal Products) | 1.5 |
| Total SA (France, Oil, Gas & Consumable Fuels) | 1.4 |
| SAP SE (Germany, Software) | 1.3 |
| Bayer AG (Germany, Pharmaceuticals) | 1.3 |
| AIA Group Ltd. (Hong Kong, Insurance) | 1.2 |
| British American Tobacco PLC (United Kingdom) (United Kingdom, Tobacco) | 1.2 |
| Prudential PLC (United Kingdom, Insurance) | 1.2 |
| LVMH Moet Hennessy - Louis Vuitton SA (France, Textiles, Apparel & Luxury Goods) | 1.2 |
| ORIX Corp. (Japan, Diversified Financial Services) | 1.1 |
| 13.0 |
Top Market Sectors as of April 30, 2018
| % of fund's net assets | |
| Financials | 25.0 |
| Industrials | 18.1 |
| Health Care | 12.7 |
| Consumer Discretionary | 11.6 |
| Information Technology | 11.2 |
| Consumer Staples | 9.8 |
| Materials | 7.9 |
| Energy | 2.7 |
| Telecommunication Services | 0.6 |
Fidelity® Overseas Fund
Schedule of Investments April 30, 2018 (Unaudited)
Showing Percentage of Net Assets
| Common Stocks - 98.7% | |||
| Shares | Value | ||
| Australia - 1.8% | |||
| Adelaide Brighton Ltd. (a) | 6,442,640 | $31,083,236 | |
| Amcor Ltd. | 4,992,990 | 51,452,635 | |
| Aub Group Ltd. | 2,726,553 | 28,829,894 | |
| Pact Group Holdings Ltd. (b) | 5,658,021 | 24,091,680 | |
| TOTAL AUSTRALIA | 135,457,445 | ||
| Austria - 0.3% | |||
| Andritz AG | 489,244 | 26,326,541 | |
| Bailiwick of Jersey - 1.1% | |||
| Sanne Group PLC | 3,071,454 | 26,258,803 | |
| Wolseley PLC | 738,954 | 56,766,343 | |
| TOTAL BAILIWICK OF JERSEY | 83,025,146 | ||
| Belgium - 0.9% | |||
| KBC Groep NV | 800,118 | 69,954,509 | |
| Bermuda - 1.7% | |||
| Credicorp Ltd. (United States) | 177,600 | 41,290,224 | |
| Hiscox Ltd. | 2,305,300 | 47,256,490 | |
| IHS Markit Ltd. (c) | 836,100 | 41,077,593 | |
| TOTAL BERMUDA | 129,624,307 | ||
| Canada - 0.7% | |||
| Constellation Software, Inc. | 78,700 | 56,246,334 | |
| Cayman Islands - 0.3% | |||
| ZTO Express (Cayman), Inc. sponsored ADR (a) | 1,195,921 | 19,732,697 | |
| Denmark - 0.9% | |||
| DSV de Sammensluttede Vognmaend A/S | 629,700 | 50,041,641 | |
| NNIT A/S (b) | 675,397 | 18,763,156 | |
| TOTAL DENMARK | 68,804,797 | ||
| France - 10.4% | |||
| ALTEN | 365,535 | 36,328,871 | |
| Amundi SA (b) | 561,706 | 47,807,723 | |
| BNP Paribas SA | 1,054,200 | 81,449,862 | |
| Capgemini SA | 523,033 | 72,004,070 | |
| Compagnie de St. Gobain | 989,518 | 51,974,000 | |
| Edenred SA | 1,566,700 | 53,920,487 | |
| Elis SA | 1,610,614 | 38,549,453 | |
| LVMH Moet Hennessy - Louis Vuitton SA (a) | 258,863 | 90,087,468 | |
| Maisons du Monde SA (b) | 952,900 | 38,756,318 | |
| Publicis Groupe SA | 376,166 | 28,164,000 | |
| Sanofi SA (a) | 928,881 | 73,439,490 | |
| Sodexo SA | 213,054 | 21,098,405 | |
| SR Teleperformance SA | 294,600 | 47,280,366 | |
| Total SA | 1,725,260 | 108,435,618 | |
| TOTAL FRANCE | 789,296,131 | ||
| Germany - 7.8% | |||
| adidas AG | 298,075 | 73,394,900 | |
| Axel Springer Verlag AG | 625,225 | 51,228,223 | |
| Bayer AG | 865,986 | 103,502,310 | |
| Deutsche Post AG | 1,718,434 | 74,587,683 | |
| Fresenius Medical Care AG & Co. KGaA | 503,436 | 51,084,090 | |
| Fresenius SE & Co. KGaA | 889,796 | 68,059,948 | |
| Hannover Reuck SE | 318,300 | 44,818,601 | |
| SAP SE | 933,545 | 103,722,153 | |
| Scout24 AG (b) | 425,300 | 22,053,653 | |
| TOTAL GERMANY | 592,451,561 | ||
| Hong Kong - 1.2% | |||
| AIA Group Ltd. | 10,673,400 | 95,390,311 | |
| India - 0.7% | |||
| Axis Bank Ltd. | 3,141,235 | 24,352,293 | |
| Housing Development Finance Corp. Ltd. | 1,034,485 | 29,268,708 | |
| PC Jeweller Ltd. | 60,988 | 132,038 | |
| TOTAL INDIA | 53,753,039 | ||
| Indonesia - 0.5% | |||
| PT Bank Rakyat Indonesia Tbk | 162,221,100 | 37,403,072 | |
| Ireland - 3.8% | |||
| CRH PLC | 1,349,200 | 47,884,573 | |
| DCC PLC (United Kingdom) | 476,112 | 45,882,438 | |
| Kerry Group PLC Class A | 510,748 | 52,117,850 | |
| Kingspan Group PLC (Ireland) | 1,124,980 | 50,944,719 | |
| Paddy Power Betfair PLC (Ireland) | 443,400 | 43,880,114 | |
| United Drug PLC (United Kingdom) | 3,726,103 | 46,936,993 | |
| TOTAL IRELAND | 287,646,687 | ||
| Israel - 0.8% | |||
| Frutarom Industries Ltd. | 664,416 | 63,784,084 | |
| Italy - 1.8% | |||
| Banca Generali SpA | 994,277 | 32,322,545 | |
| Intesa Sanpaolo SpA | 18,215,736 | 69,291,886 | |
| Prada SpA | 6,689,600 | 33,942,398 | |
| TOTAL ITALY | 135,556,829 | ||
| Japan - 18.3% | |||
| AEON Financial Service Co. Ltd. | 1,555,000 | 36,499,543 | |
| Arc Land Sakamoto Co. Ltd. | 1,032,500 | 16,311,082 | |
| Bridgestone Corp. | 1,192,000 | 50,037,395 | |
| Daiichikosho Co. Ltd. | 625,800 | 32,915,752 | |
| Daikin Industries Ltd. | 573,600 | 67,187,596 | |
| Dentsu, Inc. | 642,400 | 30,439,371 | |
| GMO Internet, Inc. (a) | 646,000 | 11,907,153 | |
| Hoya Corp. | 1,471,100 | 78,883,902 | |
| Iriso Electronics Co. Ltd. | 466,700 | 29,627,680 | |
| Keyence Corp. | 121,280 | 74,296,758 | |
| KH Neochem Co. Ltd. | 1,348,000 | 40,938,163 | |
| Miroku Jyoho Service Co., Ltd. | 837,000 | 23,888,035 | |
| Misumi Group, Inc. | 1,373,500 | 38,069,018 | |
| Mitsubishi UFJ Financial Group, Inc. | 12,568,900 | 84,228,515 | |
| Morinaga & Co. Ltd. | 587,200 | 28,629,491 | |
| Nabtesco Corp. | 1,083,600 | 39,202,689 | |
| Nakanishi, Inc. | 2,384,400 | 49,860,395 | |
| Nissan Chemical Industries Co. Ltd. | 699,700 | 31,202,319 | |
| Nitori Holdings Co. Ltd. | 335,800 | 56,765,313 | |
| NOF Corp. | 890,100 | 26,584,125 | |
| OBIC Co. Ltd. | 527,900 | 44,281,403 | |
| Olympus Corp. | 1,284,500 | 47,998,376 | |
| ORIX Corp. | 4,844,700 | 85,265,302 | |
| Otsuka Corp. | 876,800 | 40,904,501 | |
| Outsourcing, Inc. | 87,816 | 1,481,272 | |
| PALTAC Corp. | 405,100 | 20,306,879 | |
| Recruit Holdings Co. Ltd. | 2,211,800 | 51,127,137 | |
| S Foods, Inc. | 580,300 | 24,444,580 | |
| SMC Corp. | 137,200 | 52,359,898 | |
| Software Service, Inc. | 82,800 | 5,824,479 | |
| Sundrug Co. Ltd. | 803,300 | 41,370,097 | |
| Tsubaki Nakashima Co. Ltd. | 985,300 | 23,307,591 | |
| Tsuruha Holdings, Inc. | 351,300 | 50,548,381 | |
| VT Holdings Co. Ltd. | 333,300 | 1,521,375 | |
| Welcia Holdings Co. Ltd. | 983,000 | 50,624,680 | |
| TOTAL JAPAN | 1,388,840,246 | ||
| Kenya - 0.4% | |||
| Safaricom Ltd. | 95,758,300 | 26,970,807 | |
| Korea (South) - 0.3% | |||
| LG Chemical Ltd. | 67,440 | 22,670,495 | |
| Netherlands - 5.0% | |||
| Grandvision NV (b) | 1,131,600 | 27,877,011 | |
| Heineken NV (Bearer) | 469,300 | 49,475,239 | |
| IMCD Group BV | 1,002,318 | 61,790,880 | |
| ING Groep NV (Certificaten Van Aandelen) | 3,776,954 | 63,643,646 | |
| Koninklijke Philips Electronics NV | 1,565,245 | 66,250,919 | |
| Unilever NV (NY Reg.) | 1,970,174 | 112,536,339 | |
| TOTAL NETHERLANDS | 381,574,034 | ||
| New Zealand - 0.7% | |||
| EBOS Group Ltd. | 2,276,701 | 28,481,548 | |
| Trade Maine Group Ltd. | 7,184,130 | 23,504,606 | |
| TOTAL NEW ZEALAND | 51,986,154 | ||
| Norway - 1.3% | |||
| Schibsted ASA (A Shares) | 1,305,300 | 38,171,519 | |
| Statoil ASA | 2,378,159 | 60,815,968 | |
| TOTAL NORWAY | 98,987,487 | ||
| Panama - 0.3% | |||
| Copa Holdings SA Class A | 226,200 | 26,503,854 | |
| Spain - 3.1% | |||
| Amadeus IT Holding SA Class A | 907,230 | 66,501,157 | |
| CaixaBank SA | 10,530,416 | 51,208,088 | |
| Grifols SA ADR | 2,594,305 | 52,716,278 | |
| Masmovil Ibercom SA (c) | 112,690 | 16,275,700 | |
| Prosegur Cash SA (b) | 15,725,714 | 45,956,701 | |
| TOTAL SPAIN | 232,657,924 | ||
| Sweden - 3.8% | |||
| Addlife AB | 838,800 | 17,577,475 | |
| Alfa Laval AB (a) | 1,491,850 | 37,089,040 | |
| Essity AB Class B | 1,822,264 | 46,406,431 | |
| HEXPOL AB (B Shares) (a) | 3,849,062 | 39,999,845 | |
| Indutrade AB | 1,639,523 | 38,831,867 | |
| Nordea Bank AB | 6,280,267 | 64,103,312 | |
| Swedbank AB (A Shares) | 2,020,723 | 44,064,460 | |
| TOTAL SWEDEN | 288,072,430 | ||
| Switzerland - 5.8% | |||
| Credit Suisse Group AG | 3,781,741 | 63,783,760 | |
| Julius Baer Group Ltd. | 955,659 | 56,716,805 | |
| Kaba Holding AG (B Shares) (Reg.) | 49,236 | 38,256,024 | |
| Lonza Group AG | 206,492 | 50,883,296 | |
| Roche Holding AG (participation certificate) | 532,428 | 118,298,830 | |
| Sika AG | 6,022 | 43,934,470 | |
| UBS Group AG | 4,164,487 | 70,472,701 | |
| TOTAL SWITZERLAND | 442,345,886 | ||
| Taiwan - 1.0% | |||
| Taiwan Semiconductor Manufacturing Co. Ltd. | 4,887,000 | 37,160,014 | |
| United Microelectronics Corp. | 72,048,000 | 38,784,667 | |
| TOTAL TAIWAN | 75,944,681 | ||
| United Kingdom - 20.4% | |||
| Admiral Group PLC | 1,770,600 | 48,581,070 | |
| Ascential PLC | 8,294,087 | 48,117,431 | |
| Beazley PLC | 3,526,600 | 28,717,741 | |
| British American Tobacco PLC (United Kingdom) | 1,734,860 | 95,152,751 | |
| Cineworld Group PLC | 13,489,039 | 48,357,218 | |
| Compass Group PLC | 2,951,194 | 63,381,377 | |
| Conviviality PLC (d) | 5,450,078 | 3,796,580 | |
| Cranswick PLC | 613,080 | 24,594,954 | |
| Dechra Pharmaceuticals PLC | 676,095 | 25,521,987 | |
| Diploma PLC | 2,130,803 | 35,377,727 | |
| DS Smith PLC | 5,271,924 | 37,915,049 | |
| Halma PLC | 2,257,870 | 38,015,850 | |
| Hastings Group Holdings PLC (b) | 7,906,163 | 30,040,984 | |
| Hilton Food Group PLC | 2,121,873 | 25,881,678 | |
| IntegraFin Holdings PLC (c) | 4,016,531 | 15,814,537 | |
| Intertek Group PLC | 658,045 | 44,399,657 | |
| James Fisher and Sons PLC | 986,058 | 22,724,651 | |
| John Wood Group PLC | 2,430,392 | 19,024,905 | |
| JTC PLC (b)(c) | 2,833,000 | 11,954,086 | |
| LivaNova PLC (c) | 241,865 | 21,472,775 | |
| London Stock Exchange Group PLC | 1,146,430 | 67,866,478 | |
| Melrose Industries PLC | 18,343,163 | 57,576,914 | |
| Micro Focus International PLC | 1,596,823 | 27,534,230 | |
| Next PLC | 227,800 | 16,483,460 | |
| Prudential PLC | 3,682,871 | 94,701,563 | |
| Reckitt Benckiser Group PLC | 958,624 | 75,202,212 | |
| Rentokil Initial PLC | 9,286,400 | 39,248,682 | |
| Rio Tinto PLC | 1,115,454 | 60,798,874 | |
| Rolls-Royce Holdings PLC | 3,064,092 | 35,434,018 | |
| Rotork PLC | 8,268,806 | 37,452,259 | |
| Schroders PLC | 930,282 | 42,276,542 | |
| Sinclair Pharma PLC (c) | 10,232,168 | 2,112,994 | |
| Spectris PLC | 1,359,744 | 50,355,713 | |
| St. James's Place Capital PLC | 3,736,563 | 58,462,996 | |
| Standard Life PLC | 9,603,242 | 48,295,522 | |
| The Weir Group PLC | 1,860,018 | 54,696,270 | |
| Ultra Electronics Holdings PLC | 1,389,394 | 26,931,925 | |
| Victrex PLC | 1,258,588 | 45,431,344 | |
| Volution Group PLC | 9,088,967 | 24,650,178 | |
| TOTAL UNITED KINGDOM | 1,554,355,182 | ||
| United States of America - 3.6% | |||
| Alphabet, Inc. Class C (c) | 41,093 | 41,805,142 | |
| Boston Scientific Corp. (c) | 1,338,400 | 38,438,848 | |
| Moody's Corp. | 276,700 | 44,880,740 | |
| S&P Global, Inc. | 407,500 | 76,854,500 | |
| Sherwin-Williams Co. | 101,600 | 37,354,256 | |
| Worldpay, Inc. (c) | 432,300 | 35,111,406 | |
| TOTAL UNITED STATES OF AMERICA | 274,444,892 | ||
| TOTAL COMMON STOCKS | |||
| (Cost $5,980,847,066) | 7,509,807,562 | ||
| Nonconvertible Preferred Stocks - 0.9% | |||
| Germany - 0.9% | |||
| Henkel AG & Co. KGaA | 513,444 | 65,351,686 | |
| United Kingdom - 0.0% | |||
| Rolls-Royce Holdings PLC Series C (c) | 217,550,532 | 299,502 | |
| TOTAL NONCONVERTIBLE PREFERRED STOCKS | |||
| (Cost $51,453,728) | 65,651,188 | ||
| Money Market Funds - 2.0% | |||
| Fidelity Cash Central Fund, 1.74% (e) | 11,343,976 | 11,346,245 | |
| Fidelity Securities Lending Cash Central Fund 1.74% (e)(f) | 141,257,071 | 141,271,197 | |
| TOTAL MONEY MARKET FUNDS | |||
| (Cost $152,617,442) | 152,617,442 | ||
| TOTAL INVESTMENT IN SECURITIES - 101.6% | |||
| (Cost $6,184,918,236) | 7,728,076,192 | ||
| NET OTHER ASSETS (LIABILITIES) - (1.6)% | (119,903,455) | ||
| NET ASSETS - 100% | $7,608,172,737 |
Categorizations in the Schedule of Investments are based on country or territory of incorporation.
Legend
(a) Security or a portion of the security is on loan at period end.
(b) Security exempt from registration under Rule 144A of the Securities Act of 1933. These securities may be resold in transactions exempt from registration, normally to qualified institutional buyers. At the end of the period, the value of these securities amounted to $267,301,312 or 3.5% of net assets.
(c) Non-income producing
(d) Level 3 security
(e) Affiliated fund that is generally available only to investment companies and other accounts managed by Fidelity Investments. The rate quoted is the annualized seven-day yield of the fund at period end. A complete unaudited listing of the fund's holdings as of its most recent quarter end is available upon request. In addition, each Fidelity Central Fund's financial statements are available on the SEC's website or upon request.
(f) Investment made with cash collateral received from securities on loan.
Affiliated Central Funds
Information regarding fiscal year to date income earned by the Fund from investments in Fidelity Central Funds is as follows:
| Fund | Income earned |
| Fidelity Cash Central Fund | $472,085 |
| Fidelity Securities Lending Cash Central Fund | 1,345,047 |
| Total | $1,817,132 |
Amounts in the income column in the above table include any capital gain distributions from underlying funds, which are presented in the corresponding line-item in the Statement of Operations if applicable.
Investment Valuation
The following is a summary of the inputs used, as of April 30, 2018, involving the Fund's assets and liabilities carried at fair value. The inputs or methodology used for valuing securities may not be an indication of the risk associated with investing in those securities. For more information on valuation inputs, and their aggregation into the levels used below, please refer to the Investment Valuation section in the accompanying Notes to Financial Statements.
| Valuation Inputs at Reporting Date: | ||||
| Description | Total | Level 1 | Level 2 | Level 3 |
| Investments in Securities: | ||||
| Equities: | ||||
| Consumer Discretionary | $874,606,350 | $729,346,041 | $145,260,309 | $-- |
| Consumer Staples | 746,132,949 | 571,981,406 | 170,354,963 | 3,796,580 |
| Energy | 211,001,142 | 41,749,556 | 169,251,586 | -- |
| Financials | 1,910,084,513 | 1,211,265,972 | 698,818,541 | -- |
| Health Care | 966,108,089 | 553,532,450 | 412,575,639 | -- |
| Industrials | 1,368,625,262 | 1,294,037,579 | 74,587,683 | -- |
| Information Technology | 850,528,790 | 643,327,726 | 207,201,064 | -- |
| Materials | 605,125,148 | 389,814,150 | 215,310,998 | -- |
| Telecommunication Services | 43,246,507 | 43,246,507 | -- | -- |
| Money Market Funds | 152,617,442 | 152,617,442 | -- | -- |
| Total Investments in Securities: | $7,728,076,192 | $5,630,918,829 | $2,093,360,783 | $3,796,580 |
The following is a summary of transfers between Level 1 and Level 2 for the period ended April 30, 2018. Transfers are assumed to have occurred at the beginning of the period, and are primarily attributable to the valuation techniques used for foreign equity securities, as discussed in the accompanying Notes to Financial Statements:
| Transfers | Total |
| Level 1 to Level 2 | $583,462,934 |
| Level 2 to Level 1 | $1,339,271,215 |
See accompanying notes which are an integral part of the financial statements.
Fidelity® Overseas Fund
Financial Statements
Statement of Assets and Liabilities
| April 30, 2018 (Unaudited) | ||
| Assets | ||
| Investment in securities, at value (including securities loaned of $136,297,873) — See accompanying schedule: Unaffiliated issuers (cost $6,032,300,794) | $7,575,458,750 | |
| Fidelity Central Funds (cost $152,617,442) | 152,617,442 | |
| Total Investment in Securities (cost $6,184,918,236) | $7,728,076,192 | |
| Receivable for investments sold | 29,674,217 | |
| Receivable for fund shares sold | 6,980,891 | |
| Dividends receivable | 42,164,552 | |
| Distributions receivable from Fidelity Central Funds | 186,872 | |
| Prepaid expenses | 3,812 | |
| Other receivables | 537,344 | |
| Total assets | 7,807,623,880 | |
| Liabilities | ||
| Payable for investments purchased | $21,940,011 | |
| Payable for fund shares redeemed | 29,448,532 | |
| Accrued management fee | 5,057,371 | |
| Other affiliated payables | 1,037,652 | |
| Other payables and accrued expenses | 692,193 | |
| Collateral on securities loaned | 141,275,384 | |
| Total liabilities | 199,451,143 | |
| Net Assets | $7,608,172,737 | |
| Net Assets consist of: | ||
| Paid in capital | $5,839,225,850 | |
| Undistributed net investment income | 43,603,647 | |
| Accumulated undistributed net realized gain (loss) on investments and foreign currency transactions | 182,523,828 | |
| Net unrealized appreciation (depreciation) on investments and assets and liabilities in foreign currencies | 1,542,819,412 | |
| Net Assets | $7,608,172,737 | |
| Overseas: | ||
| Net Asset Value, offering price and redemption price per share ($6,392,928,831 ÷ 126,164,248 shares) | $50.67 | |
| Class K: | ||
| Net Asset Value, offering price and redemption price per share ($1,215,243,906 ÷ 24,031,485 shares) | $50.57 |
See accompanying notes which are an integral part of the financial statements.
Statement of Operations
| Six months ended April 30, 2018 (Unaudited) | ||
| Investment Income | ||
| Dividends | $89,585,383 | |
| Income from Fidelity Central Funds | 1,817,132 | |
| Income before foreign taxes withheld | 91,402,515 | |
| Less foreign taxes withheld | (7,774,440) | |
| Total income | 83,628,075 | |
| Expenses | ||
| Management fee | ||
| Basic fee | $26,356,669 | |
| Performance adjustment | 5,240,326 | |
| Transfer agent fees | 5,508,296 | |
| Accounting and security lending fees | 850,801 | |
| Custodian fees and expenses | 464,150 | |
| Independent trustees' fees and expenses | 15,788 | |
| Registration fees | 98,521 | |
| Audit | 43,235 | |
| Legal | 15,155 | |
| Interest | 13,619 | |
| Miscellaneous | 24,924 | |
| Total expenses before reductions | 38,631,484 | |
| Expense reductions | (304,295) | 38,327,189 |
| Net investment income (loss) | 45,300,886 | |
| Realized and Unrealized Gain (Loss) | ||
| Net realized gain (loss) on: | ||
| Investment securities: | ||
| Unaffiliated issuers | 196,438,194 | |
| Fidelity Central Funds | (15,288) | |
| Foreign currency transactions | (380,071) | |
| Total net realized gain (loss) | 196,042,835 | |
| Change in net unrealized appreciation (depreciation) on: | ||
| Investment securities: | ||
| Unaffiliated issuers | (81,492,921) | |
| Fidelity Central Funds | 11,865 | |
| Assets and liabilities in foreign currencies | (454,285) | |
| Total change in net unrealized appreciation (depreciation) | (81,935,341) | |
| Net gain (loss) | 114,107,494 | |
| Net increase (decrease) in net assets resulting from operations | $159,408,380 |
See accompanying notes which are an integral part of the financial statements.
Statement of Changes in Net Assets
| Six months ended April 30, 2018 (Unaudited) | Year ended October 31, 2017 | |
| Increase (Decrease) in Net Assets | ||
| Operations | ||
| Net investment income (loss) | $45,300,886 | $85,275,934 |
| Net realized gain (loss) | 196,042,835 | 136,914,624 |
| Change in net unrealized appreciation (depreciation) | (81,935,341) | 1,248,492,417 |
| Net increase (decrease) in net assets resulting from operations | 159,408,380 | 1,470,682,975 |
| Distributions to shareholders from net investment income | (83,986,110) | (95,770,528) |
| Distributions to shareholders from net realized gain | (5,103,031) | (6,822,064) |
| Total distributions | (89,089,141) | (102,592,592) |
| Share transactions - net increase (decrease) | (448,106,251) | 1,304,095,173 |
| Redemption fees | – | 11,066 |
| Total increase (decrease) in net assets | (377,787,012) | 2,672,196,622 |
| Net Assets | ||
| Beginning of period | 7,985,959,749 | 5,313,763,127 |
| End of period | $7,608,172,737 | $7,985,959,749 |
| Other Information | ||
| Undistributed net investment income end of period | $43,603,647 | $82,288,871 |
See accompanying notes which are an integral part of the financial statements.
Financial Highlights
Fidelity Overseas Fund
| Six months ended (Unaudited) April 30, | Years endedOctober 31, | |||||
| 2018 | 2017 | 2016 | 2015 | 2014 | 2013 | |
| Selected Per–Share Data | ||||||
| Net asset value, beginning of period | $50.18 | $40.73 | $41.56 | $39.02 | $39.22 | $31.35 |
| Income from Investment Operations | ||||||
| Net investment income (loss)A | .29 | .58 | .75B | .52 | .77C | .54 |
| Net realized and unrealized gain (loss) | .75 | 9.65 | (1.15) | 2.69 | (.28) | 8.10 |
| Total from investment operations | 1.04 | 10.23 | (.40) | 3.21 | .49 | 8.64 |
| Distributions from net investment income | (.52) | (.72) | (.43) | (.67) | (.51) | (.77) |
| Distributions from net realized gain | (.03) | (.05) | (.01) | – | (.18) | – |
| Total distributions | (.55) | (.78)D | (.43)E | (.67) | (.69) | (.77) |
| Redemption fees added to paid in capitalA | – | –F | –F | –F | –F | –F |
| Net asset value, end of period | $50.67 | $50.18 | $40.73 | $41.56 | $39.02 | $39.22 |
| Total ReturnG,H | 2.10% | 25.63% | (.97)% | 8.34% | 1.27% | 28.17% |
| Ratios to Average Net AssetsI,J | ||||||
| Expenses before reductions | .99%K | 1.00% | 1.03% | 1.04% | 1.04% | 1.09% |
| Expenses net of fee waivers, if any | .99%K | 1.00% | 1.03% | 1.04% | 1.04% | 1.09% |
| Expenses net of all reductions | .98%K | 1.00% | 1.03% | 1.03% | 1.04% | 1.06% |
| Net investment income (loss) | 1.13%K | 1.30% | 1.88%B | 1.28% | 1.93%C | 1.54% |
| Supplemental Data | ||||||
| Net assets, end of period (000 omitted) | $6,392,929 | $6,828,078 | $4,569,084 | $3,844,290 | $2,738,667 | $1,874,922 |
| Portfolio turnover rateL | 33%K | 26%M | 33% | 28% | 41% | 42% |
A Calculated based on average shares outstanding during the period.
B Net Investment income per share reflects a large, non-recurring dividend which amounted to $.18 per share. Excluding this non-recurring dividend, the ratio of net investment income (loss) to average net assets would have been 1.42%.
C Net Investment income per share reflects a large, non-recurring dividend which amounted to $.24 per share. Excluding this non-recurring dividend, the ratio of net investment income (loss) to average net assets would have been 1.34%.
D Total distributions of $.78 per share is comprised of distributions from net investment income of $.723 and distributions from net realized gain of $.052 per share.
E Total distributions of $.43 per share is comprised of distributions from net investment income of $.428 and distributions from net realized gain of $.006 per share.
F Amount represents less than $.005 per share.
G Total returns for periods of less than one year are not annualized.
H Total returns would have been lower if certain expenses had not been reduced during the applicable periods shown.
I Fees and expenses of any underlying Fidelity Central Funds are not included in the Fund's expense ratio. The Fund indirectly bears its proportionate share of the expenses of any underlying Fidelity Central Funds.
J Expense ratios reflect operating expenses of the class. Expenses before reductions do not reflect amounts reimbursed by the investment adviser or reductions from brokerage service arrangements or reductions from other expense offset arrangements and do not represent the amount paid by the class during periods when reimbursements or reductions occur. Expenses net of fee waivers reflect expenses after reimbursement by the investment adviser but prior to reductions from brokerage service arrangements or other expense offset arrangements. Expenses net of all reductions represent the net expenses paid by the class.
K Annualized
L Amount does not include the portfolio activity of any underlying Fidelity Central Funds.
M Portfolio turnover rate excludes securities received or delivered in-kind.
See accompanying notes which are an integral part of the financial statements.
Fidelity Overseas Fund Class K
| Six months ended (Unaudited) April 30, | Years endedOctober 31, | |||||
| 2018 | 2017 | 2016 | 2015 | 2014 | 2013 | |
| Selected Per–Share Data | ||||||
| Net asset value, beginning of period | $50.11 | $40.67 | $41.49 | $38.96 | $39.17 | $31.32 |
| Income from Investment Operations | ||||||
| Net investment income (loss)A | .31 | .64 | .80B | .57 | .82C | .60 |
| Net realized and unrealized gain (loss) | .75 | 9.62 | (1.14) | 2.68 | (.28) | 8.08 |
| Total from investment operations | 1.06 | 10.26 | (.34) | 3.25 | .54 | 8.68 |
| Distributions from net investment income | (.57) | (.77) | (.47) | (.72) | (.58) | (.83) |
| Distributions from net realized gain | (.03) | (.05) | (.01) | – | (.18) | – |
| Total distributions | (.60) | (.82) | (.48) | (.72) | (.75)D | (.83) |
| Redemption fees added to paid in capitalA | – | –E | –E | –E | –E | –E |
| Net asset value, end of period | $50.57 | $50.11 | $40.67 | $41.49 | $38.96 | $39.17 |
| Total ReturnF,G | 2.15% | 25.80% | (.85)% | 8.47% | 1.41% | 28.37% |
| Ratios to Average Net AssetsH,I | ||||||
| Expenses before reductions | .88%J | .89% | .91% | .91% | .90% | .93% |
| Expenses net of fee waivers, if any | .88%J | .89% | .91% | .91% | .90% | .92% |
| Expenses net of all reductions | .87%J | .88% | .90% | .90% | .90% | .90% |
| Net investment income (loss) | 1.24%J | 1.42% | 2.00%B | 1.40% | 2.06%C | 1.71% |
| Supplemental Data | ||||||
| Net assets, end of period (000 omitted) | $1,215,244 | $1,157,882 | $744,679 | $691,585 | $626,817 | $562,490 |
| Portfolio turnover rateK | 33%J | 26%L | 33% | 28% | 41% | 42% |
A Calculated based on average shares outstanding during the period.
B Net Investment income per share reflects a large, non-recurring dividend which amounted to $.18 per share. Excluding this non-recurring dividend, the ratio of net investment income (loss) to average net assets would have been 1.55%.
C Net Investment income per share reflects a large, non-recurring dividend which amounted to $.24 per share. Excluding this non-recurring dividend, the ratio of net investment income (loss) to average net assets would have been 1.47%.
D Total distributions of $.75 per share is comprised of distributions from net investment income of $.575 and distributions from net realized gain of $.177 per share.
E Amount represents less than $.005 per share.
F Total returns for periods of less than one year are not annualized.
G Total returns would have been lower if certain expenses had not been reduced during the applicable periods shown.
H Fees and expenses of any underlying Fidelity Central Funds are not included in the Fund's expense ratio. The Fund indirectly bears its proportionate share of the expenses of any underlying Fidelity Central Funds.
I Expense ratios reflect operating expenses of the class. Expenses before reductions do not reflect amounts reimbursed by the investment adviser or reductions from brokerage service arrangements or reductions from other expense offset arrangements and do not represent the amount paid by the class during periods when reimbursements or reductions occur. Expenses net of fee waivers reflect expenses after reimbursement by the investment adviser but prior to reductions from brokerage service arrangements or other expense offset arrangements. Expenses net of all reductions represent the net expenses paid by the class.
J Annualized
K Amount does not include the portfolio activity of any underlying Fidelity Central Funds.
L Portfolio turnover rate excludes securities received or delivered in-kind.
See accompanying notes which are an integral part of the financial statements.
Notes to Financial Statements (Unaudited)
For the period ended April 30, 2018
1. Organization.
Fidelity Overseas Fund (the Fund) is a fund of Fidelity Investment Trust (the Trust) and is authorized to issue an unlimited number of shares. The Trust is registered under the Investment Company Act of 1940, as amended (the 1940 Act), as an open-end management investment company organized as a Massachusetts business trust. The Fund offers Overseas and Class K shares, each of which has equal rights as to assets and voting privileges. Each class has exclusive voting rights with respect to matters that affect that class.
2. Investments in Fidelity Central Funds.
The Fund invests in Fidelity Central Funds, which are open-end investment companies generally available only to other investment companies and accounts managed by the investment adviser and its affiliates. The Fund's Schedule of Investments lists each of the Fidelity Central Funds held as of period end, if any, as an investment of the Fund, but does not include the underlying holdings of each Fidelity Central Fund. As an Investing Fund, the Fund indirectly bears its proportionate share of the expenses of the underlying Fidelity Central Funds.
The Money Market Central Funds seek preservation of capital and current income and are managed by Fidelity Investments Money Management, Inc. (FIMM), an affiliate of the investment adviser. Annualized expenses of the Money Market Central Funds as of their most recent shareholder report date are less than .005%.
A complete unaudited list of holdings for each Fidelity Central Fund is available upon request or at the Securities and Exchange Commission (the SEC) website at www.sec.gov. In addition, the financial statements of the Fidelity Central Funds are available on the SEC website or upon request.
3. Significant Accounting Policies.
The Fund is an investment company and applies the accounting and reporting guidance of the Financial Accounting Standards Board (FASB) Accounting Standards Codification Topic 946 Financial Services – Investments Companies. The financial statements have been prepared in conformity with accounting principles generally accepted in the United States of America (GAAP), which require management to make certain estimates and assumptions at the date of the financial statements. Actual results could differ from those estimates. Subsequent events, if any, through the date that the financial statements were issued have been evaluated in the preparation of the financial statements. The following summarizes the significant accounting policies of the Fund:
Investment Valuation. Investments are valued as of 4:00 p.m. Eastern time on the last calendar day of the period. The Board of Trustees (the Board) has delegated the day to day responsibility for the valuation of the Fund's investments to the Fair Value Committee (the Committee) established by the Fund's investment adviser. In accordance with valuation policies and procedures approved by the Board, the Fund attempts to obtain prices from one or more third party pricing vendors or brokers to value its investments. When current market prices, quotations or currency exchange rates are not readily available or reliable, investments will be fair valued in good faith by the Committee, in accordance with procedures adopted by the Board. Factors used in determining fair value vary by investment type and may include market or investment specific events. The frequency with which these procedures are used cannot be predicted and they may be utilized to a significant extent. The Committee oversees the Fund's valuation policies and procedures and reports to the Board on the Committee's activities and fair value determinations. The Board monitors the appropriateness of the procedures used in valuing the Fund's investments and ratifies the fair value determinations of the Committee.
The Fund categorizes the inputs to valuation techniques used to value its investments into a disclosure hierarchy consisting of three levels as shown below:
- Level 1 – quoted prices in active markets for identical investments
- Level 2 – other significant observable inputs (including quoted prices for similar investments, interest rates, prepayment speeds, etc.)
- Level 3 – unobservable inputs (including the Fund's own assumptions based on the best information available)
Valuation techniques used to value the Fund's investments by major category are as follows:
Equity securities, including restricted securities, for which market quotations are readily available, are valued at the last reported sale price or official closing price as reported by a third party pricing vendor on the primary market or exchange on which they are traded and are categorized as Level 1 in the hierarchy. In the event there were no sales during the day or closing prices are not available, securities are valued at the last quoted bid price or may be valued using the last available price and are generally categorized as Level 2 in the hierarchy. For foreign equity securities, when market or security specific events arise, comparisons to the valuation of American Depositary Receipts (ADRs), futures contracts, Exchange-Traded Funds (ETFs) and certain indexes as well as quoted prices for similar securities may be used and would be categorized as Level 2 in the hierarchy. Utilizing these techniques may result in transfers between Level 1 and Level 2. For equity securities, including restricted securities, where observable inputs are limited, assumptions about market activity and risk are used and these securities may be categorized as Level 3 in the hierarchy.
Investments in open-end mutual funds, including the Fidelity Central Funds, are valued at their closing net asset value (NAV) each business day and are categorized as Level 1 in the hierarchy.
Changes in valuation techniques may result in transfers in or out of an assigned level within the disclosure hierarchy. The aggregate value of investments by input level as of April 30, 2018, including information on transfers between Levels 1 and 2, is included at the end of the Fund's Schedule of Investments.
Foreign Currency. The Fund may use foreign currency contracts to facilitate transactions in foreign-denominated securities. Gains and losses from these transactions may arise from changes in the value of the foreign currency or if the counterparties do not perform under the contracts' terms.
Foreign-denominated assets, including investment securities, and liabilities are translated into U.S. dollars at the exchange rates at period end. Purchases and sales of investment securities, income and dividends received and expenses denominated in foreign currencies are translated into U.S. dollars at the exchange rate in effect on the transaction date.
The effects of exchange rate fluctuations on investments are included with the net realized and unrealized gain (loss) on investment securities. Other foreign currency transactions resulting in realized and unrealized gain (loss) are disclosed separately.
Investment Transactions and Income. For financial reporting purposes, the Fund's investment holdings and NAV include trades executed through the end of the last business day of the period. The NAV per share for processing shareholder transactions is calculated as of the close of business of the New York Stock Exchange (NYSE), normally 4:00 p.m. Eastern time and includes trades executed through the end of the prior business day. Gains and losses on securities sold are determined on the basis of identified cost and includes proceeds received from litigation. Dividend income is recorded on the ex-dividend date, except for certain dividends from foreign securities where the ex-dividend date may have passed, which are recorded as soon as the Fund is informed of the ex-dividend date. Non-cash dividends included in dividend income, if any, are recorded at the fair market value of the securities received. Income and capital gain distributions from Fidelity Central Funds, if any, are recorded on the ex-dividend date. Certain distributions received by the Fund represent a return of capital or capital gain. The Fund determines the components of these distributions subsequent to the ex-dividend date, based upon receipt of tax filings or other correspondence relating to the underlying investment. These distributions are recorded as a reduction of cost of investments and/or as a realized gain. Investment income is recorded net of foreign taxes withheld where recovery of such taxes is uncertain.
Class Allocations and Expenses. Investment income, realized and unrealized capital gains and losses, common expenses of the Fund, and certain fund-level expense reductions, if any, are allocated daily on a pro-rata basis to each class based on the relative net assets of each class to the total net assets of the Fund. Each class differs with respect to transfer agent fees incurred. Certain expense reductions may also differ by class. For the reporting period, the allocated portion of income and expenses to each class as a percent of its average net assets may vary due to the timing of recording these transactions in relation to fluctuating net assets of the classes. Expenses directly attributable to a fund are charged to that fund. Expenses attributable to more than one fund are allocated among the respective funds on the basis of relative net assets or other appropriate methods. Expense estimates are accrued in the period to which they relate and adjustments are made when actual amounts are known.
Deferred Trustee Compensation. Under a Deferred Compensation Plan (the Plan), certain independent Trustees have elected to defer receipt of a portion of their annual compensation. Deferred amounts are invested in a cross-section of Fidelity funds, are marked-to-market and remain in the Fund until distributed in accordance with the Plan. The investment of deferred amounts and the offsetting payable to the Trustees are included in the accompanying Statement of Assets and Liabilities.
Income Tax Information and Distributions to Shareholders. Each year, the Fund intends to qualify as a regulated investment company under Subchapter M of the Internal Revenue Code, including distributing substantially all of its taxable income and realized gains. As a result, no provision for U.S. Federal income taxes is required. The Fund files a U.S. federal tax return, in addition to state and local tax returns as required. The Fund's federal income tax returns are subject to examination by the Internal Revenue Service (IRS) for a period of three fiscal years after they are filed. State and local tax returns may be subject to examination for an additional fiscal year depending on the jurisdiction. Foreign taxes are provided for based on the Fund's understanding of the tax rules and rates that exist in the foreign markets in which it invests.
Distributions are declared and recorded on the ex-dividend date. Income and capital gain distributions are declared separately for each class. Income and capital gain distributions are determined in accordance with income tax regulations, which may differ from GAAP.
Capital accounts within the financial statements are adjusted for permanent book-tax differences. These adjustments have no impact on net assets or the results of operations. Capital accounts are not adjusted for temporary book-tax differences which will reverse in a subsequent period.
Book-tax differences are primarily due to foreign currency transactions, passive foreign investment companies (PFIC), deferred trustees compensation, capital loss carryforwards, expiring capital loss carryforwards and losses deferred due to wash sales.
As of period end, the cost and unrealized appreciation (depreciation) in securities, and derivatives if applicable, for federal income tax purposes were as follows:
| Gross unrealized appreciation | $1,735,331,550 |
| Gross unrealized depreciation | (194,783,022) |
| Net unrealized appreciation (depreciation) | $1,540,548,528 |
| Tax cost | $6,187,527,664 |
Restricted Securities. The Fund may invest in securities that are subject to legal or contractual restrictions on resale. These securities generally may be resold in transactions exempt from registration or to the public if the securities are registered. Disposal of these securities may involve time-consuming negotiations and expense, and prompt sale at an acceptable price may be difficult. Information regarding restricted securities is included at the end of the Fund's Schedule of Investments.
4. Purchases and Sales of Investments.
Purchases and sales of securities, other than short-term securities, aggregated $1,297,976,581 and $1,697,231,533, respectively.
Prior Fiscal Year Exchanges In-Kind. During the prior period, investments and cash received in-kind through subscriptions totaled $257,590,200 in exchange for 5,518,213 shares of the Fund. The amount of in-kind exchanges is included in share transactions in the accompanying Statement of Changes in Net Assets as well as the Notes to Financial Statements. The Fund recognized no gain or loss for federal income tax purposes.
5. Fees and Other Transactions with Affiliates.
Management Fee. Fidelity Management & Research Company (the investment adviser) and its affiliates provide the Fund with investment management related services for which the Fund pays a monthly management fee. The management fee is the sum of an individual fund fee rate that is based on an annual rate of .424% of the Fund's average net assets and an annualized group fee rate that averaged .24% during the period. The group fee rate is based upon the average net assets of all the mutual funds advised by the investment adviser, including any mutual funds previously advised by the investment adviser that are currently advised by Fidelity SelectCo, LLC, an affiliate of the investment adviser. The group fee rate decreases as assets under management increase and increases as assets under management decrease. In addition, the management fee is subject to a performance adjustment (up to a maximum of +/- .20% of the Fund's average net assets over a 36 month performance period). The upward or downward adjustment to the management fee is based on the relative investment performance of Overseas as compared to its benchmark index, the MSCI EAFE Index, over the same 36 month performance period. For the reporting period, the total annualized management fee rate, including the performance adjustment, was .80% of the Fund's average net assets. The performance adjustment included in the management fee rate may be higher or lower than the maximum performance adjustment rate due to the difference between the average net assets for the reporting and performance periods.
Transfer Agent Fees. Fidelity Investments Institutional Operations Company, Inc., (FIIOC), an affiliate of the investment adviser, is the transfer, dividend disbursing and shareholder servicing agent for each class of the Fund. FIIOC receives account fees and asset-based fees that vary according to the account size and type of account of the shareholders of Overseas. FIIOC receives an asset-based fee of Class K's average net assets. FIIOC pays for typesetting, printing and mailing of shareholder reports, except proxy statements.
For the period, transfer agent fees for each class were as follows:
| Amount | % of Class-Level Average Net Assets(a) | |
| Overseas | $5,233,063 | .16 |
| Class K | 275,233 | .05 |
| $5,508,296 |
(a) Annualized
Accounting and Security Lending Fees. Fidelity Service Company, Inc. (FSC), an affiliate of the investment adviser, maintains the Fund's accounting records. The accounting fee is based on the level of average net assets for each month. Under a separate contract, FSC administers the security lending program. The security lending fee is based on the number and duration of lending transactions. For the period, the fees were equivalent to an annualized rate of .02%.
Brokerage Commissions. The Fund placed a portion of its portfolio transactions with brokerage firms which are affiliates of the investment adviser. Brokerage commissions are included in net realized gain (loss) and change in net unrealized appreciation (depreciation) in the Statement of Operations. The commissions paid to these affiliated firms were $4,869 for the period.
Interfund Lending Program. Pursuant to an Exemptive Order issued by the SEC, the Fund, along with other registered investment companies having management contracts with Fidelity Management & Research Company (FMR) or other affiliated entities of FMR, may participate in an interfund lending program. This program provides an alternative credit facility allowing the funds to borrow from, or lend money to, other participating affiliated funds. At period end, there were no interfund loans outstanding. The Fund's activity in this program during the period for which loans were outstanding was as follows:
| Borrower or Lender | Average Loan Balance | Weighted Average Interest Rate | Interest Expense |
| Borrower | $26,290,909 | 1.64% | $13,163 |
Interfund Trades. The Fund may purchase from or sell securities to other Fidelity Funds under procedures adopted by the Board. The procedures have been designed to ensure these interfund trades are executed in accordance with Rule 17a-7 of the 1940 Act. Interfund trades are included within the respective purchases and sales amounts shown in the Purchases and Sales of Investments note.
6. Committed Line of Credit.
The Fund participates with other funds managed by the investment adviser or an affiliate in a $4.25 billion credit facility (the "line of credit") to be utilized for temporary or emergency purposes to fund shareholder redemptions or for other short-term liquidity purposes. The Fund has agreed to pay commitment fees on its pro-rata portion of the line of credit, which amounted to $11,403 and is reflected in Miscellaneous expenses on the Statement of Operations. Interest is charged to the Fund based on its borrowing at a rate equal to .75% plus the higher of the Federal Funds Rate or one-month LIBOR. The Fund's average daily loan balance during the period for which loans were outstanding amounted to $6,700,000. The weighted average interest rate and interest expense was 2.45% and $456, respectively. At period end, there were no borrowings outstanding.
7. Security Lending.
The Fund lends portfolio securities through a lending agent from time to time in order to earn additional income. For equity securities, a lending agent is used and may loan securities to certain qualified borrowers, including Fidelity Capital Markets (FCM), a broker-dealer affiliated with the Fund. On the settlement date of the loan, the Fund receives collateral (in the form of U.S. Treasury obligations, letters of credit and/or cash) against the loaned securities and maintains collateral in an amount not less than 100% of the market value of the loaned securities during the period of the loan. The market value of the loaned securities is determined at the close of business of the Fund and any additional required collateral is delivered to the Fund on the next business day. The Fund or borrower may terminate the loan at any time, and if the borrower defaults on its obligation to return the securities loaned because of insolvency or other reasons, the Fund may apply collateral received from the borrower against the obligation. The Fund may experience delays and costs in recovering the securities loaned. Any cash collateral received is invested in the Fidelity Securities Lending Cash Central Fund. The value of loaned securities and cash collateral at period end are disclosed on the Fund's Statement of Assets and Liabilities. Security lending income represents the income earned on investing cash collateral, less rebates paid to borrowers and any lending agent fees associated with the loan, plus any premium payments received for lending certain types of securities. Security lending income is presented in the Statement of Operations as a component of income from Fidelity Central Funds. Total security lending income during the period amounted to $1,345,047. During the period, there were no securities loaned to FCM.
8. Expense Reductions.
Commissions paid to certain brokers with whom the investment adviser, or its affiliates, places trades on behalf of the Fund include an amount in addition to trade execution, which may be rebated back to the Fund to offset certain expenses. This amount totaled $263,935 for the period. In addition, through arrangements with the Fund's custodian, credits realized as a result of certain uninvested cash balances were used to reduce the Fund's expenses. During the period, these credits reduced the Fund's custody expenses by $546.
In addition, during the period the investment adviser reimbursed and/or waived a portion of fund-level operating expenses in the amount of $39,814.
9. Distributions to Shareholders.
Distributions to shareholders of each class were as follows:
| Six months ended April 30, 2018 | Year ended October 31, 2017 | |
| From net investment income | ||
| Overseas | $70,575,092 | $81,032,285 |
| Class K | 13,411,018 | 14,738,243 |
| Total | $83,986,110 | $95,770,528 |
| From net realized gain | ||
| Overseas | $4,351,452 | $5,828,046 |
| Class K | 751,579 | 994,018 |
| Total | $5,103,031 | $6,822,064 |
10. Share Transactions.
Share transactions for each class were as follows and may contain automatic conversions between classes or exchanges between affiliated funds:
| Shares | Shares | Dollars | Dollars | |
| Six months ended April 30, 2018 | Year ended October 31, 2017 | Six months ended April 30, 2018 | Year ended October 31, 2017 | |
| Overseas | ||||
| Shares sold | 15,152,557 | 43,630,558(a) | $766,940,516 | $1,962,017,751(a) |
| Reinvestment of distributions | 1,397,531 | 2,111,926 | 69,429,338 | 82,914,195 |
| Shares redeemed | (26,453,069) | (21,850,358) | (1,331,662,228) | (954,218,064) |
| Net increase (decrease) | (9,902,981) | 23,892,126 | $(495,292,374) | $1,090,713,882 |
| Class K | ||||
| Shares sold | 3,633,919 | 9,782,877 | $184,691,947 | $437,887,827 |
| Reinvestment of distributions | 285,767 | 401,743 | 14,162,597 | 15,732,261 |
| Shares redeemed | (2,996,981) | (5,385,134) | (151,668,421) | (240,238,797) |
| Net increase (decrease) | 922,705 | 4,799,486 | $47,186,123 | $213,381,291 |
(a) Amount includes in-kind exchanges (see the prior Exchanges In-Kind note for additional details).
11. Other.
The Fund's organizational documents provide former and current trustees and officers with a limited indemnification against liabilities arising in connection with the performance of their duties to the Fund. In the normal course of business, the Fund may also enter into contracts that provide general indemnifications. The Fund's maximum exposure under these arrangements is unknown as this would be dependent on future claims that may be made against the Fund. The risk of material loss from such claims is considered remote.
At the end of the period, mutual funds managed by the investment adviser or its affiliates were the owners of record, in the aggregate, of approximately 25% of the total outstanding shares of the Fund.
Fidelity® Worldwide Fund
Investment Summary (Unaudited)
Geographic Diversification (% of fund's net assets)
| As of April 30, 2018 | ||
| United States of America* | 60.3% | |
| Japan | 7.5% | |
| United Kingdom | 4.8% | |
| France | 3.9% | |
| Germany | 3.3% | |
| Switzerland | 2.7% | |
| Netherlands | 2.0% | |
| India | 1.7% | |
| Spain | 1.7% | |
| Other | 12.1% | |

* Includes Short-Term investments and Net Other Assets (Liabilities).
Percentages are based on country or territory of incorporation and are adjusted for the effect of futures contracts, if applicable.
Asset Allocation as of April 30, 2018
| % of fund's net assets | |
| Stocks and Equity Futures | 94.6 |
| Short-Term Investments and Net Other Assets (Liabilities) | 5.4 |
Top Ten Stocks as of April 30, 2018
| % of fund's net assets | |
| Microsoft Corp. (United States of America, Software) | 3.0 |
| Adobe Systems, Inc. (United States of America, Software) | 3.0 |
| S&P Global, Inc. (United States of America, Capital Markets) | 3.0 |
| Humana, Inc. (United States of America, Health Care Providers & Services) | 3.0 |
| Union Pacific Corp. (United States of America, Road & Rail) | 3.0 |
| Intuit, Inc. (United States of America, Software) | 2.8 |
| Bank of America Corp. (United States of America, Banks) | 2.7 |
| Charles Schwab Corp. (United States of America, Capital Markets) | 2.3 |
| MasterCard, Inc. Class A (United States of America, IT Services) | 2.1 |
| Amazon.com, Inc. (United States of America, Internet & Direct Marketing Retail) | 1.9 |
| 26.8 |
Top Market Sectors as of April 30, 2018
| % of fund's net assets | |
| Information Technology | 25.3 |
| Financials | 18.4 |
| Industrials | 12.5 |
| Health Care | 10.9 |
| Consumer Discretionary | 10.5 |
| Energy | 6.0 |
| Consumer Staples | 4.4 |
| Materials | 3.2 |
| Real Estate | 1.0 |
| Telecommunication Services | 0.6 |
Fidelity® Worldwide Fund
Schedule of Investments April 30, 2018 (Unaudited)
Showing Percentage of Net Assets
| Common Stocks - 93.0% | |||
| Shares | Value | ||
| Australia - 0.6% | |||
| Bapcor Ltd. (a) | 648,598 | $2,861,606 | |
| Blue Sky Alternative Investments Ltd. | 254,244 | 585,998 | |
| BWX Ltd. | 139,340 | 528,658 | |
| Inghams Group Ltd. (a) | 513,123 | 1,447,795 | |
| Link Administration Holdings Ltd. | 217,620 | 1,354,106 | |
| Magellan Financial Group Ltd. | 81,493 | 1,423,721 | |
| National Storage (REIT) unit | 796,515 | 956,304 | |
| Rio Tinto Ltd. | 12,098 | 720,002 | |
| Spark Infrastructure Group unit | 923,744 | 1,628,755 | |
| TOTAL AUSTRALIA | 11,506,945 | ||
| Austria - 0.6% | |||
| Erste Group Bank AG | 122,600 | 6,010,901 | |
| Wienerberger AG | 184,100 | 4,646,470 | |
| TOTAL AUSTRIA | 10,657,371 | ||
| Bailiwick of Jersey - 0.5% | |||
| Glencore Xstrata PLC | 1,650,524 | 7,968,873 | |
| Wizz Air Holdings PLC (b)(c) | 34,000 | 1,495,041 | |
| TOTAL BAILIWICK OF JERSEY | 9,463,914 | ||
| Belgium - 0.6% | |||
| Anheuser-Busch InBev SA NV | 13,411 | 1,339,661 | |
| KBC Groep NV | 91,790 | 8,025,222 | |
| Telenet Group Holding NV (b) | 30,600 | 1,794,416 | |
| TOTAL BELGIUM | 11,159,299 | ||
| Bermuda - 0.3% | |||
| Hiscox Ltd. | 237,200 | 4,862,378 | |
| Brazil - 0.0% | |||
| Itausa-Investimentos Itau SA | 25,702 | 99,046 | |
| Canada - 1.1% | |||
| Alimentation Couche-Tard, Inc. Class B (sub. vtg.) | 54,400 | 2,351,917 | |
| Cenovus Energy, Inc. | 228,100 | 2,284,642 | |
| Constellation Software, Inc. | 4,600 | 3,287,588 | |
| PrairieSky Royalty Ltd. (a) | 177,099 | 3,926,951 | |
| Shopify, Inc. (b) | 48,000 | 6,414,240 | |
| Suncor Energy, Inc. | 94,300 | 3,606,161 | |
| TOTAL CANADA | 21,871,499 | ||
| Cayman Islands - 0.7% | |||
| Alibaba Group Holding Ltd. sponsored ADR (b) | 38,900 | 6,945,206 | |
| China Literature Ltd. (b)(c) | 205,200 | 1,652,907 | |
| ENN Energy Holdings Ltd. | 185,000 | 1,730,033 | |
| New Oriental Education & Technology Group, Inc. sponsored ADR | 13,400 | 1,203,856 | |
| Ping An Healthcare and Technology Co. Ltd. (b) | 39,500 | 275,793 | |
| Tencent Holdings Ltd. | 22,000 | 1,081,584 | |
| Zai Lab Ltd. ADR | 25,100 | 468,617 | |
| TOTAL CAYMAN ISLANDS | 13,357,996 | ||
| China - 0.6% | |||
| Jiangsu Yanghe Brewery Joint-Stock Co. Ltd. Class A | 175,500 | 3,092,372 | |
| Kweichow Moutai Co. Ltd. (A Shares) | 35,800 | 3,727,819 | |
| Qingdao Port International Co. Ltd. (c) | 876,000 | 719,696 | |
| Shanghai International Airport Co. Ltd. (A Shares) | 401,700 | 3,155,010 | |
| TOTAL CHINA | 10,694,897 | ||
| Denmark - 0.4% | |||
| NNIT A/S (c) | 116,870 | 3,246,757 | |
| Novo Nordisk A/S Series B | 52,980 | 2,491,541 | |
| Novozymes A/S Series B | 25,100 | 1,180,023 | |
| TOTAL DENMARK | 6,918,321 | ||
| Finland - 0.2% | |||
| Sampo Oyj (A Shares) | 57,000 | 3,080,286 | |
| France - 3.9% | |||
| Accor SA | 69,300 | 3,922,395 | |
| ALTEN | 23,200 | 2,305,743 | |
| Altran Technologies SA | 112,500 | 1,738,944 | |
| Amundi SA (c) | 45,020 | 3,831,726 | |
| Atos Origin SA | 16,059 | 2,170,060 | |
| BNP Paribas SA | 64,000 | 4,944,784 | |
| Capgemini SA | 34,400 | 4,735,724 | |
| Cegedim SA (b) | 39,210 | 1,666,720 | |
| Elis SA | 77,700 | 1,859,721 | |
| Kaufman & Broad SA | 11,186 | 589,769 | |
| LVMH Moet Hennessy - Louis Vuitton SA | 16,646 | 5,793,010 | |
| Rexel SA | 145,600 | 2,259,371 | |
| Sartorius Stedim Biotech | 19,800 | 1,850,671 | |
| SMCP S.A.S. (c) | 20,994 | 536,076 | |
| Societe Generale Series A | 149,900 | 8,203,845 | |
| Thales SA | 29,100 | 3,689,822 | |
| Total SA (a) | 244,501 | 15,367,317 | |
| VINCI SA | 78,600 | 7,858,719 | |
| TOTAL FRANCE | 73,324,417 | ||
| Germany - 3.3% | |||
| adidas AG | 41,320 | 10,174,209 | |
| Aumann AG (c) | 10,915 | 660,366 | |
| Deutsche Borse AG | 9,362 | 1,259,087 | |
| Deutsche Post AG | 153,749 | 6,673,391 | |
| Fresenius SE & Co. KGaA | 65,400 | 5,002,406 | |
| Henkel AG & Co. KGaA | 24,900 | 2,969,337 | |
| JOST Werke AG (c) | 14,800 | 624,643 | |
| Linde AG | 19,700 | 4,378,498 | |
| MTU Aero Engines Holdings AG | 26,200 | 4,524,394 | |
| Muenchener Rueckversicherungs AG | 8,000 | 1,835,069 | |
| Nexus AG | 46,000 | 1,538,724 | |
| Rational AG | 3,100 | 1,944,779 | |
| Rheinmetall AG | 21,200 | 2,781,562 | |
| SAP SE | 87,323 | 9,702,081 | |
| Scout24 AG (c) | 39,400 | 2,043,061 | |
| WashTec AG | 36,200 | 3,492,838 | |
| Wirecard AG | 19,900 | 2,717,933 | |
| TOTAL GERMANY | 62,322,378 | ||
| Greece - 0.1% | |||
| Ff Group (b) | 59,300 | 1,124,288 | |
| Hong Kong - 0.3% | |||
| AIA Group Ltd. | 467,600 | 4,179,035 | |
| Techtronic Industries Co. Ltd. | 231,000 | 1,353,242 | |
| TOTAL HONG KONG | 5,532,277 | ||
| India - 1.7% | |||
| Avenue Supermarts Ltd. (b)(c) | 1,642 | 36,611 | |
| Bharti Infratel Ltd. | 101,893 | 479,550 | |
| Future Retail Ltd. | 111,000 | 1,002,952 | |
| HDFC Bank Ltd. | 117,751 | 3,548,993 | |
| HDFC Bank Ltd. sponsored ADR | 46,893 | 4,492,818 | |
| Housing Development Finance Corp. Ltd. | 245,878 | 6,956,632 | |
| Kajaria Ceramics Ltd. | 158,300 | 1,296,129 | |
| Kotak Mahindra Bank Ltd. (b) | 95,387 | 1,734,507 | |
| Lupin Ltd. (b) | 1,335 | 16,260 | |
| Petronet LNG Ltd. | 196,298 | 668,335 | |
| PNB Housing Finance Ltd. (c) | 53,911 | 1,131,532 | |
| PVR Ltd. (b) | 28,483 | 615,987 | |
| Reliance Industries Ltd. | 276,192 | 3,987,770 | |
| Sunteck Realty Ltd. (b) | 304,120 | 1,961,525 | |
| V-Mart Retail Ltd. (b) | 160,867 | 5,031,365 | |
| TOTAL INDIA | 32,960,966 | ||
| Indonesia - 0.2% | |||
| PT Bank Central Asia Tbk | 393,100 | 621,602 | |
| PT Bank Rakyat Indonesia Tbk | 11,290,800 | 2,603,303 | |
| PT Kino Indonesia Tbk | 234,500 | 34,124 | |
| TOTAL INDONESIA | 3,259,029 | ||
| Ireland - 1.5% | |||
| Accenture PLC Class A | 6,000 | 907,200 | |
| Cairn Homes PLC (b) | 1,721,239 | 3,733,109 | |
| CRH PLC | 141,649 | 5,030,157 | |
| Dalata Hotel Group PLC (b) | 249,800 | 1,990,946 | |
| DCC PLC (United Kingdom) | 23,400 | 2,255,035 | |
| Glenveagh Properties PLC (c) | 446,224 | 595,979 | |
| Green REIT PLC | 621,300 | 1,138,928 | |
| Greencore Group PLC | 372,815 | 814,791 | |
| James Hardie Industries PLC CDI | 171,226 | 3,023,756 | |
| Kerry Group PLC Class A | 31,700 | 3,234,738 | |
| Ryanair Holdings PLC sponsored ADR (b) | 24,970 | 2,745,951 | |
| United Drug PLC (United Kingdom) | 260,800 | 3,285,247 | |
| TOTAL IRELAND | 28,755,837 | ||
| Israel - 0.2% | |||
| Frutarom Industries Ltd. | 45,200 | 4,339,210 | |
| Italy - 0.5% | |||
| Intesa Sanpaolo SpA | 1,563,700 | 5,948,248 | |
| Prada SpA | 698,600 | 3,544,630 | |
| TOTAL ITALY | 9,492,878 | ||
| Japan - 6.3% | |||
| A/S One Corp. | 65,700 | 4,471,350 | |
| AEON Financial Service Co. Ltd. | 112,100 | 2,631,253 | |
| Ain Holdings, Inc. | 40,300 | 2,691,090 | |
| Daiichikosho Co. Ltd. | 49,200 | 2,587,816 | |
| Daito Trust Construction Co. Ltd. | 10,900 | 1,820,156 | |
| Hoya Corp. | 99,000 | 5,308,617 | |
| Keyence Corp. | 6,320 | 3,871,665 | |
| Komatsu Ltd. | 110,100 | 3,753,170 | |
| Minebea Mitsumi, Inc. | 213,400 | 4,288,692 | |
| Misumi Group, Inc. | 64,700 | 1,793,277 | |
| Mitsubishi UFJ Financial Group, Inc. | 712,000 | 4,771,356 | |
| Monex Group, Inc. (a) | 359,400 | 2,051,460 | |
| Morinaga & Co. Ltd. | 37,000 | 1,803,970 | |
| Nidec Corp. | 23,100 | 3,621,789 | |
| Nintendo Co. Ltd. | 8,600 | 3,613,518 | |
| Nitori Holdings Co. Ltd. | 33,500 | 5,663,008 | |
| ORIX Corp. | 385,600 | 6,786,447 | |
| PALTAC Corp. | 36,900 | 1,849,726 | |
| Panasonic Corp. | 423,900 | 6,276,751 | |
| Recruit Holdings Co. Ltd. | 48,000 | 1,109,550 | |
| Relo Group, Inc. | 175,700 | 3,963,375 | |
| Renesas Electronics Corp. (b) | 316,600 | 3,324,705 | |
| SMC Corp. | 15,800 | 6,029,784 | |
| SMS Co., Ltd. | 52,200 | 1,981,614 | |
| SoftBank Corp. | 56,600 | 4,324,733 | |
| Sony Corp. | 143,000 | 6,678,975 | |
| Start Today Co. Ltd. | 127,700 | 3,691,292 | |
| Sundrug Co. Ltd. | 59,700 | 3,074,561 | |
| Taiheiyo Cement Corp. | 94,000 | 3,564,124 | |
| Tateru, Inc. | 79,600 | 1,355,792 | |
| Tsuruha Holdings, Inc. | 32,500 | 4,676,409 | |
| VT Holdings Co. Ltd. | 280,200 | 1,278,996 | |
| Welcia Holdings Co. Ltd. | 112,200 | 5,778,321 | |
| TOTAL JAPAN | 120,487,342 | ||
| Kenya - 0.1% | |||
| Safaricom Ltd. | 6,251,600 | 1,760,795 | |
| Korea (South) - 0.1% | |||
| Hyundai Fire & Marine Insurance Co. Ltd. | 21,488 | 767,482 | |
| KB Financial Group, Inc. | 28,328 | 1,605,137 | |
| TOTAL KOREA (SOUTH) | 2,372,619 | ||
| Netherlands - 2.0% | |||
| ASML Holding NV (Netherlands) | 30,600 | 5,820,028 | |
| Basic-Fit NV (b)(c) | 37,100 | 1,117,809 | |
| IMCD Group BV | 66,600 | 4,105,755 | |
| ING Groep NV (Certificaten Van Aandelen) | 326,100 | 5,494,955 | |
| Instone Real Estate Group BV (b)(c) | 68,600 | 1,643,738 | |
| Koninklijke Philips Electronics NV | 168,458 | 7,130,192 | |
| NIBC Holding NV (b)(c) | 210,661 | 2,100,024 | |
| Philips Lighting NV (c) | 16,900 | 515,109 | |
| Unilever NV (Certificaten Van Aandelen) (Bearer) | 170,427 | 9,770,339 | |
| uniQure B.V. (b) | 27,300 | 797,160 | |
| Van Lanschot NV (Bearer) | 17,200 | 531,730 | |
| TOTAL NETHERLANDS | 39,026,839 | ||
| New Zealand - 0.4% | |||
| EBOS Group Ltd. | 210,137 | 2,628,816 | |
| Fisher & Paykel Healthcare Corp. | 242,612 | 2,176,448 | |
| Ryman Healthcare Group Ltd. | 465,018 | 3,468,179 | |
| TOTAL NEW ZEALAND | 8,273,443 | ||
| Norway - 0.8% | |||
| Statoil ASA | 560,080 | 14,322,763 | |
| Philippines - 0.2% | |||
| D&L Industries, Inc. | 8,349,900 | 1,750,207 | |
| SM Investments Corp. | 141,235 | 2,557,861 | |
| TOTAL PHILIPPINES | 4,308,068 | ||
| South Africa - 0.7% | |||
| Clicks Group Ltd. | 158,805 | 2,715,077 | |
| Distell Group Ltd. | 126,410 | 1,351,404 | |
| FirstRand Ltd. | 337,500 | 1,807,490 | |
| Naspers Ltd. Class N | 15,100 | 3,678,655 | |
| PSG Group Ltd. | 117,900 | 2,121,308 | |
| Remgro Ltd. | 95,000 | 1,710,345 | |
| TOTAL SOUTH AFRICA | 13,384,279 | ||
| Spain - 1.7% | |||
| Aedas Homes SAU (c) | 32,625 | 1,162,240 | |
| Amadeus IT Holding SA Class A | 39,800 | 2,917,393 | |
| CaixaBank SA | 2,086,684 | 10,147,282 | |
| Grifols SA ADR | 215,673 | 4,382,475 | |
| Masmovil Ibercom SA (b) | 35,552 | 5,134,738 | |
| Neinor Homes SLU (b)(c) | 66,100 | 1,281,947 | |
| Prosegur Cash SA (c) | 1,332,600 | 3,894,380 | |
| Zardoya Otis SA | 303,300 | 3,102,265 | |
| TOTAL SPAIN | 32,022,720 | ||
| Sweden - 0.9% | |||
| ASSA ABLOY AB (B Shares) | 203,600 | 4,282,816 | |
| Essity AB Class B | 170,400 | 4,339,468 | |
| HEXPOL AB (B Shares) | 118,900 | 1,235,621 | |
| Indutrade AB | 115,500 | 2,735,601 | |
| Saab AB (B Shares) (a) | 56,000 | 2,299,053 | |
| Svenska Cellulosa AB (SCA) (B Shares) | 272,500 | 3,028,521 | |
| TOTAL SWEDEN | 17,921,080 | ||
| Switzerland - 2.7% | |||
| Credit Suisse Group AG | 444,556 | 7,497,989 | |
| EDAG Engineering Group AG | 77,800 | 1,490,067 | |
| Forbo Holding AG (Reg.) | 1,310 | 1,840,081 | |
| Julius Baer Group Ltd. | 60,910 | 3,614,909 | |
| Kaba Holding AG (B Shares) (Reg.) | 2,620 | 2,035,721 | |
| Lonza Group AG | 18,382 | 4,529,651 | |
| Partners Group Holding AG | 5,008 | 3,671,354 | |
| Roche Holding AG (participation certificate) | 47,009 | 10,444,811 | |
| Schindler Holding AG (participation certificate) | 11,528 | 2,391,682 | |
| Swatch Group AG (Bearer) | 21,630 | 10,443,951 | |
| UBS Group AG | 251,400 | 4,254,266 | |
| TOTAL SWITZERLAND | 52,214,482 | ||
| Taiwan - 0.1% | |||
| United Microelectronics Corp. | 4,017,000 | 2,162,420 | |
| United Kingdom - 4.8% | |||
| Anglo American PLC (United Kingdom) | 89,900 | 2,115,645 | |
| Antofagasta PLC | 161,800 | 2,166,022 | |
| AstraZeneca PLC (United Kingdom) | 150,043 | 10,503,366 | |
| Barclays PLC | 3,920 | 11,176 | |
| BCA Marketplace PLC | 511,600 | 1,342,433 | |
| BHP Billiton PLC | 226,680 | 4,833,368 | |
| British American Tobacco PLC: | |||
| (United Kingdom) | 98,174 | 5,384,599 | |
| sponsored ADR | 27,000 | 1,474,740 | |
| Bunzl PLC | 129,986 | 3,777,671 | |
| Clipper Logistics PLC | 168,521 | 1,046,333 | |
| CMC Markets PLC (c) | 15,395 | 40,142 | |
| Compass Group PLC | 179,534 | 3,855,766 | |
| Conviviality PLC (d) | 367,080 | 255,712 | |
| Countryside Properties PLC (c) | 4,173 | 20,636 | |
| Cranswick PLC | 91,656 | 3,676,967 | |
| Dechra Pharmaceuticals PLC | 20,200 | 762,532 | |
| Fever-Tree Drinks PLC | 42,000 | 1,639,815 | |
| Hastings Group Holdings PLC (c) | 129,239 | 491,068 | |
| Hilton Food Group PLC | 374,800 | 4,571,646 | |
| Indivior PLC (b) | 256,800 | 1,601,874 | |
| JTC PLC (b)(c) | 342,900 | 1,446,896 | |
| LivaNova PLC (b) | 46,100 | 4,092,758 | |
| London Stock Exchange Group PLC | 49,781 | 2,946,941 | |
| Melrose Industries PLC | 1,766,892 | 5,546,055 | |
| Micro Focus International PLC | 219,930 | 3,792,282 | |
| NCC Group Ltd. | 584,200 | 1,581,191 | |
| Reckitt Benckiser Group PLC | 21,619 | 1,695,969 | |
| Rex Bionics PLC (b)(d) | 100,000 | 2,409 | |
| Rio Tinto PLC | 65,813 | 3,587,200 | |
| Senior Engineering Group PLC | 457,700 | 1,861,361 | |
| St. James's Place Capital PLC | 127,502 | 1,994,921 | |
| Standard Chartered PLC (United Kingdom) | 608,943 | 6,430,005 | |
| Tesco PLC | 64,230 | 208,037 | |
| The Weir Group PLC | 130,800 | 3,846,346 | |
| Zpg PLC | 641,900 | 3,172,496 | |
| TOTAL UNITED KINGDOM | 91,776,378 | ||
| United States of America - 54.9% | |||
| A.O. Smith Corp. | 55,000 | 3,374,250 | |
| Activision Blizzard, Inc. | 60,000 | 3,981,000 | |
| Adobe Systems, Inc. (b) | 259,124 | 57,421,878 | |
| Adtalem Global Education, Inc. (b) | 91,000 | 4,331,600 | |
| Agilent Technologies, Inc. | 50,900 | 3,346,166 | |
| Alphabet, Inc. Class A (b) | 29,500 | 30,048,110 | |
| Amazon.com, Inc. (b) | 23,000 | 36,020,990 | |
| American Tower Corp. | 28,000 | 3,818,080 | |
| Amphenol Corp. Class A | 34,000 | 2,846,140 | |
| Baker Hughes, a GE Co. Class A | 85,000 | 3,069,350 | |
| Bank of America Corp. | 1,711,000 | 51,193,120 | |
| BlackRock, Inc. Class A | 13,000 | 6,779,500 | |
| bluebird bio, Inc. (b) | 14,200 | 2,416,130 | |
| Boston Scientific Corp. (b) | 203,159 | 5,834,726 | |
| Broadridge Financial Solutions, Inc. | 15,000 | 1,608,150 | |
| Cboe Global Markets, Inc. | 7,000 | 747,460 | |
| Charles Schwab Corp. | 796,000 | 44,321,280 | |
| Chevron Corp. | 215,100 | 26,911,161 | |
| Chipotle Mexican Grill, Inc. (b) | 8,000 | 3,386,640 | |
| ConocoPhillips Co. | 268,600 | 17,593,300 | |
| CSX Corp. | 66,000 | 3,919,740 | |
| Dollar Tree, Inc. (b) | 55,000 | 5,273,950 | |
| DowDuPont, Inc. | 83,000 | 5,248,920 | |
| Edwards Lifesciences Corp. (b) | 13,000 | 1,655,680 | |
| Electronic Arts, Inc. (b) | 23,000 | 2,713,540 | |
| EOG Resources, Inc. | 100,000 | 11,817,000 | |
| Facebook, Inc. Class A (b) | 48,500 | 8,342,000 | |
| FibroGen, Inc. (b) | 15,000 | 681,750 | |
| FleetCor Technologies, Inc. (b) | 8,000 | 1,658,240 | |
| Fortive Corp. | 18,000 | 1,265,580 | |
| General Electric Co. | 520,000 | 7,316,400 | |
| Harris Corp. | 58,000 | 9,072,360 | |
| HealthSouth Corp. | 2 | 122 | |
| Humana, Inc. | 192,000 | 56,482,560 | |
| Intercept Pharmaceuticals, Inc. (a)(b) | 17,060 | 1,160,251 | |
| Intuit, Inc. | 289,000 | 53,404,310 | |
| Intuitive Surgical, Inc. (b) | 10,700 | 4,716,346 | |
| Kirby Corp. (b) | 50,000 | 4,265,000 | |
| Lowe's Companies, Inc. | 122,000 | 10,056,460 | |
| Marriott International, Inc. Class A | 194,000 | 26,515,920 | |
| MasterCard, Inc. Class A | 220,000 | 39,219,400 | |
| McCormick & Co., Inc. (non-vtg.) | 51,000 | 5,375,910 | |
| Microsoft Corp. | 616,000 | 57,608,323 | |
| MSCI, Inc. | 124,400 | 18,638,852 | |
| Nektar Therapeutics (b) | 121,000 | 10,122,860 | |
| Netflix, Inc. (b) | 23,000 | 7,186,580 | |
| Norfolk Southern Corp. | 142,000 | 20,372,740 | |
| Northrop Grumman Corp. | 72,000 | 23,186,880 | |
| OptiNose, Inc. (a) | 41,200 | 881,680 | |
| Parametric Technology Corp. (b) | 215,000 | 17,705,250 | |
| PayPal Holdings, Inc. (b) | 395,000 | 29,470,950 | |
| Phillips 66 Co. | 88,000 | 9,795,280 | |
| Raymond James Financial, Inc. | 44,000 | 3,949,000 | |
| Red Hat, Inc. (b) | 51,000 | 8,316,060 | |
| RingCentral, Inc. (b) | 40,245 | 2,698,427 | |
| S&P Global, Inc. | 301,092 | 56,785,951 | |
| Salesforce.com, Inc. (b) | 262,000 | 31,699,380 | |
| Sarepta Therapeutics, Inc. (b) | 69,000 | 5,268,840 | |
| Spirit Airlines, Inc. (b) | 23,000 | 821,560 | |
| Square, Inc. (b) | 755,000 | 35,741,700 | |
| Stamps.com, Inc. (b) | 7,000 | 1,594,250 | |
| SVB Financial Group (b) | 7,000 | 2,097,270 | |
| T. Rowe Price Group, Inc. | 39,000 | 4,438,980 | |
| The AES Corp. | 625,000 | 7,650,000 | |
| Union Pacific Corp. | 422,000 | 56,391,860 | |
| UnitedHealth Group, Inc. | 146,000 | 34,514,400 | |
| VF Corp. | 20,000 | 1,617,400 | |
| Visa, Inc. Class A | 119,000 | 15,098,720 | |
| Walmart, Inc. | 52,000 | 4,599,920 | |
| Whiting Petroleum Corp. (b) | 55,000 | 2,245,100 | |
| Workday, Inc. Class A (b) | 17,000 | 2,122,280 | |
| Worldpay, Inc. (b) | 14,000 | 1,137,080 | |
| Zoetis, Inc. Class A | 24,000 | 2,003,520 | |
| TOTAL UNITED STATES OF AMERICA | 1,044,971,563 | ||
| TOTAL COMMON STOCKS | |||
| (Cost $1,374,365,411) | 1,769,788,023 | ||
| Preferred Stocks - 0.4% | |||
| Convertible Preferred Stocks - 0.1% | |||
| Cayman Islands - 0.1% | |||
| China Internet Plus Holdings Ltd. Series A-11 (b)(d)(e) | 369,166 | 2,063,291 | |
| Nonconvertible Preferred Stocks - 0.3% | |||
| Brazil - 0.3% | |||
| Itausa-Investimentos Itau SA (PN) | 1,131,700 | 4,396,676 | |
| TOTAL PREFERRED STOCKS | |||
| (Cost $5,177,512) | 6,459,967 | ||
| Principal Amount | Value | ||
| Government Obligations - 0.0% | |||
| United States of America - 0.0% | |||
| U.S. Treasury Bills, yield at date of purchase 1.52% to 1.79% 5/10/18 to 7/19/18(f) | |||
| (Cost $638,334) | 640,000 | 638,347 | |
| Shares | Value | ||
| Money Market Funds - 6.6% | |||
| Fidelity Cash Central Fund, 1.74% (g) | 118,012,112 | 118,035,714 | |
| Fidelity Securities Lending Cash Central Fund 1.74% (g)(h) | 7,502,803 | 7,503,554 | |
| TOTAL MONEY MARKET FUNDS | |||
| (Cost $125,538,854) | 125,539,268 | ||
| TOTAL INVESTMENT IN SECURITIES - 100.0% | |||
| (Cost $1,505,720,111) | 1,902,425,605 | ||
| NET OTHER ASSETS (LIABILITIES) - 0.0% | (129,621) | ||
| NET ASSETS - 100% | $1,902,295,984 |
| Futures Contracts | |||||
| Number of contracts | Expiration Date | Notional Amount | Value | Unrealized Appreciation/(Depreciation) | |
| Purchased | |||||
| Equity Index Contracts | |||||
| TSE TOPIX Index Contracts (Japan) | 138 | June 2018 | $22,375,137 | $425,936 | $425,936 |
The notional amount of futures purchased as a percentage of Net Assets is 1.2%
Categorizations in the Schedule of Investments are based on country or territory of incorporation.
Legend
(a) Security or a portion of the security is on loan at period end.
(b) Non-income producing
(c) Security exempt from registration under Rule 144A of the Securities Act of 1933. These securities may be resold in transactions exempt from registration, normally to qualified institutional buyers. At the end of the period, the value of these securities amounted to $30,288,384 or 1.6% of net assets.
(d) Level 3 security
(e) Restricted securities - Investment in securities not registered under the Securities Act of 1933 (excluding 144A issues). At the end of the period, the value of restricted securities (excluding 144A issues) amounted to $2,063,291 or 0.1% of net assets.
(f) Security or a portion of the security was pledged to cover margin requirements for futures contracts. At period end, the value of securities pledged amounted to $638,347.
(g) Affiliated fund that is generally available only to investment companies and other accounts managed by Fidelity Investments. The rate quoted is the annualized seven-day yield of the fund at period end. A complete unaudited listing of the fund's holdings as of its most recent quarter end is available upon request. In addition, each Fidelity Central Fund's financial statements are available on the SEC's website or upon request.
(h) Investment made with cash collateral received from securities on loan.
Additional information on each restricted holding is as follows:
| Security | Acquisition Date | Acquisition Cost |
| China Internet Plus Holdings Ltd. Series A-11 | 1/26/15 | $1,166,878 |
Affiliated Central Funds
Information regarding fiscal year to date income earned by the Fund from investments in Fidelity Central Funds is as follows:
| Fund | Income earned |
| Fidelity Cash Central Fund | $370,315 |
| Fidelity Securities Lending Cash Central Fund | 99,761 |
| Total | $470,076 |
Amounts in the income column in the above table include any capital gain distributions from underlying funds, which are presented in the corresponding line-item in the Statement of Operations if applicable.
Investment Valuation
The following is a summary of the inputs used, as of April 30, 2018, involving the Fund's assets and liabilities carried at fair value. The inputs or methodology used for valuing securities may not be an indication of the risk associated with investing in those securities. For more information on valuation inputs, and their aggregation into the levels used below, please refer to the Investment Valuation section in the accompanying Notes to Financial Statements.
| Valuation Inputs at Reporting Date: | ||||
| Description | Total | Level 1 | Level 2 | Level 3 |
| Investments in Securities: | ||||
| Equities: | ||||
| Consumer Discretionary | $197,136,757 | $156,546,775 | $38,526,691 | $2,063,291 |
| Consumer Staples | 84,625,166 | 54,413,261 | 29,956,193 | 255,712 |
| Energy | 115,595,130 | 81,248,945 | 34,346,185 | -- |
| Financials | 347,547,138 | 270,568,688 | 76,978,450 | -- |
| Health Care | 211,228,405 | 180,364,033 | 30,861,963 | 2,409 |
| Industrials | 237,582,977 | 211,569,001 | 26,013,976 | -- |
| Information Technology | 482,591,079 | 460,885,088 | 21,705,991 | -- |
| Materials | 58,816,617 | 38,691,904 | 20,124,713 | -- |
| Real Estate | 18,416,117 | 15,498,288 | 2,917,829 | -- |
| Telecommunication Services | 11,699,816 | 6,895,533 | 4,804,283 | -- |
| Utilities | 11,008,788 | 7,650,000 | 3,358,788 | -- |
| Government Obligations | 638,347 | -- | 638,347 | -- |
| Money Market Funds | 125,539,268 | 125,539,268 | -- | -- |
| Total Investments in Securities: | $1,902,425,605 | $1,609,870,784 | $290,233,409 | $2,321,412 |
| Derivative Instruments: | ||||
| Assets | ||||
| Futures Contracts | $425,936 | $425,936 | $-- | $-- |
| Total Assets | $425,936 | $425,936 | $-- | $-- |
| Total Derivative Instruments: | $425,936 | $425,936 | $-- | $-- |
The following is a summary of transfers between Level 1 and Level 2 for the period ended April 30, 2018. Transfers are assumed to have occurred at the beginning of the period, and are primarily attributable to the valuation techniques used for foreign equity securities, as discussed in the accompanying Notes to Financial Statements:
| Transfers | Total |
| Level 1 to Level 2 | $84,534,408 |
| Level 2 to Level 1 | $84,248,426 |
Value of Derivative Instruments
The following table is a summary of the Fund's value of derivative instruments by primary risk exposure as of April 30, 2018. For additional information on derivative instruments, please refer to the Derivative Instruments section in the accompanying Notes to Financial Statements.
| Primary Risk Exposure / Derivative Type | Value | |
| Asset | Liability | |
| Equity Risk | ||
| Futures Contracts(a) | $425,936 | $0 |
| Total Equity Risk | 425,936 | 0 |
| Total Value of Derivatives | $425,936 | $0 |
(a) Reflects gross cumulative appreciation (depreciation) on futures contracts as presented in the Schedule of Investments. In the Statement of Assets and Liabilities, the period end daily variation margin is included in receivable or payable for daily variation margin on futures contracts, and the net cumulative appreciation (depreciation) is included in net unrealized appreciation (depreciation).
See accompanying notes which are an integral part of the financial statements.
Fidelity® Worldwide Fund
Financial Statements
Statement of Assets and Liabilities
| April 30, 2018 (Unaudited) | ||
| Assets | ||
| Investment in securities, at value (including securities loaned of $7,151,967) — See accompanying schedule: Unaffiliated issuers (cost $1,380,181,257) | $1,776,886,337 | |
| Fidelity Central Funds (cost $125,538,854) | 125,539,268 | |
| Total Investment in Securities (cost $1,505,720,111) | $1,902,425,605 | |
| Cash | 428,844 | |
| Receivable for investments sold | 18,019,511 | |
| Receivable for fund shares sold | 2,595,958 | |
| Dividends receivable | 3,653,288 | |
| Distributions receivable from Fidelity Central Funds | 159,647 | |
| Prepaid expenses | 834 | |
| Other receivables | 131,096 | |
| Total assets | 1,927,414,783 | |
| Liabilities | ||
| Payable for investments purchased | $14,013,013 | |
| Payable for fund shares redeemed | 1,638,069 | |
| Accrued management fee | 1,163,885 | |
| Distribution and service plan fees payable | 21,223 | |
| Payable for daily variation margin on futures contracts | 88,364 | |
| Other affiliated payables | 321,438 | |
| Other payables and accrued expenses | 368,850 | |
| Collateral on securities loaned | 7,503,957 | |
| Total liabilities | 25,118,799 | |
| Net Assets | $1,902,295,984 | |
| Net Assets consist of: | ||
| Paid in capital | $1,400,947,941 | |
| Undistributed net investment income | 2,587,840 | |
| Accumulated undistributed net realized gain (loss) on investments and foreign currency transactions | 101,972,231 | |
| Net unrealized appreciation (depreciation) on investments and assets and liabilities in foreign currencies | 396,787,972 | |
| Net Assets | $1,902,295,984 | |
| Calculation of Maximum Offering Price | ||
| Class A: | ||
| Net Asset Value and redemption price per share ($35,570,347 ÷ 1,321,010 shares) | $26.93 | |
| Maximum offering price per share (100/94.25 of $26.93) | $28.57 | |
| Class M: | ||
| Net Asset Value and redemption price per share ($11,401,637 ÷ 425,605 shares) | $26.79 | |
| Maximum offering price per share (100/96.50 of $26.79) | $27.76 | |
| Class C: | ||
| Net Asset Value and offering price per share ($10,996,552 ÷ 418,486 shares)(a) | $26.28 | |
| Worldwide: | ||
| Net Asset Value, offering price and redemption price per share ($1,818,839,662 ÷ 66,788,293 shares) | $27.23 | |
| Class I: | ||
| Net Asset Value, offering price and redemption price per share ($25,487,786 ÷ 940,556 shares) | $27.10 |
(a) Redemption price per share is equal to net asset value less any applicable contingent deferred sales charge.
See accompanying notes which are an integral part of the financial statements.
Statement of Operations
| Six months ended April 30, 2018 (Unaudited) | ||
| Investment Income | ||
| Dividends | $12,493,258 | |
| Interest | 1,820 | |
| Income from Fidelity Central Funds | 470,076 | |
| Income before foreign taxes withheld | 12,965,154 | |
| Less foreign taxes withheld | (734,238) | |
| Total income | 12,230,916 | |
| Expenses | ||
| Management fee | ||
| Basic fee | $6,135,841 | |
| Performance adjustment | 383,783 | |
| Transfer agent fees | 1,566,045 | |
| Distribution and service plan fees | 124,445 | |
| Accounting and security lending fees | 283,155 | |
| Custodian fees and expenses | 95,537 | |
| Independent trustees' fees and expenses | 3,609 | |
| Registration fees | 95,374 | |
| Audit | 34,335 | |
| Legal | 8,342 | |
| Miscellaneous | 5,601 | |
| Total expenses before reductions | 8,736,067 | |
| Expense reductions | (190,590) | 8,545,477 |
| Net investment income (loss) | 3,685,439 | |
| Realized and Unrealized Gain (Loss) | ||
| Net realized gain (loss) on: | ||
| Investment securities: | ||
| Unaffiliated issuers | 111,393,511 | |
| Fidelity Central Funds | 976 | |
| Foreign currency transactions | 56,927 | |
| Futures contracts | 529,760 | |
| Total net realized gain (loss) | 111,981,174 | |
| Change in net unrealized appreciation (depreciation) on: | ||
| Investment securities: | ||
| Unaffiliated issuers (net of increase in deferred foreign taxes of $198,684) | (21,319,848) | |
| Fidelity Central Funds | 11 | |
| Assets and liabilities in foreign currencies | 2,751 | |
| Futures contracts | (298,957) | |
| Total change in net unrealized appreciation (depreciation) | (21,616,043) | |
| Net gain (loss) | 90,365,131 | |
| Net increase (decrease) in net assets resulting from operations | $94,050,570 |
See accompanying notes which are an integral part of the financial statements.
Statement of Changes in Net Assets
| Six months ended April 30, 2018 (Unaudited) | Year ended October 31, 2017 | |
| Increase (Decrease) in Net Assets | ||
| Operations | ||
| Net investment income (loss) | $3,685,439 | $11,957,628 |
| Net realized gain (loss) | 111,981,174 | 144,161,836 |
| Change in net unrealized appreciation (depreciation) | (21,616,043) | 210,799,339 |
| Net increase (decrease) in net assets resulting from operations | 94,050,570 | 366,918,803 |
| Distributions to shareholders from net investment income | (10,719,880) | (12,665,638) |
| Distributions to shareholders from net realized gain | (103,628,896) | (4,590,871) |
| Total distributions | (114,348,776) | (17,256,509) |
| Share transactions - net increase (decrease) | 190,988,948 | (100,984,602) |
| Redemption fees | – | 2,108 |
| Total increase (decrease) in net assets | 170,690,742 | 248,679,800 |
| Net Assets | ||
| Beginning of period | 1,731,605,242 | 1,482,925,442 |
| End of period | $1,902,295,984 | $1,731,605,242 |
| Other Information | ||
| Undistributed net investment income end of period | $2,587,840 | $9,622,281 |
See accompanying notes which are an integral part of the financial statements.
Financial Highlights
Fidelity Worldwide Fund Class A
| Six months ended (Unaudited) April 30, | Years endedOctober 31, | |||||
| 2018 | 2017 | 2016 | 2015 | 2014 | 2013 | |
| Selected Per–Share Data | ||||||
| Net asset value, beginning of period | $27.28 | $21.83 | $22.88 | $24.64 | $25.18 | $19.69 |
| Income from Investment Operations | ||||||
| Net investment income (loss)A | .01 | .11 | .12 | .06 | .02 | .02 |
| Net realized and unrealized gain (loss) | 1.38 | 5.53 | (.35) | .58 | 1.46 | 5.66 |
| Total from investment operations | 1.39 | 5.64 | (.23) | .64 | 1.48 | 5.68 |
| Distributions from net investment income | (.09) | (.12) | (.07) | – | (.04) | (.11) |
| Distributions from net realized gain | (1.65) | (.07) | (.75) | (2.40) | (1.98) | (.08) |
| Total distributions | (1.74) | (.19) | (.82) | (2.40) | (2.02) | (.19) |
| Redemption fees added to paid in capitalA | – | –B | –B | –B | –B | –B |
| Net asset value, end of period | $26.93 | $27.28 | $21.83 | $22.88 | $24.64 | $25.18 |
| Total ReturnC,D,E | 5.37% | 26.06% | (1.09)% | 2.73% | 6.29% | 29.10% |
| Ratios to Average Net AssetsF,G | ||||||
| Expenses before reductions | 1.24%H | 1.12% | 1.22% | 1.27% | 1.31% | 1.45% |
| Expenses net of fee waivers, if any | 1.23%H | 1.12% | 1.22% | 1.26% | 1.31% | 1.45% |
| Expenses net of all reductions | 1.21%H | 1.11% | 1.22% | 1.26% | 1.31% | 1.42% |
| Net investment income (loss) | .11%H | .47% | .55% | .27% | .10% | .09% |
| Supplemental Data | ||||||
| Net assets, end of period (000 omitted) | $35,570 | $32,823 | $29,052 | $31,043 | $33,788 | $28,661 |
| Portfolio turnover rateI | 122%H | 111% | 117% | 151% | 163% | 161% |
A Calculated based on average shares outstanding during the period.
B Amount represents less than $.005 per share.
C Total returns for periods of less than one year are not annualized.
D Total returns would have been lower if certain expenses had not been reduced during the applicable periods shown.
E Total returns do not include the effect of the sales charges.
F Fees and expenses of any underlying Fidelity Central Funds are not included in the Fund's expense ratio. The Fund indirectly bears its proportionate share of the expenses of any underlying Fidelity Central Funds.
G Expense ratios reflect operating expenses of the class. Expenses before reductions do not reflect amounts reimbursed by the investment adviser or reductions from brokerage service arrangements or reductions from other expense offset arrangements and do not represent the amount paid by the class during periods when reimbursements or reductions occur. Expenses net of fee waivers reflect expenses after reimbursement by the investment adviser but prior to reductions from brokerage service arrangements or other expense offset arrangements. Expenses net of all reductions represent the net expenses paid by the class.
H Annualized
I Amount does not include the portfolio activity of any underlying Fidelity Central Funds.
See accompanying notes which are an integral part of the financial statements.
Fidelity Worldwide Fund Class M
| Six months ended (Unaudited) April 30, | Years endedOctober 31, | |||||
| 2018 | 2017 | 2016 | 2015 | 2014 | 2013 | |
| Selected Per–Share Data | ||||||
| Net asset value, beginning of period | $27.11 | $21.67 | $22.72 | $24.49 | $25.05 | $19.61 |
| Income from Investment Operations | ||||||
| Net investment income (loss)A | (.02) | .04 | .05 | (.01) | (.04) | (.04) |
| Net realized and unrealized gain (loss) | 1.37 | 5.50 | (.35) | .57 | 1.46 | 5.63 |
| Total from investment operations | 1.35 | 5.54 | (.30) | .56 | 1.42 | 5.59 |
| Distributions from net investment income | (.02) | (.03) | –B | – | – | (.07) |
| Distributions from net realized gain | (1.65) | (.07) | (.75) | (2.33) | (1.98) | (.08) |
| Total distributions | (1.67) | (.10) | (.75) | (2.33) | (1.98) | (.15) |
| Redemption fees added to paid in capitalA | – | –B | –B | –B | –B | –B |
| Net asset value, end of period | $26.79 | $27.11 | $21.67 | $22.72 | $24.49 | $25.05 |
| Total ReturnC,D,E | 5.22% | 25.68% | (1.38)% | 2.36% | 6.05% | 28.73% |
| Ratios to Average Net AssetsF,G | ||||||
| Expenses before reductions | 1.52%H | 1.42% | 1.53% | 1.57% | 1.58% | 1.71% |
| Expenses net of fee waivers, if any | 1.52%H | 1.42% | 1.52% | 1.56% | 1.58% | 1.70% |
| Expenses net of all reductions | 1.50%H | 1.41% | 1.52% | 1.56% | 1.58% | 1.68% |
| Net investment income (loss) | (.18)%H | .17% | .25% | (.04)% | (.17)% | (.16)% |
| Supplemental Data | ||||||
| Net assets, end of period (000 omitted) | $11,402 | $10,634 | $9,270 | $13,055 | $12,160 | $9,822 |
| Portfolio turnover rateI | 122%H | 111% | 117% | 151% | 163% | 161% |
A Calculated based on average shares outstanding during the period.
B Amount represents less than $.005 per share.
C Total returns for periods of less than one year are not annualized.
D Total returns would have been lower if certain expenses had not been reduced during the applicable periods shown.
E Total returns do not include the effect of the sales charges.
F Fees and expenses of any underlying Fidelity Central Funds are not included in the Fund's expense ratio. The Fund indirectly bears its proportionate share of the expenses of any underlying Fidelity Central Funds.
G Expense ratios reflect operating expenses of the class. Expenses before reductions do not reflect amounts reimbursed by the investment adviser or reductions from brokerage service arrangements or reductions from other expense offset arrangements and do not represent the amount paid by the class during periods when reimbursements or reductions occur. Expenses net of fee waivers reflect expenses after reimbursement by the investment adviser but prior to reductions from brokerage service arrangements or other expense offset arrangements. Expenses net of all reductions represent the net expenses paid by the class.
H Annualized
I Amount does not include the portfolio activity of any underlying Fidelity Central Funds.
See accompanying notes which are an integral part of the financial statements.
Fidelity Worldwide Fund Class C
| Six months ended (Unaudited) April 30, | Years endedOctober 31, | |||||
| 2018 | 2017 | 2016 | 2015 | 2014 | 2013 | |
| Selected Per–Share Data | ||||||
| Net asset value, beginning of period | $26.67 | $21.33 | $22.48 | $24.12 | $24.78 | $19.41 |
| Income from Investment Operations | ||||||
| Net investment income (loss)A | (.09) | (.07) | (.05) | (.12) | (.15) | (.14) |
| Net realized and unrealized gain (loss) | 1.35 | 5.42 | (.35) | .57 | 1.44 | 5.58 |
| Total from investment operations | 1.26 | 5.35 | (.40) | .45 | 1.29 | 5.44 |
| Distributions from net investment income | – | – | – | – | – | – |
| Distributions from net realized gain | (1.65) | (.01) | (.75) | (2.09) | (1.95) | (.07) |
| Total distributions | (1.65) | (.01) | (.75) | (2.09) | (1.95) | (.07) |
| Redemption fees added to paid in capitalA | – | –B | –B | –B | –B | –B |
| Net asset value, end of period | $26.28 | $26.67 | $21.33 | $22.48 | $24.12 | $24.78 |
| Total ReturnC,D,E | 4.96% | 25.10% | (1.88)% | 1.90% | 5.55% | 28.12% |
| Ratios to Average Net AssetsF,G | ||||||
| Expenses before reductions | 2.01%H | 1.89% | 2.01% | 2.07% | 2.04% | 2.15% |
| Expenses net of fee waivers, if any | 2.01%H | 1.89% | 2.01% | 2.07% | 2.04% | 2.14% |
| Expenses net of all reductions | 1.99%H | 1.88% | 2.00% | 2.06% | 2.03% | 2.12% |
| Net investment income (loss) | (.66)%H | (.30)% | (.24)% | (.54)% | (.63)% | (.60)% |
| Supplemental Data | ||||||
| Net assets, end of period (000 omitted) | $10,997 | $10,264 | $10,315 | $11,231 | $9,229 | $10,778 |
| Portfolio turnover rateI | 122%H | 111% | 117% | 151% | 163% | 161% |
A Calculated based on average shares outstanding during the period.
B Amount represents less than $.005 per share.
C Total returns for periods of less than one year are not annualized.
D Total returns would have been lower if certain expenses had not been reduced during the applicable periods shown.
E Total returns do not include the effect of the contingent deferred sales charge.
F Fees and expenses of any underlying Fidelity Central Funds are not included in the Fund's expense ratio. The Fund indirectly bears its proportionate share of the expenses of any underlying Fidelity Central Funds.
G Expense ratios reflect operating expenses of the class. Expenses before reductions do not reflect amounts reimbursed by the investment adviser or reductions from brokerage service arrangements or reductions from other expense offset arrangements and do not represent the amount paid by the class during periods when reimbursements or reductions occur. Expenses net of fee waivers reflect expenses after reimbursement by the investment adviser but prior to reductions from brokerage service arrangements or other expense offset arrangements. Expenses net of all reductions represent the net expenses paid by the class.
H Annualized
I Amount does not include the portfolio activity of any underlying Fidelity Central Funds.
See accompanying notes which are an integral part of the financial statements.
Fidelity Worldwide Fund
| Six months ended (Unaudited) April 30, | Years endedOctober 31, | |||||
| 2018 | 2017 | 2016 | 2015 | 2014 | 2013 | |
| Selected Per–Share Data | ||||||
| Net asset value, beginning of period | $27.61 | $22.09 | $23.14 | $24.92 | $25.41 | $19.85 |
| Income from Investment Operations | ||||||
| Net investment income (loss)A | .06 | .19 | .19 | .13 | .11 | .10 |
| Net realized and unrealized gain (loss) | 1.38 | 5.60 | (.35) | .58 | 1.47 | 5.70 |
| Total from investment operations | 1.44 | 5.79 | (.16) | .71 | 1.58 | 5.80 |
| Distributions from net investment income | (.17) | (.20) | (.14) | (.08) | (.09) | (.16) |
| Distributions from net realized gain | (1.65) | (.07) | (.75) | (2.41) | (1.98) | (.08) |
| Total distributions | (1.82) | (.27) | (.89) | (2.49) | (2.07) | (.24) |
| Redemption fees added to paid in capitalA | – | –B | –B | –B | –B | –B |
| Net asset value, end of period | $27.23 | $27.61 | $22.09 | $23.14 | $24.92 | $25.41 |
| Total ReturnC,D | 5.51% | 26.49% | (.78)% | 3.01% | 6.64% | 29.54% |
| Ratios to Average Net AssetsE,F | ||||||
| Expenses before reductions | .93%G | .81% | .91% | .96% | .98% | 1.11% |
| Expenses net of fee waivers, if any | .93%G | .81% | .91% | .96% | .97% | 1.11% |
| Expenses net of all reductions | .91%G | .80% | .90% | .95% | .97% | 1.08% |
| Net investment income (loss) | .42%G | .79% | .87% | .57% | .44% | .43% |
| Supplemental Data | ||||||
| Net assets, end of period (000 omitted) | $1,818,840 | $1,656,173 | $1,421,364 | $1,543,516 | $1,535,658 | $1,464,415 |
| Portfolio turnover rateH | 122%G | 111% | 117% | 151% | 163% | 161% |
A Calculated based on average shares outstanding during the period.
B Amount represents less than $.005 per share.
C Total returns for periods of less than one year are not annualized.
D Total returns would have been lower if certain expenses had not been reduced during the applicable periods shown.
E Fees and expenses of any underlying Fidelity Central Funds are not included in the Fund's expense ratio. The Fund indirectly bears its proportionate share of the expenses of any underlying Fidelity Central Funds.
F Expense ratios reflect operating expenses of the class. Expenses before reductions do not reflect amounts reimbursed by the investment adviser or reductions from brokerage service arrangements or reductions from other expense offset arrangements and do not represent the amount paid by the class during periods when reimbursements or reductions occur. Expenses net of fee waivers reflect expenses after reimbursement by the investment adviser but prior to reductions from brokerage service arrangements or other expense offset arrangements. Expenses net of all reductions represent the net expenses paid by the class.
G Annualized
H Amount does not include the portfolio activity of any underlying Fidelity Central Funds.
See accompanying notes which are an integral part of the financial statements.
Fidelity Worldwide Fund Class I
| Six months ended (Unaudited) April 30, | Years endedOctober 31, | |||||
| 2018 | 2017 | 2016 | 2015 | 2014 | 2013 | |
| Selected Per–Share Data | ||||||
| Net asset value, beginning of period | $27.49 | $21.99 | $23.03 | $24.81 | $25.31 | $19.78 |
| Income from Investment Operations | ||||||
| Net investment income (loss)A | .05 | .19 | .17 | .13 | .10 | .08 |
| Net realized and unrealized gain (loss) | 1.38 | 5.56 | (.35) | .58 | 1.47 | 5.68 |
| Total from investment operations | 1.43 | 5.75 | (.18) | .71 | 1.57 | 5.76 |
| Distributions from net investment income | (.18) | (.18) | (.11) | (.07) | (.09) | (.15) |
| Distributions from net realized gain | (1.65) | (.07) | (.75) | (2.41) | (1.98) | (.08) |
| Total distributions | (1.82)B | (.25) | (.86) | (2.49)C | (2.07) | (.23) |
| Redemption fees added to paid in capitalA | – | –D | –D | –D | –D | –D |
| Net asset value, end of period | $27.10 | $27.49 | $21.99 | $23.03 | $24.81 | $25.31 |
| Total ReturnE,F | 5.50% | 26.45% | (.86)% | 3.00% | 6.63% | 29.44% |
| Ratios to Average Net AssetsG,H | ||||||
| Expenses before reductions | .95%I | .83% | .99% | .98% | 1.01% | 1.17% |
| Expenses net of fee waivers, if any | .95%I | .83% | .99% | .98% | 1.01% | 1.17% |
| Expenses net of all reductions | .93%I | .82% | .98% | .97% | 1.00% | 1.14% |
| Net investment income (loss) | .39%I | .77% | .78% | .55% | .40% | .37% |
| Supplemental Data | ||||||
| Net assets, end of period (000 omitted) | $25,488 | $21,711 | $12,924 | $25,173 | $19,107 | $10,639 |
| Portfolio turnover rateJ | 122%I | 111% | 117% | 151% | 163% | 161% |
A Calculated based on average shares outstanding during the period.
B Total distributions of $1.82 per share is comprised of distributions from net investment income of $.176 and distributions from net realized gain of $1.648 per share.
C Total distributions of $2.49 per share is comprised of distributions from net investment income of $.074 and distributions from net realized gain of $2.413 per share.
D Amount represents less than $.005 per share.
E Total returns for periods of less than one year are not annualized.
F Total returns would have been lower if certain expenses had not been reduced during the applicable periods shown.
G Fees and expenses of any underlying Fidelity Central Funds are not included in the Fund's expense ratio. The Fund indirectly bears its proportionate share of the expenses of any underlying Fidelity Central Funds.
H Expense ratios reflect operating expenses of the class. Expenses before reductions do not reflect amounts reimbursed by the investment adviser or reductions from brokerage service arrangements or reductions from other expense offset arrangements and do not represent the amount paid by the class during periods when reimbursements or reductions occur. Expenses net of fee waivers reflect expenses after reimbursement by the investment adviser but prior to reductions from brokerage service arrangements or other expense offset arrangements. Expenses net of all reductions represent the net expenses paid by the class.
I Annualized
J Amount does not include the portfolio activity of any underlying Fidelity Central Funds.
See accompanying notes which are an integral part of the financial statements.
Notes to Financial Statements (Unaudited)
For the period ended April 30, 2018
1. Organization.
Fidelity Worldwide Fund (the Fund) is a fund of Fidelity Investment Trust (the Trust) and is authorized to issue an unlimited number of shares. The Trust is registered under the Investment Company Act of 1940, as amended (the 1940 Act), as an open-end management investment company organized as a Massachusetts business trust. The Fund offers Class A, Class M, Class C, Worldwide and Class I shares, each of which has equal rights as to assets and voting privileges. Each class has exclusive voting rights with respect to matters that affect that class.
2. Investments in Fidelity Central Funds.
The Fund invests in Fidelity Central Funds, which are open-end investment companies generally available only to other investment companies and accounts managed by the investment adviser and its affiliates. The Fund's Schedule of Investments lists each of the Fidelity Central Funds held as of period end, if any, as an investment of the Fund, but does not include the underlying holdings of each Fidelity Central Fund. As an Investing Fund, the Fund indirectly bears its proportionate share of the expenses of the underlying Fidelity Central Funds.
The Money Market Central Funds seek preservation of capital and current income and are managed by Fidelity Investments Money Management, Inc. (FIMM), an affiliate of the investment adviser. Annualized expenses of the Money Market Central Funds as of their most recent shareholder report date are less than .005%.
A complete unaudited list of holdings for each Fidelity Central Fund is available upon request or at the Securities and Exchange Commission (the SEC) website at www.sec.gov. In addition, the financial statements of the Fidelity Central Funds are available on the SEC website or upon request.
3. Significant Accounting Policies.
The Fund is an investment company and applies the accounting and reporting guidance of the Financial Accounting Standards Board (FASB) Accounting Standards Codification Topic 946 Financial Services – Investments Companies. The financial statements have been prepared in conformity with accounting principles generally accepted in the United States of America (GAAP), which require management to make certain estimates and assumptions at the date of the financial statements. Actual results could differ from those estimates. Subsequent events, if any, through the date that the financial statements were issued have been evaluated in the preparation of the financial statements. The following summarizes the significant accounting policies of the Fund:
Investment Valuation. Investments are valued as of 4:00 p.m. Eastern time on the last calendar day of the period. The Board of Trustees (the Board) has delegated the day to day responsibility for the valuation of the Fund's investments to the Fair Value Committee (the Committee) established by the Fund's investment adviser. In accordance with valuation policies and procedures approved by the Board, the Fund attempts to obtain prices from one or more third party pricing vendors or brokers to value its investments. When current market prices, quotations or currency exchange rates are not readily available or reliable, investments will be fair valued in good faith by the Committee, in accordance with procedures adopted by the Board. Factors used in determining fair value vary by investment type and may include market or investment specific events, changes in interest rates and credit quality. The frequency with which these procedures are used cannot be predicted and they may be utilized to a significant extent. The Committee oversees the Fund's valuation policies and procedures and reports to the Board on the Committee's activities and fair value determinations. The Board monitors the appropriateness of the procedures used in valuing the Fund's investments and ratifies the fair value determinations of the Committee.
The Fund categorizes the inputs to valuation techniques used to value its investments into a disclosure hierarchy consisting of three levels as shown below:
- Level 1 – quoted prices in active markets for identical investments
- Level 2 – other significant observable inputs (including quoted prices for similar investments, interest rates, prepayment speeds, etc.)
- Level 3 – unobservable inputs (including the Fund's own assumptions based on the best information available)
Valuation techniques used to value the Fund's investments by major category are as follows:
Equity securities, including restricted securities, for which market quotations are readily available, are valued at the last reported sale price or official closing price as reported by a third party pricing vendor on the primary market or exchange on which they are traded and are categorized as Level 1 in the hierarchy. In the event there were no sales during the day or closing prices are not available, securities are valued at the last quoted bid price or may be valued using the last available price and are generally categorized as Level 2 in the hierarchy. For foreign equity securities, when market or security specific events arise, comparisons to the valuation of American Depositary Receipts (ADRs), futures contracts, Exchange-Traded Funds (ETFs) and certain indexes as well as quoted prices for similar securities may be used and would be categorized as Level 2 in the hierarchy. Utilizing these techniques may result in transfers between Level 1 and Level 2. For equity securities, including restricted securities, where observable inputs are limited, assumptions about market activity and risk are used and these securities may be categorized as Level 3 in the hierarchy.
Debt securities, including restricted securities, are valued based on evaluated prices received from third party pricing vendors or from brokers who make markets in such securities. U.S. government and government agency obligations are valued by pricing vendors who utilize matrix pricing which considers yield or price of bonds of comparable quality, coupon, maturity and type or by broker-supplied prices. When independent prices are unavailable or unreliable, debt securities may be valued utilizing pricing methodologies which consider similar factors that would be used by third party pricing vendors. Debt securities are generally categorized as Level 2 in the hierarchy but may be Level 3 depending on the circumstances.
Futures contracts are valued at the settlement price established each day by the board of trade or exchange on which they are traded and are categorized as Level 1 in the hierarchy. Investments in open-end mutual funds, including the Fidelity Central Funds, are valued at their closing net asset value (NAV) each business day and are categorized as Level 1 in the hierarchy.
Changes in valuation techniques may result in transfers in or out of an assigned level within the disclosure hierarchy. The aggregate value of investments by input level as of April 30, 2018, including information on transfers between Levels 1 and 2, is included at the end of the Fund's Schedule of Investments.
Foreign Currency. The Fund may use foreign currency contracts to facilitate transactions in foreign-denominated securities. Gains and losses from these transactions may arise from changes in the value of the foreign currency or if the counterparties do not perform under the contracts' terms.
Foreign-denominated assets, including investment securities, and liabilities are translated into U.S. dollars at the exchange rates at period end. Purchases and sales of investment securities, income and dividends received and expenses denominated in foreign currencies are translated into U.S. dollars at the exchange rate in effect on the transaction date.
The effects of exchange rate fluctuations on investments are included with the net realized and unrealized gain (loss) on investment securities. Other foreign currency transactions resulting in realized and unrealized gain (loss) are disclosed separately.
Investment Transactions and Income. For financial reporting purposes, the Fund's investment holdings and NAV include trades executed through the end of the last business day of the period. The NAV per share for processing shareholder transactions is calculated as of the close of business of the New York Stock Exchange (NYSE), normally 4:00 p.m. Eastern time and includes trades executed through the end of the prior business day. Gains and losses on securities sold are determined on the basis of identified cost and includes proceeds received from litigation. Dividend income is recorded on the ex-dividend date, except for certain dividends from foreign securities where the ex-dividend date may have passed, which are recorded as soon as the Fund is informed of the ex-dividend date. Non-cash dividends included in dividend income, if any, are recorded at the fair market value of the securities received. Income and capital gain distributions from Fidelity Central Funds, if any, are recorded on the ex-dividend date. Certain distributions received by the Fund represent a return of capital or capital gain. The Fund determines the components of these distributions subsequent to the ex-dividend date, based upon receipt of tax filings or other correspondence relating to the underlying investment. These distributions are recorded as a reduction of cost of investments and/or as a realized gain. Interest income is accrued as earned and includes coupon interest and amortization of premium and accretion of discount on debt securities as applicable. Investment income is recorded net of foreign taxes withheld where recovery of such taxes is uncertain.
Class Allocations and Expenses. Investment income, realized and unrealized capital gains and losses, common expenses of the Fund, and certain fund-level expense reductions, if any, are allocated daily on a pro-rata basis to each class based on the relative net assets of each class to the total net assets of the Fund. Each class differs with respect to transfer agent and distribution and service plan fees incurred. Certain expense reductions may also differ by class. For the reporting period, the allocated portion of income and expenses to each class as a percent of its average net assets may vary due to the timing of recording these transactions in relation to fluctuating net assets of the classes. Expenses directly attributable to a fund are charged to that fund. Expenses attributable to more than one fund are allocated among the respective funds on the basis of relative net assets or other appropriate methods. Expense estimates are accrued in the period to which they relate and adjustments are made when actual amounts are known.
Income Tax Information and Distributions to Shareholders. Each year, the Fund intends to qualify as a regulated investment company under Subchapter M of the Internal Revenue Code, including distributing substantially all of its taxable income and realized gains. As a result, no provision for U.S. Federal income taxes is required. The Fund files a U.S. federal tax return, in addition to state and local tax returns as required. The Fund's federal income tax returns are subject to examination by the Internal Revenue Service (IRS) for a period of three fiscal years after they are filed. State and local tax returns may be subject to examination for an additional fiscal year depending on the jurisdiction. Foreign taxes are provided for based on the Fund's understanding of the tax rules and rates that exist in the foreign markets in which it invests. The Fund is subject to a tax imposed on capital gains by certain countries in which it invests. An estimated deferred tax liability for net unrealized appreciation on the applicable securities is included in Other payables and accrued expenses on the Statement of Assets & Liabilities.
Distributions are declared and recorded on the ex-dividend date. Income and capital gain distributions are declared separately for each class. Income and capital gain distributions are determined in accordance with income tax regulations, which may differ from GAAP
Capital accounts within the financial statements are adjusted for permanent book-tax differences. These adjustments have no impact on net assets or the results of operations. Capital accounts are not adjusted for temporary book-tax differences which will reverse in a subsequent period.
Book-tax differences are primarily due to foreign currency transactions, certain foreign taxes, partnerships, passive foreign investment companies (PFIC), market discount, deferred trustees compensation, capital loss carryforwards and losses deferred due to wash sales.
As of period end, the cost and unrealized appreciation (depreciation) in securities, and derivatives if applicable, for federal income tax purposes were as follows:
| Gross unrealized appreciation | $422,693,405 |
| Gross unrealized depreciation | (34,928,488) |
| Net unrealized appreciation (depreciation) | $387,764,917 |
| Tax cost | $1,515,086,624 |
Restricted Securities. The Fund may invest in securities that are subject to legal or contractual restrictions on resale. These securities generally may be resold in transactions exempt from registration or to the public if the securities are registered. Disposal of these securities may involve time-consuming negotiations and expense, and prompt sale at an acceptable price may be difficult. Information regarding restricted securities is included at the end of the Fund's Schedule of Investments.
4. Derivative Instruments.
Risk Exposures and the Use of Derivative Instruments. The Fund's investment objective allows the Fund to enter into various types of derivative contracts, including futures contracts. Derivatives are investments whose value is primarily derived from underlying assets, indices or reference rates and may be transacted on an exchange or over-the-counter (OTC). Derivatives may involve a future commitment to buy or sell a specified asset based on specified terms, to exchange future cash flows at periodic intervals based on a notional principal amount, or for one party to make one or more payments upon the occurrence of specified events in exchange for periodic payments from the other party.
The Fund used derivatives to increase returns and to manage exposure to certain risks as defined below. The success of any strategy involving derivatives depends on analysis of numerous economic factors, and if the strategies for investment do not work as intended, the Fund may not achieve its objectives.
The Fund's use of derivatives increased or decreased its exposure to the following risk:
| Equity Risk | Equity risk relates to the fluctuations in the value of financial instruments as a result of changes in market prices (other than those arising from interest rate risk or foreign exchange risk), whether caused by factors specific to an individual investment, its issuer, or all factors affecting all instruments traded in a market or market segment. |
The Fund is also exposed to additional risks from investing in derivatives, such as liquidity risk and counterparty credit risk. Liquidity risk is the risk that the Fund will be unable to close out the derivative in the open market in a timely manner. Counterparty credit risk is the risk that the counterparty will not be able to fulfill its obligation to the Fund. Counterparty credit risk related to exchange-traded futures contracts may be mitigated by the protection provided by the exchange on which they trade.
Investing in derivatives may involve greater risks than investing in the underlying assets directly and, to varying degrees, may involve risk of loss in excess of any initial investment and collateral received and amounts recognized in the Statement of Assets and Liabilities. In addition, there may be the risk that the change in value of the derivative contract does not correspond to the change in value of the underlying instrument.
Futures Contracts. A futures contract is an agreement between two parties to buy or sell a specified underlying instrument for a fixed price at a specified future date. The Fund used futures contracts to manage its exposure to the stock market.
Upon entering into a futures contract, a fund is required to deposit either cash or securities (initial margin) with a clearing broker in an amount equal to a certain percentage of the face value of the contract. Futures contracts are marked-to-market daily and subsequent daily payments (variation margin) are made or received by a fund depending on the daily fluctuations in the value of the futures contracts and are recorded as unrealized appreciation or (depreciation). This receivable and/or payable, if any, is included in daily variation margin on futures contracts in the Statement of Assets and Liabilities. Realized gain or (loss) is recorded upon the expiration or closing of a futures contract. The net realized gain (loss) and change in net unrealized appreciation (depreciation) on futures contracts during the period is presented in the Statement of Operations.
Any open futures contracts at period end are presented in the Schedule of Investments under the caption "Futures Contracts". The notional amount at value reflects each contract's exposure to the underlying instrument or index at period end and is representative of volume of activity during the period. Securities deposited to meet initial margin requirements are identified in the Schedule of Investments.
5. Purchases and Sales of Investments.
Purchases and sales of securities, other than short-term securities, aggregated $1,092,564,022 and $1,096,412,218, respectively.
6. Fees and Other Transactions with Affiliates.
Management Fee. Fidelity Management & Research Company (the investment adviser) and its affiliates provide the Fund with investment management related services for which the Fund pays a monthly management fee. The management fee is the sum of an individual fund fee rate that is based on an annual rate of .424% of the Fund's average net assets and an annualized group fee rate that averaged .24% during the period. The group fee rate is based upon the average net assets of all the mutual funds advised by the investment adviser, including any mutual funds previously advised by the investment adviser that are currently advised by Fidelity SelectCo, LLC, an affiliate of the investment adviser. The group fee rate decreases as assets under management increase and increases as assets under management decrease. In addition, the management fee is subject to a performance adjustment (up to a maximum of +/- .20% of the Fund's average net assets over a 36 month performance period). The upward or downward adjustment to the management fee is based on the relative investment performance of Worldwide as compared to its benchmark index, the MSCI World Index, over the same 36 month performance period. For the reporting period, the total annualized management fee rate, including the performance adjustment, was .71% of the Fund's average net assets. The performance adjustment included in the management fee rate may be higher or lower than the maximum performance adjustment rate due to the difference between the average net assets for the reporting and performance periods.
Distribution and Service Plan Fees. In accordance with Rule 12b-1 of the 1940 Act, the Fund has adopted separate Distribution and Service Plans for each class of shares. Certain classes pay Fidelity Distributors Corporation (FDC), an affiliate of the investment adviser, separate Distribution and Service Fees, each of which is based on an annual percentage of each class' average net assets. In addition, FDC may pay financial intermediaries for selling shares of the Fund and providing shareholder support services. For the period, the Distribution and Service Fee rates, total fees and amounts retained by FDC were as follows:
| Distribution Fee | Service Fee | Total Fees | Retained by FDC | |
| Class A | -% | .25% | $42,426 | $1,315 |
| Class M | .25% | .25% | 27,863 | 295 |
| Class C | .75% | .25% | 54,156 | 5,394 |
| $124,445 | $7,004 |
Sales Load. FDC may receive a front-end sales charge of up to 5.75% for selling Class A shares and 3.50% for selling Class M shares, some of which is paid to financial intermediaries for selling shares of the Fund. Depending on the holding period, FDC may receive contingent deferred sales charges levied on Class A, Class M and Class C redemptions. The deferred sales charges are 1.00% for Class C shares, 1.00% for certain purchases of Class A shares and .25% for certain purchases of Class M shares.
For the period, sales charge amounts retained by FDC were as follows:
| Retained by FDC | |
| Class A | $12,070 |
| Class M | 1,933 |
| Class C(a) | 757 |
| $14,760 |
(a) When Class C shares are initially sold, FDC pays commissions from its own resources to financial intermediaries through which the sales are made.
Transfer Agent Fees. Fidelity Investments Institutional Operations Company, Inc., (FIIOC), an affiliate of the investment adviser, is the transfer, dividend disbursing and shareholder servicing agent for each class of the Fund. FIIOC receives account fees and asset-based fees that vary according to the account size and type of account of the shareholders of the respective classes of the Fund. FIIOC pays for typesetting, printing and mailing of shareholder reports, except proxy statements.
For the period, transfer agent fees for each class were as follows:
| Amount | % of Class-Level Average Net Assets(a) | |
| Class A | $37,700 | .22 |
| Class M | 14,558 | .26 |
| Class C | 13,240 | .24 |
| Worldwide | 1,477,266 | .17 |
| Class I | 23,281 | .19 |
| $1,566,045 |
(a) Annualized
Accounting and Security Lending Fees. Fidelity Service Company, Inc. (FSC), an affiliate of the investment adviser, maintains the Fund's accounting records. The accounting fee is based on the level of average net assets for each month. Under a separate contract, FSC administers the security lending program. The security lending fee is based on the number and duration of lending transactions. For the period, the fees were equivalent to an annualized rate of .03%.
Brokerage Commissions. The Fund placed a portion of its portfolio transactions with brokerage firms which are affiliates of the investment adviser. Brokerage commissions are included in net realized gain (loss) and change in net unrealized appreciation (depreciation) in the Statement of Operations. The commissions paid to these affiliated firms were $18,055 for the period.
Interfund Trades. The Fund may purchase from or sell securities to other Fidelity Funds under procedures adopted by the Board. The procedures have been designed to ensure these interfund trades are executed in accordance with Rule 17a-7 of the 1940 Act. Interfund trades are included within the respective purchases and sales amounts shown in the Purchases and Sales of Investments note.
7. Committed Line of Credit.
The Fund participates with other funds managed by the investment adviser or an affiliate in a $4.25 billion credit facility (the "line of credit") to be utilized for temporary or emergency purposes to fund shareholder redemptions or for other short-term liquidity purposes. The Fund has agreed to pay commitment fees on its pro-rata portion of the line of credit, which amounted to $2,575 and is reflected in Miscellaneous expenses on the Statement of Operations. During the period, the Fund did not borrow on this line of credit.
8. Security Lending.
The Fund lends portfolio securities through a lending agent from time to time in order to earn additional income. For equity securities, a lending agent is used and may loan securities to certain qualified borrowers, including Fidelity Capital Markets (FCM), a broker-dealer affiliated with the Fund. On the settlement date of the loan, the Fund receives collateral (in the form of U.S. Treasury obligations, letters of credit and/or cash) against the loaned securities and maintains collateral in an amount not less than 100% of the market value of the loaned securities during the period of the loan. The market value of the loaned securities is determined at the close of business of the Fund and any additional required collateral is delivered to the Fund on the next business day. The Fund or borrower may terminate the loan at any time, and if the borrower defaults on its obligation to return the securities loaned because of insolvency or other reasons, the Fund may apply collateral received from the borrower against the obligation. The Fund may experience delays and costs in recovering the securities loaned. Any cash collateral received is invested in the Fidelity Securities Lending Cash Central Fund. The value of loaned securities and cash collateral at period end are disclosed on the Fund's Statement of Assets and Liabilities. The value of loaned securities to FCM at period end was $184,040. Security lending income represents the income earned on investing cash collateral, less rebates paid to borrowers and any lending agent fees associated with the loan, plus any premium payments received for lending certain types of securities. Security lending income is presented in the Statement of Operations as a component of income from Fidelity Central Funds. Total security lending income during the period amounted to $99,761, including $710 from securities loaned to FCM.
9. Expense Reductions.
Commissions paid to certain brokers with whom the investment adviser, or its affiliates, places trades on behalf of the Fund include an amount in addition to trade execution, which may be rebated back to the Fund to offset certain expenses. This amount totaled $181,494 for the period. In addition, through arrangements with the Fund's custodian, credits realized as a result of certain uninvested cash balances were used to reduce the Fund's expenses. During the period, these credits reduced the Fund's custody expenses by $326.
In addition, during the period the investment adviser reimbursed and/or waived a portion of fund-level operating expenses in the amount of $8,770.
10. Distributions to Shareholders.
Distributions to shareholders of each class were as follows:
| Six months ended April 30, 2018 | Year ended October 31, 2017 | |
| From net investment income | ||
| Class A | $109,584 | $156,512 |
| Class M | 7,454 | 13,192 |
| Worldwide | 10,457,481 | 12,387,164 |
| Class I | 145,361 | 108,770 |
| Total | $10,719,880 | $12,665,638 |
| From net realized gain | ||
| Class A | $1,941,882 | $90,544 |
| Class M | 646,560 | 29,788 |
| Class C | 633,806 | 5,172 |
| Worldwide | 99,045,540 | 4,423,987 |
| Class I | 1,361,108 | 41,380 |
| Total | $103,628,896 | $4,590,871 |
11. Share Transactions.
Share transactions for each class were as follows and may contain automatic conversions between classes or exchanges between affiliated funds:
| Shares | Shares | Dollars | Dollars | |
| Six months ended April 30, 2018 | Year ended October 31, 2017 | Six months ended April 30, 2018 | Year ended October 31, 2017 | |
| Class A | ||||
| Shares sold | 185,097 | 252,685 | $5,028,206 | $6,107,897 |
| Reinvestment of distributions | 78,436 | 11,049 | 2,026,788 | 241,860 |
| Shares redeemed | (145,667) | (391,649) | (3,964,853) | (9,231,105) |
| Net increase (decrease) | 117,866 | (127,915) | $3,090,141 | $(2,881,348) |
| Class M | ||||
| Shares sold | 54,068 | 59,279 | $1,466,106 | $1,423,926 |
| Reinvestment of distributions | 25,202 | 1,947 | 648,710 | 42,456 |
| Shares redeemed | (45,871) | (96,788) | (1,238,552) | (2,279,691) |
| Net increase (decrease) | 33,399 | (35,562) | $876,264 | $(813,309) |
| Class C | ||||
| Shares sold | 46,901 | 50,318 | $1,240,087 | $1,172,168 |
| Reinvestment of distributions | 23,576 | 220 | 596,476 | 4,750 |
| Shares redeemed | (36,845) | (149,358) | (975,582) | (3,414,844) |
| Net increase (decrease) | 33,632 | (98,820) | $860,981 | $(2,237,926) |
| Worldwide | ||||
| Shares sold | 7,555,999 | 6,214,435 | $207,524,618 | $152,123,337 |
| Reinvestment of distributions | 4,051,546 | 735,217 | 105,785,860 | 16,240,943 |
| Shares redeemed | (4,799,918) | (11,303,639) | (131,208,239) | (268,415,255) |
| Net increase (decrease) | 6,807,627 | (4,353,987) | $182,102,239 | $(100,050,975) |
| Class I | ||||
| Shares sold | 270,557 | 418,936 | $7,370,446 | $10,241,482 |
| Reinvestment of distributions | 55,804 | 6,375 | 1,449,797 | 140,244 |
| Shares redeemed | (175,604) | (223,274) | (4,760,920) | (5,382,770) |
| Net increase (decrease) | 150,757 | 202,037 | $4,059,323 | $4,998,956 |
12. Other.
The Fund's organizational documents provide former and current trustees and officers with a limited indemnification against liabilities arising in connection with the performance of their duties to the Fund. In the normal course of business, the Fund may also enter into contracts that provide general indemnifications. The Fund's maximum exposure under these arrangements is unknown as this would be dependent on future claims that may be made against the Fund. The risk of material loss from such claims is considered remote.
Shareholder Expense Example
As a shareholder of the Fund, you incur two types of costs: (1) transaction costs, including sales charges (loads) on purchase payments or redemption proceeds, and (2) ongoing costs, including management fees, distribution and/or service (12b-1) fees and other Fund expenses. This Example is intended to help you understand your ongoing costs (in dollars) of investing in the Fund and to compare these costs with the ongoing costs of investing in other mutual funds.
The Example is based on an investment of $1,000 invested at the beginning of the period and held for the entire period (November 1, 2017 to April 30, 2018).
Actual Expenses
The first line of the accompanying table for each class of the Fund provides information about actual account values and actual expenses. You may use the information in this line, together with the amount you invested, to estimate the expenses that you paid over the period. Simply divide your account value by $1,000.00 (for example, an $8,600 account value divided by $1,000.00 = 8.6), then multiply the result by the number in the first line for a class of the Fund under the heading entitled "Expenses Paid During Period" to estimate the expenses you paid on your account during this period. A small balance maintenance fee of $12.00 that is charged once a year may apply for certain accounts with a value of less than $2,000. This fee is not included in the table below. If it was, the estimate of expenses you paid during the period would be higher, and your ending account value lower, by this amount. In addition, the Fund, as a shareholder in the underlying Fidelity Central Funds, will indirectly bear its pro-rata share of the fees and expenses incurred by the underlying Fidelity Central Funds. These fees and expenses are not included in the Fund's annualized expense ratio used to calculate the expense estimate in the table below.
Hypothetical Example for Comparison Purposes
The second line of the accompanying table for each class of the Fund provides information about hypothetical account values and hypothetical expenses based on a Class' actual expense ratio and an assumed rate of return of 5% per year before expenses, which is not the Class' actual return. The hypothetical account values and expenses may not be used to estimate the actual ending account balance or expenses you paid for the period. You may use this information to compare the ongoing costs of investing in the Fund and other funds. To do so, compare this 5% hypothetical example with the 5% hypothetical examples that appear in the shareholder reports of the other funds. A small balance maintenance fee of $12.00 that is charged once a year may apply for certain accounts with a value of less than $2,000. This fee is not included in the table below. If it was, the estimate of expenses you paid during the period would be higher, and your ending account value lower, by this amount. In addition, the Fund, as a shareholder in the underlying Fidelity Central Funds, will indirectly bear its pro-rata share of the fees and expenses incurred by the underlying Fidelity Central Funds. These fees and expenses are not included in the Fund's annualized expense ratio used to calculate the expense estimate in the table below.
Please note that the expenses shown in the table are meant to highlight your ongoing costs only and do not reflect any transaction costs. Therefore, the second line of the table is useful in comparing ongoing costs only, and will not help you determine the relative total costs of owning different funds. In addition, if these transactional costs were included, your costs would have been higher.
| Annualized Expense Ratio-A | Beginning Account Value November 1, 2017 | Ending Account Value April 30, 2018 | Expenses Paid During Period-B November 1, 2017 to April 30, 2018 | |
| Diversified International | ||||
| Diversified International | .84% | |||
| Actual | $1,000.00 | $1,009.10 | $4.18 | |
| Hypothetical-C | $1,000.00 | $1,020.63 | $4.21 | |
| Class K | .72% | |||
| Actual | $1,000.00 | $1,009.50 | $3.59 | |
| Hypothetical-C | $1,000.00 | $1,021.22 | $3.61 | |
| International Cap Appreciation | 1.08% | |||
| Actual | $1,000.00 | $1,028.40 | $5.43 | |
| Hypothetical-C | $1,000.00 | $1,019.44 | $5.41 | |
| Overseas | ||||
| Overseas | .99% | |||
| Actual | $1,000.00 | $1,021.00 | $4.96 | |
| Hypothetical-C | $1,000.00 | $1,019.89 | $4.96 | |
| Class K | .88% | |||
| Actual | $1,000.00 | $1,021.50 | $4.41 | |
| Hypothetical-C | $1,000.00 | $1,020.43 | $4.41 | |
| Worldwide | ||||
| Class A | 1.23% | |||
| Actual | $1,000.00 | $1,053.70 | $6.26 | |
| Hypothetical-C | $1,000.00 | $1,018.70 | $6.16 | |
| Class M | 1.52% | |||
| Actual | $1,000.00 | $1,052.20 | $7.73 | |
| Hypothetical-C | $1,000.00 | $1,017.26 | $7.60 | |
| Class C | 2.01% | |||
| Actual | $1,000.00 | $1,049.60 | $10.21 | |
| Hypothetical-C | $1,000.00 | $1,014.83 | $10.04 | |
| Worldwide | .93% | |||
| Actual | $1,000.00 | $1,055.10 | $4.74 | |
| Hypothetical-C | $1,000.00 | $1,020.18 | $4.66 | |
| Class I | .95% | |||
| Actual | $1,000.00 | $1,055.00 | $4.84 | |
| Hypothetical-C | $1,000.00 | $1,020.08 | $4.76 |
A Annualized expense ratio reflects expenses net of applicable fee waivers.
B Expenses are equal to each Class' annualized expense ratio, multiplied by the average account value over the period, multiplied by 181/ 365 (to reflect the one-half year period).
C 5% return per year before expenses
![]()
Corporate Headquarters
245 Summer St.
Boston, MA 02210
www.fidelity.com
IBD-SANN-0618
1.703569.120
Fidelity® Diversified International Fund Semi-Annual Report April 30, 2018 |
|
Contents
To view a fund's proxy voting guidelines and proxy voting record for the 12-month period ended June 30, visit http://www.fidelity.com/proxyvotingresults or visit the Securities and Exchange Commission's (SEC) web site at http://www.sec.gov.
You may also call 1-800-835-5092 to request a free copy of the proxy voting guidelines.
Standard & Poor's, S&P and S&P 500 are registered service marks of The McGraw-Hill Companies, Inc. and have been licensed for use by Fidelity Distributors Corporation.
Other third-party marks appearing herein are the property of their respective owners.
All other marks appearing herein are registered or unregistered trademarks or service marks of FMR LLC or an affiliated company. © 2018 FMR LLC. All rights reserved.
This report and the financial statements contained herein are submitted for the general information of the shareholders of the Fund. This report is not authorized for distribution to prospective investors in the Fund unless preceded or accompanied by an effective prospectus.
A fund files its complete schedule of portfolio holdings with the SEC for the first and third quarters of each fiscal year on Form N-Q. Forms N-Q are available on the SEC’s web site at http://www.sec.gov. A fund's Forms N-Q may be reviewed and copied at the SEC’s Public Reference Room in Washington, DC. Information regarding the operation of the SEC's Public Reference Room may be obtained by calling 1-800-SEC-0330.
For a complete list of a fund's portfolio holdings, view the most recent holdings listing, semiannual report, or annual report on Fidelity's web site at http://www.fidelity.com, http://www.institutional.fidelity.com, or http://www.401k.com, as applicable.
NOT FDIC INSURED •MAY LOSE VALUE •NO BANK GUARANTEE
Neither the Fund nor Fidelity Distributors Corporation is a bank.
Investment Summary (Unaudited)
Geographic Diversification (% of fund's net assets)
| As of April 30, 2018 | ||
| Japan | 17.1% | |
| United Kingdom | 15.0% | |
| United States of America* | 9.3% | |
| France | 7.6% | |
| Germany | 7.4% | |
| Netherlands | 5.4% | |
| India | 4.2% | |
| Switzerland | 4.1% | |
| Canada | 3.4% | |
| Other | 26.5% | |
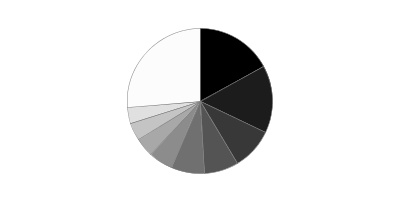
* Includes Short-Term investments and Net Other Assets (Liabilities).
Percentages are based on country or territory of incorporation and are adjusted for the effect of futures contracts, if applicable.
Asset Allocation as of April 30, 2018
| % of fund's net assets | |
| Stocks | 96.3 |
| Short-Term Investments and Net Other Assets (Liabilities) | 3.7 |
Top Ten Stocks as of April 30, 2018
| % of fund's net assets | |
| Prudential PLC (United Kingdom, Insurance) | 1.6 |
| ORIX Corp. (Japan, Diversified Financial Services) | 1.6 |
| British American Tobacco PLC sponsored ADR (United Kingdom, Tobacco) | 1.4 |
| Keyence Corp. (Japan, Electronic Equipment & Components) | 1.4 |
| Statoil ASA (Norway, Oil, Gas & Consumable Fuels) | 1.4 |
| Unilever NV (Certificaten Van Aandelen) (Bearer) (Netherlands, Personal Products) | 1.3 |
| AIA Group Ltd. (Hong Kong, Insurance) | 1.2 |
| Wolseley PLC (Bailiwick of Jersey, Trading Companies & Distributors) | 1.2 |
| SAP SE (Germany, Software) | 1.2 |
| HDFC Bank Ltd. (India, Banks) | 1.1 |
| 13.4 |
Top Market Sectors as of April 30, 2018
| % of fund's net assets | |
| Financials | 25.9 |
| Industrials | 15.8 |
| Information Technology | 11.8 |
| Consumer Staples | 10.8 |
| Consumer Discretionary | 10.7 |
| Health Care | 9.8 |
| Materials | 5.5 |
| Energy | 4.7 |
| Telecommunication Services | 1.0 |
| Utilities | 0.2 |
Schedule of Investments April 30, 2018 (Unaudited)
Showing Percentage of Net Assets
| Common Stocks - 95.4% | |||
| Shares | Value | ||
| Australia - 1.0% | |||
| Amcor Ltd. | 4,821,629 | $49,686,764 | |
| Bapcor Ltd. | 758,759 | 3,347,635 | |
| CSL Ltd. | 493,899 | 63,263,054 | |
| Link Administration Holdings Ltd. | 1,147,262 | 7,138,659 | |
| Magellan Financial Group Ltd. | 2,777,540 | 48,524,932 | |
| Technology One Ltd. | 527,524 | 1,959,473 | |
| TOTAL AUSTRALIA | 173,920,517 | ||
| Austria - 0.1% | |||
| Andritz AG | 366,300 | 19,710,843 | |
| Bailiwick of Jersey - 2.4% | |||
| Glencore Xstrata PLC | 16,288,761 | 78,643,554 | |
| Shire PLC | 1,937,787 | 103,187,022 | |
| Wolseley PLC | 2,712,825 | 208,398,838 | |
| WPP PLC | 1,108,809 | 19,027,306 | |
| TOTAL BAILIWICK OF JERSEY | 409,256,720 | ||
| Belgium - 1.2% | |||
| KBC Groep NV | 1,993,688 | 174,308,621 | |
| Umicore SA | 478,648 | 26,738,989 | |
| TOTAL BELGIUM | 201,047,610 | ||
| Bermuda - 1.2% | |||
| Credicorp Ltd. (United States) | 334,900 | 77,860,901 | |
| Hiscox Ltd. | 3,462,400 | 70,975,956 | |
| IHS Markit Ltd. (a) | 1,084,000 | 53,256,920 | |
| TOTAL BERMUDA | 202,093,777 | ||
| Canada - 3.4% | |||
| Alimentation Couche-Tard, Inc. Class B (sub. vtg.) | 3,842,181 | 166,111,973 | |
| CCL Industries, Inc. Class B | 347,400 | 16,851,180 | |
| Cenovus Energy, Inc. | 9,098,300 | 91,128,267 | |
| Constellation Software, Inc. | 53,024 | 37,895,878 | |
| Fairfax India Holdings Corp. (a) | 4,410,200 | 77,178,500 | |
| PrairieSky Royalty Ltd. (b) | 721,298 | 15,993,889 | |
| Suncor Energy, Inc. | 4,814,200 | 184,101,577 | |
| TOTAL CANADA | 589,261,264 | ||
| Cayman Islands - 1.2% | |||
| Alibaba Group Holding Ltd. sponsored ADR (a) | 481,100 | 85,895,594 | |
| ENN Energy Holdings Ltd. | 2,995,000 | 28,007,837 | |
| JD.com, Inc. sponsored ADR (a) | 1,251,092 | 45,677,369 | |
| NetEase, Inc. ADR | 145,900 | 37,506,513 | |
| Zai Lab Ltd. ADR | 556,327 | 10,386,625 | |
| TOTAL CAYMAN ISLANDS | 207,473,938 | ||
| China - 0.7% | |||
| Hangzhou Hikvision Digital Technology Co. Ltd. Class A | 1,389,310 | 8,414,887 | |
| Kweichow Moutai Co. Ltd. (A Shares) | 484,010 | 50,399,489 | |
| Shanghai International Airport Co. Ltd. (A Shares) | 5,833,200 | 45,814,792 | |
| Tonghua Dongbao Pharmaceutical Co. Ltd. Class A | 4,621,300 | 20,905,647 | |
| TOTAL CHINA | 125,534,815 | ||
| Curacao - 0.3% | |||
| Schlumberger Ltd. | 748,800 | 51,337,728 | |
| Denmark - 0.3% | |||
| NNIT A/S (c) | 356,425 | 9,901,818 | |
| Novozymes A/S Series B | 860,800 | 40,468,682 | |
| SimCorp A/S | 25,785 | 1,877,340 | |
| TOTAL DENMARK | 52,247,840 | ||
| Finland - 0.4% | |||
| Sampo Oyj (A Shares) | 1,309,900 | 70,787,127 | |
| France - 7.6% | |||
| Aeroports de Paris | 235,600 | 51,894,726 | |
| Amundi SA (c) | 1,735,613 | 147,720,883 | |
| BNP Paribas SA | 2,286,500 | 176,660,130 | |
| Capgemini SA | 510,700 | 70,306,231 | |
| Compagnie de St. Gobain | 1,601,800 | 84,133,844 | |
| Eiffage SA | 304,000 | 36,233,797 | |
| Elis SA | 1,911,900 | 45,760,623 | |
| Iliad SA | 82,686 | 16,570,375 | |
| Kering SA (b) | 135,100 | 78,245,186 | |
| LVMH Moet Hennessy - Louis Vuitton SA (b) | 456,221 | 158,770,450 | |
| Maisons du Monde SA (c) | 781,800 | 31,797,345 | |
| Sanofi SA(b) | 2,008,821 | 158,822,056 | |
| Societe Generale Series A | 1,742,200 | 95,348,493 | |
| SR Teleperformance SA | 170,600 | 27,379,601 | |
| Thales SA | 203,500 | 25,803,393 | |
| VINCI SA (b) | 1,242,900 | 124,269,742 | |
| TOTAL FRANCE | 1,329,716,875 | ||
| Germany - 6.7% | |||
| adidas AG | 570,517 | 140,478,196 | |
| Aumann AG (c) | 311,300 | 18,833,887 | |
| Axel Springer Verlag AG | 734,700 | 60,198,129 | |
| Bayer AG | 1,418,662 | 169,557,930 | |
| Brenntag AG | 139,700 | 8,016,706 | |
| Deutsche Borse AG | 315,800 | 42,471,656 | |
| Deutsche Post AG | 2,333,932 | 101,303,035 | |
| Fresenius SE & Co. KGaA | 1,573,800 | 120,378,993 | |
| Hannover Reuck SE | 374,600 | 52,745,988 | |
| Linde AG | 451,900 | 100,438,743 | |
| Morphosys AG sponsored ADR | 714,900 | 18,716,082 | |
| Rational AG | 29,539 | 18,531,239 | |
| SAP SE | 1,844,444 | 204,928,207 | |
| Scout24 AG (c) | 716,300 | 37,143,267 | |
| Symrise AG | 815,600 | 66,088,035 | |
| TOTAL GERMANY | 1,159,830,093 | ||
| Hong Kong - 1.6% | |||
| AIA Group Ltd. | 23,996,000 | 214,457,053 | |
| Techtronic Industries Co. Ltd. | 10,345,000 | 60,602,994 | |
| TOTAL HONG KONG | 275,060,047 | ||
| Hungary - 0.0% | |||
| OTP Bank PLC | 209,900 | 9,170,420 | |
| India - 4.2% | |||
| Adani Ports & Special Economic Zone Ltd. | 5,899,236 | 36,086,139 | |
| Axis Bank Ltd. | 5,377,605 | 41,689,657 | |
| Future Retail Ltd. | 623,777 | 5,636,203 | |
| Godrej Consumer Products Ltd. | 832,727 | 13,954,171 | |
| HDFC Bank Ltd. | 6,420,497 | 193,512,573 | |
| Housing Development Finance Corp. Ltd. | 6,630,847 | 187,606,708 | |
| ICICI Bank Ltd. | 9,472,506 | 40,482,586 | |
| Kajaria Ceramics Ltd. | 1,306,007 | 10,693,327 | |
| Kotak Mahindra Bank Ltd. (a) | 2,387,505 | 43,414,139 | |
| LIC Housing Finance Ltd. | 3,114,373 | 25,498,183 | |
| Motherson Sumi Systems Ltd. | 1,881,915 | 9,970,933 | |
| PC Jeweller Ltd. | 927,631 | 2,008,313 | |
| Reliance Industries Ltd. | 8,261,612 | 119,284,455 | |
| TOTAL INDIA | 729,837,387 | ||
| Indonesia - 0.9% | |||
| PT Bank Central Asia Tbk | 44,925,500 | 71,039,922 | |
| PT Bank Rakyat Indonesia Tbk | 358,339,600 | 82,621,817 | |
| TOTAL INDONESIA | 153,661,739 | ||
| Ireland - 3.3% | |||
| Allergan PLC | 211,600 | 32,512,340 | |
| CRH PLC | 2,322,800 | 82,438,695 | |
| DCC PLC (United Kingdom) | 659,189 | 63,525,385 | |
| Kerry Group PLC Class A | 887,000 | 90,511,432 | |
| Kingspan Group PLC (Ireland) | 1,669,300 | 75,594,251 | |
| Paddy Power Betfair PLC (Ireland) | 554,700 | 54,894,676 | |
| Ryanair Holdings PLC sponsored ADR (a) | 1,563,399 | 171,926,988 | |
| TOTAL IRELAND | 571,403,767 | ||
| Israel - 0.6% | |||
| Check Point Software Technologies Ltd. (a) | 840,000 | 81,068,400 | |
| Frutarom Industries Ltd. | 134,449 | 12,907,134 | |
| SodaStream International Ltd. (a) | 186,660 | 17,637,503 | |
| TOTAL ISRAEL | 111,613,037 | ||
| Italy - 1.0% | |||
| Buzzi Unicem SpA | 256,200 | 6,484,754 | |
| Intesa Sanpaolo SpA | 34,394,200 | 130,834,076 | |
| Prada SpA | 9,035,500 | 45,845,273 | |
| TOTAL ITALY | 183,164,103 | ||
| Japan - 17.1% | |||
| Bandai Namco Holdings, Inc. | 312,400 | 10,616,228 | |
| Bridgestone Corp. | 2,224,600 | 93,383,547 | |
| Daikin Industries Ltd. | 966,700 | 113,232,652 | |
| East Japan Railway Co. | 484,900 | 46,529,464 | |
| GMO Internet, Inc. | 253,600 | 4,674,387 | |
| Hoya Corp. | 3,371,100 | 180,766,449 | |
| Itochu Corp. | 1,564,400 | 31,396,758 | |
| Kao Corp. | 1,066,400 | 76,624,332 | |
| Keyence Corp. | 397,720 | 243,645,338 | |
| Minebea Mitsumi, Inc. | 6,453,100 | 129,687,712 | |
| Misumi Group, Inc. | 1,921,700 | 53,263,364 | |
| Mitsubishi UFJ Financial Group, Inc. | 24,726,300 | 165,699,427 | |
| Morinaga & Co. Ltd. | 1,112,700 | 54,250,741 | |
| Nabtesco Corp. | 678,900 | 24,561,375 | |
| Nidec Corp. | 566,000 | 88,741,676 | |
| Nintendo Co. Ltd. | 41,500 | 17,437,326 | |
| Nissan Chemical Industries Co. Ltd. | 121,500 | 5,418,153 | |
| Nitori Holdings Co. Ltd. | 841,700 | 142,285,181 | |
| Olympus Corp. | 1,609,200 | 60,131,559 | |
| ORIX Corp. | 15,434,200 | 271,637,402 | |
| Outsourcing, Inc. | 1,570,400 | 26,489,367 | |
| PALTAC Corp. | 637,800 | 31,971,679 | |
| Panasonic Corp. | 3,601,600 | 53,329,432 | |
| Recruit Holdings Co. Ltd. | 5,450,800 | 125,998,643 | |
| Renesas Electronics Corp. (a)(b) | 8,742,300 | 91,805,346 | |
| Seria Co. Ltd. | 394,900 | 19,362,093 | |
| Shin-Etsu Chemical Co. Ltd. | 515,800 | 51,924,433 | |
| Shiseido Co. Ltd. | 274,300 | 17,845,057 | |
| SMC Corp. | 212,500 | 81,096,780 | |
| SoftBank Corp. | 1,520,100 | 116,148,880 | |
| Sohgo Security Services Co., Ltd. | 403,200 | 19,953,458 | |
| Sony Corp. | 2,374,200 | 110,889,664 | |
| Start Today Co. Ltd. | 1,235,400 | 35,710,428 | |
| Subaru Corp. | 1,350,200 | 45,438,948 | |
| Sundrug Co. Ltd. | 630,900 | 32,491,465 | |
| Tsubaki Nakashima Co. Ltd. | 601,600 | 14,231,043 | |
| Tsuruha Holdings, Inc. | 1,223,400 | 176,034,413 | |
| Welcia Holdings Co. Ltd. | 1,985,800 | 102,269,063 | |
| TOTAL JAPAN | 2,966,973,263 | ||
| Korea (South) - 0.3% | |||
| LG Chemical Ltd. | 147,738 | 49,663,310 | |
| Liberia - 0.1% | |||
| Royal Caribbean Cruises Ltd. | 86,500 | 9,358,435 | |
| Luxembourg - 1.0% | |||
| B&M European Value Retail S.A. | 27,227,388 | 151,922,430 | |
| Eurofins Scientific SA | 2,838 | 1,534,686 | |
| Samsonite International SA | 3,760,200 | 16,961,113 | |
| TOTAL LUXEMBOURG | 170,418,229 | ||
| Netherlands - 5.4% | |||
| ASML Holding NV | 757,000 | 142,656,650 | |
| ING Groep NV (Certificaten Van Aandelen) | 7,083,100 | 119,353,931 | |
| Koninklijke Philips Electronics NV (d) | 2,525,900 | 106,911,824 | |
| LyondellBasell Industries NV Class A | 815,600 | 86,233,388 | |
| Philips Lighting NV (c) | 534,800 | 16,300,610 | |
| RELX NV | 5,237,910 | 111,420,162 | |
| Unilever NV (Certificaten Van Aandelen) (Bearer) | 3,892,957 | 223,177,730 | |
| Wolters Kluwer NV | 1,939,900 | 105,019,800 | |
| Yandex NV Series A (a) | 878,400 | 29,303,424 | |
| TOTAL NETHERLANDS | 940,377,519 | ||
| New Zealand - 0.2% | |||
| Ryman Healthcare Group Ltd. | 4,972,797 | 37,087,916 | |
| Norway - 1.6% | |||
| Schibsted ASA (A Shares) | 1,290,100 | 37,727,018 | |
| Statoil ASA | 9,486,900 | 242,605,734 | |
| TOTAL NORWAY | 280,332,752 | ||
| South Africa - 0.8% | |||
| Capitec Bank Holdings Ltd. | 165,800 | 11,803,968 | |
| Naspers Ltd. Class N | 523,179 | 127,456,639 | |
| TOTAL SOUTH AFRICA | 139,260,607 | ||
| Spain - 2.3% | |||
| Aedas Homes SAU (c) | 479,525 | 17,082,695 | |
| Amadeus IT Holding SA Class A | 2,075,900 | 152,166,210 | |
| CaixaBank SA | 24,610,800 | 119,679,223 | |
| Masmovil Ibercom SA (a) | 252,704 | 36,497,776 | |
| Neinor Homes SLU (a)(c) | 941,400 | 18,257,564 | |
| Prosegur Cash SA (c) | 19,390,474 | 56,666,566 | |
| TOTAL SPAIN | 400,350,034 | ||
| Sweden - 2.3% | |||
| Alfa Laval AB | 887,100 | 22,054,287 | |
| ASSA ABLOY AB (B Shares) (b) | 4,647,400 | 97,760,111 | |
| Coor Service Management Holding AB | 4,332,800 | 30,133,387 | |
| Essity AB Class B | 2,764,200 | 70,394,112 | |
| HEXPOL AB (B Shares) | 2,907,700 | 30,217,115 | |
| Indutrade AB | 662,000 | 15,679,375 | |
| Nordea Bank AB | 13,563,600 | 138,445,018 | |
| TOTAL SWEDEN | 404,683,405 | ||
| Switzerland - 4.1% | |||
| Credit Suisse Group AG | 7,488,621 | 126,304,896 | |
| Julius Baer Group Ltd. | 1,122,840 | 66,638,726 | |
| Lonza Group AG | 234,910 | 57,885,996 | |
| Roche Holding AG (participation certificate) | 707,129 | 157,115,202 | |
| Sika AG | 16,601 | 121,115,267 | |
| Swatch Group AG (Bearer) | 130,180 | 62,856,842 | |
| TE Connectivity Ltd. | 174,200 | 15,982,850 | |
| UBS Group AG | 6,442,107 | 109,015,272 | |
| TOTAL SWITZERLAND | 716,915,051 | ||
| Taiwan - 1.3% | |||
| Taiwan Semiconductor Manufacturing Co. Ltd. sponsored ADR | 4,063,400 | 156,237,730 | |
| Tripod Technology Corp. | 4,764,000 | 14,385,079 | |
| United Microelectronics Corp. | 96,782,000 | 52,099,401 | |
| TOTAL TAIWAN | 222,722,210 | ||
| Thailand - 0.2% | |||
| Kasikornbank PCL (For. Reg.) | 6,269,900 | 39,739,053 | |
| United Kingdom - 15.0% | |||
| Admiral Group PLC | 1,636,100 | 44,890,708 | |
| Aon PLC | 210,000 | 29,918,700 | |
| Ascential PLC | 6,044,532 | 35,066,832 | |
| Ashtead Group PLC | 1,284,900 | 35,962,181 | |
| AstraZeneca PLC (United Kingdom) | 1,766,355 | 123,649,043 | |
| Beazley PLC | 2,149,300 | 17,502,138 | |
| British American Tobacco PLC sponsored ADR | 4,515,800 | 246,652,996 | |
| Bunzl PLC | 3,159,670 | 91,826,763 | |
| Coca-Cola European Partners PLC | 1,115,500 | 43,727,600 | |
| Compass Group PLC | 4,190,288 | 89,992,805 | |
| Cranswick PLC | 398,946 | 16,004,532 | |
| DS Smith PLC | 4,025,000 | 28,947,320 | |
| Essentra PLC | 2,898,548 | 17,597,801 | |
| Halma PLC | 1,899,156 | 31,976,168 | |
| Hastings Group Holdings PLC (c) | 13,493,282 | 51,270,316 | |
| Imperial Tobacco Group PLC | 1,447,233 | 51,892,206 | |
| Indivior PLC (a) | 12,419,900 | 77,473,197 | |
| Informa PLC | 2,818,468 | 28,674,567 | |
| ITV PLC | 4,325,900 | 9,031,465 | |
| John Wood Group PLC | 4,352,500 | 34,071,005 | |
| LivaNova PLC (a) | 272,400 | 24,183,672 | |
| Lloyds Banking Group PLC | 139,927,600 | 124,108,476 | |
| London Stock Exchange Group PLC | 1,903,500 | 112,683,584 | |
| Melrose Industries PLC | 42,547,312 | 133,550,737 | |
| Micro Focus International PLC | 4,182,495 | 72,119,314 | |
| Prudential PLC | 11,063,856 | 284,496,641 | |
| Reckitt Benckiser Group PLC | 2,108,987 | 165,445,981 | |
| Spectris PLC | 1,694,100 | 62,737,995 | |
| St. James's Place Capital PLC | 9,395,400 | 147,002,266 | |
| Standard Chartered PLC (United Kingdom) | 8,139,416 | 85,946,446 | |
| Standard Life PLC | 15,620,302 | 78,555,828 | |
| Tesco PLC | 37,967,019 | 122,972,851 | |
| The Weir Group PLC | 2,871,100 | 84,428,463 | |
| TOTAL UNITED KINGDOM | 2,604,360,597 | ||
| United States of America - 5.6% | |||
| Alphabet, Inc. Class C (a) | 103,003 | 104,788,042 | |
| Amgen, Inc. | 590,600 | 103,047,888 | |
| Becton, Dickinson & Co. | 118,100 | 27,383,847 | |
| Boston Scientific Corp. (a) | 299,100 | 8,590,152 | |
| Citigroup, Inc. | 1,106,700 | 75,554,409 | |
| Coty, Inc. Class A | 4,749,300 | 82,400,355 | |
| DocuSign, Inc. | 50,000 | 1,931,500 | |
| DowDuPont, Inc. | 789,600 | 49,934,304 | |
| FleetCor Technologies, Inc. (a) | 73,900 | 15,317,992 | |
| MasterCard, Inc. Class A | 793,400 | 141,439,418 | |
| nLIGHT, Inc. (a) | 21,400 | 533,502 | |
| Oceaneering International, Inc. | 1,011,100 | 21,475,764 | |
| Quintiles Transnational Holdings, Inc. (a) | 184,200 | 17,638,992 | |
| S&P Global, Inc. | 686,700 | 129,511,620 | |
| Smartsheet, Inc. | 40,300 | 777,790 | |
| Valero Energy Corp. | 491,600 | 54,533,188 | |
| Visa, Inc. Class A | 1,071,300 | 135,926,544 | |
| TOTAL UNITED STATES OF AMERICA | 970,785,307 | ||
| TOTAL COMMON STOCKS | |||
| (Cost $12,288,182,954) | 16,579,157,335 | ||
| Nonconvertible Preferred Stocks - 0.9% | |||
| Brazil - 0.2% | |||
| Itau Unibanco Holding SA | 1,554,050 | 22,628,480 | |
| Germany - 0.7% | |||
| Henkel AG & Co. KGaA | 600,900 | 76,483,177 | |
| Jungheinrich AG | 364,600 | 15,427,795 | |
| Sartorius AG (non-vtg.) | 204,084 | 31,496,545 | |
| TOTAL GERMANY | 123,407,517 | ||
| TOTAL NONCONVERTIBLE PREFERRED STOCKS | |||
| (Cost $80,660,531) | 146,035,997 | ||
| Money Market Funds - 4.3% | |||
| Fidelity Cash Central Fund, 1.74% (e) | 582,997,922 | 583,114,522 | |
| Fidelity Securities Lending Cash Central Fund 1.74% (e)(f) | 171,000,265 | 171,017,365 | |
| TOTAL MONEY MARKET FUNDS | |||
| (Cost $754,109,153) | 754,131,887 | ||
| TOTAL INVESTMENT IN SECURITIES - 100.6% | |||
| (Cost $13,122,952,638) | 17,479,325,219 | ||
| NET OTHER ASSETS (LIABILITIES) - (0.6)% | (98,292,360) | ||
| NET ASSETS - 100% | $17,381,032,859 |
Categorizations in the Schedule of Investments are based on country or territory of incorporation.
Legend
(a) Non-income producing
(b) Security or a portion of the security is on loan at period end.
(c) Security exempt from registration under Rule 144A of the Securities Act of 1933. These securities may be resold in transactions exempt from registration, normally to qualified institutional buyers. At the end of the period, the value of these securities amounted to $404,974,951 or 2.3% of net assets.
(d) Security or a portion of the security purchased on a delayed delivery or when-issued basis.
(e) Affiliated fund that is generally available only to investment companies and other accounts managed by Fidelity Investments. The rate quoted is the annualized seven-day yield of the fund at period end. A complete unaudited listing of the fund's holdings as of its most recent quarter end is available upon request. In addition, each Fidelity Central Fund's financial statements are available on the SEC's website or upon request.
(f) Investment made with cash collateral received from securities on loan.
Affiliated Central Funds
Information regarding fiscal year to date income earned by the Fund from investments in Fidelity Central Funds is as follows:
| Fund | Income earned |
| Fidelity Cash Central Fund | $2,724,434 |
| Fidelity Securities Lending Cash Central Fund | 2,026,468 |
| Total | $4,750,902 |
Amounts in the income column in the above table include any capital gain distributions from underlying funds, which are presented in the corresponding line-item in the Statement of Operations if applicable.
Investment Valuation
The following is a summary of the inputs used, as of April 30, 2018, involving the Fund's assets and liabilities carried at fair value. The inputs or methodology used for valuing securities may not be an indication of the risk associated with investing in those securities. For more information on valuation inputs, and their aggregation into the levels used below, please refer to the Investment Valuation section in the accompanying Notes to Financial Statements.
| Valuation Inputs at Reporting Date: | ||||
| Description | Total | Level 1 | Level 2 | Level 3 |
| Investments in Securities: | ||||
| Equities: | ||||
| Consumer Discretionary | $1,864,430,421 | $1,250,584,466 | $613,845,955 | $-- |
| Consumer Staples | 1,880,177,178 | 1,304,226,956 | 575,950,222 | -- |
| Energy | 814,531,607 | 452,641,418 | 361,890,189 | -- |
| Financials | 4,503,963,415 | 2,228,637,279 | 2,275,326,136 | -- |
| Health Care | 1,722,528,535 | 819,116,757 | 903,411,778 | -- |
| Industrials | 2,725,613,429 | 2,407,446,394 | 318,167,035 | -- |
| Information Technology | 2,077,843,563 | 1,699,361,217 | 378,482,346 | -- |
| Materials | 921,797,621 | 749,203,480 | 172,594,141 | -- |
| Real Estate | 17,082,695 | 17,082,695 | -- | -- |
| Telecommunication Services | 169,217,031 | 53,068,151 | 116,148,880 | -- |
| Utilities | 28,007,837 | -- | 28,007,837 | -- |
| Money Market Funds | 754,131,887 | 754,131,887 | -- | -- |
| Total Investments in Securities: | $17,479,325,219 | $11,735,500,700 | $5,743,824,519 | $-- |
The following is a summary of transfers between Level 1 and Level 2 for the period ended April 30, 2018. Transfers are assumed to have occurred at the beginning of the period, and are primarily attributable to the valuation techniques used for foreign equity securities, as discussed in the accompanying Notes to Financial Statements:
| Transfers | Total |
| Level 1 to Level 2 | $2,014,158,079 |
| Level 2 to Level 1 | $2,689,090,135 |
See accompanying notes which are an integral part of the financial statements.
Financial Statements
Statement of Assets and Liabilities
| April 30, 2018 (Unaudited) | ||
| Assets | ||
| Investment in securities, at value (including securities loaned of $163,887,454) — See accompanying schedule: Unaffiliated issuers (cost $12,368,843,485) | $16,725,193,332 | |
| Fidelity Central Funds (cost $754,109,153) | 754,131,887 | |
| Total Investment in Securities (cost $13,122,952,638) | $17,479,325,219 | |
| Cash | 2,788,363 | |
| Receivable for investments sold | 65,652,414 | |
| Receivable for fund shares sold | 14,259,577 | |
| Dividends receivable | 103,483,589 | |
| Distributions receivable from Fidelity Central Funds | 1,478,817 | |
| Prepaid expenses | 10,439 | |
| Other receivables | 2,635,387 | |
| Total assets | 17,669,633,805 | |
| Liabilities | ||
| Payable for investments purchased | ||
| Regular delivery | $73,729,604 | |
| Delayed delivery | 2,364,856 | |
| Payable for fund shares redeemed | 23,226,269 | |
| Accrued management fee | 9,247,840 | |
| Other affiliated payables | 1,931,056 | |
| Other payables and accrued expenses | 7,089,131 | |
| Collateral on securities loaned | 171,012,190 | |
| Total liabilities | 288,600,946 | |
| Net Assets | $17,381,032,859 | |
| Net Assets consist of: | ||
| Paid in capital | $11,827,989,828 | |
| Undistributed net investment income | 82,108,287 | |
| Accumulated undistributed net realized gain (loss) on investments and foreign currency transactions | 1,119,187,772 | |
| Net unrealized appreciation (depreciation) on investments and assets and liabilities in foreign currencies | 4,351,746,972 | |
| Net Assets | $17,381,032,859 | |
| Diversified International: | ||
| Net Asset Value, offering price and redemption price per share ($10,747,537,561 ÷ 271,193,810 shares) | $39.63 | |
| Class K: | ||
| Net Asset Value, offering price and redemption price per share ($6,633,495,298 ÷ 167,674,278 shares) | $39.56 |
See accompanying notes which are an integral part of the financial statements.
Statement of Operations
| Six months ended April 30, 2018 (Unaudited) | ||
| Investment Income | ||
| Dividends | $176,567,388 | |
| Income from Fidelity Central Funds | 4,750,902 | |
| Income before foreign taxes withheld | 181,318,290 | |
| Less foreign taxes withheld | (15,370,481) | |
| Total income | 165,947,809 | |
| Expenses | ||
| Management fee | ||
| Basic fee | $62,124,910 | |
| Performance adjustment | (1,276,686) | |
| Transfer agent fees | 10,781,284 | |
| Accounting and security lending fees | 1,070,298 | |
| Custodian fees and expenses | 1,107,433 | |
| Independent trustees' fees and expenses | 37,634 | |
| Registration fees | 76,940 | |
| Audit | 64,072 | |
| Legal | 38,471 | |
| Miscellaneous | 64,809 | |
| Total expenses before reductions | 74,089,165 | |
| Expense reductions | (1,380,498) | 72,708,667 |
| Net investment income (loss) | 93,239,142 | |
| Realized and Unrealized Gain (Loss) | ||
| Net realized gain (loss) on: | ||
| Investment securities: | ||
| Unaffiliated issuers | 1,362,078,187 | |
| Fidelity Central Funds | 29,332 | |
| Foreign currency transactions | (426,366) | |
| Total net realized gain (loss) | 1,361,681,153 | |
| Change in net unrealized appreciation (depreciation) on: | ||
| Investment securities: | ||
| Unaffiliated issuers (net of increase in deferred foreign taxes of $1,538,682) | (1,251,376,425) | |
| Fidelity Central Funds | (20,419) | |
| Assets and liabilities in foreign currencies | 306,194 | |
| Total change in net unrealized appreciation (depreciation) | (1,251,090,650) | |
| Net gain (loss) | 110,590,503 | |
| Net increase (decrease) in net assets resulting from operations | $203,829,645 |
See accompanying notes which are an integral part of the financial statements.
Statement of Changes in Net Assets
| Six months ended April 30, 2018 (Unaudited) | Year ended October 31, 2017 | |
| Increase (Decrease) in Net Assets | ||
| Operations | ||
| Net investment income (loss) | $93,239,142 | $220,004,102 |
| Net realized gain (loss) | 1,361,681,153 | 1,655,511,842 |
| Change in net unrealized appreciation (depreciation) | (1,251,090,650) | 1,955,253,295 |
| Net increase (decrease) in net assets resulting from operations | 203,829,645 | 3,830,769,239 |
| Distributions to shareholders from net investment income | (209,711,405) | (223,211,879) |
| Distributions to shareholders from net realized gain | (782,565,744) | (38,126,771) |
| Total distributions | (992,277,149) | (261,338,650) |
| Share transactions - net increase (decrease) | (1,678,892,929) | (3,320,742,656) |
| Redemption fees | – | 26,003 |
| Total increase (decrease) in net assets | (2,467,340,433) | 248,713,936 |
| Net Assets | ||
| Beginning of period | 19,848,373,292 | 19,599,659,356 |
| End of period | $17,381,032,859 | $19,848,373,292 |
| Other Information | ||
| Undistributed net investment income end of period | $82,108,287 | $198,580,550 |
See accompanying notes which are an integral part of the financial statements.
Financial Highlights
Fidelity Diversified International Fund
| Six months ended (Unaudited) April 30, | Years endedOctober 31, | |||||
| 2018 | 2017 | 2016 | 2015 | 2014 | 2013 | |
| Selected Per–Share Data | ||||||
| Net asset value, beginning of period | $41.39 | $34.28 | $36.07 | $36.22 | $35.89 | $29.07 |
| Income from Investment Operations | ||||||
| Net investment income (loss)A | .19 | .41 | .39 | .36 | .60B | .44 |
| Net realized and unrealized gain (loss) | .17 | 7.15 | (1.71) | .80 | .28 | 6.90 |
| Total from investment operations | .36 | 7.56 | (1.32) | 1.16 | .88 | 7.34 |
| Distributions from net investment income | (.43) | (.38) | (.33)C | (.40) | (.32) | (.46) |
| Distributions from net realized gain | (1.69) | (.07) | (.14)C | (.92) | (.23) | (.07) |
| Total distributions | (2.12) | (.45) | (.47) | (1.31)D | (.55) | (.52)E |
| Redemption fees added to paid in capitalA | – | –F | –F | –F | –F | –F |
| Net asset value, end of period | $39.63 | $41.39 | $34.28 | $36.07 | $36.22 | $35.89 |
| Total ReturnG,H | .91% | 22.38% | (3.70)% | 3.29% | 2.48% | 25.66% |
| Ratios to Average Net AssetsI,J | ||||||
| Expenses before reductions | .84%K | .94% | 1.05% | 1.00% | .93% | .94% |
| Expenses net of fee waivers, if any | .84%K | .94% | 1.05% | .99% | .93% | .94% |
| Expenses net of all reductions | .82%K | .93% | 1.05% | .99% | .92% | .92% |
| Net investment income (loss) | .95%K | 1.10% | 1.15% | .98% | 1.65%B | 1.38% |
| Supplemental Data | ||||||
| Net assets, end of period (000 omitted) | $10,747,538 | $11,349,633 | $10,990,703 | $13,059,983 | $13,781,306 | $14,432,586 |
| Portfolio turnover rateL | 34%K,M | 37%M | 24%M | 31%M | 39%M | 52% |
A Calculated based on average shares outstanding during the period.
B Net Investment income per share reflects a large, non-recurring dividend which amounted to $.18 per share. Excluding this non-recurring dividend, the ratio of net investment income (loss) to average net assets would have been 1.16%.
C The amounts shown reflect certain reclassifications related to book to tax differences that were made in the year shown.
D Total distributions of $1.31 per share is comprised of distributions from net investment income of $.397 and distributions from net realized gain of $.917 per share.
E Total distributions of $.52 per share is comprised of distributions from net investment income of $.456 and distributions from net realized gain of $.068 per share.
F Amount represents less than $.005 per share.
G Total returns for periods of less than one year are not annualized.
H Total returns would have been lower if certain expenses had not been reduced during the applicable periods shown.
I Fees and expenses of any underlying Fidelity Central Funds are not included in the Fund's expense ratio. The Fund indirectly bears its proportionate share of the expenses of any underlying Fidelity Central Funds.
J Expense ratios reflect operating expenses of the class. Expenses before reductions do not reflect amounts reimbursed by the investment adviser or reductions from brokerage service arrangements or reductions from other expense offset arrangements and do not represent the amount paid by the class during periods when reimbursements or reductions occur. Expenses net of fee waivers reflect expenses after reimbursement by the investment adviser but prior to reductions from brokerage service arrangements or other expense offset arrangements. Expenses net of all reductions represent the net expenses paid by the class.
K Annualized
L Amount does not include the portfolio activity of any underlying Fidelity Central Funds.
M Portfolio turnover rate excludes securities received or delivered in-kind.
See accompanying notes which are an integral part of the financial statements.
Fidelity Diversified International Fund Class K
| Six months ended (Unaudited) April 30, | Years endedOctober 31, | |||||
| 2018 | 2017 | 2016 | 2015 | 2014 | 2013�� | |
| Selected Per–Share Data | ||||||
| Net asset value, beginning of period | $41.35 | $34.25 | $36.04 | $36.20 | $35.87 | $29.06 |
| Income from Investment Operations | ||||||
| Net investment income (loss)A | .22 | .45 | .44 | .40 | .65B | .49 |
| Net realized and unrealized gain (loss) | .16 | 7.15 | (1.71) | .80 | .28 | 6.90 |
| Total from investment operations | .38 | 7.60 | (1.27) | 1.20 | .93 | 7.39 |
| Distributions from net investment income | (.48) | (.43) | (.38)C | (.45) | (.37) | (.51) |
| Distributions from net realized gain | (1.69) | (.07) | (.14)C | (.92) | (.23) | (.07) |
| Total distributions | (2.17) | (.50) | (.52) | (1.36)D | (.60) | (.58) |
| Redemption fees added to paid in capitalA | – | –E | –E | –E | –E | –E |
| Net asset value, end of period | $39.56 | $41.35 | $34.25 | $36.04 | $36.20 | $35.87 |
| Total ReturnF,G | .95% | 22.55% | (3.57)% | 3.40% | 2.63% | 25.86% |
| Ratios to Average Net AssetsH,I | ||||||
| Expenses before reductions | .72%J | .82% | .92% | .87% | .80% | .80% |
| Expenses net of fee waivers, if any | .72%J | .81% | .92% | .87% | .80% | .80% |
| Expenses net of all reductions | .71%J | .81% | .92% | .86% | .79% | .78% |
| Net investment income (loss) | 1.07%J | 1.22% | 1.28% | 1.10% | 1.78%B | 1.52% |
| Supplemental Data | ||||||
| Net assets, end of period (000 omitted) | $6,633,495 | $8,498,740 | $8,608,956 | $10,143,540 | $11,134,431 | $11,541,599 |
| Portfolio turnover rateK | 34%J,L | 37%L | 24%L | 31%L | 39%L | 52% |
A Calculated based on average shares outstanding during the period.
B Net Investment income per share reflects a large, non-recurring dividend which amounted to $.18 per share. Excluding this non-recurring dividend, the ratio of net investment income (loss) to average net assets would have been 1.29%.
C The amounts shown reflect certain reclassifications related to book to tax differences that were made in the year shown.
D Total distributions of $1.36 per share is comprised of distributions from net investment income of $.446 and distributions from net realized gain of $.917 per share.
E Amount represents less than $.005 per share.
F Total returns for periods of less than one year are not annualized.
G Total returns would have been lower if certain expenses had not been reduced during the applicable periods shown.
H Fees and expenses of any underlying Fidelity Central Funds are not included in the Fund's expense ratio. The Fund indirectly bears its proportionate share of the expenses of any underlying Fidelity Central Funds.
I Expense ratios reflect operating expenses of the class. Expenses before reductions do not reflect amounts reimbursed by the investment adviser or reductions from brokerage service arrangements or reductions from other expense offset arrangements and do not represent the amount paid by the class during periods when reimbursements or reductions occur. Expenses net of fee waivers reflect expenses after reimbursement by the investment adviser but prior to reductions from brokerage service arrangements or other expense offset arrangements. Expenses net of all reductions represent the net expenses paid by the class.
J Annualized
K Amount does not include the portfolio activity of any underlying Fidelity Central Funds.
L Portfolio turnover rate excludes securities received or delivered in-kind.
See accompanying notes which are an integral part of the financial statements.
Notes to Financial Statements (Unaudited)
For the period ended April 30, 2018
1. Organization.
Fidelity Diversified International Fund (the Fund) is a fund of Fidelity Investment Trust (the Trust) and is authorized to issue an unlimited number of shares. The Trust is registered under the Investment Company Act of 1940, as amended (the 1940 Act), as an open-end management investment company organized as a Massachusetts business trust. The Fund offers Diversified International and Class K shares, each of which has equal rights as to assets and voting privileges. Each class has exclusive voting rights with respect to matters that affect that class. The Fund's investments in emerging markets can be subject to social, economic, regulatory, and political uncertainties and can be extremely volatile.
2. Investments in Fidelity Central Funds.
The Fund invests in Fidelity Central Funds, which are open-end investment companies generally available only to other investment companies and accounts managed by the investment adviser and its affiliates. The Fund's Schedule of Investments lists each of the Fidelity Central Funds held as of period end, if any, as an investment of the Fund, but does not include the underlying holdings of each Fidelity Central Fund. As an Investing Fund, the Fund indirectly bears its proportionate share of the expenses of the underlying Fidelity Central Funds.
The Money Market Central Funds seek preservation of capital and current income and are managed by Fidelity Investments Money Management, Inc. (FIMM), an affiliate of the investment adviser. Annualized expenses of the Money Market Central Funds as of their most recent shareholder report date are less than .005%.
A complete unaudited list of holdings for each Fidelity Central Fund is available upon request or at the Securities and Exchange Commission (the SEC) website at www.sec.gov. In addition, the financial statements of the Fidelity Central Funds are available on the SEC website or upon request.
3. Significant Accounting Policies.
The Fund is an investment company and applies the accounting and reporting guidance of the Financial Accounting Standards Board (FASB) Accounting Standards Codification Topic 946 Financial Services – Investments Companies. The financial statements have been prepared in conformity with accounting principles generally accepted in the United States of America (GAAP), which require management to make certain estimates and assumptions at the date of the financial statements. Actual results could differ from those estimates. Subsequent events, if any, through the date that the financial statements were issued have been evaluated in the preparation of the financial statements. The following summarizes the significant accounting policies of the Fund:
Investment Valuation. Investments are valued as of 4:00 p.m. Eastern time on the last calendar day of the period. The Board of Trustees (the Board) has delegated the day to day responsibility for the valuation of the Fund's investments to the Fair Value Committee (the Committee) established by the Fund's investment adviser. In accordance with valuation policies and procedures approved by the Board, the Fund attempts to obtain prices from one or more third party pricing vendors or brokers to value its investments. When current market prices, quotations or currency exchange rates are not readily available or reliable, investments will be fair valued in good faith by the Committee, in accordance with procedures adopted by the Board. Factors used in determining fair value vary by investment type and may include market or investment specific events. The frequency with which these procedures are used cannot be predicted and they may be utilized to a significant extent. The Committee oversees the Fund's valuation policies and procedures and reports to the Board on the Committee's activities and fair value determinations. The Board monitors the appropriateness of the procedures used in valuing the Fund's investments and ratifies the fair value determinations of the Committee.
The Fund categorizes the inputs to valuation techniques used to value its investments into a disclosure hierarchy consisting of three levels as shown below:
- Level 1 – quoted prices in active markets for identical investments
- Level 2 – other significant observable inputs (including quoted prices for similar investments, interest rates, prepayment speeds, etc.)
- Level 3 – unobservable inputs (including the Fund's own assumptions based on the best information available)
Valuation techniques used to value the Fund's investments by major category are as follows:
Equity securities, including restricted securities, for which market quotations are readily available, are valued at the last reported sale price or official closing price as reported by a third party pricing vendor on the primary market or exchange on which they are traded and are categorized as Level 1 in the hierarchy. In the event there were no sales during the day or closing prices are not available, securities are valued at the last quoted bid price or may be valued using the last available price and are generally categorized as Level 2 in the hierarchy. For foreign equity securities, when market or security specific events arise, comparisons to the valuation of American Depositary Receipts (ADRs), futures contracts, Exchange-Traded Funds (ETFs) and certain indexes as well as quoted prices for similar securities may be used and would be categorized as Level 2 in the hierarchy. Utilizing these techniques may result in transfers between Level 1 and Level 2. For equity securities, including restricted securities, where observable inputs are limited, assumptions about market activity and risk are used and these securities may be categorized as Level 3 in the hierarchy.
Investments in open-end mutual funds, including the Fidelity Central Funds, are valued at their closing net asset value (NAV) each business day and are categorized as Level 1 in the hierarchy.
Changes in valuation techniques may result in transfers in or out of an assigned level within the disclosure hierarchy. The aggregate value of investments by input level as of April 30, 2018, including information on transfers between Levels 1 and 2 is included at the end of the Fund's Schedule of Investments.
Foreign Currency. The Fund may use foreign currency contracts to facilitate transactions in foreign-denominated securities. Gains and losses from these transactions may arise from changes in the value of the foreign currency or if the counterparties do not perform under the contracts' terms.
Foreign-denominated assets, including investment securities, and liabilities are translated into U.S. dollars at the exchange rates at period end. Purchases and sales of investment securities, income and dividends received and expenses denominated in foreign currencies are translated into U.S. dollars at the exchange rate in effect on the transaction date.
The effects of exchange rate fluctuations on investments are included with the net realized and unrealized gain (loss) on investment securities. Other foreign currency transactions resulting in realized and unrealized gain (loss) are disclosed separately.
Investment Transactions and Income. For financial reporting purposes, the Fund's investment holdings and NAV include trades executed through the end of the last business day of the period. The NAV per share for processing shareholder transactions is calculated as of the close of business of the New York Stock Exchange (NYSE), normally 4:00 p.m. Eastern time and includes trades executed through the end of the prior business day. Gains and losses on securities sold are determined on the basis of identified cost and includes proceeds received from litigation. Dividend income is recorded on the ex-dividend date, except for certain dividends from foreign securities where the ex-dividend date may have passed, which are recorded as soon as the Fund is informed of the ex-dividend date. Non-cash dividends included in dividend income, if any, are recorded at the fair market value of the securities received. Income and capital gain distributions from Fidelity Central Funds, if any, are recorded on the ex-dividend date. Certain distributions received by the Fund represent a return of capital or capital gain. The Fund determines the components of these distributions subsequent to the ex-dividend date, based upon receipt of tax filings or other correspondence relating to the underlying investment. These distributions are recorded as a reduction of cost of investments and/or as a realized gain. Investment income is recorded net of foreign taxes withheld where recovery of such taxes is uncertain.
Class Allocations and Expenses. Investment income, realized and unrealized capital gains and losses, common expenses of the Fund, and certain fund-level expense reductions, if any, are allocated daily on a pro-rata basis to each class based on the relative net assets of each class to the total net assets of the Fund. Each class differs with respect to transfer agent fees incurred. Certain expense reductions may also differ by class. For the reporting period, the allocated portion of income and expenses to each class as a percent of its average net assets may vary due to the timing of recording these transactions in relation to fluctuating net assets of the classes. Expenses directly attributable to a fund are charged to that fund. Expenses attributable to more than one fund are allocated among the respective funds on the basis of relative net assets or other appropriate methods. Expense estimates are accrued in the period to which they relate and adjustments are made when actual amounts are known.
Deferred Trustee Compensation. Under a Deferred Compensation Plan (the Plan), certain independent Trustees have elected to defer receipt of a portion of their annual compensation. Deferred amounts are invested in a cross-section of Fidelity funds, are marked-to-market and remain in the Fund until distributed in accordance with the Plan. The investment of deferred amounts and the offsetting payable to the Trustees are included in the accompanying Statement of Assets and Liabilities.
Income Tax Information and Distributions to Shareholders. Each year, the Fund intends to qualify as a regulated investment company under Subchapter M of the Internal Revenue Code, including distributing substantially all of its taxable income and realized gains. As a result, no provision for U.S. Federal income taxes is required. The Fund files a U.S. federal tax return, in addition to state and local tax returns as required. The Fund's federal income tax returns are subject to examination by the Internal Revenue Service (IRS) for a period of three fiscal years after they are filed. State and local tax returns may be subject to examination for an additional fiscal year depending on the jurisdiction. Foreign taxes are provided for based on the Fund's understanding of the tax rules and rates that exist in the foreign markets in which it invests. The Fund is subject to a tax imposed on capital gains by certain countries in which it invests. An estimated deferred tax liability for net unrealized appreciation on the applicable securities is included in Other payables and accrued expenses on the Statement of Assets & Liabilities.
Distributions are declared and recorded on the ex-dividend date. Income and capital gain distributions are declared separately for each class. Income and capital gain distributions are determined in accordance with income tax regulations, which may differ from GAAP.
Capital accounts within the financial statements are adjusted for permanent book-tax differences. These adjustments have no impact on net assets or the results of operations. Capital accounts are not adjusted for temporary book-tax differences which will reverse in a subsequent period.
Book-tax differences are primarily due to foreign currency transactions, passive foreign investment companies (PFIC), redemptions in kind, deferred trustees compensation, capital loss carryforwards and losses deferred due to wash sales.
As of period end, the cost and unrealized appreciation (depreciation) in securities, and derivatives if applicable, for federal income tax purposes were as follows:
| Gross unrealized appreciation | $4,572,292,511 |
| Gross unrealized depreciation | (417,873,212) |
| Net unrealized appreciation (depreciation) | $4,154,419,299 |
| Tax cost | $13,324,905,920 |
Delayed Delivery Transactions and When-Issued Securities. During the period, the Fund transacted in securities on a delayed delivery or when-issued basis. Payment and delivery may take place after the customary settlement period for that security. The price of the underlying securities and the date when the securities will be delivered and paid for are fixed at the time the transaction is negotiated. The securities purchased on a delayed delivery or when-issued basis are identified as such in the Fund's Schedule of Investments. Losses may arise due to changes in the value of the underlying securities or if the counterparty does not perform under the contract's terms, or if the issuer does not issue the securities due to political, economic, or other factors.
Restricted Securities. The Fund may invest in securities that are subject to legal or contractual restrictions on resale. These securities generally may be resold in transactions exempt from registration or to the public if the securities are registered. Disposal of these securities may involve time-consuming negotiations and expense, and prompt sale at an acceptable price may be difficult. Information regarding restricted securities is included at the end of the Fund's Schedule of Investments.
4. Purchases and Sales of Investments.
Purchases and sales of securities, other than short-term securities and in-kind transactions, aggregated $3,124,596,570 and $4,036,479,910, respectively.
Redemptions In-Kind. During the period, 41,282,842 shares of the Fund held by unaffiliated entities were redeemed in-kind for investments and cash with a value of $1,673,294,063. The net realized gain of $617,019,956 on investments delivered through the in-kind redemptions is included in the accompanying Statement of Operations. The amount of the redemptions is included in share transactions activity shown in the accompanying Statement of Changes in Net Assets as well as the Notes to Financial Statements. The Fund recognized no gain or loss for federal income tax purposes.
Prior Fiscal Year Redemptions In-Kind. During the prior period, 42,309,077 shares of the Fund held by an unaffiliated entity were redeemed in-kind for investments and cash with a value of $1,506,770,841. The Fund had a net realized gain of $488,334,715 on investments delivered through the in-kind redemptions. The amount of the redemptions is included in share transactions activity shown in the accompanying Statement of Changes in Net Assets as well as the Notes to Financial Statements. The Fund recognized no gain or loss for federal income tax purposes.
5. Fees and Other Transactions with Affiliates.
Management Fee. Fidelity Management & Research Company (the investment adviser) and its affiliates provide the Fund with investment management related services for which the Fund pays a monthly management fee. The management fee is the sum of an individual fund fee rate that is based on an annual rate of .424% of the Fund's average net assets and an annualized group fee rate that averaged .24% during the period. The group fee rate is based upon the average net assets of all the mutual funds advised by the investment adviser, including any mutual funds previously advised by the investment adviser that are currently advised by Fidelity SelectCo, LLC, an affiliate of the investment adviser. The group fee rate decreases as assets under management increase and increases as assets under management decrease. In addition, the management fee is subject to a performance adjustment (up to a maximum of +/- .20% of the Fund's average net assets over a 36 month performance period). The upward or downward adjustment to the management fee is based on the relative investment performance of Diversified International as compared to its benchmark index, the MSCI EAFE Index, over the same 36 month performance period. For the reporting period, the total annualized management fee rate, including the performance adjustment, was .65% of the Fund's average net assets. The performance adjustment included in the management fee rate may be higher or lower than the maximum performance adjustment rate due to the difference between the average net assets for the reporting and performance periods.
Transfer Agent Fees. Fidelity Investments Institutional Operations Company, Inc., (FIIOC), an affiliate of the investment adviser, is the transfer, dividend disbursing and shareholder servicing agent for each class of the Fund. FIIOC receives account fees and asset-based fees that vary according to the account size and type of account of the shareholders of Diversified International. FIIOC receives an asset-based fee of Class K's average net assets. FIIOC pays for typesetting, printing and mailing of shareholder reports, except proxy statements.
For the period, transfer agent fees for each class were as follows:
| Amount | % of Class-Level Average Net Assets(a) | |
| Diversified International | $9,103,534 | .16 |
| Class K | 1,677,750 | .05 |
| $10,781,284 |
(a) Annualized
Accounting and Security Lending Fees. Fidelity Service Company, Inc. (FSC), an affiliate of the investment adviser, maintains the Fund's accounting records. The accounting fee is based on the level of average net assets for each month. Under a separate contract, FSC administers the security lending program. The security lending fee is based on the number and duration of lending transactions. For the period, the fees were equivalent to an annualized rate of .01%.
Brokerage Commissions. The Fund placed a portion of its portfolio transactions with brokerage firms which are affiliates of the investment adviser. Brokerage commissions are included in net realized gain (loss) and change in net unrealized appreciation (depreciation) in the Statement of Operations. The commissions paid to these affiliated firms were $19,129 for the period.
Interfund Trades. The Fund may purchase from or sell securities to other Fidelity Funds under procedures adopted by the Board. The procedures have been designed to ensure these interfund trades are executed in accordance with Rule 17a-7 of the 1940 Act. Interfund trades are included within the respective purchases and sales amounts shown in the Purchases and Sales of Investments note.
Prior Fiscal Year Redemptions In-Kind. During the prior period, 6,219,500 shares of the Fund held by an affiliated entity were redeemed in-kind for investments and cash, including accrued interest, with a value of $252,875,067. The Fund had a net realized gain of $95,146,213 on investments delivered through in-kind redemptions. The amount of the in-kind redemptions is included in share transactions in the accompanying Statement of Changes in Net Assets as well as the Notes to Financial Statements. The Fund recognized no gain or loss for federal income tax purposes.
6. Committed Line of Credit.
The Fund participates with other funds managed by the investment adviser or an affiliate in a $4.25 billion credit facility (the "line of credit") to be utilized for temporary or emergency purposes to fund shareholder redemptions or for other short-term liquidity purposes. The Fund has agreed to pay commitment fees on its pro-rata portion of the line of credit, which amounted to $27,372 and is reflected in Miscellaneous expenses on the Statement of Operations. During the period, the Fund did not borrow on this line of credit.
7. Security Lending.
The Fund lends portfolio securities through a lending agent from time to time in order to earn additional income. For equity securities, a lending agent is used and may loan securities to certain qualified borrowers, including Fidelity Capital Markets (FCM), a broker-dealer affiliated with the Fund. On the settlement date of the loan, the Fund receives collateral (in the form of U.S. Treasury obligations, letters of credit and/or cash) against the loaned securities and maintains collateral in an amount not less than 100% of the market value of the loaned securities during the period of the loan. The market value of the loaned securities is determined at the close of business of the Fund and any additional required collateral is delivered to the Fund on the next business day. The Fund or borrower may terminate the loan at any time, and if the borrower defaults on its obligation to return the securities loaned because of insolvency or other reasons, the Fund may apply collateral received from the borrower against the obligation. The Fund may experience delays and costs in recovering the securities loaned. Any cash collateral received is invested in the Fidelity Securities Lending Cash Central Fund. The value of loaned securities and cash collateral at period end are disclosed on the Fund's Statement of Assets and Liabilities. Security lending income represents the income earned on investing cash collateral, less rebates paid to borrowers and any lending agent fees associated with the loan, plus any premium payments received for lending certain types of securities. Security lending income is presented in the Statement of Operations as a component of income from Fidelity Central Funds. Total security lending income during the period amounted to $2,026,468. During the period, there were no securities loaned to FCM.
8. Expense Reductions.
Commissions paid to certain brokers with whom the investment adviser, or its affiliates, places trades on behalf of the Fund include an amount in addition to trade execution, which may be rebated back to the Fund to offset certain expenses. This amount totaled $1,282,915 for the period. In addition, through arrangements with the Fund's custodian, credits realized as a result of certain uninvested cash balances were used to reduce the Fund's expenses. During the period, these credits reduced the Fund's expenses by $2,069.
In addition, during the period the investment adviser reimbursed and/or waived a portion of fund-level operating expenses in the amount of $95,514.
9. Distributions to Shareholders.
Distributions to shareholders of each class were as follows:
| Six months ended April 30, 2018 | Year ended October 31, 2017 | |
| From net investment income | ||
| Diversified International | $118,100,193 | $117,261,561 |
| Class K | 91,611,212 | 105,950,318 |
| Total | $209,711,405 | $223,211,879 |
| From net realized gain | ||
| Diversified International | $460,399,805 | $21,125,448 |
| Class K | 322,165,939 | 17,001,323 |
| Total | $782,565,744 | $38,126,771 |
10. Share Transactions.
Share transactions for each class were as follows and may contain automatic conversions between classes or exchanges between affiliated funds:
| Shares | Shares | Dollars | Dollars | |
| Six months ended April 30, 2018 | Year ended October 31, 2017 | Six months ended April 30, 2018 | Year ended October 31, 2017 | |
| Diversified International | ||||
| Shares sold | 13,800,112 | 29,659,523 | $559,474,048 | $1,086,343,758 |
| Reinvestment of distributions | 13,661,964 | 3,851,054 | 537,871,482 | 128,009,018 |
| Shares redeemed | (30,453,746)(a) | (79,920,304)(b) | (1,232,324,010)(a) | (2,857,242,109)(b) |
| Net increase (decrease) | (2,991,670) | (46,409,727) | $(134,978,480) | $(1,642,889,333) |
| Class K | ||||
| Shares sold | 17,845,469 | 40,529,599 | $722,789,417 | $1,505,583,540 |
| Reinvestment of distributions | 10,532,806 | 3,707,830 | 413,728,634 | 122,951,641 |
| Shares redeemed | (66,255,185)(a) | (90,053,301)(b) | (2,680,432,500)(a) | (3,306,388,504)(b) |
| Net increase (decrease) | (37,876,910) | (45,815,872) | $(1,543,914,449) | $(1,677,853,323) |
(a) Amount includes in-kind redemptions (see the Redemptions In-Kind note for additional details).
(b) Amount includes in-kind redemptions (see the prior Redemptions In-Kind note for additional details).
11. Other.
The Fund's organizational documents provide former and current trustees and officers with a limited indemnification against liabilities arising in connection with the performance of their duties to the Fund. In the normal course of business, the Fund may also enter into contracts that provide general indemnifications. The Fund's maximum exposure under these arrangements is unknown as this would be dependent on future claims that may be made against the Fund. The risk of material loss from such claims is considered remote.
Shareholder Expense Example
As a shareholder of the Fund, you incur two types of costs: (1) transaction costs, and (2) ongoing costs, including management fees and other Fund expenses. This Example is intended to help you understand your ongoing costs (in dollars) of investing in the Fund and to compare these costs with the ongoing costs of investing in other mutual funds.
The Example is based on an investment of $1,000 invested at the beginning of the period and held for the entire period (November 1, 2017 to April 30, 2018).
Actual Expenses
The first line of the accompanying table for each class of the Fund provides information about actual account values and actual expenses. You may use the information in this line, together with the amount you invested, to estimate the expenses that you paid over the period. Simply divide your account value by $1,000.00 (for example, an $8,600 account value divided by $1,000.00 = 8.6), then multiply the result by the number in the first line for a class of the Fund under the heading entitled "Expenses Paid During Period" to estimate the expenses you paid on your account during this period. A small balance maintenance fee of $12.00 that is charged once a year may apply for certain accounts with a value of less than $2,000. This fee is not included in the table below. If it was, the estimate of expenses you paid during the period would be higher, and your ending account value lower, by this amount. In addition, the Fund, as a shareholder in the underlying Fidelity Central Funds, will indirectly bear its pro-rata share of the fees and expenses incurred by the underlying Fidelity Central Funds. These fees and expenses are not included in the Fund's annualized expense ratio used to calculate the expense estimate in the table below.
Hypothetical Example for Comparison Purposes
The second line of the accompanying table for each class of the Fund provides information about hypothetical account values and hypothetical expenses based on a Class' actual expense ratio and an assumed rate of return of 5% per year before expenses, which is not the Class' actual return. The hypothetical account values and expenses may not be used to estimate the actual ending account balance or expenses you paid for the period. You may use this information to compare the ongoing costs of investing in the Fund and other funds. To do so, compare this 5% hypothetical example with the 5% hypothetical examples that appear in the shareholder reports of the other funds. A small balance maintenance fee of $12.00 that is charged once a year may apply for certain accounts with a value of less than $2,000. This fee is not included in the table below. If it was, the estimate of expenses you paid during the period would be higher, and your ending account value lower, by this amount. In addition, the Fund, as a shareholder in the underlying Fidelity Central Funds, will indirectly bear its pro-rata share of the fees and expenses incurred by the underlying Fidelity Central Funds. These fees and expenses are not included in the Fund's annualized expense ratio used to calculate the expense estimate in the table below.
Please note that the expenses shown in the table are meant to highlight your ongoing costs only and do not reflect any transaction costs. Therefore, the second line of the table is useful in comparing ongoing costs only, and will not help you determine the relative total costs of owning different funds.
| Annualized Expense Ratio-A | Beginning Account Value November 1, 2017 | Ending Account Value April 30, 2018 | Expenses Paid During Period-B November 1, 2017 to April 30, 2018 | |
| Diversified International | .84% | |||
| Actual | $1,000.00 | $1,009.10 | $4.18 | |
| Hypothetical-C | $1,000.00 | $1,020.63 | $4.21 | |
| Class K | .72% | |||
| Actual | $1,000.00 | $1,009.50 | $3.59 | |
| Hypothetical-C | $1,000.00 | $1,021.22 | $3.61 |
A Annualized expense ratio reflects expenses net of applicable fee waivers.
B Expenses are equal to each Class' annualized expense ratio, multiplied by the average account value over the period, multiplied by 181/365 (to reflect the one-half year period).
C 5% return per year before expenses
![]()
Corporate Headquarters
245 Summer St.
Boston, MA 02210
www.fidelity.com
DIF-K-SANN-0618
1.863008.109
Fidelity Advisor® Worldwide Fund - Semi-Annual Report April 30, 2018 Class A, Class M, Class C and Class I are classes of Fidelity® Worldwide Fund |
|
Contents
To view a fund's proxy voting guidelines and proxy voting record for the 12-month period ended June 30, visit http://www.fidelity.com/proxyvotingresults or visit the Securities and Exchange Commission's (SEC) web site at http://www.sec.gov.
You may also call 1-877-208-0098 to request a free copy of the proxy voting guidelines.
Standard & Poor's, S&P and S&P 500 are registered service marks of The McGraw-Hill Companies, Inc. and have been licensed for use by Fidelity Distributors Corporation.
Other third-party marks appearing herein are the property of their respective owners.
All other marks appearing herein are registered or unregistered trademarks or service marks of FMR LLC or an affiliated company. © 2018 FMR LLC. All rights reserved.
This report and the financial statements contained herein are submitted for the general information of the shareholders of the Fund. This report is not authorized for distribution to prospective investors in the Fund unless preceded or accompanied by an effective prospectus.
A fund files its complete schedule of portfolio holdings with the SEC for the first and third quarters of each fiscal year on Form N-Q. Forms N-Q are available on the SEC’s web site at http://www.sec.gov. A fund's Forms N-Q may be reviewed and copied at the SEC’s Public Reference Room in Washington, DC. Information regarding the operation of the SEC's Public Reference Room may be obtained by calling 1-800-SEC-0330.
For a complete list of a fund's portfolio holdings, view the most recent holdings listing, semiannual report, or annual report on Fidelity's web site at http://www.fidelity.com, http://www.institutional.fidelity.com, or http://www.401k.com, as applicable.
NOT FDIC INSURED •MAY LOSE VALUE •NO BANK GUARANTEE
Neither the Fund nor Fidelity Distributors Corporation is a bank.
Investment Summary (Unaudited)
Geographic Diversification (% of fund's net assets)
| As of April 30, 2018 | ||
| United States of America* | 60.3% | |
| Japan | 7.5% | |
| United Kingdom | 4.8% | |
| France | 3.9% | |
| Germany | 3.3% | |
| Switzerland | 2.7% | |
| Netherlands | 2.0% | |
| India | 1.7% | |
| Spain | 1.7% | |
| Other | 12.1% | |

* Includes Short-Term investments and Net Other Assets (Liabilities).
Percentages are based on country or territory of incorporation and are adjusted for the effect of futures contracts, if applicable.
Asset Allocation as of April 30, 2018
| % of fund's net assets | |
| Stocks and Equity Futures | 94.6 |
| Short-Term Investments and Net Other Assets (Liabilities) | 5.4 |
Top Ten Stocks as of April 30, 2018
| % of fund's net assets | |
| Microsoft Corp. (United States of America, Software) | 3.0 |
| Adobe Systems, Inc. (United States of America, Software) | 3.0 |
| S&P Global, Inc. (United States of America, Capital Markets) | 3.0 |
| Humana, Inc. (United States of America, Health Care Providers & Services) | 3.0 |
| Union Pacific Corp. (United States of America, Road & Rail) | 3.0 |
| Intuit, Inc. (United States of America, Software) | 2.8 |
| Bank of America Corp. (United States of America, Banks) | 2.7 |
| Charles Schwab Corp. (United States of America, Capital Markets) | 2.3 |
| MasterCard, Inc. Class A (United States of America, IT Services) | 2.1 |
| Amazon.com, Inc. (United States of America, Internet & Direct Marketing Retail) | 1.9 |
| 26.8 |
Top Market Sectors as of April 30, 2018
| % of fund's net assets | |
| Information Technology | 25.3 |
| Financials | 18.4 |
| Industrials | 12.5 |
| Health Care | 10.9 |
| Consumer Discretionary | 10.5 |
| Energy | 6.0 |
| Consumer Staples | 4.4 |
| Materials | 3.2 |
| Real Estate | 1.0 |
| Telecommunication Services | 0.6 |
Schedule of Investments April 30, 2018 (Unaudited)
Showing Percentage of Net Assets
| Common Stocks - 93.0% | |||
| Shares | Value | ||
| Australia - 0.6% | |||
| Bapcor Ltd. (a) | 648,598 | $2,861,606 | |
| Blue Sky Alternative Investments Ltd. | 254,244 | 585,998 | |
| BWX Ltd. | 139,340 | 528,658 | |
| Inghams Group Ltd. (a) | 513,123 | 1,447,795 | |
| Link Administration Holdings Ltd. | 217,620 | 1,354,106 | |
| Magellan Financial Group Ltd. | 81,493 | 1,423,721 | |
| National Storage (REIT) unit | 796,515 | 956,304 | |
| Rio Tinto Ltd. | 12,098 | 720,002 | |
| Spark Infrastructure Group unit | 923,744 | 1,628,755 | |
| TOTAL AUSTRALIA | 11,506,945 | ||
| Austria - 0.6% | |||
| Erste Group Bank AG | 122,600 | 6,010,901 | |
| Wienerberger AG | 184,100 | 4,646,470 | |
| TOTAL AUSTRIA | 10,657,371 | ||
| Bailiwick of Jersey - 0.5% | |||
| Glencore Xstrata PLC | 1,650,524 | 7,968,873 | |
| Wizz Air Holdings PLC (b)(c) | 34,000 | 1,495,041 | |
| TOTAL BAILIWICK OF JERSEY | 9,463,914 | ||
| Belgium - 0.6% | |||
| Anheuser-Busch InBev SA NV | 13,411 | 1,339,661 | |
| KBC Groep NV | 91,790 | 8,025,222 | |
| Telenet Group Holding NV (b) | 30,600 | 1,794,416 | |
| TOTAL BELGIUM | 11,159,299 | ||
| Bermuda - 0.3% | |||
| Hiscox Ltd. | 237,200 | 4,862,378 | |
| Brazil - 0.0% | |||
| Itausa-Investimentos Itau SA | 25,702 | 99,046 | |
| Canada - 1.1% | |||
| Alimentation Couche-Tard, Inc. Class B (sub. vtg.) | 54,400 | 2,351,917 | |
| Cenovus Energy, Inc. | 228,100 | 2,284,642 | |
| Constellation Software, Inc. | 4,600 | 3,287,588 | |
| PrairieSky Royalty Ltd. (a) | 177,099 | 3,926,951 | |
| Shopify, Inc. (b) | 48,000 | 6,414,240 | |
| Suncor Energy, Inc. | 94,300 | 3,606,161 | |
| TOTAL CANADA | 21,871,499 | ||
| Cayman Islands - 0.7% | |||
| Alibaba Group Holding Ltd. sponsored ADR (b) | 38,900 | 6,945,206 | |
| China Literature Ltd. (b)(c) | 205,200 | 1,652,907 | |
| ENN Energy Holdings Ltd. | 185,000 | 1,730,033 | |
| New Oriental Education & Technology Group, Inc. sponsored ADR | 13,400 | 1,203,856 | |
| Ping An Healthcare and Technology Co. Ltd. (b) | 39,500 | 275,793 | |
| Tencent Holdings Ltd. | 22,000 | 1,081,584 | |
| Zai Lab Ltd. ADR | 25,100 | 468,617 | |
| TOTAL CAYMAN ISLANDS | 13,357,996 | ||
| China - 0.6% | |||
| Jiangsu Yanghe Brewery Joint-Stock Co. Ltd. Class A | 175,500 | 3,092,372 | |
| Kweichow Moutai Co. Ltd. (A Shares) | 35,800 | 3,727,819 | |
| Qingdao Port International Co. Ltd. (c) | 876,000 | 719,696 | |
| Shanghai International Airport Co. Ltd. (A Shares) | 401,700 | 3,155,010 | |
| TOTAL CHINA | 10,694,897 | ||
| Denmark - 0.4% | |||
| NNIT A/S (c) | 116,870 | 3,246,757 | |
| Novo Nordisk A/S Series B | 52,980 | 2,491,541 | |
| Novozymes A/S Series B | 25,100 | 1,180,023 | |
| TOTAL DENMARK | 6,918,321 | ||
| Finland - 0.2% | |||
| Sampo Oyj (A Shares) | 57,000 | 3,080,286 | |
| France - 3.9% | |||
| Accor SA | 69,300 | 3,922,395 | |
| ALTEN | 23,200 | 2,305,743 | |
| Altran Technologies SA | 112,500 | 1,738,944 | |
| Amundi SA (c) | 45,020 | 3,831,726 | |
| Atos Origin SA | 16,059 | 2,170,060 | |
| BNP Paribas SA | 64,000 | 4,944,784 | |
| Capgemini SA | 34,400 | 4,735,724 | |
| Cegedim SA (b) | 39,210 | 1,666,720 | |
| Elis SA | 77,700 | 1,859,721 | |
| Kaufman & Broad SA | 11,186 | 589,769 | |
| LVMH Moet Hennessy - Louis Vuitton SA | 16,646 | 5,793,010 | |
| Rexel SA | 145,600 | 2,259,371 | |
| Sartorius Stedim Biotech | 19,800 | 1,850,671 | |
| SMCP S.A.S. (c) | 20,994 | 536,076 | |
| Societe Generale Series A | 149,900 | 8,203,845 | |
| Thales SA | 29,100 | 3,689,822 | |
| Total SA (a) | 244,501 | 15,367,317 | |
| VINCI SA | 78,600 | 7,858,719 | |
| TOTAL FRANCE | 73,324,417 | ||
| Germany - 3.3% | |||
| adidas AG | 41,320 | 10,174,209 | |
| Aumann AG (c) | 10,915 | 660,366 | |
| Deutsche Borse AG | 9,362 | 1,259,087 | |
| Deutsche Post AG | 153,749 | 6,673,391 | |
| Fresenius SE & Co. KGaA | 65,400 | 5,002,406 | |
| Henkel AG & Co. KGaA | 24,900 | 2,969,337 | |
| JOST Werke AG (c) | 14,800 | 624,643 | |
| Linde AG | 19,700 | 4,378,498 | |
| MTU Aero Engines Holdings AG | 26,200 | 4,524,394 | |
| Muenchener Rueckversicherungs AG | 8,000 | 1,835,069 | |
| Nexus AG | 46,000 | 1,538,724 | |
| Rational AG | 3,100 | 1,944,779 | |
| Rheinmetall AG | 21,200 | 2,781,562 | |
| SAP SE | 87,323 | 9,702,081 | |
| Scout24 AG (c) | 39,400 | 2,043,061 | |
| WashTec AG | 36,200 | 3,492,838 | |
| Wirecard AG | 19,900 | 2,717,933 | |
| TOTAL GERMANY | 62,322,378 | ||
| Greece - 0.1% | |||
| Ff Group (b) | 59,300 | 1,124,288 | |
| Hong Kong - 0.3% | |||
| AIA Group Ltd. | 467,600 | 4,179,035 | |
| Techtronic Industries Co. Ltd. | 231,000 | 1,353,242 | |
| TOTAL HONG KONG | 5,532,277 | ||
| India - 1.7% | |||
| Avenue Supermarts Ltd. (b)(c) | 1,642 | 36,611 | |
| Bharti Infratel Ltd. | 101,893 | 479,550 | |
| Future Retail Ltd. | 111,000 | 1,002,952 | |
| HDFC Bank Ltd. | 117,751 | 3,548,993 | |
| HDFC Bank Ltd. sponsored ADR | 46,893 | 4,492,818 | |
| Housing Development Finance Corp. Ltd. | 245,878 | 6,956,632 | |
| Kajaria Ceramics Ltd. | 158,300 | 1,296,129 | |
| Kotak Mahindra Bank Ltd. (b) | 95,387 | 1,734,507 | |
| Lupin Ltd. (b) | 1,335 | 16,260 | |
| Petronet LNG Ltd. | 196,298 | 668,335 | |
| PNB Housing Finance Ltd. (c) | 53,911 | 1,131,532 | |
| PVR Ltd. (b) | 28,483 | 615,987 | |
| Reliance Industries Ltd. | 276,192 | 3,987,770 | |
| Sunteck Realty Ltd. (b) | 304,120 | 1,961,525 | |
| V-Mart Retail Ltd. (b) | 160,867 | 5,031,365 | |
| TOTAL INDIA | 32,960,966 | ||
| Indonesia - 0.2% | |||
| PT Bank Central Asia Tbk | 393,100 | 621,602 | |
| PT Bank Rakyat Indonesia Tbk | 11,290,800 | 2,603,303 | |
| PT Kino Indonesia Tbk | 234,500 | 34,124 | |
| TOTAL INDONESIA | 3,259,029 | ||
| Ireland - 1.5% | |||
| Accenture PLC Class A | 6,000 | 907,200 | |
| Cairn Homes PLC (b) | 1,721,239 | 3,733,109 | |
| CRH PLC | 141,649 | 5,030,157 | |
| Dalata Hotel Group PLC (b) | 249,800 | 1,990,946 | |
| DCC PLC (United Kingdom) | 23,400 | 2,255,035 | |
| Glenveagh Properties PLC (c) | 446,224 | 595,979 | |
| Green REIT PLC | 621,300 | 1,138,928 | |
| Greencore Group PLC | 372,815 | 814,791 | |
| James Hardie Industries PLC CDI | 171,226 | 3,023,756 | |
| Kerry Group PLC Class A | 31,700 | 3,234,738 | |
| Ryanair Holdings PLC sponsored ADR (b) | 24,970 | 2,745,951 | |
| United Drug PLC (United Kingdom) | 260,800 | 3,285,247 | |
| TOTAL IRELAND | 28,755,837 | ||
| Israel - 0.2% | |||
| Frutarom Industries Ltd. | 45,200 | 4,339,210 | |
| Italy - 0.5% | |||
| Intesa Sanpaolo SpA | 1,563,700 | 5,948,248 | |
| Prada SpA | 698,600 | 3,544,630 | |
| TOTAL ITALY | 9,492,878 | ||
| Japan - 6.3% | |||
| A/S One Corp. | 65,700 | 4,471,350 | |
| AEON Financial Service Co. Ltd. | 112,100 | 2,631,253 | |
| Ain Holdings, Inc. | 40,300 | 2,691,090 | |
| Daiichikosho Co. Ltd. | 49,200 | 2,587,816 | |
| Daito Trust Construction Co. Ltd. | 10,900 | 1,820,156 | |
| Hoya Corp. | 99,000 | 5,308,617 | |
| Keyence Corp. | 6,320 | 3,871,665 | |
| Komatsu Ltd. | 110,100 | 3,753,170 | |
| Minebea Mitsumi, Inc. | 213,400 | 4,288,692 | |
| Misumi Group, Inc. | 64,700 | 1,793,277 | |
| Mitsubishi UFJ Financial Group, Inc. | 712,000 | 4,771,356 | |
| Monex Group, Inc. (a) | 359,400 | 2,051,460 | |
| Morinaga & Co. Ltd. | 37,000 | 1,803,970 | |
| Nidec Corp. | 23,100 | 3,621,789 | |
| Nintendo Co. Ltd. | 8,600 | 3,613,518 | |
| Nitori Holdings Co. Ltd. | 33,500 | 5,663,008 | |
| ORIX Corp. | 385,600 | 6,786,447 | |
| PALTAC Corp. | 36,900 | 1,849,726 | |
| Panasonic Corp. | 423,900 | 6,276,751 | |
| Recruit Holdings Co. Ltd. | 48,000 | 1,109,550 | |
| Relo Group, Inc. | 175,700 | 3,963,375 | |
| Renesas Electronics Corp. (b) | 316,600 | 3,324,705 | |
| SMC Corp. | 15,800 | 6,029,784 | |
| SMS Co., Ltd. | 52,200 | 1,981,614 | |
| SoftBank Corp. | 56,600 | 4,324,733 | |
| Sony Corp. | 143,000 | 6,678,975 | |
| Start Today Co. Ltd. | 127,700 | 3,691,292 | |
| Sundrug Co. Ltd. | 59,700 | 3,074,561 | |
| Taiheiyo Cement Corp. | 94,000 | 3,564,124 | |
| Tateru, Inc. | 79,600 | 1,355,792 | |
| Tsuruha Holdings, Inc. | 32,500 | 4,676,409 | |
| VT Holdings Co. Ltd. | 280,200 | 1,278,996 | |
| Welcia Holdings Co. Ltd. | 112,200 | 5,778,321 | |
| TOTAL JAPAN | 120,487,342 | ||
| Kenya - 0.1% | |||
| Safaricom Ltd. | 6,251,600 | 1,760,795 | |
| Korea (South) - 0.1% | |||
| Hyundai Fire & Marine Insurance Co. Ltd. | 21,488 | 767,482 | |
| KB Financial Group, Inc. | 28,328 | 1,605,137 | |
| TOTAL KOREA (SOUTH) | 2,372,619 | ||
| Netherlands - 2.0% | |||
| ASML Holding NV (Netherlands) | 30,600 | 5,820,028 | |
| Basic-Fit NV (b)(c) | 37,100 | 1,117,809 | |
| IMCD Group BV | 66,600 | 4,105,755 | |
| ING Groep NV (Certificaten Van Aandelen) | 326,100 | 5,494,955 | |
| Instone Real Estate Group BV (b)(c) | 68,600 | 1,643,738 | |
| Koninklijke Philips Electronics NV | 168,458 | 7,130,192 | |
| NIBC Holding NV (b)(c) | 210,661 | 2,100,024 | |
| Philips Lighting NV (c) | 16,900 | 515,109 | |
| Unilever NV (Certificaten Van Aandelen) (Bearer) | 170,427 | 9,770,339 | |
| uniQure B.V. (b) | 27,300 | 797,160 | |
| Van Lanschot NV (Bearer) | 17,200 | 531,730 | |
| TOTAL NETHERLANDS | 39,026,839 | ||
| New Zealand - 0.4% | |||
| EBOS Group Ltd. | 210,137 | 2,628,816 | |
| Fisher & Paykel Healthcare Corp. | 242,612 | 2,176,448 | |
| Ryman Healthcare Group Ltd. | 465,018 | 3,468,179 | |
| TOTAL NEW ZEALAND | 8,273,443 | ||
| Norway - 0.8% | |||
| Statoil ASA | 560,080 | 14,322,763 | |
| Philippines - 0.2% | |||
| D&L Industries, Inc. | 8,349,900 | 1,750,207 | |
| SM Investments Corp. | 141,235 | 2,557,861 | |
| TOTAL PHILIPPINES | 4,308,068 | ||
| South Africa - 0.7% | |||
| Clicks Group Ltd. | 158,805 | 2,715,077 | |
| Distell Group Ltd. | 126,410 | 1,351,404 | |
| FirstRand Ltd. | 337,500 | 1,807,490 | |
| Naspers Ltd. Class N | 15,100 | 3,678,655 | |
| PSG Group Ltd. | 117,900 | 2,121,308 | |
| Remgro Ltd. | 95,000 | 1,710,345 | |
| TOTAL SOUTH AFRICA | 13,384,279 | ||
| Spain - 1.7% | |||
| Aedas Homes SAU (c) | 32,625 | 1,162,240 | |
| Amadeus IT Holding SA Class A | 39,800 | 2,917,393 | |
| CaixaBank SA | 2,086,684 | 10,147,282 | |
| Grifols SA ADR | 215,673 | 4,382,475 | |
| Masmovil Ibercom SA (b) | 35,552 | 5,134,738 | |
| Neinor Homes SLU (b)(c) | 66,100 | 1,281,947 | |
| Prosegur Cash SA (c) | 1,332,600 | 3,894,380 | |
| Zardoya Otis SA | 303,300 | 3,102,265 | |
| TOTAL SPAIN | 32,022,720 | ||
| Sweden - 0.9% | |||
| ASSA ABLOY AB (B Shares) | 203,600 | 4,282,816 | |
| Essity AB Class B | 170,400 | 4,339,468 | |
| HEXPOL AB (B Shares) | 118,900 | 1,235,621 | |
| Indutrade AB | 115,500 | 2,735,601 | |
| Saab AB (B Shares) (a) | 56,000 | 2,299,053 | |
| Svenska Cellulosa AB (SCA) (B Shares) | 272,500 | 3,028,521 | |
| TOTAL SWEDEN | 17,921,080 | ||
| Switzerland - 2.7% | |||
| Credit Suisse Group AG | 444,556 | 7,497,989 | |
| EDAG Engineering Group AG | 77,800 | 1,490,067 | |
| Forbo Holding AG (Reg.) | 1,310 | 1,840,081 | |
| Julius Baer Group Ltd. | 60,910 | 3,614,909 | |
| Kaba Holding AG (B Shares) (Reg.) | 2,620 | 2,035,721 | |
| Lonza Group AG | 18,382 | 4,529,651 | |
| Partners Group Holding AG | 5,008 | 3,671,354 | |
| Roche Holding AG (participation certificate) | 47,009 | 10,444,811 | |
| Schindler Holding AG (participation certificate) | 11,528 | 2,391,682 | |
| Swatch Group AG (Bearer) | 21,630 | 10,443,951 | |
| UBS Group AG | 251,400 | 4,254,266 | |
| TOTAL SWITZERLAND | 52,214,482 | ||
| Taiwan - 0.1% | |||
| United Microelectronics Corp. | 4,017,000 | 2,162,420 | |
| United Kingdom - 4.8% | |||
| Anglo American PLC (United Kingdom) | 89,900 | 2,115,645 | |
| Antofagasta PLC | 161,800 | 2,166,022 | |
| AstraZeneca PLC (United Kingdom) | 150,043 | 10,503,366 | |
| Barclays PLC | 3,920 | 11,176 | |
| BCA Marketplace PLC | 511,600 | 1,342,433 | |
| BHP Billiton PLC | 226,680 | 4,833,368 | |
| British American Tobacco PLC: | |||
| (United Kingdom) | 98,174 | 5,384,599 | |
| sponsored ADR | 27,000 | 1,474,740 | |
| Bunzl PLC | 129,986 | 3,777,671 | |
| Clipper Logistics PLC | 168,521 | 1,046,333 | |
| CMC Markets PLC (c) | 15,395 | 40,142 | |
| Compass Group PLC | 179,534 | 3,855,766 | |
| Conviviality PLC (d) | 367,080 | 255,712 | |
| Countryside Properties PLC (c) | 4,173 | 20,636 | |
| Cranswick PLC | 91,656 | 3,676,967 | |
| Dechra Pharmaceuticals PLC | 20,200 | 762,532 | |
| Fever-Tree Drinks PLC | 42,000 | 1,639,815 | |
| Hastings Group Holdings PLC (c) | 129,239 | 491,068 | |
| Hilton Food Group PLC | 374,800 | 4,571,646 | |
| Indivior PLC (b) | 256,800 | 1,601,874 | |
| JTC PLC (b)(c) | 342,900 | 1,446,896 | |
| LivaNova PLC (b) | 46,100 | 4,092,758 | |
| London Stock Exchange Group PLC | 49,781 | 2,946,941 | |
| Melrose Industries PLC | 1,766,892 | 5,546,055 | |
| Micro Focus International PLC | 219,930 | 3,792,282 | |
| NCC Group Ltd. | 584,200 | 1,581,191 | |
| Reckitt Benckiser Group PLC | 21,619 | 1,695,969 | |
| Rex Bionics PLC (b)(d) | 100,000 | 2,409 | |
| Rio Tinto PLC | 65,813 | 3,587,200 | |
| Senior Engineering Group PLC | 457,700 | 1,861,361 | |
| St. James's Place Capital PLC | 127,502 | 1,994,921 | |
| Standard Chartered PLC (United Kingdom) | 608,943 | 6,430,005 | |
| Tesco PLC | 64,230 | 208,037 | |
| The Weir Group PLC | 130,800 | 3,846,346 | |
| Zpg PLC | 641,900 | 3,172,496 | |
| TOTAL UNITED KINGDOM | 91,776,378 | ||
| United States of America - 54.9% | |||
| A.O. Smith Corp. | 55,000 | 3,374,250 | |
| Activision Blizzard, Inc. | 60,000 | 3,981,000 | |
| Adobe Systems, Inc. (b) | 259,124 | 57,421,878 | |
| Adtalem Global Education, Inc. (b) | 91,000 | 4,331,600 | |
| Agilent Technologies, Inc. | 50,900 | 3,346,166 | |
| Alphabet, Inc. Class A (b) | 29,500 | 30,048,110 | |
| Amazon.com, Inc. (b) | 23,000 | 36,020,990 | |
| American Tower Corp. | 28,000 | 3,818,080 | |
| Amphenol Corp. Class A | 34,000 | 2,846,140 | |
| Baker Hughes, a GE Co. Class A | 85,000 | 3,069,350 | |
| Bank of America Corp. | 1,711,000 | 51,193,120 | |
| BlackRock, Inc. Class A | 13,000 | 6,779,500 | |
| bluebird bio, Inc. (b) | 14,200 | 2,416,130 | |
| Boston Scientific Corp. (b) | 203,159 | 5,834,726 | |
| Broadridge Financial Solutions, Inc. | 15,000 | 1,608,150 | |
| Cboe Global Markets, Inc. | 7,000 | 747,460 | |
| Charles Schwab Corp. | 796,000 | 44,321,280 | |
| Chevron Corp. | 215,100 | 26,911,161 | |
| Chipotle Mexican Grill, Inc. (b) | 8,000 | 3,386,640 | |
| ConocoPhillips Co. | 268,600 | 17,593,300 | |
| CSX Corp. | 66,000 | 3,919,740 | |
| Dollar Tree, Inc. (b) | 55,000 | 5,273,950 | |
| DowDuPont, Inc. | 83,000 | 5,248,920 | |
| Edwards Lifesciences Corp. (b) | 13,000 | 1,655,680 | |
| Electronic Arts, Inc. (b) | 23,000 | 2,713,540 | |
| EOG Resources, Inc. | 100,000 | 11,817,000 | |
| Facebook, Inc. Class A (b) | 48,500 | 8,342,000 | |
| FibroGen, Inc. (b) | 15,000 | 681,750 | |
| FleetCor Technologies, Inc. (b) | 8,000 | 1,658,240 | |
| Fortive Corp. | 18,000 | 1,265,580 | |
| General Electric Co. | 520,000 | 7,316,400 | |
| Harris Corp. | 58,000 | 9,072,360 | |
| HealthSouth Corp. | 2 | 122 | |
| Humana, Inc. | 192,000 | 56,482,560 | |
| Intercept Pharmaceuticals, Inc. (a)(b) | 17,060 | 1,160,251 | |
| Intuit, Inc. | 289,000 | 53,404,310 | |
| Intuitive Surgical, Inc. (b) | 10,700 | 4,716,346 | |
| Kirby Corp. (b) | 50,000 | 4,265,000 | |
| Lowe's Companies, Inc. | 122,000 | 10,056,460 | |
| Marriott International, Inc. Class A | 194,000 | 26,515,920 | |
| MasterCard, Inc. Class A | 220,000 | 39,219,400 | |
| McCormick & Co., Inc. (non-vtg.) | 51,000 | 5,375,910 | |
| Microsoft Corp. | 616,000 | 57,608,323 | |
| MSCI, Inc. | 124,400 | 18,638,852 | |
| Nektar Therapeutics (b) | 121,000 | 10,122,860 | |
| Netflix, Inc. (b) | 23,000 | 7,186,580 | |
| Norfolk Southern Corp. | 142,000 | 20,372,740 | |
| Northrop Grumman Corp. | 72,000 | 23,186,880 | |
| OptiNose, Inc. (a) | 41,200 | 881,680 | |
| Parametric Technology Corp. (b) | 215,000 | 17,705,250 | |
| PayPal Holdings, Inc. (b) | 395,000 | 29,470,950 | |
| Phillips 66 Co. | 88,000 | 9,795,280 | |
| Raymond James Financial, Inc. | 44,000 | 3,949,000 | |
| Red Hat, Inc. (b) | 51,000 | 8,316,060 | |
| RingCentral, Inc. (b) | 40,245 | 2,698,427 | |
| S&P Global, Inc. | 301,092 | 56,785,951 | |
| Salesforce.com, Inc. (b) | 262,000 | 31,699,380 | |
| Sarepta Therapeutics, Inc. (b) | 69,000 | 5,268,840 | |
| Spirit Airlines, Inc. (b) | 23,000 | 821,560 | |
| Square, Inc. (b) | 755,000 | 35,741,700 | |
| Stamps.com, Inc. (b) | 7,000 | 1,594,250 | |
| SVB Financial Group (b) | 7,000 | 2,097,270 | |
| T. Rowe Price Group, Inc. | 39,000 | 4,438,980 | |
| The AES Corp. | 625,000 | 7,650,000 | |
| Union Pacific Corp. | 422,000 | 56,391,860 | |
| UnitedHealth Group, Inc. | 146,000 | 34,514,400 | |
| VF Corp. | 20,000 | 1,617,400 | |
| Visa, Inc. Class A | 119,000 | 15,098,720 | |
| Walmart, Inc. | 52,000 | 4,599,920 | |
| Whiting Petroleum Corp. (b) | 55,000 | 2,245,100 | |
| Workday, Inc. Class A (b) | 17,000 | 2,122,280 | |
| Worldpay, Inc. (b) | 14,000 | 1,137,080 | |
| Zoetis, Inc. Class A | 24,000 | 2,003,520 | |
| TOTAL UNITED STATES OF AMERICA | 1,044,971,563 | ||
| TOTAL COMMON STOCKS | |||
| (Cost $1,374,365,411) | 1,769,788,023 | ||
| Preferred Stocks - 0.4% | |||
| Convertible Preferred Stocks - 0.1% | |||
| Cayman Islands - 0.1% | |||
| China Internet Plus Holdings Ltd. Series A-11 (b)(d)(e) | 369,166 | 2,063,291 | |
| Nonconvertible Preferred Stocks - 0.3% | |||
| Brazil - 0.3% | |||
| Itausa-Investimentos Itau SA (PN) | 1,131,700 | 4,396,676 | |
| TOTAL PREFERRED STOCKS | |||
| (Cost $5,177,512) | 6,459,967 | ||
| Principal Amount | Value | ||
| Government Obligations - 0.0% | |||
| United States of America - 0.0% | |||
| U.S. Treasury Bills, yield at date of purchase 1.52% to 1.79% 5/10/18 to 7/19/18(f) | |||
| (Cost $638,334) | 640,000 | 638,347 | |
| Shares | Value | ||
| Money Market Funds - 6.6% | |||
| Fidelity Cash Central Fund, 1.74% (g) | 118,012,112 | 118,035,714 | |
| Fidelity Securities Lending Cash Central Fund 1.74% (g)(h) | 7,502,803 | 7,503,554 | |
| TOTAL MONEY MARKET FUNDS | |||
| (Cost $125,538,854) | 125,539,268 | ||
| TOTAL INVESTMENT IN SECURITIES - 100.0% | |||
| (Cost $1,505,720,111) | 1,902,425,605 | ||
| NET OTHER ASSETS (LIABILITIES) - 0.0% | (129,621) | ||
| NET ASSETS - 100% | $1,902,295,984 |
| Futures Contracts | |||||
| Number of contracts | Expiration Date | Notional Amount | Value | Unrealized Appreciation/(Depreciation) | |
| Purchased | |||||
| Equity Index Contracts | |||||
| TSE TOPIX Index Contracts (Japan) | 138 | June 2018 | $22,375,137 | $425,936 | $425,936 |
The notional amount of futures purchased as a percentage of Net Assets is 1.2%
Categorizations in the Schedule of Investments are based on country or territory of incorporation.
Legend
(a) Security or a portion of the security is on loan at period end.
(b) Non-income producing
(c) Security exempt from registration under Rule 144A of the Securities Act of 1933. These securities may be resold in transactions exempt from registration, normally to qualified institutional buyers. At the end of the period, the value of these securities amounted to $30,288,384 or 1.6% of net assets.
(d) Level 3 security
(e) Restricted securities - Investment in securities not registered under the Securities Act of 1933 (excluding 144A issues). At the end of the period, the value of restricted securities (excluding 144A issues) amounted to $2,063,291 or 0.1% of net assets.
(f) Security or a portion of the security was pledged to cover margin requirements for futures contracts. At period end, the value of securities pledged amounted to $638,347.
(g) Affiliated fund that is generally available only to investment companies and other accounts managed by Fidelity Investments. The rate quoted is the annualized seven-day yield of the fund at period end. A complete unaudited listing of the fund's holdings as of its most recent quarter end is available upon request. In addition, each Fidelity Central Fund's financial statements are available on the SEC's website or upon request.
(h) Investment made with cash collateral received from securities on loan.
Additional information on each restricted holding is as follows:
| Security | Acquisition Date | Acquisition Cost |
| China Internet Plus Holdings Ltd. Series A-11 | 1/26/15 | $1,166,878 |
Affiliated Central Funds
Information regarding fiscal year to date income earned by the Fund from investments in Fidelity Central Funds is as follows:
| Fund | Income earned |
| Fidelity Cash Central Fund | $370,315 |
| Fidelity Securities Lending Cash Central Fund | 99,761 |
| Total | $470,076 |
Amounts in the income column in the above table include any capital gain distributions from underlying funds, which are presented in the corresponding line-item in the Statement of Operations if applicable.
Investment Valuation
The following is a summary of the inputs used, as of April 30, 2018, involving the Fund's assets and liabilities carried at fair value. The inputs or methodology used for valuing securities may not be an indication of the risk associated with investing in those securities. For more information on valuation inputs, and their aggregation into the levels used below, please refer to the Investment Valuation section in the accompanying Notes to Financial Statements.
| Valuation Inputs at Reporting Date: | ||||
| Description | Total | Level 1 | Level 2 | Level 3 |
| Investments in Securities: | ||||
| Equities: | ||||
| Consumer Discretionary | $197,136,757 | $156,546,775 | $38,526,691 | $2,063,291 |
| Consumer Staples | 84,625,166 | 54,413,261 | 29,956,193 | 255,712 |
| Energy | 115,595,130 | 81,248,945 | 34,346,185 | -- |
| Financials | 347,547,138 | 270,568,688 | 76,978,450 | -- |
| Health Care | 211,228,405 | 180,364,033 | 30,861,963 | 2,409 |
| Industrials | 237,582,977 | 211,569,001 | 26,013,976 | -- |
| Information Technology | 482,591,079 | 460,885,088 | 21,705,991 | -- |
| Materials | 58,816,617 | 38,691,904 | 20,124,713 | -- |
| Real Estate | 18,416,117 | 15,498,288 | 2,917,829 | -- |
| Telecommunication Services | 11,699,816 | 6,895,533 | 4,804,283 | -- |
| Utilities | 11,008,788 | 7,650,000 | 3,358,788 | -- |
| Government Obligations | 638,347 | -- | 638,347 | -- |
| Money Market Funds | 125,539,268 | 125,539,268 | -- | -- |
| Total Investments in Securities: | $1,902,425,605 | $1,609,870,784 | $290,233,409 | $2,321,412 |
| Derivative Instruments: | ||||
| Assets | ||||
| Futures Contracts | $425,936 | $425,936 | $-- | $-- |
| Total Assets | $425,936 | $425,936 | $-- | $-- |
| Total Derivative Instruments: | $425,936 | $425,936 | $-- | $-- |
The following is a summary of transfers between Level 1 and Level 2 for the period ended April 30, 2018. Transfers are assumed to have occurred at the beginning of the period, and are primarily attributable to the valuation techniques used for foreign equity securities, as discussed in the accompanying Notes to Financial Statements:
| Transfers | Total |
| Level 1 to Level 2 | $84,534,408 |
| Level 2 to Level 1 | $84,248,426 |
Value of Derivative Instruments
The following table is a summary of the Fund's value of derivative instruments by primary risk exposure as of April 30, 2018. For additional information on derivative instruments, please refer to the Derivative Instruments section in the accompanying Notes to Financial Statements.
| Primary Risk Exposure / Derivative Type | Value | |
| Asset | Liability | |
| Equity Risk | ||
| Futures Contracts(a) | $425,936 | $0 |
| Total Equity Risk | 425,936 | 0 |
| Total Value of Derivatives | $425,936 | $0 |
(a) Reflects gross cumulative appreciation (depreciation) on futures contracts as presented in the Schedule of Investments. In the Statement of Assets and Liabilities, the period end daily variation margin is included in receivable or payable for daily variation margin on futures contracts, and the net cumulative appreciation (depreciation) is included in net unrealized appreciation (depreciation).
See accompanying notes which are an integral part of the financial statements.
Financial Statements
Statement of Assets and Liabilities
| April 30, 2018 (Unaudited) | ||
| Assets | ||
| Investment in securities, at value (including securities loaned of $7,151,967) — See accompanying schedule: Unaffiliated issuers (cost $1,380,181,257) | $1,776,886,337 | |
| Fidelity Central Funds (cost $125,538,854) | 125,539,268 | |
| Total Investment in Securities (cost $1,505,720,111) | $1,902,425,605 | |
| Cash | 428,844 | |
| Receivable for investments sold | 18,019,511 | |
| Receivable for fund shares sold | 2,595,958 | |
| Dividends receivable | 3,653,288 | |
| Distributions receivable from Fidelity Central Funds | 159,647 | |
| Prepaid expenses | 834 | |
| Other receivables | 131,096 | |
| Total assets | 1,927,414,783 | |
| Liabilities | ||
| Payable for investments purchased | $14,013,013 | |
| Payable for fund shares redeemed | 1,638,069 | |
| Accrued management fee | 1,163,885 | |
| Distribution and service plan fees payable | 21,223 | |
| Payable for daily variation margin on futures contracts | 88,364 | |
| Other affiliated payables | 321,438 | |
| Other payables and accrued expenses | 368,850 | |
| Collateral on securities loaned | 7,503,957 | |
| Total liabilities | 25,118,799 | |
| Net Assets | $1,902,295,984 | |
| Net Assets consist of: | ||
| Paid in capital | $1,400,947,941 | |
| Undistributed net investment income | 2,587,840 | |
| Accumulated undistributed net realized gain (loss) on investments and foreign currency transactions | 101,972,231 | |
| Net unrealized appreciation (depreciation) on investments and assets and liabilities in foreign currencies | 396,787,972 | |
| Net Assets | $1,902,295,984 | |
| Calculation of Maximum Offering Price | ||
| Class A: | ||
| Net Asset Value and redemption price per share ($35,570,347 ÷ 1,321,010 shares) | $26.93 | |
| Maximum offering price per share (100/94.25 of $26.93) | $28.57 | |
| Class M: | ||
| Net Asset Value and redemption price per share ($11,401,637 ÷ 425,605 shares) | $26.79 | |
| Maximum offering price per share (100/96.50 of $26.79) | $27.76 | |
| Class C: | ||
| Net Asset Value and offering price per share ($10,996,552 ÷ 418,486 shares)(a) | $26.28 | |
| Worldwide: | ||
| Net Asset Value, offering price and redemption price per share ($1,818,839,662 ÷ 66,788,293 shares) | $27.23 | |
| Class I: | ||
| Net Asset Value, offering price and redemption price per share ($25,487,786 ÷ 940,556 shares) | $27.10 |
(a) Redemption price per share is equal to net asset value less any applicable contingent deferred sales charge.
See accompanying notes which are an integral part of the financial statements.
Statement of Operations
| Six months ended April 30, 2018 (Unaudited) | ||
| Investment Income | ||
| Dividends | $12,493,258 | |
| Interest | 1,820 | |
| Income from Fidelity Central Funds | 470,076 | |
| Income before foreign taxes withheld | 12,965,154 | |
| Less foreign taxes withheld | (734,238) | |
| Total income | 12,230,916 | |
| Expenses | ||
| Management fee | ||
| Basic fee | $6,135,841 | |
| Performance adjustment | 383,783 | |
| Transfer agent fees | 1,566,045 | |
| Distribution and service plan fees | 124,445 | |
| Accounting and security lending fees | 283,155 | |
| Custodian fees and expenses | 95,537 | |
| Independent trustees' fees and expenses | 3,609 | |
| Registration fees | 95,374 | |
| Audit | 34,335 | |
| Legal | 8,342 | |
| Miscellaneous | 5,601 | |
| Total expenses before reductions | 8,736,067 | |
| Expense reductions | (190,590) | 8,545,477 |
| Net investment income (loss) | 3,685,439 | |
| Realized and Unrealized Gain (Loss) | ||
| Net realized gain (loss) on: | ||
| Investment securities: | ||
| Unaffiliated issuers | 111,393,511 | |
| Fidelity Central Funds | 976 | |
| Foreign currency transactions | 56,927 | |
| Futures contracts | 529,760 | |
| Total net realized gain (loss) | 111,981,174 | |
| Change in net unrealized appreciation (depreciation) on: | ||
| Investment securities: | ||
| Unaffiliated issuers (net of increase in deferred foreign taxes of $198,684) | (21,319,848) | |
| Fidelity Central Funds | 11 | |
| Assets and liabilities in foreign currencies | 2,751 | |
| Futures contracts | (298,957) | |
| Total change in net unrealized appreciation (depreciation) | (21,616,043) | |
| Net gain (loss) | 90,365,131 | |
| Net increase (decrease) in net assets resulting from operations | $94,050,570 |
See accompanying notes which are an integral part of the financial statements.
Statement of Changes in Net Assets
| Six months ended April 30, 2018 (Unaudited) | Year ended October 31, 2017 | |
| Increase (Decrease) in Net Assets | ||
| Operations | ||
| Net investment income (loss) | $3,685,439 | $11,957,628 |
| Net realized gain (loss) | 111,981,174 | 144,161,836 |
| Change in net unrealized appreciation (depreciation) | (21,616,043) | 210,799,339 |
| Net increase (decrease) in net assets resulting from operations | 94,050,570 | 366,918,803 |
| Distributions to shareholders from net investment income | (10,719,880) | (12,665,638) |
| Distributions to shareholders from net realized gain | (103,628,896) | (4,590,871) |
| Total distributions | (114,348,776) | (17,256,509) |
| Share transactions - net increase (decrease) | 190,988,948 | (100,984,602) |
| Redemption fees | – | 2,108 |
| Total increase (decrease) in net assets | 170,690,742 | 248,679,800 |
| Net Assets | ||
| Beginning of period | 1,731,605,242 | 1,482,925,442 |
| End of period | $1,902,295,984 | $1,731,605,242 |
| Other Information | ||
| Undistributed net investment income end of period | $2,587,840 | $9,622,281 |
See accompanying notes which are an integral part of the financial statements.
Financial Highlights
Fidelity Worldwide Fund Class A
| Six months ended (Unaudited) April 30, | Years endedOctober 31, | |||||
| 2018 | 2017 | 2016 | 2015 | 2014 | 2013 | |
| Selected Per–Share Data | ||||||
| Net asset value, beginning of period | $27.28 | $21.83 | $22.88 | $24.64 | $25.18 | $19.69 |
| Income from Investment Operations | ||||||
| Net investment income (loss)A | .01 | .11 | .12 | .06 | .02 | .02 |
| Net realized and unrealized gain (loss) | 1.38 | 5.53 | (.35) | .58 | 1.46 | 5.66 |
| Total from investment operations | 1.39 | 5.64 | (.23) | .64 | 1.48 | 5.68 |
| Distributions from net investment income | (.09) | (.12) | (.07) | – | (.04) | (.11) |
| Distributions from net realized gain | (1.65) | (.07) | (.75) | (2.40) | (1.98) | (.08) |
| Total distributions | (1.74) | (.19) | (.82) | (2.40) | (2.02) | (.19) |
| Redemption fees added to paid in capitalA | – | –B | –B | –B | –B | –B |
| Net asset value, end of period | $26.93 | $27.28 | $21.83 | $22.88 | $24.64 | $25.18 |
| Total ReturnC,D,E | 5.37% | 26.06% | (1.09)% | 2.73% | 6.29% | 29.10% |
| Ratios to Average Net AssetsF,G | ||||||
| Expenses before reductions | 1.24%H | 1.12% | 1.22% | 1.27% | 1.31% | 1.45% |
| Expenses net of fee waivers, if any | 1.23%H | 1.12% | 1.22% | 1.26% | 1.31% | 1.45% |
| Expenses net of all reductions | 1.21%H | 1.11% | 1.22% | 1.26% | 1.31% | 1.42% |
| Net investment income (loss) | .11%H | .47% | .55% | .27% | .10% | .09% |
| Supplemental Data | ||||||
| Net assets, end of period (000 omitted) | $35,570 | $32,823 | $29,052 | $31,043 | $33,788 | $28,661 |
| Portfolio turnover rateI | 122%H | 111% | 117% | 151% | 163% | 161% |
A Calculated based on average shares outstanding during the period.
B Amount represents less than $.005 per share.
C Total returns for periods of less than one year are not annualized.
D Total returns would have been lower if certain expenses had not been reduced during the applicable periods shown.
E Total returns do not include the effect of the sales charges.
F Fees and expenses of any underlying Fidelity Central Funds are not included in the Fund's expense ratio. The Fund indirectly bears its proportionate share of the expenses of any underlying Fidelity Central Funds.
G Expense ratios reflect operating expenses of the class. Expenses before reductions do not reflect amounts reimbursed by the investment adviser or reductions from brokerage service arrangements or reductions from other expense offset arrangements and do not represent the amount paid by the class during periods when reimbursements or reductions occur. Expenses net of fee waivers reflect expenses after reimbursement by the investment adviser but prior to reductions from brokerage service arrangements or other expense offset arrangements. Expenses net of all reductions represent the net expenses paid by the class.
H Annualized
I Amount does not include the portfolio activity of any underlying Fidelity Central Funds.
See accompanying notes which are an integral part of the financial statements.
Fidelity Worldwide Fund Class M
| Six months ended (Unaudited) April 30, | Years endedOctober 31, | |||||
| 2018 | 2017 | 2016 | 2015 | 2014 | 2013 | |
| Selected Per–Share Data | ||||||
| Net asset value, beginning of period | $27.11 | $21.67 | $22.72 | $24.49 | $25.05 | $19.61 |
| Income from Investment Operations | ||||||
| Net investment income (loss)A | (.02) | .04 | .05 | (.01) | (.04) | (.04) |
| Net realized and unrealized gain (loss) | 1.37 | 5.50 | (.35) | .57 | 1.46 | 5.63 |
| Total from investment operations | 1.35 | 5.54 | (.30) | .56 | 1.42 | 5.59 |
| Distributions from net investment income | (.02) | (.03) | –B | – | – | (.07) |
| Distributions from net realized gain | (1.65) | (.07) | (.75) | (2.33) | (1.98) | (.08) |
| Total distributions | (1.67) | (.10) | (.75) | (2.33) | (1.98) | (.15) |
| Redemption fees added to paid in capitalA | – | –B | –B | –B | –B | –B |
| Net asset value, end of period | $26.79 | $27.11 | $21.67 | $22.72 | $24.49 | $25.05 |
| Total ReturnC,D,E | 5.22% | 25.68% | (1.38)% | 2.36% | 6.05% | 28.73% |
| Ratios to Average Net AssetsF,G | ||||||
| Expenses before reductions | 1.52%H | 1.42% | 1.53% | 1.57% | 1.58% | 1.71% |
| Expenses net of fee waivers, if any | 1.52%H | 1.42% | 1.52% | 1.56% | 1.58% | 1.70% |
| Expenses net of all reductions | 1.50%H | 1.41% | 1.52% | 1.56% | 1.58% | 1.68% |
| Net investment income (loss) | (.18)%H | .17% | .25% | (.04)% | (.17)% | (.16)% |
| Supplemental Data | ||||||
| Net assets, end of period (000 omitted) | $11,402 | $10,634 | $9,270 | $13,055 | $12,160 | $9,822 |
| Portfolio turnover rateI | 122%H | 111% | 117% | 151% | 163% | 161% |
A Calculated based on average shares outstanding during the period.
B Amount represents less than $.005 per share.
C Total returns for periods of less than one year are not annualized.
D Total returns would have been lower if certain expenses had not been reduced during the applicable periods shown.
E Total returns do not include the effect of the sales charges.
F Fees and expenses of any underlying Fidelity Central Funds are not included in the Fund's expense ratio. The Fund indirectly bears its proportionate share of the expenses of any underlying Fidelity Central Funds.
G Expense ratios reflect operating expenses of the class. Expenses before reductions do not reflect amounts reimbursed by the investment adviser or reductions from brokerage service arrangements or reductions from other expense offset arrangements and do not represent the amount paid by the class during periods when reimbursements or reductions occur. Expenses net of fee waivers reflect expenses after reimbursement by the investment adviser but prior to reductions from brokerage service arrangements or other expense offset arrangements. Expenses net of all reductions represent the net expenses paid by the class.
H Annualized
I Amount does not include the portfolio activity of any underlying Fidelity Central Funds.
See accompanying notes which are an integral part of the financial statements.
Fidelity Worldwide Fund Class C
| Six months ended (Unaudited) April 30, | Years endedOctober 31, | |||||
| 2018 | 2017 | 2016 | 2015 | 2014 | 2013 | |
| Selected Per–Share Data | ||||||
| Net asset value, beginning of period | $26.67 | $21.33 | $22.48 | $24.12 | $24.78 | $19.41 |
| Income from Investment Operations | ||||||
| Net investment income (loss)A | (.09) | (.07) | (.05) | (.12) | (.15) | (.14) |
| Net realized and unrealized gain (loss) | 1.35 | 5.42 | (.35) | .57 | 1.44 | 5.58 |
| Total from investment operations | 1.26 | 5.35 | (.40) | .45 | 1.29 | 5.44 |
| Distributions from net investment income | – | – | – | – | – | – |
| Distributions from net realized gain | (1.65) | (.01) | (.75) | (2.09) | (1.95) | (.07) |
| Total distributions | (1.65) | (.01) | (.75) | (2.09) | (1.95) | (.07) |
| Redemption fees added to paid in capitalA | – | –B | –B | –B | –B | –B |
| Net asset value, end of period | $26.28 | $26.67 | $21.33 | $22.48 | $24.12 | $24.78 |
| Total ReturnC,D,E | 4.96% | 25.10% | (1.88)% | 1.90% | 5.55% | 28.12% |
| Ratios to Average Net AssetsF,G | ||||||
| Expenses before reductions | 2.01%H | 1.89% | 2.01% | 2.07% | 2.04% | 2.15% |
| Expenses net of fee waivers, if any | 2.01%H | 1.89% | 2.01% | 2.07% | 2.04% | 2.14% |
| Expenses net of all reductions | 1.99%H | 1.88% | 2.00% | 2.06% | 2.03% | 2.12% |
| Net investment income (loss) | (.66)%H | (.30)% | (.24)% | (.54)% | (.63)% | (.60)% |
| Supplemental Data | ||||||
| Net assets, end of period (000 omitted) | $10,997 | $10,264 | $10,315 | $11,231 | $9,229 | $10,778 |
| Portfolio turnover rateI | 122%H | 111% | 117% | 151% | 163% | 161% |
A Calculated based on average shares outstanding during the period.
B Amount represents less than $.005 per share.
C Total returns for periods of less than one year are not annualized.
D Total returns would have been lower if certain expenses had not been reduced during the applicable periods shown.
E Total returns do not include the effect of the contingent deferred sales charge.
F Fees and expenses of any underlying Fidelity Central Funds are not included in the Fund's expense ratio. The Fund indirectly bears its proportionate share of the expenses of any underlying Fidelity Central Funds.
G Expense ratios reflect operating expenses of the class. Expenses before reductions do not reflect amounts reimbursed by the investment adviser or reductions from brokerage service arrangements or reductions from other expense offset arrangements and do not represent the amount paid by the class during periods when reimbursements or reductions occur. Expenses net of fee waivers reflect expenses after reimbursement by the investment adviser but prior to reductions from brokerage service arrangements or other expense offset arrangements. Expenses net of all reductions represent the net expenses paid by the class.
H Annualized
I Amount does not include the portfolio activity of any underlying Fidelity Central Funds.
See accompanying notes which are an integral part of the financial statements.
Fidelity Worldwide Fund
| Six months ended (Unaudited) April 30, | Years endedOctober 31, | |||||
| 2018 | 2017 | 2016 | 2015 | 2014 | 2013 | |
| Selected Per–Share Data | ||||||
| Net asset value, beginning of period | $27.61 | $22.09 | $23.14 | $24.92 | $25.41 | $19.85 |
| Income from Investment Operations | ||||||
| Net investment income (loss)A | .06 | .19 | .19 | .13 | .11 | .10 |
| Net realized and unrealized gain (loss) | 1.38 | 5.60 | (.35) | .58 | 1.47 | 5.70 |
| Total from investment operations | 1.44 | 5.79 | (.16) | .71 | 1.58 | 5.80 |
| Distributions from net investment income | (.17) | (.20) | (.14) | (.08) | (.09) | (.16) |
| Distributions from net realized gain | (1.65) | (.07) | (.75) | (2.41) | (1.98) | (.08) |
| Total distributions | (1.82) | (.27) | (.89) | (2.49) | (2.07) | (.24) |
| Redemption fees added to paid in capitalA | – | –B | –B | –B | –B | –B |
| Net asset value, end of period | $27.23 | $27.61 | $22.09 | $23.14 | $24.92 | $25.41 |
| Total ReturnC,D | 5.51% | 26.49% | (.78)% | 3.01% | 6.64% | 29.54% |
| Ratios to Average Net AssetsE,F | ||||||
| Expenses before reductions | .93%G | .81% | .91% | .96% | .98% | 1.11% |
| Expenses net of fee waivers, if any | .93%G | .81% | .91% | .96% | .97% | 1.11% |
| Expenses net of all reductions | .91%G | .80% | .90% | .95% | .97% | 1.08% |
| Net investment income (loss) | .42%G | .79% | .87% | .57% | .44% | .43% |
| Supplemental Data | ||||||
| Net assets, end of period (000 omitted) | $1,818,840 | $1,656,173 | $1,421,364 | $1,543,516 | $1,535,658 | $1,464,415 |
| Portfolio turnover rateH | 122%G | 111% | 117% | 151% | 163% | 161% |
A Calculated based on average shares outstanding during the period.
B Amount represents less than $.005 per share.
C Total returns for periods of less than one year are not annualized.
D Total returns would have been lower if certain expenses had not been reduced during the applicable periods shown.
E Fees and expenses of any underlying Fidelity Central Funds are not included in the Fund's expense ratio. The Fund indirectly bears its proportionate share of the expenses of any underlying Fidelity Central Funds.
F Expense ratios reflect operating expenses of the class. Expenses before reductions do not reflect amounts reimbursed by the investment adviser or reductions from brokerage service arrangements or reductions from other expense offset arrangements and do not represent the amount paid by the class during periods when reimbursements or reductions occur. Expenses net of fee waivers reflect expenses after reimbursement by the investment adviser but prior to reductions from brokerage service arrangements or other expense offset arrangements. Expenses net of all reductions represent the net expenses paid by the class.
G Annualized
H Amount does not include the portfolio activity of any underlying Fidelity Central Funds.
See accompanying notes which are an integral part of the financial statements.
Fidelity Worldwide Fund Class I
| Six months ended (Unaudited) April 30, | Years endedOctober 31, | |||||
| 2018 | 2017 | 2016 | 2015 | 2014 | 2013 | |
| Selected Per–Share Data | ||||||
| Net asset value, beginning of period | $27.49 | $21.99 | $23.03 | $24.81 | $25.31 | $19.78 |
| Income from Investment Operations | ||||||
| Net investment income (loss)A | .05 | .19 | .17 | .13 | .10 | .08 |
| Net realized and unrealized gain (loss) | 1.38 | 5.56 | (.35) | .58 | 1.47 | 5.68 |
| Total from investment operations | 1.43 | 5.75 | (.18) | .71 | 1.57 | 5.76 |
| Distributions from net investment income | (.18) | (.18) | (.11) | (.07) | (.09) | (.15) |
| Distributions from net realized gain | (1.65) | (.07) | (.75) | (2.41) | (1.98) | (.08) |
| Total distributions | (1.82)B | (.25) | (.86) | (2.49)C | (2.07) | (.23) |
| Redemption fees added to paid in capitalA | – | –D | –D | –D | –D | –D |
| Net asset value, end of period | $27.10 | $27.49 | $21.99 | $23.03 | $24.81 | $25.31 |
| Total ReturnE,F | 5.50% | 26.45% | (.86)% | 3.00% | 6.63% | 29.44% |
| Ratios to Average Net AssetsG,H | ||||||
| Expenses before reductions | .95%I | .83% | .99% | .98% | 1.01% | 1.17% |
| Expenses net of fee waivers, if any | .95%I | .83% | .99% | .98% | 1.01% | 1.17% |
| Expenses net of all reductions | .93%I | .82% | .98% | .97% | 1.00% | 1.14% |
| Net investment income (loss) | .39%I | .77% | .78% | .55% | .40% | .37% |
| Supplemental Data | ||||||
| Net assets, end of period (000 omitted) | $25,488 | $21,711 | $12,924 | $25,173 | $19,107 | $10,639 |
| Portfolio turnover rateJ | 122%I | 111% | 117% | 151% | 163% | 161% |
A Calculated based on average shares outstanding during the period.
B Total distributions of $1.82 per share is comprised of distributions from net investment income of $.176 and distributions from net realized gain of $1.648 per share.
C Total distributions of $2.49 per share is comprised of distributions from net investment income of $.074 and distributions from net realized gain of $2.413 per share.
D Amount represents less than $.005 per share.
E Total returns for periods of less than one year are not annualized.
F Total returns would have been lower if certain expenses had not been reduced during the applicable periods shown.
G Fees and expenses of any underlying Fidelity Central Funds are not included in the Fund's expense ratio. The Fund indirectly bears its proportionate share of the expenses of any underlying Fidelity Central Funds.
H Expense ratios reflect operating expenses of the class. Expenses before reductions do not reflect amounts reimbursed by the investment adviser or reductions from brokerage service arrangements or reductions from other expense offset arrangements and do not represent the amount paid by the class during periods when reimbursements or reductions occur. Expenses net of fee waivers reflect expenses after reimbursement by the investment adviser but prior to reductions from brokerage service arrangements or other expense offset arrangements. Expenses net of all reductions represent the net expenses paid by the class.
I Annualized
J Amount does not include the portfolio activity of any underlying Fidelity Central Funds.
See accompanying notes which are an integral part of the financial statements.
Notes to Financial Statements (Unaudited)
For the period ended April 30, 2018
1. Organization.
Fidelity Worldwide Fund (the Fund) is a fund of Fidelity Investment Trust (the Trust) and is authorized to issue an unlimited number of shares. The Trust is registered under the Investment Company Act of 1940, as amended (the 1940 Act), as an open-end management investment company organized as a Massachusetts business trust. The Fund offers Class A, Class M, Class C, Worldwide and Class I shares, each of which has equal rights as to assets and voting privileges. Each class has exclusive voting rights with respect to matters that affect that class.
2. Investments in Fidelity Central Funds.
The Fund invests in Fidelity Central Funds, which are open-end investment companies generally available only to other investment companies and accounts managed by the investment adviser and its affiliates. The Fund's Schedule of Investments lists each of the Fidelity Central Funds held as of period end, if any, as an investment of the Fund, but does not include the underlying holdings of each Fidelity Central Fund. As an Investing Fund, the Fund indirectly bears its proportionate share of the expenses of the underlying Fidelity Central Funds.
The Money Market Central Funds seek preservation of capital and current income and are managed by Fidelity Investments Money Management, Inc. (FIMM), an affiliate of the investment adviser. Annualized expenses of the Money Market Central Funds as of their most recent shareholder report date are less than .005%.
A complete unaudited list of holdings for each Fidelity Central Fund is available upon request or at the Securities and Exchange Commission (the SEC) website at www.sec.gov. In addition, the financial statements of the Fidelity Central Funds are available on the SEC website or upon request.
3. Significant Accounting Policies.
The Fund is an investment company and applies the accounting and reporting guidance of the Financial Accounting Standards Board (FASB) Accounting Standards Codification Topic 946 Financial Services – Investments Companies. The financial statements have been prepared in conformity with accounting principles generally accepted in the United States of America (GAAP), which require management to make certain estimates and assumptions at the date of the financial statements. Actual results could differ from those estimates. Subsequent events, if any, through the date that the financial statements were issued have been evaluated in the preparation of the financial statements. The following summarizes the significant accounting policies of the Fund:
Investment Valuation. Investments are valued as of 4:00 p.m. Eastern time on the last calendar day of the period. The Board of Trustees (the Board) has delegated the day to day responsibility for the valuation of the Fund's investments to the Fair Value Committee (the Committee) established by the Fund's investment adviser. In accordance with valuation policies and procedures approved by the Board, the Fund attempts to obtain prices from one or more third party pricing vendors or brokers to value its investments. When current market prices, quotations or currency exchange rates are not readily available or reliable, investments will be fair valued in good faith by the Committee, in accordance with procedures adopted by the Board. Factors used in determining fair value vary by investment type and may include market or investment specific events, changes in interest rates and credit quality. The frequency with which these procedures are used cannot be predicted and they may be utilized to a significant extent. The Committee oversees the Fund's valuation policies and procedures and reports to the Board on the Committee's activities and fair value determinations. The Board monitors the appropriateness of the procedures used in valuing the Fund's investments and ratifies the fair value determinations of the Committee.
The Fund categorizes the inputs to valuation techniques used to value its investments into a disclosure hierarchy consisting of three levels as shown below:
- Level 1 – quoted prices in active markets for identical investments
- Level 2 – other significant observable inputs (including quoted prices for similar investments, interest rates, prepayment speeds, etc.)
- Level 3 – unobservable inputs (including the Fund's own assumptions based on the best information available)
Valuation techniques used to value the Fund's investments by major category are as follows:
Equity securities, including restricted securities, for which market quotations are readily available, are valued at the last reported sale price or official closing price as reported by a third party pricing vendor on the primary market or exchange on which they are traded and are categorized as Level 1 in the hierarchy. In the event there were no sales during the day or closing prices are not available, securities are valued at the last quoted bid price or may be valued using the last available price and are generally categorized as Level 2 in the hierarchy. For foreign equity securities, when market or security specific events arise, comparisons to the valuation of American Depositary Receipts (ADRs), futures contracts, Exchange-Traded Funds (ETFs) and certain indexes as well as quoted prices for similar securities may be used and would be categorized as Level 2 in the hierarchy. Utilizing these techniques may result in transfers between Level 1 and Level 2. For equity securities, including restricted securities, where observable inputs are limited, assumptions about market activity and risk are used and these securities may be categorized as Level 3 in the hierarchy.
Debt securities, including restricted securities, are valued based on evaluated prices received from third party pricing vendors or from brokers who make markets in such securities. U.S. government and government agency obligations are valued by pricing vendors who utilize matrix pricing which considers yield or price of bonds of comparable quality, coupon, maturity and type or by broker-supplied prices. When independent prices are unavailable or unreliable, debt securities may be valued utilizing pricing methodologies which consider similar factors that would be used by third party pricing vendors. Debt securities are generally categorized as Level 2 in the hierarchy but may be Level 3 depending on the circumstances.
Futures contracts are valued at the settlement price established each day by the board of trade or exchange on which they are traded and are categorized as Level 1 in the hierarchy. Investments in open-end mutual funds, including the Fidelity Central Funds, are valued at their closing net asset value (NAV) each business day and are categorized as Level 1 in the hierarchy.
Changes in valuation techniques may result in transfers in or out of an assigned level within the disclosure hierarchy. The aggregate value of investments by input level as of April 30, 2018, including information on transfers between Levels 1 and 2, is included at the end of the Fund's Schedule of Investments.
Foreign Currency. The Fund may use foreign currency contracts to facilitate transactions in foreign-denominated securities. Gains and losses from these transactions may arise from changes in the value of the foreign currency or if the counterparties do not perform under the contracts' terms.
Foreign-denominated assets, including investment securities, and liabilities are translated into U.S. dollars at the exchange rates at period end. Purchases and sales of investment securities, income and dividends received and expenses denominated in foreign currencies are translated into U.S. dollars at the exchange rate in effect on the transaction date.
The effects of exchange rate fluctuations on investments are included with the net realized and unrealized gain (loss) on investment securities. Other foreign currency transactions resulting in realized and unrealized gain (loss) are disclosed separately.
Investment Transactions and Income. For financial reporting purposes, the Fund's investment holdings and NAV include trades executed through the end of the last business day of the period. The NAV per share for processing shareholder transactions is calculated as of the close of business of the New York Stock Exchange (NYSE), normally 4:00 p.m. Eastern time and includes trades executed through the end of the prior business day. Gains and losses on securities sold are determined on the basis of identified cost and includes proceeds received from litigation. Dividend income is recorded on the ex-dividend date, except for certain dividends from foreign securities where the ex-dividend date may have passed, which are recorded as soon as the Fund is informed of the ex-dividend date. Non-cash dividends included in dividend income, if any, are recorded at the fair market value of the securities received. Income and capital gain distributions from Fidelity Central Funds, if any, are recorded on the ex-dividend date. Certain distributions received by the Fund represent a return of capital or capital gain. The Fund determines the components of these distributions subsequent to the ex-dividend date, based upon receipt of tax filings or other correspondence relating to the underlying investment. These distributions are recorded as a reduction of cost of investments and/or as a realized gain. Interest income is accrued as earned and includes coupon interest and amortization of premium and accretion of discount on debt securities as applicable. Investment income is recorded net of foreign taxes withheld where recovery of such taxes is uncertain.
Class Allocations and Expenses. Investment income, realized and unrealized capital gains and losses, common expenses of the Fund, and certain fund-level expense reductions, if any, are allocated daily on a pro-rata basis to each class based on the relative net assets of each class to the total net assets of the Fund. Each class differs with respect to transfer agent and distribution and service plan fees incurred. Certain expense reductions may also differ by class. For the reporting period, the allocated portion of income and expenses to each class as a percent of its average net assets may vary due to the timing of recording these transactions in relation to fluctuating net assets of the classes. Expenses directly attributable to a fund are charged to that fund. Expenses attributable to more than one fund are allocated among the respective funds on the basis of relative net assets or other appropriate methods. Expense estimates are accrued in the period to which they relate and adjustments are made when actual amounts are known.
Income Tax Information and Distributions to Shareholders. Each year, the Fund intends to qualify as a regulated investment company under Subchapter M of the Internal Revenue Code, including distributing substantially all of its taxable income and realized gains. As a result, no provision for U.S. Federal income taxes is required. The Fund files a U.S. federal tax return, in addition to state and local tax returns as required. The Fund's federal income tax returns are subject to examination by the Internal Revenue Service (IRS) for a period of three fiscal years after they are filed. State and local tax returns may be subject to examination for an additional fiscal year depending on the jurisdiction. Foreign taxes are provided for based on the Fund's understanding of the tax rules and rates that exist in the foreign markets in which it invests. The Fund is subject to a tax imposed on capital gains by certain countries in which it invests. An estimated deferred tax liability for net unrealized appreciation on the applicable securities is included in Other payables and accrued expenses on the Statement of Assets & Liabilities.
Distributions are declared and recorded on the ex-dividend date. Income and capital gain distributions are declared separately for each class. Income and capital gain distributions are determined in accordance with income tax regulations, which may differ from GAAP
Capital accounts within the financial statements are adjusted for permanent book-tax differences. These adjustments have no impact on net assets or the results of operations. Capital accounts are not adjusted for temporary book-tax differences which will reverse in a subsequent period.
Book-tax differences are primarily due to foreign currency transactions, certain foreign taxes, partnerships, passive foreign investment companies (PFIC), market discount, deferred trustees compensation, capital loss carryforwards and losses deferred due to wash sales.
As of period end, the cost and unrealized appreciation (depreciation) in securities, and derivatives if applicable, for federal income tax purposes were as follows:
| Gross unrealized appreciation | $422,693,405 |
| Gross unrealized depreciation | (34,928,488) |
| Net unrealized appreciation (depreciation) | $387,764,917 |
| Tax cost | $1,515,086,624 |
Restricted Securities. The Fund may invest in securities that are subject to legal or contractual restrictions on resale. These securities generally may be resold in transactions exempt from registration or to the public if the securities are registered. Disposal of these securities may involve time-consuming negotiations and expense, and prompt sale at an acceptable price may be difficult. Information regarding restricted securities is included at the end of the Fund's Schedule of Investments.
4. Derivative Instruments.
Risk Exposures and the Use of Derivative Instruments. The Fund's investment objective allows the Fund to enter into various types of derivative contracts, including futures contracts. Derivatives are investments whose value is primarily derived from underlying assets, indices or reference rates and may be transacted on an exchange or over-the-counter (OTC). Derivatives may involve a future commitment to buy or sell a specified asset based on specified terms, to exchange future cash flows at periodic intervals based on a notional principal amount, or for one party to make one or more payments upon the occurrence of specified events in exchange for periodic payments from the other party.
The Fund used derivatives to increase returns and to manage exposure to certain risks as defined below. The success of any strategy involving derivatives depends on analysis of numerous economic factors, and if the strategies for investment do not work as intended, the Fund may not achieve its objectives.
The Fund's use of derivatives increased or decreased its exposure to the following risk:
| Equity Risk | Equity risk relates to the fluctuations in the value of financial instruments as a result of changes in market prices (other than those arising from interest rate risk or foreign exchange risk), whether caused by factors specific to an individual investment, its issuer, or all factors affecting all instruments traded in a market or market segment. |
The Fund is also exposed to additional risks from investing in derivatives, such as liquidity risk and counterparty credit risk. Liquidity risk is the risk that the Fund will be unable to close out the derivative in the open market in a timely manner. Counterparty credit risk is the risk that the counterparty will not be able to fulfill its obligation to the Fund. Counterparty credit risk related to exchange-traded futures contracts may be mitigated by the protection provided by the exchange on which they trade.
Investing in derivatives may involve greater risks than investing in the underlying assets directly and, to varying degrees, may involve risk of loss in excess of any initial investment and collateral received and amounts recognized in the Statement of Assets and Liabilities. In addition, there may be the risk that the change in value of the derivative contract does not correspond to the change in value of the underlying instrument.
Futures Contracts. A futures contract is an agreement between two parties to buy or sell a specified underlying instrument for a fixed price at a specified future date. The Fund used futures contracts to manage its exposure to the stock market.
Upon entering into a futures contract, a fund is required to deposit either cash or securities (initial margin) with a clearing broker in an amount equal to a certain percentage of the face value of the contract. Futures contracts are marked-to-market daily and subsequent daily payments (variation margin) are made or received by a fund depending on the daily fluctuations in the value of the futures contracts and are recorded as unrealized appreciation or (depreciation). This receivable and/or payable, if any, is included in daily variation margin on futures contracts in the Statement of Assets and Liabilities. Realized gain or (loss) is recorded upon the expiration or closing of a futures contract. The net realized gain (loss) and change in net unrealized appreciation (depreciation) on futures contracts during the period is presented in the Statement of Operations.
Any open futures contracts at period end are presented in the Schedule of Investments under the caption "Futures Contracts". The notional amount at value reflects each contract's exposure to the underlying instrument or index at period end and is representative of volume of activity during the period. Securities deposited to meet initial margin requirements are identified in the Schedule of Investments.
5. Purchases and Sales of Investments.
Purchases and sales of securities, other than short-term securities, aggregated $1,092,564,022 and $1,096,412,218, respectively.
6. Fees and Other Transactions with Affiliates.
Management Fee. Fidelity Management & Research Company (the investment adviser) and its affiliates provide the Fund with investment management related services for which the Fund pays a monthly management fee. The management fee is the sum of an individual fund fee rate that is based on an annual rate of .424% of the Fund's average net assets and an annualized group fee rate that averaged .24% during the period. The group fee rate is based upon the average net assets of all the mutual funds advised by the investment adviser, including any mutual funds previously advised by the investment adviser that are currently advised by Fidelity SelectCo, LLC, an affiliate of the investment adviser. The group fee rate decreases as assets under management increase and increases as assets under management decrease. In addition, the management fee is subject to a performance adjustment (up to a maximum of +/- .20% of the Fund's average net assets over a 36 month performance period). The upward or downward adjustment to the management fee is based on the relative investment performance of Worldwide as compared to its benchmark index, the MSCI World Index, over the same 36 month performance period. For the reporting period, the total annualized management fee rate, including the performance adjustment, was .71% of the Fund's average net assets. The performance adjustment included in the management fee rate may be higher or lower than the maximum performance adjustment rate due to the difference between the average net assets for the reporting and performance periods.
Distribution and Service Plan Fees. In accordance with Rule 12b-1 of the 1940 Act, the Fund has adopted separate Distribution and Service Plans for each class of shares. Certain classes pay Fidelity Distributors Corporation (FDC), an affiliate of the investment adviser, separate Distribution and Service Fees, each of which is based on an annual percentage of each class' average net assets. In addition, FDC may pay financial intermediaries for selling shares of the Fund and providing shareholder support services. For the period, the Distribution and Service Fee rates, total fees and amounts retained by FDC were as follows:
| Distribution Fee | Service Fee | Total Fees | Retained by FDC | |
| Class A | -% | .25% | $42,426 | $1,315 |
| Class M | .25% | .25% | 27,863 | 295 |
| Class C | .75% | .25% | 54,156 | 5,394 |
| $124,445 | $7,004 |
Sales Load. FDC may receive a front-end sales charge of up to 5.75% for selling Class A shares and 3.50% for selling Class M shares, some of which is paid to financial intermediaries for selling shares of the Fund. Depending on the holding period, FDC may receive contingent deferred sales charges levied on Class A, Class M and Class C redemptions. The deferred sales charges are 1.00% for Class C shares, 1.00% for certain purchases of Class A shares and .25% for certain purchases of Class M shares.
For the period, sales charge amounts retained by FDC were as follows:
| Retained by FDC | |
| Class A | $12,070 |
| Class M | 1,933 |
| Class C(a) | 757 |
| $14,760 |
(a) When Class C shares are initially sold, FDC pays commissions from its own resources to financial intermediaries through which the sales are made.
Transfer Agent Fees. Fidelity Investments Institutional Operations Company, Inc., (FIIOC), an affiliate of the investment adviser, is the transfer, dividend disbursing and shareholder servicing agent for each class of the Fund. FIIOC receives account fees and asset-based fees that vary according to the account size and type of account of the shareholders of the respective classes of the Fund. FIIOC pays for typesetting, printing and mailing of shareholder reports, except proxy statements.
For the period, transfer agent fees for each class were as follows:
| Amount | % of Class-Level Average Net Assets(a) | |
| Class A | $37,700 | .22 |
| Class M | 14,558 | .26 |
| Class C | 13,240 | .24 |
| Worldwide | 1,477,266 | .17 |
| Class I | 23,281 | .19 |
| $1,566,045 |
(a) Annualized
Accounting and Security Lending Fees. Fidelity Service Company, Inc. (FSC), an affiliate of the investment adviser, maintains the Fund's accounting records. The accounting fee is based on the level of average net assets for each month. Under a separate contract, FSC administers the security lending program. The security lending fee is based on the number and duration of lending transactions. For the period, the fees were equivalent to an annualized rate of .03%.
Brokerage Commissions. The Fund placed a portion of its portfolio transactions with brokerage firms which are affiliates of the investment adviser. Brokerage commissions are included in net realized gain (loss) and change in net unrealized appreciation (depreciation) in the Statement of Operations. The commissions paid to these affiliated firms were $18,055 for the period.
Interfund Trades. The Fund may purchase from or sell securities to other Fidelity Funds under procedures adopted by the Board. The procedures have been designed to ensure these interfund trades are executed in accordance with Rule 17a-7 of the 1940 Act. Interfund trades are included within the respective purchases and sales amounts shown in the Purchases and Sales of Investments note.
7. Committed Line of Credit.
The Fund participates with other funds managed by the investment adviser or an affiliate in a $4.25 billion credit facility (the "line of credit") to be utilized for temporary or emergency purposes to fund shareholder redemptions or for other short-term liquidity purposes. The Fund has agreed to pay commitment fees on its pro-rata portion of the line of credit, which amounted to $2,575 and is reflected in Miscellaneous expenses on the Statement of Operations. During the period, the Fund did not borrow on this line of credit.
8. Security Lending.
The Fund lends portfolio securities through a lending agent from time to time in order to earn additional income. For equity securities, a lending agent is used and may loan securities to certain qualified borrowers, including Fidelity Capital Markets (FCM), a broker-dealer affiliated with the Fund. On the settlement date of the loan, the Fund receives collateral (in the form of U.S. Treasury obligations, letters of credit and/or cash) against the loaned securities and maintains collateral in an amount not less than 100% of the market value of the loaned securities during the period of the loan. The market value of the loaned securities is determined at the close of business of the Fund and any additional required collateral is delivered to the Fund on the next business day. The Fund or borrower may terminate the loan at any time, and if the borrower defaults on its obligation to return the securities loaned because of insolvency or other reasons, the Fund may apply collateral received from the borrower against the obligation. The Fund may experience delays and costs in recovering the securities loaned. Any cash collateral received is invested in the Fidelity Securities Lending Cash Central Fund. The value of loaned securities and cash collateral at period end are disclosed on the Fund's Statement of Assets and Liabilities. The value of loaned securities to FCM at period end was $184,040. Security lending income represents the income earned on investing cash collateral, less rebates paid to borrowers and any lending agent fees associated with the loan, plus any premium payments received for lending certain types of securities. Security lending income is presented in the Statement of Operations as a component of income from Fidelity Central Funds. Total security lending income during the period amounted to $99,761, including $710 from securities loaned to FCM.
9. Expense Reductions.
Commissions paid to certain brokers with whom the investment adviser, or its affiliates, places trades on behalf of the Fund include an amount in addition to trade execution, which may be rebated back to the Fund to offset certain expenses. This amount totaled $181,494 for the period. In addition, through arrangements with the Fund's custodian, credits realized as a result of certain uninvested cash balances were used to reduce the Fund's expenses. During the period, these credits reduced the Fund's custody expenses by $326.
In addition, during the period the investment adviser reimbursed and/or waived a portion of fund-level operating expenses in the amount of $8,770.
10. Distributions to Shareholders.
Distributions to shareholders of each class were as follows:
| Six months ended April 30, 2018 | Year ended October 31, 2017 | |
| From net investment income | ||
| Class A | $109,584 | $156,512 |
| Class M | 7,454 | 13,192 |
| Worldwide | 10,457,481 | 12,387,164 |
| Class I | 145,361 | 108,770 |
| Total | $10,719,880 | $12,665,638 |
| From net realized gain | ||
| Class A | $1,941,882 | $90,544 |
| Class M | 646,560 | 29,788 |
| Class C | 633,806 | 5,172 |
| Worldwide | 99,045,540 | 4,423,987 |
| Class I | 1,361,108 | 41,380 |
| Total | $103,628,896 | $4,590,871 |
11. Share Transactions.
Share transactions for each class were as follows and may contain automatic conversions between classes or exchanges between affiliated funds:
| Shares | Shares | Dollars | Dollars | |
| Six months ended April 30, 2018 | Year ended October 31, 2017 | Six months ended April 30, 2018 | Year ended October 31, 2017 | |
| Class A | ||||
| Shares sold | 185,097 | 252,685 | $5,028,206 | $6,107,897 |
| Reinvestment of distributions | 78,436 | 11,049 | 2,026,788 | 241,860 |
| Shares redeemed | (145,667) | (391,649) | (3,964,853) | (9,231,105) |
| Net increase (decrease) | 117,866 | (127,915) | $3,090,141 | $(2,881,348) |
| Class M | ||||
| Shares sold | 54,068 | 59,279 | $1,466,106 | $1,423,926 |
| Reinvestment of distributions | 25,202 | 1,947 | 648,710 | 42,456 |
| Shares redeemed | (45,871) | (96,788) | (1,238,552) | (2,279,691) |
| Net increase (decrease) | 33,399 | (35,562) | $876,264 | $(813,309) |
| Class C | ||||
| Shares sold | 46,901 | 50,318 | $1,240,087 | $1,172,168 |
| Reinvestment of distributions | 23,576 | 220 | 596,476 | 4,750 |
| Shares redeemed | (36,845) | (149,358) | (975,582) | (3,414,844) |
| Net increase (decrease) | 33,632 | (98,820) | $860,981 | $(2,237,926) |
| Worldwide | ||||
| Shares sold | 7,555,999 | 6,214,435 | $207,524,618 | $152,123,337 |
| Reinvestment of distributions | 4,051,546 | 735,217 | 105,785,860 | 16,240,943 |
| Shares redeemed | (4,799,918) | (11,303,639) | (131,208,239) | (268,415,255) |
| Net increase (decrease) | 6,807,627 | (4,353,987) | $182,102,239 | $(100,050,975) |
| Class I | ||||
| Shares sold | 270,557 | 418,936 | $7,370,446 | $10,241,482 |
| Reinvestment of distributions | 55,804 | 6,375 | 1,449,797 | 140,244 |
| Shares redeemed | (175,604) | (223,274) | (4,760,920) | (5,382,770) |
| Net increase (decrease) | 150,757 | 202,037 | $4,059,323 | $4,998,956 |
12. Other.
The Fund's organizational documents provide former and current trustees and officers with a limited indemnification against liabilities arising in connection with the performance of their duties to the Fund. In the normal course of business, the Fund may also enter into contracts that provide general indemnifications. The Fund's maximum exposure under these arrangements is unknown as this would be dependent on future claims that may be made against the Fund. The risk of material loss from such claims is considered remote.
Shareholder Expense Example
As a shareholder of the Fund, you incur two types of costs: (1) transaction costs, including sales charges (loads) on purchase payments or redemption proceeds, and (2) ongoing costs, including management fees, distribution and/or service (12b-1) fees and other Fund expenses. This Example is intended to help you understand your ongoing costs (in dollars) of investing in the Fund and to compare these costs with the ongoing costs of investing in other mutual funds.
The Example is based on an investment of $1,000 invested at the beginning of the period and held for the entire period (November 1, 2017 to April 30, 2018).
Actual Expenses
The first line of the accompanying table for each class of the Fund provides information about actual account values and actual expenses. You may use the information in this line, together with the amount you invested, to estimate the expenses that you paid over the period. Simply divide your account value by $1,000.00 (for example, an $8,600 account value divided by $1,000.00 = 8.6), then multiply the result by the number in the first line for a class of the Fund under the heading entitled "Expenses Paid During Period" to estimate the expenses you paid on your account during this period. A small balance maintenance fee of $12.00 that is charged once a year may apply for certain accounts with a value of less than $2,000. This fee is not included in the table below. If it was, the estimate of expenses you paid during the period would be higher, and your ending account value lower, by this amount. In addition, the Fund, as a shareholder in the underlying Fidelity Central Funds, will indirectly bear its pro-rata share of the fees and expenses incurred by the underlying Fidelity Central Funds. These fees and expenses are not included in the Fund's annualized expense ratio used to calculate the expense estimate in the table below.
Hypothetical Example for Comparison Purposes
The second line of the accompanying table for each class of the Fund provides information about hypothetical account values and hypothetical expenses based on a Class' actual expense ratio and an assumed rate of return of 5% per year before expenses, which is not the Class' actual return. The hypothetical account values and expenses may not be used to estimate the actual ending account balance or expenses you paid for the period. You may use this information to compare the ongoing costs of investing in the Fund and other funds. To do so, compare this 5% hypothetical example with the 5% hypothetical examples that appear in the shareholder reports of the other funds. A small balance maintenance fee of $12.00 that is charged once a year may apply for certain accounts with a value of less than $2,000. This fee is not included in the table below. If it was, the estimate of expenses you paid during the period would be higher, and your ending account value lower, by this amount. In addition, the Fund, as a shareholder in the underlying Fidelity Central Funds, will indirectly bear its pro-rata share of the fees and expenses incurred by the underlying Fidelity Central Funds. These fees and expenses are not included in the Fund's annualized expense ratio used to calculate the expense estimate in the table below.
Please note that the expenses shown in the table are meant to highlight your ongoing costs only and do not reflect any transaction costs. Therefore, the second line of the table is useful in comparing ongoing costs only, and will not help you determine the relative total costs of owning different funds. In addition, if these transactional costs were included, your costs would have been higher.
| Annualized Expense Ratio-A | Beginning Account Value November 1, 2017 | Ending Account Value April 30, 2018 | Expenses Paid During Period-B November 1, 2017 to April 30, 2018 | |
| Class A | 1.23% | |||
| Actual | $1,000.00 | $1,053.70 | $6.26 | |
| Hypothetical-C | $1,000.00 | $1,018.70 | $6.16 | |
| Class M | 1.52% | |||
| Actual | $1,000.00 | $1,052.20 | $7.73 | |
| Hypothetical-C | $1,000.00 | $1,017.26 | $7.60 | |
| Class C | 2.01% | |||
| Actual | $1,000.00 | $1,049.60 | $10.21 | |
| Hypothetical-C | $1,000.00 | $1,014.83 | $10.04 | |
| Worldwide | .93% | |||
| Actual | $1,000.00 | $1,055.10 | $4.74 | |
| Hypothetical-C | $1,000.00 | $1,020.18 | $4.66 | |
| Class I | .95% | |||
| Actual | $1,000.00 | $1,055.00 | $4.84 | |
| Hypothetical-C | $1,000.00 | $1,020.08 | $4.76 |
A Annualized expense ratio reflects expenses net of applicable fee waivers.
B Expenses are equal to each Class' annualized expense ratio, multiplied by the average account value over the period, multiplied by 181/365 (to reflect the one-half year period).
C 5% return per year before expenses
![]()
AWLD-SANN-0618
1.883450.109
Fidelity® Overseas Fund Semi-Annual Report April 30, 2018 |
|
Contents
To view a fund's proxy voting guidelines and proxy voting record for the 12-month period ended June 30, visit http://www.fidelity.com/proxyvotingresults or visit the Securities and Exchange Commission's (SEC) web site at http://www.sec.gov.
You may also call 1-800-835-5092 to request a free copy of the proxy voting guidelines.
Standard & Poor's, S&P and S&P 500 are registered service marks of The McGraw-Hill Companies, Inc. and have been licensed for use by Fidelity Distributors Corporation.
Other third-party marks appearing herein are the property of their respective owners.
All other marks appearing herein are registered or unregistered trademarks or service marks of FMR LLC or an affiliated company. © 2018 FMR LLC. All rights reserved.
This report and the financial statements contained herein are submitted for the general information of the shareholders of the Fund. This report is not authorized for distribution to prospective investors in the Fund unless preceded or accompanied by an effective prospectus.
A fund files its complete schedule of portfolio holdings with the SEC for the first and third quarters of each fiscal year on Form N-Q. Forms N-Q are available on the SEC’s web site at http://www.sec.gov. A fund's Forms N-Q may be reviewed and copied at the SEC’s Public Reference Room in Washington, DC. Information regarding the operation of the SEC's Public Reference Room may be obtained by calling 1-800-SEC-0330.
For a complete list of a fund's portfolio holdings, view the most recent holdings listing, semiannual report, or annual report on Fidelity's web site at http://www.fidelity.com, http://www.institutional.fidelity.com, or http://www.401k.com, as applicable.
NOT FDIC INSURED •MAY LOSE VALUE •NO BANK GUARANTEE
Neither the Fund nor Fidelity Distributors Corporation is a bank.
Investment Summary (Unaudited)
Geographic Diversification (% of fund's net assets)
| As of April 30, 2018 | ||
| United Kingdom | 20.4% | |
| Japan | 18.3% | |
| France | 10.4% | |
| Germany | 8.7% | |
| Switzerland | 5.8% | |
| Netherlands | 5.0% | |
| United States of America* | 4.0% | |
| Sweden | 3.8% | |
| Ireland | 3.8% | |
| Other | 19.8% | |
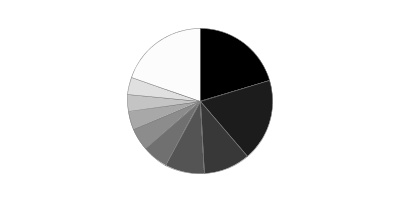
* Includes Short-Term investments and Net Other Assets (Liabilities).
Percentages are based on country or territory of incorporation and are adjusted for the effect of futures contracts, if applicable.
Asset Allocation as of April 30, 2018
| % of fund's net assets | |
| Stocks | 99.6 |
| Short-Term Investments and Net Other Assets (Liabilities) | 0.4 |
Top Ten Stocks as of April 30, 2018
| % of fund's net assets | |
| Roche Holding AG (participation certificate) (Switzerland, Pharmaceuticals) | 1.6 |
| Unilever NV (NY Reg.) (Netherlands, Personal Products) | 1.5 |
| Total SA (France, Oil, Gas & Consumable Fuels) | 1.4 |
| SAP SE (Germany, Software) | 1.3 |
| Bayer AG (Germany, Pharmaceuticals) | 1.3 |
| AIA Group Ltd. (Hong Kong, Insurance) | 1.2 |
| British American Tobacco PLC (United Kingdom) (United Kingdom, Tobacco) | 1.2 |
| Prudential PLC (United Kingdom, Insurance) | 1.2 |
| LVMH Moet Hennessy - Louis Vuitton SA (France, Textiles, Apparel & Luxury Goods) | 1.2 |
| ORIX Corp. (Japan, Diversified Financial Services) | 1.1 |
| 13.0 |
Top Market Sectors as of April 30, 2018
| % of fund's net assets | |
| Financials | 25.0 |
| Industrials | 18.1 |
| Health Care | 12.7 |
| Consumer Discretionary | 11.6 |
| Information Technology | 11.2 |
| Consumer Staples | 9.8 |
| Materials | 7.9 |
| Energy | 2.7 |
| Telecommunication Services | 0.6 |
Schedule of Investments April 30, 2018 (Unaudited)
Showing Percentage of Net Assets
| Common Stocks - 98.7% | |||
| Shares | Value | ||
| Australia - 1.8% | |||
| Adelaide Brighton Ltd. (a) | 6,442,640 | $31,083,236 | |
| Amcor Ltd. | 4,992,990 | 51,452,635 | |
| Aub Group Ltd. | 2,726,553 | 28,829,894 | |
| Pact Group Holdings Ltd. (b) | 5,658,021 | 24,091,680 | |
| TOTAL AUSTRALIA | 135,457,445 | ||
| Austria - 0.3% | |||
| Andritz AG | 489,244 | 26,326,541 | |
| Bailiwick of Jersey - 1.1% | |||
| Sanne Group PLC | 3,071,454 | 26,258,803 | |
| Wolseley PLC | 738,954 | 56,766,343 | |
| TOTAL BAILIWICK OF JERSEY | 83,025,146 | ||
| Belgium - 0.9% | |||
| KBC Groep NV | 800,118 | 69,954,509 | |
| Bermuda - 1.7% | |||
| Credicorp Ltd. (United States) | 177,600 | 41,290,224 | |
| Hiscox Ltd. | 2,305,300 | 47,256,490 | |
| IHS Markit Ltd. (c) | 836,100 | 41,077,593 | |
| TOTAL BERMUDA | 129,624,307 | ||
| Canada - 0.7% | |||
| Constellation Software, Inc. | 78,700 | 56,246,334 | |
| Cayman Islands - 0.3% | |||
| ZTO Express (Cayman), Inc. sponsored ADR (a) | 1,195,921 | 19,732,697 | |
| Denmark - 0.9% | |||
| DSV de Sammensluttede Vognmaend A/S | 629,700 | 50,041,641 | |
| NNIT A/S (b) | 675,397 | 18,763,156 | |
| TOTAL DENMARK | 68,804,797 | ||
| France - 10.4% | |||
| ALTEN | 365,535 | 36,328,871 | |
| Amundi SA (b) | 561,706 | 47,807,723 | |
| BNP Paribas SA | 1,054,200 | 81,449,862 | |
| Capgemini SA | 523,033 | 72,004,070 | |
| Compagnie de St. Gobain | 989,518 | 51,974,000 | |
| Edenred SA | 1,566,700 | 53,920,487 | |
| Elis SA | 1,610,614 | 38,549,453 | |
| LVMH Moet Hennessy - Louis Vuitton SA (a) | 258,863 | 90,087,468 | |
| Maisons du Monde SA (b) | 952,900 | 38,756,318 | |
| Publicis Groupe SA | 376,166 | 28,164,000 | |
| Sanofi SA (a) | 928,881 | 73,439,490 | |
| Sodexo SA | 213,054 | 21,098,405 | |
| SR Teleperformance SA | 294,600 | 47,280,366 | |
| Total SA | 1,725,260 | 108,435,618 | |
| TOTAL FRANCE | 789,296,131 | ||
| Germany - 7.8% | |||
| adidas AG | 298,075 | 73,394,900 | |
| Axel Springer Verlag AG | 625,225 | 51,228,223 | |
| Bayer AG | 865,986 | 103,502,310 | |
| Deutsche Post AG | 1,718,434 | 74,587,683 | |
| Fresenius Medical Care AG & Co. KGaA | 503,436 | 51,084,090 | |
| Fresenius SE & Co. KGaA | 889,796 | 68,059,948 | |
| Hannover Reuck SE | 318,300 | 44,818,601 | |
| SAP SE | 933,545 | 103,722,153 | |
| Scout24 AG (b) | 425,300 | 22,053,653 | |
| TOTAL GERMANY | 592,451,561 | ||
| Hong Kong - 1.2% | |||
| AIA Group Ltd. | 10,673,400 | 95,390,311 | |
| India - 0.7% | |||
| Axis Bank Ltd. | 3,141,235 | 24,352,293 | |
| Housing Development Finance Corp. Ltd. | 1,034,485 | 29,268,708 | |
| PC Jeweller Ltd. | 60,988 | 132,038 | |
| TOTAL INDIA | 53,753,039 | ||
| Indonesia - 0.5% | |||
| PT Bank Rakyat Indonesia Tbk | 162,221,100 | 37,403,072 | |
| Ireland - 3.8% | |||
| CRH PLC | 1,349,200 | 47,884,573 | |
| DCC PLC (United Kingdom) | 476,112 | 45,882,438 | |
| Kerry Group PLC Class A | 510,748 | 52,117,850 | |
| Kingspan Group PLC (Ireland) | 1,124,980 | 50,944,719 | |
| Paddy Power Betfair PLC (Ireland) | 443,400 | 43,880,114 | |
| United Drug PLC (United Kingdom) | 3,726,103 | 46,936,993 | |
| TOTAL IRELAND | 287,646,687 | ||
| Israel - 0.8% | |||
| Frutarom Industries Ltd. | 664,416 | 63,784,084 | |
| Italy - 1.8% | |||
| Banca Generali SpA | 994,277 | 32,322,545 | |
| Intesa Sanpaolo SpA | 18,215,736 | 69,291,886 | |
| Prada SpA | 6,689,600 | 33,942,398 | |
| TOTAL ITALY | 135,556,829 | ||
| Japan - 18.3% | |||
| AEON Financial Service Co. Ltd. | 1,555,000 | 36,499,543 | |
| Arc Land Sakamoto Co. Ltd. | 1,032,500 | 16,311,082 | |
| Bridgestone Corp. | 1,192,000 | 50,037,395 | |
| Daiichikosho Co. Ltd. | 625,800 | 32,915,752 | |
| Daikin Industries Ltd. | 573,600 | 67,187,596 | |
| Dentsu, Inc. | 642,400 | 30,439,371 | |
| GMO Internet, Inc. (a) | 646,000 | 11,907,153 | |
| Hoya Corp. | 1,471,100 | 78,883,902 | |
| Iriso Electronics Co. Ltd. | 466,700 | 29,627,680 | |
| Keyence Corp. | 121,280 | 74,296,758 | |
| KH Neochem Co. Ltd. | 1,348,000 | 40,938,163 | |
| Miroku Jyoho Service Co., Ltd. | 837,000 | 23,888,035 | |
| Misumi Group, Inc. | 1,373,500 | 38,069,018 | |
| Mitsubishi UFJ Financial Group, Inc. | 12,568,900 | 84,228,515 | |
| Morinaga & Co. Ltd. | 587,200 | 28,629,491 | |
| Nabtesco Corp. | 1,083,600 | 39,202,689 | |
| Nakanishi, Inc. | 2,384,400 | 49,860,395 | |
| Nissan Chemical Industries Co. Ltd. | 699,700 | 31,202,319 | |
| Nitori Holdings Co. Ltd. | 335,800 | 56,765,313 | |
| NOF Corp. | 890,100 | 26,584,125 | |
| OBIC Co. Ltd. | 527,900 | 44,281,403 | |
| Olympus Corp. | 1,284,500 | 47,998,376 | |
| ORIX Corp. | 4,844,700 | 85,265,302 | |
| Otsuka Corp. | 876,800 | 40,904,501 | |
| Outsourcing, Inc. | 87,816 | 1,481,272 | |
| PALTAC Corp. | 405,100 | 20,306,879 | |
| Recruit Holdings Co. Ltd. | 2,211,800 | 51,127,137 | |
| S Foods, Inc. | 580,300 | 24,444,580 | |
| SMC Corp. | 137,200 | 52,359,898 | |
| Software Service, Inc. | 82,800 | 5,824,479 | |
| Sundrug Co. Ltd. | 803,300 | 41,370,097 | |
| Tsubaki Nakashima Co. Ltd. | 985,300 | 23,307,591 | |
| Tsuruha Holdings, Inc. | 351,300 | 50,548,381 | |
| VT Holdings Co. Ltd. | 333,300 | 1,521,375 | |
| Welcia Holdings Co. Ltd. | 983,000 | 50,624,680 | |
| TOTAL JAPAN | 1,388,840,246 | ||
| Kenya - 0.4% | |||
| Safaricom Ltd. | 95,758,300 | 26,970,807 | |
| Korea (South) - 0.3% | |||
| LG Chemical Ltd. | 67,440 | 22,670,495 | |
| Netherlands - 5.0% | |||
| Grandvision NV (b) | 1,131,600 | 27,877,011 | |
| Heineken NV (Bearer) | 469,300 | 49,475,239 | |
| IMCD Group BV | 1,002,318 | 61,790,880 | |
| ING Groep NV (Certificaten Van Aandelen) | 3,776,954 | 63,643,646 | |
| Koninklijke Philips Electronics NV | 1,565,245 | 66,250,919 | |
| Unilever NV (NY Reg.) | 1,970,174 | 112,536,339 | |
| TOTAL NETHERLANDS | 381,574,034 | ||
| New Zealand - 0.7% | |||
| EBOS Group Ltd. | 2,276,701 | 28,481,548 | |
| Trade Maine Group Ltd. | 7,184,130 | 23,504,606 | |
| TOTAL NEW ZEALAND | 51,986,154 | ||
| Norway - 1.3% | |||
| Schibsted ASA (A Shares) | 1,305,300 | 38,171,519 | |
| Statoil ASA | 2,378,159 | 60,815,968 | |
| TOTAL NORWAY | 98,987,487 | ||
| Panama - 0.3% | |||
| Copa Holdings SA Class A | 226,200 | 26,503,854 | |
| Spain - 3.1% | |||
| Amadeus IT Holding SA Class A | 907,230 | 66,501,157 | |
| CaixaBank SA | 10,530,416 | 51,208,088 | |
| Grifols SA ADR | 2,594,305 | 52,716,278 | |
| Masmovil Ibercom SA (c) | 112,690 | 16,275,700 | |
| Prosegur Cash SA (b) | 15,725,714 | 45,956,701 | |
| TOTAL SPAIN | 232,657,924 | ||
| Sweden - 3.8% | |||
| Addlife AB | 838,800 | 17,577,475 | |
| Alfa Laval AB (a) | 1,491,850 | 37,089,040 | |
| Essity AB Class B | 1,822,264 | 46,406,431 | |
| HEXPOL AB (B Shares) (a) | 3,849,062 | 39,999,845 | |
| Indutrade AB | 1,639,523 | 38,831,867 | |
| Nordea Bank AB | 6,280,267 | 64,103,312 | |
| Swedbank AB (A Shares) | 2,020,723 | 44,064,460 | |
| TOTAL SWEDEN | 288,072,430 | ||
| Switzerland - 5.8% | |||
| Credit Suisse Group AG | 3,781,741 | 63,783,760 | |
| Julius Baer Group Ltd. | 955,659 | 56,716,805 | |
| Kaba Holding AG (B Shares) (Reg.) | 49,236 | 38,256,024 | |
| Lonza Group AG | 206,492 | 50,883,296 | |
| Roche Holding AG (participation certificate) | 532,428 | 118,298,830 | |
| Sika AG | 6,022 | 43,934,470 | |
| UBS Group AG | 4,164,487 | 70,472,701 | |
| TOTAL SWITZERLAND | 442,345,886 | ||
| Taiwan - 1.0% | |||
| Taiwan Semiconductor Manufacturing Co. Ltd. | 4,887,000 | 37,160,014 | |
| United Microelectronics Corp. | 72,048,000 | 38,784,667 | |
| TOTAL TAIWAN | 75,944,681 | ||
| United Kingdom - 20.4% | |||
| Admiral Group PLC | 1,770,600 | 48,581,070 | |
| Ascential PLC | 8,294,087 | 48,117,431 | |
| Beazley PLC | 3,526,600 | 28,717,741 | |
| British American Tobacco PLC (United Kingdom) | 1,734,860 | 95,152,751 | |
| Cineworld Group PLC | 13,489,039 | 48,357,218 | |
| Compass Group PLC | 2,951,194 | 63,381,377 | |
| Conviviality PLC (d) | 5,450,078 | 3,796,580 | |
| Cranswick PLC | 613,080 | 24,594,954 | |
| Dechra Pharmaceuticals PLC | 676,095 | 25,521,987 | |
| Diploma PLC | 2,130,803 | 35,377,727 | |
| DS Smith PLC | 5,271,924 | 37,915,049 | |
| Halma PLC | 2,257,870 | 38,015,850 | |
| Hastings Group Holdings PLC (b) | 7,906,163 | 30,040,984 | |
| Hilton Food Group PLC | 2,121,873 | 25,881,678 | |
| IntegraFin Holdings PLC (c) | 4,016,531 | 15,814,537 | |
| Intertek Group PLC | 658,045 | 44,399,657 | |
| James Fisher and Sons PLC | 986,058 | 22,724,651 | |
| John Wood Group PLC | 2,430,392 | 19,024,905 | |
| JTC PLC (b)(c) | 2,833,000 | 11,954,086 | |
| LivaNova PLC (c) | 241,865 | 21,472,775 | |
| London Stock Exchange Group PLC | 1,146,430 | 67,866,478 | |
| Melrose Industries PLC | 18,343,163 | 57,576,914 | |
| Micro Focus International PLC | 1,596,823 | 27,534,230 | |
| Next PLC | 227,800 | 16,483,460 | |
| Prudential PLC | 3,682,871 | 94,701,563 | |
| Reckitt Benckiser Group PLC | 958,624 | 75,202,212 | |
| Rentokil Initial PLC | 9,286,400 | 39,248,682 | |
| Rio Tinto PLC | 1,115,454 | 60,798,874 | |
| Rolls-Royce Holdings PLC | 3,064,092 | 35,434,018 | |
| Rotork PLC | 8,268,806 | 37,452,259 | |
| Schroders PLC | 930,282 | 42,276,542 | |
| Sinclair Pharma PLC (c) | 10,232,168 | 2,112,994 | |
| Spectris PLC | 1,359,744 | 50,355,713 | |
| St. James's Place Capital PLC | 3,736,563 | 58,462,996 | |
| Standard Life PLC | 9,603,242 | 48,295,522 | |
| The Weir Group PLC | 1,860,018 | 54,696,270 | |
| Ultra Electronics Holdings PLC | 1,389,394 | 26,931,925 | |
| Victrex PLC | 1,258,588 | 45,431,344 | |
| Volution Group PLC | 9,088,967 | 24,650,178 | |
| TOTAL UNITED KINGDOM | 1,554,355,182 | ||
| United States of America - 3.6% | |||
| Alphabet, Inc. Class C (c) | 41,093 | 41,805,142 | |
| Boston Scientific Corp. (c) | 1,338,400 | 38,438,848 | |
| Moody's Corp. | 276,700 | 44,880,740 | |
| S&P Global, Inc. | 407,500 | 76,854,500 | |
| Sherwin-Williams Co. | 101,600 | 37,354,256 | |
| Worldpay, Inc. (c) | 432,300 | 35,111,406 | |
| TOTAL UNITED STATES OF AMERICA | 274,444,892 | ||
| TOTAL COMMON STOCKS | |||
| (Cost $5,980,847,066) | 7,509,807,562 | ||
| Nonconvertible Preferred Stocks - 0.9% | |||
| Germany - 0.9% | |||
| Henkel AG & Co. KGaA | 513,444 | 65,351,686 | |
| United Kingdom - 0.0% | |||
| Rolls-Royce Holdings PLC Series C (c) | 217,550,532 | 299,502 | |
| TOTAL NONCONVERTIBLE PREFERRED STOCKS | |||
| (Cost $51,453,728) | 65,651,188 | ||
| Money Market Funds - 2.0% | |||
| Fidelity Cash Central Fund, 1.74% (e) | 11,343,976 | 11,346,245 | |
| Fidelity Securities Lending Cash Central Fund 1.74% (e)(f) | 141,257,071 | 141,271,197 | |
| TOTAL MONEY MARKET FUNDS | |||
| (Cost $152,617,442) | 152,617,442 | ||
| TOTAL INVESTMENT IN SECURITIES - 101.6% | |||
| (Cost $6,184,918,236) | 7,728,076,192 | ||
| NET OTHER ASSETS (LIABILITIES) - (1.6)% | (119,903,455) | ||
| NET ASSETS - 100% | $7,608,172,737 |
Categorizations in the Schedule of Investments are based on country or territory of incorporation.
Legend
(a) Security or a portion of the security is on loan at period end.
(b) Security exempt from registration under Rule 144A of the Securities Act of 1933. These securities may be resold in transactions exempt from registration, normally to qualified institutional buyers. At the end of the period, the value of these securities amounted to $267,301,312 or 3.5% of net assets.
(c) Non-income producing
(d) Level 3 security
(e) Affiliated fund that is generally available only to investment companies and other accounts managed by Fidelity Investments. The rate quoted is the annualized seven-day yield of the fund at period end. A complete unaudited listing of the fund's holdings as of its most recent quarter end is available upon request. In addition, each Fidelity Central Fund's financial statements are available on the SEC's website or upon request.
(f) Investment made with cash collateral received from securities on loan.
Affiliated Central Funds
Information regarding fiscal year to date income earned by the Fund from investments in Fidelity Central Funds is as follows:
| Fund | Income earned |
| Fidelity Cash Central Fund | $472,085 |
| Fidelity Securities Lending Cash Central Fund | 1,345,047 |
| Total | $1,817,132 |
Amounts in the income column in the above table include any capital gain distributions from underlying funds, which are presented in the corresponding line-item in the Statement of Operations if applicable.
Investment Valuation
The following is a summary of the inputs used, as of April 30, 2018, involving the Fund's assets and liabilities carried at fair value. The inputs or methodology used for valuing securities may not be an indication of the risk associated with investing in those securities. For more information on valuation inputs, and their aggregation into the levels used below, please refer to the Investment Valuation section in the accompanying Notes to Financial Statements.
| Valuation Inputs at Reporting Date: | ||||
| Description | Total | Level 1 | Level 2 | Level 3 |
| Investments in Securities: | ||||
| Equities: | ||||
| Consumer Discretionary | $874,606,350 | $729,346,041 | $145,260,309 | $-- |
| Consumer Staples | 746,132,949 | 571,981,406 | 170,354,963 | 3,796,580 |
| Energy | 211,001,142 | 41,749,556 | 169,251,586 | -- |
| Financials | 1,910,084,513 | 1,211,265,972 | 698,818,541 | -- |
| Health Care | 966,108,089 | 553,532,450 | 412,575,639 | -- |
| Industrials | 1,368,625,262 | 1,294,037,579 | 74,587,683 | -- |
| Information Technology | 850,528,790 | 643,327,726 | 207,201,064 | -- |
| Materials | 605,125,148 | 389,814,150 | 215,310,998 | -- |
| Telecommunication Services | 43,246,507 | 43,246,507 | -- | -- |
| Money Market Funds | 152,617,442 | 152,617,442 | -- | -- |
| Total Investments in Securities: | $7,728,076,192 | $5,630,918,829 | $2,093,360,783 | $3,796,580 |
The following is a summary of transfers between Level 1 and Level 2 for the period ended April 30, 2018. Transfers are assumed to have occurred at the beginning of the period, and are primarily attributable to the valuation techniques used for foreign equity securities, as discussed in the accompanying Notes to Financial Statements:
| Transfers | Total |
| Level 1 to Level 2 | $583,462,934 |
| Level 2 to Level 1 | $1,339,271,215 |
See accompanying notes which are an integral part of the financial statements.
Financial Statements
Statement of Assets and Liabilities
| April 30, 2018 (Unaudited) | ||
| Assets | ||
| Investment in securities, at value (including securities loaned of $136,297,873) — See accompanying schedule: Unaffiliated issuers (cost $6,032,300,794) | $7,575,458,750 | |
| Fidelity Central Funds (cost $152,617,442) | 152,617,442 | |
| Total Investment in Securities (cost $6,184,918,236) | $7,728,076,192 | |
| Receivable for investments sold | 29,674,217 | |
| Receivable for fund shares sold | 6,980,891 | |
| Dividends receivable | 42,164,552 | |
| Distributions receivable from Fidelity Central Funds | 186,872 | |
| Prepaid expenses | 3,812 | |
| Other receivables | 537,344 | |
| Total assets | 7,807,623,880 | |
| Liabilities | ||
| Payable for investments purchased | $21,940,011 | |
| Payable for fund shares redeemed | 29,448,532 | |
| Accrued management fee | 5,057,371 | |
| Other affiliated payables | 1,037,652 | |
| Other payables and accrued expenses | 692,193 | |
| Collateral on securities loaned | 141,275,384 | |
| Total liabilities | 199,451,143 | |
| Net Assets | $7,608,172,737 | |
| Net Assets consist of: | ||
| Paid in capital | $5,839,225,850 | |
| Undistributed net investment income | 43,603,647 | |
| Accumulated undistributed net realized gain (loss) on investments and foreign currency transactions | 182,523,828 | |
| Net unrealized appreciation (depreciation) on investments and assets and liabilities in foreign currencies | 1,542,819,412 | |
| Net Assets | $7,608,172,737 | |
| Overseas: | ||
| Net Asset Value, offering price and redemption price per share ($6,392,928,831 ÷ 126,164,248 shares) | $50.67 | |
| Class K: | ||
| Net Asset Value, offering price and redemption price per share ($1,215,243,906 ÷ 24,031,485 shares) | $50.57 |
See accompanying notes which are an integral part of the financial statements.
Statement of Operations
| Six months ended April 30, 2018 (Unaudited) | ||
| Investment Income | ||
| Dividends | $89,585,383 | |
| Income from Fidelity Central Funds | 1,817,132 | |
| Income before foreign taxes withheld | 91,402,515 | |
| Less foreign taxes withheld | (7,774,440) | |
| Total income | 83,628,075 | |
| Expenses | ||
| Management fee | ||
| Basic fee | $26,356,669 | |
| Performance adjustment | 5,240,326 | |
| Transfer agent fees | 5,508,296 | |
| Accounting and security lending fees | 850,801 | |
| Custodian fees and expenses | 464,150 | |
| Independent trustees' fees and expenses | 15,788 | |
| Registration fees | 98,521 | |
| Audit | 43,235 | |
| Legal | 15,155 | |
| Interest | 13,619 | |
| Miscellaneous | 24,924 | |
| Total expenses before reductions | 38,631,484 | |
| Expense reductions | (304,295) | 38,327,189 |
| Net investment income (loss) | 45,300,886 | |
| Realized and Unrealized Gain (Loss) | ||
| Net realized gain (loss) on: | ||
| Investment securities: | ||
| Unaffiliated issuers | 196,438,194 | |
| Fidelity Central Funds | (15,288) | |
| Foreign currency transactions | (380,071) | |
| Total net realized gain (loss) | 196,042,835 | |
| Change in net unrealized appreciation (depreciation) on: | ||
| Investment securities: | ||
| Unaffiliated issuers | (81,492,921) | |
| Fidelity Central Funds | 11,865 | |
| Assets and liabilities in foreign currencies | (454,285) | |
| Total change in net unrealized appreciation (depreciation) | (81,935,341) | |
| Net gain (loss) | 114,107,494 | |
| Net increase (decrease) in net assets resulting from operations | $159,408,380 |
See accompanying notes which are an integral part of the financial statements.
Statement of Changes in Net Assets
| Six months ended April 30, 2018 (Unaudited) | Year ended October 31, 2017 | |
| Increase (Decrease) in Net Assets | ||
| Operations | ||
| Net investment income (loss) | $45,300,886 | $85,275,934 |
| Net realized gain (loss) | 196,042,835 | 136,914,624 |
| Change in net unrealized appreciation (depreciation) | (81,935,341) | 1,248,492,417 |
| Net increase (decrease) in net assets resulting from operations | 159,408,380 | 1,470,682,975 |
| Distributions to shareholders from net investment income | (83,986,110) | (95,770,528) |
| Distributions to shareholders from net realized gain | (5,103,031) | (6,822,064) |
| Total distributions | (89,089,141) | (102,592,592) |
| Share transactions - net increase (decrease) | (448,106,251) | 1,304,095,173 |
| Redemption fees | – | 11,066 |
| Total increase (decrease) in net assets | (377,787,012) | 2,672,196,622 |
| Net Assets | ||
| Beginning of period | 7,985,959,749 | 5,313,763,127 |
| End of period | $7,608,172,737 | $7,985,959,749 |
| Other Information | ||
| Undistributed net investment income end of period | $43,603,647 | $82,288,871 |
See accompanying notes which are an integral part of the financial statements.
Financial Highlights
Fidelity Overseas Fund
| Six months ended (Unaudited) April 30, | Years endedOctober 31, | |||||
| 2018 | 2017 | 2016 | 2015 | 2014 | 2013 | |
| Selected Per–Share Data | ||||||
| Net asset value, beginning of period | $50.18 | $40.73 | $41.56 | $39.02 | $39.22 | $31.35 |
| Income from Investment Operations | ||||||
| Net investment income (loss)A | .29 | .58 | .75B | .52 | .77C | .54 |
| Net realized and unrealized gain (loss) | .75 | 9.65 | (1.15) | 2.69 | (.28) | 8.10 |
| Total from investment operations | 1.04 | 10.23 | (.40) | 3.21 | .49 | 8.64 |
| Distributions from net investment income | (.52) | (.72) | (.43) | (.67) | (.51) | (.77) |
| Distributions from net realized gain | (.03) | (.05) | (.01) | – | (.18) | – |
| Total distributions | (.55) | (.78)D | (.43)E | (.67) | (.69) | (.77) |
| Redemption fees added to paid in capitalA | – | –F | –F | –F | –F | –F |
| Net asset value, end of period | $50.67 | $50.18 | $40.73 | $41.56 | $39.02 | $39.22 |
| Total ReturnG,H | 2.10% | 25.63% | (.97)% | 8.34% | 1.27% | 28.17% |
| Ratios to Average Net AssetsI,J | ||||||
| Expenses before reductions | .99%K | 1.00% | 1.03% | 1.04% | 1.04% | 1.09% |
| Expenses net of fee waivers, if any | .99%K | 1.00% | 1.03% | 1.04% | 1.04% | 1.09% |
| Expenses net of all reductions | .98%K | 1.00% | 1.03% | 1.03% | 1.04% | 1.06% |
| Net investment income (loss) | 1.13%K | 1.30% | 1.88%B | 1.28% | 1.93%C | 1.54% |
| Supplemental Data | ||||||
| Net assets, end of period (000 omitted) | $6,392,929 | $6,828,078 | $4,569,084 | $3,844,290 | $2,738,667 | $1,874,922 |
| Portfolio turnover rateL | 33%K | 26%M | 33% | 28% | 41% | 42% |
A Calculated based on average shares outstanding during the period.
B Net Investment income per share reflects a large, non-recurring dividend which amounted to $.18 per share. Excluding this non-recurring dividend, the ratio of net investment income (loss) to average net assets would have been 1.42%.
C Net Investment income per share reflects a large, non-recurring dividend which amounted to $.24 per share. Excluding this non-recurring dividend, the ratio of net investment income (loss) to average net assets would have been 1.34%.
D Total distributions of $.78 per share is comprised of distributions from net investment income of $.723 and distributions from net realized gain of $.052 per share.
E Total distributions of $.43 per share is comprised of distributions from net investment income of $.428 and distributions from net realized gain of $.006 per share.
F Amount represents less than $.005 per share.
G Total returns for periods of less than one year are not annualized.
H Total returns would have been lower if certain expenses had not been reduced during the applicable periods shown.
I Fees and expenses of any underlying Fidelity Central Funds are not included in the Fund's expense ratio. The Fund indirectly bears its proportionate share of the expenses of any underlying Fidelity Central Funds.
J Expense ratios reflect operating expenses of the class. Expenses before reductions do not reflect amounts reimbursed by the investment adviser or reductions from brokerage service arrangements or reductions from other expense offset arrangements and do not represent the amount paid by the class during periods when reimbursements or reductions occur. Expenses net of fee waivers reflect expenses after reimbursement by the investment adviser but prior to reductions from brokerage service arrangements or other expense offset arrangements. Expenses net of all reductions represent the net expenses paid by the class.
K Annualized
L Amount does not include the portfolio activity of any underlying Fidelity Central Funds.
M Portfolio turnover rate excludes securities received or delivered in-kind.
See accompanying notes which are an integral part of the financial statements.
Fidelity Overseas Fund Class K
| Six months ended (Unaudited) April 30, | Years endedOctober 31, | |||||
| 2018 | 2017 | 2016 | 2015 | 2014 | 2013 | |
| Selected Per–Share Data | ||||||
| Net asset value, beginning of period | $50.11 | $40.67 | $41.49 | $38.96 | $39.17 | $31.32 |
| Income from Investment Operations | ||||||
| Net investment income (loss)A | .31 | .64 | .80B | .57 | .82C | .60 |
| Net realized and unrealized gain (loss) | .75 | 9.62 | (1.14) | 2.68 | (.28) | 8.08 |
| Total from investment operations | 1.06 | 10.26 | (.34) | 3.25 | .54 | 8.68 |
| Distributions from net investment income | (.57) | (.77) | (.47) | (.72) | (.58) | (.83) |
| Distributions from net realized gain | (.03) | (.05) | (.01) | – | (.18) | – |
| Total distributions | (.60) | (.82) | (.48) | (.72) | (.75)D | (.83) |
| Redemption fees added to paid in capitalA | – | –E | –E | –E | –E | –E |
| Net asset value, end of period | $50.57 | $50.11 | $40.67 | $41.49 | $38.96 | $39.17 |
| Total ReturnF,G | 2.15% | 25.80% | (.85)% | 8.47% | 1.41% | 28.37% |
| Ratios to Average Net AssetsH,I | ||||||
| Expenses before reductions | .88%J | .89% | .91% | .91% | .90% | .93% |
| Expenses net of fee waivers, if any | .88%J | .89% | .91% | .91% | .90% | .92% |
| Expenses net of all reductions | .87%J | .88% | .90% | .90% | .90% | .90% |
| Net investment income (loss) | 1.24%J | 1.42% | 2.00%B | 1.40% | 2.06%C | 1.71% |
| Supplemental Data | ||||||
| Net assets, end of period (000 omitted) | $1,215,244 | $1,157,882 | $744,679 | $691,585 | $626,817 | $562,490 |
| Portfolio turnover rateK | 33%J | 26%L | 33% | 28% | 41% | 42% |
A Calculated based on average shares outstanding during the period.
B Net Investment income per share reflects a large, non-recurring dividend which amounted to $.18 per share. Excluding this non-recurring dividend, the ratio of net investment income (loss) to average net assets would have been 1.55%.
C Net Investment income per share reflects a large, non-recurring dividend which amounted to $.24 per share. Excluding this non-recurring dividend, the ratio of net investment income (loss) to average net assets would have been 1.47%.
D Total distributions of $.75 per share is comprised of distributions from net investment income of $.575 and distributions from net realized gain of $.177 per share.
E Amount represents less than $.005 per share.
F Total returns for periods of less than one year are not annualized.
G Total returns would have been lower if certain expenses had not been reduced during the applicable periods shown.
H Fees and expenses of any underlying Fidelity Central Funds are not included in the Fund's expense ratio. The Fund indirectly bears its proportionate share of the expenses of any underlying Fidelity Central Funds.
I Expense ratios reflect operating expenses of the class. Expenses before reductions do not reflect amounts reimbursed by the investment adviser or reductions from brokerage service arrangements or reductions from other expense offset arrangements and do not represent the amount paid by the class during periods when reimbursements or reductions occur. Expenses net of fee waivers reflect expenses after reimbursement by the investment adviser but prior to reductions from brokerage service arrangements or other expense offset arrangements. Expenses net of all reductions represent the net expenses paid by the class.
J Annualized
K Amount does not include the portfolio activity of any underlying Fidelity Central Funds.
L Portfolio turnover rate excludes securities received or delivered in-kind.
See accompanying notes which are an integral part of the financial statements.
Notes to Financial Statements (Unaudited)
For the period ended April 30, 2018
1. Organization.
Fidelity Overseas Fund (the Fund) is a fund of Fidelity Investment Trust (the Trust) and is authorized to issue an unlimited number of shares. The Trust is registered under the Investment Company Act of 1940, as amended (the 1940 Act), as an open-end management investment company organized as a Massachusetts business trust. The Fund offers Overseas and Class K shares, each of which has equal rights as to assets and voting privileges. Each class has exclusive voting rights with respect to matters that affect that class.
2. Investments in Fidelity Central Funds.
The Fund invests in Fidelity Central Funds, which are open-end investment companies generally available only to other investment companies and accounts managed by the investment adviser and its affiliates. The Fund's Schedule of Investments lists each of the Fidelity Central Funds held as of period end, if any, as an investment of the Fund, but does not include the underlying holdings of each Fidelity Central Fund. As an Investing Fund, the Fund indirectly bears its proportionate share of the expenses of the underlying Fidelity Central Funds.
The Money Market Central Funds seek preservation of capital and current income and are managed by Fidelity Investments Money Management, Inc. (FIMM), an affiliate of the investment adviser. Annualized expenses of the Money Market Central Funds as of their most recent shareholder report date are less than .005%.
A complete unaudited list of holdings for each Fidelity Central Fund is available upon request or at the Securities and Exchange Commission (the SEC) website at www.sec.gov. In addition, the financial statements of the Fidelity Central Funds are available on the SEC website or upon request.
3. Significant Accounting Policies.
The Fund is an investment company and applies the accounting and reporting guidance of the Financial Accounting Standards Board (FASB) Accounting Standards Codification Topic 946 Financial Services – Investments Companies. The financial statements have been prepared in conformity with accounting principles generally accepted in the United States of America (GAAP), which require management to make certain estimates and assumptions at the date of the financial statements. Actual results could differ from those estimates. Subsequent events, if any, through the date that the financial statements were issued have been evaluated in the preparation of the financial statements. The following summarizes the significant accounting policies of the Fund:
Investment Valuation. Investments are valued as of 4:00 p.m. Eastern time on the last calendar day of the period. The Board of Trustees (the Board) has delegated the day to day responsibility for the valuation of the Fund's investments to the Fair Value Committee (the Committee) established by the Fund's investment adviser. In accordance with valuation policies and procedures approved by the Board, the Fund attempts to obtain prices from one or more third party pricing vendors or brokers to value its investments. When current market prices, quotations or currency exchange rates are not readily available or reliable, investments will be fair valued in good faith by the Committee, in accordance with procedures adopted by the Board. Factors used in determining fair value vary by investment type and may include market or investment specific events. The frequency with which these procedures are used cannot be predicted and they may be utilized to a significant extent. The Committee oversees the Fund's valuation policies and procedures and reports to the Board on the Committee's activities and fair value determinations. The Board monitors the appropriateness of the procedures used in valuing the Fund's investments and ratifies the fair value determinations of the Committee.
The Fund categorizes the inputs to valuation techniques used to value its investments into a disclosure hierarchy consisting of three levels as shown below:
- Level 1 – quoted prices in active markets for identical investments
- Level 2 – other significant observable inputs (including quoted prices for similar investments, interest rates, prepayment speeds, etc.)
- Level 3 – unobservable inputs (including the Fund's own assumptions based on the best information available)
Valuation techniques used to value the Fund's investments by major category are as follows:
Equity securities, including restricted securities, for which market quotations are readily available, are valued at the last reported sale price or official closing price as reported by a third party pricing vendor on the primary market or exchange on which they are traded and are categorized as Level 1 in the hierarchy. In the event there were no sales during the day or closing prices are not available, securities are valued at the last quoted bid price or may be valued using the last available price and are generally categorized as Level 2 in the hierarchy. For foreign equity securities, when market or security specific events arise, comparisons to the valuation of American Depositary Receipts (ADRs), futures contracts, Exchange-Traded Funds (ETFs) and certain indexes as well as quoted prices for similar securities may be used and would be categorized as Level 2 in the hierarchy. Utilizing these techniques may result in transfers between Level 1 and Level 2. For equity securities, including restricted securities, where observable inputs are limited, assumptions about market activity and risk are used and these securities may be categorized as Level 3 in the hierarchy.
Investments in open-end mutual funds, including the Fidelity Central Funds, are valued at their closing net asset value (NAV) each business day and are categorized as Level 1 in the hierarchy.
Changes in valuation techniques may result in transfers in or out of an assigned level within the disclosure hierarchy. The aggregate value of investments by input level as of April 30, 2018, including information on transfers between Levels 1 and 2, is included at the end of the Fund's Schedule of Investments.
Foreign Currency. The Fund may use foreign currency contracts to facilitate transactions in foreign-denominated securities. Gains and losses from these transactions may arise from changes in the value of the foreign currency or if the counterparties do not perform under the contracts' terms.
Foreign-denominated assets, including investment securities, and liabilities are translated into U.S. dollars at the exchange rates at period end. Purchases and sales of investment securities, income and dividends received and expenses denominated in foreign currencies are translated into U.S. dollars at the exchange rate in effect on the transaction date.
The effects of exchange rate fluctuations on investments are included with the net realized and unrealized gain (loss) on investment securities. Other foreign currency transactions resulting in realized and unrealized gain (loss) are disclosed separately.
Investment Transactions and Income. For financial reporting purposes, the Fund's investment holdings and NAV include trades executed through the end of the last business day of the period. The NAV per share for processing shareholder transactions is calculated as of the close of business of the New York Stock Exchange (NYSE), normally 4:00 p.m. Eastern time and includes trades executed through the end of the prior business day. Gains and losses on securities sold are determined on the basis of identified cost and includes proceeds received from litigation. Dividend income is recorded on the ex-dividend date, except for certain dividends from foreign securities where the ex-dividend date may have passed, which are recorded as soon as the Fund is informed of the ex-dividend date. Non-cash dividends included in dividend income, if any, are recorded at the fair market value of the securities received. Income and capital gain distributions from Fidelity Central Funds, if any, are recorded on the ex-dividend date. Certain distributions received by the Fund represent a return of capital or capital gain. The Fund determines the components of these distributions subsequent to the ex-dividend date, based upon receipt of tax filings or other correspondence relating to the underlying investment. These distributions are recorded as a reduction of cost of investments and/or as a realized gain. Investment income is recorded net of foreign taxes withheld where recovery of such taxes is uncertain.
Class Allocations and Expenses. Investment income, realized and unrealized capital gains and losses, common expenses of the Fund, and certain fund-level expense reductions, if any, are allocated daily on a pro-rata basis to each class based on the relative net assets of each class to the total net assets of the Fund. Each class differs with respect to transfer agent fees incurred. Certain expense reductions may also differ by class. For the reporting period, the allocated portion of income and expenses to each class as a percent of its average net assets may vary due to the timing of recording these transactions in relation to fluctuating net assets of the classes. Expenses directly attributable to a fund are charged to that fund. Expenses attributable to more than one fund are allocated among the respective funds on the basis of relative net assets or other appropriate methods. Expense estimates are accrued in the period to which they relate and adjustments are made when actual amounts are known.
Deferred Trustee Compensation. Under a Deferred Compensation Plan (the Plan), certain independent Trustees have elected to defer receipt of a portion of their annual compensation. Deferred amounts are invested in a cross-section of Fidelity funds, are marked-to-market and remain in the Fund until distributed in accordance with the Plan. The investment of deferred amounts and the offsetting payable to the Trustees are included in the accompanying Statement of Assets and Liabilities.
Income Tax Information and Distributions to Shareholders. Each year, the Fund intends to qualify as a regulated investment company under Subchapter M of the Internal Revenue Code, including distributing substantially all of its taxable income and realized gains. As a result, no provision for U.S. Federal income taxes is required. The Fund files a U.S. federal tax return, in addition to state and local tax returns as required. The Fund's federal income tax returns are subject to examination by the Internal Revenue Service (IRS) for a period of three fiscal years after they are filed. State and local tax returns may be subject to examination for an additional fiscal year depending on the jurisdiction. Foreign taxes are provided for based on the Fund's understanding of the tax rules and rates that exist in the foreign markets in which it invests.
Distributions are declared and recorded on the ex-dividend date. Income and capital gain distributions are declared separately for each class. Income and capital gain distributions are determined in accordance with income tax regulations, which may differ from GAAP.
Capital accounts within the financial statements are adjusted for permanent book-tax differences. These adjustments have no impact on net assets or the results of operations. Capital accounts are not adjusted for temporary book-tax differences which will reverse in a subsequent period.
Book-tax differences are primarily due to foreign currency transactions, passive foreign investment companies (PFIC), deferred trustees compensation, capital loss carryforwards, expiring capital loss carryforwards and losses deferred due to wash sales.
As of period end, the cost and unrealized appreciation (depreciation) in securities, and derivatives if applicable, for federal income tax purposes were as follows:
| Gross unrealized appreciation | $1,735,331,550 |
| Gross unrealized depreciation | (194,783,022) |
| Net unrealized appreciation (depreciation) | $1,540,548,528 |
| Tax cost | $6,187,527,664 |
Restricted Securities. The Fund may invest in securities that are subject to legal or contractual restrictions on resale. These securities generally may be resold in transactions exempt from registration or to the public if the securities are registered. Disposal of these securities may involve time-consuming negotiations and expense, and prompt sale at an acceptable price may be difficult. Information regarding restricted securities is included at the end of the Fund's Schedule of Investments.
4. Purchases and Sales of Investments.
Purchases and sales of securities, other than short-term securities, aggregated $1,297,976,581 and $1,697,231,533, respectively.
Prior Fiscal Year Exchanges In-Kind. During the prior period, investments and cash received in-kind through subscriptions totaled $257,590,200 in exchange for 5,518,213 shares of the Fund. The amount of in-kind exchanges is included in share transactions in the accompanying Statement of Changes in Net Assets as well as the Notes to Financial Statements. The Fund recognized no gain or loss for federal income tax purposes.
5. Fees and Other Transactions with Affiliates.
Management Fee. Fidelity Management & Research Company (the investment adviser) and its affiliates provide the Fund with investment management related services for which the Fund pays a monthly management fee. The management fee is the sum of an individual fund fee rate that is based on an annual rate of .424% of the Fund's average net assets and an annualized group fee rate that averaged .24% during the period. The group fee rate is based upon the average net assets of all the mutual funds advised by the investment adviser, including any mutual funds previously advised by the investment adviser that are currently advised by Fidelity SelectCo, LLC, an affiliate of the investment adviser. The group fee rate decreases as assets under management increase and increases as assets under management decrease. In addition, the management fee is subject to a performance adjustment (up to a maximum of +/- .20% of the Fund's average net assets over a 36 month performance period). The upward or downward adjustment to the management fee is based on the relative investment performance of Overseas as compared to its benchmark index, the MSCI EAFE Index, over the same 36 month performance period. For the reporting period, the total annualized management fee rate, including the performance adjustment, was .80% of the Fund's average net assets. The performance adjustment included in the management fee rate may be higher or lower than the maximum performance adjustment rate due to the difference between the average net assets for the reporting and performance periods.
Transfer Agent Fees. Fidelity Investments Institutional Operations Company, Inc., (FIIOC), an affiliate of the investment adviser, is the transfer, dividend disbursing and shareholder servicing agent for each class of the Fund. FIIOC receives account fees and asset-based fees that vary according to the account size and type of account of the shareholders of Overseas. FIIOC receives an asset-based fee of Class K's average net assets. FIIOC pays for typesetting, printing and mailing of shareholder reports, except proxy statements.
For the period, transfer agent fees for each class were as follows:
| Amount | % of Class-Level Average Net Assets(a) | |
| Overseas | $5,233,063 | .16 |
| Class K | 275,233 | .05 |
| $5,508,296 |
(a) Annualized
Accounting and Security Lending Fees. Fidelity Service Company, Inc. (FSC), an affiliate of the investment adviser, maintains the Fund's accounting records. The accounting fee is based on the level of average net assets for each month. Under a separate contract, FSC administers the security lending program. The security lending fee is based on the number and duration of lending transactions. For the period, the fees were equivalent to an annualized rate of .02%.
Brokerage Commissions. The Fund placed a portion of its portfolio transactions with brokerage firms which are affiliates of the investment adviser. Brokerage commissions are included in net realized gain (loss) and change in net unrealized appreciation (depreciation) in the Statement of Operations. The commissions paid to these affiliated firms were $4,869 for the period.
Interfund Lending Program. Pursuant to an Exemptive Order issued by the SEC, the Fund, along with other registered investment companies having management contracts with Fidelity Management & Research Company (FMR) or other affiliated entities of FMR, may participate in an interfund lending program. This program provides an alternative credit facility allowing the funds to borrow from, or lend money to, other participating affiliated funds. At period end, there were no interfund loans outstanding. The Fund's activity in this program during the period for which loans were outstanding was as follows:
| Borrower or Lender | Average Loan Balance | Weighted Average Interest Rate | Interest Expense |
| Borrower | $26,290,909 | 1.64% | $13,163 |
Interfund Trades. The Fund may purchase from or sell securities to other Fidelity Funds under procedures adopted by the Board. The procedures have been designed to ensure these interfund trades are executed in accordance with Rule 17a-7 of the 1940 Act. Interfund trades are included within the respective purchases and sales amounts shown in the Purchases and Sales of Investments note.
6. Committed Line of Credit.
The Fund participates with other funds managed by the investment adviser or an affiliate in a $4.25 billion credit facility (the "line of credit") to be utilized for temporary or emergency purposes to fund shareholder redemptions or for other short-term liquidity purposes. The Fund has agreed to pay commitment fees on its pro-rata portion of the line of credit, which amounted to $11,403 and is reflected in Miscellaneous expenses on the Statement of Operations. Interest is charged to the Fund based on its borrowing at a rate equal to .75% plus the higher of the Federal Funds Rate or one-month LIBOR. The Fund's average daily loan balance during the period for which loans were outstanding amounted to $6,700,000. The weighted average interest rate and interest expense was 2.45% and $456, respectively. At period end, there were no borrowings outstanding.
7. Security Lending.
The Fund lends portfolio securities through a lending agent from time to time in order to earn additional income. For equity securities, a lending agent is used and may loan securities to certain qualified borrowers, including Fidelity Capital Markets (FCM), a broker-dealer affiliated with the Fund. On the settlement date of the loan, the Fund receives collateral (in the form of U.S. Treasury obligations, letters of credit and/or cash) against the loaned securities and maintains collateral in an amount not less than 100% of the market value of the loaned securities during the period of the loan. The market value of the loaned securities is determined at the close of business of the Fund and any additional required collateral is delivered to the Fund on the next business day. The Fund or borrower may terminate the loan at any time, and if the borrower defaults on its obligation to return the securities loaned because of insolvency or other reasons, the Fund may apply collateral received from the borrower against the obligation. The Fund may experience delays and costs in recovering the securities loaned. Any cash collateral received is invested in the Fidelity Securities Lending Cash Central Fund. The value of loaned securities and cash collateral at period end are disclosed on the Fund's Statement of Assets and Liabilities. Security lending income represents the income earned on investing cash collateral, less rebates paid to borrowers and any lending agent fees associated with the loan, plus any premium payments received for lending certain types of securities. Security lending income is presented in the Statement of Operations as a component of income from Fidelity Central Funds. Total security lending income during the period amounted to $1,345,047. During the period, there were no securities loaned to FCM.
8. Expense Reductions.
Commissions paid to certain brokers with whom the investment adviser, or its affiliates, places trades on behalf of the Fund include an amount in addition to trade execution, which may be rebated back to the Fund to offset certain expenses. This amount totaled $263,935 for the period. In addition, through arrangements with the Fund's custodian, credits realized as a result of certain uninvested cash balances were used to reduce the Fund's expenses. During the period, these credits reduced the Fund's custody expenses by $546.
In addition, during the period the investment adviser reimbursed and/or waived a portion of fund-level operating expenses in the amount of $39,814.
9. Distributions to Shareholders.
Distributions to shareholders of each class were as follows:
| Six months ended April 30, 2018 | Year ended October 31, 2017 | |
| From net investment income | ||
| Overseas | $70,575,092 | $81,032,285 |
| Class K | 13,411,018 | 14,738,243 |
| Total | $83,986,110 | $95,770,528 |
| From net realized gain | ||
| Overseas | $4,351,452 | $5,828,046 |
| Class K | 751,579 | 994,018 |
| Total | $5,103,031 | $6,822,064 |
10. Share Transactions.
Share transactions for each class were as follows and may contain automatic conversions between classes or exchanges between affiliated funds:
| Shares | Shares | Dollars | Dollars | |
| Six months ended April 30, 2018 | Year ended October 31, 2017 | Six months ended April 30, 2018 | Year ended October 31, 2017 | |
| Overseas | ||||
| Shares sold | 15,152,557 | 43,630,558(a) | $766,940,516 | $1,962,017,751(a) |
| Reinvestment of distributions | 1,397,531 | 2,111,926 | 69,429,338 | 82,914,195 |
| Shares redeemed | (26,453,069) | (21,850,358) | (1,331,662,228) | (954,218,064) |
| Net increase (decrease) | (9,902,981) | 23,892,126 | $(495,292,374) | $1,090,713,882 |
| Class K | ||||
| Shares sold | 3,633,919 | 9,782,877 | $184,691,947 | $437,887,827 |
| Reinvestment of distributions | 285,767 | 401,743 | 14,162,597 | 15,732,261 |
| Shares redeemed | (2,996,981) | (5,385,134) | (151,668,421) | (240,238,797) |
| Net increase (decrease) | 922,705 | 4,799,486 | $47,186,123 | $213,381,291 |
(a) Amount includes in-kind exchanges (see the prior Exchanges In-Kind note for additional details).
11. Other.
The Fund's organizational documents provide former and current trustees and officers with a limited indemnification against liabilities arising in connection with the performance of their duties to the Fund. In the normal course of business, the Fund may also enter into contracts that provide general indemnifications. The Fund's maximum exposure under these arrangements is unknown as this would be dependent on future claims that may be made against the Fund. The risk of material loss from such claims is considered remote.
At the end of the period, mutual funds managed by the investment adviser or its affiliates were the owners of record, in the aggregate, of approximately 25% of the total outstanding shares of the Fund.
Shareholder Expense Example
As a shareholder of the Fund, you incur two types of costs: (1) transaction costs and (2) ongoing costs, including management fees and other Fund expenses. This Example is intended to help you understand your ongoing costs (in dollars) of investing in the Fund and to compare these costs with the ongoing costs of investing in other mutual funds.
The Example is based on an investment of $1,000 invested at the beginning of the period and held for the entire period (November 1, 2017 to April 30, 2018).
Actual Expenses
The first line of the accompanying table for each class of the Fund provides information about actual account values and actual expenses. You may use the information in this line, together with the amount you invested, to estimate the expenses that you paid over the period. Simply divide your account value by $1,000.00 (for example, an $8,600 account value divided by $1,000.00 = 8.6), then multiply the result by the number in the first line for a class of the Fund under the heading entitled "Expenses Paid During Period" to estimate the expenses you paid on your account during this period. A small balance maintenance fee of $12.00 that is charged once a year may apply for certain accounts with a value of less than $2,000. This fee is not included in the table below. If it was, the estimate of expenses you paid during the period would be higher, and your ending account value lower, by this amount. In addition, the Fund, as a shareholder in the underlying Fidelity Central Funds, will indirectly bear its pro-rata share of the fees and expenses incurred by the underlying Fidelity Central Funds. These fees and expenses are not included in the Fund's annualized expense ratio used to calculate the expense estimate in the table below.
Hypothetical Example for Comparison Purposes
The second line of the accompanying table for each class of the Fund provides information about hypothetical account values and hypothetical expenses based on a Class' actual expense ratio and an assumed rate of return of 5% per year before expenses, which is not the Class' actual return. The hypothetical account values and expenses may not be used to estimate the actual ending account balance or expenses you paid for the period. You may use this information to compare the ongoing costs of investing in the Fund and other funds. To do so, compare this 5% hypothetical example with the 5% hypothetical examples that appear in the shareholder reports of the other funds. A small balance maintenance fee of $12.00 that is charged once a year may apply for certain accounts with a value of less than $2,000. This fee is not included in the table below. If it was, the estimate of expenses you paid during the period would be higher, and your ending account value lower, by this amount. In addition, the Fund, as a shareholder in the underlying Fidelity Central Funds, will indirectly bear its pro-rata share of the fees and expenses incurred by the underlying Fidelity Central Funds. These fees and expenses are not included in the Fund's annualized expense ratio used to calculate the expense estimate in the table below.
Please note that the expenses shown in the table are meant to highlight your ongoing costs only and do not reflect any transaction costs. Therefore, the second line of the table is useful in comparing ongoing costs only, and will not help you determine the relative total costs of owning different funds.
| Annualized Expense Ratio-A | Beginning Account Value November 1, 2017 | Ending Account Value April 30, 2018 | Expenses Paid During Period-B November 1, 2017 to April 30, 2018 | |
| Overseas | .99% | |||
| Actual | $1,000.00 | $1,021.00 | $4.96 | |
| Hypothetical-C | $1,000.00 | $1,019.89 | $4.96 | |
| Class K | .88% | |||
| Actual | $1,000.00 | $1,021.50 | $4.41 | |
| Hypothetical-C | $1,000.00 | $1,020.43 | $4.41 |
A Annualized expense ratio reflects expenses net of applicable fee waivers.
B Expenses are equal to each Class' annualized expense ratio, multiplied by the average account value over the period, multiplied by 181/365 (to reflect the one-half year period).
C 5% return per year before expenses
![]()
Corporate Headquarters
245 Summer St.
Boston, MA 02210
www.fidelity.com
OVE-K-SANN-0618
1.863322.109
Fidelity's Targeted International Equity Funds® Fidelity® Canada Fund Fidelity® China Region Fund Fidelity® Emerging Asia Fund Fidelity® Emerging Markets Fund Fidelity® Europe Fund Fidelity® Japan Fund Fidelity® Japan Smaller Companies Fund Fidelity® Latin America Fund Fidelity® Nordic Fund Fidelity® Pacific Basin Fund Semi-Annual Report April 30, 2018 |
|
Contents
To view a fund's proxy voting guidelines and proxy voting record for the 12-month period ended June 30, visit http://www.fidelity.com/proxyvotingresults or visit the Securities and Exchange Commission's (SEC) web site at http://www.sec.gov.
You may also call 1-800-544-8544 to request a free copy of the proxy voting guidelines.
Standard & Poor's, S&P and S&P 500 are registered service marks of The McGraw-Hill Companies, Inc. and have been licensed for use by Fidelity Distributors Corporation.
Other third-party marks appearing herein are the property of their respective owners.
All other marks appearing herein are registered or unregistered trademarks or service marks of FMR LLC or an affiliated company. © 2018 FMR LLC. All rights reserved.
This report and the financial statements contained herein are submitted for the general information of the shareholders of the Funds. This report is not authorized for distribution to prospective investors in the Funds unless preceded or accompanied by an effective prospectus.
A fund files its complete schedule of portfolio holdings with the SEC for the first and third quarters of each fiscal year on Form N-Q. Forms N-Q are available on the SEC’s web site at http://www.sec.gov. A fund's Forms N-Q may be reviewed and copied at the SEC’s Public Reference Room in Washington, DC. Information regarding the operation of the SEC's Public Reference Room may be obtained by calling 1-800-SEC-0330.
For a complete list of a fund's portfolio holdings, view the most recent holdings listing, semiannual report, or annual report on Fidelity's web site at http://www.fidelity.com, http://www.institutional.fidelity.com, or http://www.401k.com, as applicable.
NOT FDIC INSURED •MAY LOSE VALUE •NO BANK GUARANTEE
Neither the Funds nor Fidelity Distributors Corporation is a bank.
Fidelity® Canada Fund
Investment Summary (Unaudited)
Geographic Diversification (% of fund's net assets)
| As of April 30, 2018 | ||
| Canada | 95.5% | |
| United States of America* | 3.2% | |
| Bailiwick of Jersey | 0.8% | |
| United Kingdom | 0.5% | |

* Includes Short-Term investments and Net Other Assets (Liabilities).
Percentages are based on country or territory of incorporation and are adjusted for the effect of futures contracts, if applicable.
Asset Allocation as of April 30, 2018
| % of fund's net assets | |
| Stocks | 97.4 |
| Short-Term Investments and Net Other Assets (Liabilities) | 2.6 |
Top Ten Stocks as of April 30, 2018
| % of fund's net assets | |
| Royal Bank of Canada (Banks) | 9.8 |
| The Toronto-Dominion Bank (Banks) | 9.5 |
| Suncor Energy, Inc. (Oil, Gas & Consumable Fuels) | 7.0 |
| Sun Life Financial, Inc. (Insurance) | 3.9 |
| Canadian Pacific Railway Ltd. (Road & Rail) | 3.9 |
| TELUS Corp. (Diversified Telecommunication Services) | 3.6 |
| Canadian National Railway Co. (Road & Rail) | 3.3 |
| Nutrien Ltd. (Chemicals) | 3.2 |
| Alimentation Couche-Tard, Inc. Class B (sub. vtg.) (Food & Staples Retailing) | 3.0 |
| Canadian Natural Resources Ltd. (Oil, Gas & Consumable Fuels) | 2.9 |
| 50.1 |
Top Market Sectors as of April 30, 2018
| % of fund's net assets | |
| Financials | 32.6 |
| Energy | 18.8 |
| Materials | 12.3 |
| Industrials | 9.5 |
| Consumer Staples | 7.8 |
| Telecommunication Services | 6.0 |
| Information Technology | 4.6 |
| Consumer Discretionary | 3.8 |
| Real Estate | 0.7 |
| Utilities | 0.7 |
Market Sectors may include more than one industry category.
The Fund may invest up to 35% of its total assets in any industry that represents more than 20% of the Canadian market. As of April 30, 2018, the Fund did not have more than 25% of its total assets invested in any one industry.
Fidelity® Canada Fund
Schedule of Investments April 30, 2018 (Unaudited)
Showing Percentage of Net Assets
| Common Stocks - 97.4% | |||
| Shares | Value | ||
| CONSUMER DISCRETIONARY - 3.8% | |||
| Auto Components - 0.9% | |||
| Magna International, Inc. Class A (sub. vtg.) | 172,600 | $10,193,744 | |
| Hotels, Restaurants & Leisure - 0.4% | |||
| Cara Operations Ltd. | 222,000 | 4,619,993 | |
| Leisure Products - 0.3% | |||
| BRP, Inc. | 87,700 | 3,547,753 | |
| Media - 1.5% | |||
| Cogeco Communications, Inc. | 149,400 | 7,960,165 | |
| Quebecor, Inc. Class B (sub. vtg.) | 441,700 | 8,235,755 | |
| 16,195,920 | |||
| Specialty Retail - 0.4% | |||
| AutoCanada, Inc. | 257,100 | 4,369,268 | |
| Textiles, Apparel & Luxury Goods - 0.3% | |||
| ERO Copper Corp. | 411,700 | 2,565,209 | |
| TOTAL CONSUMER DISCRETIONARY | 41,491,887 | ||
| CONSUMER STAPLES - 7.8% | |||
| Food & Staples Retailing - 7.3% | |||
| Alimentation Couche-Tard, Inc. Class B (sub. vtg.) | 773,400 | 33,436,998 | |
| George Weston Ltd. | 259,600 | 21,268,214 | |
| Jean Coutu Group, Inc. Class A (sub. vtg.) (a) | 395,700 | 7,578,382 | |
| Metro, Inc. Class A (sub. vtg.) | 375,295 | 11,908,188 | |
| North West Co., Inc. | 301,300 | 6,479,141 | |
| 80,670,923 | |||
| Tobacco - 0.5% | |||
| Imperial Tobacco Group PLC | 149,313 | 5,353,790 | |
| TOTAL CONSUMER STAPLES | 86,024,713 | ||
| ENERGY - 18.8% | |||
| Energy Equipment & Services - 1.3% | |||
| Canadian Energy Services & Technology Corp. | 2,056,100 | 10,072,720 | |
| ShawCor Ltd. Class A | 221,400 | 4,283,326 | |
| 14,356,046 | |||
| Oil, Gas & Consumable Fuels - 17.5% | |||
| Canadian Natural Resources Ltd. | 890,298 | 32,118,543 | |
| Cenovus Energy, Inc. | 1,228,200 | 12,301,610 | |
| Enbridge, Inc. | 605,000 | 18,325,052 | |
| Kinder Morgan Canada Ltd. (a)(b) | 183,500 | 2,368,157 | |
| NuVista Energy Ltd. (c) | 716,000 | 4,701,024 | |
| Parkland Fuel Corp. (a) | 229,900 | 5,337,684 | |
| Peyto Exploration & Development Corp. (a) | 608,900 | 5,757,269 | |
| Pinnacle Renewable Holds, Inc. | 408,500 | 4,546,489 | |
| PrairieSky Royalty Ltd. (a) | 1,124,518 | 24,934,793 | |
| Suncor Energy, Inc. | 2,011,200 | 76,911,032 | |
| Whitecap Resources, Inc. (a) | 643,100 | 4,658,149 | |
| 191,959,802 | |||
| TOTAL ENERGY | 206,315,848 | ||
| FINANCIALS - 32.6% | |||
| Banks - 21.7% | |||
| Bank of Nova Scotia | 419,900 | 25,809,812 | |
| Royal Bank of Canada | 1,415,500 | 107,643,929 | |
| The Toronto-Dominion Bank | 1,859,700 | 104,445,630 | |
| 237,899,371 | |||
| Capital Markets - 3.5% | |||
| Brookfield Asset Management, Inc. Class A | 247,700 | 9,817,713 | |
| CI Financial Corp. | 596,800 | 12,559,318 | |
| Fairfax India Holdings Corp. (c) | 102,000 | 1,785,000 | |
| Gluskin Sheff + Associates, Inc. | 222,700 | 2,693,665 | |
| TMX Group Ltd. | 198,300 | 11,960,241 | |
| 38,815,937 | |||
| Insurance - 7.4% | |||
| Intact Financial Corp. | 173,725 | 13,246,371 | |
| Power Corp. of Canada (sub. vtg.) | 1,060,900 | 25,209,750 | |
| Sun Life Financial, Inc. | 1,047,900 | 43,256,124 | |
| 81,712,245 | |||
| TOTAL FINANCIALS | 358,427,553 | ||
| HEALTH CARE - 0.6% | |||
| Biotechnology - 0.6% | |||
| Amgen, Inc. | 38,300 | 6,682,584 | |
| INDUSTRIALS - 9.5% | |||
| Professional Services - 0.7% | |||
| Stantec, Inc. | 273,800 | 6,966,818 | |
| Road & Rail - 8.2% | |||
| Canadian National Railway Co. | 476,900 | 36,834,902 | |
| Canadian Pacific Railway Ltd. | 234,700 | 42,825,278 | |
| TransForce, Inc. | 367,600 | 10,641,919 | |
| 90,302,099 | |||
| Trading Companies & Distributors - 0.6% | |||
| Toromont Industries Ltd. | 153,500 | 6,722,462 | |
| TOTAL INDUSTRIALS | 103,991,379 | ||
| INFORMATION TECHNOLOGY - 4.6% | |||
| IT Services - 2.0% | |||
| CGI Group, Inc. Class A (sub. vtg.) (c) | 371,100 | 21,503,828 | |
| Software - 2.6% | |||
| Constellation Software, Inc. | 22,300 | 15,937,653 | |
| Open Text Corp. | 375,328 | 13,250,998 | |
| 29,188,651 | |||
| TOTAL INFORMATION TECHNOLOGY | 50,692,479 | ||
| MATERIALS - 12.3% | |||
| Chemicals - 3.3% | |||
| Methanex Corp. | 19,000 | 1,145,224 | |
| Nutrien Ltd. | 768,681 | 34,993,111 | |
| 36,138,335 | |||
| Containers & Packaging - 1.2% | |||
| CCL Industries, Inc. Class B | 271,500 | 13,169,532 | |
| Metals & Mining - 7.2% | |||
| Agnico Eagle Mines Ltd. (Canada) | 337,600 | 14,206,572 | |
| Barrick Gold Corp. | 383,000 | 5,154,593 | |
| Franco-Nevada Corp. | 272,100 | 19,299,931 | |
| HudBay Minerals, Inc. | 551,400 | 3,852,220 | |
| Lundin Mining Corp. | 1,694,600 | 11,218,583 | |
| Premier Gold Mines Ltd. (c) | 1,683,900 | 3,567,279 | |
| Randgold Resources Ltd. | 113,264 | 9,183,854 | |
| Wheaton Precious Metals Corp. | 584,100 | 12,123,731 | |
| 78,606,763 | |||
| Paper & Forest Products - 0.6% | |||
| Western Forest Products, Inc. | 3,148,000 | 6,791,511 | |
| TOTAL MATERIALS | 134,706,141 | ||
| REAL ESTATE - 0.7% | |||
| Equity Real Estate Investment Trusts (REITs) - 0.7% | |||
| Allied Properties (REIT) | 252,800 | 8,167,097 | |
| TELECOMMUNICATION SERVICES - 6.0% | |||
| Diversified Telecommunication Services - 3.6% | |||
| TELUS Corp. | 1,116,900 | 39,971,615 | |
| Wireless Telecommunication Services - 2.4% | |||
| Rogers Communications, Inc. Class B (non-vtg.) | 545,500 | 25,750,812 | |
| TOTAL TELECOMMUNICATION SERVICES | 65,722,427 | ||
| UTILITIES - 0.7% | |||
| Electric Utilities - 0.7% | |||
| Hydro One Ltd. (b) | 495,600 | 7,870,465 | |
| TOTAL COMMON STOCKS | |||
| (Cost $773,555,131) | 1,070,092,573 | ||
| Money Market Funds - 4.5% | |||
| Fidelity Cash Central Fund, 1.74% (d) | 28,395,462 | 28,401,141 | |
| Fidelity Securities Lending Cash Central Fund 1.74% (d)(e) | 20,808,939 | 20,811,019 | |
| TOTAL MONEY MARKET FUNDS | |||
| (Cost $49,212,404) | 49,212,160 | ||
| TOTAL INVESTMENT IN SECURITIES - 101.9% | |||
| (Cost $822,767,535) | 1,119,304,733 | ||
| NET OTHER ASSETS (LIABILITIES) - (1.9)% | (21,311,127) | ||
| NET ASSETS - 100% | $1,097,993,606 |
Legend
(a) Security or a portion of the security is on loan at period end.
(b) Security exempt from registration under Rule 144A of the Securities Act of 1933. These securities may be resold in transactions exempt from registration, normally to qualified institutional buyers. At the end of the period, the value of these securities amounted to $10,238,622 or 0.9% of net assets.
(c) Non-income producing
(d) Affiliated fund that is generally available only to investment companies and other accounts managed by Fidelity Investments. The rate quoted is the annualized seven-day yield of the fund at period end. A complete unaudited listing of the fund's holdings as of its most recent quarter end is available upon request. In addition, each Fidelity Central Fund's financial statements are available on the SEC's website or upon request.
(e) Investment made with cash collateral received from securities on loan.
Affiliated Central Funds
Information regarding fiscal year to date income earned by the Fund from investments in Fidelity Central Funds is as follows:
| Fund | Income earned |
| Fidelity Cash Central Fund | $169,353 |
| Fidelity Securities Lending Cash Central Fund | 80,957 |
| Total | $250,310 |
Amounts in the income column in the above table include any capital gain distributions from underlying funds, which are presented in the corresponding line-item in the Statement of Operations if applicable.
Investment Valuation
The following is a summary of the inputs used, as of April 30, 2018, involving the Fund's assets and liabilities carried at fair value. The inputs or methodology used for valuing securities may not be an indication of the risk associated with investing in those securities. For more information on valuation inputs, and their aggregation into the levels used below, please refer to the Investment Valuation section in the accompanying Notes to Financial Statements.
| Valuation Inputs at Reporting Date: | ||||
| Description | Total | Level 1 | Level 2 | Level 3 |
| Investments in Securities: | ||||
| Equities: | ||||
| Consumer Discretionary | $41,491,887 | $41,491,887 | $-- | $-- |
| Consumer Staples | 86,024,713 | 86,024,713 | -- | -- |
| Energy | 206,315,848 | 206,315,848 | -- | -- |
| Financials | 358,427,553 | 358,427,553 | -- | -- |
| Health Care | 6,682,584 | 6,682,584 | -- | -- |
| Industrials | 103,991,379 | 103,991,379 | -- | -- |
| Information Technology | 50,692,479 | 50,692,479 | -- | -- |
| Materials | 134,706,141 | 125,522,287 | 9,183,854 | -- |
| Real Estate | 8,167,097 | 8,167,097 | -- | -- |
| Telecommunication Services | 65,722,427 | 65,722,427 | -- | -- |
| Utilities | 7,870,465 | 7,870,465 | -- | -- |
| Money Market Funds | 49,212,160 | 49,212,160 | -- | -- |
| Total Investments in Securities: | $1,119,304,733 | $1,110,120,879 | $9,183,854 | $-- |
See accompanying notes which are an integral part of the financial statements.
Fidelity® Canada Fund
Financial Statements
Statement of Assets and Liabilities
| April 30, 2018 (Unaudited) | ||
| Assets | ||
| Investment in securities, at value (including securities loaned of $19,547,539) — See accompanying schedule: Unaffiliated issuers (cost $773,555,131) | $1,070,092,573 | |
| Fidelity Central Funds (cost $49,212,404) | 49,212,160 | |
| Total Investment in Securities (cost $822,767,535) | $1,119,304,733 | |
| Foreign currency held at value (cost $935,838) | 935,838 | |
| Receivable for investments sold | 1,366,515 | |
| Receivable for fund shares sold | 178,794 | |
| Dividends receivable | 1,474,955 | |
| Distributions receivable from Fidelity Central Funds | 36,110 | |
| Prepaid expenses | 694 | |
| Other receivables | 39,311 | |
| Total assets | 1,123,336,950 | |
| Liabilities | ||
| Payable for investments purchased | $223,596 | |
| Payable for fund shares redeemed | 3,399,999 | |
| Accrued management fee | 612,513 | |
| Distribution and service plan fees payable | 22,133 | |
| Other affiliated payables | 235,113 | |
| Other payables and accrued expenses | 42,785 | |
| Collateral on securities loaned | 20,807,205 | |
| Total liabilities | 25,343,344 | |
| Net Assets | $1,097,993,606 | |
| Net Assets consist of: | ||
| Paid in capital | $774,388,722 | |
| Undistributed net investment income | 5,042,647 | |
| Accumulated undistributed net realized gain (loss) on investments and foreign currency transactions | 22,026,264 | |
| Net unrealized appreciation (depreciation) on investments and assets and liabilities in foreign currencies | 296,535,973 | |
| Net Assets | $1,097,993,606 | |
| Calculation of Maximum Offering Price | ||
| Class A: | ||
| Net Asset Value and redemption price per share ($33,263,501 ÷ 638,650 shares) | $52.08 | |
| Maximum offering price per share (100/94.25 of $52.08) | $55.26 | |
| Class M: | ||
| Net Asset Value and redemption price per share ($9,042,446 ÷ 174,386 shares) | $51.85 | |
| Maximum offering price per share (100/96.50 of $51.85) | $53.73 | |
| Class C: | ||
| Net Asset Value and offering price per share ($13,641,752 ÷ 267,861 shares)(a) | $50.93 | |
| Canada: | ||
| Net Asset Value, offering price and redemption price per share ($1,015,215,064 ÷ 19,417,537 shares) | $52.28 | |
| Class I: | ||
| Net Asset Value, offering price and redemption price per share ($26,830,843 ÷ 514,185 shares) | $52.18 |
(a) Redemption price per share is equal to net asset value less any applicable contingent deferred sales charge.
See accompanying notes which are an integral part of the financial statements.
Statement of Operations
| Six months ended April 30, 2018 (Unaudited) | ||
| Investment Income | ||
| Dividends | $15,786,711 | |
| Income from Fidelity Central Funds | 250,310 | |
| Income before foreign taxes withheld | 16,037,021 | |
| Less foreign taxes withheld | (2,273,763) | |
| Total income | 13,763,258 | |
| Expenses | ||
| Management fee | ||
| Basic fee | $4,027,533 | |
| Performance adjustment | (202,722) | |
| Transfer agent fees | 1,189,210 | |
| Distribution and service plan fees | 143,662 | |
| Accounting and security lending fees | 269,058 | |
| Custodian fees and expenses | 9,623 | |
| Independent trustees' fees and expenses | 2,374 | |
| Registration fees | 60,824 | |
| Audit | 37,709 | |
| Legal | 4,182 | |
| Miscellaneous | 4,207 | |
| Total expenses before reductions | 5,545,660 | |
| Expense reductions | (50,163) | 5,495,497 |
| Net investment income (loss) | 8,267,761 | |
| Realized and Unrealized Gain (Loss) | ||
| Net realized gain (loss) on: | ||
| Investment securities: | ||
| Unaffiliated issuers | 30,718,912 | |
| Fidelity Central Funds | 1,598 | |
| Foreign currency transactions | 6,659 | |
| Total net realized gain (loss) | 30,727,169 | |
| Change in net unrealized appreciation (depreciation) on: | ||
| Investment securities: | ||
| Unaffiliated issuers | (57,359,405) | |
| Fidelity Central Funds | (244) | |
| Assets and liabilities in foreign currencies | 8,388 | |
| Total change in net unrealized appreciation (depreciation) | (57,351,261) | |
| Net gain (loss) | (26,624,092) | |
| Net increase (decrease) in net assets resulting from operations | $(18,356,331) |
See accompanying notes which are an integral part of the financial statements.
Statement of Changes in Net Assets
| Six months ended April 30, 2018 (Unaudited) | Year ended October 31, 2017 | |
| Increase (Decrease) in Net Assets | ||
| Operations | ||
| Net investment income (loss) | $8,267,761 | $16,819,801 |
| Net realized gain (loss) | 30,727,169 | 52,938,459 |
| Change in net unrealized appreciation (depreciation) | (57,351,261) | 105,995,484 |
| Net increase (decrease) in net assets resulting from operations | (18,356,331) | 175,753,744 |
| Distributions to shareholders from net investment income | (16,688,588) | (16,443,381) |
| Distributions to shareholders from net realized gain | (10,788,163) | (5,168,976) |
| Total distributions | (27,476,751) | (21,612,357) |
| Share transactions - net increase (decrease) | (81,412,128) | (276,985,730) |
| Redemption fees | 5,144 | 38,887 |
| Total increase (decrease) in net assets | (127,240,066) | (122,805,456) |
| Net Assets | ||
| Beginning of period | 1,225,233,672 | 1,348,039,128 |
| End of period | $1,097,993,606 | $1,225,233,672 |
| Other Information | ||
| Undistributed net investment income end of period | $5,042,647 | $13,463,474 |
See accompanying notes which are an integral part of the financial statements.
Financial Highlights
Fidelity Canada Fund Class A
| Six months ended (Unaudited) April 30, | Years endedOctober 31, | |||||
| 2018 | 2017 | 2016 | 2015 | 2014 | 2013 | |
| Selected Per–Share Data | ||||||
| Net asset value, beginning of period | $54.11 | $48.09 | $45.25 | $60.56 | $57.31 | $53.65 |
| Income from Investment Operations | ||||||
| Net investment income (loss)A | .30 | .50 | .48 | .45 | .47 | .60 |
| Net realized and unrealized gain (loss) | (1.25) | 6.16 | 2.84 | (8.04) | 3.13 | 3.63 |
| Total from investment operations | (.95) | 6.66 | 3.32 | (7.59) | 3.60 | 4.23 |
| Distributions from net investment income | (.59) | (.45) | (.42) | (.50) | (.03) | (.57) |
| Distributions from net realized gain | (.49) | (.19) | (.06) | (7.22) | (.32) | – |
| Total distributions | (1.08) | (.64) | (.48) | (7.72) | (.35) | (.57) |
| Redemption fees added to paid in capitalA,B | – | – | – | – | – | – |
| Net asset value, end of period | $52.08 | $54.11 | $48.09 | $45.25 | $60.56 | $57.31 |
| Total ReturnC,D,E | (1.80)% | 13.98% | 7.45% | (14.32)% | 6.32% | 7.98% |
| Ratios to Average Net AssetsF,G | ||||||
| Expenses before reductions | 1.24%H | 1.34% | 1.48% | 1.43% | 1.29% | 1.19% |
| Expenses net of fee waivers, if any | 1.24%H | 1.34% | 1.48% | 1.43% | 1.29% | 1.19% |
| Expenses net of all reductions | 1.23%H | 1.34% | 1.48% | 1.43% | 1.29% | 1.18% |
| Net investment income (loss) | 1.13%H | .98% | 1.06% | .90% | .79% | 1.11% |
| Supplemental Data | ||||||
| Net assets, end of period (000 omitted) | $33,264 | $37,557 | $44,144 | $58,286 | $95,004 | $116,661 |
| Portfolio turnover rateI | 26%H | 26% | 44% | 24% | 85% | 64% |
A Calculated based on average shares outstanding during the period.
B Amount represents less than $.005 per share.
C Total returns for periods of less than one year are not annualized.
D Total returns would have been lower if certain expenses had not been reduced during the applicable periods shown.
E Total returns do not include the effect of the sales charges.
F Fees and expenses of any underlying Fidelity Central Funds are not included in the Fund's expense ratio. The Fund indirectly bears its proportionate share of the expenses of any underlying Fidelity Central Funds.
G Expense ratios reflect operating expenses of the class. Expenses before reductions do not reflect amounts reimbursed by the investment adviser or reductions from brokerage service arrangements or reductions from other expense offset arrangements and do not represent the amount paid by the class during periods when reimbursements or reductions occur. Expenses net of fee waivers reflect expenses after reimbursement by the investment adviser but prior to reductions from brokerage service arrangements or other expense offset arrangements. Expenses net of all reductions represent the net expenses paid by the class.
H Annualized
I Amount does not include the portfolio activity of any underlying Fidelity Central Funds.
See accompanying notes which are an integral part of the financial statements.
Fidelity Canada Fund Class M
| Six months ended (Unaudited) April 30, | Years endedOctober 31, | |||||
| 2018 | 2017 | 2016 | 2015 | 2014 | 2013 | |
| Selected Per–Share Data | ||||||
| Net asset value, beginning of period | $53.77 | $47.82 | $44.99 | $60.22 | $57.14 | $53.48 |
| Income from Investment Operations | ||||||
| Net investment income (loss)A | .22 | .35 | .35 | .29 | .29 | .45 |
| Net realized and unrealized gain (loss) | (1.25) | 6.13 | 2.83 | (8.00) | 3.11 | 3.63 |
| Total from investment operations | (1.03) | 6.48 | 3.18 | (7.71) | 3.40 | 4.08 |
| Distributions from net investment income | (.40) | (.34) | (.29) | (.30) | – | (.42) |
| Distributions from net realized gain | (.49) | (.19) | (.06) | (7.22) | (.32) | – |
| Total distributions | (.89) | (.53) | (.35) | (7.52) | (.32) | (.42) |
| Redemption fees added to paid in capitalA,B | – | – | – | – | – | – |
| Net asset value, end of period | $51.85 | $53.77 | $47.82 | $44.99 | $60.22 | $57.14 |
| Total ReturnC,D,E | (1.95)% | 13.64% | 7.14% | (14.58)% | 5.99% | 7.69% |
| Ratios to Average Net AssetsF,G | ||||||
| Expenses before reductions | 1.54%H | 1.63% | 1.77% | 1.75% | 1.59% | 1.47% |
| Expenses net of fee waivers, if any | 1.54%H | 1.63% | 1.77% | 1.75% | 1.59% | 1.47% |
| Expenses net of all reductions | 1.53%H | 1.63% | 1.77% | 1.75% | 1.59% | 1.46% |
| Net investment income (loss) | .82%H | .69% | .78% | .58% | .48% | .83% |
| Supplemental Data | ||||||
| Net assets, end of period (000 omitted) | $9,042 | $10,356 | $11,140 | $12,820 | $21,989 | $23,751 |
| Portfolio turnover rateI | 26%H | 26% | 44% | 24% | 85% | 64% |
A Calculated based on average shares outstanding during the period.
B Amount represents less than $.005 per share.
C Total returns for periods of less than one year are not annualized.
D Total returns would have been lower if certain expenses had not been reduced during the applicable periods shown.
E Total returns do not include the effect of the sales charges.
F Fees and expenses of any underlying Fidelity Central Funds are not included in the Fund's expense ratio. The Fund indirectly bears its proportionate share of the expenses of any underlying Fidelity Central Funds.
G Expense ratios reflect operating expenses of the class. Expenses before reductions do not reflect amounts reimbursed by the investment adviser or reductions from brokerage service arrangements or reductions from other expense offset arrangements and do not represent the amount paid by the class during periods when reimbursements or reductions occur. Expenses net of fee waivers reflect expenses after reimbursement by the investment adviser but prior to reductions from brokerage service arrangements or other expense offset arrangements. Expenses net of all reductions represent the net expenses paid by the class.
H Annualized
I Amount does not include the portfolio activity of any underlying Fidelity Central Funds.
See accompanying notes which are an integral part of the financial statements.
Fidelity Canada Fund Class C
| Six months ended (Unaudited) April 30, | Years endedOctober 31, | |||||
| 2018 | 2017 | 2016 | 2015 | 2014 | 2013 | |
| Selected Per–Share Data | ||||||
| Net asset value, beginning of period | $52.72 | $46.87 | $44.02 | $59.04 | $56.27 | $52.61 |
| Income from Investment Operations | ||||||
| Net investment income (loss)A | .10 | .13 | .15 | .07 | .02 | .20 |
| Net realized and unrealized gain (loss) | (1.22) | 6.01 | 2.78 | (7.85) | 3.07 | 3.58 |
| Total from investment operations | (1.12) | 6.14 | 2.93 | (7.78) | 3.09 | 3.78 |
| Distributions from net investment income | (.18) | (.11) | (.02) | (.02) | – | (.12) |
| Distributions from net realized gain | (.49) | (.19) | (.06) | (7.22) | (.32) | – |
| Total distributions | (.67) | (.29)B | (.08) | (7.24) | (.32) | (.12) |
| Redemption fees added to paid in capitalA,C | – | – | – | – | – | – |
| Net asset value, end of period | $50.93 | $52.72 | $46.87 | $44.02 | $59.04 | $56.27 |
| Total ReturnD,E,F | (2.15)% | 13.16% | 6.67% | (14.96)% | 5.53% | 7.21% |
| Ratios to Average Net AssetsG,H | ||||||
| Expenses before reductions | 1.97%I | 2.06% | 2.21% | 2.19% | 2.03% | 1.93% |
| Expenses net of fee waivers, if any | 1.97%I | 2.06% | 2.21% | 2.19% | 2.03% | 1.92% |
| Expenses net of all reductions | 1.96%I | 2.06% | 2.21% | 2.18% | 2.03% | 1.92% |
| Net investment income (loss) | .40%I | .26% | .33% | .14% | .04% | .37% |
| Supplemental Data | ||||||
| Net assets, end of period (000 omitted) | $13,642 | $15,938 | $18,489 | $21,610 | $38,749 | $46,040 |
| Portfolio turnover rateJ | 26%I | 26% | 44% | 24% | 85% | 64% |
A Calculated based on average shares outstanding during the period.
B Total distributions of $.29 per share is comprised of distributions from net investment income of $.105 and distributions from net realized gain of $.188 per share.
C Amount represents less than $.005 per share.
D Total returns for periods of less than one year are not annualized.
E Total returns would have been lower if certain expenses had not been reduced during the applicable periods shown.
F Total returns do not include the effect of the contingent deferred sales charge.
G Fees and expenses of any underlying Fidelity Central Funds are not included in the Fund's expense ratio. The Fund indirectly bears its proportionate share of the expenses of any underlying Fidelity Central Funds.
H Expense ratios reflect operating expenses of the class. Expenses before reductions do not reflect amounts reimbursed by the investment adviser or reductions from brokerage service arrangements or reductions from other expense offset arrangements and do not represent the amount paid by the class during periods when reimbursements or reductions occur. Expenses net of fee waivers reflect expenses after reimbursement by the investment adviser but prior to reductions from brokerage service arrangements or other expense offset arrangements. Expenses net of all reductions represent the net expenses paid by the class.
I Annualized
J Amount does not include the portfolio activity of any underlying Fidelity Central Funds.
See accompanying notes which are an integral part of the financial statements.
Fidelity Canada Fund
| Six months ended (Unaudited) April 30, | Years endedOctober 31, | |||||
| 2018 | 2017 | 2016 | 2015 | 2014 | 2013 | |
| Selected Per–Share Data | ||||||
| Net asset value, beginning of period | $54.41 | $48.35 | $45.55 | $60.95 | $57.72 | $54.05 |
| Income from Investment Operations | ||||||
| Net investment income (loss)A | .39 | .66 | .62 | .60 | .66 | .77 |
| Net realized and unrealized gain (loss) | (1.26) | 6.20 | 2.85 | (8.09) | 3.13 | 3.66 |
| Total from investment operations | (.87) | 6.86 | 3.47 | (7.49) | 3.79 | 4.43 |
| Distributions from net investment income | (.77) | (.61) | (.61) | (.69) | (.24) | (.76) |
| Distributions from net realized gain | (.49) | (.19) | (.06) | (7.22) | (.32) | – |
| Total distributions | (1.26) | (.80) | (.67) | (7.91) | (.56) | (.76) |
| Redemption fees added to paid in capitalA,B | – | – | – | – | – | – |
| Net asset value, end of period | $52.28 | $54.41 | $48.35 | $45.55 | $60.95 | $57.72 |
| Total ReturnC,D | (1.64)% | 14.35% | 7.79% | (14.08)% | 6.64% | 8.32% |
| Ratios to Average Net AssetsE,F | ||||||
| Expenses before reductions | .92%G | 1.02% | 1.17% | 1.15% | .98% | .87% |
| Expenses net of fee waivers, if any | .92%G | 1.02% | 1.17% | 1.15% | .98% | .87% |
| Expenses net of all reductions | .91%G | 1.02% | 1.17% | 1.14% | .98% | .86% |
| Net investment income (loss) | 1.44%G | 1.30% | 1.37% | 1.18% | 1.09% | 1.42% |
| Supplemental Data | ||||||
| Net assets, end of period (000 omitted) | $1,015,215 | $1,130,803 | $1,233,050 | $1,279,488 | $2,057,843 | $2,262,380 |
| Portfolio turnover rateH | 26%G | 26% | 44% | 24% | 85% | 64% |
A Calculated based on average shares outstanding during the period.
B Amount represents less than $.005 per share.
C Total returns for periods of less than one year are not annualized.
D Total returns would have been lower if certain expenses had not been reduced during the applicable periods shown.
E Fees and expenses of any underlying Fidelity Central Funds are not included in the Fund's expense ratio. The Fund indirectly bears its proportionate share of the expenses of any underlying Fidelity Central Funds.
F Expense ratios reflect operating expenses of the class. Expenses before reductions do not reflect amounts reimbursed by the investment adviser or reductions from brokerage service arrangements or reductions from other expense offset arrangements and do not represent the amount paid by the class during periods when reimbursements or reductions occur. Expenses net of fee waivers reflect expenses after reimbursement by the investment adviser but prior to reductions from brokerage service arrangements or other expense offset arrangements. Expenses net of all reductions represent the net expenses paid by the class.
G Annualized
H Amount does not include the portfolio activity of any underlying Fidelity Central Funds.
See accompanying notes which are an integral part of the financial statements.
Fidelity Canada Fund Class I
| Six months ended (Unaudited) April 30, | Years endedOctober 31, | |||||
| 2018 | 2017 | 2016 | 2015 | 2014 | 2013 | |
| Selected Per–Share Data | ||||||
| Net asset value, beginning of period | $54.29 | $48.28 | $45.44 | $60.80 | $57.57 | $53.91 |
| Income from Investment Operations | ||||||
| Net investment income (loss)A | .40 | .67 | .66 | .61 | .65 | .78 |
| Net realized and unrealized gain (loss) | (1.26) | 6.19 | 2.83 | (8.07) | 3.12 | 3.64 |
| Total from investment operations | (.86) | 6.86 | 3.49 | (7.46) | 3.77 | 4.42 |
| Distributions from net investment income | (.77) | (.66) | (.59) | (.68) | (.22) | (.76) |
| Distributions from net realized gain | (.49) | (.19) | (.06) | (7.22) | (.32) | – |
| Total distributions | (1.25)B | (.85) | (.65) | (7.90) | (.54) | (.76) |
| Redemption fees added to paid in capitalA,C | – | – | – | – | – | – |
| Net asset value, end of period | $52.18 | $54.29 | $48.28 | $45.44 | $60.80 | $57.57 |
| Total ReturnD,E | (1.61)% | 14.38% | 7.83% | (14.05)% | 6.62% | 8.34% |
| Ratios to Average Net AssetsF,G | ||||||
| Expenses before reductions | .88%H | 1.00% | 1.14% | 1.13% | 1.00% | .86% |
| Expenses net of fee waivers, if any | .88%H | .99% | 1.13% | 1.12% | 1.00% | .86% |
| Expenses net of all reductions | .87%H | .99% | 1.13% | 1.12% | 1.00% | .85% |
| Net investment income (loss) | 1.49%H | 1.33% | 1.41% | 1.21% | 1.08% | 1.43% |
| Supplemental Data | ||||||
| Net assets, end of period (000 omitted) | $26,831 | $30,581 | $41,217 | $14,846 | $30,165 | $30,831 |
| Portfolio turnover rateI | 26%H | 26% | 44% | 24% | 85% | 64% |
A Calculated based on average shares outstanding during the period.
B Total distributions of $1.25 per share is comprised of distributions from net investment income of $.765 and distributions from net realized gain of $.487 per share.
C Amount represents less than $.005 per share.
D Total returns for periods of less than one year are not annualized.
E Total returns would have been lower if certain expenses had not been reduced during the applicable periods shown.
F Fees and expenses of any underlying Fidelity Central Funds are not included in the Fund's expense ratio. The Fund indirectly bears its proportionate share of the expenses of any underlying Fidelity Central Funds.
G Expense ratios reflect operating expenses of the class. Expenses before reductions do not reflect amounts reimbursed by the investment adviser or reductions from brokerage service arrangements or reductions from other expense offset arrangements and do not represent the amount paid by the class during periods when reimbursements or reductions occur. Expenses net of fee waivers reflect expenses after reimbursement by the investment adviser but prior to reductions from brokerage service arrangements or other expense offset arrangements. Expenses net of all reductions represent the net expenses paid by the class.
H Annualized
I Amount does not include the portfolio activity of any underlying Fidelity Central Funds.
See accompanying notes which are an integral part of the financial statements.
Notes to Financial Statements (Unaudited)
For the period ended April 30, 2018
1. Organization.
Fidelity Canada Fund (the Fund) is a fund of Fidelity Investment Trust (the Trust) and is authorized to issue an unlimited number of shares. The Trust is registered under the Investment Company Act of 1940, as amended (the 1940 Act), as an open-end management investment company organized as a Massachusetts business trust. The Fund offers Class A, Class M, Class C, Canada and Class I shares, each of which has equal rights as to assets and voting privileges. Each class has exclusive voting rights with respect to matters that affect that class.
2. Investments in Fidelity Central Funds.
The Fund invests in Fidelity Central Funds, which are open-end investment companies generally available only to other investment companies and accounts managed by the investment adviser and its affiliates. The Fund's Schedule of Investments lists each of the Fidelity Central Funds held as of period end, if any, as an investment of the Fund, but does not include the underlying holdings of each Fidelity Central Fund. As an Investing Fund, the Fund indirectly bears its proportionate share of the expenses of the underlying Fidelity Central Funds.
The Money Market Central Funds seek preservation of capital and current income and are managed by Fidelity Investments Money Management, Inc. (FIMM), an affiliate of the investment adviser. Annualized expenses of the Money Market Central Funds as of their most recent shareholder report date are less than .005%.
A complete unaudited list of holdings for each Fidelity Central Fund is available upon request or at the Securities and Exchange Commission (the SEC) website at www.sec.gov. In addition, the financial statements of the Fidelity Central Funds are available on the SEC website or upon request.
3. Significant Accounting Policies.
The Fund is an investment company and applies the accounting and reporting guidance of the Financial Accounting Standards Board (FASB) Accounting Standards Codification Topic 946 Financial Services – Investments Companies. The financial statements have been prepared in conformity with accounting principles generally accepted in the United States of America (GAAP), which require management to make certain estimates and assumptions at the date of the financial statements. Actual results could differ from those estimates. Subsequent events, if any, through the date that the financial statements were issued have been evaluated in the preparation of the financial statements. The following summarizes the significant accounting policies of the Fund:
Investment Valuation. Investments are valued as of 4:00 p.m. Eastern time on the last calendar day of the period. The Board of Trustees (the Board) has delegated the day to day responsibility for the valuation of the Fund's investments to the Fair Value Committee (the Committee) established by the Fund's investment adviser. In accordance with valuation policies and procedures approved by the Board, the Fund attempts to obtain prices from one or more third party pricing vendors or brokers to value its investments. When current market prices, quotations or currency exchange rates are not readily available or reliable, investments will be fair valued in good faith by the Committee, in accordance with procedures adopted by the Board. Factors used in determining fair value vary by investment type and may include market or investment specific events. The frequency with which these procedures are used cannot be predicted and they may be utilized to a significant extent. The Committee oversees the Fund's valuation policies and procedures and reports to the Board on the Committee's activities and fair value determinations. The Board monitors the appropriateness of the procedures used in valuing the Fund's investments and ratifies the fair value determinations of the Committee.
The Fund categorizes the inputs to valuation techniques used to value its investments into a disclosure hierarchy consisting of three levels as shown below:
- Level 1 – quoted prices in active markets for identical investments
- Level 2 – other significant observable inputs (including quoted prices for similar investments, interest rates, prepayment speeds, etc.)
- Level 3 – unobservable inputs (including the Fund's own assumptions based on the best information available)
Valuation techniques used to value the Fund's investments by major category are as follows:
Equity securities, including restricted securities, for which market quotations are readily available, are valued at the last reported sale price or official closing price as reported by a third party pricing vendor on the primary market or exchange on which they are traded and are categorized as Level 1 in the hierarchy. In the event there were no sales during the day or closing prices are not available, securities are valued at the last quoted bid price or may be valued using the last available price and are generally categorized as Level 2 in the hierarchy. For foreign equity securities, when market or security specific events arise, comparisons to the valuation of American Depositary Receipts (ADRs), futures contracts, Exchange-Traded Funds (ETFs) and certain indexes as well as quoted prices for similar securities may be used and would be categorized as Level 2 in the hierarchy. Utilizing these techniques may result in transfers between Level 1 and Level 2. For equity securities, including restricted securities, where observable inputs are limited, assumptions about market activity and risk are used and these securities may be categorized as Level 3 in the hierarchy.
Investments in open-end mutual funds, including the Fidelity Central Funds, are valued at their closing net asset value (NAV) each business day and are categorized as Level 1 in the hierarchy.
Changes in valuation techniques may result in transfers in or out of an assigned level within the disclosure hierarchy. The aggregate value of investments by input level as of April 30, 2018 is included at the end of the Fund's Schedule of Investments.
Foreign Currency. The Fund may use foreign currency contracts to facilitate transactions in foreign-denominated securities. Gains and losses from these transactions may arise from changes in the value of the foreign currency or if the counterparties do not perform under the contracts' terms.
Foreign-denominated assets, including investment securities, and liabilities are translated into U.S. dollars at the exchange rates at period end. Purchases and sales of investment securities, income and dividends received and expenses denominated in foreign currencies are translated into U.S. dollars at the exchange rate in effect on the transaction date.
The effects of exchange rate fluctuations on investments are included with the net realized and unrealized gain (loss) on investment securities. Other foreign currency transactions resulting in realized and unrealized gain (loss) are disclosed separately.
Investment Transactions and Income. For financial reporting purposes, the Fund's investment holdings and NAV include trades executed through the end of the last business day of the period. The NAV per share for processing shareholder transactions is calculated as of the close of business of the New York Stock Exchange (NYSE), normally 4:00 p.m. Eastern time and includes trades executed through the end of the prior business day. Gains and losses on securities sold are determined on the basis of identified cost and includes proceeds received from litigation. Dividend income is recorded on the ex-dividend date, except for certain dividends from foreign securities where the ex-dividend date may have passed, which are recorded as soon as the Fund is informed of the ex-dividend date. Non-cash dividends included in dividend income, if any, are recorded at the fair market value of the securities received. Income and capital gain distributions from Fidelity Central Funds, if any, are recorded on the ex-dividend date. Certain distributions received by the Fund represent a return of capital or capital gain. The Fund determines the components of these distributions subsequent to the ex-dividend date, based upon receipt of tax filings or other correspondence relating to the underlying investment. These distributions are recorded as a reduction of cost of investments and/or as a realized gain. Investment income is recorded net of foreign taxes withheld where recovery of such taxes is uncertain.
Class Allocations and Expenses. Investment income, realized and unrealized capital gains and losses, common expenses of the Fund, and certain fund-level expense reductions, if any, are allocated daily on a pro-rata basis to each class based on the relative net assets of each class to the total net assets of the Fund. Each class differs with respect to transfer agent and distribution and service plan fees incurred. Certain expense reductions may also differ by class. For the reporting period, the allocated portion of income and expenses to each class as a percent of its average net assets may vary due to the timing of recording these transactions in relation to fluctuating net assets of the classes. Expenses directly attributable to a fund are charged to that fund. Expenses attributable to more than one fund are allocated among the respective funds on the basis of relative net assets or other appropriate methods. Expense estimates are accrued in the period to which they relate and adjustments are made when actual amounts are known.
Income Tax Information and Distributions to Shareholders. Each year, the Fund intends to qualify as a regulated investment company under Subchapter M of the Internal Revenue Code, including distributing substantially all of its taxable income and realized gains. As a result, no provision for U.S. Federal income taxes is required. The Fund files a U.S. federal tax return, in addition to state and local tax returns as required. The Fund's federal income tax returns are subject to examination by the Internal Revenue Service (IRS) for a period of three fiscal years after they are filed. State and local tax returns may be subject to examination for an additional fiscal year depending on the jurisdiction. Foreign taxes are provided for based on the Fund's understanding of the tax rules and rates that exist in the foreign markets in which it invests.
Distributions are declared and recorded on the ex-dividend date. Income and capital gain distributions are declared separately for each class. Income and capital gain distributions are determined in accordance with income tax regulations, which may differ from GAAP.
Capital accounts within the financial statements are adjusted for permanent book-tax differences. These adjustments have no impact on net assets or the results of operations. Capital accounts are not adjusted for temporary book-tax differences which will reverse in a subsequent period.
Book-tax differences are primarily due to foreign currency transactions, passive foreign investment companies (PFIC), capital loss carryforwards, deferred trustees compensation and losses deferred due to wash sales.
As of period end, the cost and unrealized appreciation (depreciation) in securities, and derivatives if applicable, for federal income tax purposes were as follows:
| Gross unrealized appreciation | $311,941,162 |
| Gross unrealized depreciation | (22,518,838) |
| Net unrealized appreciation (depreciation) | $289,422,324 |
| Tax cost | $829,882,409 |
Short-Term Trading (Redemption) Fees. Shares held by investors in the Fund less than 90 days may have been subject to a redemption fee equal to 1.50% of the NAV of shares redeemed. All redemption fees, which reduce the proceeds of the shareholder redemption, are retained by the Fund and accounted for as an addition to paid in capital. In November 2017, the Board of Trustees approved the elimination of these redemption fees effective December 18, 2017.
Restricted Securities. The Fund may invest in securities that are subject to legal or contractual restrictions on resale. These securities generally may be resold in transactions exempt from registration or to the public if the securities are registered. Disposal of these securities may involve time-consuming negotiations and expense, and prompt sale at an acceptable price may be difficult. Information regarding restricted securities is included at the end of the Fund's Schedule of Investments.
4. Purchases and Sales of Investments.
Purchases and sales of securities, other than short-term securities, aggregated $150,799,819 and $248,259,849, respectively.
5. Fees and Other Transactions with Affiliates.
Management Fee. Fidelity Management & Research Company (the investment adviser) and its affiliates provide the Fund with investment management related services for which the Fund pays a monthly management fee. The management fee is the sum of an individual fund fee rate that is based on an annual rate of .45% of the Fund's average net assets and an annualized group fee rate that averaged .24% during the period. The group fee rate is based upon the average net assets of all the mutual funds advised by the investment adviser, including any mutual funds previously advised by the investment adviser that are currently advised by Fidelity SelectCo, LLC, an affiliate of the investment adviser. The group fee rate decreases as assets under management increase and increases as assets under management decrease. In addition, the management fee is subject to a performance adjustment (up to a maximum of +/- .20% of the Fund's average net assets over a 36 month performance period). The upward or downward adjustment to the management fee is based on the relative investment performance of Canada as compared to its benchmark index, the S&P/TSX Composite Index, over the same 36 month performance period. For the reporting period, the total annualized management fee rate, including the performance adjustment, was .66% of the Fund's average net assets. The performance adjustment included in the management fee rate may be higher or lower than the maximum performance adjustment rate due to the difference between the average net assets for the reporting and performance periods.
Distribution and Service Plan Fees. In accordance with Rule 12b-1 of the 1940 Act, the Fund has adopted separate Distribution and Service Plans for each class of shares. Certain classes pay Fidelity Distributors Corporation (FDC), an affiliate of the investment adviser, separate Distribution and Service Fees, each of which is based on an annual percentage of each class' average net assets. In addition, FDC may pay financial intermediaries for selling shares of the Fund and providing shareholder support services. For the period, the Distribution and Service Fee rates, total fees and amounts retained by FDC were as follows:
| Distribution Fee | Service Fee | Total Fees | Retained by FDC | |
| Class A | -% | .25% | $44,677 | $691 |
| Class M | .25% | .25% | 24,310 | 297 |
| Class C | .75% | .25% | 74,675 | 2,567 |
| $143,662 | $3,555 |
Sales Load. FDC may receive a front-end sales charge of up to 5.75% for selling Class A shares and 3.50% for selling Class M shares, some of which is paid to financial intermediaries for selling shares of the Fund. Depending on the holding period, FDC may receive contingent deferred sales charges levied on Class A, Class M and Class C redemptions. The deferred sales charges are 1.00% for Class C shares, 1.00% for certain purchases of Class A shares and .25% for certain purchases of Class M shares.
For the period, sales charge amounts retained by FDC were as follows:
| Retained by FDC | |
| Class A | $3,864 |
| Class M | 1,224 |
| Class C(a) | 385 |
| $5,473 |
(a) When Class C shares are initially sold, FDC pays commissions from its own resources to financial intermediaries through which the sales are made.
Transfer Agent Fees. Fidelity Investments Institutional Operations Company, Inc., (FIIOC), an affiliate of the investment adviser, is the transfer, dividend disbursing and shareholder servicing agent for each class of the Fund. FIIOC receives account fees and asset-based fees that vary according to the account size and type of account of the shareholders of the respective classes of the Fund. FIIOC pays for typesetting, printing and mailing of shareholder reports, except proxy statements.
For the period, transfer agent fees for each class were as follows:
| Amount | % of Class-Level Average Net Assets(a) | |
| Class A | $48,031 | .27 |
| Class M | 15,624 | .32 |
| Class C | 18,565 | .25 |
| Canada | 1,083,299 | .20 |
| Class I | 23,691 | .16 |
| $1,189,210 |
(a) Annualized
Accounting and Security Lending Fees. Fidelity Service Company, Inc. (FSC), an affiliate of the investment adviser, maintains the Fund's accounting records. The accounting fee is based on the level of average net assets for each month. Under a separate contract, FSC administers the security lending program. The security lending fee is based on the number and duration of lending transactions. For the period, the fees were equivalent to an annualized rate of .05%.
Interfund Trades. The Fund may purchase from or sell securities to other Fidelity Funds under procedures adopted by the Board. The procedures have been designed to ensure these interfund trades are executed in accordance with Rule 17a-7 of the 1940 Act. Interfund trades are included within the respective purchases and sales amounts shown in the Purchases and Sales of Investments note.
6. Committed Line of Credit.
The Fund participates with other funds managed by the investment adviser or an affiliate in a $4.25 billion credit facility (the "line of credit") to be utilized for temporary or emergency purposes to fund shareholder redemptions or for other short-term liquidity purposes. The Fund has agreed to pay commitment fees on its pro-rata portion of the line of credit, which amounted to $1,714 and is reflected in Miscellaneous expenses on the Statement of Operations. During the period, the Fund did not borrow on this line of credit.
7. Security Lending.
The Fund lends portfolio securities through a lending agent from time to time in order to earn additional income. For equity securities, a lending agent is used and may loan securities to certain qualified borrowers, including Fidelity Capital Markets (FCM), a broker-dealer affiliated with the Fund. On the settlement date of the loan, the Fund receives collateral (in the form of U.S. Treasury obligations, letters of credit and/or cash) against the loaned securities and maintains collateral in an amount not less than 100% of the market value of the loaned securities during the period of the loan. The market value of the loaned securities is determined at the close of business of the Fund and any additional required collateral is delivered to the Fund on the next business day. The Fund or borrower may terminate the loan at any time, and if the borrower defaults on its obligation to return the securities loaned because of insolvency or other reasons, the Fund may apply collateral received from the borrower against the obligation. The Fund may experience delays and costs in recovering the securities loaned. Any cash collateral received is invested in the Fidelity Securities Lending Cash Central Fund. The value of loaned securities and cash collateral at period end are disclosed on the Fund's Statement of Assets and Liabilities. Security lending income represents the income earned on investing cash collateral, less rebates paid to borrowers and any lending agent fees associated with the loan, plus any premium payments received for lending certain types of securities. Security lending income is presented in the Statement of Operations as a component of income from Fidelity Central Funds. Total security lending income during the period amounted to $80,957. During the period, there were no securities loaned to FCM.
8. Expense Reductions.
Commissions paid to certain brokers with whom the investment adviser, or its affiliates, places trades on behalf of the Fund include an amount in addition to trade execution, which may be rebated back to the Fund to offset certain expenses. This amount totaled $44,134 for the period.
In addition, during the period the investment adviser reimbursed and/or waived a portion of fund-level operating expenses in the amount of $6,029.
9. Distributions to Shareholders.
Distributions to shareholders of each class were as follows:
| Six months ended April 30, 2018 | Year ended October 31, 2017 | |
| From net investment income | ||
| Class A | $402,298 | $406,836 |
| Class M | 75,402 | 78,661 |
| Class C | 54,494 | 39,905 |
| Canada | 15,730,428 | 15,352,959 |
| Class I | 425,966 | 565,020 |
| Total | $16,688,588 | $16,443,381 |
| From net realized gain | ||
| Class A | $332,434 | $168,842 |
| Class M | 91,347 | 43,752 |
| Class C | 144,231 | 71,450 |
| Canada | 9,948,981 | 4,723,987 |
| Class I | 271,170 | 160,945 |
| Total | $10,788,163 | $5,168,976 |
10. Share Transactions.
Share transactions for each class were as follows and may contain automatic conversions between classes or exchanges between affiliated funds:
| Shares | Shares | Dollars | Dollars | |
| Six months ended April 30, 2018 | Year ended October 31, 2017 | Six months ended April 30, 2018 | Year ended October 31, 2017 | |
| Class A | ||||
| Shares sold | 23,105 | 63,470 | $1,227,684 | $3,161,163 |
| Reinvestment of distributions | 12,714 | 10,631 | 672,936 | 525,595 |
| Shares redeemed | (91,263) | (297,916) | (4,815,773) | (14,925,894) |
| Net increase (decrease) | (55,444) | (223,815) | $(2,915,153) | $(11,239,136) |
| Class M | ||||
| Shares sold | 4,704 | 24,195 | $246,861 | $1,198,423 |
| Reinvestment of distributions | 3,154 | 2,464 | 166,353 | 121,397 |
| Shares redeemed | (26,077) | (67,009) | (1,386,007) | (3,403,775) |
| Net increase (decrease) | (18,219) | (40,350) | $(972,793) | $(2,083,955) |
| Class C | ||||
| Shares sold | 7,594 | 25,680 | $387,627 | $1,254,827 |
| Reinvestment of distributions | 3,474 | 1,995 | 180,309 | 96,717 |
| Shares redeemed | (45,537) | (119,795) | (2,349,937) | (5,862,219) |
| Net increase (decrease) | (34,469) | (92,120) | $(1,782,001) | $(4,510,675) |
| Canada | ||||
| Shares sold | 336,931 | 1,830,107 | $18,046,020 | $91,494,332 |
| Reinvestment of distributions | 457,772 | 381,896 | 24,289,363 | 18,930,598 |
| Shares redeemed | (2,160,635) | (6,928,660) | (115,553,641) | (353,430,502) |
| Net increase (decrease) | (1,365,932) | (4,716,657) | $(73,218,258) | $(243,005,572) |
| Class I | ||||
| Shares sold | 76,604 | 249,628 | $4,082,696 | $12,551,193 |
| Reinvestment of distributions | 12,538 | 14,338 | 663,882 | 709,005 |
| Shares redeemed | (138,251) | (554,299) | (7,270,501) | (29,406,590) |
| Net increase (decrease) | (49,109) | (290,333) | $(2,523,923) | $(16,146,392) |
11. Other.
The Fund's organizational documents provide former and current trustees and officers with a limited indemnification against liabilities arising in connection with the performance of their duties to the Fund. In the normal course of business, the Fund may also enter into contracts that provide general indemnifications. The Fund's maximum exposure under these arrangements is unknown as this would be dependent on future claims that may be made against the Fund. The risk of material loss from such claims is considered remote.
Fidelity® China Region Fund
Investment Summary (Unaudited)
Geographic Diversification (% of fund's net assets)
| As of April 30, 2018 | ||
| Cayman Islands | 37.5% | |
| China | 33.4% | |
| Taiwan | 12.8% | |
| Hong Kong | 7.7% | |
| United States of America* | 3.3% | |
| South Africa | 1.6% | |
| Bailiwick of Jersey | 1.2% | |
| Italy | 0.8% | |
| British Virgin Islands | 0.8% | |
| Other | 0.9% | |
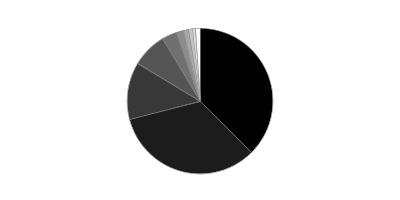
* Includes Short-Term investments and Net Other Assets (Liabilities).
Percentages are based on country or territory of incorporation and are adjusted for the effect of futures contracts, if applicable.
Asset Allocation as of April 30, 2018
| % of fund's net assets | |
| Stocks | 96.7 |
| Short-Term Investments and Net Other Assets (Liabilities) | 3.3 |
Top Ten Stocks as of April 30, 2018
| % of fund's net assets | |
| Tencent Holdings Ltd. (Internet Software & Services) | 11.2 |
| Alibaba Group Holding Ltd. sponsored ADR (Internet Software & Services) | 8.6 |
| Taiwan Semiconductor Manufacturing Co. Ltd. (Semiconductors & Semiconductor Equipment) | 5.4 |
| AIA Group Ltd. (Insurance) | 3.1 |
| China Construction Bank Corp. (H Shares) (Banks) | 2.4 |
| CNOOC Ltd. (Oil, Gas & Consumable Fuels) | 2.1 |
| Ping An Insurance (Group) Co. of China Ltd. (H Shares) (Insurance) | 2.0 |
| NetEase, Inc. ADR (Internet Software & Services) | 1.9 |
| Geely Automobile Holdings Ltd. (Automobiles) | 1.8 |
| Industrial & Commercial Bank of China Ltd. (H Shares) (Banks) | 1.7 |
| 40.2 |
Top Market Sectors as of April 30, 2018
| % of fund's net assets | |
| Information Technology | 42.0 |
| Consumer Discretionary | 16.3 |
| Financials | 13.0 |
| Health Care | 5.0 |
| Consumer Staples | 5.0 |
| Materials | 4.8 |
| Industrials | 4.2 |
| Energy | 4.0 |
| Utilities | 1.4 |
| Real Estate | 1.0 |
Market Sectors may include more than one industry category.
The Fund may invest up to 35% of its total assets in any industry that represents more than 20% of the Hong Kong, Taiwanese and Chinese markets. As of April 30, 2018, the Fund did not have more than 25% of its total assets invested in any one industry.
Fidelity® China Region Fund
Schedule of Investments April 30, 2018 (Unaudited)
Showing Percentage of Net Assets
| Common Stocks - 96.0% | |||
| Shares | Value | ||
| CONSUMER DISCRETIONARY - 15.6% | |||
| Automobiles - 2.5% | |||
| Geely Automobile Holdings Ltd. | 10,384,000 | $27,310,251 | |
| Guangzhou Automobile Group Co. Ltd. (H Shares) | 5,208,000 | 9,539,576 | |
| 36,849,827 | |||
| Diversified Consumer Services - 2.4% | |||
| New Oriental Education & Technology Group, Inc. sponsored ADR | 229,800 | 20,645,232 | |
| TAL Education Group ADR | 206,600 | 7,524,372 | |
| ZTO Express (Cayman), Inc. sponsored ADR | 471,400 | 7,778,100 | |
| 35,947,704 | |||
| Hotels, Restaurants & Leisure - 1.1% | |||
| Melco Crown Entertainment Ltd. sponsored ADR | 400,000 | 12,484,000 | |
| Summit Ascent Holdings Ltd. (a)(b) | 31,652,000 | 3,781,470 | |
| 16,265,470 | |||
| Household Durables - 3.2% | |||
| Hangzhou Robam Appliances Co. Ltd. Class A | 1,408,391 | 7,411,605 | |
| Midea Group Co. Ltd. Class A | 2,123,600 | 17,266,039 | |
| Sundart Holdings Ltd. | 20,000,000 | 11,678,743 | |
| Techtronic Industries Co. Ltd. | 1,913,500 | 11,209,650 | |
| 47,566,037 | |||
| Internet & Direct Marketing Retail - 2.7% | |||
| Ctrip.com International Ltd. ADR (b) | 99,400 | 4,065,460 | |
| JD.com, Inc. sponsored ADR (b) | 525,700 | 19,193,307 | |
| Vipshop Holdings Ltd. ADR (b) | 1,073,800 | 16,622,424 | |
| 39,881,191 | |||
| Media - 1.6% | |||
| Naspers Ltd. Class N | 99,700 | 24,288,870 | |
| Specialty Retail - 0.4% | |||
| Chow Tai Fook Jewellery Group Ltd. | 5,333,800 | 6,876,690 | |
| Textiles, Apparel & Luxury Goods - 1.7% | |||
| Prada SpA | 2,500,000 | 12,684,764 | |
| Shenzhou International Group Holdings Ltd. | 1,191,000 | 13,001,237 | |
| 25,686,001 | |||
| TOTAL CONSUMER DISCRETIONARY | 233,361,790 | ||
| CONSUMER STAPLES - 5.0% | |||
| Beverages - 4.6% | |||
| Jiangsu Yanghe Brewery Joint-Stock Co. Ltd. Class A | 1,242,989 | 21,901,904 | |
| Kweichow Moutai Co. Ltd. (A Shares) | 204,882 | 21,334,163 | |
| Wuliangye Yibin Co. Ltd. Class A | 2,363,756 | 25,285,717 | |
| 68,521,784 | |||
| Food & Staples Retailing - 0.4% | |||
| COFCO Meat Holdings Ltd. (a)(b) | 34,841,000 | 5,397,830 | |
| TOTAL CONSUMER STAPLES | 73,919,614 | ||
| ENERGY - 4.0% | |||
| Energy Equipment & Services - 1.3% | |||
| China Oilfield Services Ltd. (H Shares) | 19,464,000 | 19,419,153 | |
| Oil, Gas & Consumable Fuels - 2.7% | |||
| CNOOC Ltd. | 18,768,000 | 31,750,083 | |
| PetroChina Co. Ltd. (H Shares) | 10,832,000 | 7,981,768 | |
| 39,731,851 | |||
| TOTAL ENERGY | 59,151,004 | ||
| FINANCIALS - 13.0% | |||
| Banks - 4.1% | |||
| China Construction Bank Corp. (H Shares) | 33,810,000 | 35,421,353 | |
| Industrial & Commercial Bank of China Ltd. (H Shares) | 29,680,000 | 26,055,526 | |
| 61,476,879 | |||
| Capital Markets - 1.3% | |||
| CITIC Securities Co. Ltd. (H Shares) | 4,092,500 | 9,976,418 | |
| Shanghai International Airport Co. Ltd. ELS (UBS Warrant Programme) warrants 5/11/18 (b)(c) | 1,119,000 | 8,735,642 | |
| 18,712,060 | |||
| Insurance - 7.6% | |||
| AIA Group Ltd. | 5,240,400 | 46,834,503 | |
| China Life Insurance Co. Ltd. (H Shares) | 5,682,000 | 16,113,925 | |
| China Pacific Insurance (Group) Co. Ltd. (H Shares) | 4,724,600 | 20,848,141 | |
| Ping An Insurance (Group) Co. of China Ltd. (H Shares) | 3,041,500 | 29,719,712 | |
| 113,516,281 | |||
| TOTAL FINANCIALS | 193,705,220 | ||
| HEALTH CARE - 5.0% | |||
| Health Care Providers & Services - 0.4% | |||
| China Resources Phoenix Health | 4,880,500 | 6,379,114 | |
| Pharmaceuticals - 4.6% | |||
| CSPC Pharmaceutical Group Ltd. | 10,164,000 | 25,888,305 | |
| Jiangsu Hengrui Medicine Co. Ltd. (A Shares) | 32 | 419 | |
| Tonghua Dongbao Pharmaceutical Co. Ltd. Class A | 4,390,487 | 19,861,505 | |
| YiChang HEC ChangJiang Pharmaceutical Co. Ltd. | 2,908,400 | 13,811,016 | |
| Yunnan Baiyao Group Co. Ltd. | 559,400 | 8,353,843 | |
| 67,915,088 | |||
| TOTAL HEALTH CARE | 74,294,202 | ||
| INDUSTRIALS - 4.2% | |||
| Commercial Services & Supplies - 0.8% | |||
| Focused Photonics Hangzhou, Inc. | 2,643,902 | 11,587,018 | |
| Construction & Engineering - 0.1% | |||
| China State Construction International Holdings Ltd. | 1,126,250 | 1,464,748 | |
| Machinery - 2.3% | |||
| Han's Laser Technology Industry Group Co. Ltd. | 821,758 | 6,037,828 | |
| Sany Heavy Industry Co. Ltd. Class A | 7,886,277 | 10,851,282 | |
| Shenzhen Inovance Technology Co. Ltd. Class A | 2,692,250 | 13,931,949 | |
| Zhengzhou Yutong Bus Co. Ltd. | 1,399,918 | 4,522,644 | |
| 35,343,703 | |||
| Transportation Infrastructure - 1.0% | |||
| Shanghai International Airport Co. Ltd. (A Shares) | 1,843,822 | 14,481,643 | |
| TOTAL INDUSTRIALS | 62,877,112 | ||
| INFORMATION TECHNOLOGY - 42.0% | |||
| Communications Equipment - 0.8% | |||
| Nanfang Communication Holdings Ltd. | 20,308,000 | 11,623,062 | |
| Electronic Equipment & Components - 4.7% | |||
| AVIC Jonhon OptronicTechnology Co. Ltd. | 2,918,766 | 17,911,154 | |
| Chroma ATE, Inc. | 3,145,000 | 15,785,803 | |
| Hangzhou Hikvision Digital Technology Co. Ltd. Class A | 3,655,950 | 22,143,658 | |
| Hon Hai Precision Industry Co. Ltd. (Foxconn) | 3,778,400 | 10,490,559 | |
| Lens Technology Co. Ltd. Class A | 1,006,855 | 3,353,692 | |
| 69,684,866 | |||
| Internet Software & Services - 23.8% | |||
| 58.com, Inc. ADR (b) | 219,500 | 19,182,105 | |
| Alibaba Group Holding Ltd. sponsored ADR (b) | 715,300 | 127,709,662 | |
| Momo, Inc. ADR (b) | 300,000 | 10,470,000 | |
| NetEase, Inc. ADR | 113,600 | 29,203,152 | |
| Tencent Holdings Ltd. | 3,405,300 | 167,414,520 | |
| Weibo Corp. sponsored ADR (a)(b) | 9,970 | 1,141,764 | |
| 355,121,203 | |||
| Semiconductors & Semiconductor Equipment - 12.0% | |||
| ASE Industrial Holding Co. Ltd. | 1,697,500 | 4,571,389 | |
| ASM Pacific Technology Ltd. | 800,300 | 10,966,780 | |
| GlobalWafers Co. Ltd. | 1,109,500 | 17,867,353 | |
| Himax Technologies, Inc. sponsored ADR | 800,000 | 5,456,000 | |
| Nanya Technology Corp. | 7,689,000 | 23,892,552 | |
| Silergy Corp. | 457,000 | 9,539,881 | |
| Sino-American Silicon Products, Inc. | 3,751,000 | 16,070,471 | |
| Taiwan Semiconductor Manufacturing Co. Ltd. | 10,627,000 | 80,806,111 | |
| United Microelectronics Corp. | 18,963,000 | 10,208,106 | |
| 179,378,643 | |||
| Technology Hardware, Storage & Peripherals - 0.7% | |||
| ADLINK Technology, Inc. | 3,682,844 | 7,538,787 | |
| Advantech Co. Ltd. | 380,587 | 2,608,101 | |
| 10,146,888 | |||
| TOTAL INFORMATION TECHNOLOGY | 625,954,662 | ||
| MATERIALS - 4.8% | |||
| Construction Materials - 2.2% | |||
| BBMG Corp. (H Shares) | 33,657,000 | 15,351,237 | |
| West China Cement Ltd. | 85,964,000 | 17,435,723 | |
| 32,786,960 | |||
| Metals & Mining - 2.6% | |||
| Aluminum Corp. of China Ltd. (H Shares) (b) | 9,772,000 | 5,519,103 | |
| China Molybdenum Co. Ltd. (H Shares) | 9,999,000 | 7,513,927 | |
| Jiangxi Copper Co. Ltd. (H Shares) | 4,214,000 | 5,991,031 | |
| Zhaojin Mining Industry Co. Ltd. (H Shares) (a) | 8,844,000 | 6,923,079 | |
| Zijin Mng Group Co. Ltd. (H Shares) | 29,330,000 | 13,304,054 | |
| 39,251,194 | |||
| TOTAL MATERIALS | 72,038,154 | ||
| REAL ESTATE - 1.0% | |||
| Real Estate Management & Development - 1.0% | |||
| Beijing Capital Land Ltd. (H Shares) | 27,000,000 | 14,379,194 | |
| UTILITIES - 1.4% | |||
| Independent Power and Renewable Electricity Producers - 1.4% | |||
| Canvest Environmental Protection Group Co. Ltd. | 16,700,000 | 9,265,210 | |
| Huaneng Renewables Corp. Ltd. (H Shares) | 26,040,000 | 11,564,436 | |
| 20,829,646 | |||
| TOTAL COMMON STOCKS | |||
| (Cost $1,006,665,688) | 1,430,510,598 | ||
| Convertible Preferred Stocks - 0.7% | |||
| CONSUMER DISCRETIONARY - 0.7% | |||
| Internet & Direct Marketing Retail - 0.7% | |||
| China Internet Plus Holdings Ltd. Series A-11 (b)(d)(e) | |||
| (Cost $6,268,244) | 1,983,088 | 11,083,598 | |
| Money Market Funds - 3.6% | |||
| Fidelity Cash Central Fund, 1.74% (f) | 50,745,496 | 50,755,645 | |
| Fidelity Securities Lending Cash Central Fund 1.74% (f)(g) | 2,919,083 | 2,919,375 | |
| TOTAL MONEY MARKET FUNDS | |||
| (Cost $53,675,021) | 53,675,020 | ||
| TOTAL INVESTMENT IN SECURITIES - 100.3% | |||
| (Cost $1,066,608,953) | 1,495,269,216 | ||
| NET OTHER ASSETS (LIABILITIES) - (0.3)% | (4,818,742) | ||
| NET ASSETS - 100% | $1,490,450,474 |
Security Type Abbreviations
ELS – Equity-Linked Security
Legend
(a) Security or a portion of the security is on loan at period end.
(b) Non-income producing
(c) Security exempt from registration under Rule 144A of the Securities Act of 1933. These securities may be resold in transactions exempt from registration, normally to qualified institutional buyers. At the end of the period, the value of these securities amounted to $8,735,642 or 0.6% of net assets.
(d) Restricted securities - Investment in securities not registered under the Securities Act of 1933 (excluding 144A issues). At the end of the period, the value of restricted securities (excluding 144A issues) amounted to $11,083,598 or 0.7% of net assets.
(e) Level 3 security
(f) Affiliated fund that is generally available only to investment companies and other accounts managed by Fidelity Investments. The rate quoted is the annualized seven-day yield of the fund at period end. A complete unaudited listing of the fund's holdings as of its most recent quarter end is available upon request. In addition, each Fidelity Central Fund's financial statements are available on the SEC's website or upon request.
(g) Investment made with cash collateral received from securities on loan.
Additional information on each restricted holding is as follows:
| Security | Acquisition Date | Acquisition Cost |
| China Internet Plus Holdings Ltd. Series A-11 | 1/26/15 | $6,268,244 |
Affiliated Central Funds
Information regarding fiscal year to date income earned by the Fund from investments in Fidelity Central Funds is as follows:
| Fund | Income earned |
| Fidelity Cash Central Fund | $532,192 |
| Fidelity Securities Lending Cash Central Fund | 146,593 |
| Total | $678,785 |
Amounts in the income column in the above table include any capital gain distributions from underlying funds, which are presented in the corresponding line-item in the Statement of Operations if applicable.
Investment Valuation
The following is a summary of the inputs used, as of April 30, 2018, involving the Fund's assets and liabilities carried at fair value. The inputs or methodology used for valuing securities may not be an indication of the risk associated with investing in those securities. For more information on valuation inputs, and their aggregation into the levels used below, please refer to the Investment Valuation section in the accompanying Notes to Financial Statements.
| Valuation Inputs at Reporting Date: | ||||
| Description | Total | Level 1 | Level 2 | Level 3 |
| Investments in Securities: | ||||
| Equities: | ||||
| Consumer Discretionary | $244,445,388 | $88,312,895 | $145,048,895 | $11,083,598 |
| Consumer Staples | 73,919,614 | -- | 73,919,614 | -- |
| Energy | 59,151,004 | -- | 59,151,004 | -- |
| Financials | 193,705,220 | -- | 193,705,220 | -- |
| Health Care | 74,294,202 | -- | 74,294,202 | -- |
| Industrials | 62,877,112 | -- | 62,877,112 | -- |
| Information Technology | 625,954,662 | 193,162,683 | 432,791,979 | -- |
| Materials | 72,038,154 | -- | 72,038,154 | -- |
| Real Estate | 14,379,194 | -- | 14,379,194 | -- |
| Utilities | 20,829,646 | -- | 20,829,646 | -- |
| Money Market Funds | 53,675,020 | 53,675,020 | -- | -- |
| Total Investments in Securities: | $1,495,269,216 | $335,150,598 | $1,149,035,020 | $11,083,598 |
The following is a summary of transfers between Level 1 and Level 2 for the period ended April 30, 2018. Transfers are assumed to have occurred at the beginning of the period, and are primarily attributable to the valuation techniques used for foreign equity securities, as discussed in the accompanying Notes to Financial Statements:
| Transfers | Total |
| Level 1 to Level 2 | $685,550,361 |
| Level 2 to Level 1 | $0 |
See accompanying notes which are an integral part of the financial statements.
Fidelity® China Region Fund
Financial Statements
Statement of Assets and Liabilities
| April 30, 2018 (Unaudited) | ||
| Assets | ||
| Investment in securities, at value (including securities loaned of $2,576,843) — See accompanying schedule: Unaffiliated issuers (cost $1,012,933,932) | $1,441,594,196 | |
| Fidelity Central Funds (cost $53,675,021) | 53,675,020 | |
| Total Investment in Securities (cost $1,066,608,953) | $1,495,269,216 | |
| Receivable for fund shares sold | 844,206 | |
| Dividends receivable | 807,504 | |
| Distributions receivable from Fidelity Central Funds | 112,286 | |
| Prepaid expenses | 617 | |
| Other receivables | 161,706 | |
| Total assets | 1,497,195,535 | |
| Liabilities | ||
| Payable for fund shares redeemed | $2,303,254 | |
| Accrued management fee | 877,846 | |
| Distribution and service plan fees payable | 24,993 | |
| Other affiliated payables | 288,011 | |
| Other payables and accrued expenses | 331,637 | |
| Collateral on securities loaned | 2,919,320 | |
| Total liabilities | 6,745,061 | |
| Net Assets | $1,490,450,474 | |
| Net Assets consist of: | ||
| Paid in capital | $1,214,114,301 | |
| Accumulated net investment loss | (5,437,479) | |
| Accumulated undistributed net realized gain (loss) on investments and foreign currency transactions | (146,884,586) | |
| Net unrealized appreciation (depreciation) on investments and assets and liabilities in foreign currencies | 428,658,238 | |
| Net Assets | $1,490,450,474 | |
| Calculation of Maximum Offering Price | ||
| Class A: | ||
| Net Asset Value and redemption price per share ($32,393,839 ÷ 909,583 shares) | $35.61 | |
| Maximum offering price per share (100/94.25 of $35.61) | $37.78 | |
| Class M: | ||
| Net Asset Value and redemption price per share ($12,003,073 ÷ 338,578 shares) | $35.45 | |
| Maximum offering price per share (100/96.50 of $35.45) | $36.74 | |
| Class C: | ||
| Net Asset Value and offering price per share ($15,043,929 ÷ 433,317 shares)(a) | $34.72 | |
| China Region: | ||
| Net Asset Value, offering price and redemption price per share ($1,399,025,072 ÷ 38,823,939 shares) | $36.04 | |
| Class I: | ||
| Net Asset Value, offering price and redemption price per share ($31,984,561 ÷ 893,961 shares) | $35.78 |
(a) Redemption price per share is equal to net asset value less any applicable contingent deferred sales charge.
See accompanying notes which are an integral part of the financial statements.
Statement of Operations
| Six months ended April 30, 2018 (Unaudited) | ||
| Investment Income | ||
| Dividends | $1,349,084 | |
| Income from Fidelity Central Funds (including $146,593 from security lending) | 678,785 | |
| Income before foreign taxes withheld | 2,027,869 | |
| Less foreign taxes withheld | (89,757) | |
| Total income | 1,938,112 | |
| Expenses | ||
| Management fee | $5,312,048 | |
| Transfer agent fees | 1,346,929 | |
| Distribution and service plan fees | 151,212 | |
| Accounting and security lending fees | 345,879 | |
| Custodian fees and expenses | 191,735 | |
| Independent trustees' fees and expenses | 2,965 | |
| Registration fees | 108,289 | |
| Audit | 44,555 | |
| Legal | 2,497 | |
| Interest | 2,235 | |
| Miscellaneous | 4,384 | |
| Total expenses before reductions | 7,512,728 | |
| Expense reductions | (233,775) | 7,278,953 |
| Net investment income (loss) | (5,340,841) | |
| Realized and Unrealized Gain (Loss) | ||
| Net realized gain (loss) on: | ||
| Investment securities: | ||
| Unaffiliated issuers | (6,058,897) | |
| Fidelity Central Funds | 351 | |
| Foreign currency transactions | 8,100 | |
| Total net realized gain (loss) | (6,050,446) | |
| Change in net unrealized appreciation (depreciation) on: | ||
| Investment securities: | ||
| Unaffiliated issuers | 69,149,781 | |
| Fidelity Central Funds | (366) | |
| Assets and liabilities in foreign currencies | 774 | |
| Total change in net unrealized appreciation (depreciation) | 69,150,189 | |
| Net gain (loss) | 63,099,743 | |
| Net increase (decrease) in net assets resulting from operations | $57,758,902 |
See accompanying notes which are an integral part of the financial statements.
Statement of Changes in Net Assets
| Six months ended April 30, 2018 (Unaudited) | Year ended October 31, 2017 | |
| Increase (Decrease) in Net Assets | ||
| Operations | ||
| Net investment income (loss) | $(5,340,841) | $6,291,196 |
| Net realized gain (loss) | (6,050,446) | 78,315,721 |
| Change in net unrealized appreciation (depreciation) | 69,150,189 | 266,749,225 |
| Net increase (decrease) in net assets resulting from operations | 57,758,902 | 351,356,142 |
| Distributions to shareholders from net investment income | (5,632,791) | (10,635,865) |
| Distributions to shareholders from net realized gain | – | (1,988,966) |
| Total distributions | (5,632,791) | (12,624,831) |
| Share transactions - net increase (decrease) | 57,326,531 | (22,198,615) |
| Redemption fees | 88,492 | 258,175 |
| Total increase (decrease) in net assets | 109,541,134 | 316,790,871 |
| Net Assets | ||
| Beginning of period | 1,380,909,340 | 1,064,118,469 |
| End of period | $1,490,450,474 | $1,380,909,340 |
| Other Information | ||
| Undistributed net investment income end of period | $– | $5,536,153 |
| Accumulated net investment loss end of period | $(5,437,479) | $– |
See accompanying notes which are an integral part of the financial statements.
Financial Highlights
Fidelity China Region Fund Class A
| Six months ended (Unaudited) April 30, | Years endedOctober 31, | |||||
| 2018 | 2017 | 2016 | 2015 | 2014 | 2013 | |
| Selected Per–Share Data | ||||||
| Net asset value, beginning of period | $34.22 | $25.46 | $29.34 | $34.18 | $35.56 | $28.53 |
| Income from Investment Operations | ||||||
| Net investment income (loss)A | (.18) | .08 | .18 | .40B | .21 | .30 |
| Net realized and unrealized gain (loss) | 1.65 | 8.90 | (.20) | (.83) | 2.01C | 7.06 |
| Total from investment operations | 1.47 | 8.98 | (.02) | (.43) | 2.22 | 7.36 |
| Distributions from net investment income | (.08) | (.18) | (.27) | (.22) | (.30) | (.34) |
| Distributions from net realized gain | – | (.05) | (3.59) | (4.24) | (3.31) | – |
| Total distributions | (.08) | (.23) | (3.86) | (4.46) | (3.61) | (.34) |
| Redemption fees added to paid in capitalA | –D | .01 | –D | .05 | .01 | .01 |
| Net asset value, end of period | $35.61 | $34.22 | $25.46 | $29.34 | $34.18 | $35.56 |
| Total ReturnE,F,G | 4.29% | 35.67% | (.13)% | (1.45)% | 6.45%C | 26.07% |
| Ratios to Average Net AssetsH,I | ||||||
| Expenses before reductions | 1.26%J | 1.30% | 1.33% | 1.28% | 1.35% | 1.35% |
| Expenses net of fee waivers, if any | 1.26%J | 1.30% | 1.33% | 1.28% | 1.35% | 1.35% |
| Expenses net of all reductions | 1.23%J | 1.29% | 1.32% | 1.26% | 1.35% | 1.31% |
| Net investment income (loss) | (.98)%J | .28% | .75% | 1.26%B | .64% | .94% |
| Supplemental Data | ||||||
| Net assets, end of period (000 omitted) | $32,394 | $35,539 | $22,937 | $32,761 | $21,728 | $20,623 |
| Portfolio turnover rateK | 22%J | 68% | 70% | 151% | 87% | 92% |
A Calculated based on average shares outstanding during the period.
B Net Investment income per share reflects a large, non-recurring dividend which amounted to $.13 per share. Excluding this non-recurring dividend, the ratio of net investment income (loss) to average net assets would have been .85%.
C Amount includes a reimbursement from the investment adviser for an operational error which amounted to less than $.01 per share. Excluding this reimbursement, the total return would have been 6.42%.
D Amount represents less than $.005 per share.
E Total returns for periods of less than one year are not annualized.
F Total returns would have been lower if certain expenses had not been reduced during the applicable periods shown.
G Total returns do not include the effect of the sales charges.
H Fees and expenses of any underlying Fidelity Central Funds are not included in the Fund's expense ratio. The Fund indirectly bears its proportionate share of the expenses of any underlying Fidelity Central Funds.
I Expense ratios reflect operating expenses of the class. Expenses before reductions do not reflect amounts reimbursed by the investment adviser or reductions from brokerage service arrangements or reductions from other expense offset arrangements and do not represent the amount paid by the class during periods when reimbursements or reductions occur. Expenses net of fee waivers reflect expenses after reimbursement by the investment adviser but prior to reductions from brokerage service arrangements or other expense offset arrangements. Expenses net of all reductions represent the net expenses paid by the class.
J Annualized
K Amount does not include the portfolio activity of any underlying Fidelity Central Funds.
See accompanying notes which are an integral part of the financial statements.
Fidelity China Region Fund Class M
| Six months ended (Unaudited) April 30, | Years endedOctober 31, | |||||
| 2018 | 2017 | 2016 | 2015 | 2014 | 2013 | |
| Selected Per–Share Data | ||||||
| Net asset value, beginning of period | $34.05 | $25.34 | $29.18 | $34.02 | $35.40 | $28.40 |
| Income from Investment Operations | ||||||
| Net investment income (loss)A | (.24) | (.02) | .10 | .30B | .12 | .21 |
| Net realized and unrealized gain (loss) | 1.64 | 8.88 | (.22) | (.83) | 1.99C | 7.04 |
| Total from investment operations | 1.40 | 8.86 | (.12) | (.53) | 2.11 | 7.25 |
| Distributions from net investment income | – | (.11) | (.13) | (.12) | (.19) | (.26) |
| Distributions from net realized gain | – | (.05) | (3.59) | (4.24) | (3.31) | – |
| Total distributions | – | (.16) | (3.72) | (4.36) | (3.50) | (.26) |
| Redemption fees added to paid in capitalA | –D | .01 | –D | .05 | .01 | .01 |
| Net asset value, end of period | $35.45 | $34.05 | $25.34 | $29.18 | $34.02 | $35.40 |
| Total ReturnE,F,G | 4.11% | 35.25% | (.50)% | (1.79)% | 6.15%C | 25.74% |
| Ratios to Average Net AssetsH,I | ||||||
| Expenses before reductions | 1.61%J | 1.65% | 1.67% | 1.62% | 1.65% | 1.64% |
| Expenses net of fee waivers, if any | 1.61%J | 1.65% | 1.67% | 1.62% | 1.65% | 1.64% |
| Expenses net of all reductions | 1.58%J | 1.64% | 1.67% | 1.60% | 1.65% | 1.60% |
| Net investment income (loss) | (1.33)%J | (.07)% | .40% | .92%B | .35% | .65% |
| Supplemental Data | ||||||
| Net assets, end of period (000 omitted) | $12,003 | $9,763 | $5,644 | $6,409 | $6,305 | $5,965 |
| Portfolio turnover rateK | 22%J | 68% | 70% | 151% | 87% | 92% |
A Calculated based on average shares outstanding during the period.
B Net Investment income per share reflects a large, non-recurring dividend which amounted to $.13 per share. Excluding this non-recurring dividend, the ratio of net investment income (loss) to average net assets would have been .51%.
C Amount includes a reimbursement from the investment adviser for an operational error which amounted to less than $.01 per share. Excluding this reimbursement, the total return would have been 6.12%.
D Amount represents less than $.005 per share.
E Total returns for periods of less than one year are not annualized.
F Total returns would have been lower if certain expenses had not been reduced during the applicable periods shown.
G Total returns do not include the effect of the sales charges.
H Fees and expenses of any underlying Fidelity Central Funds are not included in the Fund's expense ratio. The Fund indirectly bears its proportionate share of the expenses of any underlying Fidelity Central Funds.
I Expense ratios reflect operating expenses of the class. Expenses before reductions do not reflect amounts reimbursed by the investment adviser or reductions from brokerage service arrangements or reductions from other expense offset arrangements and do not represent the amount paid by the class during periods when reimbursements or reductions occur. Expenses net of fee waivers reflect expenses after reimbursement by the investment adviser but prior to reductions from brokerage service arrangements or other expense offset arrangements. Expenses net of all reductions represent the net expenses paid by the class.
J Annualized
K Amount does not include the portfolio activity of any underlying Fidelity Central Funds.
See accompanying notes which are an integral part of the financial statements.
Fidelity China Region Fund Class C
| Six months ended (Unaudited) April 30, | Years endedOctober 31, | |||||
| 2018 | 2017 | 2016 | 2015 | 2014 | 2013 | |
| Selected Per–Share Data | ||||||
| Net asset value, beginning of period | $33.41 | $24.82 | $28.68 | $33.56 | $34.99 | $28.07 |
| Income from Investment Operations | ||||||
| Net investment income (loss)A | (.31) | (.13) | –B | .15C | (.02) | .06 |
| Net realized and unrealized gain (loss) | 1.62 | 8.73 | (.21) | (.80) | 1.97D | 6.97 |
| Total from investment operations | 1.31 | 8.60 | (.21) | (.65) | 1.95 | 7.03 |
| Distributions from net investment income | – | – | (.06) | (.04) | (.08) | (.12) |
| Distributions from net realized gain | – | (.02) | (3.59) | (4.24) | (3.31) | – |
| Total distributions | – | (.02) | (3.65) | (4.28) | (3.39) | (.12) |
| Redemption fees added to paid in capitalA | –B | .01 | –B | .05 | .01 | .01 |
| Net asset value, end of period | $34.72 | $33.41 | $24.82 | $28.68 | $33.56 | $34.99 |
| Total ReturnE,F,G | 3.92% | 34.71% | (.88)% | (2.21)% | 5.71%D | 25.14% |
| Ratios to Average Net AssetsH,I | ||||||
| Expenses before reductions | 2.01%J | 2.05% | 2.07% | 2.05% | 2.07% | 2.10% |
| Expenses net of fee waivers, if any | 2.01%J | 2.05% | 2.07% | 2.05% | 2.07% | 2.10% |
| Expenses net of all reductions | 1.98%J | 2.03% | 2.06% | 2.02% | 2.07% | 2.07% |
| Net investment income (loss) | (1.72)%J | (.46)% | .01% | .49%C | (.07)% | .19% |
| Supplemental Data | ||||||
| Net assets, end of period (000 omitted) | $15,044 | $12,952 | $11,218 | $14,355 | $10,445 | $6,957 |
| Portfolio turnover rateK | 22%J | 68% | 70% | 151% | 87% | 92% |
A Calculated based on average shares outstanding during the period.
B Amount represents less than $.005 per share.
C Net Investment income per share reflects a large, non-recurring dividend which amounted to $.13 per share. Excluding this non-recurring dividend, the ratio of net investment income (loss) to average net assets would have been .09%.
D Amount includes a reimbursement from the investment adviser for an operational error which amounted to less than $.01 per share. Excluding this reimbursement, the total return would have been 5.68%.
E Total returns for periods of less than one year are not annualized.
F Total returns would have been lower if certain expenses had not been reduced during the applicable periods shown.
G Total returns do not include the effect of the contingent deferred sales charge.
H Fees and expenses of any underlying Fidelity Central Funds are not included in the Fund's expense ratio. The Fund indirectly bears its proportionate share of the expenses of any underlying Fidelity Central Funds.
I Expense ratios reflect operating expenses of the class. Expenses before reductions do not reflect amounts reimbursed by the investment adviser or reductions from brokerage service arrangements or reductions from other expense offset arrangements and do not represent the amount paid by the class during periods when reimbursements or reductions occur. Expenses net of fee waivers reflect expenses after reimbursement by the investment adviser but prior to reductions from brokerage service arrangements or other expense offset arrangements. Expenses net of all reductions represent the net expenses paid by the class.
J Annualized
K Amount does not include the portfolio activity of any underlying Fidelity Central Funds.
See accompanying notes which are an integral part of the financial statements.
Fidelity China Region Fund
| Six months ended (Unaudited) April 30, | Years endedOctober 31, | |||||
| 2018 | 2017 | 2016 | 2015 | 2014 | 2013 | |
| Selected Per–Share Data | ||||||
| Net asset value, beginning of period | $34.64 | $25.78 | $29.66 | $34.51 | $35.83 | $28.73 |
| Income from Investment Operations | ||||||
| Net investment income (loss)A | (.12) | .17 | .26 | .51B | .33 | .41 |
| Net realized and unrealized gain (loss) | 1.66 | 9.00 | (.21) | (.84) | 2.03C | 7.11 |
| Total from investment operations | 1.54 | 9.17 | .05 | (.33) | 2.36 | 7.52 |
| Distributions from net investment income | (.14) | (.27) | (.35) | (.33) | (.38) | (.43) |
| Distributions from net realized gain | – | (.05) | (3.59) | (4.24) | (3.31) | – |
| Total distributions | (.14) | (.32) | (3.93)D | (4.57) | (3.69) | (.43) |
| Redemption fees added to paid in capitalA | –E | .01 | –E | .05 | .01 | .01 |
| Net asset value, end of period | $36.04 | $34.64 | $25.78 | $29.66 | $34.51 | $35.83 |
| Total ReturnF,G | 4.47% | 36.10% | .15% | (1.14)% | 6.83%C | 26.51% |
| Ratios to Average Net AssetsH,I | ||||||
| Expenses before reductions | .95%J | 1.00% | 1.02% | .99% | 1.01% | 1.02% |
| Expenses net of fee waivers, if any | .95%J | 1.00% | 1.02% | .98% | 1.01% | 1.02% |
| Expenses net of all reductions | .92%J | .99% | 1.01% | .96% | 1.01% | .98% |
| Net investment income (loss) | (.67)%J | .58% | 1.06% | 1.55%B | .99% | 1.27% |
| Supplemental Data | ||||||
| Net assets, end of period (000 omitted) | $1,399,025 | $1,294,775 | $1,004,985 | $1,262,274 | $1,352,761 | $1,425,828 |
| Portfolio turnover rateK | 22%J | 68% | 70% | 151% | 87% | 92% |
A Calculated based on average shares outstanding during the period.
B Net Investment income per share reflects a large, non-recurring dividend which amounted to $.13 per share. Excluding this non-recurring dividend, the ratio of net investment income (loss) to average net assets would have been 1.15%.
C Amount includes a reimbursement from the investment adviser for an operational error which amounted to less than $.01 per share. Excluding this reimbursement, the total return would have been 6.80%.
D Total distributions of $3.93 per share is comprised of distributions from net investment income of $.345 and distributions from net realized gain of $3.588 per share.
E Amount represents less than $.005 per share.
F Total returns for periods of less than one year are not annualized.
G Total returns would have been lower if certain expenses had not been reduced during the applicable periods shown.
H Fees and expenses of any underlying Fidelity Central Funds are not included in the Fund's expense ratio. The Fund indirectly bears its proportionate share of the expenses of any underlying Fidelity Central Funds.
I Expense ratios reflect operating expenses of the class. Expenses before reductions do not reflect amounts reimbursed by the investment adviser or reductions from brokerage service arrangements or reductions from other expense offset arrangements and do not represent the amount paid by the class during periods when reimbursements or reductions occur. Expenses net of fee waivers reflect expenses after reimbursement by the investment adviser but prior to reductions from brokerage service arrangements or other expense offset arrangements. Expenses net of all reductions represent the net expenses paid by the class.
J Annualized
K Amount does not include the portfolio activity of any underlying Fidelity Central Funds.
See accompanying notes which are an integral part of the financial statements.
Fidelity China Region Fund Class I
| Six months ended (Unaudited) April 30, | Years endedOctober 31, | |||||
| 2018 | 2017 | 2016 | 2015 | 2014 | 2013 | |
| Selected Per–Share Data | ||||||
| Net asset value, beginning of period | $34.41 | $25.62 | $29.51 | $34.39 | $35.75 | $28.68 |
| Income from Investment Operations | ||||||
| Net investment income (loss)A | (.13) | .16 | .26 | .51B | .34 | .42 |
| Net realized and unrealized gain (loss) | 1.66 | 8.95 | (.20) | (.84) | 2.02C | 7.10 |
| Total from investment operations | 1.53 | 9.11 | .06 | (.33) | 2.36 | 7.52 |
| Distributions from net investment income | (.16) | (.28) | (.36) | (.36) | (.43) | (.46) |
| Distributions from net realized gain | – | (.05) | (3.59) | (4.24) | (3.31) | – |
| Total distributions | (.16) | (.33) | (3.95) | (4.60) | (3.73)D | (.46) |
| Redemption fees added to paid in capitalA | –E | .01 | –E | .05 | .01 | .01 |
| Net asset value, end of period | $35.78 | $34.41 | $25.62 | $29.51 | $34.39 | $35.75 |
| Total ReturnF,G | 4.46% | 36.11% | .16% | (1.14)% | 6.87%C | 26.58% |
| Ratios to Average Net AssetsH,I | ||||||
| Expenses before reductions | .97%J | 1.01% | 1.00% | .97% | .98% | .97% |
| Expenses net of fee waivers, if any | .97%J | 1.01% | 1.00% | .97% | .98% | .97% |
| Expenses net of all reductions | .94%J | .99% | .99% | .95% | .98% | .93% |
| Net investment income (loss) | (.69)%J | .57% | 1.07% | 1.57%B | 1.01% | 1.32% |
| Supplemental Data | ||||||
| Net assets, end of period (000 omitted) | $31,985 | $27,880 | $19,334 | $26,961 | $19,404 | $10,206 |
| Portfolio turnover rateK | 22%J | 68% | 70% | 151% | 87% | 92% |
A Calculated based on average shares outstanding during the period.
B Net Investment income per share reflects a large, non-recurring dividend which amounted to $.13 per share. Excluding this non-recurring dividend, the ratio of net investment income (loss) to average net assets would have been 1.16%.
C Amount includes a reimbursement from the investment adviser for an operational error which amounted to less than $.01 per share. Excluding this reimbursement, the total return would have been 6.84%.
D Total distributions of $3.73 per share is comprised of distributions from net investment income of $.425 and distributions from net realized gain of $3.306 per share.
E Amount represents less than $.005 per share.
F Total returns for periods of less than one year are not annualized.
G Total returns would have been lower if certain expenses had not been reduced during the applicable periods shown.
H Fees and expenses of any underlying Fidelity Central Funds are not included in the Fund's expense ratio. The Fund indirectly bears its proportionate share of the expenses of any underlying Fidelity Central Funds.
I Expense ratios reflect operating expenses of the class. Expenses before reductions do not reflect amounts reimbursed by the investment adviser or reductions from brokerage service arrangements or reductions from other expense offset arrangements and do not represent the amount paid by the class during periods when reimbursements or reductions occur. Expenses net of fee waivers reflect expenses after reimbursement by the investment adviser but prior to reductions from brokerage service arrangements or other expense offset arrangements. Expenses net of all reductions represent the net expenses paid by the class.
J Annualized
K Amount does not include the portfolio activity of any underlying Fidelity Central Funds.
See accompanying notes which are an integral part of the financial statements.
Notes to Financial Statements (Unaudited)
For the period ended April 30, 2018
1. Organization.
Fidelity China Region Fund (the Fund) is a fund of Fidelity Investment Trust (the Trust) and is authorized to issue an unlimited number of shares. The Trust is registered under the Investment Company Act of 1940, as amended (the 1940 Act), as an open-end management investment company organized as a Massachusetts business trust. The Fund offers Class A, Class M, Class C, China Region and Class I shares, each of which has equal rights as to assets and voting privileges. Each class has exclusive voting rights with respect to matters that affect that class. The Fund's investments in emerging markets can be subject to social, economic, regulatory, and political uncertainties and can be extremely volatile.
2. Investments in Fidelity Central Funds.
The Fund invests in Fidelity Central Funds, which are open-end investment companies generally available only to other investment companies and accounts managed by the investment adviser and its affiliates. The Fund's Schedule of Investments lists each of the Fidelity Central Funds held as of period end, if any, as an investment of the Fund, but does not include the underlying holdings of each Fidelity Central Fund. As an Investing Fund, the Fund indirectly bears its proportionate share of the expenses of the underlying Fidelity Central Funds.
The Money Market Central Funds seek preservation of capital and current income and are managed by Fidelity Investments Money Management, Inc. (FIMM), an affiliate of the investment adviser. Annualized expenses of the Money Market Central Funds as of their most recent shareholder report date are less than .005%.
A complete unaudited list of holdings for each Fidelity Central Fund is available upon request or at the Securities and Exchange Commission (the SEC) website at www.sec.gov. In addition, the financial statements of the Fidelity Central Funds are available on the SEC website or upon request.
3. Significant Accounting Policies.
The Fund is an investment company and applies the accounting and reporting guidance of the Financial Accounting Standards Board (FASB) Accounting Standards Codification Topic 946 Financial Services – Investments Companies. The financial statements have been prepared in conformity with accounting principles generally accepted in the United States of America (GAAP), which require management to make certain estimates and assumptions at the date of the financial statements. Actual results could differ from those estimates. Subsequent events, if any, through the date that the financial statements were issued have been evaluated in the preparation of the financial statements. The following summarizes the significant accounting policies of the Fund:
Investment Valuation. Investments are valued as of 4:00 p.m. Eastern time on the last calendar day of the period. The Board of Trustees (the Board) has delegated the day to day responsibility for the valuation of the Fund's investments to the Fair Value Committee (the Committee) established by the Fund's investment adviser. In accordance with valuation policies and procedures approved by the Board, the Fund attempts to obtain prices from one or more third party pricing vendors or brokers to value its investments. When current market prices, quotations or currency exchange rates are not readily available or reliable, investments will be fair valued in good faith by the Committee, in accordance with procedures adopted by the Board. Factors used in determining fair value vary by investment type and may include market or investment specific events. The frequency with which these procedures are used cannot be predicted and they may be utilized to a significant extent. The Committee oversees the Fund's valuation policies and procedures and reports to the Board on the Committee's activities and fair value determinations. The Board monitors the appropriateness of the procedures used in valuing the Fund's investments and ratifies the fair value determinations of the Committee.
The Fund categorizes the inputs to valuation techniques used to value its investments into a disclosure hierarchy consisting of three levels as shown below:
- Level 1 – quoted prices in active markets for identical investments
- Level 2 – other significant observable inputs (including quoted prices for similar investments, interest rates, prepayment speeds, etc.)
- Level 3– unobservable inputs (including the Fund's own assumptions based on the best information available)
Valuation techniques used to value the Fund's investments by major category are as follows:
Equity securities, including restricted securities, for which market quotations are readily available, are valued at the last reported sale price or official closing price as reported by a third party pricing vendor on the primary market or exchange on which they are traded and are categorized as Level 1 in the hierarchy. In the event there were no sales during the day or closing prices are not available, securities are valued at the last quoted bid price or may be valued using the last available price and are generally categorized as Level 2 in the hierarchy. For foreign equity securities, when market or security specific events arise, comparisons to the valuation of American Depositary Receipts (ADRs), futures contracts, Exchange-Traded Funds (ETFs) and certain indexes as well as quoted prices for similar securities may be used and would be categorized as Level 2 in the hierarchy. Utilizing these techniques may result in transfers between Level 1 and Level 2. For equity securities, including restricted securities, where observable inputs are limited, assumptions about market activity and risk are used and these securities may be categorized as Level 3 in the hierarchy.
Investments in open-end mutual funds, including the Fidelity Central Funds, are valued at their closing net asset value (NAV) each business day and are categorized as Level 1 in the hierarchy.
Changes in valuation techniques may result in transfers in or out of an assigned level within the disclosure hierarchy. The aggregate value of investments by input level as of April 30, 2018, including information on transfers between Levels 1 and 2, is included at the end of the Fund's Schedule of Investments.
Foreign Currency. The Fund may use foreign currency contracts to facilitate transactions in foreign-denominated securities. Gains and losses from these transactions may arise from changes in the value of the foreign currency or if the counterparties do not perform under the contracts' terms.
Foreign-denominated assets, including investment securities, and liabilities are translated into U.S. dollars at the exchange rates at period end. Purchases and sales of investment securities, income and dividends received and expenses denominated in foreign currencies are translated into U.S. dollars at the exchange rate in effect on the transaction date.
The effects of exchange rate fluctuations on investments are included with the net realized and unrealized gain (loss) on investment securities. Other foreign currency transactions resulting in realized and unrealized gain (loss) are disclosed separately.
Investment Transactions and Income. For financial reporting purposes, the Fund's investment holdings and NAV include trades executed through the end of the last business day of the period. The NAV per share for processing shareholder transactions is calculated as of the close of business of the New York Stock Exchange (NYSE), normally 4:00 p.m. Eastern time and includes trades executed through the end of the prior business day. Gains and losses on securities sold are determined on the basis of identified cost. Dividend income is recorded on the ex-dividend date, except for certain dividends from foreign securities where the ex-dividend date may have passed, which are recorded as soon as the Fund is informed of the ex-dividend date. Non-cash dividends included in dividend income, if any, are recorded at the fair market value of the securities received. Income and capital gain distributions from Fidelity Central Funds, if any, are recorded on the ex-dividend date. Investment income is recorded net of foreign taxes withheld where recovery of such taxes is uncertain.
Class Allocations and Expenses. Investment income, realized and unrealized capital gains and losses, common expenses of the Fund, and certain fund-level expense reductions, if any, are allocated daily on a pro-rata basis to each class based on the relative net assets of each class to the total net assets of the Fund. Each class differs with respect to transfer agent and distribution and service plan fees incurred. Certain expense reductions may also differ by class. For the reporting period, the allocated portion of income and expenses to each class as a percent of its average net assets may vary due to the timing of recording these transactions in relation to fluctuating net assets of the classes. Expenses directly attributable to a fund are charged to that fund. Expenses attributable to more than one fund are allocated among the respective funds on the basis of relative net assets or other appropriate methods. Expense estimates are accrued in the period to which they relate and adjustments are made when actual amounts are known.
Income Tax Information and Distributions to Shareholders. Each year, the Fund intends to qualify as a regulated investment company under Subchapter M of the Internal Revenue Code, including distributing substantially all of its taxable income and realized gains. As a result, no provision for U.S. Federal income taxes is required. The Fund files a U.S. federal tax return, in addition to state and local tax returns as required. The Fund's federal income tax returns are subject to examination by the Internal Revenue Service (IRS) for a period of three fiscal years after they are filed. State and local tax returns may be subject to examination for an additional fiscal year depending on the jurisdiction. Foreign taxes are provided for based on the Fund's understanding of the tax rules and rates that exist in the foreign markets in which it invests.
Distributions are declared and recorded on the ex-dividend date. Income and capital gain distributions are declared separately for each class. Income and capital gain distributions are determined in accordance with income tax regulations, which may differ from GAAP.
Capital accounts within the financial statements are adjusted for permanent book-tax differences. These adjustments have no impact on net assets or the results of operations. Capital accounts are not adjusted for temporary book-tax differences which will reverse in a subsequent period.
Book-tax differences are primarily due to foreign currency transactions, passive foreign investment companies (PFIC), deferred trustees compensation, capital loss carryforwards and losses deferred due to wash sales.
As of period end, the cost and unrealized appreciation (depreciation) in securities, and derivatives if applicable, for federal income tax purposes were as follows:
| Gross unrealized appreciation | $473,892,337 |
| Gross unrealized depreciation | (46,862,222) |
| Net unrealized appreciation (depreciation) | $427,030,115 |
| Tax cost | $1,068,239,101 |
Capital loss carryforwards are only available to offset future capital gains of the Fund to the extent provided by regulations and may be limited. Under the Regulated Investment Company Modernization Act of 2010 (the Act), the Fund is permitted to carry forward capital losses incurred in taxable years beginning after December 22, 2010 for an unlimited period and such capital losses are required to be used prior to any losses that expire. The capital loss carryforward information presented below, including any applicable limitation, is estimated as of prior fiscal period end and is subject to adjustment.
| No expiration | |
| Short-term | $(139,203,991) |
Short-Term Trading (Redemption) Fees. Shares held by investors in the Fund less than 90 days may have been subject to a redemption fee equal to 1.50% of the NAV of shares redeemed. All redemption fees, which reduce the proceeds of the shareholder redemption, are retained by the Fund and accounted for as an addition to paid in capital. In November 2017, the Board of Trustees approved the elimination of these redemption fees effective December 18, 2017.
Restricted Securities. The Fund may invest in securities that are subject to legal or contractual restrictions on resale. These securities generally may be resold in transactions exempt from registration or to the public if the securities are registered. Disposal of these securities may involve time-consuming negotiations and expense, and prompt sale at an acceptable price may be difficult. Information regarding restricted securities is included at the end of the Fund's Schedule of Investments.
4. Purchases and Sales of Investments.
Purchases and sales of securities, other than short-term securities, aggregated $162,275,902 and $158,713,436, respectively.
5. Fees and Other Transactions with Affiliates.
Management Fee. Fidelity Management & Research Company (the investment adviser) and its affiliates provide the Fund with investment management related services for which the Fund pays a monthly management fee. The management fee is the sum of an individual fund fee rate that is based on an annual rate of .45% of the Fund's average net assets and an annualized group fee rate that averaged .24% during the period. The group fee rate is based upon the average net assets of all the mutual funds advised by the investment adviser, including any mutual funds previously advised by the investment adviser that are currently advised by Fidelity SelectCo, LLC, an affiliate of the investment adviser. The group fee rate decreases as assets under management increase and increases as assets under management decrease. For the reporting period, the total annualized management fee rate was .69% of the Fund's average net assets.
Distribution and Service Plan Fees. In accordance with Rule 12b-1 of the 1940 Act, the Fund has adopted separate Distribution and Service Plans for each class of shares. Certain classes pay Fidelity Distributors Corporation (FDC), an affiliate of the investment adviser, separate Distribution and Service Fees, each of which is based on an annual percentage of each class' average net assets. In addition, FDC may pay financial intermediaries for selling shares of the Fund and providing shareholder support services. For the period, the Distribution and Service Fee rates, total fees and amounts retained by FDC were as follows:
| Distribution Fee | Service Fee | Total Fees | Retained by FDC | |
| Class A | -% | .25% | $47,032 | $1,362 |
| Class M | .25% | .25% | 28,924 | 410 |
| Class C | .75% | .25% | 75,256 | 16,234 |
| $151,212 | $18,006 |
Sales Load. FDC may receive a front-end sales charge of up to 5.75% for selling Class A shares and 3.50% for selling Class M shares, some of which is paid to financial intermediaries for selling shares of the Fund. Depending on the holding period, FDC may receive contingent deferred sales charges levied on Class A, Class M and Class C redemptions. The deferred sales charges are 1.00% for Class C shares, 1.00% for certain purchases of Class A shares and .25% for certain purchases of Class M shares.
For the period, sales charge amounts retained by FDC were as follows:
| Retained by FDC | |
| Class A | $23,915 |
| Class M | 3,369 |
| Class C(a) | 3,475 |
| $30,759 |
(a) When Class C shares are initially sold, FDC pays commissions from its own resources to financial intermediaries through which the sales are made.
Transfer Agent Fees. Fidelity Investments Institutional Operations Company, Inc., (FIIOC), an affiliate of the investment adviser, is the transfer, dividend disbursing and shareholder servicing agent for each class of the Fund. FIIOC receives account fees and asset-based fees that vary according to the account size and type of account of the shareholders of the respective classes of the Fund. FIIOC pays for typesetting, printing and mailing of shareholder reports, except proxy statements.
For the period, transfer agent fees for each class were as follows:
| Amount | % of Class-Level Average Net Assets(a) | |
| Class A | $42,963 | .23 |
| Class M | 19,120 | .33 |
| Class C | 16,807 | .22 |
| China Region | 1,234,051 | .17 |
| Class I | 33,988 | .19 |
| $1,346,929 |
(a) Annualized
Accounting and Security Lending Fees. Fidelity Service Company, Inc. (FSC), an affiliate of the investment adviser, maintains the Fund's accounting records. The accounting fee is based on the level of average net assets for each month. Under a separate contract, FSC administers the security lending program. The security lending fee is based on the number and duration of lending transactions. For the period, the fees were equivalent to an annualized rate of .04%.
Brokerage Commissions. The Fund placed a portion of its portfolio transactions with brokerage firms which are affiliates of the investment adviser. Brokerage commissions are included in net realized gain (loss) and change in net unrealized appreciation (depreciation) in the Statement of Operations. The commissions paid to these affiliated firms were $494 for the period.
Interfund Lending Program. Pursuant to an Exemptive Order issued by the SEC, the Fund, along with other registered investment companies having management contracts with Fidelity Management & Research Company (FMR) or other affiliated entities of FMR, may participate in an interfund lending program. This program provides an alternative credit facility allowing the funds to borrow from, or lend money to, other participating affiliated funds. At period end, there were no interfund loans outstanding. The Fund's activity in this program during the period for which loans were outstanding was as follows:
| Borrower or Lender | Average Loan Balance | Weighted Average Interest Rate | Interest Expense |
| Borrower | $5,475,727 | 1.34% | $2,235 |
Interfund Trades. The Fund may purchase from or sell securities to other Fidelity Funds under procedures adopted by the Board. The procedures have been designed to ensure these interfund trades are executed in accordance with Rule 17a-7 of the 1940 Act. Interfund trades are included within the respective purchases and sales amounts shown in the Purchases and Sales of Investments note.
6. Committed Line of Credit.
The Fund participates with other funds managed by the investment adviser or an affiliate in a $4.25 billion credit facility (the "line of credit") to be utilized for temporary or emergency purposes to fund shareholder redemptions or for other short-term liquidity purposes. The Fund has agreed to pay commitment fees on its pro-rata portion of the line of credit, which amounted to $2,142 and is reflected in Miscellaneous expenses on the Statement of Operations. During the period, the Fund did not borrow on this line of credit.
7. Security Lending.
The Fund lends portfolio securities through a lending agent from time to time in order to earn additional income. For equity securities, a lending agent is used and may loan securities to certain qualified borrowers, including Fidelity Capital Markets (FCM), a broker-dealer affiliated with the Fund. On the settlement date of the loan, the Fund receives collateral (in the form of U.S. Treasury obligations, letters of credit and/or cash) against the loaned securities and maintains collateral in an amount not less than 100% of the market value of the loaned securities during the period of the loan. The market value of the loaned securities is determined at the close of business of the Fund and any additional required collateral is delivered to the Fund on the next business day. The Fund or borrower may terminate the loan at any time, and if the borrower defaults on its obligation to return the securities loaned because of insolvency or other reasons, the Fund may apply collateral received from the borrower against the obligation. The Fund may experience delays and costs in recovering the securities loaned. Any cash collateral received is invested in the Fidelity Securities Lending Cash Central Fund. The value of loaned securities and cash collateral at period end are disclosed on the Fund's Statement of Assets and Liabilities. Security lending income represents the income earned on investing cash collateral, less rebates paid to borrowers and any lending agent fees associated with the loan, plus any premium payments received for lending certain types of securities. Security lending income is presented in the Statement of Operations as a component of income from Fidelity Central Funds. During the period, there were no securities loaned to FCM.
8. Expense Reductions.
Commissions paid to certain brokers with whom the investment adviser, or its affiliates, places trades on behalf of the Fund include an amount in addition to trade execution, which may be rebated back to the Fund to offset certain expenses. This amount totaled $226,592 for the period.
In addition, during the period the investment adviser reimbursed and/or waived a portion of fund-level operating expenses in the amount of $7,183.
9. Distributions to Shareholders.
Distributions to shareholders of each class were as follows:
| Six months ended April 30, 2018 | Year ended October 31, 2017 | |
| From net investment income | ||
| Class A | $79,935 | $157,254 |
| Class M | – | 24,256 |
| China Region | 5,380,060 | 10,242,046 |
| Class I | 172,796 | 212,309 |
| Total | $5,632,791 | $10,635,865 |
| From net realized gain | ||
| Class A | $– | $43,202 |
| Class M | – | 10,926 |
| Class C | – | 7,384 |
| China Region | – | 1,889,677 |
| Class I | – | 37,777 |
| Total | $– | $1,988,966 |
10. Share Transactions.
Share transactions for each class were as follows and may contain automatic conversions between classes or exchanges between affiliated funds:
| Shares | Shares | Dollars | Dollars | |
| Six months ended April 30, 2018 | Year ended October 31, 2017 | Six months ended April 30, 2018 | Year ended October 31, 2017 | |
| Class A | ||||
| Shares sold | 186,195 | 484,746 | $6,775,443 | $14,218,284 |
| Reinvestment of distributions | 2,311 | 7,951 | 78,689 | 195,750 |
| Shares redeemed | (317,334) | (355,316) | (11,749,829) | (9,896,035) |
| Net increase (decrease) | (128,828) | 137,381 | $(4,895,697) | $4,517,999 |
| Class M | ||||
| Shares sold | 85,711 | 114,104 | $3,124,555 | $3,376,139 |
| Reinvestment of distributions | – | 1,419 | – | 34,859 |
| Shares redeemed | (33,846) | (51,513) | (1,217,409) | (1,446,359) |
| Net increase (decrease) | 51,865 | 64,010 | $1,907,146 | $1,964,639 |
| Class C | ||||
| Shares sold | 107,993 | 123,999 | $3,868,599 | $3,531,382 |
| Reinvestment of distributions | – | 254 | – | 6,148 |
| Shares redeemed | (62,308) | (188,578) | (2,211,653) | (4,895,729) |
| Net increase (decrease) | 45,685 | (64,325) | $1,656,946 | $(1,358,199) |
| China Region | ||||
| Shares sold | 7,252,530 | 7,507,787 | $269,152,089 | $224,773,166 |
| Reinvestment of distributions | 150,399 | 469,834 | 5,175,224 | 11,675,364 |
| Shares redeemed | (5,953,767) | (9,588,795) | (218,355,689) | (265,714,287) |
| Net increase (decrease) | 1,449,162 | (1,611,174) | $55,971,624 | $(29,265,757) |
| Class I | ||||
| Shares sold | 533,504 | 659,273 | $19,432,373 | $19,707,002 |
| Reinvestment of distributions | 4,532 | 8,728 | 154,844 | 215,492 |
| Shares redeemed | (454,184) | (612,455) | (16,900,705) | (17,979,791) |
| Net increase (decrease) | 83,852 | 55,546 | $2,686,512 | $1,942,703 |
11. Other.
The Fund's organizational documents provide former and current trustees and officers with a limited indemnification against liabilities arising in connection with the performance of their duties to the Fund. In the normal course of business, the Fund may also enter into contracts that provide general indemnifications. The Fund's maximum exposure under these arrangements is unknown as this would be dependent on future claims that may be made against the Fund. The risk of material loss from such claims is considered remote.
Fidelity® Emerging Asia Fund
Investment Summary (Unaudited)
Geographic Diversification (% of fund's net assets)
| As of April 30, 2018 | ||
| Cayman Islands | 19.3% | |
| China | 15.8% | |
| India | 15.7% | |
| Korea (South) | 9.6% | |
| Hong Kong | 9.0% | |
| Taiwan | 8.8% | |
| Bermuda | 4.3% | |
| United States of America* | 3.8% | |
| Indonesia | 2.8% | |
| Other | 10.9% | |

* Includes Short-Term investments and Net Other Assets (Liabilities).
Percentages are based on country or territory of incorporation and are adjusted for the effect of futures contracts, if applicable.
Asset Allocation as of April 30, 2018
| % of fund's net assets | |
| Stocks | 96.2 |
| Short-Term Investments and Net Other Assets (Liabilities) | 3.8 |
Top Ten Stocks as of April 30, 2018
| % of fund's net assets | |
| Tencent Holdings Ltd. (Cayman Islands, Internet Software & Services) | 7.2 |
| Alibaba Group Holding Ltd. sponsored ADR (Cayman Islands, Internet Software & Services) | 5.5 |
| Taiwan Semiconductor Manufacturing Co. Ltd. (Taiwan, Semiconductors & Semiconductor Equipment) | 5.3 |
| AIA Group Ltd. (Hong Kong, Insurance) | 3.4 |
| Samsung Electronics Co. Ltd. (Korea (South), Technology Hardware, Storage & Peripherals) | 2.6 |
| China Construction Bank Corp. (H Shares) (China, Banks) | 2.4 |
| Reliance Industries Ltd. (India, Oil, Gas & Consumable Fuels) | 2.3 |
| Housing Development Finance Corp. Ltd. (India, Thrifts & Mortgage Finance) | 1.9 |
| SK Hynix, Inc. (Korea (South), Semiconductors & Semiconductor Equipment) | 1.7 |
| PT Bank Central Asia Tbk (Indonesia, Banks) | 1.6 |
| 33.9 |
Top Market Sectors as of April 30, 2018
| % of fund's net assets | |
| Information Technology | 28.3 |
| Financials | 21.7 |
| Consumer Discretionary | 9.7 |
| Industrials | 7.3 |
| Utilities | 5.5 |
| Consumer Staples | 5.1 |
| Health Care | 4.8 |
| Energy | 4.2 |
| Real Estate | 4.2 |
| Telecommunication Services | 3.3 |
Fidelity® Emerging Asia Fund
Schedule of Investments April 30, 2018 (Unaudited)
Showing Percentage of Net Assets
| Common Stocks - 95.2% | |||
| Shares | Value | ||
| Australia - 1.7% | |||
| Blue Sky Alternative Investments Ltd. | 1,183,786 | $2,728,467 | |
| Netwealth Group Ltd. | 1,144,741 | 6,164,977 | |
| SpeedCast International Ltd. | 1,464,414 | 6,504,230 | |
| Woodside Petroleum Ltd. | 332,483 | 8,057,230 | |
| TOTAL AUSTRALIA | 23,454,904 | ||
| Bermuda - 4.3% | |||
| Cheung Kong Infrastructure Holdings Ltd. | 1,469,000 | 11,593,952 | |
| China Resource Gas Group Ltd. | 3,884,000 | 14,283,825 | |
| Hongkong Land Holdings Ltd. | 2,052,400 | 14,833,188 | |
| Man Wah Holdings Ltd. | 6,098,400 | 4,510,249 | |
| Tai Cheung Holdings Ltd. | 4,627,000 | 5,096,447 | |
| Vtech Holdings Ltd. | 703,500 | 8,566,008 | |
| TOTAL BERMUDA | 58,883,669 | ||
| Cayman Islands - 19.3% | |||
| Alibaba Group Holding Ltd. sponsored ADR (a) | 416,800 | 74,415,472 | |
| Geely Automobile Holdings Ltd. | 3,327,000 | 8,750,116 | |
| International Housewares Retail Co. Ltd. | 11,593,400 | 2,342,554 | |
| JD.com, Inc. sponsored ADR (a) | 440,300 | 16,075,353 | |
| NetEase, Inc. ADR | 57,800 | 14,858,646 | |
| Shenzhou International Group Holdings Ltd. | 1,436,000 | 15,675,715 | |
| Silergy Corp. | 360,000 | 7,515,005 | |
| SITC International Holdings Co. Ltd. | 8,433,000 | 8,984,906 | |
| Tencent Holdings Ltd. | 1,997,100 | 98,183,284 | |
| Value Partners Group Ltd. | 8,663,000 | 8,194,376 | |
| Xinyi Glass Holdings Ltd. | 4,628,000 | 6,653,210 | |
| TOTAL CAYMAN ISLANDS | 261,648,637 | ||
| China - 15.8% | |||
| China Construction Bank Corp. (H Shares) | 31,024,000 | 32,502,575 | |
| China Pacific Insurance (Group) Co. Ltd. (H Shares) | 2,157,800 | 9,521,678 | |
| Gree Electric Appliances, Inc. of Zhuhai Class A | 2,121,500 | 14,713,476 | |
| Hangzhou Hikvision Digital Technology Co. Ltd. Class A | 2,152,800 | 13,039,256 | |
| Jiangsu Hengrui Medicine Co. Ltd. (A Shares) | 1,070,937 | 14,037,303 | |
| Jiangsu Yanghe Brewery Joint-Stock Co. Ltd. Class A | 775,858 | 13,670,891 | |
| Kweichow Moutai Co. Ltd. (A Shares) | 182,781 | 19,032,807 | |
| PICC Property & Casualty Co. Ltd. (H Shares) | 4,633,120 | 8,294,070 | |
| Qingdao Port International Co. Ltd. (b) | 14,740,000 | 12,109,959 | |
| Shanghai International Airport Co. Ltd. (A Shares) | 1,778,269 | 13,966,780 | |
| Shenzhen Expressway Co. (H Shares) | 9,332,000 | 9,469,800 | |
| Shenzhen Inovance Technology Co. Ltd. Class A | 1,932,888 | 10,002,376 | |
| Suofeiya Home Collection Co. Ltd. Class A | 1,357,961 | 6,882,825 | |
| Tonghua Dongbao Pharmaceutical Co. Ltd. Class A | 3,301,960 | 14,937,271 | |
| Yunnan Baiyao Group Co. Ltd. | 1,018,905 | 15,215,896 | |
| Zhengzhou Yutong Bus Co. Ltd. | 2,358,500 | 7,619,485 | |
| TOTAL CHINA | 215,016,448 | ||
| Hong Kong - 9.0% | |||
| AIA Group Ltd. | 5,080,000 | 45,400,976 | |
| China Resources Beer Holdings Co. Ltd. | 3,188,666 | 13,733,356 | |
| CSPC Pharmaceutical Group Ltd. | 8,554,000 | 21,787,540 | |
| Dah Sing Banking Group Ltd. | 4,444,800 | 10,554,922 | |
| Power Assets Holdings Ltd. | 1,322,500 | 9,840,516 | |
| Sino Land Ltd. | 4,792,000 | 8,271,834 | |
| Techtronic Industries Co. Ltd. | 2,150,000 | 12,595,112 | |
| TOTAL HONG KONG | 122,184,256 | ||
| India - 15.7% | |||
| Adani Ports & Special Economic Zone Ltd. | 1,187,844 | 7,266,145 | |
| Amara Raja Batteries Ltd. | 524,656 | 6,778,407 | |
| Axis Bank Ltd. | 1,718,957 | 13,326,142 | |
| Bajaj Corp. Ltd. | 547,431 | 3,936,578 | |
| Bandhan Bank Ltd. (b) | 23,660 | 181,775 | |
| Bharti Infratel Ltd. | 1,332,884 | 6,273,093 | |
| CCL Products (India) Ltd. | 1,559,930 | 7,336,649 | |
| Future Retail Ltd. | 1,091,367 | 9,861,162 | |
| Gujarat Gas Ltd. | 418,580 | 5,560,559 | |
| Havells India Ltd. | 569,841 | 4,673,583 | |
| HDFC Bank Ltd. | 651,319 | 19,630,632 | |
| Housing Development Finance Corp. Ltd. | 923,264 | 26,121,930 | |
| Indian Oil Corp. Ltd. | 2,289,122 | 5,565,189 | |
| Indraprastha Gas Ltd. | 3,138,502 | 13,535,978 | |
| Oberoi Realty Ltd. | 900,978 | 7,423,016 | |
| Petronet LNG Ltd. | 3,603,050 | 12,267,290 | |
| Power Grid Corp. of India Ltd. | 6,610,374 | 20,629,155 | |
| Reliance Industries Ltd. | 2,135,654 | 30,835,426 | |
| UPL Ltd. | 752,532 | 8,239,132 | |
| Vakrangee Ltd. | 1,132,546 | 1,697,626 | |
| VST Industries Ltd. | 58,615 | 2,693,089 | |
| TOTAL INDIA | 213,832,556 | ||
| Indonesia - 2.8% | |||
| PT Bank Central Asia Tbk | 13,795,900 | 21,815,220 | |
| PT Bank Rakyat Indonesia Tbk | 68,894,400 | 15,884,877 | |
| TOTAL INDONESIA | 37,700,097 | ||
| Israel - 0.2% | |||
| Sarine Technologies Ltd. | 3,360,700 | 2,645,553 | |
| Japan - 2.3% | |||
| Disco Corp. | 25,300 | 4,461,983 | |
| Nissan Chemical Industries Co. Ltd. | 205,500 | 9,164,037 | |
| SMC Corp. | 19,300 | 7,365,496 | |
| SoftBank Corp. | 136,400 | 10,422,148 | |
| TOTAL JAPAN | 31,413,664 | ||
| Korea (South) - 8.6% | |||
| Coway Co. Ltd. | 143,388 | 11,715,526 | |
| Cuckoo Holdings Co. Ltd. | 64,790 | 7,199,393 | |
| Hyundai Fire & Marine Insurance Co. Ltd. | 193,621 | 6,915,520 | |
| Kakao M Corp. | 120,897 | 10,103,678 | |
| KB Financial Group, Inc. | 209,244 | 11,856,299 | |
| LG Chemical Ltd. | 31,024 | 10,428,966 | |
| Samsung Electronics Co. Ltd. | 14,061 | 34,843,158 | |
| SK Hynix, Inc. | 298,160 | 23,525,943 | |
| TOTAL KOREA (SOUTH) | 116,588,483 | ||
| Malaysia - 0.3% | |||
| Bursa Malaysia Bhd | 2,156,100 | 3,957,734 | |
| Multi-National - 1.5% | |||
| HKT Trust/HKT Ltd. unit | 15,868,300 | 20,877,699 | |
| Philippines - 1.7% | |||
| Ayala Land, Inc. | 15,554,000 | 12,240,887 | |
| Bank of the Philippine Islands (BPI) | 5,027,094 | 10,190,578 | |
| TOTAL PHILIPPINES | 22,431,465 | ||
| Singapore - 0.6% | |||
| Wing Tai Holdings Ltd. | 5,290,700 | 8,106,255 | |
| Taiwan - 8.8% | |||
| E.SUN Financial Holdings Co. Ltd. | 19,646,552 | 13,868,529 | |
| Micro-Star International Co. Ltd. | 1,996,000 | 6,222,777 | |
| Nien Made Enterprise Co. Ltd. | 674,000 | 5,976,230 | |
| Taiwan Semiconductor Manufacturing Co. Ltd. | 9,380,892 | 71,330,893 | |
| United Microelectronics Corp. | 23,575,000 | 12,690,825 | |
| Voltronic Power Technology Corp. | 569,000 | 10,108,038 | |
| TOTAL TAIWAN | 120,197,292 | ||
| Thailand - 2.6% | |||
| Bangkok Bank PCL (For. Reg.) | 2,017,700 | 12,853,712 | |
| Kasikornbank PCL (For. Reg.) | 2,000,800 | 12,681,206 | |
| Thai Beverage PCL | 14,773,900 | 9,497,946 | |
| TOTAL THAILAND | 35,032,864 | ||
| TOTAL COMMON STOCKS | |||
| (Cost $980,445,310) | 1,293,971,576 | ||
| Nonconvertible Preferred Stocks - 1.0% | |||
| Korea (South) - 1.0% | |||
| Samsung Electronics Co. Ltd. | |||
| (Cost $12,540,081) | 7,031 | 13,879,194 | |
| Money Market Funds - 4.9% | |||
| Fidelity Cash Central Fund, 1.74% (c) | |||
| (Cost $65,834,299) | 65,821,135 | 65,834,299 | |
| TOTAL INVESTMENT IN SECURITIES - 101.1% | |||
| (Cost $1,058,819,690) | 1,373,685,069 | ||
| NET OTHER ASSETS (LIABILITIES) - (1.1)% | (14,923,222) | ||
| NET ASSETS - 100% | $1,358,761,847 |
Categorizations in the Schedule of Investments are based on country or territory of incorporation.
Legend
(a) Non-income producing
(b) Security exempt from registration under Rule 144A of the Securities Act of 1933. These securities may be resold in transactions exempt from registration, normally to qualified institutional buyers. At the end of the period, the value of these securities amounted to $12,291,734 or 0.9% of net assets.
(c) Affiliated fund that is generally available only to investment companies and other accounts managed by Fidelity Investments. The rate quoted is the annualized seven-day yield of the fund at period end. A complete unaudited listing of the fund's holdings as of its most recent quarter end is available upon request. In addition, each Fidelity Central Fund's financial statements are available on the SEC's website or upon request.
Affiliated Central Funds
Information regarding fiscal year to date income earned by the Fund from investments in Fidelity Central Funds is as follows:
| Fund | Income earned |
| Fidelity Cash Central Fund | $268,976 |
| Fidelity Securities Lending Cash Central Fund | 3,556 |
| Total | $272,532 |
Amounts in the income column in the above table include any capital gain distributions from underlying funds, which are presented in the corresponding line-item in the Statement of Operations if applicable.
Investment Valuation
The following is a summary of the inputs used, as of April 30, 2018, involving the Fund's assets and liabilities carried at fair value. The inputs or methodology used for valuing securities may not be an indication of the risk associated with investing in those securities. For more information on valuation inputs, and their aggregation into the levels used below, please refer to the Investment Valuation section in the accompanying Notes to Financial Statements.
| Valuation Inputs at Reporting Date: | ||||
| Description | Total | Level 1 | Level 2 | Level 3 |
| Investments in Securities: | ||||
| Equities: | ||||
| Consumer Discretionary | $133,054,599 | $45,093,950 | $87,960,649 | $-- |
| Consumer Staples | 69,901,316 | -- | 69,901,316 | -- |
| Energy | 56,725,135 | -- | 56,725,135 | -- |
| Financials | 292,646,195 | 6,915,520 | 285,730,675 | -- |
| Health Care | 65,978,010 | -- | 65,978,010 | -- |
| Industrials | 100,990,528 | 7,365,496 | 93,625,032 | -- |
| Information Technology | 385,230,070 | 165,984,396 | 219,245,674 | -- |
| Materials | 27,832,135 | 19,593,003 | 8,239,132 | -- |
| Real Estate | 55,971,627 | -- | 55,971,627 | -- |
| Telecommunication Services | 44,077,170 | -- | 44,077,170 | -- |
| Utilities | 75,443,985 | -- | 75,443,985 | -- |
| Money Market Funds | 65,834,299 | 65,834,299 | -- | -- |
| Total Investments in Securities: | $1,373,685,069 | $310,786,664 | $1,062,898,405 | $-- |
The following is a summary of transfers between Level 1 and Level 2 for the period ended April 30, 2018. Transfers are assumed to have occurred at the beginning of the period, and are primarily attributable to the valuation techniques used for foreign equity securities, as discussed in the accompanying Notes to Financial Statements:
| Transfers | Total |
| Level 1 to Level 2 | $700,695,263 |
| Level 2 to Level 1 | $21,961,994 |
See accompanying notes which are an integral part of the financial statements.
Fidelity® Emerging Asia Fund
Financial Statements
Statement of Assets and Liabilities
| April 30, 2018 (Unaudited) | ||
| Assets | ||
| Investment in securities, at value — See accompanying schedule: Unaffiliated issuers (cost $992,985,391) | $1,307,850,770 | |
| Fidelity Central Funds (cost $65,834,299) | 65,834,299 | |
| Total Investment in Securities (cost $1,058,819,690) | $1,373,685,069 | |
| Foreign currency held at value (cost $272,453) | 272,482 | |
| Receivable for investments sold | 10,129,778 | |
| Receivable for fund shares sold | 1,863,880 | |
| Dividends receivable | 1,344,525 | |
| Distributions receivable from Fidelity Central Funds | 95,391 | |
| Prepaid expenses | 576 | |
| Other receivables | 332,220 | |
| Total assets | 1,387,723,921 | |
| Liabilities | ||
| Payable for investments purchased | $24,187,663 | |
| Payable for fund shares redeemed | 1,535,971 | |
| Accrued management fee | 777,948 | |
| Other affiliated payables | 237,815 | |
| Other payables and accrued expenses | 2,222,677 | |
| Total liabilities | 28,962,074 | |
| Net Assets | $1,358,761,847 | |
| Net Assets consist of: | ||
| Paid in capital | $1,042,912,941 | |
| Undistributed net investment income | 1,306,294 | |
| Accumulated undistributed net realized gain (loss) on investments and foreign currency transactions | 1,903,139 | |
| Net unrealized appreciation (depreciation) on investments and assets and liabilities in foreign currencies | 312,639,473 | |
| Net Assets, for 31,042,655 shares outstanding | $1,358,761,847 | |
| Net Asset Value, offering price and redemption price per share ($1,358,761,847 ÷ 31,042,655 shares) | $43.77 |
See accompanying notes which are an integral part of the financial statements.
Statement of Operations
| Six months ended April 30, 2018 (Unaudited) | ||
| Investment Income | ||
| Dividends | $8,688,178 | |
| Income from Fidelity Central Funds | 272,532 | |
| Income before foreign taxes withheld | 8,960,710 | |
| Less foreign taxes withheld | (660,165) | |
| Total income | 8,300,545 | |
| Expenses | ||
| Management fee | ||
| Basic fee | $4,695,019 | |
| Performance adjustment | 457,908 | |
| Transfer agent fees | 1,131,011 | |
| Accounting and security lending fees | 307,904 | |
| Custodian fees and expenses | 324,317 | |
| Independent trustees' fees and expenses | 2,691 | |
| Registration fees | 48,324 | |
| Audit | 40,762 | |
| Legal | 2,247 | |
| Interest | 1,898 | |
| Miscellaneous | 3,987 | |
| Total expenses before reductions | 7,016,068 | |
| Expense reductions | (110,868) | 6,905,200 |
| Net investment income (loss) | 1,395,345 | |
| Realized and Unrealized Gain (Loss) | ||
| Net realized gain (loss) on: | ||
| Investment securities: | ||
| Unaffiliated issuers | 44,517,004 | |
| Fidelity Central Funds | (262) | |
| Foreign currency transactions | (407,285) | |
| Total net realized gain (loss) | 44,109,457 | |
| Change in net unrealized appreciation (depreciation) on: | ||
| Investment securities: | ||
| Unaffiliated issuers (net of decrease in deferred foreign taxes of $1,848,596) | (39,632,369) | |
| Fidelity Central Funds | 326 | |
| Assets and liabilities in foreign currencies | (29,146) | |
| Total change in net unrealized appreciation (depreciation) | (39,661,189) | |
| Net gain (loss) | 4,448,268 | |
| Net increase (decrease) in net assets resulting from operations | $5,843,613 |
See accompanying notes which are an integral part of the financial statements.
Statement of Changes in Net Assets
| Six months ended April 30, 2018 (Unaudited) | Year ended October 31, 2017 | |
| Increase (Decrease) in Net Assets | ||
| Operations | ||
| Net investment income (loss) | $1,395,345 | $10,858,459 |
| Net realized gain (loss) | 44,109,457 | 2,628,524 |
| Change in net unrealized appreciation (depreciation) | (39,661,189) | 285,498,542 |
| Net increase (decrease) in net assets resulting from operations | 5,843,613 | 298,985,525 |
| Distributions to shareholders from net investment income | (10,579,210) | (9,245,057) |
| Distributions to shareholders from net realized gain | (630,740) | (1,418,120) |
| Total distributions | (11,209,950) | (10,663,177) |
| Share transactions | ||
| Proceeds from sales of shares | 357,795,196 | 240,731,562 |
| Reinvestment of distributions | 9,352,064 | 9,645,118 |
| Cost of shares redeemed | (289,373,379) | (174,712,854) |
| Net increase (decrease) in net assets resulting from share transactions | 77,773,881 | 75,663,826 |
| Redemption fees | 23,229 | 79,537 |
| Total increase (decrease) in net assets | 72,430,773 | 364,065,711 |
| Net Assets | ||
| Beginning of period | 1,286,331,074 | 922,265,363 |
| End of period | $1,358,761,847 | $1,286,331,074 |
| Other Information | ||
| Undistributed net investment income end of period | $1,306,294 | $10,490,159 |
| Shares | ||
| Sold | 7,910,344 | 6,226,419 |
| Issued in reinvestment of distributions | 215,039 | 301,034 |
| Redeemed | (6,357,283) | (4,887,212) |
| Net increase (decrease) | 1,768,100 | 1,640,241 |
See accompanying notes which are an integral part of the financial statements.
Financial Highlights
Fidelity Emerging Asia Fund
| Six months ended (Unaudited) April 30, | Years endedOctober 31, | |||||
| 2018 | 2017 | 2016 | 2015 | 2014 | 2013 | |
| Selected Per–Share Data | ||||||
| Net asset value, beginning of period | $43.94 | $33.37 | $31.20 | $33.03 | $30.91 | $28.57 |
| Income from Investment Operations | ||||||
| Net investment income (loss)A | .05 | .40 | .39 | .42 | .43 | .39 |
| Net realized and unrealized gain (loss) | .17 | 10.56 | 1.91 | (1.96) | 2.08 | 2.49 |
| Total from investment operations | .22 | 10.96 | 2.30 | (1.54) | 2.51 | 2.88 |
| Distributions from net investment income | (.37) | (.34) | (.13) | (.29) | (.39) | (.46) |
| Distributions from net realized gain | (.02) | (.05) | – | – | – | (.08) |
| Total distributions | (.39) | (.39) | (.13) | (.29) | (.39) | (.54) |
| Redemption fees added to paid in capitalA,B | – | – | – | – | – | – |
| Net asset value, end of period | $43.77 | $43.94 | $33.37 | $31.20 | $33.03 | $30.91 |
| Total ReturnC,D | .51% | 33.28% | 7.42% | (4.69)% | 8.21% | 10.19% |
| Ratios to Average Net AssetsE,F | ||||||
| Expenses before reductions | 1.03%G | 1.10% | 1.16% | 1.09% | 1.04% | 1.08% |
| Expenses net of fee waivers, if any | 1.03%G | 1.10% | 1.16% | 1.09% | 1.04% | 1.08% |
| Expenses net of all reductions | 1.02%G | 1.08% | 1.16% | 1.09% | 1.04% | 1.05% |
| Net investment income (loss) | .21%G | 1.07% | 1.25% | 1.26% | 1.36% | 1.31% |
| Supplemental Data | ||||||
| Net assets, end of period (000 omitted) | $1,358,762 | $1,286,331 | $922,265 | $1,008,178 | $1,111,277 | $1,172,348 |
| Portfolio turnover rateH | 44%G | 40% | 77% | 68% | 90% | 97% |
A Calculated based on average shares outstanding during the period.
B Amount represents less than $.005 per share.
C Total returns for periods of less than one year are not annualized.
D Total returns would have been lower if certain expenses had not been reduced during the applicable periods shown.
E Fees and expenses of any underlying Fidelity Central Funds are not included in the Fund's expense ratio. The Fund indirectly bears its proportionate share of the expenses of any underlying Fidelity Central Funds.
F Expense ratios reflect operating expenses of the Fund. Expenses before reductions do not reflect amounts reimbursed by the investment adviser or reductions from brokerage service arrangements or reductions from other expense offset arrangements and do not represent the amount paid by the Fund during periods when reimbursements or reductions occur. Expenses net of fee waivers reflect expenses after reimbursement by the investment adviser but prior to reductions from brokerage service arrangements or other expense offset arrangements. Expenses net of all reductions represent the net expenses paid by the Fund.
G Annualized
H Amount does not include the portfolio activity of any underlying Fidelity Central Funds.
See accompanying notes which are an integral part of the financial statements.
Notes to Financial Statements (Unaudited)
For the period ended April 30, 2018
1. Organization.
Fidelity Emerging Asia Fund (the Fund) is a fund of Fidelity Investment Trust (the Trust) and is authorized to issue an unlimited number of shares. Share transactions on the Statement of Changes in Net Assets may contain exchanges between affiliated funds. The Trust is registered under the Investment Company Act of 1940, as amended (the 1940 Act), as an open-end management investment company organized as a Massachusetts business trust. The Fund's investments in emerging markets can be subject to social, economic, regulatory, and political uncertainties and can be extremely volatile.
2. Investments in Fidelity Central Funds.
The Fund invests in Fidelity Central Funds, which are open-end investment companies generally available only to other investment companies and accounts managed by the investment adviser and its affiliates. The Fund's Schedule of Investments lists each of the Fidelity Central Funds held as of period end, if any, as an investment of the Fund, but does not include the underlying holdings of each Fidelity Central Fund. As an Investing Fund, the Fund indirectly bears its proportionate share of the expenses of the underlying Fidelity Central Funds.
The Money Market Central Funds seek preservation of capital and current income and are managed by Fidelity Investments Money Management, Inc. (FIMM), an affiliate of the investment adviser. Annualized expenses of the Money Market Central Funds as of their most recent shareholder report date are less than .005%.
A complete unaudited list of holdings for each Fidelity Central Fund is available upon request or at the Securities and Exchange Commission (the SEC) website at www.sec.gov. In addition, the financial statements of the Fidelity Central Funds are available on the SEC website or upon request.
3. Significant Accounting Policies.
The Fund is an investment company and applies the accounting and reporting guidance of the Financial Accounting Standards Board (FASB) Accounting Standards Codification Topic 946 Financial Services – Investments Companies. The financial statements have been prepared in conformity with accounting principles generally accepted in the United States of America (GAAP), which require management to make certain estimates and assumptions at the date of the financial statements. Actual results could differ from those estimates. Subsequent events, if any, through the date that the financial statements were issued have been evaluated in the preparation of the financial statements. The following summarizes the significant accounting policies of the Fund:
Investment Valuation. Investments are valued as of 4:00 p.m. Eastern time on the last calendar day of the period. The Board of Trustees (the Board) has delegated the day to day responsibility for the valuation of the Fund's investments to the Fair Value Committee (the Committee) established by the Fund's investment adviser. In accordance with valuation policies and procedures approved by the Board, the Fund attempts to obtain prices from one or more third party pricing vendors or brokers to value its investments. When current market prices, quotations or currency exchange rates are not readily available or reliable, investments will be fair valued in good faith by the Committee, in accordance with procedures adopted by the Board. Factors used in determining fair value vary by investment type and may include market or investment specific events. The frequency with which these procedures are used cannot be predicted and they may be utilized to a significant extent. The Committee oversees the Fund's valuation policies and procedures and reports to the Board on the Committee's activities and fair value determinations. The Board monitors the appropriateness of the procedures used in valuing the Fund's investments and ratifies the fair value determinations of the Committee.
The Fund categorizes the inputs to valuation techniques used to value its investments into a disclosure hierarchy consisting of three levels as shown below:
- Level 1 – quoted prices in active markets for identical investments
- Level 2 – other significant observable inputs (including quoted prices for similar investments, interest rates, prepayment speeds, etc.)
- Level 3 – unobservable inputs (including the Fund's own assumptions based on the best information available)
Valuation techniques used to value the Fund's investments by major category are as follows:
Equity securities, including restricted securities, for which market quotations are readily available, are valued at the last reported sale price or official closing price as reported by a third party pricing vendor on the primary market or exchange on which they are traded and are categorized as Level 1 in the hierarchy. In the event there were no sales during the day or closing prices are not available, securities are valued at the last quoted bid price or may be valued using the last available price and are generally categorized as Level 2 in the hierarchy. For foreign equity securities, when market or security specific events arise, comparisons to the valuation of American Depositary Receipts (ADRs), futures contracts, Exchange-Traded Funds (ETFs) and certain indexes as well as quoted prices for similar securities may be used and would be categorized as Level 2 in the hierarchy. Utilizing these techniques may result in transfers between Level 1 and Level 2. For equity securities, including restricted securities, where observable inputs are limited, assumptions about market activity and risk are used and these securities may be categorized as Level 3 in the hierarchy.
Investments in open-end mutual funds, including the Fidelity Central Funds, are valued at their closing net asset value (NAV) each business day and are categorized as Level 1 in the hierarchy.
Changes in valuation techniques may result in transfers in or out of an assigned level within the disclosure hierarchy. The aggregate value of investments by input level as of April 30, 2018, including information on transfers between Levels 1 and 2, is included at the end of the Fund's Schedule of Investments.
Foreign Currency. The Fund may use foreign currency contracts to facilitate transactions in foreign-denominated securities. Gains and losses from these transactions may arise from changes in the value of the foreign currency or if the counterparties do not perform under the contracts' terms.
Foreign-denominated assets, including investment securities, and liabilities are translated into U.S. dollars at the exchange rates at period end. Purchases and sales of investment securities, income and dividends received and expenses denominated in foreign currencies are translated into U.S. dollars at the exchange rate in effect on the transaction date.
The effects of exchange rate fluctuations on investments are included with the net realized and unrealized gain (loss) on investment securities. Other foreign currency transactions resulting in realized and unrealized gain (loss) are disclosed separately.
Investment Transactions and Income. For financial reporting purposes, the Fund's investment holdings and NAV include trades executed through the end of the last business day of the period. The NAV per share for processing shareholder transactions is calculated as of the close of business of the New York Stock Exchange (NYSE), normally 4:00 p.m. Eastern time and includes trades executed through the end of the prior business day. Gains and losses on securities sold are determined on the basis of identified cost and include proceeds received from litigation. Dividend income is recorded on the ex-dividend date, except for certain dividends from foreign securities where the ex-dividend date may have passed, which are recorded as soon as the Fund is informed of the ex-dividend date. Non-cash dividends included in dividend income, if any, are recorded at the fair market value of the securities received. Income and capital gain distributions from Fidelity Central Funds, if any, are recorded on the ex-dividend date. Certain distributions received by the Fund represent a return of capital or capital gain. The Fund determines the components of these distributions subsequent to the ex-dividend date, based upon receipt of tax filings or other correspondence relating to the underlying investment. These distributions are recorded as a reduction of cost of investments and/or as a realized gain. Investment income is recorded net of foreign taxes withheld where recovery of such taxes is uncertain.
Expenses. Expenses directly attributable to a fund are charged to that fund. Expenses attributable to more than one fund are allocated among the respective funds on the basis of relative net assets or other appropriate methods. Expense estimates are accrued in the period to which they relate and adjustments are made when actual amounts are known.
Income Tax Information and Distributions to Shareholders. Each year, the Fund intends to qualify as a regulated investment company under Subchapter M of the Internal Revenue Code, including distributing substantially all of its taxable income and realized gains. As a result, no provision for U.S. Federal income taxes is required. The Fund files a U.S. federal tax return, in addition to state and local tax returns as required. The Fund's federal income tax returns are subject to examination by the Internal Revenue Service (IRS) for a period of three fiscal years after they are filed. State and local tax returns may be subject to examination for an additional fiscal year depending on the jurisdiction. Foreign taxes are provided for based on the Fund's understanding of the tax rules and rates that exist in the foreign markets in which it invests. The Fund is subject to a tax imposed on capital gains by certain countries in which it invests. An estimated deferred tax liability for net unrealized appreciation on the applicable securities is included in Other payables and accrued expenses on the Statement of Assets & Liabilities.
Distributions are declared and recorded on the ex-dividend date. Income and capital gain distributions are determined in accordance with income tax regulations, which may differ from GAAP.
Capital accounts within the financial statements are adjusted for permanent book-tax differences. These adjustments have no impact on net assets or the results of operations. Capital accounts are not adjusted for temporary book-tax differences which will reverse in a subsequent period.
Book-tax differences are primarily due to foreign currency transactions, certain foreign taxes, passive foreign investment companies (PFIC), deferred trustees compensation, capital loss carryforwards, expiring capital loss carryforwards and losses deferred due to wash sales.
As of period end, the cost and unrealized appreciation (depreciation) in securities, and derivatives if applicable, for federal income tax purposes were as follows:
| Gross unrealized appreciation | $353,727,121 |
| Gross unrealized depreciation | (40,599,098) |
| Net unrealized appreciation (depreciation) | $313,128,023 |
| Tax cost | $1,060,557,046 |
Capital loss carryforwards are only available to offset future capital gains of the Fund to the extent provided by regulations and may be limited. Under the Regulated Investment Company Modernization Act of 2010 (the Act), the Fund is permitted to carry forward capital losses incurred in taxable years beginning after December 22, 2010 for an unlimited period and such capital losses are required to be used prior to any losses that expire. The capital loss carryforward information presented below, including any applicable limitation, is estimated as of prior fiscal period end and is subject to adjustment.
| No expiration | |
| Short-term | $(20,330,977) |
| Long-term | (20,855,934) |
| Total capital loss carryforward | $(41,186,911) |
Short-Term Trading (Redemption) Fees. Shares held by investors in the Fund less than 90 days may have been subject to a redemption fee equal to 1.50% of the NAV of shares redeemed. All redemption fees, which reduce the proceeds of the shareholder redemption, are retained by the Fund and accounted for as an addition to paid in capital. In November 2017, the Board of Trustees approved the elimination of these redemption fees effective December 18, 2017.
Restricted Securities. The Fund may invest in securities that are subject to legal or contractual restrictions on resale. These securities generally may be resold in transactions exempt from registration or to the public if the securities are registered. Disposal of these securities may involve time-consuming negotiations and expense, and prompt sale at an acceptable price may be difficult. Information regarding restricted securities is included at the end of the Fund's Schedule of Investments.
4. Purchases and Sales of Investments.
Purchases and sales of securities, other than short-term securities, aggregated $331,724,583 and $288,507,815, respectively.
5. Fees and Other Transactions with Affiliates.
Management Fee. Fidelity Management & Research Company (the investment adviser) and its affiliates provide the Fund with investment management related services for which the Fund pays a monthly management fee. The management fee is the sum of an individual fund fee rate that is based on an annual rate of .45% of the Fund's average net assets and an annualized group fee rate that averaged .24% during the period. The group fee rate is based upon the average net assets of all the mutual funds advised by the investment adviser, including any mutual funds previously advised by the investment adviser that are currently advised by Fidelity SelectCo, LLC, an affiliate of the investment adviser. The group fee rate decreases as assets under management increase and increases as assets under management decrease. In addition, the management fee is subject to a performance adjustment (up to a maximum of +/- .20% of the Fund's average net assets over a 36 month performance period). The upward or downward adjustment to the management fee is based on the Fund's relative investment performance as compared to its benchmark index, the MSCI All Country Asia ex Japan Index, over the same 36 month performance period. For the reporting period, the total annualized management fee rate, including the performance adjustment, was .76% of the Fund's average net assets. The performance adjustment included in the management fee rate may be higher or lower than the maximum performance adjustment rate due to the difference between the average net assets for the reporting and performance periods.
Transfer Agent Fees. Fidelity Investments Institutional Operations Company, Inc. (FIIOC), an affiliate of the investment adviser, is the Fund's transfer, dividend disbursing and shareholder servicing agent. FIIOC receives account fees and asset-based fees that vary according to account size and type of account. FIIOC pays for typesetting, printing and mailing of shareholder reports, except proxy statements. For the period, the transfer agent fees were equivalent to an annualized rate of .17% of average net assets.
Accounting and Security Lending Fees. Fidelity Service Company, Inc. (FSC), an affiliate of the investment adviser, maintains the Fund's accounting records. The accounting fee is based on the level of average net assets for each month. Under a separate contract, FSC administers the security lending program. The security lending fee is based on the number and duration of lending transactions. For the period, the fees were equivalent to an annualized rate of .05%.
Brokerage Commissions. The Fund placed a portion of its portfolio transactions with brokerage firms which are affiliates of the investment adviser. Brokerage commissions are included in net realized gain (loss) and change in net unrealized appreciation (depreciation) in the Statement of Operations. The commissions paid to these affiliated firms were $196 for the period.
Interfund Lending Program. Pursuant to an Exemptive Order issued by the SEC, the Fund, along with other registered investment companies having management contracts with Fidelity Management & Research Company (FMR) or other affiliated entities of FMR, may participate in an interfund lending program. This program provides an alternative credit facility allowing the funds to borrow from, or lend money to, other participating affiliated funds. At period end, there were no interfund loans outstanding. The Fund's activity in this program during the period for which loans were outstanding was as follows:
| Borrower or Lender | Average Loan Balance | Weighted Average Interest Rate | Interest Expense |
| Borrower | $20,113,000 | 1.70% | $1,898 |
Interfund Trades. The Fund may purchase from or sell securities to other Fidelity Funds under procedures adopted by the Board. The procedures have been designed to ensure these interfund trades are executed in accordance with Rule 17a-7 of the 1940 Act. Interfund trades are included within the respective purchases and sales amounts shown in the Purchases and Sales of Investments note.
6. Committed Line of Credit.
The Fund participates with other funds managed by the investment adviser or an affiliate in a $4.25 billion credit facility (the "line of credit") to be utilized for temporary or emergency purposes to fund shareholder redemptions or for other short-term liquidity purposes. The Fund has agreed to pay commitment fees on its pro-rata portion of the line of credit, which amounted to $1,913 and is reflected in Miscellaneous expenses on the Statement of Operations. During the period, the Fund did not borrow on this line of credit.
7. Security Lending.
The Fund lends portfolio securities through a lending agent from time to time in order to earn additional income. For equity securities, a lending agent is used and may loan securities to certain qualified borrowers, including Fidelity Capital Markets (FCM), a broker-dealer affiliated with the Fund. On the settlement date of the loan, the Fund receives collateral (in the form of U.S. Treasury obligations, letters of credit and/or cash) against the loaned securities and maintains collateral in an amount not less than 100% of the market value of the loaned securities during the period of the loan. The market value of the loaned securities is determined at the close of business of the Fund and any additional required collateral is delivered to the Fund on the next business day. The Fund or borrower may terminate the loan at any time, and if the borrower defaults on its obligation to return the securities loaned because of insolvency or other reasons, the Fund may apply collateral received from the borrower against the obligation. The Fund may experience delays and costs in recovering the securities loaned. Any cash collateral received is invested in the Fidelity Securities Lending Cash Central Fund. At period end, there were no security loans outstanding. Security lending income represents the income earned on investing cash collateral, less rebates paid to borrowers and any lending agent fees associated with the loan, plus any premium payments received for lending certain types of securities. Security lending income is presented in the Statement of Operations as a component of income from Fidelity Central Funds. Total security lending income during the period amounted to $3,556. During the period, there were no securities loaned to FCM.
8. Expense Reductions.
Commissions paid to certain brokers with whom the investment adviser, or its affiliates, places trades on behalf of the Fund include an amount in addition to trade execution, which may be rebated back to the Fund to offset certain expenses. This amount totaled $104,018 for the period. In addition, through arrangements with the Fund's custodian, credits realized as a result of certain uninvested cash balances were used to reduce the Fund's expenses. During the period, these credits reduced the Fund's custody expenses by $480.
In addition, during the period the investment adviser reimbursed and/or waived a portion of operating expenses in the amount of $6,370.
9. Other.
The Fund's organizational documents provide former and current trustees and officers with a limited indemnification against liabilities arising in connection with the performance of their duties to the Fund. In the normal course of business, the Fund may also enter into contracts that provide general indemnifications. The Fund's maximum exposure under these arrangements is unknown as this would be dependent on future claims that may be made against the Fund. The risk of material loss from such claims is considered remote.
Fidelity® Emerging Markets Fund
Investment Summary (Unaudited)
Geographic Diversification (% of fund's net assets)
| As of April 30, 2018 | ||
| Cayman Islands | 14.7% | |
| India | 11.9% | |
| United States of America* | 9.9% | |
| Brazil | 9.2% | |
| China | 8.0% | |
| Korea (South) | 7.4% | |
| South Africa | 5.8% | |
| Taiwan | 4.1% | |
| Mexico | 3.5% | |
| Other | 25.5% | |
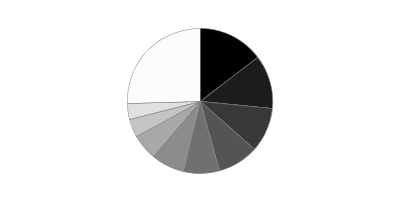
* Includes Short-Term investments and Net Other Assets (Liabilities).
Percentages are based on country or territory of incorporation and are adjusted for the effect of futures contracts, if applicable.
Asset Allocation as of April 30, 2018
| % of fund's net assets | |
| Stocks | 98.4 |
| Short-Term Investments and Net Other Assets (Liabilities) | 1.6 |
Top Ten Stocks as of April 30, 2018
| % of fund's net assets | |
| Tencent Holdings Ltd. (Cayman Islands, Internet Software & Services) | 5.9 |
| Samsung Electronics Co. Ltd. (Korea (South), Technology Hardware, Storage & Peripherals) | 5.7 |
| Alibaba Group Holding Ltd. sponsored ADR (Cayman Islands, Internet Software & Services) | 4.4 |
| Taiwan Semiconductor Manufacturing Co. Ltd. (Taiwan, Semiconductors & Semiconductor Equipment) | 4.1 |
| Naspers Ltd. Class N (South Africa, Media) | 2.5 |
| Ping An Insurance (Group) Co. of China Ltd. (H Shares) (China, Insurance) | 1.5 |
| Itau Unibanco Holding SA (Brazil, Banks) | 1.4 |
| Housing Development Finance Corp. Ltd. (India, Thrifts & Mortgage Finance) | 1.3 |
| Reliance Industries Ltd. (India, Oil, Gas & Consumable Fuels) | 1.3 |
| Sberbank of Russia (Russia, Banks) | 1.3 |
| 29.4 |
Top Market Sectors as of April 30, 2018
| % of fund's net assets | |
| Information Technology | 28.3 |
| Financials | 22.1 |
| Consumer Discretionary | 15.6 |
| Industrials | 8.7 |
| Consumer Staples | 7.2 |
| Materials | 6.9 |
| Health Care | 3.3 |
| Energy | 1.8 |
| Utilities | 1.7 |
| Telecommunication Services | 1.6 |
Fidelity® Emerging Markets Fund
Schedule of Investments April 30, 2018 (Unaudited)
Showing Percentage of Net Assets
| Common Stocks - 95.1% | |||
| Shares | Value | ||
| Argentina - 1.0% | |||
| Banco Macro SA sponsored ADR | 273,149 | $26,473,601 | |
| Telecom Argentina SA Class B sponsored ADR | 880,186 | 26,440,787 | |
| TOTAL ARGENTINA | 52,914,388 | ||
| Australia - 0.5% | |||
| Amcor Ltd. | 2,416,916 | 24,906,258 | |
| Belgium - 0.5% | |||
| Umicore SA | 513,389 | 28,679,745 | |
| Bermuda - 0.9% | |||
| Credicorp Ltd. (United States) | 198,832 | 46,226,452 | |
| Brazil - 5.9% | |||
| BM&F BOVESPA SA | 5,837,300 | 42,156,797 | |
| BTG Pactual Participations Ltd. unit | 4,100,900 | 26,198,373 | |
| CVC Brasil Operadora e Agencia de Viagens SA | 1,797,800 | 29,759,769 | |
| Equatorial Energia SA | 1,505,300 | 30,572,646 | |
| Hapvida Participacoes e Investimentos SA | 3,373,000 | 26,622,360 | |
| IRB Brasil Resseguros SA | 2,193,400 | 29,615,158 | |
| Itausa-Investimentos Itau SA | 285,238 | 1,099,199 | |
| Localiza Rent A Car SA | 3,689,600 | 29,373,985 | |
| Lojas Renner SA | 3,410,200 | 31,744,297 | |
| Notre Dame Intermedica Participacoes SA | 4,881,200 | 28,424,435 | |
| Suzano Papel e Celulose SA | 3,083,200 | 36,137,301 | |
| TOTAL BRAZIL | 311,704,320 | ||
| Cayman Islands - 14.7% | |||
| 58.com, Inc. ADR (a) | 461,000 | 40,286,790 | |
| Alibaba Group Holding Ltd. sponsored ADR (a) | 1,304,400 | 232,887,576 | |
| JD.com, Inc. sponsored ADR (a) | 1,396,400 | 50,982,564 | |
| Melco Crown Entertainment Ltd. sponsored ADR | 979,800 | 30,579,558 | |
| New Oriental Education & Technology Group, Inc. sponsored ADR | 430,483 | 38,674,593 | |
| Sands China Ltd. | 5,055,400 | 29,217,085 | |
| Shenzhou International Group Holdings Ltd. | 3,570,000 | 38,970,962 | |
| Tencent Holdings Ltd. | 6,289,700 | 309,220,060 | |
| TOTAL CAYMAN ISLANDS | 770,819,188 | ||
| Chile - 0.6% | |||
| Banco Santander Chile sponsored ADR | 964,100 | 31,844,223 | |
| China - 8.0% | |||
| China International Travel Service Corp. Ltd. (A Shares) | 3,262,600 | 26,672,480 | |
| China Merchants Bank Co. Ltd. (H Shares) | 10,146,500 | 44,242,800 | |
| Dong E-E-Jiao Co. Ltd. Class A | 2,782,450 | 25,894,729 | |
| Gree Electric Appliances, Inc. of Zhuhai Class A | 3,656,735 | 25,360,963 | |
| Hangzhou Hikvision Digital Technology Co. Ltd. Class A | 4,354,060 | 26,372,028 | |
| Inner Mongoli Yili Industries Co. Ltd. (A Shares) | 6,523,697 | 27,010,873 | |
| Jiangsu Yanghe Brewery Joint-Stock Co. Ltd. Class A | 1,613,267 | 28,426,333 | |
| Kweichow Moutai Co. Ltd. (A Shares) | 248,879 | 25,915,527 | |
| Midea Group Co. Ltd. Class A | 3,365,248 | 27,361,322 | |
| Ping An Insurance (Group) Co. of China Ltd. (H Shares) | 7,769,500 | 75,918,891 | |
| Shanghai International Airport Co. Ltd. (A Shares) | 3,798,984 | 29,837,767 | |
| Shenzhen Inovance Technology Co. Ltd. Class A | 5,954,144 | 30,811,713 | |
| Yunnan Baiyao Group Co. Ltd. | 1,880,727 | 28,085,981 | |
| TOTAL CHINA | 421,911,407 | ||
| France - 2.3% | |||
| Kering SA (b) | 50,575 | 29,291,268 | |
| LVMH Moet Hennessy - Louis Vuitton SA (b) | 90,008 | 31,323,877 | |
| Pernod Ricard SA | 171,100 | 28,420,631 | |
| Rubis | 388,400 | 30,252,554 | |
| TOTAL FRANCE | 119,288,330 | ||
| Germany - 1.2% | |||
| adidas AG | 117,389 | 28,904,651 | |
| Wirecard AG | 239,500 | 32,710,805 | |
| TOTAL GERMANY | 61,615,456 | ||
| Hong Kong - 2.4% | |||
| AIA Group Ltd. | 3,567,400 | 31,882,568 | |
| CSPC Pharmaceutical Group Ltd. | 15,334,000 | 39,056,598 | |
| Galaxy Entertainment Group Ltd. | 3,331,000 | 29,155,018 | |
| Techtronic Industries Co. Ltd. | 4,747,000 | 27,808,836 | |
| TOTAL HONG KONG | 127,903,020 | ||
| Hungary - 0.7% | |||
| OTP Bank PLC | 846,400 | 36,978,767 | |
| India - 11.9% | |||
| Adani Ports & Special Economic Zone Ltd. | 5,729,054 | 35,045,121 | |
| Asian Paints Ltd. | 1,853,120 | 33,439,243 | |
| Eicher Motors Ltd. | 71,663 | 33,482,846 | |
| Godrej Consumer Products Ltd. | 1,893,366 | 31,727,509 | |
| HDFC Bank Ltd. | 930,274 | 28,038,284 | |
| Hero Motocorp Ltd. | 570,924 | 31,981,642 | |
| Housing Development Finance Corp. Ltd. | 2,474,721 | 70,017,339 | |
| Indraprastha Gas Ltd. | 6,178,722 | 26,648,077 | |
| IndusInd Bank Ltd. | 1,093,836 | 31,115,159 | |
| Kotak Mahindra Bank Ltd. (a) | 1,720,295 | 31,281,663 | |
| Larsen & Toubro Ltd. | 1,881,470 | 39,551,653 | |
| LIC Housing Finance Ltd. | 3,592,264 | 29,410,801 | |
| Maruti Suzuki India Ltd. | 314,636 | 41,595,791 | |
| Motherson Sumi Systems Ltd. | 5,938,661 | 31,464,754 | |
| PC Jeweller Ltd. | 660,493 | 1,429,961 | |
| Pidilite Industries Ltd. (a) | 1,766,324 | 28,804,441 | |
| Reliance Industries Ltd. | 4,809,684 | 69,444,139 | |
| Ultratech Cemco Ltd. | 501,696 | 30,931,098 | |
| TOTAL INDIA | 625,409,521 | ||
| Indonesia - 1.5% | |||
| PT Bank Central Asia Tbk | 25,863,500 | 40,897,509 | |
| PT Bank Rakyat Indonesia Tbk | 171,269,700 | 39,489,394 | |
| TOTAL INDONESIA | 80,386,903 | ||
| Ireland - 0.5% | |||
| Accenture PLC Class A | 184,800 | 27,941,760 | |
| Israel - 0.5% | |||
| Frutarom Industries Ltd. | 291,600 | 27,993,665 | |
| Japan - 1.7% | |||
| Daikin Industries Ltd. | 245,600 | 28,767,911 | |
| Keyence Corp. | 49,700 | 30,446,478 | |
| Misumi Group, Inc. | 1,000,400 | 27,727,881 | |
| TOTAL JAPAN | 86,942,270 | ||
| Kenya - 0.5% | |||
| Safaricom Ltd. | 99,109,600 | 27,914,718 | |
| Korea (South) - 7.4% | |||
| LG Chemical Ltd. | 128,896 | 43,329,421 | |
| LG Household & Health Care Ltd. | 35,793 | 45,788,837 | |
| Samsung Electronics Co. Ltd. | 120,873 | 299,523,294 | |
| TOTAL KOREA (SOUTH) | 388,641,552 | ||
| Mexico - 3.5% | |||
| Embotelladoras Arca S.A.B. de CV | 4,310,100 | 29,789,436 | |
| Fomento Economico Mexicano S.A.B. de CV unit | 4,628,367 | 44,739,277 | |
| Grupo Aeroportuario del Pacifico S.A.B. de CV Series B | 3,103,857 | 32,286,532 | |
| Grupo Aeroportuario del Sureste S.A.B. de CV Series B | 1,770,520 | 31,840,306 | |
| Grupo Mexico SA de CV Series B | 8,589,942 | 28,554,982 | |
| Wal-Mart de Mexico SA de CV Series V | 6,001,233 | 16,676,465 | |
| TOTAL MEXICO | 183,886,998 | ||
| Netherlands - 1.0% | |||
| ASML Holding NV (Netherlands) | 142,300 | 27,065,033 | |
| Yandex NV Series A (a) | 827,000 | 27,588,720 | |
| TOTAL NETHERLANDS | 54,653,753 | ||
| Philippines - 2.5% | |||
| Ayala Corp. | 1,721,825 | 32,076,650 | |
| Ayala Land, Inc. | 41,781,200 | 32,881,507 | |
| SM Investments Corp. | 1,869,343 | 33,855,065 | |
| SM Prime Holdings, Inc. | 50,192,700 | 33,127,940 | |
| TOTAL PHILIPPINES | 131,941,162 | ||
| Russia - 1.3% | |||
| Sberbank of Russia | 18,487,500 | 65,898,603 | |
| South Africa - 5.8% | |||
| Capitec Bank Holdings Ltd. | 445,900 | 31,745,412 | |
| Discovery Ltd. | 2,212,185 | 30,715,897 | |
| FirstRand Ltd. | 8,423,100 | 45,110,138 | |
| Mondi Ltd. | 1,086,166 | 31,688,736 | |
| Naspers Ltd. Class N | 540,512 | 131,679,297 | |
| Sanlam Ltd. | 5,512,300 | 34,821,310 | |
| TOTAL SOUTH AFRICA | 305,760,790 | ||
| Spain - 0.5% | |||
| Amadeus IT Holding SA Class A | 385,800 | 28,279,649 | |
| Switzerland - 0.5% | |||
| Sika AG | 3,580 | 26,118,466 | |
| Taiwan - 4.1% | |||
| Taiwan Semiconductor Manufacturing Co. Ltd. | 28,097,000 | 213,645,367 | |
| Thailand - 1.6% | |||
| Airports of Thailand PCL (For. Reg.) | 17,293,700 | 38,899,980 | |
| C.P. ALL PCL (For. Reg.) | 15,514,700 | 42,673,185 | |
| TOTAL THAILAND | 81,573,165 | ||
| Turkey - 1.6% | |||
| Tofas Turk Otomobil Fabrikasi A/S | 3,869,873 | 23,836,002 | |
| Tupras Turkiye Petrol Rafinerileri A/S | 1,141,058 | 29,073,510 | |
| Turkcell Iletisim Hizmet A/S | 8,822,000 | 30,318,092 | |
| TOTAL TURKEY | 83,227,604 | ||
| United Arab Emirates - 0.6% | |||
| DP World Ltd. | 1,381,380 | 30,735,705 | |
| United Kingdom - 1.1% | |||
| NMC Health PLC | 583,700 | 28,671,727 | |
| Prudential PLC | 1,081,322 | 27,805,178 | |
| TOTAL UNITED KINGDOM | 56,476,905 | ||
| United States of America - 8.3% | |||
| A.O. Smith Corp. | 445,800 | 27,349,830 | |
| Alphabet, Inc. Class A (a) | 25,860 | 26,340,479 | |
| Amphenol Corp. Class A | 319,500 | 26,745,345 | |
| Facebook, Inc. Class A (a) | 165,700 | 28,500,400 | |
| Hilton Worldwide Holdings, Inc. | 327,000 | 25,780,680 | |
| MasterCard, Inc. Class A | 165,400 | 29,485,858 | |
| Mettler-Toledo International, Inc. (a) | 49,200 | 27,548,556 | |
| Moody's Corp. | 177,100 | 28,725,620 | |
| MSCI, Inc. | 195,500 | 29,291,765 | |
| NVIDIA Corp. | 123,100 | 27,685,190 | |
| PayPal Holdings, Inc. (a) | 355,100 | 26,494,011 | |
| S&P Global, Inc. | 151,200 | 28,516,320 | |
| Sherwin-Williams Co. | 71,200 | 26,177,392 | |
| Visa, Inc. Class A | 235,300 | 29,854,864 | |
| Yum China Holdings, Inc. | 1,046,900 | 44,765,444 | |
| TOTAL UNITED STATES OF AMERICA | 433,261,754 | ||
| TOTAL COMMON STOCKS | |||
| (Cost $3,525,452,422) | 4,995,481,864 | ||
| Nonconvertible Preferred Stocks - 3.3% | |||
| Brazil - 3.3% | |||
| Ambev SA sponsored ADR | 8,458,500 | 55,995,270 | |
| Itau Unibanco Holding SA | 5,063,610 | 73,731,088 | |
| Itausa-Investimentos Itau SA (PN) | 10,870,300 | 42,231,327 | |
| TOTAL BRAZIL | |||
| (Cost $135,919,181) | 171,957,685 | ||
| Money Market Funds - 1.7% | |||
| Fidelity Cash Central Fund, 1.74% (c) | 46,060,709 | 46,069,921 | |
| Fidelity Securities Lending Cash Central Fund 1.74% (c)(d) | 42,840,381 | 42,844,665 | |
| TOTAL MONEY MARKET FUNDS | |||
| (Cost $88,914,586) | 88,914,586 | ||
| TOTAL INVESTMENT IN SECURITIES - 100.1% | |||
| (Cost $3,750,286,189) | 5,256,354,135 | ||
| NET OTHER ASSETS (LIABILITIES) - (0.1)% | (2,795,333) | ||
| NET ASSETS - 100% | $5,253,558,802 |
Categorizations in the Schedule of Investments are based on country or territory of incorporation.
Legend
(a) Non-income producing
(b) Security or a portion of the security is on loan at period end.
(c) Affiliated fund that is generally available only to investment companies and other accounts managed by Fidelity Investments. The rate quoted is the annualized seven-day yield of the fund at period end. A complete unaudited listing of the fund's holdings as of its most recent quarter end is available upon request. In addition, each Fidelity Central Fund's financial statements are available on the SEC's website or upon request.
(d) Investment made with cash collateral received from securities on loan.
Affiliated Central Funds
Information regarding fiscal year to date income earned by the Fund from investments in Fidelity Central Funds is as follows:
| Fund | Income earned |
| Fidelity Cash Central Fund | $418,851 |
| Fidelity Securities Lending Cash Central Fund | 53,863 |
| Total | $472,714 |
Amounts in the income column in the above table include any capital gain distributions from underlying funds, which are presented in the corresponding line-item in the Statement of Operations if applicable.
Investment Valuation
The following is a summary of the inputs used, as of April 30, 2018, involving the Fund's assets and liabilities carried at fair value. The inputs or methodology used for valuing securities may not be an indication of the risk associated with investing in those securities. For more information on valuation inputs, and their aggregation into the levels used below, please refer to the Investment Valuation section in the accompanying Notes to Financial Statements.
| Valuation Inputs at Reporting Date: | ||||
| Description | Total | Level 1 | Level 2 | Level 3 |
| Investments in Securities: | ||||
| Equities: | ||||
| Consumer Discretionary | $808,340,814 | $334,318,826 | $474,021,988 | $-- |
| Consumer Staples | 377,163,343 | 221,409,916 | 155,753,427 | -- |
| Energy | 98,517,649 | 29,073,510 | 69,444,139 | -- |
| Financials | 1,160,178,646 | 469,711,050 | 690,467,596 | -- |
| Health Care | 177,682,026 | 84,644,718 | 93,037,308 | -- |
| Industrials | 449,566,295 | 208,082,150 | 241,484,145 | -- |
| Information Technology | 1,491,073,707 | 941,836,252 | 549,237,455 | -- |
| Materials | 366,760,748 | 216,990,972 | 149,769,776 | -- |
| Real Estate | 66,009,447 | -- | 66,009,447 | -- |
| Telecommunication Services | 84,673,597 | 84,673,597 | -- | -- |
| Utilities | 87,473,277 | 60,825,200 | 26,648,077 | -- |
| Money Market Funds | 88,914,586 | 88,914,586 | -- | -- |
| Total Investments in Securities: | $5,256,354,135 | $2,740,480,777 | $2,515,873,358 | $-- |
The following is a summary of transfers between Level 1 and Level 2 for the period ended April 30, 2018. Transfers are assumed to have occurred at the beginning of the period, and are primarily attributable to the valuation techniques used for foreign equity securities, as discussed in the accompanying Notes to Financial Statements:
| Transfers | Total |
| Level 1 to Level 2 | $1,424,704,881 |
| Level 2 to Level 1 | $25,602,943 |
See accompanying notes which are an integral part of the financial statements.
Fidelity® Emerging Markets Fund
Financial Statements
Statement of Assets and Liabilities
| April 30, 2018 (Unaudited) | ||
| Assets | ||
| Investment in securities, at value (including securities loaned of $41,180,858) — See accompanying schedule: Unaffiliated issuers (cost $3,661,371,603) | $5,167,439,549 | |
| Fidelity Central Funds (cost $88,914,586) | 88,914,586 | |
| Total Investment in Securities (cost $3,750,286,189) | $5,256,354,135 | |
| Foreign currency held at value (cost $6,869,019) | 6,899,969 | |
| Receivable for investments sold | 60,834,164 | |
| Receivable for fund shares sold | 19,219,489 | |
| Dividends receivable | 10,980,956 | |
| Distributions receivable from Fidelity Central Funds | 103,971 | |
| Prepaid expenses | 2,241 | |
| Other receivables | 2,333,668 | |
| Total assets | 5,356,728,593 | |
| Liabilities | ||
| Payable for investments purchased | $22,037,520 | |
| Payable for fund shares redeemed | 27,477,176 | |
| Accrued management fee | 3,070,834 | |
| Other affiliated payables | 851,902 | |
| Other payables and accrued expenses | 6,892,453 | |
| Collateral on securities loaned | 42,839,906 | |
| Total liabilities | 103,169,791 | |
| Net Assets | $5,253,558,802 | |
| Net Assets consist of: | ||
| Paid in capital | $3,826,177,291 | |
| Undistributed net investment income | 17,414,743 | |
| Accumulated undistributed net realized gain (loss) on investments and foreign currency transactions | (89,382,611) | |
| Net unrealized appreciation (depreciation) on investments and assets and liabilities in foreign currencies | 1,499,349,379 | |
| Net Assets | $5,253,558,802 | |
| Emerging Markets: | ||
| Net Asset Value, offering price and redemption price per share ($4,228,426,128 ÷ 130,811,285 shares) | $32.32 | |
| Class K: | ||
| Net Asset Value, offering price and redemption price per share ($1,025,132,674 ÷ 31,690,897 shares) | $32.35 |
See accompanying notes which are an integral part of the financial statements.
Statement of Operations
| Six months ended April 30, 2018 (Unaudited) | ||
| Investment Income | ||
| Dividends | $46,619,137 | |
| Income from Fidelity Central Funds | 472,714 | |
| Income before foreign taxes withheld | 47,091,851 | |
| Less foreign taxes withheld | (4,349,721) | |
| Total income | 42,742,130 | |
| Expenses | ||
| Management fee | $18,652,285 | |
| Transfer agent fees | 4,251,160 | |
| Accounting and security lending fees | 791,683 | |
| Custodian fees and expenses | 1,132,249 | |
| Independent trustees' fees and expenses | 10,494 | |
| Registration fees | 148,282 | |
| Audit | 46,341 | |
| Legal | 9,937 | |
| Interest | 59,023 | |
| Miscellaneous | 15,641 | |
| Total expenses before reductions | 25,117,095 | |
| Expense reductions | (1,003,489) | 24,113,606 |
| Net investment income (loss) | 18,628,524 | |
| Realized and Unrealized Gain (Loss) | ||
| Net realized gain (loss) on: | ||
| Investment securities: | ||
| Unaffiliated issuers | 167,434,366 | |
| Fidelity Central Funds | 4,759 | |
| Foreign currency transactions | (630,143) | |
| Total net realized gain (loss) | 166,808,982 | |
| Change in net unrealized appreciation (depreciation) on: | ||
| Investment securities: | ||
| Unaffiliated issuers (net of decrease in deferred foreign taxes of $2,231,057) | (16,070,821) | |
| Assets and liabilities in foreign currencies | (67,343) | |
| Total change in net unrealized appreciation (depreciation) | (16,138,164) | |
| Net gain (loss) | 150,670,818 | |
| Net increase (decrease) in net assets resulting from operations | $169,299,342 |
See accompanying notes which are an integral part of the financial statements.
Statement of Changes in Net Assets
| Six months ended April 30, 2018 (Unaudited) | Year ended October 31, 2017 | |
| Increase (Decrease) in Net Assets | ||
| Operations | ||
| Net investment income (loss) | $18,628,524 | $34,645,276 |
| Net realized gain (loss) | 166,808,982 | 212,503,902 |
| Change in net unrealized appreciation (depreciation) | (16,138,164) | 865,316,825 |
| Net increase (decrease) in net assets resulting from operations | 169,299,342 | 1,112,466,003 |
| Distributions to shareholders from net investment income | (27,149,838) | (23,974,554) |
| Distributions to shareholders from net realized gain | (4,339,116) | – |
| Total distributions | (31,488,954) | (23,974,554) |
| Share transactions - net increase (decrease) | 257,466,347 | 96,080,893 |
| Redemption fees | 97,832 | 379,582 |
| Total increase (decrease) in net assets | 395,374,567 | 1,184,951,924 |
| Net Assets | ||
| Beginning of period | 4,858,184,235 | 3,673,232,311 |
| End of period | $5,253,558,802 | $4,858,184,235 |
| Other Information | ||
| Undistributed net investment income end of period | $17,414,743 | $25,936,057 |
See accompanying notes which are an integral part of the financial statements.
Financial Highlights
Fidelity Emerging Markets Fund
| Six months ended (Unaudited) April 30, | Years endedOctober 31, | |||||
| 2018 | 2017 | 2016 | 2015 | 2014 | 2013 | |
| Selected Per–Share Data | ||||||
| Net asset value, beginning of period | $31.37 | $24.25 | $22.55 | $25.44 | $24.43 | $22.15 |
| Income from Investment Operations | ||||||
| Net investment income (loss)A | .11 | .22 | .14 | .19 | .17 | .20 |
| Net realized and unrealized gain (loss) | 1.03 | 7.05 | 1.66 | (2.91) | .86 | 2.38 |
| Total from investment operations | 1.14 | 7.27 | 1.80 | (2.72) | 1.03 | 2.58 |
| Distributions from net investment income | (.16) | (.15) | (.11) | (.14) | (.02) | (.30) |
| Distributions from net realized gain | (.03) | – | – | (.03) | – | – |
| Total distributions | (.19) | (.15) | (.11) | (.17) | (.02) | (.30) |
| Redemption fees added to paid in capitalA | –B | –B | .01 | –B | –B | –B |
| Net asset value, end of period | $32.32 | $31.37 | $24.25 | $22.55 | $25.44 | $24.43 |
| Total ReturnC,D | 3.64% | 30.21% | 8.07% | (10.76)% | 4.22% | 11.78% |
| Ratios to Average Net AssetsE,F | ||||||
| Expenses before reductions | .96%G | .97% | 1.01% | 1.05% | 1.07% | 1.08% |
| Expenses net of fee waivers, if any | .96%G | .97% | 1.01% | 1.05% | 1.07% | 1.08% |
| Expenses net of all reductions | .92%G | .96% | 1.00% | 1.03% | 1.07% | 1.03% |
| Net investment income (loss) | .66%G | .83% | .61% | .78% | .71% | .85% |
| Supplemental Data | ||||||
| Net assets, end of period (000 omitted) | $4,228,426 | $3,933,401 | $3,014,957 | $2,738,934 | $2,370,927 | $2,241,338 |
| Portfolio turnover rateH | 87%G | 81% | 79% | 107% | 94% | 119% |
A Calculated based on average shares outstanding during the period.
B Amount represents less than $.005 per share.
C Total returns for periods of less than one year are not annualized.
D Total returns would have been lower if certain expenses had not been reduced during the applicable periods shown.
E Fees and expenses of any underlying Fidelity Central Funds are not included in the Fund's expense ratio. The Fund indirectly bears its proportionate share of the expenses of any underlying Fidelity Central Funds.
F Expense ratios reflect operating expenses of the class. Expenses before reductions do not reflect amounts reimbursed by the investment adviser or reductions from brokerage service arrangements or reductions from other expense offset arrangements and do not represent the amount paid by the class during periods when reimbursements or reductions occur. Expenses net of fee waivers reflect expenses after reimbursement by the investment adviser but prior to reductions from brokerage service arrangements or other expense offset arrangements. Expenses net of all reductions represent the net expenses paid by the class.
G Annualized
H Amount does not include the portfolio activity of any underlying Fidelity Central Funds.
See accompanying notes which are an integral part of the financial statements.
Fidelity Emerging Markets Fund Class K
| Six months ended (Unaudited) April 30, | Years endedOctober 31, | |||||
| 2018 | 2017 | 2016 | 2015 | 2014 | 2013 | |
| Selected Per–Share Data | ||||||
| Net asset value, beginning of period | $31.41 | $24.28 | $22.58 | $25.48 | $24.42 | $22.15 |
| Income from Investment Operations | ||||||
| Net investment income (loss)A | .13 | .26 | .18 | .24 | .23 | .25 |
| Net realized and unrealized gain (loss) | 1.04 | 7.06 | 1.66 | (2.92) | .86 | 2.38 |
| Total from investment operations | 1.17 | 7.32 | 1.84 | (2.68) | 1.09 | 2.63 |
| Distributions from net investment income | (.20) | (.19) | (.15) | (.20) | (.03) | (.36) |
| Distributions from net realized gain | (.03) | – | – | (.03) | – | – |
| Total distributions | (.23) | (.19) | (.15) | (.22)B | (.03) | (.36) |
| Redemption fees added to paid in capitalA | –C | –C | .01 | –C | –C | –C |
| Net asset value, end of period | $32.35 | $31.41 | $24.28 | $22.58 | $25.48 | $24.42 |
| Total ReturnD,E | 3.73% | 30.44% | 8.27% | (10.60)% | 4.47% | 12.01% |
| Ratios to Average Net AssetsF,G | ||||||
| Expenses before reductions | .82%H | .83% | .84% | .85% | .86% | .87% |
| Expenses net of fee waivers, if any | .82%H | .82% | .84% | .85% | .85% | .87% |
| Expenses net of all reductions | .78%H | .81% | .83% | .83% | .85% | .82% |
| Net investment income (loss) | .80%H | .98% | .78% | .98% | .92% | 1.07% |
| Supplemental Data | ||||||
| Net assets, end of period (000 omitted) | $1,025,133 | $924,783 | $658,276 | $554,041 | $623,430 | $547,369 |
| Portfolio turnover rateI | 87%H | 81% | 79% | 107% | 94% | 119% |
A Calculated based on average shares outstanding during the period.
B Total distributions of $.22 per share is comprised of distributions from net investment income of $.195 and distributions from net realized gain of $.025 per share.
C Amount represents less than $.005 per share.
D Total returns for periods of less than one year are not annualized.
E Total returns would have been lower if certain expenses had not been reduced during the applicable periods shown.
F Fees and expenses of any underlying Fidelity Central Funds are not included in the Fund's expense ratio. The Fund indirectly bears its proportionate share of the expenses of any underlying Fidelity Central Funds.
G Expense ratios reflect operating expenses of the class. Expenses before reductions do not reflect amounts reimbursed by the investment adviser or reductions from brokerage service arrangements or reductions from other expense offset arrangements and do not represent the amount paid by the class during periods when reimbursements or reductions occur. Expenses net of fee waivers reflect expenses after reimbursement by the investment adviser but prior to reductions from brokerage service arrangements or other expense offset arrangements. Expenses net of all reductions represent the net expenses paid by the class.
H Annualized
I Amount does not include the portfolio activity of any underlying Fidelity Central Funds.
See accompanying notes which are an integral part of the financial statements.
Notes to Financial Statements (Unaudited)
For the period ended April 30, 2018
1. Organization.
Fidelity Emerging Markets Fund (the Fund) is a fund of Fidelity Investment Trust (the Trust) and is authorized to issue an unlimited number of shares. The Trust is registered under the Investment Company Act of 1940, as amended (the 1940 Act), as an open-end management investment company organized as a Massachusetts business trust. The Fund offers Emerging Markets and Class K shares, each of which has equal rights as to assets and voting privileges. Each class has exclusive voting rights with respect to matters that affect that class. The Fund's investments in emerging markets can be subject to social, economic, regulatory, and political uncertainties and can be extremely volatile.
2. Investments in Fidelity Central Funds.
The Fund invests in Fidelity Central Funds, which are open-end investment companies generally available only to other investment companies and accounts managed by the investment adviser and its affiliates. The Fund's Schedule of Investments lists each of the Fidelity Central Funds held as of period end, if any, as an investment of the Fund, but does not include the underlying holdings of each Fidelity Central Fund. As an Investing Fund, the Fund indirectly bears its proportionate share of the expenses of the underlying Fidelity Central Funds.
The Money Market Central Funds seek preservation of capital and current income and are managed by Fidelity Investments Money Management, Inc. (FIMM), an affiliate of the investment adviser. Annualized expenses of the Money Market Central Funds as of their most recent shareholder report date are less than .005%.
A complete unaudited list of holdings for each Fidelity Central Fund is available upon request or at the Securities and Exchange Commission (the SEC) website at www.sec.gov. In addition, the financial statements of the Fidelity Central Funds are available on the SEC website or upon request.
3. Significant Accounting Policies.
The Fund is an investment company and applies the accounting and reporting guidance of the Financial Accounting Standards Board (FASB) Accounting Standards Codification Topic 946 Financial Services – Investments Companies. The financial statements have been prepared in conformity with accounting principles generally accepted in the United States of America (GAAP), which require management to make certain estimates and assumptions at the date of the financial statements. Actual results could differ from those estimates. Subsequent events, if any, through the date that the financial statements were issued have been evaluated in the preparation of the financial statements. The following summarizes the significant accounting policies of the Fund:
Investment Valuation. Investments are valued as of 4:00 p.m. Eastern time on the last calendar day of the period. The Board of Trustees (the Board) has delegated the day to day responsibility for the valuation of the Fund's investments to the Fair Value Committee (the Committee) established by the Fund's investment adviser. In accordance with valuation policies and procedures approved by the Board, the Fund attempts to obtain prices from one or more third party pricing vendors or brokers to value its investments. When current market prices, quotations or currency exchange rates are not readily available or reliable, investments will be fair valued in good faith by the Committee, in accordance with procedures adopted by the Board. Factors used in determining fair value vary by investment type and may include market or investment specific events. The frequency with which these procedures are used cannot be predicted and they may be utilized to a significant extent. The Committee oversees the Fund's valuation policies and procedures and reports to the Board on the Committee's activities and fair value determinations. The Board monitors the appropriateness of the procedures used in valuing the Fund's investments and ratifies the fair value determinations of the Committee.
The Fund categorizes the inputs to valuation techniques used to value its investments into a disclosure hierarchy consisting of three levels as shown below:
- Level 1 – quoted prices in active markets for identical investments
- Level 2 – other significant observable inputs (including quoted prices for similar investments, interest rates, prepayment speeds, etc.)
- Level 3 – unobservable inputs (including the Fund's own assumptions based on the best information available)
Valuation techniques used to value the Fund's investments by major category are as follows:
Equity securities, including restricted securities, for which market quotations are readily available, are valued at the last reported sale price or official closing price as reported by a third party pricing vendor on the primary market or exchange on which they are traded and are categorized as Level 1 in the hierarchy. In the event there were no sales during the day or closing prices are not available, securities are valued at the last quoted bid price or may be valued using the last available price and are generally categorized as Level 2 in the hierarchy. For foreign equity securities, when market or security specific events arise, comparisons to the valuation of American Depositary Receipts (ADRs), futures contracts, Exchange-Traded Funds (ETFs) and certain indexes as well as quoted prices for similar securities may be used and would be categorized as Level 2 in the hierarchy. Utilizing these techniques may result in transfers between Level 1 and Level 2. For equity securities, including restricted securities, where observable inputs are limited, assumptions about market activity and risk are used and these securities may be categorized as Level 3 in the hierarchy.
Investments in open-end mutual funds, including the Fidelity Central Funds, are valued at their closing net asset value (NAV) each business day and are categorized as Level 1 in the hierarchy.
Changes in valuation techniques may result in transfers in or out of an assigned level within the disclosure hierarchy. The aggregate value of investments by input level as of April 30, 2018, including information on transfers between Levels 1 and 2, is included at the end of the Fund's Schedule of Investments.
Foreign Currency. The Fund may use foreign currency contracts to facilitate transactions in foreign-denominated securities. Gains and losses from these transactions may arise from changes in the value of the foreign currency or if the counterparties do not perform under the contracts' terms.
Foreign-denominated assets, including investment securities, and liabilities are translated into U.S. dollars at the exchange rates at period end. Purchases and sales of investment securities, income and dividends received and expenses denominated in foreign currencies are translated into U.S. dollars at the exchange rate in effect on the transaction date.
The effects of exchange rate fluctuations on investments are included with the net realized and unrealized gain (loss) on investment securities. Other foreign currency transactions resulting in realized and unrealized gain (loss) are disclosed separately.
Investment Transactions and Income. For financial reporting purposes, the Fund's investment holdings and NAV include trades executed through the end of the last business day of the period. The NAV per share for processing shareholder transactions is calculated as of the close of business of the New York Stock Exchange (NYSE), normally 4:00 p.m. Eastern time and includes trades executed through the end of the prior business day. Gains and losses on securities sold are determined on the basis of identified cost and includes proceeds received from litigation. Dividend income is recorded on the ex-dividend date, except for certain dividends from foreign securities where the ex-dividend date may have passed, which are recorded as soon as the Fund is informed of the ex-dividend date. Non-cash dividends included in dividend income, if any, are recorded at the fair market value of the securities received. Income and capital gain distributions from Fidelity Central Funds, if any, are recorded on the ex-dividend date. Certain distributions received by the Fund represent a return of capital or capital gain. The Fund determines the components of these distributions subsequent to the ex-dividend date, based upon receipt of tax filings or other correspondence relating to the underlying investment. These distributions are recorded as a reduction of cost of investments and/or as a realized gain. Investment income is recorded net of foreign taxes withheld where recovery of such taxes is uncertain.
Class Allocations and Expenses. Investment income, realized and unrealized capital gains and losses, common expenses of the Fund, and certain fund-level expense reductions, if any, are allocated daily on a pro-rata basis to each class based on the relative net assets of each class to the total net assets of the Fund. Each class differs with respect to transfer agent fees incurred. Certain expense reductions may also differ by class. For the reporting period, the allocated portion of income and expenses to each class as a percent of its average net assets may vary due to the timing of recording these transactions in relation to fluctuating net assets of the classes. Expenses directly attributable to a fund are charged to that fund. Expenses attributable to more than one fund are allocated among the respective funds on the basis of relative net assets or other appropriate methods. Expense estimates are accrued in the period to which they relate and adjustments are made when actual amounts are known.
Income Tax Information and Distributions to Shareholders. Each year, the Fund intends to qualify as a regulated investment company under Subchapter M of the Internal Revenue Code, including distributing substantially all of its taxable income and realized gains. As a result, no provision for U.S. Federal income taxes is required. The Fund files a U.S. federal tax return, in addition to state and local tax returns as required. The Fund's federal income tax returns are subject to examination by the Internal Revenue Service (IRS) for a period of three fiscal years after they are filed. State and local tax returns may be subject to examination for an additional fiscal year depending on the jurisdiction. Foreign taxes are provided for based on the Fund's understanding of the tax rules and rates that exist in the foreign markets in which it invests. The Fund is subject to a tax imposed on capital gains by certain countries in which it invests. An estimated deferred tax liability for net unrealized appreciation on the applicable securities is included in Other payables and accrued expenses on the Statement of Assets & Liabilities.
Distributions are declared and recorded on the ex-dividend date. Income and capital gain distributions are declared separately for each class. Income and capital gain distributions are determined in accordance with income tax regulations, which may differ from GAAP.
Capital accounts within the financial statements are adjusted for permanent book-tax differences. These adjustments have no impact on net assets or the results of operations. Capital accounts are not adjusted for temporary book-tax differences which will reverse in a subsequent period.
Book-tax differences are primarily due to foreign currency transactions, passive foreign investment companies (PFIC), capital loss carryforwards, certain foreign taxes, expiring capital loss carryforwards, deferred trustees compensation and losses deferred due to wash sales.
As of period end, the cost and unrealized appreciation (depreciation) in securities, and derivatives if applicable, for federal income tax purposes were as follows:
| Gross unrealized appreciation | $1,577,825,986 |
| Gross unrealized depreciation | (79,901,603) |
| Net unrealized appreciation (depreciation) | $1,497,924,383 |
| Tax cost | $3,758,429,752 |
Capital loss carryforwards are only available to offset future capital gains of the Fund to the extent provided by regulations and may be limited. Under the Regulated Investment Company Modernization Act of 2010 (the Act), the Fund is permitted to carry forward capital losses incurred in taxable years beginning after December 22, 2010 for an unlimited period and such capital losses are required to be used prior to any losses that expire. The capital loss carryforward information presented below, including any applicable limitation, is estimated as of prior fiscal period end and is subject to adjustment.
| No expiration | |
| Short-term | $(248,807,540) |
Short-Term Trading (Redemption) Fees. Shares held by investors in the Fund less than 90 days may have been subject to a redemption fee equal to 1.50% of the NAV of shares redeemed. All redemption fees, which reduce the proceeds of the shareholder redemption, are retained by the Fund and accounted for as an addition to paid in capital. In November 2017, the Board of Trustees approved the elimination of these redemption fees effective December 18, 2017.
4. Purchases and Sales of Investments.
Purchases and sales of securities, other than short-term securities, aggregated $2,550,079,602 and $2,290,013,977, respectively.
5. Fees and Other Transactions with Affiliates.
Management Fee. Fidelity Management & Research Company (the investment adviser) and its affiliates provide the Fund with investment management related services for which the Fund pays a monthly management fee. The management fee is the sum of an individual fund fee rate that is based on an annual rate of .45% of the Fund's average net assets and an annualized group fee rate that averaged .24% during the period. The group fee rate is based upon the average net assets of all the mutual funds advised by the investment adviser, including any mutual funds previously advised by the investment adviser that are currently advised by Fidelity SelectCo, LLC, an affiliate of the investment adviser. The group fee rate decreases as assets under management increase and increases as assets under management decrease. For the reporting period, the total annualized management fee rate was .69% of the Fund's average net assets.
Transfer Agent Fees. Fidelity Investments Institutional Operations Company, Inc., (FIIOC), an affiliate of the investment adviser, is the transfer, dividend disbursing and shareholder servicing agent for each class of the Fund. FIIOC receives account fees and asset-based fees that vary according to the account size and type of account of the shareholders of Emerging Markets, except for Class K. FIIOC receives an asset-based fee of Class K's average net assets. FIIOC pays for typesetting, printing and mailing of shareholder reports, except proxy statements.
For the period, transfer agent fees for each class were as follows:
| Amount | % of Class-Level Average Net Assets(a) | |
| Emerging Markets | $4,021,942 | .18 |
| Class K | 229,218 | .05 |
| $4,251,160 |
(a) Annualized
Accounting and Security Lending Fees. Fidelity Service Company, Inc. (FSC), an affiliate of the investment adviser, maintains the Fund's accounting records. The accounting fee is based on the level of average net assets for each month. Under a separate contract, FSC administers the security lending program. The security lending fee is based on the number and duration of lending transactions. For the period, the fees were equivalent to an annualized rate of .03%.
Brokerage Commissions. The Fund placed a portion of its portfolio transactions with brokerage firms which are affiliates of the investment adviser. Brokerage commissions are included in net realized gain (loss) and change in net unrealized appreciation (depreciation) in the Statement of Operations. The commissions paid to these affiliated firms were $10,337 for the period.
Interfund Lending Program. Pursuant to an Exemptive Order issued by the SEC, the Fund, along with other registered investment companies having management contracts with Fidelity Management & Research Company (FMR) or other affiliated entities of FMR, may participate in an interfund lending program. This program provides an alternative credit facility allowing the funds to borrow from, or lend money to, other participating affiliated funds. At period end, there were no interfund loans outstanding. The Fund's activity in this program during the period for which loans were outstanding was as follows:
| Borrower or Lender | Average Loan Balance | Weighted Average Interest Rate | Interest Expense |
| Borrower | $34,813,286 | 1.71% | $46,212 |
Interfund Trades. The Fund may purchase from or sell securities to other Fidelity Funds under procedures adopted by the Board. The procedures have been designed to ensure these interfund trades are executed in accordance with Rule 17a-7 of the 1940 Act. Interfund trades are included within the respective purchases and sales amounts shown in the Purchases and Sales of Investments note.
6. Committed Line of Credit.
The Fund participates with other funds managed by the investment adviser or an affiliate in a $4.25 billion credit facility (the "line of credit") to be utilized for temporary or emergency purposes to fund shareholder redemptions or for other short-term liquidity purposes. The Fund has agreed to pay commitment fees on its pro-rata portion of the line of credit, which amounted to $7,527 and is reflected in Miscellaneous expenses on the Statement of Operations. During the period, the Fund did not borrow on this line of credit.
7. Security Lending.
The Fund lends portfolio securities through a lending agent from time to time in order to earn additional income. For equity securities, a lending agent is used and may loan securities to certain qualified borrowers, including Fidelity Capital Markets (FCM), a broker-dealer affiliated with the Fund. On the settlement date of the loan, the Fund receives collateral (in the form of U.S. Treasury obligations, letters of credit and/or cash) against the loaned securities and maintains collateral in an amount not less than 100% of the market value of the loaned securities during the period of the loan. The market value of the loaned securities is determined at the close of business of the Fund and any additional required collateral is delivered to the Fund on the next business day. The Fund or borrower may terminate the loan at any time, and if the borrower defaults on its obligation to return the securities loaned because of insolvency or other reasons, the Fund may apply collateral received from the borrower against the obligation. The Fund may experience delays and costs in recovering the securities loaned. Any cash collateral received is invested in the Fidelity Securities Lending Cash Central Fund. The value of loaned securities and cash collateral at period end are disclosed on the Fund's Statement of Assets and Liabilities. Security lending income represents the income earned on investing cash collateral, less rebates paid to borrowers and any lending agent fees associated with the loan, plus any premium payments received for lending certain types of securities. Security lending income is presented in the Statement of Operations as a component of income from Fidelity Central Funds. Total security lending income during the period amounted to $53,863. During the period, there were no securities loaned to FCM.
8. Bank Borrowings.
The Fund is permitted to have bank borrowings for temporary or emergency purposes to fund shareholder redemptions or for other short-term liquidity requirements. The Fund has established borrowing arrangements with certain banks. The interest rate on the borrowings is the bank's base rate, as revised from time to time. The average loan balance during the period for which loans were outstanding amounted to $48,041,600. The weighted average interest rate was 1.92%. The interest expense amounted to $12,811 under the bank borrowing program. At period end, there were no bank borrowings outstanding.
9. Expense Reductions.
Commissions paid to certain brokers with whom the investment adviser, or its affiliates, places trades on behalf of the Fund include an amount in addition to trade execution, which may be rebated back to the Fund to offset certain expenses. This amount totaled $971,667 for the period.In addition, through arrangements with the Fund's custodian, credits realized as a result of certain uninvested cash balances were used to reduce the Fund's expenses. During the period, these credits reduced the Fund's custody expenses by $6,103.
In addition, during the period the investment adviser reimbursed and/or waived a portion of fund-level operating expenses in the amount of $25,719.
10. Distributions to Shareholders.
Distributions to shareholders of each class were as follows:
| Six months ended April 30, 2018 | Year ended October 31, 2017 | |
| From net investment income | ||
| Emerging Markets | $21,280,826 | $18,744,412 |
| Class K | 5,869,012 | 5,230,142 |
| Total | $27,149,838 | $23,974,554 |
| From net realized gain | ||
| Emerging Markets | $3,546,800 | $– |
| Class K | 792,316 | – |
| Total | $4,339,116 | $– |
11. Share Transactions.
Share transactions for each class were as follows and may contain automatic conversions between classes or exchanges between affiliated funds:
| Shares | Shares | Dollars | Dollars | |
| Six months ended April 30, 2018 | Year ended October 31, 2017 | Six months ended April 30, 2018 | Year ended October 31, 2017 | |
| Emerging Markets | ||||
| Shares sold | 28,213,866 | 35,833,343 | $934,285,779 | $958,972,147 |
| Reinvestment of distributions | 746,970 | 790,787 | 23,634,137 | 17,864,538 |
| Shares redeemed | (23,535,687) | (35,588,763) | (775,425,515) | (943,601,756) |
| Net increase (decrease) | 5,425,149 | 1,035,367 | $182,494,401 | $33,234,929 |
| Class K | ||||
| Shares sold | 6,223,868 | 9,726,562 | $206,560,220 | $257,288,456 |
| Reinvestment of distributions | 210,535 | 231,437 | 6,661,328 | 5,230,142 |
| Shares redeemed | (4,187,076) | (7,627,038) | (138,249,602) | (199,672,634) |
| Net increase (decrease) | 2,247,327 | 2,330,961 | $74,971,946 | $62,845,964 |
12. Other.
The Fund's organizational documents provide former and current trustees and officers with a limited indemnification against liabilities arising in connection with the performance of their duties to the Fund. In the normal course of business, the Fund may also enter into contracts that provide general indemnifications. The Fund's maximum exposure under these arrangements is unknown as this would be dependent on future claims that may be made against the Fund. The risk of material loss from such claims is considered remote.
Fidelity® Europe Fund
Investment Summary (Unaudited)
Geographic Diversification (% of fund's net assets)
| As of April 30, 2018 | ||
| United Kingdom | 20.8% | |
| Sweden | 18.4% | |
| Germany | 13.3% | |
| Italy | 7.8% | |
| Spain | 7.2% | |
| Ireland | 6.3% | |
| France | 5.3% | |
| Bermuda | 3.7% | |
| Netherlands | 3.5% | |
| Other* | 13.7% | |

* Includes Short-Term investments and Net Other Assets (Liabilities).
Percentages are based on country or territory of incorporation and are adjusted for the effect of futures contracts, if applicable.
Asset Allocation as of April 30, 2018
| % of fund's net assets | |
| Stocks | 99.6 |
| Short-Term Investments and Net Other Assets (Liabilities) | 0.4 |
Top Ten Stocks as of April 30, 2018
| % of fund's net assets | |
| SAP SE (Germany, Software) | 3.6 |
| Securitas AB (B Shares) (Sweden, Commercial Services & Supplies) | 3.5 |
| Prudential PLC (United Kingdom, Insurance) | 3.4 |
| Getinge AB (B Shares) (Sweden, Health Care Equipment & Supplies) | 3.2 |
| Intertrust NV (Netherlands, Professional Services) | 3.1 |
| Swatch Group AG (Bearer) (Switzerland, Textiles, Apparel & Luxury Goods) | 2.8 |
| NCC Group Ltd. (United Kingdom, IT Services) | 2.8 |
| Vostok New Ventures Ltd. (depositary receipt) (Bermuda, Capital Markets) | 2.7 |
| Micro Focus International PLC (United Kingdom, Software) | 2.5 |
| A.P. Moller - Maersk A/S Series B (Denmark, Marine) | 2.5 |
| 30.1 |
Top Market Sectors as of April 30, 2018
| % of fund's net assets | |
| Financials | 24.9 |
| Industrials | 22.2 |
| Health Care | 13.9 |
| Consumer Discretionary | 13.9 |
| Information Technology | 13.2 |
| Consumer Staples | 4.6 |
| Materials | 4.0 |
| Real Estate | 2.9 |
Fidelity® Europe Fund
Schedule of Investments April 30, 2018 (Unaudited)
Showing Percentage of Net Assets
| Common Stocks - 97.1% | |||
| Shares | Value | ||
| Bermuda - 3.7% | |||
| Vostok Emerging Finance Ltd. (depository receipt) (a)(b)(c) | 53,590,807 | $11,995,224 | |
| Vostok New Ventures Ltd. (depositary receipt) (a)(b) | 3,850,361 | 32,274,500 | |
| TOTAL BERMUDA | 44,269,724 | ||
| Canada - 1.0% | |||
| Lundin Mining Corp. (Sweden) | 1,883,900 | 12,080,075 | |
| Denmark - 2.5% | |||
| A.P. Moller - Maersk A/S Series B | 18,612 | 30,034,049 | |
| France - 5.3% | |||
| Capgemini SA | 215,900 | 29,722,176 | |
| The Vicat Group | 158,300 | 11,670,506 | |
| Wendel SA | 149,700 | 22,633,371 | |
| TOTAL FRANCE | 64,026,053 | ||
| Germany - 13.3% | |||
| Bertrandt AG | 126,900 | 14,213,422 | |
| Fresenius Medical Care AG & Co. KGaA | 179,000 | 18,163,286 | |
| Fresenius SE & Co. KGaA | 82,300 | 6,295,076 | |
| Hannover Reuck SE | 118,500 | 16,685,530 | |
| JOST Werke AG (d) | 102,100 | 4,309,194 | |
| LEG Immobilien AG | 252,828 | 29,169,804 | |
| MTU Aero Engines Holdings AG | 143,000 | 24,694,212 | |
| SAP SE | 381,437 | 42,379,816 | |
| WashTec AG | 29,300 | 2,827,076 | |
| TOTAL GERMANY | 158,737,416 | ||
| Hungary - 1.1% | |||
| OTP Bank PLC | 305,700 | 13,355,871 | |
| Ireland - 6.3% | |||
| DCC PLC (United Kingdom) | 147,600 | 14,224,064 | |
| Paddy Power Betfair PLC (Ireland) | 253,900 | 25,126,660 | |
| Ryanair Holdings PLC sponsored ADR (b) | 164,767 | 18,119,427 | |
| United Drug PLC (United Kingdom) | 1,420,241 | 17,890,499 | |
| TOTAL IRELAND | 75,360,650 | ||
| Italy - 6.7% | |||
| Banca Generali SpA | 379,600 | 12,340,262 | |
| Buzzi Unicem SpA | 490,500 | 12,415,191 | |
| Prada SpA | 5,418,200 | 27,491,435 | |
| UniCredit SpA | 1,317,933 | 28,606,266 | |
| TOTAL ITALY | 80,853,154 | ||
| Malta - 1.1% | |||
| Kambi Group PLC (b) | 1,055,109 | 12,651,693 | |
| Netherlands - 3.5% | |||
| Instone Real Estate Group BV (b)(d) | 186,700 | 4,473,556 | |
| Intertrust NV (d) | 1,881,325 | 37,486,153 | |
| TOTAL NETHERLANDS | 41,959,709 | ||
| Norway - 2.2% | |||
| Schibsted ASA (A Shares) | 890,150 | 26,031,087 | |
| Spain - 5.8% | |||
| Aedas Homes SAU (d) | 52,983 | 1,887,477 | |
| Amadeus IT Holding SA Class A | 296,800 | 21,755,832 | |
| Grifols SA | 499,300 | 14,078,992 | |
| Prosegur Cash SA (d) | 7,417,400 | 21,676,550 | |
| Prosegur Compania de Seguridad SA (Reg.) | 1,369,300 | 10,384,399 | |
| TOTAL SPAIN | 69,783,250 | ||
| Sweden - 18.4% | |||
| Arjo AB | 8,828,784 | 26,062,943 | |
| Essity AB Class B | 798,700 | 20,339,982 | |
| Getinge AB (B Shares) (a) | 4,148,384 | 38,685,689 | |
| Indutrade AB | 939,100 | 22,242,449 | |
| Investor AB (B Shares) | 670,971 | 29,354,718 | |
| Nobia AB (a) | 637,800 | 5,032,973 | |
| Nordea Bank AB | 2,322,400 | 23,704,968 | |
| Securitas AB (B Shares) (a) | 2,562,100 | 41,547,647 | |
| Swedish Match Co. AB | 285,000 | 12,823,397 | |
| TOTAL SWEDEN | 219,794,766 | ||
| Switzerland - 3.3% | |||
| EDAG Engineering Group AG | 297,000 | 5,688,303 | |
| Swatch Group AG (Bearer) | 69,820 | 33,712,281 | |
| TOTAL SWITZERLAND | 39,400,584 | ||
| United Kingdom - 20.8% | |||
| British American Tobacco PLC (United Kingdom) | 394,200 | 21,620,889 | |
| Dechra Pharmaceuticals PLC | 764,900 | 28,874,297 | |
| Diploma PLC | 938,300 | 15,578,597 | |
| IntegraFin Holdings PLC (b) | 314,300 | 1,237,513 | |
| International Personal Finance PLC | 4,931,872 | 16,512,570 | |
| Micro Focus International PLC | 1,761,458 | 30,373,053 | |
| NCC Group Ltd. | 12,345,224 | 33,413,487 | |
| Prudential PLC | 1,587,138 | 40,811,760 | |
| Rolls-Royce Holdings PLC | 2,252,300 | 26,046,228 | |
| Standard Chartered PLC (United Kingdom) | 2,594,366 | 27,394,661 | |
| The Weir Group PLC | 239,200 | 7,033,990 | |
| TOTAL UNITED KINGDOM | 248,897,045 | ||
| United States of America - 2.1% | |||
| Autoliv, Inc. (depositary receipt) | 187,300 | 25,410,676 | |
| TOTAL COMMON STOCKS | |||
| (Cost $1,011,578,750) | 1,162,645,802 | ||
| Nonconvertible Preferred Stocks - 2.5% | |||
| Italy - 1.1% | |||
| Buzzi Unicem SpA (Risparmio Shares) | 889,200 | 12,778,195 | |
| Spain - 1.4% | |||
| Grifols SA Class B | 850,250 | 17,525,661 | |
| United Kingdom - 0.0% | |||
| Rolls-Royce Holdings PLC Series C (b) | 159,913,300 | 220,153 | |
| TOTAL NONCONVERTIBLE PREFERRED STOCKS | |||
| (Cost $23,766,105) | 30,524,009 | ||
| Money Market Funds - 2.3% | |||
| Fidelity Cash Central Fund, 1.74% (e) | 1,058,641 | 1,058,853 | |
| Fidelity Securities Lending Cash Central Fund 1.74% (e)(f) | 25,832,021 | 25,834,604 | |
| TOTAL MONEY MARKET FUNDS | |||
| (Cost $26,893,457) | 26,893,457 | ||
| TOTAL INVESTMENT IN SECURITIES - 101.9% | |||
| (Cost $1,062,238,312) | 1,220,063,268 | ||
| NET OTHER ASSETS (LIABILITIES) - (1.9)% | (22,352,339) | ||
| NET ASSETS - 100% | $1,197,710,929 |
Categorizations in the Schedule of Investments are based on country or territory of incorporation.
Legend
(a) Security or a portion of the security is on loan at period end.
(b) Non-income producing
(c) Affiliated company
(d) Security exempt from registration under Rule 144A of the Securities Act of 1933. These securities may be resold in transactions exempt from registration, normally to qualified institutional buyers. At the end of the period, the value of these securities amounted to $69,832,930 or 5.8% of net assets.
(e) Affiliated fund that is generally available only to investment companies and other accounts managed by Fidelity Investments. The rate quoted is the annualized seven-day yield of the fund at period end. A complete unaudited listing of the fund's holdings as of its most recent quarter end is available upon request. In addition, each Fidelity Central Fund's financial statements are available on the SEC's website or upon request.
(f) Investment made with cash collateral received from securities on loan.
Affiliated Central Funds
Information regarding fiscal year to date income earned by the Fund from investments in Fidelity Central Funds is as follows:
| Fund | Income earned |
| Fidelity Cash Central Fund | $62,319 |
| Fidelity Securities Lending Cash Central Fund | 146,708 |
| Total | $209,027 |
Amounts in the income column in the above table include any capital gain distributions from underlying funds, which are presented in the corresponding line-item in the Statement of Operations if applicable.
Other Affiliated Issuers
An affiliated company is a company in which the Fund has ownership of at least 5% of the voting securities. Fiscal year to date transactions with companies which are or were affiliates are as follows:
| Affiliate | Value, beginning of period | Purchases | Sales Proceeds | Dividend Income | Realized Gain (loss) | Change in Unrealized appreciation (depreciation) | Value, end of period |
| Vostok Emerging Finance Ltd. (depository receipt) | $11,714,677 | $-- | $-- | $-- | $-- | $280,547 | $11,995,224 |
| Total | $11,714,677 | $-- | $-- | $-- | $-- | $280,547 | $11,995,224 |
Investment Valuation
The following is a summary of the inputs used, as of April 30, 2018, involving the Fund's assets and liabilities carried at fair value. The inputs or methodology used for valuing securities may not be an indication of the risk associated with investing in those securities. For more information on valuation inputs, and their aggregation into the levels used below, please refer to the Investment Valuation section in the accompanying Notes to Financial Statements.
| Valuation Inputs at Reporting Date: | ||||
| Description | Total | Level 1 | Level 2 | Level 3 |
| Investments in Securities: | ||||
| Equities: | ||||
| Consumer Discretionary | $165,454,302 | $137,962,867 | $27,491,435 | $-- |
| Consumer Staples | 54,784,268 | 33,163,379 | 21,620,889 | -- |
| Financials | 298,583,764 | 257,772,004 | 40,811,760 | -- |
| Health Care | 167,576,443 | 131,887,496 | 35,688,947 | -- |
| Industrials | 264,651,866 | 264,651,866 | -- | -- |
| Information Technology | 157,644,364 | 84,891,495 | 72,752,869 | -- |
| Materials | 48,943,967 | 48,943,967 | -- | -- |
| Real Estate | 35,530,837 | 35,530,837 | -- | -- |
| Money Market Funds | 26,893,457 | 26,893,457 | -- | -- |
| Total Investments in Securities: | $1,220,063,268 | $1,021,697,368 | $198,365,900 | $-- |
The following is a summary of transfers between Level 1 and Level 2 for the period ended April 30, 2018. Transfers are assumed to have occurred at the beginning of the period, and are primarily attributable to the valuation techniques used for foreign equity securities, as discussed in the accompanying Notes to Financial Statements:
| Transfers | Total |
| Level 1 to Level 2 | $37,417,161 |
| Level 2 to Level 1 | $29,106,433 |
See accompanying notes which are an integral part of the financial statements.
Fidelity® Europe Fund
Financial Statements
Statement of Assets and Liabilities
| April 30, 2018 (Unaudited) | ||
| Assets | ||
| Investment in securities, at value (including securities loaned of $23,837,249) — See accompanying schedule: Unaffiliated issuers (cost $1,028,484,888) | $1,181,174,587 | |
| Fidelity Central Funds (cost $26,893,457) | 26,893,457 | |
| Other affiliated issuers (cost $6,859,967) | 11,995,224 | |
| Total Investment in Securities (cost $1,062,238,312) | $1,220,063,268 | |
| Receivable for fund shares sold | 745,125 | |
| Dividends receivable | 4,610,815 | |
| Distributions receivable from Fidelity Central Funds | 81,040 | |
| Prepaid expenses | 703 | |
| Other receivables | 58,353 | |
| Total assets | 1,225,559,304 | |
| Liabilities | ||
| Payable for fund shares redeemed | $1,014,015 | |
| Accrued management fee | 681,191 | |
| Distribution and service plan fees payable | 18,444 | |
| Other affiliated payables | 223,571 | |
| Other payables and accrued expenses | 76,928 | |
| Collateral on securities loaned | 25,834,226 | |
| Total liabilities | 27,848,375 | |
| Net Assets | $1,197,710,929 | |
| Net Assets consist of: | ||
| Paid in capital | $1,005,887,335 | |
| Undistributed net investment income | 4,095,799 | |
| Accumulated undistributed net realized gain (loss) on investments and foreign currency transactions | 29,921,151 | |
| Net unrealized appreciation (depreciation) on investments and assets and liabilities in foreign currencies | 157,806,644 | |
| Net Assets | $1,197,710,929 | |
| Calculation of Maximum Offering Price | ||
| Class A: | ||
| Net Asset Value and redemption price per share ($21,155,462 ÷ 510,519 shares) | $41.44 | |
| Maximum offering price per share (100/94.25 of $41.44) | $43.97 | |
| Class M: | ||
| Net Asset Value and redemption price per share ($9,114,403 ÷ 219,787 shares) | $41.47 | |
| Maximum offering price per share (100/96.50 of $41.47) | $42.97 | |
| Class C: | ||
| Net Asset Value and offering price per share ($12,090,613 ÷ 293,544 shares)(a) | $41.19 | |
| Europe: | ||
| Net Asset Value, offering price and redemption price per share ($1,146,298,326 ÷ 27,634,362 shares) | $41.48 | |
| Class I: | ||
| Net Asset Value, offering price and redemption price per share ($9,052,125 ÷ 218,337 shares) | $41.46 |
(a) Redemption price per share is equal to net asset value less any applicable contingent deferred sales charge.
See accompanying notes which are an integral part of the financial statements.
Statement of Operations
| Six months ended April 30, 2018 (Unaudited) | ||
| Investment Income | ||
| Dividends | $11,381,753 | |
| Income from Fidelity Central Funds | 209,027 | |
| Income before foreign taxes withheld | 11,590,780 | |
| Less foreign taxes withheld | (1,066,617) | |
| Total income | 10,524,163 | |
| Expenses | ||
| Management fee | ||
| Basic fee | $4,380,797 | |
| Performance adjustment | 410,378 | |
| Transfer agent fees | 1,074,724 | |
| Distribution and service plan fees | 109,527 | |
| Accounting and security lending fees | 290,548 | |
| Custodian fees and expenses | 63,515 | |
| Independent trustees' fees and expenses | 2,453 | |
| Registration fees | 73,253 | |
| Audit | 42,080 | |
| Legal | 2,497 | |
| Miscellaneous | 4,361 | |
| Total expenses before reductions | 6,454,133 | |
| Expense reductions | (15,055) | 6,439,078 |
| Net investment income (loss) | 4,085,085 | |
| Realized and Unrealized Gain (Loss) | ||
| Net realized gain (loss) on: | ||
| Investment securities: | ||
| Unaffiliated issuers | 53,129,861 | |
| Fidelity Central Funds | (1,165) | |
| Foreign currency transactions | (99,568) | |
| Total net realized gain (loss) | 53,029,128 | |
| Change in net unrealized appreciation (depreciation) on: | ||
| Investment securities: | ||
| Unaffiliated issuers | (56,166,698) | |
| Fidelity Central Funds | 1,261 | |
| Other affiliated issuers | 280,547 | |
| Assets and liabilities in foreign currencies | 46,027 | |
| Total change in net unrealized appreciation (depreciation) | (55,838,863) | |
| Net gain (loss) | (2,809,735) | |
| Net increase (decrease) in net assets resulting from operations | $1,275,350 |
See accompanying notes which are an integral part of the financial statements.
Statement of Changes in Net Assets
| Six months ended April 30, 2018 (Unaudited) | Year ended October 31, 2017 | |
| Increase (Decrease) in Net Assets | ||
| Operations | ||
| Net investment income (loss) | $4,085,085 | $12,136,756 |
| Net realized gain (loss) | 53,029,128 | 23,964,986 |
| Change in net unrealized appreciation (depreciation) | (55,838,863) | 241,642,484 |
| Net increase (decrease) in net assets resulting from operations | 1,275,350 | 277,744,226 |
| Distributions to shareholders from net investment income | (11,915,078) | (11,727,868) |
| Distributions to shareholders from net realized gain | (19,345,138) | (3,911,466) |
| Total distributions | (31,260,216) | (15,639,334) |
| Share transactions - net increase (decrease) | (164,506,038) | 25,014,944 |
| Redemption fees | – | 434 |
| Total increase (decrease) in net assets | (194,490,904) | 287,120,270 |
| Net Assets | ||
| Beginning of period | 1,392,201,833 | 1,105,081,563 |
| End of period | $1,197,710,929 | $1,392,201,833 |
| Other Information | ||
| Undistributed net investment income end of period | $4,095,799 | $11,925,792 |
See accompanying notes which are an integral part of the financial statements.
Financial Highlights
Fidelity Europe Fund Class A
| Six months ended (Unaudited) April 30, | Years endedOctober 31, | ||||
| 2018 | 2017 | 2016 | 2015 | 2014 A | |
| Selected Per–Share Data | |||||
| Net asset value, beginning of period | $42.47 | $34.17 | $37.06 | $36.24 | $39.45 |
| Income from Investment Operations | |||||
| Net investment income (loss)B | .07 | .26 | .22 | .37 | .47 |
| Net realized and unrealized gain (loss) | (.11) | 8.39 | (2.67) | 1.29 | (3.68) |
| Total from investment operations | (.04) | 8.65 | (2.45) | 1.66 | (3.21) |
| Distributions from net investment income | (.33) | (.22) | (.29) | (.84) | – |
| Distributions from net realized gain | (.66) | (.13) | (.15) | – | – |
| Total distributions | (.99) | (.35) | (.44) | (.84) | – |
| Redemption fees added to paid in capitalB | – | –C | –C | –C | –C |
| Net asset value, end of period | $41.44 | $42.47 | $34.17 | $37.06 | $36.24 |
| Total ReturnD,E,F | (.08)% | 25.61% | (6.69)% | 4.63% | (8.14)% |
| Ratios to Average Net AssetsG,H | |||||
| Expenses before reductions | 1.32%I | 1.32% | 1.39% | 1.33% | 1.35%I |
| Expenses net of fee waivers, if any | 1.32%I | 1.32% | 1.39% | 1.33% | 1.35%I |
| Expenses net of all reductions | 1.32%I | 1.28% | 1.38% | 1.31% | 1.35%I |
| Net investment income (loss) | .34%I | .70% | .62% | .98% | 1.94%I |
| Supplemental Data | |||||
| Net assets, end of period (000 omitted) | $21,155 | $20,925 | $17,267 | $23,381 | $23,633 |
| Portfolio turnover rateJ | 34%I | 73% | 62% | 87% | 80%K |
A For the period March 18, 2014 (commencement of sale of shares) to October 31, 2014.
B Calculated based on average shares outstanding during the period.
C Amount represents less than $.005 per share.
D Total returns for periods of less than one year are not annualized.
E Total returns would have been lower if certain expenses had not been reduced during the applicable periods shown.
F Total returns do not include the effect of the sales charges.
G Fees and expenses of any underlying Fidelity Central Funds are not included in the Fund's expense ratio. The Fund indirectly bears its proportionate share of the expenses of any underlying Fidelity Central Funds.
H Expense ratios reflect operating expenses of the class. Expenses before reductions do not reflect amounts reimbursed by the investment adviser or reductions from brokerage service arrangements or reductions from other expense offset arrangements and do not represent the amount paid by the class during periods when reimbursements or reductions occur. Expense ratios before reductions for start-up periods may not be representative of longer-term operating periods. Expenses net of fee waivers reflect expenses after reimbursement by the investment adviser but prior to reductions from brokerage service arrangements or other expense offset arrangements. Expenses net of all reductions represent the net expenses paid by the class.
I Annualized
J Amount does not include the portfolio activity of any underlying Fidelity Central Funds.
K The portfolio turnover rate does not include the assets acquired in the merger.
See accompanying notes which are an integral part of the financial statements.
Fidelity Europe Fund Class M
| Six months ended (Unaudited) April 30, | Years endedOctober 31, | ||||
| 2018 | 2017 | 2016 | 2015 | 2014 A | |
| Selected Per–Share Data | |||||
| Net asset value, beginning of period | $42.47 | $34.13 | $36.94 | $36.18 | $39.45 |
| Income from Investment Operations | |||||
| Net investment income (loss)B | –C | .15 | .11 | .26 | .40 |
| Net realized and unrealized gain (loss) | (.12) | 8.41 | (2.67) | 1.29 | (3.67) |
| Total from investment operations | (.12) | 8.56 | (2.56) | 1.55 | (3.27) |
| Distributions from net investment income | (.23) | (.09) | (.09) | (.79) | – |
| Distributions from net realized gain | (.66) | (.13) | (.15) | – | – |
| Total distributions | (.88)D | (.22) | (.25)E | (.79) | – |
| Redemption fees added to paid in capitalB | – | –C | –C | –C | –C |
| Net asset value, end of period | $41.47 | $42.47 | $34.13 | $36.94 | $36.18 |
| Total ReturnF,G,H | (.25)% | 25.25% | (6.99)% | 4.33% | (8.29)% |
| Ratios to Average Net AssetsI,J | |||||
| Expenses before reductions | 1.65%K | 1.63% | 1.70% | 1.61% | 1.62%K |
| Expenses net of fee waivers, if any | 1.64%K | 1.63% | 1.70% | 1.61% | 1.61%K |
| Expenses net of all reductions | 1.64%K | 1.59% | 1.68% | 1.59% | 1.61%K |
| Net investment income (loss) | .02%K | .39%D | .31% | .70% | 1.68%K |
| Supplemental Data | |||||
| Net assets, end of period (000 omitted) | $9,114 | $8,874 | $6,980 | $9,632 | $13,679 |
| Portfolio turnover rateL | 34%K | 73% | 62% | 87% | 80%M |
A For the period March 18, 2014 (commencement of sale of shares) to October 31, 2014.
B Calculated based on average shares outstanding during the period.
C Amount represents less than $.005 per share.
D Total distributions of $.88 per share is comprised of distributions from net investment income of $.227 and distributions from net realized gain of $.657 per share.
E Total distributions of $.25 per share is comprised of distributions from net investment income of $.092 and distributions from net realized gain of $.154 per share.
F Total returns for periods of less than one year are not annualized.
G Total returns would have been lower if certain expenses had not been reduced during the applicable periods shown.
H Total returns do not include the effect of the sales charges.
I Fees and expenses of any underlying Fidelity Central Funds are not included in the Fund's expense ratio. The Fund indirectly bears its proportionate share of the expenses of any underlying Fidelity Central Funds.
J Expense ratios reflect operating expenses of the class. Expenses before reductions do not reflect amounts reimbursed by the investment adviser or reductions from brokerage service arrangements or reductions from other expense offset arrangements and do not represent the amount paid by the class during periods when reimbursements or reductions occur. Expense ratios before reductions for start-up periods may not be representative of longer-term operating periods. Expenses net of fee waivers reflect expenses after reimbursement by the investment adviser but prior to reductions from brokerage service arrangements or other expense offset arrangements. Expenses net of all reductions represent the net expenses paid by the class.
K Annualized
L Amount does not include the portfolio activity of any underlying Fidelity Central Funds.
M The portfolio turnover rate does not include the assets acquired in the merger.
See accompanying notes which are an integral part of the financial statements.
Fidelity Europe Fund Class C
| Six months ended (Unaudited) April 30, | Years endedOctober 31, | ||||
| 2018 | 2017 | 2016 | 2015 | 2014 A | |
| Selected Per–Share Data | |||||
| Net asset value, beginning of period | $42.15 | $33.82 | $36.81 | $36.07 | $39.45 |
| Income from Investment Operations | |||||
| Net investment income (loss)B | (.09) | (.03) | (.06) | .07 | .29 |
| Net realized and unrealized gain (loss) | (.11) | 8.36 | (2.65) | 1.29 | (3.67) |
| Total from investment operations | (.20) | 8.33 | (2.71) | 1.36 | (3.38) |
| Distributions from net investment income | (.10) | – | (.12) | (.62) | – |
| Distributions from net realized gain | (.66) | – | (.15) | – | – |
| Total distributions | (.76) | – | (.28)C | (.62) | – |
| Redemption fees added to paid in capitalB | – | –D | –D | –D | –D |
| Net asset value, end of period | $41.19 | $42.15 | $33.82 | $36.81 | $36.07 |
| Total ReturnE,F,G | (.47)% | 24.63% | (7.43)% | 3.79% | (8.57)% |
| Ratios to Average Net AssetsH,I | |||||
| Expenses before reductions | 2.10%J | 2.11% | 2.18% | 2.13% | 2.10%J |
| Expenses net of fee waivers, if any | 2.10%J | 2.11% | 2.18% | 2.13% | 2.10%J |
| Expenses net of all reductions | 2.10%J | 2.07% | 2.17% | 2.11% | 2.10%J |
| Net investment income (loss) | (.44)%J | (.09)% | (.17)% | .18% | 1.19%J |
| Supplemental Data | |||||
| Net assets, end of period (000 omitted) | $12,091 | $10,721 | $9,007 | $11,151 | $6,818 |
| Portfolio turnover rateK | 34%J | 73% | 62% | 87% | 80%L |
A For the period March 18, 2014 (commencement of sale of shares) to October 31, 2014.
B Calculated based on average shares outstanding during the period.
C Total distributions of $.28 per share is comprised of distributions from net investment income of $.123 and distributions from net realized gain of $.154 per share.
D Amount represents less than $.005 per share.
E Total returns for periods of less than one year are not annualized.
F Total returns would have been lower if certain expenses had not been reduced during the applicable periods shown.
G Total returns do not include the effect of the contingent deferred sales charge.
H Fees and expenses of any underlying Fidelity Central Funds are not included in the Fund's expense ratio. The Fund indirectly bears its proportionate share of the expenses of any underlying Fidelity Central Funds.
I Expense ratios reflect operating expenses of the class. Expenses before reductions do not reflect amounts reimbursed by the investment adviser or reductions from brokerage service arrangements or reductions from other expense offset arrangements and do not represent the amount paid by the class during periods when reimbursements or reductions occur. Expense ratios before reductions for start-up periods may not be representative of longer-term operating periods. Expenses net of fee waivers reflect expenses after reimbursement by the investment adviser but prior to reductions from brokerage service arrangements or other expense offset arrangements. Expenses net of all reductions represent the net expenses paid by the class.
J Annualized
K Amount does not include the portfolio activity of any underlying Fidelity Central Funds.
L The portfolio turnover rate does not include the assets acquired in the merger.
See accompanying notes which are an integral part of the financial statements.
Fidelity Europe Fund
| Six months ended (Unaudited) April 30, | Years endedOctober 31, | |||||
| 2018 | 2017 | 2016 | 2015 | 2014 | 2013 | |
| Selected Per–Share Data | ||||||
| Net asset value, beginning of period | $42.53 | $34.26 | $37.19 | $36.32 | $37.92 | $30.15 |
| Income from Investment Operations | ||||||
| Net investment income (loss)A | .14 | .38 | .33 | .48 | .94B | .61 |
| Net realized and unrealized gain (loss) | (.12) | 8.40 | (2.68) | 1.30 | (2.00) | 7.87 |
| Total from investment operations | .02 | 8.78 | (2.35) | 1.78 | (1.06) | 8.48 |
| Distributions from net investment income | (.41) | (.38) | (.43) | (.91) | (.52) | (.70) |
| Distributions from net realized gain | (.66) | (.13) | (.15) | – | (.02) | (.01) |
| Total distributions | (1.07) | (.51) | (.58) | (.91) | (.54) | (.71) |
| Redemption fees added to paid in capitalA | – | –C | –C | –C | –C | –C |
| Net asset value, end of period | $41.48 | $42.53 | $34.26 | $37.19 | $36.32 | $37.92 |
| Total ReturnD,E | .07% | 26.05% | (6.42)% | 4.97% | (2.82)% | 28.71% |
| Ratios to Average Net AssetsF,G | ||||||
| Expenses before reductions | 1.00%H | 1.00% | 1.07% | 1.03% | .97% | 1.06% |
| Expenses net of fee waivers, if any | 1.00%H | 1.00% | 1.07% | 1.03% | .97% | 1.05% |
| Expenses net of all reductions | .99%H | .96% | 1.06% | 1.01% | .96% | 1.02% |
| Net investment income (loss) | .66%H | 1.02% | .94% | 1.28% | 2.43%B | 1.82% |
| Supplemental Data | ||||||
| Net assets, end of period (000 omitted) | $1,146,298 | $1,343,213 | $1,066,488 | $1,384,134 | $1,237,047 | $957,048 |
| Portfolio turnover rateI | 34%H | 73% | 62% | 87% | 80%J | 59% |
A Calculated based on average shares outstanding during the period.
B Net Investment income per share reflects a large, non-recurring dividend which amounted to $.19 per share. Excluding this non-recurring dividend, the ratio of net investment income (loss) to average net assets would have been 1.93%.
C Amount represents less than $.005 per share.
D Total returns for periods of less than one year are not annualized.
E Total returns would have been lower if certain expenses had not been reduced during the applicable periods shown.
F Fees and expenses of any underlying Fidelity Central Funds are not included in the Fund's expense ratio. The Fund indirectly bears its proportionate share of the expenses of any underlying Fidelity Central Funds.
G Expense ratios reflect operating expenses of the class. Expenses before reductions do not reflect amounts reimbursed by the investment adviser or reductions from brokerage service arrangements or reductions from other expense offset arrangements and do not represent the amount paid by the class during periods when reimbursements or reductions occur. Expenses net of fee waivers reflect expenses after reimbursement by the investment adviser but prior to reductions from brokerage service arrangements or other expense offset arrangements. Expenses net of all reductions represent the net expenses paid by the class.
H Annualized
I Amount does not include the portfolio activity of any underlying Fidelity Central Funds.
J The portfolio turnover rate does not include the assets acquired in the merger.
See accompanying notes which are an integral part of the financial statements.
Fidelity Europe Fund Class I
| Six months ended (Unaudited) April 30, | Years endedOctober 31, | �� | |||
| 2018 | 2017 | 2016 | 2015 | 2014 A | |
| Selected Per–Share Data | |||||
| Net asset value, beginning of period | $42.53 | $34.29 | $37.21 | $36.32 | $39.45 |
| Income from Investment Operations | |||||
| Net investment income (loss)B | .14 | .39 | .35 | .50 | .56 |
| Net realized and unrealized gain (loss) | (.12) | 8.38 | (2.67) | 1.30 | (3.69) |
| Total from investment operations | .02 | 8.77 | (2.32) | 1.80 | (3.13) |
| Distributions from net investment income | (.43) | (.41) | (.45) | (.91) | – |
| Distributions from net realized gain | (.66) | (.13) | (.15) | – | – |
| Total distributions | (1.09) | (.53)C | (.60) | (.91) | – |
| Redemption fees added to paid in capitalB | – | –D | –D | –D | –D |
| Net asset value, end of period | $41.46 | $42.53 | $34.29 | $37.21 | $36.32 |
| Total ReturnE,F | .08% | 26.04% | (6.33)% | 5.02% | (7.93)% |
| Ratios to Average Net AssetsG,H | |||||
| Expenses before reductions | .99%I | .98% | 1.01% | .98% | .97%I |
| Expenses net of fee waivers, if any | .99%I | .98% | 1.01% | .98% | .97%I |
| Expenses net of all reductions | .99%I | .94% | 1.00% | .96% | .96%I |
| Net investment income (loss) | .67%I | 1.04% | 1.00% | 1.33% | 2.33%I |
| Supplemental Data | |||||
| Net assets, end of period (000 omitted) | $9,052 | $8,469 | $5,340 | $6,552 | $5,666 |
| Portfolio turnover rateJ | 34%I | 73% | 62% | 87% | 80%K |
A For the period March 18, 2014 (commencement of sale of shares) to October 31, 2014.
B Calculated based on average shares outstanding during the period.
C Total distributions of $.53 per share is comprised of distributions from net investment income of $.408 and distributions from net realized gain of $.126 per share.
D Amount represents less than $.005 per share.
E Total returns for periods of less than one year are not annualized.
F Total returns would have been lower if certain expenses had not been reduced during the applicable periods shown.
G Fees and expenses of any underlying Fidelity Central Funds are not included in the Fund's expense ratio. The Fund indirectly bears its proportionate share of the expenses of any underlying Fidelity Central Funds.
H Expense ratios reflect operating expenses of the class. Expenses before reductions do not reflect amounts reimbursed by the investment adviser or reductions from brokerage service arrangements or reductions from other expense offset arrangements and do not represent the amount paid by the class during periods when reimbursements or reductions occur. Expense ratios before reductions for start-up periods may not be representative of longer-term operating periods. Expenses net of fee waivers reflect expenses after reimbursement by the investment adviser but prior to reductions from brokerage service arrangements or other expense offset arrangements. Expenses net of all reductions represent the net expenses paid by the class.
I Annualized
J Amount does not include the portfolio activity of any underlying Fidelity Central Funds.
K The portfolio turnover rate does not include the assets acquired in the merger.
See accompanying notes which are an integral part of the financial statements.
Notes to Financial Statements (Unaudited)
For the period ended April 30, 2018
1. Organization.
Fidelity Europe Fund (the Fund) is a fund of Fidelity Investment Trust (the Trust) and is authorized to issue an unlimited number of shares. The Trust is registered under the Investment Company Act of 1940, as amended (the 1940 Act), as an open-end management investment company organized as a Massachusetts business trust. The Fund offers Class A, Class M, Class C, Europe and Class I shares, each of which has equal rights as to assets and voting privileges. Each class has exclusive voting rights with respect to matters that affect that class.
2. Investments in Fidelity Central Funds.
The Fund may invest in Fidelity Central Funds, which are open-end investment companies generally available only to other investment companies and accounts managed by the investment adviser and its affiliates. The Fund's Schedule of Investments lists each of the Fidelity Central Funds held as of period end, if any, as an investment of the Fund, but does not include the underlying holdings of each Fidelity Central Fund. As an Investing Fund, the Fund indirectly bears its proportionate share of the expenses of the underlying Fidelity Central Funds.
The Money Market Central Funds seek preservation of capital and current income and are managed by Fidelity Investments Money Management, Inc. (FIMM), an affiliate of the investment adviser. Annualized expenses of the Money Market Central Funds as of their most recent shareholder report date are less than .005%.
A complete unaudited list of holdings for each Fidelity Central Fund is available upon request or at the Securities and Exchange Commission (the SEC) website at www.sec.gov. In addition, the financial statements of the Fidelity Central Funds are available on the SEC website or upon request.
3. Significant Accounting Policies.
The Fund is an investment company and applies the accounting and reporting guidance of the Financial Accounting Standards Board (FASB) Accounting Standards Codification Topic 946 Financial Services – Investments Companies. The financial statements have been prepared in conformity with accounting principles generally accepted in the United States of America (GAAP), which require management to make certain estimates and assumptions at the date of the financial statements. Actual results could differ from those estimates. Subsequent events, if any, through the date that the financial statements were issued have been evaluated in the preparation of the financial statements. The following summarizes the significant accounting policies of the Fund:
Investment Valuation. Investments are valued as of 4:00 p.m. Eastern time on the last calendar day of the period. The Board of Trustees (the Board) has delegated the day to day responsibility for the valuation of the Fund's investments to the Fair Value Committee (the Committee) established by the Fund's investment adviser. In accordance with valuation policies and procedures approved by the Board, the Fund attempts to obtain prices from one or more third party pricing vendors or brokers to value its investments. When current market prices, quotations or currency exchange rates are not readily available or reliable, investments will be fair valued in good faith by the Committee, in accordance with procedures adopted by the Board. Factors used in determining fair value vary by investment type and may include market or investment specific events. The frequency with which these procedures are used cannot be predicted and they may be utilized to a significant extent. The Committee oversees the Fund's valuation policies and procedures and reports to the Board on the Committee's activities and fair value determinations. The Board monitors the appropriateness of the procedures used in valuing the Fund's investments and ratifies the fair value determinations of the Committee.
The Fund categorizes the inputs to valuation techniques used to value its investments into a disclosure hierarchy consisting of three levels as shown below:
- Level 1 – quoted prices in active markets for identical investments
- Level 2 – other significant observable inputs (including quoted prices for similar investments, interest rates, prepayment speeds, etc.)
- Level 3 – unobservable inputs (including the Fund's own assumptions based on the best information available)
Valuation techniques used to value the Fund's investments by major category are as follows:
Equity securities, including restricted securities, for which market quotations are readily available, are valued at the last reported sale price or official closing price as reported by a third party pricing vendor on the primary market or exchange on which they are traded and are categorized as Level 1 in the hierarchy. In the event there were no sales during the day or closing prices are not available, securities are valued at the last quoted bid price or may be valued using the last available price and are generally categorized as Level 2 in the hierarchy. For foreign equity securities, when market or security specific events arise, comparisons to the valuation of American Depositary Receipts (ADRs), futures contracts, Exchange-Traded Funds (ETFs)and certain indexes as well as quoted prices for similar securities may be used and would be categorized as Level 2 in the hierarchy. Utilizing these techniques may result in transfers between Level 1 and Level 2. For equity securities, including restricted securities, where observable inputs are limited, assumptions about market activity and risk are used and these securities may be categorized as Level 3 in the hierarchy.
Investments in open-end mutual funds, including the Fidelity Central Funds, are valued at their closing net asset value (NAV) each business day and are categorized as Level 1 in the hierarchy.
Changes in valuation techniques may result in transfers in or out of an assigned level within the disclosure hierarchy. The aggregate value of investments by input level as of April 30, 2018, including information on transfers between Levels 1 and 2, is included at the end of the Fund's Schedule of Investments.
Foreign Currency. The Fund may use foreign currency contracts to facilitate transactions in foreign-denominated securities. Gains and losses from these transactions may arise from changes in the value of the foreign currency or if the counterparties do not perform under the contracts' terms.
Foreign-denominated assets, including investment securities, and liabilities are translated into U.S. dollars at the exchange rates at period end. Purchases and sales of investment securities, income and dividends received and expenses denominated in foreign currencies are translated into U.S. dollars at the exchange rate in effect on the transaction date.
The effects of exchange rate fluctuations on investments are included with the net realized and unrealized gain (loss) on investment securities. Other foreign currency transactions resulting in realized and unrealized gain (loss) are disclosed separately.
Investment Transactions and Income. For financial reporting purposes, the Fund's investment holdings and NAV include trades executed through the end of the last business day of the period. The NAV per share for processing shareholder transactions is calculated as of the close of business of the New York Stock Exchange (NYSE), normally 4:00 p.m. Eastern time and includes trades executed through the end of the prior business day. Gains and losses on securities sold are determined on the basis of identified cost and includes proceeds received from litigation. Dividend income is recorded on the ex-dividend date, except for certain dividends from foreign securities where the ex-dividend date may have passed, which are recorded as soon as the Fund is informed of the ex-dividend date. Non-cash dividends included in dividend income, if any, are recorded at the fair market value of the securities received. Income and capital gain distributions from Fidelity Central Funds, if any, are recorded on the ex-dividend date. Investment income is recorded net of foreign taxes withheld where recovery of such taxes is uncertain.
Class Allocations and Expenses. Investment income, realized and unrealized capital gains and losses, common expenses of the Fund, and certain fund-level expense reductions, if any, are allocated daily on a pro-rata basis to each class based on the relative net assets of each class to the total net assets of the Fund. Each class differs with respect to transfer agent and distribution and service plan fees incurred. Certain expense reductions may also differ by class. For the reporting period, the allocated portion of income and expenses to each class as a percent of its average net assets may vary due to the timing of recording these transactions in relation to fluctuating net assets of the classes. Expenses directly attributable to a fund are charged to that fund. Expenses attributable to more than one fund are allocated among the respective funds on the basis of relative net assets or other appropriate methods. Expense estimates are accrued in the period to which they relate and adjustments are made when actual amounts are known.
Income Tax Information and Distributions to Shareholders. Each year, the Fund intends to qualify as a regulated investment company under Subchapter M of the Internal Revenue Code, including distributing substantially all of its taxable income and realized gains. As a result, no provision for U.S. Federal income taxes is required. The Fund files a U.S. federal tax return, in addition to state and local tax returns as required. The Fund's federal income tax returns are subject to examination by the Internal Revenue Service (IRS) for a period of three fiscal years after they are filed. State and local tax returns may be subject to examination for an additional fiscal year depending on the jurisdiction. Foreign taxes are provided for based on the Fund's understanding of the tax rules and rates that exist in the foreign markets in which it invests.
Distributions are declared and recorded on the ex-dividend date. Income and capital gain distributions are declared separately for each class. Income and capital gain distributions are determined in accordance with income tax regulations, which may differ from GAAP.
Capital accounts within the financial statements are adjusted for permanent book-tax differences. These adjustments have no impact on net assets or the results of operations. Capital accounts are not adjusted for temporary book-tax differences which will reverse in a subsequent period.
Book-tax differences are primarily due to foreign currency transactions, passive foreign investment companies (PFIC), deferred trustees compensation, expiring capital loss carryforwards, capital loss carryforwards and losses deferred due to wash sales.
As of period end, the cost and unrealized appreciation (depreciation) in securities, and derivatives if applicable, for federal income tax purposes were as follows:
| Gross unrealized appreciation | $208,883,812 |
| Gross unrealized depreciation | (72,913,338) |
| Net unrealized appreciation (depreciation) | $135,970,474 |
| Tax cost | $1,084,092,794 |
Restricted Securities. The Fund may invest in securities that are subject to legal or contractual restrictions on resale. These securities generally may be resold in transactions exempt from registration or to the public if the securities are registered. Disposal of these securities may involve time-consuming negotiations and expense, and prompt sale at an acceptable price may be difficult. Information regarding restricted securities is included at the end of the Fund's Schedule of Investments.
4. Purchases and Sales of Investments.
Purchases and sales of securities, other than short-term securities, aggregated $217,012,170 and $323,740,881, respectively.
5. Fees and Other Transactions with Affiliates.
Management Fee. Fidelity Management & Research Company (the investment adviser) and its affiliates provide the Fund with investment management related services for which the Fund pays a monthly management fee. The management fee is the sum of an individual fund fee rate that is based on an annual rate of .45% of the Fund's average net assets and an annualized group fee rate that averaged .24% during the period. The group fee rate is based upon the average net assets of all the mutual funds advised by the investment adviser, including any mutual funds previously advised by the investment adviser that are currently advised by Fidelity SelectCo, LLC, an affiliate of the investment adviser. The group fee rate decreases as assets under management increase and increases as assets under management decrease. In addition, the management fee is subject to a performance adjustment (up to a maximum of +/- .20% of the Fund's average net assets over a 36 month performance period). The upward or downward adjustment to the management fee is based on the relative investment performance of Europe as compared to its benchmark index, the MSCI Europe Index, over the same 36 month performance period. For the reporting period, the total annualized management fee rate, including the performance adjustment, was .76% of the Fund's average net assets. The performance adjustment included in the management fee rate may be higher or lower than the maximum performance adjustment rate due to the difference between the average net assets for the reporting and performance periods.
Distribution and Service Plan Fees. In accordance with Rule 12b-1 of the 1940 Act, the Fund has adopted separate Distribution and Service Plans for each class of shares. Certain classes pay Fidelity Distributors Corporation (FDC), an affiliate of the investment adviser, separate Distribution and Service Fees, each of which is based on an annual percentage of each class' average net assets. In addition, FDC may pay financial intermediaries for selling shares of the Fund and providing shareholder support services. For the period, the Distribution and Service Fee rates, total fees and amounts retained by FDC were as follows:
| Distribution Fee | Service Fee | Total Fees | Retained by FDC | |
| Class A | -% | .25% | $28,126 | $2,720 |
| Class M | .25% | .25% | 23,206 | 304 |
| Class C | .75% | .25% | 58,195 | 11,137 |
| $109,527 | $14,161 |
Sales Load. FDC may receive a front-end sales charge of up to 5.75% for selling Class A shares and 3.50% for selling Class M shares, some of which is paid to financial intermediaries for selling shares of the Fund. Depending on the holding period, FDC may receive contingent deferred sales charges levied on Class A, Class M and Class C redemptions. The deferred sales charges are 1.00% for Class C shares, 1.00% for certain purchases of Class A shares and .25% for certain purchases of Class M shares.
For the period, sales charge amounts retained by FDC were as follows:
| Retained by FDC | |
| Class A | $11,209 |
| Class M | 1,062 |
| Class C(a) | 1,263 |
| $13,534 |
(a) When Class C shares are initially sold, FDC pays commissions from its own resources to financial intermediaries through which the sales are made.
Transfer Agent Fees. Fidelity Investments Institutional Operations Company, Inc., (FIIOC), an affiliate of the investment adviser, is the transfer, dividend disbursing and shareholder servicing agent for each class of the Fund. FIIOC receives account fees and asset-based fees that vary according to the account size and type of account of the shareholders of the respective classes of the Fund. FIIOC pays for typesetting, printing and mailing of shareholder reports, except proxy statements.
For the period, transfer agent fees for each class were as follows:
| Amount | % of Class-Level Average Net Assets(a) | |
| Class A | $27,065 | .24 |
| Class M | 14,579 | .31 |
| Class C | 15,514 | .27 |
| Europe | 1,009,930 | .17 |
| Class I | 7,636 | .16 |
| $1,074,724 |
(a) Annualized
Accounting and Security Lending Fees. Fidelity Service Company, Inc. (FSC), an affiliate of the investment adviser, maintains the Fund's accounting records. The accounting fee is based on the level of average net assets for each month. Under a separate contract, FSC administers the security lending program. The security lending fee is based on the number and duration of lending transactions. For the period, the fees were equivalent to an annualized rate of .05%.
Interfund Trades. The Fund may purchase from or sell securities to other Fidelity Funds under procedures adopted by the Board. The procedures have been designed to ensure these interfund trades are executed in accordance with Rule 17a-7 of the 1940 Act. Interfund trades are included within the respective purchases and sales amounts shown in the Purchases and Sales of Investments note.
6. Committed Line of Credit.
The Fund participates with other funds managed by the investment adviser or an affiliate in a $4.25 billion credit facility (the "line of credit") to be utilized for temporary or emergency purposes to fund shareholder redemptions or for other short-term liquidity purposes. The Fund has agreed to pay commitment fees on its pro-rata portion of the line of credit, which amounted to $1,866 and is reflected in Miscellaneous expenses on the Statement of Operations. During the period, the Fund did not borrow on this line of credit.
7. Security Lending.
The Fund lends portfolio securities through a lending agent from time to time in order to earn additional income. For equity securities, a lending agent is used and may loan securities to certain qualified borrowers, including Fidelity Capital Markets (FCM), a broker-dealer affiliated with the Fund. On the settlement date of the loan, the Fund receives collateral (in the form of U.S. Treasury obligations, letters of credit and/or cash) against the loaned securities and maintains collateral in an amount not less than 100% of the market value of the loaned securities during the period of the loan. The market value of the loaned securities is determined at the close of business of the Fund and any additional required collateral is delivered to the Fund on the next business day. The Fund or borrower may terminate the loan at any time, and if the borrower defaults on its obligation to return the securities loaned because of insolvency or other reasons, the Fund may apply collateral received from the borrower against the obligation. The Fund may experience delays and costs in recovering the securities loaned. Any cash collateral received is invested in the Fidelity Securities Lending Cash Central Fund. The value of loaned securities and cash collateral at period end are disclosed on the Fund's Statement of Assets and Liabilities. Security lending income represents the income earned on investing cash collateral, less rebates paid to borrowers and any lending agent fees associated with the loan, plus any premium payments received for lending certain types of securities. Security lending income is presented in the Statement of Operations as a component of income from Fidelity Central Funds. Total security lending income during the period amounted to $146,708. During the period, there were no securities loaned to FCM.
8. Expense Reductions.
Commissions paid to certain brokers with whom the investment adviser, or its affiliates, places trades on behalf of the Fund include an amount in addition to trade execution, which may be rebated back to the Fund to offset certain expenses. This amount totaled $8,780 for the period.
In addition, during the period the investment adviser reimbursed and/or waived a portion of fund-level operating expenses in the amount of $6,275.
9. Distributions to Shareholders.
Distributions to shareholders of each class were as follows:
| Six months ended April 30, 2018 | Year ended October 31, 2017 | |
| From net investment income | ||
| Class A | $167,254 | $107,755 |
| Class M | 47,815 | 18,342 |
| Class C | 26,220 | – |
| Europe | 11,582,836 | 11,539,715 |
| Class I | 90,953 | 62,056 |
| Total | $11,915,078 | $11,727,868 |
| From net realized gain | ||
| Class A | $333,954 | $60,612 |
| Class M | 138,387 | 25,396 |
| Class C | 174,007 | – |
| Europe | 18,560,785 | 3,806,294 |
| Class I | 138,005 | 19,164 |
| Total | $19,345,138 | $3,911,466 |
10. Share Transactions.
Share transactions for each class were as follows and may contain automatic conversions between classes or exchanges between affiliated funds:
| Shares | Shares | Dollars | Dollars | |
| Six months ended April 30, 2018 | Year ended October 31, 2017 | Six months ended April 30, 2018 | Year ended October 31, 2017 | |
| Class A | ||||
| Shares sold | 121,265 | 183,985 | $5,182,342 | $7,204,193 |
| Reinvestment of distributions | 11,776 | 4,870 | 482,917 | 160,602 |
| Shares redeemed | (115,176) | (201,553) | (4,850,302) | (7,350,664) |
| Net increase (decrease) | 17,865 | (12,698) | $814,957 | $14,131 |
| Class M | ||||
| Shares sold | 26,138 | 58,824 | $1,113,666 | $2,231,944 |
| Reinvestment of distributions | 4,513 | 1,308 | 185,442 | 43,252 |
| Shares redeemed | (19,831) | (55,679) | (833,332) | (2,027,896) |
| Net increase (decrease) | 10,820 | 4,453 | $465,776 | $247,300 |
| Class C | ||||
| Shares sold | 62,125 | 65,577 | $2,622,334 | $2,522,918 |
| Reinvestment of distributions | 4,833 | – | 197,576 | – |
| Shares redeemed | (27,751) | (77,588) | (1,180,829) | (2,798,078) |
| Net increase (decrease) | 39,207 | (12,011) | $1,639,081 | $(275,160) |
| Europe | ||||
| Shares sold | 1,894,280 | 6,873,387 | $81,209,899 | $263,271,628 |
| Reinvestment of distributions | 696,409 | 443,969 | 28,552,790 | 14,619,907 |
| Shares redeemed | (6,538,130) | (6,861,890) | (278,011,330) | (254,648,472) |
| Net increase (decrease) | (3,947,441) | 455,466 | $(168,248,641) | $23,243,063 |
| Class I | ||||
| Shares sold | 83,439 | 152,572 | $3,564,461 | $5,796,106 |
| Reinvestment of distributions | 5,434 | 2,369 | 222,682 | 78,022 |
| Shares redeemed | (69,656) | (111,570) | (2,964,354) | (4,088,518) |
| Net increase (decrease) | 19,217 | 43,371 | $822,789 | $1,785,610 |
11. Other.
The Fund's organizational documents provide former and current trustees and officers with a limited indemnification against liabilities arising in connection with the performance of their duties to the Fund. In the normal course of business, the Fund may also enter into contracts that provide general indemnifications. The Fund's maximum exposure under these arrangements is unknown as this would be dependent on future claims that may be made against the Fund. The risk of material loss from such claims is considered remote.
Fidelity® Japan Fund
Investment Summary (Unaudited)
Geographic Diversification (% of fund's net assets)
| As of April 30, 2018 | ||
| Japan | 98.4% | |
| United States of America* | 1.0% | |
| Bermuda | 0.6% | |

* Includes Short-Term investments and Net Other Assets (Liabilities).
Percentages are based on country or territory of incorporation and are adjusted for the effect of futures contracts, if applicable.
Asset Allocation as of April 30, 2018
| % of fund's net assets | |
| Stocks | 99.0 |
| Short-Term Investments and Net Other Assets (Liabilities) | 1.0 |
Top Ten Stocks as of April 30, 2018
| % of fund's net assets | |
| SoftBank Corp. (Wireless Telecommunication Services) | 5.0 |
| Sony Corp. (Household Durables) | 4.1 |
| Mitsubishi UFJ Financial Group, Inc. (Banks) | 3.7 |
| ORIX Corp. (Diversified Financial Services) | 3.3 |
| Shimadzu Corp. (Electronic Equipment & Components) | 3.2 |
| Hoya Corp. (Health Care Equipment & Supplies) | 3.2 |
| Nidec Corp. (Electrical Equipment) | 2.6 |
| East Japan Railway Co. (Road & Rail) | 2.5 |
| Suzuki Motor Corp. (Automobiles) | 2.2 |
| Honda Motor Co. Ltd. (Automobiles) | 2.0 |
| 31.8 |
Top Market Sectors as of April 30, 2018
| % of fund's net assets | |
| Industrials | 20.0 |
| Consumer Discretionary | 20.0 |
| Information Technology | 15.6 |
| Financials | 11.1 |
| Materials | 9.1 |
| Consumer Staples | 8.9 |
| Health Care | 8.5 |
| Telecommunication Services | 5.0 |
| Real Estate | 0.8 |
Fidelity® Japan Fund
Schedule of Investments April 30, 2018 (Unaudited)
Showing Percentage of Net Assets
| Common Stocks - 99.0% | |||
| Shares | Value | ||
| CONSUMER DISCRETIONARY - 20.0% | |||
| Auto Components - 2.5% | |||
| Bridgestone Corp. | 123,900 | $5,201,035 | |
| DaikyoNishikawa Corp. | 93,800 | 1,691,180 | |
| Sumitomo Electric Industries Ltd. | 243,600 | 3,742,464 | |
| 10,634,679 | |||
| Automobiles - 5.4% | |||
| Honda Motor Co. Ltd. | 240,100 | 8,256,069 | |
| Subaru Corp. | 150,700 | 5,071,582 | |
| Suzuki Motor Corp. | 170,200 | 9,171,681 | |
| 22,499,332 | |||
| Household Durables - 7.6% | |||
| Panasonic Corp. | 503,600 | 7,456,881 | |
| Rinnai Corp. | 33,200 | 3,307,245 | |
| Sekisui Chemical Co. Ltd. | 106,300 | 1,886,407 | |
| Sekisui House Ltd. | 104,300 | 1,912,453 | |
| Sony Corp. | 365,000 | 17,047,733 | |
| 31,610,719 | |||
| Internet & Direct Marketing Retail - 0.4% | |||
| Start Today Co. Ltd. | 63,500 | 1,835,529 | |
| Leisure Products - 0.5% | |||
| Bandai Namco Holdings, Inc. | 66,700 | 2,266,653 | |
| Media - 2.1% | |||
| Dentsu, Inc. | 105,400 | 4,994,255 | |
| LIFULL Co. Ltd. | 441,900 | 3,605,697 | |
| 8,599,952 | |||
| Specialty Retail - 1.5% | |||
| Nitori Holdings Co. Ltd. | 20,000 | 3,380,900 | |
| USS Co. Ltd. | 127,000 | 2,673,134 | |
| 6,054,034 | |||
| TOTAL CONSUMER DISCRETIONARY | 83,500,898 | ||
| CONSUMER STAPLES - 8.9% | |||
| Food & Staples Retailing - 5.4% | |||
| Ain Holdings, Inc. | 33,900 | 2,263,721 | |
| Nishimoto Co. Ltd. | 19,700 | 816,328 | |
| San-A Co. Ltd. | 42,700 | 2,277,177 | |
| Seven & i Holdings Co. Ltd. | 165,900 | 7,309,690 | |
| Sundrug Co. Ltd. | 61,600 | 3,172,411 | |
| Tsuruha Holdings, Inc. | 19,600 | 2,820,234 | |
| Welcia Holdings Co. Ltd. | 74,200 | 3,821,314 | |
| 22,480,875 | |||
| Food Products - 1.3% | |||
| Japan Meat Co. Ltd. | 85,000 | 1,520,856 | |
| Morinaga & Co. Ltd. | 82,000 | 3,997,988 | |
| 5,518,844 | |||
| Personal Products - 2.2% | |||
| Kao Corp. | 80,100 | 5,755,447 | |
| Kose Corp. | 16,900 | 3,130,488 | |
| 8,885,935 | |||
| TOTAL CONSUMER STAPLES | 36,885,654 | ||
| FINANCIALS - 11.1% | |||
| Banks - 4.5% | |||
| Mitsubishi UFJ Financial Group, Inc. | 2,281,700 | 15,290,455 | |
| Shinsei Bank Ltd. | 211,700 | 3,307,570 | |
| 18,598,025 | |||
| Consumer Finance - 0.7% | |||
| AEON Financial Service Co. Ltd. | 128,600 | 3,018,547 | |
| Diversified Financial Services - 3.3% | |||
| ORIX Corp. | 785,600 | 13,826,330 | |
| Insurance - 2.6% | |||
| Sony Financial Holdings, Inc. | 173,600 | 3,174,409 | |
| Tokio Marine Holdings, Inc. | 161,800 | 7,654,863 | |
| 10,829,272 | |||
| TOTAL FINANCIALS | 46,272,174 | ||
| HEALTH CARE - 8.5% | |||
| Biotechnology - 0.4% | |||
| PeptiDream, Inc. (a)(b) | 39,000 | 1,583,974 | |
| Health Care Equipment & Supplies - 6.4% | |||
| Hoya Corp. | 250,600 | 13,437,772 | |
| Nakanishi, Inc. | 79,500 | 1,662,431 | |
| Olympus Corp. | 211,200 | 7,891,987 | |
| Paramount Bed Holdings Co. Ltd. | 76,500 | 3,806,806 | |
| 26,798,996 | |||
| Health Care Providers & Services - 1.0% | |||
| Ship Healthcare Holdings, Inc. | 120,800 | 4,204,574 | |
| Pharmaceuticals - 0.7% | |||
| Takeda Pharmaceutical Co. Ltd. | 71,300 | 3,002,447 | |
| TOTAL HEALTH CARE | 35,589,991 | ||
| INDUSTRIALS - 20.0% | |||
| Building Products - 2.6% | |||
| Daikin Industries Ltd. | 55,500 | 6,500,892 | |
| Toto Ltd. | 77,500 | 4,402,442 | |
| 10,903,334 | |||
| Commercial Services & Supplies - 1.0% | |||
| Sohgo Security Services Co., Ltd. | 87,900 | 4,349,973 | |
| Construction & Engineering - 1.8% | |||
| Mirait Holdings Corp. | 183,100 | 2,904,276 | |
| Toshiba Plant Systems & Services Corp. | 217,700 | 4,552,344 | |
| 7,456,620 | |||
| Electrical Equipment - 2.6% | |||
| Nidec Corp. | 70,500 | 11,053,513 | |
| Machinery - 3.0% | |||
| Komatsu Ltd. | 67,900 | 2,314,625 | |
| Minebea Mitsumi, Inc. | 205,100 | 4,121,887 | |
| SMC Corp. | 15,500 | 5,915,295 | |
| 12,351,807 | |||
| Professional Services - 2.7% | |||
| Benefit One, Inc. (a) | 136,600 | 3,208,825 | |
| Funai Soken Holdings, Inc. | 60,000 | 1,406,147 | |
| Outsourcing, Inc. | 210,100 | 3,543,948 | |
| Recruit Holdings Co. Ltd. | 125,800 | 2,907,945 | |
| 11,066,865 | |||
| Road & Rail - 3.0% | |||
| East Japan Railway Co. | 109,600 | 10,516,868 | |
| Hitachi Transport System Ltd. | 75,500 | 2,024,245 | |
| 12,541,113 | |||
| Trading Companies & Distributors - 3.3% | |||
| Misumi Group, Inc. | 238,300 | 6,604,912 | |
| Mitsui & Co. Ltd. | 244,900 | 4,427,779 | |
| Trusco Nakayama Corp. | 106,300 | 2,798,494 | |
| 13,831,185 | |||
| TOTAL INDUSTRIALS | 83,554,410 | ||
| INFORMATION TECHNOLOGY - 15.6% | |||
| Electronic Equipment & Components - 7.9% | |||
| Azbil Corp. | 73,500 | 3,428,924 | |
| Dexerials Corp. | 301,600 | 2,844,398 | |
| Iriso Electronics Co. Ltd. | 31,200 | 1,980,681 | |
| Murata Manufacturing Co. Ltd. | 22,800 | 2,878,416 | |
| Shimadzu Corp. | 493,700 | 13,439,912 | |
| TDK Corp. | 47,700 | 4,123,353 | |
| Topcon Corp. | 213,900 | 4,265,478 | |
| 32,961,162 | |||
| Internet Software & Services - 3.3% | |||
| DeNA Co. Ltd. | 135,000 | 2,574,780 | |
| Kakaku.com, Inc. | 273,800 | 5,237,064 | |
| SMS Co., Ltd. | 83,700 | 3,177,415 | |
| Yahoo! Japan Corp. (a) | 639,300 | 2,631,586 | |
| 13,620,845 | |||
| IT Services - 1.1% | |||
| IT Holdings Corp. | 62,800 | 2,493,158 | |
| Otsuka Corp. | 44,600 | 2,080,681 | |
| 4,573,839 | |||
| Semiconductors & Semiconductor Equipment - 1.8% | |||
| Renesas Electronics Corp. (b) | 285,500 | 2,998,116 | |
| Sumco Corp. | 185,400 | 4,582,426 | |
| 7,580,542 | |||
| Software - 1.5% | |||
| Nintendo Co. Ltd. | 15,100 | 6,344,665 | |
| TOTAL INFORMATION TECHNOLOGY | 65,081,053 | ||
| MATERIALS - 9.1% | |||
| Chemicals - 8.2% | |||
| Axalta Coating Systems Ltd. (b) | 82,200 | 2,539,980 | |
| Hitachi Chemical Co. Ltd. | 116,100 | 2,555,220 | |
| JSR Corp. | 193,000 | 3,645,673 | |
| Kansai Paint Co. Ltd. | 148,200 | 3,340,329 | |
| KH Neochem Co. Ltd. | 56,400 | 1,712,843 | |
| Nissan Chemical Industries Co. Ltd. | 72,700 | 3,241,973 | |
| Nitto Denko Corp. | 23,100 | 1,722,146 | |
| Okamoto Industries, Inc. | 113,000 | 1,132,894 | |
| Shin-Etsu Chemical Co. Ltd. | 77,400 | 7,791,685 | |
| Tokyo Ohka Kogyo Co. Ltd. | 63,800 | 2,249,808 | |
| Toray Industries, Inc. | 451,200 | 4,211,760 | |
| 34,144,311 | |||
| Construction Materials - 0.9% | |||
| Taiheiyo Cement Corp. | 103,100 | 3,909,161 | |
| TOTAL MATERIALS | 38,053,472 | ||
| REAL ESTATE - 0.8% | |||
| Real Estate Management & Development - 0.8% | |||
| Tateru, Inc. (a) | 191,200 | 3,256,626 | |
| TELECOMMUNICATION SERVICES - 5.0% | |||
| Wireless Telecommunication Services - 5.0% | |||
| SoftBank Corp. | 273,700 | 20,913,065 | |
| TOTAL COMMON STOCKS | |||
| (Cost $314,637,970) | 413,107,343 | ||
| Money Market Funds - 1.9% | |||
| Fidelity Cash Central Fund, 1.74% (c) | 2,255,456 | 2,255,908 | |
| Fidelity Securities Lending Cash Central Fund 1.74% (c)(d) | 5,821,356 | 5,821,938 | |
| TOTAL MONEY MARKET FUNDS | |||
| (Cost $8,078,155) | 8,077,846 | ||
| TOTAL INVESTMENT IN SECURITIES - 100.9% | |||
| (Cost $322,716,125) | 421,185,189 | ||
| NET OTHER ASSETS (LIABILITIES) - (0.9)% | (3,945,734) | ||
| NET ASSETS - 100% | $417,239,455 |
Legend
(a) Security or a portion of the security is on loan at period end.
(b) Non-income producing
(c) Affiliated fund that is generally available only to investment companies and other accounts managed by Fidelity Investments. The rate quoted is the annualized seven-day yield of the fund at period end. A complete unaudited listing of the fund's holdings as of its most recent quarter end is available upon request. In addition, each Fidelity Central Fund's financial statements are available on the SEC's website or upon request.
(d) Investment made with cash collateral received from securities on loan.
Affiliated Central Funds
Information regarding fiscal year to date income earned by the Fund from investments in Fidelity Central Funds is as follows:
| Fund | Income earned |
| Fidelity Cash Central Fund | $23,371 |
| Fidelity Securities Lending Cash Central Fund | 77,345 |
| Total | $100,716 |
Amounts in the income column in the above table include any capital gain distributions from underlying funds, which are presented in the corresponding line-item in the Statement of Operations if applicable.
Investment Valuation
The following is a summary of the inputs used, as of April 30, 2018, involving the Fund's assets and liabilities carried at fair value. The inputs or methodology used for valuing securities may not be an indication of the risk associated with investing in those securities. For more information on valuation inputs, and their aggregation into the levels used below, please refer to the Investment Valuation section in the accompanying Notes to Financial Statements.
| Valuation Inputs at Reporting Date: | ||||
| Description | Total | Level 1 | Level 2 | Level 3 |
| Investments in Securities: | ||||
| Equities: | ||||
| Consumer Discretionary | $83,500,898 | $50,740,215 | $32,760,683 | $-- |
| Consumer Staples | 36,885,654 | 29,575,964 | 7,309,690 | -- |
| Financials | 46,272,174 | 30,981,719 | 15,290,455 | -- |
| Health Care | 35,589,991 | 32,587,544 | 3,002,447 | -- |
| Industrials | 83,554,410 | 81,239,785 | 2,314,625 | -- |
| Information Technology | 65,081,053 | 55,857,972 | 9,223,081 | -- |
| Materials | 38,053,472 | 33,841,712 | 4,211,760 | -- |
| Real Estate | 3,256,626 | 3,256,626 | -- | -- |
| Telecommunication Services | 20,913,065 | -- | 20,913,065 | -- |
| Money Market Funds | 8,077,846 | 8,077,846 | -- | -- |
| Total Investments in Securities: | $421,185,189 | $326,159,383 | $95,025,806 | $-- |
The following is a summary of transfers between Level 1 and Level 2 for the period ended April 30, 2018. Transfers are assumed to have occurred at the beginning of the period, and are primarily attributable to the valuation techniques used for foreign equity securities, as discussed in the accompanying Notes to Financial Statements:
| Transfers | Total |
| Level 1 to Level 2 | $0 |
| Level 2 to Level 1 | $309,355,250 |
See accompanying notes which are an integral part of the financial statements.
Fidelity® Japan Fund
Financial Statements
Statement of Assets and Liabilities
| April 30, 2018 (Unaudited) | ||
| Assets | ||
| Investment in securities, at value (including securities loaned of $5,530,446) — See accompanying schedule: Unaffiliated issuers (cost $314,637,970) | $413,107,343 | |
| Fidelity Central Funds (cost $8,078,155) | 8,077,846 | |
| Total Investment in Securities (cost $322,716,125) | $421,185,189 | |
| Receivable for investments sold | 226,538 | |
| Receivable for fund shares sold | 142,106 | |
| Dividends receivable | 2,747,068 | |
| Distributions receivable from Fidelity Central Funds | 13,903 | |
| Prepaid expenses | 226 | |
| Other receivables | 17,404 | |
| Total assets | 424,332,434 | |
| Liabilities | ||
| Payable for investments purchased | $633,413 | |
| Payable for fund shares redeemed | 242,674 | |
| Accrued management fee | 247,425 | |
| Distribution and service plan fees payable | 18,630 | |
| Other affiliated payables | 81,036 | |
| Other payables and accrued expenses | 49,533 | |
| Collateral on securities loaned | 5,820,268 | |
| Total liabilities | 7,092,979 | |
| Net Assets | $417,239,455 | |
| Net Assets consist of: | ||
| Paid in capital | $432,656,380 | |
| Undistributed net investment income | 1,187,941 | |
| Accumulated undistributed net realized gain (loss) on investments and foreign currency transactions | (115,014,850) | |
| Net unrealized appreciation (depreciation) on investments and assets and liabilities in foreign currencies | 98,409,984 | |
| Net Assets | $417,239,455 | |
| Calculation of Maximum Offering Price | ||
| Class A: | ||
| Net Asset Value and redemption price per share ($17,054,725 ÷ 1,087,359 shares) | $15.68 | |
| Maximum offering price per share (100/94.25 of $15.68) | $16.64 | |
| Class M: | ||
| Net Asset Value and redemption price per share ($4,590,639 ÷ 292,944 shares) | $15.67 | |
| Maximum offering price per share (100/96.50 of $15.67) | $16.24 | |
| Class C: | ||
| Net Asset Value and offering price per share ($15,678,771 ÷ 1,009,258 shares)(a) | $15.53 | |
| Japan: | ||
| Net Asset Value, offering price and redemption price per share ($190,313,082 ÷ 12,103,231 shares) | $15.72 | |
| Class I: | ||
| Net Asset Value, offering price and redemption price per share ($189,602,238 ÷ 12,083,817 shares) | $15.69 |
(a) Redemption price per share is equal to net asset value less any applicable contingent deferred sales charge.
See accompanying notes which are an integral part of the financial statements.
Statement of Operations
| Six months ended April 30, 2018 (Unaudited) | ||
| Investment Income | ||
| Dividends | $3,629,540 | |
| Income from Fidelity Central Funds | 100,716 | |
| Income before foreign taxes withheld | 3,730,256 | |
| Less foreign taxes withheld | (362,870) | |
| Total income | 3,367,386 | |
| Expenses | ||
| Management fee | ||
| Basic fee | $1,449,166 | |
| Performance adjustment | 31,234 | |
| Transfer agent fees | 372,456 | |
| Distribution and service plan fees | 109,199 | |
| Accounting and security lending fees | 109,563 | |
| Custodian fees and expenses | 22,646 | |
| Independent trustees' fees and expenses | 841 | |
| Registration fees | 63,297 | |
| Audit | 41,699 | |
| Legal | 818 | |
| Miscellaneous | 1,423 | |
| Total expenses before reductions | 2,202,342 | |
| Expense reductions | (35,123) | 2,167,219 |
| Net investment income (loss) | 1,200,167 | |
| Realized and Unrealized Gain (Loss) | ||
| Net realized gain (loss) on: | ||
| Investment securities: | ||
| Unaffiliated issuers | 32,447,005 | |
| Fidelity Central Funds | 56 | |
| Foreign currency transactions | 152,625 | |
| Total net realized gain (loss) | 32,599,686 | |
| Change in net unrealized appreciation (depreciation) on: | ||
| Investment securities: | ||
| Unaffiliated issuers | (13,934,897) | |
| Fidelity Central Funds | 199 | |
| Assets and liabilities in foreign currencies | (53,841) | |
| Total change in net unrealized appreciation (depreciation) | (13,988,539) | |
| Net gain (loss) | 18,611,147 | |
| Net increase (decrease) in net assets resulting from operations | $19,811,314 |
See accompanying notes which are an integral part of the financial statements.
Statement of Changes in Net Assets
| Six months ended April 30, 2018 (Unaudited) | Year ended October 31, 2017 | |
| Increase (Decrease) in Net Assets | ||
| Operations | ||
| Net investment income (loss) | $1,200,167 | $2,955,189 |
| Net realized gain (loss) | 32,599,686 | 11,302,131 |
| Change in net unrealized appreciation (depreciation) | (13,988,539) | 67,770,223 |
| Net increase (decrease) in net assets resulting from operations | 19,811,314 | 82,027,543 |
| Distributions to shareholders from net investment income | (2,952,607) | (3,369,067) |
| Distributions to shareholders from net realized gain | (906,084) | (1,060,540) |
| Total distributions | (3,858,691) | (4,429,607) |
| Share transactions - net increase (decrease) | (56,069,472) | (23,430,665) |
| Redemption fees | 7,512 | 33,312 |
| Total increase (decrease) in net assets | (40,109,337) | 54,200,583 |
| Net Assets | ||
| Beginning of period | 457,348,792 | 403,148,209 |
| End of period | $417,239,455 | $457,348,792 |
| Other Information | ||
| Undistributed net investment income end of period | $1,187,941 | $2,940,381 |
See accompanying notes which are an integral part of the financial statements.
Financial Highlights
Fidelity Japan Fund Class A
| Six months ended (Unaudited) April 30, | Years endedOctober 31, | |||||
| 2018 | 2017 | 2016 | 2015 | 2014 | 2013 | |
| Selected Per–Share Data | ||||||
| Net asset value, beginning of period | $15.08 | $12.59 | $11.87 | $11.65 | $12.00 | $9.30 |
| Income from Investment Operations | ||||||
| Net investment income (loss)A | .02 | .06 | .06 | .04 | .05 | .08 |
| Net realized and unrealized gain (loss) | .69 | 2.52 | .72 | .23 | (.31) | 2.80 |
| Total from investment operations | .71 | 2.58 | .78 | .27 | (.26) | 2.88 |
| Distributions from net investment income | (.08) | (.06) | (.05) | (.05) | (.08) | (.11) |
| Distributions from net realized gain | (.04) | (.03) | (.01) | – | (.01) | (.08) |
| Total distributions | (.11)B | (.09) | (.06) | (.05) | (.09) | (.19) |
| Redemption fees added to paid in capitalA | –C | –C | –C | –C | –C | .01 |
| Net asset value, end of period | $15.68 | $15.08 | $12.59 | $11.87 | $11.65 | $12.00 |
| Total ReturnD,E,F | 4.74% | 20.70% | 6.56% | 2.31% | (2.18)% | 31.58% |
| Ratios to Average Net AssetsG,H | ||||||
| Expenses before reductions | 1.31%I | 1.11% | 1.08% | 1.10% | 1.23% | 1.26% |
| Expenses net of fee waivers, if any | 1.31%I | 1.11% | 1.08% | 1.10% | 1.23% | 1.26% |
| Expenses net of all reductions | 1.29%I | 1.11% | 1.08% | 1.09% | 1.23% | 1.25% |
| Net investment income (loss) | .31%I | .45% | .51% | .37% | .41% | .75% |
| Supplemental Data | ||||||
| Net assets, end of period (000 omitted) | $17,055 | $16,155 | $23,910 | $23,918 | $21,352 | $20,520 |
| Portfolio turnover rateJ | 28%I | 23% | 15% | 35% | 112% | 68% |
A Calculated based on average shares outstanding during the period.
B Total distributions of $.11 per share is comprised of distributions from net investment income of $.078 and distributions from net realized gain of $.035 per share.
C Amount represents less than $.005 per share.
D Total returns for periods of less than one year are not annualized.
E Total returns would have been lower if certain expenses had not been reduced during the applicable periods shown.
F Total returns do not include the effect of the sales charges.
G Fees and expenses of any underlying Fidelity Central Funds are not included in the Fund's expense ratio. The Fund indirectly bears its proportionate share of the expenses of any underlying Fidelity Central Funds.
H Expense ratios reflect operating expenses of the class. Expenses before reductions do not reflect amounts reimbursed by the investment adviser or reductions from brokerage service arrangements or reductions from other expense offset arrangements and do not represent the amount paid by the class during periods when reimbursements or reductions occur. Expenses net of fee waivers reflect expenses after reimbursement by the investment adviser but prior to reductions from brokerage service arrangements or other expense offset arrangements. Expenses net of all reductions represent the net expenses paid by the class.
I Annualized
J Amount does not include the portfolio activity of any underlying Fidelity Central Funds.
See accompanying notes which are an integral part of the financial statements.
Fidelity Japan Fund Class M
| Six months ended (Unaudited) April 30, | Years endedOctober 31, | |||||
| 2018 | 2017 | 2016 | 2015 | 2014 | 2013 | |
| Selected Per–Share Data | ||||||
| Net asset value, beginning of period | $15.06 | $12.57 | $11.85 | $11.62 | $11.96 | $9.28 |
| Income from Investment Operations | ||||||
| Net investment income (loss)A | –B | .01 | .02 | –B | .01 | .05 |
| Net realized and unrealized gain (loss) | .69 | 2.52 | .71 | .23 | (.30) | 2.78 |
| Total from investment operations | .69 | 2.53 | .73 | .23 | (.29) | 2.83 |
| Distributions from net investment income | (.05) | (.01) | –B | – | (.04) | (.08) |
| Distributions from net realized gain | (.04) | (.03) | (.01) | – | (.01) | (.08) |
| Total distributions | (.08)C | (.04) | (.01) | – | (.05) | (.16) |
| Redemption fees added to paid in capitalA | –B | –B | –B | –B | –B | .01 |
| Net asset value, end of period | $15.67 | $15.06 | $12.57 | $11.85 | $11.62 | $11.96 |
| Total ReturnD,E,F | 4.61% | 20.24% | 6.15% | 1.98% | (2.42)% | 31.04% |
| Ratios to Average Net AssetsG,H | ||||||
| Expenses before reductions | 1.65%I | 1.46% | 1.44% | 1.43% | 1.54% | 1.55% |
| Expenses net of fee waivers, if any | 1.65%I | 1.46% | 1.44% | 1.43% | 1.54% | 1.55% |
| Expenses net of all reductions | 1.64%I | 1.46% | 1.44% | 1.42% | 1.54% | 1.53% |
| Net investment income (loss) | (.03)%I | .10% | .16% | .04% | .10% | .46% |
| Supplemental Data | ||||||
| Net assets, end of period (000 omitted) | $4,591 | $4,464 | $4,193 | $4,809 | $4,104 | $5,357 |
| Portfolio turnover rateJ | 28%I | 23% | 15% | 35% | 112% | 68% |
A Calculated based on average shares outstanding during the period.
B Amount represents less than $.005 per share.
C Total distributions of $.08 per share is comprised of distributions from net investment income of $.047 and distributions from net realized gain of $.035 per share.
D Total returns for periods of less than one year are not annualized.
E Total returns would have been lower if certain expenses had not been reduced during the applicable periods shown.
F Total returns do not include the effect of the sales charges.
G Fees and expenses of any underlying Fidelity Central Funds are not included in the Fund's expense ratio. The Fund indirectly bears its proportionate share of the expenses of any underlying Fidelity Central Funds.
H Expense ratios reflect operating expenses of the class. Expenses before reductions do not reflect amounts reimbursed by the investment adviser or reductions from brokerage service arrangements or reductions from other expense offset arrangements and do not represent the amount paid by the class during periods when reimbursements or reductions occur. Expenses net of fee waivers reflect expenses after reimbursement by the investment adviser but prior to reductions from brokerage service arrangements or other expense offset arrangements. Expenses net of all reductions represent the net expenses paid by the class.
I Annualized
J Amount does not include the portfolio activity of any underlying Fidelity Central Funds.
See accompanying notes which are an integral part of the financial statements.
Fidelity Japan Fund Class C
| Six months ended (Unaudited) April 30, | Years endedOctober 31, | |||||
| 2018 | 2017 | 2016 | 2015 | 2014 | 2013 | |
| Selected Per–Share Data | ||||||
| Net asset value, beginning of period | $14.92 | $12.44 | $11.77 | $11.58 | $11.96 | $9.25 |
| Income from Investment Operations | ||||||
| Net investment income (loss)A | (.03) | (.03) | (.02) | (.04) | (.03) | –B |
| Net realized and unrealized gain (loss) | .68 | 2.51 | .69 | .23 | (.32) | 2.79 |
| Total from investment operations | .65 | 2.48 | .67 | .19 | (.35) | 2.79 |
| Distributions from net investment income | –B | – | – | – | (.03) | (.01) |
| Distributions from net realized gain | (.04) | – | – | – | (.01) | (.08) |
| Total distributions | (.04) | – | – | – | (.03)C | (.09) |
| Redemption fees added to paid in capitalA | –B | –B | –B | –B | –B | .01 |
| Net asset value, end of period | $15.53 | $14.92 | $12.44 | $11.77 | $11.58 | $11.96 |
| Total ReturnD,E,F | 4.35% | 19.94% | 5.69% | 1.64% | (2.90)% | 30.55% |
| Ratios to Average Net AssetsG,H | ||||||
| Expenses before reductions | 2.01%I | 1.81% | 1.81% | 1.81% | 1.93% | 1.97% |
| Expenses net of fee waivers, if any | 2.01%I | 1.81% | 1.81% | 1.81% | 1.93% | 1.97% |
| Expenses net of all reductions | 1.99%I | 1.81% | 1.81% | 1.80% | 1.93% | 1.95% |
| Net investment income (loss) | (.39)%I | (.25)% | (.21)% | (.34)% | (.29)% | .04% |
| Supplemental Data | ||||||
| Net assets, end of period (000 omitted) | $15,679 | $13,542 | $15,077 | $18,491 | $13,162 | $11,824 |
| Portfolio turnover rateJ | 28%I | 23% | 15% | 35% | 112% | 68% |
A Calculated based on average shares outstanding during the period.
B Amount represents less than $.005 per share.
C Total distributions of $.03 per share is comprised of distributions from net investment income of $.025 and distributions from net realized gain of $.009 per share.
D Total returns for periods of less than one year are not annualized.
E Total returns would have been lower if certain expenses had not been reduced during the applicable periods shown.
F Total returns do not include the effect of the contingent deferred sales charge.
G Fees and expenses of any underlying Fidelity Central Funds are not included in the Fund's expense ratio. The Fund indirectly bears its proportionate share of the expenses of any underlying Fidelity Central Funds.
H Expense ratios reflect operating expenses of the class. Expenses before reductions do not reflect amounts reimbursed by the investment adviser or reductions from brokerage service arrangements or reductions from other expense offset arrangements and do not represent the amount paid by the class during periods when reimbursements or reductions occur. Expenses net of fee waivers reflect expenses after reimbursement by the investment adviser but prior to reductions from brokerage service arrangements or other expense offset arrangements. Expenses net of all reductions represent the net expenses paid by the class.
I Annualized
J Amount does not include the portfolio activity of any underlying Fidelity Central Funds.
See accompanying notes which are an integral part of the financial statements.
Fidelity Japan Fund
| Six months ended (Unaudited) April 30, | Years endedOctober 31, | |||||
| 2018 | 2017 | 2016 | 2015 | 2014 | 2013 | |
| Selected Per–Share Data | ||||||
| Net asset value, beginning of period | $15.13 | $12.64 | $11.91 | $11.69 | $12.03 | $9.34 |
| Income from Investment Operations | ||||||
| Net investment income (loss)A | .05 | .10 | .09 | .08 | .09 | .12 |
| Net realized and unrealized gain (loss) | .68 | 2.54 | .72 | .23 | (.32) | 2.79 |
| Total from investment operations | .73 | 2.64 | .81 | .31 | (.23) | 2.91 |
| Distributions from net investment income | (.11) | (.11) | (.07) | (.09) | (.11) | (.15) |
| Distributions from net realized gain | (.04) | (.03) | (.01) | – | (.01) | (.08) |
| Total distributions | (.14)B | (.15)C | (.08) | (.09) | (.11)D | (.23) |
| Redemption fees added to paid in capitalA | –E | –E | –E | –E | –E | .01 |
| Net asset value, end of period | $15.72 | $15.13 | $12.64 | $11.91 | $11.69 | $12.03 |
| Total ReturnF,G | 4.86% | 21.13% | 6.80% | 2.66% | (1.90)% | 31.92% |
| Ratios to Average Net AssetsH,I | ||||||
| Expenses before reductions | 1.02%J | .82% | .78% | .80% | .90% | .93% |
| Expenses net of fee waivers, if any | 1.02%J | .82% | .78% | .80% | .90% | .93% |
| Expenses net of all reductions | 1.01%J | .82% | .78% | .79% | .90% | .91% |
| Net investment income (loss) | .60%J | .74% | .81% | .67% | .74% | 1.08% |
| Supplemental Data | ||||||
| Net assets, end of period (000 omitted) | $190,313 | $247,372 | $352,936 | $485,803 | $415,612 | $480,773 |
| Portfolio turnover rateK | 28%J | 23% | 15% | 35% | 112% | 68% |
A Calculated based on average shares outstanding during the period.
B Total distributions of $.14 per share is comprised of distributions from net investment income of $.107 and distributions from net realized gain of $.035 per share.
C Total distributions of $.15 per share is comprised of distributions from net investment income of $.112 and distributions from net realized gain of $.034 per share.
D Total distributions of $.11 per share is comprised of distributions from net investment income of $.105 and distributions from net realized gain of $.009 per share.
E Amount represents less than $.005 per share.
F Total returns for periods of less than one year are not annualized.
G Total returns would have been lower if certain expenses had not been reduced during the applicable periods shown.
H Fees and expenses of any underlying Fidelity Central Funds are not included in the Fund's expense ratio. The Fund indirectly bears its proportionate share of the expenses of any underlying Fidelity Central Funds.
I Expense ratios reflect operating expenses of the class. Expenses before reductions do not reflect amounts reimbursed by the investment adviser or reductions from brokerage service arrangements or reductions from other expense offset arrangements and do not represent the amount paid by the class during periods when reimbursements or reductions occur. Expenses net of fee waivers reflect expenses after reimbursement by the investment adviser but prior to reductions from brokerage service arrangements or other expense offset arrangements. Expenses net of all reductions represent the net expenses paid by the class.
J Annualized
K Amount does not include the portfolio activity of any underlying Fidelity Central Funds.
See accompanying notes which are an integral part of the financial statements.
Fidelity Japan Fund Class I
| Six months ended (Unaudited) April 30, | Years endedOctober 31, | |||||
| 2018 | 2017 | 2016 | 2015 | 2014 | 2013 | |
| Selected Per–Share Data | ||||||
| Net asset value, beginning of period | $15.12 | $12.62 | $11.89 | $11.67 | $12.02 | $9.33 |
| Income from Investment Operations | ||||||
| Net investment income (loss)A | .05 | .11 | .10 | .08 | .09 | .13 |
| Net realized and unrealized gain (loss) | .69 | 2.53 | .70 | .23 | (.32) | 2.78 |
| Total from investment operations | .74 | 2.64 | .80 | .31 | (.23) | 2.91 |
| Distributions from net investment income | (.14) | (.11) | (.07) | (.09) | (.12) | (.15) |
| Distributions from net realized gain | (.04) | (.03) | (.01) | – | (.01) | (.08) |
| Total distributions | (.17)B | (.14) | (.07)C | (.09) | (.12)D | (.23) |
| Redemption fees added to paid in capitalA | –E | –E | –E | –E | –E | .01 |
| Net asset value, end of period | $15.69 | $15.12 | $12.62 | $11.89 | $11.67 | $12.02 |
| Total ReturnF,G | 4.92% | 21.22% | 6.77% | 2.72% | (1.90)% | 32.04% |
| Ratios to Average Net AssetsH,I | ||||||
| Expenses before reductions | .96%J | .76% | .77% | .80% | .89% | .90% |
| Expenses net of fee waivers, if any | .96%J | .76% | .77% | .80% | .89% | .90% |
| Expenses net of all reductions | .94%J | .76% | .76% | .79% | .89% | .88% |
| Net investment income (loss) | .66%J | .80% | .83% | .67% | .76% | 1.11% |
| Supplemental Data | ||||||
| Net assets, end of period (000 omitted) | $189,602 | $175,816 | $7,032 | $13,957 | $20,253 | $20,033 |
| Portfolio turnover rateK | 28%J | 23% | 15% | 35% | 112% | 68% |
A Calculated based on average shares outstanding during the period.
B Total distributions of $.17 per share is comprised of distributions from net investment income of $.135 and distributions from net realized gain of $.035 per share.
C Total distributions of $.07 per share is comprised of distributions from net investment income of $.065 and distributions from net realized gain of $.006 per share.
D Total distributions of $.12 per share is comprised of distributions from net investment income of $.115 and distributions from net realized gain of $.009 per share.
E Amount represents less than $.005 per share.
F Total returns for periods of less than one year are not annualized.
G Total returns would have been lower if certain expenses had not been reduced during the applicable periods shown.
H Fees and expenses of any underlying Fidelity Central Funds are not included in the Fund's expense ratio. The Fund indirectly bears its proportionate share of the expenses of any underlying Fidelity Central Funds.
I Expense ratios reflect operating expenses of the class. Expenses before reductions do not reflect amounts reimbursed by the investment adviser or reductions from brokerage service arrangements or reductions from other expense offset arrangements and do not represent the amount paid by the class during periods when reimbursements or reductions occur. Expenses net of fee waivers reflect expenses after reimbursement by the investment adviser but prior to reductions from brokerage service arrangements or other expense offset arrangements. Expenses net of all reductions represent the net expenses paid by the class.
J Annualized
K Amount does not include the portfolio activity of any underlying Fidelity Central Funds.
See accompanying notes which are an integral part of the financial statements.
Notes to Financial Statements (Unaudited)
For the period ended April 30, 2018
1. Organization.
Fidelity Japan Fund (the Fund) is a fund of Fidelity Investment Trust (the Trust) and is authorized to issue an unlimited number of shares. The Trust is registered under the Investment Company Act of 1940, as amended (the 1940 Act), as an open-end management investment company organized as a Massachusetts business trust. The Fund offers Class A, Class M, Class C, Japan and Class I shares, each of which has equal rights as to assets and voting privileges. Each class has exclusive voting rights with respect to matters that affect that class.
2. Investments in Fidelity Central Funds.
The Fund invests in Fidelity Central Funds, which are open-end investment companies generally available only to other investment companies and accounts managed by the investment adviser and its affiliates. The Fund's Schedule of Investments lists each of the Fidelity Central Funds held as of period end, if any, as an investment of the Fund, but does not include the underlying holdings of each Fidelity Central Fund. As an Investing Fund, the Fund indirectly bears its proportionate share of the expenses of the underlying Fidelity Central Funds.
The Money Market Central Funds seek preservation of capital and current income and are managed by Fidelity Investments Money Management, Inc. (FIMM), an affiliate of the investment adviser. Annualized expenses of the Money Market Central Funds as of their most recent shareholder report date are less than .005%.
A complete unaudited list of holdings for each Fidelity Central Fund is available upon request or at the Securities and Exchange Commission (the SEC) website at www.sec.gov. In addition, the financial statements of the Fidelity Central Funds are available on the SEC website or upon request.
3. Significant Accounting Policies.
The Fund is an investment company and applies the accounting and reporting guidance of the Financial Accounting Standards Board (FASB) Accounting Standards Codification Topic 946 Financial Services – Investments Companies. The financial statements have been prepared in conformity with accounting principles generally accepted in the United States of America (GAAP), which require management to make certain estimates and assumptions at the date of the financial statements. Actual results could differ from those estimates. Subsequent events, if any, through the date that the financial statements were issued have been evaluated in the preparation of the financial statements. The following summarizes the significant accounting policies of the Fund:
Investment Valuation. Investments are valued as of 4:00 p.m. Eastern time on the last calendar day of the period. The Board of Trustees (the Board) has delegated the day to day responsibility for the valuation of the Fund's investments to the Fair Value Committee (the Committee) established by the Fund's investment adviser. In accordance with valuation policies and procedures approved by the Board, the Fund attempts to obtain prices from one or more third party pricing vendors or brokers to value its investments. When current market prices, quotations or currency exchange rates are not readily available or reliable, investments will be fair valued in good faith by the Committee, in accordance with procedures adopted by the Board. Factors used in determining fair value vary by investment type and may include market or investment specific events. The frequency with which these procedures are used cannot be predicted and they may be utilized to a significant extent. The Committee oversees the Fund's valuation policies and procedures and reports to the Board on the Committee's activities and fair value determinations. The Board monitors the appropriateness of the procedures used in valuing the Fund's investments and ratifies the fair value determinations of the Committee.
The Fund categorizes the inputs to valuation techniques used to value its investments into a disclosure hierarchy consisting of three levels as shown below:
- Level 1 – quoted prices in active markets for identical investments
- Level 2 – other significant observable inputs (including quoted prices for similar investments, interest rates, prepayment speeds, etc.)
- Level 3 – unobservable inputs (including the Fund's own assumptions based on the best information available)
Valuation techniques used to value the Fund's investments by major category are as follows:
Equity securities, including restricted securities, for which market quotations are readily available, are valued at the last reported sale price or official closing price as reported by a third party pricing vendor on the primary market or exchange on which they are traded and are categorized as Level 1 in the hierarchy. In the event there were no sales during the day or closing prices are not available, securities are valued at the last quoted bid price or may be valued using the last available price and are generally categorized as Level 2 in the hierarchy. For foreign equity securities, when market or security specific events arise, comparisons to the valuation of American Depositary Receipts (ADRs), futures contracts, Exchange-Traded Funds (ETFs) and certain indexes as well as quoted prices for similar securities may be used and would be categorized as Level 2 in the hierarchy. Utilizing these techniques may result in transfers between Level 1 and Level 2. For equity securities, including restricted securities, where observable inputs are limited, assumptions about market activity and risk are used and these securities may be categorized as Level 3 in the hierarchy.
Investments in open-end mutual funds, including the Fidelity Central Funds, are valued at their closing net asset value (NAV) each business day and are categorized as Level 1 in the hierarchy.
Changes in valuation techniques may result in transfers in or out of an assigned level within the disclosure hierarchy. The aggregate value of investments by input level as of April 30, 2018, including information on transfers between Levels 1 and 2, is included at the end of the Fund's Schedule of Investments.
Foreign Currency. The Fund may use foreign currency contracts to facilitate transactions in foreign-denominated securities. Gains and losses from these transactions may arise from changes in the value of the foreign currency or if the counterparties do not perform under the contracts' terms.
Foreign-denominated assets, including investment securities, and liabilities are translated into U.S. dollars at the exchange rates at period end. Purchases and sales of investment securities, income and dividends received and expenses denominated in foreign currencies are translated into U.S. dollars at the exchange rate in effect on the transaction date.
The effects of exchange rate fluctuations on investments are included with the net realized and unrealized gain (loss) on investment securities. Other foreign currency transactions resulting in realized and unrealized gain (loss) are disclosed separately.
Investment Transactions and Income. For financial reporting purposes, the Fund's investment holdings and NAV include trades executed through the end of the last business day of the period. The NAV per share for processing shareholder transactions is calculated as of the close of business of the New York Stock Exchange (NYSE), normally 4:00 p.m. Eastern time and includes trades executed through the end of the prior business day. Gains and losses on securities sold are determined on the basis of identified cost. Dividend income is recorded on the ex-dividend date, except for certain dividends from foreign securities where the ex-dividend date may have passed, which are recorded as soon as the Fund is informed of the ex-dividend date. Non-cash dividends included in dividend income, if any, are recorded at the fair market value of the securities received. Income and capital gain distributions from Fidelity Central Funds, if any, are recorded on the ex-dividend date. Investment income is recorded net of foreign taxes withheld where recovery of such taxes is uncertain.
Class Allocations and Expenses. Investment income, realized and unrealized capital gains and losses, common expenses of the Fund, and certain fund-level expense reductions, if any, are allocated daily on a pro-rata basis to each class based on the relative net assets of each class to the total net assets of the Fund. Each class differs with respect to transfer agent and distribution and service plan fees incurred. Certain expense reductions may also differ by class. For the reporting period, the allocated portion of income and expenses to each class as a percent of its average net assets may vary due to the timing of recording these transactions in relation to fluctuating net assets of the classes. Expenses directly attributable to a fund are charged to that fund. Expenses attributable to more than one fund are allocated among the respective funds on the basis of relative net assets or other appropriate methods. Expense estimates are accrued in the period to which they relate and adjustments are made when actual amounts are known.
Income Tax Information and Distributions to Shareholders. Each year, the Fund intends to qualify as a regulated investment company under Subchapter M of the Internal Revenue Code, including distributing substantially all of its taxable income and realized gains. As a result, no provision for U.S. Federal income taxes is required. The Fund files a U.S. federal tax return, in addition to state and local tax returns as required. The Fund's federal income tax returns are subject to examination by the Internal Revenue Service (IRS) for a period of three fiscal years after they are filed. State and local tax returns may be subject to examination for an additional fiscal year depending on the jurisdiction. Foreign taxes are provided for based on the Fund's understanding of the tax rules and rates that exist in the foreign markets in which it invests.
Distributions are declared and recorded on the ex-dividend date. Income and capital gain distributions are declared separately for each class. Income and capital gain distributions are determined in accordance with income tax regulations, which may differ from GAAP.
Capital accounts within the financial statements are adjusted for permanent book-tax differences. These adjustments have no impact on net assets or the results of operations. Capital accounts are not adjusted for temporary book-tax differences which will reverse in a subsequent period.
Book-tax differences are primarily due to foreign currency transactions, passive foreign investment companies (PFIC), expiring capital loss carryforwards, deferred trustees compensation, capital loss carryforwards and losses deferred due to wash sales.
As of period end, the cost and unrealized appreciation (depreciation) in securities, and derivatives if applicable, for federal income tax purposes were as follows:
| Gross unrealized appreciation | $103,423,915 |
| Gross unrealized depreciation | (10,166,307) |
| Net unrealized appreciation (depreciation) | $93,257,608 |
| Tax cost | $327,927,581 |
Capital loss carryforwards are only available to offset future capital gains of the Fund to the extent provided by regulations and may be limited. Under the Regulated Investment Company Modernization Act of 2010 (the Act), the Fund is permitted to carry forward capital losses incurred in taxable years beginning after December 22, 2010 for an unlimited period and such capital losses are required to be used prior to any losses that expire. The capital loss carryforward information presented below, including any applicable limitation, is estimated as of prior fiscal period end and is subject to adjustment.
| Fiscal year of expiration | |
| 2018 | $(26,887,863) |
| 2019 | (98,806,037) |
| Total with expiration | $(125,693,900) |
| No expiration | |
| Short-term | (5,646,628) |
| Long-term | (10,657,370) |
| Total no expiration | (16,303,998) |
| Total capital loss carryforward | $(141,997,898) |
Short-Term Trading (Redemption) Fees. Shares held by investors in the Fund less than 90 days may have been subject to a redemption fee equal to 1.50% of the NAV of shares redeemed. All redemption fees, which reduce the proceeds of the shareholder redemption, are retained by the Fund and accounted for as an addition to paid in capital. In November 2017, the Board of Trustees approved the elimination of these redemption fees effective December 18, 2017.
4. Purchases and Sales of Investments.
Purchases and sales of securities, other than short-term securities, aggregated $58,512,355 and $116,218,224, respectively.
5. Fees and Other Transactions with Affiliates.
Management Fee. Fidelity Management & Research Company (the investment adviser) and its affiliates provide the Fund with investment management related services for which the Fund pays a monthly management fee. The management fee is the sum of an individual fund fee rate that is based on an annual rate of .45% of the Fund's average net assets and an annualized group fee rate that averaged .24% during the period. The group fee rate is based upon the average net assets of all the mutual funds advised by the investment adviser, including any mutual funds previously advised by the investment adviser that are currently advised by Fidelity SelectCo, LLC, an affiliate of the investment adviser. The group fee rate decreases as assets under management increase and increases as assets under management decrease. In addition, the management fee is subject to a performance adjustment (up to a maximum of +/- .20% of the Fund's average net assets over a 36 month performance period). The upward or downward adjustment to the management fee is based on the relative investment performance of Japan as compared to its benchmark index, the TOPIX, over the same 36 month performance period. For the reporting period, the total annualized management fee rate, including the performance adjustment, was .71% of the Fund's average net assets. The performance adjustment included in the management fee rate may be higher or lower than the maximum performance adjustment rate due to the difference between the average net assets for the reporting and performance periods.
Distribution and Service Plan Fees. In accordance with Rule 12b-1 of the 1940 Act, the Fund has adopted separate Distribution and Service Plans for each class of shares. Certain classes pay Fidelity Distributors Corporation (FDC), an affiliate of the investment adviser, separate Distribution and Service Fees, each of which is based on an annual percentage of each class' average net assets. In addition, FDC may pay financial intermediaries for selling shares of the Fund and providing shareholder support services. For the period, the Distribution and Service Fee rates, total fees and amounts retained by FDC were as follows:
| Distribution Fee | Service Fee | Total Fees | Retained by FDC | |
| Class A | -% | .25% | $21,198 | $487 |
| Class M | .25% | .25% | 11,834 | 239 |
| Class C | .75% | .25% | 76,167 | 10,973 |
| $109,199 | $11,699 |
Sales Load. FDC may receive a front-end sales charge of up to 5.75% for selling Class A shares and 3.50% for selling Class M shares, some of which is paid to financial intermediaries for selling shares of the Fund. Depending on the holding period, FDC may receive contingent deferred sales charges levied on Class A, Class M and Class C redemptions. The deferred sales charges are 1.00% for Class C shares, 1.00% for certain purchases of Class A shares and .25% for certain purchases of Class M shares.
For the period, sales charge amounts retained by FDC were as follows:
| Retained by FDC | |
| Class A | $4,111 |
| Class M | 553 |
| Class C(a) | 1,294 |
| $5,958 |
(a) When Class C shares are initially sold, FDC pays commissions from its own resources to financial intermediaries through which the sales are made.
Transfer Agent Fees. Fidelity Investments Institutional Operations Company, Inc., (FIIOC), an affiliate of the investment adviser, is the transfer, dividend disbursing and shareholder servicing agent for each class of the Fund. FIIOC receives account fees and asset-based fees that vary according to the account size and type of account of the shareholders of the respective classes of the Fund. FIIOC pays for typesetting, printing and mailing of shareholder reports, except proxy statements.
For the period, transfer agent fees for each class were as follows:
| Amount | % of Class-Level Average Net Assets(a) | |
| Class A | $20,157 | .24 |
| Class M | 7,849 | .33 |
| Class C | 14,547 | .19 |
| Japan | 198,830 | .20 |
| Class I | 131,073 | .14 |
| $372,456 |
(a) Annualized
Accounting and Security Lending Fees. Fidelity Service Company, Inc. (FSC), an affiliate of the investment adviser, maintains the Fund's accounting records. The accounting fee is based on the level of average net assets for each month. Under a separate contract, FSC administers the security lending program. The security lending fee is based on the number and duration of lending transactions. For the period, the fees were equivalent to an annualized rate of .05%.
Brokerage Commissions. The Fund placed a portion of its portfolio transactions with brokerage firms which are affiliates of the investment adviser. Brokerage commissions are included in net realized gain (loss) and change in net unrealized appreciation (depreciation) in the Statement of Operations. The commissions paid to these affiliated firms were $139 for the period.
Interfund Trades. The Fund may purchase from or sell securities to other Fidelity Funds under procedures adopted by the Board. The procedures have been designed to ensure these interfund trades are executed in accordance with Rule 17a-7 of the 1940 Act. Interfund trades are included within the respective purchases and sales amounts shown in the Purchases and Sales of Investments note.
6. Committed Line of Credit.
The Fund participates with other funds managed by the investment adviser or an affiliate in a $4.25 billion credit facility (the "line of credit") to be utilized for temporary or emergency purposes to fund shareholder redemptions or for other short-term liquidity purposes. The Fund has agreed to pay commitment fees on its pro-rata portion of the line of credit, which amounted to $609 and is reflected in Miscellaneous expenses on the Statement of Operations. During the period, the Fund did not borrow on this line of credit.
7. Security Lending.
The Fund lends portfolio securities through a lending agent from time to time in order to earn additional income. For equity securities, a lending agent is used and may loan securities to certain qualified borrowers, including Fidelity Capital Markets (FCM), a broker-dealer affiliated with the Fund. On the settlement date of the loan, the Fund receives collateral (in the form of U.S. Treasury obligations, letters of credit and/or cash) against the loaned securities and maintains collateral in an amount not less than 100% of the market value of the loaned securities during the period of the loan. The market value of the loaned securities is determined at the close of business of the Fund and any additional required collateral is delivered to the Fund on the next business day. The Fund or borrower may terminate the loan at any time, and if the borrower defaults on its obligation to return the securities loaned because of insolvency or other reasons, the Fund may apply collateral received from the borrower against the obligation. The Fund may experience delays and costs in recovering the securities loaned. Any cash collateral received is invested in the Fidelity Securities Lending Cash Central Fund. The value of loaned securities and cash collateral at period end are disclosed on the Fund's Statement of Assets and Liabilities. Security lending income represents the income earned on investing cash collateral, less rebates paid to borrowers and any lending agent fees associated with the loan, plus any premium payments received for lending certain types of securities. Security lending income is presented in the Statement of Operations as a component of income from Fidelity Central Funds. Total security lending income during the period amounted to $77,345. During the period, there were no securities loaned to FCM.
8. Expense Reductions.
Commissions paid to certain brokers with whom the investment adviser, or its affiliates, places trades on behalf of the Fund include an amount in addition to trade execution, which may be rebated back to the Fund to offset certain expenses. This amount totaled $33,105 for the period.
In addition, during the period the investment adviser reimbursed and/or waived a portion of fund-level operating expenses in the amount of $2,018.
9. Distributions to Shareholders.
Distributions to shareholders of each class were as follows:
| Six months ended April 30, 2018 | Year ended October 31, 2017 | |
| From net investment income | ||
| Class A | $83,728 | $104,209 |
| Class M | 14,064 | 3,257 |
| Class C | 2,815 | – |
| Japan | 1,265,471 | 3,209,793 |
| Class I | 1,586,529 | 51,808 |
| Total | $2,952,607 | $3,369,067 |
| From net realized gain | ||
| Class A | $37,508 | $59,052 |
| Class M | 10,474 | 11,074 |
| Class C | 32,841 | – |
| Japan | 413,939 | 974,401 |
| Class I | 411,322 | 16,013 |
| Total | $906,084 | $1,060,540 |
10. Share Transactions.
Share transactions for each class were as follows and may contain automatic conversions between classes or exchanges between affiliated funds:
| Shares | Shares | Dollars | Dollars | |
| Six months ended April 30, 2018 | Year ended October 31, 2017 | Six months ended April 30, 2018 | Year ended October 31, 2017 | |
| Class A | ||||
| Shares sold | 153,141 | 261,996 | $2,427,843 | $3,537,670 |
| Reinvestment of distributions | 7,603 | 12,680 | 116,628 | 155,198 |
| Shares redeemed | (144,506) | (1,102,972) | (2,267,886)�� | (14,608,137) |
| Net increase (decrease) | 16,238 | (828,296) | $276,585 | $(10,915,269) |
| Class M | ||||
| Shares sold | 18,308 | 34,522 | $289,600 | $446,496 |
| Reinvestment of distributions | 1,589 | 1,137 | 24,389 | 13,940 |
| Shares redeemed | (23,298) | (72,947) | (368,035) | (961,323) |
| Net increase (decrease) | (3,401) | (37,288) | $(54,046) | $(500,887) |
| Class C | ||||
| Shares sold | 224,295 | 75,525 | $3,534,963 | $955,948 |
| Reinvestment of distributions | 2,227 | – | 33,918 | – |
| Shares redeemed | (125,029) | (379,339) | (1,971,732) | (4,904,728) |
| Net increase (decrease) | 101,493 | (303,814) | $1,597,149 | $(3,948,780) |
| Japan | ||||
| Shares sold | 2,709,400 | 5,531,120 | $42,654,659 | $70,265,364 |
| Reinvestment of distributions | 102,752 | 332,957 | 1,578,266 | 4,075,396 |
| Shares redeemed | (7,061,842) | (17,427,207) | (109,276,781) | (225,423,617) |
| Net increase (decrease) | (4,249,690) | (11,563,130) | $(65,043,856) | $(151,082,857) |
| Class I | ||||
| Shares sold | 394,832 | 12,120,647 | $6,274,967 | $156,870,865 |
| Reinvestment of distributions | 129,754 | 4,957 | 1,987,832 | 60,627 |
| Shares redeemed | (70,810) | (1,052,603) | (1,108,103) | (13,914,364) |
| Net increase (decrease) | 453,776 | 11,073,001 | $7,154,696 | $143,017,128 |
11. Other.
The Fund's organizational documents provide former and current trustees and officers with a limited indemnification against liabilities arising in connection with the performance of their duties to the Fund. In the normal course of business, the Fund may also enter into contracts that provide general indemnifications. The Fund's maximum exposure under these arrangements is unknown as this would be dependent on future claims that may be made against the Fund. The risk of material loss from such claims is considered remote.
At the end of the period, Strategic Advisers International Fund and Strategic Advisers Fidelity International Fund (formerly Strategic Advisers International II Fund) were the owners of record of approximately 13% and 29%, respectively, of the total outstanding shares of the Fund. Mutual funds managed by the investment adviser or its affiliates were the owners of record, in the aggregate, of approximately 42% of the total outstanding shares of the Fund.
Fidelity® Japan Smaller Companies Fund
Investment Summary (Unaudited)
Geographic Diversification (% of fund's net assets)
| As of April 30, 2018 | ||
| Japan | 93.4% | |
| United States of America* | 6.6% | |

* Includes Short-Term investments and Net Other Assets (Liabilities).
Percentages are based on country or territory of incorporation and are adjusted for the effect of futures contracts, if applicable.
Asset Allocation as of April 30, 2018
| % of fund's net assets | |
| Stocks | 93.4 |
| Short-Term Investments and Net Other Assets (Liabilities) | 6.6 |
Top Ten Stocks as of April 30, 2018
| % of fund's net assets | |
| Yamada Consulting Group Co. Ltd. (Professional Services) | 2.6 |
| A/S One Corp. (Health Care Providers & Services) | 2.0 |
| Kotobuki Spirits Co. Ltd. (Food Products) | 1.8 |
| Koshidaka Holdings Co. Ltd. (Hotels, Restaurants & Leisure) | 1.8 |
| Mitsubishi Chemical Holdings Corp. (Chemicals) | 1.7 |
| Central Automotive Products Ltd. (Distributors) | 1.7 |
| Lintec Corp. (Chemicals) | 1.6 |
| San-Ai Oil Co. Ltd. (Oil, Gas & Consumable Fuels) | 1.6 |
| Mitsubishi Heavy Industries Ltd. (Machinery) | 1.6 |
| ORIX Corp. (Diversified Financial Services) | 1.6 |
| 18.0 |
Top Market Sectors as of April 30, 2018
| % of fund's net assets | |
| Industrials | 24.9 |
| Consumer Discretionary | 18.8 |
| Information Technology | 12.1 |
| Consumer Staples | 8.9 |
| Materials | 8.7 |
| Financials | 7.9 |
| Health Care | 5.4 |
| Utilities | 2.7 |
| Energy | 2.5 |
| Real Estate | 1.5 |
Fidelity® Japan Smaller Companies Fund
Schedule of Investments April 30, 2018 (Unaudited)
Showing Percentage of Net Assets
| Common Stocks - 93.4% | |||
| Shares | Value | ||
| CONSUMER DISCRETIONARY - 18.8% | |||
| Auto Components - 3.5% | |||
| Bridgestone Corp. | 254,900 | $10,700,111 | |
| Hi-Lex Corp. | 271,100 | 7,055,246 | |
| Sumitomo Electric Industries Ltd. | 749,500 | 11,514,684 | |
| 29,270,041 | |||
| Automobiles - 2.1% | |||
| Isuzu Motors Ltd. | 666,000 | 10,198,353 | |
| Subaru Corp. | 218,000 | 7,336,462 | |
| 17,534,815 | |||
| Distributors - 3.0% | |||
| Central Automotive Products Ltd. | 885,000 | 13,802,827 | |
| Chori Co. Ltd. | 196,100 | 3,763,427 | |
| PALTAC Corp. | 140,000 | 7,017,929 | |
| 24,584,183 | |||
| Hotels, Restaurants & Leisure - 1.8% | |||
| Koshidaka Holdings Co. Ltd. | 243,000 | 14,759,605 | |
| Household Durables - 0.8% | |||
| Panasonic Corp. | 445,000 | 6,589,182 | |
| Media - 1.2% | |||
| Daiichikosho Co. Ltd. | 187,900 | 9,883,141 | |
| Specialty Retail - 5.2% | |||
| Arc Land Sakamoto Co. Ltd. | 466,700 | 7,372,767 | |
| Fuji Corp. (a) | 340,600 | 8,075,697 | |
| Nitori Holdings Co. Ltd. | 68,600 | 11,596,487 | |
| VT Holdings Co. Ltd. | 1,487,400 | 6,789,358 | |
| Workman Co. Ltd. | 244,000 | 9,731,431 | |
| 43,565,740 | |||
| Textiles, Apparel & Luxury Goods - 1.2% | |||
| Hagihara Industries, Inc. | 565,600 | 9,871,614 | |
| TOTAL CONSUMER DISCRETIONARY | 156,058,321 | ||
| CONSUMER STAPLES - 8.9% | |||
| Food & Staples Retailing - 3.4% | |||
| Kirindo Holdings Co. Ltd. | 301,100 | 8,194,040 | |
| Mitsubishi Shokuhin Co. Ltd. | 342,300 | 10,004,103 | |
| San-A Co. Ltd. | 184,000 | 9,812,660 | |
| 28,010,803 | |||
| Food Products - 5.5% | |||
| Japan Meat Co. Ltd. | 487,400 | 8,720,768 | |
| Kotobuki Spirits Co. Ltd. | 315,000 | 15,012,349 | |
| Morinaga & Co. Ltd. | 209,700 | 10,224,122 | |
| S Foods, Inc. | 292,700 | 12,329,706 | |
| 46,286,945 | |||
| TOTAL CONSUMER STAPLES | 74,297,748 | ||
| ENERGY - 2.5% | |||
| Energy Equipment & Services - 0.9% | |||
| Shinko Plantech Co. Ltd. | 798,000 | 7,518,661 | |
| Oil, Gas & Consumable Fuels - 1.6% | |||
| San-Ai Oil Co. Ltd. | 820,800 | 12,944,193 | |
| TOTAL ENERGY | 20,462,854 | ||
| FINANCIALS - 7.9% | |||
| Banks - 1.9% | |||
| Mitsubishi UFJ Financial Group, Inc. | 1,224,600 | 8,206,465 | |
| Shinsei Bank Ltd. | 503,300 | 7,863,487 | |
| 16,069,952 | |||
| Consumer Finance - 0.8% | |||
| AEON Financial Service Co. Ltd. | 291,600 | 6,844,544 | |
| Diversified Financial Services - 2.7% | |||
| Fuyo General Lease Co. Ltd. | 135,300 | 9,195,746 | |
| ORIX Corp. | 731,800 | 12,879,466 | |
| 22,075,212 | |||
| Insurance - 2.5% | |||
| T&D Holdings, Inc. | 673,000 | 11,444,447 | |
| Tokio Marine Holdings, Inc. | 199,500 | 9,438,474 | |
| 20,882,921 | |||
| TOTAL FINANCIALS | 65,872,629 | ||
| HEALTH CARE - 5.4% | |||
| Health Care Equipment & Supplies - 2.2% | |||
| Medikit Co. Ltd. | 216,100 | 11,880,360 | |
| Paramount Bed Holdings Co. Ltd. | 138,900 | 6,911,965 | |
| 18,792,325 | |||
| Health Care Providers & Services - 2.0% | |||
| A/S One Corp. | 241,000 | 16,401,756 | |
| Pharmaceuticals - 1.2% | |||
| Astellas Pharma, Inc. | 668,500 | 9,777,638 | |
| TOTAL HEALTH CARE | 44,971,719 | ||
| INDUSTRIALS - 24.9% | |||
| Air Freight & Logistics - 0.7% | |||
| AIT Corp. | 525,400 | 5,767,289 | |
| Airlines - 1.2% | |||
| Japan Airlines Co. Ltd. | 259,600 | 10,234,870 | |
| Building Products - 2.7% | |||
| Sekisui Jushi Corp. | 581,300 | 12,687,356 | |
| Sinko Industries Ltd. | 603,800 | 9,798,218 | |
| 22,485,574 | |||
| Commercial Services & Supplies - 3.2% | |||
| Aeon Delight Co. Ltd. | 317,300 | 11,131,042 | |
| ProNexus, Inc. | 594,900 | 7,705,620 | |
| Secom Joshinetsu Co. Ltd. | 240,000 | 8,079,034 | |
| 26,915,696 | |||
| Construction & Engineering - 2.2% | |||
| Hokuriku Electrical Construction Co. Ltd. | 859,300 | 9,542,538 | |
| Toshiba Plant Systems & Services Corp. | 431,500 | 9,023,134 | |
| 18,565,672 | |||
| Electrical Equipment - 1.8% | |||
| Aichi Electric Co. Ltd. | 179,400 | 5,645,225 | |
| Denyo Co. Ltd. | 543,100 | 9,518,657 | |
| 15,163,882 | |||
| Machinery - 2.8% | |||
| Mitsubishi Heavy Industries Ltd. | 325,700 | 12,888,568 | |
| NGK Insulators Ltd. | 540,000 | 9,938,529 | |
| 22,827,097 | |||
| Marine - 0.9% | |||
| Nippon Concept Corp. | 560,000 | 7,576,290 | |
| Professional Services - 3.7% | |||
| Funai Soken Holdings, Inc. | 396,480 | 9,291,820 | |
| Yamada Consulting Group Co. Ltd. | 762,400 | 21,689,208 | |
| 30,981,028 | |||
| Trading Companies & Distributors - 4.4% | |||
| Inaba Denki Sangyo Co. Ltd. | 248,800 | 10,662,532 | |
| Mitani Shoji Co. Ltd. | 143,100 | 6,806,806 | |
| Trusco Nakayama Corp. | 387,500 | 10,201,473 | |
| Yuasa Trading Co. Ltd. | 265,800 | 8,522,036 | |
| 36,192,847 | |||
| Transportation Infrastructure - 1.3% | |||
| Kamigumi Co. Ltd. | 462,000 | 10,438,529 | |
| TOTAL INDUSTRIALS | 207,148,774 | ||
| INFORMATION TECHNOLOGY - 12.1% | |||
| Electronic Equipment & Components - 2.4% | |||
| Amano Corp. | 503,200 | 12,524,764 | |
| Dexerials Corp. | 771,500 | 7,276,038 | |
| 19,800,802 | |||
| Internet Software & Services - 0.9% | |||
| Aucnet, Inc. | 570,000 | 7,398,738 | |
| IT Services - 4.0% | |||
| Fujitsu Ltd. | 1,920,000 | 11,695,280 | |
| Otsuka Corp. | 262,000 | 12,222,832 | |
| TKC Corp. | 238,200 | 9,532,794 | |
| 33,450,906 | |||
| Semiconductors & Semiconductor Equipment - 1.3% | |||
| Renesas Electronics Corp. (a)(b) | 1,045,900 | 10,983,289 | |
| Software - 2.0% | |||
| Broadleaf Co. Ltd. | 1,612,200 | 7,698,211 | |
| Oracle Corp. Japan | 114,200 | 9,401,756 | |
| 17,099,967 | |||
| Technology Hardware, Storage & Peripherals - 1.5% | |||
| Elecom Co. Ltd. | 543,500 | 12,220,298 | |
| TOTAL INFORMATION TECHNOLOGY | 100,954,000 | ||
| MATERIALS - 8.7% | |||
| Chemicals - 5.7% | |||
| C. Uyemura & Co. Ltd. | 131,400 | 8,990,779 | |
| Lintec Corp. | 458,000 | 13,259,879 | |
| Mitsubishi Chemical Holdings Corp. | 1,529,800 | 14,546,534 | |
| SK Kaken Co. Ltd. | 103,000 | 10,505,397 | |
| 47,302,589 | |||
| Construction Materials - 1.5% | |||
| Taiheiyo Cement Corp. | 328,500 | 12,455,475 | |
| Metals & Mining - 1.5% | |||
| JFE Holdings, Inc. | 597,000 | 12,311,896 | |
| TOTAL MATERIALS | 72,069,960 | ||
| REAL ESTATE - 1.5% | |||
| Real Estate Management & Development - 1.5% | |||
| Century21 Real Estate Japan Ltd. | 348,100 | 4,301,894 | |
| Daito Trust Construction Co. Ltd. | 47,400 | 7,915,176 | |
| 12,217,070 | |||
| UTILITIES - 2.7% | |||
| Electric Utilities - 1.3% | |||
| The Okinawa Electric Power Co., Inc. | 356,592 | 10,862,160 | |
| Gas Utilities - 1.4% | |||
| Tokyo Gas Co. Ltd. | 442,200 | 11,859,956 | |
| TOTAL UTILITIES | 22,722,116 | ||
| TOTAL COMMON STOCKS | |||
| (Cost $522,564,686) | 776,775,191 | ||
| Money Market Funds - 7.2% | |||
| Fidelity Cash Central Fund, 1.74% (c) | 49,344,701 | 49,354,570 | |
| Fidelity Securities Lending Cash Central Fund 1.74% (c)(d) | 10,664,091 | 10,665,158 | |
| TOTAL MONEY MARKET FUNDS | |||
| (Cost $60,019,692) | 60,019,728 | ||
| TOTAL INVESTMENT IN SECURITIES - 100.6% | |||
| (Cost $582,584,378) | 836,794,919 | ||
| NET OTHER ASSETS (LIABILITIES) - (0.6)% | (5,107,010) | ||
| NET ASSETS - 100% | $831,687,909 |
Legend
(a) Security or a portion of the security is on loan at period end.
(b) Non-income producing
(c) Affiliated fund that is generally available only to investment companies and other accounts managed by Fidelity Investments. The rate quoted is the annualized seven-day yield of the fund at period end. A complete unaudited listing of the fund's holdings as of its most recent quarter end is available upon request. In addition, each Fidelity Central Fund's financial statements are available on the SEC's website or upon request.
(d) Investment made with cash collateral received from securities on loan.
Affiliated Central Funds
Information regarding fiscal year to date income earned by the Fund from investments in Fidelity Central Funds is as follows:
| Fund | Income earned |
| Fidelity Cash Central Fund | $309,506 |
| Fidelity Securities Lending Cash Central Fund | 35,703 |
| Total | $345,209 |
Amounts in the income column in the above table include any capital gain distributions from underlying funds, which are presented in the corresponding line-item in the Statement of Operations if applicable.
Investment Valuation
The following is a summary of the inputs used, as of April 30, 2018, involving the Fund's assets and liabilities carried at fair value. The inputs or methodology used for valuing securities may not be an indication of the risk associated with investing in those securities. For more information on valuation inputs, and their aggregation into the levels used below, please refer to the Investment Valuation section in the accompanying Notes to Financial Statements.
| Valuation Inputs at Reporting Date: | ||||
| Description | Total | Level 1 | Level 2 | Level 3 |
| Investments in Securities: | ||||
| Equities: | ||||
| Consumer Discretionary | $156,058,321 | $149,469,139 | $6,589,182 | $-- |
| Consumer Staples | 74,297,748 | 74,297,748 | -- | -- |
| Energy | 20,462,854 | 20,462,854 | -- | -- |
| Financials | 65,872,629 | 57,666,164 | 8,206,465 | -- |
| Health Care | 44,971,719 | 35,194,081 | 9,777,638 | -- |
| Industrials | 207,148,774 | 207,148,774 | -- | -- |
| Information Technology | 100,954,000 | 100,954,000 | -- | -- |
| Materials | 72,069,960 | 72,069,960 | -- | -- |
| Real Estate | 12,217,070 | 12,217,070 | -- | -- |
| Utilities | 22,722,116 | 22,722,116 | -- | -- |
| Money Market Funds | 60,019,728 | 60,019,728 | -- | -- |
| Total Investments in Securities: | $836,794,919 | $812,221,634 | $24,573,285 | $-- |
The following is a summary of transfers between Level 1 and Level 2 for the period ended April 30, 2018. Transfers are assumed to have occurred at the beginning of the period, and are primarily attributable to the valuation techniques used for foreign equity securities, as discussed in the accompanying Notes to Financial Statements:
| Transfers | Total |
| Level 1 to Level 2 | $0 |
| Level 2 to Level 1 | $656,615,614 |
See accompanying notes which are an integral part of the financial statements.
Fidelity® Japan Smaller Companies Fund
Financial Statements
Statement of Assets and Liabilities
| April 30, 2018 (Unaudited) | ||
| Assets | ||
| Investment in securities, at value (including securities loaned of $10,112,470) — See accompanying schedule: Unaffiliated issuers (cost $522,564,686) | $776,775,191 | |
| Fidelity Central Funds (cost $60,019,692) | 60,019,728 | |
| Total Investment in Securities (cost $582,584,378) | $836,794,919 | |
| Receivable for fund shares sold | 446,946 | |
| Dividends receivable | 6,929,685 | |
| Distributions receivable from Fidelity Central Funds | 84,428 | |
| Prepaid expenses | 342 | |
| Other receivables | 8,897 | |
| Total assets | 844,265,217 | |
| Liabilities | ||
| Payable for investments purchased | $935,887 | |
| Payable for fund shares redeemed | 294,441 | |
| Accrued management fee | 479,561 | |
| Other affiliated payables | 151,417 | |
| Other payables and accrued expenses | 50,742 | |
| Collateral on securities loaned | 10,665,260 | |
| Total liabilities | 12,577,308 | |
| Net Assets | $831,687,909 | |
| Net Assets consist of: | ||
| Paid in capital | $585,633,926 | |
| Undistributed net investment income | 4,458,470 | |
| Accumulated undistributed net realized gain (loss) on investments and foreign currency transactions | (12,476,210) | |
| Net unrealized appreciation (depreciation) on investments and assets and liabilities in foreign currencies | 254,071,723 | |
| Net Assets, for 43,443,981 shares outstanding | $831,687,909 | |
| Net Asset Value, offering price and redemption price per share ($831,687,909 ÷ 43,443,981 shares) | $19.14 |
See accompanying notes which are an integral part of the financial statements.
Statement of Operations
| Six months ended April 30, 2018 (Unaudited) | ||
| Investment Income | ||
| Dividends | $8,738,576 | |
| Income from Fidelity Central Funds | 345,209 | |
| Income before foreign taxes withheld | 9,083,785 | |
| Less foreign taxes withheld | (873,707) | |
| Total income | 8,210,078 | |
| Expenses | ||
| Management fee | $2,796,446 | |
| Transfer agent fees | 686,527 | |
| Accounting and security lending fees | 194,306 | |
| Custodian fees and expenses | 40,246 | |
| Independent trustees' fees and expenses | 1,545 | |
| Registration fees | 22,870 | |
| Audit | 34,978 | |
| Legal | 1,370 | |
| Miscellaneous | 2,367 | |
| Total expenses before reductions | 3,780,655 | |
| Expense reductions | (18,966) | 3,761,689 |
| Net investment income (loss) | 4,448,389 | |
| Realized and Unrealized Gain (Loss) | ||
| Net realized gain (loss) on: | ||
| Investment securities: | ||
| Unaffiliated issuers | 12,866,675 | |
| Fidelity Central Funds | 362 | |
| Foreign currency transactions | 52,170 | |
| Total net realized gain (loss) | 12,919,207 | |
| Change in net unrealized appreciation (depreciation) on: | ||
| Investment securities: | ||
| Unaffiliated issuers | 30,817,804 | |
| Fidelity Central Funds | (222) | |
| Assets and liabilities in foreign currencies | (74,227) | |
| Total change in net unrealized appreciation (depreciation) | 30,743,355 | |
| Net gain (loss) | 43,662,562 | |
| Net increase (decrease) in net assets resulting from operations | $48,110,951 |
See accompanying notes which are an integral part of the financial statements.
Statement of Changes in Net Assets
| Six months ended April 30, 2018 (Unaudited) | Year ended October 31, 2017 | |
| Increase (Decrease) in Net Assets | ||
| Operations | ||
| Net investment income (loss) | $4,448,389 | $6,596,533 |
| Net realized gain (loss) | 12,919,207 | 21,029,986 |
| Change in net unrealized appreciation (depreciation) | 30,743,355 | 112,645,801 |
| Net increase (decrease) in net assets resulting from operations | 48,110,951 | 140,272,320 |
| Distributions to shareholders from net investment income | (6,388,824) | (6,334,246) |
| Distributions to shareholders from net realized gain | (29,246,624) | (9,182,783) |
| Total distributions | (35,635,448) | (15,517,029) |
| Share transactions | ||
| Proceeds from sales of shares | 152,544,774 | 109,404,114 |
| Reinvestment of distributions | 32,808,433 | 14,528,831 |
| Cost of shares redeemed | (130,201,068) | (71,725,248) |
| Net increase (decrease) in net assets resulting from share transactions | 55,152,139 | 52,207,697 |
| Redemption fees | 8,581 | 54,565 |
| Total increase (decrease) in net assets | 67,636,223 | 177,017,553 |
| Net Assets | ||
| Beginning of period | 764,051,686 | 587,034,133 |
| End of period | $831,687,909 | $764,051,686 |
| Other Information | ||
| Undistributed net investment income end of period | $4,458,470 | $6,398,905 |
| Shares | ||
| Sold | 7,958,776 | 6,520,288 |
| Issued in reinvestment of distributions | 1,763,894 | 984,338 |
| Redeemed | (6,822,996) | (4,442,602) |
| Net increase (decrease) | 2,899,674 | 3,062,024 |
See accompanying notes which are an integral part of the financial statements.
Financial Highlights
Fidelity Japan Smaller Companies Fund
| Six months ended (Unaudited) April 30, | Years endedOctober 31, | |||||
| 2018 | 2017 | 2016 | 2015 | 2014 | 2013 | |
| Selected Per–Share Data | ||||||
| Net asset value, beginning of period | $18.84 | $15.66 | $13.76 | $13.10 | $13.86 | $9.12 |
| Income from Investment Operations | ||||||
| Net investment income (loss)A | .11 | .17 | .17 | .10 | .09 | .02 |
| Net realized and unrealized gain (loss) | 1.09 | 3.42 | 1.93 | .78 | (.53) | 4.91 |
| Total from investment operations | 1.20 | 3.59 | 2.10 | .88 | (.44) | 4.93 |
| Distributions from net investment income | (.16) | (.17) | (.09) | (.03) | (.02) | (.07) |
| Distributions from net realized gain | (.74) | (.25) | (.11) | (.19) | (.31) | (.15) |
| Total distributions | (.90) | (.41)B | (.20) | (.22) | (.33) | (.22) |
| Redemption fees added to paid in capitalA | –C | –C | –C | –C | .01 | .03 |
| Net asset value, end of period | $19.14 | $18.84 | $15.66 | $13.76 | $13.10 | $13.86 |
| Total ReturnD,E | 6.53% | 23.68% | 15.44% | 6.93% | (3.16)% | 55.79% |
| Ratios to Average Net AssetsF,G | ||||||
| Expenses before reductions | .93%H | .95% | .96% | .98% | 1.00% | 1.01% |
| Expenses net of fee waivers, if any | .93%H | .95% | .96% | .98% | 1.00% | 1.01% |
| Expenses net of all reductions | .93%H | .94% | .96% | .97% | 1.00% | .98% |
| Net investment income (loss) | 1.10%H | 1.04% | 1.18% | .77% | .70% | .18% |
| Supplemental Data | ||||||
| Net assets, end of period (000 omitted) | $831,688 | $764,052 | $587,034 | $502,842 | $416,052 | $661,445 |
| Portfolio turnover rateI | 11%H | 20% | 30% | 41% | 112% | 91% |
A Calculated based on average shares outstanding during the period.
B Total distributions of $.41 per share is comprised of distributions from net investment income of $.169 and distributions from net realized gain of $.245 per share.
C Amount represents less than $.005 per share.
D Total returns for periods of less than one year are not annualized.
E Total returns would have been lower if certain expenses had not been reduced during the applicable periods shown.
F Fees and expenses of any underlying Fidelity Central Funds are not included in the Fund's expense ratio. The Fund indirectly bears its proportionate share of the expenses of any underlying Fidelity Central Funds.
G Expense ratios reflect operating expenses of the Fund. Expenses before reductions do not reflect amounts reimbursed by the investment adviser or reductions from brokerage service arrangements or reductions from other expense offset arrangements and do not represent the amount paid by the Fund during periods when reimbursements or reductions occur. Expenses net of fee waivers reflect expenses after reimbursement by the investment adviser but prior to reductions from brokerage service arrangements or other expense offset arrangements. Expenses net of all reductions represent the net expenses paid by the Fund.
H Annualized
I Amount does not include the portfolio activity of any underlying Fidelity Central Funds.
See accompanying notes which are an integral part of the financial statements.
Notes to Financial Statements (Unaudited)
For the period ended April 30, 2018
1. Organization.
Fidelity Japan Smaller Companies Fund (the Fund) is a fund of Fidelity Investment Trust (the Trust) and is authorized to issue an unlimited number of shares. Share transactions on the Statement of Changes in Net Assets may contain exchanges between affiliated funds. The Trust is registered under the Investment Company Act of 1940, as amended (the 1940 Act), as an open-end management investment company organized as a Massachusetts business trust.
2. Investments in Fidelity Central Funds.
The Fund invests in Fidelity Central Funds, which are open-end investment companies generally available only to other investment companies and accounts managed by the investment adviser and its affiliates. The Fund's Schedule of Investments lists each of the Fidelity Central Funds held as of period end, if any, as an investment of the Fund, but does not include the underlying holdings of each Fidelity Central Fund. As an Investing Fund, the Fund indirectly bears its proportionate share of the expenses of the underlying Fidelity Central Funds.
The Money Market Central Funds seek preservation of capital and current income and are managed by Fidelity Investments Money Management, Inc. (FIMM), an affiliate of the investment adviser. Annualized expenses of the Money Market Central Funds as of their most recent shareholder report date are less than .005%.
A complete unaudited list of holdings for each Fidelity Central Fund is available upon request or at the Securities and Exchange Commission (the SEC) website at www.sec.gov. In addition, the financial statements of the Fidelity Central Funds are available on the SEC website or upon request.
3. Significant Accounting Policies.
The Fund is an investment company and applies the accounting and reporting guidance of the Financial Accounting Standards Board (FASB) Accounting Standards Codification Topic 946 Financial Services – Investments Companies. The financial statements have been prepared in conformity with accounting principles generally accepted in the United States of America (GAAP), which require management to make certain estimates and assumptions at the date of the financial statements. Actual results could differ from those estimates. Subsequent events, if any, through the date that the financial statements were issued have been evaluated in the preparation of the financial statements. The following summarizes the significant accounting policies of the Fund:
Investment Valuation. Investments are valued as of 4:00 p.m. Eastern time on the last calendar day of the period. The Board of Trustees (the Board) has delegated the day to day responsibility for the valuation of the Fund's investments to the Fair Value Committee (the Committee) established by the Fund's investment adviser. In accordance with valuation policies and procedures approved by the Board, the Fund attempts to obtain prices from one or more third party pricing vendors or brokers to value its investments. When current market prices, quotations or currency exchange rates are not readily available or reliable, investments will be fair valued in good faith by the Committee, in accordance with procedures adopted by the Board. Factors used in determining fair value vary by investment type and may include market or investment specific events. The frequency with which these procedures are used cannot be predicted and they may be utilized to a significant extent. The Committee oversees the Fund's valuation policies and procedures and reports to the Board on the Committee's activities and fair value determinations. The Board monitors the appropriateness of the procedures used in valuing the Fund's investments and ratifies the fair value determinations of the Committee.
The Fund categorizes the inputs to valuation techniques used to value its investments into a disclosure hierarchy consisting of three levels as shown below:
- Level 1 – quoted prices in active markets for identical investments
- Level 2 – other significant observable inputs (including quoted prices for similar investments, interest rates, prepayment speeds, etc.)
- Level 3 – unobservable inputs (including the Fund's own assumptions based on the best information available)
Valuation techniques used to value the Fund's investments by major category are as follows:
Equity securities, including restricted securities, for which market quotations are readily available, are valued at the last reported sale price or official closing price as reported by a third party pricing vendor on the primary market or exchange on which they are traded and are categorized as Level 1 in the hierarchy. In the event there were no sales during the day or closing prices are not available, securities are valued at the last quoted bid price or may be valued using the last available price and are generally categorized as Level 2 in the hierarchy. For foreign equity securities, when market or security specific events arise, comparisons to the valuation of American Depositary Receipts (ADRs), futures contracts, Exchange-Traded Funds (ETFs) and certain indexes as well as quoted prices for similar securities may be used and would be categorized as Level 2 in the hierarchy. Utilizing these techniques may result in transfers between Level 1 and Level 2. For equity securities, including restricted securities, where observable inputs are limited, assumptions about market activity and risk are used and these securities may be categorized as Level 3 in the hierarchy.
Investments in open-end mutual funds, including the Fidelity Central Funds, are valued at their closing net asset value (NAV) each business day and are categorized as Level 1 in the hierarchy.
Changes in valuation techniques may result in transfers in or out of an assigned level within the disclosure hierarchy. The aggregate value of investments by input level as of April 30, 2018, including information on transfers between Levels 1 and 2, is included at the end of the Fund's Schedule of Investments.
Foreign Currency. The Fund may use foreign currency contracts to facilitate transactions in foreign-denominated securities. Gains and losses from these transactions may arise from changes in the value of the foreign currency or if the counterparties do not perform under the contracts' terms.
Foreign-denominated assets, including investment securities, and liabilities are translated into U.S. dollars at the exchange rates at period end. Purchases and sales of investment securities, income and dividends received and expenses denominated in foreign currencies are translated into U.S. dollars at the exchange rate in effect on the transaction date.
The effects of exchange rate fluctuations on investments are included with the net realized and unrealized gain (loss) on investment securities. Other foreign currency transactions resulting in realized and unrealized gain (loss) are disclosed separately.
Investment Transactions and Income. For financial reporting purposes, the Fund's investment holdings and NAV include trades executed through the end of the last business day of the period. The NAV per share for processing shareholder transactions is calculated as of the close of business of the New York Stock Exchange (NYSE), normally 4:00 p.m. Eastern time and includes trades executed through the end of the prior business day. Gains and losses on securities sold are determined on the basis of identified cost. Dividend income is recorded on the ex-dividend date, except for certain dividends from foreign securities where the ex-dividend date may have passed, which are recorded as soon as the Fund is informed of the ex-dividend date. Non-cash dividends included in dividend income, if any, are recorded at the fair market value of the securities received. Income and capital gain distributions from Fidelity Central Funds, if any, are recorded on the ex-dividend date. Investment income is recorded net of foreign taxes withheld where recovery of such taxes is uncertain.
Expenses. Expenses directly attributable to a fund are charged to that fund. Expenses attributable to more than one fund are allocated among the respective funds on the basis of relative net assets or other appropriate methods. Expense estimates are accrued in the period to which they relate and adjustments are made when actual amounts are known.
Income Tax Information and Distributions to Shareholders. Each year, the Fund intends to qualify as a regulated investment company under Subchapter M of the Internal Revenue Code, including distributing substantially all of its taxable income and realized gains. As a result, no provision for U.S. Federal income taxes is required. The Fund files a U.S. federal tax return, in addition to state and local tax returns as required. The Fund's federal income tax returns are subject to examination by the Internal Revenue Service (IRS) for a period of three fiscal years after they are filed. State and local tax returns may be subject to examination for an additional fiscal year depending on the jurisdiction. Foreign taxes are provided for based on the Fund's understanding of the tax rules and rates that exist in the foreign markets in which it invests.
Distributions are declared and recorded on the ex-dividend date. Income and capital gain distributions are determined in accordance with income tax regulations, which may differ from GAAP.
Capital accounts within the financial statements are adjusted for permanent book-tax differences. These adjustments have no impact on net assets or the results of operations. Capital accounts are not adjusted for temporary book-tax differences which will reverse in a subsequent period.
Book-tax differences are primarily due to foreign currency transactions, passive foreign investment companies (PFIC), deferred trustees compensation, capital loss carryforwards and losses deferred due to wash sales.
As of period end, the cost and unrealized appreciation (depreciation) in securities, and derivatives if applicable, for federal income tax purposes were as follows:
| Gross unrealized appreciation | $236,186,917 |
| Gross unrealized depreciation | (7,327,130) |
| Net unrealized appreciation (depreciation) | $228,859,787 |
| Tax cost | $607,935,132 |
Short-Term Trading (Redemption) Fees. Shares held by investors in the Fund less than 90 days may have been subject to a redemption fee equal to 1.50% of the NAV of shares redeemed. All redemption fees, which reduce the proceeds of the shareholder redemption, are retained by the Fund and accounted for as an addition to paid in capital. In November 2017, the Board of Trustees approved the elimination of these redemption fees effective December 18, 2017.
4. Purchases and Sales of Investments.
Purchases and sales of securities, other than short-term securities, aggregated $63,895,086 and $40,892,796, respectively.
5. Fees and Other Transactions with Affiliates.
Management Fee. Fidelity Management & Research Company (the investment adviser) and its affiliates provide the Fund with investment management related services for which the Fund pays a monthly management fee. The management fee is the sum of an individual fund fee rate that is based on an annual rate of .45% of the Fund's average net assets and an annualized group fee rate that averaged .24% during the period. The group fee rate is based upon the average net assets of all the mutual funds advised by the investment adviser, including any mutual funds previously advised by the investment adviser that are currently advised by Fidelity SelectCo, LLC, an affiliate of the investment adviser. The group fee rate decreases as assets under management increase and increases as assets under management decrease. For the reporting period, the total annualized management fee rate was .69% of the Fund's average net assets.
Transfer Agent Fees. Fidelity Investments Institutional Operations Company, Inc. (FIIOC), an affiliate of the investment adviser, is the Fund's transfer, dividend disbursing and shareholder servicing agent. FIIOC receives account fees and asset-based fees that vary according to account size and type of account. FIIOC pays for typesetting, printing and mailing of shareholder reports, except proxy statements. For the period, the transfer agent fees were equivalent to an annualized rate of .17% of average net assets.
Accounting and Security Lending Fees. Fidelity Service Company, Inc. (FSC), an affiliate of the investment adviser, maintains the Fund's accounting records. The accounting fee is based on the level of average net assets for each month. Under a separate contract, FSC administers the security lending program. The security lending fee is based on the number and duration of lending transactions. For the period, the fees were equivalent to an annualized rate of .05%.
Interfund Trades. The Fund may purchase from or sell securities to other Fidelity Funds under procedures adopted by the Board. The procedures have been designed to ensure these interfund trades are executed in accordance with Rule 17a-7 of the 1940 Act. Interfund trades are included within the respective purchases and sales amounts shown in the Purchases and Sales of Investments note.
6. Committed Line of Credit.
The Fund participates with other funds managed by the investment adviser or an affiliate in a $4.25 billion credit facility (the "line of credit") to be utilized for temporary or emergency purposes to fund shareholder redemptions or for other short-term liquidity purposes. The Fund has agreed to pay commitment fees on its pro-rata portion of the line of credit, which amounted to $1,124 and is reflected in Miscellaneous expenses on the Statement of Operations. During the period, the Fund did not borrow on this line of credit.
7. Security Lending.
The Fund lends portfolio securities through a lending agent from time to time in order to earn additional income. For equity securities, a lending agent is used and may loan securities to certain qualified borrowers, including Fidelity Capital Markets (FCM), a broker-dealer affiliated with the Fund. On the settlement date of the loan, the Fund receives collateral (in the form of U.S. Treasury obligations, letters of credit and/or cash) against the loaned securities and maintains collateral in an amount not less than 100% of the market value of the loaned securities during the period of the loan. The market value of the loaned securities is determined at the close of business of the Fund and any additional required collateral is delivered to the Fund on the next business day. The Fund or borrower may terminate the loan at any time, and if the borrower defaults on its obligation to return the securities loaned because of insolvency or other reasons, the Fund may apply collateral received from the borrower against the obligation. The Fund may experience delays and costs in recovering the securities loaned. Any cash collateral received is invested in the Fidelity Securities Lending Cash Central Fund. The value of loaned securities and cash collateral at period end are disclosed on the Fund's Statement of Assets and Liabilities. Security lending income represents the income earned on investing cash collateral, less rebates paid to borrowers and any lending agent fees associated with the loan, plus any premium payments received for lending certain types of securities. Security lending income is presented in the Statement of Operations as a component of income from Fidelity Central Funds. Total security lending income during the period amounted to $35,703. During the period, there were no securities loaned to FCM.
8. Expense Reductions.
Commissions paid to certain brokers with whom the investment adviser, or its affiliates, places trades on behalf of the Fund include an amount in addition to trade execution, which may be rebated back to the Fund to offset certain expenses. This amount totaled $15,041 for the period. In addition, through arrangements with the Fund's custodian, credits realized as a result of certain uninvested cash balances were used to reduce the Fund's expenses. During the period, these credits reduced the Fund's custody expenses by $54.
In addition, during the period the investment adviser reimbursed and/or waived a portion of operating expenses in the amount of $3,871.
9. Other.
The Fund's organizational documents provide former and current trustees and officers with a limited indemnification against liabilities arising in connection with the performance of their duties to the Fund. In the normal course of business, the Fund may also enter into contracts that provide general indemnifications. The Fund's maximum exposure under these arrangements is unknown as this would be dependent on future claims that may be made against the Fund. The risk of material loss from such claims is considered remote.
At the end of the period, Strategic Advisers International Fund was the owner of record of approximately 14% of the total outstanding shares of the Fund. Mutual funds managed by the investment adviser or its affiliates were the owners of record, in the aggregate, of approximately 40% of the total outstanding shares of the Fund.
Fidelity® Latin America Fund
Investment Summary (Unaudited)
Geographic Diversification (% of fund's net assets)
| As of April 30, 2018 | ||
| Brazil | 64.9% | |
| Mexico | 16.4% | |
| Panama | 4.3% | |
| Argentina | 4.0% | |
| Bermuda | 3.6% | |
| United States of America* | 1.9% | |
| Spain | 1.8% | |
| United Kingdom | 1.6% | |
| Israel | 1.5% | |

* Includes Short-Term investments and Net Other Assets (Liabilities).
Percentages are based on country or territory of incorporation and are adjusted for the effect of futures contracts, if applicable.
Asset Allocation as of April 30, 2018
| % of fund's net assets | |
| Stocks | 99.7 |
| Short-Term Investments and Net Other Assets (Liabilities) | 0.3 |
Top Ten Stocks as of April 30, 2018
| % of fund's net assets | |
| Itausa-Investimentos Itau SA (PN) (Brazil, Banks) | 9.8 |
| Itau Unibanco Holding SA (Brazil, Banks) | 8.9 |
| Petroleo Brasileiro SA - Petrobras (PN) (non-vtg.) (Brazil, Oil, Gas & Consumable Fuels) | 8.1 |
| Suzano Papel e Celulose SA (Brazil, Paper & Forest Products) | 4.0 |
| Credicorp Ltd. (United States) (Bermuda, Banks) | 3.6 |
| Credito Real S.A.B. de CV (Mexico, Consumer Finance) | 3.2 |
| Banco do Brasil SA (Brazil, Banks) | 3.0 |
| Qualicorp SA (Brazil, Health Care Providers & Services) | 2.9 |
| Genomma Lab Internacional SA de CV (Mexico, Pharmaceuticals) | 2.8 |
| Notre Dame Intermedica Participacoes SA (Brazil, Health Care Providers & Services) | 2.7 |
| 49.0 |
Top Market Sectors as of April 30, 2018
| % of fund's net assets | |
| Financials | 46.5 |
| Consumer Discretionary | 14.1 |
| Industrials | 10.2 |
| Health Care | 9.8 |
| Energy | 8.1 |
| Materials | 7.9 |
| Consumer Staples | 1.6 |
| Information Technology | 1.5 |
Market Sectors may include more than one industry category.
The Fund may invest up to 35% of its total assets in any industry that represents more than 20% of the Latin American market. As of April 30, 2018, 30.6% of the Fund’s total assets were invested in the Diversified Banks industry, which accounts for more than 20% of the Latin American market.
Fidelity® Latin America Fund
Schedule of Investments April 30, 2018 (Unaudited)
Showing Percentage of Net Assets
| Common Stocks - 71.7% | |||
| Shares | Value | ||
| Argentina - 4.0% | |||
| Banco Macro SA sponsored ADR | 108,597 | $10,525,221 | |
| Bolsas y Mercados Argentinos SA | 427,356 | 7,832,603 | |
| Loma Negra Compania Industrial Argentina SA ADR (a) | 373,359 | 7,743,466 | |
| TOTAL ARGENTINA | 26,101,290 | ||
| Bermuda - 3.6% | |||
| Credicorp Ltd. (United States) | 100,597 | 23,387,797 | |
| Brazil - 36.9% | |||
| Azul SA sponsored ADR | 448,645 | 13,907,995 | |
| Banco do Brasil SA | 1,845,139 | 19,329,927 | |
| BTG Pactual Participations Ltd. unit | 1,334,216 | 8,523,565 | |
| CVC Brasil Operadora e Agencia de Viagens SA | 707,998 | 11,719,800 | |
| Estacio Participacoes SA | 1,707,293 | 15,546,542 | |
| Grendene SA | 1,448,111 | 11,297,349 | |
| Hapvida Participacoes e Investimentos SA | 2,017,636 | 15,924,765 | |
| Instituto Hermes Pardini SA | 1,178,683 | 8,744,568 | |
| IRB Brasil Resseguros SA | 1,087,113 | 14,678,136 | |
| Itausa-Investimentos Itau SA | 379,675 | 1,463,123 | |
| Notre Dame Intermedica Participacoes SA | 3,042,916 | 17,719,652 | |
| Petrobras Distribuidora SA | 1,226,706 | 8,039,841 | |
| Qualicorp SA | 2,713,078 | 18,858,030 | |
| Rumo SA (a) | 3,045,236 | 12,908,699 | |
| Ser Educacional SA (b) | 1,730,053 | 8,197,899 | |
| Smiles Fidelidade SA | 860,158 | 17,678,516 | |
| Suzano Papel e Celulose SA | 2,220,026 | 26,020,286 | |
| Vale SA | 586,218 | 8,144,334 | |
| TOTAL BRAZIL | 238,703,027 | ||
| Israel - 1.5% | |||
| Ituran Location & Control Ltd. | 305,013 | 9,562,158 | |
| Mexico - 16.4% | |||
| Banco del Bajio SA (b) | 5,599,007 | 11,942,241 | |
| Credito Real S.A.B. de CV | 14,087,068 | 20,668,811 | |
| Genomma Lab Internacional SA de CV (a) | 18,670,399 | 18,159,216 | |
| Grupo Aeroportuario Norte S.A.B. de CV | 1,748,674 | 9,260,411 | |
| Grupo Cementos de Chihuahua S.A.B. de CV | 1,551,516 | 9,030,161 | |
| Promotora y Operadora de Infraestructura S.A.B. de CV | 1,748,760 | 12,209,121 | |
| Qualitas Controladora S.A.B. de CV | 4,349,535 | 12,142,478 | |
| Unifin Financiera SAPI de CV | 3,546,735 | 12,692,885 | |
| TOTAL MEXICO | 106,105,324 | ||
| Panama - 4.3% | |||
| Copa Holdings SA Class A | 147,655 | 17,300,736 | |
| Intergroup Financial Services Corp. | 248,403 | 10,629,164 | |
| TOTAL PANAMA | 27,929,900 | ||
| Spain - 1.8% | |||
| Prosegur Cash SA (b) | 3,850,184 | 11,251,747 | |
| United Kingdom - 1.6% | |||
| British American Tobacco PLC (United Kingdom) | 189,181 | 10,376,107 | |
| United States of America - 1.6% | |||
| First Cash Financial Services, Inc. | 120,504 | 10,447,697 | |
| TOTAL COMMON STOCKS | |||
| (Cost $368,278,573) | 463,865,047 | ||
| Nonconvertible Preferred Stocks - 28.0% | |||
| Brazil - 28.0% | |||
| Alpargatas SA (PN) | 1,784,953 | 7,953,619 | |
| Itau Unibanco Holding SA | 3,939,271 | 57,359,618 | |
| Itausa-Investimentos Itau SA (PN) | 16,316,433 | 63,389,658 | |
| Petroleo Brasileiro SA - Petrobras (PN) (non-vtg.) (a) | 8,019,294 | 52,581,406 | |
| TOTAL NONCONVERTIBLE PREFERRED STOCKS | |||
| (Cost $87,175,926) | 181,284,301 | ||
| Money Market Funds - 2.0% | |||
| Fidelity Cash Central Fund, 1.74% (c) | |||
| (Cost $13,198,337) | 13,195,697 | 13,198,337 | |
| TOTAL INVESTMENT IN SECURITIES - 101.7% | |||
| (Cost $468,652,836) | 658,347,685 | ||
| NET OTHER ASSETS (LIABILITIES) - (1.7)% | (11,181,332) | ||
| NET ASSETS - 100% | $647,166,353 |
Categorizations in the Schedule of Investments are based on country or territory of incorporation.
Legend
(a) Non-income producing
(b) Security exempt from registration under Rule 144A of the Securities Act of 1933. These securities may be resold in transactions exempt from registration, normally to qualified institutional buyers. At the end of the period, the value of these securities amounted to $31,391,887 or 4.9% of net assets.
(c) Affiliated fund that is generally available only to investment companies and other accounts managed by Fidelity Investments. The rate quoted is the annualized seven-day yield of the fund at period end. A complete unaudited listing of the fund's holdings as of its most recent quarter end is available upon request. In addition, each Fidelity Central Fund's financial statements are available on the SEC's website or upon request.
Affiliated Central Funds
Information regarding fiscal year to date income earned by the Fund from investments in Fidelity Central Funds is as follows:
| Fund | Income earned |
| Fidelity Cash Central Fund | $45,506 |
| Fidelity Securities Lending Cash Central Fund | 46 |
| Total | $45,552 |
Amounts in the income column in the above table include any capital gain distributions from underlying funds, which are presented in the corresponding line-item in the Statement of Operations if applicable.
Investment Valuation
The following is a summary of the inputs used, as of April 30, 2018, involving the Fund's assets and liabilities carried at fair value. The inputs or methodology used for valuing securities may not be an indication of the risk associated with investing in those securities. For more information on valuation inputs, and their aggregation into the levels used below, please refer to the Investment Valuation section in the accompanying Notes to Financial Statements.
| Valuation Inputs at Reporting Date: | ||||
| Description | Total | Level 1 | Level 2 | Level 3 |
| Investments in Securities: | ||||
| Equities: | ||||
| Consumer Discretionary | $92,375,807 | $92,375,807 | $-- | $-- |
| Consumer Staples | 10,376,107 | -- | 10,376,107 | -- |
| Energy | 52,581,406 | 52,581,406 | -- | -- |
| Financials | 300,247,195 | 300,247,195 | -- | -- |
| Health Care | 63,481,466 | 63,481,466 | -- | -- |
| Industrials | 65,586,962 | 65,586,962 | -- | -- |
| Information Technology | 9,562,158 | 9,562,158 | -- | -- |
| Materials | 50,938,247 | 50,938,247 | -- | -- |
| Money Market Funds | 13,198,337 | 13,198,337 | -- | -- |
| Total Investments in Securities: | $658,347,685 | $647,971,578 | $10,376,107 | $-- |
See accompanying notes which are an integral part of the financial statements.
Fidelity® Latin America Fund
Financial Statements
Statement of Assets and Liabilities
| April 30, 2018 (Unaudited) | ||
| Assets | ||
| Investment in securities, at value — See accompanying schedule: Unaffiliated issuers (cost $455,454,499) | $645,149,348 | |
| Fidelity Central Funds (cost $13,198,337) | 13,198,337 | |
| Total Investment in Securities (cost $468,652,836) | $658,347,685 | |
| Foreign currency held at value (cost $1,109,295) | 1,110,124 | |
| Receivable for investments sold | 814,675 | |
| Receivable for fund shares sold | 799,851 | |
| Dividends receivable | 1,921,258 | |
| Distributions receivable from Fidelity Central Funds | 26,488 | |
| Prepaid expenses | 309 | |
| Other receivables | 22,059 | |
| Total assets | 663,042,449 | |
| Liabilities | ||
| Payable for investments purchased | $14,533,588 | |
| Payable for fund shares redeemed | 633,028 | |
| Accrued management fee | 375,449 | |
| Distribution and service plan fees payable | 11,183 | |
| Other affiliated payables | 153,703 | |
| Other payables and accrued expenses | 169,145 | |
| Total liabilities | 15,876,096 | |
| Net Assets | $647,166,353 | |
| Net Assets consist of: | ||
| Paid in capital | $563,522,184 | |
| Undistributed net investment income | 6,777,960 | |
| Accumulated undistributed net realized gain (loss) on investments and foreign currency transactions | (112,756,542) | |
| Net unrealized appreciation (depreciation) on investments and assets and liabilities in foreign currencies | 189,622,751 | |
| Net Assets | $647,166,353 | |
| Calculation of Maximum Offering Price | ||
| Class A: | ||
| Net Asset Value and redemption price per share ($19,342,350 ÷ 736,364 shares) | $26.27 | |
| Maximum offering price per share (100/94.25 of $26.27) | $27.87 | |
| Class M: | ||
| Net Asset Value and redemption price per share ($7,082,233 ÷ 268,990 shares) | $26.33 | |
| Maximum offering price per share (100/96.50 of $26.33) | $27.28 | |
| Class C: | ||
| Net Asset Value and offering price per share ($5,024,280 ÷ 189,039 shares)(a) | $26.58 | |
| Latin America: | ||
| Net Asset Value, offering price and redemption price per share ($605,953,275 ÷ 23,141,339 shares) | $26.18 | |
| Class I: | ||
| Net Asset Value, offering price and redemption price per share ($9,764,215 ÷ 373,434 shares) | $26.15 |
(a) Redemption price per share is equal to net asset value less any applicable contingent deferred sales charge.
See accompanying notes which are an integral part of the financial statements.
Statement of Operations
| Six months ended April 30, 2018 (Unaudited) | ||
| Investment Income | ||
| Dividends | $13,806,687 | |
| Income from Fidelity Central Funds | 45,552 | |
| Income before foreign taxes withheld | 13,852,239 | |
| Less foreign taxes withheld | (1,016,847) | |
| Total income | 12,835,392 | |
| Expenses | ||
| Management fee | $2,210,946 | |
| Transfer agent fees | 747,037 | |
| Distribution and service plan fees | 65,920 | |
| Accounting and security lending fees | 158,628 | |
| Custodian fees and expenses | 191,889 | |
| Independent trustees' fees and expenses | 1,259 | |
| Registration fees | 46,253 | |
| Audit | 40,762 | |
| Legal | 1,698 | |
| Miscellaneous | 2,046 | |
| Total expenses before reductions | 3,466,438 | |
| Expense reductions | (44,430) | 3,422,008 |
| Net investment income (loss) | 9,413,384 | |
| Realized and Unrealized Gain (Loss) | ||
| Net realized gain (loss) on: | ||
| Investment securities: | ||
| Unaffiliated issuers | 30,108,737 | |
| Fidelity Central Funds | 55 | |
| Foreign currency transactions | (71,486) | |
| Total net realized gain (loss) | 30,037,306 | |
| Change in net unrealized appreciation (depreciation) on: | ||
| Investment securities: | ||
| Unaffiliated issuers | 198,855 | |
| Assets and liabilities in foreign currencies | (72,928) | |
| Total change in net unrealized appreciation (depreciation) | 125,927 | |
| Net gain (loss) | 30,163,233 | |
| Net increase (decrease) in net assets resulting from operations | $39,576,617 |
See accompanying notes which are an integral part of the financial statements.
Statement of Changes in Net Assets
| Six months ended April 30, 2018 (Unaudited) | Year ended October 31, 2017 | |
| Increase (Decrease) in Net Assets | ||
| Operations | ||
| Net investment income (loss) | $9,413,384 | $12,761,653 |
| Net realized gain (loss) | 30,037,306 | 32,325,555 |
| Change in net unrealized appreciation (depreciation) | 125,927 | 24,718,281 |
| Net increase (decrease) in net assets resulting from operations | 39,576,617 | 69,805,489 |
| Distributions to shareholders from net investment income | (9,005,746) | (12,697,307) |
| Share transactions - net increase (decrease) | (18,887,886) | (55,405,622) |
| Redemption fees | 87,345 | 272,096 |
| Total increase (decrease) in net assets | 11,770,330 | 1,974,656 |
| Net Assets | ||
| Beginning of period | 635,396,023 | 633,421,367 |
| End of period | $647,166,353 | $635,396,023 |
| Other Information | ||
| Undistributed net investment income end of period | $6,777,960 | $6,370,322 |
See accompanying notes which are an integral part of the financial statements.
Financial Highlights
Fidelity Latin America Fund Class A
| Six months ended (Unaudited) April 30, | Years endedOctober 31, | |||||
| 2018 | 2017 | 2016 | 2015 | 2014 | 2013 | |
| Selected Per–Share Data | ||||||
| Net asset value, beginning of period | $24.93 | $22.45 | $18.09 | $30.31 | $40.71 | $48.95 |
| Income from Investment Operations | ||||||
| Net investment income (loss)A | .34 | .42 | .40 | .28 | .49 | .72 |
| Net realized and unrealized gain (loss) | 1.29 | 2.48 | 4.27 | (10.11) | (4.08) | (4.73) |
| Total from investment operations | 1.63 | 2.90 | 4.67 | (9.83) | (3.59) | (4.01) |
| Distributions from net investment income | (.29) | (.43) | (.31) | (.31) | (.57) | (.79) |
| Distributions from net realized gain | – | – | – | (2.08) | (6.25) | (3.45) |
| Total distributions | (.29) | (.43) | (.31) | (2.39) | (6.82) | (4.24) |
| Redemption fees added to paid in capitalA | –B | .01 | –B | –B | .01 | .01 |
| Net asset value, end of period | $26.27 | $24.93 | $22.45 | $18.09 | $30.31 | $40.71 |
| Total ReturnC,D,E | 6.63% | 13.55% | 26.29% | (34.60)% | (9.06)% | (8.93)% |
| Ratios to Average Net AssetsF,G | ||||||
| Expenses before reductions | 1.38%H | 1.39% | 1.40% | 1.40% | 1.38% | 1.37% |
| Expenses net of fee waivers, if any | 1.38%H | 1.39% | 1.40% | 1.40% | 1.38% | 1.37% |
| Expenses net of all reductions | 1.37%H | 1.38% | 1.39% | 1.39% | 1.38% | 1.35% |
| Net investment income (loss) | 2.64%H | 1.90% | 2.14% | 1.26% | 1.52% | 1.66% |
| Supplemental Data | ||||||
| Net assets, end of period (000 omitted) | $19,342 | $17,801 | $19,115 | $16,424 | $34,898 | $48,464 |
| Portfolio turnover rateI | 58%H | 51% | 108% | 30% | 30% | 23% |
A Calculated based on average shares outstanding during the period.
B Amount represents less than $.005 per share.
C Total returns for periods of less than one year are not annualized.
D Total returns would have been lower if certain expenses had not been reduced during the applicable periods shown.
E Total returns do not include the effect of the sales charges.
F Fees and expenses of any underlying Fidelity Central Funds are not included in the Fund's expense ratio. The Fund indirectly bears its proportionate share of the expenses of any underlying Fidelity Central Funds.
G Expense ratios reflect operating expenses of the class. Expenses before reductions do not reflect amounts reimbursed by the investment adviser or reductions from brokerage service arrangements or reductions from other expense offset arrangements and do not represent the amount paid by the class during periods when reimbursements or reductions occur. Expenses net of fee waivers reflect expenses after reimbursement by the investment adviser but prior to reductions from brokerage service arrangements or other expense offset arrangements. Expenses net of all reductions represent the net expenses paid by the class.
H Annualized
I Amount does not include the portfolio activity of any underlying Fidelity Central Funds.
See accompanying notes which are an integral part of the financial statements.
Fidelity Latin America Fund Class M
| Six months ended (Unaudited) April 30, | Years endedOctober 31, | |||||
| 2018 | 2017 | 2016 | 2015 | 2014 | 2013 | |
| Selected Per–Share Data | ||||||
| Net asset value, beginning of period | $24.96 | $22.47 | $18.11 | $30.33 | $40.68 | $48.88 |
| Income from Investment Operations | ||||||
| Net investment income (loss)A | .31 | .36 | .35 | .22 | .40 | .61 |
| Net realized and unrealized gain (loss) | 1.29 | 2.49 | 4.27 | (10.13) | (4.08) | (4.74) |
| Total from investment operations | 1.60 | 2.85 | 4.62 | (9.91) | (3.68) | (4.13) |
| Distributions from net investment income | (.23) | (.37) | (.26) | (.23) | (.43) | (.63) |
| Distributions from net realized gain | – | – | – | (2.08) | (6.25) | (3.45) |
| Total distributions | (.23) | (.37) | (.26) | (2.31) | (6.68) | (4.08) |
| Redemption fees added to paid in capitalA | –B | .01 | –B | –B | .01 | .01 |
| Net asset value, end of period | $26.33 | $24.96 | $22.47 | $18.11 | $30.33 | $40.68 |
| Total ReturnC,D,E | 6.47% | 13.24% | 25.93% | (34.78)% | (9.30)% | (9.17)% |
| Ratios to Average Net AssetsF,G | ||||||
| Expenses before reductions | 1.65%H | 1.66% | 1.68% | 1.67% | 1.65% | 1.63% |
| Expenses net of fee waivers, if any | 1.65%H | 1.66% | 1.68% | 1.67% | 1.65% | 1.63% |
| Expenses net of all reductions | 1.64%H | 1.66% | 1.68% | 1.66% | 1.65% | 1.61% |
| Net investment income (loss) | 2.37%H | 1.62% | 1.86% | .99% | 1.25% | 1.40% |
| Supplemental Data | ||||||
| Net assets, end of period (000 omitted) | $7,082 | $6,740 | $7,378 | $5,284 | $9,761 | $12,705 |
| Portfolio turnover rateI | 58%H | 51% | 108% | 30% | 30% | 23% |
A Calculated based on average shares outstanding during the period.
B Amount represents less than $.005 per share.
C Total returns for periods of less than one year are not annualized.
D Total returns would have been lower if certain expenses had not been reduced during the applicable periods shown.
E Total returns do not include the effect of the sales charges.
F Fees and expenses of any underlying Fidelity Central Funds are not included in the Fund's expense ratio. The Fund indirectly bears its proportionate share of the expenses of any underlying Fidelity Central Funds.
G Expense ratios reflect operating expenses of the class. Expenses before reductions do not reflect amounts reimbursed by the investment adviser or reductions from brokerage service arrangements or reductions from other expense offset arrangements and do not represent the amount paid by the class during periods when reimbursements or reductions occur. Expenses net of fee waivers reflect expenses after reimbursement by the investment adviser but prior to reductions from brokerage service arrangements or other expense offset arrangements. Expenses net of all reductions represent the net expenses paid by the class.
H Annualized
I Amount does not include the portfolio activity of any underlying Fidelity Central Funds.
See accompanying notes which are an integral part of the financial statements.
Fidelity Latin America Fund Class C
| Six months ended (Unaudited) April 30, | Years endedOctober 31, | |||||
| 2018 | 2017 | 2016 | 2015 | 2014 | 2013 | |
| Selected Per–Share Data | ||||||
| Net asset value, beginning of period | $25.12 | $22.61 | $18.18 | $30.37 | $40.59 | $48.73 |
| Income from Investment Operations | ||||||
| Net investment income (loss)A | .25 | .26 | .26 | .11 | .25 | .40 |
| Net realized and unrealized gain (loss) | 1.31 | 2.52 | 4.30 | (10.17) | (4.07) | (4.74) |
| Total from investment operations | 1.56 | 2.78 | 4.56 | (10.06) | (3.82) | (4.34) |
| Distributions from net investment income | (.10) | (.28) | (.13) | (.05) | (.16) | (.36) |
| Distributions from net realized gain | – | – | – | (2.08) | (6.25) | (3.45) |
| Total distributions | (.10) | (.28) | (.13) | (2.13) | (6.41) | (3.81) |
| Redemption fees added to paid in capitalA | –B | .01 | –B | –B | .01 | .01 |
| Net asset value, end of period | $26.58 | $25.12 | $22.61 | $18.18 | $30.37 | $40.59 |
| Total ReturnC,D,E | 6.24% | 12.71% | 25.31% | (35.08)% | (9.74)% | (9.62)% |
| Ratios to Average Net AssetsF,G | ||||||
| Expenses before reductions | 2.13%H | 2.14% | 2.15% | 2.15% | 2.13% | 2.12% |
| Expenses net of fee waivers, if any | 2.13%H | 2.14% | 2.14% | 2.15% | 2.13% | 2.12% |
| Expenses net of all reductions | 2.12%H | 2.14% | 2.14% | 2.15% | 2.13% | 2.10% |
| Net investment income (loss) | 1.89%H | 1.15% | 1.39% | .51% | .77% | .91% |
| Supplemental Data | ||||||
| Net assets, end of period (000 omitted) | $5,024 | $5,094 | $6,590 | $5,394 | $11,349 | $15,185 |
| Portfolio turnover rateI | 58%H | 51% | 108% | 30% | 30% | 23% |
A Calculated based on average shares outstanding during the period.
B Amount represents less than $.005 per share.
C Total returns for periods of less than one year are not annualized.
D Total returns would have been lower if certain expenses had not been reduced during the applicable periods shown.
E Total returns do not include the effect of the contingent deferred sales charge.
F Fees and expenses of any underlying Fidelity Central Funds are not included in the Fund's expense ratio. The Fund indirectly bears its proportionate share of the expenses of any underlying Fidelity Central Funds.
G Expense ratios reflect operating expenses of the class. Expenses before reductions do not reflect amounts reimbursed by the investment adviser or reductions from brokerage service arrangements or reductions from other expense offset arrangements and do not represent the amount paid by the class during periods when reimbursements or reductions occur. Expenses net of fee waivers reflect expenses after reimbursement by the investment adviser but prior to reductions from brokerage service arrangements or other expense offset arrangements. Expenses net of all reductions represent the net expenses paid by the class.
H Annualized
I Amount does not include the portfolio activity of any underlying Fidelity Central Funds.
See accompanying notes which are an integral part of the financial statements.
Fidelity Latin America Fund
| Six months ended (Unaudited) April 30, | Years endedOctober 31, | |||||
| 2018 | 2017 | 2016 | 2015 | 2014 | 2013 | |
| Selected Per–Share Data | ||||||
| Net asset value, beginning of period | $24.89 | $22.41 | $18.08 | $30.34 | $40.80 | $49.09 |
| Income from Investment Operations | ||||||
| Net investment income (loss)A | .38 | .49 | .45 | .34 | .59 | .87 |
| Net realized and unrealized gain (loss) | 1.28 | 2.46 | 4.26 | (10.11) | (4.10) | (4.74) |
| Total from investment operations | 1.66 | 2.95 | 4.71 | (9.77) | (3.51) | (3.87) |
| Distributions from net investment income | (.37) | (.48) | (.38) | (.41) | (.71) | (.98) |
| Distributions from net realized gain | – | – | – | (2.08) | (6.25) | (3.45) |
| Total distributions | (.37) | (.48) | (.38) | (2.49) | (6.96) | (4.43) |
| Redemption fees added to paid in capitalA | –B | .01 | –B | –B | .01 | .01 |
| Net asset value, end of period | $26.18 | $24.89 | $22.41 | $18.08 | $30.34 | $40.80 |
| Total ReturnC,D | 6.80% | 13.87% | 26.65% | (34.45)% | (8.79)% | (8.63)% |
| Ratios to Average Net AssetsE,F | ||||||
| Expenses before reductions | 1.06%G | 1.09% | 1.14% | 1.13% | 1.08% | 1.04% |
| Expenses net of fee waivers, if any | 1.06%G | 1.09% | 1.14% | 1.12% | 1.08% | 1.04% |
| Expenses net of all reductions | 1.04%G | 1.09% | 1.13% | 1.12% | 1.07% | 1.03% |
| Net investment income (loss) | 2.96%G | 2.19% | 2.40% | 1.53% | 1.83% | 1.99% |
| Supplemental Data | ||||||
| Net assets, end of period (000 omitted) | $605,953 | $597,161 | $596,514 | $481,005 | $933,298 | $1,324,748 |
| Portfolio turnover rateH | 58%G | 51% | 108% | 30% | 30% | 23% |
A Calculated based on average shares outstanding during the period.
B Amount represents less than $.005 per share.
C Total returns for periods of less than one year are not annualized.
D Total returns would have been lower if certain expenses had not been reduced during the applicable periods shown.
E Fees and expenses of any underlying Fidelity Central Funds are not included in the Fund's expense ratio. The Fund indirectly bears its proportionate share of the expenses of any underlying Fidelity Central Funds.
F Expense ratios reflect operating expenses of the class. Expenses before reductions do not reflect amounts reimbursed by the investment adviser or reductions from brokerage service arrangements or reductions from other expense offset arrangements and do not represent the amount paid by the class during periods when reimbursements or reductions occur. Expenses net of fee waivers reflect expenses after reimbursement by the investment adviser but prior to reductions from brokerage service arrangements or other expense offset arrangements. Expenses net of all reductions represent the net expenses paid by the class.
G Annualized
H Amount does not include the portfolio activity of any underlying Fidelity Central Funds.
See accompanying notes which are an integral part of the financial statements.
Fidelity Latin America Fund Class I
| Six months ended (Unaudited) April 30, | Years endedOctober 31, | |||||
| 2018 | 2017 | 2016 | 2015 | 2014 | 2013 | |
| Selected Per–Share Data | ||||||
| Net asset value, beginning of period | $24.88 | $22.40 | $18.08 | $30.35 | $40.79 | $49.07 |
| Income from Investment Operations | ||||||
| Net investment income (loss)A | .39 | .51 | .46 | .36 | .60 | .87 |
| Net realized and unrealized gain (loss) | 1.28 | 2.45 | 4.26 | (10.13) | (4.07) | (4.74) |
| Total from investment operations | 1.67 | 2.96 | 4.72 | (9.77) | (3.47) | (3.87) |
| Distributions from net investment income | (.40) | (.49) | (.40) | (.42) | (.73) | (.97) |
| Distributions from net realized gain | – | – | – | (2.08) | (6.25) | (3.45) |
| Total distributions | (.40) | (.49) | (.40) | (2.50) | (6.98) | (4.42) |
| Redemption fees added to paid in capitalA | –B | .01 | –B | –B | .01 | .01 |
| Net asset value, end of period | $26.15 | $24.88 | $22.40 | $18.08 | $30.35 | $40.79 |
| Total ReturnC,D | 6.84% | 13.94% | 26.77% | (34.42)% | (8.69)% | (8.63)% |
| Ratios to Average Net AssetsE,F | ||||||
| Expenses before reductions | 1.00%G | 1.01% | 1.07% | 1.06% | 1.04% | 1.03% |
| Expenses net of fee waivers, if any | 1.00%G | 1.01% | 1.07% | 1.06% | 1.04% | 1.03% |
| Expenses net of all reductions | .99%G | 1.01% | 1.06% | 1.05% | 1.04% | 1.01% |
| Net investment income (loss) | 3.02%G | 2.27% | 2.47% | 1.60% | 1.86% | 2.00% |
| Supplemental Data | ||||||
| Net assets, end of period (000 omitted) | $9,764 | $8,600 | $3,825 | $1,828 | $4,531 | $5,131 |
| Portfolio turnover rateH | 58%G | 51% | 108% | 30% | 30% | 23% |
A Calculated based on average shares outstanding during the period.
B Amount represents less than $.005 per share.
C Total returns for periods of less than one year are not annualized.
D Total returns would have been lower if certain expenses had not been reduced during the applicable periods shown.
E Fees and expenses of any underlying Fidelity Central Funds are not included in the Fund's expense ratio. The Fund indirectly bears its proportionate share of the expenses of any underlying Fidelity Central Funds.
F Expense ratios reflect operating expenses of the class. Expenses before reductions do not reflect amounts reimbursed by the investment adviser or reductions from brokerage service arrangements or reductions from other expense offset arrangements and do not represent the amount paid by the class during periods when reimbursements or reductions occur. Expenses net of fee waivers reflect expenses after reimbursement by the investment adviser but prior to reductions from brokerage service arrangements or other expense offset arrangements. Expenses net of all reductions represent the net expenses paid by the class.
G Annualized
H Amount does not include the portfolio activity of any underlying Fidelity Central Funds.
See accompanying notes which are an integral part of the financial statements.
Notes to Financial Statements (Unaudited)
For the period ended April 30, 2018
1. Organization.
Fidelity Latin America Fund (the Fund) is a non-diversified fund of Fidelity Investment Trust (the Trust) and is authorized to issue an unlimited number of shares. The Trust is registered under the Investment Company Act of 1940, as amended (the 1940 Act), as an open-end management investment company organized as a Massachusetts business trust. The Fund offers Class A, Class M, Class C, Latin America and Class I shares, each of which has equal rights as to assets and voting privileges. Each class has exclusive voting rights with respect to matters that affect that class. The Fund's investments in emerging markets can be subject to social, economic, regulatory, and political uncertainties and can be extremely volatile.
2. Investments in Fidelity Central Funds.
The Fund invests in Fidelity Central Funds, which are open-end investment companies generally available only to other investment companies and accounts managed by the investment adviser and its affiliates. The Fund's Schedule of Investments lists each of the Fidelity Central Funds held as of period end, if any, as an investment of the Fund, but does not include the underlying holdings of each Fidelity Central Fund. As an Investing Fund, the Fund indirectly bears its proportionate share of the expenses of the underlying Fidelity Central Funds.
The Money Market Central Funds seek preservation of capital and current income and are managed by Fidelity Investments Money Management, Inc. (FIMM), an affiliate of the investment adviser. Annualized expenses of the Money Market Central Funds as of their most recent shareholder report date are less than .005%.
A complete unaudited list of holdings for each Fidelity Central Fund is available upon request or at the Securities and Exchange Commission (the SEC) website at www.sec.gov. In addition, the financial statements of the Fidelity Central Funds are available on the SEC website or upon request.
3. Significant Accounting Policies.
The Fund is an investment company and applies the accounting and reporting guidance of the Financial Accounting Standards Board (FASB) Accounting Standards Codification Topic 946 Financial Services – Investments Companies. The financial statements have been prepared in conformity with accounting principles generally accepted in the United States of America (GAAP), which require management to make certain estimates and assumptions at the date of the financial statements. Actual results could differ from those estimates. Subsequent events, if any, through the date that the financial statements were issued have been evaluated in the preparation of the financial statements. The following summarizes the significant accounting policies of the Fund:
Investment Valuation. Investments are valued as of 4:00 p.m. Eastern time on the last calendar day of the period. The Board of Trustees (the Board) has delegated the day to day responsibility for the valuation of the Fund's investments to the Fair Value Committee (the Committee) established by the Fund's investment adviser. In accordance with valuation policies and procedures approved by the Board, the Fund attempts to obtain prices from one or more third party pricing vendors or brokers to value its investments. When current market prices, quotations or currency exchange rates are not readily available or reliable, investments will be fair valued in good faith by the Committee, in accordance with procedures adopted by the Board. Factors used in determining fair value vary by investment type and may include market or investment specific events. The frequency with which these procedures are used cannot be predicted and they may be utilized to a significant extent. The Committee oversees the Fund's valuation policies and procedures and reports to the Board on the Committee's activities and fair value determinations. The Board monitors the appropriateness of the procedures used in valuing the Fund's investments and ratifies the fair value determinations of the Committee.
The Fund categorizes the inputs to valuation techniques used to value its investments into a disclosure hierarchy consisting of three levels as shown below:
- Level 1 – quoted prices in active markets for identical investments
- Level 2 – other significant observable inputs (including quoted prices for similar investments, interest rates, prepayment speeds, etc.)
- Level 3 – unobservable inputs (including the Fund's own assumptions based on the best information available)
Valuation techniques used to value the Fund's investments by major category are as follows:
Equity securities, including restricted securities, for which market quotations are readily available, are valued at the last reported sale price or official closing price as reported by a third party pricing vendor on the primary market or exchange on which they are traded and are categorized as Level 1 in the hierarchy. In the event there were no sales during the day or closing prices are not available, securities are valued at the last quoted bid price or may be valued using the last available price and are generally categorized as Level 2 in the hierarchy. For foreign equity securities, when market or security specific events arise, comparisons to the valuation of American Depositary Receipts (ADRs), futures contracts, Exchange-Traded Funds (ETFs) and certain indexes as well as quoted prices for similar securities may be used and would be categorized as Level 2 in the hierarchy. Utilizing these techniques may result in transfers between Level 1 and Level 2. For equity securities, including restricted securities, where observable inputs are limited, assumptions about market activity and risk are used and these securities may be categorized as Level 3 in the hierarchy.
Investments in open-end mutual funds, including the Fidelity Central Funds, are valued at their closing net asset value (NAV) each business day and are categorized as Level 1 in the hierarchy.
Changes in valuation techniques may result in transfers in or out of an assigned level within the disclosure hierarchy. The aggregate value of investments by input level as of April 30, 2018 is included at the end of the Fund's Schedule of Investments.
Foreign Currency. The Fund may use foreign currency contracts to facilitate transactions in foreign-denominated securities. Gains and losses from these transactions may arise from changes in the value of the foreign currency or if the counterparties do not perform under the contracts' terms.
Foreign-denominated assets, including investment securities, and liabilities are translated into U.S. dollars at the exchange rates at period end. Purchases and sales of investment securities, income and dividends received and expenses denominated in foreign currencies are translated into U.S. dollars at the exchange rate in effect on the transaction date.
The effects of exchange rate fluctuations on investments are included with the net realized and unrealized gain (loss) on investment securities. Other foreign currency transactions resulting in realized and unrealized gain (loss) are disclosed separately.
Investment Transactions and Income. For financial reporting purposes, the Fund's investment holdings and NAV include trades executed through the end of the last business day of the period. The NAV per share for processing shareholder transactions is calculated as of the close of business of the New York Stock Exchange (NYSE), normally 4:00 p.m. Eastern time and includes trades executed through the end of the prior business day. Gains and losses on securities sold are determined on the basis of identified cost. Dividend income is recorded on the ex-dividend date, except for certain dividends from foreign securities where the ex-dividend date may have passed, which are recorded as soon as the Fund is informed of the ex-dividend date. Non-cash dividends included in dividend income, if any, are recorded at the fair market value of the securities received. Income and capital gain distributions from Fidelity Central Funds, if any, are recorded on the ex-dividend date. Certain distributions received by the Fund represent a return of capital or capital gain. The Fund determines the components of these distributions subsequent to the ex-dividend date, based upon receipt of tax filings or other correspondence relating to the underlying investment. These distributions are recorded as a reduction of cost of investments and/or as a realized gain. Investment income is recorded net of foreign taxes withheld where recovery of such taxes is uncertain.
Class Allocations and Expenses. Investment income, realized and unrealized capital gains and losses, common expenses of the Fund, and certain fund-level expense reductions, if any, are allocated daily on a pro-rata basis to each class based on the relative net assets of each class to the total net assets of the Fund. Each class differs with respect to transfer agent and distribution and service plan fees incurred. Certain expense reductions may also differ by class. For the reporting period, the allocated portion of income and expenses to each class as a percent of its average net assets may vary due to the timing of recording these transactions in relation to fluctuating net assets of the classes. Expenses directly attributable to a fund are charged to that fund. Expenses attributable to more than one fund are allocated among the respective funds on the basis of relative net assets or other appropriate methods. Expense estimates are accrued in the period to which they relate and adjustments are made when actual amounts are known.
Income Tax Information and Distributions to Shareholders. Each year, the Fund intends to qualify as a regulated investment company under Subchapter M of the Internal Revenue Code, including distributing substantially all of its taxable income and realized gains. As a result, no provision for U.S. Federal income taxes is required. The Fund files a U.S. federal tax return, in addition to state and local tax returns as required. The Fund's federal income tax returns are subject to examination by the Internal Revenue Service (IRS) for a period of three fiscal years after they are filed. State and local tax returns may be subject to examination for an additional fiscal year depending on the jurisdiction. Foreign taxes are provided for based on the Fund's understanding of the tax rules and rates that exist in the foreign markets in which it invests.
Distributions are declared and recorded on the ex-dividend date. Income and capital gain distributions are declared separately for each class. Income and capital gain distributions are determined in accordance with income tax regulations, which may differ from GAAP.
Capital accounts within the financial statements are adjusted for permanent book-tax differences. These adjustments have no impact on net assets or the results of operations. Capital accounts are not adjusted for temporary book-tax differences which will reverse in a subsequent period.
Book-tax differences are primarily due to foreign currency transactions, passive foreign investment companies (PFIC), capital loss carryforwards, deferred trustees compensation, and losses deferred due to wash sales.
As of period end, the cost and unrealized appreciation (depreciation) in securities, and derivatives if applicable, for federal income tax purposes were as follows:
| Gross unrealized appreciation | $208,271,963 |
| Gross unrealized depreciation | (19,845,588) |
| Net unrealized appreciation (depreciation) | $188,426,375 |
| Tax cost | $469,921,310 |
Capital loss carryforwards are only available to offset future capital gains of the Fund to the extent provided by regulations and may be limited. Under the Regulated Investment Company Modernization Act of 2010 (the Act), the Fund is permitted to carry forward capital losses incurred in taxable years beginning after December 22, 2010 for an unlimited period and such capital losses are required to be used prior to any losses that expire. The capital loss carryforward information presented below, including any applicable limitation, is estimated as of prior fiscal period end and is subject to adjustment.
| No expiration | |
| Short-term | $(41,534,225) |
| Long-term | (100,189,560) |
| Total capital loss carryforward | $(141,723,785) |
Short-Term Trading (Redemption) Fees. Shares held by investors in the Fund less than 90 days may have been subject to a redemption fee equal to 1.50% of the NAV of shares redeemed. All redemption fees, which reduce the proceeds of the shareholder redemption, are retained by the Fund and accounted for as an addition to paid in capital. In November 2017, the Board of Trustees approved the elimination of these redemption fees effective December 18, 2017.
Restricted Securities. The Fund may invest in securities that are subject to legal or contractual restrictions on resale. These securities generally may be resold in transactions exempt from registration or to the public if the securities are registered. Disposal of these securities may involve time-consuming negotiations and expense, and prompt sale at an acceptable price may be difficult. Information regarding restricted securities is included at the end of the Fund's Schedule of Investments.
4. Purchases and Sales of Investments.
Purchases and sales of securities, other than short-term securities, aggregated $183,315,402 and $193,523,070, respectively.
5. Fees and Other Transactions with Affiliates.
Management Fee. Fidelity Management & Research Company (the investment adviser) and its affiliates provide the Fund with investment management related services for which the Fund pays a monthly management fee. The management fee is the sum of an individual fund fee rate that is based on an annual rate of .45% of the Fund's average net assets and an annualized group fee rate that averaged .24% during the period. The group fee rate is based upon the average net assets of all the mutual funds advised by the investment adviser, including any mutual funds previously advised by the investment adviser that are currently advised by Fidelity SelectCo, LLC, an affiliate of the investment adviser. The group fee rate decreases as assets under management increase and increases as assets under management decrease. For the reporting period, the total annualized management fee rate was .69% of the Fund's average net assets.
Distribution and Service Plan Fees. In accordance with Rule 12b-1 of the 1940 Act, the Fund has adopted separate Distribution and Service Plans for each class of shares. Certain classes pay Fidelity Distributors Corporation (FDC), an affiliate of the investment adviser, separate Distribution and Service Fees, each of which is based on an annual percentage of each class' average net assets. In addition, FDC may pay financial intermediaries for selling shares of the Fund and providing shareholder support services. For the period, the Distribution and Service Fee rates, total fees and amounts retained by FDC were as follows:
| Distribution Fee | Service Fee | Total Fees | Retained by FDC | |
| Class A | -% | .25% | $23,015 | $513 |
| Class M | .25% | .25% | 17,330 | 292 |
| Class C | .75% | .25% | 25,575 | 1,879 |
| $65,920 | $2,684 |
Sales Load. FDC may receive a front-end sales charge of up to 5.75% for selling Class A shares and 3.50% for selling Class M shares, some of which is paid to financial intermediaries for selling shares of the Fund. Depending on the holding period, FDC may receive contingent deferred sales charges levied on Class A, Class M and Class C redemptions. The deferred sales charges are 1.00% for Class C shares, 1.00% for certain purchases of Class A shares and .25% for certain purchases of Class M shares.
For the period, sales charge amounts retained by FDC were as follows:
| Retained by FDC | |
| Class A | $4,751 |
| Class M | 947 |
| Class C(a) | 518 |
| $6,216 |
(a) When Class C shares are initially sold, FDC pays commissions from its own resources to financial intermediaries through which the sales are made.
Transfer Agent Fees. Fidelity Investments Institutional Operations Company, Inc., (FIIOC), an affiliate of the investment adviser, is the transfer, dividend disbursing and shareholder servicing agent for each class of the Fund. FIIOC receives account fees and asset-based fees that vary according to the account size and type of account of the shareholders of the respective classes of the Fund. FIIOC pays for typesetting, printing and mailing of shareholder reports, except proxy statements.
For the period, transfer agent fees for each class were as follows:
| Amount | % of Class-Level Average Net Assets(a) | |
| Class A | $27,775 | .30 |
| Class M | 11,322 | .33 |
| Class C | 7,734 | .30 |
| Latin America | 692,592 | .23 |
| Class I | 7,614 | .18 |
| $747,037 |
(a) Annualized
Accounting and Security Lending Fees. Fidelity Service Company, Inc. (FSC), an affiliate of the investment adviser, maintains the Fund's accounting records. The accounting fee is based on the level of average net assets for each month. Under a separate contract, FSC administers the security lending program. The security lending fee is based on the number and duration of lending transactions. For the period, the fees were equivalent to an annualized rate of .05%.
Brokerage Commissions. The Fund placed a portion of its portfolio transactions with brokerage firms which are affiliates of the investment adviser. Brokerage commissions are included in net realized gain (loss) and change in net unrealized appreciation (depreciation) in the Statement of Operations. The commissions paid to these affiliated firms were $807 for the period.
Interfund Trades. The Fund may purchase from or sell securities to other Fidelity Funds under procedures adopted by the Board. The procedures have been designed to ensure these interfund trades are executed in accordance with Rule 17a-7 of the 1940 Act. Interfund trades are included within the respective purchases and sales amounts shown in the Purchases and Sales of Investments note.
6. Committed Line of Credit.
The Fund participates with other funds managed by the investment adviser or an affiliate in a $4.25 billion credit facility (the "line of credit") to be utilized for temporary or emergency purposes to fund shareholder redemptions or for other short-term liquidity purposes. The Fund has agreed to pay commitment fees on its pro-rata portion of the line of credit, which amounted to $927 and is reflected in Miscellaneous expenses on the Statement of Operations. During the period, the Fund did not borrow on this line of credit.
7. Security Lending.
The Fund lends portfolio securities through a lending agent from time to time in order to earn additional income. For equity securities, a lending agent is used and may loan securities to certain qualified borrowers, including Fidelity Capital Markets (FCM), a broker-dealer affiliated with the Fund. On the settlement date of the loan, the Fund receives collateral (in the form of U.S. Treasury obligations, letters of credit and/or cash) against the loaned securities and maintains collateral in an amount not less than 100% of the market value of the loaned securities during the period of the loan. The market value of the loaned securities is determined at the close of business of the Fund and any additional required collateral is delivered to the Fund on the next business day. The Fund or borrower may terminate the loan at any time, and if the borrower defaults on its obligation to return the securities loaned because of insolvency or other reasons, the Fund may apply collateral received from the borrower against the obligation. The Fund may experience delays and costs in recovering the securities loaned. Any cash collateral received is invested in the Fidelity Securities Lending Cash Central Fund. At period end, there were no security loans outstanding. Security lending income represents the income earned on investing cash collateral, less rebates paid to borrowers and any lending agent fees associated with the loan, plus any premium payments received for lending certain types of securities. Security lending income is presented in the Statement of Operations as a component of income from Fidelity Central Funds. Total security lending income during the period amounted to $46. During the period, there were no securities loaned to FCM.
8. Expense Reductions.
Commissions paid to certain brokers with whom the investment adviser, or its affiliates, places trades on behalf of the Fund include an amount in addition to trade execution, which may be rebated back to the Fund to offset certain expenses. This amount totaled $41,433 for the period.
In addition, during the period the investment adviser reimbursed and/or waived a portion of fund-level operating expenses in the amount of $2,997.
9. Distributions to Shareholders.
Distributions to shareholders of each class were as follows:
| Six months ended April 30, 2018 | Year ended October 31, 2017 | |
| From net investment income | ||
| Class A | $203,267 | $361,857 |
| Class M | 60,223 | 112,037 |
| Class C | 19,813 | 77,689 |
| Latin America | 8,592,965 | 12,063,200 |
| Class I | 129,478 | 82,524 |
| Total | $9,005,746 | $12,697,307 |
10. Share Transactions.
Share transactions for each class were as follows and may contain automatic conversions between classes or exchanges between affiliated funds:
| Shares | Shares | Dollars | Dollars | |
| Six months ended April 30, 2018 | Year ended October 31, 2017 | Six months ended April 30, 2018 | Year ended October 31, 2017 | |
| Class A | ||||
| Shares sold | 91,891 | 139,205 | $2,454,959 | $3,031,500 |
| Reinvestment of distributions | 8,149 | 18,202 | 198,340 | 345,275 |
| Shares redeemed | (77,802) | (294,686) | (2,019,503) | (6,569,414) |
| Net increase (decrease) | 22,238 | (137,279) | $633,796 | $(3,192,639) |
| Class M | ||||
| Shares sold | 24,849 | 33,689 | $666,207 | $739,767 |
| Reinvestment of distributions | 2,445 | 5,687 | 59,769 | 108,338 |
| Shares redeemed | (28,380) | (97,619) | (736,451) | (2,073,277) |
| Net increase (decrease) | (1,086) | (58,243) | $(10,475) | $(1,225,172) |
| Class C | ||||
| Shares sold | 23,762 | 20,475 | $646,189 | $450,205 |
| Reinvestment of distributions | 727 | 3,179 | 18,055 | 61,288 |
| Shares redeemed | (38,241) | (112,274) | (1,030,400) | (2,414,306) |
| Net increase (decrease) | (13,752) | (88,620) | $(366,156) | $(1,902,813) |
| Latin America | ||||
| Shares sold | 2,575,380 | 5,339,360 | $68,165,303 | $120,661,935 |
| Reinvestment of distributions | 339,440 | 610,988 | 8,218,379 | 11,542,194 |
| Shares redeemed | (3,762,655) | (8,575,067) | (96,297,058) | (185,420,867) |
| Net increase (decrease) | (847,835) | (2,624,719) | $(19,913,376) | $(53,216,738) |
| Class I | ||||
| Shares sold | 134,528 | 265,874 | $3,501,560 | $6,186,180 |
| Reinvestment of distributions | 4,501 | 3,896 | 108,773 | 73,478 |
| Shares redeemed | (111,281) | (94,860) | (2,842,008) | (2,127,918) |
| Net increase (decrease) | 27,748 | 174,910 | $768,325 | $4,131,740 |
11. Other.
The Fund's organizational documents provide former and current trustees and officers with a limited indemnification against liabilities arising in connection with the performance of their duties to the Fund. In the normal course of business, the Fund may also enter into contracts that provide general indemnifications. The Fund's maximum exposure under these arrangements is unknown as this would be dependent on future claims that may be made against the Fund. The risk of material loss from such claims is considered remote.
Fidelity® Nordic Fund
Investment Summary (Unaudited)
Geographic Diversification (% of fund's net assets)
| As of April 30, 2018 | ||
| Sweden | 57.0% | |
| Finland | 12.8% | |
| Norway | 10.3% | |
| Malta | 5.6% | |
| Denmark | 5.2% | |
| United States of America* | 3.9% | |
| Bermuda | 3.4% | |
| Canada | 1.8% | |

* Includes Short-Term investments and Net Other Assets (Liabilities).
Percentages are based on country or territory of incorporation and are adjusted for the effect of futures contracts, if applicable.
Asset Allocation as of April 30, 2018
| % of fund's net assets | |
| Stocks | 98.8 |
| Short-Term Investments and Net Other Assets (Liabilities) | 1.2 |
Top Ten Stocks as of April 30, 2018
| % of fund's net assets | |
| Kambi Group PLC (Malta, Hotels, Restaurants & Leisure) | 5.6 |
| Getinge AB (B Shares) (Sweden, Health Care Equipment & Supplies) | 4.8 |
| Arjo AB (Sweden, Health Care Equipment & Supplies) | 4.6 |
| Eltel AB (Sweden, Construction & Engineering) | 4.5 |
| Investor AB (B Shares) (Sweden, Diversified Financial Services) | 4.3 |
| AddTech AB (B Shares) (Sweden, Trading Companies & Distributors) | 4.1 |
| Essity AB Class B (Sweden, Household Products) | 3.8 |
| Securitas AB (B Shares) (Sweden, Commercial Services & Supplies) | 3.6 |
| AF AB (B Shares) (Sweden, Professional Services) | 3.6 |
| Nokian Tyres PLC (Finland, Auto Components) | 3.5 |
| 42.4 |
Top Market Sectors as of April 30, 2018
| % of fund's net assets | |
| Industrials | 35.6 |
| Consumer Discretionary | 24.6 |
| Health Care | 13.4 |
| Consumer Staples | 9.9 |
| Financials | 9.9 |
| Information Technology | 3.6 |
| Materials | 1.8 |
Market Sectors may include more than one industry category.
The Fund may invest up to 35% of its total assets in any industry that represents more than 20% of the Nordic market. As of April 30, 2018, the Fund did not have more than 25% of its total assets invested in any one industry.
Fidelity® Nordic Fund
Schedule of Investments April 30, 2018 (Unaudited)
Showing Percentage of Net Assets
| Common Stocks - 98.8% | |||
| Shares | Value | ||
| Bermuda - 3.4% | |||
| Vostok Emerging Finance Ltd. (depository receipt) (a) | 9,489,995 | $2,124,145 | |
| Vostok New Ventures Ltd. (depositary receipt) (a) | 1,015,554 | 8,512,578 | |
| TOTAL BERMUDA | 10,636,723 | ||
| Canada - 1.8% | |||
| Lundin Mining Corp. (Sweden) | 907,900 | 5,821,700 | |
| Denmark - 5.2% | |||
| A.P. Moller - Maersk A/S Series B | 5,674 | 9,156,093 | |
| SimCorp A/S | 98,700 | 7,186,093 | |
| TOTAL DENMARK | 16,342,186 | ||
| Finland - 12.8% | |||
| Caverion Corp. (a)(b) | 1,301,700 | 10,901,355 | |
| Kamux Corp. (b) | 1,100,000 | 8,528,071 | |
| Nokian Tyres PLC | 276,200 | 11,090,176 | |
| Olvi PLC (A Shares) | 289,146 | 9,707,001 | |
| TOTAL FINLAND | 40,226,603 | ||
| Malta - 5.6% | |||
| Kambi Group PLC (a)(b) | 1,462,611 | 17,538,002 | |
| Norway - 10.3% | |||
| Schibsted ASA: | |||
| (A Shares) | 311,400 | 9,106,421 | |
| (B Shares) | 262,847 | 7,077,141 | |
| Skandiabanken ASA (c) | 755,400 | 6,826,783 | |
| Zalaris ASA (A Shares) (d) | 1,688,300 | 9,259,838 | |
| TOTAL NORWAY | 32,270,183 | ||
| Sweden - 57.0% | |||
| AcadeMedia AB (a)(c) | 954,143 | 6,352,491 | |
| Addlife AB | 227,375 | 4,764,757 | |
| AddTech AB (B Shares) | 623,800 | 13,007,929 | |
| AF AB (B Shares) | 545,300 | 11,377,217 | |
| Alimak Group AB (c) | 628,300 | 9,313,304 | |
| Arjo AB | 4,870,800 | 14,378,807 | |
| Coor Service Management Holding AB | 565,300 | 3,931,500 | |
| Eltel AB (a)(b)(c) | 4,842,050 | 14,000,869 | |
| Essity AB Class B | 461,700 | 11,757,818 | |
| Getinge AB (B Shares) (b) | 1,609,400 | 15,008,434 | |
| Investor AB (B Shares) | 307,650 | 13,459,567 | |
| Lagercrantz Group AB (B Shares) | 447,800 | 4,213,794 | |
| Medicover AB Class B | 1,000,000 | 7,811,206 | |
| Momentum Group AB Class B | 791,369 | 8,901,789 | |
| Nobia AB (b) | 1,156,600 | 9,126,899 | |
| Saab AB (B Shares) (b) | 39,400 | 1,617,548 | |
| Scandi Standard | 882,800 | 6,058,970 | |
| Securitas AB (B Shares) (b) | 702,300 | 11,388,670 | |
| Swedish Match Co. AB | 76,600 | 3,446,569 | |
| Systemair AB | 698,679 | 9,239,495 | |
| TOTAL SWEDEN | 179,157,633 | ||
| United States of America - 2.7% | |||
| Autoliv, Inc. (depositary receipt) | 63,700 | 8,642,072 | |
| TOTAL COMMON STOCKS | |||
| (Cost $300,404,674) | 310,635,102 | ||
| Money Market Funds - 6.7% | |||
| Fidelity Cash Central Fund, 1.74% (e) | 5,083,916 | 5,084,933 | |
| Fidelity Securities Lending Cash Central Fund 1.74% (e)(f) | 15,921,070 | 15,922,663 | |
| TOTAL MONEY MARKET FUNDS | |||
| (Cost $21,007,596) | 21,007,596 | ||
| TOTAL INVESTMENT IN SECURITIES - 105.5% | |||
| (Cost $321,412,270) | 331,642,698 | ||
| NET OTHER ASSETS (LIABILITIES) - (5.5)% | (17,355,515) | ||
| NET ASSETS - 100% | $314,287,183 |
Categorizations in the Schedule of Investments are based on country or territory of incorporation.
Legend
(a) Non-income producing
(b) Security or a portion of the security is on loan at period end.
(c) Security exempt from registration under Rule 144A of the Securities Act of 1933. These securities may be resold in transactions exempt from registration, normally to qualified institutional buyers. At the end of the period, the value of these securities amounted to $36,493,447 or 11.6% of net assets.
(d) Affiliated company
(e) Affiliated fund that is generally available only to investment companies and other accounts managed by Fidelity Investments. The rate quoted is the annualized seven-day yield of the fund at period end. A complete unaudited listing of the fund's holdings as of its most recent quarter end is available upon request. In addition, each Fidelity Central Fund's financial statements are available on the SEC's website or upon request.
(f) Investment made with cash collateral received from securities on loan.
Affiliated Central Funds
Information regarding fiscal year to date income earned by the Fund from investments in Fidelity Central Funds is as follows:
| Fund | Income earned |
| Fidelity Cash Central Fund | $34,891 |
| Fidelity Securities Lending Cash Central Fund | 166,481 |
| Total | $201,372 |
Amounts in the income column in the above table include any capital gain distributions from underlying funds, which are presented in the corresponding line-item in the Statement of Operations if applicable.
Other Affiliated Issuers
An affiliated company is a company in which the Fund has ownership of at least 5% of the voting securities. Fiscal year to date transactions with companies which are or were affiliates are as follows:
| Affiliate | Value, beginning of period | Purchases | Sales Proceeds | Dividend Income | Realized Gain (loss) | Change in Unrealized appreciation (depreciation) | Value, end of period |
| Zalaris ASA (A Shares) | $10,024,798 | $-- | $-- | $-- | $-- | $(764,960) | $9,259,838 |
| Total | $10,024,798 | $-- | $-- | $-- | $-- | $(764,960) | $9,259,838 |
Investment Valuation
All investments are categorized as Level 1 under the Fair Value Hierarchy. The inputs or methodology used for valuing securities may not be an indication of the risk associated with investing in those securities. For more information on valuation inputs please refer to the Investment Valuation section in the accompanying Notes to Financial Statements.
See accompanying notes which are an integral part of the financial statements.
Fidelity® Nordic Fund
Financial Statements
Statement of Assets and Liabilities
| April 30, 2018 (Unaudited) | ||
| Assets | ||
| Investment in securities, at value (including securities loaned of $14,844,983) — See accompanying schedule: Unaffiliated issuers (cost $293,879,073) | $301,375,264 | |
| Fidelity Central Funds (cost $21,007,596) | 21,007,596 | |
| Other affiliated issuers (cost $6,525,601) | 9,259,838 | |
| Total Investment in Securities (cost $321,412,270) | $331,642,698 | |
| Foreign currency held at value (cost $423,932) | 423,932 | |
| Receivable for fund shares sold | 29,810 | |
| Dividends receivable | 1,351,007 | |
| Distributions receivable from Fidelity Central Funds | 91,147 | |
| Prepaid expenses | 200 | |
| Other receivables | 11,287 | |
| Total assets | 333,550,081 | |
| Liabilities | ||
| Payable for investments purchased | $2,701,745 | |
| Payable for fund shares redeemed | 344,977 | |
| Accrued management fee | 184,674 | |
| Other affiliated payables | 65,549 | |
| Other payables and accrued expenses | 44,941 | |
| Collateral on securities loaned | 15,921,012 | |
| Total liabilities | 19,262,898 | |
| Net Assets | $314,287,183 | |
| Net Assets consist of: | ||
| Paid in capital | $286,348,438 | |
| Undistributed net investment income | 1,912,423 | |
| Accumulated undistributed net realized gain (loss) on investments and foreign currency transactions | 15,770,627 | |
| Net unrealized appreciation (depreciation) on investments and assets and liabilities in foreign currencies | 10,255,695 | |
| Net Assets, for 6,289,483 shares outstanding | $314,287,183 | |
| Net Asset Value, offering price and redemption price per share ($314,287,183 ÷ 6,289,483 shares) | $49.97 |
See accompanying notes which are an integral part of the financial statements.
Statement of Operations
| Six months ended April 30, 2018 (Unaudited) | ||
| Investment Income | ||
| Dividends | $3,965,766 | |
| Income from Fidelity Central Funds | 201,372 | |
| Income before foreign taxes withheld | 4,167,138 | |
| Less foreign taxes withheld | (589,349) | |
| Total income | 3,577,789 | |
| Expenses | ||
| Management fee | $1,184,974 | |
| Transfer agent fees | 313,649 | |
| Accounting and security lending fees | 89,746 | |
| Custodian fees and expenses | 19,717 | |
| Independent trustees' fees and expenses | 701 | |
| Registration fees | 11,394 | |
| Audit | 34,742 | |
| Legal | 708 | |
| Miscellaneous | 5,456 | |
| Total expenses before reductions | 1,661,087 | |
| Expense reductions | (1,706) | 1,659,381 |
| Net investment income (loss) | 1,918,408 | |
| Realized and Unrealized Gain (Loss) | ||
| Net realized gain (loss) on: | ||
| Investment securities: | ||
| Unaffiliated issuers | 23,782,219 | |
| Fidelity Central Funds | (647) | |
| Foreign currency transactions | (55,975) | |
| Total net realized gain (loss) | 23,725,597 | |
| Change in net unrealized appreciation (depreciation) on: | ||
| Investment securities: | ||
| Unaffiliated issuers | (38,242,877) | |
| Fidelity Central Funds | 629 | |
| Other affiliated issuers | (764,960) | |
| Assets and liabilities in foreign currencies | 21,378 | |
| Total change in net unrealized appreciation (depreciation) | (38,985,830) | |
| Net gain (loss) | (15,260,233) | |
| Net increase (decrease) in net assets resulting from operations | $(13,341,825) |
See accompanying notes which are an integral part of the financial statements.
Statement of Changes in Net Assets
| Six months ended April 30, 2018 (Unaudited) | Year ended October 31, 2017 | |
| Increase (Decrease) in Net Assets | ||
| Operations | ||
| Net investment income (loss) | $1,918,408 | $3,849,788 |
| Net realized gain (loss) | 23,725,597 | 35,196,984 |
| Change in net unrealized appreciation (depreciation) | (38,985,830) | 31,563,051 |
| Net increase (decrease) in net assets resulting from operations | (13,341,825) | 70,609,823 |
| Distributions to shareholders from net investment income | (3,195,664) | (5,594,124) |
| Distributions to shareholders from net realized gain | (10,563,439) | (1,032,760) |
| Total distributions | (13,759,103) | (6,626,884) |
| Share transactions | ||
| Proceeds from sales of shares | 10,474,561 | 37,566,439 |
| Reinvestment of distributions | 12,909,432 | 6,272,273 |
| Cost of shares redeemed | (58,790,817) | (161,114,580) |
| Net increase (decrease) in net assets resulting from share transactions | (35,406,824) | (117,275,868) |
| Redemption fees | 47,618 | 20,284 |
| Total increase (decrease) in net assets | (62,460,134) | (53,272,645) |
| Net Assets | ||
| Beginning of period | 376,747,317 | 430,019,962 |
| End of period | $314,287,183 | $376,747,317 |
| Other Information | ||
| Undistributed net investment income end of period | $1,912,423 | $3,189,679 |
| Shares | ||
| Sold | 194,320 | 749,494 |
| Issued in reinvestment of distributions | 250,523 | 144,389 |
| Redeemed | (1,088,602) | (3,458,044) |
| Net increase (decrease) | (643,759) | (2,564,161) |
See accompanying notes which are an integral part of the financial statements.
Financial Highlights
Fidelity Nordic Fund
| Six months ended (Unaudited) April 30, | Years endedOctober 31, | |||||
| 2018 | 2017 | 2016 | 2015 | 2014 | 2013 | |
| Selected Per–Share Data | ||||||
| Net asset value, beginning of period | $54.34 | $45.28 | $44.99 | $43.36 | $43.91 | $30.60 |
| Income from Investment Operations | ||||||
| Net investment income (loss)A | .30 | .51 | .64 | .56 | .71 | .90 |
| Net realized and unrealized gain (loss) | (2.51) | 9.32 | .27 | 1.06 | 1.35 | 13.04 |
| Total from investment operations | (2.21) | 9.83 | .91 | 1.62 | 2.06 | 13.94 |
| Distributions from net investment income | (.50) | (.65) | (.57) | – | (.83) | (.63) |
| Distributions from net realized gain | (1.67) | (.12) | (.05) | – | (1.80) | – |
| Total distributions | (2.17) | (.77) | (.62) | – | (2.63) | (.63) |
| Redemption fees added to paid in capitalA | .01 | –B | –B | .01 | .02 | –B |
| Net asset value, end of period | $49.97 | $54.34 | $45.28 | $44.99 | $43.36 | $43.91 |
| Total ReturnC,D | (4.17)% | 22.14% | 1.97% | 3.76% | 4.88% | 46.42% |
| Ratios to Average Net AssetsE,F | ||||||
| Expenses before reductions | .97%G | .99% | .99% | 1.00% | .99% | 1.04% |
| Expenses net of fee waivers, if any | .97%G | .99% | .98% | 1.00% | .99% | 1.04% |
| Expenses net of all reductions | .97%G | .96% | .98% | .99% | .98% | 1.02% |
| Net investment income (loss) | 1.12%G | 1.04% | 1.37% | 1.26% | 1.56% | 2.50% |
| Supplemental Data | ||||||
| Net assets, end of period (000 omitted) | $314,287 | $376,747 | $430,020 | $405,726 | $487,582 | $439,147 |
| Portfolio turnover rateH | 38%G | 69% | 63% | 80% | 103% | 61% |
A Calculated based on average shares outstanding during the period.
B Amount represents less than $.005 per share.
C Total returns for periods of less than one year are not annualized.
D Total returns would have been lower if certain expenses had not been reduced during the applicable periods shown.
E Fees and expenses of any underlying Fidelity Central Funds are not included in the Fund's expense ratio. The Fund indirectly bears its proportionate share of the expenses of any underlying Fidelity Central Funds.
F Expense ratios reflect operating expenses of the Fund. Expenses before reductions do not reflect amounts reimbursed by the investment adviser or reductions from brokerage service arrangements or reductions from other expense offset arrangements and do not represent the amount paid by the Fund during periods when reimbursements or reductions occur. Expenses net of fee waivers reflect expenses after reimbursement by the investment adviser but prior to reductions from brokerage service arrangements or other expense offset arrangements. Expenses net of all reductions represent the net expenses paid by the Fund.
G Annualized
H Amount does not include the portfolio activity of any underlying Fidelity Central Funds.
See accompanying notes which are an integral part of the financial statements.
Notes to Financial Statements (Unaudited)
For the period ended April 30, 2018
1. Organization.
Fidelity Nordic Fund (the Fund) is a fund of Fidelity Investment Trust (the Trust) and is authorized to issue an unlimited number of shares. Share transactions on the Statement of Changes in Net Assets may contain exchanges between affiliated funds. The Trust is registered under the Investment Company Act of 1940, as amended (the 1940 Act), as an open-end management investment company organized as a Massachusetts business trust.
2. Investments in Fidelity Central Funds.
The Fund invests in Fidelity Central Funds, which are open-end investment companies generally available only to other investment companies and accounts managed by the investment adviser and its affiliates. The Fund's Schedule of Investments lists each of the Fidelity Central Funds held as of period end, if any, as an investment of the Fund, but does not include the underlying holdings of each Fidelity Central Fund. As an Investing Fund, the Fund indirectly bears its proportionate share of the expenses of the underlying Fidelity Central Funds.
The Money Market Central Funds seek preservation of capital and current income and are managed by Fidelity Investments Money Management, Inc. (FIMM), an affiliate of the investment adviser. Annualized expenses of the Money Market Central Funds as of their most recent shareholder report date are less than .005%.
A complete unaudited list of holdings for each Fidelity Central Fund is available upon request or at the Securities and Exchange Commission (the SEC) website at www.sec.gov. In addition, the financial statements of the Fidelity Central Funds are available on the SEC website or upon request.
3. Significant Accounting Policies.
The Fund is an investment company and applies the accounting and reporting guidance of the Financial Accounting Standards Board (FASB) Accounting Standards Codification Topic 946 Financial Services – Investments Companies. The financial statements have been prepared in conformity with accounting principles generally accepted in the United States of America (GAAP), which require management to make certain estimates and assumptions at the date of the financial statements. Actual results could differ from those estimates. Subsequent events, if any, through the date that the financial statements were issued have been evaluated in the preparation of the financial statements. The following summarizes the significant accounting policies of the Fund:
Investment Valuation. Investments are valued as of 4:00 p.m. Eastern time on the last calendar day of the period. The Board of Trustees (the Board) has delegated the day to day responsibility for the valuation of the Fund's investments to the Fair Value Committee (the Committee) established by the Fund's investment adviser. In accordance with valuation policies and procedures approved by the Board, the Fund attempts to obtain prices from one or more third party pricing vendors or brokers to value its investments. When current market prices, quotations or currency exchange rates are not readily available or reliable, investments will be fair valued in good faith by the Committee, in accordance with procedures adopted by the Board. Factors used in determining fair value vary by investment type and may include market or investment specific events. The frequency with which these procedures are used cannot be predicted and they may be utilized to a significant extent. The Committee oversees the Fund's valuation policies and procedures and reports to the Board on the Committee's activities and fair value determinations. The Board monitors the appropriateness of the procedures used in valuing the Fund's investments and ratifies the fair value determinations of the Committee.
The Fund categorizes the inputs to valuation techniques used to value its investments into a disclosure hierarchy consisting of three levels as shown below:
- Level 1 – quoted prices in active markets for identical investments
- Level 2 – other significant observable inputs (including quoted prices for similar investments, interest rates, prepayment speeds, etc.)
- Level 3 – unobservable inputs (including the Fund's own assumptions based on the best information available)
Valuation techniques used to value the Fund's investments by major category are as follows:
Equity securities, including restricted securities, for which market quotations are readily available, are valued at the last reported sale price or official closing price as reported by a third party pricing vendor on the primary market or exchange on which they are traded and are categorized as Level 1 in the hierarchy. In the event there were no sales during the day or closing prices are not available, securities are valued at the last quoted bid price or may be valued using the last available price and are generally categorized as Level 2 in the hierarchy. For foreign equity securities, when market or security specific events arise, comparisons to the valuation of American Depositary Receipts (ADRs), futures contracts, Exchange-Traded Funds (ETFs) and certain indexes as well as quoted prices for similar securities may be used and would be categorized as Level 2 in the hierarchy. Utilizing these techniques may result in transfers between Level 1 and Level 2. For equity securities, including restricted securities, where observable inputs are limited, assumptions about market activity and risk are used and these securities may be categorized as Level 3 in the hierarchy.
Investments in open-end mutual funds, including the Fidelity Central Funds, are valued at their closing net asset value (NAV) each business day and are categorized as Level 1 in the hierarchy.
Changes in valuation techniques may result in transfers in or out of an assigned level within the disclosure hierarchy. The aggregate value of investments by input level as of April 30, 2018, is included at the end of the Fund's Schedule of Investments.
Foreign Currency. The Fund may use foreign currency contracts to facilitate transactions in foreign-denominated securities. Gains and losses from these transactions may arise from changes in the value of the foreign currency or if the counterparties do not perform under the contracts' terms.
Foreign-denominated assets, including investment securities, and liabilities are translated into U.S. dollars at the exchange rates at period end. Purchases and sales of investment securities, income and dividends received and expenses denominated in foreign currencies are translated into U.S. dollars at the exchange rate in effect on the transaction date.
The effects of exchange rate fluctuations on investments are included with the net realized and unrealized gain (loss) on investment securities. Other foreign currency transactions resulting in realized and unrealized gain (loss) are disclosed separately.
Investment Transactions and Income. For financial reporting purposes, the Fund's investment holdings and NAV include trades executed through the end of the last business day of the period. The NAV per share for processing shareholder transactions is calculated as of the close of business of the New York Stock Exchange (NYSE), normally 4:00 p.m. Eastern time and includes trades executed through the end of the prior business day. Gains and losses on securities sold are determined on the basis of identified cost. Dividend income is recorded on the ex-dividend date, except for certain dividends from foreign securities where the ex-dividend date may have passed, which are recorded as soon as the Fund is informed of the ex-dividend date. Non-cash dividends included in dividend income, if any, are recorded at the fair market value of the securities received. Income and capital gain distributions from Fidelity Central Funds, if any, are recorded on the ex-dividend date. Investment income is recorded net of foreign taxes withheld where recovery of such taxes is uncertain.
Expenses. Expenses directly attributable to a fund are charged to that fund. Expenses attributable to more than one fund are allocated among the respective funds on the basis of relative net assets or other appropriate methods. Expense estimates are accrued in the period to which they relate and adjustments are made when actual amounts are known.
Income Tax Information and Distributions to Shareholders. Each year, the Fund intends to qualify as a regulated investment company under Subchapter M of the Internal Revenue Code, including distributing substantially all of its taxable income and realized gains. As a result, no provision for U.S. Federal income taxes is required. The Fund files a U.S. federal tax return, in addition to state and local tax returns as required. The Fund's federal income tax returns are subject to examination by the Internal Revenue Service (IRS) for a period of three fiscal years after they are filed. State and local tax returns may be subject to examination for an additional fiscal year depending on the jurisdiction. Foreign taxes are provided for based on the Fund's understanding of the tax rules and rates that exist in the foreign markets in which it invests.
Distributions are declared and recorded on the ex-dividend date. Income and capital gain distributions are determined in accordance with income tax regulations, which may differ from GAAP.
Capital accounts within the financial statements are adjusted for permanent book-tax differences. These adjustments have no impact on net assets or the results of operations. Capital accounts are not adjusted for temporary book-tax differences which will reverse in a subsequent period.
Book-tax differences are primarily due to foreign currency transactions, passive foreign investment companies (PFIC), deferred trustees compensation, capital loss carryforwards and losses deferred due to wash sales.
As of period end, the cost and unrealized appreciation (depreciation) in securities, and derivatives if applicable, for federal income tax purposes were as follows:
| Gross unrealized appreciation | $32,030,507 |
| Gross unrealized depreciation | (29,753,560) |
| Net unrealized appreciation (depreciation) | $2,276,947 |
| Tax cost | $329,365,751 |
Short-Term Trading (Redemption) Fees. Shares held by investors in the Fund less than 90 days may have been subject to a redemption fee equal to 1.50% of the NAV of shares redeemed. All redemption fees, which reduce the proceeds of the shareholder redemption, are retained by the Fund and accounted for as an addition to paid in capital. In November 2017, the Board of Trustees approved the elimination of these redemption fees effective December 18, 2017.
Restricted Securities. The Fund may invest in securities that are subject to legal or contractual restrictions on resale. These securities generally may be resold in transactions exempt from registration or to the public if the securities are registered. Disposal of these securities may involve time-consuming negotiations and expense, and prompt sale at an acceptable price may be difficult. Information regarding restricted securities is included at the end of the Fund's Schedule of Investments.
4. Purchases and Sales of Investments.
Purchases and sales of securities, other than short-term securities, aggregated $64,556,651 and $96,190,567, respectively.
5. Fees and Other Transactions with Affiliates.
Management Fee. Fidelity Management & Research Company (the investment adviser) and its affiliates provide the Fund with investment management related services for which the Fund pays a monthly management fee. The management fee is the sum of an individual fund fee rate that is based on an annual rate of .45% of the Fund's average net assets and an annualized group fee rate that averaged .24% during the period. The group fee rate is based upon the average net assets of all the mutual funds advised by the investment adviser, including any mutual funds previously advised by the investment adviser that are currently advised by Fidelity SelectCo, LLC, an affiliate of the investment adviser. The group fee rate decreases as assets under management increase and increases as assets under management decrease. For the reporting period, the total annualized management fee rate was .69% of the Fund's average net assets.
Transfer Agent Fees. Fidelity Investments Institutional Operations Company, Inc. (FIIOC), an affiliate of the investment adviser, is the Fund's transfer, dividend disbursing and shareholder servicing agent. FIIOC receives account fees and asset-based fees that vary according to account size and type of account. FIIOC pays for typesetting, printing and mailing of shareholder reports, except proxy statements. For the period, the transfer agent fees were equivalent to an annualized rate of .18% of average net assets.
Accounting and Security Lending Fees. Fidelity Service Company, Inc. (FSC), an affiliate of the investment adviser, maintains the Fund's accounting records. The accounting fee is based on the level of average net assets for each month. Under a separate contract, FSC administers the security lending program. The security lending fee is based on the number and duration of lending transactions. For the period, the fees were equivalent to an annualized rate of .05%.
Interfund Trades. The Funds may purchase from or sell securities to other Fidelity Funds under procedures adopted by the Board. The procedures have been designed to ensure these interfund trades are executed in accordance with Rule 17a-7 of the 1940 Act. Interfund trades are included within the respective purchases and sales amounts shown in the Purchases and Sales of Investments note.
6. Committed Line of Credit.
The Fund participates with other funds managed by the investment adviser or an affiliate in a $4.25 billion credit facility (the "line of credit") to be utilized for temporary or emergency purposes to fund shareholder redemptions or for other short-term liquidity purposes. The Fund has agreed to pay commitment fees on its pro-rata portion of the line of credit, which amounted to $509 and is reflected in Miscellaneous expenses on the Statement of Operations. During the period, the Fund did not borrow on this line of credit.
7. Security Lending.
The Fund lends portfolio securities through a lending agent from time to time in order to earn additional income. For equity securities, a lending agent is used and may loan securities to certain qualified borrowers, including Fidelity Capital Markets (FCM), a broker-dealer affiliated with the Fund. On the settlement date of the loan, the Fund receives collateral (in the form of U.S. Treasury obligations, letters of credit and/or cash) against the loaned securities and maintains collateral in an amount not less than 100% of the market value of the loaned securities during the period of the loan. The market value of the loaned securities is determined at the close of business of the Fund and any additional required collateral is delivered to the Fund on the next business day. The Fund or borrower may terminate the loan at any time, and if the borrower defaults on its obligation to return the securities loaned because of insolvency or other reasons, the Fund may apply collateral received from the borrower against the obligation. The Fund may experience delays and costs in recovering the securities loaned. Any cash collateral received is invested in the Fidelity Securities Lending Cash Central Fund. The value of loaned securities and cash collateral at period end are disclosed on the Fund's Statement of Assets and Liabilities. Security lending income represents the income earned on investing cash collateral, less rebates paid to borrowers and any lending agent fees associated with the loan, plus any premium payments received for lending certain types of securities. Security lending income is presented in the Statement of Operations as a component of income from Fidelity Central Funds. Total security lending income during the period amounted to $166,481. During the period, there were no securities loaned to FCM.
8. Expense Reductions.
During the period the investment adviser reimbursed and/or waived a portion of operating expenses in the amount of $1,706.
9. Other.
The Fund's organizational documents provide former and current trustees and officers with a limited indemnification against liabilities arising in connection with the performance of their duties to the Fund. In the normal course of business, the Fund may also enter into contracts that provide general indemnifications. The Fund's maximum exposure under these arrangements is unknown as this would be dependent on future claims that may be made against the Fund. The risk of material loss from such claims is considered remote.
Fidelity® Pacific Basin Fund
Investment Summary (Unaudited)
Geographic Diversification (% of fund's net assets)
| As of April 30, 2018 | ||
| Japan | 35.5% | |
| Australia | 13.7% | |
| China | 10.7% | |
| India | 8.2% | |
| Cayman Islands | 6.8% | |
| Taiwan | 4.9% | |
| Hong Kong | 4.1% | |
| Korea (South) | 3.4% | |
| South Africa | 3.3% | |
| Other* | 9.4% | |

* Includes Short-Term investments and Net Other Assets (Liabilities).
Percentages are based on country or territory of incorporation and are adjusted for the effect of futures contracts, if applicable.
Asset Allocation as of April 30, 2018
| % of fund's net assets | |
| Stocks | 99.7 |
| Short-Term Investments and Net Other Assets (Liabilities) | 0.3 |
Top Ten Stocks as of April 30, 2018
| % of fund's net assets | |
| Alibaba Group Holding Ltd. sponsored ADR (Cayman Islands, Internet Software & Services) | 3.3 |
| Naspers Ltd. Class N (South Africa, Media) | 3.3 |
| Taiwan Semiconductor Manufacturing Co. Ltd. (Taiwan, Semiconductors & Semiconductor Equipment) | 2.9 |
| AIA Group Ltd. (Hong Kong, Insurance) | 2.0 |
| Kweichow Moutai Co. Ltd. (A Shares) (China, Beverages) | 1.8 |
| SoftBank Corp. (Japan, Wireless Telecommunication Services) | 1.8 |
| Keyence Corp. (Japan, Electronic Equipment & Components) | 1.7 |
| Commonwealth Bank of Australia (Australia, Banks) | 1.5 |
| Nitori Holdings Co. Ltd. (Japan, Specialty Retail) | 1.5 |
| ORIX Corp. (Japan, Diversified Financial Services) | 1.4 |
| 21.2 |
Top Market Sectors as of April 30, 2018
| % of fund's net assets | |
| Information Technology | 18.1 |
| Financials | 17.4 |
| Consumer Discretionary | 15.9 |
| Health Care | 12.1 |
| Industrials | 11.1 |
| Consumer Staples | 8.9 |
| Real Estate | 3.9 |
| Telecommunication Services | 3.9 |
| Materials | 3.1 |
| Energy | 2.6 |
Fidelity® Pacific Basin Fund
Schedule of Investments April 30, 2018 (Unaudited)
Showing Percentage of Net Assets
| Common Stocks - 98.7% | |||
| Shares | Value | ||
| Australia - 13.7% | |||
| 1-Page Ltd. (a)(b) | 872,167 | $108,341 | |
| Amcor Ltd. | 920,628 | 9,487,048 | |
| Arena (REIT) unit | 3,868,965 | 6,475,297 | |
| Aristocrat Leisure Ltd. | 385,270 | 7,728,738 | |
| Australia & New Zealand Banking Group Ltd. | 555,948 | 11,175,780 | |
| Blue Sky Alternative Investments Ltd. | 1,733,447 | 3,995,362 | |
| BWX Ltd. (c) | 1,786,658 | 6,778,600 | |
| Commonwealth Bank of Australia | 279,342 | 15,041,011 | |
| CSL Ltd. | 101,927 | 13,055,733 | |
| Hansen Technologies Ltd. | 2,550,516 | 8,219,036 | |
| HUB24 Ltd. (a)(c) | 1,073,146 | 8,901,827 | |
| Magellan Financial Group Ltd. | 324,996 | 5,677,833 | |
| Netwealth Group Ltd. | 862,037 | 4,642,481 | |
| NIB Holdings Ltd. | 2,170,263 | 9,072,106 | |
| realestate.com.au Ltd. | 132,656 | 8,031,228 | |
| SpeedCast International Ltd. | 1,171,597 | 5,203,676 | |
| Technology One Ltd. | 1,127,367 | 4,187,573 | |
| Woodside Petroleum Ltd. | 385,854 | 9,350,596 | |
| TOTAL AUSTRALIA | 137,132,266 | ||
| Bermuda - 1.6% | |||
| Cheung Kong Infrastructure Holdings Ltd. | 1,211,000 | 9,557,710 | |
| Hongkong Land Holdings Ltd. | 875,100 | 6,324,558 | |
| TOTAL BERMUDA | 15,882,268 | ||
| Cayman Islands - 6.8% | |||
| Alibaba Group Holding Ltd. sponsored ADR (a) | 184,600 | 32,958,482 | |
| China High Precision Automation Group Ltd. (a)(b) | 1,875,000 | 2 | |
| China Metal Recycling (Holdings) Ltd. (a)(b) | 2,572,200 | 3 | |
| International Housewares Retail Co. Ltd. | 17,370,700 | 3,509,911 | |
| NetEase, Inc. ADR | 27,800 | 7,146,546 | |
| Silergy Corp. | 243,000 | 5,072,628 | |
| SITC International Holdings Co. Ltd. | 6,779,000 | 7,222,658 | |
| Tencent Holdings Ltd. | 244,800 | 12,035,085 | |
| TOTAL CAYMAN ISLANDS | 67,945,315 | ||
| China - 10.7% | |||
| Gree Electric Appliances, Inc. of Zhuhai Class A | 1,445,294 | 10,023,709 | |
| Hangzhou Hikvision Digital Technology Co. Ltd. Class A | 1,647,016 | 9,975,782 | |
| Industrial & Commercial Bank of China Ltd. (H Shares) | 13,110,000 | 11,509,028 | |
| Jiangsu Hengrui Medicine Co. Ltd. (A Shares) | 883,894 | 11,585,638 | |
| Jiangsu Yanghe Brewery Joint-Stock Co. Ltd. Class A | 474,054 | 8,352,999 | |
| Kweichow Moutai Co. Ltd. (A Shares) | 176,150 | 18,342,328 | |
| Shanghai International Airport Co. Ltd. (A Shares) | 1,210,013 | 9,503,616 | |
| Shenzhen Expressway Co. (H Shares) | 5,222,000 | 5,299,110 | |
| Tonghua Dongbao Pharmaceutical Co. Ltd. Class A | 1,889,600 | 8,548,095 | |
| Yunnan Baiyao Group Co. Ltd. | 622,433 | 9,295,151 | |
| Zhengzhou Yutong Bus Co. Ltd. | 1,484,223 | 4,795,003 | |
| TOTAL CHINA | 107,230,459 | ||
| Hong Kong - 4.1% | |||
| AIA Group Ltd. | 2,285,400 | 20,425,077 | |
| CSPC Pharmaceutical Group Ltd. | 4,476,000 | 11,400,635 | |
| Magnificent Hotel Investment Ltd. | 29,836,000 | 810,316 | |
| Techtronic Industries Co. Ltd. | 1,485,000 | 8,699,415 | |
| TOTAL HONG KONG | 41,335,443 | ||
| India - 8.2% | |||
| Axis Bank Ltd. | 889,398 | 6,895,021 | |
| Bharti Infratel Ltd. | 1,673,826 | 7,877,704 | |
| CCL Products (India) Ltd. | 947,967 | 4,458,470 | |
| Future Retail Ltd. | 553,160 | 4,998,136 | |
| HDFC Bank Ltd. | 394,066 | 11,877,075 | |
| Housing Development Finance Corp. Ltd. | 374,884 | 10,606,602 | |
| Indraprastha Gas Ltd. | 1,629,316 | 7,027,042 | |
| Petronet LNG Ltd. | 2,207,201 | 7,514,849 | |
| Power Grid Corp. of India Ltd. | 3,115,253 | 9,721,846 | |
| Reliance Industries Ltd. | 725,275 | 10,471,810 | |
| Vakrangee Ltd. | 555,739 | 833,023 | |
| TOTAL INDIA | 82,281,578 | ||
| Indonesia - 2.4% | |||
| PT Bank Central Asia Tbk | 9,009,100 | 14,245,935 | |
| PT Bank Rakyat Indonesia Tbk | 41,180,500 | 9,494,925 | |
| TOTAL INDONESIA | 23,740,860 | ||
| Israel - 0.4% | |||
| Sarine Technologies Ltd. | 4,391,400 | 3,456,923 | |
| Japan - 35.5% | |||
| Arcland Service Holdings Co. Ltd. | 292,000 | 6,255,617 | |
| Bank of Kyoto Ltd. | 144,400 | 8,691,475 | |
| Broadleaf Co. Ltd. | 587,804 | 2,806,748 | |
| Create SD Holdings Co. Ltd. | 211,800 | 6,141,658 | |
| Daito Trust Construction Co. Ltd. | 43,200 | 7,213,831 | |
| Disco Corp. | 24,400 | 4,303,256 | |
| East Japan Railway Co. | 91,000 | 8,732,071 | |
| Fukushima Industries Corp. | 39,100 | 1,820,518 | |
| Hoya Corp. | 233,600 | 12,526,191 | |
| Kao Corp. | 169,800 | 12,200,686 | |
| Keyence Corp. | 27,500 | 16,846,643 | |
| KH Neochem Co. Ltd. | 207,100 | 6,289,535 | |
| Minebea Mitsumi, Inc. | 463,400 | 9,312,933 | |
| Misumi Group, Inc. | 268,500 | 7,441,959 | |
| Morinaga & Co. Ltd. | 132,800 | 6,474,790 | |
| Nakanishi, Inc. | 430,500 | 9,002,223 | |
| Nidec Corp. | 70,700 | 11,084,870 | |
| Nifco, Inc. | 243,500 | 8,586,649 | |
| Nihon M&A Center, Inc. | 184,800 | 5,426,345 | |
| Nihon Parkerizing Co. Ltd. | 223,200 | 3,542,371 | |
| Nissan Chemical Industries Co. Ltd. | 251,800 | 11,228,732 | |
| Nitori Holdings Co. Ltd. | 86,700 | 14,656,202 | |
| Open House Co. Ltd. | 184,900 | 10,351,153 | |
| ORIX Corp. | 821,500 | 14,458,160 | |
| PALTAC Corp. | 110,100 | 5,519,100 | |
| Panasonic Corp. | 676,000 | 10,009,633 | |
| Paramount Bed Holdings Co. Ltd. | 129,100 | 6,424,296 | |
| PeptiDream, Inc. (a)(c) | 93,300 | 3,789,352 | |
| Pilot Corp. | 147,600 | 8,073,985 | |
| ProNexus, Inc. | 276,400 | 3,580,154 | |
| Renesas Electronics Corp. (a)(c) | 552,400 | 5,800,907 | |
| Santen Pharmaceutical Co. Ltd. | 391,000 | 6,598,930 | |
| Shionogi & Co. Ltd. | 165,100 | 8,508,721 | |
| SMC Corp. | 27,400 | 10,456,714 | |
| SMS Co., Ltd. | 133,900 | 5,083,105 | |
| SoftBank Corp. | 230,400 | 17,604,567 | |
| Start Today Co. Ltd. | 439,900 | 12,715,734 | |
| Subaru Corp. | 368,500 | 12,401,313 | |
| Sundrug Co. Ltd. | 144,600 | 7,446,926 | |
| Toto Ltd. | 165,100 | 9,378,622 | |
| Tsuruha Holdings, Inc. | 65,900 | 9,482,318 | |
| Welcia Holdings Co. Ltd. | 135,200 | 6,962,825 | |
| TOTAL JAPAN | 355,231,818 | ||
| Korea (South) - 2.4% | |||
| Coway Co. Ltd. | 76,558 | 6,255,177 | |
| Kakao M Corp. | 88,692 | 7,412,222 | |
| SK Hynix, Inc. | 125,483 | 9,901,079 | |
| TOTAL KOREA (SOUTH) | 23,568,478 | ||
| Multi-National - 0.8% | |||
| HKT Trust/HKT Ltd. unit | 6,329,000 | 8,326,976 | |
| New Zealand - 1.2% | |||
| EBOS Group Ltd. | 408,279 | 5,107,574 | |
| Ryman Healthcare Group Ltd. | 925,540 | 6,902,825 | |
| TOTAL NEW ZEALAND | 12,010,399 | ||
| Philippines - 0.6% | |||
| Ayala Land, Inc. | 7,564,600 | 5,953,286 | |
| Singapore - 0.4% | |||
| Wing Tai Holdings Ltd. | 2,781,500 | 4,261,733 | |
| South Africa - 3.3% | |||
| Naspers Ltd. Class N | 135,200 | 32,937,365 | |
| Taiwan - 4.9% | |||
| Nien Made Enterprise Co. Ltd. | 499,000 | 4,424,538 | |
| Taiwan Semiconductor Manufacturing Co. Ltd. | 3,882,000 | 29,518,145 | |
| United Microelectronics Corp. | 16,252,000 | 8,748,729 | |
| Voltronic Power Technology Corp. | 380,703 | 6,763,024 | |
| TOTAL TAIWAN | 49,454,436 | ||
| Thailand - 1.0% | |||
| Bangkok Bank PCL (For. Reg.) | 882,400 | 5,621,309 | |
| Thai Beverage PCL | 6,086,700 | 3,913,060 | |
| TOTAL THAILAND | 9,534,369 | ||
| United States of America - 0.7% | |||
| GI Dynamics, Inc. CDI (a) | 5,561,290 | 92,060 | |
| ResMed, Inc. CDI | 775,661 | 7,363,368 | |
| TOTAL UNITED STATES OF AMERICA | 7,455,428 | ||
| TOTAL COMMON STOCKS | |||
| (Cost $733,505,767) | 987,739,400 | ||
| Nonconvertible Preferred Stocks - 1.0% | |||
| Korea (South) - 1.0% | |||
| Samsung Electronics Co. Ltd. | |||
| (Cost $9,351,760) | 5,267 | 10,397,058 | |
| Money Market Funds - 2.0% | |||
| Fidelity Cash Central Fund, 1.74% (d) | 8,798,786 | 8,800,546 | |
| Fidelity Securities Lending Cash Central Fund 1.74% (d)(e) | 10,898,945 | 10,900,035 | |
| TOTAL MONEY MARKET FUNDS | |||
| (Cost $19,700,581) | 19,700,581 | ||
| TOTAL INVESTMENT IN SECURITIES - 101.7% | |||
| (Cost $762,558,108) | 1,017,837,039 | ||
| NET OTHER ASSETS (LIABILITIES) - (1.7)% | (17,105,703) | ||
| NET ASSETS - 100% | $1,000,731,336 |
Categorizations in the Schedule of Investments are based on country or territory of incorporation.
Legend
(a) Non-income producing
(b) Level 3 security
(c) Security or a portion of the security is on loan at period end.
(d) Affiliated fund that is generally available only to investment companies and other accounts managed by Fidelity Investments. The rate quoted is the annualized seven-day yield of the fund at period end. A complete unaudited listing of the fund's holdings as of its most recent quarter end is available upon request. In addition, each Fidelity Central Fund's financial statements are available on the SEC's website or upon request.
(e) Investment made with cash collateral received from securities on loan.
Affiliated Central Funds
Information regarding fiscal year to date income earned by the Fund from investments in Fidelity Central Funds is as follows:
| Fund | Income earned |
| Fidelity Cash Central Fund | $92,625 |
| Fidelity Securities Lending Cash Central Fund | 73,538 |
| Total | $166,163 |
Amounts in the income column in the above table include any capital gain distributions from underlying funds, which are presented in the corresponding line-item in the Statement of Operations if applicable.
Investment Valuation
The following is a summary of the inputs used, as of April 30, 2018, involving the Fund's assets and liabilities carried at fair value. The inputs or methodology used for valuing securities may not be an indication of the risk associated with investing in those securities. For more information on valuation inputs, and their aggregation into the levels used below, please refer to the Investment Valuation section in the accompanying Notes to Financial Statements.
| Valuation Inputs at Reporting Date: | ||||
| Description | Total | Level 1 | Level 2 | Level 3 |
| Investments in Securities: | ||||
| Equities: | ||||
| Consumer Discretionary | $156,943,775 | $73,802,014 | $83,141,761 | $-- |
| Consumer Staples | 90,554,660 | 48,709,203 | 41,845,457 | -- |
| Energy | 27,337,255 | -- | 27,337,255 | -- |
| Financials | 172,331,007 | 23,149,635 | 149,181,372 | -- |
| Health Care | 120,200,792 | 58,860,112 | 61,340,680 | -- |
| Industrials | 112,348,505 | 75,308,171 | 37,040,334 | -- |
| Information Technology | 181,973,396 | 95,243,824 | 86,621,229 | 108,343 |
| Materials | 30,547,689 | 21,060,638 | 9,487,048 | 3 |
| Real Estate | 40,579,858 | 17,564,984 | 23,014,874 | -- |
| Telecommunication Services | 39,012,923 | -- | 39,012,923 | -- |
| Utilities | 26,306,598 | -- | 26,306,598 | -- |
| Money Market Funds | 19,700,581 | 19,700,581 | -- | -- |
| Total Investments in Securities: | $1,017,837,039 | $433,399,162 | $584,329,531 | $108,346 |
The following is a summary of transfers between Level 1 and Level 2 for the period ended April 30, 2018. Transfers are assumed to have occurred at the beginning of the period, and are primarily attributable to the valuation techniques used for foreign equity securities, as discussed in the accompanying Notes to Financial Statements:
| Transfers | Total |
| Level 1 to Level 2 | $471,627,583 |
| Level 2 to Level 1 | $251,406,069 |
See accompanying notes which are an integral part of the financial statements.
Fidelity® Pacific Basin Fund
Financial Statements
Statement of Assets and Liabilities
| April 30, 2018 (Unaudited) | ||
| Assets | ||
| Investment in securities, at value (including securities loaned of $10,367,685) — See accompanying schedule: Unaffiliated issuers (cost $742,857,527) | $998,136,458 | |
| Fidelity Central Funds (cost $19,700,581) | 19,700,581 | |
| Total Investment in Securities (cost $762,558,108) | $1,017,837,039 | |
| Cash | 25,564 | |
| Receivable for investments sold | 4,387,082 | |
| Receivable for fund shares sold | 298,592 | |
| Dividends receivable | 2,836,161 | |
| Distributions receivable from Fidelity Central Funds | 31,341 | |
| Prepaid expenses | 451 | |
| Other receivables | 52,387 | |
| Total assets | 1,025,468,617 | |
| Liabilities | ||
| Payable for investments purchased | $10,919,956 | |
| Payable for fund shares redeemed | 730,891 | |
| Accrued management fee | 716,446 | |
| Other affiliated payables | 181,274 | |
| Other payables and accrued expenses | 1,289,572 | |
| Collateral on securities loaned | 10,899,142 | |
| Total liabilities | 24,737,281 | |
| Net Assets | $1,000,731,336 | |
| Net Assets consist of: | ||
| Paid in capital | $722,740,482 | |
| Undistributed net investment income | 615,352 | |
| Accumulated undistributed net realized gain (loss) on investments and foreign currency transactions | 23,335,887 | |
| Net unrealized appreciation (depreciation) on investments and assets and liabilities in foreign currencies | 254,039,615 | |
| Net Assets, for 28,986,778 shares outstanding | $1,000,731,336 | |
| Net Asset Value, offering price and redemption price per share ($1,000,731,336 ÷ 28,986,778 shares) | $34.52 |
See accompanying notes which are an integral part of the financial statements.
Statement of Operations
| Six months ended April 30, 2018 (Unaudited) | ||
| Investment Income | ||
| Dividends | $6,520,622 | |
| Income from Fidelity Central Funds | 166,163 | |
| Income before foreign taxes withheld | 6,686,785 | |
| Less foreign taxes withheld | (497,706) | |
| Total income | 6,189,079 | |
| Expenses | ||
| Management fee | ||
| Basic fee | $3,587,822 | |
| Performance adjustment | 750,116 | |
| Transfer agent fees | 832,886 | |
| Accounting and security lending fees | 241,840 | |
| Custodian fees and expenses | 123,115 | |
| Independent trustees' fees and expenses | 2,083 | |
| Registration fees | 30,962 | |
| Audit | 42,268 | |
| Legal | 2,307 | |
| Miscellaneous | 3,081 | |
| Total expenses before reductions | 5,616,480 | |
| Expense reductions | (59,786) | 5,556,694 |
| Net investment income (loss) | 632,385 | |
| Realized and Unrealized Gain (Loss) | ||
| Net realized gain (loss) on: | ||
| Investment securities: | ||
| Unaffiliated issuers | 31,229,300 | |
| Fidelity Central Funds | 233 | |
| Foreign currency transactions | (117,814) | |
| Total net realized gain (loss) | 31,111,719 | |
| Change in net unrealized appreciation (depreciation) on: | ||
| Investment securities: | ||
| Unaffiliated issuers (net of decrease in deferred foreign taxes of $559,760) | (18,266,106) | |
| Fidelity Central Funds | (188) | |
| Assets and liabilities in foreign currencies | (41,552) | |
| Total change in net unrealized appreciation (depreciation) | (18,307,846) | |
| Net gain (loss) | 12,803,873 | |
| Net increase (decrease) in net assets resulting from operations | $13,436,258 |
See accompanying notes which are an integral part of the financial statements.
Statement of Changes in Net Assets
| Six months ended April 30, 2018 (Unaudited) | Year ended October 31, 2017 | |
| Increase (Decrease) in Net Assets | ||
| Operations | ||
| Net investment income (loss) | $632,385 | $6,692,443 |
| Net realized gain (loss) | 31,111,719 | 36,776,786 |
| Change in net unrealized appreciation (depreciation) | (18,307,846) | 155,633,192 |
| Net increase (decrease) in net assets resulting from operations | 13,436,258 | 199,102,421 |
| Distributions to shareholders from net investment income | (6,385,199) | (4,211,523) |
| Distributions to shareholders from net realized gain | (36,562,199) | (11,304,612) |
| Total distributions | (42,947,398) | (15,516,135) |
| Share transactions | ||
| Proceeds from sales of shares | 131,047,287 | 225,357,974 |
| Reinvestment of distributions | 41,121,006 | 14,752,829 |
| Cost of shares redeemed | (117,202,752) | (136,848,518) |
| Net increase (decrease) in net assets resulting from share transactions | 54,965,541 | 103,262,285 |
| Redemption fees | 17,926 | 92,091 |
| Total increase (decrease) in net assets | 25,472,327 | 286,940,662 |
| Net Assets | ||
| Beginning of period | 975,259,009 | 688,318,347 |
| End of period | $1,000,731,336 | $975,259,009 |
| Other Information | ||
| Undistributed net investment income end of period | $615,352 | $6,368,166 |
| Shares | ||
| Sold | 3,633,835 | 7,627,933 |
| Issued in reinvestment of distributions | 1,184,702 | 557,552 |
| Redeemed | (3,282,663) | (4,620,784) |
| Net increase (decrease) | 1,535,874 | 3,564,701 |
See accompanying notes which are an integral part of the financial statements.
Financial Highlights
Fidelity Pacific Basin Fund
| Six months ended (Unaudited) April 30, | Years endedOctober 31, | |||||
| 2018 | 2017 | 2016 | 2015 | 2014 | 2013 | |
| Selected Per–Share Data | ||||||
| Net asset value, beginning of period | $35.53 | $28.82 | $27.01 | $28.92 | $31.47 | $24.85 |
| Income from Investment Operations | ||||||
| Net investment income (loss)A | .02 | .25 | .24 | .37B | .31 | .12 |
| Net realized and unrealized gain (loss) | .52 | 7.09 | 2.88 | (.49) | 1.25 | 7.26 |
| Total from investment operations | .54 | 7.34 | 3.12 | (.12) | 1.56 | 7.38 |
| Distributions from net investment income | (.23) | (.17) | (.36) | (.18) | (.18) | (.29) |
| Distributions from net realized gain | (1.32) | (.46) | (.95) | (1.61) | (3.93) | (.47) |
| Total distributions | (1.55) | (.63) | (1.31) | (1.79) | (4.11) | (.76) |
| Redemption fees added to paid in capitalA,C | – | – | – | – | – | – |
| Net asset value, end of period | $34.52 | $35.53 | $28.82 | $27.01 | $28.92 | $31.47 |
| Total ReturnD,E | 1.49% | 26.22% | 12.05% | (.29)% | 5.68% | 30.58% |
| Ratios to Average Net AssetsF,G | ||||||
| Expenses before reductions | 1.08%H | 1.11% | 1.19% | 1.17% | 1.18% | 1.23% |
| Expenses net of fee waivers, if any | 1.08%H | 1.11% | 1.19% | 1.17% | 1.18% | 1.22% |
| Expenses net of all reductions | 1.07%H | 1.10% | 1.19% | 1.17% | 1.18% | 1.21% |
| Net investment income (loss) | .12%H | .84% | .87% | 1.34%B | 1.09% | .42% |
| Supplemental Data | ||||||
| Net assets, end of period (000 omitted) | $1,000,731 | $975,259 | $688,318 | $654,032 | $697,202 | $719,675 |
| Portfolio turnover rateI | 32%H | 36% | 30% | 36% | 30% | 82% |
A Calculated based on average shares outstanding during the period.
B Net Investment income per share reflects a large, non-recurring dividend which amounted to $.10 per share. Excluding this non-recurring dividend, the ratio of net investment income (loss) to average net assets would have been .99%.
C Amount represents less than $.005 per share.
D Total returns for periods of less than one year are not annualized.
E Total returns would have been lower if certain expenses had not been reduced during the applicable periods shown.
F Fees and expenses of any underlying Fidelity Central Funds are not included in the Fund's expense ratio. The Fund indirectly bears its proportionate share of the expenses of any underlying Fidelity Central Funds.
G Expense ratios reflect operating expenses of the Fund. Expenses before reductions do not reflect amounts reimbursed by the investment adviser or reductions from brokerage service arrangements or reductions from other expense offset arrangements and do not represent the amount paid by the Fund during periods when reimbursements or reductions occur. Expenses net of fee waivers reflect expenses after reimbursement by the investment adviser but prior to reductions from brokerage service arrangements or other expense offset arrangements. Expenses net of all reductions represent the net expenses paid by the Fund.
H Annualized
I Amount does not include the portfolio activity of any underlying Fidelity Central Funds.
See accompanying notes which are an integral part of the financial statements.
Notes to Financial Statements (Unaudited)
For the period ended April 30, 2018
1. Organization.
Fidelity Pacific Basin Fund (the Fund) is a fund of Fidelity Investment Trust (the Trust) and is authorized to issue an unlimited number of shares. Share transactions on the Statement of Changes in Net Assets may contain exchanges between affiliated funds. The Trust is registered under the Investment Company Act of 1940, as amended (the 1940 Act), as an open-end management investment company organized as a Massachusetts business trust. The Fund's investments in emerging markets can be subject to social, economic, regulatory, and political uncertainties and can be extremely volatile.
2. Investments in Fidelity Central Funds.
The Fund invests in Fidelity Central Funds, which are open-end investment companies generally available only to other investment companies and accounts managed by the investment adviser and its affiliates. The Fund's Schedule of Investments lists each of the Fidelity Central Funds held as of period end, if any, as an investment of the Fund, but does not include the underlying holdings of each Fidelity Central Fund. As an Investing Fund, the Fund indirectly bears its proportionate share of the expenses of the underlying Fidelity Central Funds.
The Money Market Central Funds seek preservation of capital and current income and are managed by Fidelity Investments Money Management, Inc. (FIMM), an affiliate of the investment adviser. Annualized expenses of the Money Market Central Funds as of their most recent shareholder report date are less than .005%.
A complete unaudited list of holdings for each Fidelity Central Fund is available upon request or at the Securities and Exchange Commission (the SEC) website at www.sec.gov. In addition, the financial statements of the Fidelity Central Funds are available on the SEC website or upon request.
3. Significant Accounting Policies.
The Fund is an investment company and applies the accounting and reporting guidance of the Financial Accounting Standards Board (FASB) Accounting Standards Codification Topic 946 Financial Services – Investments Companies. The financial statements have been prepared in conformity with accounting principles generally accepted in the United States of America (GAAP), which require management to make certain estimates and assumptions at the date of the financial statements. Actual results could differ from those estimates. Subsequent events, if any, through the date that the financial statements were issued have been evaluated in the preparation of the financial statements. The following summarizes the significant accounting policies of the Fund:
Investment Valuation. Investments are valued as of 4:00 p.m. Eastern time on the last calendar day of the period. The Board of Trustees (the Board) has delegated the day to day responsibility for the valuation of the Fund's investments to the Fair Value Committee (the Committee) established by the Fund's investment adviser. In accordance with valuation policies and procedures approved by the Board, the Fund attempts to obtain prices from one or more third party pricing vendors or brokers to value its investments. When current market prices, quotations or currency exchange rates are not readily available or reliable, investments will be fair valued in good faith by the Committee, in accordance with procedures adopted by the Board. Factors used in determining fair value vary by investment type and may include market or investment specific events. The frequency with which these procedures are used cannot be predicted and they may be utilized to a significant extent. The Committee oversees the Fund's valuation policies and procedures and reports to the Board on the Committee's activities and fair value determinations. The Board monitors the appropriateness of the procedures used in valuing the Fund's investments and ratifies the fair value determinations of the Committee.
The Fund categorizes the inputs to valuation techniques used to value its investments into a disclosure hierarchy consisting of three levels as shown below:
- Level 1 – quoted prices in active markets for identical investments
- Level 2 – other significant observable inputs (including quoted prices for similar investments, interest rates, prepayment speeds, etc.)
- Level 3 – unobservable inputs (including the Fund's own assumptions based on the best information available)
Valuation techniques used to value the Fund's investments by major category are as follows:
Equity securities, including restricted securities, for which market quotations are readily available, are valued at the last reported sale price or official closing price as reported by a third party pricing vendor on the primary market or exchange on which they are traded and are categorized as Level 1 in the hierarchy. In the event there were no sales during the day or closing prices are not available, securities are valued at the last quoted bid price or may be valued using the last available price and are generally categorized as Level 2 in the hierarchy. For foreign equity securities, when market or security specific events arise, comparisons to the valuation of American Depositary Receipts (ADRs), futures contracts, Exchange-Traded Funds (ETFs) and certain indexes as well as quoted prices for similar securities may be used and would be categorized as Level 2 in the hierarchy. Utilizing these techniques may result in transfers between Level 1 and Level 2. For equity securities, including restricted securities, where observable inputs are limited, assumptions about market activity and risk are used and these securities may be categorized as Level 3 in the hierarchy.
Investments in open-end mutual funds, including the Fidelity Central Funds, are valued at their closing net asset value (NAV) each business day and are categorized as Level 1 in the hierarchy.
Changes in valuation techniques may result in transfers in or out of an assigned level within the disclosure hierarchy. The aggregate value of investments by input level as of April 30, 2018, including information on transfers between Levels 1 and 2, is included at the end of the Fund's Schedule of Investments.
Foreign Currency. The Fund may use foreign currency contracts to facilitate transactions in foreign-denominated securities. Gains and losses from these transactions may arise from changes in the value of the foreign currency or if the counterparties do not perform under the contracts' terms.
Foreign-denominated assets, including investment securities, and liabilities are translated into U.S. dollars at the exchange rates at period end. Purchases and sales of investment securities, income and dividends received and expenses denominated in foreign currencies are translated into U.S. dollars at the exchange rate in effect on the transaction date.
The effects of exchange rate fluctuations on investments are included with the net realized and unrealized gain (loss) on investment securities. Other foreign currency transactions resulting in realized and unrealized gain (loss) are disclosed separately.
Investment Transactions and Income. For financial reporting purposes, the Fund's investment holdings and NAV include trades executed through the end of the last business day of the period. The NAV per share for processing shareholder transactions is calculated as of the close of business of the New York Stock Exchange (NYSE), normally 4:00 p.m. Eastern time and includes trades executed through the end of the prior business day. Gains and losses on securities sold are determined on the basis of identified cost. Dividend income is recorded on the ex-dividend date, except for certain dividends from foreign securities where the ex-dividend date may have passed, which are recorded as soon as the Fund is informed of the ex-dividend date. Non-cash dividends included in dividend income, if any, are recorded at the fair market value of the securities received. Income and capital gain distributions from Fidelity Central Funds, if any, are recorded on the ex-dividend date. Investment income is recorded net of foreign taxes withheld where recovery of such taxes is uncertain.
Expenses. Expenses directly attributable to a fund are charged to that fund. Expenses attributable to more than one fund are allocated among the respective funds on the basis of relative net assets or other appropriate methods. Expense estimates are accrued in the period to which they relate and adjustments are made when actual amounts are known.
Income Tax Information and Distributions to Shareholders. Each year, the Fund intends to qualify as a regulated investment company under Subchapter M of the Internal Revenue Code, including distributing substantially all of its taxable income and realized gains. As a result, no provision for U.S. Federal income taxes is required. The Fund files a U.S. federal tax return, in addition to state and local tax returns as required. The Fund's federal income tax returns are subject to examination by the Internal Revenue Service (IRS) for a period of three fiscal years after they are filed. State and local tax returns may be subject to examination for an additional fiscal year depending on the jurisdiction. Foreign taxes are provided for based on the Fund's understanding of the tax rules and rates that exist in the foreign markets in which it invests. The Fund is subject to a tax imposed on capital gains by certain countries in which it invests. An estimated deferred tax liability for net unrealized appreciation on the applicable securities is included in Other payables and accrued expenses on the Statement of Assets & Liabilities.
Distributions are declared and recorded on the ex-dividend date. Income and capital gain distributions are determined in accordance with income tax regulations, which may differ from GAAP.
Capital accounts within the financial statements are adjusted for permanent book-tax differences. These adjustments have no impact on net assets or the results of operations. Capital accounts are not adjusted for temporary book-tax differences which will reverse in a subsequent period.
Book-tax differences are primarily due to foreign currency transactions, passive foreign investment companies (PFIC), deferred trustees compensation and losses deferred due to wash sales.
As of period end, the cost and unrealized appreciation (depreciation) in securities, and derivatives if applicable, for federal income tax purposes were as follows:
| Gross unrealized appreciation | $292,345,186 |
| Gross unrealized depreciation | (44,849,292) |
| Net unrealized appreciation (depreciation) | $247,495,894 |
| Tax cost | $770,341,145 |
Short-Term Trading (Redemption) Fees. Shares held by investors in the Fund less than 90 days may have been subject to a redemption fee equal to 1.50% of the NAV of shares redeemed. All redemption fees, which reduce the proceeds of the shareholder redemption, are retained by the Fund and accounted for as an addition to paid in capital. In November 2017, the Board of Trustees approved the elimination of these redemption fees effective December 18, 2017.
4. Purchases and Sales of Investments.
Purchases and sales of securities, other than short-term securities, aggregated $186,320,727 and $163,890,708, respectively.
5. Fees and Other Transactions with Affiliates.
Management Fee. Fidelity Management & Research Company (the investment adviser) and its affiliates provide the Fund with investment management related services for which the Fund pays a monthly management fee. The management fee is the sum of an individual fund fee rate that is based on an annual rate of .45% of the Fund's average net assets and an annualized group fee rate that averaged .24% during the period. The group fee rate is based upon the average net assets of all the mutual funds advised by the investment adviser, including any mutual funds previously advised by the investment adviser that are currently advised by Fidelity SelectCo, LLC, an affiliate of the investment adviser. The group fee rate decreases as assets under management increase and increases as assets under management decrease. In addition, the management fee is subject to a performance adjustment (up to a maximum of +/- .20% of the Fund's average net assets over a 36 month performance period). The upward or downward adjustment to the management fee is based on the Fund's relative investment performance as compared to its benchmark index, the MSCI All Country Pacific Index, over the same 36 month performance period. For the reporting period, the total annualized management fee rate, including the performance adjustment, was .84% of the Fund's average net assets. The performance adjustment included in the management fee rate may be higher or lower than the maximum performance adjustment rate due to the difference between the average net assets for the reporting and performance periods.
Transfer Agent Fees. Fidelity Investments Institutional Operations Company, Inc. (FIIOC), an affiliate of the investment adviser, is the Fund's transfer, dividend disbursing and shareholder servicing agent. FIIOC receives account fees and asset-based fees that vary according to account size and type of account. FIIOC pays for typesetting, printing and mailing of shareholder reports, except proxy statements. For the period, the transfer agent fees were equivalent to an annualized rate of .16% of average net assets.
Accounting and Security Lending Fees. Fidelity Service Company, Inc. (FSC), an affiliate of the investment adviser, maintains the Fund's accounting records. The accounting fee is based on the level of average net assets for each month. Under a separate contract, FSC administers the security lending program. The security lending fee is based on the number and duration of lending transactions. For the period, the fees were equivalent to an annualized rate of .05%.
Interfund Trades. The Fund may purchase from or sell securities to other Fidelity Funds under procedures adopted by the Board. The procedures have been designed to ensure these interfund trades are executed in accordance with Rule 17a-7 of the 1940 Act. Interfund trades are included within the respective purchases and sales amounts shown in the Purchases and Sales of Investments note.
6. Committed Line of Credit.
The Fund participates with other funds managed by the investment adviser or an affiliate in a $4.25 billion credit facility (the "line of credit") to be utilized for temporary or emergency purposes to fund shareholder redemptions or for other short-term liquidity purposes. The Fund has agreed to pay commitment fees on its pro-rata portion of the line of credit, which amounted to $1,459 and is reflected in Miscellaneous expenses on the Statement of Operations. During the period, the Fund did not borrow on this line of credit.
7. Security Lending.
The Fund lends portfolio securities through a lending agent from time to time in order to earn additional income. For equity securities, a lending agent is used and may loan securities to certain qualified borrowers, including Fidelity Capital Markets (FCM), a broker-dealer affiliated with the Fund. On the settlement date of the loan, the Fund receives collateral (in the form of U.S. Treasury obligations, letters of credit and/or cash) against the loaned securities and maintains collateral in an amount not less than 100% of the market value of the loaned securities during the period of the loan. The market value of the loaned securities is determined at the close of business of the Fund and any additional required collateral is delivered to the Fund on the next business day. The Fund or borrower may terminate the loan at any time, and if the borrower defaults on its obligation to return the securities loaned because of insolvency or other reasons, the Fund may apply collateral received from the borrower against the obligation. The Fund may experience delays and costs in recovering the securities loaned. Any cash collateral received is invested in the Fidelity Securities Lending Cash Central Fund. The value of loaned securities and cash collateral at period end are disclosed on the Fund's Statement of Assets and Liabilities. Security lending income represents the income earned on investing cash collateral, less rebates paid to borrowers and any lending agent fees associated with the loan, plus any premium payments received for lending certain types of securities. Security lending income is presented in the Statement of Operations as a component of income from Fidelity Central Funds. Total security lending income during the period amounted to $73,538. During the period, there were no securities loaned to FCM.
8. Expense Reductions.
Commissions paid to certain brokers with whom the investment adviser, or its affiliates, places trades on behalf of the Fund include an amount in addition to trade execution, which may be rebated back to the Fund to offset certain expenses. This amount totaled $54,494 for the period. In addition, through arrangements with the Fund's custodian, credits realized as a result of certain uninvested cash balances were used to reduce the Fund's expenses. During the period, these credits reduced the Fund's custody expenses by $266.
In addition, during the period the investment adviser reimbursed and/or waived a portion of operating expenses in the amount of $5,026.
9. Other.
The Fund's organizational documents provide former and current trustees and officers with a limited indemnification against liabilities arising in connection with the performance of their duties to the Fund. In the normal course of business, the Fund may also enter into contracts that provide general indemnifications. The Fund's maximum exposure under these arrangements is unknown as this would be dependent on future claims that may be made against the Fund. The risk of material loss from such claims is considered remote.
At the end of the period, Strategic Advisers Fidelity International Fund was the owner of record of approximately 15% of the total outstanding shares of the Fund. Mutual funds managed by the investment adviser or its affiliates were the owners of record, in the aggregate, of approximately 21% of the total outstanding shares of the Fund.
Shareholder Expense Example
As a shareholder of a Fund, you incur two types of costs: (1) transaction costs, including sales charges (loads) on purchase payments or redemption proceeds, redemption fees and (2) ongoing costs, including management fees, distribution and/or service (12b-1) fees and other Fund expenses. This Example is intended to help you understand your ongoing costs (in dollars) of investing in the Funds and to compare these costs with the ongoing costs of investing in other mutual funds.
The Example is based on an investment of $1,000 invested at the beginning of the period and held for the entire period (November 1, 2017 to April 30, 2018).
Actual Expenses
The first line of the accompanying table for each Class of each fund provides information about actual account values and actual expenses. You may use the information in this line, together with the amount you invested, to estimate the expenses that you paid over the period. Simply divide your account value by $1,000.00 (for example, an $8,600 account value divided by $1,000.00 = 8.6), then multiply the result by the number in the first line for a Class of the fund under the heading entitled "Expenses Paid During Period" to estimate the expenses you paid on your account during this period. A small balance maintenance fee of $12.00 that is charged once a year may apply for certain accounts with a value of less than $2,000. This fee is not included in the table below. If it was, the estimate of expenses you paid during the period would be higher, and your ending account value lower, by this amount. In addition, each Fund, as a shareholder in the underlying Fidelity Central Funds, will indirectly bear its pro-rata share of the fees and expenses incurred by the underlying Fidelity Central Funds. These fees and expenses are not included in the Fund's annualized expense ratio used to calculate the expense estimate in the table below.
Hypothetical Example for Comparison Purposes
The second line of the accompanying table for each Class of each fund provides information about hypothetical account values and hypothetical expenses based on a Class' actual expense ratio and an assumed rate of return of 5% per year before expenses, which is not the Class' actual return. The hypothetical account values and expenses may not be used to estimate the actual ending account balance or expenses you paid for the period. You may use this information to compare the ongoing costs of investing in the Fund and other funds. To do so, compare this 5% hypothetical example with the 5% hypothetical examples that appear in the shareholder reports of the other funds. A small balance maintenance fee of $12.00 that is charged once a year may apply for certain accounts with a value of less than $2,000. This fee is not included in the table below. If it was, the estimate of expenses you paid during the period would be higher, and your ending account value lower, by this amount. In addition, each Fund, as a shareholder in the underlying Fidelity Central Funds, will indirectly bear its pro-rata share of the fees and expenses incurred by the underlying Fidelity Central Funds. These fees and expenses are not included in the Fund's annualized expense ratio used to calculate the expense estimate in the table below.
Please note that the expenses shown in the table are meant to highlight your ongoing costs only and do not reflect any transaction costs. Therefore, the second line of the table is useful in comparing ongoing costs only, and will not help you determine the relative total costs of owning different funds. In addition, if these transactional costs were included, your costs would have been higher.
| Annualized Expense Ratio-A | Beginning Account Value November 1, 2017 | Ending Account Value April 30, 2018 | Expenses Paid During Period-B November 1, 2017 to April 30, 2018 | |
| Fidelity Canada Fund | ||||
| Class A | 1.24% | |||
| Actual | $1,000.00 | $982.00 | $6.09 | |
| Hypothetical-C | $1,000.00 | $1,018.65 | $6.21 | |
| Class M | 1.54% | |||
| Actual | $1,000.00 | $980.50 | $7.56 | |
| Hypothetical-C | $1,000.00 | $1,017.16 | $7.70 | |
| Class C | 1.97% | |||
| Actual | $1,000.00 | $978.50 | $9.66 | |
| Hypothetical-C | $1,000.00 | $1,015.03 | $9.84 | |
| Canada | .92% | |||
| Actual | $1,000.00 | $983.60 | $4.52 | |
| Hypothetical-C | $1,000.00 | $1,020.23 | $4.61 | |
| Class I | .88% | |||
| Actual | $1,000.00 | $983.90 | $4.33 | |
| Hypothetical-C | $1,000.00 | $1,020.43 | $4.41 | |
| Fidelity China Region Fund | ||||
| Class A | 1.26% | |||
| Actual | $1,000.00 | $1,042.90 | $6.38 | |
| Hypothetical-C | $1,000.00 | $1,018.55 | $6.31 | |
| Class M | 1.61% | |||
| Actual | $1,000.00 | $1,041.10 | $8.15 | |
| Hypothetical-C | $1,000.00 | $1,016.81 | $8.05 | |
| Class C | 2.01% | |||
| Actual | $1,000.00 | $1,039.20 | $10.16 | |
| Hypothetical-C | $1,000.00 | $1,014.83 | $10.04 | |
| China Region | .95% | |||
| Actual | $1,000.00 | $1,044.70 | $4.82 | |
| Hypothetical-C | $1,000.00 | $1,020.08 | $4.76 | |
| Class I | .97% | |||
| Actual | $1,000.00 | $1,044.60 | $4.92 | |
| Hypothetical-C | $1,000.00 | $1,019.98 | $4.86 | |
| Fidelity Emerging Asia Fund | 1.03% | |||
| Actual | $1,000.00 | $1,005.10 | $5.12 | |
| Hypothetical-C | $1,000.00 | $1,019.69 | $5.16 | |
| Fideltiy Emerging Markets Fund | ||||
| Emerging Markets | .96% | |||
| Actual | $1,000.00 | $1,036.40 | $4.85 | |
| Hypothetical-C | $1,000.00 | $1,020.03 | $4.81 | |
| Class K�� | .82% | |||
| Actual | $1,000.00 | $1,037.30 | $4.14 | |
| Hypothetical-C | $1,000.00 | $1,020.73 | $4.11 | |
| Fidelity Europe Fund | ||||
| Class A | 1.32% | |||
| Actual | $1,000.00 | $999.20 | $6.54 | |
| Hypothetical-C | $1,000.00 | $1,018.25 | $6.61 | |
| Class M | 1.64% | |||
| Actual | $1,000.00 | $997.50 | $8.12 | |
| Hypothetical-C | $1,000.00 | $1,016.66 | $8.20 | |
| Class C | 2.10% | |||
| Actual | $1,000.00 | $995.30 | $10.39 | |
| Hypothetical-C | $1,000.00 | $1,014.38 | $10.49 | |
| Europe | 1.00% | |||
| Actual | $1,000.00 | $1,000.70 | $4.96 | |
| Hypothetical-C | $1,000.00 | $1,019.84 | $5.01 | |
| Class I | .99% | |||
| Actual | $1,000.00 | $1,000.80 | $4.91 | |
| Hypothetical-C | $1,000.00 | $1,019.89 | $4.96 | |
| Fidelity Japan Fund | ||||
| Class A | 1.31% | |||
| Actual | $1,000.00 | $1,047.40 | $6.65 | |
| Hypothetical-C | $1,000.00 | $1,018.30 | $6.56 | |
| Class M | 1.65% | |||
| Actual | $1,000.00 | $1,046.10 | $8.37 | |
| Hypothetical-C | $1,000.00 | $1,016.61 | $8.25 | |
| Class C | 2.01% | |||
| Actual | $1,000.00 | $1,043.50 | $10.18 | |
| Hypothetical-C | $1,000.00 | $1,014.83 | $10.04 | |
| Japan | 1.02% | |||
| Actual | $1,000.00 | $1,048.60 | $5.18 | |
| Hypothetical-C | $1,000.00 | $1,019.74 | $5.11 | |
| Class I | .96% | |||
| Actual | $1,000.00 | $1,049.20 | $4.88 | |
| Hypothetical-C | $1,000.00 | $1,020.03 | $4.81 | |
| Fidelity Japan Smaller Companies Fund | .93% | |||
| Actual | $1,000.00 | $1,065.30 | $4.76 | |
| Hypothetical-C | $1,000.00 | $1,020.18 | $4.66 | |
| Fidelity Latin America Fund | ||||
| Class A | 1.38% | |||
| Actual | $1,000.00 | $1,066.30 | $7.07 | |
| Hypothetical-C | $1,000.00 | $1,017.95 | $6.90 | |
| Class M | 1.65% | |||
| Actual | $1,000.00 | $1,064.70 | $8.45 | |
| Hypothetical-C | $1,000.00 | $1,016.61 | $8.25 | |
| Class C | 2.13% | |||
| Actual | $1,000.00 | $1,062.40 | $10.89 | |
| Hypothetical-C | $1,000.00 | $1,014.23 | $10.64 | |
| Latin America | 1.06% | |||
| Actual | $1,000.00 | $1,068.00 | $5.44 | |
| Hypothetical-C | $1,000.00 | $1,019.54 | $5.31 | |
| Class I | 1.00% | |||
| Actual | $1,000.00 | $1,068.40 | $5.13 | |
| Hypothetical-C | $1,000.00 | $1,019.84 | $5.01 | |
| Fidelity Nordic Fund | .97% | |||
| Actual | $1,000.00 | $958.30 | $4.71 | |
| Hypothetical-C | $1,000.00 | $1,019.98 | $4.86 | |
| Fidelity Pacific Basin Fund | 1.08% | |||
| Actual | $1,000.00 | $1,014.90 | $5.40 | |
| Hypothetical-C | $1,000.00 | $1,019.44 | $5.41 |
A Annualized expense ratio reflects expenses net of applicable fee waivers.
B Expenses are equal to each Class' annualized expense ratio, multiplied by the average account value over the period, multiplied by 181/ 365 (to reflect the one-half year period).
C 5% return per year before expenses
![]()
Corporate Headquarters
245 Summer St.
Boston, MA 02210
www.fidelity.com
TIF-SANN-0618
1.703611.120
Fidelity Advisor® Canada Fund - Semi-Annual Report April 30, 2018 Class A, Class M, Class C and Class I are classes of Fidelity® Canada Fund |
|
Contents
To view a fund's proxy voting guidelines and proxy voting record for the 12-month period ended June 30, visit http://www.fidelity.com/proxyvotingresults or visit the Securities and Exchange Commission's (SEC) web site at http://www.sec.gov.
You may also call 1-877-208-0098 to request a free copy of the proxy voting guidelines.
Standard & Poor's, S&P and S&P 500 are registered service marks of The McGraw-Hill Companies, Inc. and have been licensed for use by Fidelity Distributors Corporation.
Other third-party marks appearing herein are the property of their respective owners.
All other marks appearing herein are registered or unregistered trademarks or service marks of FMR LLC or an affiliated company. © 2018 FMR LLC. All rights reserved.
This report and the financial statements contained herein are submitted for the general information of the shareholders of the Fund. This report is not authorized for distribution to prospective investors in the Fund unless preceded or accompanied by an effective prospectus.
A fund files its complete schedule of portfolio holdings with the SEC for the first and third quarters of each fiscal year on Form N-Q. Forms N-Q are available on the SEC’s web site at http://www.sec.gov. A fund's Forms N-Q may be reviewed and copied at the SEC’s Public Reference Room in Washington, DC. Information regarding the operation of the SEC's Public Reference Room may be obtained by calling 1-800-SEC-0330.
For a complete list of a fund's portfolio holdings, view the most recent holdings listing, semiannual report, or annual report on Fidelity's web site at http://www.fidelity.com, http://www.institutional.fidelity.com, or http://www.401k.com, as applicable.
NOT FDIC INSURED •MAY LOSE VALUE •NO BANK GUARANTEE
Neither the Fund nor Fidelity Distributors Corporation is a bank.
Investment Summary (Unaudited)
Geographic Diversification (% of fund's net assets)
| As of April 30, 2018 | ||
| Canada | 95.5% | |
| United States of America* | 3.2% | |
| Bailiwick of Jersey | 0.8% | |
| United Kingdom | 0.5% | |

* Includes Short-Term investments and Net Other Assets (Liabilities).
Percentages are based on country or territory of incorporation and are adjusted for the effect of futures contracts, if applicable.
Asset Allocation as of April 30, 2018
| % of fund's net assets | |
| Stocks | 97.4 |
| Short-Term Investments and Net Other Assets (Liabilities) | 2.6 |
Top Ten Stocks as of April 30, 2018
| % of fund's net assets | |
| Royal Bank of Canada (Banks) | 9.8 |
| The Toronto-Dominion Bank (Banks) | 9.5 |
| Suncor Energy, Inc. (Oil, Gas & Consumable Fuels) | 7.0 |
| Sun Life Financial, Inc. (Insurance) | 3.9 |
| Canadian Pacific Railway Ltd. (Road & Rail) | 3.9 |
| TELUS Corp. (Diversified Telecommunication Services) | 3.6 |
| Canadian National Railway Co. (Road & Rail) | 3.3 |
| Nutrien Ltd. (Chemicals) | 3.2 |
| Alimentation Couche-Tard, Inc. Class B (sub. vtg.) (Food & Staples Retailing) | 3.0 |
| Canadian Natural Resources Ltd. (Oil, Gas & Consumable Fuels) | 2.9 |
| 50.1 |
Top Market Sectors as of April 30, 2018
| % of fund's net assets | |
| Financials | 32.6 |
| Energy | 18.8 |
| Materials | 12.3 |
| Industrials | 9.5 |
| Consumer Staples | 7.8 |
| Telecommunication Services | 6.0 |
| Information Technology | 4.6 |
| Consumer Discretionary | 3.8 |
| Real Estate | 0.7 |
| Utilities | 0.7 |
Market Sectors may include more than one industry category.
The Fund may invest up to 35% of its total assets in any industry that represents more than 20% of the Canadian market. As of April 30, 2018, the Fund did not have more than 25% of its total assets invested in any one industry.
Schedule of Investments April 30, 2018 (Unaudited)
Showing Percentage of Net Assets
| Common Stocks - 97.4% | |||
| Shares | Value | ||
| CONSUMER DISCRETIONARY - 3.8% | |||
| Auto Components - 0.9% | |||
| Magna International, Inc. Class A (sub. vtg.) | 172,600 | $10,193,744 | |
| Hotels, Restaurants & Leisure - 0.4% | |||
| Cara Operations Ltd. | 222,000 | 4,619,993 | |
| Leisure Products - 0.3% | |||
| BRP, Inc. | 87,700 | 3,547,753 | |
| Media - 1.5% | |||
| Cogeco Communications, Inc. | 149,400 | 7,960,165 | |
| Quebecor, Inc. Class B (sub. vtg.) | 441,700 | 8,235,755 | |
| 16,195,920 | |||
| Specialty Retail - 0.4% | |||
| AutoCanada, Inc. | 257,100 | 4,369,268 | |
| Textiles, Apparel & Luxury Goods - 0.3% | |||
| ERO Copper Corp. | 411,700 | 2,565,209 | |
| TOTAL CONSUMER DISCRETIONARY | 41,491,887 | ||
| CONSUMER STAPLES - 7.8% | |||
| Food & Staples Retailing - 7.3% | |||
| Alimentation Couche-Tard, Inc. Class B (sub. vtg.) | 773,400 | 33,436,998 | |
| George Weston Ltd. | 259,600 | 21,268,214 | |
| Jean Coutu Group, Inc. Class A (sub. vtg.) (a) | 395,700 | 7,578,382 | |
| Metro, Inc. Class A (sub. vtg.) | 375,295 | 11,908,188 | |
| North West Co., Inc. | 301,300 | 6,479,141 | |
| 80,670,923 | |||
| Tobacco - 0.5% | |||
| Imperial Tobacco Group PLC | 149,313 | 5,353,790 | |
| TOTAL CONSUMER STAPLES | 86,024,713 | ||
| ENERGY - 18.8% | |||
| Energy Equipment & Services - 1.3% | |||
| Canadian Energy Services & Technology Corp. | 2,056,100 | 10,072,720 | |
| ShawCor Ltd. Class A | 221,400 | 4,283,326 | |
| 14,356,046 | |||
| Oil, Gas & Consumable Fuels - 17.5% | |||
| Canadian Natural Resources Ltd. | 890,298 | 32,118,543 | |
| Cenovus Energy, Inc. | 1,228,200 | 12,301,610 | |
| Enbridge, Inc. | 605,000 | 18,325,052 | |
| Kinder Morgan Canada Ltd. (a)(b) | 183,500 | 2,368,157 | |
| NuVista Energy Ltd. (c) | 716,000 | 4,701,024 | |
| Parkland Fuel Corp. (a) | 229,900 | 5,337,684 | |
| Peyto Exploration & Development Corp. (a) | 608,900 | 5,757,269 | |
| Pinnacle Renewable Holds, Inc. | 408,500 | 4,546,489 | |
| PrairieSky Royalty Ltd. (a) | 1,124,518 | 24,934,793 | |
| Suncor Energy, Inc. | 2,011,200 | 76,911,032 | |
| Whitecap Resources, Inc. (a) | 643,100 | 4,658,149 | |
| 191,959,802 | |||
| TOTAL ENERGY | 206,315,848 | ||
| FINANCIALS - 32.6% | |||
| Banks - 21.7% | |||
| Bank of Nova Scotia | 419,900 | 25,809,812 | |
| Royal Bank of Canada | 1,415,500 | 107,643,929 | |
| The Toronto-Dominion Bank | 1,859,700 | 104,445,630 | |
| 237,899,371 | |||
| Capital Markets - 3.5% | |||
| Brookfield Asset Management, Inc. Class A | 247,700 | 9,817,713 | |
| CI Financial Corp. | 596,800 | 12,559,318 | |
| Fairfax India Holdings Corp. (c) | 102,000 | 1,785,000 | |
| Gluskin Sheff + Associates, Inc. | 222,700 | 2,693,665 | |
| TMX Group Ltd. | 198,300 | 11,960,241 | |
| 38,815,937 | |||
| Insurance - 7.4% | |||
| Intact Financial Corp. | 173,725 | 13,246,371 | |
| Power Corp. of Canada (sub. vtg.) | 1,060,900 | 25,209,750 | |
| Sun Life Financial, Inc. | 1,047,900 | 43,256,124 | |
| 81,712,245 | |||
| TOTAL FINANCIALS | 358,427,553 | ||
| HEALTH CARE - 0.6% | |||
| Biotechnology - 0.6% | |||
| Amgen, Inc. | 38,300 | 6,682,584 | |
| INDUSTRIALS - 9.5% | |||
| Professional Services - 0.7% | |||
| Stantec, Inc. | 273,800 | 6,966,818 | |
| Road & Rail - 8.2% | |||
| Canadian National Railway Co. | 476,900 | 36,834,902 | |
| Canadian Pacific Railway Ltd. | 234,700 | 42,825,278 | |
| TransForce, Inc. | 367,600 | 10,641,919 | |
| 90,302,099 | |||
| Trading Companies & Distributors - 0.6% | |||
| Toromont Industries Ltd. | 153,500 | 6,722,462 | |
| TOTAL INDUSTRIALS | 103,991,379 | ||
| INFORMATION TECHNOLOGY - 4.6% | |||
| IT Services - 2.0% | |||
| CGI Group, Inc. Class A (sub. vtg.) (c) | 371,100 | 21,503,828 | |
| Software - 2.6% | |||
| Constellation Software, Inc. | 22,300 | 15,937,653 | |
| Open Text Corp. | 375,328 | 13,250,998 | |
| 29,188,651 | |||
| TOTAL INFORMATION TECHNOLOGY | 50,692,479 | ||
| MATERIALS - 12.3% | |||
| Chemicals - 3.3% | |||
| Methanex Corp. | 19,000 | 1,145,224 | |
| Nutrien Ltd. | 768,681 | 34,993,111 | |
| 36,138,335 | |||
| Containers & Packaging - 1.2% | |||
| CCL Industries, Inc. Class B | 271,500 | 13,169,532 | |
| Metals & Mining - 7.2% | |||
| Agnico Eagle Mines Ltd. (Canada) | 337,600 | 14,206,572 | |
| Barrick Gold Corp. | 383,000 | 5,154,593 | |
| Franco-Nevada Corp. | 272,100 | 19,299,931 | |
| HudBay Minerals, Inc. | 551,400 | 3,852,220 | |
| Lundin Mining Corp. | 1,694,600 | 11,218,583 | |
| Premier Gold Mines Ltd. (c) | 1,683,900 | 3,567,279 | |
| Randgold Resources Ltd. | 113,264 | 9,183,854 | |
| Wheaton Precious Metals Corp. | 584,100 | 12,123,731 | |
| 78,606,763 | |||
| Paper & Forest Products - 0.6% | |||
| Western Forest Products, Inc. | 3,148,000 | 6,791,511 | |
| TOTAL MATERIALS | 134,706,141 | ||
| REAL ESTATE - 0.7% | |||
| Equity Real Estate Investment Trusts (REITs) - 0.7% | |||
| Allied Properties (REIT) | 252,800 | 8,167,097 | |
| TELECOMMUNICATION SERVICES - 6.0% | |||
| Diversified Telecommunication Services - 3.6% | |||
| TELUS Corp. | 1,116,900 | 39,971,615 | |
| Wireless Telecommunication Services - 2.4% | |||
| Rogers Communications, Inc. Class B (non-vtg.) | 545,500 | 25,750,812 | |
| TOTAL TELECOMMUNICATION SERVICES | 65,722,427 | ||
| UTILITIES - 0.7% | |||
| Electric Utilities - 0.7% | |||
| Hydro One Ltd. (b) | 495,600 | 7,870,465 | |
| TOTAL COMMON STOCKS | |||
| (Cost $773,555,131) | 1,070,092,573 | ||
| Money Market Funds - 4.5% | |||
| Fidelity Cash Central Fund, 1.74% (d) | 28,395,462 | 28,401,141 | |
| Fidelity Securities Lending Cash Central Fund 1.74% (d)(e) | 20,808,939 | 20,811,019 | |
| TOTAL MONEY MARKET FUNDS | |||
| (Cost $49,212,404) | 49,212,160 | ||
| TOTAL INVESTMENT IN SECURITIES - 101.9% | |||
| (Cost $822,767,535) | 1,119,304,733 | ||
| NET OTHER ASSETS (LIABILITIES) - (1.9)% | (21,311,127) | ||
| NET ASSETS - 100% | $1,097,993,606 |
Legend
(a) Security or a portion of the security is on loan at period end.
(b) Security exempt from registration under Rule 144A of the Securities Act of 1933. These securities may be resold in transactions exempt from registration, normally to qualified institutional buyers. At the end of the period, the value of these securities amounted to $10,238,622 or 0.9% of net assets.
(c) Non-income producing
(d) Affiliated fund that is generally available only to investment companies and other accounts managed by Fidelity Investments. The rate quoted is the annualized seven-day yield of the fund at period end. A complete unaudited listing of the fund's holdings as of its most recent quarter end is available upon request. In addition, each Fidelity Central Fund's financial statements are available on the SEC's website or upon request.
(e) Investment made with cash collateral received from securities on loan.
Affiliated Central Funds
Information regarding fiscal year to date income earned by the Fund from investments in Fidelity Central Funds is as follows:
| Fund | Income earned |
| Fidelity Cash Central Fund | $169,353 |
| Fidelity Securities Lending Cash Central Fund | 80,957 |
| Total | $250,310 |
Amounts in the income column in the above table include any capital gain distributions from underlying funds, which are presented in the corresponding line-item in the Statement of Operations if applicable.
Investment Valuation
The following is a summary of the inputs used, as of April 30, 2018, involving the Fund's assets and liabilities carried at fair value. The inputs or methodology used for valuing securities may not be an indication of the risk associated with investing in those securities. For more information on valuation inputs, and their aggregation into the levels used below, please refer to the Investment Valuation section in the accompanying Notes to Financial Statements.
| Valuation Inputs at Reporting Date: | ||||
| Description | Total | Level 1 | Level 2 | Level 3 |
| Investments in Securities: | ||||
| Equities: | ||||
| Consumer Discretionary | $41,491,887 | $41,491,887 | $-- | $-- |
| Consumer Staples | 86,024,713 | 86,024,713 | -- | -- |
| Energy | 206,315,848 | 206,315,848 | -- | -- |
| Financials | 358,427,553 | 358,427,553 | -- | -- |
| Health Care | 6,682,584 | 6,682,584 | -- | -- |
| Industrials | 103,991,379 | 103,991,379 | -- | -- |
| Information Technology | 50,692,479 | 50,692,479 | -- | -- |
| Materials | 134,706,141 | 125,522,287 | 9,183,854 | -- |
| Real Estate | 8,167,097 | 8,167,097 | -- | -- |
| Telecommunication Services | 65,722,427 | 65,722,427 | -- | -- |
| Utilities | 7,870,465 | 7,870,465 | -- | -- |
| Money Market Funds | 49,212,160 | 49,212,160 | -- | -- |
| Total Investments in Securities: | $1,119,304,733 | $1,110,120,879 | $9,183,854 | $-- |
See accompanying notes which are an integral part of the financial statements.
Financial Statements
Statement of Assets and Liabilities
| April 30, 2018 (Unaudited) | ||
| Assets | ||
| Investment in securities, at value (including securities loaned of $19,547,539) — See accompanying schedule: Unaffiliated issuers (cost $773,555,131) | $1,070,092,573 | |
| Fidelity Central Funds (cost $49,212,404) | 49,212,160 | |
| Total Investment in Securities (cost $822,767,535) | $1,119,304,733 | |
| Foreign currency held at value (cost $935,838) | 935,838 | |
| Receivable for investments sold | 1,366,515 | |
| Receivable for fund shares sold | 178,794 | |
| Dividends receivable | 1,474,955 | |
| Distributions receivable from Fidelity Central Funds | 36,110 | |
| Prepaid expenses | 694 | |
| Other receivables | 39,311 | |
| Total assets | 1,123,336,950 | |
| Liabilities | ||
| Payable for investments purchased | $223,596 | |
| Payable for fund shares redeemed | 3,399,999 | |
| Accrued management fee | 612,513 | |
| Distribution and service plan fees payable | 22,133 | |
| Other affiliated payables | 235,113 | |
| Other payables and accrued expenses | 42,785 | |
| Collateral on securities loaned | 20,807,205 | |
| Total liabilities | 25,343,344 | |
| Net Assets | $1,097,993,606 | |
| Net Assets consist of: | ||
| Paid in capital | $774,388,722 | |
| Undistributed net investment income | 5,042,647 | |
| Accumulated undistributed net realized gain (loss) on investments and foreign currency transactions | 22,026,264 | |
| Net unrealized appreciation (depreciation) on investments and assets and liabilities in foreign currencies | 296,535,973 | |
| Net Assets | $1,097,993,606 | |
| Calculation of Maximum Offering Price | ||
| Class A: | ||
| Net Asset Value and redemption price per share ($33,263,501 ÷ 638,650 shares) | $52.08 | |
| Maximum offering price per share (100/94.25 of $52.08) | $55.26 | |
| Class M: | ||
| Net Asset Value and redemption price per share ($9,042,446 ÷ 174,386 shares) | $51.85 | |
| Maximum offering price per share (100/96.50 of $51.85) | $53.73 | |
| Class C: | ||
| Net Asset Value and offering price per share ($13,641,752 ÷ 267,861 shares)(a) | $50.93 | |
| Canada: | ||
| Net Asset Value, offering price and redemption price per share ($1,015,215,064 ÷ 19,417,537 shares) | $52.28 | |
| Class I: | ||
| Net Asset Value, offering price and redemption price per share ($26,830,843 ÷ 514,185 shares) | $52.18 |
(a) Redemption price per share is equal to net asset value less any applicable contingent deferred sales charge.
See accompanying notes which are an integral part of the financial statements.
Statement of Operations
| Six months ended April 30, 2018 (Unaudited) | ||
| Investment Income | ||
| Dividends | $15,786,711 | |
| Income from Fidelity Central Funds | 250,310 | |
| Income before foreign taxes withheld | 16,037,021 | |
| Less foreign taxes withheld | (2,273,763) | |
| Total income | 13,763,258 | |
| Expenses | ||
| Management fee | ||
| Basic fee | $4,027,533 | |
| Performance adjustment | (202,722) | |
| Transfer agent fees | 1,189,210 | |
| Distribution and service plan fees | 143,662 | |
| Accounting and security lending fees | 269,058 | |
| Custodian fees and expenses | 9,623 | |
| Independent trustees' fees and expenses | 2,374 | |
| Registration fees | 60,824 | |
| Audit | 37,709 | |
| Legal | 4,182 | |
| Miscellaneous | 4,207 | |
| Total expenses before reductions | 5,545,660 | |
| Expense reductions | (50,163) | 5,495,497 |
| Net investment income (loss) | 8,267,761 | |
| Realized and Unrealized Gain (Loss) | ||
| Net realized gain (loss) on: | ||
| Investment securities: | ||
| Unaffiliated issuers | 30,718,912 | |
| Fidelity Central Funds | 1,598 | |
| Foreign currency transactions | 6,659 | |
| Total net realized gain (loss) | 30,727,169 | |
| Change in net unrealized appreciation (depreciation) on: | ||
| Investment securities: | ||
| Unaffiliated issuers | (57,359,405) | |
| Fidelity Central Funds | (244) | |
| Assets and liabilities in foreign currencies | 8,388 | |
| Total change in net unrealized appreciation (depreciation) | (57,351,261) | |
| Net gain (loss) | (26,624,092) | |
| Net increase (decrease) in net assets resulting from operations | $(18,356,331) |
See accompanying notes which are an integral part of the financial statements.
Statement of Changes in Net Assets
| Six months ended April 30, 2018 (Unaudited) | Year ended October 31, 2017 | |
| Increase (Decrease) in Net Assets | ||
| Operations | ||
| Net investment income (loss) | $8,267,761 | $16,819,801 |
| Net realized gain (loss) | 30,727,169 | 52,938,459 |
| Change in net unrealized appreciation (depreciation) | (57,351,261) | 105,995,484 |
| Net increase (decrease) in net assets resulting from operations | (18,356,331) | 175,753,744 |
| Distributions to shareholders from net investment income | (16,688,588) | (16,443,381) |
| Distributions to shareholders from net realized gain | (10,788,163) | (5,168,976) |
| Total distributions | (27,476,751) | (21,612,357) |
| Share transactions - net increase (decrease) | (81,412,128) | (276,985,730) |
| Redemption fees | 5,144 | 38,887 |
| Total increase (decrease) in net assets | (127,240,066) | (122,805,456) |
| Net Assets | ||
| Beginning of period | 1,225,233,672 | 1,348,039,128 |
| End of period | $1,097,993,606 | $1,225,233,672 |
| Other Information | ||
| Undistributed net investment income end of period | $5,042,647 | $13,463,474 |
See accompanying notes which are an integral part of the financial statements.
Financial Highlights
Fidelity Canada Fund Class A
| Six months ended (Unaudited) April 30, | Years endedOctober 31, | |||||
| 2018 | 2017 | 2016 | 2015 | 2014 | 2013 | |
| Selected Per–Share Data | ||||||
| Net asset value, beginning of period | $54.11 | $48.09 | $45.25 | $60.56 | $57.31 | $53.65 |
| Income from Investment Operations | ||||||
| Net investment income (loss)A | .30 | .50 | .48 | .45 | .47 | .60 |
| Net realized and unrealized gain (loss) | (1.25) | 6.16 | 2.84 | (8.04) | 3.13 | 3.63 |
| Total from investment operations | (.95) | 6.66 | 3.32 | (7.59) | 3.60 | 4.23 |
| Distributions from net investment income | (.59) | (.45) | (.42) | (.50) | (.03) | (.57) |
| Distributions from net realized gain | (.49) | (.19) | (.06) | (7.22) | (.32) | – |
| Total distributions | (1.08) | (.64) | (.48) | (7.72) | (.35) | (.57) |
| Redemption fees added to paid in capitalA,B | – | – | – | – | – | – |
| Net asset value, end of period | $52.08 | $54.11 | $48.09 | $45.25 | $60.56 | $57.31 |
| Total ReturnC,D,E | (1.80)% | 13.98% | 7.45% | (14.32)% | 6.32% | 7.98% |
| Ratios to Average Net AssetsF,G | ||||||
| Expenses before reductions | 1.24%H | 1.34% | 1.48% | 1.43% | 1.29% | 1.19% |
| Expenses net of fee waivers, if any | 1.24%H | 1.34% | 1.48% | 1.43% | 1.29% | 1.19% |
| Expenses net of all reductions | 1.23%H | 1.34% | 1.48% | 1.43% | 1.29% | 1.18% |
| Net investment income (loss) | 1.13%H | .98% | 1.06% | .90% | .79% | 1.11% |
| Supplemental Data | ||||||
| Net assets, end of period (000 omitted) | $33,264 | $37,557 | $44,144 | $58,286 | $95,004 | $116,661 |
| Portfolio turnover rateI | 26%H | 26% | 44% | 24% | 85% | 64% |
A Calculated based on average shares outstanding during the period.
B Amount represents less than $.005 per share.
C Total returns for periods of less than one year are not annualized.
D Total returns would have been lower if certain expenses had not been reduced during the applicable periods shown.
E Total returns do not include the effect of the sales charges.
F Fees and expenses of any underlying Fidelity Central Funds are not included in the Fund's expense ratio. The Fund indirectly bears its proportionate share of the expenses of any underlying Fidelity Central Funds.
G Expense ratios reflect operating expenses of the class. Expenses before reductions do not reflect amounts reimbursed by the investment adviser or reductions from brokerage service arrangements or reductions from other expense offset arrangements and do not represent the amount paid by the class during periods when reimbursements or reductions occur. Expenses net of fee waivers reflect expenses after reimbursement by the investment adviser but prior to reductions from brokerage service arrangements or other expense offset arrangements. Expenses net of all reductions represent the net expenses paid by the class.
H Annualized
I Amount does not include the portfolio activity of any underlying Fidelity Central Funds.
See accompanying notes which are an integral part of the financial statements.
Fidelity Canada Fund Class M
| Six months ended (Unaudited) April 30, | Years endedOctober 31, | |||||
| 2018 | 2017 | 2016 | 2015 | 2014 | 2013 | |
| Selected Per–Share Data | ||||||
| Net asset value, beginning of period | $53.77 | $47.82 | $44.99 | $60.22 | $57.14 | $53.48 |
| Income from Investment Operations | ||||||
| Net investment income (loss)A | .22 | .35 | .35 | .29 | .29 | .45 |
| Net realized and unrealized gain (loss) | (1.25) | 6.13 | 2.83 | (8.00) | 3.11 | 3.63 |
| Total from investment operations | (1.03) | 6.48 | 3.18 | (7.71) | 3.40 | 4.08 |
| Distributions from net investment income | (.40) | (.34) | (.29) | (.30) | – | (.42) |
| Distributions from net realized gain | (.49) | (.19) | (.06) | (7.22) | (.32) | – |
| Total distributions | (.89) | (.53) | (.35) | (7.52) | (.32) | (.42) |
| Redemption fees added to paid in capitalA,B | – | – | – | – | – | – |
| Net asset value, end of period | $51.85 | $53.77 | $47.82 | $44.99 | $60.22 | $57.14 |
| Total ReturnC,D,E | (1.95)% | 13.64% | 7.14% | (14.58)% | 5.99% | 7.69% |
| Ratios to Average Net AssetsF,G | ||||||
| Expenses before reductions | 1.54%H | 1.63% | 1.77% | 1.75% | 1.59% | 1.47% |
| Expenses net of fee waivers, if any | 1.54%H | 1.63% | 1.77% | 1.75% | 1.59% | 1.47% |
| Expenses net of all reductions | 1.53%H | 1.63% | 1.77% | 1.75% | 1.59% | 1.46% |
| Net investment income (loss) | .82%H | .69% | .78% | .58% | .48% | .83% |
| Supplemental Data | ||||||
| Net assets, end of period (000 omitted) | $9,042 | $10,356 | $11,140 | $12,820 | $21,989 | $23,751 |
| Portfolio turnover rateI | 26%H | 26% | 44% | 24% | 85% | 64% |
A Calculated based on average shares outstanding during the period.
B Amount represents less than $.005 per share.
C Total returns for periods of less than one year are not annualized.
D Total returns would have been lower if certain expenses had not been reduced during the applicable periods shown.
E Total returns do not include the effect of the sales charges.
F Fees and expenses of any underlying Fidelity Central Funds are not included in the Fund's expense ratio. The Fund indirectly bears its proportionate share of the expenses of any underlying Fidelity Central Funds.
G Expense ratios reflect operating expenses of the class. Expenses before reductions do not reflect amounts reimbursed by the investment adviser or reductions from brokerage service arrangements or reductions from other expense offset arrangements and do not represent the amount paid by the class during periods when reimbursements or reductions occur. Expenses net of fee waivers reflect expenses after reimbursement by the investment adviser but prior to reductions from brokerage service arrangements or other expense offset arrangements. Expenses net of all reductions represent the net expenses paid by the class.
H Annualized
I Amount does not include the portfolio activity of any underlying Fidelity Central Funds.
See accompanying notes which are an integral part of the financial statements.
Fidelity Canada Fund Class C
| Six months ended (Unaudited) April 30, | Years endedOctober 31, | |||||
| 2018 | 2017 | 2016 | 2015 | 2014 | 2013 | |
| Selected Per–Share Data | ||||||
| Net asset value, beginning of period | $52.72 | $46.87 | $44.02 | $59.04 | $56.27 | $52.61 |
| Income from Investment Operations | ||||||
| Net investment income (loss)A | .10 | .13 | .15 | .07 | .02 | .20 |
| Net realized and unrealized gain (loss) | (1.22) | 6.01 | 2.78 | (7.85) | 3.07 | 3.58 |
| Total from investment operations | (1.12) | 6.14 | 2.93 | (7.78) | 3.09 | 3.78 |
| Distributions from net investment income | (.18) | (.11) | (.02) | (.02) | – | (.12) |
| Distributions from net realized gain | (.49) | (.19) | (.06) | (7.22) | (.32) | – |
| Total distributions | (.67) | (.29)B | (.08) | (7.24) | (.32) | (.12) |
| Redemption fees added to paid in capitalA,C | – | – | – | – | – | – |
| Net asset value, end of period | $50.93 | $52.72 | $46.87 | $44.02 | $59.04 | $56.27 |
| Total ReturnD,E,F | (2.15)% | 13.16% | 6.67% | (14.96)% | 5.53% | 7.21% |
| Ratios to Average Net AssetsG,H | ||||||
| Expenses before reductions | 1.97%I | 2.06% | 2.21% | 2.19% | 2.03% | 1.93% |
| Expenses net of fee waivers, if any | 1.97%I | 2.06% | 2.21% | 2.19% | 2.03% | 1.92% |
| Expenses net of all reductions | 1.96%I | 2.06% | 2.21% | 2.18% | 2.03% | 1.92% |
| Net investment income (loss) | .40%I | .26% | .33% | .14% | .04% | .37% |
| Supplemental Data | ||||||
| Net assets, end of period (000 omitted) | $13,642 | $15,938 | $18,489 | $21,610 | $38,749 | $46,040 |
| Portfolio turnover rateJ | 26%I | 26% | 44% | 24% | 85% | 64% |
A Calculated based on average shares outstanding during the period.
B Total distributions of $.29 per share is comprised of distributions from net investment income of $.105 and distributions from net realized gain of $.188 per share.
C Amount represents less than $.005 per share.
D Total returns for periods of less than one year are not annualized.
E Total returns would have been lower if certain expenses had not been reduced during the applicable periods shown.
F Total returns do not include the effect of the contingent deferred sales charge.
G Fees and expenses of any underlying Fidelity Central Funds are not included in the Fund's expense ratio. The Fund indirectly bears its proportionate share of the expenses of any underlying Fidelity Central Funds.
H Expense ratios reflect operating expenses of the class. Expenses before reductions do not reflect amounts reimbursed by the investment adviser or reductions from brokerage service arrangements or reductions from other expense offset arrangements and do not represent the amount paid by the class during periods when reimbursements or reductions occur. Expenses net of fee waivers reflect expenses after reimbursement by the investment adviser but prior to reductions from brokerage service arrangements or other expense offset arrangements. Expenses net of all reductions represent the net expenses paid by the class.
I Annualized
J Amount does not include the portfolio activity of any underlying Fidelity Central Funds.
See accompanying notes which are an integral part of the financial statements.
Fidelity Canada Fund
| Six months ended (Unaudited) April 30, | Years endedOctober 31, | |||||
| 2018 | 2017 | 2016 | 2015 | 2014 | 2013 | |
| Selected Per–Share Data | ||||||
| Net asset value, beginning of period | $54.41 | $48.35 | $45.55 | $60.95 | $57.72 | $54.05 |
| Income from Investment Operations | ||||||
| Net investment income (loss)A | .39 | .66 | .62 | .60 | .66 | .77 |
| Net realized and unrealized gain (loss) | (1.26) | 6.20 | 2.85 | (8.09) | 3.13 | 3.66 |
| Total from investment operations | (.87) | 6.86 | 3.47 | (7.49) | 3.79 | 4.43 |
| Distributions from net investment income | (.77) | (.61) | (.61) | (.69) | (.24) | (.76) |
| Distributions from net realized gain | (.49) | (.19) | (.06) | (7.22) | (.32) | – |
| Total distributions | (1.26) | (.80) | (.67) | (7.91) | (.56) | (.76) |
| Redemption fees added to paid in capitalA,B | – | – | – | – | – | – |
| Net asset value, end of period | $52.28 | $54.41 | $48.35 | $45.55 | $60.95 | $57.72 |
| Total ReturnC,D | (1.64)% | 14.35% | 7.79% | (14.08)% | 6.64% | 8.32% |
| Ratios to Average Net AssetsE,F | ||||||
| Expenses before reductions | .92%G | 1.02% | 1.17% | 1.15% | .98% | .87% |
| Expenses net of fee waivers, if any | .92%G | 1.02% | 1.17% | 1.15% | .98% | .87% |
| Expenses net of all reductions | .91%G | 1.02% | 1.17% | 1.14% | .98% | .86% |
| Net investment income (loss) | 1.44%G | 1.30% | 1.37% | 1.18% | 1.09% | 1.42% |
| Supplemental Data | ||||||
| Net assets, end of period (000 omitted) | $1,015,215 | $1,130,803 | $1,233,050 | $1,279,488 | $2,057,843 | $2,262,380 |
| Portfolio turnover rateH | 26%G | 26% | 44% | 24% | 85% | 64% |
A Calculated based on average shares outstanding during the period.
B Amount represents less than $.005 per share.
C Total returns for periods of less than one year are not annualized.
D Total returns would have been lower if certain expenses had not been reduced during the applicable periods shown.
E Fees and expenses of any underlying Fidelity Central Funds are not included in the Fund's expense ratio. The Fund indirectly bears its proportionate share of the expenses of any underlying Fidelity Central Funds.
F Expense ratios reflect operating expenses of the class. Expenses before reductions do not reflect amounts reimbursed by the investment adviser or reductions from brokerage service arrangements or reductions from other expense offset arrangements and do not represent the amount paid by the class during periods when reimbursements or reductions occur. Expenses net of fee waivers reflect expenses after reimbursement by the investment adviser but prior to reductions from brokerage service arrangements or other expense offset arrangements. Expenses net of all reductions represent the net expenses paid by the class.
G Annualized
H Amount does not include the portfolio activity of any underlying Fidelity Central Funds.
See accompanying notes which are an integral part of the financial statements.
Fidelity Canada Fund Class I
| Six months ended (Unaudited) April 30, | Years endedOctober 31, | |||||
| 2018 | 2017 | 2016 | 2015 | 2014 | 2013 | |
| Selected Per–Share Data | ||||||
| Net asset value, beginning of period | $54.29 | $48.28 | $45.44 | $60.80 | $57.57 | $53.91 |
| Income from Investment Operations | ||||||
| Net investment income (loss)A | .40 | .67 | .66 | .61 | .65 | .78 |
| Net realized and unrealized gain (loss) | (1.26) | 6.19 | 2.83 | (8.07) | 3.12 | 3.64 |
| Total from investment operations | (.86) | 6.86 | 3.49 | (7.46) | 3.77 | 4.42 |
| Distributions from net investment income | (.77) | (.66) | (.59) | (.68) | (.22) | (.76) |
| Distributions from net realized gain | (.49) | (.19) | (.06) | (7.22) | (.32) | – |
| Total distributions | (1.25)B | (.85) | (.65) | (7.90) | (.54) | (.76) |
| Redemption fees added to paid in capitalA,C | – | – | – | – | – | – |
| Net asset value, end of period | $52.18 | $54.29 | $48.28 | $45.44 | $60.80 | $57.57 |
| Total ReturnD,E | (1.61)% | 14.38% | 7.83% | (14.05)% | 6.62% | 8.34% |
| Ratios to Average Net AssetsF,G | ||||||
| Expenses before reductions | .88%H | 1.00% | 1.14% | 1.13% | 1.00% | .86% |
| Expenses net of fee waivers, if any | .88%H | .99% | 1.13% | 1.12% | 1.00% | .86% |
| Expenses net of all reductions | .87%H | .99% | 1.13% | 1.12% | 1.00% | .85% |
| Net investment income (loss) | 1.49%H | 1.33% | 1.41% | 1.21% | 1.08% | 1.43% |
| Supplemental Data | ||||||
| Net assets, end of period (000 omitted) | $26,831 | $30,581 | $41,217 | $14,846 | $30,165 | $30,831 |
| Portfolio turnover rateI | 26%H | 26% | 44% | 24% | 85% | 64% |
A Calculated based on average shares outstanding during the period.
B Total distributions of $1.25 per share is comprised of distributions from net investment income of $.765 and distributions from net realized gain of $.487 per share.
C Amount represents less than $.005 per share.
D Total returns for periods of less than one year are not annualized.
E Total returns would have been lower if certain expenses had not been reduced during the applicable periods shown.
F Fees and expenses of any underlying Fidelity Central Funds are not included in the Fund's expense ratio. The Fund indirectly bears its proportionate share of the expenses of any underlying Fidelity Central Funds.
G Expense ratios reflect operating expenses of the class. Expenses before reductions do not reflect amounts reimbursed by the investment adviser or reductions from brokerage service arrangements or reductions from other expense offset arrangements and do not represent the amount paid by the class during periods when reimbursements or reductions occur. Expenses net of fee waivers reflect expenses after reimbursement by the investment adviser but prior to reductions from brokerage service arrangements or other expense offset arrangements. Expenses net of all reductions represent the net expenses paid by the class.
H Annualized
I Amount does not include the portfolio activity of any underlying Fidelity Central Funds.
See accompanying notes which are an integral part of the financial statements.
Notes to Financial Statements (Unaudited)
For the period ended April 30, 2018
1. Organization.
Fidelity Canada Fund (the Fund) is a fund of Fidelity Investment Trust (the Trust) and is authorized to issue an unlimited number of shares. The Trust is registered under the Investment Company Act of 1940, as amended (the 1940 Act), as an open-end management investment company organized as a Massachusetts business trust. The Fund offers Class A, Class M, Class C, Canada and Class I shares, each of which has equal rights as to assets and voting privileges. Each class has exclusive voting rights with respect to matters that affect that class.
2. Investments in Fidelity Central Funds.
The Fund invests in Fidelity Central Funds, which are open-end investment companies generally available only to other investment companies and accounts managed by the investment adviser and its affiliates. The Fund's Schedule of Investments lists each of the Fidelity Central Funds held as of period end, if any, as an investment of the Fund, but does not include the underlying holdings of each Fidelity Central Fund. As an Investing Fund, the Fund indirectly bears its proportionate share of the expenses of the underlying Fidelity Central Funds.
The Money Market Central Funds seek preservation of capital and current income and are managed by Fidelity Investments Money Management, Inc. (FIMM), an affiliate of the investment adviser. Annualized expenses of the Money Market Central Funds as of their most recent shareholder report date are less than .005%.
A complete unaudited list of holdings for each Fidelity Central Fund is available upon request or at the Securities and Exchange Commission (the SEC) website at www.sec.gov. In addition, the financial statements of the Fidelity Central Funds are available on the SEC website or upon request.
3. Significant Accounting Policies.
The Fund is an investment company and applies the accounting and reporting guidance of the Financial Accounting Standards Board (FASB) Accounting Standards Codification Topic 946 Financial Services – Investments Companies. The financial statements have been prepared in conformity with accounting principles generally accepted in the United States of America (GAAP), which require management to make certain estimates and assumptions at the date of the financial statements. Actual results could differ from those estimates. Subsequent events, if any, through the date that the financial statements were issued have been evaluated in the preparation of the financial statements. The following summarizes the significant accounting policies of the Fund:
Investment Valuation. Investments are valued as of 4:00 p.m. Eastern time on the last calendar day of the period. The Board of Trustees (the Board) has delegated the day to day responsibility for the valuation of the Fund's investments to the Fair Value Committee (the Committee) established by the Fund's investment adviser. In accordance with valuation policies and procedures approved by the Board, the Fund attempts to obtain prices from one or more third party pricing vendors or brokers to value its investments. When current market prices, quotations or currency exchange rates are not readily available or reliable, investments will be fair valued in good faith by the Committee, in accordance with procedures adopted by the Board. Factors used in determining fair value vary by investment type and may include market or investment specific events. The frequency with which these procedures are used cannot be predicted and they may be utilized to a significant extent. The Committee oversees the Fund's valuation policies and procedures and reports to the Board on the Committee's activities and fair value determinations. The Board monitors the appropriateness of the procedures used in valuing the Fund's investments and ratifies the fair value determinations of the Committee.
The Fund categorizes the inputs to valuation techniques used to value its investments into a disclosure hierarchy consisting of three levels as shown below:
- Level 1 – quoted prices in active markets for identical investments
- Level 2 – other significant observable inputs (including quoted prices for similar investments, interest rates, prepayment speeds, etc.)
- Level 3 – unobservable inputs (including the Fund's own assumptions based on the best information available)
Valuation techniques used to value the Fund's investments by major category are as follows:
Equity securities, including restricted securities, for which market quotations are readily available, are valued at the last reported sale price or official closing price as reported by a third party pricing vendor on the primary market or exchange on which they are traded and are categorized as Level 1 in the hierarchy. In the event there were no sales during the day or closing prices are not available, securities are valued at the last quoted bid price or may be valued using the last available price and are generally categorized as Level 2 in the hierarchy. For foreign equity securities, when market or security specific events arise, comparisons to the valuation of American Depositary Receipts (ADRs), futures contracts, Exchange-Traded Funds (ETFs) and certain indexes as well as quoted prices for similar securities may be used and would be categorized as Level 2 in the hierarchy. Utilizing these techniques may result in transfers between Level 1 and Level 2. For equity securities, including restricted securities, where observable inputs are limited, assumptions about market activity and risk are used and these securities may be categorized as Level 3 in the hierarchy.
Investments in open-end mutual funds, including the Fidelity Central Funds, are valued at their closing net asset value (NAV) each business day and are categorized as Level 1 in the hierarchy.
Changes in valuation techniques may result in transfers in or out of an assigned level within the disclosure hierarchy. The aggregate value of investments by input level as of April 30, 2018 is included at the end of the Fund's Schedule of Investments.
Foreign Currency. The Fund may use foreign currency contracts to facilitate transactions in foreign-denominated securities. Gains and losses from these transactions may arise from changes in the value of the foreign currency or if the counterparties do not perform under the contracts' terms.
Foreign-denominated assets, including investment securities, and liabilities are translated into U.S. dollars at the exchange rates at period end. Purchases and sales of investment securities, income and dividends received and expenses denominated in foreign currencies are translated into U.S. dollars at the exchange rate in effect on the transaction date.
The effects of exchange rate fluctuations on investments are included with the net realized and unrealized gain (loss) on investment securities. Other foreign currency transactions resulting in realized and unrealized gain (loss) are disclosed separately.
Investment Transactions and Income. For financial reporting purposes, the Fund's investment holdings and NAV include trades executed through the end of the last business day of the period. The NAV per share for processing shareholder transactions is calculated as of the close of business of the New York Stock Exchange (NYSE), normally 4:00 p.m. Eastern time and includes trades executed through the end of the prior business day. Gains and losses on securities sold are determined on the basis of identified cost and includes proceeds received from litigation. Dividend income is recorded on the ex-dividend date, except for certain dividends from foreign securities where the ex-dividend date may have passed, which are recorded as soon as the Fund is informed of the ex-dividend date. Non-cash dividends included in dividend income, if any, are recorded at the fair market value of the securities received. Income and capital gain distributions from Fidelity Central Funds, if any, are recorded on the ex-dividend date. Certain distributions received by the Fund represent a return of capital or capital gain. The Fund determines the components of these distributions subsequent to the ex-dividend date, based upon receipt of tax filings or other correspondence relating to the underlying investment. These distributions are recorded as a reduction of cost of investments and/or as a realized gain. Investment income is recorded net of foreign taxes withheld where recovery of such taxes is uncertain.
Class Allocations and Expenses. Investment income, realized and unrealized capital gains and losses, common expenses of the Fund, and certain fund-level expense reductions, if any, are allocated daily on a pro-rata basis to each class based on the relative net assets of each class to the total net assets of the Fund. Each class differs with respect to transfer agent and distribution and service plan fees incurred. Certain expense reductions may also differ by class. For the reporting period, the allocated portion of income and expenses to each class as a percent of its average net assets may vary due to the timing of recording these transactions in relation to fluctuating net assets of the classes. Expenses directly attributable to a fund are charged to that fund. Expenses attributable to more than one fund are allocated among the respective funds on the basis of relative net assets or other appropriate methods. Expense estimates are accrued in the period to which they relate and adjustments are made when actual amounts are known.
Income Tax Information and Distributions to Shareholders. Each year, the Fund intends to qualify as a regulated investment company under Subchapter M of the Internal Revenue Code, including distributing substantially all of its taxable income and realized gains. As a result, no provision for U.S. Federal income taxes is required. The Fund files a U.S. federal tax return, in addition to state and local tax returns as required. The Fund's federal income tax returns are subject to examination by the Internal Revenue Service (IRS) for a period of three fiscal years after they are filed. State and local tax returns may be subject to examination for an additional fiscal year depending on the jurisdiction. Foreign taxes are provided for based on the Fund's understanding of the tax rules and rates that exist in the foreign markets in which it invests.
Distributions are declared and recorded on the ex-dividend date. Income and capital gain distributions are declared separately for each class. Income and capital gain distributions are determined in accordance with income tax regulations, which may differ from GAAP.
Capital accounts within the financial statements are adjusted for permanent book-tax differences. These adjustments have no impact on net assets or the results of operations. Capital accounts are not adjusted for temporary book-tax differences which will reverse in a subsequent period.
Book-tax differences are primarily due to foreign currency transactions, passive foreign investment companies (PFIC), capital loss carryforwards, deferred trustees compensation and losses deferred due to wash sales.
As of period end, the cost and unrealized appreciation (depreciation) in securities, and derivatives if applicable, for federal income tax purposes were as follows:
| Gross unrealized appreciation | $311,941,162 |
| Gross unrealized depreciation | (22,518,838) |
| Net unrealized appreciation (depreciation) | $289,422,324 |
| Tax cost | $829,882,409 |
Short-Term Trading (Redemption) Fees. Shares held by investors in the Fund less than 90 days may have been subject to a redemption fee equal to 1.50% of the NAV of shares redeemed. All redemption fees, which reduce the proceeds of the shareholder redemption, are retained by the Fund and accounted for as an addition to paid in capital. In November 2017, the Board of Trustees approved the elimination of these redemption fees effective December 18, 2017.
Restricted Securities. The Fund may invest in securities that are subject to legal or contractual restrictions on resale. These securities generally may be resold in transactions exempt from registration or to the public if the securities are registered. Disposal of these securities may involve time-consuming negotiations and expense, and prompt sale at an acceptable price may be difficult. Information regarding restricted securities is included at the end of the Fund's Schedule of Investments.
4. Purchases and Sales of Investments.
Purchases and sales of securities, other than short-term securities, aggregated $150,799,819 and $248,259,849, respectively.
5. Fees and Other Transactions with Affiliates.
Management Fee. Fidelity Management & Research Company (the investment adviser) and its affiliates provide the Fund with investment management related services for which the Fund pays a monthly management fee. The management fee is the sum of an individual fund fee rate that is based on an annual rate of .45% of the Fund's average net assets and an annualized group fee rate that averaged .24% during the period. The group fee rate is based upon the average net assets of all the mutual funds advised by the investment adviser, including any mutual funds previously advised by the investment adviser that are currently advised by Fidelity SelectCo, LLC, an affiliate of the investment adviser. The group fee rate decreases as assets under management increase and increases as assets under management decrease. In addition, the management fee is subject to a performance adjustment (up to a maximum of +/- .20% of the Fund's average net assets over a 36 month performance period). The upward or downward adjustment to the management fee is based on the relative investment performance of Canada as compared to its benchmark index, the S&P/TSX Composite Index, over the same 36 month performance period. For the reporting period, the total annualized management fee rate, including the performance adjustment, was .66% of the Fund's average net assets. The performance adjustment included in the management fee rate may be higher or lower than the maximum performance adjustment rate due to the difference between the average net assets for the reporting and performance periods.
Distribution and Service Plan Fees. In accordance with Rule 12b-1 of the 1940 Act, the Fund has adopted separate Distribution and Service Plans for each class of shares. Certain classes pay Fidelity Distributors Corporation (FDC), an affiliate of the investment adviser, separate Distribution and Service Fees, each of which is based on an annual percentage of each class' average net assets. In addition, FDC may pay financial intermediaries for selling shares of the Fund and providing shareholder support services. For the period, the Distribution and Service Fee rates, total fees and amounts retained by FDC were as follows:
| Distribution Fee | Service Fee | Total Fees | Retained by FDC | |
| Class A | -% | .25% | $44,677 | $691 |
| Class M | .25% | .25% | 24,310 | 297 |
| Class C | .75% | .25% | 74,675 | 2,567 |
| $143,662 | $3,555 |
Sales Load. FDC may receive a front-end sales charge of up to 5.75% for selling Class A shares and 3.50% for selling Class M shares, some of which is paid to financial intermediaries for selling shares of the Fund. Depending on the holding period, FDC may receive contingent deferred sales charges levied on Class A, Class M and Class C redemptions. The deferred sales charges are 1.00% for Class C shares, 1.00% for certain purchases of Class A shares and .25% for certain purchases of Class M shares.
For the period, sales charge amounts retained by FDC were as follows:
| Retained by FDC | |
| Class A | $3,864 |
| Class M | 1,224 |
| Class C(a) | 385 |
| $5,473 |
(a) When Class C shares are initially sold, FDC pays commissions from its own resources to financial intermediaries through which the sales are made.
Transfer Agent Fees. Fidelity Investments Institutional Operations Company, Inc., (FIIOC), an affiliate of the investment adviser, is the transfer, dividend disbursing and shareholder servicing agent for each class of the Fund. FIIOC receives account fees and asset-based fees that vary according to the account size and type of account of the shareholders of the respective classes of the Fund. FIIOC pays for typesetting, printing and mailing of shareholder reports, except proxy statements.
For the period, transfer agent fees for each class were as follows:
| Amount | % of Class-Level Average Net Assets(a) | |
| Class A | $48,031 | .27 |
| Class M | 15,624 | .32 |
| Class C | 18,565 | .25 |
| Canada | 1,083,299 | .20 |
| Class I | 23,691 | .16 |
| $1,189,210 |
(a) Annualized
Accounting and Security Lending Fees. Fidelity Service Company, Inc. (FSC), an affiliate of the investment adviser, maintains the Fund's accounting records. The accounting fee is based on the level of average net assets for each month. Under a separate contract, FSC administers the security lending program. The security lending fee is based on the number and duration of lending transactions. For the period, the fees were equivalent to an annualized rate of .05%.
Interfund Trades. The Fund may purchase from or sell securities to other Fidelity Funds under procedures adopted by the Board. The procedures have been designed to ensure these interfund trades are executed in accordance with Rule 17a-7 of the 1940 Act. Interfund trades are included within the respective purchases and sales amounts shown in the Purchases and Sales of Investments note.
6. Committed Line of Credit.
The Fund participates with other funds managed by the investment adviser or an affiliate in a $4.25 billion credit facility (the "line of credit") to be utilized for temporary or emergency purposes to fund shareholder redemptions or for other short-term liquidity purposes. The Fund has agreed to pay commitment fees on its pro-rata portion of the line of credit, which amounted to $1,714 and is reflected in Miscellaneous expenses on the Statement of Operations. During the period, the Fund did not borrow on this line of credit.
7. Security Lending.
The Fund lends portfolio securities through a lending agent from time to time in order to earn additional income. For equity securities, a lending agent is used and may loan securities to certain qualified borrowers, including Fidelity Capital Markets (FCM), a broker-dealer affiliated with the Fund. On the settlement date of the loan, the Fund receives collateral (in the form of U.S. Treasury obligations, letters of credit and/or cash) against the loaned securities and maintains collateral in an amount not less than 100% of the market value of the loaned securities during the period of the loan. The market value of the loaned securities is determined at the close of business of the Fund and any additional required collateral is delivered to the Fund on the next business day. The Fund or borrower may terminate the loan at any time, and if the borrower defaults on its obligation to return the securities loaned because of insolvency or other reasons, the Fund may apply collateral received from the borrower against the obligation. The Fund may experience delays and costs in recovering the securities loaned. Any cash collateral received is invested in the Fidelity Securities Lending Cash Central Fund. The value of loaned securities and cash collateral at period end are disclosed on the Fund's Statement of Assets and Liabilities. Security lending income represents the income earned on investing cash collateral, less rebates paid to borrowers and any lending agent fees associated with the loan, plus any premium payments received for lending certain types of securities. Security lending income is presented in the Statement of Operations as a component of income from Fidelity Central Funds. Total security lending income during the period amounted to $80,957. During the period, there were no securities loaned to FCM.
8. Expense Reductions.
Commissions paid to certain brokers with whom the investment adviser, or its affiliates, places trades on behalf of the Fund include an amount in addition to trade execution, which may be rebated back to the Fund to offset certain expenses. This amount totaled $44,134 for the period.
In addition, during the period the investment adviser reimbursed and/or waived a portion of fund-level operating expenses in the amount of $6,029.
9. Distributions to Shareholders.
Distributions to shareholders of each class were as follows:
| Six months ended April 30, 2018 | Year ended October 31, 2017 | |
| From net investment income | ||
| Class A | $402,298 | $406,836 |
| Class M | 75,402 | 78,661 |
| Class C | 54,494 | 39,905 |
| Canada | 15,730,428 | 15,352,959 |
| Class I | 425,966 | 565,020 |
| Total | $16,688,588 | $16,443,381 |
| From net realized gain | ||
| Class A | $332,434 | $168,842 |
| Class M | 91,347 | 43,752 |
| Class C | 144,231 | 71,450 |
| Canada | 9,948,981 | 4,723,987 |
| Class I | 271,170 | 160,945 |
| Total | $10,788,163 | $5,168,976 |
10. Share Transactions.
Share transactions for each class were as follows and may contain automatic conversions between classes or exchanges between affiliated funds:
| Shares | Shares | Dollars | Dollars | |
| Six months ended April 30, 2018 | Year ended October 31, 2017 | Six months ended April 30, 2018 | Year ended October 31, 2017 | |
| Class A | ||||
| Shares sold | 23,105 | 63,470 | $1,227,684 | $3,161,163 |
| Reinvestment of distributions | 12,714 | 10,631 | 672,936 | 525,595 |
| Shares redeemed | (91,263) | (297,916) | (4,815,773) | (14,925,894) |
| Net increase (decrease) | (55,444) | (223,815) | $(2,915,153) | $(11,239,136) |
| Class M | ||||
| Shares sold | 4,704 | 24,195 | $246,861 | $1,198,423 |
| Reinvestment of distributions | 3,154 | 2,464 | 166,353 | 121,397 |
| Shares redeemed | (26,077) | (67,009) | (1,386,007) | (3,403,775) |
| Net increase (decrease) | (18,219) | (40,350) | $(972,793) | $(2,083,955) |
| Class C | ||||
| Shares sold | 7,594 | 25,680 | $387,627 | $1,254,827 |
| Reinvestment of distributions | 3,474 | 1,995 | 180,309 | 96,717 |
| Shares redeemed | (45,537) | (119,795) | (2,349,937) | (5,862,219) |
| Net increase (decrease) | (34,469) | (92,120) | $(1,782,001) | $(4,510,675) |
| Canada | ||||
| Shares sold | 336,931 | 1,830,107 | $18,046,020 | $91,494,332 |
| Reinvestment of distributions | 457,772 | 381,896 | 24,289,363 | 18,930,598 |
| Shares redeemed | (2,160,635) | (6,928,660) | (115,553,641) | (353,430,502) |
| Net increase (decrease) | (1,365,932) | (4,716,657) | $(73,218,258) | $(243,005,572) |
| Class I | ||||
| Shares sold | 76,604 | 249,628 | $4,082,696 | $12,551,193 |
| Reinvestment of distributions | 12,538 | 14,338 | 663,882 | 709,005 |
| Shares redeemed | (138,251) | (554,299) | (7,270,501) | (29,406,590) |
| Net increase (decrease) | (49,109) | (290,333) | $(2,523,923) | $(16,146,392) |
11. Other.
The Fund's organizational documents provide former and current trustees and officers with a limited indemnification against liabilities arising in connection with the performance of their duties to the Fund. In the normal course of business, the Fund may also enter into contracts that provide general indemnifications. The Fund's maximum exposure under these arrangements is unknown as this would be dependent on future claims that may be made against the Fund. The risk of material loss from such claims is considered remote.
Shareholder Expense Example
As a shareholder of the Fund, you incur two types of costs: (1) transaction costs, including sales charges (loads) on purchase payments or redemption proceeds, redemption fees and (2) ongoing costs, including management fees, distribution and/or service (12b-1) fees and other Fund expenses. This Example is intended to help you understand your ongoing costs (in dollars) of investing in the Fund and to compare these costs with the ongoing costs of investing in other mutual funds.
The Example is based on an investment of $1,000 invested at the beginning of the period and held for the entire period (November 1, 2017 to April 30, 2018).
Actual Expenses
The first line of the accompanying table for each class of the Fund provides information about actual account values and actual expenses. You may use the information in this line, together with the amount you invested, to estimate the expenses that you paid over the period. Simply divide your account value by $1,000.00 (for example, an $8,600 account value divided by $1,000.00 = 8.6), then multiply the result by the number in the first line for a class of the Fund under the heading entitled "Expenses Paid During Period" to estimate the expenses you paid on your account during this period. A small balance maintenance fee of $12.00 that is charged once a year may apply for certain accounts with a value of less than $2,000. This fee is not included in the table below. If it was, the estimate of expenses you paid during the period would be higher, and your ending account value lower, by this amount. In addition, the Fund, as a shareholder in the underlying Fidelity Central Funds, will indirectly bear its pro-rata share of the fees and expenses incurred by the underlying Fidelity Central Funds. These fees and expenses are not included in the Fund's annualized expense ratio used to calculate the expense estimate in the table below.
Hypothetical Example for Comparison Purposes
The second line of the accompanying table for each class of the Fund provides information about hypothetical account values and hypothetical expenses based on a Class' actual expense ratio and an assumed rate of return of 5% per year before expenses, which is not the Class' actual return. The hypothetical account values and expenses may not be used to estimate the actual ending account balance or expenses you paid for the period. You may use this information to compare the ongoing costs of investing in the Fund and other funds. To do so, compare this 5% hypothetical example with the 5% hypothetical examples that appear in the shareholder reports of the other funds. A small balance maintenance fee of $12.00 that is charged once a year may apply for certain accounts with a value of less than $2,000. This fee is not included in the table below. If it was, the estimate of expenses you paid during the period would be higher, and your ending account value lower, by this amount. In addition, the Fund, as a shareholder in the underlying Fidelity Central Funds, will indirectly bear its pro-rata share of the fees and expenses incurred by the underlying Fidelity Central Funds. These fees and expenses are not included in the Fund's annualized expense ratio used to calculate the expense estimate in the table below.
Please note that the expenses shown in the table are meant to highlight your ongoing costs only and do not reflect any transaction costs. Therefore, the second line of the table is useful in comparing ongoing costs only, and will not help you determine the relative total costs of owning different funds. In addition, if these transactional costs were included, your costs would have been higher.
| Annualized Expense Ratio-A | Beginning Account Value November 1, 2017 | Ending Account Value April 30, 2018 | Expenses Paid During Period-B November 1, 2017 to April 30, 2018 | |
| Class A | 1.24% | |||
| Actual | $1,000.00 | $982.00 | $6.09 | |
| Hypothetical-C | $1,000.00 | $1,018.65 | $6.21 | |
| Class M | 1.54% | |||
| Actual | $1,000.00 | $980.50 | $7.56 | |
| Hypothetical-C | $1,000.00 | $1,017.16 | $7.70 | |
| Class C | 1.97% | |||
| Actual | $1,000.00 | $978.50 | $9.66 | |
| Hypothetical-C | $1,000.00 | $1,015.03 | $9.84 | |
| Canada | .92% | |||
| Actual | $1,000.00 | $983.60 | $4.52 | |
| Hypothetical-C | $1,000.00 | $1,020.23 | $4.61 | |
| Class I | .88% | |||
| Actual | $1,000.00 | $983.90 | $4.33 | |
| Hypothetical-C | $1,000.00 | $1,020.43 | $4.41 |
A Annualized expense ratio reflects expenses net of applicable fee waivers.
B Expenses are equal to each Class' annualized expense ratio, multiplied by the average account value over the period, multiplied by 181/365 (to reflect the one-half year period).
C 5% return per year before expenses
![]()
ACAN-SANN-0618
1.843168.110
Fidelity Advisor® China Region Fund - Semi-Annual Report April 30, 2018 Class A, Class M, Class C and Class I are classes of Fidelity® China Region Fund |
|
Contents
To view a fund's proxy voting guidelines and proxy voting record for the 12-month period ended June 30, visit http://www.fidelity.com/proxyvotingresults or visit the Securities and Exchange Commission's (SEC) web site at http://www.sec.gov.
You may also call 1-877-208-0098 to request a free copy of the proxy voting guidelines.
Standard & Poor's, S&P and S&P 500 are registered service marks of The McGraw-Hill Companies, Inc. and have been licensed for use by Fidelity Distributors Corporation.
Other third-party marks appearing herein are the property of their respective owners.
All other marks appearing herein are registered or unregistered trademarks or service marks of FMR LLC or an affiliated company. © 2018 FMR LLC. All rights reserved.
This report and the financial statements contained herein are submitted for the general information of the shareholders of the Fund. This report is not authorized for distribution to prospective investors in the Fund unless preceded or accompanied by an effective prospectus.
A fund files its complete schedule of portfolio holdings with the SEC for the first and third quarters of each fiscal year on Form N-Q. Forms N-Q are available on the SEC’s web site at http://www.sec.gov. A fund's Forms N-Q may be reviewed and copied at the SEC’s Public Reference Room in Washington, DC. Information regarding the operation of the SEC's Public Reference Room may be obtained by calling 1-800-SEC-0330.
For a complete list of a fund's portfolio holdings, view the most recent holdings listing, semiannual report, or annual report on Fidelity's web site at http://www.fidelity.com, http://www.institutional.fidelity.com, or http://www.401k.com, as applicable.
NOT FDIC INSURED •MAY LOSE VALUE •NO BANK GUARANTEE
Neither the Fund nor Fidelity Distributors Corporation is a bank.
Investment Summary (Unaudited)
Geographic Diversification (% of fund's net assets)
| As of April 30, 2018 | ||
| Cayman Islands | 37.5% | |
| China | 33.4% | |
| Taiwan | 12.8% | |
| Hong Kong | 7.7% | |
| United States of America* | 3.3% | |
| South Africa | 1.6% | |
| Bailiwick of Jersey | 1.2% | |
| Italy | 0.8% | |
| British Virgin Islands | 0.8% | |
| Other | 0.9% | |

* Includes Short-Term investments and Net Other Assets (Liabilities).
Percentages are based on country or territory of incorporation and are adjusted for the effect of futures contracts, if applicable.
Asset Allocation as of April 30, 2018
| % of fund's net assets | |
| Stocks | 96.7 |
| Short-Term Investments and Net Other Assets (Liabilities) | 3.3 |
Top Ten Stocks as of April 30, 2018
| % of fund's net assets | |
| Tencent Holdings Ltd. (Internet Software & Services) | 11.2 |
| Alibaba Group Holding Ltd. sponsored ADR (Internet Software & Services) | 8.6 |
| Taiwan Semiconductor Manufacturing Co. Ltd. (Semiconductors & Semiconductor Equipment) | 5.4 |
| AIA Group Ltd. (Insurance) | 3.1 |
| China Construction Bank Corp. (H Shares) (Banks) | 2.4 |
| CNOOC Ltd. (Oil, Gas & Consumable Fuels) | 2.1 |
| Ping An Insurance (Group) Co. of China Ltd. (H Shares) (Insurance) | 2.0 |
| NetEase, Inc. ADR (Internet Software & Services) | 1.9 |
| Geely Automobile Holdings Ltd. (Automobiles) | 1.8 |
| Industrial & Commercial Bank of China Ltd. (H Shares) (Banks) | 1.7 |
| 40.2 |
Top Market Sectors as of April 30, 2018
| % of fund's net assets | |
| Information Technology | 42.0 |
| Consumer Discretionary | 16.3 |
| Financials | 13.0 |
| Health Care | 5.0 |
| Consumer Staples | 5.0 |
| Materials | 4.8 |
| Industrials | 4.2 |
| Energy | 4.0 |
| Utilities | 1.4 |
| Real Estate | 1.0 |
Market Sectors may include more than one industry category.
The Fund may invest up to 35% of its total assets in any industry that represents more than 20% of the Hong Kong, Taiwanese and Chinese markets. As of April 30, 2018, the Fund did not have more than 25% of its total assets invested in any one industry.
Schedule of Investments April 30, 2018 (Unaudited)
Showing Percentage of Net Assets
| Common Stocks - 96.0% | |||
| Shares | Value | ||
| CONSUMER DISCRETIONARY - 15.6% | |||
| Automobiles - 2.5% | |||
| Geely Automobile Holdings Ltd. | 10,384,000 | $27,310,251 | |
| Guangzhou Automobile Group Co. Ltd. (H Shares) | 5,208,000 | 9,539,576 | |
| 36,849,827 | |||
| Diversified Consumer Services - 2.4% | |||
| New Oriental Education & Technology Group, Inc. sponsored ADR | 229,800 | 20,645,232 | |
| TAL Education Group ADR | 206,600 | 7,524,372 | |
| ZTO Express (Cayman), Inc. sponsored ADR | 471,400 | 7,778,100 | |
| 35,947,704 | |||
| Hotels, Restaurants & Leisure - 1.1% | |||
| Melco Crown Entertainment Ltd. sponsored ADR | 400,000 | 12,484,000 | |
| Summit Ascent Holdings Ltd. (a)(b) | 31,652,000 | 3,781,470 | |
| 16,265,470 | |||
| Household Durables - 3.2% | |||
| Hangzhou Robam Appliances Co. Ltd. Class A | 1,408,391 | 7,411,605 | |
| Midea Group Co. Ltd. Class A | 2,123,600 | 17,266,039 | |
| Sundart Holdings Ltd. | 20,000,000 | 11,678,743 | |
| Techtronic Industries Co. Ltd. | 1,913,500 | 11,209,650 | |
| 47,566,037 | |||
| Internet & Direct Marketing Retail - 2.7% | |||
| Ctrip.com International Ltd. ADR (a) | 99,400 | 4,065,460 | |
| JD.com, Inc. sponsored ADR (a) | 525,700 | 19,193,307 | |
| Vipshop Holdings Ltd. ADR (a) | 1,073,800 | 16,622,424 | |
| 39,881,191 | |||
| Media - 1.6% | |||
| Naspers Ltd. Class N | 99,700 | 24,288,870 | |
| Specialty Retail - 0.4% | |||
| Chow Tai Fook Jewellery Group Ltd. | 5,333,800 | 6,876,690 | |
| Textiles, Apparel & Luxury Goods - 1.7% | |||
| Prada SpA | 2,500,000 | 12,684,764 | |
| Shenzhou International Group Holdings Ltd. | 1,191,000 | 13,001,237 | |
| 25,686,001 | |||
| TOTAL CONSUMER DISCRETIONARY | 233,361,790 | ||
| CONSUMER STAPLES - 5.0% | |||
| Beverages - 4.6% | |||
| Jiangsu Yanghe Brewery Joint-Stock Co. Ltd. Class A | 1,242,989 | 21,901,904 | |
| Kweichow Moutai Co. Ltd. (A Shares) | 204,882 | 21,334,163 | |
| Wuliangye Yibin Co. Ltd. Class A | 2,363,756 | 25,285,717 | |
| 68,521,784 | |||
| Food & Staples Retailing - 0.4% | |||
| COFCO Meat Holdings Ltd. (a)(b) | 34,841,000 | 5,397,830 | |
| TOTAL CONSUMER STAPLES | 73,919,614 | ||
| ENERGY - 4.0% | |||
| Energy Equipment & Services - 1.3% | |||
| China Oilfield Services Ltd. (H Shares) | 19,464,000 | 19,419,153 | |
| Oil, Gas & Consumable Fuels - 2.7% | |||
| CNOOC Ltd. | 18,768,000 | 31,750,083 | |
| PetroChina Co. Ltd. (H Shares) | 10,832,000 | 7,981,768 | |
| 39,731,851 | |||
| TOTAL ENERGY | 59,151,004 | ||
| FINANCIALS - 13.0% | |||
| Banks - 4.1% | |||
| China Construction Bank Corp. (H Shares) | 33,810,000 | 35,421,353 | |
| Industrial & Commercial Bank of China Ltd. (H Shares) | 29,680,000 | 26,055,526 | |
| 61,476,879 | |||
| Capital Markets - 1.3% | |||
| CITIC Securities Co. Ltd. (H Shares) | 4,092,500 | 9,976,418 | |
| Shanghai International Airport Co. Ltd. ELS (UBS Warrant Programme) warrants 5/11/18 (a)(c) | 1,119,000 | 8,735,642 | |
| 18,712,060 | |||
| Insurance - 7.6% | |||
| AIA Group Ltd. | 5,240,400 | 46,834,503 | |
| China Life Insurance Co. Ltd. (H Shares) | 5,682,000 | 16,113,925 | |
| China Pacific Insurance (Group) Co. Ltd. (H Shares) | 4,724,600 | 20,848,141 | |
| Ping An Insurance (Group) Co. of China Ltd. (H Shares) | 3,041,500 | 29,719,712 | |
| 113,516,281 | |||
| TOTAL FINANCIALS | 193,705,220 | ||
| HEALTH CARE - 5.0% | |||
| Health Care Providers & Services - 0.4% | |||
| China Resources Phoenix Health | 4,880,500 | 6,379,114 | |
| Pharmaceuticals - 4.6% | |||
| CSPC Pharmaceutical Group Ltd. | 10,164,000 | 25,888,305 | |
| Jiangsu Hengrui Medicine Co. Ltd. (A Shares) | 32 | 419 | |
| Tonghua Dongbao Pharmaceutical Co. Ltd. Class A | 4,390,487 | 19,861,505 | |
| YiChang HEC ChangJiang Pharmaceutical Co. Ltd. | 2,908,400 | 13,811,016 | |
| Yunnan Baiyao Group Co. Ltd. | 559,400 | 8,353,843 | |
| 67,915,088 | |||
| TOTAL HEALTH CARE | 74,294,202 | ||
| INDUSTRIALS - 4.2% | |||
| Commercial Services & Supplies - 0.8% | |||
| Focused Photonics Hangzhou, Inc. | 2,643,902 | 11,587,018 | |
| Construction & Engineering - 0.1% | |||
| China State Construction International Holdings Ltd. | 1,126,250 | 1,464,748 | |
| Machinery - 2.3% | |||
| Han's Laser Technology Industry Group Co. Ltd. | 821,758 | 6,037,828 | |
| Sany Heavy Industry Co. Ltd. Class A | 7,886,277 | 10,851,282 | |
| Shenzhen Inovance Technology Co. Ltd. Class A | 2,692,250 | 13,931,949 | |
| Zhengzhou Yutong Bus Co. Ltd. | 1,399,918 | 4,522,644 | |
| 35,343,703 | |||
| Transportation Infrastructure - 1.0% | |||
| Shanghai International Airport Co. Ltd. (A Shares) | 1,843,822 | 14,481,643 | |
| TOTAL INDUSTRIALS | 62,877,112 | ||
| INFORMATION TECHNOLOGY - 42.0% | |||
| Communications Equipment - 0.8% | |||
| Nanfang Communication Holdings Ltd. | 20,308,000 | 11,623,062 | |
| Electronic Equipment & Components - 4.7% | |||
| AVIC Jonhon OptronicTechnology Co. Ltd. | 2,918,766 | 17,911,154 | |
| Chroma ATE, Inc. | 3,145,000 | 15,785,803 | |
| Hangzhou Hikvision Digital Technology Co. Ltd. Class A | 3,655,950 | 22,143,658 | |
| Hon Hai Precision Industry Co. Ltd. (Foxconn) | 3,778,400 | 10,490,559 | |
| Lens Technology Co. Ltd. Class A | 1,006,855 | 3,353,692 | |
| 69,684,866 | |||
| Internet Software & Services - 23.8% | |||
| 58.com, Inc. ADR (a) | 219,500 | 19,182,105 | |
| Alibaba Group Holding Ltd. sponsored ADR (a) | 715,300 | 127,709,662 | |
| Momo, Inc. ADR (a) | 300,000 | 10,470,000 | |
| NetEase, Inc. ADR | 113,600 | 29,203,152 | |
| Tencent Holdings Ltd. | 3,405,300 | 167,414,520 | |
| Weibo Corp. sponsored ADR (a)(b) | 9,970 | 1,141,764 | |
| 355,121,203 | |||
| Semiconductors & Semiconductor Equipment - 12.0% | |||
| ASE Industrial Holding Co. Ltd. | 1,697,500 | 4,571,389 | |
| ASM Pacific Technology Ltd. | 800,300 | 10,966,780 | |
| GlobalWafers Co. Ltd. | 1,109,500 | 17,867,353 | |
| Himax Technologies, Inc. sponsored ADR | 800,000 | 5,456,000 | |
| Nanya Technology Corp. | 7,689,000 | 23,892,552 | |
| Silergy Corp. | 457,000 | 9,539,881 | |
| Sino-American Silicon Products, Inc. | 3,751,000 | 16,070,471 | |
| Taiwan Semiconductor Manufacturing Co. Ltd. | 10,627,000 | 80,806,111 | |
| United Microelectronics Corp. | 18,963,000 | 10,208,106 | |
| 179,378,643 | |||
| Technology Hardware, Storage & Peripherals - 0.7% | |||
| ADLINK Technology, Inc. | 3,682,844 | 7,538,787 | |
| Advantech Co. Ltd. | 380,587 | 2,608,101 | |
| 10,146,888 | |||
| TOTAL INFORMATION TECHNOLOGY | 625,954,662 | ||
| MATERIALS - 4.8% | |||
| Construction Materials - 2.2% | |||
| BBMG Corp. (H Shares) | 33,657,000 | 15,351,237 | |
| West China Cement Ltd. | 85,964,000 | 17,435,723 | |
| 32,786,960 | |||
| Metals & Mining - 2.6% | |||
| Aluminum Corp. of China Ltd. (H Shares) (a) | 9,772,000 | 5,519,103 | |
| China Molybdenum Co. Ltd. (H Shares) | 9,999,000 | 7,513,927 | |
| Jiangxi Copper Co. Ltd. (H Shares) | 4,214,000 | 5,991,031 | |
| Zhaojin Mining Industry Co. Ltd. (H Shares) (b) | 8,844,000 | 6,923,079 | |
| Zijin Mng Group Co. Ltd. (H Shares) | 29,330,000 | 13,304,054 | |
| 39,251,194 | |||
| TOTAL MATERIALS | 72,038,154 | ||
| REAL ESTATE - 1.0% | |||
| Real Estate Management & Development - 1.0% | |||
| Beijing Capital Land Ltd. (H Shares) | 27,000,000 | 14,379,194 | |
| UTILITIES - 1.4% | |||
| Independent Power and Renewable Electricity Producers - 1.4% | |||
| Canvest Environmental Protection Group Co. Ltd. | 16,700,000 | 9,265,210 | |
| Huaneng Renewables Corp. Ltd. (H Shares) | 26,040,000 | 11,564,436 | |
| 20,829,646 | |||
| TOTAL COMMON STOCKS | |||
| (Cost $1,006,665,688) | 1,430,510,598 | ||
| Convertible Preferred Stocks - 0.7% | |||
| CONSUMER DISCRETIONARY - 0.7% | |||
| Internet & Direct Marketing Retail - 0.7% | |||
| China Internet Plus Holdings Ltd. Series A-11 (a)(d)(e) | |||
| (Cost $6,268,244) | 1,983,088 | 11,083,598 | |
| Money Market Funds - 3.6% | |||
| Fidelity Cash Central Fund, 1.74% (f) | 50,745,496 | 50,755,645 | |
| Fidelity Securities Lending Cash Central Fund 1.74% (f)(g) | 2,919,083 | 2,919,375 | |
| TOTAL MONEY MARKET FUNDS | |||
| (Cost $53,675,021) | 53,675,020 | ||
| TOTAL INVESTMENT IN SECURITIES - 100.3% | |||
| (Cost $1,066,608,953) | 1,495,269,216 | ||
| NET OTHER ASSETS (LIABILITIES) - (0.3)% | (4,818,742) | ||
| NET ASSETS - 100% | $1,490,450,474 |
Security Type Abbreviations
ELS – Equity-Linked Security
Legend
(a) Non-income producing
(b) Security or a portion of the security is on loan at period end.
(c) Security exempt from registration under Rule 144A of the Securities Act of 1933. These securities may be resold in transactions exempt from registration, normally to qualified institutional buyers. At the end of the period, the value of these securities amounted to $8,735,642 or 0.6% of net assets.
(d) Restricted securities - Investment in securities not registered under the Securities Act of 1933 (excluding 144A issues). At the end of the period, the value of restricted securities (excluding 144A issues) amounted to $11,083,598 or 0.7% of net assets.
(e) Level 3 security
(f) Affiliated fund that is generally available only to investment companies and other accounts managed by Fidelity Investments. The rate quoted is the annualized seven-day yield of the fund at period end. A complete unaudited listing of the fund's holdings as of its most recent quarter end is available upon request. In addition, each Fidelity Central Fund's financial statements are available on the SEC's website or upon request.
(g) Investment made with cash collateral received from securities on loan.
Additional information on each restricted holding is as follows:
| Security | Acquisition Date | Acquisition Cost |
| China Internet Plus Holdings Ltd. Series A-11 | 1/26/15 | $6,268,244 |
Affiliated Central Funds
Information regarding fiscal year to date income earned by the Fund from investments in Fidelity Central Funds is as follows:
| Fund | Income earned |
| Fidelity Cash Central Fund | $532,192 |
| Fidelity Securities Lending Cash Central Fund | 146,593 |
| Total | $678,785 |
Amounts in the income column in the above table include any capital gain distributions from underlying funds, which are presented in the corresponding line-item in the Statement of Operations if applicable.
Investment Valuation
The following is a summary of the inputs used, as of April 30, 2018, involving the Fund's assets and liabilities carried at fair value. The inputs or methodology used for valuing securities may not be an indication of the risk associated with investing in those securities. For more information on valuation inputs, and their aggregation into the levels used below, please refer to the Investment Valuation section in the accompanying Notes to Financial Statements.
| Valuation Inputs at Reporting Date: | ||||
| Description | Total | Level 1 | Level 2 | Level 3 |
| Investments in Securities: | ||||
| Equities: | ||||
| Consumer Discretionary | $244,445,388 | $88,312,895 | $145,048,895 | $11,083,598 |
| Consumer Staples | 73,919,614 | -- | 73,919,614 | -- |
| Energy | 59,151,004 | -- | 59,151,004 | -- |
| Financials | 193,705,220 | -- | 193,705,220 | -- |
| Health Care | 74,294,202 | -- | 74,294,202 | -- |
| Industrials | 62,877,112 | -- | 62,877,112 | -- |
| Information Technology | 625,954,662 | 193,162,683 | 432,791,979 | -- |
| Materials | 72,038,154 | -- | 72,038,154 | -- |
| Real Estate | 14,379,194 | -- | 14,379,194 | -- |
| Utilities | 20,829,646 | -- | 20,829,646 | -- |
| Money Market Funds | 53,675,020 | 53,675,020 | -- | -- |
| Total Investments in Securities: | $1,495,269,216 | $335,150,598 | $1,149,035,020 | $11,083,598 |
The following is a summary of transfers between Level 1 and Level 2 for the period ended April 30, 2018. Transfers are assumed to have occurred at the beginning of the period, and are primarily attributable to the valuation techniques used for foreign equity securities, as discussed in the accompanying Notes to Financial Statements:
| Transfers | Total |
| Level 1 to Level 2 | $685,550,361 |
| Level 2 to Level 1 | $0 |
See accompanying notes which are an integral part of the financial statements.
Financial Statements
Statement of Assets and Liabilities
| April 30, 2018 (Unaudited) | ||
| Assets | ||
| Investment in securities, at value (including securities loaned of $2,576,843) — See accompanying schedule: Unaffiliated issuers (cost $1,012,933,932) | $1,441,594,196 | |
| Fidelity Central Funds (cost $53,675,021) | 53,675,020 | |
| Total Investment in Securities (cost $1,066,608,953) | $1,495,269,216 | |
| Receivable for fund shares sold | 844,206 | |
| Dividends receivable | 807,504 | |
| Distributions receivable from Fidelity Central Funds | 112,286 | |
| Prepaid expenses | 617 | |
| Other receivables | 161,706 | |
| Total assets | 1,497,195,535 | |
| Liabilities | ||
| Payable for fund shares redeemed | $2,303,254 | |
| Accrued management fee | 877,846 | |
| Distribution and service plan fees payable | 24,993 | |
| Other affiliated payables | 288,011 | |
| Other payables and accrued expenses | 331,637 | |
| Collateral on securities loaned | 2,919,320 | |
| Total liabilities | 6,745,061 | |
| Net Assets | $1,490,450,474 | |
| Net Assets consist of: | ||
| Paid in capital | $1,214,114,301 | |
| Accumulated net investment loss | (5,437,479) | |
| Accumulated undistributed net realized gain (loss) on investments and foreign currency transactions | (146,884,586) | |
| Net unrealized appreciation (depreciation) on investments and assets and liabilities in foreign currencies | 428,658,238 | |
| Net Assets | $1,490,450,474 | |
| Calculation of Maximum Offering Price | ||
| Class A: | ||
| Net Asset Value and redemption price per share ($32,393,839 ÷ 909,583 shares) | $35.61 | |
| Maximum offering price per share (100/94.25 of $35.61) | $37.78 | |
| Class M: | ||
| Net Asset Value and redemption price per share ($12,003,073 ÷ 338,578 shares) | $35.45 | |
| Maximum offering price per share (100/96.50 of $35.45) | $36.74 | |
| Class C: | ||
| Net Asset Value and offering price per share ($15,043,929 ÷ 433,317 shares)(a) | $34.72 | |
| China Region: | ||
| Net Asset Value, offering price and redemption price per share ($1,399,025,072 ÷ 38,823,939 shares) | $36.04 | |
| Class I: | ||
| Net Asset Value, offering price and redemption price per share ($31,984,561 ÷ 893,961 shares) | $35.78 |
(a) Redemption price per share is equal to net asset value less any applicable contingent deferred sales charge.
See accompanying notes which are an integral part of the financial statements.
Statement of Operations
| Six months ended April 30, 2018 (Unaudited) | ||
| Investment Income | ||
| Dividends | $1,349,084 | |
| Income from Fidelity Central Funds (including $146,593 from security lending) | 678,785 | |
| Income before foreign taxes withheld | 2,027,869 | |
| Less foreign taxes withheld | (89,757) | |
| Total income | 1,938,112 | |
| Expenses | ||
| Management fee | $5,312,048 | |
| Transfer agent fees | 1,346,929 | |
| Distribution and service plan fees | 151,212 | |
| Accounting and security lending fees | 345,879 | |
| Custodian fees and expenses | 191,735 | |
| Independent trustees' fees and expenses | 2,965 | |
| Registration fees | 108,289 | |
| Audit | 44,555 | |
| Legal | 2,497 | |
| Interest | 2,235 | |
| Miscellaneous | 4,384 | |
| Total expenses before reductions | 7,512,728 | |
| Expense reductions | (233,775) | 7,278,953 |
| Net investment income (loss) | (5,340,841) | |
| Realized and Unrealized Gain (Loss) | ||
| Net realized gain (loss) on: | ||
| Investment securities: | ||
| Unaffiliated issuers | (6,058,897) | |
| Fidelity Central Funds | 351 | |
| Foreign currency transactions | 8,100 | |
| Total net realized gain (loss) | (6,050,446) | |
| Change in net unrealized appreciation (depreciation) on: | ||
| Investment securities: | ||
| Unaffiliated issuers | 69,149,781 | |
| Fidelity Central Funds | (366) | |
| Assets and liabilities in foreign currencies | 774 | |
| Total change in net unrealized appreciation (depreciation) | 69,150,189 | |
| Net gain (loss) | 63,099,743 | |
| Net increase (decrease) in net assets resulting from operations | $57,758,902 |
See accompanying notes which are an integral part of the financial statements.
Statement of Changes in Net Assets
| Six months ended April 30, 2018 (Unaudited) | Year ended October 31, 2017 | |
| Increase (Decrease) in Net Assets | ||
| Operations | ||
| Net investment income (loss) | $(5,340,841) | $6,291,196 |
| Net realized gain (loss) | (6,050,446) | 78,315,721 |
| Change in net unrealized appreciation (depreciation) | 69,150,189 | 266,749,225 |
| Net increase (decrease) in net assets resulting from operations | 57,758,902 | 351,356,142 |
| Distributions to shareholders from net investment income | (5,632,791) | (10,635,865) |
| Distributions to shareholders from net realized gain | – | (1,988,966) |
| Total distributions | (5,632,791) | (12,624,831) |
| Share transactions - net increase (decrease) | 57,326,531 | (22,198,615) |
| Redemption fees | 88,492 | 258,175 |
| Total increase (decrease) in net assets | 109,541,134 | 316,790,871 |
| Net Assets | ||
| Beginning of period | 1,380,909,340 | 1,064,118,469 |
| End of period | $1,490,450,474 | $1,380,909,340 |
| Other Information | ||
| Undistributed net investment income end of period | $– | $5,536,153 |
| Accumulated net investment loss end of period | $(5,437,479) | $– |
See accompanying notes which are an integral part of the financial statements.
Financial Highlights
Fidelity China Region Fund Class A
| Six months ended (Unaudited) April 30, | Years endedOctober 31, | |||||
| 2018 | 2017 | 2016 | 2015 | 2014 | 2013 | |
| Selected Per–Share Data | ||||||
| Net asset value, beginning of period | $34.22 | $25.46 | $29.34 | $34.18 | $35.56 | $28.53 |
| Income from Investment Operations | ||||||
| Net investment income (loss)A | (.18) | .08 | .18 | .40B | .21 | .30 |
| Net realized and unrealized gain (loss) | 1.65 | 8.90 | (.20) | (.83) | 2.01C | 7.06 |
| Total from investment operations | 1.47 | 8.98 | (.02) | (.43) | 2.22 | 7.36 |
| Distributions from net investment income | (.08) | (.18) | (.27) | (.22) | (.30) | (.34) |
| Distributions from net realized gain | – | (.05) | (3.59) | (4.24) | (3.31) | – |
| Total distributions | (.08) | (.23) | (3.86) | (4.46) | (3.61) | (.34) |
| Redemption fees added to paid in capitalA | –D | .01 | –D | .05 | .01 | .01 |
| Net asset value, end of period | $35.61 | $34.22 | $25.46 | $29.34 | $34.18 | $35.56 |
| Total ReturnE,F,G | 4.29% | 35.67% | (.13)% | (1.45)% | 6.45%C | 26.07% |
| Ratios to Average Net AssetsH,I | ||||||
| Expenses before reductions | 1.26%J | 1.30% | 1.33% | 1.28% | 1.35% | 1.35% |
| Expenses net of fee waivers, if any | 1.26%J | 1.30% | 1.33% | 1.28% | 1.35% | 1.35% |
| Expenses net of all reductions | 1.23%J | 1.29% | 1.32% | 1.26% | 1.35% | 1.31% |
| Net investment income (loss) | (.98)%J | .28% | .75% | 1.26%B | .64% | .94% |
| Supplemental Data | ||||||
| Net assets, end of period (000 omitted) | $32,394 | $35,539 | $22,937 | $32,761 | $21,728 | $20,623 |
| Portfolio turnover rateK | 22%J | 68% | 70% | 151% | 87% | 92% |
A Calculated based on average shares outstanding during the period.
B Net Investment income per share reflects a large, non-recurring dividend which amounted to $.13 per share. Excluding this non-recurring dividend, the ratio of net investment income (loss) to average net assets would have been .85%.
C Amount includes a reimbursement from the investment adviser for an operational error which amounted to less than $.01 per share. Excluding this reimbursement, the total return would have been 6.42%.
D Amount represents less than $.005 per share.
E Total returns for periods of less than one year are not annualized.
F Total returns would have been lower if certain expenses had not been reduced during the applicable periods shown.
G Total returns do not include the effect of the sales charges.
H Fees and expenses of any underlying Fidelity Central Funds are not included in the Fund's expense ratio. The Fund indirectly bears its proportionate share of the expenses of any underlying Fidelity Central Funds.
I Expense ratios reflect operating expenses of the class. Expenses before reductions do not reflect amounts reimbursed by the investment adviser or reductions from brokerage service arrangements or reductions from other expense offset arrangements and do not represent the amount paid by the class during periods when reimbursements or reductions occur. Expenses net of fee waivers reflect expenses after reimbursement by the investment adviser but prior to reductions from brokerage service arrangements or other expense offset arrangements. Expenses net of all reductions represent the net expenses paid by the class.
J Annualized
K Amount does not include the portfolio activity of any underlying Fidelity Central Funds.
See accompanying notes which are an integral part of the financial statements.
Fidelity China Region Fund Class M
| Six months ended (Unaudited) April 30, | Years endedOctober 31, | |||||
| 2018 | 2017 | 2016 | 2015 | 2014 | 2013 | |
| Selected Per–Share Data | ||||||
| Net asset value, beginning of period | $34.05 | $25.34 | $29.18 | $34.02 | $35.40 | $28.40 |
| Income from Investment Operations | ||||||
| Net investment income (loss)A | (.24) | (.02) | .10 | .30B | .12 | .21 |
| Net realized and unrealized gain (loss) | 1.64 | 8.88 | (.22) | (.83) | 1.99C | 7.04 |
| Total from investment operations | 1.40 | 8.86 | (.12) | (.53) | 2.11 | 7.25 |
| Distributions from net investment income | – | (.11) | (.13) | (.12) | (.19) | (.26) |
| Distributions from net realized gain | – | (.05) | (3.59) | (4.24) | (3.31) | – |
| Total distributions | – | (.16) | (3.72) | (4.36) | (3.50) | (.26) |
| Redemption fees added to paid in capitalA | –D | .01 | –D | .05 | .01 | .01 |
| Net asset value, end of period | $35.45 | $34.05 | $25.34 | $29.18 | $34.02 | $35.40 |
| Total ReturnE,F,G | 4.11% | 35.25% | (.50)% | (1.79)% | 6.15%C | 25.74% |
| Ratios to Average Net AssetsH,I | ||||||
| Expenses before reductions | 1.61%J | 1.65% | 1.67% | 1.62% | 1.65% | 1.64% |
| Expenses net of fee waivers, if any | 1.61%J | 1.65% | 1.67% | 1.62% | 1.65% | 1.64% |
| Expenses net of all reductions | 1.58%J | 1.64% | 1.67% | 1.60% | 1.65% | 1.60% |
| Net investment income (loss) | (1.33)%J | (.07)% | .40% | .92%B | .35% | .65% |
| Supplemental Data | ||||||
| Net assets, end of period (000 omitted) | $12,003 | $9,763 | $5,644 | $6,409 | $6,305 | $5,965 |
| Portfolio turnover rateK | 22%J | 68% | 70% | 151% | 87% | 92% |
A Calculated based on average shares outstanding during the period.
B Net Investment income per share reflects a large, non-recurring dividend which amounted to $.13 per share. Excluding this non-recurring dividend, the ratio of net investment income (loss) to average net assets would have been .51%.
C Amount includes a reimbursement from the investment adviser for an operational error which amounted to less than $.01 per share. Excluding this reimbursement, the total return would have been 6.12%.
D Amount represents less than $.005 per share.
E Total returns for periods of less than one year are not annualized.
F Total returns would have been lower if certain expenses had not been reduced during the applicable periods shown.
G Total returns do not include the effect of the sales charges.
H Fees and expenses of any underlying Fidelity Central Funds are not included in the Fund's expense ratio. The Fund indirectly bears its proportionate share of the expenses of any underlying Fidelity Central Funds.
I Expense ratios reflect operating expenses of the class. Expenses before reductions do not reflect amounts reimbursed by the investment adviser or reductions from brokerage service arrangements or reductions from other expense offset arrangements and do not represent the amount paid by the class during periods when reimbursements or reductions occur. Expenses net of fee waivers reflect expenses after reimbursement by the investment adviser but prior to reductions from brokerage service arrangements or other expense offset arrangements. Expenses net of all reductions represent the net expenses paid by the class.
J Annualized
K Amount does not include the portfolio activity of any underlying Fidelity Central Funds.
See accompanying notes which are an integral part of the financial statements.
Fidelity China Region Fund Class C
| Six months ended (Unaudited) April 30, | Years endedOctober 31, | |||||
| 2018 | 2017 | 2016 | 2015 | 2014 | 2013 | |
| Selected Per–Share Data | �� | |||||
| Net asset value, beginning of period | $33.41 | $24.82 | $28.68 | $33.56 | $34.99 | $28.07 |
| Income from Investment Operations | ||||||
| Net investment income (loss)A | (.31) | (.13) | –B | .15C | (.02) | .06 |
| Net realized and unrealized gain (loss) | 1.62 | 8.73 | (.21) | (.80) | 1.97D | 6.97 |
| Total from investment operations | 1.31 | 8.60 | (.21) | (.65) | 1.95 | 7.03 |
| Distributions from net investment income | – | – | (.06) | (.04) | (.08) | (.12) |
| Distributions from net realized gain | – | (.02) | (3.59) | (4.24) | (3.31) | – |
| Total distributions | – | (.02) | (3.65) | (4.28) | (3.39) | (.12) |
| Redemption fees added to paid in capitalA | –B | .01 | –B | .05 | .01 | .01 |
| Net asset value, end of period | $34.72 | $33.41 | $24.82 | $28.68 | $33.56 | $34.99 |
| Total ReturnE,F,G | 3.92% | 34.71% | (.88)% | (2.21)% | 5.71%D | 25.14% |
| Ratios to Average Net AssetsH,I | ||||||
| Expenses before reductions | 2.01%J | 2.05% | 2.07% | 2.05% | 2.07% | 2.10% |
| Expenses net of fee waivers, if any | 2.01%J | 2.05% | 2.07% | 2.05% | 2.07% | 2.10% |
| Expenses net of all reductions | 1.98%J | 2.03% | 2.06% | 2.02% | 2.07% | 2.07% |
| Net investment income (loss) | (1.72)%J | (.46)% | .01% | .49%C | (.07)% | .19% |
| Supplemental Data | ||||||
| Net assets, end of period (000 omitted) | $15,044 | $12,952 | $11,218 | $14,355 | $10,445 | $6,957 |
| Portfolio turnover rateK | 22%J | 68% | 70% | 151% | 87% | 92% |
A Calculated based on average shares outstanding during the period.
B Amount represents less than $.005 per share.
C Net Investment income per share reflects a large, non-recurring dividend which amounted to $.13 per share. Excluding this non-recurring dividend, the ratio of net investment income (loss) to average net assets would have been .09%.
D Amount includes a reimbursement from the investment adviser for an operational error which amounted to less than $.01 per share. Excluding this reimbursement, the total return would have been 5.68%.
E Total returns for periods of less than one year are not annualized.
F Total returns would have been lower if certain expenses had not been reduced during the applicable periods shown.
G Total returns do not include the effect of the contingent deferred sales charge.
H Fees and expenses of any underlying Fidelity Central Funds are not included in the Fund's expense ratio. The Fund indirectly bears its proportionate share of the expenses of any underlying Fidelity Central Funds.
I Expense ratios reflect operating expenses of the class. Expenses before reductions do not reflect amounts reimbursed by the investment adviser or reductions from brokerage service arrangements or reductions from other expense offset arrangements and do not represent the amount paid by the class during periods when reimbursements or reductions occur. Expenses net of fee waivers reflect expenses after reimbursement by the investment adviser but prior to reductions from brokerage service arrangements or other expense offset arrangements. Expenses net of all reductions represent the net expenses paid by the class.
J Annualized
K Amount does not include the portfolio activity of any underlying Fidelity Central Funds.
See accompanying notes which are an integral part of the financial statements.
Fidelity China Region Fund
| Six months ended (Unaudited) April 30, | Years endedOctober 31, | |||||
| 2018 | 2017 | 2016 | 2015 | 2014 | 2013 | |
| Selected Per–Share Data | ||||||
| Net asset value, beginning of period | $34.64 | $25.78 | $29.66 | $34.51 | $35.83 | $28.73 |
| Income from Investment Operations | ||||||
| Net investment income (loss)A | (.12) | .17 | .26 | .51B | .33 | .41 |
| Net realized and unrealized gain (loss) | 1.66 | 9.00 | (.21) | (.84) | 2.03C | 7.11 |
| Total from investment operations | 1.54 | 9.17 | .05 | (.33) | 2.36 | 7.52 |
| Distributions from net investment income | (.14) | (.27) | (.35) | (.33) | (.38) | (.43) |
| Distributions from net realized gain | – | (.05) | (3.59) | (4.24) | (3.31) | – |
| Total distributions | (.14) | (.32) | (3.93)D | (4.57) | (3.69) | (.43) |
| Redemption fees added to paid in capitalA | –E | .01 | –E | .05 | .01 | .01 |
| Net asset value, end of period | $36.04 | $34.64 | $25.78 | $29.66 | $34.51 | $35.83 |
| Total ReturnF,G | 4.47% | 36.10% | .15% | (1.14)% | 6.83%C | 26.51% |
| Ratios to Average Net AssetsH,I | ||||||
| Expenses before reductions | .95%J | 1.00% | 1.02% | .99% | 1.01% | 1.02% |
| Expenses net of fee waivers, if any | .95%J | 1.00% | 1.02% | .98% | 1.01% | 1.02% |
| Expenses net of all reductions | .92%J | .99% | 1.01% | .96% | 1.01% | .98% |
| Net investment income (loss) | (.67)%J | .58% | 1.06% | 1.55%B | .99% | 1.27% |
| Supplemental Data | ||||||
| Net assets, end of period (000 omitted) | $1,399,025 | $1,294,775 | $1,004,985 | $1,262,274 | $1,352,761 | $1,425,828 |
| Portfolio turnover rateK | 22%J | 68% | 70% | 151% | 87% | 92% |
A Calculated based on average shares outstanding during the period.
B Net Investment income per share reflects a large, non-recurring dividend which amounted to $.13 per share. Excluding this non-recurring dividend, the ratio of net investment income (loss) to average net assets would have been 1.15%.
C Amount includes a reimbursement from the investment adviser for an operational error which amounted to less than $.01 per share. Excluding this reimbursement, the total return would have been 6.80%.
D Total distributions of $3.93 per share is comprised of distributions from net investment income of $.345 and distributions from net realized gain of $3.588 per share.
E Amount represents less than $.005 per share.
F Total returns for periods of less than one year are not annualized.
G Total returns would have been lower if certain expenses had not been reduced during the applicable periods shown.
H Fees and expenses of any underlying Fidelity Central Funds are not included in the Fund's expense ratio. The Fund indirectly bears its proportionate share of the expenses of any underlying Fidelity Central Funds.
I Expense ratios reflect operating expenses of the class. Expenses before reductions do not reflect amounts reimbursed by the investment adviser or reductions from brokerage service arrangements or reductions from other expense offset arrangements and do not represent the amount paid by the class during periods when reimbursements or reductions occur. Expenses net of fee waivers reflect expenses after reimbursement by the investment adviser but prior to reductions from brokerage service arrangements or other expense offset arrangements. Expenses net of all reductions represent the net expenses paid by the class.
J Annualized
K Amount does not include the portfolio activity of any underlying Fidelity Central Funds.
See accompanying notes which are an integral part of the financial statements.
Fidelity China Region Fund Class I
| Six months ended (Unaudited) April 30, | Years endedOctober 31, | |||||
| 2018 | 2017 | 2016 | 2015 | 2014 | 2013 | |
| Selected Per–Share Data | ||||||
| Net asset value, beginning of period | $34.41 | $25.62 | $29.51 | $34.39 | $35.75 | $28.68 |
| Income from Investment Operations | ||||||
| Net investment income (loss)A | (.13) | .16 | .26 | .51B | .34 | .42 |
| Net realized and unrealized gain (loss) | 1.66 | 8.95 | (.20) | (.84) | 2.02C | 7.10 |
| Total from investment operations | 1.53 | 9.11 | .06 | (.33) | 2.36 | 7.52 |
| Distributions from net investment income | (.16) | (.28) | (.36) | (.36) | (.43) | (.46) |
| Distributions from net realized gain | – | (.05) | (3.59) | (4.24) | (3.31) | – |
| Total distributions | (.16) | (.33) | (3.95) | (4.60) | (3.73)D | (.46) |
| Redemption fees added to paid in capitalA | –E | .01 | –E | .05 | .01 | .01 |
| Net asset value, end of period | $35.78 | $34.41 | $25.62 | $29.51 | $34.39 | $35.75 |
| Total ReturnF,G | 4.46% | 36.11% | .16% | (1.14)% | 6.87%C | 26.58% |
| Ratios to Average Net AssetsH,I | ||||||
| Expenses before reductions | .97%J | 1.01% | 1.00% | .97% | .98% | .97% |
| Expenses net of fee waivers, if any | .97%J | 1.01% | 1.00% | .97% | .98% | .97% |
| Expenses net of all reductions | .94%J | .99% | .99% | .95% | .98% | .93% |
| Net investment income (loss) | (.69)%J | .57% | 1.07% | 1.57%B | 1.01% | 1.32% |
| Supplemental Data | ||||||
| Net assets, end of period (000 omitted) | $31,985 | $27,880 | $19,334 | $26,961 | $19,404 | $10,206 |
| Portfolio turnover rateK | 22%J | 68% | 70% | 151% | 87% | 92% |
A Calculated based on average shares outstanding during the period.
B Net Investment income per share reflects a large, non-recurring dividend which amounted to $.13 per share. Excluding this non-recurring dividend, the ratio of net investment income (loss) to average net assets would have been 1.16%.
C Amount includes a reimbursement from the investment adviser for an operational error which amounted to less than $.01 per share. Excluding this reimbursement, the total return would have been 6.84%.
D Total distributions of $3.73 per share is comprised of distributions from net investment income of $.425 and distributions from net realized gain of $3.306 per share.
E Amount represents less than $.005 per share.
F Total returns for periods of less than one year are not annualized.
G Total returns would have been lower if certain expenses had not been reduced during the applicable periods shown.
H Fees and expenses of any underlying Fidelity Central Funds are not included in the Fund's expense ratio. The Fund indirectly bears its proportionate share of the expenses of any underlying Fidelity Central Funds.
I Expense ratios reflect operating expenses of the class. Expenses before reductions do not reflect amounts reimbursed by the investment adviser or reductions from brokerage service arrangements or reductions from other expense offset arrangements and do not represent the amount paid by the class during periods when reimbursements or reductions occur. Expenses net of fee waivers reflect expenses after reimbursement by the investment adviser but prior to reductions from brokerage service arrangements or other expense offset arrangements. Expenses net of all reductions represent the net expenses paid by the class.
J Annualized
K Amount does not include the portfolio activity of any underlying Fidelity Central Funds.
See accompanying notes which are an integral part of the financial statements.
Notes to Financial Statements (Unaudited)
For the period ended April 30, 2018
1. Organization.
Fidelity China Region Fund (the Fund) is a fund of Fidelity Investment Trust (the Trust) and is authorized to issue an unlimited number of shares. The Trust is registered under the Investment Company Act of 1940, as amended (the 1940 Act), as an open-end management investment company organized as a Massachusetts business trust. The Fund offers Class A, Class M, Class C, China Region and Class I shares, each of which has equal rights as to assets and voting privileges. Each class has exclusive voting rights with respect to matters that affect that class. The Fund's investments in emerging markets can be subject to social, economic, regulatory, and political uncertainties and can be extremely volatile.
2. Investments in Fidelity Central Funds.
The Fund invests in Fidelity Central Funds, which are open-end investment companies generally available only to other investment companies and accounts managed by the investment adviser and its affiliates. The Fund's Schedule of Investments lists each of the Fidelity Central Funds held as of period end, if any, as an investment of the Fund, but does not include the underlying holdings of each Fidelity Central Fund. As an Investing Fund, the Fund indirectly bears its proportionate share of the expenses of the underlying Fidelity Central Funds.
The Money Market Central Funds seek preservation of capital and current income and are managed by Fidelity Investments Money Management, Inc. (FIMM), an affiliate of the investment adviser. Annualized expenses of the Money Market Central Funds as of their most recent shareholder report date are less than .005%.
A complete unaudited list of holdings for each Fidelity Central Fund is available upon request or at the Securities and Exchange Commission (the SEC) website at www.sec.gov. In addition, the financial statements of the Fidelity Central Funds are available on the SEC website or upon request.
3. Significant Accounting Policies.
The Fund is an investment company and applies the accounting and reporting guidance of the Financial Accounting Standards Board (FASB) Accounting Standards Codification Topic 946 Financial Services – Investments Companies. The financial statements have been prepared in conformity with accounting principles generally accepted in the United States of America (GAAP), which require management to make certain estimates and assumptions at the date of the financial statements. Actual results could differ from those estimates. Subsequent events, if any, through the date that the financial statements were issued have been evaluated in the preparation of the financial statements. The following summarizes the significant accounting policies of the Fund:
Investment Valuation. Investments are valued as of 4:00 p.m. Eastern time on the last calendar day of the period. The Board of Trustees (the Board) has delegated the day to day responsibility for the valuation of the Fund's investments to the Fair Value Committee (the Committee) established by the Fund's investment adviser. In accordance with valuation policies and procedures approved by the Board, the Fund attempts to obtain prices from one or more third party pricing vendors or brokers to value its investments. When current market prices, quotations or currency exchange rates are not readily available or reliable, investments will be fair valued in good faith by the Committee, in accordance with procedures adopted by the Board. Factors used in determining fair value vary by investment type and may include market or investment specific events. The frequency with which these procedures are used cannot be predicted and they may be utilized to a significant extent. The Committee oversees the Fund's valuation policies and procedures and reports to the Board on the Committee's activities and fair value determinations. The Board monitors the appropriateness of the procedures used in valuing the Fund's investments and ratifies the fair value determinations of the Committee.
The Fund categorizes the inputs to valuation techniques used to value its investments into a disclosure hierarchy consisting of three levels as shown below:
- Level 1 – quoted prices in active markets for identical investments
- Level 2 – other significant observable inputs (including quoted prices for similar investments, interest rates, prepayment speeds, etc.)
- Level 3– unobservable inputs (including the Fund's own assumptions based on the best information available)
Valuation techniques used to value the Fund's investments by major category are as follows:
Equity securities, including restricted securities, for which market quotations are readily available, are valued at the last reported sale price or official closing price as reported by a third party pricing vendor on the primary market or exchange on which they are traded and are categorized as Level 1 in the hierarchy. In the event there were no sales during the day or closing prices are not available, securities are valued at the last quoted bid price or may be valued using the last available price and are generally categorized as Level 2 in the hierarchy. For foreign equity securities, when market or security specific events arise, comparisons to the valuation of American Depositary Receipts (ADRs), futures contracts, Exchange-Traded Funds (ETFs) and certain indexes as well as quoted prices for similar securities may be used and would be categorized as Level 2 in the hierarchy. Utilizing these techniques may result in transfers between Level 1 and Level 2. For equity securities, including restricted securities, where observable inputs are limited, assumptions about market activity and risk are used and these securities may be categorized as Level 3 in the hierarchy.
Investments in open-end mutual funds, including the Fidelity Central Funds, are valued at their closing net asset value (NAV) each business day and are categorized as Level 1 in the hierarchy.
Changes in valuation techniques may result in transfers in or out of an assigned level within the disclosure hierarchy. The aggregate value of investments by input level as of April 30, 2018, including information on transfers between Levels 1 and 2, is included at the end of the Fund's Schedule of Investments.
Foreign Currency. The Fund may use foreign currency contracts to facilitate transactions in foreign-denominated securities. Gains and losses from these transactions may arise from changes in the value of the foreign currency or if the counterparties do not perform under the contracts' terms.
Foreign-denominated assets, including investment securities, and liabilities are translated into U.S. dollars at the exchange rates at period end. Purchases and sales of investment securities, income and dividends received and expenses denominated in foreign currencies are translated into U.S. dollars at the exchange rate in effect on the transaction date.
The effects of exchange rate fluctuations on investments are included with the net realized and unrealized gain (loss) on investment securities. Other foreign currency transactions resulting in realized and unrealized gain (loss) are disclosed separately.
Investment Transactions and Income. For financial reporting purposes, the Fund's investment holdings and NAV include trades executed through the end of the last business day of the period. The NAV per share for processing shareholder transactions is calculated as of the close of business of the New York Stock Exchange (NYSE), normally 4:00 p.m. Eastern time and includes trades executed through the end of the prior business day. Gains and losses on securities sold are determined on the basis of identified cost. Dividend income is recorded on the ex-dividend date, except for certain dividends from foreign securities where the ex-dividend date may have passed, which are recorded as soon as the Fund is informed of the ex-dividend date. Non-cash dividends included in dividend income, if any, are recorded at the fair market value of the securities received. Income and capital gain distributions from Fidelity Central Funds, if any, are recorded on the ex-dividend date. Investment income is recorded net of foreign taxes withheld where recovery of such taxes is uncertain.
Class Allocations and Expenses. Investment income, realized and unrealized capital gains and losses, common expenses of the Fund, and certain fund-level expense reductions, if any, are allocated daily on a pro-rata basis to each class based on the relative net assets of each class to the total net assets of the Fund. Each class differs with respect to transfer agent and distribution and service plan fees incurred. Certain expense reductions may also differ by class. For the reporting period, the allocated portion of income and expenses to each class as a percent of its average net assets may vary due to the timing of recording these transactions in relation to fluctuating net assets of the classes. Expenses directly attributable to a fund are charged to that fund. Expenses attributable to more than one fund are allocated among the respective funds on the basis of relative net assets or other appropriate methods. Expense estimates are accrued in the period to which they relate and adjustments are made when actual amounts are known.
Income Tax Information and Distributions to Shareholders. Each year, the Fund intends to qualify as a regulated investment company under Subchapter M of the Internal Revenue Code, including distributing substantially all of its taxable income and realized gains. As a result, no provision for U.S. Federal income taxes is required. The Fund files a U.S. federal tax return, in addition to state and local tax returns as required. The Fund's federal income tax returns are subject to examination by the Internal Revenue Service (IRS) for a period of three fiscal years after they are filed. State and local tax returns may be subject to examination for an additional fiscal year depending on the jurisdiction. Foreign taxes are provided for based on the Fund's understanding of the tax rules and rates that exist in the foreign markets in which it invests.
Distributions are declared and recorded on the ex-dividend date. Income and capital gain distributions are declared separately for each class. Income and capital gain distributions are determined in accordance with income tax regulations, which may differ from GAAP.
Capital accounts within the financial statements are adjusted for permanent book-tax differences. These adjustments have no impact on net assets or the results of operations. Capital accounts are not adjusted for temporary book-tax differences which will reverse in a subsequent period.
Book-tax differences are primarily due to foreign currency transactions, passive foreign investment companies (PFIC), deferred trustees compensation, capital loss carryforwards and losses deferred due to wash sales.
As of period end, the cost and unrealized appreciation (depreciation) in securities, and derivatives if applicable, for federal income tax purposes were as follows:
| Gross unrealized appreciation | $473,892,337 |
| Gross unrealized depreciation | (46,862,222) |
| Net unrealized appreciation (depreciation) | $427,030,115 |
| Tax cost | $1,068,239,101 |
Capital loss carryforwards are only available to offset future capital gains of the Fund to the extent provided by regulations and may be limited. Under the Regulated Investment Company Modernization Act of 2010 (the Act), the Fund is permitted to carry forward capital losses incurred in taxable years beginning after December 22, 2010 for an unlimited period and such capital losses are required to be used prior to any losses that expire. The capital loss carryforward information presented below, including any applicable limitation, is estimated as of prior fiscal period end and is subject to adjustment.
| No expiration | |
| Short-term | $(139,203,991) |
Short-Term Trading (Redemption) Fees. Shares held by investors in the Fund less than 90 days may have been subject to a redemption fee equal to 1.50% of the NAV of shares redeemed. All redemption fees, which reduce the proceeds of the shareholder redemption, are retained by the Fund and accounted for as an addition to paid in capital. In November 2017, the Board of Trustees approved the elimination of these redemption fees effective December 18, 2017.
Restricted Securities. The Fund may invest in securities that are subject to legal or contractual restrictions on resale. These securities generally may be resold in transactions exempt from registration or to the public if the securities are registered. Disposal of these securities may involve time-consuming negotiations and expense, and prompt sale at an acceptable price may be difficult. Information regarding restricted securities is included at the end of the Fund's Schedule of Investments.
4. Purchases and Sales of Investments.
Purchases and sales of securities, other than short-term securities, aggregated $162,275,902 and $158,713,436, respectively.
5. Fees and Other Transactions with Affiliates.
Management Fee. Fidelity Management & Research Company (the investment adviser) and its affiliates provide the Fund with investment management related services for which the Fund pays a monthly management fee. The management fee is the sum of an individual fund fee rate that is based on an annual rate of .45% of the Fund's average net assets and an annualized group fee rate that averaged .24% during the period. The group fee rate is based upon the average net assets of all the mutual funds advised by the investment adviser, including any mutual funds previously advised by the investment adviser that are currently advised by Fidelity SelectCo, LLC, an affiliate of the investment adviser. The group fee rate decreases as assets under management increase and increases as assets under management decrease. For the reporting period, the total annualized management fee rate was .69% of the Fund's average net assets.
Distribution and Service Plan Fees. In accordance with Rule 12b-1 of the 1940 Act, the Fund has adopted separate Distribution and Service Plans for each class of shares. Certain classes pay Fidelity Distributors Corporation (FDC), an affiliate of the investment adviser, separate Distribution and Service Fees, each of which is based on an annual percentage of each class' average net assets. In addition, FDC may pay financial intermediaries for selling shares of the Fund and providing shareholder support services. For the period, the Distribution and Service Fee rates, total fees and amounts retained by FDC were as follows:
| Distribution Fee | Service Fee | Total Fees | Retained by FDC | |
| Class A | -% | .25% | $47,032 | $1,362 |
| Class M | .25% | .25% | 28,924 | 410 |
| Class C | .75% | .25% | 75,256 | 16,234 |
| $151,212 | $18,006 |
Sales Load. FDC may receive a front-end sales charge of up to 5.75% for selling Class A shares and 3.50% for selling Class M shares, some of which is paid to financial intermediaries for selling shares of the Fund. Depending on the holding period, FDC may receive contingent deferred sales charges levied on Class A, Class M and Class C redemptions. The deferred sales charges are 1.00% for Class C shares, 1.00% for certain purchases of Class A shares and .25% for certain purchases of Class M shares.
For the period, sales charge amounts retained by FDC were as follows:
| Retained by FDC | |
| Class A | $23,915 |
| Class M | 3,369 |
| Class C(a) | 3,475 |
| $30,759 |
(a) When Class C shares are initially sold, FDC pays commissions from its own resources to financial intermediaries through which the sales are made.
Transfer Agent Fees. Fidelity Investments Institutional Operations Company, Inc., (FIIOC), an affiliate of the investment adviser, is the transfer, dividend disbursing and shareholder servicing agent for each class of the Fund. FIIOC receives account fees and asset-based fees that vary according to the account size and type of account of the shareholders of the respective classes of the Fund. FIIOC pays for typesetting, printing and mailing of shareholder reports, except proxy statements.
For the period, transfer agent fees for each class were as follows:
| Amount | % of Class-Level Average Net Assets(a) | |
| Class A | $42,963 | .23 |
| Class M | 19,120 | .33 |
| Class C | 16,807 | .22 |
| China Region | 1,234,051 | .17 |
| Class I | 33,988 | .19 |
| $1,346,929 |
(a) Annualized
Accounting and Security Lending Fees. Fidelity Service Company, Inc. (FSC), an affiliate of the investment adviser, maintains the Fund's accounting records. The accounting fee is based on the level of average net assets for each month. Under a separate contract, FSC administers the security lending program. The security lending fee is based on the number and duration of lending transactions. For the period, the fees were equivalent to an annualized rate of .04%.
Brokerage Commissions. The Fund placed a portion of its portfolio transactions with brokerage firms which are affiliates of the investment adviser. Brokerage commissions are included in net realized gain (loss) and change in net unrealized appreciation (depreciation) in the Statement of Operations. The commissions paid to these affiliated firms were $494 for the period.
Interfund Lending Program. Pursuant to an Exemptive Order issued by the SEC, the Fund, along with other registered investment companies having management contracts with Fidelity Management & Research Company (FMR) or other affiliated entities of FMR, may participate in an interfund lending program. This program provides an alternative credit facility allowing the funds to borrow from, or lend money to, other participating affiliated funds. At period end, there were no interfund loans outstanding. The Fund's activity in this program during the period for which loans were outstanding was as follows:
| Borrower or Lender | Average Loan Balance | Weighted Average Interest Rate | Interest Expense |
| Borrower | $5,475,727 | 1.34% | $2,235 |
Interfund Trades. The Fund may purchase from or sell securities to other Fidelity Funds under procedures adopted by the Board. The procedures have been designed to ensure these interfund trades are executed in accordance with Rule 17a-7 of the 1940 Act. Interfund trades are included within the respective purchases and sales amounts shown in the Purchases and Sales of Investments note.
6. Committed Line of Credit.
The Fund participates with other funds managed by the investment adviser or an affiliate in a $4.25 billion credit facility (the "line of credit") to be utilized for temporary or emergency purposes to fund shareholder redemptions or for other short-term liquidity purposes. The Fund has agreed to pay commitment fees on its pro-rata portion of the line of credit, which amounted to $2,142 and is reflected in Miscellaneous expenses on the Statement of Operations. During the period, the Fund did not borrow on this line of credit.
7. Security Lending.
The Fund lends portfolio securities through a lending agent from time to time in order to earn additional income. For equity securities, a lending agent is used and may loan securities to certain qualified borrowers, including Fidelity Capital Markets (FCM), a broker-dealer affiliated with the Fund. On the settlement date of the loan, the Fund receives collateral (in the form of U.S. Treasury obligations, letters of credit and/or cash) against the loaned securities and maintains collateral in an amount not less than 100% of the market value of the loaned securities during the period of the loan. The market value of the loaned securities is determined at the close of business of the Fund and any additional required collateral is delivered to the Fund on the next business day. The Fund or borrower may terminate the loan at any time, and if the borrower defaults on its obligation to return the securities loaned because of insolvency or other reasons, the Fund may apply collateral received from the borrower against the obligation. The Fund may experience delays and costs in recovering the securities loaned. Any cash collateral received is invested in the Fidelity Securities Lending Cash Central Fund. The value of loaned securities and cash collateral at period end are disclosed on the Fund's Statement of Assets and Liabilities. Security lending income represents the income earned on investing cash collateral, less rebates paid to borrowers and any lending agent fees associated with the loan, plus any premium payments received for lending certain types of securities. Security lending income is presented in the Statement of Operations as a component of income from Fidelity Central Funds. During the period, there were no securities loaned to FCM.
8. Expense Reductions.
Commissions paid to certain brokers with whom the investment adviser, or its affiliates, places trades on behalf of the Fund include an amount in addition to trade execution, which may be rebated back to the Fund to offset certain expenses. This amount totaled $226,592 for the period.
In addition, during the period the investment adviser reimbursed and/or waived a portion of fund-level operating expenses in the amount of $7,183.
9. Distributions to Shareholders.
Distributions to shareholders of each class were as follows:
| Six months ended April 30, 2018 | Year ended October 31, 2017 | |
| From net investment income | ||
| Class A | $79,935 | $157,254 |
| Class M | – | 24,256 |
| China Region | 5,380,060 | 10,242,046 |
| Class I | 172,796 | 212,309 |
| Total | $5,632,791 | $10,635,865 |
| From net realized gain | ||
| Class A | $– | $43,202 |
| Class M | – | 10,926 |
| Class C | – | 7,384 |
| China Region | – | 1,889,677 |
| Class I | – | 37,777 |
| Total | $– | $1,988,966 |
10. Share Transactions.
Share transactions for each class were as follows and may contain automatic conversions between classes or exchanges between affiliated funds:
| Shares | Shares | Dollars | Dollars | |
| Six months ended April 30, 2018 | Year ended October 31, 2017 | Six months ended April 30, 2018 | Year ended October 31, 2017 | |
| Class A | ||||
| Shares sold | 186,195 | 484,746 | $6,775,443 | $14,218,284 |
| Reinvestment of distributions | 2,311 | 7,951 | 78,689 | 195,750 |
| Shares redeemed | (317,334) | (355,316) | (11,749,829) | (9,896,035) |
| Net increase (decrease) | (128,828) | 137,381 | $(4,895,697) | $4,517,999 |
| Class M | ||||
| Shares sold | 85,711 | 114,104 | $3,124,555 | $3,376,139 |
| Reinvestment of distributions | – | 1,419 | – | 34,859 |
| Shares redeemed | (33,846) | (51,513) | (1,217,409) | (1,446,359) |
| Net increase (decrease) | 51,865 | 64,010 | $1,907,146 | $1,964,639 |
| Class C | ||||
| Shares sold | 107,993 | 123,999 | $3,868,599 | $3,531,382 |
| Reinvestment of distributions | – | 254 | – | 6,148 |
| Shares redeemed | (62,308) | (188,578) | (2,211,653) | (4,895,729) |
| Net increase (decrease) | 45,685 | (64,325) | $1,656,946 | $(1,358,199) |
| China Region | ||||
| Shares sold | 7,252,530 | 7,507,787 | $269,152,089 | $224,773,166 |
| Reinvestment of distributions | 150,399 | 469,834 | 5,175,224 | 11,675,364 |
| Shares redeemed | (5,953,767) | (9,588,795) | (218,355,689) | (265,714,287) |
| Net increase (decrease) | 1,449,162 | (1,611,174) | $55,971,624 | $(29,265,757) |
| Class I | ||||
| Shares sold | 533,504 | 659,273 | $19,432,373 | $19,707,002 |
| Reinvestment of distributions | 4,532 | 8,728 | 154,844 | 215,492 |
| Shares redeemed | (454,184) | (612,455) | (16,900,705) | (17,979,791) |
| Net increase (decrease) | 83,852 | 55,546 | $2,686,512 | $1,942,703 |
11. Other.
The Fund's organizational documents provide former and current trustees and officers with a limited indemnification against liabilities arising in connection with the performance of their duties to the Fund. In the normal course of business, the Fund may also enter into contracts that provide general indemnifications. The Fund's maximum exposure under these arrangements is unknown as this would be dependent on future claims that may be made against the Fund. The risk of material loss from such claims is considered remote.
Shareholder Expense Example
As a shareholder of the Fund, you incur two types of costs: (1) transaction costs, including sales charges (loads) on purchase payments or redemption proceeds, redemption fees and (2) ongoing costs, including management fees, distribution and/or service (12b-1) fees and other Fund expenses. This Example is intended to help you understand your ongoing costs (in dollars) of investing in the Fund and to compare these costs with the ongoing costs of investing in other mutual funds.
The Example is based on an investment of $1,000 invested at the beginning of the period and held for the entire period (November 1, 2017 to April 30, 2018).
Actual Expenses
The first line of the accompanying table for each class of the Fund provides information about actual account values and actual expenses. You may use the information in this line, together with the amount you invested, to estimate the expenses that you paid over the period. Simply divide your account value by $1,000.00 (for example, an $8,600 account value divided by $1,000.00 = 8.6), then multiply the result by the number in the first line for a class of the Fund under the heading entitled "Expenses Paid During Period" to estimate the expenses you paid on your account during this period. A small balance maintenance fee of $12.00 that is charged once a year may apply for certain accounts with a value of less than $2,000. This fee is not included in the table below. If it was, the estimate of expenses you paid during the period would be higher, and your ending account value lower, by this amount. In addition, the Fund, as a shareholder in the underlying Fidelity Central Funds, will indirectly bear its pro-rata share of the fees and expenses incurred by the underlying Fidelity Central Funds. These fees and expenses are not included in the Fund's annualized expense ratio used to calculate the expense estimate in the table below.
Hypothetical Example for Comparison Purposes
The second line of the accompanying table for each class of the Fund provides information about hypothetical account values and hypothetical expenses based on a Class' actual expense ratio and an assumed rate of return of 5% per year before expenses, which is not the Class' actual return. The hypothetical account values and expenses may not be used to estimate the actual ending account balance or expenses you paid for the period. You may use this information to compare the ongoing costs of investing in the Fund and other funds. To do so, compare this 5% hypothetical example with the 5% hypothetical examples that appear in the shareholder reports of the other funds. A small balance maintenance fee of $12.00 that is charged once a year may apply for certain accounts with a value of less than $2,000. This fee is not included in the table below. If it was, the estimate of expenses you paid during the period would be higher, and your ending account value lower, by this amount. In addition, the Fund, as a shareholder in the underlying Fidelity Central Funds, will indirectly bear its pro-rata share of the fees and expenses incurred by the underlying Fidelity Central Funds. These fees and expenses are not included in the Fund's annualized expense ratio used to calculate the expense estimate in the table below.
Please note that the expenses shown in the table are meant to highlight your ongoing costs only and do not reflect any transaction costs. Therefore, the second line of the table is useful in comparing ongoing costs only, and will not help you determine the relative total costs of owning different funds. In addition, if these transactional costs were included, your costs would have been higher.
| Annualized Expense Ratio-A | Beginning Account Value November 1, 2017 | Ending Account Value April 30, 2018 | Expenses Paid During Period-B November 1, 2017 to April 30, 2018 | |
| Class A | 1.26% | |||
| Actual | $1,000.00 | $1,042.90 | $6.38 | |
| Hypothetical-C | $1,000.00 | $1,018.55 | $6.31 | |
| Class M | 1.61% | |||
| Actual | $1,000.00 | $1,041.10 | $8.15 | |
| Hypothetical-C | $1,000.00 | $1,016.81 | $8.05 | |
| Class C | 2.01% | |||
| Actual | $1,000.00 | $1,039.20 | $10.16 | |
| Hypothetical-C | $1,000.00 | $1,014.83 | $10.04 | |
| China Region | .95% | |||
| Actual | $1,000.00 | $1,044.70 | $4.82 | |
| Hypothetical-C | $1,000.00 | $1,020.08 | $4.76 | |
| Class I | .97% | |||
| Actual | $1,000.00 | $1,044.60 | $4.92 | |
| Hypothetical-C | $1,000.00 | $1,019.98 | $4.86 |
A Annualized expense ratio reflects expenses net of applicable fee waivers.
B Expenses are equal to each Class' annualized expense ratio, multiplied by the average account value over the period, multiplied by 181/365 (to reflect the one-half year period).
C 5% return per year before expenses
![]()
AHKC-SANN-0618
1.861464.109
Fidelity® Emerging Markets Fund Semi-Annual Report April 30, 2018 |
|
Contents
To view a fund's proxy voting guidelines and proxy voting record for the 12-month period ended June 30, visit http://www.fidelity.com/proxyvotingresults or visit the Securities and Exchange Commission's (SEC) web site at http://www.sec.gov.
You may also call 1-800-835-5092 to request a free copy of the proxy voting guidelines.
Standard & Poor's, S&P and S&P 500 are registered service marks of The McGraw-Hill Companies, Inc. and have been licensed for use by Fidelity Distributors Corporation.
Other third-party marks appearing herein are the property of their respective owners.
All other marks appearing herein are registered or unregistered trademarks or service marks of FMR LLC or an affiliated company. © 2018 FMR LLC. All rights reserved.
This report and the financial statements contained herein are submitted for the general information of the shareholders of the Fund. This report is not authorized for distribution to prospective investors in the Fund unless preceded or accompanied by an effective prospectus.
A fund files its complete schedule of portfolio holdings with the SEC for the first and third quarters of each fiscal year on Form N-Q. Forms N-Q are available on the SEC’s web site at http://www.sec.gov. A fund's Forms N-Q may be reviewed and copied at the SEC’s Public Reference Room in Washington, DC. Information regarding the operation of the SEC's Public Reference Room may be obtained by calling 1-800-SEC-0330.
For a complete list of a fund's portfolio holdings, view the most recent holdings listing, semiannual report, or annual report on Fidelity's web site at http://www.fidelity.com, http://www.institutional.fidelity.com, or http://www.401k.com, as applicable.
NOT FDIC INSURED •MAY LOSE VALUE •NO BANK GUARANTEE
Neither the Fund nor Fidelity Distributors Corporation is a bank.
Investment Summary (Unaudited)
Geographic Diversification (% of fund's net assets)
| As of April 30, 2018 | ||
| Cayman Islands | 14.7% | |
| India | 11.9% | |
| United States of America* | 9.9% | |
| Brazil | 9.2% | |
| China | 8.0% | |
| Korea (South) | 7.4% | |
| South Africa | 5.8% | |
| Taiwan | 4.1% | |
| Mexico | 3.5% | |
| Other | 25.5% | |

* Includes Short-Term investments and Net Other Assets (Liabilities).
Percentages are based on country or territory of incorporation and are adjusted for the effect of futures contracts, if applicable.
Asset Allocation as of April 30, 2018
| % of fund's net assets | |
| Stocks | 98.4 |
| Short-Term Investments and Net Other Assets (Liabilities) | 1.6 |
Top Ten Stocks as of April 30, 2018
| % of fund's net assets | |
| Tencent Holdings Ltd. (Cayman Islands, Internet Software & Services) | 5.9 |
| Samsung Electronics Co. Ltd. (Korea (South), Technology Hardware, Storage & Peripherals) | 5.7 |
| Alibaba Group Holding Ltd. sponsored ADR (Cayman Islands, Internet Software & Services) | 4.4 |
| Taiwan Semiconductor Manufacturing Co. Ltd. (Taiwan, Semiconductors & Semiconductor Equipment) | 4.1 |
| Naspers Ltd. Class N (South Africa, Media) | 2.5 |
| Ping An Insurance (Group) Co. of China Ltd. (H Shares) (China, Insurance) | 1.5 |
| Itau Unibanco Holding SA (Brazil, Banks) | 1.4 |
| Housing Development Finance Corp. Ltd. (India, Thrifts & Mortgage Finance) | 1.3 |
| Reliance Industries Ltd. (India, Oil, Gas & Consumable Fuels) | 1.3 |
| Sberbank of Russia (Russia, Banks) | 1.3 |
| 29.4 |
Top Market Sectors as of April 30, 2018
| % of fund's net assets | |
| Information Technology | 28.3 |
| Financials | 22.1 |
| Consumer Discretionary | 15.6 |
| Industrials | 8.7 |
| Consumer Staples | 7.2 |
| Materials | 6.9 |
| Health Care | 3.3 |
| Energy | 1.8 |
| Utilities | 1.7 |
| Telecommunication Services | 1.6 |
Schedule of Investments April 30, 2018 (Unaudited)
Showing Percentage of Net Assets
| Common Stocks - 95.1% | |||
| Shares | Value | ||
| Argentina - 1.0% | |||
| Banco Macro SA sponsored ADR | 273,149 | $26,473,601 | |
| Telecom Argentina SA Class B sponsored ADR | 880,186 | 26,440,787 | |
| TOTAL ARGENTINA | 52,914,388 | ||
| Australia - 0.5% | |||
| Amcor Ltd. | 2,416,916 | 24,906,258 | |
| Belgium - 0.5% | |||
| Umicore SA | 513,389 | 28,679,745 | |
| Bermuda - 0.9% | |||
| Credicorp Ltd. (United States) | 198,832 | 46,226,452 | |
| Brazil - 5.9% | |||
| BM&F BOVESPA SA | 5,837,300 | 42,156,797 | |
| BTG Pactual Participations Ltd. unit | 4,100,900 | 26,198,373 | |
| CVC Brasil Operadora e Agencia de Viagens SA | 1,797,800 | 29,759,769 | |
| Equatorial Energia SA | 1,505,300 | 30,572,646 | |
| Hapvida Participacoes e Investimentos SA | 3,373,000 | 26,622,360 | |
| IRB Brasil Resseguros SA | 2,193,400 | 29,615,158 | |
| Itausa-Investimentos Itau SA | 285,238 | 1,099,199 | |
| Localiza Rent A Car SA | 3,689,600 | 29,373,985 | |
| Lojas Renner SA | 3,410,200 | 31,744,297 | |
| Notre Dame Intermedica Participacoes SA | 4,881,200 | 28,424,435 | |
| Suzano Papel e Celulose SA | 3,083,200 | 36,137,301 | |
| TOTAL BRAZIL | 311,704,320 | ||
| Cayman Islands - 14.7% | |||
| 58.com, Inc. ADR (a) | 461,000 | 40,286,790 | |
| Alibaba Group Holding Ltd. sponsored ADR (a) | 1,304,400 | 232,887,576 | |
| JD.com, Inc. sponsored ADR (a) | 1,396,400 | 50,982,564 | |
| Melco Crown Entertainment Ltd. sponsored ADR | 979,800 | 30,579,558 | |
| New Oriental Education & Technology Group, Inc. sponsored ADR | 430,483 | 38,674,593 | |
| Sands China Ltd. | 5,055,400 | 29,217,085 | |
| Shenzhou International Group Holdings Ltd. | 3,570,000 | 38,970,962 | |
| Tencent Holdings Ltd. | 6,289,700 | 309,220,060 | |
| TOTAL CAYMAN ISLANDS | 770,819,188 | ||
| Chile - 0.6% | |||
| Banco Santander Chile sponsored ADR | 964,100 | 31,844,223 | |
| China - 8.0% | |||
| China International Travel Service Corp. Ltd. (A Shares) | 3,262,600 | 26,672,480 | |
| China Merchants Bank Co. Ltd. (H Shares) | 10,146,500 | 44,242,800 | |
| Dong E-E-Jiao Co. Ltd. Class A | 2,782,450 | 25,894,729 | |
| Gree Electric Appliances, Inc. of Zhuhai Class A | 3,656,735 | 25,360,963 | |
| Hangzhou Hikvision Digital Technology Co. Ltd. Class A | 4,354,060 | 26,372,028 | |
| Inner Mongoli Yili Industries Co. Ltd. (A Shares) | 6,523,697 | 27,010,873 | |
| Jiangsu Yanghe Brewery Joint-Stock Co. Ltd. Class A | 1,613,267 | 28,426,333 | |
| Kweichow Moutai Co. Ltd. (A Shares) | 248,879 | 25,915,527 | |
| Midea Group Co. Ltd. Class A | 3,365,248 | 27,361,322 | |
| Ping An Insurance (Group) Co. of China Ltd. (H Shares) | 7,769,500 | 75,918,891 | |
| Shanghai International Airport Co. Ltd. (A Shares) | 3,798,984 | 29,837,767 | |
| Shenzhen Inovance Technology Co. Ltd. Class A | 5,954,144 | 30,811,713 | |
| Yunnan Baiyao Group Co. Ltd. | 1,880,727 | 28,085,981 | |
| TOTAL CHINA | 421,911,407 | ||
| France - 2.3% | |||
| Kering SA (b) | 50,575 | 29,291,268 | |
| LVMH Moet Hennessy - Louis Vuitton SA (b) | 90,008 | 31,323,877 | |
| Pernod Ricard SA | 171,100 | 28,420,631 | |
| Rubis | 388,400 | 30,252,554 | |
| TOTAL FRANCE | 119,288,330 | ||
| Germany - 1.2% | |||
| adidas AG | 117,389 | 28,904,651 | |
| Wirecard AG | 239,500 | 32,710,805 | |
| TOTAL GERMANY | 61,615,456 | ||
| Hong Kong - 2.4% | |||
| AIA Group Ltd. | 3,567,400 | 31,882,568 | |
| CSPC Pharmaceutical Group Ltd. | 15,334,000 | 39,056,598 | |
| Galaxy Entertainment Group Ltd. | 3,331,000 | 29,155,018 | |
| Techtronic Industries Co. Ltd. | 4,747,000 | 27,808,836 | |
| TOTAL HONG KONG | 127,903,020 | ||
| Hungary - 0.7% | |||
| OTP Bank PLC | 846,400 | 36,978,767 | |
| India - 11.9% | |||
| Adani Ports & Special Economic Zone Ltd. | 5,729,054 | 35,045,121 | |
| Asian Paints Ltd. | 1,853,120 | 33,439,243 | |
| Eicher Motors Ltd. | 71,663 | 33,482,846 | |
| Godrej Consumer Products Ltd. | 1,893,366 | 31,727,509 | |
| HDFC Bank Ltd. | 930,274 | 28,038,284 | |
| Hero Motocorp Ltd. | 570,924 | 31,981,642 | |
| Housing Development Finance Corp. Ltd. | 2,474,721 | 70,017,339 | |
| Indraprastha Gas Ltd. | 6,178,722 | 26,648,077 | |
| IndusInd Bank Ltd. | 1,093,836 | 31,115,159 | |
| Kotak Mahindra Bank Ltd. (a) | 1,720,295 | 31,281,663 | |
| Larsen & Toubro Ltd. | 1,881,470 | 39,551,653 | |
| LIC Housing Finance Ltd. | 3,592,264 | 29,410,801 | |
| Maruti Suzuki India Ltd. | 314,636 | 41,595,791 | |
| Motherson Sumi Systems Ltd. | 5,938,661 | 31,464,754 | |
| PC Jeweller Ltd. | 660,493 | 1,429,961 | |
| Pidilite Industries Ltd. (a) | 1,766,324 | 28,804,441 | |
| Reliance Industries Ltd. | 4,809,684 | 69,444,139 | |
| Ultratech Cemco Ltd. | 501,696 | 30,931,098 | |
| TOTAL INDIA | 625,409,521 | ||
| Indonesia - 1.5% | |||
| PT Bank Central Asia Tbk | 25,863,500 | 40,897,509 | |
| PT Bank Rakyat Indonesia Tbk | 171,269,700 | 39,489,394 | |
| TOTAL INDONESIA | 80,386,903 | ||
| Ireland - 0.5% | |||
| Accenture PLC Class A | 184,800 | 27,941,760 | |
| Israel - 0.5% | |||
| Frutarom Industries Ltd. | 291,600 | 27,993,665 | |
| Japan - 1.7% | |||
| Daikin Industries Ltd. | 245,600 | 28,767,911 | |
| Keyence Corp. | 49,700 | 30,446,478 | |
| Misumi Group, Inc. | 1,000,400 | 27,727,881 | |
| TOTAL JAPAN | 86,942,270 | ||
| Kenya - 0.5% | |||
| Safaricom Ltd. | 99,109,600 | 27,914,718 | |
| Korea (South) - 7.4% | |||
| LG Chemical Ltd. | 128,896 | 43,329,421 | |
| LG Household & Health Care Ltd. | 35,793 | 45,788,837 | |
| Samsung Electronics Co. Ltd. | 120,873 | 299,523,294 | |
| TOTAL KOREA (SOUTH) | 388,641,552 | ||
| Mexico - 3.5% | |||
| Embotelladoras Arca S.A.B. de CV | 4,310,100 | 29,789,436 | |
| Fomento Economico Mexicano S.A.B. de CV unit | 4,628,367 | 44,739,277 | |
| Grupo Aeroportuario del Pacifico S.A.B. de CV Series B | 3,103,857 | 32,286,532 | |
| Grupo Aeroportuario del Sureste S.A.B. de CV Series B | 1,770,520 | 31,840,306 | |
| Grupo Mexico SA de CV Series B | 8,589,942 | 28,554,982 | |
| Wal-Mart de Mexico SA de CV Series V | 6,001,233 | 16,676,465 | |
| TOTAL MEXICO | 183,886,998 | ||
| Netherlands - 1.0% | |||
| ASML Holding NV (Netherlands) | 142,300 | 27,065,033 | |
| Yandex NV Series A (a) | 827,000 | 27,588,720 | |
| TOTAL NETHERLANDS | 54,653,753 | ||
| Philippines - 2.5% | |||
| Ayala Corp. | 1,721,825 | 32,076,650 | |
| Ayala Land, Inc. | 41,781,200 | 32,881,507 | |
| SM Investments Corp. | 1,869,343 | 33,855,065 | |
| SM Prime Holdings, Inc. | 50,192,700 | 33,127,940 | |
| TOTAL PHILIPPINES | 131,941,162 | ||
| Russia - 1.3% | |||
| Sberbank of Russia | 18,487,500 | 65,898,603 | |
| South Africa - 5.8% | |||
| Capitec Bank Holdings Ltd. | 445,900 | 31,745,412 | |
| Discovery Ltd. | 2,212,185 | 30,715,897 | |
| FirstRand Ltd. | 8,423,100 | 45,110,138 | |
| Mondi Ltd. | 1,086,166 | 31,688,736 | |
| Naspers Ltd. Class N | 540,512 | 131,679,297 | |
| Sanlam Ltd. | 5,512,300 | 34,821,310 | |
| TOTAL SOUTH AFRICA | 305,760,790 | ||
| Spain - 0.5% | |||
| Amadeus IT Holding SA Class A | 385,800 | 28,279,649 | |
| Switzerland - 0.5% | |||
| Sika AG | 3,580 | 26,118,466 | |
| Taiwan - 4.1% | |||
| Taiwan Semiconductor Manufacturing Co. Ltd. | 28,097,000 | 213,645,367 | |
| Thailand - 1.6% | |||
| Airports of Thailand PCL (For. Reg.) | 17,293,700 | 38,899,980 | |
| C.P. ALL PCL (For. Reg.) | 15,514,700 | 42,673,185 | |
| TOTAL THAILAND | 81,573,165 | ||
| Turkey - 1.6% | |||
| Tofas Turk Otomobil Fabrikasi A/S | 3,869,873 | 23,836,002 | |
| Tupras Turkiye Petrol Rafinerileri A/S | 1,141,058 | 29,073,510 | |
| Turkcell Iletisim Hizmet A/S | 8,822,000 | 30,318,092 | |
| TOTAL TURKEY | 83,227,604 | ||
| United Arab Emirates - 0.6% | |||
| DP World Ltd. | 1,381,380 | 30,735,705 | |
| United Kingdom - 1.1% | |||
| NMC Health PLC | 583,700 | 28,671,727 | |
| Prudential PLC | 1,081,322 | 27,805,178 | |
| TOTAL UNITED KINGDOM | 56,476,905 | ||
| United States of America - 8.3% | |||
| A.O. Smith Corp. | 445,800 | 27,349,830 | |
| Alphabet, Inc. Class A (a) | 25,860 | 26,340,479 | |
| Amphenol Corp. Class A | 319,500 | 26,745,345 | |
| Facebook, Inc. Class A (a) | 165,700 | 28,500,400 | |
| Hilton Worldwide Holdings, Inc. | 327,000 | 25,780,680 | |
| MasterCard, Inc. Class A | 165,400 | 29,485,858 | |
| Mettler-Toledo International, Inc. (a) | 49,200 | 27,548,556 | |
| Moody's Corp. | 177,100 | 28,725,620 | |
| MSCI, Inc. | 195,500 | 29,291,765 | |
| NVIDIA Corp. | 123,100 | 27,685,190 | |
| PayPal Holdings, Inc. (a) | 355,100 | 26,494,011 | |
| S&P Global, Inc. | 151,200 | 28,516,320 | |
| Sherwin-Williams Co. | 71,200 | 26,177,392 | |
| Visa, Inc. Class A | 235,300 | 29,854,864 | |
| Yum China Holdings, Inc. | 1,046,900 | 44,765,444 | |
| TOTAL UNITED STATES OF AMERICA | 433,261,754 | ||
| TOTAL COMMON STOCKS | |||
| (Cost $3,525,452,422) | 4,995,481,864 | ||
| Nonconvertible Preferred Stocks - 3.3% | |||
| Brazil - 3.3% | |||
| Ambev SA sponsored ADR | 8,458,500 | 55,995,270 | |
| Itau Unibanco Holding SA | 5,063,610 | 73,731,088 | |
| Itausa-Investimentos Itau SA (PN) | 10,870,300 | 42,231,327 | |
| TOTAL BRAZIL | |||
| (Cost $135,919,181) | 171,957,685 | ||
| Money Market Funds - 1.7% | |||
| Fidelity Cash Central Fund, 1.74% (c) | 46,060,709 | 46,069,921 | |
| Fidelity Securities Lending Cash Central Fund 1.74% (c)(d) | 42,840,381 | 42,844,665 | |
| TOTAL MONEY MARKET FUNDS | |||
| (Cost $88,914,586) | 88,914,586 | ||
| TOTAL INVESTMENT IN SECURITIES - 100.1% | |||
| (Cost $3,750,286,189) | 5,256,354,135 | ||
| NET OTHER ASSETS (LIABILITIES) - (0.1)% | (2,795,333) | ||
| NET ASSETS - 100% | $5,253,558,802 |
Categorizations in the Schedule of Investments are based on country or territory of incorporation.
Legend
(a) Non-income producing
(b) Security or a portion of the security is on loan at period end.
(c) Affiliated fund that is generally available only to investment companies and other accounts managed by Fidelity Investments. The rate quoted is the annualized seven-day yield of the fund at period end. A complete unaudited listing of the fund's holdings as of its most recent quarter end is available upon request. In addition, each Fidelity Central Fund's financial statements are available on the SEC's website or upon request.
(d) Investment made with cash collateral received from securities on loan.
Affiliated Central Funds
Information regarding fiscal year to date income earned by the Fund from investments in Fidelity Central Funds is as follows:
| Fund | Income earned |
| Fidelity Cash Central Fund | $418,851 |
| Fidelity Securities Lending Cash Central Fund | 53,863 |
| Total | $472,714 |
Amounts in the income column in the above table include any capital gain distributions from underlying funds, which are presented in the corresponding line-item in the Statement of Operations if applicable.
Investment Valuation
The following is a summary of the inputs used, as of April 30, 2018, involving the Fund's assets and liabilities carried at fair value. The inputs or methodology used for valuing securities may not be an indication of the risk associated with investing in those securities. For more information on valuation inputs, and their aggregation into the levels used below, please refer to the Investment Valuation section in the accompanying Notes to Financial Statements.
| Valuation Inputs at Reporting Date: | ||||
| Description | Total | Level 1 | Level 2 | Level 3 |
| Investments in Securities: | ||||
| Equities: | ||||
| Consumer Discretionary | $808,340,814 | $334,318,826 | $474,021,988 | $-- |
| Consumer Staples | 377,163,343 | 221,409,916 | 155,753,427 | -- |
| Energy | 98,517,649 | 29,073,510 | 69,444,139 | -- |
| Financials | 1,160,178,646 | 469,711,050 | 690,467,596 | -- |
| Health Care | 177,682,026 | 84,644,718 | 93,037,308 | -- |
| Industrials | 449,566,295 | 208,082,150 | 241,484,145 | -- |
| Information Technology | 1,491,073,707 | 941,836,252 | 549,237,455 | -- |
| Materials | 366,760,748 | 216,990,972 | 149,769,776 | -- |
| Real Estate | 66,009,447 | -- | 66,009,447 | -- |
| Telecommunication Services | 84,673,597 | 84,673,597 | -- | -- |
| Utilities | 87,473,277 | 60,825,200 | 26,648,077 | -- |
| Money Market Funds | 88,914,586 | 88,914,586 | -- | -- |
| Total Investments in Securities: | $5,256,354,135 | $2,740,480,777 | $2,515,873,358 | $-- |
The following is a summary of transfers between Level 1 and Level 2 for the period ended April 30, 2018. Transfers are assumed to have occurred at the beginning of the period, and are primarily attributable to the valuation techniques used for foreign equity securities, as discussed in the accompanying Notes to Financial Statements:
| Transfers | Total |
| Level 1 to Level 2 | $1,424,704,881 |
| Level 2 to Level 1 | $25,602,943 |
See accompanying notes which are an integral part of the financial statements.
Financial Statements
Statement of Assets and Liabilities
| April 30, 2018 (Unaudited) | ||
| Assets | ||
| Investment in securities, at value (including securities loaned of $41,180,858) — See accompanying schedule: Unaffiliated issuers (cost $3,661,371,603) | $5,167,439,549 | |
| Fidelity Central Funds (cost $88,914,586) | 88,914,586 | |
| Total Investment in Securities (cost $3,750,286,189) | $5,256,354,135 | |
| Foreign currency held at value (cost $6,869,019) | 6,899,969 | |
| Receivable for investments sold | 60,834,164 | |
| Receivable for fund shares sold | 19,219,489 | |
| Dividends receivable | 10,980,956 | |
| Distributions receivable from Fidelity Central Funds | 103,971 | |
| Prepaid expenses | 2,241 | |
| Other receivables | 2,333,668 | |
| Total assets | 5,356,728,593 | |
| Liabilities | ||
| Payable for investments purchased | $22,037,520 | |
| Payable for fund shares redeemed | 27,477,176 | |
| Accrued management fee | 3,070,834 | |
| Other affiliated payables | 851,902 | |
| Other payables and accrued expenses | 6,892,453 | |
| Collateral on securities loaned | 42,839,906 | |
| Total liabilities | 103,169,791 | |
| Net Assets | $5,253,558,802 | |
| Net Assets consist of: | ||
| Paid in capital | $3,826,177,291 | |
| Undistributed net investment income | 17,414,743 | |
| Accumulated undistributed net realized gain (loss) on investments and foreign currency transactions | (89,382,611) | |
| Net unrealized appreciation (depreciation) on investments and assets and liabilities in foreign currencies | 1,499,349,379 | |
| Net Assets | $5,253,558,802 | |
| Emerging Markets: | ||
| Net Asset Value, offering price and redemption price per share ($4,228,426,128 ÷ 130,811,285 shares) | $32.32 | |
| Class K: | ||
| Net Asset Value, offering price and redemption price per share ($1,025,132,674 ÷ 31,690,897 shares) | $32.35 |
See accompanying notes which are an integral part of the financial statements.
Statement of Operations
| Six months ended April 30, 2018 (Unaudited) | ||
| Investment Income | ||
| Dividends | $46,619,137 | |
| Income from Fidelity Central Funds | 472,714 | |
| Income before foreign taxes withheld | 47,091,851 | |
| Less foreign taxes withheld | (4,349,721) | |
| Total income | 42,742,130 | |
| Expenses | ||
| Management fee | $18,652,285 | |
| Transfer agent fees | 4,251,160 | |
| Accounting and security lending fees | 791,683 | |
| Custodian fees and expenses | 1,132,249 | |
| Independent trustees' fees and expenses | 10,494 | |
| Registration fees | 148,282 | |
| Audit | 46,341 | |
| Legal | 9,937 | |
| Interest | 59,023 | |
| Miscellaneous | 15,641 | |
| Total expenses before reductions | 25,117,095 | |
| Expense reductions | (1,003,489) | 24,113,606 |
| Net investment income (loss) | 18,628,524 | |
| Realized and Unrealized Gain (Loss) | ||
| Net realized gain (loss) on: | ||
| Investment securities: | ||
| Unaffiliated issuers | 167,434,366 | |
| Fidelity Central Funds | 4,759 | |
| Foreign currency transactions | (630,143) | |
| Total net realized gain (loss) | 166,808,982 | |
| Change in net unrealized appreciation (depreciation) on: | ||
| Investment securities: | ||
| Unaffiliated issuers (net of decrease in deferred foreign taxes of $2,231,057) | (16,070,821) | |
| Assets and liabilities in foreign currencies | (67,343) | |
| Total change in net unrealized appreciation (depreciation) | (16,138,164) | |
| Net gain (loss) | 150,670,818 | |
| Net increase (decrease) in net assets resulting from operations | $169,299,342 |
See accompanying notes which are an integral part of the financial statements.
Statement of Changes in Net Assets
| Six months ended April 30, 2018 (Unaudited) | Year ended October 31, 2017 | |
| Increase (Decrease) in Net Assets | ||
| Operations | ||
| Net investment income (loss) | $18,628,524 | $34,645,276 |
| Net realized gain (loss) | 166,808,982 | 212,503,902 |
| Change in net unrealized appreciation (depreciation) | (16,138,164) | 865,316,825 |
| Net increase (decrease) in net assets resulting from operations | 169,299,342 | 1,112,466,003 |
| Distributions to shareholders from net investment income | (27,149,838) | (23,974,554) |
| Distributions to shareholders from net realized gain | (4,339,116) | – |
| Total distributions | (31,488,954) | (23,974,554) |
| Share transactions - net increase (decrease) | 257,466,347 | 96,080,893 |
| Redemption fees | 97,832 | 379,582 |
| Total increase (decrease) in net assets | 395,374,567 | 1,184,951,924 |
| Net Assets | ||
| Beginning of period | 4,858,184,235 | 3,673,232,311 |
| End of period | $5,253,558,802 | $4,858,184,235 |
| Other Information | ||
| Undistributed net investment income end of period | $17,414,743 | $25,936,057 |
See accompanying notes which are an integral part of the financial statements.
Financial Highlights
Fidelity Emerging Markets Fund
| Six months ended (Unaudited) April 30, | Years endedOctober 31, | |||||
| 2018 | 2017 | 2016 | 2015 | 2014 | 2013 | |
| Selected Per–Share Data | ||||||
| Net asset value, beginning of period | $31.37 | $24.25 | $22.55 | $25.44 | $24.43 | $22.15 |
| Income from Investment Operations | ||||||
| Net investment income (loss)A | .11 | .22 | .14 | .19 | .17 | .20 |
| Net realized and unrealized gain (loss) | 1.03 | 7.05 | 1.66 | (2.91) | .86 | 2.38 |
| Total from investment operations | 1.14 | 7.27 | 1.80 | (2.72) | 1.03 | 2.58 |
| Distributions from net investment income | (.16) | (.15) | (.11) | (.14) | (.02) | (.30) |
| Distributions from net realized gain | (.03) | – | – | (.03) | – | – |
| Total distributions | (.19) | (.15) | (.11) | (.17) | (.02) | (.30) |
| Redemption fees added to paid in capitalA | –B | –B | .01 | –B | –B | –B |
| Net asset value, end of period | $32.32 | $31.37 | $24.25 | $22.55 | $25.44 | $24.43 |
| Total ReturnC,D | 3.64% | 30.21% | 8.07% | (10.76)% | 4.22% | 11.78% |
| Ratios to Average Net AssetsE,F | ||||||
| Expenses before reductions | .96%G | .97% | 1.01% | 1.05% | 1.07% | 1.08% |
| Expenses net of fee waivers, if any | .96%G | .97% | 1.01% | 1.05% | 1.07% | 1.08% |
| Expenses net of all reductions | .92%G | .96% | 1.00% | 1.03% | 1.07% | 1.03% |
| Net investment income (loss) | .66%G | .83% | .61% | .78% | .71% | .85% |
| Supplemental Data | ||||||
| Net assets, end of period (000 omitted) | $4,228,426 | $3,933,401 | $3,014,957 | $2,738,934 | $2,370,927 | $2,241,338 |
| Portfolio turnover rateH | 87%G | 81% | 79% | 107% | 94% | 119% |
A Calculated based on average shares outstanding during the period.
B Amount represents less than $.005 per share.
C Total returns for periods of less than one year are not annualized.
D Total returns would have been lower if certain expenses had not been reduced during the applicable periods shown.
E Fees and expenses of any underlying Fidelity Central Funds are not included in the Fund's expense ratio. The Fund indirectly bears its proportionate share of the expenses of any underlying Fidelity Central Funds.
F Expense ratios reflect operating expenses of the class. Expenses before reductions do not reflect amounts reimbursed by the investment adviser or reductions from brokerage service arrangements or reductions from other expense offset arrangements and do not represent the amount paid by the class during periods when reimbursements or reductions occur. Expenses net of fee waivers reflect expenses after reimbursement by the investment adviser but prior to reductions from brokerage service arrangements or other expense offset arrangements. Expenses net of all reductions represent the net expenses paid by the class.
G Annualized
H Amount does not include the portfolio activity of any underlying Fidelity Central Funds.
See accompanying notes which are an integral part of the financial statements.
Fidelity Emerging Markets Fund Class K
| Six months ended (Unaudited) April 30, | Years endedOctober 31, | |||||
| 2018 | 2017 | 2016 | 2015 | 2014 | 2013 | |
| Selected Per–Share Data | ||||||
| Net asset value, beginning of period | $31.41 | $24.28 | $22.58 | $25.48 | $24.42 | $22.15 |
| Income from Investment Operations | ||||||
| Net investment income (loss)A | .13 | .26 | .18 | .24 | .23 | .25 |
| Net realized and unrealized gain (loss) | 1.04 | 7.06 | 1.66 | (2.92) | .86 | 2.38 |
| Total from investment operations | 1.17 | 7.32 | 1.84 | (2.68) | 1.09 | 2.63 |
| Distributions from net investment income | (.20) | (.19) | (.15) | (.20) | (.03) | (.36) |
| Distributions from net realized gain | (.03) | – | – | (.03) | – | – |
| Total distributions | (.23) | (.19) | (.15) | (.22)B | (.03) | (.36) |
| Redemption fees added to paid in capitalA | –C | –C | .01 | –C | –C | –C |
| Net asset value, end of period | $32.35 | $31.41 | $24.28 | $22.58 | $25.48 | $24.42 |
| Total ReturnD,E | 3.73% | 30.44% | 8.27% | (10.60)% | 4.47% | 12.01% |
| Ratios to Average Net AssetsF,G | ||||||
| Expenses before reductions | .82%H | .83% | .84% | .85% | .86% | .87% |
| Expenses net of fee waivers, if any | .82%H | .82% | .84% | .85% | .85% | .87% |
| Expenses net of all reductions | .78%H | .81% | .83% | .83% | .85% | .82% |
| Net investment income (loss) | .80%H | .98% | .78% | .98% | .92% | 1.07% |
| Supplemental Data | ||||||
| Net assets, end of period (000 omitted) | $1,025,133 | $924,783 | $658,276 | $554,041 | $623,430 | $547,369 |
| Portfolio turnover rateI | 87%H | 81% | 79% | 107% | 94% | 119% |
A Calculated based on average shares outstanding during the period.
B Total distributions of $.22 per share is comprised of distributions from net investment income of $.195 and distributions from net realized gain of $.025 per share.
C Amount represents less than $.005 per share.
D Total returns for periods of less than one year are not annualized.
E Total returns would have been lower if certain expenses had not been reduced during the applicable periods shown.
F Fees and expenses of any underlying Fidelity Central Funds are not included in the Fund's expense ratio. The Fund indirectly bears its proportionate share of the expenses of any underlying Fidelity Central Funds.
G Expense ratios reflect operating expenses of the class. Expenses before reductions do not reflect amounts reimbursed by the investment adviser or reductions from brokerage service arrangements or reductions from other expense offset arrangements and do not represent the amount paid by the class during periods when reimbursements or reductions occur. Expenses net of fee waivers reflect expenses after reimbursement by the investment adviser but prior to reductions from brokerage service arrangements or other expense offset arrangements. Expenses net of all reductions represent the net expenses paid by the class.
H Annualized
I Amount does not include the portfolio activity of any underlying Fidelity Central Funds.
See accompanying notes which are an integral part of the financial statements.
Notes to Financial Statements (Unaudited)
For the period ended April 30, 2018
1. Organization.
Fidelity Emerging Markets Fund (the Fund) is a fund of Fidelity Investment Trust (the Trust) and is authorized to issue an unlimited number of shares. The Trust is registered under the Investment Company Act of 1940, as amended (the 1940 Act), as an open-end management investment company organized as a Massachusetts business trust. The Fund offers Emerging Markets and Class K shares, each of which has equal rights as to assets and voting privileges. Each class has exclusive voting rights with respect to matters that affect that class. The Fund's investments in emerging markets can be subject to social, economic, regulatory, and political uncertainties and can be extremely volatile.
2. Investments in Fidelity Central Funds.
The Fund invests in Fidelity Central Funds, which are open-end investment companies generally available only to other investment companies and accounts managed by the investment adviser and its affiliates. The Fund's Schedule of Investments lists each of the Fidelity Central Funds held as of period end, if any, as an investment of the Fund, but does not include the underlying holdings of each Fidelity Central Fund. As an Investing Fund, the Fund indirectly bears its proportionate share of the expenses of the underlying Fidelity Central Funds.
The Money Market Central Funds seek preservation of capital and current income and are managed by Fidelity Investments Money Management, Inc. (FIMM), an affiliate of the investment adviser. Annualized expenses of the Money Market Central Funds as of their most recent shareholder report date are less than .005%.
A complete unaudited list of holdings for each Fidelity Central Fund is available upon request or at the Securities and Exchange Commission (the SEC) website at www.sec.gov. In addition, the financial statements of the Fidelity Central Funds are available on the SEC website or upon request.
3. Significant Accounting Policies.
The Fund is an investment company and applies the accounting and reporting guidance of the Financial Accounting Standards Board (FASB) Accounting Standards Codification Topic 946 Financial Services – Investments Companies. The financial statements have been prepared in conformity with accounting principles generally accepted in the United States of America (GAAP), which require management to make certain estimates and assumptions at the date of the financial statements. Actual results could differ from those estimates. Subsequent events, if any, through the date that the financial statements were issued have been evaluated in the preparation of the financial statements. The following summarizes the significant accounting policies of the Fund:
Investment Valuation. Investments are valued as of 4:00 p.m. Eastern time on the last calendar day of the period. The Board of Trustees (the Board) has delegated the day to day responsibility for the valuation of the Fund's investments to the Fair Value Committee (the Committee) established by the Fund's investment adviser. In accordance with valuation policies and procedures approved by the Board, the Fund attempts to obtain prices from one or more third party pricing vendors or brokers to value its investments. When current market prices, quotations or currency exchange rates are not readily available or reliable, investments will be fair valued in good faith by the Committee, in accordance with procedures adopted by the Board. Factors used in determining fair value vary by investment type and may include market or investment specific events. The frequency with which these procedures are used cannot be predicted and they may be utilized to a significant extent. The Committee oversees the Fund's valuation policies and procedures and reports to the Board on the Committee's activities and fair value determinations. The Board monitors the appropriateness of the procedures used in valuing the Fund's investments and ratifies the fair value determinations of the Committee.
The Fund categorizes the inputs to valuation techniques used to value its investments into a disclosure hierarchy consisting of three levels as shown below:
- Level 1 – quoted prices in active markets for identical investments
- Level 2 – other significant observable inputs (including quoted prices for similar investments, interest rates, prepayment speeds, etc.)
- Level 3 – unobservable inputs (including the Fund's own assumptions based on the best information available)
Valuation techniques used to value the Fund's investments by major category are as follows:
Equity securities, including restricted securities, for which market quotations are readily available, are valued at the last reported sale price or official closing price as reported by a third party pricing vendor on the primary market or exchange on which they are traded and are categorized as Level 1 in the hierarchy. In the event there were no sales during the day or closing prices are not available, securities are valued at the last quoted bid price or may be valued using the last available price and are generally categorized as Level 2 in the hierarchy. For foreign equity securities, when market or security specific events arise, comparisons to the valuation of American Depositary Receipts (ADRs), futures contracts, Exchange-Traded Funds (ETFs) and certain indexes as well as quoted prices for similar securities may be used and would be categorized as Level 2 in the hierarchy. Utilizing these techniques may result in transfers between Level 1 and Level 2. For equity securities, including restricted securities, where observable inputs are limited, assumptions about market activity and risk are used and these securities may be categorized as Level 3 in the hierarchy.
Investments in open-end mutual funds, including the Fidelity Central Funds, are valued at their closing net asset value (NAV) each business day and are categorized as Level 1 in the hierarchy.
Changes in valuation techniques may result in transfers in or out of an assigned level within the disclosure hierarchy. The aggregate value of investments by input level as of April 30, 2018, including information on transfers between Levels 1 and 2, is included at the end of the Fund's Schedule of Investments.
Foreign Currency. The Fund may use foreign currency contracts to facilitate transactions in foreign-denominated securities. Gains and losses from these transactions may arise from changes in the value of the foreign currency or if the counterparties do not perform under the contracts' terms.
Foreign-denominated assets, including investment securities, and liabilities are translated into U.S. dollars at the exchange rates at period end. Purchases and sales of investment securities, income and dividends received and expenses denominated in foreign currencies are translated into U.S. dollars at the exchange rate in effect on the transaction date.
The effects of exchange rate fluctuations on investments are included with the net realized and unrealized gain (loss) on investment securities. Other foreign currency transactions resulting in realized and unrealized gain (loss) are disclosed separately.
Investment Transactions and Income. For financial reporting purposes, the Fund's investment holdings and NAV include trades executed through the end of the last business day of the period. The NAV per share for processing shareholder transactions is calculated as of the close of business of the New York Stock Exchange (NYSE), normally 4:00 p.m. Eastern time and includes trades executed through the end of the prior business day. Gains and losses on securities sold are determined on the basis of identified cost and includes proceeds received from litigation. Dividend income is recorded on the ex-dividend date, except for certain dividends from foreign securities where the ex-dividend date may have passed, which are recorded as soon as the Fund is informed of the ex-dividend date. Non-cash dividends included in dividend income, if any, are recorded at the fair market value of the securities received. Income and capital gain distributions from Fidelity Central Funds, if any, are recorded on the ex-dividend date. Certain distributions received by the Fund represent a return of capital or capital gain. The Fund determines the components of these distributions subsequent to the ex-dividend date, based upon receipt of tax filings or other correspondence relating to the underlying investment. These distributions are recorded as a reduction of cost of investments and/or as a realized gain. Investment income is recorded net of foreign taxes withheld where recovery of such taxes is uncertain.
Class Allocations and Expenses. Investment income, realized and unrealized capital gains and losses, common expenses of the Fund, and certain fund-level expense reductions, if any, are allocated daily on a pro-rata basis to each class based on the relative net assets of each class to the total net assets of the Fund. Each class differs with respect to transfer agent fees incurred. Certain expense reductions may also differ by class. For the reporting period, the allocated portion of income and expenses to each class as a percent of its average net assets may vary due to the timing of recording these transactions in relation to fluctuating net assets of the classes. Expenses directly attributable to a fund are charged to that fund. Expenses attributable to more than one fund are allocated among the respective funds on the basis of relative net assets or other appropriate methods. Expense estimates are accrued in the period to which they relate and adjustments are made when actual amounts are known.
Income Tax Information and Distributions to Shareholders. Each year, the Fund intends to qualify as a regulated investment company under Subchapter M of the Internal Revenue Code, including distributing substantially all of its taxable income and realized gains. As a result, no provision for U.S. Federal income taxes is required. The Fund files a U.S. federal tax return, in addition to state and local tax returns as required. The Fund's federal income tax returns are subject to examination by the Internal Revenue Service (IRS) for a period of three fiscal years after they are filed. State and local tax returns may be subject to examination for an additional fiscal year depending on the jurisdiction. Foreign taxes are provided for based on the Fund's understanding of the tax rules and rates that exist in the foreign markets in which it invests. The Fund is subject to a tax imposed on capital gains by certain countries in which it invests. An estimated deferred tax liability for net unrealized appreciation on the applicable securities is included in Other payables and accrued expenses on the Statement of Assets & Liabilities.
Distributions are declared and recorded on the ex-dividend date. Income and capital gain distributions are declared separately for each class. Income and capital gain distributions are determined in accordance with income tax regulations, which may differ from GAAP.
Capital accounts within the financial statements are adjusted for permanent book-tax differences. These adjustments have no impact on net assets or the results of operations. Capital accounts are not adjusted for temporary book-tax differences which will reverse in a subsequent period.
Book-tax differences are primarily due to foreign currency transactions, passive foreign investment companies (PFIC), capital loss carryforwards, certain foreign taxes, expiring capital loss carryforwards, deferred trustees compensation and losses deferred due to wash sales.
As of period end, the cost and unrealized appreciation (depreciation) in securities, and derivatives if applicable, for federal income tax purposes were as follows:
| Gross unrealized appreciation | $1,577,825,986 |
| Gross unrealized depreciation | (79,901,603) |
| Net unrealized appreciation (depreciation) | $1,497,924,383 |
| Tax cost | $3,758,429,752 |
Capital loss carryforwards are only available to offset future capital gains of the Fund to the extent provided by regulations and may be limited. Under the Regulated Investment Company Modernization Act of 2010 (the Act), the Fund is permitted to carry forward capital losses incurred in taxable years beginning after December 22, 2010 for an unlimited period and such capital losses are required to be used prior to any losses that expire. The capital loss carryforward information presented below, including any applicable limitation, is estimated as of prior fiscal period end and is subject to adjustment.
| No expiration | |
| Short-term | $(248,807,540) |
Short-Term Trading (Redemption) Fees. Shares held by investors in the Fund less than 90 days may have been subject to a redemption fee equal to 1.50% of the NAV of shares redeemed. All redemption fees, which reduce the proceeds of the shareholder redemption, are retained by the Fund and accounted for as an addition to paid in capital. In November 2017, the Board of Trustees approved the elimination of these redemption fees effective December 18, 2017.
4. Purchases and Sales of Investments.
Purchases and sales of securities, other than short-term securities, aggregated $2,550,079,602 and $2,290,013,977, respectively.
5. Fees and Other Transactions with Affiliates.
Management Fee. Fidelity Management & Research Company (the investment adviser) and its affiliates provide the Fund with investment management related services for which the Fund pays a monthly management fee. The management fee is the sum of an individual fund fee rate that is based on an annual rate of .45% of the Fund's average net assets and an annualized group fee rate that averaged .24% during the period. The group fee rate is based upon the average net assets of all the mutual funds advised by the investment adviser, including any mutual funds previously advised by the investment adviser that are currently advised by Fidelity SelectCo, LLC, an affiliate of the investment adviser. The group fee rate decreases as assets under management increase and increases as assets under management decrease. For the reporting period, the total annualized management fee rate was .69% of the Fund's average net assets.
Transfer Agent Fees. Fidelity Investments Institutional Operations Company, Inc., (FIIOC), an affiliate of the investment adviser, is the transfer, dividend disbursing and shareholder servicing agent for each class of the Fund. FIIOC receives account fees and asset-based fees that vary according to the account size and type of account of the shareholders of Emerging Markets, except for Class K. FIIOC receives an asset-based fee of Class K's average net assets. FIIOC pays for typesetting, printing and mailing of shareholder reports, except proxy statements.
For the period, transfer agent fees for each class were as follows:
| Amount | % of Class-Level Average Net Assets(a) | |
| Emerging Markets | $4,021,942 | .18 |
| Class K | 229,218 | .05 |
| $4,251,160 |
(a) Annualized
Accounting and Security Lending Fees. Fidelity Service Company, Inc. (FSC), an affiliate of the investment adviser, maintains the Fund's accounting records. The accounting fee is based on the level of average net assets for each month. Under a separate contract, FSC administers the security lending program. The security lending fee is based on the number and duration of lending transactions. For the period, the fees were equivalent to an annualized rate of .03%.
Brokerage Commissions. The Fund placed a portion of its portfolio transactions with brokerage firms which are affiliates of the investment adviser. Brokerage commissions are included in net realized gain (loss) and change in net unrealized appreciation (depreciation) in the Statement of Operations. The commissions paid to these affiliated firms were $10,337 for the period.
Interfund Lending Program. Pursuant to an Exemptive Order issued by the SEC, the Fund, along with other registered investment companies having management contracts with Fidelity Management & Research Company (FMR) or other affiliated entities of FMR, may participate in an interfund lending program. This program provides an alternative credit facility allowing the funds to borrow from, or lend money to, other participating affiliated funds. At period end, there were no interfund loans outstanding. The Fund's activity in this program during the period for which loans were outstanding was as follows:
| Borrower or Lender | Average Loan Balance | Weighted Average Interest Rate | Interest Expense |
| Borrower | $34,813,286 | 1.71% | $46,212 |
Interfund Trades. The Fund may purchase from or sell securities to other Fidelity Funds under procedures adopted by the Board. The procedures have been designed to ensure these interfund trades are executed in accordance with Rule 17a-7 of the 1940 Act. Interfund trades are included within the respective purchases and sales amounts shown in the Purchases and Sales of Investments note.
6. Committed Line of Credit.
The Fund participates with other funds managed by the investment adviser or an affiliate in a $4.25 billion credit facility (the "line of credit") to be utilized for temporary or emergency purposes to fund shareholder redemptions or for other short-term liquidity purposes. The Fund has agreed to pay commitment fees on its pro-rata portion of the line of credit, which amounted to $7,527 and is reflected in Miscellaneous expenses on the Statement of Operations. During the period, the Fund did not borrow on this line of credit.
7. Security Lending.
The Fund lends portfolio securities through a lending agent from time to time in order to earn additional income. For equity securities, a lending agent is used and may loan securities to certain qualified borrowers, including Fidelity Capital Markets (FCM), a broker-dealer affiliated with the Fund. On the settlement date of the loan, the Fund receives collateral (in the form of U.S. Treasury obligations, letters of credit and/or cash) against the loaned securities and maintains collateral in an amount not less than 100% of the market value of the loaned securities during the period of the loan. The market value of the loaned securities is determined at the close of business of the Fund and any additional required collateral is delivered to the Fund on the next business day. The Fund or borrower may terminate the loan at any time, and if the borrower defaults on its obligation to return the securities loaned because of insolvency or other reasons, the Fund may apply collateral received from the borrower against the obligation. The Fund may experience delays and costs in recovering the securities loaned. Any cash collateral received is invested in the Fidelity Securities Lending Cash Central Fund. The value of loaned securities and cash collateral at period end are disclosed on the Fund's Statement of Assets and Liabilities. Security lending income represents the income earned on investing cash collateral, less rebates paid to borrowers and any lending agent fees associated with the loan, plus any premium payments received for lending certain types of securities. Security lending income is presented in the Statement of Operations as a component of income from Fidelity Central Funds. Total security lending income during the period amounted to $53,863. During the period, there were no securities loaned to FCM.
8. Bank Borrowings.
The Fund is permitted to have bank borrowings for temporary or emergency purposes to fund shareholder redemptions or for other short-term liquidity requirements. The Fund has established borrowing arrangements with certain banks. The interest rate on the borrowings is the bank's base rate, as revised from time to time. The average loan balance during the period for which loans were outstanding amounted to $48,041,600. The weighted average interest rate was 1.92%. The interest expense amounted to $12,811 under the bank borrowing program. At period end, there were no bank borrowings outstanding.
9. Expense Reductions.
Commissions paid to certain brokers with whom the investment adviser, or its affiliates, places trades on behalf of the Fund include an amount in addition to trade execution, which may be rebated back to the Fund to offset certain expenses. This amount totaled $971,667 for the period.In addition, through arrangements with the Fund's custodian, credits realized as a result of certain uninvested cash balances were used to reduce the Fund's expenses. During the period, these credits reduced the Fund's custody expenses by $6,103.
In addition, during the period the investment adviser reimbursed and/or waived a portion of fund-level operating expenses in the amount of $25,719.
10. Distributions to Shareholders.
Distributions to shareholders of each class were as follows:
| Six months ended April 30, 2018 | Year ended October 31, 2017 | |
| From net investment income | ||
| Emerging Markets | $21,280,826 | $18,744,412 |
| Class K | 5,869,012 | 5,230,142 |
| Total | $27,149,838 | $23,974,554 |
| From net realized gain | ||
| Emerging Markets | $3,546,800 | $– |
| Class K | 792,316 | – |
| Total | $4,339,116 | $– |
11. Share Transactions.
Share transactions for each class were as follows and may contain automatic conversions between classes or exchanges between affiliated funds:
| Shares | Shares | Dollars | Dollars | |
| Six months ended April 30, 2018 | Year ended October 31, 2017 | Six months ended April 30, 2018 | Year ended October 31, 2017 | |
| Emerging Markets | ||||
| Shares sold | 28,213,866 | 35,833,343 | $934,285,779 | $958,972,147 |
| Reinvestment of distributions | 746,970 | 790,787 | 23,634,137 | 17,864,538 |
| Shares redeemed | (23,535,687) | (35,588,763) | (775,425,515) | (943,601,756) |
| Net increase (decrease) | 5,425,149 | 1,035,367 | $182,494,401 | $33,234,929 |
| Class K | ||||
| Shares sold | 6,223,868 | 9,726,562 | $206,560,220 | $257,288,456 |
| Reinvestment of distributions | 210,535 | 231,437 | 6,661,328 | 5,230,142 |
| Shares redeemed | (4,187,076) | (7,627,038) | (138,249,602) | (199,672,634) |
| Net increase (decrease) | 2,247,327 | 2,330,961 | $74,971,946 | $62,845,964 |
12. Other.
The Fund's organizational documents provide former and current trustees and officers with a limited indemnification against liabilities arising in connection with the performance of their duties to the Fund. In the normal course of business, the Fund may also enter into contracts that provide general indemnifications. The Fund's maximum exposure under these arrangements is unknown as this would be dependent on future claims that may be made against the Fund. The risk of material loss from such claims is considered remote.
Shareholder Expense Example
As a shareholder of the Fund, you incur two types of costs: (1) transaction costs, including redemption fees and (2) ongoing costs, including management fees and other Fund expenses. This Example is intended to help you understand your ongoing costs (in dollars) of investing in the Fund and to compare these costs with the ongoing costs of investing in other mutual funds.
The Example is based on an investment of $1,000 invested at the beginning of the period and held for the entire period (November 1, 2017 to April 30, 2018).
Actual Expenses
The first line of the accompanying table for each class of the Fund provides information about actual account values and actual expenses. You may use the information in this line, together with the amount you invested, to estimate the expenses that you paid over the period. Simply divide your account value by $1,000.00 (for example, an $8,600 account value divided by $1,000.00 = 8.6), then multiply the result by the number in the first line for a class of the Fund under the heading entitled "Expenses Paid During Period" to estimate the expenses you paid on your account during this period. A small balance maintenance fee of $12.00 that is charged once a year may apply for certain accounts with a value of less than $2,000. This fee is not included in the table below. If it was, the estimate of expenses you paid during the period would be higher, and your ending account value lower, by this amount. In addition, the Fund, as a shareholder in the underlying Fidelity Central Funds, will indirectly bear its pro-rata share of the fees and expenses incurred by the underlying Fidelity Central Funds. These fees and expenses are not included in the Fund's annualized expense ratio used to calculate the expense estimate in the table below.
Hypothetical Example for Comparison Purposes
The second line of the accompanying table for each class of the Fund provides information about hypothetical account values and hypothetical expenses based on a Class' actual expense ratio and an assumed rate of return of 5% per year before expenses, which is not the Class' actual return. The hypothetical account values and expenses may not be used to estimate the actual ending account balance or expenses you paid for the period. You may use this information to compare the ongoing costs of investing in the Fund and other funds. To do so, compare this 5% hypothetical example with the 5% hypothetical examples that appear in the shareholder reports of the other funds. A small balance maintenance fee of $12.00 that is charged once a year may apply for certain accounts with a value of less than $2,000. This fee is not included in the table below. If it was, the estimate of expenses you paid during the period would be higher, and your ending account value lower, by this amount. In addition, the Fund, as a shareholder in the underlying Fidelity Central Funds, will indirectly bear its pro-rata share of the fees and expenses incurred by the underlying Fidelity Central Funds. These fees and expenses are not included in the Fund's annualized expense ratio used to calculate the expense estimate in the table below.
Please note that the expenses shown in the table are meant to highlight your ongoing costs only and do not reflect any transaction costs. Therefore, the second line of the table is useful in comparing ongoing costs only, and will not help you determine the relative total costs of owning different funds. In addition, if these transactional costs were included, your costs would have been higher.
| Annualized Expense Ratio-A | Beginning Account Value November 1, 2017 | Ending Account Value April 30, 2018 | Expenses Paid During Period-B November 1, 2017 to April 30, 2018 | |
| Emerging Markets | .96% | |||
| Actual | $1,000.00 | $1,036.40 | $4.85 | |
| Hypothetical-C | $1,000.00 | $1,020.03 | $4.81 | |
| Class K | .82% | |||
| Actual | $1,000.00 | $1,037.30 | $4.14 | |
| Hypothetical-C | $1,000.00 | $1,020.73 | $4.11 |
A Annualized expense ratio reflects expenses net of applicable fee waivers.
B Expenses are equal to each Class' annualized expense ratio, multiplied by the average account value over the period, multiplied by 181/365 (to reflect the one-half year period).
C 5% return per year before expenses
![]()
Corporate Headquarters
245 Summer St.
Boston, MA 02210
www.fidelity.com
EMF-K-SANN-0618
1.863019.109
Fidelity Advisor® Europe Fund - Semi-Annual Report April 30, 2018 Class A, Class M, Class C and Class I are classes of Fidelity® Europe Fund |
|
Contents
To view a fund's proxy voting guidelines and proxy voting record for the 12-month period ended June 30, visit http://www.fidelity.com/proxyvotingresults or visit the Securities and Exchange Commission's (SEC) web site at http://www.sec.gov.
You may also call 1-877-208-0098 to request a free copy of the proxy voting guidelines.
Standard & Poor's, S&P and S&P 500 are registered service marks of The McGraw-Hill Companies, Inc. and have been licensed for use by Fidelity Distributors Corporation.
Other third-party marks appearing herein are the property of their respective owners.
All other marks appearing herein are registered or unregistered trademarks or service marks of FMR LLC or an affiliated company. © 2018 FMR LLC. All rights reserved.
This report and the financial statements contained herein are submitted for the general information of the shareholders of the Fund. This report is not authorized for distribution to prospective investors in the Fund unless preceded or accompanied by an effective prospectus.
A fund files its complete schedule of portfolio holdings with the SEC for the first and third quarters of each fiscal year on Form N-Q. Forms N-Q are available on the SEC’s web site at http://www.sec.gov. A fund's Forms N-Q may be reviewed and copied at the SEC’s Public Reference Room in Washington, DC. Information regarding the operation of the SEC's Public Reference Room may be obtained by calling 1-800-SEC-0330.
For a complete list of a fund's portfolio holdings, view the most recent holdings listing, semiannual report, or annual report on Fidelity's web site at http://www.fidelity.com, http://www.institutional.fidelity.com, or http://www.401k.com, as applicable.
NOT FDIC INSURED •MAY LOSE VALUE •NO BANK GUARANTEE
Neither the Fund nor Fidelity Distributors Corporation is a bank.
Investment Summary (Unaudited)
Geographic Diversification (% of fund's net assets)
| As of April 30, 2018 | ||
| United Kingdom | 20.8% | |
| Sweden | 18.4% | |
| Germany | 13.3% | |
| Italy | 7.8% | |
| Spain | 7.2% | |
| Ireland | 6.3% | |
| France | 5.3% | |
| Bermuda | 3.7% | |
| Netherlands | 3.5% | |
| Other* | 13.7% | |

* Includes Short-Term investments and Net Other Assets (Liabilities).
Percentages are based on country or territory of incorporation and are adjusted for the effect of futures contracts, if applicable.
Asset Allocation as of April 30, 2018
| % of fund's net assets | |
| Stocks | 99.6 |
| Short-Term Investments and Net Other Assets (Liabilities) | 0.4 |
Top Ten Stocks as of April 30, 2018
| % of fund's net assets | |
| SAP SE (Germany, Software) | 3.6 |
| Securitas AB (B Shares) (Sweden, Commercial Services & Supplies) | 3.5 |
| Prudential PLC (United Kingdom, Insurance) | 3.4 |
| Getinge AB (B Shares) (Sweden, Health Care Equipment & Supplies) | 3.2 |
| Intertrust NV (Netherlands, Professional Services) | 3.1 |
| Swatch Group AG (Bearer) (Switzerland, Textiles, Apparel & Luxury Goods) | 2.8 |
| NCC Group Ltd. (United Kingdom, IT Services) | 2.8 |
| Vostok New Ventures Ltd. (depositary receipt) (Bermuda, Capital Markets) | 2.7 |
| Micro Focus International PLC (United Kingdom, Software) | 2.5 |
| A.P. Moller - Maersk A/S Series B (Denmark, Marine) | 2.5 |
| 30.1 |
Top Market Sectors as of April 30, 2018
| % of fund's net assets | |
| Financials | 24.9 |
| Industrials | 22.2 |
| Health Care | 13.9 |
| Consumer Discretionary | 13.9 |
| Information Technology | 13.2 |
| Consumer Staples | 4.6 |
| Materials | 4.0 |
| Real Estate | 2.9 |
Schedule of Investments April 30, 2018 (Unaudited)
Showing Percentage of Net Assets
| Common Stocks - 97.1% | |||
| Shares | Value | ||
| Bermuda - 3.7% | |||
| Vostok Emerging Finance Ltd. (depository receipt) (a)(b)(c) | 53,590,807 | $11,995,224 | |
| Vostok New Ventures Ltd. (depositary receipt) (a)(b) | 3,850,361 | 32,274,500 | |
| TOTAL BERMUDA | 44,269,724 | ||
| Canada - 1.0% | |||
| Lundin Mining Corp. (Sweden) | 1,883,900 | 12,080,075 | |
| Denmark - 2.5% | |||
| A.P. Moller - Maersk A/S Series B | 18,612 | 30,034,049 | |
| France - 5.3% | |||
| Capgemini SA | 215,900 | 29,722,176 | |
| The Vicat Group | 158,300 | 11,670,506 | |
| Wendel SA | 149,700 | 22,633,371 | |
| TOTAL FRANCE | 64,026,053 | ||
| Germany - 13.3% | |||
| Bertrandt AG | 126,900 | 14,213,422 | |
| Fresenius Medical Care AG & Co. KGaA | 179,000 | 18,163,286 | |
| Fresenius SE & Co. KGaA | 82,300 | 6,295,076 | |
| Hannover Reuck SE | 118,500 | 16,685,530 | |
| JOST Werke AG (d) | 102,100 | 4,309,194 | |
| LEG Immobilien AG | 252,828 | 29,169,804 | |
| MTU Aero Engines Holdings AG | 143,000 | 24,694,212 | |
| SAP SE | 381,437 | 42,379,816 | |
| WashTec AG | 29,300 | 2,827,076 | |
| TOTAL GERMANY | 158,737,416 | ||
| Hungary - 1.1% | |||
| OTP Bank PLC | 305,700 | 13,355,871 | |
| Ireland - 6.3% | |||
| DCC PLC (United Kingdom) | 147,600 | 14,224,064 | |
| Paddy Power Betfair PLC (Ireland) | 253,900 | 25,126,660 | |
| Ryanair Holdings PLC sponsored ADR (a) | 164,767 | 18,119,427 | |
| United Drug PLC (United Kingdom) | 1,420,241 | 17,890,499 | |
| TOTAL IRELAND | 75,360,650 | ||
| Italy - 6.7% | |||
| Banca Generali SpA | 379,600 | 12,340,262 | |
| Buzzi Unicem SpA | 490,500 | 12,415,191 | |
| Prada SpA | 5,418,200 | 27,491,435 | |
| UniCredit SpA | 1,317,933 | 28,606,266 | |
| TOTAL ITALY | 80,853,154 | ||
| Malta - 1.1% | |||
| Kambi Group PLC (a) | 1,055,109 | 12,651,693 | |
| Netherlands - 3.5% | |||
| Instone Real Estate Group BV (a)(d) | 186,700 | 4,473,556 | |
| Intertrust NV (d) | 1,881,325 | 37,486,153 | |
| TOTAL NETHERLANDS | 41,959,709 | ||
| Norway - 2.2% | |||
| Schibsted ASA (A Shares) | 890,150 | 26,031,087 | |
| Spain - 5.8% | |||
| Aedas Homes SAU (d) | 52,983 | 1,887,477 | |
| Amadeus IT Holding SA Class A | 296,800 | 21,755,832 | |
| Grifols SA | 499,300 | 14,078,992 | |
| Prosegur Cash SA (d) | 7,417,400 | 21,676,550 | |
| Prosegur Compania de Seguridad SA (Reg.) | 1,369,300 | 10,384,399 | |
| TOTAL SPAIN | 69,783,250 | ||
| Sweden - 18.4% | |||
| Arjo AB | 8,828,784 | 26,062,943 | |
| Essity AB Class B | 798,700 | 20,339,982 | |
| Getinge AB (B Shares) (b) | 4,148,384 | 38,685,689 | |
| Indutrade AB | 939,100 | 22,242,449 | |
| Investor AB (B Shares) | 670,971 | 29,354,718 | |
| Nobia AB (b) | 637,800 | 5,032,973 | |
| Nordea Bank AB | 2,322,400 | 23,704,968 | |
| Securitas AB (B Shares) (b) | 2,562,100 | 41,547,647 | |
| Swedish Match Co. AB | 285,000 | 12,823,397 | |
| TOTAL SWEDEN | 219,794,766 | ||
| Switzerland - 3.3% | |||
| EDAG Engineering Group AG | 297,000 | 5,688,303 | |
| Swatch Group AG (Bearer) | 69,820 | 33,712,281 | |
| TOTAL SWITZERLAND | 39,400,584 | ||
| United Kingdom - 20.8% | |||
| British American Tobacco PLC (United Kingdom) | 394,200 | 21,620,889 | |
| Dechra Pharmaceuticals PLC | 764,900 | 28,874,297 | |
| Diploma PLC | 938,300 | 15,578,597 | |
| IntegraFin Holdings PLC (a) | 314,300 | 1,237,513 | |
| International Personal Finance PLC | 4,931,872 | 16,512,570 | |
| Micro Focus International PLC | 1,761,458 | 30,373,053 | |
| NCC Group Ltd. | 12,345,224 | 33,413,487 | |
| Prudential PLC | 1,587,138 | 40,811,760 | |
| Rolls-Royce Holdings PLC | 2,252,300 | 26,046,228 | |
| Standard Chartered PLC (United Kingdom) | 2,594,366 | 27,394,661 | |
| The Weir Group PLC | 239,200 | 7,033,990 | |
| TOTAL UNITED KINGDOM | 248,897,045 | ||
| United States of America - 2.1% | |||
| Autoliv, Inc. (depositary receipt) | 187,300 | 25,410,676 | |
| TOTAL COMMON STOCKS | |||
| (Cost $1,011,578,750) | 1,162,645,802 | ||
| Nonconvertible Preferred Stocks - 2.5% | |||
| Italy - 1.1% | |||
| Buzzi Unicem SpA (Risparmio Shares) | 889,200 | 12,778,195 | |
| Spain - 1.4% | |||
| Grifols SA Class B | 850,250 | 17,525,661 | |
| United Kingdom - 0.0% | |||
| Rolls-Royce Holdings PLC Series C (a) | 159,913,300 | 220,153 | |
| TOTAL NONCONVERTIBLE PREFERRED STOCKS | |||
| (Cost $23,766,105) | 30,524,009 | ||
| Money Market Funds - 2.3% | |||
| Fidelity Cash Central Fund, 1.74% (e) | 1,058,641 | 1,058,853 | |
| Fidelity Securities Lending Cash Central Fund 1.74% (e)(f) | 25,832,021 | 25,834,604 | |
| TOTAL MONEY MARKET FUNDS | |||
| (Cost $26,893,457) | 26,893,457 | ||
| TOTAL INVESTMENT IN SECURITIES - 101.9% | |||
| (Cost $1,062,238,312) | 1,220,063,268 | ||
| NET OTHER ASSETS (LIABILITIES) - (1.9)% | (22,352,339) | ||
| NET ASSETS - 100% | $1,197,710,929 |
Categorizations in the Schedule of Investments are based on country or territory of incorporation.
Legend
(a) Non-income producing
(b) Security or a portion of the security is on loan at period end.
(c) Affiliated company
(d) Security exempt from registration under Rule 144A of the Securities Act of 1933. These securities may be resold in transactions exempt from registration, normally to qualified institutional buyers. At the end of the period, the value of these securities amounted to $69,832,930 or 5.8% of net assets.
(e) Affiliated fund that is generally available only to investment companies and other accounts managed by Fidelity Investments. The rate quoted is the annualized seven-day yield of the fund at period end. A complete unaudited listing of the fund's holdings as of its most recent quarter end is available upon request. In addition, each Fidelity Central Fund's financial statements are available on the SEC's website or upon request.
(f) Investment made with cash collateral received from securities on loan.
Affiliated Central Funds
Information regarding fiscal year to date income earned by the Fund from investments in Fidelity Central Funds is as follows:
| Fund | Income earned |
| Fidelity Cash Central Fund | $62,319 |
| Fidelity Securities Lending Cash Central Fund | 146,708 |
| Total | $209,027 |
Amounts in the income column in the above table include any capital gain distributions from underlying funds, which are presented in the corresponding line-item in the Statement of Operations if applicable.
Other Affiliated Issuers
An affiliated company is a company in which the Fund has ownership of at least 5% of the voting securities. Fiscal year to date transactions with companies which are or were affiliates are as follows:
| Affiliate | Value, beginning of period | Purchases | Sales Proceeds | Dividend Income | Realized Gain (loss) | Change in Unrealized appreciation (depreciation) | Value, end of period |
| Vostok Emerging Finance Ltd. (depository receipt) | $11,714,677 | $-- | $-- | $-- | $-- | $280,547 | $11,995,224 |
| Total | $11,714,677 | $-- | $-- | $-- | $-- | $280,547 | $11,995,224 |
Investment Valuation
The following is a summary of the inputs used, as of April 30, 2018, involving the Fund's assets and liabilities carried at fair value. The inputs or methodology used for valuing securities may not be an indication of the risk associated with investing in those securities. For more information on valuation inputs, and their aggregation into the levels used below, please refer to the Investment Valuation section in the accompanying Notes to Financial Statements.
| Valuation Inputs at Reporting Date: | ||||
| Description | Total | Level 1 | Level 2 | Level 3 |
| Investments in Securities: | ||||
| Equities: | ||||
| Consumer Discretionary | $165,454,302 | $137,962,867 | $27,491,435 | $-- |
| Consumer Staples | 54,784,268 | 33,163,379 | 21,620,889 | -- |
| Financials | 298,583,764 | 257,772,004 | 40,811,760 | -- |
| Health Care | 167,576,443 | 131,887,496 | 35,688,947 | -- |
| Industrials | 264,651,866 | 264,651,866 | -- | -- |
| Information Technology | 157,644,364 | 84,891,495 | 72,752,869 | -- |
| Materials | 48,943,967 | 48,943,967 | -- | -- |
| Real Estate | 35,530,837 | 35,530,837 | -- | -- |
| Money Market Funds | 26,893,457 | 26,893,457 | -- | -- |
| Total Investments in Securities: | $1,220,063,268 | $1,021,697,368 | $198,365,900 | $-- |
The following is a summary of transfers between Level 1 and Level 2 for the period ended April 30, 2018. Transfers are assumed to have occurred at the beginning of the period, and are primarily attributable to the valuation techniques used for foreign equity securities, as discussed in the accompanying Notes to Financial Statements:
| Transfers | Total |
| Level 1 to Level 2 | $37,417,161 |
| Level 2 to Level 1 | $29,106,433 |
See accompanying notes which are an integral part of the financial statements.
Financial Statements
Statement of Assets and Liabilities
| April 30, 2018 (Unaudited) | ||
| Assets | ||
| Investment in securities, at value (including securities loaned of $23,837,249) — See accompanying schedule: Unaffiliated issuers (cost $1,028,484,888) | $1,181,174,587 | |
| Fidelity Central Funds (cost $26,893,457) | 26,893,457 | |
| Other affiliated issuers (cost $6,859,967) | 11,995,224 | |
| Total Investment in Securities (cost $1,062,238,312) | $1,220,063,268 | |
| Receivable for fund shares sold | 745,125 | |
| Dividends receivable | 4,610,815 | |
| Distributions receivable from Fidelity Central Funds | 81,040 | |
| Prepaid expenses | 703 | |
| Other receivables | 58,353 | |
| Total assets | 1,225,559,304 | |
| Liabilities | ||
| Payable for fund shares redeemed | $1,014,015 | |
| Accrued management fee | 681,191 | |
| Distribution and service plan fees payable | 18,444 | |
| Other affiliated payables | 223,571 | |
| Other payables and accrued expenses | 76,928 | |
| Collateral on securities loaned | 25,834,226 | |
| Total liabilities | 27,848,375 | |
| Net Assets | $1,197,710,929 | |
| Net Assets consist of: | ||
| Paid in capital | $1,005,887,335 | |
| Undistributed net investment income | 4,095,799 | |
| Accumulated undistributed net realized gain (loss) on investments and foreign currency transactions | 29,921,151 | |
| Net unrealized appreciation (depreciation) on investments and assets and liabilities in foreign currencies | 157,806,644 | |
| Net Assets | $1,197,710,929 | |
| Calculation of Maximum Offering Price | ||
| Class A: | ||
| Net Asset Value and redemption price per share ($21,155,462 ÷ 510,519 shares) | $41.44 | |
| Maximum offering price per share (100/94.25 of $41.44) | $43.97 | |
| Class M: | ||
| Net Asset Value and redemption price per share ($9,114,403 ÷ 219,787 shares) | $41.47 | |
| Maximum offering price per share (100/96.50 of $41.47) | $42.97 | |
| Class C: | ||
| Net Asset Value and offering price per share ($12,090,613 ÷ 293,544 shares)(a) | $41.19 | |
| Europe: | ||
| Net Asset Value, offering price and redemption price per share ($1,146,298,326 ÷ 27,634,362 shares) | $41.48 | |
| Class I: | ||
| Net Asset Value, offering price and redemption price per share ($9,052,125 ÷ 218,337 shares) | $41.46 |
(a) Redemption price per share is equal to net asset value less any applicable contingent deferred sales charge.
See accompanying notes which are an integral part of the financial statements.
Statement of Operations
| Six months ended April 30, 2018 (Unaudited) | ||
| Investment Income | ||
| Dividends | $11,381,753 | |
| Income from Fidelity Central Funds | 209,027 | |
| Income before foreign taxes withheld | 11,590,780 | |
| Less foreign taxes withheld | (1,066,617) | |
| Total income | 10,524,163 | |
| Expenses | ||
| Management fee | ||
| Basic fee | $4,380,797 | |
| Performance adjustment | 410,378 | |
| Transfer agent fees | 1,074,724 | |
| Distribution and service plan fees | 109,527 | |
| Accounting and security lending fees | 290,548 | |
| Custodian fees and expenses | 63,515 | |
| Independent trustees' fees and expenses | 2,453 | |
| Registration fees | 73,253 | |
| Audit | 42,080 | |
| Legal | 2,497 | |
| Miscellaneous | 4,361 | |
| Total expenses before reductions | 6,454,133 | |
| Expense reductions | (15,055) | 6,439,078 |
| Net investment income (loss) | 4,085,085 | |
| Realized and Unrealized Gain (Loss) | ||
| Net realized gain (loss) on: | ||
| Investment securities: | ||
| Unaffiliated issuers | 53,129,861 | |
| Fidelity Central Funds | (1,165) | |
| Foreign currency transactions | (99,568) | |
| Total net realized gain (loss) | 53,029,128 | |
| Change in net unrealized appreciation (depreciation) on: | ||
| Investment securities: | ||
| Unaffiliated issuers | (56,166,698) | |
| Fidelity Central Funds | 1,261 | |
| Other affiliated issuers | 280,547 | |
| Assets and liabilities in foreign currencies | 46,027 | |
| Total change in net unrealized appreciation (depreciation) | (55,838,863) | |
| Net gain (loss) | (2,809,735) | |
| Net increase (decrease) in net assets resulting from operations | $1,275,350 |
See accompanying notes which are an integral part of the financial statements.
Statement of Changes in Net Assets
| Six months ended April 30, 2018 (Unaudited) | Year ended October 31, 2017 | |
| Increase (Decrease) in Net Assets | ||
| Operations | ||
| Net investment income (loss) | $4,085,085 | $12,136,756 |
| Net realized gain (loss) | 53,029,128 | 23,964,986 |
| Change in net unrealized appreciation (depreciation) | (55,838,863) | 241,642,484 |
| Net increase (decrease) in net assets resulting from operations | 1,275,350 | 277,744,226 |
| Distributions to shareholders from net investment income | (11,915,078) | (11,727,868) |
| Distributions to shareholders from net realized gain | (19,345,138) | (3,911,466) |
| Total distributions | (31,260,216) | (15,639,334) |
| Share transactions - net increase (decrease) | (164,506,038) | 25,014,944 |
| Redemption fees | – | 434 |
| Total increase (decrease) in net assets | (194,490,904) | 287,120,270 |
| Net Assets | ||
| Beginning of period | 1,392,201,833 | 1,105,081,563 |
| End of period | $1,197,710,929 | $1,392,201,833 |
| Other Information | ||
| Undistributed net investment income end of period | $4,095,799 | $11,925,792 |
See accompanying notes which are an integral part of the financial statements.
Financial Highlights
Fidelity Europe Fund Class A
| Six months ended (Unaudited) April 30, | Years endedOctober 31, | ||||
| 2018 | 2017 | 2016 | 2015 | 2014 A | |
| Selected Per–Share Data | |||||
| Net asset value, beginning of period | $42.47 | $34.17 | $37.06 | $36.24 | $39.45 |
| Income from Investment Operations | |||||
| Net investment income (loss)B | .07 | .26 | .22 | .37 | .47 |
| Net realized and unrealized gain (loss) | (.11) | 8.39 | (2.67) | 1.29 | (3.68) |
| Total from investment operations | (.04) | 8.65 | (2.45) | 1.66 | (3.21) |
| Distributions from net investment income | (.33) | (.22) | (.29) | (.84) | – |
| Distributions from net realized gain | (.66) | (.13) | (.15) | – | – |
| Total distributions | (.99) | (.35) | (.44) | (.84) | – |
| Redemption fees added to paid in capitalB | – | –C | –C | –C | –C |
| Net asset value, end of period | $41.44 | $42.47 | $34.17 | $37.06 | $36.24 |
| Total ReturnD,E,F | (.08)% | 25.61% | (6.69)% | 4.63% | (8.14)% |
| Ratios to Average Net AssetsG,H | |||||
| Expenses before reductions | 1.32%I | 1.32% | 1.39% | 1.33% | 1.35%I |
| Expenses net of fee waivers, if any | 1.32%I | 1.32% | 1.39% | 1.33% | 1.35%I |
| Expenses net of all reductions | 1.32%I | 1.28% | 1.38% | 1.31% | 1.35%I |
| Net investment income (loss) | .34%I | .70% | .62% | .98% | 1.94%I |
| Supplemental Data | |||||
| Net assets, end of period (000 omitted) | $21,155 | $20,925 | $17,267 | $23,381 | $23,633 |
| Portfolio turnover rateJ | 34%I | 73% | 62% | 87% | 80%K |
A For the period March 18, 2014 (commencement of sale of shares) to October 31, 2014.
B Calculated based on average shares outstanding during the period.
C Amount represents less than $.005 per share.
D Total returns for periods of less than one year are not annualized.
E Total returns would have been lower if certain expenses had not been reduced during the applicable periods shown.
F Total returns do not include the effect of the sales charges.
G Fees and expenses of any underlying Fidelity Central Funds are not included in the Fund's expense ratio. The Fund indirectly bears its proportionate share of the expenses of any underlying Fidelity Central Funds.
H Expense ratios reflect operating expenses of the class. Expenses before reductions do not reflect amounts reimbursed by the investment adviser or reductions from brokerage service arrangements or reductions from other expense offset arrangements and do not represent the amount paid by the class during periods when reimbursements or reductions occur. Expense ratios before reductions for start-up periods may not be representative of longer-term operating periods. Expenses net of fee waivers reflect expenses after reimbursement by the investment adviser but prior to reductions from brokerage service arrangements or other expense offset arrangements. Expenses net of all reductions represent the net expenses paid by the class.
I Annualized
J Amount does not include the portfolio activity of any underlying Fidelity Central Funds.
K The portfolio turnover rate does not include the assets acquired in the merger.
See accompanying notes which are an integral part of the financial statements.
Fidelity Europe Fund Class M
| Six months ended (Unaudited) April 30, | Years endedOctober 31, | ||||
| 2018 | 2017 | 2016 | 2015 | 2014 A | |
| Selected Per–Share Data | |||||
| Net asset value, beginning of period | $42.47 | $34.13 | $36.94 | $36.18 | $39.45 |
| Income from Investment Operations | |||||
| Net investment income (loss)B | –C | .15 | .11 | .26 | .40 |
| Net realized and unrealized gain (loss) | (.12) | 8.41 | (2.67) | 1.29 | (3.67) |
| Total from investment operations | (.12) | 8.56 | (2.56) | 1.55 | (3.27) |
| Distributions from net investment income | (.23) | (.09) | (.09) | (.79) | – |
| Distributions from net realized gain | (.66) | (.13) | (.15) | – | – |
| Total distributions | (.88)D | (.22) | (.25)E | (.79) | – |
| Redemption fees added to paid in capitalB | – | –C | –C | –C | –C |
| Net asset value, end of period | $41.47 | $42.47 | $34.13 | $36.94 | $36.18 |
| Total ReturnF,G,H | (.25)% | 25.25% | (6.99)% | 4.33% | (8.29)% |
| Ratios to Average Net AssetsI,J | |||||
| Expenses before reductions | 1.65%K | 1.63% | 1.70% | 1.61% | 1.62%K |
| Expenses net of fee waivers, if any | 1.64%K | 1.63% | 1.70% | 1.61% | 1.61%K |
| Expenses net of all reductions | 1.64%K | 1.59% | 1.68% | 1.59% | 1.61%K |
| Net investment income (loss) | .02%K | .39%D | .31% | .70% | 1.68%K |
| Supplemental Data | |||||
| Net assets, end of period (000 omitted) | $9,114 | $8,874 | $6,980 | $9,632 | $13,679 |
| Portfolio turnover rateL | 34%K | 73% | 62% | 87% | 80%M |
A For the period March 18, 2014 (commencement of sale of shares) to October 31, 2014.
B Calculated based on average shares outstanding during the period.
C Amount represents less than $.005 per share.
D Total distributions of $.88 per share is comprised of distributions from net investment income of $.227 and distributions from net realized gain of $.657 per share.
E Total distributions of $.25 per share is comprised of distributions from net investment income of $.092 and distributions from net realized gain of $.154 per share.
F Total returns for periods of less than one year are not annualized.
G Total returns would have been lower if certain expenses had not been reduced during the applicable periods shown.
H Total returns do not include the effect of the sales charges.
I Fees and expenses of any underlying Fidelity Central Funds are not included in the Fund's expense ratio. The Fund indirectly bears its proportionate share of the expenses of any underlying Fidelity Central Funds.
J Expense ratios reflect operating expenses of the class. Expenses before reductions do not reflect amounts reimbursed by the investment adviser or reductions from brokerage service arrangements or reductions from other expense offset arrangements and do not represent the amount paid by the class during periods when reimbursements or reductions occur. Expense ratios before reductions for start-up periods may not be representative of longer-term operating periods. Expenses net of fee waivers reflect expenses after reimbursement by the investment adviser but prior to reductions from brokerage service arrangements or other expense offset arrangements. Expenses net of all reductions represent the net expenses paid by the class.
K Annualized
L Amount does not include the portfolio activity of any underlying Fidelity Central Funds.
M The portfolio turnover rate does not include the assets acquired in the merger.
See accompanying notes which are an integral part of the financial statements.
Fidelity Europe Fund Class C
| Six months ended (Unaudited) April 30, | Years endedOctober 31, | ||||
| 2018 | 2017 | 2016 | 2015 | 2014 A | |
| Selected Per–Share Data | |||||
| Net asset value, beginning of period | $42.15 | $33.82 | $36.81 | $36.07 | $39.45 |
| Income from Investment Operations | |||||
| Net investment income (loss)B | (.09) | (.03) | (.06) | .07 | .29 |
| Net realized and unrealized gain (loss) | (.11) | 8.36 | (2.65) | 1.29 | (3.67) |
| Total from investment operations | (.20) | 8.33 | (2.71) | 1.36 | (3.38) |
| Distributions from net investment income | (.10) | – | (.12) | (.62) | – |
| Distributions from net realized gain | (.66) | – | (.15) | – | – |
| Total distributions | (.76) | – | (.28)C | (.62) | – |
| Redemption fees added to paid in capitalB | – | –D | –D | –D | –D |
| Net asset value, end of period | $41.19 | $42.15 | $33.82 | $36.81 | $36.07 |
| Total ReturnE,F,G | (.47)% | 24.63% | (7.43)% | 3.79% | (8.57)% |
| Ratios to Average Net AssetsH,I | |||||
| Expenses before reductions | 2.10%J | 2.11% | 2.18% | 2.13% | 2.10%J |
| Expenses net of fee waivers, if any | 2.10%J | 2.11% | 2.18% | 2.13% | 2.10%J |
| Expenses net of all reductions | 2.10%J | 2.07% | 2.17% | 2.11% | 2.10%J |
| Net investment income (loss) | (.44)%J | (.09)% | (.17)% | .18% | 1.19%J |
| Supplemental Data | |||||
| Net assets, end of period (000 omitted) | $12,091 | $10,721 | $9,007 | $11,151 | $6,818 |
| Portfolio turnover rateK | 34%J | 73% | 62% | 87% | 80%L |
A For the period March 18, 2014 (commencement of sale of shares) to October 31, 2014.
B Calculated based on average shares outstanding during the period.
C Total distributions of $.28 per share is comprised of distributions from net investment income of $.123 and distributions from net realized gain of $.154 per share.
D Amount represents less than $.005 per share.
E Total returns for periods of less than one year are not annualized.
F Total returns would have been lower if certain expenses had not been reduced during the applicable periods shown.
G Total returns do not include the effect of the contingent deferred sales charge.
H Fees and expenses of any underlying Fidelity Central Funds are not included in the Fund's expense ratio. The Fund indirectly bears its proportionate share of the expenses of any underlying Fidelity Central Funds.
I Expense ratios reflect operating expenses of the class. Expenses before reductions do not reflect amounts reimbursed by the investment adviser or reductions from brokerage service arrangements or reductions from other expense offset arrangements and do not represent the amount paid by the class during periods when reimbursements or reductions occur. Expense ratios before reductions for start-up periods may not be representative of longer-term operating periods. Expenses net of fee waivers reflect expenses after reimbursement by the investment adviser but prior to reductions from brokerage service arrangements or other expense offset arrangements. Expenses net of all reductions represent the net expenses paid by the class.
J Annualized
K Amount does not include the portfolio activity of any underlying Fidelity Central Funds.
L The portfolio turnover rate does not include the assets acquired in the merger.
See accompanying notes which are an integral part of the financial statements.
Fidelity Europe Fund
| Six months ended (Unaudited) April 30, | Years endedOctober 31, | |||||
| 2018 | 2017 | 2016 | 2015 | 2014 | 2013 | |
| Selected Per–Share Data | ||||||
| Net asset value, beginning of period | $42.53 | $34.26 | $37.19 | $36.32 | $37.92 | $30.15 |
| Income from Investment Operations | ||||||
| Net investment income (loss)A | .14 | .38 | .33 | .48 | .94B | .61 |
| Net realized and unrealized gain (loss) | (.12) | 8.40 | (2.68) | 1.30 | (2.00) | 7.87 |
| Total from investment operations | .02 | 8.78 | (2.35) | 1.78 | (1.06) | 8.48 |
| Distributions from net investment income | (.41) | (.38) | (.43) | (.91) | (.52) | (.70) |
| Distributions from net realized gain | (.66) | (.13) | (.15) | – | (.02) | (.01) |
| Total distributions | (1.07) | (.51) | (.58) | (.91) | (.54) | (.71) |
| Redemption fees added to paid in capitalA | – | –C | –C | –C | –C | –C |
| Net asset value, end of period | $41.48 | $42.53 | $34.26 | $37.19 | $36.32 | $37.92 |
| Total ReturnD,E | .07% | 26.05% | (6.42)% | 4.97% | (2.82)% | 28.71% |
| Ratios to Average Net AssetsF,G | ||||||
| Expenses before reductions | 1.00%H | 1.00% | 1.07% | 1.03% | .97% | 1.06% |
| Expenses net of fee waivers, if any | 1.00%H | 1.00% | 1.07% | 1.03% | .97% | 1.05% |
| Expenses net of all reductions | .99%H | .96% | 1.06% | 1.01% | .96% | 1.02% |
| Net investment income (loss) | .66%H | 1.02% | .94% | 1.28% | 2.43%B | 1.82% |
| Supplemental Data | ||||||
| Net assets, end of period (000 omitted) | $1,146,298 | $1,343,213 | $1,066,488 | $1,384,134 | $1,237,047 | $957,048 |
| Portfolio turnover rateI | 34%H | 73% | 62% | 87% | 80%J | 59% |
A Calculated based on average shares outstanding during the period.
B Net Investment income per share reflects a large, non-recurring dividend which amounted to $.19 per share. Excluding this non-recurring dividend, the ratio of net investment income (loss) to average net assets would have been 1.93%.
C Amount represents less than $.005 per share.
D Total returns for periods of less than one year are not annualized.
E Total returns would have been lower if certain expenses had not been reduced during the applicable periods shown.
F Fees and expenses of any underlying Fidelity Central Funds are not included in the Fund's expense ratio. The Fund indirectly bears its proportionate share of the expenses of any underlying Fidelity Central Funds.
G Expense ratios reflect operating expenses of the class. Expenses before reductions do not reflect amounts reimbursed by the investment adviser or reductions from brokerage service arrangements or reductions from other expense offset arrangements and do not represent the amount paid by the class during periods when reimbursements or reductions occur. Expenses net of fee waivers reflect expenses after reimbursement by the investment adviser but prior to reductions from brokerage service arrangements or other expense offset arrangements. Expenses net of all reductions represent the net expenses paid by the class.
H Annualized
I Amount does not include the portfolio activity of any underlying Fidelity Central Funds.
J The portfolio turnover rate does not include the assets acquired in the merger.
See accompanying notes which are an integral part of the financial statements.
Fidelity Europe Fund Class I
| Six months ended (Unaudited) April 30, | Years endedOctober 31, | ||||
| 2018 | 2017 | 2016 | 2015 | 2014 A | |
| Selected Per–Share Data | |||||
| Net asset value, beginning of period | $42.53 | $34.29 | $37.21 | $36.32 | $39.45 |
| Income from Investment Operations | |||||
| Net investment income (loss)B | .14 | .39 | .35 | .50 | .56 |
| Net realized and unrealized gain (loss) | (.12) | 8.38 | (2.67) | 1.30 | (3.69) |
| Total from investment operations | .02 | 8.77 | (2.32) | 1.80 | (3.13) |
| Distributions from net investment income | (.43) | (.41) | (.45) | (.91) | – |
| Distributions from net realized gain | (.66) | (.13) | (.15) | – | – |
| Total distributions | (1.09) | (.53)C | (.60) | (.91) | – |
| Redemption fees added to paid in capitalB | – | –D | –D | –D | –D |
| Net asset value, end of period | $41.46 | $42.53 | $34.29 | $37.21 | $36.32 |
| Total ReturnE,F | .08% | 26.04% | (6.33)% | 5.02% | (7.93)% |
| Ratios to Average Net AssetsG,H | |||||
| Expenses before reductions | .99%I | .98% | 1.01% | .98% | .97%I |
| Expenses net of fee waivers, if any | .99%I | .98% | 1.01% | .98% | .97%I |
| Expenses net of all reductions | .99%I | .94% | 1.00% | .96% | .96%I |
| Net investment income (loss) | .67%I | 1.04% | 1.00% | 1.33% | 2.33%I |
| Supplemental Data | |||||
| Net assets, end of period (000 omitted) | $9,052 | $8,469 | $5,340 | $6,552 | $5,666 |
| Portfolio turnover rateJ | 34%I | 73% | 62% | 87% | 80%K |
A For the period March 18, 2014 (commencement of sale of shares) to October 31, 2014.
B Calculated based on average shares outstanding during the period.
C Total distributions of $.53 per share is comprised of distributions from net investment income of $.408 and distributions from net realized gain of $.126 per share.
D Amount represents less than $.005 per share.
E Total returns for periods of less than one year are not annualized.
F Total returns would have been lower if certain expenses had not been reduced during the applicable periods shown.
G Fees and expenses of any underlying Fidelity Central Funds are not included in the Fund's expense ratio. The Fund indirectly bears its proportionate share of the expenses of any underlying Fidelity Central Funds.
H Expense ratios reflect operating expenses of the class. Expenses before reductions do not reflect amounts reimbursed by the investment adviser or reductions from brokerage service arrangements or reductions from other expense offset arrangements and do not represent the amount paid by the class during periods when reimbursements or reductions occur. Expense ratios before reductions for start-up periods may not be representative of longer-term operating periods. Expenses net of fee waivers reflect expenses after reimbursement by the investment adviser but prior to reductions from brokerage service arrangements or other expense offset arrangements. Expenses net of all reductions represent the net expenses paid by the class.
I Annualized
J Amount does not include the portfolio activity of any underlying Fidelity Central Funds.
K The portfolio turnover rate does not include the assets acquired in the merger.
See accompanying notes which are an integral part of the financial statements.
Notes to Financial Statements (Unaudited)
For the period ended April 30, 2018
1. Organization.
Fidelity Europe Fund (the Fund) is a fund of Fidelity Investment Trust (the Trust) and is authorized to issue an unlimited number of shares. The Trust is registered under the Investment Company Act of 1940, as amended (the 1940 Act), as an open-end management investment company organized as a Massachusetts business trust. The Fund offers Class A, Class M, Class C, Europe and Class I shares, each of which has equal rights as to assets and voting privileges. Each class has exclusive voting rights with respect to matters that affect that class.
2. Investments in Fidelity Central Funds.
The Fund may invest in Fidelity Central Funds, which are open-end investment companies generally available only to other investment companies and accounts managed by the investment adviser and its affiliates. The Fund's Schedule of Investments lists each of the Fidelity Central Funds held as of period end, if any, as an investment of the Fund, but does not include the underlying holdings of each Fidelity Central Fund. As an Investing Fund, the Fund indirectly bears its proportionate share of the expenses of the underlying Fidelity Central Funds.
The Money Market Central Funds seek preservation of capital and current income and are managed by Fidelity Investments Money Management, Inc. (FIMM), an affiliate of the investment adviser. Annualized expenses of the Money Market Central Funds as of their most recent shareholder report date are less than .005%.
A complete unaudited list of holdings for each Fidelity Central Fund is available upon request or at the Securities and Exchange Commission (the SEC) website at www.sec.gov. In addition, the financial statements of the Fidelity Central Funds are available on the SEC website or upon request.
3. Significant Accounting Policies.
The Fund is an investment company and applies the accounting and reporting guidance of the Financial Accounting Standards Board (FASB) Accounting Standards Codification Topic 946 Financial Services – Investments Companies. The financial statements have been prepared in conformity with accounting principles generally accepted in the United States of America (GAAP), which require management to make certain estimates and assumptions at the date of the financial statements. Actual results could differ from those estimates. Subsequent events, if any, through the date that the financial statements were issued have been evaluated in the preparation of the financial statements. The following summarizes the significant accounting policies of the Fund:
Investment Valuation. Investments are valued as of 4:00 p.m. Eastern time on the last calendar day of the period. The Board of Trustees (the Board) has delegated the day to day responsibility for the valuation of the Fund's investments to the Fair Value Committee (the Committee) established by the Fund's investment adviser. In accordance with valuation policies and procedures approved by the Board, the Fund attempts to obtain prices from one or more third party pricing vendors or brokers to value its investments. When current market prices, quotations or currency exchange rates are not readily available or reliable, investments will be fair valued in good faith by the Committee, in accordance with procedures adopted by the Board. Factors used in determining fair value vary by investment type and may include market or investment specific events. The frequency with which these procedures are used cannot be predicted and they may be utilized to a significant extent. The Committee oversees the Fund's valuation policies and procedures and reports to the Board on the Committee's activities and fair value determinations. The Board monitors the appropriateness of the procedures used in valuing the Fund's investments and ratifies the fair value determinations of the Committee.
The Fund categorizes the inputs to valuation techniques used to value its investments into a disclosure hierarchy consisting of three levels as shown below:
- Level 1 – quoted prices in active markets for identical investments
- Level 2 – other significant observable inputs (including quoted prices for similar investments, interest rates, prepayment speeds, etc.)
- Level 3 – unobservable inputs (including the Fund's own assumptions based on the best information available)
Valuation techniques used to value the Fund's investments by major category are as follows:
Equity securities, including restricted securities, for which market quotations are readily available, are valued at the last reported sale price or official closing price as reported by a third party pricing vendor on the primary market or exchange on which they are traded and are categorized as Level 1 in the hierarchy. In the event there were no sales during the day or closing prices are not available, securities are valued at the last quoted bid price or may be valued using the last available price and are generally categorized as Level 2 in the hierarchy. For foreign equity securities, when market or security specific events arise, comparisons to the valuation of American Depositary Receipts (ADRs), futures contracts, Exchange-Traded Funds (ETFs)and certain indexes as well as quoted prices for similar securities may be used and would be categorized as Level 2 in the hierarchy. Utilizing these techniques may result in transfers between Level 1 and Level 2. For equity securities, including restricted securities, where observable inputs are limited, assumptions about market activity and risk are used and these securities may be categorized as Level 3 in the hierarchy.
Investments in open-end mutual funds, including the Fidelity Central Funds, are valued at their closing net asset value (NAV) each business day and are categorized as Level 1 in the hierarchy.
Changes in valuation techniques may result in transfers in or out of an assigned level within the disclosure hierarchy. The aggregate value of investments by input level as of April 30, 2018, including information on transfers between Levels 1 and 2, is included at the end of the Fund's Schedule of Investments.
Foreign Currency. The Fund may use foreign currency contracts to facilitate transactions in foreign-denominated securities. Gains and losses from these transactions may arise from changes in the value of the foreign currency or if the counterparties do not perform under the contracts' terms.
Foreign-denominated assets, including investment securities, and liabilities are translated into U.S. dollars at the exchange rates at period end. Purchases and sales of investment securities, income and dividends received and expenses denominated in foreign currencies are translated into U.S. dollars at the exchange rate in effect on the transaction date.
The effects of exchange rate fluctuations on investments are included with the net realized and unrealized gain (loss) on investment securities. Other foreign currency transactions resulting in realized and unrealized gain (loss) are disclosed separately.
Investment Transactions and Income. For financial reporting purposes, the Fund's investment holdings and NAV include trades executed through the end of the last business day of the period. The NAV per share for processing shareholder transactions is calculated as of the close of business of the New York Stock Exchange (NYSE), normally 4:00 p.m. Eastern time and includes trades executed through the end of the prior business day. Gains and losses on securities sold are determined on the basis of identified cost and includes proceeds received from litigation. Dividend income is recorded on the ex-dividend date, except for certain dividends from foreign securities where the ex-dividend date may have passed, which are recorded as soon as the Fund is informed of the ex-dividend date. Non-cash dividends included in dividend income, if any, are recorded at the fair market value of the securities received. Income and capital gain distributions from Fidelity Central Funds, if any, are recorded on the ex-dividend date. Investment income is recorded net of foreign taxes withheld where recovery of such taxes is uncertain.
Class Allocations and Expenses. Investment income, realized and unrealized capital gains and losses, common expenses of the Fund, and certain fund-level expense reductions, if any, are allocated daily on a pro-rata basis to each class based on the relative net assets of each class to the total net assets of the Fund. Each class differs with respect to transfer agent and distribution and service plan fees incurred. Certain expense reductions may also differ by class. For the reporting period, the allocated portion of income and expenses to each class as a percent of its average net assets may vary due to the timing of recording these transactions in relation to fluctuating net assets of the classes. Expenses directly attributable to a fund are charged to that fund. Expenses attributable to more than one fund are allocated among the respective funds on the basis of relative net assets or other appropriate methods. Expense estimates are accrued in the period to which they relate and adjustments are made when actual amounts are known.
Income Tax Information and Distributions to Shareholders. Each year, the Fund intends to qualify as a regulated investment company under Subchapter M of the Internal Revenue Code, including distributing substantially all of its taxable income and realized gains. As a result, no provision for U.S. Federal income taxes is required. The Fund files a U.S. federal tax return, in addition to state and local tax returns as required. The Fund's federal income tax returns are subject to examination by the Internal Revenue Service (IRS) for a period of three fiscal years after they are filed. State and local tax returns may be subject to examination for an additional fiscal year depending on the jurisdiction. Foreign taxes are provided for based on the Fund's understanding of the tax rules and rates that exist in the foreign markets in which it invests.
Distributions are declared and recorded on the ex-dividend date. Income and capital gain distributions are declared separately for each class. Income and capital gain distributions are determined in accordance with income tax regulations, which may differ from GAAP.
Capital accounts within the financial statements are adjusted for permanent book-tax differences. These adjustments have no impact on net assets or the results of operations. Capital accounts are not adjusted for temporary book-tax differences which will reverse in a subsequent period.
Book-tax differences are primarily due to foreign currency transactions, passive foreign investment companies (PFIC), deferred trustees compensation, expiring capital loss carryforwards, capital loss carryforwards and losses deferred due to wash sales.
As of period end, the cost and unrealized appreciation (depreciation) in securities, and derivatives if applicable, for federal income tax purposes were as follows:
| Gross unrealized appreciation | $208,883,812 |
| Gross unrealized depreciation | (72,913,338) |
| Net unrealized appreciation (depreciation) | $135,970,474 |
| Tax cost | $1,084,092,794 |
Restricted Securities. The Fund may invest in securities that are subject to legal or contractual restrictions on resale. These securities generally may be resold in transactions exempt from registration or to the public if the securities are registered. Disposal of these securities may involve time-consuming negotiations and expense, and prompt sale at an acceptable price may be difficult. Information regarding restricted securities is included at the end of the Fund's Schedule of Investments.
4. Purchases and Sales of Investments.
Purchases and sales of securities, other than short-term securities, aggregated $217,012,170 and $323,740,881, respectively.
5. Fees and Other Transactions with Affiliates.
Management Fee. Fidelity Management & Research Company (the investment adviser) and its affiliates provide the Fund with investment management related services for which the Fund pays a monthly management fee. The management fee is the sum of an individual fund fee rate that is based on an annual rate of .45% of the Fund's average net assets and an annualized group fee rate that averaged .24% during the period. The group fee rate is based upon the average net assets of all the mutual funds advised by the investment adviser, including any mutual funds previously advised by the investment adviser that are currently advised by Fidelity SelectCo, LLC, an affiliate of the investment adviser. The group fee rate decreases as assets under management increase and increases as assets under management decrease. In addition, the management fee is subject to a performance adjustment (up to a maximum of +/- .20% of the Fund's average net assets over a 36 month performance period). The upward or downward adjustment to the management fee is based on the relative investment performance of Europe as compared to its benchmark index, the MSCI Europe Index, over the same 36 month performance period. For the reporting period, the total annualized management fee rate, including the performance adjustment, was .76% of the Fund's average net assets. The performance adjustment included in the management fee rate may be higher or lower than the maximum performance adjustment rate due to the difference between the average net assets for the reporting and performance periods.
Distribution and Service Plan Fees. In accordance with Rule 12b-1 of the 1940 Act, the Fund has adopted separate Distribution and Service Plans for each class of shares. Certain classes pay Fidelity Distributors Corporation (FDC), an affiliate of the investment adviser, separate Distribution and Service Fees, each of which is based on an annual percentage of each class' average net assets. In addition, FDC may pay financial intermediaries for selling shares of the Fund and providing shareholder support services. For the period, the Distribution and Service Fee rates, total fees and amounts retained by FDC were as follows:
| Distribution Fee | Service Fee | Total Fees | Retained by FDC | |
| Class A | -% | .25% | $28,126 | $2,720 |
| Class M | .25% | .25% | 23,206 | 304 |
| Class C | .75% | .25% | 58,195 | 11,137 |
| $109,527 | $14,161 |
Sales Load. FDC may receive a front-end sales charge of up to 5.75% for selling Class A shares and 3.50% for selling Class M shares, some of which is paid to financial intermediaries for selling shares of the Fund. Depending on the holding period, FDC may receive contingent deferred sales charges levied on Class A, Class M and Class C redemptions. The deferred sales charges are 1.00% for Class C shares, 1.00% for certain purchases of Class A shares and .25% for certain purchases of Class M shares.
For the period, sales charge amounts retained by FDC were as follows:
| Retained by FDC | |
| Class A | $11,209 |
| Class M | 1,062 |
| Class C(a) | 1,263 |
| $13,534 |
(a) When Class C shares are initially sold, FDC pays commissions from its own resources to financial intermediaries through which the sales are made.
Transfer Agent Fees. Fidelity Investments Institutional Operations Company, Inc., (FIIOC), an affiliate of the investment adviser, is the transfer, dividend disbursing and shareholder servicing agent for each class of the Fund. FIIOC receives account fees and asset-based fees that vary according to the account size and type of account of the shareholders of the respective classes of the Fund. FIIOC pays for typesetting, printing and mailing of shareholder reports, except proxy statements.
For the period, transfer agent fees for each class were as follows:
| Amount | % of Class-Level Average Net Assets(a) | |
| Class A | $27,065 | .24 |
| Class M | 14,579 | .31 |
| Class C | 15,514 | .27 |
| Europe | 1,009,930 | .17 |
| Class I | 7,636 | .16 |
| $1,074,724 |
(a) Annualized
Accounting and Security Lending Fees. Fidelity Service Company, Inc. (FSC), an affiliate of the investment adviser, maintains the Fund's accounting records. The accounting fee is based on the level of average net assets for each month. Under a separate contract, FSC administers the security lending program. The security lending fee is based on the number and duration of lending transactions. For the period, the fees were equivalent to an annualized rate of .05%.
Interfund Trades. The Fund may purchase from or sell securities to other Fidelity Funds under procedures adopted by the Board. The procedures have been designed to ensure these interfund trades are executed in accordance with Rule 17a-7 of the 1940 Act. Interfund trades are included within the respective purchases and sales amounts shown in the Purchases and Sales of Investments note.
6. Committed Line of Credit.
The Fund participates with other funds managed by the investment adviser or an affiliate in a $4.25 billion credit facility (the "line of credit") to be utilized for temporary or emergency purposes to fund shareholder redemptions or for other short-term liquidity purposes. The Fund has agreed to pay commitment fees on its pro-rata portion of the line of credit, which amounted to $1,866 and is reflected in Miscellaneous expenses on the Statement of Operations. During the period, the Fund did not borrow on this line of credit.
7. Security Lending.
The Fund lends portfolio securities through a lending agent from time to time in order to earn additional income. For equity securities, a lending agent is used and may loan securities to certain qualified borrowers, including Fidelity Capital Markets (FCM), a broker-dealer affiliated with the Fund. On the settlement date of the loan, the Fund receives collateral (in the form of U.S. Treasury obligations, letters of credit and/or cash) against the loaned securities and maintains collateral in an amount not less than 100% of the market value of the loaned securities during the period of the loan. The market value of the loaned securities is determined at the close of business of the Fund and any additional required collateral is delivered to the Fund on the next business day. The Fund or borrower may terminate the loan at any time, and if the borrower defaults on its obligation to return the securities loaned because of insolvency or other reasons, the Fund may apply collateral received from the borrower against the obligation. The Fund may experience delays and costs in recovering the securities loaned. Any cash collateral received is invested in the Fidelity Securities Lending Cash Central Fund. The value of loaned securities and cash collateral at period end are disclosed on the Fund's Statement of Assets and Liabilities. Security lending income represents the income earned on investing cash collateral, less rebates paid to borrowers and any lending agent fees associated with the loan, plus any premium payments received for lending certain types of securities. Security lending income is presented in the Statement of Operations as a component of income from Fidelity Central Funds. Total security lending income during the period amounted to $146,708. During the period, there were no securities loaned to FCM.
8. Expense Reductions.
Commissions paid to certain brokers with whom the investment adviser, or its affiliates, places trades on behalf of the Fund include an amount in addition to trade execution, which may be rebated back to the Fund to offset certain expenses. This amount totaled $8,780 for the period.
In addition, during the period the investment adviser reimbursed and/or waived a portion of fund-level operating expenses in the amount of $6,275.
9. Distributions to Shareholders.
Distributions to shareholders of each class were as follows:
| Six months ended April 30, 2018 | Year ended October 31, 2017 | |
| From net investment income | ||
| Class A | $167,254 | $107,755 |
| Class M | 47,815 | 18,342 |
| Class C | 26,220 | – |
| Europe | 11,582,836 | 11,539,715 |
| Class I | 90,953 | 62,056 |
| Total | $11,915,078 | $11,727,868 |
| From net realized gain | ||
| Class A | $333,954 | $60,612 |
| Class M | 138,387 | 25,396 |
| Class C | 174,007 | – |
| Europe | 18,560,785 | 3,806,294 |
| Class I | 138,005 | 19,164 |
| Total | $19,345,138 | $3,911,466 |
10. Share Transactions.
Share transactions for each class were as follows and may contain automatic conversions between classes or exchanges between affiliated funds:
| Shares | Shares | Dollars | Dollars | |
| Six months ended April 30, 2018 | Year ended October 31, 2017 | Six months ended April 30, 2018 | Year ended October 31, 2017 | |
| Class A | ||||
| Shares sold | 121,265 | 183,985 | $5,182,342 | $7,204,193 |
| Reinvestment of distributions | 11,776 | 4,870 | 482,917 | 160,602 |
| Shares redeemed | (115,176) | (201,553) | (4,850,302) | (7,350,664) |
| Net increase (decrease) | 17,865 | (12,698) | $814,957 | $14,131 |
| Class M | ||||
| Shares sold | 26,138 | 58,824 | $1,113,666 | $2,231,944 |
| Reinvestment of distributions | 4,513 | 1,308 | 185,442 | 43,252 |
| Shares redeemed | (19,831) | (55,679) | (833,332) | (2,027,896) |
| Net increase (decrease) | 10,820 | 4,453 | $465,776 | $247,300 |
| Class C | ||||
| Shares sold | 62,125 | 65,577 | $2,622,334 | $2,522,918 |
| Reinvestment of distributions | 4,833 | – | 197,576 | – |
| Shares redeemed | (27,751) | (77,588) | (1,180,829) | (2,798,078) |
| Net increase (decrease) | 39,207 | (12,011) | $1,639,081 | $(275,160) |
| Europe | ||||
| Shares sold | 1,894,280 | 6,873,387 | $81,209,899 | $263,271,628 |
| Reinvestment of distributions | 696,409 | 443,969 | 28,552,790 | 14,619,907 |
| Shares redeemed | (6,538,130) | (6,861,890) | (278,011,330) | (254,648,472) |
| Net increase (decrease) | (3,947,441) | 455,466 | $(168,248,641) | $23,243,063 |
| Class I | ||||
| Shares sold | 83,439 | 152,572 | $3,564,461 | $5,796,106 |
| Reinvestment of distributions | 5,434 | 2,369 | 222,682 | 78,022 |
| Shares redeemed | (69,656) | (111,570) | (2,964,354) | (4,088,518) |
| Net increase (decrease) | 19,217 | 43,371 | $822,789 | $1,785,610 |
11. Other.
The Fund's organizational documents provide former and current trustees and officers with a limited indemnification against liabilities arising in connection with the performance of their duties to the Fund. In the normal course of business, the Fund may also enter into contracts that provide general indemnifications. The Fund's maximum exposure under these arrangements is unknown as this would be dependent on future claims that may be made against the Fund. The risk of material loss from such claims is considered remote.
Shareholder Expense Example
As a shareholder of the Fund, you incur two types of costs: (1) transaction costs, including sales charges (loads) on purchase payments or redemption proceeds, and (2) ongoing costs, including management fees, distribution and/or service (12b-1) fees and other Fund expenses. This Example is intended to help you understand your ongoing costs (in dollars) of investing in the Fund and to compare these costs with the ongoing costs of investing in other mutual funds.
The Example is based on an investment of $1,000 invested at the beginning of the period and held for the entire period (November 1, 2017 to April 30, 2018).
Actual Expenses
The first line of the accompanying table for each class of the Fund provides information about actual account values and actual expenses. You may use the information in this line, together with the amount you invested, to estimate the expenses that you paid over the period. Simply divide your account value by $1,000.00 (for example, an $8,600 account value divided by $1,000.00 = 8.6), then multiply the result by the number in the first line for a class of the Fund under the heading entitled "Expenses Paid During Period" to estimate the expenses you paid on your account during this period. A small balance maintenance fee of $12.00 that is charged once a year may apply for certain accounts with a value of less than $2,000. This fee is not included in the table below. If it was, the estimate of expenses you paid during the period would be higher, and your ending account value lower, by this amount. In addition, the Fund, as a shareholder in the underlying Fidelity Central Funds, will indirectly bear its pro-rata share of the fees and expenses incurred by the underlying Fidelity Central Funds. These fees and expenses are not included in the Fund's annualized expense ratio used to calculate the expense estimate in the table below.
Hypothetical Example for Comparison Purposes
The second line of the accompanying table for each class of the Fund provides information about hypothetical account values and hypothetical expenses based on a Class' actual expense ratio and an assumed rate of return of 5% per year before expenses, which is not the Class' actual return. The hypothetical account values and expenses may not be used to estimate the actual ending account balance or expenses you paid for the period. You may use this information to compare the ongoing costs of investing in the Fund and other funds. To do so, compare this 5% hypothetical example with the 5% hypothetical examples that appear in the shareholder reports of the other funds. A small balance maintenance fee of $12.00 that is charged once a year may apply for certain accounts with a value of less than $2,000. This fee is not included in the table below. If it was, the estimate of expenses you paid during the period would be higher, and your ending account value lower, by this amount. In addition, the Fund, as a shareholder in the underlying Fidelity Central Funds, will indirectly bear its pro-rata share of the fees and expenses incurred by the underlying Fidelity Central Funds. These fees and expenses are not included in the Fund's annualized expense ratio used to calculate the expense estimate in the table below.
Please note that the expenses shown in the table are meant to highlight your ongoing costs only and do not reflect any transaction costs. Therefore, the second line of the table is useful in comparing ongoing costs only, and will not help you determine the relative total costs of owning different funds. In addition, if these transactional costs were included, your costs would have been higher.
| Annualized Expense Ratio-A | Beginning Account Value November 1, 2017 | Ending Account Value April 30, 2018 | Expenses Paid During Period-B November 1, 2017 to April 30, 2018 | |
| Class A | 1.32% | |||
| Actual | $1,000.00 | $999.20 | $6.54 | |
| Hypothetical-C | $1,000.00 | $1,018.25 | $6.61 | |
| Class M | 1.64% | |||
| Actual | $1,000.00 | $997.50 | $8.12 | |
| Hypothetical-C | $1,000.00 | $1,016.66 | $8.20 | |
| Class C | 2.10% | |||
| Actual | $1,000.00 | $995.30 | $10.39 | |
| Hypothetical-C | $1,000.00 | $1,014.38 | $10.49 | |
| Europe | 1.00% | |||
| Actual | $1,000.00 | $1,000.70 | $4.96 | |
| Hypothetical-C | $1,000.00 | $1,019.84 | $5.01 | |
| Class I | .99% | |||
| Actual | $1,000.00 | $1,000.80 | $4.91 | |
| Hypothetical-C | $1,000.00 | $1,019.89 | $4.96 |
A Annualized expense ratio reflects expenses net of applicable fee waivers.
B Expenses are equal to each Class' annualized expense ratio, multiplied by the average account value over the period, multiplied by 181/365 (to reflect the one-half year period).
C 5% return per year before expenses
![]()
AEUF-SANN-0618
1.9585995.104
Fidelity Advisor® Japan Fund - Semi-Annual Report April 30, 2018 Class A, Class M, Class C and Class I are classes of Fidelity® Japan Fund |
|
Contents
To view a fund's proxy voting guidelines and proxy voting record for the 12-month period ended June 30, visit http://www.fidelity.com/proxyvotingresults or visit the Securities and Exchange Commission's (SEC) web site at http://www.sec.gov.
You may also call 1-877-208-0098 to request a free copy of the proxy voting guidelines.
Standard & Poor's, S&P and S&P 500 are registered service marks of The McGraw-Hill Companies, Inc. and have been licensed for use by Fidelity Distributors Corporation.
Other third-party marks appearing herein are the property of their respective owners.
All other marks appearing herein are registered or unregistered trademarks or service marks of FMR LLC or an affiliated company. © 2018 FMR LLC. All rights reserved.
This report and the financial statements contained herein are submitted for the general information of the shareholders of the Fund. This report is not authorized for distribution to prospective investors in the Fund unless preceded or accompanied by an effective prospectus.
A fund files its complete schedule of portfolio holdings with the SEC for the first and third quarters of each fiscal year on Form N-Q. Forms N-Q are available on the SEC’s web site at http://www.sec.gov. A fund's Forms N-Q may be reviewed and copied at the SEC’s Public Reference Room in Washington, DC. Information regarding the operation of the SEC's Public Reference Room may be obtained by calling 1-800-SEC-0330.
For a complete list of a fund's portfolio holdings, view the most recent holdings listing, semiannual report, or annual report on Fidelity's web site at http://www.fidelity.com, http://www.institutional.fidelity.com, or http://www.401k.com, as applicable.
NOT FDIC INSURED •MAY LOSE VALUE •NO BANK GUARANTEE
Neither the Fund nor Fidelity Distributors Corporation is a bank.
Investment Summary (Unaudited)
Geographic Diversification (% of fund's net assets)
| As of April 30, 2018 | ||
| Japan | 98.4% | |
| United States of America* | 1.0% | |
| Bermuda | 0.6% | |

* Includes Short-Term investments and Net Other Assets (Liabilities).
Percentages are based on country or territory of incorporation and are adjusted for the effect of futures contracts, if applicable.
Asset Allocation as of April 30, 2018
| % of fund's net assets | |
| Stocks | 99.0 |
| Short-Term Investments and Net Other Assets (Liabilities) | 1.0 |
Top Ten Stocks as of April 30, 2018
| % of fund's net assets | |
| SoftBank Corp. (Wireless Telecommunication Services) | 5.0 |
| Sony Corp. (Household Durables) | 4.1 |
| Mitsubishi UFJ Financial Group, Inc. (Banks) | 3.7 |
| ORIX Corp. (Diversified Financial Services) | 3.3 |
| Shimadzu Corp. (Electronic Equipment & Components) | 3.2 |
| Hoya Corp. (Health Care Equipment & Supplies) | 3.2 |
| Nidec Corp. (Electrical Equipment) | 2.6 |
| East Japan Railway Co. (Road & Rail) | 2.5 |
| Suzuki Motor Corp. (Automobiles) | 2.2 |
| Honda Motor Co. Ltd. (Automobiles) | 2.0 |
| 31.8 |
Top Market Sectors as of April 30, 2018
| % of fund's net assets | |
| Industrials | 20.0 |
| Consumer Discretionary | 20.0 |
| Information Technology | 15.6 |
| Financials | 11.1 |
| Materials | 9.1 |
| Consumer Staples | 8.9 |
| Health Care | 8.5 |
| Telecommunication Services | 5.0 |
| Real Estate | 0.8 |
Schedule of Investments April 30, 2018 (Unaudited)
Showing Percentage of Net Assets
| Common Stocks - 99.0% | |||
| Shares | Value | ||
| CONSUMER DISCRETIONARY - 20.0% | |||
| Auto Components - 2.5% | |||
| Bridgestone Corp. | 123,900 | $5,201,035 | |
| DaikyoNishikawa Corp. | 93,800 | 1,691,180 | |
| Sumitomo Electric Industries Ltd. | 243,600 | 3,742,464 | |
| 10,634,679 | |||
| Automobiles - 5.4% | |||
| Honda Motor Co. Ltd. | 240,100 | 8,256,069 | |
| Subaru Corp. | 150,700 | 5,071,582 | |
| Suzuki Motor Corp. | 170,200 | 9,171,681 | |
| 22,499,332 | |||
| Household Durables - 7.6% | |||
| Panasonic Corp. | 503,600 | 7,456,881 | |
| Rinnai Corp. | 33,200 | 3,307,245 | |
| Sekisui Chemical Co. Ltd. | 106,300 | 1,886,407 | |
| Sekisui House Ltd. | 104,300 | 1,912,453 | |
| Sony Corp. | 365,000 | 17,047,733 | |
| 31,610,719 | |||
| Internet & Direct Marketing Retail - 0.4% | |||
| Start Today Co. Ltd. | 63,500 | 1,835,529 | |
| Leisure Products - 0.5% | |||
| Bandai Namco Holdings, Inc. | 66,700 | 2,266,653 | |
| Media - 2.1% | |||
| Dentsu, Inc. | 105,400 | 4,994,255 | |
| LIFULL Co. Ltd. | 441,900 | 3,605,697 | |
| 8,599,952 | |||
| Specialty Retail - 1.5% | |||
| Nitori Holdings Co. Ltd. | 20,000 | 3,380,900 | |
| USS Co. Ltd. | 127,000 | 2,673,134 | |
| 6,054,034 | |||
| TOTAL CONSUMER DISCRETIONARY | 83,500,898 | ||
| CONSUMER STAPLES - 8.9% | |||
| Food & Staples Retailing - 5.4% | |||
| Ain Holdings, Inc. | 33,900 | 2,263,721 | |
| Nishimoto Co. Ltd. | 19,700 | 816,328 | |
| San-A Co. Ltd. | 42,700 | 2,277,177 | |
| Seven & i Holdings Co. Ltd. | 165,900 | 7,309,690 | |
| Sundrug Co. Ltd. | 61,600 | 3,172,411 | |
| Tsuruha Holdings, Inc. | 19,600 | 2,820,234 | |
| Welcia Holdings Co. Ltd. | 74,200 | 3,821,314 | |
| 22,480,875 | |||
| Food Products - 1.3% | |||
| Japan Meat Co. Ltd. | 85,000 | 1,520,856 | |
| Morinaga & Co. Ltd. | 82,000 | 3,997,988 | |
| 5,518,844 | |||
| Personal Products - 2.2% | |||
| Kao Corp. | 80,100 | 5,755,447 | |
| Kose Corp. | 16,900 | 3,130,488 | |
| 8,885,935 | |||
| TOTAL CONSUMER STAPLES | 36,885,654 | ||
| FINANCIALS - 11.1% | |||
| Banks - 4.5% | |||
| Mitsubishi UFJ Financial Group, Inc. | 2,281,700 | 15,290,455 | |
| Shinsei Bank Ltd. | 211,700 | 3,307,570 | |
| 18,598,025 | |||
| Consumer Finance - 0.7% | |||
| AEON Financial Service Co. Ltd. | 128,600 | 3,018,547 | |
| Diversified Financial Services - 3.3% | |||
| ORIX Corp. | 785,600 | 13,826,330 | |
| Insurance - 2.6% | |||
| Sony Financial Holdings, Inc. | 173,600 | 3,174,409 | |
| Tokio Marine Holdings, Inc. | 161,800 | 7,654,863 | |
| 10,829,272 | |||
| TOTAL FINANCIALS | 46,272,174 | ||
| HEALTH CARE - 8.5% | |||
| Biotechnology - 0.4% | |||
| PeptiDream, Inc. (a)(b) | 39,000 | 1,583,974 | |
| Health Care Equipment & Supplies - 6.4% | |||
| Hoya Corp. | 250,600 | 13,437,772 | |
| Nakanishi, Inc. | 79,500 | 1,662,431 | |
| Olympus Corp. | 211,200 | 7,891,987 | |
| Paramount Bed Holdings Co. Ltd. | 76,500 | 3,806,806 | |
| 26,798,996 | |||
| Health Care Providers & Services - 1.0% | |||
| Ship Healthcare Holdings, Inc. | 120,800 | 4,204,574 | |
| Pharmaceuticals - 0.7% | |||
| Takeda Pharmaceutical Co. Ltd. | 71,300 | 3,002,447 | |
| TOTAL HEALTH CARE | 35,589,991 | ||
| INDUSTRIALS - 20.0% | |||
| Building Products - 2.6% | |||
| Daikin Industries Ltd. | 55,500 | 6,500,892 | |
| Toto Ltd. | 77,500 | 4,402,442 | |
| 10,903,334 | |||
| Commercial Services & Supplies - 1.0% | |||
| Sohgo Security Services Co., Ltd. | 87,900 | 4,349,973 | |
| Construction & Engineering - 1.8% | |||
| Mirait Holdings Corp. | 183,100 | 2,904,276 | |
| Toshiba Plant Systems & Services Corp. | 217,700 | 4,552,344 | |
| 7,456,620 | |||
| Electrical Equipment - 2.6% | |||
| Nidec Corp. | 70,500 | 11,053,513 | |
| Machinery - 3.0% | |||
| Komatsu Ltd. | 67,900 | 2,314,625 | |
| Minebea Mitsumi, Inc. | 205,100 | 4,121,887 | |
| SMC Corp. | 15,500 | 5,915,295 | |
| 12,351,807 | |||
| Professional Services - 2.7% | |||
| Benefit One, Inc. (b) | 136,600 | 3,208,825 | |
| Funai Soken Holdings, Inc. | 60,000 | 1,406,147 | |
| Outsourcing, Inc. | 210,100 | 3,543,948 | |
| Recruit Holdings Co. Ltd. | 125,800 | 2,907,945 | |
| 11,066,865 | |||
| Road & Rail - 3.0% | |||
| East Japan Railway Co. | 109,600 | 10,516,868 | |
| Hitachi Transport System Ltd. | 75,500 | 2,024,245 | |
| 12,541,113 | |||
| Trading Companies & Distributors - 3.3% | |||
| Misumi Group, Inc. | 238,300 | 6,604,912 | |
| Mitsui & Co. Ltd. | 244,900 | 4,427,779 | |
| Trusco Nakayama Corp. | 106,300 | 2,798,494 | |
| 13,831,185 | |||
| TOTAL INDUSTRIALS | 83,554,410 | ||
| INFORMATION TECHNOLOGY - 15.6% | |||
| Electronic Equipment & Components - 7.9% | |||
| Azbil Corp. | 73,500 | 3,428,924 | |
| Dexerials Corp. | 301,600 | 2,844,398 | |
| Iriso Electronics Co. Ltd. | 31,200 | 1,980,681 | |
| Murata Manufacturing Co. Ltd. | 22,800 | 2,878,416 | |
| Shimadzu Corp. | 493,700 | 13,439,912 | |
| TDK Corp. | 47,700 | 4,123,353 | |
| Topcon Corp. | 213,900 | 4,265,478 | |
| 32,961,162 | |||
| Internet Software & Services - 3.3% | |||
| DeNA Co. Ltd. | 135,000 | 2,574,780 | |
| Kakaku.com, Inc. | 273,800 | 5,237,064 | |
| SMS Co., Ltd. | 83,700 | 3,177,415 | |
| Yahoo! Japan Corp. (b) | 639,300 | 2,631,586 | |
| 13,620,845 | |||
| IT Services - 1.1% | |||
| IT Holdings Corp. | 62,800 | 2,493,158 | |
| Otsuka Corp. | 44,600 | 2,080,681 | |
| 4,573,839 | |||
| Semiconductors & Semiconductor Equipment - 1.8% | |||
| Renesas Electronics Corp. (a) | 285,500 | 2,998,116 | |
| Sumco Corp. | 185,400 | 4,582,426 | |
| 7,580,542 | |||
| Software - 1.5% | |||
| Nintendo Co. Ltd. | 15,100 | 6,344,665 | |
| TOTAL INFORMATION TECHNOLOGY | 65,081,053 | ||
| MATERIALS - 9.1% | |||
| Chemicals - 8.2% | |||
| Axalta Coating Systems Ltd. (a) | 82,200 | 2,539,980 | |
| Hitachi Chemical Co. Ltd. | 116,100 | 2,555,220 | |
| JSR Corp. | 193,000 | 3,645,673 | |
| Kansai Paint Co. Ltd. | 148,200 | 3,340,329 | |
| KH Neochem Co. Ltd. | 56,400 | 1,712,843 | |
| Nissan Chemical Industries Co. Ltd. | 72,700 | 3,241,973 | |
| Nitto Denko Corp. | 23,100 | 1,722,146 | |
| Okamoto Industries, Inc. | 113,000 | 1,132,894 | |
| Shin-Etsu Chemical Co. Ltd. | 77,400 | 7,791,685 | |
| Tokyo Ohka Kogyo Co. Ltd. | 63,800 | 2,249,808 | |
| Toray Industries, Inc. | 451,200 | 4,211,760 | |
| 34,144,311 | |||
| Construction Materials - 0.9% | |||
| Taiheiyo Cement Corp. | 103,100 | 3,909,161 | |
| TOTAL MATERIALS | 38,053,472 | ||
| REAL ESTATE - 0.8% | |||
| Real Estate Management & Development - 0.8% | |||
| Tateru, Inc. (b) | 191,200 | 3,256,626 | |
| TELECOMMUNICATION SERVICES - 5.0% | |||
| Wireless Telecommunication Services - 5.0% | |||
| SoftBank Corp. | 273,700 | 20,913,065 | |
| TOTAL COMMON STOCKS | |||
| (Cost $314,637,970) | 413,107,343 | ||
| Money Market Funds - 1.9% | |||
| Fidelity Cash Central Fund, 1.74% (c) | 2,255,456 | 2,255,908 | |
| Fidelity Securities Lending Cash Central Fund 1.74% (c)(d) | 5,821,356 | 5,821,938 | |
| TOTAL MONEY MARKET FUNDS | |||
| (Cost $8,078,155) | 8,077,846 | ||
| TOTAL INVESTMENT IN SECURITIES - 100.9% | |||
| (Cost $322,716,125) | 421,185,189 | ||
| NET OTHER ASSETS (LIABILITIES) - (0.9)% | (3,945,734) | ||
| NET ASSETS - 100% | $417,239,455 |
Legend
(a) Non-income producing
(b) Security or a portion of the security is on loan at period end.
(c) Affiliated fund that is generally available only to investment companies and other accounts managed by Fidelity Investments. The rate quoted is the annualized seven-day yield of the fund at period end. A complete unaudited listing of the fund's holdings as of its most recent quarter end is available upon request. In addition, each Fidelity Central Fund's financial statements are available on the SEC's website or upon request.
(d) Investment made with cash collateral received from securities on loan.
Affiliated Central Funds
Information regarding fiscal year to date income earned by the Fund from investments in Fidelity Central Funds is as follows:
| Fund | Income earned |
| Fidelity Cash Central Fund | $23,371 |
| Fidelity Securities Lending Cash Central Fund | 77,345 |
| Total | $100,716 |
Amounts in the income column in the above table include any capital gain distributions from underlying funds, which are presented in the corresponding line-item in the Statement of Operations if applicable.
Investment Valuation
The following is a summary of the inputs used, as of April 30, 2018, involving the Fund's assets and liabilities carried at fair value. The inputs or methodology used for valuing securities may not be an indication of the risk associated with investing in those securities. For more information on valuation inputs, and their aggregation into the levels used below, please refer to the Investment Valuation section in the accompanying Notes to Financial Statements.
| Valuation Inputs at Reporting Date: | ||||
| Description | Total | Level 1 | Level 2 | Level 3 |
| Investments in Securities: | ||||
| Equities: | ||||
| Consumer Discretionary | $83,500,898 | $50,740,215 | $32,760,683 | $-- |
| Consumer Staples | 36,885,654 | 29,575,964 | 7,309,690 | -- |
| Financials | 46,272,174 | 30,981,719 | 15,290,455 | -- |
| Health Care | 35,589,991 | 32,587,544 | 3,002,447 | -- |
| Industrials | 83,554,410 | 81,239,785 | 2,314,625 | -- |
| Information Technology | 65,081,053 | 55,857,972 | 9,223,081 | -- |
| Materials | 38,053,472 | 33,841,712 | 4,211,760 | -- |
| Real Estate | 3,256,626 | 3,256,626 | -- | -- |
| Telecommunication Services | 20,913,065 | -- | 20,913,065 | -- |
| Money Market Funds | 8,077,846 | 8,077,846 | -- | -- |
| Total Investments in Securities: | $421,185,189 | $326,159,383 | $95,025,806 | $-- |
The following is a summary of transfers between Level 1 and Level 2 for the period ended April 30, 2018. Transfers are assumed to have occurred at the beginning of the period, and are primarily attributable to the valuation techniques used for foreign equity securities, as discussed in the accompanying Notes to Financial Statements:
| Transfers | Total |
| Level 1 to Level 2 | $0 |
| Level 2 to Level 1 | $309,355,250 |
See accompanying notes which are an integral part of the financial statements.
Financial Statements
Statement of Assets and Liabilities
| April 30, 2018 (Unaudited) | ||
| Assets | ||
| Investment in securities, at value (including securities loaned of $5,530,446) — See accompanying schedule: Unaffiliated issuers (cost $314,637,970) | $413,107,343 | |
| Fidelity Central Funds (cost $8,078,155) | 8,077,846 | |
| Total Investment in Securities (cost $322,716,125) | $421,185,189 | |
| Receivable for investments sold | 226,538 | |
| Receivable for fund shares sold | 142,106 | |
| Dividends receivable | 2,747,068 | |
| Distributions receivable from Fidelity Central Funds | 13,903 | |
| Prepaid expenses | 226 | |
| Other receivables | 17,404 | |
| Total assets | 424,332,434 | |
| Liabilities | ||
| Payable for investments purchased | $633,413 | |
| Payable for fund shares redeemed | 242,674 | |
| Accrued management fee | 247,425 | |
| Distribution and service plan fees payable | 18,630 | |
| Other affiliated payables | 81,036 | |
| Other payables and accrued expenses | 49,533 | |
| Collateral on securities loaned | 5,820,268 | |
| Total liabilities | 7,092,979 | |
| Net Assets | $417,239,455 | |
| Net Assets consist of: | ||
| Paid in capital | $432,656,380 | |
| Undistributed net investment income | 1,187,941 | |
| Accumulated undistributed net realized gain (loss) on investments and foreign currency transactions | (115,014,850) | |
| Net unrealized appreciation (depreciation) on investments and assets and liabilities in foreign currencies | 98,409,984 | |
| Net Assets | $417,239,455 | |
| Calculation of Maximum Offering Price | ||
| Class A: | ||
| Net Asset Value and redemption price per share ($17,054,725 ÷ 1,087,359 shares) | $15.68 | |
| Maximum offering price per share (100/94.25 of $15.68) | $16.64 | |
| Class M: | ||
| Net Asset Value and redemption price per share ($4,590,639 ÷ 292,944 shares) | $15.67 | |
| Maximum offering price per share (100/96.50 of $15.67) | $16.24 | |
| Class C: | ||
| Net Asset Value and offering price per share ($15,678,771 ÷ 1,009,258 shares)(a) | $15.53 | |
| Japan: | ||
| Net Asset Value, offering price and redemption price per share ($190,313,082 ÷ 12,103,231 shares) | $15.72 | |
| Class I: | ||
| Net Asset Value, offering price and redemption price per share ($189,602,238 ÷ 12,083,817 shares) | $15.69 |
(a) Redemption price per share is equal to net asset value less any applicable contingent deferred sales charge.
See accompanying notes which are an integral part of the financial statements.
Statement of Operations
| Six months ended April 30, 2018 (Unaudited) | ||
| Investment Income | ||
| Dividends | $3,629,540 | |
| Income from Fidelity Central Funds | 100,716 | |
| Income before foreign taxes withheld | 3,730,256 | |
| Less foreign taxes withheld | (362,870) | |
| Total income | 3,367,386 | |
| Expenses | ||
| Management fee | ||
| Basic fee | $1,449,166 | |
| Performance adjustment | 31,234 | |
| Transfer agent fees | 372,456 | |
| Distribution and service plan fees | 109,199 | |
| Accounting and security lending fees | 109,563 | |
| Custodian fees and expenses | 22,646 | |
| Independent trustees' fees and expenses | 841 | |
| Registration fees | 63,297 | |
| Audit | 41,699 | |
| Legal | 818 | |
| Miscellaneous | 1,423 | |
| Total expenses before reductions | 2,202,342 | |
| Expense reductions | (35,123) | 2,167,219 |
| Net investment income (loss) | 1,200,167 | |
| Realized and Unrealized Gain (Loss) | ||
| Net realized gain (loss) on: | ||
| Investment securities: | ||
| Unaffiliated issuers | 32,447,005 | |
| Fidelity Central Funds | 56 | |
| Foreign currency transactions | 152,625 | |
| Total net realized gain (loss) | 32,599,686 | |
| Change in net unrealized appreciation (depreciation) on: | ||
| Investment securities: | ||
| Unaffiliated issuers | (13,934,897) | |
| Fidelity Central Funds | 199 | |
| Assets and liabilities in foreign currencies | (53,841) | |
| Total change in net unrealized appreciation (depreciation) | (13,988,539) | |
| Net gain (loss) | 18,611,147 | |
| Net increase (decrease) in net assets resulting from operations | $19,811,314 |
See accompanying notes which are an integral part of the financial statements.
Statement of Changes in Net Assets
| Six months ended April 30, 2018 (Unaudited) | Year ended October 31, 2017 | |
| Increase (Decrease) in Net Assets | ||
| Operations | ||
| Net investment income (loss) | $1,200,167 | $2,955,189 |
| Net realized gain (loss) | 32,599,686 | 11,302,131 |
| Change in net unrealized appreciation (depreciation) | (13,988,539) | 67,770,223 |
| Net increase (decrease) in net assets resulting from operations | 19,811,314 | 82,027,543 |
| Distributions to shareholders from net investment income | (2,952,607) | (3,369,067) |
| Distributions to shareholders from net realized gain | (906,084) | (1,060,540) |
| Total distributions | (3,858,691) | (4,429,607) |
| Share transactions - net increase (decrease) | (56,069,472) | (23,430,665) |
| Redemption fees | 7,512 | 33,312 |
| Total increase (decrease) in net assets | (40,109,337) | 54,200,583 |
| Net Assets | ||
| Beginning of period | 457,348,792 | 403,148,209 |
| End of period | $417,239,455 | $457,348,792 |
| Other Information | ||
| Undistributed net investment income end of period | $1,187,941 | $2,940,381 |
See accompanying notes which are an integral part of the financial statements.
Financial Highlights
Fidelity Japan Fund Class A
| Six months ended (Unaudited) April 30, | Years endedOctober 31, | |||||
| 2018 | 2017 | 2016 | 2015 | 2014 | 2013 | |
| Selected Per–Share Data | ||||||
| Net asset value, beginning of period | $15.08 | $12.59 | $11.87 | $11.65 | $12.00 | $9.30 |
| Income from Investment Operations | ||||||
| Net investment income (loss)A | .02 | .06 | .06 | .04 | .05 | .08 |
| Net realized and unrealized gain (loss) | .69 | 2.52 | .72 | .23 | (.31) | 2.80 |
| Total from investment operations | .71 | 2.58 | .78 | .27 | (.26) | 2.88 |
| Distributions from net investment income | (.08) | (.06) | (.05) | (.05) | (.08) | (.11) |
| Distributions from net realized gain | (.04) | (.03) | (.01) | – | (.01) | (.08) |
| Total distributions | (.11)B | (.09) | (.06) | (.05) | (.09) | (.19) |
| Redemption fees added to paid in capitalA | –C | –C | –C | –C | –C | .01 |
| Net asset value, end of period | $15.68 | $15.08 | $12.59 | $11.87 | $11.65 | $12.00 |
| Total ReturnD,E,F | 4.74% | 20.70% | 6.56% | 2.31% | (2.18)% | 31.58% |
| Ratios to Average Net AssetsG,H | ||||||
| Expenses before reductions | 1.31%I | 1.11% | 1.08% | 1.10% | 1.23% | 1.26% |
| Expenses net of fee waivers, if any | 1.31%I | 1.11% | 1.08% | 1.10% | 1.23% | 1.26% |
| Expenses net of all reductions | 1.29%I | 1.11% | 1.08% | 1.09% | 1.23% | 1.25% |
| Net investment income (loss) | .31%I | .45% | .51% | .37% | .41% | .75% |
| Supplemental Data | ||||||
| Net assets, end of period (000 omitted) | $17,055 | $16,155 | $23,910 | $23,918 | $21,352 | $20,520 |
| Portfolio turnover rateJ | 28%I | 23% | 15% | 35% | 112% | 68% |
A Calculated based on average shares outstanding during the period.
B Total distributions of $.11 per share is comprised of distributions from net investment income of $.078 and distributions from net realized gain of $.035 per share.
C Amount represents less than $.005 per share.
D Total returns for periods of less than one year are not annualized.
E Total returns would have been lower if certain expenses had not been reduced during the applicable periods shown.
F Total returns do not include the effect of the sales charges.
G Fees and expenses of any underlying Fidelity Central Funds are not included in the Fund's expense ratio. The Fund indirectly bears its proportionate share of the expenses of any underlying Fidelity Central Funds.
H Expense ratios reflect operating expenses of the class. Expenses before reductions do not reflect amounts reimbursed by the investment adviser or reductions from brokerage service arrangements or reductions from other expense offset arrangements and do not represent the amount paid by the class during periods when reimbursements or reductions occur. Expenses net of fee waivers reflect expenses after reimbursement by the investment adviser but prior to reductions from brokerage service arrangements or other expense offset arrangements. Expenses net of all reductions represent the net expenses paid by the class.
I Annualized
J Amount does not include the portfolio activity of any underlying Fidelity Central Funds.
See accompanying notes which are an integral part of the financial statements.
Fidelity Japan Fund Class M
| Six months ended (Unaudited) April 30, | Years endedOctober 31, | |||||
| 2018 | 2017 | 2016 | 2015 | 2014 | 2013 | |
| Selected Per–Share Data | ||||||
| Net asset value, beginning of period | $15.06 | $12.57 | $11.85 | $11.62 | $11.96 | $9.28 |
| Income from Investment Operations | ||||||
| Net investment income (loss)A | –B | .01 | .02 | –B | .01 | .05 |
| Net realized and unrealized gain (loss) | .69 | 2.52 | .71 | .23 | (.30) | 2.78 |
| Total from investment operations | .69 | 2.53 | .73 | .23 | (.29) | 2.83 |
| Distributions from net investment income | (.05) | (.01) | –B | – | (.04) | (.08) |
| Distributions from net realized gain | (.04) | (.03) | (.01) | – | (.01) | (.08) |
| Total distributions | (.08)C | (.04) | (.01) | – | (.05) | (.16) |
| Redemption fees added to paid in capitalA | –B | –B | –B | –B | –B | .01 |
| Net asset value, end of period | $15.67 | $15.06 | $12.57 | $11.85 | $11.62 | $11.96 |
| Total ReturnD,E,F | 4.61% | 20.24% | 6.15% | 1.98% | (2.42)% | 31.04% |
| Ratios to Average Net AssetsG,H | ||||||
| Expenses before reductions | 1.65%I | 1.46% | 1.44% | 1.43% | 1.54% | 1.55% |
| Expenses net of fee waivers, if any | 1.65%I | 1.46% | 1.44% | 1.43% | 1.54% | 1.55% |
| Expenses net of all reductions | 1.64%I | 1.46% | 1.44% | 1.42% | 1.54% | 1.53% |
| Net investment income (loss) | (.03)%I | .10% | .16% | .04% | .10% | .46% |
| Supplemental Data | ||||||
| Net assets, end of period (000 omitted) | $4,591 | $4,464 | $4,193 | $4,809 | $4,104 | $5,357 |
| Portfolio turnover rateJ | 28%I | 23% | 15% | 35% | 112% | 68% |
A Calculated based on average shares outstanding during the period.
B Amount represents less than $.005 per share.
C Total distributions of $.08 per share is comprised of distributions from net investment income of $.047 and distributions from net realized gain of $.035 per share.
D Total returns for periods of less than one year are not annualized.
E Total returns would have been lower if certain expenses had not been reduced during the applicable periods shown.
F Total returns do not include the effect of the sales charges.
G Fees and expenses of any underlying Fidelity Central Funds are not included in the Fund's expense ratio. The Fund indirectly bears its proportionate share of the expenses of any underlying Fidelity Central Funds.
H Expense ratios reflect operating expenses of the class. Expenses before reductions do not reflect amounts reimbursed by the investment adviser or reductions from brokerage service arrangements or reductions from other expense offset arrangements and do not represent the amount paid by the class during periods when reimbursements or reductions occur. Expenses net of fee waivers reflect expenses after reimbursement by the investment adviser but prior to reductions from brokerage service arrangements or other expense offset arrangements. Expenses net of all reductions represent the net expenses paid by the class.
I Annualized
J Amount does not include the portfolio activity of any underlying Fidelity Central Funds.
See accompanying notes which are an integral part of the financial statements.
Fidelity Japan Fund Class C
| Six months ended (Unaudited) April 30, | Years endedOctober 31, | |||||
| 2018 | 2017 | 2016 | 2015 | 2014 | 2013 | |
| Selected Per–Share Data | ||||||
| Net asset value, beginning of period | $14.92 | $12.44 | $11.77 | $11.58 | $11.96 | $9.25 |
| Income from Investment Operations | ||||||
| Net investment income (loss)A | (.03) | (.03) | (.02) | (.04) | (.03) | –B |
| Net realized and unrealized gain (loss) | .68 | 2.51 | .69 | .23 | (.32) | 2.79 |
| Total from investment operations | .65 | 2.48 | .67 | .19 | (.35) | 2.79 |
| Distributions from net investment income | –B | – | – | – | (.03) | (.01) |
| Distributions from net realized gain | (.04) | – | – | – | (.01) | (.08) |
| Total distributions | (.04) | – | – | – | (.03)C | (.09) |
| Redemption fees added to paid in capitalA | –B | –B | –B | –B | –B | .01 |
| Net asset value, end of period | $15.53 | $14.92 | $12.44 | $11.77 | $11.58 | $11.96 |
| Total ReturnD,E,F | 4.35% | 19.94% | 5.69% | 1.64% | (2.90)% | 30.55% |
| Ratios to Average Net AssetsG,H | ||||||
| Expenses before reductions | 2.01%I | 1.81% | 1.81% | 1.81% | 1.93% | 1.97% |
| Expenses net of fee waivers, if any | 2.01%I | 1.81% | 1.81% | 1.81% | 1.93% | 1.97% |
| Expenses net of all reductions | 1.99%I | 1.81% | 1.81% | 1.80% | 1.93% | 1.95% |
| Net investment income (loss) | (.39)%I | (.25)% | (.21)% | (.34)% | (.29)% | .04% |
| Supplemental Data | ||||||
| Net assets, end of period (000 omitted) | $15,679 | $13,542 | $15,077 | $18,491 | $13,162 | $11,824 |
| Portfolio turnover rateJ | 28%I | 23% | 15% | 35% | 112% | 68% |
A Calculated based on average shares outstanding during the period.
B Amount represents less than $.005 per share.
C Total distributions of $.03 per share is comprised of distributions from net investment income of $.025 and distributions from net realized gain of $.009 per share.
D Total returns for periods of less than one year are not annualized.
E Total returns would have been lower if certain expenses had not been reduced during the applicable periods shown.
F Total returns do not include the effect of the contingent deferred sales charge.
G Fees and expenses of any underlying Fidelity Central Funds are not included in the Fund's expense ratio. The Fund indirectly bears its proportionate share of the expenses of any underlying Fidelity Central Funds.
H Expense ratios reflect operating expenses of the class. Expenses before reductions do not reflect amounts reimbursed by the investment adviser or reductions from brokerage service arrangements or reductions from other expense offset arrangements and do not represent the amount paid by the class during periods when reimbursements or reductions occur. Expenses net of fee waivers reflect expenses after reimbursement by the investment adviser but prior to reductions from brokerage service arrangements or other expense offset arrangements. Expenses net of all reductions represent the net expenses paid by the class.
I Annualized
J Amount does not include the portfolio activity of any underlying Fidelity Central Funds.
See accompanying notes which are an integral part of the financial statements.
Fidelity Japan Fund
| Six months ended (Unaudited) April 30, | Years endedOctober 31, | |||||
| 2018 | 2017 | 2016 | 2015 | 2014 | 2013 | |
| Selected Per–Share Data | ||||||
| Net asset value, beginning of period | $15.13 | $12.64 | $11.91 | $11.69 | $12.03 | $9.34 |
| Income from Investment Operations | ||||||
| Net investment income (loss)A | .05 | .10 | .09 | .08 | .09 | .12 |
| Net realized and unrealized gain (loss) | .68 | 2.54 | .72 | .23 | (.32) | 2.79 |
| Total from investment operations | .73 | 2.64 | .81 | .31 | (.23) | 2.91 |
| Distributions from net investment income | (.11) | (.11) | (.07) | (.09) | (.11) | (.15) |
| Distributions from net realized gain | (.04) | (.03) | (.01) | – | (.01) | (.08) |
| Total distributions | (.14)B | (.15)C | (.08) | (.09) | (.11)D | (.23) |
| Redemption fees added to paid in capitalA | –E | –E | –E | –E | –E | .01 |
| Net asset value, end of period | $15.72 | $15.13 | $12.64 | $11.91 | $11.69 | $12.03 |
| Total ReturnF,G | 4.86% | 21.13% | 6.80% | 2.66% | (1.90)% | 31.92% |
| Ratios to Average Net AssetsH,I | ||||||
| Expenses before reductions | 1.02%J | .82% | .78% | .80% | .90% | .93% |
| Expenses net of fee waivers, if any | 1.02%J | .82% | .78% | .80% | .90% | .93% |
| Expenses net of all reductions | 1.01%J | .82% | .78% | .79% | .90% | .91% |
| Net investment income (loss) | .60%J | .74% | .81% | .67% | .74% | 1.08% |
| Supplemental Data | ||||||
| Net assets, end of period (000 omitted) | $190,313 | $247,372 | $352,936 | $485,803 | $415,612 | $480,773 |
| Portfolio turnover rateK | 28%J | 23% | 15% | 35% | 112% | 68% |
A Calculated based on average shares outstanding during the period.
B Total distributions of $.14 per share is comprised of distributions from net investment income of $.107 and distributions from net realized gain of $.035 per share.
C Total distributions of $.15 per share is comprised of distributions from net investment income of $.112 and distributions from net realized gain of $.034 per share.
D Total distributions of $.11 per share is comprised of distributions from net investment income of $.105 and distributions from net realized gain of $.009 per share.
E Amount represents less than $.005 per share.
F Total returns for periods of less than one year are not annualized.
G Total returns would have been lower if certain expenses had not been reduced during the applicable periods shown.
H Fees and expenses of any underlying Fidelity Central Funds are not included in the Fund's expense ratio. The Fund indirectly bears its proportionate share of the expenses of any underlying Fidelity Central Funds.
I Expense ratios reflect operating expenses of the class. Expenses before reductions do not reflect amounts reimbursed by the investment adviser or reductions from brokerage service arrangements or reductions from other expense offset arrangements and do not represent the amount paid by the class during periods when reimbursements or reductions occur. Expenses net of fee waivers reflect expenses after reimbursement by the investment adviser but prior to reductions from brokerage service arrangements or other expense offset arrangements. Expenses net of all reductions represent the net expenses paid by the class.
J Annualized
K Amount does not include the portfolio activity of any underlying Fidelity Central Funds.
See accompanying notes which are an integral part of the financial statements.
Fidelity Japan Fund Class I
| Six months ended (Unaudited) April 30, | Years endedOctober 31, | |||||
| 2018 | 2017 | 2016 | 2015 | 2014 | 2013 | |
| Selected Per–Share Data | ||||||
| Net asset value, beginning of period | $15.12 | $12.62 | $11.89 | $11.67 | $12.02 | $9.33 |
| Income from Investment Operations | ||||||
| Net investment income (loss)A | .05 | .11 | .10 | .08 | .09 | .13 |
| Net realized and unrealized gain (loss) | .69 | 2.53 | .70 | .23 | (.32) | 2.78 |
| Total from investment operations | .74 | 2.64 | .80 | .31 | (.23) | 2.91 |
| Distributions from net investment income | (.14) | (.11) | (.07) | (.09) | (.12) | (.15) |
| Distributions from net realized gain | (.04) | (.03) | (.01) | – | (.01) | (.08) |
| Total distributions | (.17)B | (.14) | (.07)C | (.09) | (.12)D | (.23) |
| Redemption fees added to paid in capitalA | –E | –E | –E | –E | –E | .01 |
| Net asset value, end of period | $15.69 | $15.12 | $12.62 | $11.89 | $11.67 | $12.02 |
| Total ReturnF,G | 4.92% | 21.22% | 6.77% | 2.72% | (1.90)% | 32.04% |
| Ratios to Average Net AssetsH,I | ||||||
| Expenses before reductions | .96%J | .76% | .77% | .80% | .89% | .90% |
| Expenses net of fee waivers, if any | .96%J | .76% | .77% | .80% | .89% | .90% |
| Expenses net of all reductions | .94%J | .76% | .76% | .79% | .89% | .88% |
| Net investment income (loss) | .66%J | .80% | .83% | .67% | .76% | 1.11% |
| Supplemental Data | ||||||
| Net assets, end of period (000 omitted) | $189,602 | $175,816 | $7,032 | $13,957 | $20,253 | $20,033 |
| Portfolio turnover rateK | 28%J | 23% | 15% | 35% | 112% | 68% |
A Calculated based on average shares outstanding during the period.
B Total distributions of $.17 per share is comprised of distributions from net investment income of $.135 and distributions from net realized gain of $.035 per share.
C Total distributions of $.07 per share is comprised of distributions from net investment income of $.065 and distributions from net realized gain of $.006 per share.
D Total distributions of $.12 per share is comprised of distributions from net investment income of $.115 and distributions from net realized gain of $.009 per share.
E Amount represents less than $.005 per share.
F Total returns for periods of less than one year are not annualized.
G Total returns would have been lower if certain expenses had not been reduced during the applicable periods shown.
H Fees and expenses of any underlying Fidelity Central Funds are not included in the Fund's expense ratio. The Fund indirectly bears its proportionate share of the expenses of any underlying Fidelity Central Funds.
I Expense ratios reflect operating expenses of the class. Expenses before reductions do not reflect amounts reimbursed by the investment adviser or reductions from brokerage service arrangements or reductions from other expense offset arrangements and do not represent the amount paid by the class during periods when reimbursements or reductions occur. Expenses net of fee waivers reflect expenses after reimbursement by the investment adviser but prior to reductions from brokerage service arrangements or other expense offset arrangements. Expenses net of all reductions represent the net expenses paid by the class.
J Annualized
K Amount does not include the portfolio activity of any underlying Fidelity Central Funds.
See accompanying notes which are an integral part of the financial statements.
Notes to Financial Statements (Unaudited)
For the period ended April 30, 2018
1. Organization.
Fidelity Japan Fund (the Fund) is a fund of Fidelity Investment Trust (the Trust) and is authorized to issue an unlimited number of shares. The Trust is registered under the Investment Company Act of 1940, as amended (the 1940 Act), as an open-end management investment company organized as a Massachusetts business trust. The Fund offers Class A, Class M, Class C, Japan and Class I shares, each of which has equal rights as to assets and voting privileges. Each class has exclusive voting rights with respect to matters that affect that class.
2. Investments in Fidelity Central Funds.
The Fund invests in Fidelity Central Funds, which are open-end investment companies generally available only to other investment companies and accounts managed by the investment adviser and its affiliates. The Fund's Schedule of Investments lists each of the Fidelity Central Funds held as of period end, if any, as an investment of the Fund, but does not include the underlying holdings of each Fidelity Central Fund. As an Investing Fund, the Fund indirectly bears its proportionate share of the expenses of the underlying Fidelity Central Funds.
The Money Market Central Funds seek preservation of capital and current income and are managed by Fidelity Investments Money Management, Inc. (FIMM), an affiliate of the investment adviser. Annualized expenses of the Money Market Central Funds as of their most recent shareholder report date are less than .005%.
A complete unaudited list of holdings for each Fidelity Central Fund is available upon request or at the Securities and Exchange Commission (the SEC) website at www.sec.gov. In addition, the financial statements of the Fidelity Central Funds are available on the SEC website or upon request.
3. Significant Accounting Policies.
The Fund is an investment company and applies the accounting and reporting guidance of the Financial Accounting Standards Board (FASB) Accounting Standards Codification Topic 946 Financial Services – Investments Companies. The financial statements have been prepared in conformity with accounting principles generally accepted in the United States of America (GAAP), which require management to make certain estimates and assumptions at the date of the financial statements. Actual results could differ from those estimates. Subsequent events, if any, through the date that the financial statements were issued have been evaluated in the preparation of the financial statements. The following summarizes the significant accounting policies of the Fund:
Investment Valuation. Investments are valued as of 4:00 p.m. Eastern time on the last calendar day of the period. The Board of Trustees (the Board) has delegated the day to day responsibility for the valuation of the Fund's investments to the Fair Value Committee (the Committee) established by the Fund's investment adviser. In accordance with valuation policies and procedures approved by the Board, the Fund attempts to obtain prices from one or more third party pricing vendors or brokers to value its investments. When current market prices, quotations or currency exchange rates are not readily available or reliable, investments will be fair valued in good faith by the Committee, in accordance with procedures adopted by the Board. Factors used in determining fair value vary by investment type and may include market or investment specific events. The frequency with which these procedures are used cannot be predicted and they may be utilized to a significant extent. The Committee oversees the Fund's valuation policies and procedures and reports to the Board on the Committee's activities and fair value determinations. The Board monitors the appropriateness of the procedures used in valuing the Fund's investments and ratifies the fair value determinations of the Committee.
The Fund categorizes the inputs to valuation techniques used to value its investments into a disclosure hierarchy consisting of three levels as shown below:
- Level 1 – quoted prices in active markets for identical investments
- Level 2 – other significant observable inputs (including quoted prices for similar investments, interest rates, prepayment speeds, etc.)
- Level 3 – unobservable inputs (including the Fund's own assumptions based on the best information available)
Valuation techniques used to value the Fund's investments by major category are as follows:
Equity securities, including restricted securities, for which market quotations are readily available, are valued at the last reported sale price or official closing price as reported by a third party pricing vendor on the primary market or exchange on which they are traded and are categorized as Level 1 in the hierarchy. In the event there were no sales during the day or closing prices are not available, securities are valued at the last quoted bid price or may be valued using the last available price and are generally categorized as Level 2 in the hierarchy. For foreign equity securities, when market or security specific events arise, comparisons to the valuation of American Depositary Receipts (ADRs), futures contracts, Exchange-Traded Funds (ETFs) and certain indexes as well as quoted prices for similar securities may be used and would be categorized as Level 2 in the hierarchy. Utilizing these techniques may result in transfers between Level 1 and Level 2. For equity securities, including restricted securities, where observable inputs are limited, assumptions about market activity and risk are used and these securities may be categorized as Level 3 in the hierarchy.
Investments in open-end mutual funds, including the Fidelity Central Funds, are valued at their closing net asset value (NAV) each business day and are categorized as Level 1 in the hierarchy.
Changes in valuation techniques may result in transfers in or out of an assigned level within the disclosure hierarchy. The aggregate value of investments by input level as of April 30, 2018, including information on transfers between Levels 1 and 2, is included at the end of the Fund's Schedule of Investments.
Foreign Currency. The Fund may use foreign currency contracts to facilitate transactions in foreign-denominated securities. Gains and losses from these transactions may arise from changes in the value of the foreign currency or if the counterparties do not perform under the contracts' terms.
Foreign-denominated assets, including investment securities, and liabilities are translated into U.S. dollars at the exchange rates at period end. Purchases and sales of investment securities, income and dividends received and expenses denominated in foreign currencies are translated into U.S. dollars at the exchange rate in effect on the transaction date.
The effects of exchange rate fluctuations on investments are included with the net realized and unrealized gain (loss) on investment securities. Other foreign currency transactions resulting in realized and unrealized gain (loss) are disclosed separately.
Investment Transactions and Income. For financial reporting purposes, the Fund's investment holdings and NAV include trades executed through the end of the last business day of the period. The NAV per share for processing shareholder transactions is calculated as of the close of business of the New York Stock Exchange (NYSE), normally 4:00 p.m. Eastern time and includes trades executed through the end of the prior business day. Gains and losses on securities sold are determined on the basis of identified cost. Dividend income is recorded on the ex-dividend date, except for certain dividends from foreign securities where the ex-dividend date may have passed, which are recorded as soon as the Fund is informed of the ex-dividend date. Non-cash dividends included in dividend income, if any, are recorded at the fair market value of the securities received. Income and capital gain distributions from Fidelity Central Funds, if any, are recorded on the ex-dividend date. Investment income is recorded net of foreign taxes withheld where recovery of such taxes is uncertain.
Class Allocations and Expenses. Investment income, realized and unrealized capital gains and losses, common expenses of the Fund, and certain fund-level expense reductions, if any, are allocated daily on a pro-rata basis to each class based on the relative net assets of each class to the total net assets of the Fund. Each class differs with respect to transfer agent and distribution and service plan fees incurred. Certain expense reductions may also differ by class. For the reporting period, the allocated portion of income and expenses to each class as a percent of its average net assets may vary due to the timing of recording these transactions in relation to fluctuating net assets of the classes. Expenses directly attributable to a fund are charged to that fund. Expenses attributable to more than one fund are allocated among the respective funds on the basis of relative net assets or other appropriate methods. Expense estimates are accrued in the period to which they relate and adjustments are made when actual amounts are known.
Income Tax Information and Distributions to Shareholders. Each year, the Fund intends to qualify as a regulated investment company under Subchapter M of the Internal Revenue Code, including distributing substantially all of its taxable income and realized gains. As a result, no provision for U.S. Federal income taxes is required. The Fund files a U.S. federal tax return, in addition to state and local tax returns as required. The Fund's federal income tax returns are subject to examination by the Internal Revenue Service (IRS) for a period of three fiscal years after they are filed. State and local tax returns may be subject to examination for an additional fiscal year depending on the jurisdiction. Foreign taxes are provided for based on the Fund's understanding of the tax rules and rates that exist in the foreign markets in which it invests.
Distributions are declared and recorded on the ex-dividend date. Income and capital gain distributions are declared separately for each class. Income and capital gain distributions are determined in accordance with income tax regulations, which may differ from GAAP.
Capital accounts within the financial statements are adjusted for permanent book-tax differences. These adjustments have no impact on net assets or the results of operations. Capital accounts are not adjusted for temporary book-tax differences which will reverse in a subsequent period.
Book-tax differences are primarily due to foreign currency transactions, passive foreign investment companies (PFIC), expiring capital loss carryforwards, deferred trustees compensation, capital loss carryforwards and losses deferred due to wash sales.
As of period end, the cost and unrealized appreciation (depreciation) in securities, and derivatives if applicable, for federal income tax purposes were as follows:
| Gross unrealized appreciation | $103,423,915 |
| Gross unrealized depreciation | (10,166,307) |
| Net unrealized appreciation (depreciation) | $93,257,608 |
| Tax cost | $327,927,581 |
Capital loss carryforwards are only available to offset future capital gains of the Fund to the extent provided by regulations and may be limited. Under the Regulated Investment Company Modernization Act of 2010 (the Act), the Fund is permitted to carry forward capital losses incurred in taxable years beginning after December 22, 2010 for an unlimited period and such capital losses are required to be used prior to any losses that expire. The capital loss carryforward information presented below, including any applicable limitation, is estimated as of prior fiscal period end and is subject to adjustment.
| Fiscal year of expiration | |
| 2018 | $(26,887,863) |
| 2019 | (98,806,037) |
| Total with expiration | $(125,693,900) |
| No expiration | |
| Short-term | (5,646,628) |
| Long-term | (10,657,370) |
| Total no expiration | (16,303,998) |
| Total capital loss carryforward | $(141,997,898) |
Short-Term Trading (Redemption) Fees. Shares held by investors in the Fund less than 90 days may have been subject to a redemption fee equal to 1.50% of the NAV of shares redeemed. All redemption fees, which reduce the proceeds of the shareholder redemption, are retained by the Fund and accounted for as an addition to paid in capital. In November 2017, the Board of Trustees approved the elimination of these redemption fees effective December 18, 2017.
4. Purchases and Sales of Investments.
Purchases and sales of securities, other than short-term securities, aggregated $58,512,355 and $116,218,224, respectively.
5. Fees and Other Transactions with Affiliates.
Management Fee. Fidelity Management & Research Company (the investment adviser) and its affiliates provide the Fund with investment management related services for which the Fund pays a monthly management fee. The management fee is the sum of an individual fund fee rate that is based on an annual rate of .45% of the Fund's average net assets and an annualized group fee rate that averaged .24% during the period. The group fee rate is based upon the average net assets of all the mutual funds advised by the investment adviser, including any mutual funds previously advised by the investment adviser that are currently advised by Fidelity SelectCo, LLC, an affiliate of the investment adviser. The group fee rate decreases as assets under management increase and increases as assets under management decrease. In addition, the management fee is subject to a performance adjustment (up to a maximum of +/- .20% of the Fund's average net assets over a 36 month performance period). The upward or downward adjustment to the management fee is based on the relative investment performance of Japan as compared to its benchmark index, the TOPIX, over the same 36 month performance period. For the reporting period, the total annualized management fee rate, including the performance adjustment, was .71% of the Fund's average net assets. The performance adjustment included in the management fee rate may be higher or lower than the maximum performance adjustment rate due to the difference between the average net assets for the reporting and performance periods.
Distribution and Service Plan Fees. In accordance with Rule 12b-1 of the 1940 Act, the Fund has adopted separate Distribution and Service Plans for each class of shares. Certain classes pay Fidelity Distributors Corporation (FDC), an affiliate of the investment adviser, separate Distribution and Service Fees, each of which is based on an annual percentage of each class' average net assets. In addition, FDC may pay financial intermediaries for selling shares of the Fund and providing shareholder support services. For the period, the Distribution and Service Fee rates, total fees and amounts retained by FDC were as follows:
| Distribution Fee | Service Fee | Total Fees | Retained by FDC | |
| Class A | -% | .25% | $21,198 | $487 |
| Class M | .25% | .25% | 11,834 | 239 |
| Class C | .75% | .25% | 76,167 | 10,973 |
| $109,199 | $11,699 |
Sales Load. FDC may receive a front-end sales charge of up to 5.75% for selling Class A shares and 3.50% for selling Class M shares, some of which is paid to financial intermediaries for selling shares of the Fund. Depending on the holding period, FDC may receive contingent deferred sales charges levied on Class A, Class M and Class C redemptions. The deferred sales charges are 1.00% for Class C shares, 1.00% for certain purchases of Class A shares and .25% for certain purchases of Class M shares.
For the period, sales charge amounts retained by FDC were as follows:
| Retained by FDC | |
| Class A | $4,111 |
| Class M | 553 |
| Class C(a) | 1,294 |
| $5,958 |
(a) When Class C shares are initially sold, FDC pays commissions from its own resources to financial intermediaries through which the sales are made.
Transfer Agent Fees. Fidelity Investments Institutional Operations Company, Inc., (FIIOC), an affiliate of the investment adviser, is the transfer, dividend disbursing and shareholder servicing agent for each class of the Fund. FIIOC receives account fees and asset-based fees that vary according to the account size and type of account of the shareholders of the respective classes of the Fund. FIIOC pays for typesetting, printing and mailing of shareholder reports, except proxy statements.
For the period, transfer agent fees for each class were as follows:
| Amount | % of Class-Level Average Net Assets(a) | |
| Class A | $20,157 | .24 |
| Class M | 7,849 | .33 |
| Class C | 14,547 | .19 |
| Japan | 198,830 | .20 |
| Class I | 131,073 | .14 |
| $372,456 |
(a) Annualized
Accounting and Security Lending Fees. Fidelity Service Company, Inc. (FSC), an affiliate of the investment adviser, maintains the Fund's accounting records. The accounting fee is based on the level of average net assets for each month. Under a separate contract, FSC administers the security lending program. The security lending fee is based on the number and duration of lending transactions. For the period, the fees were equivalent to an annualized rate of .05%.
Brokerage Commissions. The Fund placed a portion of its portfolio transactions with brokerage firms which are affiliates of the investment adviser. Brokerage commissions are included in net realized gain (loss) and change in net unrealized appreciation (depreciation) in the Statement of Operations. The commissions paid to these affiliated firms were $139 for the period.
Interfund Trades. The Fund may purchase from or sell securities to other Fidelity Funds under procedures adopted by the Board. The procedures have been designed to ensure these interfund trades are executed in accordance with Rule 17a-7 of the 1940 Act. Interfund trades are included within the respective purchases and sales amounts shown in the Purchases and Sales of Investments note.
6. Committed Line of Credit.
The Fund participates with other funds managed by the investment adviser or an affiliate in a $4.25 billion credit facility (the "line of credit") to be utilized for temporary or emergency purposes to fund shareholder redemptions or for other short-term liquidity purposes. The Fund has agreed to pay commitment fees on its pro-rata portion of the line of credit, which amounted to $609 and is reflected in Miscellaneous expenses on the Statement of Operations. During the period, the Fund did not borrow on this line of credit.
7. Security Lending.
The Fund lends portfolio securities through a lending agent from time to time in order to earn additional income. For equity securities, a lending agent is used and may loan securities to certain qualified borrowers, including Fidelity Capital Markets (FCM), a broker-dealer affiliated with the Fund. On the settlement date of the loan, the Fund receives collateral (in the form of U.S. Treasury obligations, letters of credit and/or cash) against the loaned securities and maintains collateral in an amount not less than 100% of the market value of the loaned securities during the period of the loan. The market value of the loaned securities is determined at the close of business of the Fund and any additional required collateral is delivered to the Fund on the next business day. The Fund or borrower may terminate the loan at any time, and if the borrower defaults on its obligation to return the securities loaned because of insolvency or other reasons, the Fund may apply collateral received from the borrower against the obligation. The Fund may experience delays and costs in recovering the securities loaned. Any cash collateral received is invested in the Fidelity Securities Lending Cash Central Fund. The value of loaned securities and cash collateral at period end are disclosed on the Fund's Statement of Assets and Liabilities. Security lending income represents the income earned on investing cash collateral, less rebates paid to borrowers and any lending agent fees associated with the loan, plus any premium payments received for lending certain types of securities. Security lending income is presented in the Statement of Operations as a component of income from Fidelity Central Funds. Total security lending income during the period amounted to $77,345. During the period, there were no securities loaned to FCM.
8. Expense Reductions.
Commissions paid to certain brokers with whom the investment adviser, or its affiliates, places trades on behalf of the Fund include an amount in addition to trade execution, which may be rebated back to the Fund to offset certain expenses. This amount totaled $33,105 for the period.
In addition, during the period the investment adviser reimbursed and/or waived a portion of fund-level operating expenses in the amount of $2,018.
9. Distributions to Shareholders.
Distributions to shareholders of each class were as follows:
| Six months ended April 30, 2018 | Year ended October 31, 2017 | |
| From net investment income | ||
| Class A | $83,728 | $104,209 |
| Class M | 14,064 | 3,257 |
| Class C | 2,815 | – |
| Japan | 1,265,471 | 3,209,793 |
| Class I | 1,586,529 | 51,808 |
| Total | $2,952,607 | $3,369,067 |
| From net realized gain | ||
| Class A | $37,508 | $59,052 |
| Class M | 10,474 | 11,074 |
| Class C | 32,841 | – |
| Japan | 413,939 | 974,401 |
| Class I | 411,322 | 16,013 |
| Total | $906,084 | $1,060,540 |
10. Share Transactions.
Share transactions for each class were as follows and may contain automatic conversions between classes or exchanges between affiliated funds:
| Shares | Shares | Dollars | Dollars | |
| Six months ended April 30, 2018 | Year ended October 31, 2017 | Six months ended April 30, 2018 | Year ended October 31, 2017 | |
| Class A | ||||
| Shares sold | 153,141 | 261,996 | $2,427,843 | $3,537,670 |
| Reinvestment of distributions | 7,603 | 12,680 | 116,628 | 155,198 |
| Shares redeemed | (144,506) | (1,102,972) | (2,267,886) | (14,608,137) |
| Net increase (decrease) | 16,238 | (828,296) | $276,585 | $(10,915,269) |
| Class M | ||||
| Shares sold | 18,308 | 34,522 | $289,600 | $446,496 |
| Reinvestment of distributions | 1,589 | 1,137 | 24,389 | 13,940 |
| Shares redeemed | (23,298) | (72,947) | (368,035) | (961,323) |
| Net increase (decrease) | (3,401) | (37,288) | $(54,046) | $(500,887) |
| Class C | ||||
| Shares sold | 224,295 | 75,525 | $3,534,963 | $955,948 |
| Reinvestment of distributions | 2,227 | – | 33,918 | – |
| Shares redeemed | (125,029) | (379,339) | (1,971,732) | (4,904,728) |
| Net increase (decrease) | 101,493 | (303,814) | $1,597,149 | $(3,948,780) |
| Japan | ||||
| Shares sold | 2,709,400 | 5,531,120 | $42,654,659 | $70,265,364 |
| Reinvestment of distributions | 102,752 | 332,957 | 1,578,266 | 4,075,396 |
| Shares redeemed | (7,061,842) | (17,427,207) | (109,276,781) | (225,423,617) |
| Net increase (decrease) | (4,249,690) | (11,563,130) | $(65,043,856) | $(151,082,857) |
| Class I | ||||
| Shares sold | 394,832 | 12,120,647 | $6,274,967 | $156,870,865 |
| Reinvestment of distributions | 129,754 | 4,957 | 1,987,832 | 60,627 |
| Shares redeemed | (70,810) | (1,052,603) | (1,108,103) | (13,914,364) |
| Net increase (decrease) | 453,776 | 11,073,001 | $7,154,696 | $143,017,128 |
11. Other.
The Fund's organizational documents provide former and current trustees and officers with a limited indemnification against liabilities arising in connection with the performance of their duties to the Fund. In the normal course of business, the Fund may also enter into contracts that provide general indemnifications. The Fund's maximum exposure under these arrangements is unknown as this would be dependent on future claims that may be made against the Fund. The risk of material loss from such claims is considered remote.
At the end of the period, Strategic Advisers International Fund and Strategic Advisers Fidelity International Fund (formerly Strategic Advisers International II Fund) were the owners of record of approximately 13% and 29%, respectively, of the total outstanding shares of the Fund. Mutual funds managed by the investment adviser or its affiliates were the owners of record, in the aggregate, of approximately 42% of the total outstanding shares of the Fund.
Shareholder Expense Example
As a shareholder of the Fund, you incur two types of costs: (1) transaction costs, including sales charges (loads) on purchase payments or redemption proceeds, redemption fees and (2) ongoing costs, including management fees, distribution and/or service (12b-1) fees and other Fund expenses. This Example is intended to help you understand your ongoing costs (in dollars) of investing in the Fund and to compare these costs with the ongoing costs of investing in other mutual funds.
The Example is based on an investment of $1,000 invested at the beginning of the period and held for the entire period (November 1, 2017 to April 30, 2018).
Actual Expenses
The first line of the accompanying table for each class of the Fund provides information about actual account values and actual expenses. You may use the information in this line, together with the amount you invested, to estimate the expenses that you paid over the period. Simply divide your account value by $1,000.00 (for example, an $8,600 account value divided by $1,000.00 = 8.6), then multiply the result by the number in the first line for a class of the Fund under the heading entitled "Expenses Paid During Period" to estimate the expenses you paid on your account during this period. A small balance maintenance fee of $12.00 that is charged once a year may apply for certain accounts with a value of less than $2,000. This fee is not included in the table below. If it was, the estimate of expenses you paid during the period would be higher, and your ending account value lower, by this amount. In addition, the Fund, as a shareholder in the underlying Fidelity Central Funds, will indirectly bear its pro-rata share of the fees and expenses incurred by the underlying Fidelity Central Funds. These fees and expenses are not included in the Fund's annualized expense ratio used to calculate the expense estimate in the table below.
Hypothetical Example for Comparison Purposes
The second line of the accompanying table for each class of the Fund provides information about hypothetical account values and hypothetical expenses based on a Class' actual expense ratio and an assumed rate of return of 5% per year before expenses, which is not the Class' actual return. The hypothetical account values and expenses may not be used to estimate the actual ending account balance or expenses you paid for the period. You may use this information to compare the ongoing costs of investing in the Fund and other funds. To do so, compare this 5% hypothetical example with the 5% hypothetical examples that appear in the shareholder reports of the other funds. A small balance maintenance fee of $12.00 that is charged once a year may apply for certain accounts with a value of less than $2,000. This fee is not included in the table below. If it was, the estimate of expenses you paid during the period would be higher, and your ending account value lower, by this amount. In addition, the Fund, as a shareholder in the underlying Fidelity Central Funds, will indirectly bear its pro-rata share of the fees and expenses incurred by the underlying Fidelity Central Funds. These fees and expenses are not included in the Fund's annualized expense ratio used to calculate the expense estimate in the table below.
Please note that the expenses shown in the table are meant to highlight your ongoing costs only and do not reflect any transaction costs. Therefore, the second line of the table is useful in comparing ongoing costs only, and will not help you determine the relative total costs of owning different funds. In addition, if these transactional costs were included, your costs would have been higher.
| Annualized Expense Ratio-A | Beginning Account Value November 1, 2017 | Ending Account Value April 30, 2018 | Expenses Paid During Period-B November 1, 2017 to April 30, 2018 | |
| Class A | 1.31% | |||
| Actual | $1,000.00 | $1,047.40 | $6.65 | |
| Hypothetical-C | $1,000.00 | $1,018.30 | $6.56 | |
| Class M | 1.65% | |||
| Actual | $1,000.00 | $1,046.10 | $8.37 | |
| Hypothetical-C | $1,000.00 | $1,016.61 | $8.25 | |
| Class C | 2.01% | |||
| Actual | $1,000.00 | $1,043.50 | $10.18 | |
| Hypothetical-C | $1,000.00 | $1,014.83 | $10.04 | |
| Japan | 1.02% | |||
| Actual | $1,000.00 | $1,048.60 | $5.18 | |
| Hypothetical-C | $1,000.00 | $1,019.74 | $5.11 | |
| Class I | .96% | |||
| Actual | $1,000.00 | $1,049.20 | $4.88 | |
| Hypothetical-C | $1,000.00 | $1,020.03 | $4.81 |
A Annualized expense ratio reflects expenses net of applicable fee waivers.
B Expenses are equal to each Class' annualized expense ratio, multiplied by the average account value over the period, multiplied by 181/365 (to reflect the one-half year period).
C 5% return per year before expenses
![]()
AJPNA-SANN-0618
1.917401.107
Fidelity Advisor® Latin America Fund - Semi-Annual Report April 30, 2018 Class A, Class M, Class C and Class I are classes of Fidelity® Latin America Fund |
|
Contents
To view a fund's proxy voting guidelines and proxy voting record for the 12-month period ended June 30, visit http://www.fidelity.com/proxyvotingresults or visit the Securities and Exchange Commission's (SEC) web site at http://www.sec.gov.
You may also call 1-877-208-0098 to request a free copy of the proxy voting guidelines.
Standard & Poor's, S&P and S&P 500 are registered service marks of The McGraw-Hill Companies, Inc. and have been licensed for use by Fidelity Distributors Corporation.
Other third-party marks appearing herein are the property of their respective owners.
All other marks appearing herein are registered or unregistered trademarks or service marks of FMR LLC or an affiliated company. © 2018 FMR LLC. All rights reserved.
This report and the financial statements contained herein are submitted for the general information of the shareholders of the Fund. This report is not authorized for distribution to prospective investors in the Fund unless preceded or accompanied by an effective prospectus.
A fund files its complete schedule of portfolio holdings with the SEC for the first and third quarters of each fiscal year on Form N-Q. Forms N-Q are available on the SEC’s web site at http://www.sec.gov. A fund's Forms N-Q may be reviewed and copied at the SEC’s Public Reference Room in Washington, DC. Information regarding the operation of the SEC's Public Reference Room may be obtained by calling 1-800-SEC-0330.
For a complete list of a fund's portfolio holdings, view the most recent holdings listing, semiannual report, or annual report on Fidelity's web site at http://www.fidelity.com, http://www.institutional.fidelity.com, or http://www.401k.com, as applicable.
NOT FDIC INSURED •MAY LOSE VALUE •NO BANK GUARANTEE
Neither the Fund nor Fidelity Distributors Corporation is a bank.
Investment Summary (Unaudited)
Geographic Diversification (% of fund's net assets)
| As of April 30, 2018 | ||
| Brazil | 64.9% | |
| Mexico | 16.4% | |
| Panama | 4.3% | |
| Argentina | 4.0% | |
| Bermuda | 3.6% | |
| United States of America* | 1.9% | |
| Spain | 1.8% | |
| United Kingdom | 1.6% | |
| Israel | 1.5% | |

* Includes Short-Term investments and Net Other Assets (Liabilities).
Percentages are based on country or territory of incorporation and are adjusted for the effect of futures contracts, if applicable.
Asset Allocation as of April 30, 2018
| % of fund's net assets | |
| Stocks | 99.7 |
| Short-Term Investments and Net Other Assets (Liabilities) | 0.3 |
Top Ten Stocks as of April 30, 2018
| % of fund's net assets | |
| Itausa-Investimentos Itau SA (PN) (Brazil, Banks) | 9.8 |
| Itau Unibanco Holding SA (Brazil, Banks) | 8.9 |
| Petroleo Brasileiro SA - Petrobras (PN) (non-vtg.) (Brazil, Oil, Gas & Consumable Fuels) | 8.1 |
| Suzano Papel e Celulose SA (Brazil, Paper & Forest Products) | 4.0 |
| Credicorp Ltd. (United States) (Bermuda, Banks) | 3.6 |
| Credito Real S.A.B. de CV (Mexico, Consumer Finance) | 3.2 |
| Banco do Brasil SA (Brazil, Banks) | 3.0 |
| Qualicorp SA (Brazil, Health Care Providers & Services) | 2.9 |
| Genomma Lab Internacional SA de CV (Mexico, Pharmaceuticals) | 2.8 |
| Notre Dame Intermedica Participacoes SA (Brazil, Health Care Providers & Services) | 2.7 |
| 49.0 |
Top Market Sectors as of April 30, 2018
| % of fund's net assets | |
| Financials | 46.5 |
| Consumer Discretionary | 14.1 |
| Industrials | 10.2 |
| Health Care | 9.8 |
| Energy | 8.1 |
| Materials | 7.9 |
| Consumer Staples | 1.6 |
| Information Technology | 1.5 |
Market Sectors may include more than one industry category.
The Fund may invest up to 35% of its total assets in any industry that represents more than 20% of the Latin American market. As of April 30, 2018, 30.6% of the Fund’s total assets were invested in the Diversified Banks industry, which accounts for more than 20% of the Latin American market.
Schedule of Investments April 30, 2018 (Unaudited)
Showing Percentage of Net Assets
| Common Stocks - 71.7% | |||
| Shares | Value | ||
| Argentina - 4.0% | |||
| Banco Macro SA sponsored ADR | 108,597 | $10,525,221 | |
| Bolsas y Mercados Argentinos SA | 427,356 | 7,832,603 | |
| Loma Negra Compania Industrial Argentina SA ADR (a) | 373,359 | 7,743,466 | |
| TOTAL ARGENTINA | 26,101,290 | ||
| Bermuda - 3.6% | |||
| Credicorp Ltd. (United States) | 100,597 | 23,387,797 | |
| Brazil - 36.9% | |||
| Azul SA sponsored ADR | 448,645 | 13,907,995 | |
| Banco do Brasil SA | 1,845,139 | 19,329,927 | |
| BTG Pactual Participations Ltd. unit | 1,334,216 | 8,523,565 | |
| CVC Brasil Operadora e Agencia de Viagens SA | 707,998 | 11,719,800 | |
| Estacio Participacoes SA | 1,707,293 | 15,546,542 | |
| Grendene SA | 1,448,111 | 11,297,349 | |
| Hapvida Participacoes e Investimentos SA | 2,017,636 | 15,924,765 | |
| Instituto Hermes Pardini SA | 1,178,683 | 8,744,568 | |
| IRB Brasil Resseguros SA | 1,087,113 | 14,678,136 | |
| Itausa-Investimentos Itau SA | 379,675 | 1,463,123 | |
| Notre Dame Intermedica Participacoes SA | 3,042,916 | 17,719,652 | |
| Petrobras Distribuidora SA | 1,226,706 | 8,039,841 | |
| Qualicorp SA | 2,713,078 | 18,858,030 | |
| Rumo SA (a) | 3,045,236 | 12,908,699 | |
| Ser Educacional SA (b) | 1,730,053 | 8,197,899 | |
| Smiles Fidelidade SA | 860,158 | 17,678,516 | |
| Suzano Papel e Celulose SA | 2,220,026 | 26,020,286 | |
| Vale SA | 586,218 | 8,144,334 | |
| TOTAL BRAZIL | 238,703,027 | ||
| Israel - 1.5% | |||
| Ituran Location & Control Ltd. | 305,013 | 9,562,158 | |
| Mexico - 16.4% | |||
| Banco del Bajio SA (b) | 5,599,007 | 11,942,241 | |
| Credito Real S.A.B. de CV | 14,087,068 | 20,668,811 | |
| Genomma Lab Internacional SA de CV (a) | 18,670,399 | 18,159,216 | |
| Grupo Aeroportuario Norte S.A.B. de CV | 1,748,674 | 9,260,411 | |
| Grupo Cementos de Chihuahua S.A.B. de CV | 1,551,516 | 9,030,161 | |
| Promotora y Operadora de Infraestructura S.A.B. de CV | 1,748,760 | 12,209,121 | |
| Qualitas Controladora S.A.B. de CV | 4,349,535 | 12,142,478 | |
| Unifin Financiera SAPI de CV | 3,546,735 | 12,692,885 | |
| TOTAL MEXICO | 106,105,324 | ||
| Panama - 4.3% | |||
| Copa Holdings SA Class A | 147,655 | 17,300,736 | |
| Intergroup Financial Services Corp. | 248,403 | 10,629,164 | |
| TOTAL PANAMA | 27,929,900 | ||
| Spain - 1.8% | |||
| Prosegur Cash SA (b) | 3,850,184 | 11,251,747 | |
| United Kingdom - 1.6% | |||
| British American Tobacco PLC (United Kingdom) | 189,181 | 10,376,107 | |
| United States of America - 1.6% | |||
| First Cash Financial Services, Inc. | 120,504 | 10,447,697 | |
| TOTAL COMMON STOCKS | |||
| (Cost $368,278,573) | 463,865,047 | ||
| Nonconvertible Preferred Stocks - 28.0% | |||
| Brazil - 28.0% | |||
| Alpargatas SA (PN) | 1,784,953 | 7,953,619 | |
| Itau Unibanco Holding SA | 3,939,271 | 57,359,618 | |
| Itausa-Investimentos Itau SA (PN) | 16,316,433 | 63,389,658 | |
| Petroleo Brasileiro SA - Petrobras (PN) (non-vtg.) (a) | 8,019,294 | 52,581,406 | |
| TOTAL NONCONVERTIBLE PREFERRED STOCKS | |||
| (Cost $87,175,926) | 181,284,301 | ||
| Money Market Funds - 2.0% | |||
| Fidelity Cash Central Fund, 1.74% (c) | |||
| (Cost $13,198,337) | 13,195,697 | 13,198,337 | |
| TOTAL INVESTMENT IN SECURITIES - 101.7% | |||
| (Cost $468,652,836) | 658,347,685 | ||
| NET OTHER ASSETS (LIABILITIES) - (1.7)% | (11,181,332) | ||
| NET ASSETS - 100% | $647,166,353 |
Categorizations in the Schedule of Investments are based on country or territory of incorporation.
Legend
(a) Non-income producing
(b) Security exempt from registration under Rule 144A of the Securities Act of 1933. These securities may be resold in transactions exempt from registration, normally to qualified institutional buyers. At the end of the period, the value of these securities amounted to $31,391,887 or 4.9% of net assets.
(c) Affiliated fund that is generally available only to investment companies and other accounts managed by Fidelity Investments. The rate quoted is the annualized seven-day yield of the fund at period end. A complete unaudited listing of the fund's holdings as of its most recent quarter end is available upon request. In addition, each Fidelity Central Fund's financial statements are available on the SEC's website or upon request.
Affiliated Central Funds
Information regarding fiscal year to date income earned by the Fund from investments in Fidelity Central Funds is as follows:
| Fund | Income earned |
| Fidelity Cash Central Fund | $45,506 |
| Fidelity Securities Lending Cash Central Fund | 46 |
| Total | $45,552 |
Amounts in the income column in the above table include any capital gain distributions from underlying funds, which are presented in the corresponding line-item in the Statement of Operations if applicable.
Investment Valuation
The following is a summary of the inputs used, as of April 30, 2018, involving the Fund's assets and liabilities carried at fair value. The inputs or methodology used for valuing securities may not be an indication of the risk associated with investing in those securities. For more information on valuation inputs, and their aggregation into the levels used below, please refer to the Investment Valuation section in the accompanying Notes to Financial Statements.
| Valuation Inputs at Reporting Date: | ||||
| Description | Total | Level 1 | Level 2 | Level 3 |
| Investments in Securities: | ||||
| Equities: | ||||
| Consumer Discretionary | $92,375,807 | $92,375,807 | $-- | $-- |
| Consumer Staples | 10,376,107 | -- | 10,376,107 | -- |
| Energy | 52,581,406 | 52,581,406 | -- | -- |
| Financials | 300,247,195 | 300,247,195 | -- | -- |
| Health Care | 63,481,466 | 63,481,466 | -- | -- |
| Industrials | 65,586,962 | 65,586,962 | -- | -- |
| Information Technology | 9,562,158 | 9,562,158 | -- | -- |
| Materials | 50,938,247 | 50,938,247 | -- | -- |
| Money Market Funds | 13,198,337 | 13,198,337 | -- | -- |
| Total Investments in Securities: | $658,347,685 | $647,971,578 | $10,376,107 | $-- |
See accompanying notes which are an integral part of the financial statements.
Financial Statements
Statement of Assets and Liabilities
| April 30, 2018 (Unaudited) | ||
| Assets | ||
| Investment in securities, at value — See accompanying schedule: Unaffiliated issuers (cost $455,454,499) | $645,149,348 | |
| Fidelity Central Funds (cost $13,198,337) | 13,198,337 | |
| Total Investment in Securities (cost $468,652,836) | $658,347,685 | |
| Foreign currency held at value (cost $1,109,295) | 1,110,124 | |
| Receivable for investments sold | 814,675 | |
| Receivable for fund shares sold | 799,851 | |
| Dividends receivable | 1,921,258 | |
| Distributions receivable from Fidelity Central Funds | 26,488 | |
| Prepaid expenses | 309 | |
| Other receivables | 22,059 | |
| Total assets | 663,042,449 | |
| Liabilities | ||
| Payable for investments purchased | $14,533,588 | |
| Payable for fund shares redeemed | 633,028 | |
| Accrued management fee | 375,449 | |
| Distribution and service plan fees payable | 11,183 | |
| Other affiliated payables | 153,703 | |
| Other payables and accrued expenses | 169,145 | |
| Total liabilities | 15,876,096 | |
| Net Assets | $647,166,353 | |
| Net Assets consist of: | ||
| Paid in capital | $563,522,184 | |
| Undistributed net investment income | 6,777,960 | |
| Accumulated undistributed net realized gain (loss) on investments and foreign currency transactions | (112,756,542) | |
| Net unrealized appreciation (depreciation) on investments and assets and liabilities in foreign currencies | 189,622,751 | |
| Net Assets | $647,166,353 | |
| Calculation of Maximum Offering Price | ||
| Class A: | ||
| Net Asset Value and redemption price per share ($19,342,350 ÷ 736,364 shares) | $26.27 | |
| Maximum offering price per share (100/94.25 of $26.27) | $27.87 | |
| Class M: | ||
| Net Asset Value and redemption price per share ($7,082,233 ÷ 268,990 shares) | $26.33 | |
| Maximum offering price per share (100/96.50 of $26.33) | $27.28 | |
| Class C: | ||
| Net Asset Value and offering price per share ($5,024,280 ÷ 189,039 shares)(a) | $26.58 | |
| Latin America: | ||
| Net Asset Value, offering price and redemption price per share ($605,953,275 ÷ 23,141,339 shares) | $26.18 | |
| Class I: | ||
| Net Asset Value, offering price and redemption price per share ($9,764,215 ÷ 373,434 shares) | $26.15 |
(a) Redemption price per share is equal to net asset value less any applicable contingent deferred sales charge.
See accompanying notes which are an integral part of the financial statements.
Statement of Operations
| Six months ended April 30, 2018 (Unaudited) | ||
| Investment Income | ||
| Dividends | $13,806,687 | |
| Income from Fidelity Central Funds | 45,552 | |
| Income before foreign taxes withheld | 13,852,239 | |
| Less foreign taxes withheld | (1,016,847) | |
| Total income | 12,835,392 | |
| Expenses | ||
| Management fee | $2,210,946 | |
| Transfer agent fees | 747,037 | |
| Distribution and service plan fees | 65,920 | |
| Accounting and security lending fees | 158,628 | |
| Custodian fees and expenses | 191,889 | |
| Independent trustees' fees and expenses | 1,259 | |
| Registration fees | 46,253 | |
| Audit | 40,762 | |
| Legal | 1,698 | |
| Miscellaneous | 2,046 | |
| Total expenses before reductions | 3,466,438 | |
| Expense reductions | (44,430) | 3,422,008 |
| Net investment income (loss) | 9,413,384 | |
| Realized and Unrealized Gain (Loss) | ||
| Net realized gain (loss) on: | ||
| Investment securities: | ||
| Unaffiliated issuers | 30,108,737 | |
| Fidelity Central Funds | 55 | |
| Foreign currency transactions | (71,486) | |
| Total net realized gain (loss) | 30,037,306 | |
| Change in net unrealized appreciation (depreciation) on: | ||
| Investment securities: | ||
| Unaffiliated issuers | 198,855 | |
| Assets and liabilities in foreign currencies | (72,928) | |
| Total change in net unrealized appreciation (depreciation) | 125,927 | |
| Net gain (loss) | 30,163,233 | |
| Net increase (decrease) in net assets resulting from operations | $39,576,617 |
See accompanying notes which are an integral part of the financial statements.
Statement of Changes in Net Assets
| Six months ended April 30, 2018 (Unaudited) | Year ended October 31, 2017 | |
| Increase (Decrease) in Net Assets | ||
| Operations | ||
| Net investment income (loss) | $9,413,384 | $12,761,653 |
| Net realized gain (loss) | 30,037,306 | 32,325,555 |
| Change in net unrealized appreciation (depreciation) | 125,927 | 24,718,281 |
| Net increase (decrease) in net assets resulting from operations | 39,576,617 | 69,805,489 |
| Distributions to shareholders from net investment income | (9,005,746) | (12,697,307) |
| Share transactions - net increase (decrease) | (18,887,886) | (55,405,622) |
| Redemption fees | 87,345 | 272,096 |
| Total increase (decrease) in net assets | 11,770,330 | 1,974,656 |
| Net Assets | ||
| Beginning of period | 635,396,023 | 633,421,367 |
| End of period | $647,166,353 | $635,396,023 |
| Other Information | ||
| Undistributed net investment income end of period | $6,777,960 | $6,370,322 |
See accompanying notes which are an integral part of the financial statements.
Financial Highlights
Fidelity Latin America Fund Class A
| Six months ended (Unaudited) April 30, | Years endedOctober 31, | |||||
| 2018 | 2017 | 2016 | 2015 | 2014 | 2013 | |
| Selected Per–Share Data | ||||||
| Net asset value, beginning of period | $24.93 | $22.45 | $18.09 | $30.31 | $40.71 | $48.95 |
| Income from Investment Operations | ||||||
| Net investment income (loss)A | .34 | .42 | .40 | .28 | .49 | .72 |
| Net realized and unrealized gain (loss) | 1.29 | 2.48 | 4.27 | (10.11) | (4.08) | (4.73) |
| Total from investment operations | 1.63 | 2.90 | 4.67 | (9.83) | (3.59) | (4.01) |
| Distributions from net investment income | (.29) | (.43) | (.31) | (.31) | (.57) | (.79) |
| Distributions from net realized gain | – | – | – | (2.08) | (6.25) | (3.45) |
| Total distributions | (.29) | (.43) | (.31) | (2.39) | (6.82) | (4.24) |
| Redemption fees added to paid in capitalA | –B | .01 | –B | –B | .01 | .01 |
| Net asset value, end of period | $26.27 | $24.93 | $22.45 | $18.09 | $30.31 | $40.71 |
| Total ReturnC,D,E | 6.63% | 13.55% | 26.29% | (34.60)% | (9.06)% | (8.93)% |
| Ratios to Average Net AssetsF,G | ||||||
| Expenses before reductions | 1.38%H | 1.39% | 1.40% | 1.40% | 1.38% | 1.37% |
| Expenses net of fee waivers, if any | 1.38%H | 1.39% | 1.40% | 1.40% | 1.38% | 1.37% |
| Expenses net of all reductions | 1.37%H | 1.38% | 1.39% | 1.39% | 1.38% | 1.35% |
| Net investment income (loss) | 2.64%H | 1.90% | 2.14% | 1.26% | 1.52% | 1.66% |
| Supplemental Data | ||||||
| Net assets, end of period (000 omitted) | $19,342 | $17,801 | $19,115 | $16,424 | $34,898 | $48,464 |
| Portfolio turnover rateI | 58%H | 51% | 108% | 30% | 30% | 23% |
A Calculated based on average shares outstanding during the period.
B Amount represents less than $.005 per share.
C Total returns for periods of less than one year are not annualized.
D Total returns would have been lower if certain expenses had not been reduced during the applicable periods shown.
E Total returns do not include the effect of the sales charges.
F Fees and expenses of any underlying Fidelity Central Funds are not included in the Fund's expense ratio. The Fund indirectly bears its proportionate share of the expenses of any underlying Fidelity Central Funds.
G Expense ratios reflect operating expenses of the class. Expenses before reductions do not reflect amounts reimbursed by the investment adviser or reductions from brokerage service arrangements or reductions from other expense offset arrangements and do not represent the amount paid by the class during periods when reimbursements or reductions occur. Expenses net of fee waivers reflect expenses after reimbursement by the investment adviser but prior to reductions from brokerage service arrangements or other expense offset arrangements. Expenses net of all reductions represent the net expenses paid by the class.
H Annualized
I Amount does not include the portfolio activity of any underlying Fidelity Central Funds.
See accompanying notes which are an integral part of the financial statements.
Fidelity Latin America Fund Class M
| Six months ended (Unaudited) April 30, | Years endedOctober 31, | |||||
| 2018 | 2017 | 2016 | 2015 | 2014 | 2013 | |
| Selected Per–Share Data | ||||||
| Net asset value, beginning of period | $24.96 | $22.47 | $18.11 | $30.33 | $40.68 | $48.88 |
| Income from Investment Operations | ||||||
| Net investment income (loss)A | .31 | .36 | .35 | .22 | .40 | .61 |
| Net realized and unrealized gain (loss) | 1.29 | 2.49 | 4.27 | (10.13) | (4.08) | (4.74) |
| Total from investment operations | 1.60 | 2.85 | 4.62 | (9.91) | (3.68) | (4.13) |
| Distributions from net investment income | (.23) | (.37) | (.26) | (.23) | (.43) | (.63) |
| Distributions from net realized gain | – | – | – | (2.08) | (6.25) | (3.45) |
| Total distributions | (.23) | (.37) | (.26) | (2.31) | (6.68) | (4.08) |
| Redemption fees added to paid in capitalA | –B | .01 | –B | –B | .01 | .01 |
| Net asset value, end of period | $26.33 | $24.96 | $22.47 | $18.11 | $30.33 | $40.68 |
| Total ReturnC,D,E | 6.47% | 13.24% | 25.93% | (34.78)% | (9.30)% | (9.17)% |
| Ratios to Average Net AssetsF,G | ||||||
| Expenses before reductions | 1.65%H | 1.66% | 1.68% | 1.67% | 1.65% | 1.63% |
| Expenses net of fee waivers, if any | 1.65%H | 1.66% | 1.68% | 1.67% | 1.65% | 1.63% |
| Expenses net of all reductions | 1.64%H | 1.66% | 1.68% | 1.66% | 1.65% | 1.61% |
| Net investment income (loss) | 2.37%H | 1.62% | 1.86% | .99% | 1.25% | 1.40% |
| Supplemental Data | ||||||
| Net assets, end of period (000 omitted) | $7,082 | $6,740 | $7,378 | $5,284 | $9,761 | $12,705 |
| Portfolio turnover rateI | 58%H | 51% | 108% | 30% | 30% | 23% |
A Calculated based on average shares outstanding during the period.
B Amount represents less than $.005 per share.
C Total returns for periods of less than one year are not annualized.
D Total returns would have been lower if certain expenses had not been reduced during the applicable periods shown.
E Total returns do not include the effect of the sales charges.
F Fees and expenses of any underlying Fidelity Central Funds are not included in the Fund's expense ratio. The Fund indirectly bears its proportionate share of the expenses of any underlying Fidelity Central Funds.
G Expense ratios reflect operating expenses of the class. Expenses before reductions do not reflect amounts reimbursed by the investment adviser or reductions from brokerage service arrangements or reductions from other expense offset arrangements and do not represent the amount paid by the class during periods when reimbursements or reductions occur. Expenses net of fee waivers reflect expenses after reimbursement by the investment adviser but prior to reductions from brokerage service arrangements or other expense offset arrangements. Expenses net of all reductions represent the net expenses paid by the class.
H Annualized
I Amount does not include the portfolio activity of any underlying Fidelity Central Funds.
See accompanying notes which are an integral part of the financial statements.
Fidelity Latin America Fund Class C
| Six months ended (Unaudited) April 30, | Years endedOctober 31, | |||||
| 2018 | 2017 | 2016 | 2015 | 2014 | 2013 | |
| Selected Per–Share Data | ||||||
| Net asset value, beginning of period | $25.12 | $22.61 | $18.18 | $30.37 | $40.59 | $48.73 |
| Income from Investment Operations | ||||||
| Net investment income (loss)A | .25 | .26 | .26 | .11 | .25 | .40 |
| Net realized and unrealized gain (loss) | 1.31 | 2.52 | 4.30 | (10.17) | (4.07) | (4.74) |
| Total from investment operations | 1.56 | 2.78 | 4.56 | (10.06) | (3.82) | (4.34) |
| Distributions from net investment income | (.10) | (.28) | (.13) | (.05) | (.16) | (.36) |
| Distributions from net realized gain | – | – | – | (2.08) | (6.25) | (3.45) |
| Total distributions | (.10) | (.28) | (.13) | (2.13) | (6.41) | (3.81) |
| Redemption fees added to paid in capitalA | –B | .01 | –B | –B | .01 | .01 |
| Net asset value, end of period | $26.58 | $25.12 | $22.61 | $18.18 | $30.37 | $40.59 |
| Total ReturnC,D,E | 6.24% | 12.71% | 25.31% | (35.08)% | (9.74)% | (9.62)% |
| Ratios to Average Net AssetsF,G | ||||||
| Expenses before reductions | 2.13%H | 2.14% | 2.15% | 2.15% | 2.13% | 2.12% |
| Expenses net of fee waivers, if any | 2.13%H | 2.14% | 2.14% | 2.15% | 2.13% | 2.12% |
| Expenses net of all reductions | 2.12%H | 2.14% | 2.14% | 2.15% | 2.13% | 2.10% |
| Net investment income (loss) | 1.89%H | 1.15% | 1.39% | .51% | .77% | .91% |
| Supplemental Data | ||||||
| Net assets, end of period (000 omitted) | $5,024 | $5,094 | $6,590 | $5,394 | $11,349 | $15,185 |
| Portfolio turnover rateI | 58%H | 51% | 108% | 30% | 30% | 23% |
A Calculated based on average shares outstanding during the period.
B Amount represents less than $.005 per share.
C Total returns for periods of less than one year are not annualized.
D Total returns would have been lower if certain expenses had not been reduced during the applicable periods shown.
E Total returns do not include the effect of the contingent deferred sales charge.
F Fees and expenses of any underlying Fidelity Central Funds are not included in the Fund's expense ratio. The Fund indirectly bears its proportionate share of the expenses of any underlying Fidelity Central Funds.
G Expense ratios reflect operating expenses of the class. Expenses before reductions do not reflect amounts reimbursed by the investment adviser or reductions from brokerage service arrangements or reductions from other expense offset arrangements and do not represent the amount paid by the class during periods when reimbursements or reductions occur. Expenses net of fee waivers reflect expenses after reimbursement by the investment adviser but prior to reductions from brokerage service arrangements or other expense offset arrangements. Expenses net of all reductions represent the net expenses paid by the class.
H Annualized
I Amount does not include the portfolio activity of any underlying Fidelity Central Funds.
See accompanying notes which are an integral part of the financial statements.
Fidelity Latin America Fund
| Six months ended (Unaudited) April 30, | Years endedOctober 31, | |||||
| 2018 | 2017 | 2016 | 2015 | 2014 | 2013 | |
| Selected Per–Share Data | ||||||
| Net asset value, beginning of period | $24.89 | $22.41 | $18.08 | $30.34 | $40.80 | $49.09 |
| Income from Investment Operations | ||||||
| Net investment income (loss)A | .38 | .49 | .45 | .34 | .59 | .87 |
| Net realized and unrealized gain (loss) | 1.28 | 2.46 | 4.26 | (10.11) | (4.10) | (4.74) |
| Total from investment operations | 1.66 | 2.95 | 4.71 | (9.77) | (3.51) | (3.87) |
| Distributions from net investment income | (.37) | (.48) | (.38) | (.41) | (.71) | (.98) |
| Distributions from net realized gain | – | – | – | (2.08) | (6.25) | (3.45) |
| Total distributions | (.37) | (.48) | (.38) | (2.49) | (6.96) | (4.43) |
| Redemption fees added to paid in capitalA | –B | .01 | –B | –B | .01 | .01 |
| Net asset value, end of period | $26.18 | $24.89 | $22.41 | $18.08 | $30.34 | $40.80 |
| Total ReturnC,D | 6.80% | 13.87% | 26.65% | (34.45)% | (8.79)% | (8.63)% |
| Ratios to Average Net AssetsE,F | ||||||
| Expenses before reductions | 1.06%G | 1.09% | 1.14% | 1.13% | 1.08% | 1.04% |
| Expenses net of fee waivers, if any | 1.06%G | 1.09% | 1.14% | 1.12% | 1.08% | 1.04% |
| Expenses net of all reductions | 1.04%G | 1.09% | 1.13% | 1.12% | 1.07% | 1.03% |
| Net investment income (loss) | 2.96%G | 2.19% | 2.40% | 1.53% | 1.83% | 1.99% |
| Supplemental Data | ||||||
| Net assets, end of period (000 omitted) | $605,953 | $597,161 | $596,514 | $481,005 | $933,298 | $1,324,748 |
| Portfolio turnover rateH | 58%G | 51% | 108% | 30% | 30% | 23% |
A Calculated based on average shares outstanding during the period.
B Amount represents less than $.005 per share.
C Total returns for periods of less than one year are not annualized.
D Total returns would have been lower if certain expenses had not been reduced during the applicable periods shown.
E Fees and expenses of any underlying Fidelity Central Funds are not included in the Fund's expense ratio. The Fund indirectly bears its proportionate share of the expenses of any underlying Fidelity Central Funds.
F Expense ratios reflect operating expenses of the class. Expenses before reductions do not reflect amounts reimbursed by the investment adviser or reductions from brokerage service arrangements or reductions from other expense offset arrangements and do not represent the amount paid by the class during periods when reimbursements or reductions occur. Expenses net of fee waivers reflect expenses after reimbursement by the investment adviser but prior to reductions from brokerage service arrangements or other expense offset arrangements. Expenses net of all reductions represent the net expenses paid by the class.
G Annualized
H Amount does not include the portfolio activity of any underlying Fidelity Central Funds.
See accompanying notes which are an integral part of the financial statements.
Fidelity Latin America Fund Class I
| Six months ended (Unaudited) April 30, | Years endedOctober 31, | |||||
| 2018 | 2017 | 2016 | 2015 | 2014 | 2013 | |
| Selected Per–Share Data | ||||||
| Net asset value, beginning of period | $24.88 | $22.40 | $18.08 | $30.35 | $40.79 | $49.07 |
| Income from Investment Operations | ||||||
| Net investment income (loss)A | .39 | .51 | .46 | .36 | .60 | .87 |
| Net realized and unrealized gain (loss) | 1.28 | 2.45 | 4.26 | (10.13) | (4.07) | (4.74) |
| Total from investment operations | 1.67 | 2.96 | 4.72 | (9.77) | (3.47) | (3.87) |
| Distributions from net investment income | (.40) | (.49) | (.40) | (.42) | (.73) | (.97) |
| Distributions from net realized gain | – | – | – | (2.08) | (6.25) | (3.45) |
| Total distributions | (.40) | (.49) | (.40) | (2.50) | (6.98) | (4.42) |
| Redemption fees added to paid in capitalA | –B | .01 | –B | –B | .01 | .01 |
| Net asset value, end of period | $26.15 | $24.88 | $22.40 | $18.08 | $30.35 | $40.79 |
| Total ReturnC,D | 6.84% | 13.94% | 26.77% | (34.42)% | (8.69)% | (8.63)% |
| Ratios to Average Net AssetsE,F | ||||||
| Expenses before reductions | 1.00%G | 1.01% | 1.07% | 1.06% | 1.04% | 1.03% |
| Expenses net of fee waivers, if any | 1.00%G | 1.01% | 1.07% | 1.06% | 1.04% | 1.03% |
| Expenses net of all reductions | .99%G | 1.01% | 1.06% | 1.05% | 1.04% | 1.01% |
| Net investment income (loss) | 3.02%G | 2.27% | 2.47% | 1.60% | 1.86% | 2.00% |
| Supplemental Data | ||||||
| Net assets, end of period (000 omitted) | $9,764 | $8,600 | $3,825 | $1,828 | $4,531 | $5,131 |
| Portfolio turnover rateH | 58%G | 51% | 108% | 30% | 30% | 23% |
A Calculated based on average shares outstanding during the period.
B Amount represents less than $.005 per share.
C Total returns for periods of less than one year are not annualized.
D Total returns would have been lower if certain expenses had not been reduced during the applicable periods shown.
E Fees and expenses of any underlying Fidelity Central Funds are not included in the Fund's expense ratio. The Fund indirectly bears its proportionate share of the expenses of any underlying Fidelity Central Funds.
F Expense ratios reflect operating expenses of the class. Expenses before reductions do not reflect amounts reimbursed by the investment adviser or reductions from brokerage service arrangements or reductions from other expense offset arrangements and do not represent the amount paid by the class during periods when reimbursements or reductions occur. Expenses net of fee waivers reflect expenses after reimbursement by the investment adviser but prior to reductions from brokerage service arrangements or other expense offset arrangements. Expenses net of all reductions represent the net expenses paid by the class.
G Annualized
H Amount does not include the portfolio activity of any underlying Fidelity Central Funds.
See accompanying notes which are an integral part of the financial statements.
Notes to Financial Statements (Unaudited)
For the period ended April 30, 2018
1. Organization.
Fidelity Latin America Fund (the Fund) is a non-diversified fund of Fidelity Investment Trust (the Trust) and is authorized to issue an unlimited number of shares. The Trust is registered under the Investment Company Act of 1940, as amended (the 1940 Act), as an open-end management investment company organized as a Massachusetts business trust. The Fund offers Class A, Class M, Class C, Latin America and Class I shares, each of which has equal rights as to assets and voting privileges. Each class has exclusive voting rights with respect to matters that affect that class. The Fund's investments in emerging markets can be subject to social, economic, regulatory, and political uncertainties and can be extremely volatile.
2. Investments in Fidelity Central Funds.
The Fund invests in Fidelity Central Funds, which are open-end investment companies generally available only to other investment companies and accounts managed by the investment adviser and its affiliates. The Fund's Schedule of Investments lists each of the Fidelity Central Funds held as of period end, if any, as an investment of the Fund, but does not include the underlying holdings of each Fidelity Central Fund. As an Investing Fund, the Fund indirectly bears its proportionate share of the expenses of the underlying Fidelity Central Funds.
The Money Market Central Funds seek preservation of capital and current income and are managed by Fidelity Investments Money Management, Inc. (FIMM), an affiliate of the investment adviser. Annualized expenses of the Money Market Central Funds as of their most recent shareholder report date are less than .005%.
A complete unaudited list of holdings for each Fidelity Central Fund is available upon request or at the Securities and Exchange Commission (the SEC) website at www.sec.gov. In addition, the financial statements of the Fidelity Central Funds are available on the SEC website or upon request.
3. Significant Accounting Policies.
The Fund is an investment company and applies the accounting and reporting guidance of the Financial Accounting Standards Board (FASB) Accounting Standards Codification Topic 946 Financial Services – Investments Companies. The financial statements have been prepared in conformity with accounting principles generally accepted in the United States of America (GAAP), which require management to make certain estimates and assumptions at the date of the financial statements. Actual results could differ from those estimates. Subsequent events, if any, through the date that the financial statements were issued have been evaluated in the preparation of the financial statements. The following summarizes the significant accounting policies of the Fund:
Investment Valuation. Investments are valued as of 4:00 p.m. Eastern time on the last calendar day of the period. The Board of Trustees (the Board) has delegated the day to day responsibility for the valuation of the Fund's investments to the Fair Value Committee (the Committee) established by the Fund's investment adviser. In accordance with valuation policies and procedures approved by the Board, the Fund attempts to obtain prices from one or more third party pricing vendors or brokers to value its investments. When current market prices, quotations or currency exchange rates are not readily available or reliable, investments will be fair valued in good faith by the Committee, in accordance with procedures adopted by the Board. Factors used in determining fair value vary by investment type and may include market or investment specific events. The frequency with which these procedures are used cannot be predicted and they may be utilized to a significant extent. The Committee oversees the Fund's valuation policies and procedures and reports to the Board on the Committee's activities and fair value determinations. The Board monitors the appropriateness of the procedures used in valuing the Fund's investments and ratifies the fair value determinations of the Committee.
The Fund categorizes the inputs to valuation techniques used to value its investments into a disclosure hierarchy consisting of three levels as shown below:
- Level 1 – quoted prices in active markets for identical investments
- Level 2 – other significant observable inputs (including quoted prices for similar investments, interest rates, prepayment speeds, etc.)
- Level 3 – unobservable inputs (including the Fund's own assumptions based on the best information available)
Valuation techniques used to value the Fund's investments by major category are as follows:
Equity securities, including restricted securities, for which market quotations are readily available, are valued at the last reported sale price or official closing price as reported by a third party pricing vendor on the primary market or exchange on which they are traded and are categorized as Level 1 in the hierarchy. In the event there were no sales during the day or closing prices are not available, securities are valued at the last quoted bid price or may be valued using the last available price and are generally categorized as Level 2 in the hierarchy. For foreign equity securities, when market or security specific events arise, comparisons to the valuation of American Depositary Receipts (ADRs), futures contracts, Exchange-Traded Funds (ETFs) and certain indexes as well as quoted prices for similar securities may be used and would be categorized as Level 2 in the hierarchy. Utilizing these techniques may result in transfers between Level 1 and Level 2. For equity securities, including restricted securities, where observable inputs are limited, assumptions about market activity and risk are used and these securities may be categorized as Level 3 in the hierarchy.
Investments in open-end mutual funds, including the Fidelity Central Funds, are valued at their closing net asset value (NAV) each business day and are categorized as Level 1 in the hierarchy.
Changes in valuation techniques may result in transfers in or out of an assigned level within the disclosure hierarchy. The aggregate value of investments by input level as of April 30, 2018 is included at the end of the Fund's Schedule of Investments.
Foreign Currency. The Fund may use foreign currency contracts to facilitate transactions in foreign-denominated securities. Gains and losses from these transactions may arise from changes in the value of the foreign currency or if the counterparties do not perform under the contracts' terms.
Foreign-denominated assets, including investment securities, and liabilities are translated into U.S. dollars at the exchange rates at period end. Purchases and sales of investment securities, income and dividends received and expenses denominated in foreign currencies are translated into U.S. dollars at the exchange rate in effect on the transaction date.
The effects of exchange rate fluctuations on investments are included with the net realized and unrealized gain (loss) on investment securities. Other foreign currency transactions resulting in realized and unrealized gain (loss) are disclosed separately.
Investment Transactions and Income. For financial reporting purposes, the Fund's investment holdings and NAV include trades executed through the end of the last business day of the period. The NAV per share for processing shareholder transactions is calculated as of the close of business of the New York Stock Exchange (NYSE), normally 4:00 p.m. Eastern time and includes trades executed through the end of the prior business day. Gains and losses on securities sold are determined on the basis of identified cost. Dividend income is recorded on the ex-dividend date, except for certain dividends from foreign securities where the ex-dividend date may have passed, which are recorded as soon as the Fund is informed of the ex-dividend date. Non-cash dividends included in dividend income, if any, are recorded at the fair market value of the securities received. Income and capital gain distributions from Fidelity Central Funds, if any, are recorded on the ex-dividend date. Certain distributions received by the Fund represent a return of capital or capital gain. The Fund determines the components of these distributions subsequent to the ex-dividend date, based upon receipt of tax filings or other correspondence relating to the underlying investment. These distributions are recorded as a reduction of cost of investments and/or as a realized gain. Investment income is recorded net of foreign taxes withheld where recovery of such taxes is uncertain.
Class Allocations and Expenses. Investment income, realized and unrealized capital gains and losses, common expenses of the Fund, and certain fund-level expense reductions, if any, are allocated daily on a pro-rata basis to each class based on the relative net assets of each class to the total net assets of the Fund. Each class differs with respect to transfer agent and distribution and service plan fees incurred. Certain expense reductions may also differ by class. For the reporting period, the allocated portion of income and expenses to each class as a percent of its average net assets may vary due to the timing of recording these transactions in relation to fluctuating net assets of the classes. Expenses directly attributable to a fund are charged to that fund. Expenses attributable to more than one fund are allocated among the respective funds on the basis of relative net assets or other appropriate methods. Expense estimates are accrued in the period to which they relate and adjustments are made when actual amounts are known.
Income Tax Information and Distributions to Shareholders. Each year, the Fund intends to qualify as a regulated investment company under Subchapter M of the Internal Revenue Code, including distributing substantially all of its taxable income and realized gains. As a result, no provision for U.S. Federal income taxes is required. The Fund files a U.S. federal tax return, in addition to state and local tax returns as required. The Fund's federal income tax returns are subject to examination by the Internal Revenue Service (IRS) for a period of three fiscal years after they are filed. State and local tax returns may be subject to examination for an additional fiscal year depending on the jurisdiction. Foreign taxes are provided for based on the Fund's understanding of the tax rules and rates that exist in the foreign markets in which it invests.
Distributions are declared and recorded on the ex-dividend date. Income and capital gain distributions are declared separately for each class. Income and capital gain distributions are determined in accordance with income tax regulations, which may differ from GAAP.
Capital accounts within the financial statements are adjusted for permanent book-tax differences. These adjustments have no impact on net assets or the results of operations. Capital accounts are not adjusted for temporary book-tax differences which will reverse in a subsequent period.
Book-tax differences are primarily due to foreign currency transactions, passive foreign investment companies (PFIC), capital loss carryforwards, deferred trustees compensation, and losses deferred due to wash sales.
As of period end, the cost and unrealized appreciation (depreciation) in securities, and derivatives if applicable, for federal income tax purposes were as follows:
| Gross unrealized appreciation | $208,271,963 |
| Gross unrealized depreciation | (19,845,588) |
| Net unrealized appreciation (depreciation) | $188,426,375 |
| Tax cost | $469,921,310 |
Capital loss carryforwards are only available to offset future capital gains of the Fund to the extent provided by regulations and may be limited. Under the Regulated Investment Company Modernization Act of 2010 (the Act), the Fund is permitted to carry forward capital losses incurred in taxable years beginning after December 22, 2010 for an unlimited period and such capital losses are required to be used prior to any losses that expire. The capital loss carryforward information presented below, including any applicable limitation, is estimated as of prior fiscal period end and is subject to adjustment.
| No expiration | |
| Short-term | $(41,534,225) |
| Long-term | (100,189,560) |
| Total capital loss carryforward | $(141,723,785) |
Short-Term Trading (Redemption) Fees. Shares held by investors in the Fund less than 90 days may have been subject to a redemption fee equal to 1.50% of the NAV of shares redeemed. All redemption fees, which reduce the proceeds of the shareholder redemption, are retained by the Fund and accounted for as an addition to paid in capital. In November 2017, the Board of Trustees approved the elimination of these redemption fees effective December 18, 2017.
Restricted Securities. The Fund may invest in securities that are subject to legal or contractual restrictions on resale. These securities generally may be resold in transactions exempt from registration or to the public if the securities are registered. Disposal of these securities may involve time-consuming negotiations and expense, and prompt sale at an acceptable price may be difficult. Information regarding restricted securities is included at the end of the Fund's Schedule of Investments.
4. Purchases and Sales of Investments.
Purchases and sales of securities, other than short-term securities, aggregated $183,315,402 and $193,523,070, respectively.
5. Fees and Other Transactions with Affiliates.
Management Fee. Fidelity Management & Research Company (the investment adviser) and its affiliates provide the Fund with investment management related services for which the Fund pays a monthly management fee. The management fee is the sum of an individual fund fee rate that is based on an annual rate of .45% of the Fund's average net assets and an annualized group fee rate that averaged .24% during the period. The group fee rate is based upon the average net assets of all the mutual funds advised by the investment adviser, including any mutual funds previously advised by the investment adviser that are currently advised by Fidelity SelectCo, LLC, an affiliate of the investment adviser. The group fee rate decreases as assets under management increase and increases as assets under management decrease. For the reporting period, the total annualized management fee rate was .69% of the Fund's average net assets.
Distribution and Service Plan Fees. In accordance with Rule 12b-1 of the 1940 Act, the Fund has adopted separate Distribution and Service Plans for each class of shares. Certain classes pay Fidelity Distributors Corporation (FDC), an affiliate of the investment adviser, separate Distribution and Service Fees, each of which is based on an annual percentage of each class' average net assets. In addition, FDC may pay financial intermediaries for selling shares of the Fund and providing shareholder support services. For the period, the Distribution and Service Fee rates, total fees and amounts retained by FDC were as follows:
| Distribution Fee | Service Fee | Total Fees | Retained by FDC | |
| Class A | -% | .25% | $23,015 | $513 |
| Class M | .25% | .25% | 17,330 | 292 |
| Class C | .75% | .25% | 25,575 | 1,879 |
| $65,920 | $2,684 |
Sales Load. FDC may receive a front-end sales charge of up to 5.75% for selling Class A shares and 3.50% for selling Class M shares, some of which is paid to financial intermediaries for selling shares of the Fund. Depending on the holding period, FDC may receive contingent deferred sales charges levied on Class A, Class M and Class C redemptions. The deferred sales charges are 1.00% for Class C shares, 1.00% for certain purchases of Class A shares and .25% for certain purchases of Class M shares.
For the period, sales charge amounts retained by FDC were as follows:
| Retained by FDC | |
| Class A | $4,751 |
| Class M | 947 |
| Class C(a) | 518 |
| $6,216 |
(a) When Class C shares are initially sold, FDC pays commissions from its own resources to financial intermediaries through which the sales are made.
Transfer Agent Fees. Fidelity Investments Institutional Operations Company, Inc., (FIIOC), an affiliate of the investment adviser, is the transfer, dividend disbursing and shareholder servicing agent for each class of the Fund. FIIOC receives account fees and asset-based fees that vary according to the account size and type of account of the shareholders of the respective classes of the Fund. FIIOC pays for typesetting, printing and mailing of shareholder reports, except proxy statements.
For the period, transfer agent fees for each class were as follows:
| Amount | % of Class-Level Average Net Assets(a) | |
| Class A | $27,775 | .30 |
| Class M | 11,322 | .33 |
| Class C | 7,734 | .30 |
| Latin America | 692,592 | .23 |
| Class I | 7,614 | .18 |
| $747,037 |
(a) Annualized
Accounting and Security Lending Fees. Fidelity Service Company, Inc. (FSC), an affiliate of the investment adviser, maintains the Fund's accounting records. The accounting fee is based on the level of average net assets for each month. Under a separate contract, FSC administers the security lending program. The security lending fee is based on the number and duration of lending transactions. For the period, the fees were equivalent to an annualized rate of .05%.
Brokerage Commissions. The Fund placed a portion of its portfolio transactions with brokerage firms which are affiliates of the investment adviser. Brokerage commissions are included in net realized gain (loss) and change in net unrealized appreciation (depreciation) in the Statement of Operations. The commissions paid to these affiliated firms were $807 for the period.
Interfund Trades. The Fund may purchase from or sell securities to other Fidelity Funds under procedures adopted by the Board. The procedures have been designed to ensure these interfund trades are executed in accordance with Rule 17a-7 of the 1940 Act. Interfund trades are included within the respective purchases and sales amounts shown in the Purchases and Sales of Investments note.
6. Committed Line of Credit.
The Fund participates with other funds managed by the investment adviser or an affiliate in a $4.25 billion credit facility (the "line of credit") to be utilized for temporary or emergency purposes to fund shareholder redemptions or for other short-term liquidity purposes. The Fund has agreed to pay commitment fees on its pro-rata portion of the line of credit, which amounted to $927 and is reflected in Miscellaneous expenses on the Statement of Operations. During the period, the Fund did not borrow on this line of credit.
7. Security Lending.
The Fund lends portfolio securities through a lending agent from time to time in order to earn additional income. For equity securities, a lending agent is used and may loan securities to certain qualified borrowers, including Fidelity Capital Markets (FCM), a broker-dealer affiliated with the Fund. On the settlement date of the loan, the Fund receives collateral (in the form of U.S. Treasury obligations, letters of credit and/or cash) against the loaned securities and maintains collateral in an amount not less than 100% of the market value of the loaned securities during the period of the loan. The market value of the loaned securities is determined at the close of business of the Fund and any additional required collateral is delivered to the Fund on the next business day. The Fund or borrower may terminate the loan at any time, and if the borrower defaults on its obligation to return the securities loaned because of insolvency or other reasons, the Fund may apply collateral received from the borrower against the obligation. The Fund may experience delays and costs in recovering the securities loaned. Any cash collateral received is invested in the Fidelity Securities Lending Cash Central Fund. At period end, there were no security loans outstanding. Security lending income represents the income earned on investing cash collateral, less rebates paid to borrowers and any lending agent fees associated with the loan, plus any premium payments received for lending certain types of securities. Security lending income is presented in the Statement of Operations as a component of income from Fidelity Central Funds. Total security lending income during the period amounted to $46. During the period, there were no securities loaned to FCM.
8. Expense Reductions.
Commissions paid to certain brokers with whom the investment adviser, or its affiliates, places trades on behalf of the Fund include an amount in addition to trade execution, which may be rebated back to the Fund to offset certain expenses. This amount totaled $41,433 for the period.
In addition, during the period the investment adviser reimbursed and/or waived a portion of fund-level operating expenses in the amount of $2,997.
9. Distributions to Shareholders.
Distributions to shareholders of each class were as follows:
| Six months ended April 30, 2018 | Year ended October 31, 2017 | |
| From net investment income | ||
| Class A | $203,267 | $361,857 |
| Class M | 60,223 | 112,037 |
| Class C | 19,813 | 77,689 |
| Latin America | 8,592,965 | 12,063,200 |
| Class I | 129,478 | 82,524 |
| Total | $9,005,746 | $12,697,307 |
10. Share Transactions.
Share transactions for each class were as follows and may contain automatic conversions between classes or exchanges between affiliated funds:
| Shares | Shares | Dollars | Dollars | |
| Six months ended April 30, 2018 | Year ended October 31, 2017 | Six months ended April 30, 2018 | Year ended October 31, 2017 | |
| Class A | ||||
| Shares sold | 91,891 | 139,205 | $2,454,959 | $3,031,500 |
| Reinvestment of distributions | 8,149 | 18,202 | 198,340 | 345,275 |
| Shares redeemed | (77,802) | (294,686) | (2,019,503) | (6,569,414) |
| Net increase (decrease) | 22,238 | (137,279) | $633,796 | $(3,192,639) |
| Class M | ||||
| Shares sold | 24,849 | 33,689 | $666,207 | $739,767 |
| Reinvestment of distributions | 2,445 | 5,687 | 59,769 | 108,338 |
| Shares redeemed | (28,380) | (97,619) | (736,451) | (2,073,277) |
| Net increase (decrease) | (1,086) | (58,243) | $(10,475) | $(1,225,172) |
| Class C | ||||
| Shares sold | 23,762 | 20,475 | $646,189 | $450,205 |
| Reinvestment of distributions | 727 | 3,179 | 18,055 | 61,288 |
| Shares redeemed | (38,241) | (112,274) | (1,030,400) | (2,414,306) |
| Net increase (decrease) | (13,752) | (88,620) | $(366,156) | $(1,902,813) |
| Latin America | ||||
| Shares sold | 2,575,380 | 5,339,360 | $68,165,303 | $120,661,935 |
| Reinvestment of distributions | 339,440 | 610,988 | 8,218,379 | 11,542,194 |
| Shares redeemed | (3,762,655) | (8,575,067) | (96,297,058) | (185,420,867) |
| Net increase (decrease) | (847,835) | (2,624,719) | $(19,913,376) | $(53,216,738) |
| Class I | ||||
| Shares sold | 134,528 | 265,874 | $3,501,560 | $6,186,180 |
| Reinvestment of distributions | 4,501 | 3,896 | 108,773 | 73,478 |
| Shares redeemed | (111,281) | (94,860) | (2,842,008) | (2,127,918) |
| Net increase (decrease) | 27,748 | 174,910 | $768,325 | $4,131,740 |
11. Other.
The Fund's organizational documents provide former and current trustees and officers with a limited indemnification against liabilities arising in connection with the performance of their duties to the Fund. In the normal course of business, the Fund may also enter into contracts that provide general indemnifications. The Fund's maximum exposure under these arrangements is unknown as this would be dependent on future claims that may be made against the Fund. The risk of material loss from such claims is considered remote.
Shareholder Expense Example
As a shareholder of the Fund, you incur two types of costs: (1) transaction costs, including sales charges (loads) on purchase payments or redemption proceeds, redemption fees and (2) ongoing costs, including management fees, distribution and/or service (12b-1) fees and other Fund expenses. This Example is intended to help you understand your ongoing costs (in dollars) of investing in the Fund and to compare these costs with the ongoing costs of investing in other mutual funds.
The Example is based on an investment of $1,000 invested at the beginning of the period and held for the entire period (November 1, 2017 to April 30, 2018).
Actual Expenses
The first line of the accompanying table for each class of the Fund provides information about actual account values and actual expenses. You may use the information in this line, together with the amount you invested, to estimate the expenses that you paid over the period. Simply divide your account value by $1,000.00 (for example, an $8,600 account value divided by $1,000.00 = 8.6), then multiply the result by the number in the first line for a class of the Fund under the heading entitled "Expenses Paid During Period" to estimate the expenses you paid on your account during this period. A small balance maintenance fee of $12.00 that is charged once a year may apply for certain accounts with a value of less than $2,000. This fee is not included in the table below. If it was, the estimate of expenses you paid during the period would be higher, and your ending account value lower, by this amount. In addition, the Fund, as a shareholder in the underlying Fidelity Central Funds, will indirectly bear its pro-rata share of the fees and expenses incurred by the underlying Fidelity Central Funds. These fees and expenses are not included in the Fund's annualized expense ratio used to calculate the expense estimate in the table below.
Hypothetical Example for Comparison Purposes
The second line of the accompanying table for each class of the Fund provides information about hypothetical account values and hypothetical expenses based on a Class' actual expense ratio and an assumed rate of return of 5% per year before expenses, which is not the Class' actual return. The hypothetical account values and expenses may not be used to estimate the actual ending account balance or expenses you paid for the period. You may use this information to compare the ongoing costs of investing in the Fund and other funds. To do so, compare this 5% hypothetical example with the 5% hypothetical examples that appear in the shareholder reports of the other funds. A small balance maintenance fee of $12.00 that is charged once a year may apply for certain accounts with a value of less than $2,000. This fee is not included in the table below. If it was, the estimate of expenses you paid during the period would be higher, and your ending account value lower, by this amount. In addition, the Fund, as a shareholder in the underlying Fidelity Central Funds, will indirectly bear its pro-rata share of the fees and expenses incurred by the underlying Fidelity Central Funds. These fees and expenses are not included in the Fund's annualized expense ratio used to calculate the expense estimate in the table below.
Please note that the expenses shown in the table are meant to highlight your ongoing costs only and do not reflect any transaction costs. Therefore, the second line of the table is useful in comparing ongoing costs only, and will not help you determine the relative total costs of owning different funds. In addition, if these transactional costs were included, your costs would have been higher.
| Annualized Expense Ratio-A | Beginning Account Value November 1, 2017 | Ending Account Value April 30, 2018 | Expenses Paid During Period-B November 1, 2017 to April 30, 2018 | |
| Class A | 1.38% | |||
| Actual | $1,000.00 | $1,066.30 | $7.07 | |
| Hypothetical-C | $1,000.00 | $1,017.95 | $6.90 | |
| Class M | 1.65% | |||
| Actual | $1,000.00 | $1,064.70 | $8.45 | |
| Hypothetical-C | $1,000.00 | $1,016.61 | $8.25 | |
| Class C | 2.13% | |||
| Actual | $1,000.00 | $1,062.40 | $10.89 | |
| Hypothetical-C | $1,000.00 | $1,014.23 | $10.64 | |
| Latin America | 1.06% | |||
| Actual | $1,000.00 | $1,068.00 | $5.44 | |
| Hypothetical-C | $1,000.00 | $1,019.54 | $5.31 | |
| Class I | 1.00% | |||
| Actual | $1,000.00 | $1,068.40 | $5.13 | |
| Hypothetical-C | $1,000.00 | $1,019.84 | $5.01 |
A Annualized expense ratio reflects expenses net of applicable fee waivers.
B Expenses are equal to each Class' annualized expense ratio, multiplied by the average account value over the period, multiplied by 181/365 (to reflect the one-half year period).
C 5% return per year before expenses
![]()
FALAA-SANN-0618
1.917421.107
Fidelity Advisor® Total International Equity Fund - Semi-Annual Report April 30, 2018 Class A, Class M, Class C, Class I and Class Z are classes of Fidelity® Total International Equity Fund |
|
Contents
To view a fund's proxy voting guidelines and proxy voting record for the 12-month period ended June 30, visit http://www.fidelity.com/proxyvotingresults or visit the Securities and Exchange Commission's (SEC) web site at http://www.sec.gov.
You may also call 1-877-208-0098 to request a free copy of the proxy voting guidelines.
Standard & Poor's, S&P and S&P 500 are registered service marks of The McGraw-Hill Companies, Inc. and have been licensed for use by Fidelity Distributors Corporation.
Other third-party marks appearing herein are the property of their respective owners.
All other marks appearing herein are registered or unregistered trademarks or service marks of FMR LLC or an affiliated company. © 2018 FMR LLC. All rights reserved.
This report and the financial statements contained herein are submitted for the general information of the shareholders of the Fund. This report is not authorized for distribution to prospective investors in the Fund unless preceded or accompanied by an effective prospectus.
A fund files its complete schedule of portfolio holdings with the SEC for the first and third quarters of each fiscal year on Form N-Q. Forms N-Q are available on the SEC’s web site at http://www.sec.gov. A fund's Forms N-Q may be reviewed and copied at the SEC’s Public Reference Room in Washington, DC. Information regarding the operation of the SEC's Public Reference Room may be obtained by calling 1-800-SEC-0330.
For a complete list of a fund's portfolio holdings, view the most recent holdings listing, semiannual report, or annual report on Fidelity's web site at http://www.fidelity.com, http://www.institutional.fidelity.com, or http://www.401k.com, as applicable.
NOT FDIC INSURED •MAY LOSE VALUE •NO BANK GUARANTEE
Neither the Fund nor Fidelity Distributors Corporation is a bank.
Investment Summary (Unaudited)
Geographic Diversification (% of fund's net assets)
| As of April 30, 2018 | ||
| Japan | 14.0% | |
| United States of America* | 10.8% | |
| United Kingdom | 9.9% | |
| France | 6.6% | |
| Germany | 5.6% | |
| Switzerland | 4.9% | |
| Canada | 4.7% | |
| Cayman Islands | 4.5% | |
| India | 3.6% | |
| Other | 35.4% | |

* Includes Short-Term investments and Net Other Assets (Liabilities).
Percentages are based on country or territory of incorporation and are adjusted for the effect of futures contracts, if applicable.
Asset Allocation as of April 30, 2018
| % of fund's net assets | |
| Stocks | 97.6 |
| Short-Term Investments and Net Other Assets (Liabilities) | 2.4 |
Top Ten Stocks as of April 30, 2018
| % of fund's net assets | |
| Alibaba Group Holding Ltd. sponsored ADR (Cayman Islands, Internet Software & Services) | 1.6 |
| Tencent Holdings Ltd. (Cayman Islands, Internet Software & Services) | 1.6 |
| Samsung Electronics Co. Ltd. (Korea (South), Technology Hardware, Storage & Peripherals) | 1.5 |
| Taiwan Semiconductor Manufacturing Co. Ltd. (Taiwan, Semiconductors & Semiconductor Equipment) | 1.4 |
| Nestle SA (Reg. S) (Switzerland, Food Products) | 1.3 |
| SAP SE (Germany, Software) | 1.2 |
| Naspers Ltd. Class N (South Africa, Media) | 1.2 |
| Keyence Corp. (Japan, Electronic Equipment & Components) | 1.2 |
| AIA Group Ltd. (Hong Kong, Insurance) | 1.1 |
| CSL Ltd. (Australia, Biotechnology) | 1.1 |
| 13.2 |
Top Market Sectors as of April 30, 2018
| % of fund's net assets | |
| Financials | 22.9 |
| Information Technology | 17.3 |
| Industrials | 14.6 |
| Consumer Discretionary | 10.4 |
| Materials | 8.1 |
| Consumer Staples | 7.9 |
| Health Care | 7.7 |
| Energy | 5.1 |
| Real Estate | 1.5 |
| Telecommunication Services | 1.6 |
Schedule of Investments April 30, 2018 (Unaudited)
Showing Percentage of Net Assets
| Common Stocks - 96.1% | |||
| Shares | Value | ||
| Argentina - 0.3% | |||
| Banco Macro SA sponsored ADR | 1,700 | $164,764 | |
| Telecom Argentina SA Class B sponsored ADR | 5,500 | 165,220 | |
| TOTAL ARGENTINA | 329,984 | ||
| Australia - 2.5% | |||
| Accent Group Ltd. | 17,436 | 16,384 | |
| Adelaide Brighton Ltd. | 7,189 | 34,684 | |
| Amcor Ltd. | 15,195 | 156,584 | |
| Beacon Lighting Group Ltd. | 15,420 | 17,078 | |
| Commonwealth Bank of Australia | 12,417 | 668,586 | |
| CSL Ltd. | 10,391 | 1,330,973 | |
| DuluxGroup Ltd. | 9,393 | 54,612 | |
| Imdex Ltd. (a) | 41,011 | 38,243 | |
| Insurance Australia Group Ltd. | 47,430 | 280,782 | |
| Macquarie Group Ltd. | 3,880 | 315,980 | |
| Magellan Financial Group Ltd. | 7,387 | 129,054 | |
| TOTAL AUSTRALIA | 3,042,960 | ||
| Austria - 0.7% | |||
| Andritz AG | 8,972 | 482,789 | |
| Erste Group Bank AG | 7,800 | 382,423 | |
| TOTAL AUSTRIA | 865,212 | ||
| Bailiwick of Jersey - 0.2% | |||
| Integrated Diagnostics Holdings PLC | 7,500 | 35,625 | |
| Wolseley PLC | 3,248 | 249,511 | |
| TOTAL BAILIWICK OF JERSEY | 285,136 | ||
| Belgium - 1.4% | |||
| Anheuser-Busch InBev SA NV | 5,771 | 576,481 | |
| KBC Ancora | 1,311 | 79,554 | |
| KBC Groep NV | 10,652 | 931,307 | |
| Umicore SA | 3,228 | 180,328 | |
| TOTAL BELGIUM | 1,767,670 | ||
| Bermuda - 0.3% | |||
| Credicorp Ltd. (United States) | 1,212 | 281,778 | |
| Vostok New Ventures Ltd. (depositary receipt) (a) | 3,860 | 32,355 | |
| TOTAL BERMUDA | 314,133 | ||
| Brazil - 1.7% | |||
| BM&F BOVESPA SA | 36,500 | 263,602 | |
| BTG Pactual Participations Ltd. unit | 25,500 | 162,905 | |
| CVC Brasil Operadora e Agencia de Viagens SA | 11,400 | 188,709 | |
| Equatorial Energia SA | 9,500 | 192,945 | |
| Hapvida Participacoes e Investimentos SA | 22,100 | 174,431 | |
| IRB Brasil Resseguros SA | 13,800 | 186,327 | |
| Itau Unibanco Holding SA | 4,000 | 50,354 | |
| Itausa-Investimentos Itau SA | 1,756 | 6,767 | |
| Localiza Rent A Car SA | 23,200 | 184,702 | |
| Lojas Renner SA | 21,400 | 199,205 | |
| Notre Dame Intermedica Participacoes SA | 34,500 | 200,902 | |
| Suzano Papel e Celulose SA | 19,500 | 228,554 | |
| TOTAL BRAZIL | 2,039,403 | ||
| Canada - 4.7% | |||
| Alimentation Couche-Tard, Inc. Class B (sub. vtg.) | 15,722 | 679,721 | |
| Canadian National Railway Co. | 9,263 | 715,458 | |
| Canadian Pacific Railway Ltd. | 3,653 | 666,556 | |
| CCL Industries, Inc. Class B | 12,290 | 596,146 | |
| Constellation Software, Inc. | 957 | 683,961 | |
| Franco-Nevada Corp. | 8,859 | 628,365 | |
| McCoy Global, Inc. (a) | 7,100 | 7,078 | |
| New Look Vision Group, Inc. | 1,300 | 32,906 | |
| Nutrien Ltd. | 15,765 | 717,679 | |
| Pason Systems, Inc. | 20,491 | 286,470 | |
| PrairieSky Royalty Ltd. | 14,273 | 316,486 | |
| ShawCor Ltd. Class A | 800 | 15,477 | |
| Suncor Energy, Inc. | 13,500 | 516,258 | |
| TOTAL CANADA | 5,862,561 | ||
| Cayman Islands - 4.5% | |||
| 58.com, Inc. ADR (a) | 4,900 | 428,211 | |
| Alibaba Group Holding Ltd. sponsored ADR (a) | 10,982 | 1,960,737 | |
| JD.com, Inc. sponsored ADR (a) | 8,800 | 321,288 | |
| Melco Crown Entertainment Ltd. sponsored ADR | 6,200 | 193,502 | |
| New Oriental Education & Technology Group, Inc. sponsored ADR | 2,660 | 238,974 | |
| Ping An Healthcare and Technology Co. Ltd. (a) | 2,700 | 18,852 | |
| Sands China Ltd. | 32,000 | 184,940 | |
| Shenzhou International Group Holdings Ltd. | 22,000 | 240,157 | |
| Tencent Holdings Ltd. | 39,500 | 1,941,936 | |
| Value Partners Group Ltd. | 20,000 | 18,918 | |
| TOTAL CAYMAN ISLANDS | 5,547,515 | ||
| Chile - 0.2% | |||
| Banco Santander Chile sponsored ADR | 6,100 | 201,483 | |
| China - 2.1% | |||
| China International Travel Service Corp. Ltd. (A Shares) | 20,500 | 167,592 | |
| China Merchants Bank Co. Ltd. (H Shares) | 63,500 | 276,885 | |
| Dong E-E-Jiao Co. Ltd. Class A | 17,500 | 162,863 | |
| Gree Electric Appliances, Inc. of Zhuhai Class A | 23,000 | 159,514 | |
| Hangzhou Hikvision Digital Technology Co. Ltd. Class A | 27,100 | 164,142 | |
| Inner Mongoli Yili Industries Co. Ltd. (A Shares) | 41,082 | 170,097 | |
| Jiangsu Yanghe Brewery Joint-Stock Co. Ltd. Class A | 10,100 | 177,966 | |
| Kweichow Moutai Co. Ltd. (A Shares) | 1,594 | 165,982 | |
| Midea Group Co. Ltd. Class A | 21,100 | 171,555 | |
| Ping An Insurance (Group) Co. of China Ltd. (H Shares) | 49,000 | 478,799 | |
| Shanghai International Airport Co. Ltd. (A Shares) | 23,900 | 187,714 | |
| Shenzhen Inovance Technology Co. Ltd. Class A | 37,000 | 191,469 | |
| Yunnan Baiyao Group Co. Ltd. | 11,700 | 174,723 | |
| TOTAL CHINA | 2,649,301 | ||
| Denmark - 0.5% | |||
| Jyske Bank A/S (Reg.) | 4,854 | 291,805 | |
| Novo Nordisk A/S Series B sponsored ADR | 5,100 | 239,394 | |
| Scandinavian Tobacco Group A/S (b) | 1,550 | 25,927 | |
| SimCorp A/S | 400 | 29,123 | |
| Spar Nord Bank A/S | 4,231 | 48,484 | |
| TOTAL DENMARK | 634,733 | ||
| Finland - 0.4% | |||
| Sampo Oyj (A Shares) | 6,653 | 359,529 | |
| Tikkurila Oyj | 7,680 | 138,930 | |
| TOTAL FINLAND | 498,459 | ||
| France - 6.6% | |||
| Accor SA | 3,800 | 215,081 | |
| Atos Origin SA | 2,936 | 396,743 | |
| AXA SA (c) | 22,006 | 629,342 | |
| Bouygues SA | 5,303 | 270,565 | |
| Capgemini SA | 2,602 | 358,208 | |
| Compagnie de St. Gobain | 3,900 | 204,846 | |
| Edenred SA | 6,900 | 237,475 | |
| Elis SA | 10,751 | 257,321 | |
| Kering SA | 300 | 173,749 | |
| Laurent-Perrier Group SA | 259 | 32,684 | |
| Legrand SA | 3,600 | 280,405 | |
| LVMH Moet Hennessy - Louis Vuitton SA (c) | 566 | 196,975 | |
| Natixis SA | 42,900 | 352,903 | |
| Pernod Ricard SA | 1,100 | 182,716 | |
| Rubis | 2,400 | 186,936 | |
| Safran SA | 3,500 | 410,516 | |
| Sanofi SA | 8,336 | 659,064 | |
| Societe Generale Series A | 11,100 | 607,490 | |
| SR Teleperformance SA | 1,900 | 304,931 | |
| Total SA (c) | 19,344 | 1,215,804 | |
| Vetoquinol SA | 600 | 38,112 | |
| VINCI SA | 5,300 | 529,914 | |
| Virbac SA (a) | 170 | 26,524 | |
| Vivendi SA | 12,552 | 331,804 | |
| TOTAL FRANCE | 8,100,108 | ||
| Germany - 5.3% | |||
| adidas AG | 734 | 180,733 | |
| BASF AG | 6,995 | 727,784 | |
| Bayer AG | 5,700 | 681,262 | |
| Brenntag AG | 3,500 | 200,848 | |
| CompuGroup Medical AG | 2,146 | 112,057 | |
| CTS Eventim AG | 2,012 | 94,369 | |
| Deutsche Post AG | 6,277 | 272,450 | |
| Deutsche Telekom AG | 28,800 | 504,104 | |
| Fielmann AG | 358 | 29,441 | |
| Fresenius SE & Co. KGaA | 2,100 | 160,628 | |
| Hannover Reuck SE | 2,500 | 352,015 | |
| HeidelbergCement Finance AG | 2,000 | 196,259 | |
| Linde AG | 3,000 | 666,776 | |
| MTU Aero Engines Holdings AG | 1,200 | 207,224 | |
| Nexus AG | 1,420 | 47,500 | |
| SAP SE | 13,268 | 1,474,150 | |
| Vonovia SE | 8,665 | 435,401 | |
| WashTec AG | 400 | 38,595 | |
| Wirecard AG | 1,500 | 204,869 | |
| TOTAL GERMANY | 6,586,465 | ||
| Greece - 0.0% | |||
| Motor Oil (HELLAS) Corinth Refineries SA | 900 | 21,498 | |
| Hong Kong - 1.6% | |||
| AIA Group Ltd. | 158,400 | 1,415,652 | |
| CSPC Pharmaceutical Group Ltd. | 96,000 | 244,518 | |
| Galaxy Entertainment Group Ltd. | 21,000 | 183,805 | |
| Techtronic Industries Co. Ltd. | 30,000 | 175,746 | |
| TOTAL HONG KONG | 2,019,721 | ||
| Hungary - 0.2% | |||
| OTP Bank PLC | 5,300 | 231,554 | |
| India - 3.6% | |||
| Adani Ports & Special Economic Zone Ltd. | 35,777 | 218,851 | |
| Asian Paints Ltd. | 11,557 | 208,544 | |
| Eicher Motors Ltd. | 451 | 210,719 | |
| Godrej Consumer Products Ltd. | 11,927 | 199,863 | |
| HDFC Bank Ltd. | 5,849 | 176,288 | |
| Hero Motocorp Ltd. | 3,589 | 201,046 | |
| Housing Development Finance Corp. Ltd. | 31,556 | 892,815 | |
| Indraprastha Gas Ltd. | 38,447 | 165,817 | |
| IndusInd Bank Ltd. | 6,813 | 193,802 | |
| Jyothy Laboratories Ltd. | 2,614 | 14,241 | |
| Kotak Mahindra Bank Ltd. (a) | 10,824 | 196,822 | |
| Larsen & Toubro Ltd. | 11,829 | 248,665 | |
| LIC Housing Finance Ltd. | 22,434 | 183,673 | |
| Maruti Suzuki India Ltd. | 1,978 | 261,497 | |
| Motherson Sumi Systems Ltd. | 37,292 | 197,584 | |
| PC Jeweller Ltd. | 12,069 | 26,129 | |
| Pidilite Industries Ltd. (a) | 11,106 | 181,112 | |
| Reliance Industries Ltd. | 30,239 | 436,603 | |
| Ultratech Cemco Ltd. | 3,130 | 192,974 | |
| TOTAL INDIA | 4,407,045 | ||
| Indonesia - 0.5% | |||
| PT Bank Central Asia Tbk | 162,100 | 256,326 | |
| PT Bank Rakyat Indonesia Tbk | 1,586,800 | 365,866 | |
| TOTAL INDONESIA | 622,192 | ||
| Ireland - 1.5% | |||
| Accenture PLC Class A | 1,200 | 181,440 | |
| Allergan PLC | 500 | 76,825 | |
| CRH PLC | 7,087 | 251,669 | |
| CRH PLC sponsored ADR | 20,929 | 740,049 | |
| FBD Holdings PLC | 1,972 | 27,981 | |
| James Hardie Industries PLC CDI | 34,139 | 602,876 | |
| TOTAL IRELAND | 1,880,840 | ||
| Isle of Man - 0.2% | |||
| Playtech Ltd. | 22,130 | 246,960 | |
| Israel - 0.3% | |||
| Azrieli Group | 282 | 12,937 | |
| Frutarom Industries Ltd. | 1,800 | 172,800 | |
| Ituran Location & Control Ltd. | 2,261 | 70,882 | |
| Strauss Group Ltd. | 2,659 | 54,843 | |
| TOTAL ISRAEL | 311,462 | ||
| Italy - 1.3% | |||
| Assicurazioni Generali SpA | 14,600 | 295,142 | |
| Azimut Holding SpA | 1,114 | 23,448 | |
| Beni Stabili SpA SIIQ | 34,326 | 32,519 | |
| Interpump Group SpA | 12,891 | 410,662 | |
| Intesa Sanpaolo SpA | 155,600 | 591,896 | |
| Mediobanca SpA | 21,802 | 264,992 | |
| TOTAL ITALY | 1,618,659 | ||
| Japan - 14.0% | |||
| AEON Financial Service Co. Ltd. | 6,900 | 161,959 | |
| Ai Holdings Corp. | 1,100 | 29,452 | |
| Aoki Super Co. Ltd. | 2,000 | 23,838 | |
| Artnature, Inc. | 3,200 | 21,954 | |
| Asahi Co. Ltd. | 1,100 | 13,503 | |
| Aucnet, Inc. | 1,200 | 15,576 | |
| Azbil Corp. | 4,900 | 228,595 | |
| Broadleaf Co. Ltd. | 5,800 | 27,695 | |
| Central Automotive Products Ltd. | 2,400 | 37,431 | |
| Coca-Cola West Co. Ltd. | 800 | 34,468 | |
| Daiichikosho Co. Ltd. | 1,400 | 73,637 | |
| Daikin Industries Ltd. | 1,500 | 175,700 | |
| Daikokutenbussan Co. Ltd. | 1,000 | 51,683 | |
| DENSO Corp. | 7,800 | 410,692 | |
| East Japan Railway Co. | 6,500 | 623,719 | |
| Fanuc Corp. | 1,800 | 385,579 | |
| Funai Soken Holdings, Inc. | 1,950 | 45,700 | |
| GCA Savvian Group Corp. | 3,100 | 27,535 | |
| Goldcrest Co. Ltd. | 2,960 | 63,007 | |
| Honda Motor Co. Ltd. | 18,500 | 636,140 | |
| Hoya Corp. | 9,300 | 498,688 | |
| Idemitsu Kosan Co. Ltd. | 4,500 | 176,386 | |
| Itochu Corp. | 25,300 | 507,759 | |
| Japan Tobacco, Inc. | 8,120 | 218,115 | |
| Kao Corp. | 3,700 | 265,857 | |
| Keyence Corp. | 2,342 | 1,434,721 | |
| Kobayashi Pharmaceutical Co. Ltd. | 1,000 | 84,431 | |
| Komatsu Ltd. | 14,300 | 487,469 | |
| Koshidaka Holdings Co. Ltd. | 1,100 | 66,813 | |
| Kusuri No Aoki Holdings Co. Ltd. | 500 | 34,349 | |
| Lasertec Corp. | 2,600 | 86,809 | |
| Makita Corp. | 6,100 | 274,533 | |
| Medikit Co. Ltd. | 600 | 32,986 | |
| Miroku Jyoho Service Co., Ltd. | 900 | 25,686 | |
| Misumi Group, Inc. | 25,800 | 715,093 | |
| Mitsubishi UFJ Financial Group, Inc. | 109,800 | 735,808 | |
| Mitsuboshi Belting Ltd. | 2,000 | 22,887 | |
| Mitsui Fudosan Co. Ltd. | 11,100 | 285,471 | |
| Nabtesco Corp. | 7,300 | 264,101 | |
| Nagaileben Co. Ltd. | 2,900 | 76,851 | |
| Nakano Refrigerators Co. Ltd. | 700 | 32,913 | |
| ND Software Co. Ltd. | 1,300 | 12,260 | |
| Nihon Parkerizing Co. Ltd. | 7,100 | 112,683 | |
| Nintendo Co. Ltd. | 1,100 | 462,194 | |
| Nomura Holdings, Inc. | 46,200 | 266,091 | |
| NS Tool Co. Ltd. | 1,000 | 27,259 | |
| OBIC Co. Ltd. | 5,600 | 469,740 | |
| Olympus Corp. | 4,800 | 179,363 | |
| Oracle Corp. Japan | 2,400 | 197,585 | |
| ORIX Corp. | 25,900 | 455,832 | |
| OSG Corp. | 15,700 | 348,697 | |
| Panasonic Corp. | 19,000 | 281,336 | |
| Paramount Bed Holdings Co. Ltd. | 1,800 | 89,572 | |
| ProNexus, Inc. | 2,900 | 37,563 | |
| Recruit Holdings Co. Ltd. | 10,100 | 233,468 | |
| San-Ai Oil Co. Ltd. | 4,500 | 70,966 | |
| Shin-Etsu Chemical Co. Ltd. | 3,300 | 332,204 | |
| Shinsei Bank Ltd. | 13,500 | 210,922 | |
| SHO-BOND Holdings Co. Ltd. | 5,240 | 396,883 | |
| Shoei Co. Ltd. | 2,000 | 74,369 | |
| SK Kaken Co. Ltd. | 100 | 10,199 | |
| SoftBank Corp. | 4,100 | 313,276 | |
| Software Service, Inc. | 500 | 35,172 | |
| Sony Corp. | 5,100 | 238,201 | |
| Sony Financial Holdings, Inc. | 14,300 | 261,486 | |
| Subaru Corp. | 8,100 | 272,593 | |
| Sumitomo Mitsui Financial Group, Inc. | 11,300 | 470,964 | |
| T&D Holdings, Inc. | 15,800 | 268,681 | |
| Taiheiyo Cement Corp. | 5,100 | 193,373 | |
| Techno Medica Co. Ltd. | 500 | 9,559 | |
| The Monogatari Corp. | 280 | 30,531 | |
| TKC Corp. | 1,000 | 40,020 | |
| Tocalo Co. Ltd. | 1,200 | 14,962 | |
| Tokio Marine Holdings, Inc. | 8,600 | 406,872 | |
| USS Co. Ltd. | 38,400 | 808,255 | |
| Welcia Holdings Co. Ltd. | 1,200 | 61,800 | |
| Workman Co. Ltd. | 1,300 | 51,848 | |
| Yamada Consulting Group Co. Ltd. | 1,900 | 54,052 | |
| Yamato Kogyo Co. Ltd. | 800 | 23,783 | |
| TOTAL JAPAN | 17,240,203 | ||
| Kenya - 0.4% | |||
| Safaricom Ltd. | 1,588,700 | 447,465 | |
| Korea (South) - 2.3% | |||
| BGF Retail Co. Ltd. | 1,146 | 204,390 | |
| Leeno Industrial, Inc. | 264 | 14,125 | |
| LG Chemical Ltd. | 810 | 272,288 | |
| LG Household & Health Care Ltd. | 225 | 287,835 | |
| NAVER Corp. | 237 | 158,454 | |
| Samsung Electronics Co. Ltd. | 759 | 1,880,802 | |
| TOTAL KOREA (SOUTH) | 2,817,894 | ||
| Mexico - 1.2% | |||
| Consorcio ARA S.A.B. de CV | 41,655 | 15,725 | |
| Embotelladoras Arca S.A.B. de CV | 27,400 | 189,376 | |
| Fomento Economico Mexicano S.A.B. de CV: | |||
| unit | 29,000 | 280,323 | |
| sponsored ADR | 1,833 | 177,178 | |
| Grupo Aeroportuario del Pacifico S.A.B. de CV Series B | 19,500 | 202,840 | |
| Grupo Aeroportuario del Sureste S.A.B. de CV Series B | 11,110 | 199,798 | |
| Grupo Mexico SA de CV Series B | 54,300 | 180,506 | |
| Wal-Mart de Mexico SA de CV Series V | 79,600 | 221,196 | |
| TOTAL MEXICO | 1,466,942 | ||
| Netherlands - 2.1% | |||
| Aalberts Industries NV | 1,700 | 83,841 | |
| ASML Holding NV (Netherlands) | 5,600 | 1,065,103 | |
| ING Groep NV (Certificaten Van Aandelen) | 31,076 | 523,647 | |
| Koninklijke Philips Electronics NV | 5,100 | 215,864 | |
| RELX NV | 10,125 | 215,378 | |
| Takeaway.com Holding BV (a)(b) | 600 | 34,924 | |
| VastNed Retail NV | 596 | 29,833 | |
| Wolters Kluwer NV | 5,100 | 276,097 | |
| Yandex NV Series A (a) | 5,197 | 173,372 | |
| TOTAL NETHERLANDS | 2,618,059 | ||
| New Zealand - 0.1% | |||
| Auckland International Airport Ltd. | 28,018 | 125,772 | |
| Norway - 0.6% | |||
| Kongsberg Gruppen ASA | 1,900 | 46,657 | |
| Schibsted ASA (B Shares) | 5,321 | 143,268 | |
| Skandiabanken ASA (b) | 3,000 | 27,112 | |
| Statoil ASA | 21,785 | 557,101 | |
| TOTAL NORWAY | 774,138 | ||
| Philippines - 0.7% | |||
| Ayala Corp. | 10,810 | 201,384 | |
| Ayala Land, Inc. | 262,000 | 206,192 | |
| Jollibee Food Corp. | 7,250 | 39,904 | |
| SM Investments Corp. | 11,620 | 210,446 | |
| SM Prime Holdings, Inc. | 314,700 | 207,707 | |
| TOTAL PHILIPPINES | 865,633 | ||
| Portugal - 0.2% | |||
| Galp Energia SGPS SA Class B | 13,658 | 262,492 | |
| Russia - 0.3% | |||
| Sberbank of Russia | 116,230 | 414,301 | |
| South Africa - 2.4% | |||
| Capitec Bank Holdings Ltd. | 2,824 | 201,052 | |
| Clicks Group Ltd. | 23,630 | 404,000 | |
| Discovery Ltd. | 13,922 | 193,305 | |
| FirstRand Ltd. | 52,950 | 283,575 | |
| Mondi Ltd. | 6,814 | 198,797 | |
| Naspers Ltd. Class N | 5,918 | 1,441,741 | |
| Sanlam Ltd. | 34,626 | 218,733 | |
| TOTAL SOUTH AFRICA | 2,941,203 | ||
| Spain - 2.6% | |||
| Amadeus IT Holding SA Class A | 12,400 | 908,936 | |
| Banco Bilbao Vizcaya Argentaria SA | 18,100 | 146,466 | |
| Banco Santander SA (Spain) | 142,726 | 926,068 | |
| CaixaBank SA | 71,306 | 346,752 | |
| Hispania Activos Inmobiliarios SA | 8,395 | 178,425 | |
| Masmovil Ibercom SA (a) | 821 | 118,576 | |
| Merlin Properties Socimi SA | 10,300 | 159,210 | |
| Prosegur Compania de Seguridad SA (Reg.) | 39,976 | 303,167 | |
| Unicaja Banco SA | 84,700 | 153,528 | |
| TOTAL SPAIN | 3,241,128 | ||
| Sweden - 2.9% | |||
| Addlife AB | 1,000 | 20,956 | |
| AddTech AB (B Shares) | 3,000 | 62,558 | |
| Alfa Laval AB | 9,000 | 223,750 | |
| ASSA ABLOY AB (B Shares) | 37,700 | 793,036 | |
| Atlas Copco AB (A Shares) | 15,800 | 620,874 | |
| Fagerhult AB | 21,125 | 215,914 | |
| Investor AB (B Shares) | 6,067 | 265,429 | |
| Lagercrantz Group AB (B Shares) | 4,600 | 43,286 | |
| Loomis AB (B Shares) | 4,200 | 153,579 | |
| Nordea Bank AB | 47,667 | 486,542 | |
| Saab AB (B Shares) | 1,300 | 53,371 | |
| Svenska Handelsbanken AB (A Shares) | 23,145 | 258,119 | |
| Swedbank AB (A Shares) | 15,300 | 333,636 | |
| TOTAL SWEDEN | 3,531,050 | ||
| Switzerland - 4.9% | |||
| Credit Suisse Group AG | 24,558 | 414,201 | |
| Lafargeholcim Ltd. (Reg.) | 3,990 | 222,892 | |
| Nestle SA (Reg. S) | 21,158 | 1,639,112 | |
| Novartis AG | 14,049 | 1,081,412 | |
| Roche Holding AG (participation certificate) | 4,364 | 969,626 | |
| Schindler Holding AG: | |||
| (participation certificate) | 1,564 | 324,479 | |
| (Reg.) | 324 | 65,094 | |
| Sika AG | 20 | 145,913 | |
| Tecan Group AG | 210 | 46,408 | |
| UBS Group AG | 37,089 | 623,095 | |
| Zurich Insurance Group AG | 1,602 | 511,736 | |
| TOTAL SWITZERLAND | 6,043,968 | ||
| Taiwan - 1.4% | |||
| Addcn Technology Co. Ltd. | 3,772 | 32,607 | |
| Taiwan Semiconductor Manufacturing Co. Ltd. | 223,035 | 1,695,925 | |
| TOTAL TAIWAN | 1,728,532 | ||
| Thailand - 0.4% | |||
| Airports of Thailand PCL (For. Reg.) | 108,700 | 244,507 | |
| C.P. ALL PCL (For. Reg.) | 97,400 | 267,899 | |
| TOTAL THAILAND | 512,406 | ||
| Turkey - 0.5% | |||
| Tofas Turk Otomobil Fabrikasi A/S | 23,988 | 147,751 | |
| Tupras Turkiye Petrol Rafinerileri A/S | 11,000 | 280,274 | |
| Turkcell Iletisim Hizmet A/S | 55,000 | 189,016 | |
| TOTAL TURKEY | 617,041 | ||
| United Arab Emirates - 0.2% | |||
| DP World Ltd. | 8,675 | 193,019 | |
| United Kingdom - 9.9% | |||
| Alliance Pharma PLC | 18,714 | 20,868 | |
| Ascential PLC | 10,612 | 61,565 | |
| AstraZeneca PLC (United Kingdom) | 6,068 | 424,774 | |
| Aviva PLC | 61,683 | 448,168 | |
| Avon Rubber PLC | 1,500 | 27,775 | |
| BAE Systems PLC | 76,202 | 639,352 | |
| BHP Billiton PLC | 24,140 | 514,723 | |
| BP PLC | 125,375 | 931,281 | |
| British American Tobacco PLC (United Kingdom) | 19,012 | 1,042,761 | |
| Bunzl PLC | 8,846 | 257,084 | |
| Cineworld Group PLC | 7,700 | 27,604 | |
| Compass Group PLC | 10,448 | 224,387 | |
| Dechra Pharmaceuticals PLC | 4,100 | 154,771 | |
| DP Poland PLC (a) | 40,100 | 16,838 | |
| Elementis PLC | 44,408 | 173,383 | |
| GlaxoSmithKline PLC | 12,475 | 250,213 | |
| Great Portland Estates PLC | 5,506 | 52,864 | |
| Hilton Food Group PLC | 2,654 | 32,372 | |
| Howden Joinery Group PLC | 4,500 | 29,532 | |
| HSBC Holdings PLC sponsored ADR | 8,131 | 408,664 | |
| Imperial Tobacco Group PLC | 9,638 | 345,582 | |
| Informa PLC | 81,957 | 833,815 | |
| InterContinental Hotel Group PLC ADR | 9,091 | 578,551 | |
| ITE Group PLC | 17,600 | 36,829 | |
| Liberty Global PLC Class A (a) | 6,300 | 189,882 | |
| Melrose Industries PLC | 52,773 | 165,648 | |
| Micro Focus International PLC | 8,658 | 149,291 | |
| NMC Health PLC | 3,662 | 179,880 | |
| Prudential PLC | 38,892 | 1,000,071 | |
| Reckitt Benckiser Group PLC | 5,551 | 435,465 | |
| Rightmove PLC | 2,400 | 150,831 | |
| Royal Dutch Shell PLC Class B sponsored ADR | 11,000 | 796,620 | |
| Shaftesbury PLC | 13,137 | 182,847 | |
| Spectris PLC | 10,070 | 372,925 | |
| Spirax-Sarco Engineering PLC | 1,899 | 150,717 | |
| Standard Chartered PLC (United Kingdom) | 31,309 | 330,601 | |
| Standard Life PLC | 64,324 | 323,491 | |
| The Weir Group PLC | 7,800 | 229,369 | |
| Topps Tiles PLC | 19,600 | 18,618 | |
| Ultra Electronics Holdings PLC | 2,001 | 38,787 | |
| TOTAL UNITED KINGDOM | 12,248,799 | ||
| United States of America - 8.4% | |||
| A.O. Smith Corp. | 2,762 | 169,449 | |
| Alphabet, Inc. Class A (a) | 771 | 785,325 | |
| Amgen, Inc. | 1,100 | 191,928 | |
| Amphenol Corp. Class A | 2,040 | 170,768 | |
| Autoliv, Inc. | 3,474 | 465,690 | |
| Berkshire Hathaway, Inc. Class B (a) | 2,416 | 468,052 | |
| Black Knight, Inc. (a) | 2,100 | 102,165 | |
| ConocoPhillips Co. | 4,500 | 294,750 | |
| Facebook, Inc. Class A (a) | 1,000 | 172,000 | |
| Hilton Worldwide Holdings, Inc. | 2,100 | 165,564 | |
| Martin Marietta Materials, Inc. | 1,930 | 375,906 | |
| MasterCard, Inc. Class A | 6,253 | 1,114,722 | |
| Mettler-Toledo International, Inc. (a) | 300 | 167,979 | |
| Mohawk Industries, Inc. (a) | 1,365 | 286,486 | |
| Moody's Corp. | 2,839 | 460,486 | |
| MSCI, Inc. | 3,951 | 591,978 | |
| NVIDIA Corp. | 800 | 179,920 | |
| PayPal Holdings, Inc. (a) | 4,400 | 328,284 | |
| Philip Morris International, Inc. | 5,300 | 434,600 | |
| PriceSmart, Inc. | 2,385 | 208,926 | |
| ResMed, Inc. | 4,610 | 436,290 | |
| S&P Global, Inc. | 4,201 | 792,309 | |
| Sherwin-Williams Co. | 1,500 | 551,490 | |
| Visa, Inc. Class A | 9,231 | 1,171,229 | |
| Yum China Holdings, Inc. | 6,600 | 282,216 | |
| TOTAL UNITED STATES OF AMERICA | 10,368,512 | ||
| TOTAL COMMON STOCKS | |||
| (Cost $103,674,967) | 118,543,611 | ||
| Nonconvertible Preferred Stocks - 1.5% | |||
| Brazil - 1.1% | |||
| Ambev SA sponsored ADR | 53,100 | 351,522 | |
| Itau Unibanco Holding SA | 48,270 | 702,858 | |
| Itausa-Investimentos Itau SA (PN) | 68,700 | 266,901 | |
| TOTAL BRAZIL | 1,321,281 | ||
| Germany - 0.3% | |||
| Porsche Automobil Holding SE (Germany) | 3,500 | 299,243 | |
| Sartorius AG (non-vtg.) | 630 | 97,229 | |
| TOTAL GERMANY | 396,472 | ||
| Spain - 0.1% | |||
| Grifols SA Class B | 8,100 | 166,960 | |
| TOTAL NONCONVERTIBLE PREFERRED STOCKS | |||
| (Cost $1,667,580) | 1,884,713 | ||
| Money Market Funds - 2.3% | |||
| Fidelity Cash Central Fund, 1.74% (d) | 2,080,643 | 2,081,059 | |
| Fidelity Securities Lending Cash Central Fund 1.74% (d)(e) | 824,105 | 824,187 | |
| TOTAL MONEY MARKET FUNDS | |||
| (Cost $2,905,246) | 2,905,246 | ||
| TOTAL INVESTMENT IN SECURITIES - 99.9% | |||
| (Cost $108,247,793) | 123,333,570 | ||
| NET OTHER ASSETS (LIABILITIES) - 0.1% | 74,171 | ||
| NET ASSETS - 100% | $123,407,741 |
Categorizations in the Schedule of Investments are based on country or territory of incorporation.
Legend
(a) Non-income producing
(b) Security exempt from registration under Rule 144A of the Securities Act of 1933. These securities may be resold in transactions exempt from registration, normally to qualified institutional buyers. At the end of the period, the value of these securities amounted to $87,963 or 0.1% of net assets.
(c) Security or a portion of the security is on loan at period end.
(d) Affiliated fund that is generally available only to investment companies and other accounts managed by Fidelity Investments. The rate quoted is the annualized seven-day yield of the fund at period end. A complete unaudited listing of the fund's holdings as of its most recent quarter end is available upon request. In addition, each Fidelity Central Fund's financial statements are available on the SEC's website or upon request.
(e) Investment made with cash collateral received from securities on loan.
Affiliated Central Funds
Information regarding fiscal year to date income earned by the Fund from investments in Fidelity Central Funds is as follows:
| Fund | Income earned |
| Fidelity Cash Central Fund | $13,811 |
| Fidelity Securities Lending Cash Central Fund | 4,991 |
| Total | $18,802 |
Amounts in the income column in the above table include any capital gain distributions from underlying funds, which are presented in the corresponding line-item in the Statement of Operations if applicable.
Investment Valuation
The following is a summary of the inputs used, as of April 30, 2018, involving the Fund's assets and liabilities carried at fair value. The inputs or methodology used for valuing securities may not be an indication of the risk associated with investing in those securities. For more information on valuation inputs, and their aggregation into the levels used below, please refer to the Investment Valuation section in the accompanying Notes to Financial Statements.
| Valuation Inputs at Reporting Date: | ||||
| Description | Total | Level 1 | Level 2 | Level 3 |
| Investments in Securities: | ||||
| Equities: | ||||
| Consumer Discretionary | $12,952,673 | $8,115,349 | $4,837,324 | $-- |
| Consumer Staples | 9,573,626 | 5,056,240 | 4,517,386 | -- |
| Energy | 6,185,544 | 3,044,755 | 3,140,789 | -- |
| Financials | 28,459,216 | 14,145,867 | 14,313,349 | -- |
| Health Care | 9,569,431 | 3,188,327 | 6,381,104 | -- |
| Industrials | 17,952,413 | 13,714,762 | 4,237,651 | -- |
| Information Technology | 21,582,545 | 15,662,300 | 5,920,245 | -- |
| Materials | 10,023,108 | 6,860,506 | 3,162,602 | -- |
| Real Estate | 1,846,413 | 1,432,514 | 413,899 | -- |
| Telecommunication Services | 1,737,657 | 920,277 | 817,380 | -- |
| Utilities | 545,698 | 379,881 | 165,817 | -- |
| Money Market Funds | 2,905,246 | 2,905,246 | -- | -- |
| Total Investments in Securities: | $123,333,570 | $75,426,024 | $47,907,546 | $-- |
The following is a summary of transfers between Level 1 and Level 2 for the period ended April 30, 2018. Transfers are assumed to have occurred at the beginning of the period, and are primarily attributable to the valuation techniques used for foreign equity securities, as discussed in the accompanying Notes to Financial Statements:
| Transfers | Total |
| Level 1 to Level 2 | $17,647,146 |
| Level 2 to Level 1 | $14,652,933 |
See accompanying notes which are an integral part of the financial statements.
Financial Statements
Statement of Assets and Liabilities
| April 30, 2018 (Unaudited) | ||
| Assets | ||
| Investment in securities, at value (including securities loaned of $790,441) — See accompanying schedule: Unaffiliated issuers (cost $105,342,547) | $120,428,324 | |
| Fidelity Central Funds (cost $2,905,246) | 2,905,246 | |
| Total Investment in Securities (cost $108,247,793) | $123,333,570 | |
| Cash | 34,369 | |
| Foreign currency held at value (cost $94,888) | 95,096 | |
| Receivable for investments sold | 419,733 | |
| Receivable for fund shares sold | 124,436 | |
| Dividends receivable | 879,578 | |
| Distributions receivable from Fidelity Central Funds | 4,287 | |
| Prepaid expenses | 57 | |
| Receivable from investment adviser for expense reductions | 14,725 | |
| Other receivables | 20,886 | |
| Total assets | 124,926,737 | |
| Liabilities | ||
| Payable for investments purchased | $324,866 | |
| Payable for fund shares redeemed | 117,530 | |
| Accrued management fee | 86,427 | |
| Distribution and service plan fees payable | 10,956 | |
| Other affiliated payables | 24,314 | |
| Other payables and accrued expenses | 130,754 | |
| Collateral on securities loaned | 824,149 | |
| Total liabilities | 1,518,996 | |
| Net Assets | $123,407,741 | |
| Net Assets consist of: | ||
| Paid in capital | $111,147,897 | |
| Undistributed net investment income | 552,973 | |
| Accumulated undistributed net realized gain (loss) on investments and foreign currency transactions | (3,319,994) | |
| Net unrealized appreciation (depreciation) on investments and assets and liabilities in foreign currencies | 15,026,865 | |
| Net Assets | $123,407,741 | |
| Calculation of Maximum Offering Price | ||
| Class A: | ||
| Net Asset Value and redemption price per share ($8,924,317 ÷ 966,239 shares) | $9.24 | |
| Maximum offering price per share (100/94.25 of $9.24) | $9.80 | |
| Class M: | ||
| Net Asset Value and redemption price per share ($15,163,646 ÷ 1,634,961 shares) | $9.27 | |
| Maximum offering price per share (100/96.50 of $9.27) | $9.61 | |
| Class C: | ||
| Net Asset Value and offering price per share ($3,254,365 ÷ 352,101 shares)(a) | $9.24 | |
| Total International Equity: | ||
| Net Asset Value, offering price and redemption price per share ($85,981,011 ÷ 9,281,532 shares) | $9.26 | |
| Class I: | ||
| Net Asset Value, offering price and redemption price per share ($9,716,529 ÷ 1,053,884 shares) | $9.22 | |
| Class Z: | ||
| Net Asset Value, offering price and redemption price per share ($367,873 ÷ 39,805 shares) | $9.24 |
(a) Redemption price per share is equal to net asset value less any applicable contingent deferred sales charge.
See accompanying notes which are an integral part of the financial statements.
Statement of Operations
| Six months ended April 30, 2018 (Unaudited) | ||
| Investment Income | ||
| Dividends | $1,479,305 | |
| Income from Fidelity Central Funds | 18,802 | |
| Income before foreign taxes withheld | 1,498,107 | |
| Less foreign taxes withheld | (143,321) | |
| Total income | 1,354,786 | |
| Expenses | ||
| Management fee | ||
| Basic fee | $424,732 | |
| Performance adjustment | 95,601 | |
| Transfer agent fees | 113,886 | |
| Distribution and service plan fees | 67,578 | |
| Accounting and security lending fees | 31,876 | |
| Custodian fees and expenses | 71,300 | |
| Independent trustees' fees and expenses | 241 | |
| Registration fees | 39,408 | |
| Audit | 49,680 | |
| Legal | 1,205 | |
| Miscellaneous | 419 | |
| Total expenses before reductions | 895,926 | |
| Expense reductions | (95,755) | 800,171 |
| Net investment income (loss) | 554,615 | |
| Realized and Unrealized Gain (Loss) | ||
| Net realized gain (loss) on: | ||
| Investment securities: | ||
| Unaffiliated issuers | 3,187,699 | |
| Fidelity Central Funds | 91 | |
| Foreign currency transactions | (7,315) | |
| Total net realized gain (loss) | 3,180,475 | |
| Change in net unrealized appreciation (depreciation) on: | ||
| Investment securities: | ||
| Unaffiliated issuers (net of decrease in deferred foreign taxes of $57,326) | (865,993) | |
| Assets and liabilities in foreign currencies | (4,986) | |
| Total change in net unrealized appreciation (depreciation) | (870,979) | |
| Net gain (loss) | 2,309,496 | |
| Net increase (decrease) in net assets resulting from operations | $2,864,111 |
See accompanying notes which are an integral part of the financial statements.
Statement of Changes in Net Assets
| Six months ended April 30, 2018 (Unaudited) | Year ended October 31, 2017 | |
| Increase (Decrease) in Net Assets | ||
| Operations | ||
| Net investment income (loss) | $554,615 | $2,786,915 |
| Net realized gain (loss) | 3,180,475 | 70,763,610 |
| Change in net unrealized appreciation (depreciation) | (870,979) | (21,931,310) |
| Net increase (decrease) in net assets resulting from operations | 2,864,111 | 51,619,215 |
| Distributions to shareholders from net investment income | (1,843,688) | (4,227,310) |
| Distributions to shareholders from net realized gain | (2,829,792) | – |
| Total distributions | (4,673,480) | (4,227,310) |
| Share transactions - net increase (decrease) | 7,720,597 | (237,908,011) |
| Redemption fees | 13 | 2,629 |
| Total increase (decrease) in net assets | 5,911,241 | (190,513,477) |
| Net Assets | ||
| Beginning of period | 117,496,500 | 308,009,977 |
| End of period | $123,407,741 | $117,496,500 |
| Other Information | ||
| Undistributed net investment income end of period | $552,973 | $1,842,046 |
See accompanying notes which are an integral part of the financial statements.
Financial Highlights
Fidelity Total International Equity Fund Class A
| Six months ended (Unaudited) April 30, | Years endedOctober 31, | |||||
| 2018 | 2017 | 2016 | 2015 | 2014 | 2013 | |
| Selected Per–Share Data | ||||||
| Net asset value, beginning of period | $9.39 | $7.67 | $7.79 | $8.00 | $8.27 | $7.31 |
| Income from Investment Operations | ||||||
| Net investment income (loss)A | .04 | .09 | .08 | .07 | .13 | .09 |
| Net realized and unrealized gain (loss) | .19 | 1.71 | (.14) | (.14) | (.12) | 1.24 |
| Total from investment operations | .23 | 1.80 | (.06) | (.07) | .01 | 1.33 |
| Distributions from net investment income | (.15) | (.08) | (.06) | (.10) | (.10) | (.13) |
| Distributions from net realized gain | (.23) | – | – | (.04) | (.18) | (.25) |
| Total distributions | (.38) | (.08) | (.06) | (.14) | (.28) | (.37)B |
| Redemption fees added to paid in capitalA,C | – | – | – | – | – | – |
| Net asset value, end of period | $9.24 | $9.39 | $7.67 | $7.79 | $8.00 | $8.27 |
| Total ReturnD,E,F | 2.50% | 23.78% | (.76)% | (.89)% | .19% | 19.00% |
| Ratios to Average Net AssetsG,H | ||||||
| Expenses before reductions | 1.64%I | 1.67% | 1.52% | 1.48% | 1.44% | 1.50% |
| Expenses net of fee waivers, if any | 1.45%I | 1.45% | 1.45% | 1.45% | 1.44% | 1.45% |
| Expenses net of all reductions | 1.44%I | 1.43% | 1.45% | 1.44% | 1.44% | 1.43% |
| Net investment income (loss) | .76%I | 1.02% | 1.10% | .86% | 1.63% | 1.21% |
| Supplemental Data | ||||||
| Net assets, end of period (000 omitted) | $8,924 | $9,292 | $8,576 | $9,163 | $9,164 | $9,034 |
| Portfolio turnover rateJ | 53%I | 66%K | 51% | 53% | 85% | 89% |
A Calculated based on average shares outstanding during the period.
B Total distributions of $.37 per share is comprised of distributions from net investment income of $.126 and distributions from net realized gain of $.245 per share.
C Amount represents less than $.005 per share.
D Total returns for periods of less than one year are not annualized.
E Total returns would have been lower if certain expenses had not been reduced during the applicable periods shown.
F Total returns do not include the effect of the sales charges.
G Fees and expenses of any underlying Fidelity Central Funds are not included in the Fund's expense ratio. The Fund indirectly bears its proportionate share of the expenses of any underlying Fidelity Central Funds.
H Expense ratios reflect operating expenses of the class. Expenses before reductions do not reflect amounts reimbursed by the investment adviser or reductions from brokerage service arrangements or reductions from other expense offset arrangements and do not represent the amount paid by the class during periods when reimbursements or reductions occur. Expenses net of fee waivers reflect expenses after reimbursement by the investment adviser but prior to reductions from brokerage service arrangements or other expense offset arrangements. Expenses net of all reductions represent the net expenses paid by the class.
I Annualized
J Amount does not include the portfolio activity of any underlying Fidelity Central Funds.
K Portfolio turnover rate excludes securities received or delivered in-kind.
See accompanying notes which are an integral part of the financial statements.
Fidelity Total International Equity Fund Class M
| Six months ended (Unaudited) April 30, | Years endedOctober 31, | |||||
| 2018 | 2017 | 2016 | 2015 | 2014 | 2013 | |
| Selected Per–Share Data | ||||||
| Net asset value, beginning of period | $9.42 | $7.70 | $7.81 | $8.04 | $8.32 | $7.37 |
| Income from Investment Operations | ||||||
| Net investment income (loss)A | .02 | .06 | .06 | .05 | .11 | .07 |
| Net realized and unrealized gain (loss) | .19 | 1.73 | (.13) | (.15) | (.12) | 1.25 |
| Total from investment operations | .21 | 1.79 | (.07) | (.10) | (.01) | 1.32 |
| Distributions from net investment income | (.13) | (.07) | (.04) | (.09) | (.09) | (.13) |
| Distributions from net realized gain | (.23) | – | – | (.04) | (.18) | (.25) |
| Total distributions | (.36) | (.07) | (.04) | (.13) | (.27) | (.37)B |
| Redemption fees added to paid in capitalA,C | – | – | – | – | – | – |
| Net asset value, end of period | $9.27 | $9.42 | $7.70 | $7.81 | $8.04 | $8.32 |
| Total ReturnD,E,F | 2.28% | 23.41% | (.86)% | (1.26)% | (.06)% | 18.73% |
| Ratios to Average Net AssetsG,H | ||||||
| Expenses before reductions | 1.88%I | 1.90% | 1.73% | 1.70% | 1.68% | 1.75% |
| Expenses net of fee waivers, if any | 1.70%I | 1.70% | 1.70% | 1.70% | 1.68% | 1.70% |
| Expenses net of all reductions | 1.69%I | 1.68% | 1.69% | 1.69% | 1.68% | 1.67% |
| Net investment income (loss) | .51%I | .77% | .85% | .61% | 1.38% | .96% |
| Supplemental Data | ||||||
| Net assets, end of period (000 omitted) | $15,164 | $15,894 | $13,893 | $13,962 | $10,282 | $7,909 |
| Portfolio turnover rateJ | 53%I | 66%K | 51% | 53% | 85% | 89% |
A Calculated based on average shares outstanding during the period.
B Total distributions of $.37 per share is comprised of distributions from net investment income of $.128 and distributions from net realized gain of $.245 per share.
C Amount represents less than $.005 per share.
D Total returns for periods of less than one year are not annualized.
E Total returns would have been lower if certain expenses had not been reduced during the applicable periods shown.
F Total returns do not include the effect of the sales charges.
G Fees and expenses of any underlying Fidelity Central Funds are not included in the Fund's expense ratio. The Fund indirectly bears its proportionate share of the expenses of any underlying Fidelity Central Funds.
H Expense ratios reflect operating expenses of the class. Expenses before reductions do not reflect amounts reimbursed by the investment adviser or reductions from brokerage service arrangements or reductions from other expense offset arrangements and do not represent the amount paid by the class during periods when reimbursements or reductions occur. Expenses net of fee waivers reflect expenses after reimbursement by the investment adviser but prior to reductions from brokerage service arrangements or other expense offset arrangements. Expenses net of all reductions represent the net expenses paid by the class.
I Annualized
J Amount does not include the portfolio activity of any underlying Fidelity Central Funds.
K Portfolio turnover rate excludes securities received or delivered in-kind.
See accompanying notes which are an integral part of the financial statements.
Fidelity Total International Equity Fund Class C
| Six months ended (Unaudited) April 30, | Years endedOctober 31, | |||||
| 2018 | 2017 | 2016 | 2015 | 2014 | 2013 | |
| Selected Per–Share Data | ||||||
| Net asset value, beginning of period | $9.37 | $7.66 | $7.77 | $8.00 | $8.28 | $7.31 |
| Income from Investment Operations | ||||||
| Net investment income (loss)A | –B | .02 | .03 | .01 | .07 | .04 |
| Net realized and unrealized gain (loss) | .19 | 1.71 | (.14) | (.15) | (.12) | 1.25 |
| Total from investment operations | .19 | 1.73 | (.11) | (.14) | (.05) | 1.29 |
| Distributions from net investment income | (.10) | (.02) | – | (.05) | (.05) | (.08) |
| Distributions from net realized gain | (.23) | – | – | (.04) | (.18) | (.25) |
| Total distributions | (.32)C | (.02) | – | (.09) | (.23) | (.32)D |
| Redemption fees added to paid in capitalA,B | – | – | – | – | – | – |
| Net asset value, end of period | $9.24 | $9.37 | $7.66 | $7.77 | $8.00 | $8.28 |
| Total ReturnE,F,G | 2.11% | 22.70% | (1.42)% | (1.73)% | (.57)% | 18.30% |
| Ratios to Average Net AssetsH,I | ||||||
| Expenses before reductions | 2.47%J | 2.48% | 2.30% | 2.26% | 2.22% | 2.26% |
| Expenses net of fee waivers, if any | 2.20%J | 2.20% | 2.20% | 2.20% | 2.20% | 2.20% |
| Expenses net of all reductions | 2.19%J | 2.18% | 2.20% | 2.19% | 2.20% | 2.18% |
| Net investment income (loss) | .01%J | .27% | .35% | .11% | .87% | .46% |
| Supplemental Data | ||||||
| Net assets, end of period (000 omitted) | $3,254 | $3,211 | $2,713 | $3,311 | $4,028 | $3,584 |
| Portfolio turnover rateK | 53%J | 66%L | 51% | 53% | 85% | 89% |
A Calculated based on average shares outstanding during the period.
B Amount represents less than $.005 per share.
C Total distributions of $.32 per share is comprised of distributions from net investment income of $.097 and distributions from net realized gain of $.226 per share.
D Total distributions of $.32 per share is comprised of distributions from net investment income of $.075 and distributions from net realized gain of $.245 per share.
E Total returns for periods of less than one year are not annualized.
F Total returns would have been lower if certain expenses had not been reduced during the applicable periods shown.
G Total returns do not include the effect of the contingent deferred sales charge.
H Fees and expenses of any underlying Fidelity Central Funds are not included in the Fund's expense ratio. The Fund indirectly bears its proportionate share of the expenses of any underlying Fidelity Central Funds.
I Expense ratios reflect operating expenses of the class. Expenses before reductions do not reflect amounts reimbursed by the investment adviser or reductions from brokerage service arrangements or reductions from other expense offset arrangements and do not represent the amount paid by the class during periods when reimbursements or reductions occur. Expenses net of fee waivers reflect expenses after reimbursement by the investment adviser but prior to reductions from brokerage service arrangements or other expense offset arrangements. Expenses net of all reductions represent the net expenses paid by the class.
J Annualized
K Amount does not include the portfolio activity of any underlying Fidelity Central Funds.
L Portfolio turnover rate excludes securities received or delivered in-kind.
See accompanying notes which are an integral part of the financial statements.
Fidelity Total International Equity Fund
| Six months ended (Unaudited) April 30, | Years endedOctober 31, | |||||
| 2018 | 2017 | 2016 | 2015 | 2014 | 2013 | |
| Selected Per–Share Data | ||||||
| Net asset value, beginning of period | $9.40 | $7.70 | $7.82 | $8.03 | $8.29 | $7.32 |
| Income from Investment Operations | ||||||
| Net investment income (loss)A | .05 | .11 | .11 | .10 | .16 | .12 |
| Net realized and unrealized gain (loss) | .19 | 1.70 | (.13) | (.14) | (.12) | 1.24 |
| Total from investment operations | .24 | 1.81 | (.02) | (.04) | .04 | 1.36 |
| Distributions from net investment income | (.15) | (.11) | (.10) | (.13) | (.12) | (.15) |
| Distributions from net realized gain | (.23) | – | – | (.04) | (.18) | (.25) |
| Total distributions | (.38) | (.11) | (.10) | (.17) | (.30) | (.39)B |
| Redemption fees added to paid in capitalA,C | – | – | – | – | – | – |
| Net asset value, end of period | $9.26 | $9.40 | $7.70 | $7.82 | $8.03 | $8.29 |
| Total ReturnD,E | 2.57% | 23.86% | (.32)% | (.51)% | .55% | 19.48% |
| Ratios to Average Net AssetsF,G | ||||||
| Expenses before reductions | 1.33%H | 1.15% | 1.11% | 1.07% | 1.04% | 1.09% |
| Expenses net of fee waivers, if any | 1.20%H | 1.14% | 1.11% | 1.07% | 1.04% | 1.09% |
| Expenses net of all reductions | 1.19%H | 1.13% | 1.10% | 1.06% | 1.04% | 1.07% |
| Net investment income (loss) | 1.01%H | 1.33% | 1.44% | 1.24% | 2.03% | 1.57% |
| Supplemental Data | ||||||
| Net assets, end of period (000 omitted) | $85,981 | $82,077 | $280,672 | $307,035 | $324,438 | $324,395 |
| Portfolio turnover rateI | 53%H | 66%J | 51% | 53% | 85% | 89% |
A Calculated based on average shares outstanding during the period.
B Total distributions of $.39 per share is comprised of distributions from net investment income of $.148 and distributions from net realized gain of $.245 per share.
C Amount represents less than $.005 per share.
D Total returns for periods of less than one year are not annualized.
E Total returns would have been lower if certain expenses had not been reduced during the applicable periods shown.
F Fees and expenses of any underlying Fidelity Central Funds are not included in the Fund's expense ratio. The Fund indirectly bears its proportionate share of the expenses of any underlying Fidelity Central Funds.
G Expense ratios reflect operating expenses of the class. Expenses before reductions do not reflect amounts reimbursed by the investment adviser or reductions from brokerage service arrangements or reductions from other expense offset arrangements and do not represent the amount paid by the class during periods when reimbursements or reductions occur. Expenses net of fee waivers reflect expenses after reimbursement by the investment adviser but prior to reductions from brokerage service arrangements or other expense offset arrangements. Expenses net of all reductions represent the net expenses paid by the class.
H Annualized
I Amount does not include the portfolio activity of any underlying Fidelity Central Funds.
J Portfolio turnover rate excludes securities received or delivered in-kind.
See accompanying notes which are an integral part of the financial statements.
Fidelity Total International Equity Fund Class I
| Six months ended (Unaudited) April 30, | Years endedOctober 31, | |||||
| 2018 | 2017 | 2016 | 2015 | 2014 | 2013 | |
| Selected Per–Share Data | ||||||
| Net asset value, beginning of period | $9.38 | $7.66 | $7.78 | $7.99 | $8.26 | $7.30 |
| Income from Investment Operations | ||||||
| Net investment income (loss)A | .05 | .11 | .10 | .09 | .15 | .11 |
| Net realized and unrealized gain (loss) | .19 | 1.71 | (.13) | (.14) | (.12) | 1.24 |
| Total from investment operations | .24 | 1.82 | (.03) | (.05) | .03 | 1.35 |
| Distributions from net investment income | (.17) | (.10) | (.09) | (.12) | (.12) | (.15) |
| Distributions from net realized gain | (.23) | – | – | (.04) | (.18) | (.25) |
| Total distributions | (.40) | (.10) | (.09) | (.16) | (.30) | (.39)B |
| Redemption fees added to paid in capitalA,C | – | – | – | – | – | – |
| Net asset value, end of period | $9.22 | $9.38 | $7.66 | $7.78 | $7.99 | $8.26 |
| Total ReturnD,E | 2.61% | 24.08% | (.43)% | (.64)% | .37% | 19.40% |
| Ratios to Average Net AssetsF,G | ||||||
| Expenses before reductions | 1.34%H | 1.42% | 1.22% | 1.17% | 1.15% | 1.21% |
| Expenses net of fee waivers, if any | 1.20%H | 1.20% | 1.20% | 1.17% | 1.15% | 1.20% |
| Expenses net of all reductions | 1.19%H | 1.18% | 1.20% | 1.16% | 1.15% | 1.18% |
| Net investment income (loss) | 1.01%H | 1.28% | 1.35% | 1.14% | 1.91% | 1.46% |
| Supplemental Data | ||||||
| Net assets, end of period (000 omitted) | $9,717 | $6,776 | $2,156 | $2,602 | $2,240 | $2,372 |
| Portfolio turnover rateI | 53%H | 66%J | 51% | 53% | 85% | 89% |
A Calculated based on average shares outstanding during the period.
B Total distributions of $.39 per share is comprised of distributions from net investment income of $.148 and distributions from net realized gain of $.245 per share.
C Amount represents less than $.005 per share.
D Total returns for periods of less than one year are not annualized.
E Total returns would have been lower if certain expenses had not been reduced during the applicable periods shown.
F Fees and expenses of any underlying Fidelity Central Funds are not included in the Fund's expense ratio. The Fund indirectly bears its proportionate share of the expenses of any underlying Fidelity Central Funds.
G Expense ratios reflect operating expenses of the class. Expenses before reductions do not reflect amounts reimbursed by the investment adviser or reductions from brokerage service arrangements or reductions from other expense offset arrangements and do not represent the amount paid by the class during periods when reimbursements or reductions occur. Expenses net of fee waivers reflect expenses after reimbursement by the investment adviser but prior to reductions from brokerage service arrangements or other expense offset arrangements. Expenses net of all reductions represent the net expenses paid by the class.
H Annualized
I Amount does not include the portfolio activity of any underlying Fidelity Central Funds.
J Portfolio turnover rate excludes securities received or delivered in-kind.
See accompanying notes which are an integral part of the financial statements.
Fidelity Total International Equity Fund Class Z
| Six months ended (Unaudited) April 30, | Years endedOctober 31, | |
| 2018 | 2017 A | |
| Selected Per–Share Data | ||
| Net asset value, beginning of period | $9.39 | $7.73 |
| Income from Investment Operations | ||
| Net investment income (loss)B | .05 | .08 |
| Net realized and unrealized gain (loss) | .20 | 1.58 |
| Total from investment operations | .25 | 1.66 |
| Distributions from net investment income | (.17) | – |
| Distributions from net realized gain | (.23) | – |
| Total distributions | (.40) | – |
| Redemption fees added to paid in capitalB,C | – | – |
| Net asset value, end of period | $9.24 | $9.39 |
| Total ReturnD,E | 2.71% | 21.47% |
| Ratios to Average Net AssetsF,G | ||
| Expenses before reductions | 1.21%H | 1.32%H |
| Expenses net of fee waivers, if any | 1.05%H | 1.05%H |
| Expenses net of all reductions | 1.04%H | 1.04%H |
| Net investment income (loss) | 1.16%H | 1.27%H |
| Supplemental Data | ||
| Net assets, end of period (000 omitted) | $368 | $246 |
| Portfolio turnover rateI | 53%H | 66%J |
A For the period February 1, 2017 (commencement of sale of shares) to October 31, 2017.
B Calculated based on average shares outstanding during the period.
C Amount represents less than $.005 per share.
D Total returns for periods of less than one year are not annualized.
E Total returns would have been lower if certain expenses had not been reduced during the applicable periods shown.
F Fees and expenses of any underlying Fidelity Central Funds are not included in the Fund's expense ratio. The Fund indirectly bears its proportionate share of the expenses of any underlying Fidelity Central Funds.
G Expense ratios reflect operating expenses of the class. Expenses before reductions do not reflect amounts reimbursed by the investment adviser or reductions from brokerage service arrangements or reductions from other expense offset arrangements and do not represent the amount paid by the class during periods when reimbursements or reductions occur. Expense ratios before reductions for start-up periods may not be representative of longer-term operating periods. Expenses net of fee waivers reflect expenses after reimbursement by the investment adviser but prior to reductions from brokerage service arrangements or other expense offset arrangements. Expenses net of all reductions represent the net expenses paid by the class.
H Annualized
I Amount does not include the portfolio activity of any underlying Fidelity Central Funds.
J Portfolio turnover rate excludes securities received or delivered in-kind.
See accompanying notes which are an integral part of the financial statements.
Notes to Financial Statements (Unaudited)
For the period ended April 30, 2018
1. Organization.
Fidelity Total International Equity Fund (the Fund) is a fund of Fidelity Investment Trust (the Trust) and is authorized to issue an unlimited number of shares. The Trust is registered under the Investment Company Act of 1940, as amended (the 1940 Act), as an open-end management investment company organized as a Massachusetts business trust. The Fund offers Class A, Class M, Class C, Total International Equity, Class I and Class Z shares, each of which has equal rights as to assets and voting privileges. Each class has exclusive voting rights with respect to matters that affect that class. The Fund's investments in emerging markets can be subject to social, economic, regulatory, and political uncertainties and can be extremely volatile.
2. Investments in Fidelity Central Funds.
The Fund invests in Fidelity Central Funds, which are open-end investment companies generally available only to other investment companies and accounts managed by the investment adviser and its affiliates. The Fund's Schedule of Investments lists each of the Fidelity Central Funds held as of period end, if any, as an investment of the Fund, but does not include the underlying holdings of each Fidelity Central Fund. As an Investing Fund, the Fund indirectly bears its proportionate share of the expenses of the underlying Fidelity Central Funds.
The Money Market Central Funds seek preservation of capital and current income and are managed by Fidelity Investments Money Management, Inc. (FIMM), an affiliate of the investment adviser. Annualized expenses of the Money Market Central Funds as of their most recent shareholder report date are less than .005%.
A complete unaudited list of holdings for each Fidelity Central Fund is available upon request or at the Securities and Exchange Commission (the SEC) website at www.sec.gov. In addition, the financial statements of the Fidelity Central Funds are available on the SEC website or upon request.
3. Significant Accounting Policies.
The Fund is an investment company and applies the accounting and reporting guidance of the Financial Accounting Standards Board (FASB) Accounting Standards Codification Topic 946 Financial Services – Investments Companies. The financial statements have been prepared in conformity with accounting principles generally accepted in the United States of America (GAAP), which require management to make certain estimates and assumptions at the date of the financial statements. Actual results could differ from those estimates. Subsequent events, if any, through the date that the financial statements were issued have been evaluated in the preparation of the financial statements. The following summarizes the significant accounting policies of the Fund:
Investment Valuation. Investments are valued as of 4:00 p.m. Eastern time on the last calendar day of the period. The Board of Trustees (the Board) has delegated the day to day responsibility for the valuation of the Fund's investments to the Fair Value Committee (the Committee) established by the Fund's investment adviser. In accordance with valuation policies and procedures approved by the Board, the Fund attempts to obtain prices from one or more third party pricing vendors or brokers to value its investments. When current market prices, quotations or currency exchange rates are not readily available or reliable, investments will be fair valued in good faith by the Committee, in accordance with procedures adopted by the Board. Factors used in determining fair value vary by investment type and may include market or investment specific events. The frequency with which these procedures are used cannot be predicted and they may be utilized to a significant extent. The Committee oversees the Fund's valuation policies and procedures and reports to the Board on the Committee's activities and fair value determinations. The Board monitors the appropriateness of the procedures used in valuing the Fund's investments and ratifies the fair value determinations of the Committee.
The Fund categorizes the inputs to valuation techniques used to value its investments into a disclosure hierarchy consisting of three levels as shown below:
- Level 1 – quoted prices in active markets for identical investments
- Level 2 – other significant observable inputs (including quoted prices for similar investments, interest rates, prepayment speeds, etc.)
- Level 3 – unobservable inputs (including the Fund's own assumptions based on the best information available)
Valuation techniques used to value the Fund's investments by major category are as follows:
Equity securities, including restricted securities, for which market quotations are readily available, are valued at the last reported sale price or official closing price as reported by a third party pricing vendor on the primary market or exchange on which they are traded and are categorized as Level 1 in the hierarchy. In the event there were no sales during the day or closing prices are not available, securities are valued at the last quoted bid price or may be valued using the last available price and are generally categorized as Level 2 in the hierarchy. For foreign equity securities, when market or security specific events arise, comparisons to the valuation of American Depositary Receipts (ADRs), futures contracts, Exchange-Traded Funds (ETFs) and certain indexes as well as quoted prices for similar securities may be used and would be categorized as Level 2 in the hierarchy. Utilizing these techniques may result in transfers between Level 1 and Level 2. For equity securities, including restricted securities, where observable inputs are limited, assumptions about market activity and risk are used and these securities may be categorized as Level 3 in the hierarchy.
Investments in open-end mutual funds, including the Fidelity Central Funds, are valued at their closing net asset value (NAV) each business day and are categorized as Level 1 in the hierarchy.
Changes in valuation techniques may result in transfers in or out of an assigned level within the disclosure hierarchy. The aggregate value of investments by input level as of April 30, 2018, including information on transfers between Levels 1 and 2, is included at the end of the Fund's Schedule of Investments.
Foreign Currency. The Fund may use foreign currency contracts to facilitate transactions in foreign-denominated securities. Gains and losses from these transactions may arise from changes in the value of the foreign currency or if the counterparties do not perform under the contracts' terms.
Foreign-denominated assets, including investment securities, and liabilities are translated into U.S. dollars at the exchange rates at period end. Purchases and sales of investment securities, income and dividends received and expenses denominated in foreign currencies are translated into U.S. dollars at the exchange rate in effect on the transaction date.
The effects of exchange rate fluctuations on investments are included with the net realized and unrealized gain (loss) on investment securities. Other foreign currency transactions resulting in realized and unrealized gain (loss) are disclosed separately.
Investment Transactions and Income. For financial reporting purposes, the Fund's investment holdings and NAV include trades executed through the end of the last business day of the period. The NAV per share for processing shareholder transactions is calculated as of the close of business of the New York Stock Exchange (NYSE), normally 4:00 p.m. Eastern time and includes trades executed through the end of the prior business day. Gains and losses on securities sold are determined on the basis of identified cost and includes proceeds received from litigation. Dividend income is recorded on the ex-dividend date, except for certain dividends from foreign securities where the ex-dividend date may have passed, which are recorded as soon as the Fund is informed of the ex-dividend date. Non-cash dividends included in dividend income, if any, are recorded at the fair market value of the securities received. Income and capital gain distributions from Fidelity Central Funds, if any, are recorded on the ex-dividend date. Certain distributions received by the Fund represent a return of capital or capital gain. The Fund determines the components of these distributions subsequent to the ex-dividend date, based upon receipt of tax filings or other correspondence relating to the underlying investment. These distributions are recorded as a reduction of cost of investments and/or as a realized gain. Investment income is recorded net of foreign taxes withheld where recovery of such taxes is uncertain.
Class Allocations and Expenses. Investment income, realized and unrealized capital gains and losses, common expenses of the Fund, and certain fund-level expense reductions, if any, are allocated daily on a pro-rata basis to each class based on the relative net assets of each class to the total net assets of the Fund. Each class differs with respect to transfer agent and distribution and service plan fees incurred. Certain expense reductions may also differ by class. For the reporting period, the allocated portion of income and expenses to each class as a percent of its average net assets may vary due to the timing of recording these transactions in relation to fluctuating net assets of the classes. Expenses directly attributable to a fund are charged to that fund. Expenses attributable to more than one fund are allocated among the respective funds on the basis of relative net assets or other appropriate methods. Expense estimates are accrued in the period to which they relate and adjustments are made when actual amounts are known.
Income Tax Information and Distributions to Shareholders. Each year, the Fund intends to qualify as a regulated investment company under Subchapter M of the Internal Revenue Code, including distributing substantially all of its taxable income and realized gains. As a result, no provision for U.S. Federal income taxes is required. The Fund files a U.S. federal tax return, in addition to state and local tax returns as required. The Fund's federal income tax returns are subject to examination by the Internal Revenue Service (IRS) for a period of three fiscal years after they are filed. State and local tax returns may be subject to examination for an additional fiscal year depending on the jurisdiction. Foreign taxes are provided for based on the Fund's understanding of the tax rules and rates that exist in the foreign markets in which it invests. The Fund is subject to a tax imposed on capital gains by certain countries in which it invests. An estimated deferred tax liability for net unrealized appreciation on the applicable securities is included in Other payables and accrued expenses on the Statement of Assets & Liabilities.
Distributions are declared and recorded on the ex-dividend date. Income and capital gain distributions are declared separately for each class. Income and capital gain distributions are determined in accordance with income tax regulations, which may differ from GAAP.
Capital accounts within the financial statements are adjusted for permanent book-tax differences. These adjustments have no impact on net assets or the results of operations. Capital accounts are not adjusted for temporary book-tax differences which will reverse in a subsequent period.
Book-tax differences are primarily due to futures contracts, foreign currency transactions, certain foreign taxes, passive foreign investment companies (PFIC), redemptions in kind, partnerships, capital loss carryforwards and losses deferred due to wash sales.
As of period end, the cost and unrealized appreciation (depreciation) in securities, and derivatives if applicable, for federal income tax purposes were as follows:
| Gross unrealized appreciation | $18,724,271 |
| Gross unrealized depreciation | (4,286,044) |
| Net unrealized appreciation (depreciation) | $14,438,227 |
| Tax cost | $108,895,343 |
Capital loss carryforwards are only available to offset future capital gains of the Fund to the extent provided by regulations and may be limited. Under the Regulated Investment Company Modernization Act of 2010 (the Act), the Fund is permitted to carry forward capital losses incurred in taxable years beginning after December 22, 2010 for an unlimited period and such capital losses are required to be used prior to any losses that expire. The capital loss carryforward information presented below, including any applicable limitation, is estimated as of prior fiscal period end and is subject to adjustment.
| Fiscal year of expiration | |
| 2019 | $(5,453,268) |
Due to a large redemption in a prior period, $5,453,268 of capital losses that will be available to offset future capital gains of the Fund will be limited to approximately $2,189,706 per year.
Short-Term Trading (Redemption) Fees. Shares held by investors in the Fund less than 30 days may have been subject to a redemption fee equal to 1.00% of the NAV of shares redeemed. All redemption fees, which reduce the proceeds of the shareholder redemption, are retained by the Fund and accounted for as an addition to paid in capital. In November 2017, the Board of Trustees approved the elimination of these redemption fees effective December 18, 2017.
Restricted Securities. The Fund may invest in securities that are subject to legal or contractual restrictions on resale. These securities generally may be resold in transactions exempt from registration or to the public if the securities are registered. Disposal of these securities may involve time-consuming negotiations and expense, and prompt sale at an acceptable price may be difficult. Information regarding restricted securities is included at the end of the Fund's Schedule of Investments.
4. Purchases and Sales of Investments.
Purchases and sales of securities, other than short-term securities, aggregated $35,022,649 and $32,010,577, respectively.
5. Fees and Other Transactions with Affiliates.
Management Fee. Fidelity Management & Research Company (the investment adviser) and its affiliates provide the Fund with investment management related services for which the Fund pays a monthly management fee. The management fee is the sum of an individual fund fee rate that is based on an annual rate of .45% of the Fund's average net assets and an annualized group fee rate that averaged .24% during the period. The group fee rate is based upon the average net assets of all the mutual funds advised by the investment adviser, including any mutual funds previously advised by the investment adviser that are currently advised by Fidelity SelectCo, LLC, an affiliate of the investment adviser. The group fee rate decreases as assets under management increase and increases as assets under management decrease. In addition, the management fee is subject to a performance adjustment (up to a maximum of +/- .20% of the Fund's average net assets over a 36 month performance period). The upward or downward adjustment to the management fee is based on the relative investment performance of Total International Equity as compared to its benchmark index, the MSCI All Country World ex USA Index, over the same 36 month performance period. For the reporting period, the total annualized management fee rate, including the performance adjustment, was .85% of the Fund's average net assets. The performance adjustment included in the management fee rate may be higher or lower than the maximum performance adjustment rate due to the difference between the average net assets for the reporting and performance periods.
Distribution and Service Plan Fees. In accordance with Rule 12b-1 of the 1940 Act, the Fund has adopted separate Distribution and Service Plans for each class of shares. Certain classes pay Fidelity Distributors Corporation (FDC), an affiliate of the investment adviser, separate Distribution and Service Fees, each of which is based on an annual percentage of each class' average net assets. In addition, FDC may pay financial intermediaries for selling shares of the Fund and providing shareholder support services. For the period, the Distribution and Service Fee rates, total fees and amounts retained by FDC were as follows:
| Distribution Fee | Service Fee | Total Fees | Retained by FDC | |
| Class A | -% | .25% | $11,607 | $1,022 |
| Class M | .25% | .25% | 39,436 | 477 |
| Class C | .75% | .25% | 16,535 | 2,807 |
| $67,578 | $4,306 |
Sales Load. FDC may receive a front-end sales charge of up to 5.75% for selling Class A shares and 3.50% for selling Class M shares, some of which is paid to financial intermediaries for selling shares of the Fund. Depending on the holding period, FDC may receive contingent deferred sales charges levied on Class A, Class M and Class C redemptions. The deferred sales charges are 1.00% for Class C shares, 1.00% for certain purchases of Class A shares and .25% for certain purchases of Class M shares.
For the period, sales charge amounts retained by FDC were as follows:
| Retained by FDC | |
| Class A | $2,303 |
| Class M | 1,138 |
| Class C(a) | 721 |
| $4,162 |
(a) When Class C shares are initially sold, FDC pays commissions from its own resources to financial intermediaries through which the sales are made.
Transfer Agent Fees. Fidelity Investments Institutional Operations Company, Inc., (FIIOC), an affiliate of the investment adviser, is the transfer, dividend disbursing and shareholder servicing agent for each class of the Fund. FIIOC receives account fees and asset-based fees that vary according to the account size and type of account of the shareholders of the respective classes of the Fund, except for Class Z. FIIOC receives an asset-based fee of Class Z's average net assets. FIIOC pays for typesetting, printing and mailing of shareholder reports, except proxy statements.
For the period, transfer agent fees for each class were as follows:
| Amount | % of Class-Level Average Net Assets(a) | |
| Class A | $10,722 | .23 |
| Class M | 17,548 | .22 |
| Class C | 5,055 | .31 |
| Total International Equity | 72,783 | .17 |
| Class I | 7,715 | .18 |
| Class Z | 63 | .05 |
| $113,886 |
(a) Annualized
Accounting and Security Lending Fees. Fidelity Service Company, Inc. (FSC), an affiliate of the investment adviser, maintains the Fund's accounting records. The accounting fee is based on the level of average net assets for each month. Under a separate contract, FSC administers the security lending program. The security lending fee is based on the number and duration of lending transactions. For the period, the fees were equivalent to an annualized rate of .05%.
Brokerage Commissions. The Fund placed a portion of its portfolio transactions with brokerage firms which are affiliates of the investment adviser. Brokerage commissions are included in net realized gain (loss) and change in net unrealized appreciation (depreciation) in the Statement of Operations. The commissions paid to these affiliated firms were $133 for the period.
Interfund Trades. The Fund may purchase from or sell securities to other Fidelity Funds under procedures adopted by the Board. The procedures have been designed to ensure these interfund trades are executed in accordance with Rule 17a-7 of the 1940 Act. Interfund trades are included within the respective purchases and sales amounts shown in the Purchases and Sales of Investments note.
Prior Fiscal Year Redemptions In-Kind. During the prior period, 30,358,599 shares of the Fund held by an affiliated entity were redeemed in-kind for investments and cash with a value of $259,566,026. The Fund had a net realized gain of $51,686,661 on investments delivered through the in-kind redemptions. The amount of the redemptions is included in share transactions activity shown in the accompanying Statement of Changes in Net Assets as well as the Notes to Financial Statements. The Fund recognized no gain or loss for federal income tax purposes.
6. Committed Line of Credit.
The Fund participates with other funds managed by the investment adviser or an affiliate in a $4.25 billion credit facility (the "line of credit") to be utilized for temporary or emergency purposes to fund shareholder redemptions or for other short-term liquidity purposes. The Fund has agreed to pay commitment fees on its pro-rata portion of the line of credit, which amounted to $173 and is reflected in Miscellaneous expenses on the Statement of Operations. During the period, the Fund did not borrow on this line of credit.
7. Security Lending.
The Fund lends portfolio securities through a lending agent from time to time in order to earn additional income. For equity securities, a lending agent is used and may loan securities to certain qualified borrowers, including Fidelity Capital Markets (FCM), a broker-dealer affiliated with the Fund. On the settlement date of the loan, the Fund receives collateral (in the form of U.S. Treasury obligations, letters of credit and/or cash) against the loaned securities and maintains collateral in an amount not less than 100% of the market value of the loaned securities during the period of the loan. The market value of the loaned securities is determined at the close of business of the Fund and any additional required collateral is delivered to the Fund on the next business day. The Fund or borrower may terminate the loan at any time, and if the borrower defaults on its obligation to return the securities loaned because of insolvency or other reasons, the Fund may apply collateral received from the borrower against the obligation. The Fund may experience delays and costs in recovering the securities loaned. Any cash collateral received is invested in the Fidelity Securities Lending Cash Central Fund. The value of loaned securities and cash collateral at period end are disclosed on the Fund's Statement of Assets and Liabilities. Security lending income represents the income earned on investing cash collateral, less rebates paid to borrowers and any lending agent fees associated with the loan, plus any premium payments received for lending certain types of securities. Security lending income is presented in the Statement of Operations as a component of income from Fidelity Central Funds. Total security lending income during the period amounted to $4,991. During the period, there were no securities loaned to FCM.
8. Expense Reductions.
The investment adviser contractually agreed to reimburse each class to the extent annual operating expenses exceeded certain levels of class-level average net assets as noted in the table below. This reimbursement will remain in place through December 31, 2018. Some expenses, for example the compensation of the independent Trustees, and certain miscellaneous expenses such as proxy and shareholder meeting expenses, are excluded from this reimbursement.
The following classes were in reimbursement during the period:
| Expense Limitations | Reimbursement | |
| Class A | 1.45% | $9,030 |
| Class M | 1.70% | 14,595 |
| Class C | 2.20% | 4,429 |
| Total International Equity | 1.20% | 56,001 |
| Class I | 1.20% | 5,936 |
| Class Z | 1.05% | 218 |
| $90,209 |
Commissions paid to certain brokers with whom the investment adviser, or its affiliates, places trades on behalf of the Fund include an amount in addition to trade execution, which may be rebated back to the Fund to offset certain expenses. This amount totaled $4,950 for the period.
In addition, during the period the investment adviser reimbursed and/or waived a portion of fund-level operating expenses in the amount of $596.
9. Distributions to Shareholders.
Distributions to shareholders of each class were as follows:
| Six months ended April 30, 2018 | Year ended October 31, 2017 | |
| From net investment income | ||
| Class A | $151,458 | $92,173 |
| Class M | 219,262 | 119,902 |
| Class C | 33,155 | 8,223 |
| Total International Equity | 1,290,652 | 3,979,536 |
| Class I | 144,575 | 27,476 |
| Class Z | 4,586 | – |
| Total | $1,843,688 | $4,227,310 |
| From net realized gain | ||
| Class A | $225,194 | $– |
| Class M | 372,580 | – |
| Class C | 77,248 | – |
| Total International Equity | 1,957,633 | – |
| Class I | 191,076 | – |
| Class Z | 6,061 | – |
| Total | $2,829,792 | $– |
10. Share Transactions.
Share transactions for each class were as follows and may contain automatic conversions between classes or exchanges between affiliated funds:
| Shares | Shares | Dollars | Dollars | |
| Six months ended April 30, 2018 | Year ended October 31, 2017(a) | Six months ended April 30, 2018 | Year ended October 31, 2017(a) | |
| Class A | ||||
| Shares sold | 110,826 | 192,334 | $1,039,758 | $1,631,763 |
| Reinvestment of distributions | 41,465 | 12,257 | 376,502 | 91,682 |
| Shares redeemed | (175,572) | (332,738) | (1,639,375) | (2,778,571) |
| Net increase (decrease) | (23,281) | (128,147) | $(223,115) | $(1,055,126) |
| Class M | ||||
| Shares sold | 58,871 | 238,813 | $558,124 | $1,896,741 |
| Reinvestment of distributions | 64,894 | 15,944 | 591,835 | 119,902 |
| Shares redeemed | (176,260) | (372,174) | (1,659,112) | (3,041,931) |
| Net increase (decrease) | (52,495) | (117,417) | $(509,153) | $(1,025,288) |
| Class C | ||||
| Shares sold | 40,743 | 96,785 | $387,808 | $808,355 |
| Reinvestment of distributions | 12,119 | 1,070 | 110,403 | 8,046 |
| Shares redeemed | (43,295) | (109,698) | (407,499) | (920,097) |
| Net increase (decrease) | 9,567 | (11,843) | $90,712 | $(103,696) |
| Total International Equity | ||||
| Shares sold | 1,038,947 | 6,763,065 | $9,856,225 | $53,465,510 |
| Reinvestment of distributions | 329,975 | 523,250 | 3,002,772 | 3,913,907 |
| Shares redeemed | (818,669) | (35,028,420)(b) | (7,717,657) | (297,076,095)(b) |
| Net increase (decrease) | 550,253 | (27,742,105) | $5,141,340 | $(239,696,678) |
| Class I | ||||
| Shares sold | 377,043 | 604,657 | $3,530,788 | $5,121,757 |
| Reinvestment of distributions | 36,520 | 3,621 | 330,507 | 27,016 |
| Shares redeemed | (82,109) | (167,386) | (765,596) | (1,392,556) |
| Net increase (decrease) | 331,454 | 440,892 | $3,095,699 | $3,756,217 |
| Class Z | ||||
| Shares sold | 14,798 | 26,796 | $137,272 | $221,657 |
| Reinvestment of distributions | 1,174 | – | 10,647 | – |
| Shares redeemed | (2,394) | (569) | (22,805) | (5,097) |
| Net increase (decrease) | 13,578 | 26,227 | $125,114 | $216,560 |
(a) Share transactions for Class Z are for the period February 1, 2017 (commencement of sale of shares) to October 31, 2017
(b) Amount includes in-kind redemptions (see the Prior Fiscal Year Redemptions In-Kind note for additional details).
11. Other.
The Fund's organizational documents provide former and current trustees and officers with a limited indemnification against liabilities arising in connection with the performance of their duties to the Fund. In the normal course of business, the Fund may also enter into contracts that provide general indemnifications. The Fund's maximum exposure under these arrangements is unknown as this would be dependent on future claims that may be made against the Fund. The risk of material loss from such claims is considered remote.
Shareholder Expense Example
As a shareholder of the Fund, you incur two types of costs: (1) transaction costs, including sales charges (loads) on purchase payments or redemption proceeds, redemption fees and (2) ongoing costs, including management fees, distribution and/or service (12b-1) fees and other Fund expenses. This Example is intended to help you understand your ongoing costs (in dollars) of investing in the Fund and to compare these costs with the ongoing costs of investing in other mutual funds.
The Example is based on an investment of $1,000 invested at the beginning of the period and held for the entire period (November 1, 2017 to April 30, 2018).
Actual Expenses
The first line of the accompanying table for each class of the Fund provides information about actual account values and actual expenses. You may use the information in this line, together with the amount you invested, to estimate the expenses that you paid over the period. Simply divide your account value by $1,000.00 (for example, an $8,600 account value divided by $1,000.00 = 8.6), then multiply the result by the number in the first line for a class of the Fund under the heading entitled "Expenses Paid During Period" to estimate the expenses you paid on your account during this period. A small balance maintenance fee of $12.00 that is charged once a year may apply for certain accounts with a value of less than $2,000. This fee is not included in the table below. If it was, the estimate of expenses you paid during the period would be higher, and your ending account value lower, by this amount. In addition, the Fund, as a shareholder in the underlying Fidelity Central Funds, will indirectly bear its pro-rata share of the fees and expenses incurred by the underlying Fidelity Central Funds. These fees and expenses are not included in the Fund's annualized expense ratio used to calculate the expense estimate in the table below.
Hypothetical Example for Comparison Purposes
The second line of the accompanying table for each class of the Fund provides information about hypothetical account values and hypothetical expenses based on a Class' actual expense ratio and an assumed rate of return of 5% per year before expenses, which is not the Class' actual return. The hypothetical account values and expenses may not be used to estimate the actual ending account balance or expenses you paid for the period. You may use this information to compare the ongoing costs of investing in the Fund and other funds. To do so, compare this 5% hypothetical example with the 5% hypothetical examples that appear in the shareholder reports of the other funds. A small balance maintenance fee of $12.00 that is charged once a year may apply for certain accounts with a value of less than $2,000. This fee is not included in the table below. If it was, the estimate of expenses you paid during the period would be higher, and your ending account value lower, by this amount. In addition, the Fund, as a shareholder in the underlying Fidelity Central Funds, will indirectly bear its pro-rata share of the fees and expenses incurred by the underlying Fidelity Central Funds. These fees and expenses are not included in the Fund's annualized expense ratio used to calculate the expense estimate in the table below.
Please note that the expenses shown in the table are meant to highlight your ongoing costs only and do not reflect any transaction costs. Therefore, the second line of the table is useful in comparing ongoing costs only, and will not help you determine the relative total costs of owning different funds. In addition, if these transactional costs were included, your costs would have been higher.
| Annualized Expense Ratio-A | Beginning Account Value November 1, 2017 | Ending Account Value April 30, 2018 | Expenses Paid During Period-B November 1, 2017 to April 30, 2018 | |
| Class A | 1.45% | |||
| Actual | $1,000.00 | $1,025.00 | $7.28 | |
| Hypothetical-C | $1,000.00 | $1,017.60 | $7.25 | |
| Class M | 1.70% | |||
| Actual | $1,000.00 | $1,022.80 | $8.53 | |
| Hypothetical-C | $1,000.00 | $1,016.36 | $8.50 | |
| Class C | 2.20% | |||
| Actual | $1,000.00 | $1,021.10 | $11.02 | |
| Hypothetical-C | $1,000.00 | $1,013.88 | $10.99 | |
| Total International Equity | 1.20% | |||
| Actual | $1,000.00 | $1,025.70 | $6.03 | |
| Hypothetical-C | $1,000.00 | $1,018.84 | $6.01 | |
| Class I | 1.20% | |||
| Actual | $1,000.00 | $1,026.10 | $6.03 | |
| Hypothetical-C | $1,000.00 | $1,018.84 | $6.01 | |
| Class Z | 1.05% | |||
| Actual | $1,000.00 | $1,027.10 | $5.28 | |
| Hypothetical-C | $1,000.00 | $1,019.59 | $5.26 |
A Annualized expense ratio reflects expenses net of applicable fee waivers.
B Expenses are equal to each Class' annualized expense ratio, multiplied by the average account value over the period, multiplied by 181/365 (to reflect the one-half year period).
C 5% return per year before expenses
![]()
ATIE-SANN-0618
1.853367.110
Fidelity® Total International Equity Fund Semi-Annual Report April 30, 2018 |
|
Contents
To view a fund's proxy voting guidelines and proxy voting record for the 12-month period ended June 30, visit http://www.fidelity.com/proxyvotingresults or visit the Securities and Exchange Commission's (SEC) web site at http://www.sec.gov.
You may also call 1-800-544-8544 to request a free copy of the proxy voting guidelines.
Standard & Poor's, S&P and S&P 500 are registered service marks of The McGraw-Hill Companies, Inc. and have been licensed for use by Fidelity Distributors Corporation.
Other third-party marks appearing herein are the property of their respective owners.
All other marks appearing herein are registered or unregistered trademarks or service marks of FMR LLC or an affiliated company. © 2018 FMR LLC. All rights reserved.
This report and the financial statements contained herein are submitted for the general information of the shareholders of the Fund. This report is not authorized for distribution to prospective investors in the Fund unless preceded or accompanied by an effective prospectus.
A fund files its complete schedule of portfolio holdings with the SEC for the first and third quarters of each fiscal year on Form N-Q. Forms N-Q are available on the SEC’s web site at http://www.sec.gov. A fund's Forms N-Q may be reviewed and copied at the SEC’s Public Reference Room in Washington, DC. Information regarding the operation of the SEC's Public Reference Room may be obtained by calling 1-800-SEC-0330.
For a complete list of a fund's portfolio holdings, view the most recent holdings listing, semiannual report, or annual report on Fidelity's web site at http://www.fidelity.com, http://www.institutional.fidelity.com, or http://www.401k.com, as applicable.
NOT FDIC INSURED •MAY LOSE VALUE •NO BANK GUARANTEE
Neither the Fund nor Fidelity Distributors Corporation is a bank.
Investment Summary (Unaudited)
Geographic Diversification (% of fund's net assets)
| As of April 30, 2018 | ||
| Japan | 14.0% | |
| United States of America* | 10.8% | |
| United Kingdom | 9.9% | |
| France | 6.6% | |
| Germany | 5.6% | |
| Switzerland | 4.9% | |
| Canada | 4.7% | |
| Cayman Islands | 4.5% | |
| India | 3.6% | |
| Other | 35.4% | |
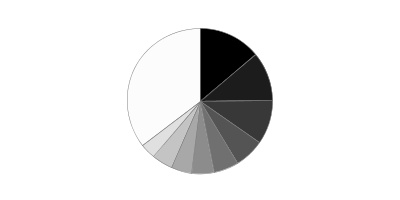
* Includes Short-Term investments and Net Other Assets (Liabilities).
Percentages are based on country or territory of incorporation and are adjusted for the effect of futures contracts, if applicable.
Asset Allocation as of April 30, 2018
| % of fund's net assets | |
| Stocks | 97.6 |
| Short-Term Investments and Net Other Assets (Liabilities) | 2.4 |
Top Ten Stocks as of April 30, 2018
| % of fund's net assets | |
| Alibaba Group Holding Ltd. sponsored ADR (Cayman Islands, Internet Software & Services) | 1.6 |
| Tencent Holdings Ltd. (Cayman Islands, Internet Software & Services) | 1.6 |
| Samsung Electronics Co. Ltd. (Korea (South), Technology Hardware, Storage & Peripherals) | 1.5 |
| Taiwan Semiconductor Manufacturing Co. Ltd. (Taiwan, Semiconductors & Semiconductor Equipment) | 1.4 |
| Nestle SA (Reg. S) (Switzerland, Food Products) | 1.3 |
| SAP SE (Germany, Software) | 1.2 |
| Naspers Ltd. Class N (South Africa, Media) | 1.2 |
| Keyence Corp. (Japan, Electronic Equipment & Components) | 1.2 |
| AIA Group Ltd. (Hong Kong, Insurance) | 1.1 |
| CSL Ltd. (Australia, Biotechnology) | 1.1 |
| 13.2 |
Top Market Sectors as of April 30, 2018
| % of fund's net assets | |
| Financials | 22.9 |
| Information Technology | 17.3 |
| Industrials | 14.6 |
| Consumer Discretionary | 10.4 |
| Materials | 8.1 |
| Consumer Staples | 7.9 |
| Health Care | 7.7 |
| Energy | 5.1 |
| Real Estate | 1.5 |
| Telecommunication Services | 1.6 |
Schedule of Investments April 30, 2018 (Unaudited)
Showing Percentage of Net Assets
| Common Stocks - 96.1% | |||
| Shares | Value | ||
| Argentina - 0.3% | |||
| Banco Macro SA sponsored ADR | 1,700 | $164,764 | |
| Telecom Argentina SA Class B sponsored ADR | 5,500 | 165,220 | |
| TOTAL ARGENTINA | 329,984 | ||
| Australia - 2.5% | |||
| Accent Group Ltd. | 17,436 | 16,384 | |
| Adelaide Brighton Ltd. | 7,189 | 34,684 | |
| Amcor Ltd. | 15,195 | 156,584 | |
| Beacon Lighting Group Ltd. | 15,420 | 17,078 | |
| Commonwealth Bank of Australia | 12,417 | 668,586 | |
| CSL Ltd. | 10,391 | 1,330,973 | |
| DuluxGroup Ltd. | 9,393 | 54,612 | |
| Imdex Ltd. (a) | 41,011 | 38,243 | |
| Insurance Australia Group Ltd. | 47,430 | 280,782 | |
| Macquarie Group Ltd. | 3,880 | 315,980 | |
| Magellan Financial Group Ltd. | 7,387 | 129,054 | |
| TOTAL AUSTRALIA | 3,042,960 | ||
| Austria - 0.7% | |||
| Andritz AG | 8,972 | 482,789 | |
| Erste Group Bank AG | 7,800 | 382,423 | |
| TOTAL AUSTRIA | 865,212 | ||
| Bailiwick of Jersey - 0.2% | |||
| Integrated Diagnostics Holdings PLC | 7,500 | 35,625 | |
| Wolseley PLC | 3,248 | 249,511 | |
| TOTAL BAILIWICK OF JERSEY | 285,136 | ||
| Belgium - 1.4% | |||
| Anheuser-Busch InBev SA NV | 5,771 | 576,481 | |
| KBC Ancora | 1,311 | 79,554 | |
| KBC Groep NV | 10,652 | 931,307 | |
| Umicore SA | 3,228 | 180,328 | |
| TOTAL BELGIUM | 1,767,670 | ||
| Bermuda - 0.3% | |||
| Credicorp Ltd. (United States) | 1,212 | 281,778 | |
| Vostok New Ventures Ltd. (depositary receipt) (a) | 3,860 | 32,355 | |
| TOTAL BERMUDA | 314,133 | ||
| Brazil - 1.7% | |||
| BM&F BOVESPA SA | 36,500 | 263,602 | |
| BTG Pactual Participations Ltd. unit | 25,500 | 162,905 | |
| CVC Brasil Operadora e Agencia de Viagens SA | 11,400 | 188,709 | |
| Equatorial Energia SA | 9,500 | 192,945 | |
| Hapvida Participacoes e Investimentos SA | 22,100 | 174,431 | |
| IRB Brasil Resseguros SA | 13,800 | 186,327 | |
| Itau Unibanco Holding SA | 4,000 | 50,354 | |
| Itausa-Investimentos Itau SA | 1,756 | 6,767 | |
| Localiza Rent A Car SA | 23,200 | 184,702 | |
| Lojas Renner SA | 21,400 | 199,205 | |
| Notre Dame Intermedica Participacoes SA | 34,500 | 200,902 | |
| Suzano Papel e Celulose SA | 19,500 | 228,554 | |
| TOTAL BRAZIL | 2,039,403 | ||
| Canada - 4.7% | |||
| Alimentation Couche-Tard, Inc. Class B (sub. vtg.) | 15,722 | 679,721 | |
| Canadian National Railway Co. | 9,263 | 715,458 | |
| Canadian Pacific Railway Ltd. | 3,653 | 666,556 | |
| CCL Industries, Inc. Class B | 12,290 | 596,146 | |
| Constellation Software, Inc. | 957 | 683,961 | |
| Franco-Nevada Corp. | 8,859 | 628,365 | |
| McCoy Global, Inc. (a) | 7,100 | 7,078 | |
| New Look Vision Group, Inc. | 1,300 | 32,906 | |
| Nutrien Ltd. | 15,765 | 717,679 | |
| Pason Systems, Inc. | 20,491 | 286,470 | |
| PrairieSky Royalty Ltd. | 14,273 | 316,486 | |
| ShawCor Ltd. Class A | 800 | 15,477 | |
| Suncor Energy, Inc. | 13,500 | 516,258 | |
| TOTAL CANADA | 5,862,561 | ||
| Cayman Islands - 4.5% | |||
| 58.com, Inc. ADR (a) | 4,900 | 428,211 | |
| Alibaba Group Holding Ltd. sponsored ADR (a) | 10,982 | 1,960,737 | |
| JD.com, Inc. sponsored ADR (a) | 8,800 | 321,288 | |
| Melco Crown Entertainment Ltd. sponsored ADR | 6,200 | 193,502 | |
| New Oriental Education & Technology Group, Inc. sponsored ADR | 2,660 | 238,974 | |
| Ping An Healthcare and Technology Co. Ltd. (a) | 2,700 | 18,852 | |
| Sands China Ltd. | 32,000 | 184,940 | |
| Shenzhou International Group Holdings Ltd. | 22,000 | 240,157 | |
| Tencent Holdings Ltd. | 39,500 | 1,941,936 | |
| Value Partners Group Ltd. | 20,000 | 18,918 | |
| TOTAL CAYMAN ISLANDS | 5,547,515 | ||
| Chile - 0.2% | |||
| Banco Santander Chile sponsored ADR | 6,100 | 201,483 | |
| China - 2.1% | |||
| China International Travel Service Corp. Ltd. (A Shares) | 20,500 | 167,592 | |
| China Merchants Bank Co. Ltd. (H Shares) | 63,500 | 276,885 | |
| Dong E-E-Jiao Co. Ltd. Class A | 17,500 | 162,863 | |
| Gree Electric Appliances, Inc. of Zhuhai Class A | 23,000 | 159,514 | |
| Hangzhou Hikvision Digital Technology Co. Ltd. Class A | 27,100 | 164,142 | |
| Inner Mongoli Yili Industries Co. Ltd. (A Shares) | 41,082 | 170,097 | |
| Jiangsu Yanghe Brewery Joint-Stock Co. Ltd. Class A | 10,100 | 177,966 | |
| Kweichow Moutai Co. Ltd. (A Shares) | 1,594 | 165,982 | |
| Midea Group Co. Ltd. Class A | 21,100 | 171,555 | |
| Ping An Insurance (Group) Co. of China Ltd. (H Shares) | 49,000 | 478,799 | |
| Shanghai International Airport Co. Ltd. (A Shares) | 23,900 | 187,714 | |
| Shenzhen Inovance Technology Co. Ltd. Class A | 37,000 | 191,469 | |
| Yunnan Baiyao Group Co. Ltd. | 11,700 | 174,723 | |
| TOTAL CHINA | 2,649,301 | ||
| Denmark - 0.5% | |||
| Jyske Bank A/S (Reg.) | 4,854 | 291,805 | |
| Novo Nordisk A/S Series B sponsored ADR | 5,100 | 239,394 | |
| Scandinavian Tobacco Group A/S (b) | 1,550 | 25,927 | |
| SimCorp A/S | 400 | 29,123 | |
| Spar Nord Bank A/S | 4,231 | 48,484 | |
| TOTAL DENMARK | 634,733 | ||
| Finland - 0.4% | |||
| Sampo Oyj (A Shares) | 6,653 | 359,529 | |
| Tikkurila Oyj | 7,680 | 138,930 | |
| TOTAL FINLAND | 498,459 | ||
| France - 6.6% | |||
| Accor SA | 3,800 | 215,081 | |
| Atos Origin SA | 2,936 | 396,743 | |
| AXA SA (c) | 22,006 | 629,342 | |
| Bouygues SA | 5,303 | 270,565 | |
| Capgemini SA | 2,602 | 358,208 | |
| Compagnie de St. Gobain | 3,900 | 204,846 | |
| Edenred SA | 6,900 | 237,475 | |
| Elis SA | 10,751 | 257,321 | |
| Kering SA | 300 | 173,749 | |
| Laurent-Perrier Group SA | 259 | 32,684 | |
| Legrand SA | 3,600 | 280,405 | |
| LVMH Moet Hennessy - Louis Vuitton SA (c) | 566 | 196,975 | |
| Natixis SA | 42,900 | 352,903 | |
| Pernod Ricard SA | 1,100 | 182,716 | |
| Rubis | 2,400 | 186,936 | |
| Safran SA | 3,500 | 410,516 | |
| Sanofi SA | 8,336 | 659,064 | |
| Societe Generale Series A | 11,100 | 607,490 | |
| SR Teleperformance SA | 1,900 | 304,931 | |
| Total SA (c) | 19,344 | 1,215,804 | |
| Vetoquinol SA | 600 | 38,112 | |
| VINCI SA | 5,300 | 529,914 | |
| Virbac SA (a) | 170 | 26,524 | |
| Vivendi SA | 12,552 | 331,804 | |
| TOTAL FRANCE | 8,100,108 | ||
| Germany - 5.3% | |||
| adidas AG | 734 | 180,733 | |
| BASF AG | 6,995 | 727,784 | |
| Bayer AG | 5,700 | 681,262 | |
| Brenntag AG | 3,500 | 200,848 | |
| CompuGroup Medical AG | 2,146 | 112,057 | |
| CTS Eventim AG | 2,012 | 94,369 | |
| Deutsche Post AG | 6,277 | 272,450 | |
| Deutsche Telekom AG | 28,800 | 504,104 | |
| Fielmann AG | 358 | 29,441 | |
| Fresenius SE & Co. KGaA | 2,100 | 160,628 | |
| Hannover Reuck SE | 2,500 | 352,015 | |
| HeidelbergCement Finance AG | 2,000 | 196,259 | |
| Linde AG | 3,000 | 666,776 | |
| MTU Aero Engines Holdings AG | 1,200 | 207,224 | |
| Nexus AG | 1,420 | 47,500 | |
| SAP SE | 13,268 | 1,474,150 | |
| Vonovia SE | 8,665 | 435,401 | |
| WashTec AG | 400 | 38,595 | |
| Wirecard AG | 1,500 | 204,869 | |
| TOTAL GERMANY | 6,586,465 | ||
| Greece - 0.0% | |||
| Motor Oil (HELLAS) Corinth Refineries SA | 900 | 21,498 | |
| Hong Kong - 1.6% | |||
| AIA Group Ltd. | 158,400 | 1,415,652 | |
| CSPC Pharmaceutical Group Ltd. | 96,000 | 244,518 | |
| Galaxy Entertainment Group Ltd. | 21,000 | 183,805 | |
| Techtronic Industries Co. Ltd. | 30,000 | 175,746 | |
| TOTAL HONG KONG | 2,019,721 | ||
| Hungary - 0.2% | |||
| OTP Bank PLC | 5,300 | 231,554 | |
| India - 3.6% | |||
| Adani Ports & Special Economic Zone Ltd. | 35,777 | 218,851 | |
| Asian Paints Ltd. | 11,557 | 208,544 | |
| Eicher Motors Ltd. | 451 | 210,719 | |
| Godrej Consumer Products Ltd. | 11,927 | 199,863 | |
| HDFC Bank Ltd. | 5,849 | 176,288 | |
| Hero Motocorp Ltd. | 3,589 | 201,046 | |
| Housing Development Finance Corp. Ltd. | 31,556 | 892,815 | |
| Indraprastha Gas Ltd. | 38,447 | 165,817 | |
| IndusInd Bank Ltd. | 6,813 | 193,802 | |
| Jyothy Laboratories Ltd. | 2,614 | 14,241 | |
| Kotak Mahindra Bank Ltd. (a) | 10,824 | 196,822 | |
| Larsen & Toubro Ltd. | 11,829 | 248,665 | |
| LIC Housing Finance Ltd. | 22,434 | 183,673 | |
| Maruti Suzuki India Ltd. | 1,978 | 261,497 | |
| Motherson Sumi Systems Ltd. | 37,292 | 197,584 | |
| PC Jeweller Ltd. | 12,069 | 26,129 | |
| Pidilite Industries Ltd. (a) | 11,106 | 181,112 | |
| Reliance Industries Ltd. | 30,239 | 436,603 | |
| Ultratech Cemco Ltd. | 3,130 | 192,974 | |
| TOTAL INDIA | 4,407,045 | ||
| Indonesia - 0.5% | |||
| PT Bank Central Asia Tbk | 162,100 | 256,326 | |
| PT Bank Rakyat Indonesia Tbk | 1,586,800 | 365,866 | |
| TOTAL INDONESIA | 622,192 | ||
| Ireland - 1.5% | |||
| Accenture PLC Class A | 1,200 | 181,440 | |
| Allergan PLC | 500 | 76,825 | |
| CRH PLC | 7,087 | 251,669 | |
| CRH PLC sponsored ADR | 20,929 | 740,049 | |
| FBD Holdings PLC | 1,972 | 27,981 | |
| James Hardie Industries PLC CDI | 34,139 | 602,876 | |
| TOTAL IRELAND | 1,880,840 | ||
| Isle of Man - 0.2% | |||
| Playtech Ltd. | 22,130 | 246,960 | |
| Israel - 0.3% | |||
| Azrieli Group | 282 | 12,937 | |
| Frutarom Industries Ltd. | 1,800 | 172,800 | |
| Ituran Location & Control Ltd. | 2,261 | 70,882 | |
| Strauss Group Ltd. | 2,659 | 54,843 | |
| TOTAL ISRAEL | 311,462 | ||
| Italy - 1.3% | |||
| Assicurazioni Generali SpA | 14,600 | 295,142 | |
| Azimut Holding SpA | 1,114 | 23,448 | |
| Beni Stabili SpA SIIQ | 34,326 | 32,519 | |
| Interpump Group SpA | 12,891 | 410,662 | |
| Intesa Sanpaolo SpA | 155,600 | 591,896 | |
| Mediobanca SpA | 21,802 | 264,992 | |
| TOTAL ITALY | 1,618,659 | ||
| Japan - 14.0% | |||
| AEON Financial Service Co. Ltd. | 6,900 | 161,959 | |
| Ai Holdings Corp. | 1,100 | 29,452 | |
| Aoki Super Co. Ltd. | 2,000 | 23,838 | |
| Artnature, Inc. | 3,200 | 21,954 | |
| Asahi Co. Ltd. | 1,100 | 13,503 | |
| Aucnet, Inc. | 1,200 | 15,576 | |
| Azbil Corp. | 4,900 | 228,595 | |
| Broadleaf Co. Ltd. | 5,800 | 27,695 | |
| Central Automotive Products Ltd. | 2,400 | 37,431 | |
| Coca-Cola West Co. Ltd. | 800 | 34,468 | |
| Daiichikosho Co. Ltd. | 1,400 | 73,637 | |
| Daikin Industries Ltd. | 1,500 | 175,700 | |
| Daikokutenbussan Co. Ltd. | 1,000 | 51,683 | |
| DENSO Corp. | 7,800 | 410,692 | |
| East Japan Railway Co. | 6,500 | 623,719 | |
| Fanuc Corp. | 1,800 | 385,579 | |
| Funai Soken Holdings, Inc. | 1,950 | 45,700 | |
| GCA Savvian Group Corp. | 3,100 | 27,535 | |
| Goldcrest Co. Ltd. | 2,960 | 63,007 | |
| Honda Motor Co. Ltd. | 18,500 | 636,140 | |
| Hoya Corp. | 9,300 | 498,688 | |
| Idemitsu Kosan Co. Ltd. | 4,500 | 176,386 | |
| Itochu Corp. | 25,300 | 507,759 | |
| Japan Tobacco, Inc. | 8,120 | 218,115 | |
| Kao Corp. | 3,700 | 265,857 | |
| Keyence Corp. | 2,342 | 1,434,721 | |
| Kobayashi Pharmaceutical Co. Ltd. | 1,000 | 84,431 | |
| Komatsu Ltd. | 14,300 | 487,469 | |
| Koshidaka Holdings Co. Ltd. | 1,100 | 66,813 | |
| Kusuri No Aoki Holdings Co. Ltd. | 500 | 34,349 | |
| Lasertec Corp. | 2,600 | 86,809 | |
| Makita Corp. | 6,100 | 274,533 | |
| Medikit Co. Ltd. | 600 | 32,986 | |
| Miroku Jyoho Service Co., Ltd. | 900 | 25,686 | |
| Misumi Group, Inc. | 25,800 | 715,093 | |
| Mitsubishi UFJ Financial Group, Inc. | 109,800 | 735,808 | |
| Mitsuboshi Belting Ltd. | 2,000 | 22,887 | |
| Mitsui Fudosan Co. Ltd. | 11,100 | 285,471 | |
| Nabtesco Corp. | 7,300 | 264,101 | |
| Nagaileben Co. Ltd. | 2,900 | 76,851 | |
| Nakano Refrigerators Co. Ltd. | 700 | 32,913 | |
| ND Software Co. Ltd. | 1,300 | 12,260 | |
| Nihon Parkerizing Co. Ltd. | 7,100 | 112,683 | |
| Nintendo Co. Ltd. | 1,100 | 462,194 | |
| Nomura Holdings, Inc. | 46,200 | 266,091 | |
| NS Tool Co. Ltd. | 1,000 | 27,259 | |
| OBIC Co. Ltd. | 5,600 | 469,740 | |
| Olympus Corp. | 4,800 | 179,363 | |
| Oracle Corp. Japan | 2,400 | 197,585 | |
| ORIX Corp. | 25,900 | 455,832 | |
| OSG Corp. | 15,700 | 348,697 | |
| Panasonic Corp. | 19,000 | 281,336 | |
| Paramount Bed Holdings Co. Ltd. | 1,800 | 89,572 | |
| ProNexus, Inc. | 2,900 | 37,563 | |
| Recruit Holdings Co. Ltd. | 10,100 | 233,468 | |
| San-Ai Oil Co. Ltd. | 4,500 | 70,966 | |
| Shin-Etsu Chemical Co. Ltd. | 3,300 | 332,204 | |
| Shinsei Bank Ltd. | 13,500 | 210,922 | |
| SHO-BOND Holdings Co. Ltd. | 5,240 | 396,883 | |
| Shoei Co. Ltd. | 2,000 | 74,369 | |
| SK Kaken Co. Ltd. | 100 | 10,199 | |
| SoftBank Corp. | 4,100 | 313,276 | |
| Software Service, Inc. | 500 | 35,172 | |
| Sony Corp. | 5,100 | 238,201 | |
| Sony Financial Holdings, Inc. | 14,300 | 261,486 | |
| Subaru Corp. | 8,100 | 272,593 | |
| Sumitomo Mitsui Financial Group, Inc. | 11,300 | 470,964 | |
| T&D Holdings, Inc. | 15,800 | 268,681 | |
| Taiheiyo Cement Corp. | 5,100 | 193,373 | |
| Techno Medica Co. Ltd. | 500 | 9,559 | |
| The Monogatari Corp. | 280 | 30,531 | |
| TKC Corp. | 1,000 | 40,020 | |
| Tocalo Co. Ltd. | 1,200 | 14,962 | |
| Tokio Marine Holdings, Inc. | 8,600 | 406,872 | |
| USS Co. Ltd. | 38,400 | 808,255 | |
| Welcia Holdings Co. Ltd. | 1,200 | 61,800 | |
| Workman Co. Ltd. | 1,300 | 51,848 | |
| Yamada Consulting Group Co. Ltd. | 1,900 | 54,052 | |
| Yamato Kogyo Co. Ltd. | 800 | 23,783 | |
| TOTAL JAPAN | 17,240,203 | ||
| Kenya - 0.4% | |||
| Safaricom Ltd. | 1,588,700 | 447,465 | |
| Korea (South) - 2.3% | |||
| BGF Retail Co. Ltd. | 1,146 | 204,390 | |
| Leeno Industrial, Inc. | 264 | 14,125 | |
| LG Chemical Ltd. | 810 | 272,288 | |
| LG Household & Health Care Ltd. | 225 | 287,835 | |
| NAVER Corp. | 237 | 158,454 | |
| Samsung Electronics Co. Ltd. | 759 | 1,880,802 | |
| TOTAL KOREA (SOUTH) | 2,817,894 | ||
| Mexico - 1.2% | |||
| Consorcio ARA S.A.B. de CV | 41,655 | 15,725 | |
| Embotelladoras Arca S.A.B. de CV | 27,400 | 189,376 | |
| Fomento Economico Mexicano S.A.B. de CV: | |||
| unit | 29,000 | 280,323 | |
| sponsored ADR | 1,833 | 177,178 | |
| Grupo Aeroportuario del Pacifico S.A.B. de CV Series B | 19,500 | 202,840 | |
| Grupo Aeroportuario del Sureste S.A.B. de CV Series B | 11,110 | 199,798 | |
| Grupo Mexico SA de CV Series B | 54,300 | 180,506 | |
| Wal-Mart de Mexico SA de CV Series V | 79,600 | 221,196 | |
| TOTAL MEXICO | 1,466,942 | ||
| Netherlands - 2.1% | |||
| Aalberts Industries NV | 1,700 | 83,841 | |
| ASML Holding NV (Netherlands) | 5,600 | 1,065,103 | |
| ING Groep NV (Certificaten Van Aandelen) | 31,076 | 523,647 | |
| Koninklijke Philips Electronics NV | 5,100 | 215,864 | |
| RELX NV | 10,125 | 215,378 | |
| Takeaway.com Holding BV (a)(b) | 600 | 34,924 | |
| VastNed Retail NV | 596 | 29,833 | |
| Wolters Kluwer NV | 5,100 | 276,097 | |
| Yandex NV Series A (a) | 5,197 | 173,372 | |
| TOTAL NETHERLANDS | 2,618,059 | ||
| New Zealand - 0.1% | |||
| Auckland International Airport Ltd. | 28,018 | 125,772 | |
| Norway - 0.6% | |||
| Kongsberg Gruppen ASA | 1,900 | 46,657 | |
| Schibsted ASA (B Shares) | 5,321 | 143,268 | |
| Skandiabanken ASA (b) | 3,000 | 27,112 | |
| Statoil ASA | 21,785 | 557,101 | |
| TOTAL NORWAY | 774,138 | ||
| Philippines - 0.7% | |||
| Ayala Corp. | 10,810 | 201,384 | |
| Ayala Land, Inc. | 262,000 | 206,192 | |
| Jollibee Food Corp. | 7,250 | 39,904 | |
| SM Investments Corp. | 11,620 | 210,446 | |
| SM Prime Holdings, Inc. | 314,700 | 207,707 | |
| TOTAL PHILIPPINES | 865,633 | ||
| Portugal - 0.2% | |||
| Galp Energia SGPS SA Class B | 13,658 | 262,492 | |
| Russia - 0.3% | |||
| Sberbank of Russia | 116,230 | 414,301 | |
| South Africa - 2.4% | |||
| Capitec Bank Holdings Ltd. | 2,824 | 201,052 | |
| Clicks Group Ltd. | 23,630 | 404,000 | |
| Discovery Ltd. | 13,922 | 193,305 | |
| FirstRand Ltd. | 52,950 | 283,575 | |
| Mondi Ltd. | 6,814 | 198,797 | |
| Naspers Ltd. Class N | 5,918 | 1,441,741 | |
| Sanlam Ltd. | 34,626 | 218,733 | |
| TOTAL SOUTH AFRICA | 2,941,203 | ||
| Spain - 2.6% | |||
| Amadeus IT Holding SA Class A | 12,400 | 908,936 | |
| Banco Bilbao Vizcaya Argentaria SA | 18,100 | 146,466 | |
| Banco Santander SA (Spain) | 142,726 | 926,068 | |
| CaixaBank SA | 71,306 | 346,752 | |
| Hispania Activos Inmobiliarios SA | 8,395 | 178,425 | |
| Masmovil Ibercom SA (a) | 821 | 118,576 | |
| Merlin Properties Socimi SA | 10,300 | 159,210 | |
| Prosegur Compania de Seguridad SA (Reg.) | 39,976 | 303,167 | |
| Unicaja Banco SA | 84,700 | 153,528 | |
| TOTAL SPAIN | 3,241,128 | ||
| Sweden - 2.9% | |||
| Addlife AB | 1,000 | 20,956 | |
| AddTech AB (B Shares) | 3,000 | 62,558 | |
| Alfa Laval AB | 9,000 | 223,750 | |
| ASSA ABLOY AB (B Shares) | 37,700 | 793,036 | |
| Atlas Copco AB (A Shares) | 15,800 | 620,874 | |
| Fagerhult AB | 21,125 | 215,914 | |
| Investor AB (B Shares) | 6,067 | 265,429 | |
| Lagercrantz Group AB (B Shares) | 4,600 | 43,286 | |
| Loomis AB (B Shares) | 4,200 | 153,579 | |
| Nordea Bank AB | 47,667 | 486,542 | |
| Saab AB (B Shares) | 1,300 | 53,371 | |
| Svenska Handelsbanken AB (A Shares) | 23,145 | 258,119 | |
| Swedbank AB (A Shares) | 15,300 | 333,636 | |
| TOTAL SWEDEN | 3,531,050 | ||
| Switzerland - 4.9% | |||
| Credit Suisse Group AG | 24,558 | 414,201 | |
| Lafargeholcim Ltd. (Reg.) | 3,990 | 222,892 | |
| Nestle SA (Reg. S) | 21,158 | 1,639,112 | |
| Novartis AG | 14,049 | 1,081,412 | |
| Roche Holding AG (participation certificate) | 4,364 | 969,626 | |
| Schindler Holding AG: | |||
| (participation certificate) | 1,564 | 324,479 | |
| (Reg.) | 324 | 65,094 | |
| Sika AG | 20 | 145,913 | |
| Tecan Group AG | 210 | 46,408 | |
| UBS Group AG | 37,089 | 623,095 | |
| Zurich Insurance Group AG | 1,602 | 511,736 | |
| TOTAL SWITZERLAND | 6,043,968 | ||
| Taiwan - 1.4% | |||
| Addcn Technology Co. Ltd. | 3,772 | 32,607 | |
| Taiwan Semiconductor Manufacturing Co. Ltd. | 223,035 | 1,695,925 | |
| TOTAL TAIWAN | 1,728,532 | ||
| Thailand - 0.4% | |||
| Airports of Thailand PCL (For. Reg.) | 108,700 | 244,507 | |
| C.P. ALL PCL (For. Reg.) | 97,400 | 267,899 | |
| TOTAL THAILAND | 512,406 | ||
| Turkey - 0.5% | |||
| Tofas Turk Otomobil Fabrikasi A/S | 23,988 | 147,751 | |
| Tupras Turkiye Petrol Rafinerileri A/S | 11,000 | 280,274 | |
| Turkcell Iletisim Hizmet A/S | 55,000 | 189,016 | |
| TOTAL TURKEY | 617,041 | ||
| United Arab Emirates - 0.2% | |||
| DP World Ltd. | 8,675 | 193,019 | |
| United Kingdom - 9.9% | |||
| Alliance Pharma PLC | 18,714 | 20,868 | |
| Ascential PLC | 10,612 | 61,565 | |
| AstraZeneca PLC (United Kingdom) | 6,068 | 424,774 | |
| Aviva PLC | 61,683 | 448,168 | |
| Avon Rubber PLC | 1,500 | 27,775 | |
| BAE Systems PLC | 76,202 | 639,352 | |
| BHP Billiton PLC | 24,140 | 514,723 | |
| BP PLC | 125,375 | 931,281 | |
| British American Tobacco PLC (United Kingdom) | 19,012 | 1,042,761 | |
| Bunzl PLC | 8,846 | 257,084 | |
| Cineworld Group PLC | 7,700 | 27,604 | |
| Compass Group PLC | 10,448 | 224,387 | |
| Dechra Pharmaceuticals PLC | 4,100 | 154,771 | |
| DP Poland PLC (a) | 40,100 | 16,838 | |
| Elementis PLC | 44,408 | 173,383 | |
| GlaxoSmithKline PLC | 12,475 | 250,213 | |
| Great Portland Estates PLC | 5,506 | 52,864 | |
| Hilton Food Group PLC | 2,654 | 32,372 | |
| Howden Joinery Group PLC | 4,500 | 29,532 | |
| HSBC Holdings PLC sponsored ADR | 8,131 | 408,664 | |
| Imperial Tobacco Group PLC | 9,638 | 345,582 | |
| Informa PLC | 81,957 | 833,815 | |
| InterContinental Hotel Group PLC ADR | 9,091 | 578,551 | |
| ITE Group PLC | 17,600 | 36,829 | |
| Liberty Global PLC Class A (a) | 6,300 | 189,882 | |
| Melrose Industries PLC | 52,773 | 165,648 | |
| Micro Focus International PLC | 8,658 | 149,291 | |
| NMC Health PLC | 3,662 | 179,880 | |
| Prudential PLC | 38,892 | 1,000,071 | |
| Reckitt Benckiser Group PLC | 5,551 | 435,465 | |
| Rightmove PLC | 2,400 | 150,831 | |
| Royal Dutch Shell PLC Class B sponsored ADR | 11,000 | 796,620 | |
| Shaftesbury PLC | 13,137 | 182,847 | |
| Spectris PLC | 10,070 | 372,925 | |
| Spirax-Sarco Engineering PLC | 1,899 | 150,717 | |
| Standard Chartered PLC (United Kingdom) | 31,309 | 330,601 | |
| Standard Life PLC | 64,324 | 323,491 | |
| The Weir Group PLC | 7,800 | 229,369 | |
| Topps Tiles PLC | 19,600 | 18,618 | |
| Ultra Electronics Holdings PLC | 2,001 | 38,787 | |
| TOTAL UNITED KINGDOM | 12,248,799 | ||
| United States of America - 8.4% | |||
| A.O. Smith Corp. | 2,762 | 169,449 | |
| Alphabet, Inc. Class A (a) | 771 | 785,325 | |
| Amgen, Inc. | 1,100 | 191,928 | |
| Amphenol Corp. Class A | 2,040 | 170,768 | |
| Autoliv, Inc. | 3,474 | 465,690 | |
| Berkshire Hathaway, Inc. Class B (a) | 2,416 | 468,052 | |
| Black Knight, Inc. (a) | 2,100 | 102,165 | |
| ConocoPhillips Co. | 4,500 | 294,750 | |
| Facebook, Inc. Class A (a) | 1,000 | 172,000 | |
| Hilton Worldwide Holdings, Inc. | 2,100 | 165,564 | |
| Martin Marietta Materials, Inc. | 1,930 | 375,906 | |
| MasterCard, Inc. Class A | 6,253 | 1,114,722 | |
| Mettler-Toledo International, Inc. (a) | 300 | 167,979 | |
| Mohawk Industries, Inc. (a) | 1,365 | 286,486 | |
| Moody's Corp. | 2,839 | 460,486 | |
| MSCI, Inc. | 3,951 | 591,978 | |
| NVIDIA Corp. | 800 | 179,920 | |
| PayPal Holdings, Inc. (a) | 4,400 | 328,284 | |
| Philip Morris International, Inc. | 5,300 | 434,600 | |
| PriceSmart, Inc. | 2,385 | 208,926 | |
| ResMed, Inc. | 4,610 | 436,290 | |
| S&P Global, Inc. | 4,201 | 792,309 | |
| Sherwin-Williams Co. | 1,500 | 551,490 | |
| Visa, Inc. Class A | 9,231 | 1,171,229 | |
| Yum China Holdings, Inc. | 6,600 | 282,216 | |
| TOTAL UNITED STATES OF AMERICA | 10,368,512 | ||
| TOTAL COMMON STOCKS | |||
| (Cost $103,674,967) | 118,543,611 | ||
| Nonconvertible Preferred Stocks - 1.5% | |||
| Brazil - 1.1% | |||
| Ambev SA sponsored ADR | 53,100 | 351,522 | |
| Itau Unibanco Holding SA | 48,270 | 702,858 | |
| Itausa-Investimentos Itau SA (PN) | 68,700 | 266,901 | |
| TOTAL BRAZIL | 1,321,281 | ||
| Germany - 0.3% | |||
| Porsche Automobil Holding SE (Germany) | 3,500 | 299,243 | |
| Sartorius AG (non-vtg.) | 630 | 97,229 | |
| TOTAL GERMANY | 396,472 | ||
| Spain - 0.1% | |||
| Grifols SA Class B | 8,100 | 166,960 | |
| TOTAL NONCONVERTIBLE PREFERRED STOCKS | |||
| (Cost $1,667,580) | 1,884,713 | ||
| Money Market Funds - 2.3% | |||
| Fidelity Cash Central Fund, 1.74% (d) | 2,080,643 | 2,081,059 | |
| Fidelity Securities Lending Cash Central Fund 1.74% (d)(e) | 824,105 | 824,187 | |
| TOTAL MONEY MARKET FUNDS | |||
| (Cost $2,905,246) | 2,905,246 | ||
| TOTAL INVESTMENT IN SECURITIES - 99.9% | |||
| (Cost $108,247,793) | 123,333,570 | ||
| NET OTHER ASSETS (LIABILITIES) - 0.1% | 74,171 | ||
| NET ASSETS - 100% | $123,407,741 |
Categorizations in the Schedule of Investments are based on country or territory of incorporation.
Legend
(a) Non-income producing
(b) Security exempt from registration under Rule 144A of the Securities Act of 1933. These securities may be resold in transactions exempt from registration, normally to qualified institutional buyers. At the end of the period, the value of these securities amounted to $87,963 or 0.1% of net assets.
(c) Security or a portion of the security is on loan at period end.
(d) Affiliated fund that is generally available only to investment companies and other accounts managed by Fidelity Investments. The rate quoted is the annualized seven-day yield of the fund at period end. A complete unaudited listing of the fund's holdings as of its most recent quarter end is available upon request. In addition, each Fidelity Central Fund's financial statements are available on the SEC's website or upon request.
(e) Investment made with cash collateral received from securities on loan.
Affiliated Central Funds
Information regarding fiscal year to date income earned by the Fund from investments in Fidelity Central Funds is as follows:
| Fund | Income earned |
| Fidelity Cash Central Fund | $13,811 |
| Fidelity Securities Lending Cash Central Fund | 4,991 |
| Total | $18,802 |
Amounts in the income column in the above table include any capital gain distributions from underlying funds, which are presented in the corresponding line-item in the Statement of Operations if applicable.
Investment Valuation
The following is a summary of the inputs used, as of April 30, 2018, involving the Fund's assets and liabilities carried at fair value. The inputs or methodology used for valuing securities may not be an indication of the risk associated with investing in those securities. For more information on valuation inputs, and their aggregation into the levels used below, please refer to the Investment Valuation section in the accompanying Notes to Financial Statements.
| Valuation Inputs at Reporting Date: | ||||
| Description | Total | Level 1 | Level 2 | Level 3 |
| Investments in Securities: | ||||
| Equities: | ||||
| Consumer Discretionary | $12,952,673 | $8,115,349 | $4,837,324 | $-- |
| Consumer Staples | 9,573,626 | 5,056,240 | 4,517,386 | -- |
| Energy | 6,185,544 | 3,044,755 | 3,140,789 | -- |
| Financials | 28,459,216 | 14,145,867 | 14,313,349 | -- |
| Health Care | 9,569,431 | 3,188,327 | 6,381,104 | -- |
| Industrials | 17,952,413 | 13,714,762 | 4,237,651 | -- |
| Information Technology | 21,582,545 | 15,662,300 | 5,920,245 | -- |
| Materials | 10,023,108 | 6,860,506 | 3,162,602 | -- |
| Real Estate | 1,846,413 | 1,432,514 | 413,899 | -- |
| Telecommunication Services | 1,737,657 | 920,277 | 817,380 | -- |
| Utilities | 545,698 | 379,881 | 165,817 | -- |
| Money Market Funds | 2,905,246 | 2,905,246 | -- | -- |
| Total Investments in Securities: | $123,333,570 | $75,426,024 | $47,907,546 | $-- |
The following is a summary of transfers between Level 1 and Level 2 for the period ended April 30, 2018. Transfers are assumed to have occurred at the beginning of the period, and are primarily attributable to the valuation techniques used for foreign equity securities, as discussed in the accompanying Notes to Financial Statements:
| Transfers | Total |
| Level 1 to Level 2 | $17,647,146 |
| Level 2 to Level 1 | $14,652,933 |
See accompanying notes which are an integral part of the financial statements.
Financial Statements
Statement of Assets and Liabilities
| April 30, 2018 (Unaudited) | ||
| Assets | ||
| Investment in securities, at value (including securities loaned of $790,441) — See accompanying schedule: Unaffiliated issuers (cost $105,342,547) | $120,428,324 | |
| Fidelity Central Funds (cost $2,905,246) | 2,905,246 | |
| Total Investment in Securities (cost $108,247,793) | $123,333,570 | |
| Cash | 34,369 | |
| Foreign currency held at value (cost $94,888) | 95,096 | |
| Receivable for investments sold | 419,733 | |
| Receivable for fund shares sold | 124,436 | |
| Dividends receivable | 879,578 | |
| Distributions receivable from Fidelity Central Funds | 4,287 | |
| Prepaid expenses | 57 | |
| Receivable from investment adviser for expense reductions | 14,725 | |
| Other receivables | 20,886 | |
| Total assets | 124,926,737 | |
| Liabilities | ||
| Payable for investments purchased | $324,866 | |
| Payable for fund shares redeemed | 117,530 | |
| Accrued management fee | 86,427 | |
| Distribution and service plan fees payable | 10,956 | |
| Other affiliated payables | 24,314 | |
| Other payables and accrued expenses | 130,754 | |
| Collateral on securities loaned | 824,149 | |
| Total liabilities | 1,518,996 | |
| Net Assets | $123,407,741 | |
| Net Assets consist of: | ||
| Paid in capital | $111,147,897 | |
| Undistributed net investment income | 552,973 | |
| Accumulated undistributed net realized gain (loss) on investments and foreign currency transactions | (3,319,994) | |
| Net unrealized appreciation (depreciation) on investments and assets and liabilities in foreign currencies | 15,026,865 | |
| Net Assets | $123,407,741 | |
| Calculation of Maximum Offering Price | ||
| Class A: | ||
| Net Asset Value and redemption price per share ($8,924,317 ÷ 966,239 shares) | $9.24 | |
| Maximum offering price per share (100/94.25 of $9.24) | $9.80 | |
| Class M: | ||
| Net Asset Value and redemption price per share ($15,163,646 ÷ 1,634,961 shares) | $9.27 | |
| Maximum offering price per share (100/96.50 of $9.27) | $9.61 | |
| Class C: | ||
| Net Asset Value and offering price per share ($3,254,365 ÷ 352,101 shares)(a) | $9.24 | |
| Total International Equity: | ||
| Net Asset Value, offering price and redemption price per share ($85,981,011 ÷ 9,281,532 shares) | $9.26 | |
| Class I: | ||
| Net Asset Value, offering price and redemption price per share ($9,716,529 ÷ 1,053,884 shares) | $9.22 | |
| Class Z: | ||
| Net Asset Value, offering price and redemption price per share ($367,873 ÷ 39,805 shares) | $9.24 |
(a) Redemption price per share is equal to net asset value less any applicable contingent deferred sales charge.
See accompanying notes which are an integral part of the financial statements.
Statement of Operations
| Six months ended April 30, 2018 (Unaudited) | ||
| Investment Income | ||
| Dividends | $1,479,305 | |
| Income from Fidelity Central Funds | 18,802 | |
| Income before foreign taxes withheld | 1,498,107 | |
| Less foreign taxes withheld | (143,321) | |
| Total income | 1,354,786 | |
| Expenses | ||
| Management fee | ||
| Basic fee | $424,732 | |
| Performance adjustment | 95,601 | |
| Transfer agent fees | 113,886 | |
| Distribution and service plan fees | 67,578 | |
| Accounting and security lending fees | 31,876 | |
| Custodian fees and expenses | 71,300 | |
| Independent trustees' fees and expenses | 241 | |
| Registration fees | 39,408 | |
| Audit | 49,680 | |
| Legal | 1,205 | |
| Miscellaneous | 419 | |
| Total expenses before reductions | 895,926 | |
| Expense reductions | (95,755) | 800,171 |
| Net investment income (loss) | 554,615 | |
| Realized and Unrealized Gain (Loss) | ||
| Net realized gain (loss) on: | ||
| Investment securities: | ||
| Unaffiliated issuers | 3,187,699 | |
| Fidelity Central Funds | 91 | |
| Foreign currency transactions | (7,315) | |
| Total net realized gain (loss) | 3,180,475 | |
| Change in net unrealized appreciation (depreciation) on: | ||
| Investment securities: | ||
| Unaffiliated issuers (net of decrease in deferred foreign taxes of $57,326) | (865,993) | |
| Assets and liabilities in foreign currencies | (4,986) | |
| Total change in net unrealized appreciation (depreciation) | (870,979) | |
| Net gain (loss) | 2,309,496 | |
| Net increase (decrease) in net assets resulting from operations | $2,864,111 |
See accompanying notes which are an integral part of the financial statements.
Statement of Changes in Net Assets
| Six months ended April 30, 2018 (Unaudited) | Year ended October 31, 2017 | |
| Increase (Decrease) in Net Assets | ||
| Operations | ||
| Net investment income (loss) | $554,615 | $2,786,915 |
| Net realized gain (loss) | 3,180,475 | 70,763,610 |
| Change in net unrealized appreciation (depreciation) | (870,979) | (21,931,310) |
| Net increase (decrease) in net assets resulting from operations | 2,864,111 | 51,619,215 |
| Distributions to shareholders from net investment income | (1,843,688) | (4,227,310) |
| Distributions to shareholders from net realized gain | (2,829,792) | – |
| Total distributions | (4,673,480) | (4,227,310) |
| Share transactions - net increase (decrease) | 7,720,597 | (237,908,011) |
| Redemption fees | 13 | 2,629 |
| Total increase (decrease) in net assets | 5,911,241 | (190,513,477) |
| Net Assets | ||
| Beginning of period | 117,496,500 | 308,009,977 |
| End of period | $123,407,741 | $117,496,500 |
| Other Information | ||
| Undistributed net investment income end of period | $552,973 | $1,842,046 |
See accompanying notes which are an integral part of the financial statements.
Financial Highlights
Fidelity Total International Equity Fund Class A
| Six months ended (Unaudited) April 30, | Years endedOctober 31, | |||||
| 2018 | 2017 | 2016 | 2015 | 2014 | 2013 | |
| Selected Per–Share Data | ||||||
| Net asset value, beginning of period | $9.39 | $7.67 | $7.79 | $8.00 | $8.27 | $7.31 |
| Income from Investment Operations | ||||||
| Net investment income (loss)A | .04 | .09 | .08 | .07 | .13 | .09 |
| Net realized and unrealized gain (loss) | .19 | 1.71 | (.14) | (.14) | (.12) | 1.24 |
| Total from investment operations | .23 | 1.80 | (.06) | (.07) | .01 | 1.33 |
| Distributions from net investment income | (.15) | (.08) | (.06) | (.10) | (.10) | (.13) |
| Distributions from net realized gain | (.23) | – | – | (.04) | (.18) | (.25) |
| Total distributions | (.38) | (.08) | (.06) | (.14) | (.28) | (.37)B |
| Redemption fees added to paid in capitalA,C | – | – | – | – | – | – |
| Net asset value, end of period | $9.24 | $9.39 | $7.67 | $7.79 | $8.00 | $8.27 |
| Total ReturnD,E,F | 2.50% | 23.78% | (.76)% | (.89)% | .19% | 19.00% |
| Ratios to Average Net AssetsG,H | ||||||
| Expenses before reductions | 1.64%I | 1.67% | 1.52% | 1.48% | 1.44% | 1.50% |
| Expenses net of fee waivers, if any | 1.45%I | 1.45% | 1.45% | 1.45% | 1.44% | 1.45% |
| Expenses net of all reductions | 1.44%I | 1.43% | 1.45% | 1.44% | 1.44% | 1.43% |
| Net investment income (loss) | .76%I | 1.02% | 1.10% | .86% | 1.63% | 1.21% |
| Supplemental Data | ||||||
| Net assets, end of period (000 omitted) | $8,924 | $9,292 | $8,576 | $9,163 | $9,164 | $9,034 |
| Portfolio turnover rateJ | 53%I | 66%K | 51% | 53% | 85% | 89% |
A Calculated based on average shares outstanding during the period.
B Total distributions of $.37 per share is comprised of distributions from net investment income of $.126 and distributions from net realized gain of $.245 per share.
C Amount represents less than $.005 per share.
D Total returns for periods of less than one year are not annualized.
E Total returns would have been lower if certain expenses had not been reduced during the applicable periods shown.
F Total returns do not include the effect of the sales charges.
G Fees and expenses of any underlying Fidelity Central Funds are not included in the Fund's expense ratio. The Fund indirectly bears its proportionate share of the expenses of any underlying Fidelity Central Funds.
H Expense ratios reflect operating expenses of the class. Expenses before reductions do not reflect amounts reimbursed by the investment adviser or reductions from brokerage service arrangements or reductions from other expense offset arrangements and do not represent the amount paid by the class during periods when reimbursements or reductions occur. Expenses net of fee waivers reflect expenses after reimbursement by the investment adviser but prior to reductions from brokerage service arrangements or other expense offset arrangements. Expenses net of all reductions represent the net expenses paid by the class.
I Annualized
J Amount does not include the portfolio activity of any underlying Fidelity Central Funds.
K Portfolio turnover rate excludes securities received or delivered in-kind.
See accompanying notes which are an integral part of the financial statements.
Fidelity Total International Equity Fund Class M
| Six months ended (Unaudited) April 30, | Years endedOctober 31, | |||||
| 2018 | 2017 | 2016 | 2015 | 2014 | 2013 | |
| Selected Per–Share Data | ||||||
| Net asset value, beginning of period | $9.42 | $7.70 | $7.81 | $8.04 | $8.32 | $7.37 |
| Income from Investment Operations | ||||||
| Net investment income (loss)A | .02 | .06 | .06 | .05 | .11 | .07 |
| Net realized and unrealized gain (loss) | .19 | 1.73 | (.13) | (.15) | (.12) | 1.25 |
| Total from investment operations | .21 | 1.79 | (.07) | (.10) | (.01) | 1.32 |
| Distributions from net investment income | (.13) | (.07) | (.04) | (.09) | (.09) | (.13) |
| Distributions from net realized gain | (.23) | – | – | (.04) | (.18) | (.25) |
| Total distributions | (.36) | (.07) | (.04) | (.13) | (.27) | (.37)B |
| Redemption fees added to paid in capitalA,C | – | – | – | – | – | – |
| Net asset value, end of period | $9.27 | $9.42 | $7.70 | $7.81 | $8.04 | $8.32 |
| Total ReturnD,E,F | 2.28% | 23.41% | (.86)% | (1.26)% | (.06)% | 18.73% |
| Ratios to Average Net AssetsG,H | ||||||
| Expenses before reductions | 1.88%I | 1.90% | 1.73% | 1.70% | 1.68% | 1.75% |
| Expenses net of fee waivers, if any | 1.70%I | 1.70% | 1.70% | 1.70% | 1.68% | 1.70% |
| Expenses net of all reductions | 1.69%I | 1.68% | 1.69% | 1.69% | 1.68% | 1.67% |
| Net investment income (loss) | .51%I | .77% | .85% | .61% | 1.38% | .96% |
| Supplemental Data | ||||||
| Net assets, end of period (000 omitted) | $15,164 | $15,894 | $13,893 | $13,962 | $10,282 | $7,909 |
| Portfolio turnover rateJ | 53%I | 66%K | 51% | 53% | 85% | 89% |
A Calculated based on average shares outstanding during the period.
B Total distributions of $.37 per share is comprised of distributions from net investment income of $.128 and distributions from net realized gain of $.245 per share.
C Amount represents less than $.005 per share.
D Total returns for periods of less than one year are not annualized.
E Total returns would have been lower if certain expenses had not been reduced during the applicable periods shown.
F Total returns do not include the effect of the sales charges.
G Fees and expenses of any underlying Fidelity Central Funds are not included in the Fund's expense ratio. The Fund indirectly bears its proportionate share of the expenses of any underlying Fidelity Central Funds.
H Expense ratios reflect operating expenses of the class. Expenses before reductions do not reflect amounts reimbursed by the investment adviser or reductions from brokerage service arrangements or reductions from other expense offset arrangements and do not represent the amount paid by the class during periods when reimbursements or reductions occur. Expenses net of fee waivers reflect expenses after reimbursement by the investment adviser but prior to reductions from brokerage service arrangements or other expense offset arrangements. Expenses net of all reductions represent the net expenses paid by the class.
I Annualized
J Amount does not include the portfolio activity of any underlying Fidelity Central Funds.
K Portfolio turnover rate excludes securities received or delivered in-kind.
See accompanying notes which are an integral part of the financial statements.
Fidelity Total International Equity Fund Class C
| Six months ended (Unaudited) April 30, | Years endedOctober 31, | |||||
| 2018 | 2017 | 2016 | 2015 | 2014 | 2013 | |
| Selected Per–Share Data | ||||||
| Net asset value, beginning of period | $9.37 | $7.66 | $7.77 | $8.00 | $8.28 | $7.31 |
| Income from Investment Operations | ||||||
| Net investment income (loss)A | –B | .02 | .03 | .01 | .07 | .04 |
| Net realized and unrealized gain (loss) | .19 | 1.71 | (.14) | (.15) | (.12) | 1.25 |
| Total from investment operations | .19 | 1.73 | (.11) | (.14) | (.05) | 1.29 |
| Distributions from net investment income | (.10) | (.02) | – | (.05) | (.05) | (.08) |
| Distributions from net realized gain | (.23) | – | – | (.04) | (.18) | (.25) |
| Total distributions | (.32)C | (.02) | – | (.09) | (.23) | (.32)D |
| Redemption fees added to paid in capitalA,B | – | – | – | – | – | – |
| Net asset value, end of period | $9.24 | $9.37 | $7.66 | $7.77 | $8.00 | $8.28 |
| Total ReturnE,F,G | 2.11% | 22.70% | (1.42)% | (1.73)% | (.57)% | 18.30% |
| Ratios to Average Net AssetsH,I | ||||||
| Expenses before reductions | 2.47%J | 2.48% | 2.30% | 2.26% | 2.22% | 2.26% |
| Expenses net of fee waivers, if any | 2.20%J | 2.20% | 2.20% | 2.20% | 2.20% | 2.20% |
| Expenses net of all reductions | 2.19%J | 2.18% | 2.20% | 2.19% | 2.20% | 2.18% |
| Net investment income (loss) | .01%J | .27% | .35% | .11% | .87% | .46% |
| Supplemental Data | ||||||
| Net assets, end of period (000 omitted) | $3,254 | $3,211 | $2,713 | $3,311 | $4,028 | $3,584 |
| Portfolio turnover rateK | 53%J | 66%L | 51% | 53% | 85% | 89% |
A Calculated based on average shares outstanding during the period.
B Amount represents less than $.005 per share.
C Total distributions of $.32 per share is comprised of distributions from net investment income of $.097 and distributions from net realized gain of $.226 per share.
D Total distributions of $.32 per share is comprised of distributions from net investment income of $.075 and distributions from net realized gain of $.245 per share.
E Total returns for periods of less than one year are not annualized.
F Total returns would have been lower if certain expenses had not been reduced during the applicable periods shown.
G Total returns do not include the effect of the contingent deferred sales charge.
H Fees and expenses of any underlying Fidelity Central Funds are not included in the Fund's expense ratio. The Fund indirectly bears its proportionate share of the expenses of any underlying Fidelity Central Funds.
I Expense ratios reflect operating expenses of the class. Expenses before reductions do not reflect amounts reimbursed by the investment adviser or reductions from brokerage service arrangements or reductions from other expense offset arrangements and do not represent the amount paid by the class during periods when reimbursements or reductions occur. Expenses net of fee waivers reflect expenses after reimbursement by the investment adviser but prior to reductions from brokerage service arrangements or other expense offset arrangements. Expenses net of all reductions represent the net expenses paid by the class.
J Annualized
K Amount does not include the portfolio activity of any underlying Fidelity Central Funds.
L Portfolio turnover rate excludes securities received or delivered in-kind.
See accompanying notes which are an integral part of the financial statements.
Fidelity Total International Equity Fund
| Six months ended (Unaudited) April 30, | Years endedOctober 31, | |||||
| 2018 | 2017 | 2016 | 2015 | 2014 | 2013 | |
| Selected Per–Share Data | ||||||
| Net asset value, beginning of period | $9.40 | $7.70 | $7.82 | $8.03 | $8.29 | $7.32 |
| Income from Investment Operations | ||||||
| Net investment income (loss)A | .05 | .11 | .11 | .10 | .16 | .12 |
| Net realized and unrealized gain (loss) | .19 | 1.70 | (.13) | (.14) | (.12) | 1.24 |
| Total from investment operations | .24 | 1.81 | (.02) | (.04) | .04 | 1.36 |
| Distributions from net investment income | (.15) | (.11) | (.10) | (.13) | (.12) | (.15) |
| Distributions from net realized gain | (.23) | – | – | (.04) | (.18) | (.25) |
| Total distributions | (.38) | (.11) | (.10) | (.17) | (.30) | (.39)B |
| Redemption fees added to paid in capitalA,C | – | – | – | – | – | – |
| Net asset value, end of period | $9.26 | $9.40 | $7.70 | $7.82 | $8.03 | $8.29 |
| Total ReturnD,E | 2.57% | 23.86% | (.32)% | (.51)% | .55% | 19.48% |
| Ratios to Average Net AssetsF,G | ||||||
| Expenses before reductions | 1.33%H | 1.15% | 1.11% | 1.07% | 1.04% | 1.09% |
| Expenses net of fee waivers, if any | 1.20%H | 1.14% | 1.11% | 1.07% | 1.04% | 1.09% |
| Expenses net of all reductions | 1.19%H | 1.13% | 1.10% | 1.06% | 1.04% | 1.07% |
| Net investment income (loss) | 1.01%H | 1.33% | 1.44% | 1.24% | 2.03% | 1.57% |
| Supplemental Data | ||||||
| Net assets, end of period (000 omitted) | $85,981 | $82,077 | $280,672 | $307,035 | $324,438 | $324,395 |
| Portfolio turnover rateI | 53%H | 66%J | 51% | 53% | 85% | 89% |
A Calculated based on average shares outstanding during the period.
B Total distributions of $.39 per share is comprised of distributions from net investment income of $.148 and distributions from net realized gain of $.245 per share.
C Amount represents less than $.005 per share.
D Total returns for periods of less than one year are not annualized.
E Total returns would have been lower if certain expenses had not been reduced during the applicable periods shown.
F Fees and expenses of any underlying Fidelity Central Funds are not included in the Fund's expense ratio. The Fund indirectly bears its proportionate share of the expenses of any underlying Fidelity Central Funds.
G Expense ratios reflect operating expenses of the class. Expenses before reductions do not reflect amounts reimbursed by the investment adviser or reductions from brokerage service arrangements or reductions from other expense offset arrangements and do not represent the amount paid by the class during periods when reimbursements or reductions occur. Expenses net of fee waivers reflect expenses after reimbursement by the investment adviser but prior to reductions from brokerage service arrangements or other expense offset arrangements. Expenses net of all reductions represent the net expenses paid by the class.
H Annualized
I Amount does not include the portfolio activity of any underlying Fidelity Central Funds.
J Portfolio turnover rate excludes securities received or delivered in-kind.
See accompanying notes which are an integral part of the financial statements.
Fidelity Total International Equity Fund Class I
| Six months ended (Unaudited) April 30, | Years endedOctober 31, | |||||
| 2018 | 2017 | 2016 | 2015 | 2014 | 2013 | |
| Selected Per–Share Data | ||||||
| Net asset value, beginning of period | $9.38 | $7.66 | $7.78 | $7.99 | $8.26 | $7.30 |
| Income from Investment Operations | ||||||
| Net investment income (loss)A | .05 | .11 | .10 | .09 | .15 | .11 |
| Net realized and unrealized gain (loss) | .19 | 1.71 | (.13) | (.14) | (.12) | 1.24 |
| Total from investment operations | .24 | 1.82 | (.03) | (.05) | .03 | 1.35 |
| Distributions from net investment income | (.17) | (.10) | (.09) | (.12) | (.12) | (.15) |
| Distributions from net realized gain | (.23) | – | – | (.04) | (.18) | (.25) |
| Total distributions | (.40) | (.10) | (.09) | (.16) | (.30) | (.39)B |
| Redemption fees added to paid in capitalA,C | – | – | – | – | – | – |
| Net asset value, end of period | $9.22 | $9.38 | $7.66 | $7.78 | $7.99 | $8.26 |
| Total ReturnD,E | 2.61% | 24.08% | (.43)% | (.64)% | .37% | 19.40% |
| Ratios to Average Net AssetsF,G | ||||||
| Expenses before reductions | 1.34%H | 1.42% | 1.22% | 1.17% | 1.15% | 1.21% |
| Expenses net of fee waivers, if any | 1.20%H | 1.20% | 1.20% | 1.17% | 1.15% | 1.20% |
| Expenses net of all reductions | 1.19%H | 1.18% | 1.20% | 1.16% | 1.15% | 1.18% |
| Net investment income (loss) | 1.01%H | 1.28% | 1.35% | 1.14% | 1.91% | 1.46% |
| Supplemental Data | ||||||
| Net assets, end of period (000 omitted) | $9,717 | $6,776 | $2,156 | $2,602 | $2,240 | $2,372 |
| Portfolio turnover rateI | 53%H | 66%J | 51% | 53% | 85% | 89% |
A Calculated based on average shares outstanding during the period.
B Total distributions of $.39 per share is comprised of distributions from net investment income of $.148 and distributions from net realized gain of $.245 per share.
C Amount represents less than $.005 per share.
D Total returns for periods of less than one year are not annualized.
E Total returns would have been lower if certain expenses had not been reduced during the applicable periods shown.
F Fees and expenses of any underlying Fidelity Central Funds are not included in the Fund's expense ratio. The Fund indirectly bears its proportionate share of the expenses of any underlying Fidelity Central Funds.
G Expense ratios reflect operating expenses of the class. Expenses before reductions do not reflect amounts reimbursed by the investment adviser or reductions from brokerage service arrangements or reductions from other expense offset arrangements and do not represent the amount paid by the class during periods when reimbursements or reductions occur. Expenses net of fee waivers reflect expenses after reimbursement by the investment adviser but prior to reductions from brokerage service arrangements or other expense offset arrangements. Expenses net of all reductions represent the net expenses paid by the class.
H Annualized
I Amount does not include the portfolio activity of any underlying Fidelity Central Funds.
J Portfolio turnover rate excludes securities received or delivered in-kind.
See accompanying notes which are an integral part of the financial statements.
Fidelity Total International Equity Fund Class Z
| Six months ended (Unaudited) April 30, | Years endedOctober 31, | |
| 2018 | 2017 A | |
| Selected Per–Share Data | ||
| Net asset value, beginning of period | $9.39 | $7.73 |
| Income from Investment Operations | ||
| Net investment income (loss)B | .05 | .08 |
| Net realized and unrealized gain (loss) | .20 | 1.58 |
| Total from investment operations | .25 | 1.66 |
| Distributions from net investment income | (.17) | – |
| Distributions from net realized gain | (.23) | – |
| Total distributions | (.40) | – |
| Redemption fees added to paid in capitalB,C | – | – |
| Net asset value, end of period | $9.24 | $9.39 |
| Total ReturnD,E | 2.71% | 21.47% |
| Ratios to Average Net AssetsF,G | ||
| Expenses before reductions | 1.21%H | 1.32%H |
| Expenses net of fee waivers, if any | 1.05%H | 1.05%H |
| Expenses net of all reductions | 1.04%H | 1.04%H |
| Net investment income (loss) | 1.16%H | 1.27%H |
| Supplemental Data | ||
| Net assets, end of period (000 omitted) | $368 | $246 |
| Portfolio turnover rateI | 53%H | 66%J |
A For the period February 1, 2017 (commencement of sale of shares) to October 31, 2017.
B Calculated based on average shares outstanding during the period.
C Amount represents less than $.005 per share.
D Total returns for periods of less than one year are not annualized.
E Total returns would have been lower if certain expenses had not been reduced during the applicable periods shown.
F Fees and expenses of any underlying Fidelity Central Funds are not included in the Fund's expense ratio. The Fund indirectly bears its proportionate share of the expenses of any underlying Fidelity Central Funds.
G Expense ratios reflect operating expenses of the class. Expenses before reductions do not reflect amounts reimbursed by the investment adviser or reductions from brokerage service arrangements or reductions from other expense offset arrangements and do not represent the amount paid by the class during periods when reimbursements or reductions occur. Expense ratios before reductions for start-up periods may not be representative of longer-term operating periods. Expenses net of fee waivers reflect expenses after reimbursement by the investment adviser but prior to reductions from brokerage service arrangements or other expense offset arrangements. Expenses net of all reductions represent the net expenses paid by the class.
H Annualized
I Amount does not include the portfolio activity of any underlying Fidelity Central Funds.
J Portfolio turnover rate excludes securities received or delivered in-kind.
See accompanying notes which are an integral part of the financial statements.
Notes to Financial Statements (Unaudited)
For the period ended April 30, 2018
1. Organization.
Fidelity Total International Equity Fund (the Fund) is a fund of Fidelity Investment Trust (the Trust) and is authorized to issue an unlimited number of shares. The Trust is registered under the Investment Company Act of 1940, as amended (the 1940 Act), as an open-end management investment company organized as a Massachusetts business trust. The Fund offers Class A, Class M, Class C, Total International Equity, Class I and Class Z shares, each of which has equal rights as to assets and voting privileges. Each class has exclusive voting rights with respect to matters that affect that class. The Fund's investments in emerging markets can be subject to social, economic, regulatory, and political uncertainties and can be extremely volatile.
2. Investments in Fidelity Central Funds.
The Fund invests in Fidelity Central Funds, which are open-end investment companies generally available only to other investment companies and accounts managed by the investment adviser and its affiliates. The Fund's Schedule of Investments lists each of the Fidelity Central Funds held as of period end, if any, as an investment of the Fund, but does not include the underlying holdings of each Fidelity Central Fund. As an Investing Fund, the Fund indirectly bears its proportionate share of the expenses of the underlying Fidelity Central Funds.
The Money Market Central Funds seek preservation of capital and current income and are managed by Fidelity Investments Money Management, Inc. (FIMM), an affiliate of the investment adviser. Annualized expenses of the Money Market Central Funds as of their most recent shareholder report date are less than .005%.
A complete unaudited list of holdings for each Fidelity Central Fund is available upon request or at the Securities and Exchange Commission (the SEC) website at www.sec.gov. In addition, the financial statements of the Fidelity Central Funds are available on the SEC website or upon request.
3. Significant Accounting Policies.
The Fund is an investment company and applies the accounting and reporting guidance of the Financial Accounting Standards Board (FASB) Accounting Standards Codification Topic 946 Financial Services – Investments Companies. The financial statements have been prepared in conformity with accounting principles generally accepted in the United States of America (GAAP), which require management to make certain estimates and assumptions at the date of the financial statements. Actual results could differ from those estimates. Subsequent events, if any, through the date that the financial statements were issued have been evaluated in the preparation of the financial statements. The following summarizes the significant accounting policies of the Fund:
Investment Valuation. Investments are valued as of 4:00 p.m. Eastern time on the last calendar day of the period. The Board of Trustees (the Board) has delegated the day to day responsibility for the valuation of the Fund's investments to the Fair Value Committee (the Committee) established by the Fund's investment adviser. In accordance with valuation policies and procedures approved by the Board, the Fund attempts to obtain prices from one or more third party pricing vendors or brokers to value its investments. When current market prices, quotations or currency exchange rates are not readily available or reliable, investments will be fair valued in good faith by the Committee, in accordance with procedures adopted by the Board. Factors used in determining fair value vary by investment type and may include market or investment specific events. The frequency with which these procedures are used cannot be predicted and they may be utilized to a significant extent. The Committee oversees the Fund's valuation policies and procedures and reports to the Board on the Committee's activities and fair value determinations. The Board monitors the appropriateness of the procedures used in valuing the Fund's investments and ratifies the fair value determinations of the Committee.
The Fund categorizes the inputs to valuation techniques used to value its investments into a disclosure hierarchy consisting of three levels as shown below:
- Level 1 – quoted prices in active markets for identical investments
- Level 2 – other significant observable inputs (including quoted prices for similar investments, interest rates, prepayment speeds, etc.)
- Level 3 – unobservable inputs (including the Fund's own assumptions based on the best information available)
Valuation techniques used to value the Fund's investments by major category are as follows:
Equity securities, including restricted securities, for which market quotations are readily available, are valued at the last reported sale price or official closing price as reported by a third party pricing vendor on the primary market or exchange on which they are traded and are categorized as Level 1 in the hierarchy. In the event there were no sales during the day or closing prices are not available, securities are valued at the last quoted bid price or may be valued using the last available price and are generally categorized as Level 2 in the hierarchy. For foreign equity securities, when market or security specific events arise, comparisons to the valuation of American Depositary Receipts (ADRs), futures contracts, Exchange-Traded Funds (ETFs) and certain indexes as well as quoted prices for similar securities may be used and would be categorized as Level 2 in the hierarchy. Utilizing these techniques may result in transfers between Level 1 and Level 2. For equity securities, including restricted securities, where observable inputs are limited, assumptions about market activity and risk are used and these securities may be categorized as Level 3 in the hierarchy.
Investments in open-end mutual funds, including the Fidelity Central Funds, are valued at their closing net asset value (NAV) each business day and are categorized as Level 1 in the hierarchy.
Changes in valuation techniques may result in transfers in or out of an assigned level within the disclosure hierarchy. The aggregate value of investments by input level as of April 30, 2018, including information on transfers between Levels 1 and 2, is included at the end of the Fund's Schedule of Investments.
Foreign Currency. The Fund may use foreign currency contracts to facilitate transactions in foreign-denominated securities. Gains and losses from these transactions may arise from changes in the value of the foreign currency or if the counterparties do not perform under the contracts' terms.
Foreign-denominated assets, including investment securities, and liabilities are translated into U.S. dollars at the exchange rates at period end. Purchases and sales of investment securities, income and dividends received and expenses denominated in foreign currencies are translated into U.S. dollars at the exchange rate in effect on the transaction date.
The effects of exchange rate fluctuations on investments are included with the net realized and unrealized gain (loss) on investment securities. Other foreign currency transactions resulting in realized and unrealized gain (loss) are disclosed separately.
Investment Transactions and Income. For financial reporting purposes, the Fund's investment holdings and NAV include trades executed through the end of the last business day of the period. The NAV per share for processing shareholder transactions is calculated as of the close of business of the New York Stock Exchange (NYSE), normally 4:00 p.m. Eastern time and includes trades executed through the end of the prior business day. Gains and losses on securities sold are determined on the basis of identified cost and includes proceeds received from litigation. Dividend income is recorded on the ex-dividend date, except for certain dividends from foreign securities where the ex-dividend date may have passed, which are recorded as soon as the Fund is informed of the ex-dividend date. Non-cash dividends included in dividend income, if any, are recorded at the fair market value of the securities received. Income and capital gain distributions from Fidelity Central Funds, if any, are recorded on the ex-dividend date. Certain distributions received by the Fund represent a return of capital or capital gain. The Fund determines the components of these distributions subsequent to the ex-dividend date, based upon receipt of tax filings or other correspondence relating to the underlying investment. These distributions are recorded as a reduction of cost of investments and/or as a realized gain. Investment income is recorded net of foreign taxes withheld where recovery of such taxes is uncertain.
Class Allocations and Expenses. Investment income, realized and unrealized capital gains and losses, common expenses of the Fund, and certain fund-level expense reductions, if any, are allocated daily on a pro-rata basis to each class based on the relative net assets of each class to the total net assets of the Fund. Each class differs with respect to transfer agent and distribution and service plan fees incurred. Certain expense reductions may also differ by class. For the reporting period, the allocated portion of income and expenses to each class as a percent of its average net assets may vary due to the timing of recording these transactions in relation to fluctuating net assets of the classes. Expenses directly attributable to a fund are charged to that fund. Expenses attributable to more than one fund are allocated among the respective funds on the basis of relative net assets or other appropriate methods. Expense estimates are accrued in the period to which they relate and adjustments are made when actual amounts are known.
Income Tax Information and Distributions to Shareholders. Each year, the Fund intends to qualify as a regulated investment company under Subchapter M of the Internal Revenue Code, including distributing substantially all of its taxable income and realized gains. As a result, no provision for U.S. Federal income taxes is required. The Fund files a U.S. federal tax return, in addition to state and local tax returns as required. The Fund's federal income tax returns are subject to examination by the Internal Revenue Service (IRS) for a period of three fiscal years after they are filed. State and local tax returns may be subject to examination for an additional fiscal year depending on the jurisdiction. Foreign taxes are provided for based on the Fund's understanding of the tax rules and rates that exist in the foreign markets in which it invests. The Fund is subject to a tax imposed on capital gains by certain countries in which it invests. An estimated deferred tax liability for net unrealized appreciation on the applicable securities is included in Other payables and accrued expenses on the Statement of Assets & Liabilities.
Distributions are declared and recorded on the ex-dividend date. Income and capital gain distributions are declared separately for each class. Income and capital gain distributions are determined in accordance with income tax regulations, which may differ from GAAP.
Capital accounts within the financial statements are adjusted for permanent book-tax differences. These adjustments have no impact on net assets or the results of operations. Capital accounts are not adjusted for temporary book-tax differences which will reverse in a subsequent period.
Book-tax differences are primarily due to futures contracts, foreign currency transactions, certain foreign taxes, passive foreign investment companies (PFIC), redemptions in kind, partnerships, capital loss carryforwards and losses deferred due to wash sales.
As of period end, the cost and unrealized appreciation (depreciation) in securities, and derivatives if applicable, for federal income tax purposes were as follows:
| Gross unrealized appreciation | $18,724,271 |
| Gross unrealized depreciation | (4,286,044) |
| Net unrealized appreciation (depreciation) | $14,438,227 |
| Tax cost | $108,895,343 |
Capital loss carryforwards are only available to offset future capital gains of the Fund to the extent provided by regulations and may be limited. Under the Regulated Investment Company Modernization Act of 2010 (the Act), the Fund is permitted to carry forward capital losses incurred in taxable years beginning after December 22, 2010 for an unlimited period and such capital losses are required to be used prior to any losses that expire. The capital loss carryforward information presented below, including any applicable limitation, is estimated as of prior fiscal period end and is subject to adjustment.
| Fiscal year of expiration | |
| 2019 | $(5,453,268) |
Due to a large redemption in a prior period, $5,453,268 of capital losses that will be available to offset future capital gains of the Fund will be limited to approximately $2,189,706 per year.
Short-Term Trading (Redemption) Fees. Shares held by investors in the Fund less than 30 days may have been subject to a redemption fee equal to 1.00% of the NAV of shares redeemed. All redemption fees, which reduce the proceeds of the shareholder redemption, are retained by the Fund and accounted for as an addition to paid in capital. In November 2017, the Board of Trustees approved the elimination of these redemption fees effective December 18, 2017.
Restricted Securities. The Fund may invest in securities that are subject to legal or contractual restrictions on resale. These securities generally may be resold in transactions exempt from registration or to the public if the securities are registered. Disposal of these securities may involve time-consuming negotiations and expense, and prompt sale at an acceptable price may be difficult. Information regarding restricted securities is included at the end of the Fund's Schedule of Investments.
4. Purchases and Sales of Investments.
Purchases and sales of securities, other than short-term securities, aggregated $35,022,649 and $32,010,577, respectively.
5. Fees and Other Transactions with Affiliates.
Management Fee. Fidelity Management & Research Company (the investment adviser) and its affiliates provide the Fund with investment management related services for which the Fund pays a monthly management fee. The management fee is the sum of an individual fund fee rate that is based on an annual rate of .45% of the Fund's average net assets and an annualized group fee rate that averaged .24% during the period. The group fee rate is based upon the average net assets of all the mutual funds advised by the investment adviser, including any mutual funds previously advised by the investment adviser that are currently advised by Fidelity SelectCo, LLC, an affiliate of the investment adviser. The group fee rate decreases as assets under management increase and increases as assets under management decrease. In addition, the management fee is subject to a performance adjustment (up to a maximum of +/- .20% of the Fund's average net assets over a 36 month performance period). The upward or downward adjustment to the management fee is based on the relative investment performance of Total International Equity as compared to its benchmark index, the MSCI All Country World ex USA Index, over the same 36 month performance period. For the reporting period, the total annualized management fee rate, including the performance adjustment, was .85% of the Fund's average net assets. The performance adjustment included in the management fee rate may be higher or lower than the maximum performance adjustment rate due to the difference between the average net assets for the reporting and performance periods.
Distribution and Service Plan Fees. In accordance with Rule 12b-1 of the 1940 Act, the Fund has adopted separate Distribution and Service Plans for each class of shares. Certain classes pay Fidelity Distributors Corporation (FDC), an affiliate of the investment adviser, separate Distribution and Service Fees, each of which is based on an annual percentage of each class' average net assets. In addition, FDC may pay financial intermediaries for selling shares of the Fund and providing shareholder support services. For the period, the Distribution and Service Fee rates, total fees and amounts retained by FDC were as follows:
| Distribution Fee | Service Fee | Total Fees | Retained by FDC | |
| Class A | -% | .25% | $11,607 | $1,022 |
| Class M | .25% | .25% | 39,436 | 477 |
| Class C | .75% | .25% | 16,535 | 2,807 |
| $67,578 | $4,306 |
Sales Load. FDC may receive a front-end sales charge of up to 5.75% for selling Class A shares and 3.50% for selling Class M shares, some of which is paid to financial intermediaries for selling shares of the Fund. Depending on the holding period, FDC may receive contingent deferred sales charges levied on Class A, Class M and Class C redemptions. The deferred sales charges are 1.00% for Class C shares, 1.00% for certain purchases of Class A shares and .25% for certain purchases of Class M shares.
For the period, sales charge amounts retained by FDC were as follows:
| Retained by FDC | |
| Class A | $2,303 |
| Class M | 1,138 |
| Class C(a) | 721 |
| $4,162 |
(a) When Class C shares are initially sold, FDC pays commissions from its own resources to financial intermediaries through which the sales are made.
Transfer Agent Fees. Fidelity Investments Institutional Operations Company, Inc., (FIIOC), an affiliate of the investment adviser, is the transfer, dividend disbursing and shareholder servicing agent for each class of the Fund. FIIOC receives account fees and asset-based fees that vary according to the account size and type of account of the shareholders of the respective classes of the Fund, except for Class Z. FIIOC receives an asset-based fee of Class Z's average net assets. FIIOC pays for typesetting, printing and mailing of shareholder reports, except proxy statements.
For the period, transfer agent fees for each class were as follows:
| Amount | % of Class-Level Average Net Assets(a) | |
| Class A | $10,722 | .23 |
| Class M | 17,548 | .22 |
| Class C | 5,055 | .31 |
| Total International Equity | 72,783 | .17 |
| Class I | 7,715 | .18 |
| Class Z | 63 | .05 |
| $113,886 |
(a) Annualized
Accounting and Security Lending Fees. Fidelity Service Company, Inc. (FSC), an affiliate of the investment adviser, maintains the Fund's accounting records. The accounting fee is based on the level of average net assets for each month. Under a separate contract, FSC administers the security lending program. The security lending fee is based on the number and duration of lending transactions. For the period, the fees were equivalent to an annualized rate of .05%.
Brokerage Commissions. The Fund placed a portion of its portfolio transactions with brokerage firms which are affiliates of the investment adviser. Brokerage commissions are included in net realized gain (loss) and change in net unrealized appreciation (depreciation) in the Statement of Operations. The commissions paid to these affiliated firms were $133 for the period.
Interfund Trades. The Fund may purchase from or sell securities to other Fidelity Funds under procedures adopted by the Board. The procedures have been designed to ensure these interfund trades are executed in accordance with Rule 17a-7 of the 1940 Act. Interfund trades are included within the respective purchases and sales amounts shown in the Purchases and Sales of Investments note.
Prior Fiscal Year Redemptions In-Kind. During the prior period, 30,358,599 shares of the Fund held by an affiliated entity were redeemed in-kind for investments and cash with a value of $259,566,026. The Fund had a net realized gain of $51,686,661 on investments delivered through the in-kind redemptions. The amount of the redemptions is included in share transactions activity shown in the accompanying Statement of Changes in Net Assets as well as the Notes to Financial Statements. The Fund recognized no gain or loss for federal income tax purposes.
6. Committed Line of Credit.
The Fund participates with other funds managed by the investment adviser or an affiliate in a $4.25 billion credit facility (the "line of credit") to be utilized for temporary or emergency purposes to fund shareholder redemptions or for other short-term liquidity purposes. The Fund has agreed to pay commitment fees on its pro-rata portion of the line of credit, which amounted to $173 and is reflected in Miscellaneous expenses on the Statement of Operations. During the period, the Fund did not borrow on this line of credit.
7. Security Lending.
The Fund lends portfolio securities through a lending agent from time to time in order to earn additional income. For equity securities, a lending agent is used and may loan securities to certain qualified borrowers, including Fidelity Capital Markets (FCM), a broker-dealer affiliated with the Fund. On the settlement date of the loan, the Fund receives collateral (in the form of U.S. Treasury obligations, letters of credit and/or cash) against the loaned securities and maintains collateral in an amount not less than 100% of the market value of the loaned securities during the period of the loan. The market value of the loaned securities is determined at the close of business of the Fund and any additional required collateral is delivered to the Fund on the next business day. The Fund or borrower may terminate the loan at any time, and if the borrower defaults on its obligation to return the securities loaned because of insolvency or other reasons, the Fund may apply collateral received from the borrower against the obligation. The Fund may experience delays and costs in recovering the securities loaned. Any cash collateral received is invested in the Fidelity Securities Lending Cash Central Fund. The value of loaned securities and cash collateral at period end are disclosed on the Fund's Statement of Assets and Liabilities. Security lending income represents the income earned on investing cash collateral, less rebates paid to borrowers and any lending agent fees associated with the loan, plus any premium payments received for lending certain types of securities. Security lending income is presented in the Statement of Operations as a component of income from Fidelity Central Funds. Total security lending income during the period amounted to $4,991. During the period, there were no securities loaned to FCM.
8. Expense Reductions.
The investment adviser contractually agreed to reimburse each class to the extent annual operating expenses exceeded certain levels of class-level average net assets as noted in the table below. This reimbursement will remain in place through December 31, 2018. Some expenses, for example the compensation of the independent Trustees, and certain miscellaneous expenses such as proxy and shareholder meeting expenses, are excluded from this reimbursement.
The following classes were in reimbursement during the period:
| Expense Limitations | Reimbursement | |
| Class A | 1.45% | $9,030 |
| Class M | 1.70% | 14,595 |
| Class C | 2.20% | 4,429 |
| Total International Equity | 1.20% | 56,001 |
| Class I | 1.20% | 5,936 |
| Class Z | 1.05% | 218 |
| $90,209 |
Commissions paid to certain brokers with whom the investment adviser, or its affiliates, places trades on behalf of the Fund include an amount in addition to trade execution, which may be rebated back to the Fund to offset certain expenses. This amount totaled $4,950 for the period.
In addition, during the period the investment adviser reimbursed and/or waived a portion of fund-level operating expenses in the amount of $596.
9. Distributions to Shareholders.
Distributions to shareholders of each class were as follows:
| Six months ended April 30, 2018 | Year ended October 31, 2017 | |
| From net investment income | ||
| Class A | $151,458 | $92,173 |
| Class M | 219,262 | 119,902 |
| Class C | 33,155 | 8,223 |
| Total International Equity | 1,290,652 | 3,979,536 |
| Class I | 144,575 | 27,476 |
| Class Z | 4,586 | – |
| Total | $1,843,688 | $4,227,310 |
| From net realized gain | ||
| Class A | $225,194 | $– |
| Class M | 372,580 | – |
| Class C | 77,248 | – |
| Total International Equity | 1,957,633 | – |
| Class I | 191,076 | – |
| Class Z | 6,061 | – |
| Total | $2,829,792 | $– |
10. Share Transactions.
Share transactions for each class were as follows and may contain automatic conversions between classes or exchanges between affiliated funds:
| Shares | Shares | Dollars | Dollars | |
| Six months ended April 30, 2018 | Year ended October 31, 2017(a) | Six months ended April 30, 2018 | Year ended October 31, 2017(a) | |
| Class A | ||||
| Shares sold | 110,826 | 192,334 | $1,039,758 | $1,631,763 |
| Reinvestment of distributions | 41,465 | 12,257 | 376,502 | 91,682 |
| Shares redeemed | (175,572) | (332,738) | (1,639,375) | (2,778,571) |
| Net increase (decrease) | (23,281) | (128,147) | $(223,115) | $(1,055,126) |
| Class M | ||||
| Shares sold | 58,871 | 238,813 | $558,124 | $1,896,741 |
| Reinvestment of distributions | 64,894 | 15,944 | 591,835 | 119,902 |
| Shares redeemed | (176,260) | (372,174) | (1,659,112) | (3,041,931) |
| Net increase (decrease) | (52,495) | (117,417) | $(509,153) | $(1,025,288) |
| Class C | ||||
| Shares sold | 40,743 | 96,785 | $387,808 | $808,355 |
| Reinvestment of distributions | 12,119 | 1,070 | 110,403 | 8,046 |
| Shares redeemed | (43,295) | (109,698) | (407,499) | (920,097) |
| Net increase (decrease) | 9,567 | (11,843) | $90,712 | $(103,696) |
| Total International Equity | ||||
| Shares sold | 1,038,947 | 6,763,065 | $9,856,225 | $53,465,510 |
| Reinvestment of distributions | 329,975 | 523,250 | 3,002,772 | 3,913,907 |
| Shares redeemed | (818,669) | (35,028,420)(b) | (7,717,657) | (297,076,095)(b) |
| Net increase (decrease) | 550,253 | (27,742,105) | $5,141,340 | $(239,696,678) |
| Class I | ||||
| Shares sold | 377,043 | 604,657 | $3,530,788 | $5,121,757 |
| Reinvestment of distributions | 36,520 | 3,621 | 330,507 | 27,016 |
| Shares redeemed | (82,109) | (167,386) | (765,596) | (1,392,556) |
| Net increase (decrease) | 331,454 | 440,892 | $3,095,699 | $3,756,217 |
| Class Z | ||||
| Shares sold | 14,798 | 26,796 | $137,272 | $221,657 |
| Reinvestment of distributions | 1,174 | – | 10,647 | – |
| Shares redeemed | (2,394) | (569) | (22,805) | (5,097) |
| Net increase (decrease) | 13,578 | 26,227 | $125,114 | $216,560 |
(a) Share transactions for Class Z are for the period February 1, 2017 (commencement of sale of shares) to October 31, 2017
(b) Amount includes in-kind redemptions (see the Prior Fiscal Year Redemptions In-Kind note for additional details).
11. Other.
The Fund's organizational documents provide former and current trustees and officers with a limited indemnification against liabilities arising in connection with the performance of their duties to the Fund. In the normal course of business, the Fund may also enter into contracts that provide general indemnifications. The Fund's maximum exposure under these arrangements is unknown as this would be dependent on future claims that may be made against the Fund. The risk of material loss from such claims is considered remote.
Shareholder Expense Example
As a shareholder of the Fund, you incur two types of costs: (1) transaction costs, including sales charges (loads) on purchase payments or redemption proceeds, redemption fees and (2) ongoing costs, including management fees, distribution and/or service (12b-1) fees and other Fund expenses. This Example is intended to help you understand your ongoing costs (in dollars) of investing in the Fund and to compare these costs with the ongoing costs of investing in other mutual funds.
The Example is based on an investment of $1,000 invested at the beginning of the period and held for the entire period (November 1, 2017 to April 30, 2018).
Actual Expenses
The first line of the accompanying table for each class of the Fund provides information about actual account values and actual expenses. You may use the information in this line, together with the amount you invested, to estimate the expenses that you paid over the period. Simply divide your account value by $1,000.00 (for example, an $8,600 account value divided by $1,000.00 = 8.6), then multiply the result by the number in the first line for a class of the Fund under the heading entitled "Expenses Paid During Period" to estimate the expenses you paid on your account during this period. A small balance maintenance fee of $12.00 that is charged once a year may apply for certain accounts with a value of less than $2,000. This fee is not included in the table below. If it was, the estimate of expenses you paid during the period would be higher, and your ending account value lower, by this amount. In addition, the Fund, as a shareholder in the underlying Fidelity Central Funds, will indirectly bear its pro-rata share of the fees and expenses incurred by the underlying Fidelity Central Funds. These fees and expenses are not included in the Fund's annualized expense ratio used to calculate the expense estimate in the table below.
Hypothetical Example for Comparison Purposes
The second line of the accompanying table for each class of the Fund provides information about hypothetical account values and hypothetical expenses based on a Class' actual expense ratio and an assumed rate of return of 5% per year before expenses, which is not the Class' actual return. The hypothetical account values and expenses may not be used to estimate the actual ending account balance or expenses you paid for the period. You may use this information to compare the ongoing costs of investing in the Fund and other funds. To do so, compare this 5% hypothetical example with the 5% hypothetical examples that appear in the shareholder reports of the other funds. A small balance maintenance fee of $12.00 that is charged once a year may apply for certain accounts with a value of less than $2,000. This fee is not included in the table below. If it was, the estimate of expenses you paid during the period would be higher, and your ending account value lower, by this amount. In addition, the Fund, as a shareholder in the underlying Fidelity Central Funds, will indirectly bear its pro-rata share of the fees and expenses incurred by the underlying Fidelity Central Funds. These fees and expenses are not included in the Fund's annualized expense ratio used to calculate the expense estimate in the table below.
Please note that the expenses shown in the table are meant to highlight your ongoing costs only and do not reflect any transaction costs. Therefore, the second line of the table is useful in comparing ongoing costs only, and will not help you determine the relative total costs of owning different funds. In addition, if these transactional costs were included, your costs would have been higher.
| Annualized Expense Ratio-A | Beginning Account Value November 1, 2017 | Ending Account Value April 30, 2018 | Expenses Paid During Period-B November 1, 2017 to April 30, 2018 | |
| Class A | 1.45% | |||
| Actual | $1,000.00 | $1,025.00 | $7.28 | |
| Hypothetical-C | $1,000.00 | $1,017.60 | $7.25 | |
| Class M | 1.70% | |||
| Actual | $1,000.00 | $1,022.80 | $8.53 | |
| Hypothetical-C | $1,000.00 | $1,016.36 | $8.50 | |
| Class C | 2.20% | |||
| Actual | $1,000.00 | $1,021.10 | $11.02 | |
| Hypothetical-C | $1,000.00 | $1,013.88 | $10.99 | |
| Total International Equity | 1.20% | |||
| Actual | $1,000.00 | $1,025.70 | $6.03 | |
| Hypothetical-C | $1,000.00 | $1,018.84 | $6.01 | |
| Class I | 1.20% | |||
| Actual | $1,000.00 | $1,026.10 | $6.03 | |
| Hypothetical-C | $1,000.00 | $1,018.84 | $6.01 | |
| Class Z | 1.05% | |||
| Actual | $1,000.00 | $1,027.10 | $5.28 | |
| Hypothetical-C | $1,000.00 | $1,019.59 | $5.26 |
A Annualized expense ratio reflects expenses net of applicable fee waivers.
B Expenses are equal to each Class' annualized expense ratio, multiplied by the average account value over the period, multiplied by 181/365 (to reflect the one-half year period).
C 5% return per year before expenses
![]()
Corporate Headquarters
245 Summer St.
Boston, MA 02210
www.fidelity.com
TIE-SANN-0618
1.912361.108
Fidelity Advisor® International Growth Fund - Semi-Annual Report April 30, 2018 Class A, Class M, Class C, Class I and Class Z are classes of Fidelity® International Growth Fund |
|
Contents
To view a fund's proxy voting guidelines and proxy voting record for the 12-month period ended June 30, visit http://www.fidelity.com/proxyvotingresults or visit the Securities and Exchange Commission's (SEC) web site at http://www.sec.gov.
You may also call 1-877-208-0098 to request a free copy of the proxy voting guidelines.
Standard & Poor's, S&P and S&P 500 are registered service marks of The McGraw-Hill Companies, Inc. and have been licensed for use by Fidelity Distributors Corporation.
Other third-party marks appearing herein are the property of their respective owners.
All other marks appearing herein are registered or unregistered trademarks or service marks of FMR LLC or an affiliated company. © 2018 FMR LLC. All rights reserved.
This report and the financial statements contained herein are submitted for the general information of the shareholders of the Fund. This report is not authorized for distribution to prospective investors in the Fund unless preceded or accompanied by an effective prospectus.
A fund files its complete schedule of portfolio holdings with the SEC for the first and third quarters of each fiscal year on Form N-Q. Forms N-Q are available on the SEC’s web site at http://www.sec.gov. A fund's Forms N-Q may be reviewed and copied at the SEC’s Public Reference Room in Washington, DC. Information regarding the operation of the SEC's Public Reference Room may be obtained by calling 1-800-SEC-0330.
For a complete list of a fund's portfolio holdings, view the most recent holdings listing, semiannual report, or annual report on Fidelity's web site at http://www.fidelity.com, http://www.institutional.fidelity.com, or http://www.401k.com, as applicable.
NOT FDIC INSURED •MAY LOSE VALUE •NO BANK GUARANTEE
Neither the Fund nor Fidelity Distributors Corporation is a bank.
Investment Summary (Unaudited)
Geographic Diversification (% of fund's net assets)
| As of April 30, 2018 | ||
| United States of America* | 21.4% | |
| Japan | 13.8% | |
| United Kingdom | 10.7% | |
| Germany | 6.6% | |
| Switzerland | 6.4% | |
| Sweden | 5.0% | |
| Spain | 3.5% | |
| Australia | 3.4% | |
| Ireland | 3.3% | |
| Other | 25.9% | |
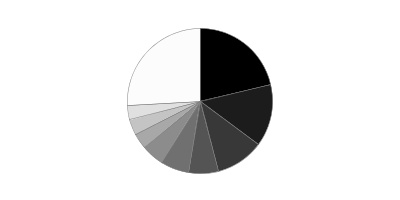
* Includes Short-Term investments and Net Other Assets (Liabilities).
Percentages are based on country or territory of incorporation and are adjusted for the effect of futures contracts, if applicable.
Asset Allocation as of April 30, 2018
| % of fund's net assets | |
| Stocks | 96.2 |
| Short-Term Investments and Net Other Assets (Liabilities) | 3.8 |
Top Ten Stocks as of April 30, 2018
| % of fund's net assets | |
| CSL Ltd. (Australia, Biotechnology) | 3.4 |
| SAP SE (Germany, Software) | 3.2 |
| Keyence Corp. (Japan, Electronic Equipment & Components) | 3.2 |
| Nestle SA (Reg. S) (Switzerland, Food Products) | 2.9 |
| AIA Group Ltd. (Hong Kong, Insurance) | 2.7 |
| Visa, Inc. Class A (United States of America, IT Services) | 2.6 |
| Roche Holding AG (participation certificate) (Switzerland, Pharmaceuticals) | 2.5 |
| MasterCard, Inc. Class A (United States of America, IT Services) | 2.4 |
| ASML Holding NV (Netherlands) (Netherlands, Semiconductors & Semiconductor Equipment) | 2.3 |
| British American Tobacco PLC (United Kingdom) (United Kingdom, Tobacco) | 2.2 |
| 27.4 |
Top Market Sectors as of April 30, 2018
| % of fund's net assets | |
| Information Technology | 22.5 |
| Industrials | 19.5 |
| Financials | 13.4 |
| Consumer Staples | 11.3 |
| Health Care | 10.1 |
| Consumer Discretionary | 9.8 |
| Materials | 7.4 |
| Real Estate | 0.9 |
| Telecommunication Services | 0.7 |
| Energy | 0.6 |
Schedule of Investments April 30, 2018 (Unaudited)
Showing Percentage of Net Assets
| Common Stocks - 95.6% | |||
| Shares | Value | ||
| Australia - 3.4% | |||
| CSL Ltd. | 648,255 | $83,034,369 | |
| Austria - 1.1% | |||
| Andritz AG | 506,321 | 27,245,465 | |
| Belgium - 2.6% | |||
| Anheuser-Busch InBev SA NV | 368,291 | 36,789,572 | |
| KBC Groep NV | 290,376 | 25,387,643 | |
| TOTAL BELGIUM | 62,177,215 | ||
| Brazil - 0.1% | |||
| Itau Unibanco Holding SA | 230,900 | 2,906,682 | |
| Canada - 1.9% | |||
| Alimentation Couche-Tard, Inc. Class B (sub. vtg.) | 232,600 | 10,056,175 | |
| Canadian Pacific Railway Ltd. | 65,300 | 11,915,171 | |
| Franco-Nevada Corp. | 195,200 | 13,845,449 | |
| Pason Systems, Inc. | 280,500 | 3,921,473 | |
| PrairieSky Royalty Ltd. | 275,300 | 6,104,436 | |
| TOTAL CANADA | 45,842,704 | ||
| Cayman Islands - 1.7% | |||
| 58.com, Inc. ADR (a) | 110,870 | 9,688,929 | |
| Alibaba Group Holding Ltd. sponsored ADR (a) | 177,900 | 31,762,266 | |
| Ping An Healthcare and Technology Co. Ltd. (a) | 100,800 | 703,795 | |
| TOTAL CAYMAN ISLANDS | 42,154,990 | ||
| Denmark - 1.2% | |||
| Jyske Bank A/S (Reg.) | 240,800 | 14,476,023 | |
| Novo Nordisk A/S Series B sponsored ADR | 320,600 | 15,048,964 | |
| TOTAL DENMARK | 29,524,987 | ||
| Finland - 0.2% | |||
| Tikkurila Oyj | 298,300 | 5,396,202 | |
| France - 2.8% | |||
| Edenred SA | 436,300 | 15,015,963 | |
| Elis SA | 397,736 | 9,519,665 | |
| Legrand SA | 228,100 | 17,766,755 | |
| Safran SA | 222,700 | 26,120,522 | |
| TOTAL FRANCE | 68,422,905 | ||
| Germany - 6.6% | |||
| Bayer AG | 364,000 | 43,505,138 | |
| Linde AG | 112,200 | 24,937,435 | |
| MTU Aero Engines Holdings AG | 76,900 | 13,279,615 | |
| SAP SE | 700,434 | 77,822,197 | |
| TOTAL GERMANY | 159,544,385 | ||
| Hong Kong - 2.7% | |||
| AIA Group Ltd. | 7,472,400 | 66,782,334 | |
| India - 1.2% | |||
| Housing Development Finance Corp. Ltd. | 1,013,329 | 28,670,141 | |
| Ireland - 3.3% | |||
| CRH PLC sponsored ADR (b) | 1,327,566 | 46,942,734 | |
| James Hardie Industries PLC CDI | 1,923,278 | 33,964,021 | |
| TOTAL IRELAND | 80,906,755 | ||
| Isle of Man - 0.5% | |||
| Playtech Ltd. | 1,065,276 | 11,887,980 | |
| Italy - 0.8% | |||
| Interpump Group SpA | 590,826 | 18,821,641 | |
| Japan - 13.8% | |||
| Azbil Corp. | 95,300 | 4,445,939 | |
| DENSO Corp. | 494,400 | 26,031,526 | |
| East Japan Railway Co. | 258,800 | 24,833,626 | |
| Fanuc Corp. | 110,700 | 23,713,117 | |
| Hoya Corp. | 348,600 | 18,692,766 | |
| Keyence Corp. | 126,924 | 77,754,302 | |
| Komatsu Ltd. | 895,700 | 30,533,280 | |
| Misumi Group, Inc. | 1,066,500 | 29,559,962 | |
| Nabtesco Corp. | 330,700 | 11,964,128 | |
| Nintendo Co. Ltd. | 35,000 | 14,706,178 | |
| OSG Corp. | 604,900 | 13,434,844 | |
| SHO-BOND Holdings Co. Ltd. | 237,400 | 17,980,900 | |
| USS Co. Ltd. | 1,990,600 | 41,898,743 | |
| TOTAL JAPAN | 335,549,311 | ||
| Kenya - 0.7% | |||
| Safaricom Ltd. | 62,911,800 | 17,719,425 | |
| Korea (South) - 0.8% | |||
| BGF Retail Co. Ltd. | 57,931 | 10,332,022 | |
| NAVER Corp. | 15,043 | 10,057,462 | |
| TOTAL KOREA (SOUTH) | 20,389,484 | ||
| Mexico - 0.5% | |||
| Fomento Economico Mexicano S.A.B. de CV sponsored ADR | 118,655 | 11,469,192 | |
| Netherlands - 2.3% | |||
| ASML Holding NV (Netherlands) (b) | 299,200 | 56,906,942 | |
| New Zealand - 0.3% | |||
| Auckland International Airport Ltd. | 1,774,867 | 7,967,321 | |
| Norway - 0.4% | |||
| Schibsted ASA (B Shares) | 324,975 | 8,749,935 | |
| South Africa - 2.4% | |||
| Clicks Group Ltd. | 1,195,770 | 20,443,990 | |
| Naspers Ltd. Class N | 154,900 | 37,736,670 | |
| TOTAL SOUTH AFRICA | 58,180,660 | ||
| Spain - 3.5% | |||
| Amadeus IT Holding SA Class A | 632,100 | 46,333,764 | |
| Banco Bilbao Vizcaya Argentaria SA | 1,176,800 | 9,522,734 | |
| Hispania Activos Inmobiliarios SA | 381,324 | 8,104,569 | |
| Merlin Properties Socimi SA | 469,900 | 7,263,376 | |
| Prosegur Compania de Seguridad SA (Reg.) | 1,742,449 | 13,214,259 | |
| TOTAL SPAIN | 84,438,702 | ||
| Sweden - 5.0% | |||
| ASSA ABLOY AB (B Shares) (b) | 2,389,483 | 50,263,830 | |
| Atlas Copco AB (A Shares) | 1,004,700 | 39,480,540 | |
| Fagerhult AB | 881,632 | 9,010,988 | |
| Loomis AB (B Shares) | 176,600 | 6,457,643 | |
| Svenska Handelsbanken AB (A Shares) | 1,465,820 | 16,347,211 | |
| TOTAL SWEDEN | 121,560,212 | ||
| Switzerland - 6.4% | |||
| Nestle SA (Reg. S) | 902,305 | 69,901,652 | |
| Roche Holding AG (participation certificate) | 276,670 | 61,472,607 | |
| Schindler Holding AG: | |||
| (participation certificate) | 99,045 | 20,548,589 | |
| (Reg.) | 18,350 | 3,686,665 | |
| TOTAL SWITZERLAND | 155,609,513 | ||
| Taiwan - 0.9% | |||
| Taiwan Semiconductor Manufacturing Co. Ltd. | 2,918,000 | 22,188,034 | |
| Turkey - 0.2% | |||
| Tupras Turkiye Petrol Rafinerileri A/S | 217,012 | 5,529,342 | |
| United Kingdom - 10.7% | |||
| BAE Systems PLC | 2,476,700 | 20,780,073 | |
| British American Tobacco PLC (United Kingdom) | 959,300 | 52,615,217 | |
| Elementis PLC | 1,676,110 | 6,544,072 | |
| Informa PLC | 2,867,284 | 29,171,211 | |
| InterContinental Hotel Group PLC ADR (b) | 543,522 | 34,589,740 | |
| Melrose Industries PLC | 3,140,139 | 9,856,507 | |
| Prudential PLC | 2,032,177 | 52,255,520 | |
| Reckitt Benckiser Group PLC | 348,745 | 27,358,376 | |
| Rightmove PLC | 90,400 | 5,681,311 | |
| Shaftesbury PLC | 469,333 | 6,532,382 | |
| Spectris PLC | 378,557 | 14,019,189 | |
| TOTAL UNITED KINGDOM | 259,403,598 | ||
| United States of America - 17.6% | |||
| Alphabet, Inc. Class A (a) | 36,336 | 37,011,123 | |
| Autoliv, Inc. (b) | 206,069 | 27,623,549 | |
| Berkshire Hathaway, Inc. Class B (a) | 148,484 | 28,765,805 | |
| Black Knight, Inc. (a) | 132,800 | 6,460,720 | |
| Martin Marietta Materials, Inc. | 112,600 | 21,931,102 | |
| MasterCard, Inc. Class A | 332,400 | 59,256,948 | |
| Mohawk Industries, Inc. (a) | 83,900 | 17,608,932 | |
| Moody's Corp. | 105,700 | 17,144,540 | |
| MSCI, Inc. | 166,800 | 24,991,644 | |
| PayPal Holdings, Inc. (a) | 142,400 | 10,624,464 | |
| Philip Morris International, Inc. | 330,308 | 27,085,256 | |
| PriceSmart, Inc. | 116,700 | 10,222,920 | |
| ResMed, Inc. | 263,600 | 24,947,104 | |
| S&P Global, Inc. | 132,000 | 24,895,200 | |
| Sherwin-Williams Co. | 74,100 | 27,243,606 | |
| Visa, Inc. Class A | 486,760 | 61,760,109 | |
| TOTAL UNITED STATES OF AMERICA | 427,573,022 | ||
| TOTAL COMMON STOCKS | |||
| (Cost $1,810,136,950) | 2,326,553,448 | ||
| Nonconvertible Preferred Stocks - 0.6% | |||
| Brazil - 0.6% | |||
| Itau Unibanco Holding SA | |||
| (Cost $13,722,725) | 1,050,500 | 15,296,302 | |
| Money Market Funds - 8.0% | |||
| Fidelity Cash Central Fund, 1.74% (c) | 78,144,997 | 78,160,626 | |
| Fidelity Securities Lending Cash Central Fund 1.74% (c)(d) | 116,764,346 | 116,776,022 | |
| TOTAL MONEY MARKET FUNDS | |||
| (Cost $194,936,648) | 194,936,648 | ||
| TOTAL INVESTMENT IN SECURITIES - 104.2% | |||
| (Cost $2,018,796,323) | 2,536,786,398 | ||
| NET OTHER ASSETS (LIABILITIES) - (4.2)% | (102,341,868) | ||
| NET ASSETS - 100% | $2,434,444,530 |
Categorizations in the Schedule of Investments are based on country or territory of incorporation.
Legend
(a) Non-income producing
(b) Security or a portion of the security is on loan at period end.
(c) Affiliated fund that is generally available only to investment companies and other accounts managed by Fidelity Investments. The rate quoted is the annualized seven-day yield of the fund at period end. A complete unaudited listing of the fund's holdings as of its most recent quarter end is available upon request. In addition, each Fidelity Central Fund's financial statements are available on the SEC's website or upon request.
(d) Investment made with cash collateral received from securities on loan.
Affiliated Central Funds
Information regarding fiscal year to date income earned by the Fund from investments in Fidelity Central Funds is as follows:
| Fund | Income earned |
| Fidelity Cash Central Fund | $351,120 |
| Fidelity Securities Lending Cash Central Fund | 207,438 |
| Total | $558,558 |
Amounts in the income column in the above table include any capital gain distributions from underlying funds, which are presented in the corresponding line-item in the Statement of Operations if applicable.
Investment Valuation
The following is a summary of the inputs used, as of April 30, 2018, involving the Fund's assets and liabilities carried at fair value. The inputs or methodology used for valuing securities may not be an indication of the risk associated with investing in those securities. For more information on valuation inputs, and their aggregation into the levels used below, please refer to the Investment Valuation section in the accompanying Notes to Financial Statements.
| Valuation Inputs at Reporting Date: | ||||
| Description | Total | Level 1 | Level 2 | Level 3 |
| Investments in Securities: | ||||
| Equities: | ||||
| Consumer Discretionary | $235,298,286 | $197,561,616 | $37,736,670 | $-- |
| Consumer Staples | 276,274,372 | 105,955,137 | 170,319,235 | -- |
| Energy | 15,555,251 | 15,555,251 | -- | -- |
| Financials | 327,441,779 | 153,863,839 | 173,577,940 | -- |
| Health Care | 247,404,743 | 58,688,834 | 188,715,909 | -- |
| Industrials | 472,971,069 | 371,824,077 | 101,146,992 | -- |
| Information Technology | 546,479,877 | 431,763,468 | 114,716,409 | -- |
| Materials | 180,804,621 | 146,840,600 | 33,964,021 | -- |
| Real Estate | 21,900,327 | 21,900,327 | -- | -- |
| Telecommunication Services | 17,719,425 | 17,719,425 | -- | -- |
| Money Market Funds | 194,936,648 | 194,936,648 | -- | -- |
| Total Investments in Securities: | $2,536,786,398 | $1,716,609,222 | $820,177,176 | $-- |
The following is a summary of transfers between Level 1 and Level 2 for the period ended April 30, 2018. Transfers are assumed to have occurred at the beginning of the period, and are primarily attributable to the valuation techniques used for foreign equity securities, as discussed in the accompanying Notes to Financial Statements:
| Transfers | Total |
| Level 1 to Level 2 | $252,146,114 |
| Level 2 to Level 1 | $406,173,441 |
See accompanying notes which are an integral part of the financial statements.
Financial Statements
Statement of Assets and Liabilities
| April 30, 2018 (Unaudited) | ||
| Assets | ||
| Investment in securities, at value (including securities loaned of $110,898,463) — See accompanying schedule: Unaffiliated issuers (cost $1,823,859,675) | $2,341,849,750 | |
| Fidelity Central Funds (cost $194,936,648) | 194,936,648 | |
| Total Investment in Securities (cost $2,018,796,323) | $2,536,786,398 | |
| Foreign currency held at value (cost $211,154) | 211,154 | |
| Receivable for investments sold | 4,169,157 | |
| Receivable for fund shares sold | 6,588,831 | |
| Dividends receivable | 14,601,735 | |
| Distributions receivable from Fidelity Central Funds | 109,723 | |
| Prepaid expenses | 1,096 | |
| Other receivables | 56,265 | |
| Total assets | 2,562,524,359 | |
| Liabilities | ||
| Payable for investments purchased | $7,515,768 | |
| Payable for fund shares redeemed | 1,650,022 | |
| Accrued management fee | 1,382,041 | |
| Distribution and service plan fees payable | 106,675 | |
| Other affiliated payables | 419,126 | |
| Other payables and accrued expenses | 239,048 | |
| Collateral on securities loaned | 116,767,149 | |
| Total liabilities | 128,079,829 | |
| Net Assets | $2,434,444,530 | |
| Net Assets consist of: | ||
| Paid in capital | $1,977,683,957 | |
| Undistributed net investment income | 13,090,126 | |
| Accumulated undistributed net realized gain (loss) on investments and foreign currency transactions | (74,062,762) | |
| Net unrealized appreciation (depreciation) on investments and assets and liabilities in foreign currencies | 517,733,209 | |
| Net Assets | $2,434,444,530 | |
| Calculation of Maximum Offering Price | ||
| Class A: | ||
| Net Asset Value and redemption price per share ($161,278,286 ÷ 11,963,841 shares) | $13.48 | |
| Maximum offering price per share (100/94.25 of $13.48) | $14.30 | |
| Class M: | ||
| Net Asset Value and redemption price per share ($31,686,072÷ 2,355,222 shares) | $13.45 | |
| Maximum offering price per share (100/96.50 of $13.45) | $13.94 | |
| Class C: | ||
| Net Asset Value and offering price per share ($70,680,330 ÷ 5,339,404 shares)(a) | $13.24 | |
| International Growth: | ||
| Net Asset Value, offering price and redemption price per share ($930,528,739 ÷ 68,576,631 shares) | $13.57 | |
| Class I: | ||
| Net Asset Value, offering price and redemption price per share ($824,016,754 ÷ 60,851,076 shares) | $13.54 | |
| Class Z: | ||
| Net Asset Value, offering price and redemption price per share ($416,254,349 ÷ 30,699,863 shares) | $13.56 |
(a) Redemption price per share is equal to net asset value less any applicable contingent deferred sales charge.
See accompanying notes which are an integral part of the financial statements.
Statement of Operations
| Six months ended April 30, 2018 (Unaudited) | ||
| Investment Income | ||
| Dividends | $28,132,447 | |
| Income from Fidelity Central Funds | 558,558 | |
| Income before foreign taxes withheld | 28,691,005 | |
| Less foreign taxes withheld | (2,820,258) | |
| Total income | 25,870,747 | |
| Expenses | ||
| Management fee | ||
| Basic fee | $8,510,674 | |
| Performance adjustment | 209,909 | |
| Transfer agent fees | 2,150,997 | |
| Distribution and service plan fees | 647,471 | |
| Accounting and security lending fees | 541,504 | |
| Custodian fees and expenses | 158,665 | |
| Independent trustees' fees and expenses | 4,818 | |
| Registration fees | 84,521 | |
| Audit | 37,705 | |
| Legal | 5,220 | |
| Interest | 12,804 | |
| Miscellaneous | 7,407 | |
| Total expenses before reductions | 12,371,695 | |
| Expense reductions | (117,558) | 12,254,137 |
| Net investment income (loss) | 13,616,610 | |
| Realized and Unrealized Gain (Loss) | ||
| Net realized gain (loss) on: | ||
| Investment securities: | ||
| Unaffiliated issuers | 20,470,806 | |
| Fidelity Central Funds | 2,201 | |
| Foreign currency transactions | (138,586) | |
| Total net realized gain (loss) | 20,334,421 | |
| Change in net unrealized appreciation (depreciation) on: | ||
| Investment securities: | ||
| Unaffiliated issuers (net of increase in deferred foreign taxes of $56,921) | 1,436,583 | |
| Assets and liabilities in foreign currencies | (107,020) | |
| Total change in net unrealized appreciation (depreciation) | 1,329,563 | |
| Net gain (loss) | 21,663,984 | |
| Net increase (decrease) in net assets resulting from operations | $35,280,594 |
See accompanying notes which are an integral part of the financial statements.
Statement of Changes in Net Assets
| Six months ended April 30, 2018 (Unaudited) | Year ended October 31, 2017 | |
| Increase (Decrease) in Net Assets | ||
| Operations | ||
| Net investment income (loss) | $13,616,610 | $16,277,855 |
| Net realized gain (loss) | 20,334,421 | (12,551,371) |
| Change in net unrealized appreciation (depreciation) | 1,329,563 | 409,389,366 |
| Net increase (decrease) in net assets resulting from operations | 35,280,594 | 413,115,850 |
| Distributions to shareholders from net investment income | (14,086,190) | (18,629,181) |
| Distributions to shareholders from net realized gain | (2,550,030) | – |
| Total distributions | (16,636,220) | (18,629,181) |
| Share transactions - net increase (decrease) | 92,426,049 | 210,891,938 |
| Redemption fees | – | 6,903 |
| Total increase (decrease) in net assets | 111,070,423 | 605,385,510 |
| Net Assets | ||
| Beginning of period | 2,323,374,107 | 1,717,988,597 |
| End of period | $2,434,444,530 | $2,323,374,107 |
| Other Information | ||
| Undistributed net investment income end of period | $13,090,126 | $13,559,706 |
See accompanying notes which are an integral part of the financial statements.
Financial Highlights
Fidelity International Growth Fund Class A
| Six months ended (Unaudited) April 30, | Years endedOctober 31, | |||||
| 2018 | 2017 | 2016 | 2015 | 2014 | 2013 | |
| Selected Per–Share Data | ||||||
| Net asset value, beginning of period | $13.34 | $10.88 | $11.30 | $11.01 | $10.78 | $8.91 |
| Income from Investment Operations | ||||||
| Net investment income (loss)A | .06 | .07 | .12B | .07 | .09 | .08 |
| Net realized and unrealized gain (loss) | .14 | 2.49 | (.48) | .28 | .18 | 1.88 |
| Total from investment operations | .20 | 2.56 | (.36) | .35 | .27 | 1.96 |
| Distributions from net investment income | (.04) | (.10) | (.05) | (.06) | (.03) | (.08) |
| Distributions from net realized gain | (.02) | – | (.01) | – | (.01) | (.01) |
| Total distributions | (.06) | (.10) | (.06) | (.06) | (.04) | (.09) |
| Redemption fees added to paid in capitalA | – | –C | –C | –C | –C | –C |
| Net asset value, end of period | $13.48 | $13.34 | $10.88 | $11.30 | $11.01 | $10.78 |
| Total ReturnD,E,F | 1.48% | 23.80% | (3.22)% | 3.20% | 2.54% | 22.18% |
| Ratios to Average Net AssetsG,H | ||||||
| Expenses before reductions | 1.25%I | 1.28% | 1.27% | 1.26% | 1.35% | 1.44% |
| Expenses net of fee waivers, if any | 1.25%I | 1.28% | 1.27% | 1.26% | 1.35% | 1.43% |
| Expenses net of all reductions | 1.24%I | 1.27% | 1.27% | 1.25% | 1.34% | 1.42% |
| Net investment income (loss) | .86%I | .62% | 1.05%B | .66% | .84% | .80% |
| Supplemental Data | ||||||
| Net assets, end of period (000 omitted) | $161,278 | $156,988 | $221,861 | $184,878 | $119,017 | $74,595 |
| Portfolio turnover rateJ | 36%I | 22% | 29% | 26% | 27% | 32% |
A Calculated based on average shares outstanding during the period.
B Net Investment income per share reflects a large, non-recurring dividend which amounted to $.04 per share. Excluding this non-recurring dividend, the ratio of net investment income (loss) to average net assets would have been .68%.
C Amount represents less than $.005 per share.
D Total returns for periods of less than one year are not annualized.
E Total returns would have been lower if certain expenses had not been reduced during the applicable periods shown.
F Total returns do not include the effect of the sales charges.
G Fees and expenses of any underlying Fidelity Central Funds are not included in the Fund's expense ratio. The Fund indirectly bears its proportionate share of the expenses of any underlying Fidelity Central Funds.
H Expense ratios reflect operating expenses of the class. Expenses before reductions do not reflect amounts reimbursed by the investment adviser or reductions from brokerage service arrangements or reductions from other expense offset arrangements and do not represent the amount paid by the class during periods when reimbursements or reductions occur. Expenses net of fee waivers reflect expenses after reimbursement by the investment adviser but prior to reductions from brokerage service arrangements or other expense offset arrangements. Expenses net of all reductions represent the net expenses paid by the class.
I Annualized
J Amount does not include the portfolio activity of any underlying Fidelity Central Funds.
See accompanying notes which are an integral part of the financial statements.
Fidelity International Growth Fund Class M
| Six months ended (Unaudited) April 30, | Years endedOctober 31, | |||||
| 2018 | 2017 | 2016 | 2015 | 2014 | 2013 | |
| Selected Per–Share Data | ||||||
| Net asset value, beginning of period | $13.30 | $10.84 | $11.26 | $10.96 | $10.75 | $8.89 |
| Income from Investment Operations | ||||||
| Net investment income (loss)A | .04 | .04 | .08B | .04 | .06 | .05 |
| Net realized and unrealized gain (loss) | .13 | 2.49 | (.48) | .27 | .18 | 1.88 |
| Total from investment operations | .17 | 2.53 | (.40) | .31 | .24 | 1.93 |
| Distributions from net investment income | (.01) | (.07) | (.01) | (.01) | (.02) | (.07) |
| Distributions from net realized gain | (.02) | – | (.01) | – | (.01) | (.01) |
| Total distributions | (.02)C | (.07) | (.02) | (.01) | (.03) | (.07)D |
| Redemption fees added to paid in capitalA | – | –E | –E | –E | –E | –E |
| Net asset value, end of period | $13.45 | $13.30 | $10.84 | $11.26 | $10.96 | $10.75 |
| Total ReturnF,G,H | 1.28% | 23.51% | (3.58)% | 2.85% | 2.21% | 21.91% |
| Ratios to Average Net AssetsI,J | ||||||
| Expenses before reductions | 1.55%K | 1.59% | 1.61% | 1.58% | 1.65% | 1.69% |
| Expenses net of fee waivers, if any | 1.55%K | 1.59% | 1.61% | 1.58% | 1.65% | 1.69% |
| Expenses net of all reductions | 1.54%K | 1.58% | 1.61% | 1.58% | 1.65% | 1.68% |
| Net investment income (loss) | .56%K | .31% | .71%B | .33% | .53% | .54% |
| Supplemental Data | ||||||
| Net assets, end of period (000 omitted) | $31,686 | $33,597 | $27,966 | $28,833 | $26,369 | $23,118 |
| Portfolio turnover rateL | 36%K | 22% | 29% | 26% | 27% | 32% |
A Calculated based on average shares outstanding during the period.
B Net Investment income per share reflects a large, non-recurring dividend which amounted to $.04 per share. Excluding this non-recurring dividend, the ratio of net investment income (loss) to average net assets would have been .34%.
C Total distributions of $.02 per share is comprised of distributions from net investment income of $.005 and distributions from net realized gain of $.015 per share.
D Total distributions of $.07 per share is comprised of distributions from net investment income of $.69 and distributions from net realized gain of $.005 per share.
E Amount represents less than $.005 per share.
F Total returns for periods of less than one year are not annualized.
G Total returns would have been lower if certain expenses had not been reduced during the applicable periods shown.
H Total returns do not include the effect of the sales charges.
I Fees and expenses of any underlying Fidelity Central Funds are not included in the Fund's expense ratio. The Fund indirectly bears its proportionate share of the expenses of any underlying Fidelity Central Funds.
J Expense ratios reflect operating expenses of the class. Expenses before reductions do not reflect amounts reimbursed by the investment adviser or reductions from brokerage service arrangements or reductions from other expense offset arrangements and do not represent the amount paid by the class during periods when reimbursements or reductions occur. Expenses net of fee waivers reflect expenses after reimbursement by the investment adviser but prior to reductions from brokerage service arrangements or other expense offset arrangements. Expenses net of all reductions represent the net expenses paid by the class.
K Annualized
L Amount does not include the portfolio activity of any underlying Fidelity Central Funds.
See accompanying notes which are an integral part of the financial statements.
Fidelity International Growth Fund Class C
| Six months ended (Unaudited) April 30, | Years endedOctober 31, | |||||
| 2018 | 2017 | 2016 | 2015 | 2014 | 2013 | |
| Selected Per–Share Data | ||||||
| Net asset value, beginning of period | $13.10 | $10.67 | $11.12 | $10.87 | $10.69 | $8.84 |
| Income from Investment Operations | ||||||
| Net investment income (loss)A | .01 | (.02) | .03B | (.02) | .01 | .01 |
| Net realized and unrealized gain (loss) | .13 | 2.47 | (.47) | .27 | .18 | 1.87 |
| Total from investment operations | .14 | 2.45 | (.44) | .25 | .19 | 1.88 |
| Distributions from net investment income | – | (.02) | – | – | – | (.02) |
| Distributions from net realized gain | – | – | (.01) | – | (.01) | (.01) |
| Total distributions | – | (.02) | (.01) | – | (.01) | (.03) |
| Redemption fees added to paid in capitalA | – | –C | –C | –C | –C | –C |
| Net asset value, end of period | $13.24 | $13.10 | $10.67 | $11.12 | $10.87 | $10.69 |
| Total ReturnD,E,F | 1.07% | 22.96% | (3.98)% | 2.30% | 1.77% | 21.29% |
| Ratios to Average Net AssetsG,H | ||||||
| Expenses before reductions | 2.01%I | 2.04% | 2.07% | 2.06% | 2.12% | 2.19% |
| Expenses net of fee waivers, if any | 2.00%I | 2.04% | 2.07% | 2.06% | 2.12% | 2.18% |
| Expenses net of all reductions | 2.00%I | 2.04% | 2.06% | 2.05% | 2.12% | 2.17% |
| Net investment income (loss) | .10%I | (.15)% | .26%B | (.15)% | .06% | .05% |
| Supplemental Data | ||||||
| Net assets, end of period (000 omitted) | $70,680 | $68,908 | $52,738 | $52,378 | $32,737 | $17,196 |
| Portfolio turnover rateJ | 36%I | 22% | 29% | 26% | 27% | 32% |
A Calculated based on average shares outstanding during the period.
B Net Investment income per share reflects a large, non-recurring dividend which amounted to $.04 per share. Excluding this non-recurring dividend, the ratio of net investment income (loss) to average net assets would have been (.12) %.
C Amount represents less than $.005 per share.
D Total returns for periods of less than one year are not annualized.
E Total returns would have been lower if certain expenses had not been reduced during the applicable periods shown.
F Total returns do not include the effect of the contingent deferred sales charge.
G Fees and expenses of any underlying Fidelity Central Funds are not included in the Fund's expense ratio. The Fund indirectly bears its proportionate share of the expenses of any underlying Fidelity Central Funds.
H Expense ratios reflect operating expenses of the class. Expenses before reductions do not reflect amounts reimbursed by the investment adviser or reductions from brokerage service arrangements or reductions from other expense offset arrangements and do not represent the amount paid by the class during periods when reimbursements or reductions occur. Expenses net of fee waivers reflect expenses after reimbursement by the investment adviser but prior to reductions from brokerage service arrangements or other expense offset arrangements. Expenses net of all reductions represent the net expenses paid by the class.
I Annualized
J Amount does not include the portfolio activity of any underlying Fidelity Central Funds.
See accompanying notes which are an integral part of the financial statements.
Fidelity International Growth Fund
| Six months ended (Unaudited) April 30, | Years endedOctober 31, | |||||
| 2018 | 2017 | 2016 | 2015 | 2014 | 2013 | |
| Selected Per–Share Data | ||||||
| Net asset value, beginning of period | $13.45 | $10.97 | $11.38 | $11.10 | $10.84 | $8.95 |
| Income from Investment Operations | ||||||
| Net investment income (loss)A | .08 | .10 | .15B | .11 | .13 | .11 |
| Net realized and unrealized gain (loss) | .13 | 2.51 | (.47) | .26 | .19 | 1.88 |
| Total from investment operations | .21 | 2.61 | (.32) | .37 | .32 | 1.99 |
| Distributions from net investment income | (.08) | (.13) | (.08) | (.09) | (.05) | (.10) |
| Distributions from net realized gain | (.02) | – | (.01) | – | (.01) | (.01) |
| Total distributions | (.09)C | (.13) | (.09) | (.09) | (.06) | (.10)D |
| Redemption fees added to paid in capitalA | – | –E | –E | –E | –E | –E |
| Net asset value, end of period | $13.57 | $13.45 | $10.97 | $11.38 | $11.10 | $10.84 |
| Total ReturnF,G | 1.60% | 24.14% | (2.87)% | 3.36% | 2.96% | 22.48% |
| Ratios to Average Net AssetsH,I | ||||||
| Expenses before reductions | .99%J | 1.03% | .99% | .97% | 1.04% | 1.13% |
| Expenses net of fee waivers, if any | .98%J | 1.03% | .99% | .97% | 1.04% | 1.13% |
| Expenses net of all reductions | .98%J | 1.03% | .98% | .96% | 1.04% | 1.11% |
| Net investment income (loss) | 1.12%J | .87% | 1.34%B | .94% | 1.14% | 1.11% |
| Supplemental Data | ||||||
| Net assets, end of period (000 omitted) | $930,529 | $961,775 | $1,038,771 | $938,348 | $635,607 | $430,914 |
| Portfolio turnover rateK | 36%J | 22% | 29% | 26% | 27% | 32% |
A Calculated based on average shares outstanding during the period.
B Net Investment income per share reflects a large, non-recurring dividend which amounted to $.04 per share. Excluding this non-recurring dividend, the ratio of net investment income (loss) to average net assets would have been .96%.
C Total distributions of $.09 per share is comprised of distributions from net investment income of $.079 and distributions from net realized gain of $.015 per share.
D Total distributions of $.10 per share is comprised of distributions from net investment income of $.097 and distributions from net realized gain of $.005 per share.
E Amount represents less than $.005 per share.
F Total returns for periods of less than one year are not annualized.
G Total returns would have been lower if certain expenses had not been reduced during the applicable periods shown.
H Fees and expenses of any underlying Fidelity Central Funds are not included in the Fund's expense ratio. The Fund indirectly bears its proportionate share of the expenses of any underlying Fidelity Central Funds.
I Expense ratios reflect operating expenses of the class. Expenses before reductions do not reflect amounts reimbursed by the investment adviser or reductions from brokerage service arrangements or reductions from other expense offset arrangements and do not represent the amount paid by the class during periods when reimbursements or reductions occur. Expenses net of fee waivers reflect expenses after reimbursement by the investment adviser but prior to reductions from brokerage service arrangements or other expense offset arrangements. Expenses net of all reductions represent the net expenses paid by the class.
J Annualized
K Amount does not include the portfolio activity of any underlying Fidelity Central Funds.
See accompanying notes which are an integral part of the financial statements.
Fidelity International Growth Fund Class I
| Six months ended (Unaudited) April 30, | Years endedOctober 31, | |||||
| 2018 | 2017 | 2016 | 2015 | 2014 | 2013 | |
| Selected Per–Share Data | ||||||
| Net asset value, beginning of period | $13.43 | $10.95 | $11.36 | $11.08 | $10.84 | $8.94 |
| Income from Investment Operations | ||||||
| Net investment income (loss)A | .08 | .11 | .15B | .11 | .13 | .11 |
| Net realized and unrealized gain (loss) | .13 | 2.51 | (.47) | .27 | .18 | 1.90 |
| Total from investment operations | .21 | 2.62 | (.32) | .38 | .31 | 2.01 |
| Distributions from net investment income | (.09) | (.14) | (.08) | (.10) | (.06) | (.10) |
| Distributions from net realized gain | (.02) | – | (.01) | – | (.01) | (.01) |
| Total distributions | (.10)C | (.14) | (.09) | (.10) | (.07) | (.11) |
| Redemption fees added to paid in capitalA | – | –D | –D | –D | –D | –D |
| Net asset value, end of period | $13.54 | $13.43 | $10.95 | $11.36 | $11.08 | $10.84 |
| Total ReturnE,F | 1.60% | 24.23% | (2.87)% | 3.41% | 2.84% | 22.66% |
| Ratios to Average Net AssetsG,H | ||||||
| Expenses before reductions | .96%I | .98% | .98% | .98% | 1.04% | 1.11% |
| Expenses net of fee waivers, if any | .95%I | .98% | .98% | .98% | 1.04% | 1.11% |
| Expenses net of all reductions | .95%I | .97% | .98% | .97% | 1.04% | 1.09% |
| Net investment income (loss) | 1.15%I | .92% | 1.34%B | .94% | 1.14% | 1.13% |
| Supplemental Data | ||||||
| Net assets, end of period (000 omitted) | $824,017 | $728,227 | $359,676 | $267,745 | $121,554 | $38,771 |
| Portfolio turnover rateJ | 36%I | 22% | 29% | 26% | 27% | 32% |
A Calculated based on average shares outstanding during the period.
B Net Investment income per share reflects a large, non-recurring dividend which amounted to $.04 per share. Excluding this non-recurring dividend, the ratio of net investment income (loss) to average net assets would have been .97%.
C Total distributions of $0.10 per share is comprised of distributions from net investment income of $.089 and distributions from net realized gain of $.015 per share.
D Amount represents less than $.005 per share.
E Total returns for periods of less than one year are not annualized.
F Total returns would have been lower if certain expenses had not been reduced during the applicable periods shown.
G Fees and expenses of any underlying Fidelity Central Funds are not included in the Fund's expense ratio. The Fund indirectly bears its proportionate share of the expenses of any underlying Fidelity Central Funds.
H Expense ratios reflect operating expenses of the class. Expenses before reductions do not reflect amounts reimbursed by the investment adviser or reductions from brokerage service arrangements or reductions from other expense offset arrangements and do not represent the amount paid by the class during periods when reimbursements or reductions occur. Expenses net of fee waivers reflect expenses after reimbursement by the investment adviser but prior to reductions from brokerage service arrangements or other expense offset arrangements. Expenses net of all reductions represent the net expenses paid by the class.
I Annualized
J Amount does not include the portfolio activity of any underlying Fidelity Central Funds.
See accompanying notes which are an integral part of the financial statements.
Fidelity International Growth Fund Class Z
| Six months ended (Unaudited) April 30, | Years endedOctober 31, | |||||
| 2018 | 2017 | 2016 | 2015 | 2014 | 2013 A | |
| Selected Per–Share Data | ||||||
| Net asset value, beginning of period | $13.45 | $10.97 | $11.38 | $11.10 | $10.84 | $10.26 |
| Income from Investment Operations | ||||||
| Net investment income (loss)B | .09 | .13 | .16C | .12 | .14 | .02 |
| Net realized and unrealized gain (loss) | .14 | 2.50 | (.47) | .27 | .19 | .56 |
| Total from investment operations | .23 | 2.63 | (.31) | .39 | .33 | .58 |
| Distributions from net investment income | (.10) | (.15) | (.09) | (.11) | (.06) | – |
| Distributions from net realized gain | (.02) | – | (.01) | – | (.01) | – |
| Total distributions | (.12) | (.15) | (.10) | (.11) | (.07) | – |
| Redemption fees added to paid in capitalB | – | –D | –D | –D | –D | –D |
| Net asset value, end of period | $13.56 | $13.45 | $10.97 | $11.38 | $11.10 | $10.84 |
| Total ReturnE,F | 1.71% | 24.33% | (2.73)% | 3.52% | 3.07% | 5.65% |
| Ratios to Average Net AssetsG,H | ||||||
| Expenses before reductions | .82%I | .84% | .85% | .84% | .88% | .94%I |
| Expenses net of fee waivers, if any | .82%I | .84% | .85% | .84% | .88% | .94%I |
| Expenses net of all reductions | .81%I | .84% | .84% | .83% | .88% | .93%I |
| Net investment income (loss) | 1.29%I | 1.05% | 1.48%C | 1.07% | 1.30% | .65%I |
| Supplemental Data | ||||||
| Net assets, end of period (000 omitted) | $416,254 | $373,878 | $16,977 | $897 | $104 | $106 |
| Portfolio turnover rateJ | 36%I | 22% | 29% | 26% | 27% | 32% |
A For the period August 13, 2013 (commencement of sale of shares) to October 31, 2013.
B Calculated based on average shares outstanding during the period.
C Net Investment income per share reflects a large, non-recurring dividend which amounted to $.04 per share. Excluding this non-recurring dividend, the ratio of net investment income (loss) to average net assets would have been 1.10%.
D Amount represents less than $.005 per share.
E Total returns for periods of less than one year are not annualized.
F Total returns would have been lower if certain expenses had not been reduced during the applicable periods shown.
G Fees and expenses of any underlying Fidelity Central Funds are not included in the Fund's expense ratio. The Fund indirectly bears its proportionate share of the expenses of any underlying Fidelity Central Funds.
H Expense ratios reflect operating expenses of the class. Expenses before reductions do not reflect amounts reimbursed by the investment adviser or reductions from brokerage service arrangements or reductions from other expense offset arrangements and do not represent the amount paid by the class during periods when reimbursements or reductions occur. Expense ratios before reductions for start-up periods may not be representative of longer-term operating periods. Expenses net of fee waivers reflect expenses after reimbursement by the investment adviser but prior to reductions from brokerage service arrangements or other expense offset arrangements. Expenses net of all reductions represent the net expenses paid by the class.
I Annualized
J Amount does not include the portfolio activity of any underlying Fidelity Central Funds.
See accompanying notes which are an integral part of the financial statements.
Notes to Financial Statements (Unaudited)
For the period ended April 30, 2018
1. Organization.
Fidelity International Growth Fund (the Fund) is a fund of Fidelity Investment Trust (the Trust) and is authorized to issue an unlimited number of shares. The Trust is registered under the Investment Company Act of 1940, as amended (the 1940 Act), as an open-end management investment company organized as a Massachusetts business trust. The Fund offers Class A, Class M, Class C, International Growth, Class I, and Class Z shares, each of which has equal rights as to assets and voting privileges. Each class has exclusive voting rights with respect to matters that affect that class.
2. Investments in Fidelity Central Funds.
The Fund invests in Fidelity Central Funds, which are open-end investment companies generally available only to other investment companies and accounts managed by the investment adviser and its affiliates. The Fund's Schedule of Investments lists each of the Fidelity Central Funds held as of period end, if any, as an investment of the Fund, but does not include the underlying holdings of each Fidelity Central Fund. As an Investing Fund, the Fund indirectly bears its proportionate share of the expenses of the underlying Fidelity Central Funds.
The Money Market Central Funds seek preservation of capital and current income and are managed by Fidelity Investments Money Management, Inc. (FIMM), an affiliate of the investment adviser. Annualized expenses of the Money Market Central Funds as of their most recent shareholder report date are less than .005%.
A complete unaudited list of holdings for each Fidelity Central Fund is available upon request or at the Securities and Exchange Commission (the SEC) website at www.sec.gov. In addition, the financial statements of the Fidelity Central Funds are available on the SEC website or upon request.
3. Significant Accounting Policies.
The Fund is an investment company and applies the accounting and reporting guidance of the Financial Accounting Standards Board (FASB) Accounting Standards Codification Topic 946 Financial Services – Investments Companies. The financial statements have been prepared in conformity with accounting principles generally accepted in the United States of America (GAAP), which require management to make certain estimates and assumptions at the date of the financial statements. Actual results could differ from those estimates. Subsequent events, if any, through the date that the financial statements were issued have been evaluated in the preparation of the financial statements. The following summarizes the significant accounting policies of the Fund:
Investment Valuation. Investments are valued as of 4:00 p.m. Eastern time on the last calendar day of the period. The Board of Trustees (the Board) has delegated the day to day responsibility for the valuation of the Fund's investments to the Fair Value Committee (the Committee) established by the Fund's investment adviser. In accordance with valuation policies and procedures approved by the Board, the Fund attempts to obtain prices from one or more third party pricing vendors or brokers to value its investments. When current market prices, quotations or currency exchange rates are not readily available or reliable, investments will be fair valued in good faith by the Committee, in accordance with procedures adopted by the Board. Factors used in determining fair value vary by investment type and may include market or investment specific events. The frequency with which these procedures are used cannot be predicted and they may be utilized to a significant extent. The Committee oversees the Fund's valuation policies and procedures and reports to the Board on the Committee's activities and fair value determinations. The Board monitors the appropriateness of the procedures used in valuing the Fund's investments and ratifies the fair value determinations of the Committee.
The Fund categorizes the inputs to valuation techniques used to value its investments into a disclosure hierarchy consisting of three levels as shown below:
- Level 1 – quoted prices in active markets for identical investments
- Level 2 – other significant observable inputs (including quoted prices for similar investments, interest rates, prepayment speeds, etc.)
- Level 3 – unobservable inputs (including the Fund's own assumptions based on the best information available)
Valuation techniques used to value the Fund's investments by major category are as follows:
Equity securities, including restricted securities, for which market quotations are readily available, are valued at the last reported sale price or official closing price as reported by a third party pricing vendor on the primary market or exchange on which they are traded and are categorized as Level 1 in the hierarchy. In the event there were no sales during the day or closing prices are not available, securities are valued at the last quoted bid price or may be valued using the last available price and are generally categorized as Level 2 in the hierarchy. For foreign equity securities, when market or security specific events arise, comparisons to the valuation of American Depositary Receipts (ADRs), futures contracts, Exchange-Traded Funds (ETFs) and certain indexes as well as quoted prices for similar securities may be used and would be categorized as Level 2 in the hierarchy. Utilizing these techniques may result in transfers between Level 1 and Level 2. For equity securities, including restricted securities, where observable inputs are limited, assumptions about market activity and risk are used and these securities may be categorized as Level 3 in the hierarchy.
Investments in open-end mutual funds, including the Fidelity Central Funds, are valued at their closing net asset value (NAV) each business day and are categorized as Level 1 in the hierarchy.
Changes in valuation techniques may result in transfers in or out of an assigned level within the disclosure hierarchy. The aggregate value of investments by input level as of April 30, 2018, including information on transfers between Levels 1 and 2 is included at the end of the Fund's Schedule of Investments.
Foreign Currency. The Fund may use foreign currency contracts to facilitate transactions in foreign-denominated securities. Gains and losses from these transactions may arise from changes in the value of the foreign currency or if the counterparties do not perform under the contracts' terms.
Foreign-denominated assets, including investment securities, and liabilities are translated into U.S. dollars at the exchange rates at period end. Purchases and sales of investment securities, income and dividends received and expenses denominated in foreign currencies are translated into U.S. dollars at the exchange rate in effect on the transaction date.
The effects of exchange rate fluctuations on investments are included with the net realized and unrealized gain (loss) on investment securities. Other foreign currency transactions resulting in realized and unrealized gain (loss) are disclosed separately.
Investment Transactions and Income. For financial reporting purposes, the Fund's investment holdings and NAV include trades executed through the end of the last business day of the period. The NAV per share for processing shareholder transactions is calculated as of the close of business of the New York Stock Exchange (NYSE), normally 4:00 p.m. Eastern time and includes trades executed through the end of the prior business day. Gains and losses on securities sold are determined on the basis of identified cost and includes proceeds received from litigation. Dividend income is recorded on the ex-dividend date, except for certain dividends from foreign securities where the ex-dividend date may have passed, which are recorded as soon as the Fund is informed of the ex-dividend date. Non-cash dividends included in dividend income, if any, are recorded at the fair market value of the securities received. Income and capital gain distributions from Fidelity Central Funds, if any, are recorded on the ex-dividend date. Certain distributions received by the Fund represent a return of capital or capital gain. The Fund determines the components of these distributions subsequent to the ex-dividend date, based upon receipt of tax filings or other correspondence relating to the underlying investment. These distributions are recorded as a reduction of cost of investments and/or as a realized gain. Investment income is recorded net of foreign taxes withheld where recovery of such taxes is uncertain.
Class Allocations and Expenses. Investment income, realized and unrealized capital gains and losses, common expenses of the Fund, and certain fund-level expense reductions, if any, are allocated daily on a pro-rata basis to each class based on the relative net assets of each class to the total net assets of the Fund. Each class differs with respect to transfer agent and distribution and service plan fees incurred. Certain expense reductions may also differ by class. For the reporting period, the allocated portion of income and expenses to each class as a percent of its average net assets may vary due to the timing of recording these transactions in relation to fluctuating net assets of the classes. Expenses directly attributable to a fund are charged to that fund. Expenses attributable to more than one fund are allocated among the respective funds on the basis of relative net assets or other appropriate methods. Expense estimates are accrued in the period to which they relate and adjustments are made when actual amounts are known.
Income Tax Information and Distributions to Shareholders. Each year, the Fund intends to qualify as a regulated investment company under Subchapter M of the Internal Revenue Code, including distributing substantially all of its taxable income and realized gains. As a result, no provision for U.S. Federal income taxes is required. The Fund files a U.S. federal tax return, in addition to state and local tax returns as required. The Fund's federal income tax returns are subject to examination by the Internal Revenue Service (IRS) for a period of three fiscal years after they are filed. State and local tax returns may be subject to examination for an additional fiscal year depending on the jurisdiction. Foreign taxes are provided for based on the Fund's understanding of the tax rules and rates that exist in the foreign markets in which it invests. The Fund is subject to a tax imposed on capital gains by certain countries in which it invests. An estimated deferred tax liability for net unrealized appreciation on the applicable securities is included in Other payables and accrued expenses on the Statement of Assets & Liabilities.
Distributions are declared and recorded on the ex-dividend date. Income and capital gain distributions are declared separately for each class. Income and capital gain distributions are determined in accordance with income tax regulations, which may differ from GAAP.
Capital accounts within the financial statements are adjusted for permanent book-tax differences. These adjustments have no impact on net assets or the results of operations. Capital accounts are not adjusted for temporary book-tax differences which will reverse in a subsequent period.
Book-tax differences are primarily due to foreign currency transactions, certain foreign taxes, passive foreign investment companies (PFIC), capital loss carryforwards and losses deferred due to wash sales.
As of period end, the cost and unrealized appreciation (depreciation) in securities, and derivatives if applicable, for federal income tax purposes were as follows:
| Gross unrealized appreciation | $569,648,604 |
| Gross unrealized depreciation | (54,858,839) |
| Net unrealized appreciation (depreciation) | $514,789,765 |
| Tax cost | $2,021,996,633 |
Capital loss carryforwards are only available to offset future capital gains of the Fund to the extent provided by regulations and may be limited. Under the Regulated Investment Company Modernization Act of 2010 (the Act), the Fund is permitted to carry forward capital losses incurred in taxable years beginning after December 22, 2010 for an unlimited period and such capital losses are required to be used prior to any losses that expire. The capital loss carryforward information presented below, including any applicable limitation, is estimated as of prior fiscal period end and is subject to adjustment.
| No expiration | |
| Short-term | $(60,492,711) |
| Long-term | (26,057,719) |
| Total no expiration | $(86,550,430) |
4. Purchases and Sales of Investments.
Purchases and sales of securities, other than short-term securities, aggregated $470,825,477 and $428,760,667, respectively.
5. Fees and Other Transactions with Affiliates.
Management Fee. Fidelity Management & Research Company (the investment adviser) and its affiliates provide the Fund with investment management related services for which the Fund pays a monthly management fee. The management fee is the sum of an individual fund fee rate that is based on an annual rate of .45% of the Fund's average net assets and an annualized group fee rate that averaged .24% during the period. The group fee rate is based upon the average net assets of all the mutual funds advised by the investment adviser, including any mutual funds previously advised by the investment adviser that are currently advised by Fidelity SelectCo, LLC, an affiliate of the investment adviser. The group fee rate decreases as assets under management increase and increases as assets under management decrease. In addition, the management fee is subject to a performance adjustment (up to a maximum of +/- .20% of the Fund's average net assets over a 36 month performance period). The upward or downward adjustment to the management fee is based on the relative investment performance of International Growth as compared to its benchmark index, the MSCI EAFE Growth Index, over the same 36 month performance period. For the reporting period, the total annualized management fee rate, including the performance adjustment, was .71% of the Fund's average net assets. The performance adjustment included in the management fee rate may be higher or lower than the maximum performance adjustment rate due to the difference between the average net assets for the reporting and performance periods.
Distribution and Service Plan Fees. In accordance with Rule 12b-1 of the 1940 Act, the Fund has adopted separate Distribution and Service Plans for each class of shares. Certain classes pay Fidelity Distributors Corporation (FDC), an affiliate of the investment adviser, separate Distribution and Service Fees, each of which is based on an annual percentage of each class' average net assets. In addition, FDC may pay financial intermediaries for selling shares of the Fund and providing shareholder support services. For the period, the Distribution and Service Fee rates, total fees and amounts retained by FDC were as follows:
| Distribution Fee | Service Fee | Total Fees | Retained by FDC | |
| Class A | -% | .25% | $202,773 | $8,028 |
| Class M | .25% | .25% | 83,158 | 1,001 |
| Class C | .75% | .25% | 361,540 | 78,914 |
| $647,471 | $87,943 |
Sales Load. FDC may receive a front-end sales charge of up to 5.75% for selling Class A shares and 3.50% for selling Class M shares, some of which is paid to financial intermediaries for selling shares of the Fund. Depending on the holding period, FDC may receive contingent deferred sales charges levied on Class A, Class M and Class C redemptions. The deferred sales charges are 1.00% for Class C shares, 1.00% for certain purchases of Class A shares and .25% for certain purchases of Class M shares.
For the period, sales charge amounts retained by FDC were as follows:
| Retained by FDC | |
| Class A | $59,276 |
| Class M | 6,706 |
| Class C(a) | 7,870 |
| $73,852 |
(a) When Class C shares are initially sold, FDC pays commissions from its own resources to financial intermediaries through which the sales are made.
Transfer Agent Fees. Fidelity Investments Institutional Operations Company, Inc., (FIIOC), an affiliate of the investment adviser, is the transfer, dividend disbursing and shareholder servicing agent for each class of the Fund. FIIOC receives account fees and asset-based fees that vary according to the account size and type of account of the shareholders of the respective classes of the Fund, except for Class Z. FIIOC receives an asset-based fee of Class Z's average net assets. FIIOC pays for typesetting, printing and mailing of shareholder reports, except proxy statements.
For the period, transfer agent fees for each class were as follows:
| Amount | % of Class-Level Average Net Assets(a) | |
| Class A | $183,279 | .23 |
| Class M | 45,313 | .27 |
| Class C | 82,454 | .23 |
| International Growth | 1,040,139 | .21 |
| Class I | 708,469 | .18 |
| Class Z | 91,343 | .05 |
| $2,150,997 |
(a) Annualized
Accounting and Security Lending Fees. Fidelity Service Company, Inc. (FSC), an affiliate of the investment adviser, maintains the Fund's accounting records. The accounting fee is based on the level of average net assets for each month. Under a separate contract, FSC administers the security lending program. The security lending fee is based on the number and duration of lending transactions. For the period, the fees were equivalent to an annualized rate of .04%.
Brokerage Commissions. The Fund placed a portion of its portfolio transactions with brokerage firms which are affiliates of the investment adviser. Brokerage commissions are included in net realized gain (loss) and change in net unrealized appreciation (depreciation) in the Statement of Operations. The commissions paid to these affiliated firms were $995 for the period.
Interfund Lending Program. Pursuant to an Exemptive Order issued by the SEC, the Fund, along with other registered investment companies having management contracts with Fidelity Management & Research Company (FMR) or other affiliated entities of FMR, may participate in an interfund lending program. This program provides an alternative credit facility allowing the funds to borrow from, or lend money to, other participating affiliated funds. At period end, there were no interfund loans outstanding. The Fund's activity in this program during the period for which loans were outstanding was as follows:
| Borrower or Lender | Average Loan Balance | Weighted Average Interest Rate | Interest Expense |
| Borrower | $40,450,167 | 1.90% | $12,804 |
Interfund Trades. The Fund may purchase from or sell securities to other Fidelity Funds under procedures adopted by the Board. The procedures have been designed to ensure these interfund trades are executed in accordance with Rule 17a-7 of the 1940 Act. Interfund trades are included within the respective purchases and sales amounts shown in the Purchases and Sales of Investments note.
6. Committed Line of Credit.
The Fund participates with other funds managed by the investment adviser or an affiliate in a $4.25 billion credit facility (the "line of credit") to be utilized for temporary or emergency purposes to fund shareholder redemptions or for other short-term liquidity purposes. The Fund has agreed to pay commitment fees on its pro-rata portion of the line of credit, which amounted to $3,465 and is reflected in Miscellaneous expenses on the Statement of Operations. During the period, the Fund did not borrow on this line of credit.
7. Security Lending.
The Fund lends portfolio securities through a lending agent from time to time in order to earn additional income. For equity securities, a lending agent is used and may loan securities to certain qualified borrowers, including Fidelity Capital Markets (FCM), a broker-dealer affiliated with the Fund. On the settlement date of the loan, the Fund receives collateral (in the form of U.S. Treasury obligations, letters of credit and/or cash) against the loaned securities and maintains collateral in an amount not less than 100% of the market value of the loaned securities during the period of the loan. The market value of the loaned securities is determined at the close of business of the Fund and any additional required collateral is delivered to the Fund on the next business day. The Fund or borrower may terminate the loan at any time, and if the borrower defaults on its obligation to return the securities loaned because of insolvency or other reasons, the Fund may apply collateral received from the borrower against the obligation. The Fund may experience delays and costs in recovering the securities loaned. Any cash collateral received is invested in the Fidelity Securities Lending Cash Central Fund. The value of loaned securities and cash collateral at period end are disclosed on the Fund's Statement of Assets and Liabilities. At period end, there were no security loans outstanding with FCM. Security lending income represents the income earned on investing cash collateral, less rebates paid to borrowers and any lending agent fees associated with the loan, plus any premium payments received for lending certain types of securities. Security lending income is presented in the Statement of Operations as a component of income from Fidelity Central Funds. Total security lending income during the period amounted to $207,438, including $106 from securities loaned to FCM.
8. Expense Reductions.
Commissions paid to certain brokers with whom the investment adviser, or its affiliates, places trades on behalf of the Fund include an amount in addition to trade execution, which may be rebated back to the Fund to offset certain expenses. This amount totaled $105,299 for the period. Through arrangements with the Fund's custodian credits realized as a result of certain uninvested cash balances were used to reduce the Fund's expenses. During the period, these credits reduced the Fund's custody expenses by $335.
In addition, during the period the investment adviser reimbursed and/or waived a portion of fund-level operating expenses in the amount of $11,924.
9. Distributions to Shareholders.
Distributions to shareholders of each class were as follows:
| Six months ended April 30, 2018 | Year ended October 31, 2017 | |
| From net investment income | ||
| Class A | $491,758 | $1,997,030 |
| Class M | 12,154 | 186,824 |
| Class C | – | 77,926 |
| International Growth | 5,670,567 | 11,653,320 |
| Class I | 4,983,374 | 4,492,180 |
| Class Z | 2,928,337 | 221,901 |
| Total | $14,086,190 | $18,629,181 |
| From net realized gain | ||
| Class A | $175,523 | $– |
| Class M | 36,436 | – |
| International Growth | 1,076,314 | – |
| Class I | 839,568 | – |
| Class Z | 422,189 | – |
| Total | $2,550,030 | $– |
10. Share Transactions.
Share transactions for each class were as follows and may contain automatic conversions between classes or exchanges between affiliated funds:
| Shares | Shares | Dollars | Dollars | |
| Six months ended April 30, 2018 | Year ended October 31, 2017 | Six months ended April 30, 2018 | Year ended October 31, 2017 | |
| Class A | ||||
| Shares sold | 1,572,515 | 4,137,031 | $21,580,659 | $48,223,768 |
| Reinvestment of distributions | 49,581 | 187,295 | 663,775 | 1,972,221 |
| Shares redeemed | (1,423,213) | (12,953,360) | (19,459,107) | (147,524,032) |
| Net increase (decrease) | 198,883 | (8,629,034) | $2,785,327 | $(97,328,043) |
| Class M | ||||
| Shares sold | 218,936 | 634,763 | $3,003,474 | $7,389,758 |
| Reinvestment of distributions | 3,624 | 17,518 | 48,527 | 184,470 |
| Shares redeemed | (393,405) | (705,137) | (5,352,323) | (8,346,528) |
| Net increase (decrease) | (170,845) | (52,856) | $(2,300,322) | $(772,300) |
| Class C | ||||
| Shares sold | 751,386 | 1,572,029 | $10,186,038 | $18,704,209 |
| Reinvestment of distributions | – | 7,327 | – | 76,279 |
| Shares redeemed | (673,468) | (1,259,133) | (9,055,177) | (14,766,822) |
| Net increase (decrease) | 77,918 | 320,223 | $1,130,861 | $4,013,666 |
| International Growth | ||||
| Shares sold | 12,132,112 | 28,743,527 | $168,190,900 | $341,195,764 |
| Reinvestment of distributions | 469,327 | 929,056 | 6,314,733 | 9,838,706 |
| Shares redeemed | (15,533,206) | (52,869,764) | (215,100,341) | (601,819,958) |
| Net increase (decrease) | (2,931,767) | (23,197,181) | $(40,594,708) | $(250,785,488) |
| Class I | ||||
| Shares sold | 13,570,374 | 38,959,806 | $186,925,933 | $465,525,076 |
| Reinvestment of distributions | 352,720 | 415,087 | 4,735,066 | 4,387,467 |
| Shares redeemed | (7,294,020) | (17,997,694) | (100,623,165) | (214,014,368) |
| Net increase (decrease) | 6,629,074 | 21,377,199 | $91,037,834 | $255,898,175 |
| Class Z | ||||
| Shares sold | 4,797,477 | 35,134,319 | $66,427,683 | $405,268,628 |
| Reinvestment of distributions | 140,992 | 20,974 | 1,894,059 | 221,901 |
| Shares redeemed | (2,028,589) | (8,913,102) | (27,954,685) | (105,624,601) |
| Net increase (decrease) | 2,909,880 | 26,242,191 | $40,367,057 | $299,865,928 |
11. Other.
The Fund's organizational documents provide former and current trustees and officers with a limited indemnification against liabilities arising in connection with the performance of their duties to the Fund. In the normal course of business, the Fund may also enter into contracts that provide general indemnifications. The Fund's maximum exposure under these arrangements is unknown as this would be dependent on future claims that may be made against the Fund. The risk of material loss from such claims is considered remote.
Shareholder Expense Example
As a shareholder of the Fund, you incur two types of costs: (1) transaction costs, including sales charges (loads) on purchase payments or redemption proceeds, and (2) ongoing costs, including management fees, distribution and/or service (12b-1) fees and other Fund expenses. This Example is intended to help you understand your ongoing costs (in dollars) of investing in the Fund and to compare these costs with the ongoing costs of investing in other mutual funds.
The Example is based on an investment of $1,000 invested at the beginning of the period and held for the entire period (November 1, 2017 to April 30, 2018).
Actual Expenses
The first line of the accompanying table for each class of the Fund provides information about actual account values and actual expenses. You may use the information in this line, together with the amount you invested, to estimate the expenses that you paid over the period. Simply divide your account value by $1,000.00 (for example, an $8,600 account value divided by $1,000.00 = 8.6), then multiply the result by the number in the first line for a class of the Fund under the heading entitled "Expenses Paid During Period" to estimate the expenses you paid on your account during this period. A small balance maintenance fee of $12.00 that is charged once a year may apply for certain accounts with a value of less than $2,000. This fee is not included in the table below. If it was, the estimate of expenses you paid during the period would be higher, and your ending account value lower, by this amount. In addition, the Fund, as a shareholder in the underlying Fidelity Central Funds, will indirectly bear its pro-rata share of the fees and expenses incurred by the underlying Fidelity Central Funds. These fees and expenses are not included in the Fund's annualized expense ratio used to calculate the expense estimate in the table below.
Hypothetical Example for Comparison Purposes
The second line of the accompanying table for each class of the Fund provides information about hypothetical account values and hypothetical expenses based on a Class' actual expense ratio and an assumed rate of return of 5% per year before expenses, which is not the Class' actual return. The hypothetical account values and expenses may not be used to estimate the actual ending account balance or expenses you paid for the period. You may use this information to compare the ongoing costs of investing in the Fund and other funds. To do so, compare this 5% hypothetical example with the 5% hypothetical examples that appear in the shareholder reports of the other funds. A small balance maintenance fee of $12.00 that is charged once a year may apply for certain accounts with a value of less than $2,000. This fee is not included in the table below. If it was, the estimate of expenses you paid during the period would be higher, and your ending account value lower, by this amount. In addition, the Fund, as a shareholder in the underlying Fidelity Central Funds, will indirectly bear its pro-rata share of the fees and expenses incurred by the underlying Fidelity Central Funds. These fees and expenses are not included in the Fund's annualized expense ratio used to calculate the expense estimate in the table below.
Please note that the expenses shown in the table are meant to highlight your ongoing costs only and do not reflect any transaction costs. Therefore, the second line of the table is useful in comparing ongoing costs only, and will not help you determine the relative total costs of owning different funds. In addition, if these transactional costs were included, your costs would have been higher.
| Annualized Expense Ratio-A | Beginning Account Value November 1, 2017 | Ending Account Value April 30, 2018 | Expenses Paid During Period-B November 1, 2017 to April 30, 2018 | |
| Class A | 1.25% | |||
| Actual | $1,000.00 | $1,014.80 | $6.24 | |
| Hypothetical-C | $1,000.00 | $1,018.60 | $6.26 | |
| Class M | 1.55% | |||
| Actual | $1,000.00 | $1,012.80 | $7.74 | |
| Hypothetical-C | $1,000.00 | $1,017.11 | $7.75 | |
| Class C | 2.00% | |||
| Actual | $1,000.00 | $1,010.70 | $9.97 | |
| Hypothetical-C | $1,000.00 | $1,014.88 | $9.99 | |
| International Growth | .98% | |||
| Actual | $1,000.00 | $1,016.00 | $4.90 | |
| Hypothetical-C | $1,000.00 | $1,019.93 | $4.91 | |
| Class I | .95% | |||
| Actual | $1,000.00 | $1,016.00 | $4.75 | |
| Hypothetical-C | $1,000.00 | $1,020.08 | $4.76 | |
| Class Z | .82% | |||
| Actual | $1,000.00 | $1,017.10 | $4.10 | |
| Hypothetical-C | $1,000.00 | $1,020.73 | $4.11 |
A Annualized expense ratio reflects expenses net of applicable fee waivers.
B Expenses are equal to each Class' annualized expense ratio, multiplied by the average account value over the period, multiplied by 181/365 (to reflect the one-half year period).
C 5% return per year before expenses
![]()
AIGF-SANN-0618
1.853352.110
Fidelity® International Growth Fund Semi-Annual Report April 30, 2018 |
|
Contents
To view a fund's proxy voting guidelines and proxy voting record for the 12-month period ended June 30, visit http://www.fidelity.com/proxyvotingresults or visit the Securities and Exchange Commission's (SEC) web site at http://www.sec.gov.
You may also call 1-800-544-8544 to request a free copy of the proxy voting guidelines.
Standard & Poor's, S&P and S&P 500 are registered service marks of The McGraw-Hill Companies, Inc. and have been licensed for use by Fidelity Distributors Corporation.
Other third-party marks appearing herein are the property of their respective owners.
All other marks appearing herein are registered or unregistered trademarks or service marks of FMR LLC or an affiliated company. © 2018 FMR LLC. All rights reserved.
This report and the financial statements contained herein are submitted for the general information of the shareholders of the Fund. This report is not authorized for distribution to prospective investors in the Fund unless preceded or accompanied by an effective prospectus.
A fund files its complete schedule of portfolio holdings with the SEC for the first and third quarters of each fiscal year on Form N-Q. Forms N-Q are available on the SEC’s web site at http://www.sec.gov. A fund's Forms N-Q may be reviewed and copied at the SEC’s Public Reference Room in Washington, DC. Information regarding the operation of the SEC's Public Reference Room may be obtained by calling 1-800-SEC-0330.
For a complete list of a fund's portfolio holdings, view the most recent holdings listing, semiannual report, or annual report on Fidelity's web site at http://www.fidelity.com, http://www.institutional.fidelity.com, or http://www.401k.com, as applicable.
NOT FDIC INSURED •MAY LOSE VALUE •NO BANK GUARANTEE
Neither the Fund nor Fidelity Distributors Corporation is a bank.
Investment Summary (Unaudited)
Geographic Diversification (% of fund's net assets)
| As of April 30, 2018 | ||
| United States of America* | 21.4% | |
| Japan | 13.8% | |
| United Kingdom | 10.7% | |
| Germany | 6.6% | |
| Switzerland | 6.4% | |
| Sweden | 5.0% | |
| Spain | 3.5% | |
| Australia | 3.4% | |
| Ireland | 3.3% | |
| Other | 25.9% | |

* Includes Short-Term investments and Net Other Assets (Liabilities).
Percentages are based on country or territory of incorporation and are adjusted for the effect of futures contracts, if applicable.
Asset Allocation as of April 30, 2018
| % of fund's net assets | |
| Stocks | 96.2 |
| Short-Term Investments and Net Other Assets (Liabilities) | 3.8 |
Top Ten Stocks as of April 30, 2018
| % of fund's net assets | |
| CSL Ltd. (Australia, Biotechnology) | 3.4 |
| SAP SE (Germany, Software) | 3.2 |
| Keyence Corp. (Japan, Electronic Equipment & Components) | 3.2 |
| Nestle SA (Reg. S) (Switzerland, Food Products) | 2.9 |
| AIA Group Ltd. (Hong Kong, Insurance) | 2.7 |
| Visa, Inc. Class A (United States of America, IT Services) | 2.6 |
| Roche Holding AG (participation certificate) (Switzerland, Pharmaceuticals) | 2.5 |
| MasterCard, Inc. Class A (United States of America, IT Services) | 2.4 |
| ASML Holding NV (Netherlands) (Netherlands, Semiconductors & Semiconductor Equipment) | 2.3 |
| British American Tobacco PLC (United Kingdom) (United Kingdom, Tobacco) | 2.2 |
| 27.4 |
Top Market Sectors as of April 30, 2018
| % of fund's net assets | |
| Information Technology | 22.5 |
| Industrials | 19.5 |
| Financials | 13.4 |
| Consumer Staples | 11.3 |
| Health Care | 10.1 |
| Consumer Discretionary | 9.8 |
| Materials | 7.4 |
| Real Estate | 0.9 |
| Telecommunication Services | 0.7 |
| Energy | 0.6 |
Schedule of Investments April 30, 2018 (Unaudited)
Showing Percentage of Net Assets
| Common Stocks - 95.6% | |||
| Shares | Value | ||
| Australia - 3.4% | |||
| CSL Ltd. | 648,255 | $83,034,369 | |
| Austria - 1.1% | |||
| Andritz AG | 506,321 | 27,245,465 | |
| Belgium - 2.6% | |||
| Anheuser-Busch InBev SA NV | 368,291 | 36,789,572 | |
| KBC Groep NV | 290,376 | 25,387,643 | |
| TOTAL BELGIUM | 62,177,215 | ||
| Brazil - 0.1% | |||
| Itau Unibanco Holding SA | 230,900 | 2,906,682 | |
| Canada - 1.9% | |||
| Alimentation Couche-Tard, Inc. Class B (sub. vtg.) | 232,600 | 10,056,175 | |
| Canadian Pacific Railway Ltd. | 65,300 | 11,915,171 | |
| Franco-Nevada Corp. | 195,200 | 13,845,449 | |
| Pason Systems, Inc. | 280,500 | 3,921,473 | |
| PrairieSky Royalty Ltd. | 275,300 | 6,104,436 | |
| TOTAL CANADA | 45,842,704 | ||
| Cayman Islands - 1.7% | |||
| 58.com, Inc. ADR (a) | 110,870 | 9,688,929 | |
| Alibaba Group Holding Ltd. sponsored ADR (a) | 177,900 | 31,762,266 | |
| Ping An Healthcare and Technology Co. Ltd. (a) | 100,800 | 703,795 | |
| TOTAL CAYMAN ISLANDS | 42,154,990 | ||
| Denmark - 1.2% | |||
| Jyske Bank A/S (Reg.) | 240,800 | 14,476,023 | |
| Novo Nordisk A/S Series B sponsored ADR | 320,600 | 15,048,964 | |
| TOTAL DENMARK | 29,524,987 | ||
| Finland - 0.2% | |||
| Tikkurila Oyj | 298,300 | 5,396,202 | |
| France - 2.8% | |||
| Edenred SA | 436,300 | 15,015,963 | |
| Elis SA | 397,736 | 9,519,665 | |
| Legrand SA | 228,100 | 17,766,755 | |
| Safran SA | 222,700 | 26,120,522 | |
| TOTAL FRANCE | 68,422,905 | ||
| Germany - 6.6% | |||
| Bayer AG | 364,000 | 43,505,138 | |
| Linde AG | 112,200 | 24,937,435 | |
| MTU Aero Engines Holdings AG | 76,900 | 13,279,615 | |
| SAP SE | 700,434 | 77,822,197 | |
| TOTAL GERMANY | 159,544,385 | ||
| Hong Kong - 2.7% | |||
| AIA Group Ltd. | 7,472,400 | 66,782,334 | |
| India - 1.2% | |||
| Housing Development Finance Corp. Ltd. | 1,013,329 | 28,670,141 | |
| Ireland - 3.3% | |||
| CRH PLC sponsored ADR (b) | 1,327,566 | 46,942,734 | |
| James Hardie Industries PLC CDI | 1,923,278 | 33,964,021 | |
| TOTAL IRELAND | 80,906,755 | ||
| Isle of Man - 0.5% | |||
| Playtech Ltd. | 1,065,276 | 11,887,980 | |
| Italy - 0.8% | |||
| Interpump Group SpA | 590,826 | 18,821,641 | |
| Japan - 13.8% | |||
| Azbil Corp. | 95,300 | 4,445,939 | |
| DENSO Corp. | 494,400 | 26,031,526 | |
| East Japan Railway Co. | 258,800 | 24,833,626 | |
| Fanuc Corp. | 110,700 | 23,713,117 | |
| Hoya Corp. | 348,600 | 18,692,766 | |
| Keyence Corp. | 126,924 | 77,754,302 | |
| Komatsu Ltd. | 895,700 | 30,533,280 | |
| Misumi Group, Inc. | 1,066,500 | 29,559,962 | |
| Nabtesco Corp. | 330,700 | 11,964,128 | |
| Nintendo Co. Ltd. | 35,000 | 14,706,178 | |
| OSG Corp. | 604,900 | 13,434,844 | |
| SHO-BOND Holdings Co. Ltd. | 237,400 | 17,980,900 | |
| USS Co. Ltd. | 1,990,600 | 41,898,743 | |
| TOTAL JAPAN | 335,549,311 | ||
| Kenya - 0.7% | |||
| Safaricom Ltd. | 62,911,800 | 17,719,425 | |
| Korea (South) - 0.8% | |||
| BGF Retail Co. Ltd. | 57,931 | 10,332,022 | |
| NAVER Corp. | 15,043 | 10,057,462 | |
| TOTAL KOREA (SOUTH) | 20,389,484 | ||
| Mexico - 0.5% | |||
| Fomento Economico Mexicano S.A.B. de CV sponsored ADR | 118,655 | 11,469,192 | |
| Netherlands - 2.3% | |||
| ASML Holding NV (Netherlands) (b) | 299,200 | 56,906,942 | |
| New Zealand - 0.3% | |||
| Auckland International Airport Ltd. | 1,774,867 | 7,967,321 | |
| Norway - 0.4% | |||
| Schibsted ASA (B Shares) | 324,975 | 8,749,935 | |
| South Africa - 2.4% | |||
| Clicks Group Ltd. | 1,195,770 | 20,443,990 | |
| Naspers Ltd. Class N | 154,900 | 37,736,670 | |
| TOTAL SOUTH AFRICA | 58,180,660 | ||
| Spain - 3.5% | |||
| Amadeus IT Holding SA Class A | 632,100 | 46,333,764 | |
| Banco Bilbao Vizcaya Argentaria SA | 1,176,800 | 9,522,734 | |
| Hispania Activos Inmobiliarios SA | 381,324 | 8,104,569 | |
| Merlin Properties Socimi SA | 469,900 | 7,263,376 | |
| Prosegur Compania de Seguridad SA (Reg.) | 1,742,449 | 13,214,259 | |
| TOTAL SPAIN | 84,438,702 | ||
| Sweden - 5.0% | |||
| ASSA ABLOY AB (B Shares) (b) | 2,389,483 | 50,263,830 | |
| Atlas Copco AB (A Shares) | 1,004,700 | 39,480,540 | |
| Fagerhult AB | 881,632 | 9,010,988 | |
| Loomis AB (B Shares) | 176,600 | 6,457,643 | |
| Svenska Handelsbanken AB (A Shares) | 1,465,820 | 16,347,211 | |
| TOTAL SWEDEN | 121,560,212 | ||
| Switzerland - 6.4% | |||
| Nestle SA (Reg. S) | 902,305 | 69,901,652 | |
| Roche Holding AG (participation certificate) | 276,670 | 61,472,607 | |
| Schindler Holding AG: | |||
| (participation certificate) | 99,045 | 20,548,589 | |
| (Reg.) | 18,350 | 3,686,665 | |
| TOTAL SWITZERLAND | 155,609,513 | ||
| Taiwan - 0.9% | |||
| Taiwan Semiconductor Manufacturing Co. Ltd. | 2,918,000 | 22,188,034 | |
| Turkey - 0.2% | |||
| Tupras Turkiye Petrol Rafinerileri A/S | 217,012 | 5,529,342 | |
| United Kingdom - 10.7% | |||
| BAE Systems PLC | 2,476,700 | 20,780,073 | |
| British American Tobacco PLC (United Kingdom) | 959,300 | 52,615,217 | |
| Elementis PLC | 1,676,110 | 6,544,072 | |
| Informa PLC | 2,867,284 | 29,171,211 | |
| InterContinental Hotel Group PLC ADR (b) | 543,522 | 34,589,740 | |
| Melrose Industries PLC | 3,140,139 | 9,856,507 | |
| Prudential PLC | 2,032,177 | 52,255,520 | |
| Reckitt Benckiser Group PLC | 348,745 | 27,358,376 | |
| Rightmove PLC | 90,400 | 5,681,311 | |
| Shaftesbury PLC | 469,333 | 6,532,382 | |
| Spectris PLC | 378,557 | 14,019,189 | |
| TOTAL UNITED KINGDOM | 259,403,598 | ||
| United States of America - 17.6% | |||
| Alphabet, Inc. Class A (a) | 36,336 | 37,011,123 | |
| Autoliv, Inc. (b) | 206,069 | 27,623,549 | |
| Berkshire Hathaway, Inc. Class B (a) | 148,484 | 28,765,805 | |
| Black Knight, Inc. (a) | 132,800 | 6,460,720 | |
| Martin Marietta Materials, Inc. | 112,600 | 21,931,102 | |
| MasterCard, Inc. Class A | 332,400 | 59,256,948 | |
| Mohawk Industries, Inc. (a) | 83,900 | 17,608,932 | |
| Moody's Corp. | 105,700 | 17,144,540 | |
| MSCI, Inc. | 166,800 | 24,991,644 | |
| PayPal Holdings, Inc. (a) | 142,400 | 10,624,464 | |
| Philip Morris International, Inc. | 330,308 | 27,085,256 | |
| PriceSmart, Inc. | 116,700 | 10,222,920 | |
| ResMed, Inc. | 263,600 | 24,947,104 | |
| S&P Global, Inc. | 132,000 | 24,895,200 | |
| Sherwin-Williams Co. | 74,100 | 27,243,606 | |
| Visa, Inc. Class A | 486,760 | 61,760,109 | |
| TOTAL UNITED STATES OF AMERICA | 427,573,022 | ||
| TOTAL COMMON STOCKS | |||
| (Cost $1,810,136,950) | 2,326,553,448 | ||
| Nonconvertible Preferred Stocks - 0.6% | |||
| Brazil - 0.6% | |||
| Itau Unibanco Holding SA | |||
| (Cost $13,722,725) | 1,050,500 | 15,296,302 | |
| Money Market Funds - 8.0% | |||
| Fidelity Cash Central Fund, 1.74% (c) | 78,144,997 | 78,160,626 | |
| Fidelity Securities Lending Cash Central Fund 1.74% (c)(d) | 116,764,346 | 116,776,022 | |
| TOTAL MONEY MARKET FUNDS | |||
| (Cost $194,936,648) | 194,936,648 | ||
| TOTAL INVESTMENT IN SECURITIES - 104.2% | |||
| (Cost $2,018,796,323) | 2,536,786,398 | ||
| NET OTHER ASSETS (LIABILITIES) - (4.2)% | (102,341,868) | ||
| NET ASSETS - 100% | $2,434,444,530 |
Categorizations in the Schedule of Investments are based on country or territory of incorporation.
Legend
(a) Non-income producing
(b) Security or a portion of the security is on loan at period end.
(c) Affiliated fund that is generally available only to investment companies and other accounts managed by Fidelity Investments. The rate quoted is the annualized seven-day yield of the fund at period end. A complete unaudited listing of the fund's holdings as of its most recent quarter end is available upon request. In addition, each Fidelity Central Fund's financial statements are available on the SEC's website or upon request.
(d) Investment made with cash collateral received from securities on loan.
Affiliated Central Funds
Information regarding fiscal year to date income earned by the Fund from investments in Fidelity Central Funds is as follows:
| Fund | Income earned |
| Fidelity Cash Central Fund | $351,120 |
| Fidelity Securities Lending Cash Central Fund | 207,438 |
| Total | $558,558 |
Amounts in the income column in the above table include any capital gain distributions from underlying funds, which are presented in the corresponding line-item in the Statement of Operations if applicable.
Investment Valuation
The following is a summary of the inputs used, as of April 30, 2018, involving the Fund's assets and liabilities carried at fair value. The inputs or methodology used for valuing securities may not be an indication of the risk associated with investing in those securities. For more information on valuation inputs, and their aggregation into the levels used below, please refer to the Investment Valuation section in the accompanying Notes to Financial Statements.
| Valuation Inputs at Reporting Date: | ||||
| Description | Total | Level 1 | Level 2 | Level 3 |
| Investments in Securities: | ||||
| Equities: | ||||
| Consumer Discretionary | $235,298,286 | $197,561,616 | $37,736,670 | $-- |
| Consumer Staples | 276,274,372 | 105,955,137 | 170,319,235 | -- |
| Energy | 15,555,251 | 15,555,251 | -- | -- |
| Financials | 327,441,779 | 153,863,839 | 173,577,940 | -- |
| Health Care | 247,404,743 | 58,688,834 | 188,715,909 | -- |
| Industrials | 472,971,069 | 371,824,077 | 101,146,992 | -- |
| Information Technology | 546,479,877 | 431,763,468 | 114,716,409 | -- |
| Materials | 180,804,621 | 146,840,600 | 33,964,021 | -- |
| Real Estate | 21,900,327 | 21,900,327 | -- | -- |
| Telecommunication Services | 17,719,425 | 17,719,425 | -- | -- |
| Money Market Funds | 194,936,648 | 194,936,648 | -- | -- |
| Total Investments in Securities: | $2,536,786,398 | $1,716,609,222 | $820,177,176 | $-- |
The following is a summary of transfers between Level 1 and Level 2 for the period ended April 30, 2018. Transfers are assumed to have occurred at the beginning of the period, and are primarily attributable to the valuation techniques used for foreign equity securities, as discussed in the accompanying Notes to Financial Statements:
| Transfers | Total |
| Level 1 to Level 2 | $252,146,114 |
| Level 2 to Level 1 | $406,173,441 |
See accompanying notes which are an integral part of the financial statements.
Financial Statements
Statement of Assets and Liabilities
| April 30, 2018 (Unaudited) | ||
| Assets | ||
| Investment in securities, at value (including securities loaned of $110,898,463) — See accompanying schedule: Unaffiliated issuers (cost $1,823,859,675) | $2,341,849,750 | |
| Fidelity Central Funds (cost $194,936,648) | 194,936,648 | |
| Total Investment in Securities (cost $2,018,796,323) | $2,536,786,398 | |
| Foreign currency held at value (cost $211,154) | 211,154 | |
| Receivable for investments sold | 4,169,157 | |
| Receivable for fund shares sold | 6,588,831 | |
| Dividends receivable | 14,601,735 | |
| Distributions receivable from Fidelity Central Funds | 109,723 | |
| Prepaid expenses | 1,096 | |
| Other receivables | 56,265 | |
| Total assets | 2,562,524,359 | |
| Liabilities | ||
| Payable for investments purchased | $7,515,768 | |
| Payable for fund shares redeemed | 1,650,022 | |
| Accrued management fee | 1,382,041 | |
| Distribution and service plan fees payable | 106,675 | |
| Other affiliated payables | 419,126 | |
| Other payables and accrued expenses | 239,048 | |
| Collateral on securities loaned | 116,767,149 | |
| Total liabilities | 128,079,829 | |
| Net Assets | $2,434,444,530 | |
| Net Assets consist of: | ||
| Paid in capital | $1,977,683,957 | |
| Undistributed net investment income | 13,090,126 | |
| Accumulated undistributed net realized gain (loss) on investments and foreign currency transactions | (74,062,762) | |
| Net unrealized appreciation (depreciation) on investments and assets and liabilities in foreign currencies | 517,733,209 | |
| Net Assets | $2,434,444,530 | |
| Calculation of Maximum Offering Price | ||
| Class A: | ||
| Net Asset Value and redemption price per share ($161,278,286 ÷ 11,963,841 shares) | $13.48 | |
| Maximum offering price per share (100/94.25 of $13.48) | $14.30 | |
| Class M: | ||
| Net Asset Value and redemption price per share ($31,686,072÷ 2,355,222 shares) | $13.45 | |
| Maximum offering price per share (100/96.50 of $13.45) | $13.94 | |
| Class C: | ||
| Net Asset Value and offering price per share ($70,680,330 ÷ 5,339,404 shares)(a) | $13.24 | |
| International Growth: | ||
| Net Asset Value, offering price and redemption price per share ($930,528,739 ÷ 68,576,631 shares) | $13.57 | |
| Class I: | ||
| Net Asset Value, offering price and redemption price per share ($824,016,754 ÷ 60,851,076 shares) | $13.54 | |
| Class Z: | ||
| Net Asset Value, offering price and redemption price per share ($416,254,349 ÷ 30,699,863 shares) | $13.56 |
(a) Redemption price per share is equal to net asset value less any applicable contingent deferred sales charge.
See accompanying notes which are an integral part of the financial statements.
Statement of Operations
| Six months ended April 30, 2018 (Unaudited) | ||
| Investment Income | ||
| Dividends | $28,132,447 | |
| Income from Fidelity Central Funds | 558,558 | |
| Income before foreign taxes withheld | 28,691,005 | |
| Less foreign taxes withheld | (2,820,258) | |
| Total income | 25,870,747 | |
| Expenses | ||
| Management fee | ||
| Basic fee | $8,510,674 | |
| Performance adjustment | 209,909 | |
| Transfer agent fees | 2,150,997 | |
| Distribution and service plan fees | 647,471 | |
| Accounting and security lending fees | 541,504 | |
| Custodian fees and expenses | 158,665 | |
| Independent trustees' fees and expenses | 4,818 | |
| Registration fees | 84,521 | |
| Audit | 37,705 | |
| Legal | 5,220 | |
| Interest | 12,804 | |
| Miscellaneous | 7,407 | |
| Total expenses before reductions | 12,371,695 | |
| Expense reductions | (117,558) | 12,254,137 |
| Net investment income (loss) | 13,616,610 | |
| Realized and Unrealized Gain (Loss) | ||
| Net realized gain (loss) on: | ||
| Investment securities: | ||
| Unaffiliated issuers | 20,470,806 | |
| Fidelity Central Funds | 2,201 | |
| Foreign currency transactions | (138,586) | |
| Total net realized gain (loss) | 20,334,421 | |
| Change in net unrealized appreciation (depreciation) on: | ||
| Investment securities: | ||
| Unaffiliated issuers (net of increase in deferred foreign taxes of $56,921) | 1,436,583 | |
| Assets and liabilities in foreign currencies | (107,020) | |
| Total change in net unrealized appreciation (depreciation) | 1,329,563 | |
| Net gain (loss) | 21,663,984 | |
| Net increase (decrease) in net assets resulting from operations | $35,280,594 |
See accompanying notes which are an integral part of the financial statements.
Statement of Changes in Net Assets
| Six months ended April 30, 2018 (Unaudited) | Year ended October 31, 2017 | |
| Increase (Decrease) in Net Assets | ||
| Operations | ||
| Net investment income (loss) | $13,616,610 | $16,277,855 |
| Net realized gain (loss) | 20,334,421 | (12,551,371) |
| Change in net unrealized appreciation (depreciation) | 1,329,563 | 409,389,366 |
| Net increase (decrease) in net assets resulting from operations | 35,280,594 | 413,115,850 |
| Distributions to shareholders from net investment income | (14,086,190) | (18,629,181) |
| Distributions to shareholders from net realized gain | (2,550,030) | – |
| Total distributions | (16,636,220) | (18,629,181) |
| Share transactions - net increase (decrease) | 92,426,049 | 210,891,938 |
| Redemption fees | – | 6,903 |
| Total increase (decrease) in net assets | 111,070,423 | 605,385,510 |
| Net Assets | ||
| Beginning of period | 2,323,374,107 | 1,717,988,597 |
| End of period | $2,434,444,530 | $2,323,374,107 |
| Other Information | ||
| Undistributed net investment income end of period | $13,090,126 | $13,559,706 |
See accompanying notes which are an integral part of the financial statements.
Financial Highlights
Fidelity International Growth Fund Class A
| Six months ended (Unaudited) April 30, | Years endedOctober 31, | |||||
| 2018 | 2017 | 2016 | 2015 | 2014 | 2013 | |
| Selected Per–Share Data | ||||||
| Net asset value, beginning of period | $13.34 | $10.88 | $11.30 | $11.01 | $10.78 | $8.91 |
| Income from Investment Operations | ||||||
| Net investment income (loss)A | .06 | .07 | .12B | .07 | .09 | .08 |
| Net realized and unrealized gain (loss) | .14 | 2.49 | (.48) | .28 | .18 | 1.88 |
| Total from investment operations | .20 | 2.56 | (.36) | .35 | .27 | 1.96 |
| Distributions from net investment income | (.04) | (.10) | (.05) | (.06) | (.03) | (.08) |
| Distributions from net realized gain | (.02) | – | (.01) | – | (.01) | (.01) |
| Total distributions | (.06) | (.10) | (.06) | (.06) | (.04) | (.09) |
| Redemption fees added to paid in capitalA | – | –C | –C | –C | –C | –C |
| Net asset value, end of period | $13.48 | $13.34 | $10.88 | $11.30 | $11.01 | $10.78 |
| Total ReturnD,E,F | 1.48% | 23.80% | (3.22)% | 3.20% | 2.54% | 22.18% |
| Ratios to Average Net AssetsG,H | ||||||
| Expenses before reductions | 1.25%I | 1.28% | 1.27% | 1.26% | 1.35% | 1.44% |
| Expenses net of fee waivers, if any | 1.25%I | 1.28% | 1.27% | 1.26% | 1.35% | 1.43% |
| Expenses net of all reductions | 1.24%I | 1.27% | 1.27% | 1.25% | 1.34% | 1.42% |
| Net investment income (loss) | .86%I | .62% | 1.05%B | .66% | .84% | .80% |
| Supplemental Data | ||||||
| Net assets, end of period (000 omitted) | $161,278 | $156,988 | $221,861 | $184,878 | $119,017 | $74,595 |
| Portfolio turnover rateJ | 36%I | 22% | 29% | 26% | 27% | 32% |
A Calculated based on average shares outstanding during the period.
B Net Investment income per share reflects a large, non-recurring dividend which amounted to $.04 per share. Excluding this non-recurring dividend, the ratio of net investment income (loss) to average net assets would have been .68%.
C Amount represents less than $.005 per share.
D Total returns for periods of less than one year are not annualized.
E Total returns would have been lower if certain expenses had not been reduced during the applicable periods shown.
F Total returns do not include the effect of the sales charges.
G Fees and expenses of any underlying Fidelity Central Funds are not included in the Fund's expense ratio. The Fund indirectly bears its proportionate share of the expenses of any underlying Fidelity Central Funds.
H Expense ratios reflect operating expenses of the class. Expenses before reductions do not reflect amounts reimbursed by the investment adviser or reductions from brokerage service arrangements or reductions from other expense offset arrangements and do not represent the amount paid by the class during periods when reimbursements or reductions occur. Expenses net of fee waivers reflect expenses after reimbursement by the investment adviser but prior to reductions from brokerage service arrangements or other expense offset arrangements. Expenses net of all reductions represent the net expenses paid by the class.
I Annualized
J Amount does not include the portfolio activity of any underlying Fidelity Central Funds.
See accompanying notes which are an integral part of the financial statements.
Fidelity International Growth Fund Class M
| Six months ended (Unaudited) April 30, | Years endedOctober 31, | |||||
| 2018 | 2017 | 2016 | 2015 | 2014 | 2013 | |
| Selected Per–Share Data | ||||||
| Net asset value, beginning of period | $13.30 | $10.84 | $11.26 | $10.96 | $10.75 | $8.89 |
| Income from Investment Operations | ||||||
| Net investment income (loss)A | .04 | .04 | .08B | .04 | .06 | .05 |
| Net realized and unrealized gain (loss) | .13 | 2.49 | (.48) | .27 | .18 | 1.88 |
| Total from investment operations | .17 | 2.53 | (.40) | .31 | .24 | 1.93 |
| Distributions from net investment income | (.01) | (.07) | (.01) | (.01) | (.02) | (.07) |
| Distributions from net realized gain | (.02) | – | (.01) | – | (.01) | (.01) |
| Total distributions | (.02)C | (.07) | (.02) | (.01) | (.03) | (.07)D |
| Redemption fees added to paid in capitalA | – | –E | –E | –E | –E | –E |
| Net asset value, end of period | $13.45 | $13.30 | $10.84 | $11.26 | $10.96 | $10.75 |
| Total ReturnF,G,H | 1.28% | 23.51% | (3.58)% | 2.85% | 2.21% | 21.91% |
| Ratios to Average Net AssetsI,J | ||||||
| Expenses before reductions | 1.55%K | 1.59% | 1.61% | 1.58% | 1.65% | 1.69% |
| Expenses net of fee waivers, if any | 1.55%K | 1.59% | 1.61% | 1.58% | 1.65% | 1.69% |
| Expenses net of all reductions | 1.54%K | 1.58% | 1.61% | 1.58% | 1.65% | 1.68% |
| Net investment income (loss) | .56%K | .31% | .71%B | .33% | .53% | .54% |
| Supplemental Data | ||||||
| Net assets, end of period (000 omitted) | $31,686 | $33,597 | $27,966 | $28,833 | $26,369 | $23,118 |
| Portfolio turnover rateL | 36%K | 22% | 29% | 26% | 27% | 32% |
A Calculated based on average shares outstanding during the period.
B Net Investment income per share reflects a large, non-recurring dividend which amounted to $.04 per share. Excluding this non-recurring dividend, the ratio of net investment income (loss) to average net assets would have been .34%.
C Total distributions of $.02 per share is comprised of distributions from net investment income of $.005 and distributions from net realized gain of $.015 per share.
D Total distributions of $.07 per share is comprised of distributions from net investment income of $.69 and distributions from net realized gain of $.005 per share.
E Amount represents less than $.005 per share.
F Total returns for periods of less than one year are not annualized.
G Total returns would have been lower if certain expenses had not been reduced during the applicable periods shown.
H Total returns do not include the effect of the sales charges.
I Fees and expenses of any underlying Fidelity Central Funds are not included in the Fund's expense ratio. The Fund indirectly bears its proportionate share of the expenses of any underlying Fidelity Central Funds.
J Expense ratios reflect operating expenses of the class. Expenses before reductions do not reflect amounts reimbursed by the investment adviser or reductions from brokerage service arrangements or reductions from other expense offset arrangements and do not represent the amount paid by the class during periods when reimbursements or reductions occur. Expenses net of fee waivers reflect expenses after reimbursement by the investment adviser but prior to reductions from brokerage service arrangements or other expense offset arrangements. Expenses net of all reductions represent the net expenses paid by the class.
K Annualized
L Amount does not include the portfolio activity of any underlying Fidelity Central Funds.
See accompanying notes which are an integral part of the financial statements.
Fidelity International Growth Fund Class C
| Six months ended (Unaudited) April 30, | Years endedOctober 31, | |||||
| 2018 | 2017 | 2016 | 2015 | 2014 | 2013 | |
| Selected Per–Share Data | ||||||
| Net asset value, beginning of period | $13.10 | $10.67 | $11.12 | $10.87 | $10.69 | $8.84 |
| Income from Investment Operations | ||||||
| Net investment income (loss)A | .01 | (.02) | .03B | (.02) | .01 | .01 |
| Net realized and unrealized gain (loss) | .13 | 2.47 | (.47) | .27 | .18 | 1.87 |
| Total from investment operations | .14 | 2.45 | (.44) | .25 | .19 | 1.88 |
| Distributions from net investment income | – | (.02) | – | – | – | (.02) |
| Distributions from net realized gain | – | – | (.01) | – | (.01) | (.01) |
| Total distributions | – | (.02) | (.01) | – | (.01) | (.03) |
| Redemption fees added to paid in capitalA | – | –C | –C | –C | –C | –C |
| Net asset value, end of period | $13.24 | $13.10 | $10.67 | $11.12 | $10.87 | $10.69 |
| Total ReturnD,E,F | 1.07% | 22.96% | (3.98)% | 2.30% | 1.77% | 21.29% |
| Ratios to Average Net AssetsG,H | ||||||
| Expenses before reductions | 2.01%I | 2.04% | 2.07% | 2.06% | 2.12% | 2.19% |
| Expenses net of fee waivers, if any | 2.00%I | 2.04% | 2.07% | 2.06% | 2.12% | 2.18% |
| Expenses net of all reductions | 2.00%I | 2.04% | 2.06% | 2.05% | 2.12% | 2.17% |
| Net investment income (loss) | .10%I | (.15)% | .26%B | (.15)% | .06% | .05% |
| Supplemental Data | ||||||
| Net assets, end of period (000 omitted) | $70,680 | $68,908 | $52,738 | $52,378 | $32,737 | $17,196 |
| Portfolio turnover rateJ | 36%I | 22% | 29% | 26% | 27% | 32% |
A Calculated based on average shares outstanding during the period.
B Net Investment income per share reflects a large, non-recurring dividend which amounted to $.04 per share. Excluding this non-recurring dividend, the ratio of net investment income (loss) to average net assets would have been (.12) %.
C Amount represents less than $.005 per share.
D Total returns for periods of less than one year are not annualized.
E Total returns would have been lower if certain expenses had not been reduced during the applicable periods shown.
F Total returns do not include the effect of the contingent deferred sales charge.
G Fees and expenses of any underlying Fidelity Central Funds are not included in the Fund's expense ratio. The Fund indirectly bears its proportionate share of the expenses of any underlying Fidelity Central Funds.
H Expense ratios reflect operating expenses of the class. Expenses before reductions do not reflect amounts reimbursed by the investment adviser or reductions from brokerage service arrangements or reductions from other expense offset arrangements and do not represent the amount paid by the class during periods when reimbursements or reductions occur. Expenses net of fee waivers reflect expenses after reimbursement by the investment adviser but prior to reductions from brokerage service arrangements or other expense offset arrangements. Expenses net of all reductions represent the net expenses paid by the class.
I Annualized
J Amount does not include the portfolio activity of any underlying Fidelity Central Funds.
See accompanying notes which are an integral part of the financial statements.
Fidelity International Growth Fund
| Six months ended (Unaudited) April 30, | Years endedOctober 31, | |||||
| 2018 | 2017 | 2016 | 2015 | 2014 | 2013 | |
| Selected Per–Share Data | ||||||
| Net asset value, beginning of period | $13.45 | $10.97 | $11.38 | $11.10 | $10.84 | $8.95 |
| Income from Investment Operations | ||||||
| Net investment income (loss)A | .08 | .10 | .15B | .11 | .13 | .11 |
| Net realized and unrealized gain (loss) | .13 | 2.51 | (.47) | .26 | .19 | 1.88 |
| Total from investment operations | .21 | 2.61 | (.32) | .37 | .32 | 1.99 |
| Distributions from net investment income | (.08) | (.13) | (.08) | (.09) | (.05) | (.10) |
| Distributions from net realized gain | (.02) | – | (.01) | – | (.01) | (.01) |
| Total distributions | (.09)C | (.13) | (.09) | (.09) | (.06) | (.10)D |
| Redemption fees added to paid in capitalA | – | –E | –E | –E | –E | –E |
| Net asset value, end of period | $13.57 | $13.45 | $10.97 | $11.38 | $11.10 | $10.84 |
| Total ReturnF,G | 1.60% | 24.14% | (2.87)% | 3.36% | 2.96% | 22.48% |
| Ratios to Average Net AssetsH,I | ||||||
| Expenses before reductions | .99%J | 1.03% | .99% | .97% | 1.04% | 1.13% |
| Expenses net of fee waivers, if any | .98%J | 1.03% | .99% | .97% | 1.04% | 1.13% |
| Expenses net of all reductions | .98%J | 1.03% | .98% | .96% | 1.04% | 1.11% |
| Net investment income (loss) | 1.12%J | .87% | 1.34%B | .94% | 1.14% | 1.11% |
| Supplemental Data | ||||||
| Net assets, end of period (000 omitted) | $930,529 | $961,775 | $1,038,771 | $938,348 | $635,607 | $430,914 |
| Portfolio turnover rateK | 36%J | 22% | 29% | 26% | 27% | 32% |
A Calculated based on average shares outstanding during the period.
B Net Investment income per share reflects a large, non-recurring dividend which amounted to $.04 per share. Excluding this non-recurring dividend, the ratio of net investment income (loss) to average net assets would have been .96%.
C Total distributions of $.09 per share is comprised of distributions from net investment income of $.079 and distributions from net realized gain of $.015 per share.
D Total distributions of $.10 per share is comprised of distributions from net investment income of $.097 and distributions from net realized gain of $.005 per share.
E Amount represents less than $.005 per share.
F Total returns for periods of less than one year are not annualized.
G Total returns would have been lower if certain expenses had not been reduced during the applicable periods shown.
H Fees and expenses of any underlying Fidelity Central Funds are not included in the Fund's expense ratio. The Fund indirectly bears its proportionate share of the expenses of any underlying Fidelity Central Funds.
I Expense ratios reflect operating expenses of the class. Expenses before reductions do not reflect amounts reimbursed by the investment adviser or reductions from brokerage service arrangements or reductions from other expense offset arrangements and do not represent the amount paid by the class during periods when reimbursements or reductions occur. Expenses net of fee waivers reflect expenses after reimbursement by the investment adviser but prior to reductions from brokerage service arrangements or other expense offset arrangements. Expenses net of all reductions represent the net expenses paid by the class.
J Annualized
K Amount does not include the portfolio activity of any underlying Fidelity Central Funds.
See accompanying notes which are an integral part of the financial statements.
Fidelity International Growth Fund Class I
| Six months ended (Unaudited) April 30, | Years endedOctober 31, | |||||
| 2018 | 2017 | 2016 | 2015 | 2014 | 2013 | |
| Selected Per–Share Data | ||||||
| Net asset value, beginning of period | $13.43 | $10.95 | $11.36 | $11.08 | $10.84 | $8.94 |
| Income from Investment Operations | ||||||
| Net investment income (loss)A | .08 | .11 | .15B | .11 | .13 | .11 |
| Net realized and unrealized gain (loss) | .13 | 2.51 | (.47) | .27 | .18 | 1.90 |
| Total from investment operations | .21 | 2.62 | (.32) | .38 | .31 | 2.01 |
| Distributions from net investment income | (.09) | (.14) | (.08) | (.10) | (.06) | (.10) |
| Distributions from net realized gain | (.02) | – | (.01) | – | (.01) | (.01) |
| Total distributions | (.10)C | (.14) | (.09) | (.10) | (.07) | (.11) |
| Redemption fees added to paid in capitalA | – | –D | –D | –D | –D | –D |
| Net asset value, end of period | $13.54 | $13.43 | $10.95 | $11.36 | $11.08 | $10.84 |
| Total ReturnE,F | 1.60% | 24.23% | (2.87)% | 3.41% | 2.84% | 22.66% |
| Ratios to Average Net AssetsG,H | ||||||
| Expenses before reductions | .96%I | .98% | .98% | .98% | 1.04% | 1.11% |
| Expenses net of fee waivers, if any | .95%I | .98% | .98% | .98% | 1.04% | 1.11% |
| Expenses net of all reductions | .95%I | .97% | .98% | .97% | 1.04% | 1.09% |
| Net investment income (loss) | 1.15%I | .92% | 1.34%B | .94% | 1.14% | 1.13% |
| Supplemental Data | ||||||
| Net assets, end of period (000 omitted) | $824,017 | $728,227 | $359,676 | $267,745 | $121,554 | $38,771 |
| Portfolio turnover rateJ | 36%I | 22% | 29% | 26% | 27% | 32% |
A Calculated based on average shares outstanding during the period.
B Net Investment income per share reflects a large, non-recurring dividend which amounted to $.04 per share. Excluding this non-recurring dividend, the ratio of net investment income (loss) to average net assets would have been .97%.
C Total distributions of $0.10 per share is comprised of distributions from net investment income of $.089 and distributions from net realized gain of $.015 per share.
D Amount represents less than $.005 per share.
E Total returns for periods of less than one year are not annualized.
F Total returns would have been lower if certain expenses had not been reduced during the applicable periods shown.
G Fees and expenses of any underlying Fidelity Central Funds are not included in the Fund's expense ratio. The Fund indirectly bears its proportionate share of the expenses of any underlying Fidelity Central Funds.
H Expense ratios reflect operating expenses of the class. Expenses before reductions do not reflect amounts reimbursed by the investment adviser or reductions from brokerage service arrangements or reductions from other expense offset arrangements and do not represent the amount paid by the class during periods when reimbursements or reductions occur. Expenses net of fee waivers reflect expenses after reimbursement by the investment adviser but prior to reductions from brokerage service arrangements or other expense offset arrangements. Expenses net of all reductions represent the net expenses paid by the class.
I Annualized
J Amount does not include the portfolio activity of any underlying Fidelity Central Funds.
See accompanying notes which are an integral part of the financial statements.
Fidelity International Growth Fund Class Z
| Six months ended (Unaudited) April 30, | Years endedOctober 31, | |||||
| 2018 | 2017 | 2016 | 2015 | 2014 | 2013 A | |
| Selected Per–Share Data | ||||||
| Net asset value, beginning of period | $13.45 | $10.97 | $11.38 | $11.10 | $10.84 | $10.26 |
| Income from Investment Operations | ||||||
| Net investment income (loss)B | .09 | .13 | .16C | .12 | .14 | .02 |
| Net realized and unrealized gain (loss) | .14 | 2.50 | (.47) | .27 | .19 | .56 |
| Total from investment operations | .23 | 2.63 | (.31) | .39 | .33 | .58 |
| Distributions from net investment income | (.10) | (.15) | (.09) | (.11) | (.06) | – |
| Distributions from net realized gain | (.02) | – | (.01) | – | (.01) | – |
| Total distributions | (.12) | (.15) | (.10) | (.11) | (.07) | – |
| Redemption fees added to paid in capitalB | – | –D | –D | –D | –D | –D |
| Net asset value, end of period | $13.56 | $13.45 | $10.97 | $11.38 | $11.10 | $10.84 |
| Total ReturnE,F | 1.71% | 24.33% | (2.73)% | 3.52% | 3.07% | 5.65% |
| Ratios to Average Net AssetsG,H | ||||||
| Expenses before reductions | .82%I | .84% | .85% | .84% | .88% | .94%I |
| Expenses net of fee waivers, if any | .82%I | .84% | .85% | .84% | .88% | .94%I |
| Expenses net of all reductions | .81%I | .84% | .84% | .83% | .88% | .93%I |
| Net investment income (loss) | 1.29%I | 1.05% | 1.48%C | 1.07% | 1.30% | .65%I |
| Supplemental Data | ||||||
| Net assets, end of period (000 omitted) | $416,254 | $373,878 | $16,977 | $897 | $104 | $106 |
| Portfolio turnover rateJ | 36%I | 22% | 29% | 26% | 27% | 32% |
A For the period August 13, 2013 (commencement of sale of shares) to October 31, 2013.
B Calculated based on average shares outstanding during the period.
C Net Investment income per share reflects a large, non-recurring dividend which amounted to $.04 per share. Excluding this non-recurring dividend, the ratio of net investment income (loss) to average net assets would have been 1.10%.
D Amount represents less than $.005 per share.
E Total returns for periods of less than one year are not annualized.
F Total returns would have been lower if certain expenses had not been reduced during the applicable periods shown.
G Fees and expenses of any underlying Fidelity Central Funds are not included in the Fund's expense ratio. The Fund indirectly bears its proportionate share of the expenses of any underlying Fidelity Central Funds.
H Expense ratios reflect operating expenses of the class. Expenses before reductions do not reflect amounts reimbursed by the investment adviser or reductions from brokerage service arrangements or reductions from other expense offset arrangements and do not represent the amount paid by the class during periods when reimbursements or reductions occur. Expense ratios before reductions for start-up periods may not be representative of longer-term operating periods. Expenses net of fee waivers reflect expenses after reimbursement by the investment adviser but prior to reductions from brokerage service arrangements or other expense offset arrangements. Expenses net of all reductions represent the net expenses paid by the class.
I Annualized
J Amount does not include the portfolio activity of any underlying Fidelity Central Funds.
See accompanying notes which are an integral part of the financial statements.
Notes to Financial Statements (Unaudited)
For the period ended April 30, 2018
1. Organization.
Fidelity International Growth Fund (the Fund) is a fund of Fidelity Investment Trust (the Trust) and is authorized to issue an unlimited number of shares. The Trust is registered under the Investment Company Act of 1940, as amended (the 1940 Act), as an open-end management investment company organized as a Massachusetts business trust. The Fund offers Class A, Class M, Class C, International Growth, Class I, and Class Z shares, each of which has equal rights as to assets and voting privileges. Each class has exclusive voting rights with respect to matters that affect that class.
2. Investments in Fidelity Central Funds.
The Fund invests in Fidelity Central Funds, which are open-end investment companies generally available only to other investment companies and accounts managed by the investment adviser and its affiliates. The Fund's Schedule of Investments lists each of the Fidelity Central Funds held as of period end, if any, as an investment of the Fund, but does not include the underlying holdings of each Fidelity Central Fund. As an Investing Fund, the Fund indirectly bears its proportionate share of the expenses of the underlying Fidelity Central Funds.
The Money Market Central Funds seek preservation of capital and current income and are managed by Fidelity Investments Money Management, Inc. (FIMM), an affiliate of the investment adviser. Annualized expenses of the Money Market Central Funds as of their most recent shareholder report date are less than .005%.
A complete unaudited list of holdings for each Fidelity Central Fund is available upon request or at the Securities and Exchange Commission (the SEC) website at www.sec.gov. In addition, the financial statements of the Fidelity Central Funds are available on the SEC website or upon request.
3. Significant Accounting Policies.
The Fund is an investment company and applies the accounting and reporting guidance of the Financial Accounting Standards Board (FASB) Accounting Standards Codification Topic 946 Financial Services – Investments Companies. The financial statements have been prepared in conformity with accounting principles generally accepted in the United States of America (GAAP), which require management to make certain estimates and assumptions at the date of the financial statements. Actual results could differ from those estimates. Subsequent events, if any, through the date that the financial statements were issued have been evaluated in the preparation of the financial statements. The following summarizes the significant accounting policies of the Fund:
Investment Valuation. Investments are valued as of 4:00 p.m. Eastern time on the last calendar day of the period. The Board of Trustees (the Board) has delegated the day to day responsibility for the valuation of the Fund's investments to the Fair Value Committee (the Committee) established by the Fund's investment adviser. In accordance with valuation policies and procedures approved by the Board, the Fund attempts to obtain prices from one or more third party pricing vendors or brokers to value its investments. When current market prices, quotations or currency exchange rates are not readily available or reliable, investments will be fair valued in good faith by the Committee, in accordance with procedures adopted by the Board. Factors used in determining fair value vary by investment type and may include market or investment specific events. The frequency with which these procedures are used cannot be predicted and they may be utilized to a significant extent. The Committee oversees the Fund's valuation policies and procedures and reports to the Board on the Committee's activities and fair value determinations. The Board monitors the appropriateness of the procedures used in valuing the Fund's investments and ratifies the fair value determinations of the Committee.
The Fund categorizes the inputs to valuation techniques used to value its investments into a disclosure hierarchy consisting of three levels as shown below:
- Level 1 – quoted prices in active markets for identical investments
- Level 2 – other significant observable inputs (including quoted prices for similar investments, interest rates, prepayment speeds, etc.)
- Level 3 – unobservable inputs (including the Fund's own assumptions based on the best information available)
Valuation techniques used to value the Fund's investments by major category are as follows:
Equity securities, including restricted securities, for which market quotations are readily available, are valued at the last reported sale price or official closing price as reported by a third party pricing vendor on the primary market or exchange on which they are traded and are categorized as Level 1 in the hierarchy. In the event there were no sales during the day or closing prices are not available, securities are valued at the last quoted bid price or may be valued using the last available price and are generally categorized as Level 2 in the hierarchy. For foreign equity securities, when market or security specific events arise, comparisons to the valuation of American Depositary Receipts (ADRs), futures contracts, Exchange-Traded Funds (ETFs) and certain indexes as well as quoted prices for similar securities may be used and would be categorized as Level 2 in the hierarchy. Utilizing these techniques may result in transfers between Level 1 and Level 2. For equity securities, including restricted securities, where observable inputs are limited, assumptions about market activity and risk are used and these securities may be categorized as Level 3 in the hierarchy.
Investments in open-end mutual funds, including the Fidelity Central Funds, are valued at their closing net asset value (NAV) each business day and are categorized as Level 1 in the hierarchy.
Changes in valuation techniques may result in transfers in or out of an assigned level within the disclosure hierarchy. The aggregate value of investments by input level as of April 30, 2018, including information on transfers between Levels 1 and 2 is included at the end of the Fund's Schedule of Investments.
Foreign Currency. The Fund may use foreign currency contracts to facilitate transactions in foreign-denominated securities. Gains and losses from these transactions may arise from changes in the value of the foreign currency or if the counterparties do not perform under the contracts' terms.
Foreign-denominated assets, including investment securities, and liabilities are translated into U.S. dollars at the exchange rates at period end. Purchases and sales of investment securities, income and dividends received and expenses denominated in foreign currencies are translated into U.S. dollars at the exchange rate in effect on the transaction date.
The effects of exchange rate fluctuations on investments are included with the net realized and unrealized gain (loss) on investment securities. Other foreign currency transactions resulting in realized and unrealized gain (loss) are disclosed separately.
Investment Transactions and Income. For financial reporting purposes, the Fund's investment holdings and NAV include trades executed through the end of the last business day of the period. The NAV per share for processing shareholder transactions is calculated as of the close of business of the New York Stock Exchange (NYSE), normally 4:00 p.m. Eastern time and includes trades executed through the end of the prior business day. Gains and losses on securities sold are determined on the basis of identified cost and includes proceeds received from litigation. Dividend income is recorded on the ex-dividend date, except for certain dividends from foreign securities where the ex-dividend date may have passed, which are recorded as soon as the Fund is informed of the ex-dividend date. Non-cash dividends included in dividend income, if any, are recorded at the fair market value of the securities received. Income and capital gain distributions from Fidelity Central Funds, if any, are recorded on the ex-dividend date. Certain distributions received by the Fund represent a return of capital or capital gain. The Fund determines the components of these distributions subsequent to the ex-dividend date, based upon receipt of tax filings or other correspondence relating to the underlying investment. These distributions are recorded as a reduction of cost of investments and/or as a realized gain. Investment income is recorded net of foreign taxes withheld where recovery of such taxes is uncertain.
Class Allocations and Expenses. Investment income, realized and unrealized capital gains and losses, common expenses of the Fund, and certain fund-level expense reductions, if any, are allocated daily on a pro-rata basis to each class based on the relative net assets of each class to the total net assets of the Fund. Each class differs with respect to transfer agent and distribution and service plan fees incurred. Certain expense reductions may also differ by class. For the reporting period, the allocated portion of income and expenses to each class as a percent of its average net assets may vary due to the timing of recording these transactions in relation to fluctuating net assets of the classes. Expenses directly attributable to a fund are charged to that fund. Expenses attributable to more than one fund are allocated among the respective funds on the basis of relative net assets or other appropriate methods. Expense estimates are accrued in the period to which they relate and adjustments are made when actual amounts are known.
Income Tax Information and Distributions to Shareholders. Each year, the Fund intends to qualify as a regulated investment company under Subchapter M of the Internal Revenue Code, including distributing substantially all of its taxable income and realized gains. As a result, no provision for U.S. Federal income taxes is required. The Fund files a U.S. federal tax return, in addition to state and local tax returns as required. The Fund's federal income tax returns are subject to examination by the Internal Revenue Service (IRS) for a period of three fiscal years after they are filed. State and local tax returns may be subject to examination for an additional fiscal year depending on the jurisdiction. Foreign taxes are provided for based on the Fund's understanding of the tax rules and rates that exist in the foreign markets in which it invests. The Fund is subject to a tax imposed on capital gains by certain countries in which it invests. An estimated deferred tax liability for net unrealized appreciation on the applicable securities is included in Other payables and accrued expenses on the Statement of Assets & Liabilities.
Distributions are declared and recorded on the ex-dividend date. Income and capital gain distributions are declared separately for each class. Income and capital gain distributions are determined in accordance with income tax regulations, which may differ from GAAP.
Capital accounts within the financial statements are adjusted for permanent book-tax differences. These adjustments have no impact on net assets or the results of operations. Capital accounts are not adjusted for temporary book-tax differences which will reverse in a subsequent period.
Book-tax differences are primarily due to foreign currency transactions, certain foreign taxes, passive foreign investment companies (PFIC), capital loss carryforwards and losses deferred due to wash sales.
As of period end, the cost and unrealized appreciation (depreciation) in securities, and derivatives if applicable, for federal income tax purposes were as follows:
| Gross unrealized appreciation | $569,648,604 |
| Gross unrealized depreciation | (54,858,839) |
| Net unrealized appreciation (depreciation) | $514,789,765 |
| Tax cost | $2,021,996,633 |
Capital loss carryforwards are only available to offset future capital gains of the Fund to the extent provided by regulations and may be limited. Under the Regulated Investment Company Modernization Act of 2010 (the Act), the Fund is permitted to carry forward capital losses incurred in taxable years beginning after December 22, 2010 for an unlimited period and such capital losses are required to be used prior to any losses that expire. The capital loss carryforward information presented below, including any applicable limitation, is estimated as of prior fiscal period end and is subject to adjustment.
| No expiration | |
| Short-term | $(60,492,711) |
| Long-term | (26,057,719) |
| Total no expiration | $(86,550,430) |
4. Purchases and Sales of Investments.
Purchases and sales of securities, other than short-term securities, aggregated $470,825,477 and $428,760,667, respectively.
5. Fees and Other Transactions with Affiliates.
Management Fee. Fidelity Management & Research Company (the investment adviser) and its affiliates provide the Fund with investment management related services for which the Fund pays a monthly management fee. The management fee is the sum of an individual fund fee rate that is based on an annual rate of .45% of the Fund's average net assets and an annualized group fee rate that averaged .24% during the period. The group fee rate is based upon the average net assets of all the mutual funds advised by the investment adviser, including any mutual funds previously advised by the investment adviser that are currently advised by Fidelity SelectCo, LLC, an affiliate of the investment adviser. The group fee rate decreases as assets under management increase and increases as assets under management decrease. In addition, the management fee is subject to a performance adjustment (up to a maximum of +/- .20% of the Fund's average net assets over a 36 month performance period). The upward or downward adjustment to the management fee is based on the relative investment performance of International Growth as compared to its benchmark index, the MSCI EAFE Growth Index, over the same 36 month performance period. For the reporting period, the total annualized management fee rate, including the performance adjustment, was .71% of the Fund's average net assets. The performance adjustment included in the management fee rate may be higher or lower than the maximum performance adjustment rate due to the difference between the average net assets for the reporting and performance periods.
Distribution and Service Plan Fees. In accordance with Rule 12b-1 of the 1940 Act, the Fund has adopted separate Distribution and Service Plans for each class of shares. Certain classes pay Fidelity Distributors Corporation (FDC), an affiliate of the investment adviser, separate Distribution and Service Fees, each of which is based on an annual percentage of each class' average net assets. In addition, FDC may pay financial intermediaries for selling shares of the Fund and providing shareholder support services. For the period, the Distribution and Service Fee rates, total fees and amounts retained by FDC were as follows:
| Distribution Fee | Service Fee | Total Fees | Retained by FDC | |
| Class A | -% | .25% | $202,773 | $8,028 |
| Class M | .25% | .25% | 83,158 | 1,001 |
| Class C | .75% | .25% | 361,540 | 78,914 |
| $647,471 | $87,943 |
Sales Load. FDC may receive a front-end sales charge of up to 5.75% for selling Class A shares and 3.50% for selling Class M shares, some of which is paid to financial intermediaries for selling shares of the Fund. Depending on the holding period, FDC may receive contingent deferred sales charges levied on Class A, Class M and Class C redemptions. The deferred sales charges are 1.00% for Class C shares, 1.00% for certain purchases of Class A shares and .25% for certain purchases of Class M shares.
For the period, sales charge amounts retained by FDC were as follows:
| Retained by FDC | |
| Class A | $59,276 |
| Class M | 6,706 |
| Class C(a) | 7,870 |
| $73,852 |
(a) When Class C shares are initially sold, FDC pays commissions from its own resources to financial intermediaries through which the sales are made.
Transfer Agent Fees. Fidelity Investments Institutional Operations Company, Inc., (FIIOC), an affiliate of the investment adviser, is the transfer, dividend disbursing and shareholder servicing agent for each class of the Fund. FIIOC receives account fees and asset-based fees that vary according to the account size and type of account of the shareholders of the respective classes of the Fund, except for Class Z. FIIOC receives an asset-based fee of Class Z's average net assets. FIIOC pays for typesetting, printing and mailing of shareholder reports, except proxy statements.
For the period, transfer agent fees for each class were as follows:
| Amount | % of Class-Level Average Net Assets(a) | |
| Class A | $183,279 | .23 |
| Class M | 45,313 | .27 |
| Class C | 82,454 | .23 |
| International Growth | 1,040,139 | .21 |
| Class I | 708,469 | .18 |
| Class Z | 91,343 | .05 |
| $2,150,997 |
(a) Annualized
Accounting and Security Lending Fees. Fidelity Service Company, Inc. (FSC), an affiliate of the investment adviser, maintains the Fund's accounting records. The accounting fee is based on the level of average net assets for each month. Under a separate contract, FSC administers the security lending program. The security lending fee is based on the number and duration of lending transactions. For the period, the fees were equivalent to an annualized rate of .04%.
Brokerage Commissions. The Fund placed a portion of its portfolio transactions with brokerage firms which are affiliates of the investment adviser. Brokerage commissions are included in net realized gain (loss) and change in net unrealized appreciation (depreciation) in the Statement of Operations. The commissions paid to these affiliated firms were $995 for the period.
Interfund Lending Program. Pursuant to an Exemptive Order issued by the SEC, the Fund, along with other registered investment companies having management contracts with Fidelity Management & Research Company (FMR) or other affiliated entities of FMR, may participate in an interfund lending program. This program provides an alternative credit facility allowing the funds to borrow from, or lend money to, other participating affiliated funds. At period end, there were no interfund loans outstanding. The Fund's activity in this program during the period for which loans were outstanding was as follows:
| Borrower or Lender | Average Loan Balance | Weighted Average Interest Rate | Interest Expense |
| Borrower | $40,450,167 | 1.90% | $12,804 |
Interfund Trades. The Fund may purchase from or sell securities to other Fidelity Funds under procedures adopted by the Board. The procedures have been designed to ensure these interfund trades are executed in accordance with Rule 17a-7 of the 1940 Act. Interfund trades are included within the respective purchases and sales amounts shown in the Purchases and Sales of Investments note.
6. Committed Line of Credit.
The Fund participates with other funds managed by the investment adviser or an affiliate in a $4.25 billion credit facility (the "line of credit") to be utilized for temporary or emergency purposes to fund shareholder redemptions or for other short-term liquidity purposes. The Fund has agreed to pay commitment fees on its pro-rata portion of the line of credit, which amounted to $3,465 and is reflected in Miscellaneous expenses on the Statement of Operations. During the period, the Fund did not borrow on this line of credit.
7. Security Lending.
The Fund lends portfolio securities through a lending agent from time to time in order to earn additional income. For equity securities, a lending agent is used and may loan securities to certain qualified borrowers, including Fidelity Capital Markets (FCM), a broker-dealer affiliated with the Fund. On the settlement date of the loan, the Fund receives collateral (in the form of U.S. Treasury obligations, letters of credit and/or cash) against the loaned securities and maintains collateral in an amount not less than 100% of the market value of the loaned securities during the period of the loan. The market value of the loaned securities is determined at the close of business of the Fund and any additional required collateral is delivered to the Fund on the next business day. The Fund or borrower may terminate the loan at any time, and if the borrower defaults on its obligation to return the securities loaned because of insolvency or other reasons, the Fund may apply collateral received from the borrower against the obligation. The Fund may experience delays and costs in recovering the securities loaned. Any cash collateral received is invested in the Fidelity Securities Lending Cash Central Fund. The value of loaned securities and cash collateral at period end are disclosed on the Fund's Statement of Assets and Liabilities. At period end, there were no security loans outstanding with FCM. Security lending income represents the income earned on investing cash collateral, less rebates paid to borrowers and any lending agent fees associated with the loan, plus any premium payments received for lending certain types of securities. Security lending income is presented in the Statement of Operations as a component of income from Fidelity Central Funds. Total security lending income during the period amounted to $207,438, including $106 from securities loaned to FCM.
8. Expense Reductions.
Commissions paid to certain brokers with whom the investment adviser, or its affiliates, places trades on behalf of the Fund include an amount in addition to trade execution, which may be rebated back to the Fund to offset certain expenses. This amount totaled $105,299 for the period. Through arrangements with the Fund's custodian credits realized as a result of certain uninvested cash balances were used to reduce the Fund's expenses. During the period, these credits reduced the Fund's custody expenses by $335.
In addition, during the period the investment adviser reimbursed and/or waived a portion of fund-level operating expenses in the amount of $11,924.
9. Distributions to Shareholders.
Distributions to shareholders of each class were as follows:
| Six months ended April 30, 2018 | Year ended October 31, 2017 | |
| From net investment income | ||
| Class A | $491,758 | $1,997,030 |
| Class M | 12,154 | 186,824 |
| Class C | – | 77,926 |
| International Growth | 5,670,567 | 11,653,320 |
| Class I | 4,983,374 | 4,492,180 |
| Class Z | 2,928,337 | 221,901 |
| Total | $14,086,190 | $18,629,181 |
| From net realized gain | ||
| Class A | $175,523 | $– |
| Class M | 36,436 | – |
| International Growth | 1,076,314 | – |
| Class I | 839,568 | – |
| Class Z | 422,189 | – |
| Total | $2,550,030 | $– |
10. Share Transactions.
Share transactions for each class were as follows and may contain automatic conversions between classes or exchanges between affiliated funds:
| Shares | Shares | Dollars | Dollars | |
| Six months ended April 30, 2018 | Year ended October 31, 2017 | Six months ended April 30, 2018 | Year ended October 31, 2017 | |
| Class A | ||||
| Shares sold | 1,572,515 | 4,137,031 | $21,580,659 | $48,223,768 |
| Reinvestment of distributions | 49,581 | 187,295 | 663,775 | 1,972,221 |
| Shares redeemed | (1,423,213) | (12,953,360) | (19,459,107) | (147,524,032) |
| Net increase (decrease) | 198,883 | (8,629,034) | $2,785,327 | $(97,328,043) |
| Class M | ||||
| Shares sold | 218,936 | 634,763 | $3,003,474 | $7,389,758 |
| Reinvestment of distributions | 3,624 | 17,518 | 48,527 | 184,470 |
| Shares redeemed | (393,405) | (705,137) | (5,352,323) | (8,346,528) |
| Net increase (decrease) | (170,845) | (52,856) | $(2,300,322) | $(772,300) |
| Class C | ||||
| Shares sold | 751,386 | 1,572,029 | $10,186,038 | $18,704,209 |
| Reinvestment of distributions | – | 7,327 | – | 76,279 |
| Shares redeemed | (673,468) | (1,259,133) | (9,055,177) | (14,766,822) |
| Net increase (decrease) | 77,918 | 320,223 | $1,130,861 | $4,013,666 |
| International Growth | ||||
| Shares sold | 12,132,112 | 28,743,527 | $168,190,900 | $341,195,764 |
| Reinvestment of distributions | 469,327 | 929,056 | 6,314,733 | 9,838,706 |
| Shares redeemed | (15,533,206) | (52,869,764) | (215,100,341) | (601,819,958) |
| Net increase (decrease) | (2,931,767) | (23,197,181) | $(40,594,708) | $(250,785,488) |
| Class I | ||||
| Shares sold | 13,570,374 | 38,959,806 | $186,925,933 | $465,525,076 |
| Reinvestment of distributions | 352,720 | 415,087 | 4,735,066 | 4,387,467 |
| Shares redeemed | (7,294,020) | (17,997,694) | (100,623,165) | (214,014,368) |
| Net increase (decrease) | 6,629,074 | 21,377,199 | $91,037,834 | $255,898,175 |
| Class Z | ||||
| Shares sold | 4,797,477 | 35,134,319 | $66,427,683 | $405,268,628 |
| Reinvestment of distributions | 140,992 | 20,974 | 1,894,059 | 221,901 |
| Shares redeemed | (2,028,589) | (8,913,102) | (27,954,685) | (105,624,601) |
| Net increase (decrease) | 2,909,880 | 26,242,191 | $40,367,057 | $299,865,928 |
11. Other.
The Fund's organizational documents provide former and current trustees and officers with a limited indemnification against liabilities arising in connection with the performance of their duties to the Fund. In the normal course of business, the Fund may also enter into contracts that provide general indemnifications. The Fund's maximum exposure under these arrangements is unknown as this would be dependent on future claims that may be made against the Fund. The risk of material loss from such claims is considered remote.
Shareholder Expense Example
As a shareholder of the Fund, you incur two types of costs: (1) transaction costs, including sales charges (loads) on purchase payments or redemption proceeds, and (2) ongoing costs, including management fees, distribution and/or service (12b-1) fees and other Fund expenses. This Example is intended to help you understand your ongoing costs (in dollars) of investing in the Fund and to compare these costs with the ongoing costs of investing in other mutual funds.
The Example is based on an investment of $1,000 invested at the beginning of the period and held for the entire period (November 1, 2017 to April 30, 2018).
Actual Expenses
The first line of the accompanying table for each class of the Fund provides information about actual account values and actual expenses. You may use the information in this line, together with the amount you invested, to estimate the expenses that you paid over the period. Simply divide your account value by $1,000.00 (for example, an $8,600 account value divided by $1,000.00 = 8.6), then multiply the result by the number in the first line for a class of the Fund under the heading entitled "Expenses Paid During Period" to estimate the expenses you paid on your account during this period. A small balance maintenance fee of $12.00 that is charged once a year may apply for certain accounts with a value of less than $2,000. This fee is not included in the table below. If it was, the estimate of expenses you paid during the period would be higher, and your ending account value lower, by this amount. In addition, the Fund, as a shareholder in the underlying Fidelity Central Funds, will indirectly bear its pro-rata share of the fees and expenses incurred by the underlying Fidelity Central Funds. These fees and expenses are not included in the Fund's annualized expense ratio used to calculate the expense estimate in the table below.
Hypothetical Example for Comparison Purposes
The second line of the accompanying table for each class of the Fund provides information about hypothetical account values and hypothetical expenses based on a Class' actual expense ratio and an assumed rate of return of 5% per year before expenses, which is not the Class' actual return. The hypothetical account values and expenses may not be used to estimate the actual ending account balance or expenses you paid for the period. You may use this information to compare the ongoing costs of investing in the Fund and other funds. To do so, compare this 5% hypothetical example with the 5% hypothetical examples that appear in the shareholder reports of the other funds. A small balance maintenance fee of $12.00 that is charged once a year may apply for certain accounts with a value of less than $2,000. This fee is not included in the table below. If it was, the estimate of expenses you paid during the period would be higher, and your ending account value lower, by this amount. In addition, the Fund, as a shareholder in the underlying Fidelity Central Funds, will indirectly bear its pro-rata share of the fees and expenses incurred by the underlying Fidelity Central Funds. These fees and expenses are not included in the Fund's annualized expense ratio used to calculate the expense estimate in the table below.
Please note that the expenses shown in the table are meant to highlight your ongoing costs only and do not reflect any transaction costs. Therefore, the second line of the table is useful in comparing ongoing costs only, and will not help you determine the relative total costs of owning different funds. In addition, if these transactional costs were included, your costs would have been higher.
| Annualized Expense Ratio-A | Beginning Account Value November 1, 2017 | Ending Account Value April 30, 2018 | Expenses Paid During Period-B November 1, 2017 to April 30, 2018 | |
| Class A | 1.25% | |||
| Actual | $1,000.00 | $1,014.80 | $6.24 | |
| Hypothetical-C | $1,000.00 | $1,018.60 | $6.26 | |
| Class M | 1.55% | |||
| Actual | $1,000.00 | $1,012.80 | $7.74 | |
| Hypothetical-C | $1,000.00 | $1,017.11 | $7.75 | |
| Class C | 2.00% | |||
| Actual | $1,000.00 | $1,010.70 | $9.97 | |
| Hypothetical-C | $1,000.00 | $1,014.88 | $9.99 | |
| International Growth | .98% | |||
| Actual | $1,000.00 | $1,016.00 | $4.90 | |
| Hypothetical-C | $1,000.00 | $1,019.93 | $4.91 | |
| Class I | .95% | |||
| Actual | $1,000.00 | $1,016.00 | $4.75 | |
| Hypothetical-C | $1,000.00 | $1,020.08 | $4.76 | |
| Class Z | .82% | |||
| Actual | $1,000.00 | $1,017.10 | $4.10 | |
| Hypothetical-C | $1,000.00 | $1,020.73 | $4.11 |
A Annualized expense ratio reflects expenses net of applicable fee waivers.
B Expenses are equal to each Class' annualized expense ratio, multiplied by the average account value over the period, multiplied by 181/365 (to reflect the one-half year period).
C 5% return per year before expenses
![]()
Corporate Headquarters
245 Summer St.
Boston, MA 02210
www.fidelity.com
IGF-SANN-0618
1.912353.108
Fidelity Advisor® Emerging Europe, Middle East, Africa (EMEA) Fund - Semi-Annual Report April 30, 2018 Class A, Class M, Class C and Class I are classes of Fidelity® Emerging Europe, Middle East, Africa (EMEA) Fund |
|
Contents
To view a fund's proxy voting guidelines and proxy voting record for the 12-month period ended June 30, visit http://www.fidelity.com/proxyvotingresults or visit the Securities and Exchange Commission's (SEC) web site at http://www.sec.gov.
You may also call 1-877-208-0098 to request a free copy of the proxy voting guidelines.
Standard & Poor's, S&P and S&P 500 are registered service marks of The McGraw-Hill Companies, Inc. and have been licensed for use by Fidelity Distributors Corporation.
Other third-party marks appearing herein are the property of their respective owners.
All other marks appearing herein are registered or unregistered trademarks or service marks of FMR LLC or an affiliated company. © 2018 FMR LLC. All rights reserved.
This report and the financial statements contained herein are submitted for the general information of the shareholders of the Fund. This report is not authorized for distribution to prospective investors in the Fund unless preceded or accompanied by an effective prospectus.
A fund files its complete schedule of portfolio holdings with the SEC for the first and third quarters of each fiscal year on Form N-Q. Forms N-Q are available on the SEC’s web site at http://www.sec.gov. A fund's Forms N-Q may be reviewed and copied at the SEC’s Public Reference Room in Washington, DC. Information regarding the operation of the SEC's Public Reference Room may be obtained by calling 1-800-SEC-0330.
For a complete list of a fund's portfolio holdings, view the most recent holdings listing, semiannual report, or annual report on Fidelity's web site at http://www.fidelity.com, http://www.institutional.fidelity.com, or http://www.401k.com, as applicable.
NOT FDIC INSURED •MAY LOSE VALUE •NO BANK GUARANTEE
Neither the Fund nor Fidelity Distributors Corporation is a bank.
Investment Summary (Unaudited)
Geographic Diversification (% of fund's net assets)
| As of April 30, 2018 | ||
| South Africa | 41.9% | |
| Russia | 24.8% | |
| United Arab Emirates | 5.7% | |
| United Kingdom | 5.2% | |
| Hungary | 2.7% | |
| Poland | 2.7% | |
| Romania | 2.6% | |
| United States of America | 2.5% | |
| Nigeria | 2.1% | |
| Other* | 9.8% | |
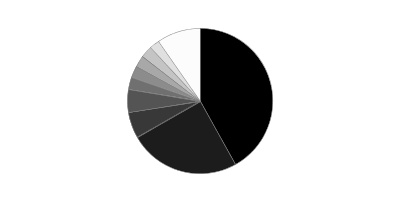
* Includes Short-Term investments and Net Other Assets (Liabilities).
Percentages are based on country or territory of incorporation and are adjusted for the effect of futures contracts, if applicable.
Asset Allocation as of April 30, 2018
| % of fund's net assets | |
| Stocks | 97.5 |
| Short-Term Investments and Net Other Assets (Liabilities) | 2.5 |
Top Ten Stocks as of April 30, 2018
| % of fund's net assets | |
| Naspers Ltd. Class N (South Africa, Media) | 7.7 |
| Sberbank of Russia (Russia, Banks) | 5.8 |
| Lukoil PJSC (Russia, Oil, Gas & Consumable Fuels) | 4.5 |
| Tatneft PAO (Russia, Oil, Gas & Consumable Fuels) | 4.2 |
| Gazprom OAO (Russia, Oil, Gas & Consumable Fuels) | 4.0 |
| Standard Bank Group Ltd. (South Africa, Banks) | 3.9 |
| FirstRand Ltd. (South Africa, Diversified Financial Services) | 3.4 |
| HSBC Bank PLC | 3.2 |
| MTN Group Ltd. (South Africa, Wireless Telecommunication Services) | 3.0 |
| PSG Group Ltd. (South Africa, Diversified Financial Services) | 2.2 |
| 41.9 |
Top Market Sectors as of April 30, 2018
| % of fund's net assets | |
| Financials | 33.1 |
| Energy | 18.4 |
| Consumer Discretionary | 17.2 |
| Materials | 10.6 |
| Consumer Staples | 8.0 |
| Industrials | 4.0 |
| Telecommunication Services | 3.7 |
| Real Estate | 1.6 |
| Health Care | 0.9 |
Market Sectors may include more than one industry category.
The Fund may invest up to 35% of its total assets in any industry that represents more than 20% of the emerging Europe, Middle East and Africa markets. As of April 30, 2018, the Fund did not have more than 25% of its total assets invested in any one industry.
Schedule of Investments April 30, 2018 (Unaudited)
Showing Percentage of Net Assets
| Common Stocks - 94.9% | |||
| Shares | Value | ||
| Austria - 0.5% | |||
| Erste Group Bank AG | 12,600 | $617,760 | |
| Bailiwick of Jersey - 0.5% | |||
| Glencore Xstrata PLC | 119,600 | 581,700 | |
| Bermuda - 0.9% | |||
| Central European Media Enterprises Ltd. Class A (a)(b) | 235,500 | 1,000,875 | |
| Botswana - 0.2% | |||
| First National Bank of Botswana Ltd. | 1,042,331 | 233,440 | |
| Canada - 0.8% | |||
| First Quantum Minerals Ltd. | 64,000 | 922,154 | |
| Cyprus - 0.6% | |||
| Globaltrans Investment PLC GDR (Reg. S) | 61,900 | 651,188 | |
| Greece - 2.1% | |||
| Fourlis Holdings SA | 91,700 | 653,348 | |
| Jumbo SA | 26,536 | 485,800 | |
| Mytilineos Holdings SA | 51,000 | 615,876 | |
| Sarantis SA | 37,800 | 650,474 | |
| TOTAL GREECE | 2,405,498 | ||
| Hungary - 2.7% | |||
| MOL Hungarian Oil and Gas PLC Series A (For. Reg.) | 86,600 | 1,000,713 | |
| OTP Bank PLC | 50,200 | 2,193,211 | |
| TOTAL HUNGARY | 3,193,924 | ||
| Kenya - 1.3% | |||
| KCB Group Ltd. | 1,388,600 | 692,223 | |
| Safaricom Ltd. | 2,814,544 | 792,730 | |
| TOTAL KENYA | 1,484,953 | ||
| Morocco - 0.5% | |||
| Attijariwafa Bank | 11,725 | 643,903 | |
| Netherlands - 0.6% | |||
| X5 Retail Group NV GDR (Reg. S) (a) | 24,200 | 689,700 | |
| Nigeria - 2.1% | |||
| Dangote Cement PLC | 1,107,463 | 756,766 | |
| Guaranty Trust Bank PLC | 4,263,598 | 532,950 | |
| Nigerian Breweries PLC | 1,630,122 | 588,202 | |
| Zenith Bank PLC | 6,951,272 | 530,034 | |
| TOTAL NIGERIA | 2,407,952 | ||
| Oman - 0.5% | |||
| BankMuscat SAOG (a) | 643,984 | 642,478 | |
| Pakistan - 0.5% | |||
| United Bank Ltd. | 344,400 | 599,280 | |
| Poland - 2.7% | |||
| AmRest Holdings NV (a) | 4,000 | 525,379 | |
| Globe Trade Centre SA | 333,900 | 879,974 | |
| Inter Cars SA | 7,700 | 526,518 | |
| LPP SA | 220 | 574,782 | |
| Orbis SA | 21,900 | 599,000 | |
| TOTAL POLAND | 3,105,653 | ||
| Romania - 2.6% | |||
| Banca Transilvania SA | 1,015,997 | 675,295 | |
| BRD-Groupe Societe Generale | 423,335 | 1,645,468 | |
| Fondul Propietatea SA GDR | 56,500 | 706,250 | |
| TOTAL ROMANIA | 3,027,013 | ||
| Russia - 22.2% | |||
| Alrosa Co. Ltd. | 928,200 | 1,320,831 | |
| Gazprom OAO | 2,023,613 | 4,689,441 | |
| Lukoil PJSC | 21,700 | 1,433,557 | |
| Lukoil PJSC sponsored ADR | 57,195 | 3,820,626 | |
| MMC Norilsk Nickel PJSC | 12,400 | 2,118,055 | |
| NOVATEK OAO | 206,800 | 2,528,659 | |
| Novolipetsk Steel OJSC GDR (Reg. S) | 50,400 | 1,292,760 | |
| Sberbank of Russia | 1,892,150 | 6,744,559 | |
| Tatneft PAO | 175,800 | 1,873,367 | |
| TOTAL RUSSIA | 25,821,855 | ||
| South Africa - 41.9% | |||
| African Rainbow Minerals Ltd. | 97,100 | 793,855 | |
| Anglo American Platinum Ltd. | 47,200 | 1,266,620 | |
| ArcelorMittal South Africa Ltd. (a) | 780,000 | 183,556 | |
| AVI Ltd. | 67,400 | 616,498 | |
| Barloworld Ltd. | 69,000 | 931,899 | |
| Cashbuild Ltd. | 31,400 | 1,092,099 | |
| City Lodge Hotels Ltd. | 62,000 | 810,895 | |
| Clicks Group Ltd. | 75,583 | 1,292,237 | |
| Dis-Chem Pharmacies Pty Ltd. (c) | 187,000 | 558,404 | |
| DRDGOLD Ltd. | 3,045,114 | 719,904 | |
| Exxaro Resources Ltd. | 99,600 | 883,449 | |
| FirstRand Ltd. | 730,500 | 3,912,212 | |
| Hulamin Ltd. | 1,096,900 | 455,162 | |
| Imperial Holdings Ltd. | 72,200 | 1,388,846 | |
| KAP Industrial Holdings Ltd. | 1,145,700 | 809,896 | |
| Mr Price Group Ltd. | 97,300 | 2,135,137 | |
| MTN Group Ltd. | 343,950 | 3,452,123 | |
| Murray & Roberts Holdings Ltd. | 399,000 | 493,904 | |
| Nampak Ltd. (a) | 1,025,600 | 1,141,197 | |
| Naspers Ltd. Class N | 37,000 | 9,013,929 | |
| Pioneer Foods Ltd. | 68,100 | 662,304 | |
| Pretoria Portland Cement Co. Ltd. (a) | 1,192,249 | 833,033 | |
| PSG Group Ltd. | 142,300 | 2,560,323 | |
| RMB Holdings Ltd. | 256,000 | 1,605,701 | |
| Sanlam Ltd. | 338,800 | 2,140,206 | |
| Shoprite Holdings Ltd. | 123,100 | 2,449,175 | |
| Spar Group Ltd. | 79,200 | 1,331,417 | |
| Spur Corp. Ltd. | 257,400 | 552,527 | |
| Standard Bank Group Ltd. | 262,686 | 4,505,223 | |
| Steinhoff Africa Retail Ltd. (a) | 140,000 | 217,608 | |
| TOTAL SOUTH AFRICA | 48,809,339 | ||
| Turkey - 0.8% | |||
| Tupras Turkiye Petrol Rafinerileri A/S | 36,000 | 917,260 | |
| United Arab Emirates - 5.7% | |||
| Abu Dhabi National Oil Co. for Distribution PJSC (a) | 937,731 | 625,469 | |
| Agthia Group PJSC | 344,787 | 413,014 | |
| Aldar Properties PJSC | 1,597,568 | 913,356 | |
| DP World Ltd. | 52,278 | 1,163,186 | |
| Dubai Financial Market PJSC | 2,741,002 | 731,302 | |
| Dubai Islamic Bank Pakistan Ltd. | 539,253 | 807,452 | |
| Dubai Parks and Resorts PJSC (a) | 4,523,254 | 475,335 | |
| National Bank of Abu Dhabi PJSC | 460,340 | 1,554,038 | |
| TOTAL UNITED ARAB EMIRATES | 6,683,152 | ||
| United Kingdom - 5.2% | |||
| Abdullah Al-Othaim Markets Co. ELS (HSBC Bank Warrant Program) warrants 7/20/20 (a)(c) | 29,800 | 643,558 | |
| Al Rajhi Banking & Investment Corp. ELS (HSBC Bank Warrant Program) warrants 1/19/21 (a)(c) | 29,800 | 667,555 | |
| ALDREES Petroleum and Transport Services Co. ELS (HSBC Warrant Program) warrants 1/30/20 (a)(c) | 96,625 | 733,528 | |
| BGEO Group PLC | 11,500 | 550,955 | |
| Georgia Healthcare Group PLC (a)(c) | 107,500 | 409,947 | |
| NMC Health PLC | 13,149 | 645,888 | |
| Saudi Co. For Hardware LLC ELS (HSBC Bank Warrant Program) warrants 5/21/18 (a)(c) | 17,800 | 621,819 | |
| Tullow Oil PLC (a) | 234,500 | 735,098 | |
| United International Transportation Co. ELS (HSBC Bank Warrant Program) warrants 7/8/20(a)(c) | 104,504 | 1,040,790 | |
| TOTAL UNITED KINGDOM | 6,049,138 | ||
| TOTAL COMMON STOCKS | |||
| (Cost $79,990,620) | 110,488,215 | ||
| Nonconvertible Preferred Stocks - 2.6% | |||
| Russia - 2.6% | |||
| Tatneft PAO | |||
| (Cost $1,316,366) | 404,100 | 3,051,325 | |
| Money Market Funds - 0.7% | |||
| Fidelity Securities Lending Cash Central Fund 1.74% (d)(e) | |||
| (Cost $794,808) | 794,724 | 794,803 | |
| TOTAL INVESTMENT IN SECURITIES - 98.2% | |||
| (Cost $82,101,794) | 114,334,343 | ||
| NET OTHER ASSETS (LIABILITIES) - 1.8% | 2,063,077 | ||
| NET ASSETS - 100% | $116,397,420 |
Security Type Abbreviations
ELS – Equity-Linked Security
Categorizations in the Schedule of Investments are based on country or territory of incorporation.
Legend
(a) Non-income producing
(b) Security or a portion of the security is on loan at period end.
(c) Security exempt from registration under Rule 144A of the Securities Act of 1933. These securities may be resold in transactions exempt from registration, normally to qualified institutional buyers. At the end of the period, the value of these securities amounted to $4,675,601 or 4.0% of net assets.
(d) Affiliated fund that is generally available only to investment companies and other accounts managed by Fidelity Investments. The rate quoted is the annualized seven-day yield of the fund at period end. A complete unaudited listing of the fund's holdings as of its most recent quarter end is available upon request. In addition, each Fidelity Central Fund's financial statements are available on the SEC's website or upon request.
(e) Investment made with cash collateral received from securities on loan.
Affiliated Central Funds
Information regarding fiscal year to date income earned by the Fund from investments in Fidelity Central Funds is as follows:
| Fund | Income earned |
| Fidelity Cash Central Fund | $9,651 |
| Fidelity Securities Lending Cash Central Fund | 1,901 |
| Total | $11,552 |
Amounts in the income column in the above table include any capital gain distributions from underlying funds, which are presented in the corresponding line-item in the Statement of Operations if applicable.
Investment Valuation
The following is a summary of the inputs used, as of April 30, 2018, involving the Fund's assets and liabilities carried at fair value. The inputs or methodology used for valuing securities may not be an indication of the risk associated with investing in those securities. For more information on valuation inputs, and their aggregation into the levels used below, please refer to the Investment Valuation section in the accompanying Notes to Financial Statements.
| Valuation Inputs at Reporting Date: | ||||
| Description | Total | Level 1 | Level 2 | Level 3 |
| Investments in Securities: | ||||
| Equities: | ||||
| Consumer Discretionary | $20,052,078 | $4,841,037 | $15,211,041 | $-- |
| Consumer Staples | 9,251,425 | 2,341,390 | 6,910,035 | -- |
| Energy | 21,558,964 | 19,241,958 | 2,317,006 | -- |
| Financials | 38,531,513 | 13,356,039 | 25,175,474 | -- |
| Health Care | 1,055,835 | 1,055,835 | -- | -- |
| Industrials | 4,665,949 | 2,430,250 | 2,235,699 | -- |
| Materials | 12,385,593 | 4,292,511 | 8,093,082 | -- |
| Real Estate | 1,793,330 | 1,793,330 | -- | -- |
| Telecommunication Services | 4,244,853 | 792,730 | 3,452,123 | -- |
| Money Market Funds | 794,803 | 794,803 | -- | -- |
| Total Investments in Securities: | $114,334,343 | $50,939,883 | $63,394,460 | $-- |
The following is a summary of transfers between Level 1 and Level 2 for the period ended April 30, 2018. Transfers are assumed to have occurred at the beginning of the period, and are primarily attributable to the valuation techniques used for foreign equity securities, as discussed in the accompanying Notes to Financial Statements:
| Transfers | Total |
| Level 1 to Level 2 | $39,397,547 |
| Level 2 to Level 1 | $0 |
See accompanying notes which are an integral part of the financial statements.
Financial Statements
Statement of Assets and Liabilities
| April 30, 2018 (Unaudited) | ||
| Assets | ||
| Investment in securities, at value (including securities loaned of $750,550) — See accompanying schedule: Unaffiliated issuers (cost $81,306,986) | $113,539,540 | |
| Fidelity Central Funds (cost $794,808) | 794,803 | |
| Total Investment in Securities (cost $82,101,794) | $114,334,343 | |
| Foreign currency held at value (cost $27,752) | 27,767 | |
| Receivable for investments sold | 2,374,418 | |
| Receivable for fund shares sold | 868,585 | |
| Dividends receivable | 182,004 | |
| Distributions receivable from Fidelity Central Funds | 3,296 | |
| Prepaid expenses | 52 | |
| Receivable from investment adviser for expense reductions | 1,052 | |
| Other receivables | 17,683 | |
| Total assets | 117,809,200 | |
| Liabilities | ||
| Payable to custodian bank | $200,277 | |
| Payable for fund shares redeemed | 234,097 | |
| Accrued management fee | 79,535 | |
| Distribution and service plan fees payable | 6,646 | |
| Other affiliated payables | 29,189 | |
| Other payables and accrued expenses | 67,336 | |
| Collateral on securities loaned | 794,700 | |
| Total liabilities | 1,411,780 | |
| Net Assets | $116,397,420 | |
| Net Assets consist of: | ||
| Paid in capital | $101,085,005 | |
| Undistributed net investment income | 801,566 | |
| Accumulated undistributed net realized gain (loss) on investments and foreign currency transactions | (17,713,084) | |
| Net unrealized appreciation (depreciation) on investments and assets and liabilities in foreign currencies | 32,223,933 | |
| Net Assets | $116,397,420 | |
| Calculation of Maximum Offering Price | ||
| Class A: | ||
| Net Asset Value and redemption price per share ($7,238,663 ÷ 705,674 shares) | $10.26 | |
| Maximum offering price per share (100/94.25 of $10.26) | $10.89 | |
| Class M: | ||
| Net Asset Value and redemption price per share ($2,890,958 ÷ 282,745 shares) | $10.22 | |
| Maximum offering price per share (100/96.50 of $10.22) | $10.59 | |
| Class C: | ||
| Net Asset Value and offering price per share ($4,636,361 ÷ 453,751 shares)(a) | $10.22 | |
| Emerging Europe, Middle East, Africa (EMEA): | ||
| Net Asset Value, offering price and redemption price per share ($94,070,229 ÷ 9,164,068 shares) | $10.27 | |
| Class I: | ||
| Net Asset Value, offering price and redemption price per share ($7,561,209 ÷ 737,512 shares) | $10.25 |
(a) Redemption price per share is equal to net asset value less any applicable contingent deferred sales charge.
See accompanying notes which are an integral part of the financial statements.
Statement of Operations
| Six months ended April 30, 2018 (Unaudited) | ||
| Investment Income | ||
| Dividends | $1,978,868 | |
| Income from Fidelity Central Funds | 11,552 | |
| Income before foreign taxes withheld | 1,990,420 | |
| Less foreign taxes withheld | (177,108) | |
| Total income | 1,813,312 | |
| Expenses | ||
| Management fee | $455,124 | |
| Transfer agent fees | 134,710 | |
| Distribution and service plan fees | 39,098 | |
| Accounting and security lending fees | 29,886 | |
| Custodian fees and expenses | 56,798 | |
| Independent trustees' fees and expenses | 222 | |
| Registration fees | 71,162 | |
| Audit | 34,316 | |
| Legal | 1,901 | |
| Miscellaneous | 348 | |
| Total expenses before reductions | 823,565 | |
| Expense reductions | (18,822) | 804,743 |
| Net investment income (loss) | 1,008,569 | |
| Realized and Unrealized Gain (Loss) | ||
| Net realized gain (loss) on: | ||
| Investment securities: | ||
| Unaffiliated issuers | 2,167,519 | |
| Fidelity Central Funds | 8 | |
| Foreign currency transactions | (3,642) | |
| Total net realized gain (loss) | 2,163,885 | |
| Change in net unrealized appreciation (depreciation) on: | ||
| Investment securities: | ||
| Unaffiliated issuers | 6,574,710 | |
| Fidelity Central Funds | (5) | |
| Assets and liabilities in foreign currencies | (7,355) | |
| Total change in net unrealized appreciation (depreciation) | 6,567,350 | |
| Net gain (loss) | 8,731,235 | |
| Net increase (decrease) in net assets resulting from operations | $9,739,804 |
See accompanying notes which are an integral part of the financial statements.
Statement of Changes in Net Assets
| Six months ended April 30, 2018 (Unaudited) | Year ended October 31, 2017 | |
| Increase (Decrease) in Net Assets | ||
| Operations | ||
| Net investment income (loss) | $1,008,569 | $1,644,538 |
| Net realized gain (loss) | 2,163,885 | 3,966,888 |
| Change in net unrealized appreciation (depreciation) | 6,567,350 | 10,350,803 |
| Net increase (decrease) in net assets resulting from operations | 9,739,804 | 15,962,229 |
| Distributions to shareholders from net investment income | (1,562,179) | (1,167,439) |
| Distributions to shareholders from net realized gain | (83,502) | – |
| Total distributions | (1,645,681) | (1,167,439) |
| Share transactions - net increase (decrease) | 8,655,675 | (13,935,496) |
| Redemption fees | 823 | 71,905 |
| Total increase (decrease) in net assets | 16,750,621 | 931,199 |
| Net Assets | ||
| Beginning of period | 99,646,799 | 98,715,600 |
| End of period | $116,397,420 | $99,646,799 |
| Other Information | ||
| Undistributed net investment income end of period | $801,566 | $1,355,176 |
See accompanying notes which are an integral part of the financial statements.
Financial Highlights
Fidelity Emerging Europe, Middle East, Africa (EMEA) Fund Class A
| Six months ended (Unaudited) April 30, | Years endedOctober 31, | |||||
| 2018 | 2017 | 2016 | 2015 | 2014 | 2013 | |
| Selected Per–Share Data | ||||||
| Net asset value, beginning of period | $9.39 | $8.13 | $7.49 | $9.04 | $9.49 | $8.71 |
| Income from Investment Operations | ||||||
| Net investment income (loss)A | .08 | .12 | .14 | .12 | .13 | .16 |
| Net realized and unrealized gain (loss) | .93 | 1.22 | .61 | (1.50) | (.46) | .85 |
| Total from investment operations | 1.01 | 1.34 | .75 | (1.38) | (.33) | 1.01 |
| Distributions from net investment income | (.13) | (.09) | (.11) | (.14) | (.12) | (.15) |
| Distributions from net realized gain | (.01) | – | – | (.04) | – | (.07) |
| Total distributions | (.14) | (.09) | (.11) | (.17)B | (.12) | (.23)C |
| Redemption fees added to paid in capitalA | –D | .01 | –D | –D | –D | –D |
| Net asset value, end of period | $10.26 | $9.39 | $8.13 | $7.49 | $9.04 | $9.49 |
| Total ReturnE,F,G | 10.84% | 16.69% | 10.22% | (15.42)% | (3.48)% | 11.75% |
| Ratios to Average Net AssetsH,I | ||||||
| Expenses before reductions | 1.62%J | 1.63% | 1.69% | 1.61% | 1.60% | 1.64% |
| Expenses net of fee waivers, if any | 1.62%J | 1.62% | 1.65% | 1.61% | 1.60% | 1.63% |
| Expenses net of all reductions | 1.59%J | 1.61% | 1.64% | 1.60% | 1.60% | 1.62% |
| Net investment income (loss) | 1.56%J | 1.41% | 1.90% | 1.51% | 1.45% | 1.82% |
| Supplemental Data | ||||||
| Net assets, end of period (000 omitted) | $7,239 | $5,538 | $7,867 | $5,788 | $7,889 | $10,883 |
| Portfolio turnover rateK | 40%J | 47% | 54% | 50% | 38% | 64% |
A Calculated based on average shares outstanding during the period.
B Total distributions of $.17 per share is comprised of distributions from net investment income of $.135 and distributions from net realized gain of $.039 per share.
C Total distributions of $.23 per share is comprised of distributions from net investment income of $.151 and distributions from net realized gain of $.074 per share.
D Amount represents less than $.005 per share.
E Total returns for periods of less than one year are not annualized.
F Total returns would have been lower if certain expenses had not been reduced during the applicable periods shown.
G Total returns do not include the effect of the sales charges.
H Fees and expenses of any underlying Fidelity Central Funds are not included in the Fund's expense ratio. The Fund indirectly bears its proportionate share of the expenses of any underlying Fidelity Central Funds.
I Expense ratios reflect operating expenses of the class. Expenses before reductions do not reflect amounts reimbursed by the investment adviser or reductions from brokerage service arrangements or reductions from other expense offset arrangements and do not represent the amount paid by the class during periods when reimbursements or reductions occur. Expenses net of fee waivers reflect expenses after reimbursement by the investment adviser but prior to reductions from brokerage service arrangements or other expense offset arrangements. Expenses net of all reductions represent the net expenses paid by the class.
J Annualized
K Amount does not include the portfolio activity of any underlying Fidelity Central Funds.
See accompanying notes which are an integral part of the financial statements.
Fidelity Emerging Europe, Middle East, Africa (EMEA) Fund Class M
| Six months ended (Unaudited) April 30, | Years endedOctober 31, | |||||
| 2018 | 2017 | 2016 | 2015 | 2014 | 2013 | |
| Selected Per–Share Data | ||||||
| Net asset value, beginning of period | $9.35 | $8.10 | $7.44 | $9.01 | $9.46 | $8.68 |
| Income from Investment Operations | ||||||
| Net investment income (loss)A | .07 | .10 | .12 | .10 | .11 | .14 |
| Net realized and unrealized gain (loss) | .92 | 1.21 | .61 | (1.51) | (.46) | .84 |
| Total from investment operations | .99 | 1.31 | .73 | (1.41) | (.35) | .98 |
| Distributions from net investment income | (.11) | (.07) | (.07) | (.13) | (.10) | (.12) |
| Distributions from net realized gain | (.01) | – | – | (.04) | – | (.07) |
| Total distributions | (.12) | (.07) | (.07) | (.16)B | (.10) | (.20)C |
| Redemption fees added to paid in capitalA | –D | .01 | –D | –D | –D | –D |
| Net asset value, end of period | $10.22 | $9.35 | $8.10 | $7.44 | $9.01 | $9.46 |
| Total ReturnE,F,G | 10.65% | 16.40% | 9.98% | (15.80)% | (3.67)% | 11.42% |
| Ratios to Average Net AssetsH,I | ||||||
| Expenses before reductions | 1.96%J | 1.95% | 2.00% | 1.92% | 1.92% | 1.93% |
| Expenses net of fee waivers, if any | 1.90%J | 1.90% | 1.90% | 1.90% | 1.90% | 1.90% |
| Expenses net of all reductions | 1.87%J | 1.88% | 1.89% | 1.89% | 1.90% | 1.88% |
| Net investment income (loss) | 1.28%J | 1.14% | 1.65% | 1.22% | 1.15% | 1.55% |
| Supplemental Data | ||||||
| Net assets, end of period (000 omitted) | $2,891 | $2,490 | $2,580 | $2,003 | $2,465 | $3,465 |
| Portfolio turnover rateK | 40%J | 47% | 54% | 50% | 38% | 64% |
A Calculated based on average shares outstanding during the period.
B Total distributions of $.16 per share is comprised of distributions from net investment income of $.125 and distributions from net realized gain of $.039 per share.
C Total distributions of $.20 per share is comprised of distributions from net investment income of $.122 and distributions from net realized gain of $.074 per share.
D Amount represents less than $.005 per share.
E Total returns for periods of less than one year are not annualized.
F Total returns would have been lower if certain expenses had not been reduced during the applicable periods shown.
G Total returns do not include the effect of the sales charges.
H Fees and expenses of any underlying Fidelity Central Funds are not included in the Fund's expense ratio. The Fund indirectly bears its proportionate share of the expenses of any underlying Fidelity Central Funds.
I Expense ratios reflect operating expenses of the class. Expenses before reductions do not reflect amounts reimbursed by the investment adviser or reductions from brokerage service arrangements or reductions from other expense offset arrangements and do not represent the amount paid by the class during periods when reimbursements or reductions occur. Expenses net of fee waivers reflect expenses after reimbursement by the investment adviser but prior to reductions from brokerage service arrangements or other expense offset arrangements. Expenses net of all reductions represent the net expenses paid by the class.
J Annualized
K Amount does not include the portfolio activity of any underlying Fidelity Central Funds.
See accompanying notes which are an integral part of the financial statements.
Fidelity Emerging Europe, Middle East, Africa (EMEA) Fund Class C
| Six months ended (Unaudited) April 30, | Years endedOctober 31, | |||||
| 2018 | 2017 | 2016 | 2015 | 2014 | 2013 | |
| Selected Per–Share Data | ||||||
| Net asset value, beginning of period | $9.30 | $8.06 | $7.39 | $8.93 | $9.39 | $8.62 |
| Income from Investment Operations | ||||||
| Net investment income (loss)A | .04 | .06 | .09 | .06 | .06 | .09 |
| Net realized and unrealized gain (loss) | .93 | 1.20 | .60 | (1.48) | (.46) | .83 |
| Total from investment operations | .97 | 1.26 | .69 | (1.42) | (.40) | .92 |
| Distributions from net investment income | (.04) | (.03) | (.02) | (.08) | (.06) | (.08) |
| Distributions from net realized gain | (.01) | – | – | (.04) | – | (.07) |
| Total distributions | (.05) | (.03) | (.02) | (.12) | (.06) | (.15) |
| Redemption fees added to paid in capitalA | –B | .01 | –B | –B | –B | –B |
| Net asset value, end of period | $10.22 | $9.30 | $8.06 | $7.39 | $8.93 | $9.39 |
| Total ReturnC,D,E | 10.42% | 15.85% | 9.33% | (16.08)% | (4.24)% | 10.83% |
| Ratios to Average Net AssetsF,G | ||||||
| Expenses before reductions | 2.41%H | 2.42% | 2.47% | 2.41% | 2.40% | 2.42% |
| Expenses net of fee waivers, if any | 2.40%H | 2.39% | 2.40% | 2.40% | 2.40% | 2.40% |
| Expenses net of all reductions | 2.37%H | 2.37% | 2.39% | 2.39% | 2.40% | 2.38% |
| Net investment income (loss) | .78%H | .65% | 1.15% | .72% | .65% | 1.05% |
| Supplemental Data | ||||||
| Net assets, end of period (000 omitted) | $4,636 | $4,336 | $6,269 | $4,104 | $6,662 | $6,782 |
| Portfolio turnover rateI | 40%H | 47% | 54% | 50% | 38% | 64% |
A Calculated based on average shares outstanding during the period.
B Amount represents less than $.005 per share.
C Total returns for periods of less than one year are not annualized.
D Total returns would have been lower if certain expenses had not been reduced during the applicable periods shown.
E Total returns do not include the effect of the contingent deferred sales charge.
F Fees and expenses of any underlying Fidelity Central Funds are not included in the Fund's expense ratio. The Fund indirectly bears its proportionate share of the expenses of any underlying Fidelity Central Funds.
G Expense ratios reflect operating expenses of the class. Expenses before reductions do not reflect amounts reimbursed by the investment adviser or reductions from brokerage service arrangements or reductions from other expense offset arrangements and do not represent the amount paid by the class during periods when reimbursements or reductions occur. Expenses net of fee waivers reflect expenses after reimbursement by the investment adviser but prior to reductions from brokerage service arrangements or other expense offset arrangements. Expenses net of all reductions represent the net expenses paid by the class.
H Annualized
I Amount does not include the portfolio activity of any underlying Fidelity Central Funds.
See accompanying notes which are an integral part of the financial statements.
Fidelity Emerging Europe, Middle East, Africa (EMEA) Fund
| Six months ended (Unaudited) April 30, | Years endedOctober 31, | |||||
| 2018 | 2017 | 2016 | 2015 | 2014 | 2013 | |
| Selected Per–Share Data | ||||||
| Net asset value, beginning of period | $9.41 | $8.14 | $7.50 | $9.08 | $9.52 | $8.75 |
| Income from Investment Operations | ||||||
| Net investment income (loss)A | .09 | .15 | .16 | .14 | .16 | .18 |
| Net realized and unrealized gain (loss) | .94 | 1.21 | .61 | (1.51) | (.47) | .84 |
| Total from investment operations | 1.03 | 1.36 | .77 | (1.37) | (.31) | 1.02 |
| Distributions from net investment income | (.16) | (.10) | (.13) | (.17) | (.13) | (.18) |
| Distributions from net realized gain | (.01) | – | – | (.04) | – | (.07) |
| Total distributions | (.17) | (.10) | (.13) | (.21) | (.13) | (.25) |
| Redemption fees added to paid in capitalA | –B | .01 | –B | –B | –B | –B |
| Net asset value, end of period | $10.27 | $9.41 | $8.14 | $7.50 | $9.08 | $9.52 |
| Total ReturnC,D | 11.03% | 17.04% | 10.54% | (15.33)% | (3.21)% | 11.90% |
| Ratios to Average Net AssetsE,F | ||||||
| Expenses before reductions | 1.36%G | 1.38% | 1.46% | 1.39% | 1.37% | 1.40% |
| Expenses net of fee waivers, if any | 1.36%G | 1.38% | 1.40% | 1.38% | 1.37% | 1.40% |
| Expenses net of all reductions | 1.33%G | 1.37% | 1.39% | 1.38% | 1.37% | 1.38% |
| Net investment income (loss) | 1.82%G | 1.66% | 2.15% | 1.74% | 1.68% | 2.05% |
| Supplemental Data | ||||||
| Net assets, end of period (000 omitted) | $94,070 | $80,392 | $76,193 | $67,521 | $96,784 | $110,265 |
| Portfolio turnover rateH | 40%G | 47% | 54% | 50% | 38% | 64% |
A Calculated based on average shares outstanding during the period.
B Amount represents less than $.005 per share.
C Total returns for periods of less than one year are not annualized.
D Total returns would have been lower if certain expenses had not been reduced during the applicable periods shown.
E Fees and expenses of any underlying Fidelity Central Funds are not included in the Fund's expense ratio. The Fund indirectly bears its proportionate share of the expenses of any underlying Fidelity Central Funds.
F Expense ratios reflect operating expenses of the class. Expenses before reductions do not reflect amounts reimbursed by the investment adviser or reductions from brokerage service arrangements or reductions from other expense offset arrangements and do not represent the amount paid by the class during periods when reimbursements or reductions occur. Expenses net of fee waivers reflect expenses after reimbursement by the investment adviser but prior to reductions from brokerage service arrangements or other expense offset arrangements. Expenses net of all reductions represent the net expenses paid by the class.
G Annualized
H Amount does not include the portfolio activity of any underlying Fidelity Central Funds.
See accompanying notes which are an integral part of the financial statements.
Fidelity Emerging Europe, Middle East, Africa (EMEA) Fund Class I
| Six months ended (Unaudited) April 30, | Years endedOctober 31, | |||||
| 2018 | 2017 | 2016 | 2015 | 2014 | 2013 | |
| Selected Per–Share Data | ||||||
| Net asset value, beginning of period | $9.40 | $8.14 | $7.50 | $9.08 | $9.52 | $8.75 |
| Income from Investment Operations | ||||||
| Net investment income (loss)A | .10 | .16 | .17 | .15 | .16 | .19 |
| Net realized and unrealized gain (loss) | .93 | 1.20 | .61 | (1.51) | (.46) | .84 |
| Total from investment operations | 1.03 | 1.36 | .78 | (1.36) | (.30) | 1.03 |
| Distributions from net investment income | (.17) | (.11) | (.14) | (.18) | (.14) | (.19) |
| Distributions from net realized gain | (.01) | – | – | (.04) | – | (.07) |
| Total distributions | (.18) | (.11) | (.14) | (.22) | (.14) | (.26) |
| Redemption fees added to paid in capitalA | –B | .01 | –B | –B | –B | –B |
| Net asset value, end of period | $10.25 | $9.40 | $8.14 | $7.50 | $9.08 | $9.52 |
| Total ReturnC,D | 11.04% | 17.01% | 10.69% | (15.23)% | (3.09)% | 12.05% |
| Ratios to Average Net AssetsE,F | ||||||
| Expenses before reductions | 1.28%G | 1.27% | 1.31% | 1.25% | 1.26% | 1.30% |
| Expenses net of fee waivers, if any | 1.28%G | 1.27% | 1.31% | 1.25% | 1.26% | 1.30% |
| Expenses net of all reductions | 1.25%G | 1.26% | 1.30% | 1.24% | 1.26% | 1.28% |
| Net investment income (loss) | 1.90%G | 1.77% | 2.24% | 1.88% | 1.79% | 2.15% |
| Supplemental Data | ||||||
| Net assets, end of period (000 omitted) | $7,561 | $6,891 | $5,807 | $3,478 | $5,596 | $10,231 |
| Portfolio turnover rateH | 40%G | 47% | 54% | 50% | 38% | 64% |
A Calculated based on average shares outstanding during the period.
B Amount represents less than $.005 per share.
C Total returns for periods of less than one year are not annualized.
D Total returns would have been lower if certain expenses had not been reduced during the applicable periods shown.
E Fees and expenses of any underlying Fidelity Central Funds are not included in the Fund's expense ratio. The Fund indirectly bears its proportionate share of the expenses of any underlying Fidelity Central Funds.
F Expense ratios reflect operating expenses of the class. Expenses before reductions do not reflect amounts reimbursed by the investment adviser or reductions from brokerage service arrangements or reductions from other expense offset arrangements and do not represent the amount paid by the class during periods when reimbursements or reductions occur. Expenses net of fee waivers reflect expenses after reimbursement by the investment adviser but prior to reductions from brokerage service arrangements or other expense offset arrangements. Expenses net of all reductions represent the net expenses paid by the class.
G Annualized
H Amount does not include the portfolio activity of any underlying Fidelity Central Funds.
See accompanying notes which are an integral part of the financial statements.
Notes to Financial Statements (Unaudited)
For the period ended April 30, 2018
1. Organization.
Fidelity Emerging Europe, Middle East, Africa (EMEA) Fund (the Fund) is a non-diversified fund of Fidelity Investment Trust (the Trust) and is authorized to issue an unlimited number of shares. The Trust is registered under the Investment Company Act of 1940, as amended (the 1940 Act), as an open-end management investment company organized as a Massachusetts business trust. The Fund offers Class A, Class M, Class C, Emerging Europe, Middle East, Africa (EMEA) and Class I shares, each of which has equal rights as to assets and voting privileges. Each class has exclusive voting rights with respect to matters that affect that class. The Fund's investments in emerging markets can be subject to social, economic, regulatory, and political uncertainties and can be extremely volatile.
2. Investments in Fidelity Central Funds.
The Fund invests in Fidelity Central Funds, which are open-end investment companies generally available only to other investment companies and accounts managed by the investment adviser and its affiliates. The Fund's Schedule of Investments lists each of the Fidelity Central Funds held as of period end, if any, as an investment of the Fund, but does not include the underlying holdings of each Fidelity Central Fund. As an Investing Fund, the Fund indirectly bears its proportionate share of the expenses of the underlying Fidelity Central Funds.
The Money Market Central Funds seek preservation of capital and current income and are managed by Fidelity Investments Money Management, Inc. (FIMM), an affiliate of the investment adviser. Annualized expenses of the Money Market Central Funds as of their most recent shareholder report date are less than .005%.
A complete unaudited list of holdings for each Fidelity Central Fund is available upon request or at the Securities and Exchange Commission (the SEC) website at www.sec.gov. In addition, the financial statements of the Fidelity Central Funds are available on the SEC website or upon request.
3. Significant Accounting Policies.
The Fund is an investment company and applies the accounting and reporting guidance of the Financial Accounting Standards Board (FASB) Accounting Standards Codification Topic 946 Financial Services – Investments Companies. The financial statements have been prepared in conformity with accounting principles generally accepted in the United States of America (GAAP), which require management to make certain estimates and assumptions at the date of the financial statements. Actual results could differ from those estimates. Subsequent events, if any, through the date that the financial statements were issued have been evaluated in the preparation of the financial statements. The following summarizes the significant accounting policies of the Fund:
Investment Valuation. Investments are valued as of 4:00 p.m. Eastern time on the last calendar day of the period. The Board of Trustees (the Board) has delegated the day to day responsibility for the valuation of the Fund's investments to the Fair Value Committee (the Committee) established by the Fund's investment adviser. In accordance with valuation policies and procedures approved by the Board, the Fund attempts to obtain prices from one or more third party pricing vendors or brokers to value its investments. When current market prices, quotations or currency exchange rates are not readily available or reliable, investments will be fair valued in good faith by the Committee, in accordance with procedures adopted by the Board. Factors used in determining fair value vary by investment type and may include market or investment specific events. The frequency with which these procedures are used cannot be predicted and they may be utilized to a significant extent. The Committee oversees the Fund's valuation policies and procedures and reports to the Board on the Committee's activities and fair value determinations. The Board monitors the appropriateness of the procedures used in valuing the Fund's investments and ratifies the fair value determinations of the Committee.
The Fund categorizes the inputs to valuation techniques used to value its investments into a disclosure hierarchy consisting of three levels as shown below:
- Level 1 – quoted prices in active markets for identical investments
- Level 2 – other significant observable inputs (including quoted prices for similar investments, interest rates, prepayment speeds, etc.)
- Level 3 – unobservable inputs (including the Fund's own assumptions based on the best information available)
Valuation techniques used to value the Fund's investments by major category are as follows:
Equity securities, including restricted securities, for which market quotations are readily available, are valued at the last reported sale price or official closing price as reported by a third party pricing vendor on the primary market or exchange on which they are traded and are categorized as Level 1 in the hierarchy. In the event there were no sales during the day or closing prices are not available, securities are valued at the last quoted bid price or may be valued using the last available price and are generally categorized as Level 2 in the hierarchy. For foreign equity securities, when market or security specific events arise, comparisons to the valuation of American Depositary Receipts (ADRs), futures contracts, Exchange-Traded Funds (ETFs) and certain indexes as well as quoted prices for similar securities may be used and would be categorized as Level 2 in the hierarchy. Utilizing these techniques may result in transfers between Level 1 and Level 2. For equity securities, including restricted securities, where observable inputs are limited, assumptions about market activity and risk are used and these securities may be categorized as Level 3 in the hierarchy.
Investments in open-end mutual funds, including the Fidelity Central Funds, are valued at their closing net asset value (NAV) each business day and are categorized as Level 1 in the hierarchy.
Changes in valuation techniques may result in transfers in or out of an assigned level within the disclosure hierarchy. The aggregate value of investments by input level as of April 30, 2018, including information on transfers between Levels 1 and 2, is included at the end of the Fund's Schedule of Investments.
Foreign Currency. The Fund may use foreign currency contracts to facilitate transactions in foreign-denominated securities. Gains and losses from these transactions may arise from changes in the value of the foreign currency or if the counterparties do not perform under the contracts' terms.
Foreign-denominated assets, including investment securities, and liabilities are translated into U.S. dollars at the exchange rates at period end. Purchases and sales of investment securities, income and dividends received and expenses denominated in foreign currencies are translated into U.S. dollars at the exchange rate in effect on the transaction date.
The effects of exchange rate fluctuations on investments are included with the net realized and unrealized gain (loss) on investment securities. Other foreign currency transactions resulting in realized and unrealized gain (loss) are disclosed separately.
Investment Transactions and Income. For financial reporting purposes, the Fund's investment holdings and NAV include trades executed through the end of the last business day of the period. The NAV per share for processing shareholder transactions is calculated as of the close of business of the New York Stock Exchange (NYSE), normally 4:00 p.m. Eastern time and includes trades executed through the end of the prior business day. Gains and losses on securities sold are determined on the basis of identified cost and includes proceeds received from litigation. Dividend income is recorded on the ex-dividend date, except for certain dividends from foreign securities where the ex-dividend date may have passed, which are recorded as soon as the Fund is informed of the ex-dividend date. Non-cash dividends included in dividend income, if any, are recorded at the fair market value of the securities received. Income and capital gain distributions from Fidelity Central Funds, if any, are recorded on the ex-dividend date. Investment income is recorded net of foreign taxes withheld where recovery of such taxes is uncertain.
Class Allocations and Expenses. Investment income, realized and unrealized capital gains and losses, common expenses of the Fund, and certain fund-level expense reductions, if any, are allocated daily on a pro-rata basis to each class based on the relative net assets of each class to the total net assets of the Fund. Each class differs with respect to transfer agent and distribution and service plan fees incurred. Certain expense reductions may also differ by class. For the reporting period, the allocated portion of income and expenses to each class as a percent of its average net assets may vary due to the timing of recording these transactions in relation to fluctuating net assets of the classes. Expenses directly attributable to a fund are charged to that fund. Expenses attributable to more than one fund are allocated among the respective funds on the basis of relative net assets or other appropriate methods. Expense estimates are accrued in the period to which they relate and adjustments are made when actual amounts are known.
Income Tax Information and Distributions to Shareholders. Each year, the Fund intends to qualify as a regulated investment company under Subchapter M of the Internal Revenue Code, including distributing substantially all of its taxable income and realized gains. As a result, no provision for U.S. Federal income taxes is required. The Fund files a U.S. federal tax return, in addition to state and local tax returns as required. The Fund's federal income tax returns are subject to examination by the Internal Revenue Service (IRS) for a period of three fiscal years after they are filed. State and local tax returns may be subject to examination for an additional fiscal year depending on the jurisdiction. Foreign taxes are provided for based on the Fund's understanding of the tax rules and rates that exist in the foreign markets in which it invests.
Distributions are declared and recorded on the ex-dividend date. Income and capital gain distributions are declared separately for each class. Income and capital gain distributions are determined in accordance with income tax regulations, which may differ from GAAP.
Capital accounts within the financial statements are adjusted for permanent book-tax differences. These adjustments have no impact on net assets or the results of operations. Capital accounts are not adjusted for temporary book-tax differences which will reverse in a subsequent period.
Book-tax differences are primarily due to foreign currency transactions, certain foreign taxes, passive foreign investment companies (PFIC), capital loss carryforwards and losses deferred due to wash sales.
As of period end, the cost and unrealized appreciation (depreciation) in securities, and derivatives if applicable, for federal income tax purposes as follows:
| Gross unrealized appreciation | $37,752,691 |
| Gross unrealized depreciation | (5,742,293) |
| Net unrealized appreciation (depreciation) | $32,010,398 |
| Tax cost | $82,323,945 |
Capital loss carryforwards are only available to offset future capital gains of the Fund to the extent provided by regulations and may be limited. Under the Regulated Investment Company Modernization Act of 2010 (the Act), the Fund is permitted to carry forward capital losses incurred in taxable years beginning after December 22, 2010 for an unlimited period and such capital losses are required to be used prior to any losses that expire. The capital loss carryforward information presented below, including any applicable limitation, is estimated as of prior fiscal period end and is subject to adjustment.
| Fiscal year of expiration | |
| 2018 | $(1,624,705) |
| No expiration | |
| Short-term | (2,621,070) |
| Long-term | (15,049,441) |
| Total no expiration | (17,670,511) |
| Total capital loss carryforward | $(19,295,216) |
Short-Term Trading (Redemption) Fees. Shares held by investors in the Fund less than 90 days may have been subject to a redemption fee equal to 1.50% of the NAV of shares redeemed. All redemption fees, which reduce the proceeds of the shareholder redemption, are retained by the Fund and accounted for as an addition to paid in capital. In November 2017, the Board of Trustees approved the elimination of these redemption fees effective December 18, 2017.
Restricted Securities. The Fund may invest in securities that are subject to legal or contractual restrictions on resale. These securities generally may be resold in transactions exempt from registration or to the public if the securities are registered. Disposal of these securities may involve time-consuming negotiations and expense, and prompt sale at an acceptable price may be difficult. Information regarding restricted securities is included at the end of the Fund's Schedule of Investments.
4. Purchases and Sales of Investments.
Purchases and sales of securities, other than short-term securities, aggregated $27,282,853 and $22,262,957, respectively.
5. Fees and Other Transactions with Affiliates.
Management Fee. Fidelity Management & Research Company (the investment adviser) and its affiliates provide the Fund with investment management related services for which the Fund pays a monthly management fee. The management fee is the sum of an individual fund fee rate that is based on an annual rate of .55% of the Fund's average net assets and an annualized group fee rate that averaged .24% during the period. The group fee rate is based upon the average net assets of all the mutual funds advised by the investment adviser, including any mutual funds previously advised by the investment adviser that are currently advised by Fidelity SelectCo, LLC, an affiliate of the investment adviser. The group fee rate decreases as assets under management increase and increases as assets under management decrease. For the reporting period, the total annualized management fee rate was .79% of the Fund's average net assets.
Distribution and Service Plan Fees. In accordance with Rule 12b-1 of the 1940 Act, the Fund has adopted separate Distribution and Service Plans for each class of shares. Certain classes pay Fidelity Distributors Corporation (FDC), an affiliate of the investment adviser, separate Distribution and Service Fees, each of which is based on an annual percentage of each class' average net assets. In addition, FDC may pay financial intermediaries for selling shares of the Fund and providing shareholder support services. For the period, the Distribution and Service Fee rates, total fees and amounts retained by FDC were as follows:
| Distribution Fee | Service Fee | Total Fees | Retained by FDC | |
| Class A | -% | .25% | $8,140 | $259 |
| Class M | .25% | .25% | 7,206 | 193 |
| Class C | .75% | .25% | 23,752 | 2,457 |
| $39,098 | $2,909 |
Sales Load. FDC may receive a front-end sales charge of up to 5.75% for selling Class A shares and 3.50% for selling Class M shares, some of which is paid to financial intermediaries for selling shares of the Fund. Depending on the holding period, FDC may receive contingent deferred sales charges levied on Class A, Class M and Class C redemptions. The deferred sales charges are 1.00% for Class C shares, 1.00% for certain purchases of Class A shares and .25% for certain purchases of Class M shares.
For the period, sales charge amounts retained by FDC were as follows:
| Retained by FDC | |
| Class A | $4,279 |
| Class M | 619 |
| Class C(a) | 168 |
| $5,066 |
(a) When Class C shares are initially sold, FDC pays commissions from its own resources to financial intermediaries through which the sales are made.
Transfer Agent Fees. Fidelity Investments Institutional Operations Company, Inc., (FIIOC), an affiliate of the investment adviser, is the transfer, dividend disbursing and shareholder servicing agent for each class of the Fund. FIIOC receives account fees and asset-based fees that vary according to the account size and type of account of the shareholders of the respective classes of the Fund. FIIOC pays for typesetting, printing and mailing of shareholder reports, except proxy statements.
For the period, transfer agent fees for each class were as follows:
| Amount | % of Class-Level Average Net Assets(a) | |
| Class A | $7,857 | .24 |
| Class M | 4,728 | .33 |
| Class C | 6,693 | .28 |
| Emerging Europe, Middle East, Africa (EMEA) | 109,252 | .24 |
| Class I | 6,180 | .15 |
| $134,710 |
(a) Annualized
Accounting and Security Lending Fees. Fidelity Service Company, Inc. (FSC), an affiliate of the investment adviser, maintains the Fund's accounting records. The accounting fee is based on the level of average net assets for each month. Under a separate contract, FSC administers the security lending program. The security lending fee is based on the number and duration of lending transactions. For the period, the fees were equivalent to an annualized rate of .05%.
Interfund Trades. The Fund may purchase from or sell securities to other Fidelity Funds under procedures adopted by the Board. The procedures have been designed to ensure these interfund trades are executed in accordance with Rule 17a-7 of the 1940 Act. Interfund trades are included within the respective purchases and sales amounts shown in the Purchases and Sales of Investments note.
Other. During the period, the investment adviser reimbursed the Fund for certain losses in the amount of $4,023.
6. Committed Line of Credit.
The Fund participates with other funds managed by the investment adviser or an affiliate in a $4.25 billion credit facility (the "line of credit") to be utilized for temporary or emergency purposes to fund shareholder redemptions or for other short-term liquidity purposes. The Fund has agreed to pay commitment fees on its pro-rata portion of the line of credit, which amounted to $158 and is reflected in Miscellaneous expenses on the Statement of Operations. During the period, the Fund did not borrow on this line of credit.
7. Security Lending.
The Fund lends portfolio securities through a lending agent from time to time in order to earn additional income. For equity securities, a lending agent is used and may loan securities to certain qualified borrowers, including Fidelity Capital Markets (FCM), a broker-dealer affiliated with the Fund. On the settlement date of the loan, the Fund receives collateral (in the form of U.S. Treasury obligations, letters of credit and/or cash) against the loaned securities and maintains collateral in an amount not less than 100% of the market value of the loaned securities during the period of the loan. The market value of the loaned securities is determined at the close of business of the Fund and any additional required collateral is delivered to the Fund on the next business day. The Fund or borrower may terminate the loan at any time, and if the borrower defaults on its obligation to return the securities loaned because of insolvency or other reasons, the Fund may apply collateral received from the borrower against the obligation. The Fund may experience delays and costs in recovering the securities loaned. Any cash collateral received is invested in the Fidelity Securities Lending Cash Central Fund. The value of loaned securities and cash collateral at period end are disclosed on the Fund's Statement of Assets and Liabilities. Security lending income represents the income earned on investing cash collateral, less rebates paid to borrowers and any lending agent fees associated with the loan, plus any premium payments received for lending certain types of securities. Security lending income is presented in the Statement of Operations as a component of income from Fidelity Central Funds. Total security lending income during the period amounted to $1,901. During the period, there were no securities loaned to FCM.
8. Expense Reductions.
The investment adviser voluntarily agreed to reimburse each class to the extent annual operating expenses exceeded certain levels of class-level average net assets as noted in the table below. Some expenses, for example the compensation of the independent Trustees, and certain miscellaneous expenses such as proxy and shareholder meeting expenses, are excluded from this reimbursement.
The following classes were in reimbursement during the period:
| Expense Limitations | Reimbursement | |
| Class M | 1.90% | $818 |
| Class C | 2.40% | 233 |
| $1,051 |
Commissions paid to certain brokers with whom the investment adviser, or its affiliates, places trades on behalf of the Fund include an amount in addition to trade execution, which may be rebated back to the Fund to offset certain expenses. This amount totaled $17,250 for the period.
In addition, during the period the investment adviser reimbursed and/or waived a portion of fund-level operating expenses in the amount of $521.
9. Distributions to Shareholders.
Distributions to shareholders of each class were as follows:
| Six months ended April 30, 2018 | Year ended October 31, 2017 | |
| From net investment income | ||
| Class A | $75,918 | $82,211 |
| Class M | 29,419 | 22,957 |
| Class C | 17,501 | 25,148 |
| Emerging Europe, Middle East, Africa (EMEA) | 1,323,089 | 957,314 |
| Class I | 116,252 | 79,809 |
| Total | $1,562,179 | $1,167,439 |
| From net realized gain | ||
| Class A | $4,672 | $– |
| Class M | 2,159 | – |
| Class C | 3,684 | – |
| Emerging Europe, Middle East, Africa (EMEA) | 67,418 | – |
| Class I | 5,569 | – |
| Total | $83,502 | $– |
10. Share Transactions.
Share transactions for each class were as follows and may contain automatic conversions between classes or exchanges between affiliated funds:
| Shares | Shares | Dollars | Dollars | |
| Six months ended April 30, 2018 | Year ended October 31, 2017 | Six months ended April 30, 2018 | Year ended October 31, 2017 | |
| Class A | ||||
| Shares sold | 149,657 | 288,036 | $1,625,658 | $2,454,533 |
| Reinvestment of distributions | 8,201 | 9,506 | 78,321 | 78,136 |
| Shares redeemed | (42,016) | (675,335) | (435,416) | (5,836,992) |
| Net increase (decrease) | 115,842 | (377,793) | $1,268,563 | $(3,304,323) |
| Class M | ||||
| Shares sold | 29,936 | 66,562 | $316,443 | $565,838 |
| Reinvestment of distributions | 3,314 | 2,795 | 31,578 | 22,945 |
| Shares redeemed | (16,763) | (121,397) | (178,404) | (1,049,817) |
| Net increase (decrease) | 16,487 | (52,040) | $169,617 | $(461,034) |
| Class C | ||||
| Shares sold | 54,741 | 157,368 | $578,365 | $1,360,245 |
| Reinvestment of distributions | 2,063 | 2,631 | 19,680 | 21,571 |
| Shares redeemed | (69,262) | (471,197) | (726,669) | (4,103,204) |
| Net increase (decrease) | (12,458) | (311,198) | $(128,624) | $(2,721,388) |
| Emerging Europe, Middle East, Africa (EMEA) | ||||
| Shares sold | 2,402,986 | 3,934,827 | $25,914,807 | $34,220,494 |
| Reinvestment of distributions | 134,990 | 108,986 | 1,287,802 | 895,866 |
| Shares redeemed | (1,917,207) | (4,855,547) | (19,986,524) | (42,616,730) |
| Net increase (decrease) | 620,769 | (811,734) | $7,216,085 | $(7,500,370) |
| Class I | ||||
| Shares sold | 458,489 | 791,073 | $4,858,180 | $6,865,207 |
| Reinvestment of distributions | 11,175 | 9,024 | 106,495 | 74,090 |
| Shares redeemed | (464,940) | (780,970) | (4,834,641) | (6,887,678) |
| Net increase (decrease) | 4,724 | 19,127 | $130,034 | $51,619 |
11. Other.
The Fund's organizational documents provide former and current trustees and officers with a limited indemnification against liabilities arising in connection with the performance of their duties to the Fund. In the normal course of business, the Fund may also enter into contracts that provide general indemnifications. The Fund's maximum exposure under these arrangements is unknown as this would be dependent on future claims that may be made against the Fund. The risk of material loss from such claims is considered remote.
Shareholder Expense Example
As a shareholder of the Fund, you incur two types of costs: (1) transaction costs, including sales charges (loads) on purchase payments or redemption proceeds, redemption fees and (2) ongoing costs, including management fees, distribution and/or service (12b-1) fees and other Fund expenses. This Example is intended to help you understand your ongoing costs (in dollars) of investing in the Fund and to compare these costs with the ongoing costs of investing in other mutual funds.
The Example is based on an investment of $1,000 invested at the beginning of the period and held for the entire period (November 1, 2017 to April 30, 2018).
Actual Expenses
The first line of the accompanying table for each class of the Fund provides information about actual account values and actual expenses. You may use the information in this line, together with the amount you invested, to estimate the expenses that you paid over the period. Simply divide your account value by $1,000.00 (for example, an $8,600 account value divided by $1,000.00 = 8.6), then multiply the result by the number in the first line for a class of the Fund under the heading entitled "Expenses Paid During Period" to estimate the expenses you paid on your account during this period. A small balance maintenance fee of $12.00 that is charged once a year may apply for certain accounts with a value of less than $2,000. This fee is not included in the table below. If it was, the estimate of expenses you paid during the period would be higher, and your ending account value lower, by this amount. In addition, the Fund, as a shareholder in the underlying Fidelity Central Funds, will indirectly bear its pro-rata share of the fees and expenses incurred by the underlying Fidelity Central Funds. These fees and expenses are not included in the Fund's annualized expense ratio used to calculate the expense estimate in the table below.
Hypothetical Example for Comparison Purposes
The second line of the accompanying table for each class of the Fund provides information about hypothetical account values and hypothetical expenses based on a Class' actual expense ratio and an assumed rate of return of 5% per year before expenses, which is not the Class' actual return. The hypothetical account values and expenses may not be used to estimate the actual ending account balance or expenses you paid for the period. You may use this information to compare the ongoing costs of investing in the Fund and other funds. To do so, compare this 5% hypothetical example with the 5% hypothetical examples that appear in the shareholder reports of the other funds. A small balance maintenance fee of $12.00 that is charged once a year may apply for certain accounts with a value of less than $2,000. This fee is not included in the table below. If it was, the estimate of expenses you paid during the period would be higher, and your ending account value lower, by this amount. In addition, the Fund, as a shareholder in the underlying Fidelity Central Funds, will indirectly bear its pro-rata share of the fees and expenses incurred by the underlying Fidelity Central Funds. These fees and expenses are not included in the Fund's annualized expense ratio used to calculate the expense estimate in the table below.
Please note that the expenses shown in the table are meant to highlight your ongoing costs only and do not reflect any transaction costs. Therefore, the second line of the table is useful in comparing ongoing costs only, and will not help you determine the relative total costs of owning different funds. In addition, if these transactional costs were included, your costs would have been higher.
| Annualized Expense Ratio-A | Beginning Account Value November 1, 2017 | Ending Account Value April 30, 2018 | Expenses Paid During Period-B November 1, 2017 to April 30, 2018 | |
| Class A | 1.62% | |||
| Actual | $1,000.00 | $1,108.40 | $8.47 | |
| Hypothetical-C | $1,000.00 | $1,016.76 | $8.10 | |
| Class M | 1.90% | |||
| Actual | $1,000.00 | $1,106.50 | $9.92 | |
| Hypothetical-C | $1,000.00 | $1,015.37 | $9.49 | |
| Class C | 2.40% | |||
| Actual | $1,000.00 | $1,104.20 | $12.52 | |
| Hypothetical-C | $1,000.00 | $1,012.89 | $11.98 | |
| Emerging Europe, Middle East, Africa (EMEA) | 1.36% | |||
| Actual | $1,000.00 | $1,110.30 | $7.12 | |
| Hypothetical-C | $1,000.00 | $1,018.05 | $6.81 | |
| Class I | 1.28% | |||
| Actual | $1,000.00 | $1,110.40 | $6.70 | |
| Hypothetical-C | $1,000.00 | $1,018.45 | $6.41 |
A Annualized expense ratio reflects expenses net of applicable fee waivers.
B Expenses are equal to each Class' annualized expense ratio, multiplied by the average account value over the period, multiplied by 181/365 (to reflect the one-half year period).
C 5% return per year before expenses
![]()
AEME-SANN-0618
1.861993.109
Fidelity® Emerging Europe, Middle East, Africa (EMEA) Fund Semi-Annual Report April 30, 2018 |
|
Contents
To view a fund's proxy voting guidelines and proxy voting record for the 12-month period ended June 30, visit http://www.fidelity.com/proxyvotingresults or visit the Securities and Exchange Commission's (SEC) web site at http://www.sec.gov.
You may also call 1-800-544-8544 to request a free copy of the proxy voting guidelines.
Standard & Poor's, S&P and S&P 500 are registered service marks of The McGraw-Hill Companies, Inc. and have been licensed for use by Fidelity Distributors Corporation.
Other third-party marks appearing herein are the property of their respective owners.
All other marks appearing herein are registered or unregistered trademarks or service marks of FMR LLC or an affiliated company. © 2018 FMR LLC. All rights reserved.
This report and the financial statements contained herein are submitted for the general information of the shareholders of the Fund. This report is not authorized for distribution to prospective investors in the Fund unless preceded or accompanied by an effective prospectus.
A fund files its complete schedule of portfolio holdings with the SEC for the first and third quarters of each fiscal year on Form N-Q. Forms N-Q are available on the SEC’s web site at http://www.sec.gov. A fund's Forms N-Q may be reviewed and copied at the SEC’s Public Reference Room in Washington, DC. Information regarding the operation of the SEC's Public Reference Room may be obtained by calling 1-800-SEC-0330.
For a complete list of a fund's portfolio holdings, view the most recent holdings listing, semiannual report, or annual report on Fidelity's web site at http://www.fidelity.com, http://www.institutional.fidelity.com, or http://www.401k.com, as applicable.
NOT FDIC INSURED •MAY LOSE VALUE •NO BANK GUARANTEE
Neither the Fund nor Fidelity Distributors Corporation is a bank.
Investment Summary (Unaudited)
Geographic Diversification (% of fund's net assets)
| As of April 30, 2018 | ||
| South Africa | 41.9% | |
| Russia | 24.8% | |
| United Arab Emirates | 5.7% | |
| United Kingdom | 5.2% | |
| Hungary | 2.7% | |
| Poland | 2.7% | |
| Romania | 2.6% | |
| United States of America | 2.5% | |
| Nigeria | 2.1% | |
| Other* | 9.8% | |

* Includes Short-Term investments and Net Other Assets (Liabilities).
Percentages are based on country or territory of incorporation and are adjusted for the effect of futures contracts, if applicable.
Asset Allocation as of April 30, 2018
| % of fund's net assets | |
| Stocks | 97.5 |
| Short-Term Investments and Net Other Assets (Liabilities) | 2.5 |
Top Ten Stocks as of April 30, 2018
| % of fund's net assets | |
| Naspers Ltd. Class N (South Africa, Media) | 7.7 |
| Sberbank of Russia (Russia, Banks) | 5.8 |
| Lukoil PJSC (Russia, Oil, Gas & Consumable Fuels) | 4.5 |
| Tatneft PAO (Russia, Oil, Gas & Consumable Fuels) | 4.2 |
| Gazprom OAO (Russia, Oil, Gas & Consumable Fuels) | 4.0 |
| Standard Bank Group Ltd. (South Africa, Banks) | 3.9 |
| FirstRand Ltd. (South Africa, Diversified Financial Services) | 3.4 |
| HSBC Bank PLC | 3.2 |
| MTN Group Ltd. (South Africa, Wireless Telecommunication Services) | 3.0 |
| PSG Group Ltd. (South Africa, Diversified Financial Services) | 2.2 |
| 41.9 |
Top Market Sectors as of April 30, 2018
| % of fund's net assets | |
| Financials | 33.1 |
| Energy | 18.4 |
| Consumer Discretionary | 17.2 |
| Materials | 10.6 |
| Consumer Staples | 8.0 |
| Industrials | 4.0 |
| Telecommunication Services | 3.7 |
| Real Estate | 1.6 |
| Health Care | 0.9 |
Market Sectors may include more than one industry category.
The Fund may invest up to 35% of its total assets in any industry that represents more than 20% of the emerging Europe, Middle East and Africa markets. As of April 30, 2018, the Fund did not have more than 25% of its total assets invested in any one industry.
Schedule of Investments April 30, 2018 (Unaudited)
Showing Percentage of Net Assets
| Common Stocks - 94.9% | |||
| Shares | Value | ||
| Austria - 0.5% | |||
| Erste Group Bank AG | 12,600 | $617,760 | |
| Bailiwick of Jersey - 0.5% | |||
| Glencore Xstrata PLC | 119,600 | 581,700 | |
| Bermuda - 0.9% | |||
| Central European Media Enterprises Ltd. Class A (a)(b) | 235,500 | 1,000,875 | |
| Botswana - 0.2% | |||
| First National Bank of Botswana Ltd. | 1,042,331 | 233,440 | |
| Canada - 0.8% | |||
| First Quantum Minerals Ltd. | 64,000 | 922,154 | |
| Cyprus - 0.6% | |||
| Globaltrans Investment PLC GDR (Reg. S) | 61,900 | 651,188 | |
| Greece - 2.1% | |||
| Fourlis Holdings SA | 91,700 | 653,348 | |
| Jumbo SA | 26,536 | 485,800 | |
| Mytilineos Holdings SA | 51,000 | 615,876 | |
| Sarantis SA | 37,800 | 650,474 | |
| TOTAL GREECE | 2,405,498 | ||
| Hungary - 2.7% | |||
| MOL Hungarian Oil and Gas PLC Series A (For. Reg.) | 86,600 | 1,000,713 | |
| OTP Bank PLC | 50,200 | 2,193,211 | |
| TOTAL HUNGARY | 3,193,924 | ||
| Kenya - 1.3% | |||
| KCB Group Ltd. | 1,388,600 | 692,223 | |
| Safaricom Ltd. | 2,814,544 | 792,730 | |
| TOTAL KENYA | 1,484,953 | ||
| Morocco - 0.5% | |||
| Attijariwafa Bank | 11,725 | 643,903 | |
| Netherlands - 0.6% | |||
| X5 Retail Group NV GDR (Reg. S) (a) | 24,200 | 689,700 | |
| Nigeria - 2.1% | |||
| Dangote Cement PLC | 1,107,463 | 756,766 | |
| Guaranty Trust Bank PLC | 4,263,598 | 532,950 | |
| Nigerian Breweries PLC | 1,630,122 | 588,202 | |
| Zenith Bank PLC | 6,951,272 | 530,034 | |
| TOTAL NIGERIA | 2,407,952 | ||
| Oman - 0.5% | |||
| BankMuscat SAOG (a) | 643,984 | 642,478 | |
| Pakistan - 0.5% | |||
| United Bank Ltd. | 344,400 | 599,280 | |
| Poland - 2.7% | |||
| AmRest Holdings NV (a) | 4,000 | 525,379 | |
| Globe Trade Centre SA | 333,900 | 879,974 | |
| Inter Cars SA | 7,700 | 526,518 | |
| LPP SA | 220 | 574,782 | |
| Orbis SA | 21,900 | 599,000 | |
| TOTAL POLAND | 3,105,653 | ||
| Romania - 2.6% | |||
| Banca Transilvania SA | 1,015,997 | 675,295 | |
| BRD-Groupe Societe Generale | 423,335 | 1,645,468 | |
| Fondul Propietatea SA GDR | 56,500 | 706,250 | |
| TOTAL ROMANIA | 3,027,013 | ||
| Russia - 22.2% | |||
| Alrosa Co. Ltd. | 928,200 | 1,320,831 | |
| Gazprom OAO | 2,023,613 | 4,689,441 | |
| Lukoil PJSC | 21,700 | 1,433,557 | |
| Lukoil PJSC sponsored ADR | 57,195 | 3,820,626 | |
| MMC Norilsk Nickel PJSC | 12,400 | 2,118,055 | |
| NOVATEK OAO | 206,800 | 2,528,659 | |
| Novolipetsk Steel OJSC GDR (Reg. S) | 50,400 | 1,292,760 | |
| Sberbank of Russia | 1,892,150 | 6,744,559 | |
| Tatneft PAO | 175,800 | 1,873,367 | |
| TOTAL RUSSIA | 25,821,855 | ||
| South Africa - 41.9% | |||
| African Rainbow Minerals Ltd. | 97,100 | 793,855 | |
| Anglo American Platinum Ltd. | 47,200 | 1,266,620 | |
| ArcelorMittal South Africa Ltd. (a) | 780,000 | 183,556 | |
| AVI Ltd. | 67,400 | 616,498 | |
| Barloworld Ltd. | 69,000 | 931,899 | |
| Cashbuild Ltd. | 31,400 | 1,092,099 | |
| City Lodge Hotels Ltd. | 62,000 | 810,895 | |
| Clicks Group Ltd. | 75,583 | 1,292,237 | |
| Dis-Chem Pharmacies Pty Ltd. (c) | 187,000 | 558,404 | |
| DRDGOLD Ltd. | 3,045,114 | 719,904 | |
| Exxaro Resources Ltd. | 99,600 | 883,449 | |
| FirstRand Ltd. | 730,500 | 3,912,212 | |
| Hulamin Ltd. | 1,096,900 | 455,162 | |
| Imperial Holdings Ltd. | 72,200 | 1,388,846 | |
| KAP Industrial Holdings Ltd. | 1,145,700 | 809,896 | |
| Mr Price Group Ltd. | 97,300 | 2,135,137 | |
| MTN Group Ltd. | 343,950 | 3,452,123 | |
| Murray & Roberts Holdings Ltd. | 399,000 | 493,904 | |
| Nampak Ltd. (a) | 1,025,600 | 1,141,197 | |
| Naspers Ltd. Class N | 37,000 | 9,013,929 | |
| Pioneer Foods Ltd. | 68,100 | 662,304 | |
| Pretoria Portland Cement Co. Ltd. (a) | 1,192,249 | 833,033 | |
| PSG Group Ltd. | 142,300 | 2,560,323 | |
| RMB Holdings Ltd. | 256,000 | 1,605,701 | |
| Sanlam Ltd. | 338,800 | 2,140,206 | |
| Shoprite Holdings Ltd. | 123,100 | 2,449,175 | |
| Spar Group Ltd. | 79,200 | 1,331,417 | |
| Spur Corp. Ltd. | 257,400 | 552,527 | |
| Standard Bank Group Ltd. | 262,686 | 4,505,223 | |
| Steinhoff Africa Retail Ltd. (a) | 140,000 | 217,608 | |
| TOTAL SOUTH AFRICA | 48,809,339 | ||
| Turkey - 0.8% | |||
| Tupras Turkiye Petrol Rafinerileri A/S | 36,000 | 917,260 | |
| United Arab Emirates - 5.7% | |||
| Abu Dhabi National Oil Co. for Distribution PJSC (a) | 937,731 | 625,469 | |
| Agthia Group PJSC | 344,787 | 413,014 | |
| Aldar Properties PJSC | 1,597,568 | 913,356 | |
| DP World Ltd. | 52,278 | 1,163,186 | |
| Dubai Financial Market PJSC | 2,741,002 | 731,302 | |
| Dubai Islamic Bank Pakistan Ltd. | 539,253 | 807,452 | |
| Dubai Parks and Resorts PJSC (a) | 4,523,254 | 475,335 | |
| National Bank of Abu Dhabi PJSC | 460,340 | 1,554,038 | |
| TOTAL UNITED ARAB EMIRATES | 6,683,152 | ||
| United Kingdom - 5.2% | |||
| Abdullah Al-Othaim Markets Co. ELS (HSBC Bank Warrant Program) warrants 7/20/20 (a)(c) | 29,800 | 643,558 | |
| Al Rajhi Banking & Investment Corp. ELS (HSBC Bank Warrant Program) warrants 1/19/21 (a)(c) | 29,800 | 667,555 | |
| ALDREES Petroleum and Transport Services Co. ELS (HSBC Warrant Program) warrants 1/30/20 (a)(c) | 96,625 | 733,528 | |
| BGEO Group PLC | 11,500 | 550,955 | |
| Georgia Healthcare Group PLC (a)(c) | 107,500 | 409,947 | |
| NMC Health PLC | 13,149 | 645,888 | |
| Saudi Co. For Hardware LLC ELS (HSBC Bank Warrant Program) warrants 5/21/18 (a)(c) | 17,800 | 621,819 | |
| Tullow Oil PLC (a) | 234,500 | 735,098 | |
| United International Transportation Co. ELS (HSBC Bank Warrant Program) warrants 7/8/20(a)(c) | 104,504 | 1,040,790 | |
| TOTAL UNITED KINGDOM | 6,049,138 | ||
| TOTAL COMMON STOCKS | |||
| (Cost $79,990,620) | 110,488,215 | ||
| Nonconvertible Preferred Stocks - 2.6% | |||
| Russia - 2.6% | |||
| Tatneft PAO | |||
| (Cost $1,316,366) | 404,100 | 3,051,325 | |
| Money Market Funds - 0.7% | |||
| Fidelity Securities Lending Cash Central Fund 1.74% (d)(e) | |||
| (Cost $794,808) | 794,724 | 794,803 | |
| TOTAL INVESTMENT IN SECURITIES - 98.2% | |||
| (Cost $82,101,794) | 114,334,343 | ||
| NET OTHER ASSETS (LIABILITIES) - 1.8% | 2,063,077 | ||
| NET ASSETS - 100% | $116,397,420 |
Security Type Abbreviations
ELS – Equity-Linked Security
Categorizations in the Schedule of Investments are based on country or territory of incorporation.
Legend
(a) Non-income producing
(b) Security or a portion of the security is on loan at period end.
(c) Security exempt from registration under Rule 144A of the Securities Act of 1933. These securities may be resold in transactions exempt from registration, normally to qualified institutional buyers. At the end of the period, the value of these securities amounted to $4,675,601 or 4.0% of net assets.
(d) Affiliated fund that is generally available only to investment companies and other accounts managed by Fidelity Investments. The rate quoted is the annualized seven-day yield of the fund at period end. A complete unaudited listing of the fund's holdings as of its most recent quarter end is available upon request. In addition, each Fidelity Central Fund's financial statements are available on the SEC's website or upon request.
(e) Investment made with cash collateral received from securities on loan.
Affiliated Central Funds
Information regarding fiscal year to date income earned by the Fund from investments in Fidelity Central Funds is as follows:
| Fund | Income earned |
| Fidelity Cash Central Fund | $9,651 |
| Fidelity Securities Lending Cash Central Fund | 1,901 |
| Total | $11,552 |
Amounts in the income column in the above table include any capital gain distributions from underlying funds, which are presented in the corresponding line-item in the Statement of Operations if applicable.
Investment Valuation
The following is a summary of the inputs used, as of April 30, 2018, involving the Fund's assets and liabilities carried at fair value. The inputs or methodology used for valuing securities may not be an indication of the risk associated with investing in those securities. For more information on valuation inputs, and their aggregation into the levels used below, please refer to the Investment Valuation section in the accompanying Notes to Financial Statements.
| Valuation Inputs at Reporting Date: | ||||
| Description | Total | Level 1 | Level 2 | Level 3 |
| Investments in Securities: | ||||
| Equities: | ||||
| Consumer Discretionary | $20,052,078 | $4,841,037 | $15,211,041 | $-- |
| Consumer Staples | 9,251,425 | 2,341,390 | 6,910,035 | -- |
| Energy | 21,558,964 | 19,241,958 | 2,317,006 | -- |
| Financials | 38,531,513 | 13,356,039 | 25,175,474 | -- |
| Health Care | 1,055,835 | 1,055,835 | -- | -- |
| Industrials | 4,665,949 | 2,430,250 | 2,235,699 | -- |
| Materials | 12,385,593 | 4,292,511 | 8,093,082 | -- |
| Real Estate | 1,793,330 | 1,793,330 | -- | -- |
| Telecommunication Services | 4,244,853 | 792,730 | 3,452,123 | -- |
| Money Market Funds | 794,803 | 794,803 | -- | -- |
| Total Investments in Securities: | $114,334,343 | $50,939,883 | $63,394,460 | $-- |
The following is a summary of transfers between Level 1 and Level 2 for the period ended April 30, 2018. Transfers are assumed to have occurred at the beginning of the period, and are primarily attributable to the valuation techniques used for foreign equity securities, as discussed in the accompanying Notes to Financial Statements:
| Transfers | Total |
| Level 1 to Level 2 | $39,397,547 |
| Level 2 to Level 1 | $0 |
See accompanying notes which are an integral part of the financial statements.
Financial Statements
Statement of Assets and Liabilities
| April 30, 2018 (Unaudited) | ||
| Assets | ||
| Investment in securities, at value (including securities loaned of $750,550) — See accompanying schedule: Unaffiliated issuers (cost $81,306,986) | $113,539,540 | |
| Fidelity Central Funds (cost $794,808) | 794,803 | |
| Total Investment in Securities (cost $82,101,794) | $114,334,343 | |
| Foreign currency held at value (cost $27,752) | 27,767 | |
| Receivable for investments sold | 2,374,418 | |
| Receivable for fund shares sold | 868,585 | |
| Dividends receivable | 182,004 | |
| Distributions receivable from Fidelity Central Funds | 3,296 | |
| Prepaid expenses | 52 | |
| Receivable from investment adviser for expense reductions | 1,052 | |
| Other receivables | 17,683 | |
| Total assets | 117,809,200 | |
| Liabilities | ||
| Payable to custodian bank | $200,277 | |
| Payable for fund shares redeemed | 234,097 | |
| Accrued management fee | 79,535 | |
| Distribution and service plan fees payable | 6,646 | |
| Other affiliated payables | 29,189 | |
| Other payables and accrued expenses | 67,336 | |
| Collateral on securities loaned | 794,700 | |
| Total liabilities | 1,411,780 | |
| Net Assets | $116,397,420 | |
| Net Assets consist of: | ||
| Paid in capital | $101,085,005 | |
| Undistributed net investment income | 801,566 | |
| Accumulated undistributed net realized gain (loss) on investments and foreign currency transactions | (17,713,084) | |
| Net unrealized appreciation (depreciation) on investments and assets and liabilities in foreign currencies | 32,223,933 | |
| Net Assets | $116,397,420 | |
| Calculation of Maximum Offering Price | ||
| Class A: | ||
| Net Asset Value and redemption price per share ($7,238,663 ÷ 705,674 shares) | $10.26 | |
| Maximum offering price per share (100/94.25 of $10.26) | $10.89 | |
| Class M: | ||
| Net Asset Value and redemption price per share ($2,890,958 ÷ 282,745 shares) | $10.22 | |
| Maximum offering price per share (100/96.50 of $10.22) | $10.59 | |
| Class C: | ||
| Net Asset Value and offering price per share ($4,636,361 ÷ 453,751 shares)(a) | $10.22 | |
| Emerging Europe, Middle East, Africa (EMEA): | ||
| Net Asset Value, offering price and redemption price per share ($94,070,229 ÷ 9,164,068 shares) | $10.27 | |
| Class I: | ||
| Net Asset Value, offering price and redemption price per share ($7,561,209 ÷ 737,512 shares) | $10.25 |
(a) Redemption price per share is equal to net asset value less any applicable contingent deferred sales charge.
See accompanying notes which are an integral part of the financial statements.
Statement of Operations
| Six months ended April 30, 2018 (Unaudited) | ||
| Investment Income | ||
| Dividends | $1,978,868 | |
| Income from Fidelity Central Funds | 11,552 | |
| Income before foreign taxes withheld | 1,990,420 | |
| Less foreign taxes withheld | (177,108) | |
| Total income | 1,813,312 | |
| Expenses | ||
| Management fee | $455,124 | |
| Transfer agent fees | 134,710 | |
| Distribution and service plan fees | 39,098 | |
| Accounting and security lending fees | 29,886 | |
| Custodian fees and expenses | 56,798 | |
| Independent trustees' fees and expenses | 222 | |
| Registration fees | 71,162 | |
| Audit | 34,316 | |
| Legal | 1,901 | |
| Miscellaneous | 348 | |
| Total expenses before reductions | 823,565 | |
| Expense reductions | (18,822) | 804,743 |
| Net investment income (loss) | 1,008,569 | |
| Realized and Unrealized Gain (Loss) | ||
| Net realized gain (loss) on: | ||
| Investment securities: | ||
| Unaffiliated issuers | 2,167,519 | |
| Fidelity Central Funds | 8 | |
| Foreign currency transactions | (3,642) | |
| Total net realized gain (loss) | 2,163,885 | |
| Change in net unrealized appreciation (depreciation) on: | ||
| Investment securities: | ||
| Unaffiliated issuers | 6,574,710 | |
| Fidelity Central Funds | (5) | |
| Assets and liabilities in foreign currencies | (7,355) | |
| Total change in net unrealized appreciation (depreciation) | 6,567,350 | |
| Net gain (loss) | 8,731,235 | |
| Net increase (decrease) in net assets resulting from operations | $9,739,804 |
See accompanying notes which are an integral part of the financial statements.
Statement of Changes in Net Assets
| Six months ended April 30, 2018 (Unaudited) | Year ended October 31, 2017 | |
| Increase (Decrease) in Net Assets | ||
| Operations | ||
| Net investment income (loss) | $1,008,569 | $1,644,538 |
| Net realized gain (loss) | 2,163,885 | 3,966,888 |
| Change in net unrealized appreciation (depreciation) | 6,567,350 | 10,350,803 |
| Net increase (decrease) in net assets resulting from operations | 9,739,804 | 15,962,229 |
| Distributions to shareholders from net investment income | (1,562,179) | (1,167,439) |
| Distributions to shareholders from net realized gain | (83,502) | – |
| Total distributions | (1,645,681) | (1,167,439) |
| Share transactions - net increase (decrease) | 8,655,675 | (13,935,496) |
| Redemption fees | 823 | 71,905 |
| Total increase (decrease) in net assets | 16,750,621 | 931,199 |
| Net Assets | ||
| Beginning of period | 99,646,799 | 98,715,600 |
| End of period | $116,397,420 | $99,646,799 |
| Other Information | ||
| Undistributed net investment income end of period | $801,566 | $1,355,176 |
See accompanying notes which are an integral part of the financial statements.
Financial Highlights
Fidelity Emerging Europe, Middle East, Africa (EMEA) Fund Class A
| Six months ended (Unaudited) April 30, | Years endedOctober 31, | |||||
| 2018 | 2017 | 2016 | 2015 | 2014 | 2013 | |
| Selected Per–Share Data | ||||||
| Net asset value, beginning of period | $9.39 | $8.13 | $7.49 | $9.04 | $9.49 | $8.71 |
| Income from Investment Operations | ||||||
| Net investment income (loss)A | .08 | .12 | .14 | .12 | .13 | .16 |
| Net realized and unrealized gain (loss) | .93 | 1.22 | .61 | (1.50) | (.46) | .85 |
| Total from investment operations | 1.01 | 1.34 | .75 | (1.38) | (.33) | 1.01 |
| Distributions from net investment income | (.13) | (.09) | (.11) | (.14) | (.12) | (.15) |
| Distributions from net realized gain | (.01) | – | – | (.04) | – | (.07) |
| Total distributions | (.14) | (.09) | (.11) | (.17)B | (.12) | (.23)C |
| Redemption fees added to paid in capitalA | –D | .01 | –D | –D | –D | –D |
| Net asset value, end of period | $10.26 | $9.39 | $8.13 | $7.49 | $9.04 | $9.49 |
| Total ReturnE,F,G | 10.84% | 16.69% | 10.22% | (15.42)% | (3.48)% | 11.75% |
| Ratios to Average Net AssetsH,I | ||||||
| Expenses before reductions | 1.62%J | 1.63% | 1.69% | 1.61% | 1.60% | 1.64% |
| Expenses net of fee waivers, if any | 1.62%J | 1.62% | 1.65% | 1.61% | 1.60% | 1.63% |
| Expenses net of all reductions | 1.59%J | 1.61% | 1.64% | 1.60% | 1.60% | 1.62% |
| Net investment income (loss) | 1.56%J | 1.41% | 1.90% | 1.51% | 1.45% | 1.82% |
| Supplemental Data | ||||||
| Net assets, end of period (000 omitted) | $7,239 | $5,538 | $7,867 | $5,788 | $7,889 | $10,883 |
| Portfolio turnover rateK | 40%J | 47% | 54% | 50% | 38% | 64% |
A Calculated based on average shares outstanding during the period.
B Total distributions of $.17 per share is comprised of distributions from net investment income of $.135 and distributions from net realized gain of $.039 per share.
C Total distributions of $.23 per share is comprised of distributions from net investment income of $.151 and distributions from net realized gain of $.074 per share.
D Amount represents less than $.005 per share.
E Total returns for periods of less than one year are not annualized.
F Total returns would have been lower if certain expenses had not been reduced during the applicable periods shown.
G Total returns do not include the effect of the sales charges.
H Fees and expenses of any underlying Fidelity Central Funds are not included in the Fund's expense ratio. The Fund indirectly bears its proportionate share of the expenses of any underlying Fidelity Central Funds.
I Expense ratios reflect operating expenses of the class. Expenses before reductions do not reflect amounts reimbursed by the investment adviser or reductions from brokerage service arrangements or reductions from other expense offset arrangements and do not represent the amount paid by the class during periods when reimbursements or reductions occur. Expenses net of fee waivers reflect expenses after reimbursement by the investment adviser but prior to reductions from brokerage service arrangements or other expense offset arrangements. Expenses net of all reductions represent the net expenses paid by the class.
J Annualized
K Amount does not include the portfolio activity of any underlying Fidelity Central Funds.
See accompanying notes which are an integral part of the financial statements.
Fidelity Emerging Europe, Middle East, Africa (EMEA) Fund Class M
| Six months ended (Unaudited) April 30, | Years endedOctober 31, | |||||
| 2018 | 2017 | 2016 | 2015 | 2014 | 2013 | |
| Selected Per–Share Data | ||||||
| Net asset value, beginning of period | $9.35 | $8.10 | $7.44 | $9.01 | $9.46 | $8.68 |
| Income from Investment Operations | ||||||
| Net investment income (loss)A | .07 | .10 | .12 | .10 | .11 | .14 |
| Net realized and unrealized gain (loss) | .92 | 1.21 | .61 | (1.51) | (.46) | .84 |
| Total from investment operations | .99 | 1.31 | .73 | (1.41) | (.35) | .98 |
| Distributions from net investment income | (.11) | (.07) | (.07) | (.13) | (.10) | (.12) |
| Distributions from net realized gain | (.01) | – | – | (.04) | – | (.07) |
| Total distributions | (.12) | (.07) | (.07) | (.16)B | (.10) | (.20)C |
| Redemption fees added to paid in capitalA | –D | .01 | –D | –D | –D | –D |
| Net asset value, end of period | $10.22 | $9.35 | $8.10 | $7.44 | $9.01 | $9.46 |
| Total ReturnE,F,G | 10.65% | 16.40% | 9.98% | (15.80)% | (3.67)% | 11.42% |
| Ratios to Average Net AssetsH,I | ||||||
| Expenses before reductions | 1.96%J | 1.95% | 2.00% | 1.92% | 1.92% | 1.93% |
| Expenses net of fee waivers, if any | 1.90%J | 1.90% | 1.90% | 1.90% | 1.90% | 1.90% |
| Expenses net of all reductions | 1.87%J | 1.88% | 1.89% | 1.89% | 1.90% | 1.88% |
| Net investment income (loss) | 1.28%J | 1.14% | 1.65% | 1.22% | 1.15% | 1.55% |
| Supplemental Data | ||||||
| Net assets, end of period (000 omitted) | $2,891 | $2,490 | $2,580 | $2,003 | $2,465 | $3,465 |
| Portfolio turnover rateK | 40%J | 47% | 54% | 50% | 38% | 64% |
A Calculated based on average shares outstanding during the period.
B Total distributions of $.16 per share is comprised of distributions from net investment income of $.125 and distributions from net realized gain of $.039 per share.
C Total distributions of $.20 per share is comprised of distributions from net investment income of $.122 and distributions from net realized gain of $.074 per share.
D Amount represents less than $.005 per share.
E Total returns for periods of less than one year are not annualized.
F Total returns would have been lower if certain expenses had not been reduced during the applicable periods shown.
G Total returns do not include the effect of the sales charges.
H Fees and expenses of any underlying Fidelity Central Funds are not included in the Fund's expense ratio. The Fund indirectly bears its proportionate share of the expenses of any underlying Fidelity Central Funds.
I Expense ratios reflect operating expenses of the class. Expenses before reductions do not reflect amounts reimbursed by the investment adviser or reductions from brokerage service arrangements or reductions from other expense offset arrangements and do not represent the amount paid by the class during periods when reimbursements or reductions occur. Expenses net of fee waivers reflect expenses after reimbursement by the investment adviser but prior to reductions from brokerage service arrangements or other expense offset arrangements. Expenses net of all reductions represent the net expenses paid by the class.
J Annualized
K Amount does not include the portfolio activity of any underlying Fidelity Central Funds.
See accompanying notes which are an integral part of the financial statements.
Fidelity Emerging Europe, Middle East, Africa (EMEA) Fund Class C
| Six months ended (Unaudited) April 30, | Years endedOctober 31, | |||||
| 2018 | 2017 | 2016 | 2015 | 2014 | 2013 | |
| Selected Per–Share Data | ||||||
| Net asset value, beginning of period | $9.30 | $8.06 | $7.39 | $8.93 | $9.39 | $8.62 |
| Income from Investment Operations | ||||||
| Net investment income (loss)A | .04 | .06 | .09 | .06 | .06 | .09 |
| Net realized and unrealized gain (loss) | .93 | 1.20 | .60 | (1.48) | (.46) | .83 |
| Total from investment operations | .97 | 1.26 | .69 | (1.42) | (.40) | .92 |
| Distributions from net investment income | (.04) | (.03) | (.02) | (.08) | (.06) | (.08) |
| Distributions from net realized gain | (.01) | – | – | (.04) | – | (.07) |
| Total distributions | (.05) | (.03) | (.02) | (.12) | (.06) | (.15) |
| Redemption fees added to paid in capitalA | –B | .01 | –B | –B | –B | –B |
| Net asset value, end of period | $10.22 | $9.30 | $8.06 | $7.39 | $8.93 | $9.39 |
| Total ReturnC,D,E | 10.42% | 15.85% | 9.33% | (16.08)% | (4.24)% | 10.83% |
| Ratios to Average Net AssetsF,G | ||||||
| Expenses before reductions | 2.41%H | 2.42% | 2.47% | 2.41% | 2.40% | 2.42% |
| Expenses net of fee waivers, if any | 2.40%H | 2.39% | 2.40% | 2.40% | 2.40% | 2.40% |
| Expenses net of all reductions | 2.37%H | 2.37% | 2.39% | 2.39% | 2.40% | 2.38% |
| Net investment income (loss) | .78%H | .65% | 1.15% | .72% | .65% | 1.05% |
| Supplemental Data | ||||||
| Net assets, end of period (000 omitted) | $4,636 | $4,336 | $6,269 | $4,104 | $6,662 | $6,782 |
| Portfolio turnover rateI | 40%H | 47% | 54% | 50% | 38% | 64% |
A Calculated based on average shares outstanding during the period.
B Amount represents less than $.005 per share.
C Total returns for periods of less than one year are not annualized.
D Total returns would have been lower if certain expenses had not been reduced during the applicable periods shown.
E Total returns do not include the effect of the contingent deferred sales charge.
F Fees and expenses of any underlying Fidelity Central Funds are not included in the Fund's expense ratio. The Fund indirectly bears its proportionate share of the expenses of any underlying Fidelity Central Funds.
G Expense ratios reflect operating expenses of the class. Expenses before reductions do not reflect amounts reimbursed by the investment adviser or reductions from brokerage service arrangements or reductions from other expense offset arrangements and do not represent the amount paid by the class during periods when reimbursements or reductions occur. Expenses net of fee waivers reflect expenses after reimbursement by the investment adviser but prior to reductions from brokerage service arrangements or other expense offset arrangements. Expenses net of all reductions represent the net expenses paid by the class.
H Annualized
I Amount does not include the portfolio activity of any underlying Fidelity Central Funds.
See accompanying notes which are an integral part of the financial statements.
Fidelity Emerging Europe, Middle East, Africa (EMEA) Fund
| Six months ended (Unaudited) April 30, | Years endedOctober 31, | |||||
| 2018 | 2017 | 2016 | 2015 | 2014 | 2013 | |
| Selected Per–Share Data | ||||||
| Net asset value, beginning of period | $9.41 | $8.14 | $7.50 | $9.08 | $9.52 | $8.75 |
| Income from Investment Operations | ||||||
| Net investment income (loss)A | .09 | .15 | .16 | .14 | .16 | .18 |
| Net realized and unrealized gain (loss) | .94 | 1.21 | .61 | (1.51) | (.47) | .84 |
| Total from investment operations | 1.03 | 1.36 | .77 | (1.37) | (.31) | 1.02 |
| Distributions from net investment income | (.16) | (.10) | (.13) | (.17) | (.13) | (.18) |
| Distributions from net realized gain | (.01) | – | – | (.04) | – | (.07) |
| Total distributions | (.17) | (.10) | (.13) | (.21) | (.13) | (.25) |
| Redemption fees added to paid in capitalA | –B | .01 | –B | –B | –B | –B |
| Net asset value, end of period | $10.27 | $9.41 | $8.14 | $7.50 | $9.08 | $9.52 |
| Total ReturnC,D | 11.03% | 17.04% | 10.54% | (15.33)% | (3.21)% | 11.90% |
| Ratios to Average Net AssetsE,F | ||||||
| Expenses before reductions | 1.36%G | 1.38% | 1.46% | 1.39% | 1.37% | 1.40% |
| Expenses net of fee waivers, if any | 1.36%G | 1.38% | 1.40% | 1.38% | 1.37% | 1.40% |
| Expenses net of all reductions | 1.33%G | 1.37% | 1.39% | 1.38% | 1.37% | 1.38% |
| Net investment income (loss) | 1.82%G | 1.66% | 2.15% | 1.74% | 1.68% | 2.05% |
| Supplemental Data | ||||||
| Net assets, end of period (000 omitted) | $94,070 | $80,392 | $76,193 | $67,521 | $96,784 | $110,265 |
| Portfolio turnover rateH | 40%G | 47% | 54% | 50% | 38% | 64% |
A Calculated based on average shares outstanding during the period.
B Amount represents less than $.005 per share.
C Total returns for periods of less than one year are not annualized.
D Total returns would have been lower if certain expenses had not been reduced during the applicable periods shown.
E Fees and expenses of any underlying Fidelity Central Funds are not included in the Fund's expense ratio. The Fund indirectly bears its proportionate share of the expenses of any underlying Fidelity Central Funds.
F Expense ratios reflect operating expenses of the class. Expenses before reductions do not reflect amounts reimbursed by the investment adviser or reductions from brokerage service arrangements or reductions from other expense offset arrangements and do not represent the amount paid by the class during periods when reimbursements or reductions occur. Expenses net of fee waivers reflect expenses after reimbursement by the investment adviser but prior to reductions from brokerage service arrangements or other expense offset arrangements. Expenses net of all reductions represent the net expenses paid by the class.
G Annualized
H Amount does not include the portfolio activity of any underlying Fidelity Central Funds.
See accompanying notes which are an integral part of the financial statements.
Fidelity Emerging Europe, Middle East, Africa (EMEA) Fund Class I
| Six months ended (Unaudited) April 30, | Years endedOctober 31, | |||||
| 2018 | 2017 | 2016 | 2015 | 2014 | 2013 | |
| Selected Per–Share Data | ||||||
| Net asset value, beginning of period | $9.40 | $8.14 | $7.50 | $9.08 | $9.52 | $8.75 |
| Income from Investment Operations | ||||||
| Net investment income (loss)A | .10 | .16 | .17 | .15 | .16 | .19 |
| Net realized and unrealized gain (loss) | .93 | 1.20 | .61 | (1.51) | (.46) | .84 |
| Total from investment operations | 1.03 | 1.36 | .78 | (1.36) | (.30) | 1.03 |
| Distributions from net investment income | (.17) | (.11) | (.14) | (.18) | (.14) | (.19) |
| Distributions from net realized gain | (.01) | – | – | (.04) | – | (.07) |
| Total distributions | (.18) | (.11) | (.14) | (.22) | (.14) | (.26) |
| Redemption fees added to paid in capitalA | –B | .01 | –B | –B | –B | –B |
| Net asset value, end of period | $10.25 | $9.40 | $8.14 | $7.50 | $9.08 | $9.52 |
| Total ReturnC,D | 11.04% | 17.01% | 10.69% | (15.23)% | (3.09)% | 12.05% |
| Ratios to Average Net AssetsE,F | ||||||
| Expenses before reductions | 1.28%G | 1.27% | 1.31% | 1.25% | 1.26% | 1.30% |
| Expenses net of fee waivers, if any | 1.28%G | 1.27% | 1.31% | 1.25% | 1.26% | 1.30% |
| Expenses net of all reductions | 1.25%G | 1.26% | 1.30% | 1.24% | 1.26% | 1.28% |
| Net investment income (loss) | 1.90%G | 1.77% | 2.24% | 1.88% | 1.79% | 2.15% |
| Supplemental Data | ||||||
| Net assets, end of period (000 omitted) | $7,561 | $6,891 | $5,807 | $3,478 | $5,596 | $10,231 |
| Portfolio turnover rateH | 40%G | 47% | 54% | 50% | 38% | 64% |
A Calculated based on average shares outstanding during the period.
B Amount represents less than $.005 per share.
C Total returns for periods of less than one year are not annualized.
D Total returns would have been lower if certain expenses had not been reduced during the applicable periods shown.
E Fees and expenses of any underlying Fidelity Central Funds are not included in the Fund's expense ratio. The Fund indirectly bears its proportionate share of the expenses of any underlying Fidelity Central Funds.
F Expense ratios reflect operating expenses of the class. Expenses before reductions do not reflect amounts reimbursed by the investment adviser or reductions from brokerage service arrangements or reductions from other expense offset arrangements and do not represent the amount paid by the class during periods when reimbursements or reductions occur. Expenses net of fee waivers reflect expenses after reimbursement by the investment adviser but prior to reductions from brokerage service arrangements or other expense offset arrangements. Expenses net of all reductions represent the net expenses paid by the class.
G Annualized
H Amount does not include the portfolio activity of any underlying Fidelity Central Funds.
See accompanying notes which are an integral part of the financial statements.
Notes to Financial Statements (Unaudited)
For the period ended April 30, 2018
1. Organization.
Fidelity Emerging Europe, Middle East, Africa (EMEA) Fund (the Fund) is a non-diversified fund of Fidelity Investment Trust (the Trust) and is authorized to issue an unlimited number of shares. The Trust is registered under the Investment Company Act of 1940, as amended (the 1940 Act), as an open-end management investment company organized as a Massachusetts business trust. The Fund offers Class A, Class M, Class C, Emerging Europe, Middle East, Africa (EMEA) and Class I shares, each of which has equal rights as to assets and voting privileges. Each class has exclusive voting rights with respect to matters that affect that class. The Fund's investments in emerging markets can be subject to social, economic, regulatory, and political uncertainties and can be extremely volatile.
2. Investments in Fidelity Central Funds.
The Fund invests in Fidelity Central Funds, which are open-end investment companies generally available only to other investment companies and accounts managed by the investment adviser and its affiliates. The Fund's Schedule of Investments lists each of the Fidelity Central Funds held as of period end, if any, as an investment of the Fund, but does not include the underlying holdings of each Fidelity Central Fund. As an Investing Fund, the Fund indirectly bears its proportionate share of the expenses of the underlying Fidelity Central Funds.
The Money Market Central Funds seek preservation of capital and current income and are managed by Fidelity Investments Money Management, Inc. (FIMM), an affiliate of the investment adviser. Annualized expenses of the Money Market Central Funds as of their most recent shareholder report date are less than .005%.
A complete unaudited list of holdings for each Fidelity Central Fund is available upon request or at the Securities and Exchange Commission (the SEC) website at www.sec.gov. In addition, the financial statements of the Fidelity Central Funds are available on the SEC website or upon request.
3. Significant Accounting Policies.
The Fund is an investment company and applies the accounting and reporting guidance of the Financial Accounting Standards Board (FASB) Accounting Standards Codification Topic 946 Financial Services – Investments Companies. The financial statements have been prepared in conformity with accounting principles generally accepted in the United States of America (GAAP), which require management to make certain estimates and assumptions at the date of the financial statements. Actual results could differ from those estimates. Subsequent events, if any, through the date that the financial statements were issued have been evaluated in the preparation of the financial statements. The following summarizes the significant accounting policies of the Fund:
Investment Valuation. Investments are valued as of 4:00 p.m. Eastern time on the last calendar day of the period. The Board of Trustees (the Board) has delegated the day to day responsibility for the valuation of the Fund's investments to the Fair Value Committee (the Committee) established by the Fund's investment adviser. In accordance with valuation policies and procedures approved by the Board, the Fund attempts to obtain prices from one or more third party pricing vendors or brokers to value its investments. When current market prices, quotations or currency exchange rates are not readily available or reliable, investments will be fair valued in good faith by the Committee, in accordance with procedures adopted by the Board. Factors used in determining fair value vary by investment type and may include market or investment specific events. The frequency with which these procedures are used cannot be predicted and they may be utilized to a significant extent. The Committee oversees the Fund's valuation policies and procedures and reports to the Board on the Committee's activities and fair value determinations. The Board monitors the appropriateness of the procedures used in valuing the Fund's investments and ratifies the fair value determinations of the Committee.
The Fund categorizes the inputs to valuation techniques used to value its investments into a disclosure hierarchy consisting of three levels as shown below:
- Level 1 – quoted prices in active markets for identical investments
- Level 2 – other significant observable inputs (including quoted prices for similar investments, interest rates, prepayment speeds, etc.)
- Level 3 – unobservable inputs (including the Fund's own assumptions based on the best information available)
Valuation techniques used to value the Fund's investments by major category are as follows:
Equity securities, including restricted securities, for which market quotations are readily available, are valued at the last reported sale price or official closing price as reported by a third party pricing vendor on the primary market or exchange on which they are traded and are categorized as Level 1 in the hierarchy. In the event there were no sales during the day or closing prices are not available, securities are valued at the last quoted bid price or may be valued using the last available price and are generally categorized as Level 2 in the hierarchy. For foreign equity securities, when market or security specific events arise, comparisons to the valuation of American Depositary Receipts (ADRs), futures contracts, Exchange-Traded Funds (ETFs) and certain indexes as well as quoted prices for similar securities may be used and would be categorized as Level 2 in the hierarchy. Utilizing these techniques may result in transfers between Level 1 and Level 2. For equity securities, including restricted securities, where observable inputs are limited, assumptions about market activity and risk are used and these securities may be categorized as Level 3 in the hierarchy.
Investments in open-end mutual funds, including the Fidelity Central Funds, are valued at their closing net asset value (NAV) each business day and are categorized as Level 1 in the hierarchy.
Changes in valuation techniques may result in transfers in or out of an assigned level within the disclosure hierarchy. The aggregate value of investments by input level as of April 30, 2018, including information on transfers between Levels 1 and 2, is included at the end of the Fund's Schedule of Investments.
Foreign Currency. The Fund may use foreign currency contracts to facilitate transactions in foreign-denominated securities. Gains and losses from these transactions may arise from changes in the value of the foreign currency or if the counterparties do not perform under the contracts' terms.
Foreign-denominated assets, including investment securities, and liabilities are translated into U.S. dollars at the exchange rates at period end. Purchases and sales of investment securities, income and dividends received and expenses denominated in foreign currencies are translated into U.S. dollars at the exchange rate in effect on the transaction date.
The effects of exchange rate fluctuations on investments are included with the net realized and unrealized gain (loss) on investment securities. Other foreign currency transactions resulting in realized and unrealized gain (loss) are disclosed separately.
Investment Transactions and Income. For financial reporting purposes, the Fund's investment holdings and NAV include trades executed through the end of the last business day of the period. The NAV per share for processing shareholder transactions is calculated as of the close of business of the New York Stock Exchange (NYSE), normally 4:00 p.m. Eastern time and includes trades executed through the end of the prior business day. Gains and losses on securities sold are determined on the basis of identified cost and includes proceeds received from litigation. Dividend income is recorded on the ex-dividend date, except for certain dividends from foreign securities where the ex-dividend date may have passed, which are recorded as soon as the Fund is informed of the ex-dividend date. Non-cash dividends included in dividend income, if any, are recorded at the fair market value of the securities received. Income and capital gain distributions from Fidelity Central Funds, if any, are recorded on the ex-dividend date. Investment income is recorded net of foreign taxes withheld where recovery of such taxes is uncertain.
Class Allocations and Expenses. Investment income, realized and unrealized capital gains and losses, common expenses of the Fund, and certain fund-level expense reductions, if any, are allocated daily on a pro-rata basis to each class based on the relative net assets of each class to the total net assets of the Fund. Each class differs with respect to transfer agent and distribution and service plan fees incurred. Certain expense reductions may also differ by class. For the reporting period, the allocated portion of income and expenses to each class as a percent of its average net assets may vary due to the timing of recording these transactions in relation to fluctuating net assets of the classes. Expenses directly attributable to a fund are charged to that fund. Expenses attributable to more than one fund are allocated among the respective funds on the basis of relative net assets or other appropriate methods. Expense estimates are accrued in the period to which they relate and adjustments are made when actual amounts are known.
Income Tax Information and Distributions to Shareholders. Each year, the Fund intends to qualify as a regulated investment company under Subchapter M of the Internal Revenue Code, including distributing substantially all of its taxable income and realized gains. As a result, no provision for U.S. Federal income taxes is required. The Fund files a U.S. federal tax return, in addition to state and local tax returns as required. The Fund's federal income tax returns are subject to examination by the Internal Revenue Service (IRS) for a period of three fiscal years after they are filed. State and local tax returns may be subject to examination for an additional fiscal year depending on the jurisdiction. Foreign taxes are provided for based on the Fund's understanding of the tax rules and rates that exist in the foreign markets in which it invests.
Distributions are declared and recorded on the ex-dividend date. Income and capital gain distributions are declared separately for each class. Income and capital gain distributions are determined in accordance with income tax regulations, which may differ from GAAP.
Capital accounts within the financial statements are adjusted for permanent book-tax differences. These adjustments have no impact on net assets or the results of operations. Capital accounts are not adjusted for temporary book-tax differences which will reverse in a subsequent period.
Book-tax differences are primarily due to foreign currency transactions, certain foreign taxes, passive foreign investment companies (PFIC), capital loss carryforwards and losses deferred due to wash sales.
As of period end, the cost and unrealized appreciation (depreciation) in securities, and derivatives if applicable, for federal income tax purposes as follows:
| Gross unrealized appreciation | $37,752,691 |
| Gross unrealized depreciation | (5,742,293) |
| Net unrealized appreciation (depreciation) | $32,010,398 |
| Tax cost | $82,323,945 |
Capital loss carryforwards are only available to offset future capital gains of the Fund to the extent provided by regulations and may be limited. Under the Regulated Investment Company Modernization Act of 2010 (the Act), the Fund is permitted to carry forward capital losses incurred in taxable years beginning after December 22, 2010 for an unlimited period and such capital losses are required to be used prior to any losses that expire. The capital loss carryforward information presented below, including any applicable limitation, is estimated as of prior fiscal period end and is subject to adjustment.
| Fiscal year of expiration | |
| 2018 | $(1,624,705) |
| No expiration | |
| Short-term | (2,621,070) |
| Long-term | (15,049,441) |
| Total no expiration | (17,670,511) |
| Total capital loss carryforward | $(19,295,216) |
Short-Term Trading (Redemption) Fees. Shares held by investors in the Fund less than 90 days may have been subject to a redemption fee equal to 1.50% of the NAV of shares redeemed. All redemption fees, which reduce the proceeds of the shareholder redemption, are retained by the Fund and accounted for as an addition to paid in capital. In November 2017, the Board of Trustees approved the elimination of these redemption fees effective December 18, 2017.
Restricted Securities. The Fund may invest in securities that are subject to legal or contractual restrictions on resale. These securities generally may be resold in transactions exempt from registration or to the public if the securities are registered. Disposal of these securities may involve time-consuming negotiations and expense, and prompt sale at an acceptable price may be difficult. Information regarding restricted securities is included at the end of the Fund's Schedule of Investments.
4. Purchases and Sales of Investments.
Purchases and sales of securities, other than short-term securities, aggregated $27,282,853 and $22,262,957, respectively.
5. Fees and Other Transactions with Affiliates.
Management Fee. Fidelity Management & Research Company (the investment adviser) and its affiliates provide the Fund with investment management related services for which the Fund pays a monthly management fee. The management fee is the sum of an individual fund fee rate that is based on an annual rate of .55% of the Fund's average net assets and an annualized group fee rate that averaged .24% during the period. The group fee rate is based upon the average net assets of all the mutual funds advised by the investment adviser, including any mutual funds previously advised by the investment adviser that are currently advised by Fidelity SelectCo, LLC, an affiliate of the investment adviser. The group fee rate decreases as assets under management increase and increases as assets under management decrease. For the reporting period, the total annualized management fee rate was .79% of the Fund's average net assets.
Distribution and Service Plan Fees. In accordance with Rule 12b-1 of the 1940 Act, the Fund has adopted separate Distribution and Service Plans for each class of shares. Certain classes pay Fidelity Distributors Corporation (FDC), an affiliate of the investment adviser, separate Distribution and Service Fees, each of which is based on an annual percentage of each class' average net assets. In addition, FDC may pay financial intermediaries for selling shares of the Fund and providing shareholder support services. For the period, the Distribution and Service Fee rates, total fees and amounts retained by FDC were as follows:
| Distribution Fee | Service Fee | Total Fees | Retained by FDC | |
| Class A | -% | .25% | $8,140 | $259 |
| Class M | .25% | .25% | 7,206 | 193 |
| Class C | .75% | .25% | 23,752 | 2,457 |
| $39,098 | $2,909 |
Sales Load. FDC may receive a front-end sales charge of up to 5.75% for selling Class A shares and 3.50% for selling Class M shares, some of which is paid to financial intermediaries for selling shares of the Fund. Depending on the holding period, FDC may receive contingent deferred sales charges levied on Class A, Class M and Class C redemptions. The deferred sales charges are 1.00% for Class C shares, 1.00% for certain purchases of Class A shares and .25% for certain purchases of Class M shares.
For the period, sales charge amounts retained by FDC were as follows:
| Retained by FDC | |
| Class A | $4,279 |
| Class M | 619 |
| Class C(a) | 168 |
| $5,066 |
(a) When Class C shares are initially sold, FDC pays commissions from its own resources to financial intermediaries through which the sales are made.
Transfer Agent Fees. Fidelity Investments Institutional Operations Company, Inc., (FIIOC), an affiliate of the investment adviser, is the transfer, dividend disbursing and shareholder servicing agent for each class of the Fund. FIIOC receives account fees and asset-based fees that vary according to the account size and type of account of the shareholders of the respective classes of the Fund. FIIOC pays for typesetting, printing and mailing of shareholder reports, except proxy statements.
For the period, transfer agent fees for each class were as follows:
| Amount | % of Class-Level Average Net Assets(a) | |
| Class A | $7,857 | .24 |
| Class M | 4,728 | .33 |
| Class C | 6,693 | .28 |
| Emerging Europe, Middle East, Africa (EMEA) | 109,252 | .24 |
| Class I | 6,180 | .15 |
| $134,710 |
(a) Annualized
Accounting and Security Lending Fees. Fidelity Service Company, Inc. (FSC), an affiliate of the investment adviser, maintains the Fund's accounting records. The accounting fee is based on the level of average net assets for each month. Under a separate contract, FSC administers the security lending program. The security lending fee is based on the number and duration of lending transactions. For the period, the fees were equivalent to an annualized rate of .05%.
Interfund Trades. The Fund may purchase from or sell securities to other Fidelity Funds under procedures adopted by the Board. The procedures have been designed to ensure these interfund trades are executed in accordance with Rule 17a-7 of the 1940 Act. Interfund trades are included within the respective purchases and sales amounts shown in the Purchases and Sales of Investments note.
Other. During the period, the investment adviser reimbursed the Fund for certain losses in the amount of $4,023.
6. Committed Line of Credit.
The Fund participates with other funds managed by the investment adviser or an affiliate in a $4.25 billion credit facility (the "line of credit") to be utilized for temporary or emergency purposes to fund shareholder redemptions or for other short-term liquidity purposes. The Fund has agreed to pay commitment fees on its pro-rata portion of the line of credit, which amounted to $158 and is reflected in Miscellaneous expenses on the Statement of Operations. During the period, the Fund did not borrow on this line of credit.
7. Security Lending.
The Fund lends portfolio securities through a lending agent from time to time in order to earn additional income. For equity securities, a lending agent is used and may loan securities to certain qualified borrowers, including Fidelity Capital Markets (FCM), a broker-dealer affiliated with the Fund. On the settlement date of the loan, the Fund receives collateral (in the form of U.S. Treasury obligations, letters of credit and/or cash) against the loaned securities and maintains collateral in an amount not less than 100% of the market value of the loaned securities during the period of the loan. The market value of the loaned securities is determined at the close of business of the Fund and any additional required collateral is delivered to the Fund on the next business day. The Fund or borrower may terminate the loan at any time, and if the borrower defaults on its obligation to return the securities loaned because of insolvency or other reasons, the Fund may apply collateral received from the borrower against the obligation. The Fund may experience delays and costs in recovering the securities loaned. Any cash collateral received is invested in the Fidelity Securities Lending Cash Central Fund. The value of loaned securities and cash collateral at period end are disclosed on the Fund's Statement of Assets and Liabilities. Security lending income represents the income earned on investing cash collateral, less rebates paid to borrowers and any lending agent fees associated with the loan, plus any premium payments received for lending certain types of securities. Security lending income is presented in the Statement of Operations as a component of income from Fidelity Central Funds. Total security lending income during the period amounted to $1,901. During the period, there were no securities loaned to FCM.
8. Expense Reductions.
The investment adviser voluntarily agreed to reimburse each class to the extent annual operating expenses exceeded certain levels of class-level average net assets as noted in the table below. Some expenses, for example the compensation of the independent Trustees, and certain miscellaneous expenses such as proxy and shareholder meeting expenses, are excluded from this reimbursement.
The following classes were in reimbursement during the period:
| Expense Limitations | Reimbursement | |
| Class M | 1.90% | $818 |
| Class C | 2.40% | 233 |
| $1,051 |
Commissions paid to certain brokers with whom the investment adviser, or its affiliates, places trades on behalf of the Fund include an amount in addition to trade execution, which may be rebated back to the Fund to offset certain expenses. This amount totaled $17,250 for the period.
In addition, during the period the investment adviser reimbursed and/or waived a portion of fund-level operating expenses in the amount of $521.
9. Distributions to Shareholders.
Distributions to shareholders of each class were as follows:
| Six months ended April 30, 2018 | Year ended October 31, 2017 | |
| From net investment income | ||
| Class A | $75,918 | $82,211 |
| Class M | 29,419 | 22,957 |
| Class C | 17,501 | 25,148 |
| Emerging Europe, Middle East, Africa (EMEA) | 1,323,089 | 957,314 |
| Class I | 116,252 | 79,809 |
| Total | $1,562,179 | $1,167,439 |
| From net realized gain | ||
| Class A | $4,672 | $– |
| Class M | 2,159 | – |
| Class C | 3,684 | – |
| Emerging Europe, Middle East, Africa (EMEA) | 67,418 | – |
| Class I | 5,569 | – |
| Total | $83,502 | $– |
10. Share Transactions.
Share transactions for each class were as follows and may contain automatic conversions between classes or exchanges between affiliated funds:
| Shares | Shares | Dollars | Dollars | |
| Six months ended April 30, 2018 | Year ended October 31, 2017 | Six months ended April 30, 2018 | Year ended October 31, 2017 | |
| Class A | ||||
| Shares sold | 149,657 | 288,036 | $1,625,658 | $2,454,533 |
| Reinvestment of distributions | 8,201 | 9,506 | 78,321 | 78,136 |
| Shares redeemed | (42,016) | (675,335) | (435,416) | (5,836,992) |
| Net increase (decrease) | 115,842 | (377,793) | $1,268,563 | $(3,304,323) |
| Class M | ||||
| Shares sold | 29,936 | 66,562 | $316,443 | $565,838 |
| Reinvestment of distributions | 3,314 | 2,795 | 31,578 | 22,945 |
| Shares redeemed | (16,763) | (121,397) | (178,404) | (1,049,817) |
| Net increase (decrease) | 16,487 | (52,040) | $169,617 | $(461,034) |
| Class C | ||||
| Shares sold | 54,741 | 157,368 | $578,365 | $1,360,245 |
| Reinvestment of distributions | 2,063 | 2,631 | 19,680 | 21,571 |
| Shares redeemed | (69,262) | (471,197) | (726,669) | (4,103,204) |
| Net increase (decrease) | (12,458) | (311,198) | $(128,624) | $(2,721,388) |
| Emerging Europe, Middle East, Africa (EMEA) | ||||
| Shares sold | 2,402,986 | 3,934,827 | $25,914,807 | $34,220,494 |
| Reinvestment of distributions | 134,990 | 108,986 | 1,287,802 | 895,866 |
| Shares redeemed | (1,917,207) | (4,855,547) | (19,986,524) | (42,616,730) |
| Net increase (decrease) | 620,769 | (811,734) | $7,216,085 | $(7,500,370) |
| Class I | ||||
| Shares sold | 458,489 | 791,073 | $4,858,180 | $6,865,207 |
| Reinvestment of distributions | 11,175 | 9,024 | 106,495 | 74,090 |
| Shares redeemed | (464,940) | (780,970) | (4,834,641) | (6,887,678) |
| Net increase (decrease) | 4,724 | 19,127 | $130,034 | $51,619 |
11. Other.
The Fund's organizational documents provide former and current trustees and officers with a limited indemnification against liabilities arising in connection with the performance of their duties to the Fund. In the normal course of business, the Fund may also enter into contracts that provide general indemnifications. The Fund's maximum exposure under these arrangements is unknown as this would be dependent on future claims that may be made against the Fund. The risk of material loss from such claims is considered remote.
Shareholder Expense Example
As a shareholder of the Fund, you incur two types of costs: (1) transaction costs, including sales charges (loads) on purchase payments or redemption proceeds, redemption fees and (2) ongoing costs, including management fees, distribution and/or service (12b-1) fees and other Fund expenses. This Example is intended to help you understand your ongoing costs (in dollars) of investing in the Fund and to compare these costs with the ongoing costs of investing in other mutual funds.
The Example is based on an investment of $1,000 invested at the beginning of the period and held for the entire period (November 1, 2017 to April 30, 2018).
Actual Expenses
The first line of the accompanying table for each class of the Fund provides information about actual account values and actual expenses. You may use the information in this line, together with the amount you invested, to estimate the expenses that you paid over the period. Simply divide your account value by $1,000.00 (for example, an $8,600 account value divided by $1,000.00 = 8.6), then multiply the result by the number in the first line for a class of the Fund under the heading entitled "Expenses Paid During Period" to estimate the expenses you paid on your account during this period. A small balance maintenance fee of $12.00 that is charged once a year may apply for certain accounts with a value of less than $2,000. This fee is not included in the table below. If it was, the estimate of expenses you paid during the period would be higher, and your ending account value lower, by this amount. In addition, the Fund, as a shareholder in the underlying Fidelity Central Funds, will indirectly bear its pro-rata share of the fees and expenses incurred by the underlying Fidelity Central Funds. These fees and expenses are not included in the Fund's annualized expense ratio used to calculate the expense estimate in the table below.
Hypothetical Example for Comparison Purposes
The second line of the accompanying table for each class of the Fund provides information about hypothetical account values and hypothetical expenses based on a Class' actual expense ratio and an assumed rate of return of 5% per year before expenses, which is not the Class' actual return. The hypothetical account values and expenses may not be used to estimate the actual ending account balance or expenses you paid for the period. You may use this information to compare the ongoing costs of investing in the Fund and other funds. To do so, compare this 5% hypothetical example with the 5% hypothetical examples that appear in the shareholder reports of the other funds. A small balance maintenance fee of $12.00 that is charged once a year may apply for certain accounts with a value of less than $2,000. This fee is not included in the table below. If it was, the estimate of expenses you paid during the period would be higher, and your ending account value lower, by this amount. In addition, the Fund, as a shareholder in the underlying Fidelity Central Funds, will indirectly bear its pro-rata share of the fees and expenses incurred by the underlying Fidelity Central Funds. These fees and expenses are not included in the Fund's annualized expense ratio used to calculate the expense estimate in the table below.
Please note that the expenses shown in the table are meant to highlight your ongoing costs only and do not reflect any transaction costs. Therefore, the second line of the table is useful in comparing ongoing costs only, and will not help you determine the relative total costs of owning different funds. In addition, if these transactional costs were included, your costs would have been higher.
| Annualized Expense Ratio-A | Beginning Account Value November 1, 2017 | Ending Account Value April 30, 2018 | Expenses Paid During Period-B November 1, 2017 to April 30, 2018 | |
| Class A | 1.62% | |||
| Actual | $1,000.00 | $1,108.40 | $8.47 | |
| Hypothetical-C | $1,000.00 | $1,016.76 | $8.10 | |
| Class M | 1.90% | |||
| Actual | $1,000.00 | $1,106.50 | $9.92 | |
| Hypothetical-C | $1,000.00 | $1,015.37 | $9.49 | |
| Class C | 2.40% | |||
| Actual | $1,000.00 | $1,104.20 | $12.52 | |
| Hypothetical-C | $1,000.00 | $1,012.89 | $11.98 | |
| Emerging Europe, Middle East, Africa (EMEA) | 1.36% | |||
| Actual | $1,000.00 | $1,110.30 | $7.12 | |
| Hypothetical-C | $1,000.00 | $1,018.05 | $6.81 | |
| Class I | 1.28% | |||
| Actual | $1,000.00 | $1,110.40 | $6.70 | |
| Hypothetical-C | $1,000.00 | $1,018.45 | $6.41 |
A Annualized expense ratio reflects expenses net of applicable fee waivers.
B Expenses are equal to each Class' annualized expense ratio, multiplied by the average account value over the period, multiplied by 181/365 (to reflect the one-half year period).
C 5% return per year before expenses
![]()
Corporate Headquarters
245 Summer St.
Boston, MA 02210
www.fidelity.com
EME-SANN-0618
1.861975.109
Fidelity® Series Emerging Markets Opportunities Fund (formerly Fidelity® Series Emerging Markets Fund) Fidelity® Series International Growth Fund Fidelity® Series International Small Cap Fund Fidelity® Series International Value Fund Semi-Annual Report April 30, 2018 |
|
Contents
Fidelity® Series Emerging Markets Opportunities Fund | |
Fidelity® Series International Growth Fund | |
Fidelity® Series International Small Cap Fund | |
Fidelity® Series International Value Fund | |
To view a fund's proxy voting guidelines and proxy voting record for the 12-month period ended June 30, visit http://www.fidelity.com/proxyvotingresults or visit the Securities and Exchange Commission's (SEC) web site at http://www.sec.gov.
You may also call 1-800-544-8544 to request a free copy of the proxy voting guidelines.
Standard & Poor's, S&P and S&P 500 are registered service marks of The McGraw-Hill Companies, Inc. and have been licensed for use by Fidelity Distributors Corporation.
Other third-party marks appearing herein are the property of their respective owners.
All other marks appearing herein are registered or unregistered trademarks or service marks of FMR LLC or an affiliated company. © 2018 FMR LLC. All rights reserved.
This report and the financial statements contained herein are submitted for the general information of the shareholders of the Funds. This report is not authorized for distribution to prospective investors in the Funds unless preceded or accompanied by an effective prospectus.
A fund files its complete schedule of portfolio holdings with the SEC for the first and third quarters of each fiscal year on Form N-Q. Forms N-Q are available on the SEC’s web site at http://www.sec.gov. A fund's Forms N-Q may be reviewed and copied at the SEC’s Public Reference Room in Washington, DC. Information regarding the operation of the SEC's Public Reference Room may be obtained by calling 1-800-SEC-0330.
For a complete list of a fund's portfolio holdings, view the most recent holdings listing, semiannual report, or annual report on Fidelity's web site at http://www.fidelity.com, http://www.institutional.fidelity.com, or http://www.401k.com, as applicable.
NOT FDIC INSURED •MAY LOSE VALUE •NO BANK GUARANTEE
Neither the Funds nor Fidelity Distributors Corporation is a bank.
Fidelity® Series Emerging Markets Opportunities Fund
Investment Summary (Unaudited)
Geographic Diversification (% of fund's net assets)
| As of April 30, 2018 | ||
| Cayman Islands | 18.7% | |
| Korea (South) | 11.7% | |
| Brazil | 9.0% | |
| India | 8.6% | |
| China | 8.6% | |
| South Africa | 8.1% | |
| Taiwan | 5.6% | |
| Hong Kong | 4.7% | |
| Russia | 4.3% | |
| Other* | 20.7% | |
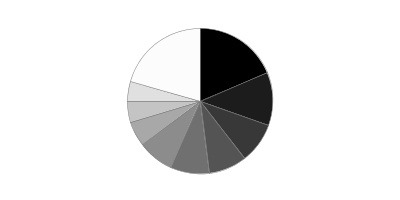
* Includes Short-Term investments and Net Other Assets (Liabilities).
Percentages are based on country or territory of incorporation and are adjusted for the effect of futures contracts, if applicable.
Asset Allocation as of April 30, 2018
| % of fund's net assets | |
| Stocks and Equity Futures | 98.5 |
| Short-Term Investments and Net Other Assets (Liabilities) | 1.5 |
Top Ten Stocks as of April 30, 2018
| % of fund's net assets | |
| Tencent Holdings Ltd. (Cayman Islands, Internet Software & Services) | 6.2 |
| Alibaba Group Holding Ltd. sponsored ADR (Cayman Islands, Internet Software & Services) | 4.0 |
| Taiwan Semiconductor Manufacturing Co. Ltd. (Taiwan, Semiconductors & Semiconductor Equipment) | 3.0 |
| Naspers Ltd. Class N (South Africa, Media) | 2.8 |
| Industrial & Commercial Bank of China Ltd. (H Shares) (China, Banks) | 2.7 |
| JD.com, Inc. sponsored ADR (Cayman Islands, Internet & Direct Marketing Retail) | 2.4 |
| Sberbank of Russia (Russia, Banks) | 1.9 |
| China Literature Ltd. (Cayman Islands, Media) | 1.7 |
| Itau Unibanco Holding SA sponsored ADR (Brazil, Banks) | 1.4 |
| Vale SA sponsored ADR (Brazil, Metals & Mining) | 1.3 |
| 27.4 |
Top Market Sectors as of April 30, 2018
| % of fund's net assets | |
| Financials | 23.5 |
| Information Technology | 21.8 |
| Consumer Discretionary | 15.2 |
| Materials | 8.4 |
| Energy | 6.9 |
| Consumer Staples | 6.5 |
| Industrials | 4.2 |
| Telecommunication Services | 3.9 |
| Utilities | 2.7 |
| Real Estate | 2.7 |
Fidelity® Series Emerging Markets Opportunities Fund
Schedule of Investments April 30, 2018 (Unaudited)
Showing Percentage of Net Assets
| Common Stocks - 90.7% | |||
| Shares | Value | ||
| Argentina - 0.7% | |||
| Central Puerto SA sponsored ADR (a) | 1,230,700 | $19,038,929 | |
| Grupo Superveille SA sponsored ADR | 845,572 | 23,625,282 | |
| Telecom Argentina SA Class B sponsored ADR | 691,234 | 20,764,669 | |
| YPF SA Class D sponsored ADR | 1,774,000 | 38,832,860 | |
| TOTAL ARGENTINA | 102,261,740 | ||
| Australia - 0.1% | |||
| Frontier Digital Ventures Ltd. (a)(b) | 14,419,658 | 7,042,134 | |
| Bermuda - 1.1% | |||
| AGTech Holdings Ltd. (a) | 53,392,000 | 5,816,848 | |
| China Resource Gas Group Ltd. | 9,552,000 | 35,128,500 | |
| Credicorp Ltd. (United States) | 273,640 | 63,618,564 | |
| GP Investments Ltd. Class A (depositary receipt) (a)(b) | 7,634,637 | 10,918,455 | |
| Shangri-La Asia Ltd. | 24,304,000 | 47,298,401 | |
| TOTAL BERMUDA | 162,780,768 | ||
| Brazil - 3.9% | |||
| Azul SA sponsored ADR | 1,279,500 | 39,664,500 | |
| B2W Companhia Global do Varejo (a) | 13,529,902 | 111,616,284 | |
| Banco do Brasil SA | 6,794,600 | 71,181,154 | |
| BTG Pactual Participations Ltd. unit | 3,396,900 | 21,700,908 | |
| Companhia de Saneamento de Minas Gerais | 2,745,970 | 39,505,848 | |
| Cosan SA Industria e Comercio | 703,300 | 7,986,205 | |
| Direcional Engenharia SA (a)(b) | 12,916,500 | 22,454,180 | |
| Localiza Rent A Car SA | 4,617,370 | 36,760,233 | |
| Petrobras Distribuidora SA | 4,836,000 | 31,695,182 | |
| Vale SA sponsored ADR | 13,783,270 | 190,760,457 | |
| TOTAL BRAZIL | 573,324,951 | ||
| British Virgin Islands - 0.7% | |||
| Despegar.com Corp. (c) | 663,900 | 19,492,104 | |
| Mail.Ru Group Ltd. GDR (Reg. S) (a) | 2,738,000 | 86,520,800 | |
| TOTAL BRITISH VIRGIN ISLANDS | 106,012,904 | ||
| Canada - 0.3% | |||
| Pan American Silver Corp. | 2,608,500 | 42,049,020 | |
| Cayman Islands - 18.4% | |||
| 58.com, Inc. ADR (a) | 1,244,818 | 108,784,645 | |
| Alibaba Group Holding Ltd. sponsored ADR (a) | 3,309,906 | 590,950,617 | |
| Bilibili, Inc. ADR (a)(c) | 656,198 | 7,165,682 | |
| BizLink Holding, Inc. | 1,226,617 | 9,041,799 | |
| China Biologic Products Holdings, Inc. | 206,800 | 17,964,716 | |
| China Literature Ltd. (a)(c)(d) | 30,109,101 | 242,531,962 | |
| China Resources Land Ltd. | 14,276,000 | 53,616,779 | |
| ENN Energy Holdings Ltd. | 2,550,000 | 23,846,405 | |
| Haitian International Holdings Ltd. | 12,133,000 | 32,289,579 | |
| JD.com, Inc. sponsored ADR (a) | 9,440,804 | 344,683,754 | |
| Kingsoft Corp. Ltd. | 18,527,000 | 55,013,617 | |
| Momo, Inc. ADR (a) | 1,440,629 | 50,277,952 | |
| NetEase, Inc. ADR | 412,600 | 106,067,082 | |
| Ping An Healthcare and Technology Co. Ltd. (a) | 604,900 | 4,223,468 | |
| Secoo Holding Ltd. ADR (c) | 384,990 | 3,996,196 | |
| Shimao Property Holdings Ltd. | 15,455,000 | 40,879,489 | |
| Tencent Holdings Ltd. | 18,495,399 | 909,287,962 | |
| Uni-President China Holdings Ltd. | 74,633,000 | 70,552,994 | |
| Vipshop Holdings Ltd. ADR (a) | 503,800 | 7,798,824 | |
| Yirendai Ltd. sponsored ADR (c) | 328,899 | 11,600,268 | |
| TOTAL CAYMAN ISLANDS | 2,690,573,790 | ||
| Chile - 1.3% | |||
| Compania Cervecerias Unidas SA sponsored ADR (c) | 2,002,100 | 55,298,002 | |
| Enersis SA | 89,067,456 | 20,329,731 | |
| Inversiones La Construccion SA | 1,119,954 | 22,185,081 | |
| Sociedad Quimica y Minera de Chile SA (PN-B) sponsored ADR (c) | 341,700 | 18,755,913 | |
| Vina Concha y Toro SA | 34,096,719 | 77,826,084 | |
| TOTAL CHILE | 194,394,811 | ||
| China - 8.6% | |||
| Anhui Conch Cement Co. Ltd. (H Shares) | 4,306,000 | 26,875,817 | |
| BBMG Corp. (H Shares) | 67,969,500 | 31,001,454 | |
| China International Travel Service Corp. Ltd. (A Shares) | 5,106,000 | 41,742,685 | |
| China Life Insurance Co. Ltd. (H Shares) | 50,383,900 | 142,886,729 | |
| China Longyuan Power Grid Corp. Ltd. (H Shares) | 81,675,810 | 80,223,634 | |
| China Oilfield Services Ltd. (H Shares) | 37,124,000 | 37,038,462 | |
| China Pacific Insurance (Group) Co. Ltd. (H Shares) | 20,645,894 | 91,103,694 | |
| China Petroleum & Chemical Corp. (H Shares) | 104,424,000 | 101,694,296 | |
| China Telecom Corp. Ltd. (H Shares) | 138,930,882 | 67,344,239 | |
| Hangzhou Hikvision Digital Technology Co. Ltd. Class A | 3,204,082 | 19,406,747 | |
| Industrial & Commercial Bank of China Ltd. (H Shares) | 449,279,400 | 394,414,126 | |
| PICC Property & Casualty Co. Ltd. (H Shares) | 19,854,500 | 35,542,919 | |
| Qingdao Haier Co. Ltd. | 13,773,537 | 37,206,124 | |
| Shanghai International Airport Co. Ltd. (A Shares) | 6,183,698 | 48,567,653 | |
| Shenzhen Inovance Technology Co. Ltd. Class A | 3,274,116 | 16,943,010 | |
| Tsingtao Brewery Co. Ltd. (H Shares) | 10,682,000 | 55,304,942 | |
| Zhengzhou Yutong Bus Co. Ltd. | 8,851,451 | 28,595,930 | |
| TOTAL CHINA | 1,255,892,461 | ||
| Cyprus - 0.0% | |||
| Etalon Group PLC GDR (Reg. S) | 1,203,326 | 3,429,479 | |
| Egypt - 0.0% | |||
| Six of October Development & Investment Co. (a) | 4,068,500 | 6,155,176 | |
| Greece - 0.5% | |||
| Titan Cement Co. SA (Reg.) | 2,875,700 | 75,878,393 | |
| Hong Kong - 4.7% | |||
| China Overseas Land and Investment Ltd. | 26,371,000 | 88,359,505 | |
| China Resources Beer Holdings Co. Ltd. | 29,836,666 | 128,504,384 | |
| China Resources Power Holdings Co. Ltd. | 14,126,397 | 27,096,038 | |
| China Unicom Ltd. | 26,447,000 | 37,397,355 | |
| China Unicom Ltd. sponsored ADR (a)(c) | 4,745,000 | 66,572,350 | |
| CNOOC Ltd. | 69,558,000 | 117,672,222 | |
| CSPC Pharmaceutical Group Ltd. | 31,918,000 | 81,297,020 | |
| Far East Horizon Ltd. | 108,734,750 | 107,896,158 | |
| Techtronic Industries Co. Ltd. | 5,879,500 | 34,443,238 | |
| TOTAL HONG KONG | 689,238,270 | ||
| India - 8.6% | |||
| Adani Ports & Special Economic Zone Ltd. | 8,093,250 | 49,507,113 | |
| Axis Bank Ltd. | 8,711,369 | 67,534,523 | |
| Axis Bank Ltd. GDR (Reg. S) | 109,427 | 4,234,825 | |
| Bharat Petroleum Corp. Ltd. | 8,409,103 | 48,860,457 | |
| Bharti Airtel Ltd. | 6,266,398 | 38,481,303 | |
| Bharti Infratel Ltd. | 5,596,893 | 26,341,250 | |
| Federal Bank Ltd. | 34,387,389 | 50,643,164 | |
| Future Retail Ltd. | 1,797,997 | 16,245,992 | |
| ICICI Bank Ltd. | 8,365,328 | 35,750,846 | |
| ICICI Bank Ltd. sponsored ADR | 8,972,570 | 76,356,571 | |
| Indraprastha Gas Ltd. | 7,122,826 | 30,719,883 | |
| InterGlobe Aviation Ltd. (d) | 1,351,840 | 28,462,828 | |
| ITC Ltd. | 13,179,690 | 55,697,442 | |
| JK Cement Ltd. | 2,290,331 | 34,404,714 | |
| Larsen & Toubro Ltd. | 2,954,433 | 62,107,133 | |
| LIC Housing Finance Ltd. | 9,786,202 | 80,122,184 | |
| Lupin Ltd. (a) | 4,472,654 | 54,476,957 | |
| Manappuram General Finance & Leasing Ltd. | 19,123,356 | 34,990,844 | |
| Petronet LNG Ltd. | 8,287,338 | 28,215,868 | |
| Phoenix Mills Ltd. (a) | 5,763,289 | 54,049,064 | |
| Power Grid Corp. of India Ltd. | 8,161,223 | 25,468,927 | |
| Reliance Industries Ltd. | 11,424,669 | 164,953,935 | |
| SREI Infrastructure Finance Ltd. (b) | 34,355,610 | 44,008,512 | |
| State Bank of India | 17,674,440 | 65,305,043 | |
| Sun Pharmaceutical Industries Ltd. | 9,832,184 | 78,001,145 | |
| Tejas Networks Ltd. (d) | 950,220 | 4,767,202 | |
| TOTAL INDIA | 1,259,707,725 | ||
| Indonesia - 2.3% | |||
| PT Astra International Tbk | 113,885,800 | 58,289,820 | |
| PT Bank Mandiri (Persero) Tbk | 103,337,700 | 52,346,192 | |
| PT Bank Rakyat Indonesia Tbk | 361,034,100 | 83,243,083 | |
| PT Indocement Tunggal Prakarsa Tbk | 15,238,200 | 19,284,119 | |
| PT Kalbe Farma Tbk | 176,378,200 | 19,040,825 | |
| PT Link Net Tbk | 17,059,571 | 6,644,879 | |
| PT Media Nusantara Citra Tbk | 305,976,800 | 28,947,404 | |
| PT Perusahaan Gas Negara Tbk Series B | 33,905,400 | 4,799,448 | |
| PT Semen Gresik (Persero) Tbk | 54,924,300 | 37,935,395 | |
| PT Telekomunikasi Indonesia Tbk Series B | 112,297,800 | 30,643,215 | |
| TOTAL INDONESIA | 341,174,380 | ||
| Israel - 0.2% | |||
| Bezeq The Israel Telecommunication Corp. Ltd. | 20,789,637 | 26,237,245 | |
| Italy - 0.5% | |||
| Prada SpA | 15,413,100 | 78,204,612 | |
| Japan - 0.7% | |||
| GMO Internet, Inc. | 342,400 | 6,311,160 | |
| Panasonic Corp. | 1,918,100 | 28,401,594 | |
| Renesas Electronics Corp. (a) | 1,207,800 | 12,683,447 | |
| SoftBank Corp. | 310,500 | 23,724,904 | |
| Sumco Corp. | 1,008,500 | 24,926,518 | |
| TOTAL JAPAN | 96,047,623 | ||
| Korea (South) - 9.6% | |||
| AMOREPACIFIC Group, Inc. | 632,472 | 84,453,623 | |
| BS Financial Group, Inc. | 13,952,576 | 136,148,114 | |
| Coway Co. Ltd. | 408,075 | 33,341,796 | |
| Daou Technology, Inc. (b) | 3,046,123 | 68,691,898 | |
| Hanon Systems | 2,717,112 | 27,655,084 | |
| Hyundai Fire & Marine Insurance Co. Ltd. | 1,300,094 | 46,435,180 | |
| Hyundai Mobis | 523,966 | 121,337,692 | |
| Iljin Materials Co. Ltd. | 536,815 | 16,767,245 | |
| InterPark INT Corp. (b) | 3,076,471 | 25,337,418 | |
| KB Financial Group, Inc. | 2,687,873 | 152,301,740 | |
| KEPCO Plant Service & Engineering Co. Ltd. | 435,539 | 20,619,397 | |
| Korea Electric Power Corp. | 289,896 | 10,113,852 | |
| Korean Reinsurance Co. | 2,015,677 | 22,209,761 | |
| KT Corp. | 270,996 | 6,871,800 | |
| KT Corp. sponsored ADR | 313,200 | 4,206,276 | |
| LG Chemical Ltd. | 267,962 | 90,077,568 | |
| LG Corp. | 577,647 | 43,744,587 | |
| NAVER Corp. | 37,063 | 24,779,614 | |
| POSCO | 250,657 | 86,134,728 | |
| Samsung Electronics Co. Ltd. | 16,900 | 41,878,200 | |
| Samsung Life Insurance Co. Ltd. | 416,750 | 45,530,499 | |
| Samsung SDI Co. Ltd. | 539,199 | 92,390,239 | |
| Shinhan Financial Group Co. Ltd. | 3,034,161 | 134,738,383 | |
| SK Hynix, Inc. | 803,060 | 63,364,447 | |
| TOTAL KOREA (SOUTH) | 1,399,129,141 | ||
| Luxembourg - 0.5% | |||
| Samsonite International SA | 15,692,100 | 70,782,267 | |
| Mauritius - 0.1% | |||
| MakeMyTrip Ltd. (a)(c) | 534,796 | 19,733,972 | |
| Mexico - 1.8% | |||
| America Movil S.A.B. de CV Series L sponsored ADR | 1,213,100 | 22,430,219 | |
| Grupo Aeroportuario del Pacifico S.A.B. de CV Series B | 2,977,600 | 30,973,198 | |
| Grupo Financiero Banorte S.A.B. de CV Series O | 10,534,918 | 65,917,699 | |
| Macquarie Mexican (REIT) (b)(d) | 41,033,921 | 43,793,972 | |
| Promotora y Operadora de Infraestructura S.A.B. de CV | 2,449,700 | 25,102,088 | |
| Wal-Mart de Mexico SA de CV Series V | 26,830,500 | 74,557,660 | |
| TOTAL MEXICO | 262,774,836 | ||
| Netherlands - 1.1% | |||
| VEON Ltd. sponsored ADR (c) | 11,377,320 | 31,287,630 | |
| Yandex NV Series A (a) | 3,941,080 | 131,474,429 | |
| TOTAL NETHERLANDS | 162,762,059 | ||
| Nigeria - 0.6% | |||
| Guaranty Trust Bank PLC | 101,802,322 | 12,725,290 | |
| Guaranty Trust Bank PLC GDR (Reg. S) | 3,878,704 | 24,241,900 | |
| Transnational Corp. of Nigeria PLC | 1,235,285,783 | 5,833,294 | |
| Zenith Bank PLC | 523,819,093 | 39,941,206 | |
| TOTAL NIGERIA | 82,741,690 | ||
| Pakistan - 0.3% | |||
| Habib Bank Ltd. | 27,063,400 | 45,593,528 | |
| Panama - 0.3% | |||
| Copa Holdings SA Class A | 324,800 | 38,056,816 | |
| Peru - 0.4% | |||
| Compania de Minas Buenaventura SA sponsored ADR | 3,745,100 | 59,734,345 | |
| Philippines - 0.9% | |||
| International Container Terminal Services, Inc. | 9,866,630 | 16,117,415 | |
| Metro Pacific Investments Corp. | 90,504,000 | 8,914,926 | |
| Metropolitan Bank & Trust Co. | 42,813,962 | 70,230,660 | |
| Robinsons Land Corp. | 87,676,931 | 30,283,998 | |
| TOTAL PHILIPPINES | 125,546,999 | ||
| Russia - 4.3% | |||
| Lukoil PJSC sponsored ADR | 1,842,600 | 123,085,680 | |
| MMC Norilsk Nickel PJSC sponsored ADR | 5,857,300 | 100,716,274 | |
| Mobile TeleSystems OJSC | 1,687,400 | 7,971,235 | |
| Mobile TeleSystems OJSC sponsored ADR | 386,700 | 4,060,350 | |
| NOVATEK OAO GDR (Reg. S) | 435,500 | 55,308,500 | |
| RusHydro PJSC | 869,194,900 | 10,283,063 | |
| Sberbank of Russia | 31,948,600 | 113,880,628 | |
| Sberbank of Russia sponsored ADR | 10,460,594 | 155,862,851 | |
| Tatneft PAO | 3,534,100 | 37,660,214 | |
| Unipro PJSC | 491,217,196 | 21,654,197 | |
| TOTAL RUSSIA | 630,482,992 | ||
| Singapore - 0.2% | |||
| First Resources Ltd. | 24,365,000 | 30,981,698 | |
| South Africa - 8.1% | |||
| Aspen Pharmacare Holdings Ltd. | 2,523,982 | 54,421,256 | |
| Barclays Africa Group Ltd. | 6,594,926 | 96,597,689 | |
| Bidvest Group Ltd. | 2,910,245 | 57,009,253 | |
| FirstRand Ltd. | 16,031,200 | 85,855,522 | |
| Imperial Holdings Ltd. | 6,506,800 | 125,165,434 | |
| Life Healthcare Group Holdings Ltd. | 16,984,500 | 40,037,275 | |
| Mr Price Group Ltd. | 2,288,000 | 50,207,547 | |
| MTN Group Ltd. | 5,533,900 | 55,542,102 | |
| Naspers Ltd. Class N | 1,664,100 | 405,407,314 | |
| Nedbank Group Ltd. | 2,035,200 | 48,535,477 | |
| Sasol Ltd. | 2,213,500 | 79,126,795 | |
| Tiger Brands Ltd. | 2,721,100 | 85,043,624 | |
| TOTAL SOUTH AFRICA | 1,182,949,288 | ||
| Taiwan - 5.6% | |||
| Advantech Co. Ltd. | 1,495,795 | 10,250,441 | |
| Chroma ATE, Inc. | 4,125,000 | 20,704,750 | |
| GlobalWafers Co. Ltd. | 4,107,300 | 66,143,830 | |
| King's Town Bank | 20,419,000 | 24,414,716 | |
| LandMark Optoelectronics Corp. | 2,603,446 | 24,238,809 | |
| Largan Precision Co. Ltd. | 649,900 | 75,454,843 | |
| MediaTek, Inc. | 1,037,000 | 11,773,537 | |
| Nanya Technology Corp. | 8,960,000 | 27,842,016 | |
| PChome Online, Inc. | 1,521,613 | 7,035,934 | |
| Taiwan Semiconductor Manufacturing Co. Ltd. | 45,685,284 | 347,384,036 | |
| Taiwan Semiconductor Manufacturing Co. Ltd. sponsored ADR | 2,124,701 | 81,694,753 | |
| Unified-President Enterprises Corp. | 33,951,000 | 81,563,979 | |
| United Microelectronics Corp. | 64,080,000 | 34,495,357 | |
| Universal Cement Corp. | 17,213,931 | 12,753,214 | |
| TOTAL TAIWAN | 825,750,215 | ||
| Thailand - 1.1% | |||
| PTT Global Chemical PCL (For. Reg.) | 30,326,100 | 93,696,397 | |
| Siam Cement PCL (For. Reg.) | 4,069,100 | 60,170,447 | |
| TOTAL THAILAND | 153,866,844 | ||
| Turkey - 1.4% | |||
| Bim Birlesik Magazalar A/S JSC | 2,661,000 | 45,167,758 | |
| Tupras Turkiye Petrol Rafinerileri A/S | 2,141,796 | 54,571,745 | |
| Turkcell Iletisim Hizmet A/S | 13,260,000 | 45,569,927 | |
| Turkcell Iletisim Hizmet A/S sponsored ADR (c) | 486,200 | 4,205,630 | |
| Turkiye Garanti Bankasi A/S | 22,916,000 | 51,957,451 | |
| TOTAL TURKEY | 201,472,511 | ||
| United Arab Emirates - 1.2% | |||
| DP World Ltd. | 1,867,270 | 41,546,758 | |
| Emaar Properties PJSC | 43,319,718 | 68,285,033 | |
| National Bank of Abu Dhabi PJSC | 19,782,981 | 66,784,358 | |
| TOTAL UNITED ARAB EMIRATES | 176,616,149 | ||
| United Kingdom - 0.2% | |||
| Fresnillo PLC | 1,650,000 | 28,962,326 | |
| United States of America - 0.4% | |||
| MercadoLibre, Inc. | 182,650 | 62,029,767 | |
| TOTAL COMMON STOCKS | |||
| (Cost $9,872,868,247) | 13,270,372,925 | ||
| Preferred Stocks - 7.5% | |||
| Convertible Preferred Stocks - 0.3% | |||
| Cayman Islands - 0.3% | |||
| China Internet Plus Holdings Ltd. Series A-11 (a)(e)(f) | 7,577,282 | 42,349,884 | |
| Nonconvertible Preferred Stocks - 7.2% | |||
| Brazil - 5.1% | |||
| Ambev SA sponsored ADR | 15,438,900 | 102,205,518 | |
| Banco do Estado Rio Grande do Sul SA | 6,166,586 | 35,363,871 | |
| Companhia Paranaense de Energia-Copel: | |||
| (PN-B) | 106,400 | 813,672 | |
| (PN-B) sponsored ADR (c) | 5,823,721 | 44,667,940 | |
| Fibria Celulose SA sponsored ADR | 4,186,200 | 81,882,072 | |
| Itau Unibanco Holding SA sponsored ADR | 14,417,094 | 209,480,376 | |
| Metalurgica Gerdau SA (PN) | 24,411,522 | 54,492,493 | |
| Petroleo Brasileiro SA - Petrobras (PN) sponsored ADR (non-vtg.) (a) | 13,146,800 | 172,880,420 | |
| Telefonica Brasil SA | 3,483,900 | 48,869,276 | |
| 750,655,638 | |||
| Korea (South) - 2.1% | |||
| Hyundai Motor Co. Series 2 | 1,340,620 | 143,960,875 | |
| Samsung Electronics Co. Ltd. | 54,016 | 106,627,584 | |
| Samsung Fire & Marine Insurance Co. Ltd. | 304,152 | 52,115,594 | |
| 302,704,053 | |||
| TOTAL NONCONVERTIBLE PREFERRED STOCKS | 1,053,359,691 | ||
| TOTAL PREFERRED STOCKS | |||
| (Cost $696,538,666) | 1,095,709,575 | ||
| Principal Amount | Value | ||
| Government Obligations - 0.0% | |||
| United States of America - 0.0% | |||
| U.S. Treasury Bills, yield at date of purchase 1.48% to 1.69% 5/10/18 to 7/5/18 (Cost $4,023,016)(g) | 4,030,000 | 4,022,875 | |
| Shares | Value | ||
| Money Market Funds - 2.4% | |||
| Fidelity Cash Central Fund, 1.74% (h) | 242,757,777 | 242,806,329 | |
| Fidelity Securities Lending Cash Central Fund 1.74% (h)(i) | 103,851,303 | 103,861,688 | |
| TOTAL MONEY MARKET FUNDS | |||
| (Cost $346,668,016) | 346,668,017 | ||
| TOTAL INVESTMENT IN SECURITIES - 100.6% | |||
| (Cost $10,920,097,945) | 14,716,773,392 | ||
| NET OTHER ASSETS (LIABILITIES) - (0.6)% | (90,545,436) | ||
| NET ASSETS - 100% | $14,626,227,956 |
| Futures Contracts | |||||
| Number of contracts | Expiration Date | Notional Amount | Value | Unrealized Appreciation/(Depreciation) | |
| Purchased | |||||
| Equity Index Contracts | |||||
| ICE E-mini MSCI Emerging Markets Index Contracts (United States) | 665 | June 2018 | $38,310,650 | $(323,528) | $(323,528) |
The notional amount of futures purchased as a percentage of Net Assets is 0.3%
Categorizations in the Schedule of Investments are based on country or territory of incorporation.
Legend
(a) Non-income producing
(b) Affiliated company
(c) Security or a portion of the security is on loan at period end.
(d) Security exempt from registration under Rule 144A of the Securities Act of 1933. These securities may be resold in transactions exempt from registration, normally to qualified institutional buyers. At the end of the period, the value of these securities amounted to $319,555,964 or 2.2% of net assets.
(e) Restricted securities - Investment in securities not registered under the Securities Act of 1933 (excluding 144A issues). At the end of the period, the value of restricted securities (excluding 144A issues) amounted to $42,349,884 or 0.3% of net assets.
(f) Level 3 security
(g) Security or a portion of the security was pledged to cover margin requirements for futures contracts. At period end, the value of securities pledged amounted to $1,826,410.
(h) Affiliated fund that is generally available only to investment companies and other accounts managed by Fidelity Investments. The rate quoted is the annualized seven-day yield of the fund at period end. A complete unaudited listing of the fund's holdings as of its most recent quarter end is available upon request. In addition, each Fidelity Central Fund's financial statements are available on the SEC's website or upon request.
(i) Investment made with cash collateral received from securities on loan.
Additional information on each restricted holding is as follows:
| Security | Acquisition Date | Acquisition Cost |
| China Internet Plus Holdings Ltd. Series A-11 | 1/26/15 | $23,950,652 |
Affiliated Central Funds
Information regarding fiscal year to date income earned by the Fund from investments in Fidelity Central Funds is as follows:
| Fund | Income earned |
| Fidelity Cash Central Fund | $1,154,903 |
| Fidelity Securities Lending Cash Central Fund | 956,248 |
| Total | $2,111,151 |
Amounts in the income column in the above table include any capital gain distributions from underlying funds, which are presented in the corresponding line-item in the Statement of Operations if applicable.
Other Affiliated Issuers
An affiliated company is a company in which the Fund has ownership of at least 5% of the voting securities. Fiscal year to date transactions with companies which are or were affiliates are as follows:
| Affiliate | Value, beginning of period | Purchases | Sales Proceeds | Dividend Income | Realized Gain (loss) | Change in Unrealized appreciation (depreciation) | Value, end of period |
| B2W Companhia Global do Varejo | $176,861,949 | $-- | $88,652,364 | $-- | $37,188,355 | $(13,781,656) | $-- |
| Daou Technology, Inc. | 49,992,717 | -- | -- | 709,232 | -- | 18,699,181 | 68,691,898 |
| Direcional Engenharia SA | 24,131,764 | -- | 1,096,605 | -- | (173,367) | (407,612) | 22,454,180 |
| Frontier Digital Ventures Ltd. | 7,489,111 | -- | 366,385 | -- | 122,415 | (203,007) | 7,042,134 |
| GP Investments Ltd. Class A (depositary receipt) | 13,652,868 | -- | -- | -- | -- | (2,734,413) | 10,918,455 |
| InterPark INT Corp. | 25,671,882 | -- | -- | 358,643 | -- | (334,464) | 25,337,418 |
| Macquarie Mexican (REIT) | 73,579,884 | -- | 22,629,626 | 2,037,554 | (12,763,210) | 5,606,924 | 43,793,972 |
| SREI Infrastructure Finance Ltd. | 60,858,509 | -- | -- | -- | -- | (16,849,997) | 44,008,512 |
| Total | $432,238,684 | $-- | $112,744,980 | $3,105,429 | $24,374,193 | $(10,005,044) | $222,246,569 |
Investment Valuation
The following is a summary of the inputs used, as of April 30, 2018, involving the Fund's assets and liabilities carried at fair value. The inputs or methodology used for valuing securities may not be an indication of the risk associated with investing in those securities. For more information on valuation inputs, and their aggregation into the levels used below, please refer to the Investment Valuation section in the accompanying Notes to Financial Statements.
| Valuation Inputs at Reporting Date: | ||||
| Description | Total | Level 1 | Level 2 | Level 3 |
| Investments in Securities: | ||||
| Equities: | ||||
| Consumer Discretionary | $2,232,136,975 | $913,103,361 | $1,276,683,730 | $42,349,884 |
| Consumer Staples | 947,157,708 | 439,508,645 | 507,649,063 | -- |
| Energy | 988,760,864 | 490,325,624 | 498,435,240 | -- |
| Financials | 3,394,078,174 | 1,372,820,416 | 2,021,257,758 | -- |
| Health Care | 349,462,662 | 17,964,716 | 331,497,946 | -- |
| Industrials | 625,109,290 | 276,467,577 | 348,641,713 | -- |
| Information Technology | 3,241,143,176 | 1,626,294,449 | 1,614,848,727 | -- |
| Materials | 1,224,691,941 | 743,308,861 | 481,383,080 | -- |
| Real Estate | 388,852,495 | 121,663,660 | 267,188,835 | -- |
| Telecommunication Services | 575,165,854 | 274,203,572 | 300,962,282 | -- |
| Utilities | 399,523,361 | 162,126,674 | 237,396,687 | -- |
| Government Obligations | 4,022,875 | -- | 4,022,875 | -- |
| Money Market Funds | 346,668,017 | 346,668,017 | -- | -- |
| Total Investments in Securities: | $14,716,773,392 | $6,784,455,572 | $7,889,967,936 | $42,349,884 |
| Derivative Instruments: | ||||
| Liabilities | ||||
| Futures Contracts | $(323,528) | $(323,528) | $-- | $-- |
| Total Liabilities | $(323,528) | $(323,528) | $-- | $-- |
| Total Derivative Instruments: | $(323,528) | $(323,528) | $-- | $-- |
The following is a summary of transfers between Level 1 and Level 2 for the period ended April 30, 2018. Transfers are assumed to have occurred at the beginning of the period, and are primarily attributable to the valuation techniques used for foreign equity securities, as discussed in the accompanying Notes to Financial Statements:
| Transfers | Total |
| Level 1 to Level 2 | $5,009,452,989 |
| Level 2 to Level 1 | $46,907,776 |
Value of Derivative Instruments
The following table is a summary of the Fund's value of derivative instruments by primary risk exposure as of April 30, 2018. For additional information on derivative instruments, please refer to the Derivative Instruments section in the accompanying Notes to Financial Statements.
| Primary Risk Exposure / Derivative Type | Value | |
| Asset | Liability | |
| Equity Risk | ||
| Futures Contracts(a) | $0 | $(323,528) |
| Total Equity Risk | 0 | (323,528) |
| Total Value of Derivatives | $0 | $(323,528) |
(a) Reflects gross cumulative appreciation (depreciation) on futures contracts as presented in the Schedule of Investments. In the Statement of Assets and Liabilities, the period end daily variation margin is included in receivable or payable for daily variation margin on futures contracts, and the net cumulative appreciation (depreciation) is included in net unrealized appreciation (depreciation).
See accompanying notes which are an integral part of the financial statements.
Fidelity® Series Emerging Markets Opportunities Fund
Financial Statements
Statement of Assets and Liabilities
| April 30, 2018 (Unaudited) | ||
| Assets | ||
| Investment in securities, at value (including securities loaned of $100,697,580) — See accompanying schedule: Unaffiliated issuers (cost $10,338,697,620) | $14,147,858,806 | |
| Fidelity Central Funds (cost $346,668,016) | 346,668,017 | |
| Other affiliated issuers (cost $234,732,309) | 222,246,569 | |
| Total Investment in Securities (cost $10,920,097,945) | $14,716,773,392 | |
| Cash | 1,825,877 | |
| Foreign currency held at value (cost $36,336,735) | 36,338,528 | |
| Receivable for investments sold | 43,251,130 | |
| Receivable for fund shares sold | 10,004,083 | |
| Dividends receivable | 13,793,380 | |
| Interest receivable | 2,781 | |
| Distributions receivable from Fidelity Central Funds | 699,545 | |
| Receivable from investment adviser for expense reductions | 547,642 | |
| Other receivables | 4,384,871 | |
| Total assets | 14,827,621,229 | |
| Liabilities | ||
| Payable for investments purchased | $64,802,943 | |
| Payable for fund shares redeemed | 8,716,767 | |
| Payable for daily variation margin on futures contracts | 315,875 | |
| Other payables and accrued expenses | 23,706,613 | |
| Collateral on securities loaned | 103,851,075 | |
| Total liabilities | 201,393,273 | |
| Net Assets | $14,626,227,956 | |
| Net Assets consist of: | ||
| Paid in capital | $9,953,282,342 | |
| Undistributed net investment income | 73,903,432 | |
| Accumulated undistributed net realized gain (loss) on investments and foreign currency transactions | 824,424,453 | |
| Net unrealized appreciation (depreciation) on investments and assets and liabilities in foreign currencies | 3,774,617,729 | |
| Net Assets | $14,626,227,956 | |
| Net Asset Value, offering price and redemption price per share ($14,626,227,956 ÷ 687,121,759 shares) | $21.29 |
See accompanying notes which are an integral part of the financial statements.
Statement of Operations
| Six months ended April 30, 2018 (Unaudited) | ||
| Investment Income | ||
| Dividends (including $3,105,429 earned from other affiliated issuers) | $142,450,885 | |
| Interest | 29,702 | |
| Income from Fidelity Central Funds | 2,111,151 | |
| Income before foreign taxes withheld | 144,591,738 | |
| Less foreign taxes withheld | (17,442,054) | |
| Total income | 127,149,684 | |
| Expenses | ||
| Custodian fees and expenses | $4,052,672 | |
| Independent trustees' fees and expenses | 31,320 | |
| Interest | 15,870 | |
| Miscellaneous | 22,572 | |
| Total expenses before reductions | 4,122,434 | |
| Expense reductions | (2,961,527) | 1,160,907 |
| Net investment income (loss) | 125,988,777 | |
| Realized and Unrealized Gain (Loss) | ||
| Net realized gain (loss) on: | ||
| Investment securities: | ||
| Unaffiliated issuers | 918,859,157 | |
| Fidelity Central Funds | (1,020) | |
| Other affiliated issuers | 24,374,193 | |
| Foreign currency transactions | (4,049,748) | |
| Futures contracts | 948,224 | |
| Total net realized gain (loss) | 940,130,806 | |
| Change in net unrealized appreciation (depreciation) on: | ||
| Investment securities: | ||
| Unaffiliated issuers (net of decrease in deferred foreign taxes of $9,666,516) | (589,260,380) | |
| Fidelity Central Funds | (473) | |
| Other affiliated issuers | (10,005,044) | |
| Assets and liabilities in foreign currencies | (637,289) | |
| Futures contracts | (323,528) | |
| Total change in net unrealized appreciation (depreciation) | (600,226,714) | |
| Net gain (loss) | 339,904,092 | |
| Net increase (decrease) in net assets resulting from operations | $465,892,869 |
See accompanying notes which are an integral part of the financial statements.
Statement of Changes in Net Assets
| Six months ended April 30, 2018 (Unaudited) | Year ended October 31, 2017 | |
| Increase (Decrease) in Net Assets | ||
| Operations | ||
| Net investment income (loss) | $125,988,777 | $267,130,789 |
| Net realized gain (loss) | 940,130,806 | 1,483,007,190 |
| Change in net unrealized appreciation (depreciation) | (600,226,714) | 2,448,297,246 |
| Net increase (decrease) in net assets resulting from operations | 465,892,869 | 4,198,435,225 |
| Distributions to shareholders from net investment income | (277,477,968) | (193,538,453) |
| Distributions to shareholders from net realized gain | (164,909,386) | (33,641,199) |
| Total distributions | (442,387,354) | (227,179,652) |
| Share transactions - net increase (decrease) | (1,144,724,287) | (3,684,478,975) |
| Total increase (decrease) in net assets | (1,121,218,772) | 286,776,598 |
| Net Assets | ||
| Beginning of period | 15,747,446,728 | 15,460,670,130 |
| End of period | $14,626,227,956 | $15,747,446,728 |
| Other Information | ||
| Undistributed net investment income end of period | $73,903,432 | $225,392,623 |
See accompanying notes which are an integral part of the financial statements.
Financial Highlights
Fidelity Series Emerging Markets Opportunities Fund
| Six months ended (Unaudited) April 30, | Years endedOctober 31, | |||||
| 2018 | 2017 | 2016 | 2015 | 2014 | 2013 | |
| Selected Per–Share Data | ||||||
| Net asset value, beginning of period | $21.35 | $16.79 | $15.31 | $17.77 | $17.56 | $16.25 |
| Income from Investment Operations | ||||||
| Net investment income (loss)A | .18 | .30 | .19 | .21B | .21 | .20 |
| Net realized and unrealized gain (loss) | .38 | 4.49 | 1.47 | (2.53) | .17 | 1.34 |
| Total from investment operations | .56 | 4.79 | 1.66 | (2.32) | .38 | 1.54 |
| Distributions from net investment income | (.39) | (.19) | (.18) | (.14) | (.17) | (.22) |
| Distributions from net realized gain | (.23) | (.04) | – | – | (.01) | (.01) |
| Total distributions | (.62) | (.23) | (.18) | (.14) | (.17)C | (.23) |
| Net asset value, end of period | $21.29 | $21.35 | $16.79 | $15.31 | $17.77 | $17.56 |
| Total ReturnD,E | 2.69% | 29.04% | 11.02% | (13.14)% | 2.20% | 9.59% |
| Ratios to Average Net AssetsF,G | ||||||
| Expenses before reductions | .05%H | .59% | 1.03% | 1.04% | 1.06% | 1.09% |
| Expenses net of fee waivers, if any | .01%H | .57% | 1.03% | 1.04% | 1.06% | 1.09% |
| Expenses net of all reductions | .01%H | .56% | 1.03% | 1.03% | 1.06% | 1.06% |
| Net investment income (loss) | 1.62%H | 1.63% | 1.24% | 1.29%B | 1.18% | 1.22% |
| Supplemental Data | ||||||
| Net assets, end of period (000 omitted) | $14,626,228 | $15,747,447 | $6,998,219 | $5,571,493 | $4,837,497 | $3,623,928 |
| Portfolio turnover rateI | 50%H | 56% | 45% | 64% | 93% | 79% |
A Calculated based on average shares outstanding during the period.
B Net Investment income per share reflects a large, non-recurring dividend which amounted to $.05 per share. Excluding this non-recurring dividend, the ratio of net investment income (loss) to average net assets would have been 1.00%.
C Total distributions of $.17 per share is comprised of distributions from net investment income of $.166 and distributions from net realized gain of $.006 per share.
D Total returns for periods of less than one year are not annualized.
E Total returns would have been lower if certain expenses had not been reduced during the applicable periods shown.
F Fees and expenses of any underlying Fidelity Central Funds are not included in the Fund's expense ratio. The Fund indirectly bears its proportionate share of the expenses of any underlying Fidelity Central Funds.
G Expense ratios reflect operating expenses of the class. Expenses before reductions do not reflect amounts reimbursed by the investment adviser or reductions from brokerage service arrangements or reductions from other expense offset arrangements and do not represent the amount paid by the class during periods when reimbursements or reductions occur. Expenses net of fee waivers reflect expenses after reimbursement by the investment adviser but prior to reductions from brokerage service arrangements or other expense offset arrangements. Expenses net of all reductions represent the net expenses paid by the class.
H Annualized
I Amount does not include the portfolio activity of any underlying Fidelity Central Funds.
See accompanying notes which are an integral part of the financial statements.
Fidelity® Series International Growth Fund
Investment Summary (Unaudited)
Geographic Diversification (% of fund's net assets)
| As of April 30, 2018 | ||
| United States of America* | 21.0% | |
| Japan | 13.8% | |
| United Kingdom | 10.7% | |
| Germany | 6.5% | |
| Switzerland | 6.5% | |
| Sweden | 5.0% | |
| Spain | 3.5% | |
| Australia | 3.4% | |
| Ireland | 3.3% | |
| Other | 26.3% | |
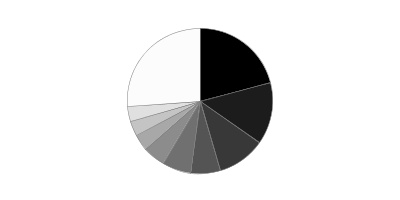
* Includes Short-Term investments and Net Other Assets (Liabilities).
Percentages are based on country or territory of incorporation and are adjusted for the effect of futures contracts, if applicable.
Asset Allocation as of April 30, 2018
| % of fund's net assets | |
| Stocks | 96.8 |
| Short-Term Investments and Net Other Assets (Liabilities) | 3.2 |
Top Ten Stocks as of April 30, 2018
| % of fund's net assets | |
| CSL Ltd. (Australia, Biotechnology) | 3.4 |
| SAP SE (Germany, Software) | 3.2 |
| Keyence Corp. (Japan, Electronic Equipment & Components) | 3.2 |
| Nestle SA (Reg. S) (Switzerland, Food Products) | 2.9 |
| AIA Group Ltd. (Hong Kong, Insurance) | 2.7 |
| Visa, Inc. Class A (United States of America, IT Services) | 2.6 |
| Roche Holding AG (participation certificate) (Switzerland, Pharmaceuticals) | 2.6 |
| MasterCard, Inc. Class A (United States of America, IT Services) | 2.5 |
| ASML Holding NV (Netherlands) (Netherlands, Semiconductors & Semiconductor Equipment) | 2.4 |
| British American Tobacco PLC (United Kingdom) (United Kingdom, Tobacco) | 2.2 |
| 27.7 |
Top Market Sectors as of April 30, 2018
| % of fund's net assets | |
| Information Technology | 22.7 |
| Industrials | 19.4 |
| Financials | 13.7 |
| Consumer Staples | 11.4 |
| Health Care | 10.1 |
| Consumer Discretionary | 9.7 |
| Materials | 7.5 |
| Real Estate | 1.0 |
| Telecommunication Services | 0.7 |
| Energy | 0.6 |
Fidelity® Series International Growth Fund
Schedule of Investments April 30, 2018 (Unaudited)
Showing Percentage of Net Assets
| Common Stocks - 96.2% | |||
| Shares | Value | ||
| Australia - 3.4% | |||
| CSL Ltd. | 3,853,438 | $493,583,208 | |
| Austria - 1.1% | |||
| Andritz AG | 2,984,660 | 160,606,513 | |
| Belgium - 2.6% | |||
| Anheuser-Busch InBev SA NV (a) | 2,182,481 | 218,013,859 | |
| KBC Groep NV | 1,733,682 | 151,576,234 | |
| TOTAL BELGIUM | 369,590,093 | ||
| Brazil - 0.1% | |||
| Itau Unibanco Holding SA | 1,505,300 | 18,949,455 | |
| Canada - 1.9% | |||
| Alimentation Couche-Tard, Inc. Class B (sub. vtg.) | 1,391,400 | 60,155,469 | |
| Canadian Pacific Railway Ltd. | 385,800 | 70,396,218 | |
| Franco-Nevada Corp. | 1,160,800 | 82,335,026 | |
| Pason Systems, Inc. | 1,851,469 | 25,884,083 | |
| PrairieSky Royalty Ltd. (a) | 1,659,900 | 36,806,225 | |
| TOTAL CANADA | 275,577,021 | ||
| Cayman Islands - 1.8% | |||
| 58.com, Inc. ADR (b) | 662,600 | 57,904,614 | |
| Alibaba Group Holding Ltd. sponsored ADR (b) | 1,083,200 | 193,394,528 | |
| Ping An Healthcare and Technology Co. Ltd. (b) | 601,500 | 4,199,729 | |
| TOTAL CAYMAN ISLANDS | 255,498,871 | ||
| Denmark - 1.2% | |||
| Jyske Bank A/S (Reg.) | 1,407,900 | 84,637,845 | |
| Novo Nordisk A/S Series B sponsored ADR | 1,955,781 | 91,804,360 | |
| TOTAL DENMARK | 176,442,205 | ||
| Finland - 0.3% | |||
| Tikkurila Oyj | 1,985,479 | 35,917,013 | |
| France - 2.9% | |||
| Edenred SA | 2,587,700 | 89,059,836 | |
| Elis SA | 2,606,841 | 62,393,780 | |
| Legrand SA | 1,360,000 | 105,930,672 | |
| Safran SA | 1,326,200 | 155,550,231 | |
| TOTAL FRANCE | 412,934,519 | ||
| Germany - 6.5% | |||
| Bayer AG | 2,161,600 | 258,353,591 | |
| Linde AG | 669,200 | 148,735,576 | |
| MTU Aero Engines Holdings AG | 456,100 | 78,762,450 | |
| SAP SE | 4,169,913 | 463,301,025 | |
| TOTAL GERMANY | 949,152,642 | ||
| Hong Kong - 2.7% | |||
| AIA Group Ltd. | 44,321,800 | 396,112,795 | |
| India - 1.2% | |||
| Bandhan Bank Ltd. (c) | 622,148 | 4,779,847 | |
| Housing Development Finance Corp. Ltd. | 5,972,940 | 168,992,530 | |
| TOTAL INDIA | 173,772,377 | ||
| Ireland - 3.3% | |||
| CRH PLC sponsored ADR (a) | 7,910,305 | 279,708,385 | |
| James Hardie Industries PLC CDI | 11,489,597 | 202,899,898 | |
| TOTAL IRELAND | 482,608,283 | ||
| Isle of Man - 0.5% | |||
| Playtech Ltd. | 6,368,650 | 71,071,142 | |
| Italy - 0.8% | |||
| Interpump Group SpA | 3,723,049 | 118,603,266 | |
| Japan - 13.8% | |||
| Azbil Corp. | 564,600 | 26,339,737 | |
| DENSO Corp. | 2,965,200 | 156,125,971 | |
| East Japan Railway Co. | 1,548,500 | 148,589,142 | |
| Fanuc Corp. | 662,600 | 141,935,968 | |
| Hoya Corp. | 2,054,224 | 110,152,407 | |
| Keyence Corp. | 751,500 | 460,372,805 | |
| Komatsu Ltd. | 5,371,800 | 183,117,866 | |
| Misumi Group, Inc. | 6,345,100 | 175,865,834 | |
| Nabtesco Corp. | 1,970,800 | 71,299,982 | |
| Nintendo Co. Ltd. | 209,000 | 87,816,893 | |
| OSG Corp. | 3,556,000 | 78,978,851 | |
| SHO-BOND Holdings Co. Ltd. (d) | 1,459,200 | 110,521,186 | |
| USS Co. Ltd. | 11,790,200 | 248,163,650 | |
| TOTAL JAPAN | 1,999,280,292 | ||
| Kenya - 0.7% | |||
| Safaricom Ltd. | 375,891,000 | 105,871,593 | |
| Korea (South) - 0.8% | |||
| BGF Retail Co. Ltd. | 342,524 | 61,089,324 | |
| NAVER Corp. | 89,819 | 60,051,268 | |
| TOTAL KOREA (SOUTH) | 121,140,592 | ||
| Mexico - 0.5% | |||
| Fomento Economico Mexicano S.A.B. de CV sponsored ADR | 709,312 | 68,562,098 | |
| Netherlands - 2.4% | |||
| ASML Holding NV (Netherlands) (a) | 1,793,000 | 341,023,221 | |
| New Zealand - 0.3% | |||
| Auckland International Airport Ltd. | 11,012,513 | 49,434,818 | |
| Norway - 0.4% | |||
| Schibsted ASA (B Shares) | 1,942,065 | 52,289,997 | |
| South Africa - 2.4% | |||
| Clicks Group Ltd. | 7,375,251 | 126,094,114 | |
| Naspers Ltd. Class N | 927,910 | 226,057,028 | |
| TOTAL SOUTH AFRICA | 352,151,142 | ||
| Spain - 3.5% | |||
| Amadeus IT Holding SA Class A | 3,725,400 | 273,076,738 | |
| Banco Bilbao Vizcaya Argentaria SA | 7,024,000 | 56,838,617 | |
| Hispania Activos Inmobiliarios SA | 2,517,010 | 53,495,927 | |
| Merlin Properties Socimi SA | 2,837,600 | 43,861,578 | |
| Prosegur Compania de Seguridad SA (Reg.) | 10,418,189 | 79,008,712 | |
| TOTAL SPAIN | 506,281,572 | ||
| Sweden - 5.0% | |||
| ASSA ABLOY AB (B Shares) (a) | 14,147,817 | 297,605,579 | |
| Atlas Copco AB (A Shares) | 5,981,300 | 235,040,264 | |
| Fagerhult AB | 5,169,192 | 52,833,296 | |
| Loomis AB (B Shares) | 1,067,400 | 39,031,077 | |
| Svenska Handelsbanken AB (A Shares) | 8,774,613 | 97,856,799 | |
| TOTAL SWEDEN | 722,367,015 | ||
| Switzerland - 6.5% | |||
| Nestle SA (Reg. S) | 5,421,199 | 419,980,791 | |
| Roche Holding AG (participation certificate) | 1,680,030 | 373,281,613 | |
| Schindler Holding AG: | |||
| (participation certificate) | 579,078 | 120,139,694 | |
| (Reg.) | 154,309 | 31,001,939 | |
| TOTAL SWITZERLAND | 944,404,037 | ||
| Taiwan - 0.9% | |||
| Taiwan Semiconductor Manufacturing Co. Ltd. | 17,786,000 | 135,242,072 | |
| Turkey - 0.2% | |||
| Tupras Turkiye Petrol Rafinerileri A/S | 1,282,924 | 32,688,175 | |
| United Kingdom - 10.7% | |||
| BAE Systems PLC | 14,787,200 | 124,067,951 | |
| British American Tobacco PLC (United Kingdom) | 5,724,700 | 313,985,541 | |
| Elementis PLC | 9,821,247 | 38,345,303 | |
| Informa PLC | 16,566,754 | 168,547,058 | |
| InterContinental Hotel Group PLC ADR (a) | 3,270,539 | 208,137,102 | |
| Melrose Industries PLC | 18,425,530 | 57,835,454 | |
| Prudential PLC | 12,168,969 | 312,913,589 | |
| Reckitt Benckiser Group PLC | 2,082,787 | 163,390,641 | |
| Rightmove PLC | 566,370 | 35,594,290 | |
| Shaftesbury PLC | 2,918,400 | 40,619,567 | |
| Spectris PLC | 2,246,200 | 83,184,042 | |
| TOTAL UNITED KINGDOM | 1,546,620,538 | ||
| United States of America - 17.8% | |||
| Alphabet, Inc. Class A (b) | 217,694 | 221,738,755 | |
| Autoliv, Inc. (a) | 1,236,527 | 165,756,444 | |
| Berkshire Hathaway, Inc. Class B (b) | 892,750 | 172,952,458 | |
| Black Knight, Inc. (b) | 787,600 | 38,316,740 | |
| Martin Marietta Materials, Inc. | 664,300 | 129,385,711 | |
| MasterCard, Inc. Class A | 2,060,110 | 367,255,810 | |
| Mohawk Industries, Inc. (b) | 512,315 | 107,524,672 | |
| Moody's Corp. | 612,600 | 99,363,720 | |
| MSCI, Inc. | 1,030,400 | 154,384,832 | |
| PayPal Holdings, Inc. (b) | 848,100 | 63,276,741 | |
| Philip Morris International, Inc. | 1,983,492 | 162,646,344 | |
| PriceSmart, Inc. | 697,275 | 61,081,290 | |
| ResMed, Inc. | 1,554,200 | 147,089,488 | |
| S&P Global, Inc. | 807,371 | 152,270,171 | |
| Sherwin-Williams Co. | 446,900 | 164,307,254 | |
| Visa, Inc. Class A | 2,942,696 | 373,369,268 | |
| TOTAL UNITED STATES OF AMERICA | 2,580,719,698 | ||
| TOTAL COMMON STOCKS | |||
| (Cost $9,280,829,710) | 13,948,496,263 | ||
| Nonconvertible Preferred Stocks - 0.6% | |||
| Brazil - 0.6% | |||
| Itau Unibanco Holding SA | |||
| (Cost $81,261,989) | 6,270,500 | 91,304,580 | |
| Money Market Funds - 6.7% | |||
| Fidelity Cash Central Fund, 1.74% (e) | 396,880,418 | 396,959,794 | |
| Fidelity Securities Lending Cash Central Fund 1.74% (e)(f) | 578,836,414 | 578,894,297 | |
| TOTAL MONEY MARKET FUNDS | |||
| (Cost $975,854,326) | 975,854,091 | ||
| TOTAL INVESTMENT IN SECURITIES - 103.5% | |||
| (Cost $10,337,946,025) | 15,015,654,934 | ||
| NET OTHER ASSETS (LIABILITIES) - (3.5)% | (513,209,416) | ||
| NET ASSETS - 100% | $14,502,445,518 |
Categorizations in the Schedule of Investments are based on country or territory of incorporation.
Legend
(a) Security or a portion of the security is on loan at period end.
(b) Non-income producing
(c) Security exempt from registration under Rule 144A of the Securities Act of 1933. These securities may be resold in transactions exempt from registration, normally to qualified institutional buyers. At the end of the period, the value of these securities amounted to $4,779,847 or 0.0% of net assets.
(d) Affiliated company
(e) Affiliated fund that is generally available only to investment companies and other accounts managed by Fidelity Investments. The rate quoted is the annualized seven-day yield of the fund at period end. A complete unaudited listing of the fund's holdings as of its most recent quarter end is available upon request. In addition, each Fidelity Central Fund's financial statements are available on the SEC's website or upon request.
(f) Investment made with cash collateral received from securities on loan.
Affiliated Central Funds
Information regarding fiscal year to date income earned by the Fund from investments in Fidelity Central Funds is as follows:
| Fund | Income earned |
| Fidelity Cash Central Fund | $1,809,515 |
| Fidelity Securities Lending Cash Central Fund | 807,037 |
| Total | $2,616,552 |
Amounts in the income column in the above table include any capital gain distributions from underlying funds, which are presented in the corresponding line-item in the Statement of Operations if applicable.
Other Affiliated Issuers
An affiliated company is a company in which the Fund has ownership of at least 5% of the voting securities. Fiscal year to date transactions with companies which are or were affiliates are as follows:
| Affiliate | Value, beginning of period | Purchases | Sales Proceeds | Dividend Income | Realized Gain (loss) | Change in Unrealized appreciation (depreciation) | Value, end of period |
| SHO-BOND Holdings Co. Ltd. | $93,058,290 | $-- | $4,089,000 | $600,689 | $1,630,231 | $19,921,665 | $110,521,186 |
| Total | $93,058,290 | $-- | $4,089,000 | $600,689 | $1,630,231 | $19,921,665 | $110,521,186 |
Investment Valuation
The following is a summary of the inputs used, as of April 30, 2018, involving the Fund's assets and liabilities carried at fair value. The inputs or methodology used for valuing securities may not be an indication of the risk associated with investing in those securities. For more information on valuation inputs, and their aggregation into the levels used below, please refer to the Investment Valuation section in the accompanying Notes to Financial Statements.
| Valuation Inputs at Reporting Date: | ||||
| Description | Total | Level 1 | Level 2 | Level 3 |
| Investments in Securities: | ||||
| Equities: | ||||
| Consumer Discretionary | $1,403,673,064 | $1,177,616,036 | $226,057,028 | $-- |
| Consumer Staples | 1,654,999,471 | 631,548,384 | 1,023,451,087 | -- |
| Energy | 95,378,483 | 95,378,483 | -- | -- |
| Financials | 1,962,933,472 | 925,439,295 | 1,037,494,177 | -- |
| Health Care | 1,478,464,396 | 349,046,255 | 1,129,418,141 | -- |
| Industrials | 2,837,610,579 | 2,232,938,563 | 604,672,016 | -- |
| Information Technology | 3,281,258,547 | 2,594,898,557 | 686,359,990 | -- |
| Materials | 1,081,634,166 | 878,734,268 | 202,899,898 | -- |
| Real Estate | 137,977,072 | 137,977,072 | -- | -- |
| Telecommunication Services | 105,871,593 | 105,871,593 | -- | -- |
| Money Market Funds | 975,854,091 | 975,854,091 | -- | -- |
| Total Investments in Securities: | $15,015,654,934 | $10,105,302,597 | $4,910,352,337 | $-- |
The following is a summary of transfers between Level 1 and Level 2 for the period ended April 30, 2018. Transfers are assumed to have occurred at the beginning of the period, and are primarily attributable to the valuation techniques used for foreign equity securities, as discussed in the accompanying Notes to Financial Statements:
| Transfers | Total |
| Level 1 to Level 2 | $1,613,395,964 |
| Level 2 to Level 1 | $2,621,668,519 |
See accompanying notes which are an integral part of the financial statements.
Fidelity® Series International Growth Fund
Financial Statements
Statement of Assets and Liabilities
| April 30, 2018 (Unaudited) | ||
| Assets | ||
| Investment in securities, at value (including securities loaned of $547,192,039) — See accompanying schedule: Unaffiliated issuers (cost $9,319,756,659) | $13,929,279,657 | |
| Fidelity Central Funds (cost $975,854,326) | 975,854,091 | |
| Other affiliated issuers (cost $42,335,040) | 110,521,186 | |
| Total Investment in Securities (cost $10,337,946,025) | $15,015,654,934 | |
| Foreign currency held at value (cost $1,147,204) | 1,147,204 | |
| Receivable for investments sold | 17,396,274 | |
| Receivable for fund shares sold | 3,801,754 | |
| Dividends receivable | 86,616,937 | |
| Distributions receivable from Fidelity Central Funds | 525,901 | |
| Other receivables | 299,555 | |
| Total assets | 15,125,442,559 | |
| Liabilities | ||
| Payable for investments purchased | $41,176,051 | |
| Payable for fund shares redeemed | 2,330,497 | |
| Other payables and accrued expenses | 628,936 | |
| Collateral on securities loaned | 578,861,557 | |
| Total liabilities | 622,997,041 | |
| Net Assets | $14,502,445,518 | |
| Net Assets consist of: | ||
| Paid in capital | $9,259,905,206 | |
| Undistributed net investment income | 128,930,943 | |
| Accumulated undistributed net realized gain (loss) on investments and foreign currency transactions | 436,364,132 | |
| Net unrealized appreciation (depreciation) on investments and assets and liabilities in foreign currencies | 4,677,245,237 | |
| Net Assets | $14,502,445,518 | |
| Net Asset Value, offering price and redemption price per share ($14,502,445,518 ÷ 903,062,677 shares) | $16.06 |
See accompanying notes which are an integral part of the financial statements.
Statement of Operations
| Six months ended April 30, 2018 (Unaudited) | ||
| Investment Income | ||
| Dividends (including $600,689 earned from other affiliated issuers) | $169,290,594 | |
| Income from Fidelity Central Funds | 2,616,552 | |
| Income before foreign taxes withheld | 171,907,146 | |
| Less foreign taxes withheld | (17,058,473) | |
| Total income | 154,848,673 | |
| Expenses | ||
| Custodian fees and expenses | $861,919 | |
| Independent trustees' fees and expenses | 29,855 | |
| Miscellaneous | 21,497 | |
| Total expenses before reductions | 913,271 | |
| Expense reductions | (554,926) | 358,345 |
| Net investment income (loss) | 154,490,328 | |
| Realized and Unrealized Gain (Loss) | ||
| Net realized gain (loss) on: | ||
| Investment securities: | ||
| Unaffiliated issuers | 475,289,194 | |
| Fidelity Central Funds | 4,454 | |
| Other affiliated issuers | 1,630,231 | |
| Foreign currency transactions | (406,817) | |
| Total net realized gain (loss) | 476,517,062 | |
| Change in net unrealized appreciation (depreciation) on: | ||
| Investment securities: | ||
| Unaffiliated issuers | (319,263,852) | |
| Fidelity Central Funds | (2,154) | |
| Other affiliated issuers | 19,921,665 | |
| Assets and liabilities in foreign currencies | (553,776) | |
| Total change in net unrealized appreciation (depreciation) | (299,898,117) | |
| Net gain (loss) | 176,618,945 | |
| Net increase (decrease) in net assets resulting from operations | $331,109,273 |
See accompanying notes which are an integral part of the financial statements.
Statement of Changes in Net Assets
| Six months ended April 30, 2018 (Unaudited) | Year ended October 31, 2017 | |
| Increase (Decrease) in Net Assets | ||
| Operations | ||
| Net investment income (loss) | $154,490,328 | $205,053,294 |
| Net realized gain (loss) | 476,517,062 | 232,127,473 |
| Change in net unrealized appreciation (depreciation) | (299,898,117) | 2,728,057,321 |
| Net increase (decrease) in net assets resulting from operations | 331,109,273 | 3,165,238,088 |
| Distributions to shareholders from net investment income | (218,066,581) | (170,410,130) |
| Distributions to shareholders from net realized gain | (242,599,071) | (166,389,831) |
| Total distributions | (460,665,652) | (336,799,961) |
| Share transactions - net increase (decrease) | (152,812,569) | (561,512,168) |
| Total increase (decrease) in net assets | (282,368,948) | 2,266,925,959 |
| Net Assets | ||
| Beginning of period | 14,784,814,466 | 12,517,888,507 |
| End of period | $14,502,445,518 | $14,784,814,466 |
| Other Information | ||
| Undistributed net investment income end of period | $128,930,943 | $192,507,196 |
See accompanying notes which are an integral part of the financial statements.
Financial Highlights
Fidelity Series International Growth Fund
| Six months ended (Unaudited) April 30, | Years endedOctober 31, | |||||
| 2018 | 2017 | 2016 | 2015 | 2014 | 2013 | |
| Selected Per–Share Data | ||||||
| Net asset value, beginning of period | $16.22 | $13.37 | $14.28 | $14.17 | $13.95 | $11.55 |
| Income from Investment Operations | ||||||
| Net investment income (loss)A | .17 | .21 | .17B | .15 | .17 | .16 |
| Net realized and unrealized gain (loss) | .18 | 2.97 | (.60) | .36 | .20 | 2.43 |
| Total from investment operations | .35 | 3.18 | (.43) | .51 | .37 | 2.59 |
| Distributions from net investment income | (.24) | (.16) | (.16) | (.19) | (.10) | (.19) |
| Distributions from net realized gain | (.27) | (.17) | (.33) | (.21) | (.05) | – |
| Total distributions | (.51) | (.33) | (.48)C | (.40) | (.15) | (.19) |
| Net asset value, end of period | $16.06 | $16.22 | $13.37 | $14.28 | $14.17 | $13.95 |
| Total ReturnD,E | 2.18% | 24.42% | (3.10)% | 3.65% | 2.66% | 22.72% |
| Ratios to Average Net AssetsF,G | ||||||
| Expenses before reductions | .01%H | .51% | .94% | .92% | .97% | 1.04% |
| Expenses net of fee waivers, if any | .01%H | .51% | .94% | .91% | .97% | 1.04% |
| Expenses net of all reductions | - %H,I | .51% | .94% | .91% | .97% | 1.02% |
| Net investment income (loss) | 2.05%H | 1.41% | 1.27%B | 1.06% | 1.23% | 1.26% |
| Supplemental Data | ||||||
| Net assets, end of period (000 omitted) | $14,502,446 | $14,784,814 | $5,618,983 | $5,563,674 | $6,049,347 | $5,642,298 |
| Portfolio turnover rateJ | 26%H | 23% | 26% | 24% | 33% | 41% |
A Calculated based on average shares outstanding during the period.
B Net Investment income per share reflects a large, non-recurring dividend which amounted to $.05 per share. Excluding this non-recurring dividend, the ratio of net investment income (loss) to average net assets would have been .93%.
C Total distributions of $.48 per share is comprised of distributions from net investment income of $.156 and distributions from net realized gain of $.326 per share.
D Total returns for periods of less than one year are not annualized.
E Total returns would have been lower if certain expenses had not been reduced during the applicable periods shown.
F Fees and expenses of any underlying Fidelity Central Funds are not included in the Fund's expense ratio. The Fund indirectly bears its proportionate share of the expenses of any underlying Fidelity Central Funds.
G Expense ratios reflect operating expenses of the class. Expenses before reductions do not reflect amounts reimbursed by the investment adviser or reductions from brokerage service arrangements or reductions from other expense offset arrangements and do not represent the amount paid by the class during periods when reimbursements or reductions occur. Expenses net of fee waivers reflect expenses after reimbursement by the investment adviser but prior to reductions from brokerage service arrangements or other expense offset arrangements. Expenses net of all reductions represent the net expenses paid by the class.
H Annualized
I Amount represents less than .005%.
J Amount does not include the portfolio activity of any underlying Fidelity Central Funds.
See accompanying notes which are an integral part of the financial statements.
Fidelity® Series International Small Cap Fund
Investment Summary (Unaudited)
Geographic Diversification (% of fund's net assets)
| As of April 30, 2018 | ||
| Japan | 34.8% | |
| United Kingdom | 16.9% | |
| Germany | 5.7% | |
| United States of America* | 5.2% | |
| Sweden | 4.1% | |
| France | 2.9% | |
| Netherlands | 2.8% | |
| Spain | 2.8% | |
| Australia | 2.5% | |
| Other | 22.3% | |

* Includes Short-Term investments and Net Other Assets (Liabilities).
Percentages are based on country or territory of incorporation and are adjusted for the effect of futures contracts, if applicable.
Asset Allocation as of April 30, 2018
| % of fund's net assets | |
| Stocks | 96.8 |
| Short-Term Investments and Net Other Assets (Liabilities) | 3.2 |
Top Ten Stocks as of April 30, 2018
| % of fund's net assets | |
| Spectris PLC (United Kingdom, Electronic Equipment & Components) | 2.1 |
| Spirax-Sarco Engineering PLC (United Kingdom, Machinery) | 2.0 |
| Dechra Pharmaceuticals PLC (United Kingdom, Pharmaceuticals) | 2.0 |
| USS Co. Ltd. (Japan, Specialty Retail) | 2.0 |
| Azbil Corp. (Japan, Electronic Equipment & Components) | 1.9 |
| OBIC Co. Ltd. (Japan, IT Services) | 1.8 |
| Nihon Parkerizing Co. Ltd. (Japan, Chemicals) | 1.6 |
| CompuGroup Medical AG (Germany, Health Care Technology) | 1.5 |
| Interpump Group SpA (Italy, Machinery) | 1.5 |
| SHO-BOND Holdings Co. Ltd. (Japan, Construction & Engineering) | 1.5 |
| 17.9 |
Top Market Sectors as of April 30, 2018
| % of fund's net assets | |
| Industrials | 22.5 |
| Consumer Discretionary | 16.1 |
| Information Technology | 13.2 |
| Health Care | 11.9 |
| Consumer Staples | 9.1 |
| Financials | 8.3 |
| Materials | 7.7 |
| Real Estate | 5.7 |
| Energy | 2.3 |
Fidelity® Series International Small Cap Fund
Schedule of Investments April 30, 2018 (Unaudited)
Showing Percentage of Net Assets
| Common Stocks - 95.4% | |||
| Shares | Value | ||
| Australia - 2.5% | |||
| Accent Group Ltd. (a) | 8,417,771 | $7,909,673 | |
| Adelaide Brighton Ltd. (a) | 3,027,427 | 14,606,159 | |
| Bapcor Ltd. | 810,786 | 3,577,177 | |
| Beacon Lighting Group Ltd. | 6,633,510 | 7,346,829 | |
| Domain Holdings Australia Ltd. | 285,479 | 661,879 | |
| DuluxGroup Ltd. | 4,809,181 | 27,961,352 | |
| Imdex Ltd. (b) | 16,634,283 | 15,511,550 | |
| John Fairfax Holdings Ltd. | 2,854,785 | 1,528,060 | |
| Nanosonics Ltd. (a)(b) | 678,844 | 1,222,453 | |
| Pact Group Holdings Ltd. (c) | 916,667 | 3,903,140 | |
| Quintis Ltd. (a)(b)(d) | 9,242,850 | 70 | |
| Reckon Ltd. (b)(e) | 5,931,484 | 5,703,761 | |
| Sigma Healthcare Ltd. | 2,445,948 | 1,421,282 | |
| SomnoMed Ltd. (b) | 305,402 | 665,729 | |
| TOTAL AUSTRALIA | 92,019,114 | ||
| Austria - 0.9% | |||
| Andritz AG | 418,024 | 22,494,146 | |
| IMMOFINANZ Immobilien Anlagen AG | 2,169,441 | 5,695,482 | |
| Wienerberger AG | 144,100 | 3,636,917 | |
| TOTAL AUSTRIA | 31,826,545 | ||
| Bailiwick of Jersey - 0.6% | |||
| Integrated Diagnostics Holdings PLC | 4,317,632 | 20,508,752 | |
| Belgium - 1.4% | |||
| Barco NV | 20,100 | 2,602,040 | |
| Econocom Group SA | 641,189 | 4,142,504 | |
| KBC Ancora | 739,573 | 44,878,695 | |
| TOTAL BELGIUM | 51,623,239 | ||
| Bermuda - 0.6% | |||
| Vostok New Ventures Ltd. (depositary receipt) (b) | 2,608,342 | 21,863,647 | |
| Brazil - 0.3% | |||
| Magnesita Refratarios SA | 163,600 | 2,685,259 | |
| Sul America SA unit | 1,089,702 | 6,725,096 | |
| TOTAL BRAZIL | 9,410,355 | ||
| Canada - 1.4% | |||
| McCoy Global, Inc. (b) | 1,118,050 | 1,114,610 | |
| New Look Vision Group, Inc. | 597,900 | 15,134,351 | |
| Pason Systems, Inc. | 792,600 | 11,080,782 | |
| PrairieSky Royalty Ltd. | 319,000 | 7,073,430 | |
| ShawCor Ltd. Class A | 489,800 | 9,475,939 | |
| Total Energy Services, Inc. | 360,000 | 3,818,840 | |
| ZCL Composites, Inc. | 280,000 | 2,643,094 | |
| TOTAL CANADA | 50,341,046 | ||
| Cayman Islands - 0.9% | |||
| 58.com, Inc. ADR (b) | 133,100 | 11,631,609 | |
| SITC International Holdings Co. Ltd. | 5,202,000 | 5,542,450 | |
| Value Partners Group Ltd. | 17,091,000 | 16,166,464 | |
| TOTAL CAYMAN ISLANDS | 33,340,523 | ||
| Denmark - 2.4% | |||
| Jyske Bank A/S (Reg.) | 505,519 | 30,389,970 | |
| Royal Unibrew A/S | 40,600 | 2,698,024 | |
| Scandinavian Tobacco Group A/S (c) | 870,097 | 14,554,032 | |
| SimCorp A/S | 174,600 | 12,712,177 | |
| Spar Nord Bank A/S | 2,405,285 | 27,562,710 | |
| TOTAL DENMARK | 87,916,913 | ||
| Finland - 0.6% | |||
| Olvi PLC (A Shares) | 119,900 | 4,025,196 | |
| Tikkurila Oyj (a) | 977,930 | 17,690,605 | |
| TOTAL FINLAND | 21,715,801 | ||
| France - 2.9% | |||
| Cegedim SA (b) | 58,251 | 2,476,106 | |
| Elis SA | 2,151,704 | 51,500,243 | |
| Laurent-Perrier Group SA | 135,868 | 17,145,754 | |
| Somfy SA | 13,500 | 1,343,334 | |
| Vetoquinol SA | 297,927 | 18,924,252 | |
| Virbac SA (a)(b) | 84,200 | 13,137,046 | |
| TOTAL FRANCE | 104,526,735 | ||
| Germany - 4.5% | |||
| CompuGroup Medical AG | 1,052,353 | 54,950,321 | |
| CTS Eventim AG | 929,695 | 43,605,656 | |
| Fielmann AG | 176,790 | 14,538,778 | |
| JOST Werke AG (c) | 45,000 | 1,899,253 | |
| MLP AG (a) | 672,245 | 4,083,369 | |
| Nexus AG | 608,016 | 20,338,451 | |
| SMA Solar Technology AG (a) | 81,053 | 5,006,542 | |
| WashTec AG | 191,031 | 18,432,054 | |
| TOTAL GERMANY | 162,854,424 | ||
| Greece - 0.5% | |||
| Fourlis Holdings SA | 752,500 | 5,361,442 | |
| Motor Oil (HELLAS) Corinth Refineries SA | 372,900 | 8,907,212 | |
| Mytilineos Holdings SA | 318,300 | 3,843,791 | |
| TOTAL GREECE | 18,112,445 | ||
| India - 0.2% | |||
| Jyothy Laboratories Ltd. | 1,295,727 | 7,059,259 | |
| Ireland - 1.8% | |||
| Cairn Homes PLC (b) | 1,233,100 | 2,674,408 | |
| FBD Holdings PLC | 1,291,400 | 18,324,062 | |
| James Hardie Industries PLC CDI | 2,145,147 | 37,882,104 | |
| Mincon Group PLC | 1,337,028 | 2,066,682 | |
| United Drug PLC (United Kingdom) | 216,000 | 2,720,910 | |
| TOTAL IRELAND | 63,668,166 | ||
| Isle of Man - 0.8% | |||
| Playtech Ltd. | 2,500,341 | 27,902,631 | |
| Israel - 2.0% | |||
| Azrieli Group | 162,479 | 7,453,641 | |
| Ituran Location & Control Ltd. (e) | 1,211,686 | 37,986,356 | |
| Strauss Group Ltd. | 1,265,055 | 26,092,342 | |
| TOTAL ISRAEL | 71,532,339 | ||
| Italy - 2.2% | |||
| Azimut Holding SpA | 522,564 | 10,999,172 | |
| Beni Stabili SpA SIIQ | 16,853,520 | 15,966,388 | |
| Interpump Group SpA | 1,658,466 | 52,832,902 | |
| TOTAL ITALY | 79,798,462 | ||
| Japan - 34.8% | |||
| Aeon Delight Co. Ltd. | 6,800 | 238,547 | |
| Ai Holdings Corp. | 570,600 | 15,277,591 | |
| Aoki Super Co. Ltd. | 301,000 | 3,587,660 | |
| Arcland Service Holdings Co. Ltd. | 113,200 | 2,425,123 | |
| Artnature, Inc. | 1,682,000 | 11,539,517 | |
| Asahi Co. Ltd. | 556,900 | 6,836,442 | |
| Asante, Inc. | 216,400 | 3,885,778 | |
| Aucnet, Inc. | 524,800 | 6,812,031 | |
| Azbil Corp. | 1,465,100 | 68,349,890 | |
| Bank of Kyoto Ltd. | 97,200 | 5,850,494 | |
| Broadleaf Co. Ltd. | 1,763,000 | 8,418,277 | |
| Central Automotive Products Ltd. | 121,079 | 1,888,398 | |
| Chugoku Marine Paints Ltd. | 275,000 | 2,716,795 | |
| Coca-Cola West Co. Ltd. | 350,450 | 15,098,971 | |
| Daiichikosho Co. Ltd. | 631,000 | 33,189,261 | |
| Daikokutenbussan Co. Ltd. | 569,400 | 29,428,375 | |
| Funai Soken Holdings, Inc. | 933,500 | 21,877,305 | |
| GCA Savvian Group Corp. (a) | 1,935,687 | 17,193,122 | |
| GMO Internet, Inc. (a) | 346,280 | 6,382,677 | |
| Goldcrest Co. Ltd. | 1,493,510 | 31,791,052 | |
| Iwatsuka Confectionary Co. Ltd. | 118,300 | 5,659,614 | |
| Kamigumi Co. Ltd. | 171,050 | 3,864,741 | |
| Kobayashi Pharmaceutical Co. Ltd. | 464,600 | 39,226,656 | |
| Konoike Transport Co. Ltd. | 38,100 | 668,109 | |
| Koshidaka Holdings Co. Ltd. | 504,500 | 30,642,883 | |
| Kusuri No Aoki Holdings Co. Ltd. | 337,500 | 23,185,373 | |
| Lasertec Corp. | 1,209,800 | 40,393,066 | |
| Leopalace21 Corp. | 634,096 | 5,516,148 | |
| Mandom Corp. | 83,600 | 3,020,673 | |
| Medikit Co. Ltd. | 261,400 | 14,370,783 | |
| Mirait Holdings Corp. | 209,100 | 3,316,679 | |
| Miroku Jyoho Service Co., Ltd. | 419,800 | 11,981,120 | |
| Misumi Group, Inc. | 1,411,500 | 39,122,256 | |
| Mitsuboshi Belting Ltd. | 381,000 | 4,359,962 | |
| Monex Group, Inc. | 1,902,932 | 10,861,961 | |
| Morinaga & Co. Ltd. | 70,900 | 3,456,797 | |
| Nabtesco Corp. | 914,600 | 33,088,575 | |
| Nagaileben Co. Ltd. | 1,388,300 | 36,790,204 | |
| Nakanishi, Inc. | 94,500 | 1,976,098 | |
| Nakano Refrigerators Co. Ltd. | 285,100 | 13,404,812 | |
| ND Software Co. Ltd. | 231,036 | 2,178,907 | |
| Nihon Parkerizing Co. Ltd. | 3,545,200 | 56,265,295 | |
| Nitto Kohki Co. Ltd. | 83,400 | 2,197,146 | |
| NOF Corp. | 175,000 | 5,226,628 | |
| NS Tool Co. Ltd. | 116,400 | 3,172,997 | |
| OBIC Co. Ltd. | 788,200 | 66,115,935 | |
| Okamoto Industries, Inc. | 300,000 | 3,007,684 | |
| OSG Corp. | 2,270,800 | 50,434,526 | |
| PALTAC Corp. | 149,200 | 7,479,107 | |
| Paramount Bed Holdings Co. Ltd. | 804,060 | 40,011,767 | |
| ProNexus, Inc. | 1,241,000 | 16,074,424 | |
| S Foods, Inc. | 113,500 | 4,781,078 | |
| San-Ai Oil Co. Ltd. | 2,176,900 | 34,330,183 | |
| Sekisui Jushi Corp. | 163,500 | 3,568,524 | |
| Shinko Plantech Co. Ltd. | 138,200 | 1,302,104 | |
| Shinsei Bank Ltd. | 398,600 | 6,227,669 | |
| Ship Healthcare Holdings, Inc. | 50,200 | 1,747,265 | |
| SHO-BOND Holdings Co. Ltd. | 693,600 | 52,533,919 | |
| Shoei Co. Ltd. (a)(e) | 847,300 | 31,506,353 | |
| SK Kaken Co. Ltd. | 217,000 | 22,132,730 | |
| Software Service, Inc. | 168,400 | 11,845,920 | |
| Techno Medica Co. Ltd. | 283,000 | 5,410,446 | |
| The Monogatari Corp. | 178,700 | 19,485,035 | |
| TKC Corp. | 491,500 | 19,669,891 | |
| Tocalo Co. Ltd. | 1,595,000 | 19,886,434 | |
| Toshiba Plant Systems & Services Corp. | 178,800 | 3,738,902 | |
| Tsuruha Holdings, Inc. | 29,870 | 4,297,979 | |
| USS Co. Ltd. | 3,404,200 | 71,652,618 | |
| Welcia Holdings Co. Ltd. | 646,000 | 33,269,118 | |
| Workman Co. Ltd. | 650,700 | 25,951,811 | |
| Yamato Kogyo Co. Ltd. | 372,700 | 11,080,086 | |
| Yuasa Trading Co. Ltd. | 105,500 | 3,382,524 | |
| TOTAL JAPAN | 1,257,658,821 | ||
| Korea (South) - 0.9% | |||
| BGF Retail Co. Ltd. | 134,460 | 23,981,007 | |
| iMarketKorea, Inc. | 91,458 | 774,587 | |
| Leeno Industrial, Inc. | 134,483 | 7,195,533 | |
| TOTAL KOREA (SOUTH) | 31,951,127 | ||
| Luxembourg - 0.1% | |||
| B&M European Value Retail S.A. | 653,731 | 3,647,665 | |
| Mexico - 0.3% | |||
| Consorcio ARA S.A.B. de CV | 25,765,095 | 9,726,290 | |
| Genomma Lab Internacional SA de CV (b) | 1,109,000 | 1,078,636 | |
| TOTAL MEXICO | 10,804,926 | ||
| Netherlands - 2.8% | |||
| Aalberts Industries NV | 984,900 | 48,573,676 | |
| Arcadis NV | 135,318 | 2,670,120 | |
| Arcadis NV rights (b) | 135,318 | 76,803 | |
| BinckBank NV | 644,130 | 3,757,022 | |
| Intertrust NV (c) | 220,360 | 4,390,761 | |
| PostNL NV | 842,900 | 3,278,611 | |
| PostNL NV rights 5/13/18 (a)(b) | 842,900 | 173,041 | |
| RHI Magnesita NV | 25,148 | 1,506,289 | |
| Takeaway.com Holding BV (b)(c) | 232,278 | 13,520,048 | |
| Van Lanschot NV (Bearer) | 227,504 | 7,033,186 | |
| VastNed Retail NV | 302,554 | 15,144,347 | |
| TOTAL NETHERLANDS | 100,123,904 | ||
| New Zealand - 0.0% | |||
| EBOS Group Ltd. | 136,231 | 1,704,251 | |
| Norway - 1.4% | |||
| ABG Sundal Collier ASA | 4,483,578 | 3,532,181 | |
| Borregaard ASA | 290,000 | 3,083,530 | |
| Kongsberg Gruppen ASA | 946,448 | 23,241,496 | |
| Schibsted ASA (A Shares) | 82,366 | 2,408,669 | |
| Skandiabanken ASA (c) | 1,970,249 | 17,805,748 | |
| TOTAL NORWAY | 50,071,624 | ||
| Philippines - 0.5% | |||
| Jollibee Food Corp. | 3,045,490 | 16,762,348 | |
| Pilipinas Shell Petroleum Corp. | 3,233,850 | 3,253,608 | |
| TOTAL PHILIPPINES | 20,015,956 | ||
| Singapore - 0.1% | |||
| Boustead Singapore Ltd. | 5,792,200 | 3,520,229 | |
| Hour Glass Ltd. | 1,558,300 | 763,109 | |
| TOTAL SINGAPORE | 4,283,338 | ||
| South Africa - 1.1% | |||
| Clicks Group Ltd. | 2,379,853 | 40,688,168 | |
| Spain - 2.8% | |||
| Baron de Ley SA (b) | 9,415 | 1,273,390 | |
| Hispania Activos Inmobiliarios SA | 1,100,650 | 23,392,951 | |
| Merlin Properties Socimi SA | 1,590,500 | 24,584,804 | |
| Prosegur Cash SA (c) | 1,033,400 | 3,020,000 | |
| Prosegur Compania de Seguridad SA (Reg.) | 6,274,186 | 47,581,720 | |
| TOTAL SPAIN | 99,852,865 | ||
| Sweden - 4.1% | |||
| Addlife AB | 537,000 | 11,253,105 | |
| AddTech AB (B Shares) | 1,373,010 | 28,630,998 | |
| Fagerhult AB (a) | 3,347,305 | 34,212,147 | |
| Granges AB | 215,000 | 3,019,991 | |
| Lagercrantz Group AB (B Shares) | 2,126,041 | 20,006,027 | |
| Loomis AB (B Shares) | 701,600 | 25,655,053 | |
| Saab AB (B Shares) (a) | 582,100 | 23,897,832 | |
| TOTAL SWEDEN | 146,675,153 | ||
| Switzerland - 0.7% | |||
| EDAG Engineering Group AG | 175,700 | 3,365,101 | |
| Tecan Group AG | 67,923 | 15,010,229 | |
| Vontobel Holdings AG | 88,220 | 5,839,790 | |
| TOTAL SWITZERLAND | 24,215,120 | ||
| Taiwan - 0.4% | |||
| Addcn Technology Co. Ltd. | 1,655,570 | 14,311,454 | |
| United Kingdom - 16.9% | |||
| Alliance Pharma PLC | 14,391,866 | 16,048,758 | |
| Ascential PLC | 5,878,940 | 34,106,164 | |
| Avon Rubber PLC | 591,677 | 10,955,855 | |
| Cineworld Group PLC | 4,710,400 | 16,886,439 | |
| Countrywide PLC (b) | 3,763,869 | 5,585,893 | |
| Dechra Pharmaceuticals PLC | 1,907,363 | 72,001,264 | |
| DP Poland PLC (b)(e) | 7,918,000 | 3,324,717 | |
| Elementis PLC | 8,274,282 | 32,305,455 | |
| Equiniti Group PLC (c) | 1,717,223 | 6,513,098 | |
| GetBusy PLC (a) | 2,405,905 | 1,126,151 | |
| Great Portland Estates PLC | 2,460,172 | 23,620,372 | |
| H&T Group PLC | 1,274,806 | 5,975,862 | |
| Hill & Smith Holdings PLC | 123,063 | 2,248,214 | |
| Hilton Food Group PLC | 1,019,138 | 12,430,999 | |
| Howden Joinery Group PLC | 1,942,000 | 12,744,820 | |
| Indivior PLC (b) | 359,400 | 2,241,875 | |
| Informa PLC | 4,379,938 | 44,560,670 | |
| InterContinental Hotel Group PLC ADR | 187,247 | 11,916,399 | |
| ITE Group PLC | 8,271,572 | 17,308,959 | |
| LivaNova PLC (b) | 35,384 | 3,141,392 | |
| LSL Property Services PLC | 500,000 | 1,720,875 | |
| Luxfer Holdings PLC sponsored | 225,000 | 3,150,000 | |
| Mears Group PLC | 790,738 | 3,559,751 | |
| Mitie Group PLC | 1,448,060 | 3,656,160 | |
| PayPoint PLC | 35,600 | 421,000 | |
| Polypipe Group PLC | 444,600 | 2,345,494 | |
| Rightmove PLC | 479,647 | 30,144,066 | |
| Shaftesbury PLC | 2,772,755 | 38,592,416 | |
| Sinclair Pharma PLC (b) | 3,630,425 | 749,701 | |
| Spectris PLC | 2,015,161 | 74,627,915 | |
| Spirax-Sarco Engineering PLC | 910,628 | 72,273,590 | |
| Topps Tiles PLC (e) | 10,714,845 | 10,178,278 | |
| Tullett Prebon PLC | 1,076,603 | 6,983,935 | |
| Ultra Electronics Holdings PLC | 1,144,827 | 22,191,253 | |
| Zpg PLC | 680,923 | 3,365,362 | |
| TOTAL UNITED KINGDOM | 609,003,152 | ||
| United States of America - 2.0% | |||
| Autoliv, Inc. | 96,700 | 12,962,635 | |
| Martin Marietta Materials, Inc. | 58,080 | 11,312,242 | |
| Mohawk Industries, Inc. (b) | 32,962 | 6,918,065 | |
| PriceSmart, Inc. | 263,926 | 23,119,918 | |
| ResMed, Inc. | 171,700 | 16,249,688 | |
| TOTAL UNITED STATES OF AMERICA | 70,562,548 | ||
| TOTAL COMMON STOCKS | |||
| (Cost $2,211,774,971) | 3,441,590,468 | ||
| Nonconvertible Preferred Stocks - 1.4% | |||
| Brazil - 0.2% | |||
| Banco ABC Brasil SA | 1,051,382 | 5,630,260 | |
| Germany - 1.2% | |||
| Sartorius AG (non-vtg.) | 290,755 | 44,872,591 | |
| TOTAL NONCONVERTIBLE PREFERRED STOCKS | |||
| (Cost $11,851,470) | 50,502,851 | ||
| Money Market Funds - 3.3% | |||
| Fidelity Cash Central Fund, 1.74% (f) | 104,987,218 | 105,008,215 | |
| Fidelity Securities Lending Cash Central Fund 1.74% (f)(g) | 14,334,626 | 14,336,060 | |
| TOTAL MONEY MARKET FUNDS | |||
| (Cost $119,344,275) | 119,344,275 | ||
| TOTAL INVESTMENT IN SECURITIES - 100.1% | |||
| (Cost $2,342,970,716) | 3,611,437,594 | ||
| NET OTHER ASSETS (LIABILITIES) - (0.1)% | (2,373,391) | ||
| NET ASSETS - 100% | $3,609,064,203 |
Categorizations in the Schedule of Investments are based on country or territory of incorporation.
Legend
(a) Security or a portion of the security is on loan at period end.
(b) Non-income producing
(c) Security exempt from registration under Rule 144A of the Securities Act of 1933. These securities may be resold in transactions exempt from registration, normally to qualified institutional buyers. At the end of the period, the value of these securities amounted to $65,606,080 or 1.8% of net assets.
(d) Level 3 security
(e) Affiliated company
(f) Affiliated fund that is generally available only to investment companies and other accounts managed by Fidelity Investments. The rate quoted is the annualized seven-day yield of the fund at period end. A complete unaudited listing of the fund's holdings as of its most recent quarter end is available upon request. In addition, each Fidelity Central Fund's financial statements are available on the SEC's website or upon request.
(g) Investment made with cash collateral received from securities on loan.
Affiliated Central Funds
Information regarding fiscal year to date income earned by the Fund from investments in Fidelity Central Funds is as follows:
| Fund | Income earned |
| Fidelity Cash Central Fund | $418,786 |
| Fidelity Securities Lending Cash Central Fund | 443,891 |
| Total | $862,677 |
Amounts in the income column in the above table include any capital gain distributions from underlying funds, which are presented in the corresponding line-item in the Statement of Operations if applicable.
Other Affiliated Issuers
An affiliated company is a company in which the Fund has ownership of at least 5% of the voting securities. Fiscal year to date transactions with companies which are or were affiliates are as follows:
| Affiliate | Value, beginning of period | Purchases | Sales Proceeds | Dividend Income | Realized Gain (loss) | Change in Unrealized appreciation (depreciation) | Value, end of period |
| Artnature, Inc. | $11,683,496 | $-- | $683,832 | $198,137 | $(462,434) | $1,002,287 | $-- |
| DP Poland PLC | 3,859,020 | 471,160 | -- | -- | -- | (1,005,463) | 3,324,717 |
| Ituran Location & Control Ltd. | 34,047,553 | 8,289,006 | -- | 364,783 | -- | (4,350,203) | 37,986,356 |
| Reckon Ltd. | 5,651,804 | 81 | -- | -- | -- | 51,876 | 5,703,761 |
| Shoei Co. Ltd. | 27,389,174 | 1,193,673 | -- | 44,492 | -- | 2,923,506 | 31,506,353 |
| Topps Tiles PLC | 9,904,292 | 33,470 | 2,112 | 329,175 | (513) | 243,141 | 10,178,278 |
| Total | $92,535,339 | $9,987,390 | $685,944 | $936,587 | $(462,947) | $(1,134,856) | $88,699,465 |
Investment Valuation
The following is a summary of the inputs used, as of April 30, 2018, involving the Fund's assets and liabilities carried at fair value. The inputs or methodology used for valuing securities may not be an indication of the risk associated with investing in those securities. For more information on valuation inputs, and their aggregation into the levels used below, please refer to the Investment Valuation section in the accompanying Notes to Financial Statements.
| Valuation Inputs at Reporting Date: | ||||
| Description | Total | Level 1 | Level 2 | Level 3 |
| Investments in Securities: | ||||
| Equities: | ||||
| Consumer Discretionary | $574,776,623 | $536,889,427 | $37,887,196 | $-- |
| Consumer Staples | 335,065,868 | 287,318,441 | 47,747,427 | -- |
| Energy | 82,999,802 | 79,746,194 | 3,253,608 | -- |
| Financials | 295,258,447 | 279,091,983 | 16,166,464 | -- |
| Health Care | 435,048,182 | 431,738,718 | 3,309,464 | -- |
| Industrials | 810,960,981 | 801,898,302 | 9,062,679 | -- |
| Information Technology | 481,136,952 | 460,459,858 | 20,677,094 | -- |
| Materials | 277,782,095 | 177,917,720 | 99,864,305 | 70 |
| Real Estate | 199,064,369 | 199,064,369 | -- | -- |
| Money Market Funds | 119,344,275 | 119,344,275 | -- | -- |
| Total Investments in Securities: | $3,611,437,594 | $3,373,469,287 | $237,968,237 | $70 |
The following is a summary of transfers between Level 1 and Level 2 for the period ended April 30, 2018. Transfers are assumed to have occurred at the beginning of the period, and are primarily attributable to the valuation techniques used for foreign equity securities, as discussed in the accompanying Notes to Financial Statements:
| Transfers | Total |
| Level 1 to Level 2 | $235,269,793 |
| Level 2 to Level 1 | $1,161,520,596 |
The following is a reconciliation of Investments in Securities and Derivative Instruments for which Level 3 inputs were used in determining value:
| Investments in Securities: | |
| Equities - Industrials | |
| Beginning Balance | $45,204,204 |
| Net Realized Gain (Loss) on Investment Securities | (5,131,681) |
| Net Unrealized Gain (Loss) on Investment Securities | (12,049,961) |
| Cost of Purchases | -- |
| Proceeds of Sales | (28,022,562) |
| Amortization/Accretion | -- |
| Transfers into Level 3 | -- |
| Transfers out of Level 3 | -- |
| Ending Balance | $-- |
| The change in unrealized gain (loss) for the period attributable to Level 3 securities held at April 30, 2018 | $-- |
| Other Investments in Securities | |
| Beginning Balance | $2,086,834 |
| Net Realized Gain (Loss) on Investment Securities | -- |
| Net Unrealized Gain (Loss) on Investment Securities | (2,086,764) |
| Cost of Purchases | -- |
| Proceeds of Sales | -- |
| Amortization/Accretion | -- |
| Transfers into Level 3 | -- |
| Transfers out of Level 3 | -- |
| Ending Balance | $70 |
| The change in unrealized gain (loss) for the period attributable to Level 3 securities held at April 30, 2018 | $(2,086,764) |
The information used in the above reconciliation represents fiscal year to date activity for any Investments in Securities identified as using Level 3 inputs at either the beginning or the end of the current fiscal period. Transfers in or out of Level 3 represent the beginning value of any Security or Instrument where a change in the pricing level occurred from the beginning to the end of the period. The cost of purchases and the proceeds of sales may include securities received or delivered through corporate actions or exchanges. Realized and unrealized gains (losses) disclosed in the reconciliation are included in Net Gain (Loss) on the Fund's Statement of Operations.
See accompanying notes which are an integral part of the financial statements.
Fidelity® Series International Small Cap Fund
Financial Statements
Statement of Assets and Liabilities
| April 30, 2018 (Unaudited) | ||
| Assets | ||
| Investment in securities, at value (including securities loaned of $13,533,457) — See accompanying schedule: Unaffiliated issuers (cost $2,154,963,377) | $3,403,393,854 | |
| Fidelity Central Funds (cost $119,344,275) | 119,344,275 | |
| Other affiliated issuers (cost $68,663,064) | 88,699,465 | |
| Total Investment in Securities (cost $2,342,970,716) | $3,611,437,594 | |
| Cash | 86,307 | |
| Foreign currency held at value (cost $779,470) | 779,470 | |
| Receivable for investments sold | 5,748,254 | |
| Receivable for fund shares sold | 7,154,323 | |
| Dividends receivable | 13,589,307 | |
| Distributions receivable from Fidelity Central Funds | 211,645 | |
| Other receivables | 37,000 | |
| Total assets | 3,639,043,900 | |
| Liabilities | ||
| Payable for investments purchased | $8,688,624 | |
| Payable for fund shares redeemed | 6,801,745 | |
| Other payables and accrued expenses | 154,617 | |
| Collateral on securities loaned | 14,334,711 | |
| Total liabilities | 29,979,697 | |
| Net Assets | $3,609,064,203 | |
| Net Assets consist of: | ||
| Paid in capital | $2,199,368,527 | |
| Undistributed net investment income | 29,412,739 | |
| Accumulated undistributed net realized gain (loss) on investments and foreign currency transactions | 111,902,576 | |
| Net unrealized appreciation (depreciation) on investments and assets and liabilities in foreign currencies | 1,268,380,361 | |
| Net Assets | $3,609,064,203 | |
| Net Asset Value, offering price and redemption price per share ($3,609,064,203 ÷ 193,422,349 shares) | $18.66 |
See accompanying notes which are an integral part of the financial statements.
Statement of Operations
| Six months ended April 30, 2018 (Unaudited) | ||
| Investment Income | ||
| Dividends (including $936,587 earned from other affiliated issuers) | $39,605,796 | |
| Income from Fidelity Central Funds | 862,677 | |
| Income before foreign taxes withheld | 40,468,473 | |
| Less foreign taxes withheld | (3,515,242) | |
| Total income | 36,953,231 | |
| Expenses | ||
| Custodian fees and expenses | $213,788 | |
| Independent trustees' fees and expenses | 7,228 | |
| Interest | 2,458 | |
| Miscellaneous | 5,204 | |
| Total expenses before reductions | 228,678 | |
| Expense reductions | (37,858) | 190,820 |
| Net investment income (loss) | 36,762,411 | |
| Realized and Unrealized Gain (Loss) | ||
| Net realized gain (loss) on: | ||
| Investment securities: | ||
| Unaffiliated issuers | 177,627,683 | |
| Fidelity Central Funds | 5,383 | |
| Other affiliated issuers | (462,947) | |
| Foreign currency transactions | (81,311) | |
| Total net realized gain (loss) | 177,088,808 | |
| Change in net unrealized appreciation (depreciation) on: | ||
| Investment securities: | ||
| Unaffiliated issuers | 117,276,906 | |
| Fidelity Central Funds | (6,339) | |
| Other affiliated issuers | (1,134,856) | |
| Assets and liabilities in foreign currencies | (92,695) | |
| Total change in net unrealized appreciation (depreciation) | 116,043,016 | |
| Net gain (loss) | 293,131,824 | |
| Net increase (decrease) in net assets resulting from operations | $329,894,235 |
See accompanying notes which are an integral part of the financial statements.
Statement of Changes in Net Assets
| Six months ended April 30, 2018 (Unaudited) | Year ended October 31, 2017 | |
| Increase (Decrease) in Net Assets | ||
| Operations | ||
| Net investment income (loss) | $36,762,411 | $51,126,067 |
| Net realized gain (loss) | 177,088,808 | 129,673,688 |
| Change in net unrealized appreciation (depreciation) | 116,043,016 | 594,814,022 |
| Net increase (decrease) in net assets resulting from operations | 329,894,235 | 775,613,777 |
| Distributions to shareholders from net investment income | (54,863,235) | (34,157,192) |
| Distributions to shareholders from net realized gain | (163,242,187) | (85,456,930) |
| Total distributions | (218,105,422) | (119,614,122) |
| Share transactions - net increase (decrease) | (74,885,547) | 11,810,740 |
| Total increase (decrease) in net assets | 36,903,266 | 667,810,395 |
| Net Assets | ||
| Beginning of period | 3,572,160,937 | 2,904,350,542 |
| End of period | $3,609,064,203 | $3,572,160,937 |
| Other Information | ||
| Undistributed net investment income end of period | $29,412,739 | $47,513,563 |
See accompanying notes which are an integral part of the financial statements.
Financial Highlights
Fidelity Series International Small Cap Fund
| Six months ended (Unaudited) April 30, | Years endedOctober 31, | |||||
| 2018 | 2017 | 2016 | 2015 | 2014 | 2013 | |
| Selected Per–Share Data | ||||||
| Net asset value, beginning of period | $18.17 | $15.02 | $16.11 | $15.21 | $15.75 | $12.44 |
| Income from Investment Operations | ||||||
| Net investment income (loss)A | .19 | .25 | .15 | .14 | .14 | .15 |
| Net realized and unrealized gain (loss) | 1.43 | 3.47 | (.13) | 1.10 | (.11) | 3.29 |
| Total from investment operations | 1.62 | 3.72 | .02 | 1.24 | .03 | 3.44 |
| Distributions from net investment income | (.29) | (.15) | (.15) | (.14) | (.13) | (.12) |
| Distributions from net realized gain | (.85) | (.42) | (.96) | (.20) | (.44) | (.01) |
| Total distributions | (1.13)B | (.57) | (1.11) | (.34) | (.57) | (.13) |
| Net asset value, end of period | $18.66 | $18.17 | $15.02 | $16.11 | $15.21 | $15.75 |
| Total ReturnC,D | 9.35% | 25.87% | .02% | 8.36% | .21% | 27.95% |
| Ratios to Average Net AssetsE,F | ||||||
| Expenses before reductions | .01%G | .56% | 1.06% | 1.10% | 1.18% | 1.23% |
| Expenses net of fee waivers, if any | .01%G | .56% | 1.06% | 1.10% | 1.18% | 1.23% |
| Expenses net of all reductions | .01%G | .55% | 1.05% | 1.10% | 1.18% | 1.22% |
| Net investment income (loss) | 2.00%G | 1.52% | 1.01% | .89% | .86% | 1.05% |
| Supplemental Data | ||||||
| Net assets, end of period (000 omitted) | $3,609,064 | $3,572,161 | $1,303,650 | $1,276,570 | $1,330,809 | $1,163,381 |
| Portfolio turnover rateH | 12%G | 21% | 21% | 16% | 18% | 29% |
A Calculated based on average shares outstanding during the period.
B Total distributions of $1.13 per share is comprised of distributions from net investment income of $.285 and distributions from net realized gain of $.848 per share.
C Total returns for periods of less than one year are not annualized.
D Total returns would have been lower if certain expenses had not been reduced during the applicable periods shown.
E Fees and expenses of any underlying Fidelity Central Funds are not included in the Fund's expense ratio. The Fund indirectly bears its proportionate share of the expenses of any underlying Fidelity Central Funds.
F Expense ratios reflect operating expenses of the class. Expenses before reductions do not reflect amounts reimbursed by the investment adviser or reductions from brokerage service arrangements or reductions from other expense offset arrangements and do not represent the amount paid by the class during periods when reimbursements or reductions occur. Expenses net of fee waivers reflect expenses after reimbursement by the investment adviser but prior to reductions from brokerage service arrangements or other expense offset arrangements. Expenses net of all reductions represent the net expenses paid by the class.
G Annualized
H Amount does not include the portfolio activity of any underlying Fidelity Central Funds.
See accompanying notes which are an integral part of the financial statements.
Fidelity® Series International Value Fund
Investment Summary (Unaudited)
Geographic Diversification (% of fund's net assets)
| As of April 30, 2018 | ||
| Japan | 22.4% | |
| United Kingdom | 16.7% | |
| France | 15.4% | |
| Germany | 9.3% | |
| Switzerland | 8.5% | |
| Spain | 4.3% | |
| Australia | 3.6% | |
| Sweden | 3.4% | |
| Netherlands | 3.1% | |
| Other* | 13.3% | |

* Includes Short-Term investments and Net Other Assets (Liabilities).
Percentages are based on country or territory of incorporation and are adjusted for the effect of futures contracts, if applicable.
Asset Allocation as of April 30, 2018
| % of fund's net assets | |
| Stocks | 99.2 |
| Short-Term Investments and Net Other Assets (Liabilities) | 0.8 |
Top Ten Stocks as of April 30, 2018
| % of fund's net assets | |
| Total SA (France, Oil, Gas & Consumable Fuels) | 3.1 |
| Novartis AG (Switzerland, Pharmaceuticals) | 2.7 |
| BP PLC (United Kingdom, Oil, Gas & Consumable Fuels) | 2.3 |
| Banco Santander SA (Spain) (Spain, Banks) | 2.3 |
| Royal Dutch Shell PLC Class B sponsored ADR (United Kingdom, Oil, Gas & Consumable Fuels) | 2.0 |
| Mitsubishi UFJ Financial Group, Inc. (Japan, Banks) | 1.8 |
| BASF AG (Germany, Chemicals) | 1.8 |
| Commonwealth Bank of Australia (Australia, Banks) | 1.7 |
| Sanofi SA (France, Pharmaceuticals) | 1.7 |
| Honda Motor Co. Ltd. (Japan, Automobiles) | 1.6 |
| 21.0 |
Top Market Sectors as of April 30, 2018
| % of fund's net assets | |
| Financials | 39.5 |
| Industrials | 12.3 |
| Energy | 10.6 |
| Health Care | 9.2 |
| Consumer Discretionary | 7.5 |
| Materials | 7.2 |
| Information Technology | 4.7 |
| Consumer Staples | 4.0 |
| Telecommunication Services | 2.4 |
| Real Estate | 1.8 |
Fidelity® Series International Value Fund
Schedule of Investments April 30, 2018 (Unaudited)
Showing Percentage of Net Assets
| Common Stocks - 98.0% | |||
| Shares | Value | ||
| Australia - 3.6% | |||
| Commonwealth Bank of Australia | 4,750,075 | $255,765,093 | |
| Insurance Australia Group Ltd. | 17,901,270 | 105,974,070 | |
| Macquarie Group Ltd. | 1,515,613 | 123,428,897 | |
| Magellan Financial Group Ltd. | 2,868,826 | 50,119,742 | |
| TOTAL AUSTRALIA | 535,287,802 | ||
| Austria - 1.0% | |||
| Erste Group Bank AG | 2,989,600 | 146,575,783 | |
| Bailiwick of Jersey - 0.6% | |||
| Wolseley PLC | 1,258,564 | 96,682,711 | |
| Belgium - 1.3% | |||
| KBC Groep NV | 2,299,467 | 201,042,952 | |
| Canada - 0.4% | |||
| Nutrien Ltd. | 1,414,680 | 64,401,298 | |
| Finland - 0.9% | |||
| Sampo Oyj (A Shares) | 2,488,413 | 134,474,088 | |
| France - 15.4% | |||
| Accor SA | 1,457,400 | 82,489,149 | |
| Atos Origin SA | 1,101,043 | 148,784,425 | |
| AXA SA (a) | 8,292,973 | 237,167,882 | |
| Bouygues SA (a) | 2,001,799 | 102,133,987 | |
| Capgemini SA | 996,905 | 137,240,323 | |
| Compagnie de St. Gobain | 1,499,300 | 78,750,076 | |
| Natixis SA | 16,079,100 | 132,269,430 | |
| Sanofi SA (a) | 3,146,060 | 248,734,814 | |
| Societe Generale Series A | 4,159,900 | 227,666,282 | |
| SR Teleperformance SA | 733,400 | 117,703,395 | |
| Total SA (a) | 7,305,532 | 459,165,499 | |
| VINCI SA (a) | 2,035,100 | 203,476,831 | |
| Vivendi SA | 4,697,581 | 124,177,566 | |
| TOTAL FRANCE | 2,299,759,659 | ||
| Germany - 8.5% | |||
| BASF AG | 2,638,527 | 274,521,524 | |
| Brenntag AG | 1,312,300 | 75,306,535 | |
| Deutsche Post AG | 2,354,883 | 102,212,401 | |
| Deutsche Telekom AG | 10,854,770 | 189,997,782 | |
| Fresenius SE & Co. KGaA | 803,400 | 61,451,571 | |
| Hannover Reuck SE | 928,000 | 130,668,117 | |
| HeidelbergCement Finance AG | 755,200 | 74,107,456 | |
| Linde AG | 452,700 | 100,616,550 | |
| SAP SE | 838,667 | 93,180,668 | |
| Vonovia SE | 3,272,704 | 164,447,603 | |
| TOTAL GERMANY | 1,266,510,207 | ||
| Hong Kong - 0.4% | |||
| AIA Group Ltd. | 6,806,400 | 60,830,159 | |
| India - 0.0% | |||
| PC Jeweller Ltd. | 3,561,724 | 7,711,100 | |
| Indonesia - 0.3% | |||
| PT Bank Rakyat Indonesia Tbk | 191,864,200 | 44,237,837 | |
| Ireland - 0.8% | |||
| Allergan PLC | 188,300 | 28,932,295 | |
| CRH PLC | 2,683,861 | 95,307,708 | |
| TOTAL IRELAND | 124,240,003 | ||
| Italy - 2.9% | |||
| Assicurazioni Generali SpA | 5,525,700 | 111,703,263 | |
| Intesa Sanpaolo SpA | 58,735,500 | 223,427,347 | |
| Mediobanca SpA | 8,229,191 | 100,021,653 | |
| TOTAL ITALY | 435,152,263 | ||
| Japan - 22.4% | |||
| AEON Financial Service Co. Ltd. | 2,594,300 | 60,894,382 | |
| East Japan Railway Co. | 882,100 | 84,643,514 | |
| Honda Motor Co. Ltd. | 6,943,100 | 238,745,156 | |
| Hoya Corp. | 1,453,800 | 77,956,235 | |
| Idemitsu Kosan Co. Ltd. | 1,706,400 | 66,885,510 | |
| Itochu Corp. | 9,545,900 | 191,581,637 | |
| Japan Tobacco, Inc. | 3,158,200 | 84,834,013 | |
| Kao Corp. | 1,380,900 | 99,222,187 | |
| Makita Corp. | 2,362,200 | 106,311,965 | |
| Mitsubishi UFJ Financial Group, Inc. | 41,432,300 | 277,652,069 | |
| Mitsui Fudosan Co. Ltd. | 4,170,600 | 107,259,805 | |
| Nintendo Co. Ltd. | 176,100 | 73,993,085 | |
| Nomura Holdings, Inc. | 17,398,700 | 100,208,770 | |
| OBIC Co. Ltd. | 1,457,000 | 122,216,337 | |
| Olympus Corp. | 1,825,500 | 68,214,119 | |
| Oracle Corp. Japan | 888,600 | 73,155,873 | |
| ORIX Corp. | 10,017,200 | 176,299,788 | |
| Panasonic Corp. | 7,264,109 | 107,560,752 | |
| Recruit Holdings Co. Ltd. | 3,787,600 | 87,552,737 | |
| Shin-Etsu Chemical Co. Ltd. | 1,263,100 | 127,153,453 | |
| Shinsei Bank Ltd. | 5,426,500 | 84,782,858 | |
| SoftBank Corp. | 1,538,200 | 117,531,877 | |
| Sony Corp. | 1,922,100 | 89,773,828 | |
| Sony Financial Holdings, Inc. | 5,712,400 | 104,455,613 | |
| Subaru Corp. | 3,154,200 | 106,149,852 | |
| Sumitomo Mitsui Financial Group, Inc. | 4,361,500 | 181,779,759 | |
| T&D Holdings, Inc. | 5,969,900 | 101,518,881 | |
| Taiheiyo Cement Corp. | 1,956,400 | 74,179,272 | |
| Tokio Marine Holdings, Inc. | 3,255,900 | 154,038,738 | |
| TOTAL JAPAN | 3,346,552,065 | ||
| Netherlands - 3.1% | |||
| ING Groep NV (Certificaten Van Aandelen) | 11,894,234 | 200,424,049 | |
| Koninklijke Philips Electronics NV | 1,957,600 | 82,857,827 | |
| RELX NV | 3,822,267 | 81,306,782 | |
| Wolters Kluwer NV | 1,907,361 | 103,258,246 | |
| TOTAL NETHERLANDS | 467,846,904 | ||
| Norway - 1.4% | |||
| Statoil ASA | 8,212,767 | 210,022,702 | |
| Portugal - 0.7% | |||
| Galp Energia SGPS SA Class B | 5,150,975 | 98,996,352 | |
| Spain - 3.9% | |||
| Banco Santander SA (Spain) | 53,763,348 | 348,839,979 | |
| CaixaBank SA | 26,877,808 | 130,703,398 | |
| Masmovil Ibercom SA (b) | 309,852 | 44,751,602 | |
| Unicaja Banco SA | 31,565,347 | 57,215,588 | |
| TOTAL SPAIN | 581,510,567 | ||
| Sweden - 3.4% | |||
| Alfa Laval AB (a) | 3,453,900 | 85,867,772 | |
| Investor AB (B Shares) | 2,344,795 | 102,583,861 | |
| Nordea Bank AB | 18,467,733 | 188,501,993 | |
| Swedbank AB (A Shares) | 5,794,400 | 126,354,334 | |
| TOTAL SWEDEN | 503,307,960 | ||
| Switzerland - 8.5% | |||
| Credit Suisse Group AG | 9,264,050 | 156,249,712 | |
| Lafargeholcim Ltd. (Reg.) | 1,522,460 | 85,048,825 | |
| Nestle SA (Reg. S) | 2,593,173 | 200,893,354 | |
| Novartis AG | 5,299,376 | 407,915,846 | |
| UBS Group AG (a) | 13,983,671 | 234,925,673 | |
| Zurich Insurance Group AG | 604,200 | 193,002,955 | |
| TOTAL SWITZERLAND | 1,278,036,365 | ||
| United Kingdom - 16.7% | |||
| AstraZeneca PLC (United Kingdom) | 2,289,756 | 160,288,355 | |
| Aviva PLC | 23,288,382 | 169,205,752 | |
| BAE Systems PLC | 14,236,872 | 119,450,575 | |
| BHP Billiton PLC | 9,060,766 | 193,197,544 | |
| BP PLC | 47,280,731 | 351,199,666 | |
| British American Tobacco PLC (United Kingdom) | 1,471,331 | 80,698,842 | |
| Bunzl PLC | 3,329,412 | 96,759,828 | |
| Compass Group PLC | 3,942,290 | 84,666,671 | |
| GlaxoSmithKline PLC | 4,765,562 | 95,583,675 | |
| HSBC Holdings PLC sponsored ADR (a) | 3,071,906 | 154,393,996 | |
| Imperial Tobacco Group PLC | 3,635,374 | 130,350,522 | |
| Informa PLC | 10,645,964 | 108,310,048 | |
| Liberty Global PLC Class A (b) | 2,367,200 | 71,347,408 | |
| Micro Focus International PLC | 3,239,105 | 55,852,315 | |
| Royal Dutch Shell PLC Class B sponsored ADR (a) | 4,159,400 | 301,223,748 | |
| Standard Chartered PLC (United Kingdom) | 11,796,105 | 124,558,482 | |
| Standard Life PLC | 24,254,063 | 121,975,748 | |
| The Weir Group PLC | 2,962,300 | 87,110,319 | |
| TOTAL UNITED KINGDOM | 2,506,173,494 | ||
| United States of America - 1.8% | |||
| Amgen, Inc. | 413,700 | 72,182,376 | |
| ConocoPhillips Co. | 1,638,600 | 107,328,300 | |
| S&P Global, Inc. | 462,300 | 87,189,780 | |
| TOTAL UNITED STATES OF AMERICA | 266,700,456 | ||
| TOTAL COMMON STOCKS | |||
| (Cost $12,357,857,756) | 14,676,052,727 | ||
| Nonconvertible Preferred Stocks - 1.2% | |||
| Germany - 0.8% | |||
| Porsche Automobil Holding SE (Germany) | 1,296,900 | 110,882,460 | |
| Spain - 0.4% | |||
| Grifols SA Class B | 3,097,238 | 63,841,393 | |
| TOTAL NONCONVERTIBLE PREFERRED STOCKS | |||
| (Cost $154,668,424) | 174,723,853 | ||
| Money Market Funds - 3.3% | |||
| Fidelity Cash Central Fund, 1.74% (c) | 18,564,483 | 18,568,196 | |
| Fidelity Securities Lending Cash Central Fund 1.74% (c)(d) | 479,508,672 | 479,556,623 | |
| TOTAL MONEY MARKET FUNDS | |||
| (Cost $498,124,819) | 498,124,819 | ||
| TOTAL INVESTMENT IN SECURITIES - 102.5% | |||
| (Cost $13,010,650,999) | 15,348,901,399 | ||
| NET OTHER ASSETS (LIABILITIES) - (2.5)% | (377,893,709) | ||
| NET ASSETS - 100% | $14,971,007,690 |
Categorizations in the Schedule of Investments are based on country or territory of incorporation.
Legend
(a) Security or a portion of the security is on loan at period end.
(b) Non-income producing
(c) Affiliated fund that is generally available only to investment companies and other accounts managed by Fidelity Investments. The rate quoted is the annualized seven-day yield of the fund at period end. A complete unaudited listing of the fund's holdings as of its most recent quarter end is available upon request. In addition, each Fidelity Central Fund's financial statements are available on the SEC's website or upon request.
(d) Investment made with cash collateral received from securities on loan.
Affiliated Central Funds
Information regarding fiscal year to date income earned by the Fund from investments in Fidelity Central Funds is as follows:
| Fund | Income earned |
| Fidelity Cash Central Fund | $516,753 |
| Fidelity Securities Lending Cash Central Fund | 3,864,741 |
| Total | $4,381,494 |
Amounts in the income column in the above table include any capital gain distributions from underlying funds, which are presented in the corresponding line-item in the Statement of Operations if applicable.
Investment Valuation
The following is a summary of the inputs used, as of April 30, 2018, involving the Fund's assets and liabilities carried at fair value. The inputs or methodology used for valuing securities may not be an indication of the risk associated with investing in those securities. For more information on valuation inputs, and their aggregation into the levels used below, please refer to the Investment Valuation section in the accompanying Notes to Financial Statements.
| Valuation Inputs at Reporting Date: | ||||
| Description | Total | Level 1 | Level 2 | Level 3 |
| Investments in Securities: | ||||
| Equities: | ||||
| Consumer Discretionary | $1,131,813,990 | $688,023,154 | $443,790,836 | $-- |
| Consumer Staples | 595,998,918 | 314,406,722 | 281,592,196 | -- |
| Energy | 1,594,821,777 | 574,433,910 | 1,020,387,867 | -- |
| Financials | 5,923,128,753 | 3,185,284,980 | 2,737,843,773 | -- |
| Health Care | 1,367,958,506 | 308,736,596 | 1,059,221,910 | -- |
| Industrials | 1,820,109,311 | 1,394,969,504 | 425,139,807 | -- |
| Information Technology | 704,423,026 | 481,396,958 | 223,026,068 | -- |
| Materials | 1,088,533,630 | 525,506,854 | 563,026,776 | -- |
| Real Estate | 271,707,408 | 271,707,408 | -- | -- |
| Telecommunication Services | 352,281,261 | 44,751,602 | 307,529,659 | -- |
| Money Market Funds | 498,124,819 | 498,124,819 | -- | -- |
| Total Investments in Securities: | $15,348,901,399 | $8,287,342,507 | $7,061,558,892 | $-- |
The following is a summary of transfers between Level 1 and Level 2 for the period ended April 30, 2018. Transfers are assumed to have occurred at the beginning of the period, and are primarily attributable to the valuation techniques used for foreign equity securities, as discussed in the accompanying Notes to Financial Statements:
| Transfers | Total |
| Level 1 to Level 2 | $1,590,224,881 |
| Level 2 to Level 1 | $2,188,186,517 |
See accompanying notes which are an integral part of the financial statements.
Fidelity® Series International Value Fund
Financial Statements
Statement of Assets and Liabilities
| April 30, 2018 (Unaudited) | ||
| Assets | ||
| Investment in securities, at value (including securities loaned of $462,223,750) — See accompanying schedule: Unaffiliated issuers (cost $12,512,526,180) | $14,850,776,580 | |
| Fidelity Central Funds (cost $498,124,819) | 498,124,819 | |
| Total Investment in Securities (cost $13,010,650,999) | $15,348,901,399 | |
| Foreign currency held at value (cost $10,939,862) | 10,891,607 | |
| Receivable for fund shares sold | 3,801,754 | |
| Dividends receivable | 92,070,989 | |
| Distributions receivable from Fidelity Central Funds | 1,184,266 | |
| Other receivables | 806,037 | |
| Total assets | 15,457,656,052 | |
| Liabilities | ||
| Payable for investments purchased | $4,313,584 | |
| Payable for fund shares redeemed | 2,330,496 | |
| Other payables and accrued expenses | 451,162 | |
| Collateral on securities loaned | 479,553,120 | |
| Total liabilities | 486,648,362 | |
| Net Assets | $14,971,007,690 | |
| Net Assets consist of: | ||
| Paid in capital | $12,988,293,290 | |
| Undistributed net investment income | 190,252,911 | |
| Accumulated undistributed net realized gain (loss) on investments and foreign currency transactions | (544,490,603) | |
| Net unrealized appreciation (depreciation) on investments and assets and liabilities in foreign currencies | 2,336,952,092 | |
| Net Assets | $14,971,007,690 | |
| Net Asset Value, offering price and redemption price per share ($14,971,007,690 ÷ 1,395,248,136 shares) | $10.73 |
See accompanying notes which are an integral part of the financial statements.
Statement of Operations
| Six months ended April 30, 2018 (Unaudited) | ||
| Investment Income | ||
| Dividends | $251,718,328 | |
| Income from Fidelity Central Funds | 4,381,494 | |
| Income before foreign taxes withheld | 256,099,822 | |
| Less foreign taxes withheld | (23,416,035) | |
| Total income | 232,683,787 | |
| Expenses | ||
| Custodian fees and expenses | $659,789 | |
| Independent trustees' fees and expenses | 29,706 | |
| Interest | 7,287 | |
| Miscellaneous | 21,425 | |
| Total expenses | 718,207 | |
| Net investment income (loss) | 231,965,580 | |
| Realized and Unrealized Gain (Loss) | ||
| Net realized gain (loss) on: | ||
| Investment securities: | ||
| Unaffiliated issuers | 321,387,491 | |
| Fidelity Central Funds | (23,077) | |
| Foreign currency transactions | 555,051 | |
| Total net realized gain (loss) | 321,919,465 | |
| Change in net unrealized appreciation (depreciation) on: | ||
| Investment securities: | ||
| Unaffiliated issuers | (254,737,198) | |
| Fidelity Central Funds | 6,189 | |
| Assets and liabilities in foreign currencies | (1,188,917) | |
| Total change in net unrealized appreciation (depreciation) | (255,919,926) | |
| Net gain (loss) | 65,999,539 | |
| Net increase (decrease) in net assets resulting from operations | $297,965,119 |
See accompanying notes which are an integral part of the financial statements.
Statement of Changes in Net Assets
| Six months ended April 30, 2018 (Unaudited) | Year ended October 31, 2017 | |
| Increase (Decrease) in Net Assets | ||
| Operations | ||
| Net investment income (loss) | $231,965,580 | $412,099,973 |
| Net realized gain (loss) | 321,919,465 | 50,055,017 |
| Change in net unrealized appreciation (depreciation) | (255,919,926) | 2,178,152,740 |
| Net increase (decrease) in net assets resulting from operations | 297,965,119 | 2,640,307,730 |
| Distributions to shareholders from net investment income | (425,044,762) | (329,576,938) |
| Distributions to shareholders from net realized gain | (35,648,916) | (24,285,362) |
| Total distributions | (460,693,678) | (353,862,300) |
| Share transactions - net increase (decrease) | 340,602,108 | (355,425,913) |
| Total increase (decrease) in net assets | 177,873,549 | 1,931,019,517 |
| Net Assets | ||
| Beginning of period | 14,793,134,141 | 12,862,114,624 |
| End of period | $14,971,007,690 | $14,793,134,141 |
| Other Information | ||
| Undistributed net investment income end of period | $190,252,911 | $383,332,093 |
See accompanying notes which are an integral part of the financial statements.
Financial Highlights
Fidelity Series International Value Fund
| Six months ended (Unaudited) April 30, | Years endedOctober 31, | |||||
| 2018 | 2017 | 2016 | 2015 | 2014 | 2013 | |
| Selected Per–Share Data | ||||||
| Net asset value, beginning of period | $10.87 | $9.27 | $9.91 | $10.73 | $11.14 | $9.16 |
| Income from Investment Operations | ||||||
| Net investment income (loss)A | .17 | .29 | .24 | .22 | .45B | .26 |
| Net realized and unrealized gain (loss) | .03 | 1.55 | (.68) | (.28) | (.59) | 2.03 |
| Total from investment operations | .20 | 1.84 | (.44) | (.06) | (.14) | 2.29 |
| Distributions from net investment income | (.31) | (.22) | (.20) | (.44) | (.24) | (.26) |
| Distributions from net realized gain | (.03) | (.02) | – | (.32) | (.04) | (.06) |
| Total distributions | (.34) | (.24) | (.20) | (.76) | (.27)C | (.31)D |
| Net asset value, end of period | $10.73 | $10.87 | $9.27 | $9.91 | $10.73 | $11.14 |
| Total ReturnE,F | 1.86% | 20.33% | (4.49)% | (.65)% | (1.25)% | 25.78% |
| Ratios to Average Net AssetsG,H | ||||||
| Expenses before reductions | .01%I | .48% | .96% | .89% | .82% | .88% |
| Expenses net of fee waivers, if any | .01%I | .47% | .96% | .89% | .82% | .88% |
| Expenses net of all reductions | .01%I | .46% | .95% | .88% | .81% | .85% |
| Net investment income (loss) | 3.09%I | 2.86% | 2.58% | 2.12% | 4.05%B | 2.58% |
| Supplemental Data | ||||||
| Net assets, end of period (000 omitted) | $14,971,008 | $14,793,134 | $5,774,976 | $5,556,957 | $5,971,189 | $5,710,397 |
| Portfolio turnover rateJ | 46%I | 51% | 45% | 44% | 70% | 80% |
A Calculated based on average shares outstanding during the period.
B Net Investment income per share reflects a large, non-recurring dividend which amounted to $.18 per share. Excluding this non-recurring dividend, the ratio of net investment income (loss) to average net assets would have been 2.46%.
C Total distributions of $.27 per share is comprised of distributions from net investment income of $.237 and distributions from net realized gain of $.036 per share.
D Total distributions of $.31 per share is comprised of distributions from net investment income of $.256 and distributions from net realized gain of $.057 per share.
E Total returns for periods of less than one year are not annualized.
F Total returns would have been lower if certain expenses had not been reduced during the applicable periods shown.
G Fees and expenses of any underlying Fidelity Central Funds are not included in the Fund's expense ratio. The Fund indirectly bears its proportionate share of the expenses of any underlying Fidelity Central Funds.
H Expense ratios reflect operating expenses of the class. Expenses before reductions do not reflect amounts reimbursed by the investment adviser or reductions from brokerage service arrangements or reductions from other expense offset arrangements and do not represent the amount paid by the class during periods when reimbursements or reductions occur. Expenses net of fee waivers reflect expenses after reimbursement by the investment adviser but prior to reductions from brokerage service arrangements or other expense offset arrangements. Expenses net of all reductions represent the net expenses paid by the class.
I Annualized
J Amount does not include the portfolio activity of any underlying Fidelity Central Funds.
See accompanying notes which are an integral part of the financial statements.
Notes to Financial Statements (Unaudited)
For the period ended April 30, 2018
1. Organization.
Fidelity Series Emerging Markets Fund, Fidelity Series International Growth Fund, Fidelity Series International Small Cap Fund, and Fidelity Series International Value Fund (the Funds) are funds of Fidelity Investment Trust (the Trust). The Trust is registered under the Investment Company Act of 1940, as amended (the 1940 Act), as an open-end management investment company organized as a Massachusetts business trust. Each Fund is authorized to issue an unlimited number of shares. In May 2018 the Board of Trustees approved a change in the name of Fidelity Series Emerging Markets Fund to Fidelity Series Emerging Markets Opportunities Fund effective May 31, 2018. Shares of the Funds are only available for purchase by mutual funds for which Fidelity Management & Research Company (FMR) or an affiliate serves as an investment manager. Effective August 28, 2017, each Fund no longer offers Class F, and all outstanding shares of Class F were exchanged for shares of Fidelity Series Emerging Markets Opportunities Fund, Fidelity Series International Growth Fund, Fidelity Series International Small Cap Fund, and Fidelity Series International Value Fund, respectively. Fidelity Series Emerging Markets Opportunities Fund's investments in emerging markets can be subject to social, economic, regulatory, and political uncertainties and can be extremely volatile.
2. Investments in Fidelity Central Funds.
The Funds invest in Fidelity Central Funds, which are open-end investment companies generally available only to other investment companies and accounts managed by the investment adviser and its affiliates. The Funds' Schedules of Investments list each of the Fidelity Central Funds held as of period end, if any, as an investment of each Fund, but do not include the underlying holdings of each Fidelity Central Fund. As an Investing Fund, each Fund indirectly bears its proportionate share of the expenses of the underlying Fidelity Central Funds.
The Money Market Central Funds seek preservation of capital and current income and are managed by Fidelity Investments Money Management, Inc. (FIMM), an affiliate of the investment adviser. Annualized expenses of the Money Market Central Funds as of their most recent shareholder report date are less than .005%.
A complete unaudited list of holdings for each Fidelity Central Fund is available upon request or at the Securities and Exchange Commission (the SEC) website at www.sec.gov. In addition, the financial statements of the Fidelity Central Funds are available on the SEC website or upon request.
3. Significant Accounting Policies.
Each Fund is an investment company and applies the accounting and reporting guidance of the Financial Accounting Standards Board (FASB) Accounting Standards Codification Topic 946 Financial Services – Investments Companies. The financial statements have been prepared in conformity with accounting principles generally accepted in the United States of America (GAAP), which require management to make certain estimates and assumptions at the date of the financial statements. Actual results could differ from those estimates. Subsequent events, if any, through the date that the financial statements were issued have been evaluated in the preparation of the financial statements. The following summarizes the significant accounting policies of the Funds:
Investment Valuation. Investments are valued as of 4:00 p.m. Eastern time on the last calendar day of the period. The Board of Trustees (the Board) has delegated the day to day responsibility for the valuation of each Fund's investments to the Fair Value Committee (the Committee) established by each Fund's investment adviser. In accordance with valuation policies and procedures approved by the Board, each Fund attempts to obtain prices from one or more third party pricing vendors or brokers to value its investments. When current market prices, quotations or currency exchange rates are not readily available or reliable, investments will be fair valued in good faith by the Committee, in accordance with procedures adopted by the Board. Factors used in determining fair value vary by investment type and may include market or investment specific events, changes in interest rates and credit quality. The frequency with which these procedures are used cannot be predicted and they may be utilized to a significant extent. The Committee oversees each Fund's valuation policies and procedures and reports to the Board on the Committee's activities and fair value determinations. The Board monitors the appropriateness of the procedures used in valuing each Fund's investments and ratifies the fair value determinations of the Committee.
Each Fund categorizes the inputs to valuation techniques used to value its investments into a disclosure hierarchy consisting of three levels as shown below:
- Level 1 – quoted prices in active markets for identical investments
- Level 2 – other significant observable inputs (including quoted prices for similar investments, interest rates, prepayment speeds, etc.)
- Level 3 – unobservable inputs (including the Fund's own assumptions based on the best information available)
Valuation techniques used to value each Fund's investments by major category are as follows:
Equity securities, including restricted securities, for which market quotations are readily available, are valued at the last reported sale price or official closing price as reported by a third party pricing vendor on the primary market or exchange on which they are traded and are categorized as Level 1 in the hierarchy. In the event there were no sales during the day or closing prices are not available, securities are valued at the last quoted bid price or may be valued using the last available price and are generally categorized as Level 2 in the hierarchy. For foreign equity securities, when market or security specific events arise, comparisons to the valuation of American Depositary Receipts (ADRs), futures contracts, Exchange-Traded Funds (ETFs) and certain indexes as well as quoted prices for similar securities may be used and would be categorized as Level 2 in the hierarchy. Utilizing these techniques may result in transfers between Level 1 and Level 2. For equity securities, including restricted securities, where observable inputs are limited, assumptions about market activity and risk are used and these securities may be categorized as Level 3 in the hierarchy. Equity securities, including restricted securities, for which observable inputs are not available are valued using alternate valuation approaches, including the market approach and the income approach and are categorized as Level 3 in the hierarchy. The market approach generally consists of using comparable market transactions while the income approach generally consists of using the net present value of estimated future cash flows, adjusted as appropriate for liquidity, credit, market and/or other risk factors.
Debt securities, including restricted securities, are valued based on evaluated prices received from third party pricing vendors or from brokers who make markets in such securities. U.S. government and government agency obligations are valued by pricing vendors who utilize matrix pricing which considers yield or price of bonds of comparable quality, coupon, maturity and type or by broker-supplied prices. When independent prices are unavailable or unreliable, debt securities may be valued utilizing pricing methodologies which consider similar factors that would be used by third party pricing vendors. Debt securities are generally categorized as Level 2 in the hierarchy but may be Level 3 depending on the circumstances.
Futures contracts are valued at the settlement price established each day by the board of trade or exchange on which they are traded and are categorized as Level 1 in the hierarchy. Investments in open-end mutual funds, including the Fidelity Central Funds, are valued at their closing net asset value (NAV) each business day and are categorized as Level 1 in the hierarchy.
Changes in valuation techniques may result in transfers in or out of an assigned level within the disclosure hierarchy. The aggregate value of investments by input level as of April 30, 2018, including information on transfers between Levels 1 and 2, is included at the end of each applicable Fund's Schedule of Investments.
Foreign Currency. The Funds may use foreign currency contracts to facilitate transactions in foreign-denominated securities. Gains and losses from these transactions may arise from changes in the value of the foreign currency or if the counterparties do not perform under the contracts' terms.
Foreign-denominated assets, including investment securities, and liabilities are translated into U.S. dollars at the exchange rates at period end. Purchases and sales of investment securities, income and dividends received and expenses denominated in foreign currencies are translated into U.S. dollars at the exchange rate in effect on the transaction date.
The effects of exchange rate fluctuations on investments are included with the net realized and unrealized gain (loss) on investment securities. Other foreign currency transactions resulting in realized and unrealized gain (loss) are disclosed separately.
Investment Transactions and Income. For financial reporting purposes, the Funds' investment holdings and NAV include trades executed through the end of the last business day of the period. The NAV per share for processing shareholder transactions is calculated as of the close of business of the New York Stock Exchange (NYSE), normally 4:00 p.m. Eastern time and includes trades executed through the end of the prior business day. Gains and losses on securities sold are determined on the basis of identified cost and includes proceeds received from litigation. Dividend income is recorded on the ex-dividend date, except for certain dividends from foreign securities where the ex-dividend date may have passed, which are recorded as soon as the Funds are informed of the ex-dividend date. Non-cash dividends included in dividend income, if any, are recorded at the fair market value of the securities received. Income and capital gain distributions from Fidelity Central Funds, if any, are recorded on the ex-dividend date. Certain distributions received by the Funds represent a return of capital or capital gain. The Funds determine the components of these distributions subsequent to the ex-dividend date, based upon receipt of tax filings or other correspondence relating to the underlying investment. These distributions are recorded as a reduction of cost of investments and/or as a realized gain. Interest income is accrued as earned and includes coupon interest and amortization of premium and accretion of discount on debt securities as applicable. Investment income is recorded net of foreign taxes withheld where recovery of such taxes is uncertain.
Expenses. Expenses directly attributable to a fund are charged to that fund. Expenses attributable to more than one fund are allocated among the respective funds on the basis of relative net assets or other appropriate methods. Expense estimates are accrued in the period to which they relate and adjustments are made when actual amounts are known.
Income Tax Information and Distributions to Shareholders. Each year, each Fund intends to qualify as a regulated investment company under Subchapter M of the Internal Revenue Code, including distributing substantially all of its taxable income and realized gains. As a result, no provision for U.S. Federal income taxes is required. Each Fund files a U.S. federal tax return, in addition to state and local tax returns as required. Each Fund's federal income tax returns are subject to examination by the Internal Revenue Service (IRS) for a period of three fiscal years after they are filed. State and local tax returns may be subject to examination for an additional fiscal year depending on the jurisdiction. Foreign taxes are provided for based on each Fund's understanding of the tax rules and rates that exist in the foreign markets in which it invests. Fidelity Series Emerging Markets Opportunities Fund is subject to a tax imposed on capital gains by certain countries in which it invests. An estimated deferred tax liability for net unrealized appreciation on the applicable securities is included in Other payables and accrued expenses on Fidelity Series Emerging Markets Opportunities Fund's Statement of Assets & Liabilities.
Distributions are declared and recorded on the ex-dividend date. Income and capital gain distributions are declared separately for each class. Income and capital gain distributions are determined in accordance with income tax regulations, which may differ from GAAP.
Capital accounts within the financial statements are adjusted for permanent book-tax differences. These adjustments have no impact on net assets or the results of operations. Capital accounts are not adjusted for temporary book-tax differences which will reverse in a subsequent period.
Book-tax differences are primarily due to futures contracts, foreign currency transactions, certain foreign taxes, passive foreign investment companies (PFIC), market discount, partnerships, capital loss carryforwards, and losses deferred due to wash sales.
As of period end, the cost and unrealized appreciation (depreciation) in securities, and derivatives if applicable, for federal income tax purposes were as follows for each Fund:
| Tax cost | Gross unrealized appreciation | Gross unrealized depreciation | Net unrealized appreciation (depreciation) | |
| Fidelity Series Emerging Markets Opportunities Fund | $11,011,120,348 | $4,247,366,930 | $(542,037,414) | $3,705,329,516 |
| Fidelity Series International Growth Fund | 10,375,717,538 | 4,864,022,281 | (224,084,885) | 4,639,937,396 |
| Fidelity Series International Small Cap Fund | 2,403,680,544 | 1,308,594,388 | (100,837,338) | 1,207,757,050 |
| Fidelity Series International Value Fund | 13,101,653,064 | 2,599,070,069 | (351,821,734) | 2,247,248,335 |
Capital loss carryforwards are only available to offset future capital gains of the Funds to the extent provided by regulations and may be limited. Under the Regulated Investment Company Modernization Act of 2010 (the Act), the Funds are permitted to carry forward capital losses incurred in taxable years beginning after December 22, 2010 for an unlimited period and such capital losses are required to be used prior to any losses that expire. The capital loss carryforward information presented below, including any applicable limitation, is estimated as of prior fiscal period end and is subject to adjustment.
| No expiration | ||||
| Short-term | Long-term | Total no expiration | Total capital loss carryforward | |
| Fidelity Series International Value Fund | (497,362,833) | (261,223,764) | (758,586,597) | (758,586,597) |
Restricted Securities. The Funds may invest in securities that are subject to legal or contractual restrictions on resale. These securities generally may be resold in transactions exempt from registration or to the public if the securities are registered. Disposal of these securities may involve time-consuming negotiations and expense, and prompt sale at an acceptable price may be difficult. Information regarding restricted securities is included at the end of each applicable Fund's Schedule of Investments.
4. Derivative Instruments.
Risk Exposures and the Use of Derivative Instruments. The Funds' investment objective allows the Funds to enter into various types of derivative contracts, including futures contracts. Derivatives are investments whose value is primarily derived from underlying assets, indices or reference rates and may be transacted on an exchange or over-the-counter (OTC). Derivatives may involve a future commitment to buy or sell a specified asset based on specified terms, to exchange future cash flows at periodic intervals based on a notional principal amount, or for one party to make one or more payments upon the occurrence of specified events in exchange for periodic payments from the other party.
The Funds used derivatives to increase returns and to manage exposure to certain risks as defined below. The success of any strategy involving derivatives depends on analysis of numerous economic factors, and if the strategies for investment do not work as intended, the Funds may not achieve their objectives.
The Funds' use of derivatives increased or decreased their exposure to the following risk:
| Equity Risk | Equity risk relates to the fluctuations in the value of financial instruments as a result of changes in market prices (other than those arising from interest rate risk or foreign exchange risk), whether caused by factors specific to an individual investment, its issuer, or all factors affecting all instruments traded in a market or market segment. |
The Funds are also exposed to additional risks from investing in derivatives, such as liquidity risk and counterparty credit risk. Liquidity risk is the risk that the Funds will be unable to close out the derivative in the open market in a timely manner. Counterparty credit risk is the risk that the counterparty will not be able to fulfill its obligation to the Funds.
Investing in derivatives may involve greater risks than investing in the underlying assets directly and, to varying degrees, may involve risk of loss in excess of any initial investment and collateral received and amounts recognized in the Statement of Assets and Liabilities. In addition, there may be the risk that the change in value of the derivative contract does not correspond to the change in value of the underlying instrument.
Futures Contracts. A futures contract is an agreement between two parties to buy or sell a specified underlying instrument for a fixed price at a specified future date. The Funds used futures contracts to manage their exposure to the stock market.
Upon entering into a futures contract, a fund is required to deposit either cash or securities (initial margin) with a clearing broker in an amount equal to a certain percentage of the face value of the contract. Futures contracts are marked-to-market daily and subsequent daily payments (variation margin) are made or received by a fund depending on the daily fluctuations in the value of the futures contracts and are recorded as unrealized appreciation or (depreciation). This receivable and/or payable, if any, is included in daily variation margin on futures contracts in the Statement of Assets and Liabilities. Realized gain or (loss) is recorded upon the expiration or closing of a futures contract. The net realized gain (loss) and change in net unrealized appreciation (depreciation) on futures contracts during the period is presented in the Statement of Operations.
Any open futures contracts at period end are presented in the Schedule of Investments under the caption "Futures Contracts". The notional amount at value reflects each contract's exposure to the underlying instrument or index at period end and is representative of volume of activity during the period.
5. Purchases and Sales of Investments.
Purchases and sales of securities, other than short-term securities, are noted in the table below.
| Purchases ($) | Sales ($) | |
| Fidelity Series Emerging Markets Opportunities Fund | 3,814,685,995 | 5,341,433,619 |
| Fidelity Series International Growth Fund | 1,914,718,259 | 2,637,650,384 |
| Fidelity Series International Small Cap Fund | 221,254,815 | 518,792,447 |
| Fidelity Series International Value Fund | 3,534,968,675 | 3,437,017,846 |
6. Fees and Other Transactions with Affiliates.
Management Fee. Fidelity Management & Research Company (the investment adviser) and its affiliates provide the Funds with investment management related services for which the Funds do not pay a management fee. Under the management contract, the investment adviser or an affiliate pays all ordinary operating expenses of the Funds, except custody fees, fees and expenses of the independent Trustees, and certain miscellaneous expenses such as proxy and shareholder meeting expenses.
Brokerage Commissions. Certain Funds placed a portion of their portfolio transactions with brokerage firms which are affiliates of the investment adviser. Brokerage commissions are included in net realized gain (loss) and change in net unrealized appreciation (depreciation) in the Statement of Operations. The commissions paid to these affiliated firms were as follows:
| Amount | |
| Fidelity Series Emerging Markets Opportunities Fund | $43,579 |
| Fidelity Series International Growth Fund | 4,817 |
| Fidelity Series International Small Cap Fund | 606 |
| Fidelity Series International Value Fund | 8,898 |
Interfund Lending Program. Pursuant to an Exemptive Order issued by the SEC, the Funds, along with other registered investment companies having management contracts with FMR or other affiliated entities of FMR, may participate in an interfund lending program. This program provides an alternative credit facility allowing the funds to borrow from, or lend money to, other participating affiliated funds. At period end, there were no interfund loans outstanding. Each applicable fund's activity in this program during the period for which loans were outstanding was as follows:
| Borrower or Lender | Average Loan Balance | Weighted Average Interest Rate | Interest Expense | |
| Fidelity Series Emerging Markets Opportunities Fund | Borrower | $25,640,250 | 1.39% | $15,870 |
| Fidelity Series International Small Cap Fund | Borrower | $13,957,000 | 1.59% | $2,458 |
| Fidelity Series International Value Fund | Borrower | $54,406,667 | 1.61% | $7,287 |
Interfund Trades. The Funds may purchase from or sell securities to other Fidelity Funds under procedures adopted by the Board. The procedures have been designed to ensure these interfund trades are executed in accordance with Rule 17a-7 of the 1940 Act. Interfund trades are included within the respective purchases and sales amounts shown in the Purchases and Sales of Investments note.
7. Committed Line of Credit.
Certain Funds participate with other funds managed by the investment adviser or an affiliate in a $4.25 billion credit facility (the "line of credit") to be utilized for temporary or emergency purposes to fund shareholder redemptions or for other short-term liquidity purposes. The participating funds have agreed to pay commitment fees on their pro-rata portion of the line of credit, which are reflected in Miscellaneous expenses on the Statement of Operations, and are as follows:
| Fidelity Series Emerging Markets Opportunities Fund | $22,572 |
| Fidelity Series International Growth Fund | 21,497 |
| Fidelity Series International Small Cap Fund | 5,204 |
| Fidelity Series International Value Fund | 21,425 |
During the period, the Funds did not borrow on this line of credit.
8. Security Lending.
Certain Funds lend portfolio securities through a lending agent from time to time in order to earn additional income. For equity securities, a lending agent is used and may loan securities to certain qualified borrowers, including Fidelity Capital Markets (FCM), a broker-dealer affiliated with the Funds. On the settlement date of the loan, each applicable Fund receives collateral (in the form of U.S. Treasury obligations, letters of credit and/or cash) against the loaned securities and maintains collateral in an amount not less than 100% of the market value of the loaned securities during the period of the loan. The market value of the loaned securities is determined at the close of business of the Funds and any additional required collateral is delivered to the Funds on the next business day. The Funds or borrower may terminate the loan at any time, and if the borrower defaults on its obligation to return the securities loaned because of insolvency or other reasons, the Funds may apply collateral received from the borrower against the obligation. The Funds may experience delays and costs in recovering the securities loaned. Any cash collateral received is invested in the Fidelity Securities Lending Cash Central Fund. The value of loaned securities and cash collateral at period end are disclosed on each applicable Fund's Statement of Assets and Liabilities. Security lending income represents the income earned on investing cash collateral, less rebates paid to borrowers and any lending agent fees associated with the loan, plus any premium payments received for lending certain types of securities. Security lending income is presented on each applicable Fund's Statement of Operations as a component of income from Fidelity Central Funds. FCM security lending activity was as follows:
| Total Security Lending Income | Security Lending Income From Securities Loaned to FCM | Value of Securities Loaned to FCM at Period End | |
| Fidelity Series Emerging Markets Opportunities Fund | $956,248 | $ - | $– |
| Fidelity Series International Growth Fund | $807,037 | $11,096 | $– |
| Fidelity Series International Small Cap Fund | $443,891 | $414 | $– |
| Fidelity Series International Value Fund | $3,864,741 | $ - | $– |
9. Expense Reductions.
Effective June1, 2017, the investment adviser contractually agreed to reimburse each Fund to the extent annual operating expenses exceeded certain levels of class-level average net assets as noted in the table below. This reimbursement will remain in place through December 31, 2020. Some expenses, for example the compensation of the independent Trustees, and certain other expenses such as interest expense, are excluded from this reimbursement.
The following Funds were in reimbursement during the period:
| Expense Limitations | Reimbursement | |
| Fidelity Series Emerging Markets Opportunities Fund | ||
| Series Emerging Markets Opportunities | .014% | $2,961,527 |
Commissions paid to certain brokers with whom the investment adviser, or its affiliates, places trades on behalf of Certain Funds include an amount in addition to trade execution, which may be rebated back to the Funds to offset certain expenses. In addition, through arrangements with each applicable Fund's custodian, credits realized as a result of certain uninvested cash balances were used to reduce the Fund's expenses. All of the applicable expense reductions are noted in the table below.
| Brokerage Service reduction | |
| Fidelity Series International Growth Fund | $554,926 |
| Fidelity Series International Small Cap Fund | 37,858 |
10. Distributions to Shareholders.
Distributions to shareholders of each class were as follows:
| Six months ended April 30, 2018 | Year ended October 31, 2017 | |
| Fidelity Series Emerging Markets Opportunities Fund | ||
| From net investment income | ||
| Series Emerging Markets Opportunities | $277,477,968 | $82,269,688 |
| Class F | – | 111,268,765 |
| Total | $277,477,968 | $193,538,453 |
| From net realized gain | ||
| Series Emerging Markets Opportunities | $164,909,386 | $15,266,540 |
| Class F | – | 18,374,659 |
| Total | $164,909,386 | $33,641,199 |
| Fidelity Series International Growth Fund | ||
| From net investment income | ||
| Series International Growth | $218,066,581 | $71,631,335 |
| Class F | – | 98,778,795 |
| Total | $218,066,581 | $170,410,130 |
| From net realized gain | ||
| Series International Growth | $242,599,071 | $74,784,915 |
| Class F | – | 91,604,916 |
| Total | $242,599,071 | $166,389,831 |
| Fidelity Series International Small Cap Fund | ||
| From net investment income | ||
| Series International Small Cap | $54,863,235 | $14,167,288 |
| Class F | – | 19,989,904 |
| Total | $54,863,235 | $34,157,192 |
| From net realized gain | ||
| Series International Small Cap | $163,242,187 | $38,362,071 |
| Class F | – | 47,094,859 |
| Total | $163,242,187 | $85,456,930 |
| Fidelity Series International Value Fund | ||
| From net investment income | ||
| Series International Value | $425,044,762 | $143,191,242 |
| Class F | – | 186,385,696 |
| Total | $425,044,762 | $329,576,938 |
| From net realized gain | ||
| Series International Value | $35,648,916 | $10,915,924 |
| Class F | – | 13,369,438 |
| Total | $35,648,916 | $24,285,362 |
11. Share Transactions.
Transactions for each class of shares were as follows:
| Shares | Shares | Dollars | Dollars | |
| Six months ended April 30, 2018 | Year ended October 31, 2017 | Six months ended April 30, 2018 | Year ended October 31, 2017 | |
| Fidelity Series Emerging Markets Opportunities Fund | ||||
| Series Emerging Markets Opportunities | ||||
| Shares sold | 25,857,047 | 519,778,624 | $567,476,090 | $10,628,254,799 |
| Reinvestment of distributions | 21,392,038 | 6,260,348 | 442,387,354 | 97,536,228 |
| Shares redeemed | (97,699,757) | (205,349,586) | (2,154,587,731) | (4,080,491,417) |
| Net increase (decrease) | (50,450,672) | 320,689,386 | $(1,144,724,287) | $6,645,299,610 |
| Class F | ||||
| Shares sold | – | 47,966,801 | $– | $834,470,841 |
| Reinvestment of distributions | – | 8,299,835 | – | 129,643,424 |
| Shares redeemed | – | (558,565,734) | – | (11,293,892,850) |
| Net increase (decrease) | – | (502,299,098) | $– | $(10,329,778,585) |
| Fidelity Series International Growth Fund | ||||
| Series International Growth | ||||
| Shares sold | 33,844,608 | 616,887,379 | $553,808,238 | $9,472,471,861 |
| Reinvestment of distributions | 29,082,428 | 11,528,839 | 460,665,652 | 146,416,250 |
| Shares redeemed | (71,140,103) | (137,272,697) | (1,167,286,459) | (2,083,470,910) |
| Net increase (decrease) | (8,213,067) | 491,143,521 | $(152,812,569) | $7,535,417,201 |
| Class F | ||||
| Shares sold | – | 82,432,313 | $– | $1,122,218,322 |
| Reinvestment of distributions | – | 14,967,273 | – | 190,383,711 |
| Shares redeemed | – | (611,580,376) | – | (9,409,531,402) |
| Net increase (decrease) | – | (514,180,790) | $– | $(8,096,929,369) |
| Fidelity Series International Small Cap Fund | ||||
| Series International Small Cap | ||||
| Shares sold | 7,298,467 | 126,808,547 | $135,148,568 | $2,182,522,510 |
| Reinvestment of distributions | 12,463,167 | 3,725,486 | 218,105,422 | 52,529,358 |
| Shares redeemed | (22,885,003) | (20,793,540) | (428,139,537) | (347,551,675) |
| Net increase (decrease) | (3,123,369) | 109,740,493 | $(74,885,547) | $1,887,500,193 |
| Class F | ||||
| Shares sold | – | 15,972,969 | $– | $242,899,916 |
| Reinvestment of distributions | – | 4,751,046 | – | 67,084,763 |
| Shares redeemed | – | (126,992,159) | – | (2,185,674,132) |
| Net increase (decrease) | – | (106,268,144) | $– | $(1,875,689,453) |
| Fidelity Series International Value Fund | ||||
| Series International Value | ||||
| Shares sold | 57,126,863 | 901,998,924 | $618,828,646 | $9,348,838,001 |
| Reinvestment of distributions | 43,750,587 | 16,805,580 | 460,693,678 | 154,107,166 |
| Shares redeemed | (67,164,966) | (180,222,845) | (738,920,216) | (1,855,842,145) |
| Net increase (decrease) | 33,712,484 | 738,581,659 | $340,602,108 | $7,647,103,022 |
| Class F | ||||
| Shares sold | – | 100,477,660 | $– | $970,415,947 |
| Reinvestment of distributions | – | 21,759,819 | – | 199,755,135 |
| Shares redeemed | – | (884,352,197) | – | (9,172,700,017) |
| Net increase (decrease) | – | (762,114,718) | $– | $(8,002,528,935) |
12. Other.
The Funds' organizational documents provide former and current trustees and officers with a limited indemnification against liabilities arising in connection with the performance of their duties to the Funds. In the normal course of business, the Funds may also enter into contracts that provide general indemnifications. The Funds' maximum exposure under these arrangements is unknown as this would be dependent on future claims that may be made against the Funds. The risk of material loss from such claims is considered remote.
At the end of the period, mutual funds managed by the investment adviser or its affiliates were the owners of record of all of the outstanding shares of the Funds.
Shareholder Expense Example
As a shareholder of the Fund, you incur two types of costs: (1) transaction costs and (2) ongoing costs, including other Fund expenses. This Example is intended to help you understand your ongoing costs (in dollars) of investing in the Fund and to compare these costs with the ongoing costs of investing in other mutual funds.
The Example is based on an investment of $1,000 invested at the beginning of the period and held for the entire period (November 1, 2017 to April 30, 2018).
Actual Expenses
The first line of the accompanying table for each Fund provides information about actual account values and actual expenses. You may use the information in this line, together with the amount you invested, to estimate the expenses that you paid over the period. Simply divide your account value by $1,000.00 (for example, an $8,600 account value divided by $1,000.00 = 8.6), then multiply the result by the number in the first line for each Fund under the heading entitled "Expenses Paid During Period" to estimate the expenses you paid on your account during this period. In addition, each Fund, as a shareholder in the underlying Fidelity Central Funds, will indirectly bear its pro-rata share of the fees and expenses incurred by the underlying Fidelity Central Funds. These fees and expenses are not included in the Fund's annualized expense ratio used to calculate the expense estimate in the table below.
Hypothetical Example for Comparison Purposes
The second line of the accompanying table for each Fund provides information about hypothetical account values and hypothetical expenses based on each Fund's actual expense ratio and an assumed rate of return of 5% per year before expenses, which is not each Fund's actual return. The hypothetical account values and expenses may not be used to estimate the actual ending account balance or expenses you paid for the period. You may use this information to compare the ongoing costs of investing in the Fund and other funds. To do so, compare this 5% hypothetical example with the 5% hypothetical examples that appear in the shareholder reports of the other funds. In addition, each Fund, as a shareholder in the underlying Fidelity Central Funds, will indirectly bear its pro-rata share of the fees and expenses incurred by the underlying Fidelity Central Funds. These fees and expenses are not included in the Fund's annualized expense ratio used to calculate the expense estimate in the table below.
Please note that the expenses shown in the table are meant to highlight your ongoing costs only and do not reflect any transaction costs. Therefore, the second line of the table is useful in comparing ongoing costs only, and will not help you determine the relative total costs of owning different funds.
| Annualized Expense Ratio-A | Beginning Account Value November 1, 2017 | Ending Account Value April 30, 2018 | Expenses Paid During Period-B November 1, 2017 to April 30, 2018 | |
| Fidelity Series Emerging Markets Opportunities Fund | ||||
| Series Emerging Markets Opportunities | .01% | |||
| Actual | $1,000.00 | $1,026.90 | $.05 | |
| Hypothetical-C | $1,000.00 | $1,024.74 | $.05 | |
| Fidelity Series International Growth Fund | ||||
| Series International Growth | .01% | |||
| Actual | $1,000.00 | $1,021.80 | $.05 | |
| Hypothetical-C | $1,000.00 | $1,024.74 | $.05 | |
| Fidelity Series International Small Cap Fund | ||||
| Series International Small Cap | .01% | |||
| Actual | $1,000.00 | $1,093.50 | $.05 | |
| Hypothetical-C | $1,000.00 | $1,024.74 | $.05 | |
| Fidelity Series International Value Fund | ||||
| Series International Value | .01% | |||
| Actual | $1,000.00 | $1,018.60 | $.05 | |
| Hypothetical-C | $1,000.00 | $1,024.74 | $.05 |
A Annualized expense ratio reflects expenses net of applicable fee waivers.
B Expenses are equal to each Fund's annualized expense ratio, multiplied by the average account value over the period, multiplied by 181/ 365 (to reflect the one-half year period).
C 5% return per year before expenses
![]()
GSV-S-SANN-0618
1.907946.108
Fidelity Advisor® Global Commodity Stock Fund - Semi-Annual Report April 30, 2018 Class A, Class M, Class C and Class I are classes of Fidelity® Global Commodity Stock Fund |
|
Contents
To view a fund's proxy voting guidelines and proxy voting record for the 12-month period ended June 30, visit http://www.fidelity.com/proxyvotingresults or visit the Securities and Exchange Commission's (SEC) web site at http://www.sec.gov.
You may also call 1-877-208-0098 to request a free copy of the proxy voting guidelines.
Standard & Poor's, S&P and S&P 500 are registered service marks of The McGraw-Hill Companies, Inc. and have been licensed for use by Fidelity Distributors Corporation.
Other third-party marks appearing herein are the property of their respective owners.
All other marks appearing herein are registered or unregistered trademarks or service marks of FMR LLC or an affiliated company. © 2018 FMR LLC. All rights reserved.
This report and the financial statements contained herein are submitted for the general information of the shareholders of the Fund. This report is not authorized for distribution to prospective investors in the Fund unless preceded or accompanied by an effective prospectus.
A fund files its complete schedule of portfolio holdings with the SEC for the first and third quarters of each fiscal year on Form N-Q. Forms N-Q are available on the SEC’s web site at http://www.sec.gov. A fund's Forms N-Q may be reviewed and copied at the SEC’s Public Reference Room in Washington, DC. Information regarding the operation of the SEC's Public Reference Room may be obtained by calling 1-800-SEC-0330.
For a complete list of a fund's portfolio holdings, view the most recent holdings listing, semiannual report, or annual report on Fidelity's web site at http://www.fidelity.com, http://www.institutional.fidelity.com, or http://www.401k.com, as applicable.
NOT FDIC INSURED •MAY LOSE VALUE •NO BANK GUARANTEE
Neither the Fund nor Fidelity Distributors Corporation is a bank.
Investment Summary (Unaudited)
Top Ten Stocks as of April 30, 2018
| % of fund's net assets | |
| Nutrien Ltd. | 4.9 |
| BHP Billiton PLC | 4.7 |
| Royal Dutch Shell PLC Class A (United Kingdom) | 4.5 |
| Chevron Corp. | 3.9 |
| Rio Tinto PLC | 3.3 |
| Glencore Xstrata PLC | 2.6 |
| BP PLC | 2.4 |
| UPM-Kymmene Corp. | 2.3 |
| FMC Corp. | 2.2 |
| Exxon Mobil Corp. | 2.2 |
| 33.0 |
Top Sectors (% of fund's net assets)
| As of April 30, 2018 | ||
| Energy | 32.0% | |
| Metals | 31.8% | |
| Agriculture | 25.1% | |
| Other | 9.6% | |
| Short-Term Investments and Net Other Assets | 1.5% | |
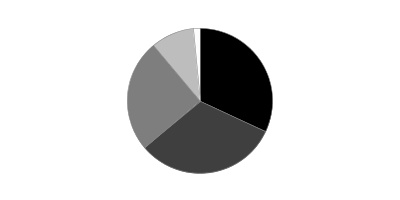
Schedule of Investments April 30, 2018 (Unaudited)
Showing Percentage of Net Assets
| Common Stocks - 97.1% | |||
| Shares | Value | ||
| Chemicals - 17.1% | |||
| Commodity Chemicals - 1.4% | |||
| LG Chemical Ltd. | 7,230 | $2,430,422 | |
| LyondellBasell Industries NV Class A | 31,900 | 3,372,787 | |
| Olin Corp. | 30,300 | 914,757 | |
| Tronox Ltd. Class A | 14,265 | 245,073 | |
| Westlake Chemical Corp. | 14,600 | 1,561,762 | |
| 8,524,801 | |||
| Diversified Chemicals - 1.7% | |||
| BASF AG | 11,400 | 1,186,096 | |
| DowDuPont, Inc. | 92,758 | 5,866,016 | |
| The Chemours Co. LLC | 66,000 | 3,195,060 | |
| 10,247,172 | |||
| Fertilizers & Agricultural Chemicals - 13.1% | |||
| CF Industries Holdings, Inc. | 284,860 | 11,052,568 | |
| FMC Corp. | 169,300 | 13,498,289 | |
| K&S AG | 181,700 | 5,356,065 | |
| Nutrien Ltd. | 655,483 | 29,839,933 | |
| OCI NV (a)(b) | 61,600 | 1,466,191 | |
| Sociedad Quimica y Minera de Chile SA (PN-B) sponsored ADR (b) | 5,600 | 307,384 | |
| The Mosaic Co. | 359,261 | 9,682,084 | |
| UPL Ltd. | 240,689 | 2,635,195 | |
| Yara International ASA | 140,500 | 5,937,138 | |
| 79,774,847 | |||
| Industrial Gases - 0.2% | |||
| Air Liquide SA | 7,200 | 935,830 | |
| Linde AG | 2,900 | 644,550 | |
| 1,580,380 | |||
| Specialty Chemicals - 0.7% | |||
| Platform Specialty Products Corp. (a) | 286,900 | 2,889,083 | |
| Umicore SA | 23,000 | 1,284,862 | |
| 4,173,945 | |||
| TOTAL CHEMICALS | 104,301,145 | ||
| Commercial Services & Supplies - 0.1% | |||
| Environmental & Facility Services - 0.1% | |||
| Clean TeQ Holdings Ltd. (a)(b) | 674,700 | 463,811 | |
| Construction Materials - 0.3% | |||
| Construction Materials - 0.3% | |||
| Buzzi Unicem SpA | 24,700 | 625,189 | |
| Dalmia Bharat Ltd. | 20,700 | 947,684 | |
| Shree Cement Ltd. | 2,300 | 585,029 | |
| 2,157,902 | |||
| Containers & Packaging - 0.6% | |||
| Paper Packaging - 0.6% | |||
| Amcor Ltd. | 53,700 | 553,377 | |
| Packaging Corp. of America | 13,500 | 1,561,815 | |
| WestRock Co. | 27,559 | 1,630,390 | |
| 3,745,582 | |||
| Electric Utilities - 0.5% | |||
| Electric Utilities - 0.5% | |||
| Exelon Corp. | 40,700 | 1,614,976 | |
| Vistra Energy Corp. (a) | 54,700 | 1,249,895 | |
| 2,864,871 | |||
| Electronic Equipment & Components - 0.1% | |||
| Electronic Manufacturing Services - 0.1% | |||
| Philips Lighting NV (c) | 16,000 | 487,677 | |
| Energy Equipment & Services - 0.3% | |||
| Oil & Gas Equipment & Services - 0.3% | |||
| Baker Hughes, a GE Co. Class A | 200 | 7,222 | |
| John Wood Group PLC | 214,500 | 1,679,088 | |
| 1,686,310 | |||
| Food Products - 5.4% | |||
| Agricultural Products - 5.2% | |||
| Archer Daniels Midland Co. | 131,900 | 5,985,622 | |
| Bunge Ltd. | 149,500 | 10,798,385 | |
| Darling International, Inc. (a) | 216,800 | 3,715,952 | |
| First Resources Ltd. | 2,215,700 | 2,817,408 | |
| Ingredion, Inc. | 54,300 | 6,575,187 | |
| Wilmar International Ltd. | 667,800 | 1,633,725 | |
| 31,526,279 | |||
| Packaged Foods & Meats - 0.2% | |||
| Adecoagro SA (a) | 169,500 | 1,308,540 | |
| TOTAL FOOD PRODUCTS | 32,834,819 | ||
| Gas Utilities - 0.2% | |||
| Gas Utilities - 0.2% | |||
| Indraprastha Gas Ltd. | 259,000 | 1,117,036 | |
| Independent Power and Renewable Electricity Producers - 0.7% | |||
| Independent Power Producers & Energy Traders - 0.7% | |||
| China Resources Power Holdings Co. Ltd. | 644,000 | 1,235,265 | |
| NRG Energy, Inc. | 59,800 | 1,853,800 | |
| The AES Corp. | 105,900 | 1,296,216 | |
| 4,385,281 | |||
| Machinery - 1.3% | |||
| Agricultural & Farm Machinery - 0.6% | |||
| Deere & Co. | 26,700 | 3,613,311 | |
| Jain Irrigation Systems Ltd. | 147,859 | 257,971 | |
| 3,871,282 | |||
| Construction Machinery & Heavy Trucks - 0.3% | |||
| Allison Transmission Holdings, Inc. | 36,000 | 1,403,640 | |
| Komatsu Ltd. | 9,100 | 310,207 | |
| 1,713,847 | |||
| Industrial Machinery - 0.4% | |||
| Andritz AG | 20,500 | 1,103,118 | |
| The Weir Group PLC | 39,100 | 1,149,787 | |
| 2,252,905 | |||
| TOTAL MACHINERY | 7,838,034 | ||
| Metals & Mining - 31.6% | |||
| Aluminum - 0.4% | |||
| Aluminum Corp. of China Ltd. (H Shares) (a) | 520,000 | 293,689 | |
| Hindalco Industries Ltd. | 160,000 | 562,926 | |
| Norsk Hydro ASA | 203,900 | 1,273,550 | |
| 2,130,165 | |||
| Copper - 2.0% | |||
| First Quantum Minerals Ltd. | 301,624 | 4,345,998 | |
| Freeport-McMoRan, Inc. | 496,700 | 7,554,807 | |
| Lundin Mining Corp. | 45,400 | 300,557 | |
| 12,201,362 | |||
| Diversified Metals & Mining - 14.2% | |||
| Anglo American PLC (United Kingdom) | 302,851 | 7,127,086 | |
| Arizona Mining, Inc. (a) | 658,178 | 2,076,110 | |
| BHP Billiton PLC | 1,352,193 | 28,832,040 | |
| Boliden AB | 55,200 | 1,921,392 | |
| Glencore Xstrata PLC | 3,259,673 | 15,737,985 | |
| Grupo Mexico SA de CV Series B | 182,620 | 607,072 | |
| Ivanhoe Mines Ltd. (a) | 847,900 | 1,750,018 | |
| Korea Zinc Co. Ltd. | 3,450 | 1,396,526 | |
| MMC Norilsk Nickel PJSC sponsored ADR | 60,800 | 1,045,456 | |
| Rio Tinto PLC | 365,787 | 19,937,566 | |
| South32 Ltd. | 237,594 | 659,328 | |
| Sumitomo Metal Mining Co. Ltd. | 6,900 | 296,526 | |
| Teck Resources Ltd. Class B (sub. vtg.) | 136,500 | 3,426,454 | |
| Turquoise Hill Resources Ltd. (a) | 436,100 | 1,290,689 | |
| Vedanta Ltd. | 60,000 | 267,571 | |
| Vedanta Resources PLC | 29,400 | 294,739 | |
| 86,666,558 | |||
| Gold - 6.7% | |||
| Agnico Eagle Mines Ltd. (Canada) | 76,100 | 3,202,370 | |
| Alamos Gold, Inc. | 58,900 | 318,366 | |
| AngloGold Ashanti Ltd. sponsored ADR | 96,200 | 863,876 | |
| B2Gold Corp. (a) | 928,680 | 2,668,974 | |
| Barrick Gold Corp. | 337,800 | 4,546,270 | |
| Continental Gold, Inc. (a) | 613,200 | 1,657,233 | |
| Detour Gold Corp. (a) | 167,600 | 1,211,362 | |
| Endeavour Mining Corp. (a) | 37,200 | 634,800 | |
| Franco-Nevada Corp. | 29,900 | 2,120,794 | |
| Gold Standard Ventures Corp. (a) | 855,500 | 1,332,606 | |
| Goldcorp, Inc. | 190,610 | 2,529,689 | |
| Guyana Goldfields, Inc. (a) | 393,900 | 1,527,802 | |
| IAMGOLD Corp. (a) | 113,900 | 622,749 | |
| Kinross Gold Corp. (a) | 312,300 | 1,208,872 | |
| Kirkland Lake Gold Ltd. | 10,000 | 174,462 | |
| Newcrest Mining Ltd. | 70,215 | 1,112,905 | |
| Newmont Mining Corp. | 118,400 | 4,651,936 | |
| Premier Gold Mines Ltd. (a) | 1,124,200 | 2,381,576 | |
| Randgold Resources Ltd. sponsored ADR | 33,600 | 2,724,960 | |
| Seabridge Gold, Inc. (a) | 56,449 | 589,892 | |
| SEMAFO, Inc. (a) | 461,100 | 1,429,322 | |
| Sibanye-Stillwater ADR (b) | 278,957 | 984,718 | |
| Solgold PLC (a)(b) | 990,000 | 355,726 | |
| Torex Gold Resources, Inc. (a) | 198,170 | 2,037,341 | |
| 40,888,601 | |||
| Precious Metals & Minerals - 0.5% | |||
| Alrosa Co. Ltd. | 812,900 | 1,156,758 | |
| Dalradian Resources, Inc. (a) | 37,400 | 29,711 | |
| Fresnillo PLC | 17,400 | 305,421 | |
| Impala Platinum Holdings Ltd. (a) | 122,400 | 218,006 | |
| Industrias Penoles SA de CV | 27,865 | 584,862 | |
| Osisko Mining, Inc. (a) | 463,500 | 960,248 | |
| 3,255,006 | |||
| Silver - 0.6% | |||
| MAG Silver Corp. (a) | 86,200 | 958,039 | |
| Wheaton Precious Metals Corp. | 140,500 | 2,916,255 | |
| 3,874,294 | |||
| Steel - 7.2% | |||
| ArcelorMittal SA Class A unit (a) | 162,102 | 5,485,532 | |
| BlueScope Steel Ltd. | 96,700 | 1,188,390 | |
| China Steel Corp. | 1,344,000 | 1,061,633 | |
| Fortescue Metals Group Ltd. | 330,863 | 1,122,574 | |
| Hyundai Steel Co. | 37,939 | 2,146,839 | |
| JFE Holdings, Inc. | 163,000 | 3,361,540 | |
| Nippon Steel & Sumitomo Metal Corp. | 137,800 | 3,006,339 | |
| Nucor Corp. | 79,592 | 4,904,459 | |
| POSCO | 21,014 | 7,221,163 | |
| Steel Dynamics, Inc. | 62,400 | 2,796,144 | |
| Thyssenkrupp AG | 151,700 | 3,956,967 | |
| Vale SA sponsored ADR | 441,041 | 6,104,007 | |
| Voestalpine AG | 22,300 | 1,177,088 | |
| 43,532,675 | |||
| TOTAL METALS & MINING | 192,548,661 | ||
| Multi-Utilities - 0.0% | |||
| Multi-Utilities - 0.0% | |||
| E.ON AG | 3,279 | 35,904 | |
| Oil, Gas & Consumable Fuels - 31.1% | |||
| Coal & Consumable Fuels - 0.1% | |||
| China Shenhua Energy Co. Ltd. (H Shares) | 125,000 | 306,607 | |
| Integrated Oil & Gas - 19.7% | |||
| BP PLC | 1,933,600 | 14,362,715 | |
| Cenovus Energy, Inc. | 314,500 | 3,150,021 | |
| Chevron Corp. | 191,900 | 24,008,609 | |
| China Petroleum & Chemical Corp. (H Shares) | 2,239,000 | 2,180,471 | |
| Exxon Mobil Corp. | 170,600 | 13,264,150 | |
| Lukoil PJSC sponsored ADR | 52,200 | 3,486,960 | |
| Occidental Petroleum Corp. | 58,800 | 4,542,888 | |
| Royal Dutch Shell PLC: | |||
| Class A (United Kingdom) | 796,800 | 27,721,641 | |
| Class B (United Kingdom) | 56,830 | 2,028,766 | |
| Statoil ASA | 63,700 | 1,628,982 | |
| Suncor Energy, Inc. | 273,732 | 10,467,885 | |
| Total SA | 201,100 | 12,639,488 | |
| YPF SA Class D sponsored ADR | 40,300 | 882,167 | |
| 120,364,743 | |||
| Oil & Gas Exploration & Production - 9.9% | |||
| Anadarko Petroleum Corp. | 99,300 | 6,684,876 | |
| Birchcliff Energy Ltd. | 25,000 | 90,541 | |
| Cabot Oil & Gas Corp. | 58,800 | 1,405,908 | |
| Canadian Natural Resources Ltd. | 113,800 | 4,105,468 | |
| Centennial Resource Development, Inc. Class A (a) | 11,300 | 209,050 | |
| Cimarex Energy Co. | 9,700 | 975,723 | |
| CNOOC Ltd. sponsored ADR | 23,000 | 3,887,230 | |
| ConocoPhillips Co. | 149,900 | 9,818,450 | |
| Continental Resources, Inc. (a) | 692 | 45,714 | |
| Devon Energy Corp. | 161,100 | 5,852,763 | |
| Diamondback Energy, Inc. (a) | 7,500 | 963,375 | |
| Encana Corp. | 77,400 | 963,921 | |
| EOG Resources, Inc. | 58,200 | 6,877,494 | |
| EQT Corp. | 50,601 | 2,539,664 | |
| Extraction Oil & Gas, Inc. (a) | 45,000 | 635,400 | |
| Marathon Oil Corp. | 68,300 | 1,246,475 | |
| Newfield Exploration Co. (a) | 24,300 | 724,140 | |
| Noble Energy, Inc. | 145,800 | 4,932,414 | |
| NOVATEK OAO GDR (Reg. S) | 13,500 | 1,714,500 | |
| Pioneer Natural Resources Co. | 17,910 | 3,609,761 | |
| PrairieSky Royalty Ltd. | 124,398 | 2,758,371 | |
| Range Resources Corp. | 42,000 | 581,700 | |
| Whiting Petroleum Corp. (a) | 2,000 | 81,640 | |
| 60,704,578 | |||
| Oil & Gas Refining & Marketing - 0.8% | |||
| Reliance Industries Ltd. | 197,141 | 2,846,401 | |
| Tupras Turkiye Petrol Rafinerileri A/S | 47,000 | 1,197,533 | |
| Valero Energy Corp. | 5,800 | 643,394 | |
| 4,687,328 | |||
| Oil & Gas Storage & Transport - 0.6% | |||
| Boardwalk Pipeline Partners, LP | 135,500 | 1,540,635 | |
| Cheniere Energy, Inc. (a) | 5,400 | 314,064 | |
| Petronet LNG Ltd. | 583,132 | 1,985,387 | |
| 3,840,086 | |||
| TOTAL OIL, GAS & CONSUMABLE FUELS | 189,903,342 | ||
| Paper & Forest Products - 6.8% | |||
| Forest Products - 0.1% | |||
| Quintis Ltd. (a)(d) | 413,280 | 3 | |
| Svenska Cellulosa AB (SCA) (B Shares) | 200 | 2,223 | |
| West Fraser Timber Co. Ltd. | 4,500 | 304,813 | |
| Western Forest Products, Inc. | 25,000 | 53,935 | |
| 360,974 | |||
| Paper Products - 6.7% | |||
| Fibria Celulose SA | 164,700 | 3,235,044 | |
| Mondi PLC | 431,200 | 12,027,005 | |
| Nine Dragons Paper (Holdings) Ltd. | 1,014,000 | 1,512,340 | |
| Sappi Ltd. | 485,006 | 3,095,150 | |
| Stora Enso Oyj (R Shares) | 239,500 | 4,753,334 | |
| Suzano Papel e Celulose SA | 234,800 | 2,752,023 | |
| UPM-Kymmene Corp. | 385,100 | 13,802,588 | |
| 41,177,484 | |||
| TOTAL PAPER & FOREST PRODUCTS | 41,538,458 | ||
| Pharmaceuticals - 0.4% | |||
| Pharmaceuticals - 0.4% | |||
| Bayer AG | 23,100 | 2,760,903 | |
| Trading Companies & Distributors - 0.6% | |||
| Trading Companies & Distributors - 0.6% | |||
| Brenntag AG | 25,800 | 1,480,537 | |
| Univar, Inc. (a) | 74,000 | 2,039,440 | |
| 3,519,977 | |||
| TOTAL COMMON STOCKS | |||
| (Cost $614,443,431) | 592,189,713 | ||
| Nonconvertible Preferred Stocks - 1.4% | |||
| Metals & Mining - 0.2% | |||
| Steel - 0.2% | |||
| Gerdau SA | 52,000 | 247,145 | |
| Gerdau SA sponsored ADR | 201,600 | 941,472 | |
| 1,188,617 | |||
| Oil, Gas & Consumable Fuels - 1.2% | |||
| Integrated Oil & Gas - 1.2% | |||
| Petroleo Brasileiro SA - Petrobras (PN) sponsored ADR (non-vtg.) (a)(b) | 588,300 | 7,736,145 | |
| TOTAL NONCONVERTIBLE PREFERRED STOCKS | |||
| (Cost $6,678,135) | 8,924,762 | ||
| Money Market Funds - 2.2% | |||
| Fidelity Cash Central Fund, 1.74% (e) | 10,651,369 | 10,653,499 | |
| Fidelity Securities Lending Cash Central Fund 1.74% (e)(f) | 2,824,843 | 2,825,125 | |
| TOTAL MONEY MARKET FUNDS | |||
| (Cost $13,478,865) | 13,478,624 | ||
| TOTAL INVESTMENT IN SECURITIES - 100.7% | |||
| (Cost $634,600,431) | 614,593,099 | ||
| NET OTHER ASSETS (LIABILITIES) - (0.7)% | (4,491,593) | ||
| NET ASSETS - 100% | $610,101,506 |
Legend
(a) Non-income producing
(b) Security or a portion of the security is on loan at period end.
(c) Security exempt from registration under Rule 144A of the Securities Act of 1933. These securities may be resold in transactions exempt from registration, normally to qualified institutional buyers. At the end of the period, the value of these securities amounted to $487,677 or 0.1% of net assets.
(d) Level 3 security
(e) Affiliated fund that is generally available only to investment companies and other accounts managed by Fidelity Investments. The rate quoted is the annualized seven-day yield of the fund at period end. A complete unaudited listing of the fund's holdings as of its most recent quarter end is available upon request. In addition, each Fidelity Central Fund's financial statements are available on the SEC's website or upon request.
(f) Investment made with cash collateral received from securities on loan.
Affiliated Central Funds
Information regarding fiscal year to date income earned by the Fund from investments in Fidelity Central Funds is as follows:
| Fund | Income earned |
| Fidelity Cash Central Fund | $44,314 |
| Fidelity Securities Lending Cash Central Fund | 125,488 |
| Total | $169,802 |
Amounts in the income column in the above table include any capital gain distributions from underlying funds, which are presented in the corresponding line-item in the Statement of Operations if applicable.
Investment Valuation
The following is a summary of the inputs used, as of April 30, 2018, involving the Fund's assets and liabilities carried at fair value. The inputs or methodology used for valuing securities may not be an indication of the risk associated with investing in those securities. For more information on valuation inputs, and their aggregation into the levels used below, please refer to the Investment Valuation section in the accompanying Notes to Financial Statements.
| Valuation Inputs at Reporting Date: | ||||
| Description | Total | Level 1 | Level 2 | Level 3 |
| Investments in Securities: | ||||
| Common Stocks | $592,189,713 | $440,654,980 | $151,534,730 | $3 |
| Nonconvertible Preferred Stocks | 8,924,762 | 8,924,762 | -- | -- |
| Money Market Funds | 13,478,624 | 13,478,624 | -- | -- |
| Total Investments in Securities: | $614,593,099 | $463,058,366 | $151,534,730 | $3 |
The following is a summary of transfers between Level 1 and Level 2 for the period ended April 30, 2018. Transfers are assumed to have occurred at the beginning of the period, and are primarily attributable to the valuation techniques used for foreign equity securities, as discussed in the accompanying Notes to Financial Statements:
| Transfers | Total |
| Level 1 to Level 2 | $15,687,236 |
| Level 2 to Level 1 | $4,689,349 |
Other Information
Distribution of investments by country or territory of incorporation, as a percentage of Total Net Assets, is as follows (Unaudited):
| United States of America | 33.0% |
| United Kingdom | 19.0% |
| Canada | 16.3% |
| Brazil | 3.3% |
| Finland | 3.1% |
| Bailiwick of Jersey | 3.0% |
| Germany | 2.5% |
| France | 2.2% |
| Korea (South) | 2.2% |
| Bermuda | 2.0% |
| India | 1.7% |
| Norway | 1.5% |
| Russia | 1.3% |
| Japan | 1.2% |
| Luxembourg | 1.1% |
| Others (Individually Less Than 1%) | 6.6% |
| 100.0% |
See accompanying notes which are an integral part of the financial statements.
Financial Statements
Statement of Assets and Liabilities
| April 30, 2018 (Unaudited) | ||
| Assets | ||
| Investment in securities, at value (including securities loaned of $2,670,453) — See accompanying schedule: Unaffiliated issuers (cost $621,121,566) | $601,114,475 | |
| Fidelity Central Funds (cost $13,478,865) | 13,478,624 | |
| Total Investment in Securities (cost $634,600,431) | $614,593,099 | |
| Foreign currency held at value (cost $85,972) | 85,972 | |
| Receivable for investments sold | 797,756 | |
| Receivable for fund shares sold | 1,557,355 | |
| Dividends receivable | 1,152,243 | |
| Distributions receivable from Fidelity Central Funds | 40,358 | |
| Prepaid expenses | 201 | |
| Other receivables | 26,173 | |
| Total assets | 618,253,157 | |
| Liabilities | ||
| Payable for investments purchased | $1,636,041 | |
| Payable for fund shares redeemed | 3,114,276 | |
| Accrued management fee | 346,518 | |
| Distribution and service plan fees payable | 30,008 | |
| Other affiliated payables | 156,157 | |
| Other payables and accrued expenses | 44,196 | |
| Collateral on securities loaned | 2,824,455 | |
| Total liabilities | 8,151,651 | |
| Net Assets | $610,101,506 | |
| Net Assets consist of: | ||
| Paid in capital | $678,256,880 | |
| Undistributed net investment income | 3,191,396 | |
| Accumulated undistributed net realized gain (loss) on investments and foreign currency transactions | (51,318,391) | |
| Net unrealized appreciation (depreciation) on investments and assets and liabilities in foreign currencies | (20,028,379) | |
| Net Assets | $610,101,506 | |
| Calculation of Maximum Offering Price | ||
| Class A: | ||
| Net Asset Value and redemption price per share ($35,740,711 ÷ 2,656,989 shares) | $13.45 | |
| Maximum offering price per share (100/94.25 of $13.45) | $14.27 | |
| Class M: | ||
| Net Asset Value and redemption price per share ($8,175,227 ÷ 608,387 shares) | $13.44 | |
| Maximum offering price per share (100/96.50 of $13.44) | $13.93 | |
| Class C: | ||
| Net Asset Value and offering price per share ($23,988,249 ÷ 1,800,794 shares)(a) | $13.32 | |
| Global Commodity Stock: | ||
| Net Asset Value, offering price and redemption price per share ($422,154,468 ÷ 31,371,567 shares) | $13.46 | |
| Class I: | ||
| Net Asset Value, offering price and redemption price per share ($120,042,851 ÷ 8,918,312 shares) | $13.46 |
(a) Redemption price per share is equal to net asset value less any applicable contingent deferred sales charge.
See accompanying notes which are an integral part of the financial statements.
Statement of Operations
| Six months ended April 30, 2018 (Unaudited) | ||
| Investment Income | ||
| Dividends | $7,652,159 | |
| Income from Fidelity Central Funds | 169,802 | |
| Income before foreign taxes withheld | 7,821,961 | |
| Less foreign taxes withheld | (434,438) | |
| Total income | 7,387,523 | |
| Expenses | ||
| Management fee | $2,009,264 | |
| Transfer agent fees | 765,050 | |
| Distribution and service plan fees | 156,059 | |
| Accounting and security lending fees | 147,728 | |
| Custodian fees and expenses | 28,208 | |
| Independent trustees' fees and expenses | 1,075 | |
| Registration fees | 79,931 | |
| Audit | 26,799 | |
| Legal | 2,022 | |
| Interest | 1,921 | |
| Miscellaneous | 1,518 | |
| Total expenses before reductions | 3,219,575 | |
| Expense reductions | (34,102) | 3,185,473 |
| Net investment income (loss) | 4,202,050 | |
| Realized and Unrealized Gain (Loss) | ||
| Net realized gain (loss) on: | ||
| Investment securities: | ||
| Unaffiliated issuers | 14,898,092 | |
| Fidelity Central Funds | 1,719 | |
| Foreign currency transactions | 57,347 | |
| Total net realized gain (loss) | 14,957,158 | |
| Change in net unrealized appreciation (depreciation) on: | ||
| Investment securities: | ||
| Unaffiliated issuers | 22,249,935 | |
| Fidelity Central Funds | 203 | |
| Assets and liabilities in foreign currencies | 717 | |
| Total change in net unrealized appreciation (depreciation) | 22,250,855 | |
| Net gain (loss) | 37,208,013 | |
| Net increase (decrease) in net assets resulting from operations | $41,410,063 |
See accompanying notes which are an integral part of the financial statements.
Statement of Changes in Net Assets
| Six months ended April 30, 2018 (Unaudited) | Year ended October 31, 2017 | |
| Increase (Decrease) in Net Assets | ||
| Operations | ||
| Net investment income (loss) | $4,202,050 | $5,241,419 |
| Net realized gain (loss) | 14,957,158 | 30,354,449 |
| Change in net unrealized appreciation (depreciation) | 22,250,855 | 31,191,808 |
| Net increase (decrease) in net assets resulting from operations | 41,410,063 | 66,787,676 |
| Distributions to shareholders from net investment income | (5,388,694) | (3,511,036) |
| Distributions to shareholders from net realized gain | (2,013,457) | (2,362,260) |
| Total distributions | (7,402,151) | (5,873,296) |
| Share transactions - net increase (decrease) | 146,797,323 | 15,840,057 |
| Redemption fees | 181 | 12,604 |
| Total increase (decrease) in net assets | 180,805,416 | 76,767,041 |
| Net Assets | ||
| Beginning of period | 429,296,090 | 352,529,049 |
| End of period | $610,101,506 | $429,296,090 |
| Other Information | ||
| Undistributed net investment income end of period | $3,191,396 | $4,378,040 |
See accompanying notes which are an integral part of the financial statements.
Financial Highlights
Fidelity Global Commodity Stock Fund Class A
| Six months ended (Unaudited) April 30, | Years endedOctober 31, | |||||
| 2018 | 2017 | 2016 | 2015 | 2014 | 2013 | |
| Selected Per–Share Data | ||||||
| Net asset value, beginning of period | $12.56 | $10.73 | $10.05 | $13.25 | $14.17 | $14.59 |
| Income from Investment Operations | ||||||
| Net investment income (loss)A | .08 | .12 | .11 | .22 | .15 | .16 |
| Net realized and unrealized gain (loss) | .94 | 1.86 | .79 | (3.25) | (.91) | (.45) |
| Total from investment operations | 1.02 | 1.98 | .90 | (3.03) | (.76) | (.29) |
| Distributions from net investment income | (.09) | (.08) | (.21) | (.14) | (.15) | (.13) |
| Distributions from net realized gain | (.05) | (.07) | (.01) | (.03) | (.01) | – |
| Total distributions | (.13)B | (.15) | (.22) | (.17) | (.16) | (.13) |
| Redemption fees added to paid in capitalA,C | – | – | – | – | – | – |
| Net asset value, end of period | $13.45 | $12.56 | $10.73 | $10.05 | $13.25 | $14.17 |
| Total ReturnD,E,F | 8.24% | 18.53% | 9.29% | (23.16)% | (5.41)% | (2.00)% |
| Ratios to Average Net AssetsG,H | ||||||
| Expenses before reductions | 1.30%I | 1.33% | 1.38% | 1.34% | 1.35% | 1.36% |
| Expenses net of fee waivers, if any | 1.30%I | 1.33% | 1.38% | 1.34% | 1.35% | 1.35% |
| Expenses net of all reductions | 1.29%I | 1.32% | 1.37% | 1.34% | 1.35% | 1.34% |
| Net investment income (loss) | 1.25%I | 1.07% | 1.18% | 1.85% | 1.05% | 1.12% |
| Supplemental Data | ||||||
| Net assets, end of period (000 omitted) | $35,741 | $29,920 | $34,791 | $31,391 | $51,586 | $71,293 |
| Portfolio turnover rateJ | 61%I | 81% | 85% | 77% | 75% | 65% |
A Calculated based on average shares outstanding during the period.
B Total distributions of $.13 per share is comprised of distributions from net investment income of $.086 and distributions from net realized gain of $.047 per share.
C Amount represents less than $.005 per share.
D Total returns for periods of less than one year are not annualized.
E Total returns would have been lower if certain expenses had not been reduced during the applicable periods shown.
F Total returns do not include the effect of the sales charges.
G Fees and expenses of any underlying Fidelity Central Funds are not included in the Fund's expense ratio. The Fund indirectly bears its proportionate share of the expenses of any underlying Fidelity Central Funds.
H Expense ratios reflect operating expenses of the class. Expenses before reductions do not reflect amounts reimbursed by the investment adviser or reductions from brokerage service arrangements or reductions from other expense offset arrangements and do not represent the amount paid by the class during periods when reimbursements or reductions occur. Expenses net of fee waivers reflect expenses after reimbursement by the investment adviser but prior to reductions from brokerage service arrangements or other expense offset arrangements. Expenses net of all reductions represent the net expenses paid by the class.
I Annualized
J Amount does not include the portfolio activity of any underlying Fidelity Central Funds.
See accompanying notes which are an integral part of the financial statements.
Fidelity Global Commodity Stock Fund Class M
| Six months ended (Unaudited) April 30, | Years endedOctober 31, | |||||
| 2018 | 2017 | 2016 | 2015 | 2014 | 2013 | |
| Selected Per–Share Data | ||||||
| Net asset value, beginning of period | $12.53 | $10.72 | $10.02 | $13.21 | $14.13 | $14.54 |
| Income from Investment Operations | ||||||
| Net investment income (loss)A | .06 | .09 | .09 | .19 | .11 | .12 |
| Net realized and unrealized gain (loss) | .95 | 1.84 | .79 | (3.25) | (.90) | (.45) |
| Total from investment operations | 1.01 | 1.93 | .88 | (3.06) | (.79) | (.33) |
| Distributions from net investment income | (.06) | (.05) | (.17) | (.10) | (.11) | (.08) |
| Distributions from net realized gain | (.05) | (.07) | (.01) | (.03) | (.01) | – |
| Total distributions | (.10)B | (.12) | (.18) | (.13) | (.13)C | (.08) |
| Redemption fees added to paid in capitalA,D | – | – | – | – | – | – |
| Net asset value, end of period | $13.44 | $12.53 | $10.72 | $10.02 | $13.21 | $14.13 |
| Total ReturnE,F,G | 8.15% | 18.09% | 9.08% | (23.40)% | (5.65)% | (2.26)% |
| Ratios to Average Net AssetsH,I | ||||||
| Expenses before reductions | 1.60%J | 1.62% | 1.65% | 1.63% | 1.62% | 1.62% |
| Expenses net of fee waivers, if any | 1.60%J | 1.62% | 1.65% | 1.63% | 1.62% | 1.61% |
| Expenses net of all reductions | 1.59%J | 1.61% | 1.64% | 1.62% | 1.62% | 1.60% |
| Net investment income (loss) | .95%J | .78% | .90% | 1.57% | .78% | .86% |
| Supplemental Data | ||||||
| Net assets, end of period (000 omitted) | $8,175 | $6,876 | $6,068 | $6,335 | $9,867 | $12,551 |
| Portfolio turnover rateK | 61%J | 81% | 85% | 77% | 75% | 65% |
A Calculated based on average shares outstanding during the period.
B Total distributions of $.10 per share is comprised of distributions from net investment income of $.055 and distributions from net realized gain of $.047 per share.
C Total distributions of $.13 per share is comprised of distributions from net investment income of $.113 and distributions from net realized gain of $.013 per share.
D Amount represents less than $.005 per share.
E Total returns for periods of less than one year are not annualized.
F Total returns would have been lower if certain expenses had not been reduced during the applicable periods shown.
G Total returns do not include the effect of the sales charges.
H Fees and expenses of any underlying Fidelity Central Funds are not included in the Fund's expense ratio. The Fund indirectly bears its proportionate share of the expenses of any underlying Fidelity Central Funds.
I Expense ratios reflect operating expenses of the class. Expenses before reductions do not reflect amounts reimbursed by the investment adviser or reductions from brokerage service arrangements or reductions from other expense offset arrangements and do not represent the amount paid by the class during periods when reimbursements or reductions occur. Expenses net of fee waivers reflect expenses after reimbursement by the investment adviser but prior to reductions from brokerage service arrangements or other expense offset arrangements. Expenses net of all reductions represent the net expenses paid by the class.
J Annualized
K Amount does not include the portfolio activity of any underlying Fidelity Central Funds.
See accompanying notes which are an integral part of the financial statements.
Fidelity Global Commodity Stock Fund Class C
| Six months ended (Unaudited) April 30, | Years endedOctober 31, | |||||
| 2018 | 2017 | 2016 | 2015 | 2014 | 2013 | |
| Selected Per–Share Data | ||||||
| Net asset value, beginning of period | $12.39 | $10.61 | $9.92 | $13.06 | $13.96 | $14.37 |
| Income from Investment Operations | ||||||
| Net investment income (loss)A | .03 | .04 | .04 | .13 | .04 | .05 |
| Net realized and unrealized gain (loss) | .95 | 1.82 | .78 | (3.22) | (.89) | (.44) |
| Total from investment operations | .98 | 1.86 | .82 | (3.09) | (.85) | (.39) |
| Distributions from net investment income | – | (.01) | (.12) | (.03) | (.03) | (.02) |
| Distributions from net realized gain | (.05) | (.07) | (.01) | (.03) | (.01) | – |
| Total distributions | (.05) | (.08) | (.13) | (.05)B | (.05)C | (.02) |
| Redemption fees added to paid in capitalA,D | – | – | – | – | – | – |
| Net asset value, end of period | $13.32 | $12.39 | $10.61 | $9.92 | $13.06 | $13.96 |
| Total ReturnE,F,G | 7.92% | 17.59% | 8.46% | (23.74)% | (6.13)% | (2.75)% |
| Ratios to Average Net AssetsH,I | ||||||
| Expenses before reductions | 2.01%J | 2.07% | 2.13% | 2.12% | 2.11% | 2.11% |
| Expenses net of fee waivers, if any | 2.01%J | 2.07% | 2.13% | 2.12% | 2.11% | 2.11% |
| Expenses net of all reductions | 2.00%J | 2.06% | 2.12% | 2.11% | 2.11% | 2.10% |
| Net investment income (loss) | .54%J | .33% | .43% | 1.08% | .29% | .36% |
| Supplemental Data | ||||||
| Net assets, end of period (000 omitted) | $23,988 | $14,289 | $12,620 | $11,274 | $17,659 | $23,830 |
| Portfolio turnover rateK | 61%J | 81% | 85% | 77% | 75% | 65% |
A Calculated based on average shares outstanding during the period.
B Total distributions of $.05 per share is comprised of distributions from net investment income of $.025 and distributions from net realized gain of $.026 per share.
C Total distributions of $.05 per share is comprised of distributions from net investment income of $.033 and distributions from net realized gain of $.013 per share.
D Amount represents less than $.005 per share.
E Total returns for periods of less than one year are not annualized.
F Total returns would have been lower if certain expenses had not been reduced during the applicable periods shown.
G Total returns do not include the effect of the contingent deferred sales charge.
H Fees and expenses of any underlying Fidelity Central Funds are not included in the Fund's expense ratio. The Fund indirectly bears its proportionate share of the expenses of any underlying Fidelity Central Funds.
I Expense ratios reflect operating expenses of the class. Expenses before reductions do not reflect amounts reimbursed by the investment adviser or reductions from brokerage service arrangements or reductions from other expense offset arrangements and do not represent the amount paid by the class during periods when reimbursements or reductions occur. Expenses net of fee waivers reflect expenses after reimbursement by the investment adviser but prior to reductions from brokerage service arrangements or other expense offset arrangements. Expenses net of all reductions represent the net expenses paid by the class.
J Annualized
K Amount does not include the portfolio activity of any underlying Fidelity Central Funds.
See accompanying notes which are an integral part of the financial statements.
Fidelity Global Commodity Stock Fund
| Six months ended (Unaudited) April 30, | Years endedOctober 31, | |||||
| 2018 | 2017 | 2016 | 2015 | 2014 | 2013 | |
| Selected Per–Share Data | ||||||
| Net asset value, beginning of period | $12.59 | $10.77 | $10.09 | $13.31 | $14.24 | $14.66 |
| Income from Investment Operations | ||||||
| Net investment income (loss)A | .10 | .15 | .14 | .25 | .19 | .19 |
| Net realized and unrealized gain (loss) | .95 | 1.84 | .79 | (3.27) | (.92) | (.45) |
| Total from investment operations | 1.05 | 1.99 | .93 | (3.02) | (.73) | (.26) |
| Distributions from net investment income | (.13) | (.11) | (.24) | (.18) | (.19) | (.16) |
| Distributions from net realized gain | (.05) | (.07) | (.01) | (.03) | (.01) | – |
| Total distributions | (.18) | (.17)B | (.25) | (.20)C | (.20) | (.16) |
| Redemption fees added to paid in capitalA,D | – | – | – | – | – | – |
| Net asset value, end of period | $13.46 | $12.59 | $10.77 | $10.09 | $13.31 | $14.24 |
| Total ReturnE,F | 8.45% | 18.65% | 9.62% | (22.97)% | (5.16)% | (1.75)% |
| Ratios to Average Net AssetsG,H | ||||||
| Expenses before reductions | 1.09%I | 1.10% | 1.13% | 1.12% | 1.11% | 1.11% |
| Expenses net of fee waivers, if any | 1.09%I | 1.10% | 1.13% | 1.12% | 1.11% | 1.11% |
| Expenses net of all reductions | 1.08%I | 1.09% | 1.12% | 1.11% | 1.11% | 1.09% |
| Net investment income (loss) | 1.46%I | 1.30% | 1.43% | 2.08% | 1.29% | 1.37% |
| Supplemental Data | ||||||
| Net assets, end of period (000 omitted) | $422,154 | $264,557 | $228,982 | $156,320 | $223,084 | $273,476 |
| Portfolio turnover rateJ | 61%I | 81% | 85% | 77% | 75% | 65% |
A Calculated based on average shares outstanding during the period.
B Total distributions of $.17 per share is comprised of distributions from net investment income of $.105 and distributions from net realized gain of $.068 per share.
C Total distributions of $.20 per share is comprised of distributions from net investment income of $.178 and distributions from net realized gain of $.026 per share.
D Amount represents less than $.005 per share.
E Total returns for periods of less than one year are not annualized.
F Total returns would have been lower if certain expenses had not been reduced during the applicable periods shown.
G Fees and expenses of any underlying Fidelity Central Funds are not included in the Fund's expense ratio. The Fund indirectly bears its proportionate share of the expenses of any underlying Fidelity Central Funds.
H Expense ratios reflect operating expenses of the class. Expenses before reductions do not reflect amounts reimbursed by the investment adviser or reductions from brokerage service arrangements or reductions from other expense offset arrangements and do not represent the amount paid by the class during periods when reimbursements or reductions occur. Expenses net of fee waivers reflect expenses after reimbursement by the investment adviser but prior to reductions from brokerage service arrangements or other expense offset arrangements. Expenses net of all reductions represent the net expenses paid by the class.
I Annualized
J Amount does not include the portfolio activity of any underlying Fidelity Central Funds.
See accompanying notes which are an integral part of the financial statements.
Fidelity Global Commodity Stock Fund Class I
| Six months ended (Unaudited) April 30, | Years endedOctober 31, | |||||
| 2018 | 2017 | 2016 | 2015 | 2014 | 2013 | |
| Selected Per–Share Data | ||||||
| Net asset value, beginning of period | $12.60 | $10.76 | $10.09 | $13.31 | $14.24 | $14.67 |
| Income from Investment Operations | ||||||
| Net investment income (loss)A | .11 | .17 | .16 | .25 | .19 | .20 |
| Net realized and unrealized gain (loss) | .94 | 1.86 | .77 | (3.26) | (.92) | (.45) |
| Total from investment operations | 1.05 | 2.03 | .93 | (3.01) | (.73) | (.25) |
| Distributions from net investment income | (.14) | (.12) | (.25) | (.19) | (.19) | (.18) |
| Distributions from net realized gain | (.05) | (.07) | (.01) | (.03) | (.01) | – |
| Total distributions | (.19) | (.19) | (.26) | (.21)B | (.20) | (.18) |
| Redemption fees added to paid in capitalA,C | – | – | – | – | – | – |
| Net asset value, end of period | $13.46 | $12.60 | $10.76 | $10.09 | $13.31 | $14.24 |
| Total ReturnD,E | 8.43% | 18.99% | 9.63% | (22.93)% | (5.16)% | (1.71)% |
| Ratios to Average Net AssetsF,G | ||||||
| Expenses before reductions | .94%H | .96% | 1.01% | 1.09% | 1.06% | 1.04% |
| Expenses net of fee waivers, if any | .94%H | .95% | 1.01% | 1.08% | 1.06% | 1.04% |
| Expenses net of all reductions | .93%H | .94% | 1.00% | 1.08% | 1.06% | 1.03% |
| Net investment income (loss) | 1.61%H | 1.45% | 1.55% | 2.11% | 1.34% | 1.43% |
| Supplemental Data | ||||||
| Net assets, end of period (000 omitted) | $120,043 | $113,655 | $70,068 | $24,841 | $23,840 | $31,613 |
| Portfolio turnover rateI | 61%H | 81% | 85% | 77% | 75% | 65% |
A Calculated based on average shares outstanding during the period.
B Total distributions of $.21 per share is comprised of distributions from net investment income of $.186 and distributions from net realized gain of $.026 per share.
C Amount represents less than $.005 per share.
D Total returns for periods of less than one year are not annualized.
E Total returns would have been lower if certain expenses had not been reduced during the applicable periods shown.
F Fees and expenses of any underlying Fidelity Central Funds are not included in the Fund's expense ratio. The Fund indirectly bears its proportionate share of the expenses of any underlying Fidelity Central Funds.
G Expense ratios reflect operating expenses of the class. Expenses before reductions do not reflect amounts reimbursed by the investment adviser or reductions from brokerage service arrangements or reductions from other expense offset arrangements and do not represent the amount paid by the class during periods when reimbursements or reductions occur. Expenses net of fee waivers reflect expenses after reimbursement by the investment adviser but prior to reductions from brokerage service arrangements or other expense offset arrangements. Expenses net of all reductions represent the net expenses paid by the class.
H Annualized
I Amount does not include the portfolio activity of any underlying Fidelity Central Funds.
See accompanying notes which are an integral part of the financial statements.
Notes to Financial Statements (Unaudited)
For the period ended April 30, 2018
1. Organization.
Fidelity Global Commodity Stock Fund (the Fund) is a non-diversified fund of Fidelity Investment Trust (the Trust) and is authorized to issue an unlimited number of shares. The Trust is registered under the Investment Company Act of 1940, as amended (the 1940 Act), as an open-end management investment company organized as a Massachusetts business trust. The Fund offers Class A, Class M, Class C, Global Commodity Stock and Class I shares, each of which has equal rights as to assets and voting privileges. Each class has exclusive voting rights with respect to matters that affect that class. The Fund's investments in emerging markets can be subject to social, economic, regulatory, and political uncertainties and can be extremely volatile.
2. Investments in Fidelity Central Funds.
The Fund invests in Fidelity Central Funds, which are open-end investment companies generally available only to other investment companies and accounts managed by the investment adviser and its affiliates. The Fund's Schedule of Investments lists each of the Fidelity Central Funds held as of period end, if any, as an investment of the Fund, but does not include the underlying holdings of each Fidelity Central Fund. As an Investing Fund, the Fund indirectly bears its proportionate share of the expenses of the underlying Fidelity Central Funds.
The Money Market Central Funds seek preservation of capital and current income and are managed by Fidelity Investments Money Management, Inc. (FIMM), an affiliate of the investment adviser. Annualized expenses of the Money Market Central Funds as of their most recent shareholder report date are less than .005%.
A complete unaudited list of holdings for each Fidelity Central Fund is available upon request or at the Securities and Exchange Commission (the SEC) website at www.sec.gov. In addition, the financial statements of the Fidelity Central Funds are available on the SEC website or upon request.
3. Significant Accounting Policies.
The Fund is an investment company and applies the accounting and reporting guidance of the Financial Accounting Standards Board (FASB) Accounting Standards Codification Topic 946 Financial Services – Investments Companies. The financial statements have been prepared in conformity with accounting principles generally accepted in the United States of America (GAAP), which require management to make certain estimates and assumptions at the date of the financial statements. Actual results could differ from those estimates. Subsequent events, if any, through the date that the financial statements were issued have been evaluated in the preparation of the financial statements. The following summarizes the significant accounting policies of the Fund:
Investment Valuation. Investments are valued as of 4:00 p.m. Eastern time on the last calendar day of the period. The Board of Trustees (the Board) has delegated the day to day responsibility for the valuation of the Fund's investments to the Fair Value Committee (the Committee) established by the Fund's investment adviser. In accordance with valuation policies and procedures approved by the Board, the Fund attempts to obtain prices from one or more third party pricing vendors or brokers to value its investments. When current market prices, quotations or currency exchange rates are not readily available or reliable, investments will be fair valued in good faith by the Committee, in accordance with procedures adopted by the Board. Factors used in determining fair value vary by investment type and may include market or investment specific events. The frequency with which these procedures are used cannot be predicted and they may be utilized to a significant extent. The Committee oversees the Fund's valuation policies and procedures and reports to the Board on the Committee's activities and fair value determinations. The Board monitors the appropriateness of the procedures used in valuing the Fund's investments and ratifies the fair value determinations of the Committee.
The Fund categorizes the inputs to valuation techniques used to value its investments into a disclosure hierarchy consisting of three levels as shown below:
- Level 1 – quoted prices in active markets for identical investments
- Level 2 – other significant observable inputs (including quoted prices for similar investments, interest rates, prepayment speeds, etc.)
- Level 3 – unobservable inputs (including the Fund's own assumptions based on the best information available)
Valuation techniques used to value the Fund's investments by major category are as follows:
Equity securities, including restricted securities, for which market quotations are readily available, are valued at the last reported sale price or official closing price as reported by a third party pricing vendor on the primary market or exchange on which they are traded and are categorized as Level 1 in the hierarchy. In the event there were no sales during the day or closing prices are not available, securities are valued at the last quoted bid price or may be valued using the last available price and are generally categorized as Level 2 in the hierarchy. For foreign equity securities, when market or security specific events arise, comparisons to the valuation of American Depositary Receipts (ADRs), futures contracts, Exchange-Traded Funds (ETFs) and certain indexes as well as quoted prices for similar securities may be used and would be categorized as Level 2 in the hierarchy. Utilizing these techniques may result in transfers between Level 1 and Level 2. For equity securities, including restricted securities, where observable inputs are limited, assumptions about market activity and risk are used and these securities may be categorized as Level 3 in the hierarchy.
Investments in open-end mutual funds, including the Fidelity Central Funds, are valued at their closing net asset value (NAV) each business day and are categorized as Level 1 in the hierarchy.
Changes in valuation techniques may result in transfers in or out of an assigned level within the disclosure hierarchy. The aggregate value of investments by input level as of April 30, 2018, including information on transfers between Levels 1 and 2, is included at the end of the Fund's Schedule of Investments.
Foreign Currency. The Fund may use foreign currency contracts to facilitate transactions in foreign-denominated securities. Gains and losses from these transactions may arise from changes in the value of the foreign currency or if the counterparties do not perform under the contracts' terms.
Foreign-denominated assets, including investment securities, and liabilities are translated into U.S. dollars at the exchange rates at period end. Purchases and sales of investment securities, income and dividends received and expenses denominated in foreign currencies are translated into U.S. dollars at the exchange rate in effect on the transaction date.
The effects of exchange rate fluctuations on investments are included with the net realized and unrealized gain (loss) on investment securities. Other foreign currency transactions resulting in realized and unrealized gain (loss) are disclosed separately.
Investment Transactions and Income. For financial reporting purposes, the Fund's investment holdings and NAV include trades executed through the end of the last business day of the period. The NAV per share for processing shareholder transactions is calculated as of the close of business of the New York Stock Exchange (NYSE), normally 4:00 p.m. Eastern time and includes trades executed through the end of the prior business day. Gains and losses on securities sold are determined on the basis of identified cost and include proceeds received from litigation. Dividend income is recorded on the ex-dividend date, except for certain dividends from foreign securities where the ex-dividend date may have passed, which are recorded as soon as the Fund is informed of the ex-dividend date. Non-cash dividends included in dividend income, if any, are recorded at the fair market value of the securities received. Income and capital gain distributions from Fidelity Central Funds, if any, are recorded on the ex-dividend date. Certain distributions received by the Fund represent a return of capital or capital gain. The Fund determines the components of these distributions subsequent to the ex-dividend date, based upon receipt of tax filings or other correspondence relating to the underlying investment. These distributions are recorded as a reduction of cost of investments and/or as a realized gain. Investment income is recorded net of foreign taxes withheld where recovery of such taxes is uncertain.
Class Allocations and Expenses. Investment income, realized and unrealized capital gains and losses, common expenses of the Fund, and certain fund-level expense reductions, if any, are allocated daily on a pro-rata basis to each class based on the relative net assets of each class to the total net assets of the Fund. Each class differs with respect to transfer agent and distribution and service plan fees incurred. Certain expense reductions may also differ by class. For the reporting period, the allocated portion of income and expenses to each class as a percent of its average net assets may vary due to the timing of recording these transactions in relation to fluctuating net assets of the classes. Expenses directly attributable to a fund are charged to that fund. Expenses attributable to more than one fund are allocated among the respective funds on the basis of relative net assets or other appropriate methods. Expense estimates are accrued in the period to which they relate and adjustments are made when actual amounts are known.
Income Tax Information and Distributions to Shareholders. Each year, the Fund intends to qualify as a regulated investment company under Subchapter M of the Internal Revenue Code, including distributing substantially all of its taxable income and realized gains. As a result, no provision for U.S. Federal income taxes is required. The Fund files a U.S. federal tax return, in addition to state and local tax returns as required. The Fund's federal income tax returns are subject to examination by the Internal Revenue Service (IRS) for a period of three fiscal years after they are filed. State and local tax returns may be subject to examination for an additional fiscal year depending on the jurisdiction. Foreign taxes are provided for based on the Fund's understanding of the tax rules and rates that exist in the foreign markets in which it invests.
Distributions are declared and recorded on the ex-dividend date. Income and capital gain distributions are declared separately for each class. Income and capital gain distributions are determined in accordance with income tax regulations, which may differ from GAAP.
Capital accounts within the financial statements are adjusted for permanent book-tax differences. These adjustments have no impact on net assets or the results of operations. Capital accounts are not adjusted for temporary book-tax differences which will reverse in a subsequent period.
Book-tax differences are primarily due to foreign currency transactions, passive foreign investment companies (PFIC), partnerships, capital loss carryforwards and losses deferred due to wash sales.
As of period end, the cost and unrealized appreciation (depreciation) in securities, and derivatives if applicable, for federal income tax purposes were as follows:
| Gross unrealized appreciation | $46,327,115 |
| Gross unrealized depreciation | (74,679,689) |
| Net unrealized appreciation (depreciation) | $(28,352,574) |
| Tax cost | $642,945,673 |
Capital loss carryforwards are only available to offset future capital gains of the Fund to the extent provided by regulations and may be limited. Under the Regulated Investment Company Modernization Act of 2010 (the Act), the Fund is permitted to carry forward capital losses incurred in taxable years beginning after December 22, 2010 for an unlimited period and such capital losses are required to be used prior to any losses that expire. The capital loss carryforward information presented below, including any applicable limitation, is estimated as of prior fiscal period end and is subject to adjustment.
| Fiscal year of expiration | |
| 2019 | $(6,952,413) |
| No expiration | |
| Long-term | (51,094,968) |
| Total capital loss carryforward | $(58,047,381) |
Short-Term Trading (Redemption) Fees. During the period, shares held by investors in the Fund less than 30 days may have been subject to a redemption fee equal to 1.00% of the NAV of shares redeemed. All redemption fees, which reduce the proceeds of the shareholder redemption, are retained by the Fund and accounted for as an addition to paid in capital. In November 2017, the Board of Trustees approved the elimination of these redemption fees effective December 18, 2017.
Restricted Securities. The Fund may invest in securities that are subject to legal or contractual restrictions on resale. These securities generally may be resold in transactions exempt from registration or to the public if the securities are registered. Disposal of these securities may involve time-consuming negotiations and expense, and prompt sale at an acceptable price may be difficult. Information regarding restricted securities is included at the end of the Fund's Schedule of Investments.
4. Purchases and Sales of Investments.
Purchases and sales of securities, other than short-term securities, aggregated $310,879,576 and $171,088,831, respectively.
5. Fees and Other Transactions with Affiliates.
Management Fee. Fidelity Management & Research Company (the investment adviser) and its affiliates provide the Fund with investment management related services for which the Fund pays a monthly management fee. The management fee is the sum of an individual fund fee rate that is based on an annual rate of .45% of the Fund's average net assets and an annualized group fee rate that averaged .24% during the period. The group fee rate is based upon the average net assets of all the mutual funds advised by the investment adviser, including any mutual funds previously advised by the investment adviser that are currently advised by Fidelity SelectCo, LLC, an affiliate of the investment adviser. The group fee rate decreases as assets under management increase and increases as assets under management decrease. For the reporting period, the total annualized management fee rate was .69% of the Fund's average net assets.
Distribution and Service Plan Fees. In accordance with Rule 12b-1 of the 1940 Act, the Fund has adopted separate Distribution and Service Plans for each class of shares. Certain classes pay Fidelity Distributors Corporation (FDC), an affiliate of the investment adviser, separate Distribution and Service Fees, each of which is based on an annual percentage of each class' average net assets. In addition, FDC may pay financial intermediaries for selling shares of the Fund and providing shareholder support services. For the period, the Distribution and Service Fee rates, total fees and amounts retained by FDC were as follows:
| Distribution Fee | Service Fee | Total Fees | Retained by FDC | |
| Class A | -% | .25% | $39,158 | $1,147 |
| Class M | .25% | .25% | 18,456 | 156 |
| Class C | .75% | .25% | 98,445 | 12,671 |
| $156,059 | $13,974 |
Sales Load. FDC may receive a front-end sales charge of up to 5.75% for selling Class A shares and 3.50% for selling Class M shares, some of which is paid to financial intermediaries for selling shares of the Fund. Depending on the holding period, FDC may receive contingent deferred sales charges levied on Class A, Class M and Class C redemptions. The deferred sales charges are 1.00% for Class C shares, 1.00% for certain purchases of Class A shares and .25% for certain purchases of Class M shares.
For the period, sales charge amounts retained by FDC were as follows:
| Retained by FDC | |
| Class A | $10,335 |
| Class M | 935 |
| Class C(a) | 1,012 |
| $12,282 |
(a) When Class C shares are initially sold, FDC pays commissions from its own resources to financial intermediaries through which the sales are made.
Transfer Agent Fees. Fidelity Investments Institutional Operations Company, Inc., (FIIOC), an affiliate of the investment adviser, is the transfer, dividend disbursing and shareholder servicing agent for each class of the Fund. FIIOC receives account fees and asset-based fees that vary according to the account size and type of account of the shareholders of the respective classes of the Fund. FIIOC pays for typesetting, printing and mailing of shareholder reports, except proxy statements.
For the period, transfer agent fees for each class were as follows:
| Amount | % of Class-Level Average Net Assets(a) | |
| Class A | $40,346 | .26 |
| Class M | 11,570 | .31 |
| Class C | 22,090 | .22 |
| Global Commodity Stock | 598,930 | .30 |
| Class I | 92,114 | .15 |
| $765,050 |
(a) Annualized
Accounting and Security Lending Fees. Fidelity Service Company, Inc. (FSC), an affiliate of the investment adviser, maintains the Fund's accounting records. The accounting fee is based on the level of average net assets for each month. Under a separate contract, FSC administers the security lending program. The security lending fee is based on the number and duration of lending transactions. For the period, the fees were equivalent to an annualized rate of .05%.
Brokerage Commissions. The Fund placed a portion of its portfolio transactions with brokerage firms which are affiliates of the investment adviser. Brokerage commissions are included in net realized gain (loss) and change in net unrealized appreciation (depreciation) in the Statement of Operations. The commissions paid to these affiliated firms were $2,620 for the period.
Interfund Lending Program. Pursuant to an Exemptive Order issued by the SEC, the Fund, along with other registered investment companies having management contracts with Fidelity Management & Research Company (FMR) or other affiliated entities of FMR, may participate in an interfund lending program. This program provides an alternative credit facility allowing the funds to borrow from, or lend money to, other participating affiliated funds. At period end, there were no interfund loans outstanding. The Fund's activity in this program during the period for which loans were outstanding was as follows:
| Borrower or Lender | Average Loan Balance | Weighted Average Interest Rate | Interest Expense |
| Borrower | $8,883,750 | 1.95% | $1,921 |
Interfund Trades. The Fund may purchase from or sell securities to other Fidelity Funds under procedures adopted by the Board. The procedures have been designed to ensure these interfund trades are executed in accordance with Rule 17a-7 of the 1940 Act. Interfund trades are included within the respective purchases and sales amounts shown in the Purchases and Sales of Investments note.
6. Committed Line of Credit.
The Fund participates with other funds managed by the investment adviser or an affiliate in a $4.25 billion credit facility (the "line of credit") to be utilized for temporary or emergency purposes to fund shareholder redemptions or for other short-term liquidity purposes. The Fund has agreed to pay commitment fees on its pro-rata portion of the line of credit, which amounted to $770 and is reflected in Miscellaneous expenses on the Statement of Operations. During the period, the Fund did not borrow on this line of credit.
7. Security Lending.
The Fund lends portfolio securities through a lending agent from time to time in order to earn additional income. For equity securities, a lending agent is used and may loan securities to certain qualified borrowers, including Fidelity Capital Markets (FCM), a broker-dealer affiliated with the Fund. On the settlement date of the loan, the Fund receives collateral (in the form of U.S. Treasury obligations, letters of credit and/or cash) against the loaned securities and maintains collateral in an amount not less than 100% of the market value of the loaned securities during the period of the loan. The market value of the loaned securities is determined at the close of business of the Fund and any additional required collateral is delivered to the Fund on the next business day. The Fund or borrower may terminate the loan at any time, and if the borrower defaults on its obligation to return the securities loaned because of insolvency or other reasons, the Fund may apply collateral received from the borrower against the obligation. The Fund may experience delays and costs in recovering the securities loaned. Any cash collateral received is invested in the Fidelity Securities Lending Cash Central Fund. The value of loaned securities and cash collateral at period end are disclosed on the Fund's Statement of Assets and Liabilities. At period end, there were no security loans outstanding with FCM. Security lending income represents the income earned on investing cash collateral, less rebates paid to borrowers and any lending agent fees associated with the loan, plus any premium payments received for lending certain types of securities. Security lending income is presented in the Statement of Operations as a component of income from Fidelity Central Funds. Total security lending income during the period amounted to $125,488, including $12 from securities loaned to FCM.
8. Expense Reductions.
Commissions paid to certain brokers with whom the investment adviser, or its affiliates, places trades on behalf of the Fund include an amount in addition to trade execution, which may be rebated back to the Fund to offset certain expenses. This amount totaled $31,352 for the period.
In addition, during the period the investment adviser reimbursed and/or waived a portion of fund-level operating expenses in the amount of $2,750.
9. Distributions to Shareholders.
Distributions to shareholders of each class were as follows:
| Six months ended April 30, 2018 | Year ended October 31, 2017 | |
| From net investment income | ||
| Class A | $200,164 | $252,767 |
| Class M | 29,988 | 29,683 |
| Class C | – | 14,849 |
| Global Commodity Stock | 3,910,788 | 2,329,358 |
| Class I | 1,247,754 | 884,379 |
| Total | $5,388,694 | $3,511,036 |
| From net realized gain | ||
| Class A | $109,392 | $220,361 |
| Class M | 25,627 | 39,578 |
| Class C | 53,428 | 84,142 |
| Global Commodity Stock | 1,403,107 | 1,508,537 |
| Class I | 421,903 | 509,642 |
| Total | $2,013,457 | $2,362,260 |
10. Share Transactions.
Share transactions for each class were as follows and may contain automatic conversions between classes or exchanges between affiliated funds:
| Shares | Shares | Dollars | Dollars | |
| Six months ended April 30, 2018 | Year ended October 31, 2017 | Six months ended April 30, 2018 | Year ended October 31, 2017 | |
| Class A | ||||
| Shares sold | 623,347 | 651,469 | $8,284,893 | $7,552,817 |
| Reinvestment of distributions | 24,771 | 39,394 | 306,172 | 455,002 |
| Shares redeemed | (373,735) | (1,549,520) | (4,907,588) | (18,059,878) |
| Net increase (decrease) | 274,383 | (858,657) | $3,683,477 | $(10,052,059) |
| Class M | ||||
| Shares sold | 120,719 | 139,490 | $1,588,532 | $1,612,955 |
| Reinvestment of distributions | 4,488 | 5,865 | 55,468 | 67,801 |
| Shares redeemed | (65,479) | (162,841) | (867,969) | (1,893,807) |
| Net increase (decrease) | 59,728 | (17,486) | $776,031 | $(213,051) |
| Class C | ||||
| Shares sold | 791,082 | 316,655 | $10,651,169 | $3,641,065 |
| Reinvestment of distributions | 4,237 | 8,150 | 52,034 | 93,566 |
| Shares redeemed | (147,326) | (361,056) | (1,924,632) | (4,124,666) |
| Net increase (decrease) | 647,993 | (36,251) | $8,778,571 | $(390,035) |
| Global Commodity Stock | ||||
| Shares sold | 13,872,352 | 7,707,102 | $180,441,775 | $89,805,053 |
| Reinvestment of distributions | 414,534 | 315,142 | 5,123,639 | 3,643,039 |
| Shares redeemed | (3,921,482) | (8,286,656) | (51,378,848) | (96,347,286) |
| Net increase (decrease) | 10,365,404 | (264,412) | $134,186,566 | $(2,899,194) |
| Class I | ||||
| Shares sold | 1,609,952 | 4,738,302 | $21,622,289 | $54,914,110 |
| Reinvestment of distributions | 65,617 | 58,242 | 810,368 | 672,698 |
| Shares redeemed | (1,779,948) | (2,283,691) | (23,059,979) | (26,192,412) |
| Net increase (decrease) | (104,379) | 2,512,853 | $(627,322) | $29,394,396 |
11. Other.
The Fund's organizational documents provide former and current trustees and officers with a limited indemnification against liabilities arising in connection with the performance of their duties to the Fund. In the normal course of business, the Fund may also enter into contracts that provide general indemnifications. The Fund's maximum exposure under these arrangements is unknown as this would be dependent on future claims that may be made against the Fund. The risk of material loss from such claims is considered remote.
At the end of the period, VIP FundsManager 50% Portfolio and VIP FundsManager 60% Portfolio were the owners of record of approximately 12% and 11%, respectively, of the total outstanding shares of the Fund. Mutual funds managed by the investment adviser or its affiliates were the owners of record, in the aggregate, of approximately 28% of the total outstanding shares of the Fund.
Shareholder Expense Example
As a shareholder of the Fund, you incur two types of costs: (1) transaction costs, including sales charges (loads) on purchase payments or redemption proceeds, redemption fees and (2) ongoing costs, including management fees, distribution and/or service (12b-1) fees and other Fund expenses. This Example is intended to help you understand your ongoing costs (in dollars) of investing in the Fund and to compare these costs with the ongoing costs of investing in other mutual funds.
The Example is based on an investment of $1,000 invested at the beginning of the period and held for the entire period (November 1, 2017 to April 30, 2018).
Actual Expenses
The first line of the accompanying table for each class of the Fund provides information about actual account values and actual expenses. You may use the information in this line, together with the amount you invested, to estimate the expenses that you paid over the period. Simply divide your account value by $1,000.00 (for example, an $8,600 account value divided by $1,000.00 = 8.6), then multiply the result by the number in the first line for a class of the Fund under the heading entitled "Expenses Paid During Period" to estimate the expenses you paid on your account during this period. A small balance maintenance fee of $12.00 that is charged once a year may apply for certain accounts with a value of less than $2,000. This fee is not included in the table below. If it was, the estimate of expenses you paid during the period would be higher, and your ending account value lower, by this amount. In addition, the Fund, as a shareholder in the underlying Fidelity Central Funds, will indirectly bear its pro-rata share of the fees and expenses incurred by the underlying Fidelity Central Funds. These fees and expenses are not included in the Fund's annualized expense ratio used to calculate the expense estimate in the table below.
Hypothetical Example for Comparison Purposes
The second line of the accompanying table for each class of the Fund provides information about hypothetical account values and hypothetical expenses based on a Class' actual expense ratio and an assumed rate of return of 5% per year before expenses, which is not the Class' actual return. The hypothetical account values and expenses may not be used to estimate the actual ending account balance or expenses you paid for the period. You may use this information to compare the ongoing costs of investing in the Fund and other funds. To do so, compare this 5% hypothetical example with the 5% hypothetical examples that appear in the shareholder reports of the other funds. A small balance maintenance fee of $12.00 that is charged once a year may apply for certain accounts with a value of less than $2,000. This fee is not included in the table below. If it was, the estimate of expenses you paid during the period would be higher, and your ending account value lower, by this amount. In addition, the Fund, as a shareholder in the underlying Fidelity Central Funds, will indirectly bear its pro-rata share of the fees and expenses incurred by the underlying Fidelity Central Funds. These fees and expenses are not included in the Fund's annualized expense ratio used to calculate the expense estimate in the table below.
Please note that the expenses shown in the table are meant to highlight your ongoing costs only and do not reflect any transaction costs. Therefore, the second line of the table is useful in comparing ongoing costs only, and will not help you determine the relative total costs of owning different funds. In addition, if these transactional costs were included, your costs would have been higher.
| Annualized Expense Ratio-A | Beginning Account Value November 1, 2017 | Ending Account Value April 30, 2018 | Expenses Paid During Period-B November 1, 2017 to April 30, 2018 | |
| Class A | 1.30% | |||
| Actual | $1,000.00 | $1,082.40 | $6.71 | |
| Hypothetical-C | $1,000.00 | $1,018.35 | $6.51 | |
| Class M | 1.60% | |||
| Actual | $1,000.00 | $1,081.50 | $8.26 | |
| Hypothetical-C | $1,000.00 | $1,016.86 | $8.00 | |
| Class C | 2.01% | |||
| Actual | $1,000.00 | $1,079.20 | $10.36 | |
| Hypothetical-C | $1,000.00 | $1,014.83 | $10.04 | |
| Global Commodity Stock | 1.09% | |||
| Actual | $1,000.00 | $1,084.50 | $5.63 | |
| Hypothetical-C | $1,000.00 | $1,019.39 | $5.46 | |
| Class I | .94% | |||
| Actual | $1,000.00 | $1,084.30 | $4.86 | |
| Hypothetical-C | $1,000.00 | $1,020.13 | $4.71 |
A Annualized expense ratio reflects expenses net of applicable fee waivers.
B Expenses are equal to each Class' annualized expense ratio, multiplied by the average account value over the period, multiplied by 181/365 (to reflect the one-half year period).
C 5% return per year before expenses
![]()
AGCS-SANN-0618
1.879399.109
Fidelity® Global Commodity Stock Fund Semi-Annual Report April 30, 2018 |
|
Contents
To view a fund's proxy voting guidelines and proxy voting record for the 12-month period ended June 30, visit http://www.fidelity.com/proxyvotingresults or visit the Securities and Exchange Commission's (SEC) web site at http://www.sec.gov.
You may also call 1-800-544-8544 to request a free copy of the proxy voting guidelines.
Standard & Poor's, S&P and S&P 500 are registered service marks of The McGraw-Hill Companies, Inc. and have been licensed for use by Fidelity Distributors Corporation.
Other third-party marks appearing herein are the property of their respective owners.
All other marks appearing herein are registered or unregistered trademarks or service marks of FMR LLC or an affiliated company. © 2018 FMR LLC. All rights reserved.
This report and the financial statements contained herein are submitted for the general information of the shareholders of the Fund. This report is not authorized for distribution to prospective investors in the Fund unless preceded or accompanied by an effective prospectus.
A fund files its complete schedule of portfolio holdings with the SEC for the first and third quarters of each fiscal year on Form N-Q. Forms N-Q are available on the SEC’s web site at http://www.sec.gov. A fund's Forms N-Q may be reviewed and copied at the SEC’s Public Reference Room in Washington, DC. Information regarding the operation of the SEC's Public Reference Room may be obtained by calling 1-800-SEC-0330.
For a complete list of a fund's portfolio holdings, view the most recent holdings listing, semiannual report, or annual report on Fidelity's web site at http://www.fidelity.com, http://www.institutional.fidelity.com, or http://www.401k.com, as applicable.
NOT FDIC INSURED •MAY LOSE VALUE •NO BANK GUARANTEE
Neither the Fund nor Fidelity Distributors Corporation is a bank.
Investment Summary (Unaudited)
Top Ten Stocks as of April 30, 2018
| % of fund's net assets | |
| Nutrien Ltd. | 4.9 |
| BHP Billiton PLC | 4.7 |
| Royal Dutch Shell PLC Class A (United Kingdom) | 4.5 |
| Chevron Corp. | 3.9 |
| Rio Tinto PLC | 3.3 |
| Glencore Xstrata PLC | 2.6 |
| BP PLC | 2.4 |
| UPM-Kymmene Corp. | 2.3 |
| FMC Corp. | 2.2 |
| Exxon Mobil Corp. | 2.2 |
| 33.0 |
Top Sectors (% of fund's net assets)
| As of April 30, 2018 | ||
| Energy | 32.0% | |
| Metals | 31.8% | |
| Agriculture | 25.1% | |
| Other | 9.6% | |
| Short-Term Investments and Net Other Assets | 1.5% | |

Schedule of Investments April 30, 2018 (Unaudited)
Showing Percentage of Net Assets
| Common Stocks - 97.1% | |||
| Shares | Value | ||
| Chemicals - 17.1% | |||
| Commodity Chemicals - 1.4% | |||
| LG Chemical Ltd. | 7,230 | $2,430,422 | |
| LyondellBasell Industries NV Class A | 31,900 | 3,372,787 | |
| Olin Corp. | 30,300 | 914,757 | |
| Tronox Ltd. Class A | 14,265 | 245,073 | |
| Westlake Chemical Corp. | 14,600 | 1,561,762 | |
| 8,524,801 | |||
| Diversified Chemicals - 1.7% | |||
| BASF AG | 11,400 | 1,186,096 | |
| DowDuPont, Inc. | 92,758 | 5,866,016 | |
| The Chemours Co. LLC | 66,000 | 3,195,060 | |
| 10,247,172 | |||
| Fertilizers & Agricultural Chemicals - 13.1% | |||
| CF Industries Holdings, Inc. | 284,860 | 11,052,568 | |
| FMC Corp. | 169,300 | 13,498,289 | |
| K&S AG | 181,700 | 5,356,065 | |
| Nutrien Ltd. | 655,483 | 29,839,933 | |
| OCI NV (a)(b) | 61,600 | 1,466,191 | |
| Sociedad Quimica y Minera de Chile SA (PN-B) sponsored ADR (b) | 5,600 | 307,384 | |
| The Mosaic Co. | 359,261 | 9,682,084 | |
| UPL Ltd. | 240,689 | 2,635,195 | |
| Yara International ASA | 140,500 | 5,937,138 | |
| 79,774,847 | |||
| Industrial Gases - 0.2% | |||
| Air Liquide SA | 7,200 | 935,830 | |
| Linde AG | 2,900 | 644,550 | |
| 1,580,380 | |||
| Specialty Chemicals - 0.7% | |||
| Platform Specialty Products Corp. (a) | 286,900 | 2,889,083 | |
| Umicore SA | 23,000 | 1,284,862 | |
| 4,173,945 | |||
| TOTAL CHEMICALS | 104,301,145 | ||
| Commercial Services & Supplies - 0.1% | |||
| Environmental & Facility Services - 0.1% | |||
| Clean TeQ Holdings Ltd. (a)(b) | 674,700 | 463,811 | |
| Construction Materials - 0.3% | |||
| Construction Materials - 0.3% | |||
| Buzzi Unicem SpA | 24,700 | 625,189 | |
| Dalmia Bharat Ltd. | 20,700 | 947,684 | |
| Shree Cement Ltd. | 2,300 | 585,029 | |
| 2,157,902 | |||
| Containers & Packaging - 0.6% | |||
| Paper Packaging - 0.6% | |||
| Amcor Ltd. | 53,700 | 553,377 | |
| Packaging Corp. of America | 13,500 | 1,561,815 | |
| WestRock Co. | 27,559 | 1,630,390 | |
| 3,745,582 | |||
| Electric Utilities - 0.5% | |||
| Electric Utilities - 0.5% | |||
| Exelon Corp. | 40,700 | 1,614,976 | |
| Vistra Energy Corp. (a) | 54,700 | 1,249,895 | |
| 2,864,871 | |||
| Electronic Equipment & Components - 0.1% | |||
| Electronic Manufacturing Services - 0.1% | |||
| Philips Lighting NV (c) | 16,000 | 487,677 | |
| Energy Equipment & Services - 0.3% | |||
| Oil & Gas Equipment & Services - 0.3% | |||
| Baker Hughes, a GE Co. Class A | 200 | 7,222 | |
| John Wood Group PLC | 214,500 | 1,679,088 | |
| 1,686,310 | |||
| Food Products - 5.4% | |||
| Agricultural Products - 5.2% | |||
| Archer Daniels Midland Co. | 131,900 | 5,985,622 | |
| Bunge Ltd. | 149,500 | 10,798,385 | |
| Darling International, Inc. (a) | 216,800 | 3,715,952 | |
| First Resources Ltd. | 2,215,700 | 2,817,408 | |
| Ingredion, Inc. | 54,300 | 6,575,187 | |
| Wilmar International Ltd. | 667,800 | 1,633,725 | |
| 31,526,279 | |||
| Packaged Foods & Meats - 0.2% | |||
| Adecoagro SA (a) | 169,500 | 1,308,540 | |
| TOTAL FOOD PRODUCTS | 32,834,819 | ||
| Gas Utilities - 0.2% | |||
| Gas Utilities - 0.2% | |||
| Indraprastha Gas Ltd. | 259,000 | 1,117,036 | |
| Independent Power and Renewable Electricity Producers - 0.7% | |||
| Independent Power Producers & Energy Traders - 0.7% | |||
| China Resources Power Holdings Co. Ltd. | 644,000 | 1,235,265 | |
| NRG Energy, Inc. | 59,800 | 1,853,800 | |
| The AES Corp. | 105,900 | 1,296,216 | |
| 4,385,281 | |||
| Machinery - 1.3% | |||
| Agricultural & Farm Machinery - 0.6% | |||
| Deere & Co. | 26,700 | 3,613,311 | |
| Jain Irrigation Systems Ltd. | 147,859 | 257,971 | |
| 3,871,282 | |||
| Construction Machinery & Heavy Trucks - 0.3% | |||
| Allison Transmission Holdings, Inc. | 36,000 | 1,403,640 | |
| Komatsu Ltd. | 9,100 | 310,207 | |
| 1,713,847 | |||
| Industrial Machinery - 0.4% | |||
| Andritz AG | 20,500 | 1,103,118 | |
| The Weir Group PLC | 39,100 | 1,149,787 | |
| 2,252,905 | |||
| TOTAL MACHINERY | 7,838,034 | ||
| Metals & Mining - 31.6% | |||
| Aluminum - 0.4% | |||
| Aluminum Corp. of China Ltd. (H Shares) (a) | 520,000 | 293,689 | |
| Hindalco Industries Ltd. | 160,000 | 562,926 | |
| Norsk Hydro ASA | 203,900 | 1,273,550 | |
| 2,130,165 | |||
| Copper - 2.0% | |||
| First Quantum Minerals Ltd. | 301,624 | 4,345,998 | |
| Freeport-McMoRan, Inc. | 496,700 | 7,554,807 | |
| Lundin Mining Corp. | 45,400 | 300,557 | |
| 12,201,362 | |||
| Diversified Metals & Mining - 14.2% | |||
| Anglo American PLC (United Kingdom) | 302,851 | 7,127,086 | |
| Arizona Mining, Inc. (a) | 658,178 | 2,076,110 | |
| BHP Billiton PLC | 1,352,193 | 28,832,040 | |
| Boliden AB | 55,200 | 1,921,392 | |
| Glencore Xstrata PLC | 3,259,673 | 15,737,985 | |
| Grupo Mexico SA de CV Series B | 182,620 | 607,072 | |
| Ivanhoe Mines Ltd. (a) | 847,900 | 1,750,018 | |
| Korea Zinc Co. Ltd. | 3,450 | 1,396,526 | |
| MMC Norilsk Nickel PJSC sponsored ADR | 60,800 | 1,045,456 | |
| Rio Tinto PLC | 365,787 | 19,937,566 | |
| South32 Ltd. | 237,594 | 659,328 | |
| Sumitomo Metal Mining Co. Ltd. | 6,900 | 296,526 | |
| Teck Resources Ltd. Class B (sub. vtg.) | 136,500 | 3,426,454 | |
| Turquoise Hill Resources Ltd. (a) | 436,100 | 1,290,689 | |
| Vedanta Ltd. | 60,000 | 267,571 | |
| Vedanta Resources PLC | 29,400 | 294,739 | |
| 86,666,558 | |||
| Gold - 6.7% | |||
| Agnico Eagle Mines Ltd. (Canada) | 76,100 | 3,202,370 | |
| Alamos Gold, Inc. | 58,900 | 318,366 | |
| AngloGold Ashanti Ltd. sponsored ADR | 96,200 | 863,876 | |
| B2Gold Corp. (a) | 928,680 | 2,668,974 | |
| Barrick Gold Corp. | 337,800 | 4,546,270 | |
| Continental Gold, Inc. (a) | 613,200 | 1,657,233 | |
| Detour Gold Corp. (a) | 167,600 | 1,211,362 | |
| Endeavour Mining Corp. (a) | 37,200 | 634,800 | |
| Franco-Nevada Corp. | 29,900 | 2,120,794 | |
| Gold Standard Ventures Corp. (a) | 855,500 | 1,332,606 | |
| Goldcorp, Inc. | 190,610 | 2,529,689 | |
| Guyana Goldfields, Inc. (a) | 393,900 | 1,527,802 | |
| IAMGOLD Corp. (a) | 113,900 | 622,749 | |
| Kinross Gold Corp. (a) | 312,300 | 1,208,872 | |
| Kirkland Lake Gold Ltd. | 10,000 | 174,462 | |
| Newcrest Mining Ltd. | 70,215 | 1,112,905 | |
| Newmont Mining Corp. | 118,400 | 4,651,936 | |
| Premier Gold Mines Ltd. (a) | 1,124,200 | 2,381,576 | |
| Randgold Resources Ltd. sponsored ADR | 33,600 | 2,724,960 | |
| Seabridge Gold, Inc. (a) | 56,449 | 589,892 | |
| SEMAFO, Inc. (a) | 461,100 | 1,429,322 | |
| Sibanye-Stillwater ADR (b) | 278,957 | 984,718 | |
| Solgold PLC (a)(b) | 990,000 | 355,726 | |
| Torex Gold Resources, Inc. (a) | 198,170 | 2,037,341 | |
| 40,888,601 | |||
| Precious Metals & Minerals - 0.5% | |||
| Alrosa Co. Ltd. | 812,900 | 1,156,758 | |
| Dalradian Resources, Inc. (a) | 37,400 | 29,711 | |
| Fresnillo PLC | 17,400 | 305,421 | |
| Impala Platinum Holdings Ltd. (a) | 122,400 | 218,006 | |
| Industrias Penoles SA de CV | 27,865 | 584,862 | |
| Osisko Mining, Inc. (a) | 463,500 | 960,248 | |
| 3,255,006 | |||
| Silver - 0.6% | |||
| MAG Silver Corp. (a) | 86,200 | 958,039 | |
| Wheaton Precious Metals Corp. | 140,500 | 2,916,255 | |
| 3,874,294 | |||
| Steel - 7.2% | |||
| ArcelorMittal SA Class A unit (a) | 162,102 | 5,485,532 | |
| BlueScope Steel Ltd. | 96,700 | 1,188,390 | |
| China Steel Corp. | 1,344,000 | 1,061,633 | |
| Fortescue Metals Group Ltd. | 330,863 | 1,122,574 | |
| Hyundai Steel Co. | 37,939 | 2,146,839 | |
| JFE Holdings, Inc. | 163,000 | 3,361,540 | |
| Nippon Steel & Sumitomo Metal Corp. | 137,800 | 3,006,339 | |
| Nucor Corp. | 79,592 | 4,904,459 | |
| POSCO | 21,014 | 7,221,163 | |
| Steel Dynamics, Inc. | 62,400 | 2,796,144 | |
| Thyssenkrupp AG | 151,700 | 3,956,967 | |
| Vale SA sponsored ADR | 441,041 | 6,104,007 | |
| Voestalpine AG | 22,300 | 1,177,088 | |
| 43,532,675 | |||
| TOTAL METALS & MINING | 192,548,661 | ||
| Multi-Utilities - 0.0% | |||
| Multi-Utilities - 0.0% | |||
| E.ON AG | 3,279 | 35,904 | |
| Oil, Gas & Consumable Fuels - 31.1% | |||
| Coal & Consumable Fuels - 0.1% | |||
| China Shenhua Energy Co. Ltd. (H Shares) | 125,000 | 306,607 | |
| Integrated Oil & Gas - 19.7% | |||
| BP PLC | 1,933,600 | 14,362,715 | |
| Cenovus Energy, Inc. | 314,500 | 3,150,021 | |
| Chevron Corp. | 191,900 | 24,008,609 | |
| China Petroleum & Chemical Corp. (H Shares) | 2,239,000 | 2,180,471 | |
| Exxon Mobil Corp. | 170,600 | 13,264,150 | |
| Lukoil PJSC sponsored ADR | 52,200 | 3,486,960 | |
| Occidental Petroleum Corp. | 58,800 | 4,542,888 | |
| Royal Dutch Shell PLC: | |||
| Class A (United Kingdom) | 796,800 | 27,721,641 | |
| Class B (United Kingdom) | 56,830 | 2,028,766 | |
| Statoil ASA | 63,700 | 1,628,982 | |
| Suncor Energy, Inc. | 273,732 | 10,467,885 | |
| Total SA | 201,100 | 12,639,488 | |
| YPF SA Class D sponsored ADR | 40,300 | 882,167 | |
| 120,364,743 | |||
| Oil & Gas Exploration & Production - 9.9% | |||
| Anadarko Petroleum Corp. | 99,300 | 6,684,876 | |
| Birchcliff Energy Ltd. | 25,000 | 90,541 | |
| Cabot Oil & Gas Corp. | 58,800 | 1,405,908 | |
| Canadian Natural Resources Ltd. | 113,800 | 4,105,468 | |
| Centennial Resource Development, Inc. Class A (a) | 11,300 | 209,050 | |
| Cimarex Energy Co. | 9,700 | 975,723 | |
| CNOOC Ltd. sponsored ADR | 23,000 | 3,887,230 | |
| ConocoPhillips Co. | 149,900 | 9,818,450 | |
| Continental Resources, Inc. (a) | 692 | 45,714 | |
| Devon Energy Corp. | 161,100 | 5,852,763 | |
| Diamondback Energy, Inc. (a) | 7,500 | 963,375 | |
| Encana Corp. | 77,400 | 963,921 | |
| EOG Resources, Inc. | 58,200 | 6,877,494 | |
| EQT Corp. | 50,601 | 2,539,664 | |
| Extraction Oil & Gas, Inc. (a) | 45,000 | 635,400 | |
| Marathon Oil Corp. | 68,300 | 1,246,475 | |
| Newfield Exploration Co. (a) | 24,300 | 724,140 | |
| Noble Energy, Inc. | 145,800 | 4,932,414 | |
| NOVATEK OAO GDR (Reg. S) | 13,500 | 1,714,500 | |
| Pioneer Natural Resources Co. | 17,910 | 3,609,761 | |
| PrairieSky Royalty Ltd. | 124,398 | 2,758,371 | |
| Range Resources Corp. | 42,000 | 581,700 | |
| Whiting Petroleum Corp. (a) | 2,000 | 81,640 | |
| 60,704,578 | |||
| Oil & Gas Refining & Marketing - 0.8% | |||
| Reliance Industries Ltd. | 197,141 | 2,846,401 | |
| Tupras Turkiye Petrol Rafinerileri A/S | 47,000 | 1,197,533 | |
| Valero Energy Corp. | 5,800 | 643,394 | |
| 4,687,328 | |||
| Oil & Gas Storage & Transport - 0.6% | |||
| Boardwalk Pipeline Partners, LP | 135,500 | 1,540,635 | |
| Cheniere Energy, Inc. (a) | 5,400 | 314,064 | |
| Petronet LNG Ltd. | 583,132 | 1,985,387 | |
| 3,840,086 | |||
| TOTAL OIL, GAS & CONSUMABLE FUELS | 189,903,342 | ||
| Paper & Forest Products - 6.8% | |||
| Forest Products - 0.1% | |||
| Quintis Ltd. (a)(d) | 413,280 | 3 | |
| Svenska Cellulosa AB (SCA) (B Shares) | 200 | 2,223 | |
| West Fraser Timber Co. Ltd. | 4,500 | 304,813 | |
| Western Forest Products, Inc. | 25,000 | 53,935 | |
| 360,974 | |||
| Paper Products - 6.7% | |||
| Fibria Celulose SA | 164,700 | 3,235,044 | |
| Mondi PLC | 431,200 | 12,027,005 | |
| Nine Dragons Paper (Holdings) Ltd. | 1,014,000 | 1,512,340 | |
| Sappi Ltd. | 485,006 | 3,095,150 | |
| Stora Enso Oyj (R Shares) | 239,500 | 4,753,334 | |
| Suzano Papel e Celulose SA | 234,800 | 2,752,023 | |
| UPM-Kymmene Corp. | 385,100 | 13,802,588 | |
| 41,177,484 | |||
| TOTAL PAPER & FOREST PRODUCTS | 41,538,458 | ||
| Pharmaceuticals - 0.4% | |||
| Pharmaceuticals - 0.4% | |||
| Bayer AG | 23,100 | 2,760,903 | |
| Trading Companies & Distributors - 0.6% | |||
| Trading Companies & Distributors - 0.6% | |||
| Brenntag AG | 25,800 | 1,480,537 | |
| Univar, Inc. (a) | 74,000 | 2,039,440 | |
| 3,519,977 | |||
| TOTAL COMMON STOCKS | |||
| (Cost $614,443,431) | 592,189,713 | ||
| Nonconvertible Preferred Stocks - 1.4% | |||
| Metals & Mining - 0.2% | |||
| Steel - 0.2% | |||
| Gerdau SA | 52,000 | 247,145 | |
| Gerdau SA sponsored ADR | 201,600 | 941,472 | |
| 1,188,617 | |||
| Oil, Gas & Consumable Fuels - 1.2% | |||
| Integrated Oil & Gas - 1.2% | |||
| Petroleo Brasileiro SA - Petrobras (PN) sponsored ADR (non-vtg.) (a)(b) | 588,300 | 7,736,145 | |
| TOTAL NONCONVERTIBLE PREFERRED STOCKS | |||
| (Cost $6,678,135) | 8,924,762 | ||
| Money Market Funds - 2.2% | |||
| Fidelity Cash Central Fund, 1.74% (e) | 10,651,369 | 10,653,499 | |
| Fidelity Securities Lending Cash Central Fund 1.74% (e)(f) | 2,824,843 | 2,825,125 | |
| TOTAL MONEY MARKET FUNDS | |||
| (Cost $13,478,865) | 13,478,624 | ||
| TOTAL INVESTMENT IN SECURITIES - 100.7% | |||
| (Cost $634,600,431) | 614,593,099 | ||
| NET OTHER ASSETS (LIABILITIES) - (0.7)% | (4,491,593) | ||
| NET ASSETS - 100% | $610,101,506 |
Legend
(a) Non-income producing
(b) Security or a portion of the security is on loan at period end.
(c) Security exempt from registration under Rule 144A of the Securities Act of 1933. These securities may be resold in transactions exempt from registration, normally to qualified institutional buyers. At the end of the period, the value of these securities amounted to $487,677 or 0.1% of net assets.
(d) Level 3 security
(e) Affiliated fund that is generally available only to investment companies and other accounts managed by Fidelity Investments. The rate quoted is the annualized seven-day yield of the fund at period end. A complete unaudited listing of the fund's holdings as of its most recent quarter end is available upon request. In addition, each Fidelity Central Fund's financial statements are available on the SEC's website or upon request.
(f) Investment made with cash collateral received from securities on loan.
Affiliated Central Funds
Information regarding fiscal year to date income earned by the Fund from investments in Fidelity Central Funds is as follows:
| Fund | Income earned |
| Fidelity Cash Central Fund | $44,314 |
| Fidelity Securities Lending Cash Central Fund | 125,488 |
| Total | $169,802 |
Amounts in the income column in the above table include any capital gain distributions from underlying funds, which are presented in the corresponding line-item in the Statement of Operations if applicable.
Investment Valuation
The following is a summary of the inputs used, as of April 30, 2018, involving the Fund's assets and liabilities carried at fair value. The inputs or methodology used for valuing securities may not be an indication of the risk associated with investing in those securities. For more information on valuation inputs, and their aggregation into the levels used below, please refer to the Investment Valuation section in the accompanying Notes to Financial Statements.
| Valuation Inputs at Reporting Date: | ||||
| Description | Total | Level 1 | Level 2 | Level 3 |
| Investments in Securities: | ||||
| Common Stocks | $592,189,713 | $440,654,980 | $151,534,730 | $3 |
| Nonconvertible Preferred Stocks | 8,924,762 | 8,924,762 | -- | -- |
| Money Market Funds | 13,478,624 | 13,478,624 | -- | -- |
| Total Investments in Securities: | $614,593,099 | $463,058,366 | $151,534,730 | $3 |
The following is a summary of transfers between Level 1 and Level 2 for the period ended April 30, 2018. Transfers are assumed to have occurred at the beginning of the period, and are primarily attributable to the valuation techniques used for foreign equity securities, as discussed in the accompanying Notes to Financial Statements:
| Transfers | Total |
| Level 1 to Level 2 | $15,687,236 |
| Level 2 to Level 1 | $4,689,349 |
Other Information
Distribution of investments by country or territory of incorporation, as a percentage of Total Net Assets, is as follows (Unaudited):
| United States of America | 33.0% |
| United Kingdom | 19.0% |
| Canada | 16.3% |
| Brazil | 3.3% |
| Finland | 3.1% |
| Bailiwick of Jersey | 3.0% |
| Germany | 2.5% |
| France | 2.2% |
| Korea (South) | 2.2% |
| Bermuda | 2.0% |
| India | 1.7% |
| Norway | 1.5% |
| Russia | 1.3% |
| Japan | 1.2% |
| Luxembourg | 1.1% |
| Others (Individually Less Than 1%) | 6.6% |
| 100.0% |
See accompanying notes which are an integral part of the financial statements.
Financial Statements
Statement of Assets and Liabilities
| April 30, 2018 (Unaudited) | ||
| Assets | ||
| Investment in securities, at value (including securities loaned of $2,670,453) — See accompanying schedule: Unaffiliated issuers (cost $621,121,566) | $601,114,475 | |
| Fidelity Central Funds (cost $13,478,865) | 13,478,624 | |
| Total Investment in Securities (cost $634,600,431) | $614,593,099 | |
| Foreign currency held at value (cost $85,972) | 85,972 | |
| Receivable for investments sold | 797,756 | |
| Receivable for fund shares sold | 1,557,355 | |
| Dividends receivable | 1,152,243 | |
| Distributions receivable from Fidelity Central Funds | 40,358 | |
| Prepaid expenses | 201 | |
| Other receivables | 26,173 | |
| Total assets | 618,253,157 | |
| Liabilities | ||
| Payable for investments purchased | $1,636,041 | |
| Payable for fund shares redeemed | 3,114,276 | |
| Accrued management fee | 346,518 | |
| Distribution and service plan fees payable | 30,008 | |
| Other affiliated payables | 156,157 | |
| Other payables and accrued expenses | 44,196 | |
| Collateral on securities loaned | 2,824,455 | |
| Total liabilities | 8,151,651 | |
| Net Assets | $610,101,506 | |
| Net Assets consist of: | ||
| Paid in capital | $678,256,880 | |
| Undistributed net investment income | 3,191,396 | |
| Accumulated undistributed net realized gain (loss) on investments and foreign currency transactions | (51,318,391) | |
| Net unrealized appreciation (depreciation) on investments and assets and liabilities in foreign currencies | (20,028,379) | |
| Net Assets | $610,101,506 | |
| Calculation of Maximum Offering Price | ||
| Class A: | ||
| Net Asset Value and redemption price per share ($35,740,711 ÷ 2,656,989 shares) | $13.45 | |
| Maximum offering price per share (100/94.25 of $13.45) | $14.27 | |
| Class M: | ||
| Net Asset Value and redemption price per share ($8,175,227 ÷ 608,387 shares) | $13.44 | |
| Maximum offering price per share (100/96.50 of $13.44) | $13.93 | |
| Class C: | ||
| Net Asset Value and offering price per share ($23,988,249 ÷ 1,800,794 shares)(a) | $13.32 | |
| Global Commodity Stock: | ||
| Net Asset Value, offering price and redemption price per share ($422,154,468 ÷ 31,371,567 shares) | $13.46 | |
| Class I: | ||
| Net Asset Value, offering price and redemption price per share ($120,042,851 ÷ 8,918,312 shares) | $13.46 |
(a) Redemption price per share is equal to net asset value less any applicable contingent deferred sales charge.
See accompanying notes which are an integral part of the financial statements.
Statement of Operations
| Six months ended April 30, 2018 (Unaudited) | ||
| Investment Income | ||
| Dividends | $7,652,159 | |
| Income from Fidelity Central Funds | 169,802 | |
| Income before foreign taxes withheld | 7,821,961 | |
| Less foreign taxes withheld | (434,438) | |
| Total income | 7,387,523 | |
| Expenses | ||
| Management fee | $2,009,264 | |
| Transfer agent fees | 765,050 | |
| Distribution and service plan fees | 156,059 | |
| Accounting and security lending fees | 147,728 | |
| Custodian fees and expenses | 28,208 | |
| Independent trustees' fees and expenses | 1,075 | |
| Registration fees | 79,931 | |
| Audit | 26,799 | |
| Legal | 2,022 | |
| Interest | 1,921 | |
| Miscellaneous | 1,518 | |
| Total expenses before reductions | 3,219,575 | |
| Expense reductions | (34,102) | 3,185,473 |
| Net investment income (loss) | 4,202,050 | |
| Realized and Unrealized Gain (Loss) | ||
| Net realized gain (loss) on: | ||
| Investment securities: | ||
| Unaffiliated issuers | 14,898,092 | |
| Fidelity Central Funds | 1,719 | |
| Foreign currency transactions | 57,347 | |
| Total net realized gain (loss) | 14,957,158 | |
| Change in net unrealized appreciation (depreciation) on: | ||
| Investment securities: | ||
| Unaffiliated issuers | 22,249,935 | |
| Fidelity Central Funds | 203 | |
| Assets and liabilities in foreign currencies | 717 | |
| Total change in net unrealized appreciation (depreciation) | 22,250,855 | |
| Net gain (loss) | 37,208,013 | |
| Net increase (decrease) in net assets resulting from operations | $41,410,063 |
See accompanying notes which are an integral part of the financial statements.
Statement of Changes in Net Assets
| Six months ended April 30, 2018 (Unaudited) | Year ended October 31, 2017 | |
| Increase (Decrease) in Net Assets | ||
| Operations | ||
| Net investment income (loss) | $4,202,050 | $5,241,419 |
| Net realized gain (loss) | 14,957,158 | 30,354,449 |
| Change in net unrealized appreciation (depreciation) | 22,250,855 | 31,191,808 |
| Net increase (decrease) in net assets resulting from operations | 41,410,063 | 66,787,676 |
| Distributions to shareholders from net investment income | (5,388,694) | (3,511,036) |
| Distributions to shareholders from net realized gain | (2,013,457) | (2,362,260) |
| Total distributions | (7,402,151) | (5,873,296) |
| Share transactions - net increase (decrease) | 146,797,323 | 15,840,057 |
| Redemption fees | 181 | 12,604 |
| Total increase (decrease) in net assets | 180,805,416 | 76,767,041 |
| Net Assets | ||
| Beginning of period | 429,296,090 | 352,529,049 |
| End of period | $610,101,506 | $429,296,090 |
| Other Information | ||
| Undistributed net investment income end of period | $3,191,396 | $4,378,040 |
See accompanying notes which are an integral part of the financial statements.
Financial Highlights
Fidelity Global Commodity Stock Fund Class A
| Six months ended (Unaudited) April 30, | Years endedOctober 31, | |||||
| 2018 | 2017 | 2016 | 2015 | 2014 | 2013 | |
| Selected Per–Share Data | ||||||
| Net asset value, beginning of period | $12.56 | $10.73 | $10.05 | $13.25 | $14.17 | $14.59 |
| Income from Investment Operations | ||||||
| Net investment income (loss)A | .08 | .12 | .11 | .22 | .15 | .16 |
| Net realized and unrealized gain (loss) | .94 | 1.86 | .79 | (3.25) | (.91) | (.45) |
| Total from investment operations | 1.02 | 1.98 | .90 | (3.03) | (.76) | (.29) |
| Distributions from net investment income | (.09) | (.08) | (.21) | (.14) | (.15) | (.13) |
| Distributions from net realized gain | (.05) | (.07) | (.01) | (.03) | (.01) | – |
| Total distributions | (.13)B | (.15) | (.22) | (.17) | (.16) | (.13) |
| Redemption fees added to paid in capitalA,C | – | – | – | – | – | – |
| Net asset value, end of period | $13.45 | $12.56 | $10.73 | $10.05 | $13.25 | $14.17 |
| Total ReturnD,E,F | 8.24% | 18.53% | 9.29% | (23.16)% | (5.41)% | (2.00)% |
| Ratios to Average Net AssetsG,H | ||||||
| Expenses before reductions | 1.30%I | 1.33% | 1.38% | 1.34% | 1.35% | 1.36% |
| Expenses net of fee waivers, if any | 1.30%I | 1.33% | 1.38% | 1.34% | 1.35% | 1.35% |
| Expenses net of all reductions | 1.29%I | 1.32% | 1.37% | 1.34% | 1.35% | 1.34% |
| Net investment income (loss) | 1.25%I | 1.07% | 1.18% | 1.85% | 1.05% | 1.12% |
| Supplemental Data | ||||||
| Net assets, end of period (000 omitted) | $35,741 | $29,920 | $34,791 | $31,391 | $51,586 | $71,293 |
| Portfolio turnover rateJ | 61%I | 81% | 85% | 77% | 75% | 65% |
A Calculated based on average shares outstanding during the period.
B Total distributions of $.13 per share is comprised of distributions from net investment income of $.086 and distributions from net realized gain of $.047 per share.
C Amount represents less than $.005 per share.
D Total returns for periods of less than one year are not annualized.
E Total returns would have been lower if certain expenses had not been reduced during the applicable periods shown.
F Total returns do not include the effect of the sales charges.
G Fees and expenses of any underlying Fidelity Central Funds are not included in the Fund's expense ratio. The Fund indirectly bears its proportionate share of the expenses of any underlying Fidelity Central Funds.
H Expense ratios reflect operating expenses of the class. Expenses before reductions do not reflect amounts reimbursed by the investment adviser or reductions from brokerage service arrangements or reductions from other expense offset arrangements and do not represent the amount paid by the class during periods when reimbursements or reductions occur. Expenses net of fee waivers reflect expenses after reimbursement by the investment adviser but prior to reductions from brokerage service arrangements or other expense offset arrangements. Expenses net of all reductions represent the net expenses paid by the class.
I Annualized
J Amount does not include the portfolio activity of any underlying Fidelity Central Funds.
See accompanying notes which are an integral part of the financial statements.
Fidelity Global Commodity Stock Fund Class M
| Six months ended (Unaudited) April 30, | Years endedOctober 31, | |||||
| 2018 | 2017 | 2016 | 2015 | 2014 | 2013 | |
| Selected Per–Share Data | ||||||
| Net asset value, beginning of period | $12.53 | $10.72 | $10.02 | $13.21 | $14.13 | $14.54 |
| Income from Investment Operations | ||||||
| Net investment income (loss)A | .06 | .09 | .09 | .19 | .11 | .12 |
| Net realized and unrealized gain (loss) | .95 | 1.84 | .79 | (3.25) | (.90) | (.45) |
| Total from investment operations | 1.01 | 1.93 | .88 | (3.06) | (.79) | (.33) |
| Distributions from net investment income | (.06) | (.05) | (.17) | (.10) | (.11) | (.08) |
| Distributions from net realized gain | (.05) | (.07) | (.01) | (.03) | (.01) | – |
| Total distributions | (.10)B | (.12) | (.18) | (.13) | (.13)C | (.08) |
| Redemption fees added to paid in capitalA,D | – | – | – | – | – | – |
| Net asset value, end of period | $13.44 | $12.53 | $10.72 | $10.02 | $13.21 | $14.13 |
| Total ReturnE,F,G | 8.15% | 18.09% | 9.08% | (23.40)% | (5.65)% | (2.26)% |
| Ratios to Average Net AssetsH,I | ||||||
| Expenses before reductions | 1.60%J | 1.62% | 1.65% | 1.63% | 1.62% | 1.62% |
| Expenses net of fee waivers, if any | 1.60%J | 1.62% | 1.65% | 1.63% | 1.62% | 1.61% |
| Expenses net of all reductions | 1.59%J | 1.61% | 1.64% | 1.62% | 1.62% | 1.60% |
| Net investment income (loss) | .95%J | .78% | .90% | 1.57% | .78% | .86% |
| Supplemental Data | ||||||
| Net assets, end of period (000 omitted) | $8,175 | $6,876 | $6,068 | $6,335 | $9,867 | $12,551 |
| Portfolio turnover rateK | 61%J | 81% | 85% | 77% | 75% | 65% |
A Calculated based on average shares outstanding during the period.
B Total distributions of $.10 per share is comprised of distributions from net investment income of $.055 and distributions from net realized gain of $.047 per share.
C Total distributions of $.13 per share is comprised of distributions from net investment income of $.113 and distributions from net realized gain of $.013 per share.
D Amount represents less than $.005 per share.
E Total returns for periods of less than one year are not annualized.
F Total returns would have been lower if certain expenses had not been reduced during the applicable periods shown.
G Total returns do not include the effect of the sales charges.
H Fees and expenses of any underlying Fidelity Central Funds are not included in the Fund's expense ratio. The Fund indirectly bears its proportionate share of the expenses of any underlying Fidelity Central Funds.
I Expense ratios reflect operating expenses of the class. Expenses before reductions do not reflect amounts reimbursed by the investment adviser or reductions from brokerage service arrangements or reductions from other expense offset arrangements and do not represent the amount paid by the class during periods when reimbursements or reductions occur. Expenses net of fee waivers reflect expenses after reimbursement by the investment adviser but prior to reductions from brokerage service arrangements or other expense offset arrangements. Expenses net of all reductions represent the net expenses paid by the class.
J Annualized
K Amount does not include the portfolio activity of any underlying Fidelity Central Funds.
See accompanying notes which are an integral part of the financial statements.
Fidelity Global Commodity Stock Fund Class C
| Six months ended (Unaudited) April 30, | Years endedOctober 31, | |||||
| 2018 | 2017 | 2016 | 2015 | 2014 | 2013 | |
| Selected Per–Share Data | ||||||
| Net asset value, beginning of period | $12.39 | $10.61 | $9.92 | $13.06 | $13.96 | $14.37 |
| Income from Investment Operations | ||||||
| Net investment income (loss)A | .03 | .04 | .04 | .13 | .04 | .05 |
| Net realized and unrealized gain (loss) | .95 | 1.82 | .78 | (3.22) | (.89) | (.44) |
| Total from investment operations | .98 | 1.86 | .82 | (3.09) | (.85) | (.39) |
| Distributions from net investment income | – | (.01) | (.12) | (.03) | (.03) | (.02) |
| Distributions from net realized gain | (.05) | (.07) | (.01) | (.03) | (.01) | – |
| Total distributions | (.05) | (.08) | (.13) | (.05)B | (.05)C | (.02) |
| Redemption fees added to paid in capitalA,D | – | – | – | – | – | – |
| Net asset value, end of period | $13.32 | $12.39 | $10.61 | $9.92 | $13.06 | $13.96 |
| Total ReturnE,F,G | 7.92% | 17.59% | 8.46% | (23.74)% | (6.13)% | (2.75)% |
| Ratios to Average Net AssetsH,I | ||||||
| Expenses before reductions | 2.01%J | 2.07% | 2.13% | 2.12% | 2.11% | 2.11% |
| Expenses net of fee waivers, if any | 2.01%J | 2.07% | 2.13% | 2.12% | 2.11% | 2.11% |
| Expenses net of all reductions | 2.00%J | 2.06% | 2.12% | 2.11% | 2.11% | 2.10% |
| Net investment income (loss) | .54%J | .33% | .43% | 1.08% | .29% | .36% |
| Supplemental Data | ||||||
| Net assets, end of period (000 omitted) | $23,988 | $14,289 | $12,620 | $11,274 | $17,659 | $23,830 |
| Portfolio turnover rateK | 61%J | 81% | 85% | 77% | 75% | 65% |
A Calculated based on average shares outstanding during the period.
B Total distributions of $.05 per share is comprised of distributions from net investment income of $.025 and distributions from net realized gain of $.026 per share.
C Total distributions of $.05 per share is comprised of distributions from net investment income of $.033 and distributions from net realized gain of $.013 per share.
D Amount represents less than $.005 per share.
E Total returns for periods of less than one year are not annualized.
F Total returns would have been lower if certain expenses had not been reduced during the applicable periods shown.
G Total returns do not include the effect of the contingent deferred sales charge.
H Fees and expenses of any underlying Fidelity Central Funds are not included in the Fund's expense ratio. The Fund indirectly bears its proportionate share of the expenses of any underlying Fidelity Central Funds.
I Expense ratios reflect operating expenses of the class. Expenses before reductions do not reflect amounts reimbursed by the investment adviser or reductions from brokerage service arrangements or reductions from other expense offset arrangements and do not represent the amount paid by the class during periods when reimbursements or reductions occur. Expenses net of fee waivers reflect expenses after reimbursement by the investment adviser but prior to reductions from brokerage service arrangements or other expense offset arrangements. Expenses net of all reductions represent the net expenses paid by the class.
J Annualized
K Amount does not include the portfolio activity of any underlying Fidelity Central Funds.
See accompanying notes which are an integral part of the financial statements.
Fidelity Global Commodity Stock Fund
| Six months ended (Unaudited) April 30, | Years endedOctober 31, | |||||
| 2018 | 2017 | 2016 | 2015 | 2014 | 2013 | |
| Selected Per–Share Data | ||||||
| Net asset value, beginning of period | $12.59 | $10.77 | $10.09 | $13.31 | $14.24 | $14.66 |
| Income from Investment Operations | ||||||
| Net investment income (loss)A | .10 | .15 | .14 | .25 | .19 | .19 |
| Net realized and unrealized gain (loss) | .95 | 1.84 | .79 | (3.27) | (.92) | (.45) |
| Total from investment operations | 1.05 | 1.99 | .93 | (3.02) | (.73) | (.26) |
| Distributions from net investment income | (.13) | (.11) | (.24) | (.18) | (.19) | (.16) |
| Distributions from net realized gain | (.05) | (.07) | (.01) | (.03) | (.01) | – |
| Total distributions | (.18) | (.17)B | (.25) | (.20)C | (.20) | (.16) |
| Redemption fees added to paid in capitalA,D | – | – | – | – | – | – |
| Net asset value, end of period | $13.46 | $12.59 | $10.77 | $10.09 | $13.31 | $14.24 |
| Total ReturnE,F | 8.45% | 18.65% | 9.62% | (22.97)% | (5.16)% | (1.75)% |
| Ratios to Average Net AssetsG,H | ||||||
| Expenses before reductions | 1.09%I | 1.10% | 1.13% | 1.12% | 1.11% | 1.11% |
| Expenses net of fee waivers, if any | 1.09%I | 1.10% | 1.13% | 1.12% | 1.11% | 1.11% |
| Expenses net of all reductions | 1.08%I | 1.09% | 1.12% | 1.11% | 1.11% | 1.09% |
| Net investment income (loss) | 1.46%I | 1.30% | 1.43% | 2.08% | 1.29% | 1.37% |
| Supplemental Data | ||||||
| Net assets, end of period (000 omitted) | $422,154 | $264,557 | $228,982 | $156,320 | $223,084 | $273,476 |
| Portfolio turnover rateJ | 61%I | 81% | 85% | 77% | 75% | 65% |
A Calculated based on average shares outstanding during the period.
B Total distributions of $.17 per share is comprised of distributions from net investment income of $.105 and distributions from net realized gain of $.068 per share.
C Total distributions of $.20 per share is comprised of distributions from net investment income of $.178 and distributions from net realized gain of $.026 per share.
D Amount represents less than $.005 per share.
E Total returns for periods of less than one year are not annualized.
F Total returns would have been lower if certain expenses had not been reduced during the applicable periods shown.
G Fees and expenses of any underlying Fidelity Central Funds are not included in the Fund's expense ratio. The Fund indirectly bears its proportionate share of the expenses of any underlying Fidelity Central Funds.
H Expense ratios reflect operating expenses of the class. Expenses before reductions do not reflect amounts reimbursed by the investment adviser or reductions from brokerage service arrangements or reductions from other expense offset arrangements and do not represent the amount paid by the class during periods when reimbursements or reductions occur. Expenses net of fee waivers reflect expenses after reimbursement by the investment adviser but prior to reductions from brokerage service arrangements or other expense offset arrangements. Expenses net of all reductions represent the net expenses paid by the class.
I Annualized
J Amount does not include the portfolio activity of any underlying Fidelity Central Funds.
See accompanying notes which are an integral part of the financial statements.
Fidelity Global Commodity Stock Fund Class I
| Six months ended (Unaudited) April 30, | Years endedOctober 31, | |||||
| 2018 | 2017 | 2016 | 2015 | 2014 | 2013 | |
| Selected Per–Share Data | ||||||
| Net asset value, beginning of period | $12.60 | $10.76 | $10.09 | $13.31 | $14.24 | $14.67 |
| Income from Investment Operations | ||||||
| Net investment income (loss)A | .11 | .17 | .16 | .25 | .19 | .20 |
| Net realized and unrealized gain (loss) | .94 | 1.86 | .77 | (3.26) | (.92) | (.45) |
| Total from investment operations | 1.05 | 2.03 | .93 | (3.01) | (.73) | (.25) |
| Distributions from net investment income | (.14) | (.12) | (.25) | (.19) | (.19) | (.18) |
| Distributions from net realized gain | (.05) | (.07) | (.01) | (.03) | (.01) | – |
| Total distributions | (.19) | (.19) | (.26) | (.21)B | (.20) | (.18) |
| Redemption fees added to paid in capitalA,C | – | – | – | – | – | – |
| Net asset value, end of period | $13.46 | $12.60 | $10.76 | $10.09 | $13.31 | $14.24 |
| Total ReturnD,E | 8.43% | 18.99% | 9.63% | (22.93)% | (5.16)% | (1.71)% |
| Ratios to Average Net AssetsF,G | ||||||
| Expenses before reductions | .94%H | .96% | 1.01% | 1.09% | 1.06% | 1.04% |
| Expenses net of fee waivers, if any | .94%H | .95% | 1.01% | 1.08% | 1.06% | 1.04% |
| Expenses net of all reductions | .93%H | .94% | 1.00% | 1.08% | 1.06% | 1.03% |
| Net investment income (loss) | 1.61%H | 1.45% | 1.55% | 2.11% | 1.34% | 1.43% |
| Supplemental Data | ||||||
| Net assets, end of period (000 omitted) | $120,043 | $113,655 | $70,068 | $24,841 | $23,840 | $31,613 |
| Portfolio turnover rateI | 61%H | 81% | 85% | 77% | 75% | 65% |
A Calculated based on average shares outstanding during the period.
B Total distributions of $.21 per share is comprised of distributions from net investment income of $.186 and distributions from net realized gain of $.026 per share.
C Amount represents less than $.005 per share.
D Total returns for periods of less than one year are not annualized.
E Total returns would have been lower if certain expenses had not been reduced during the applicable periods shown.
F Fees and expenses of any underlying Fidelity Central Funds are not included in the Fund's expense ratio. The Fund indirectly bears its proportionate share of the expenses of any underlying Fidelity Central Funds.
G Expense ratios reflect operating expenses of the class. Expenses before reductions do not reflect amounts reimbursed by the investment adviser or reductions from brokerage service arrangements or reductions from other expense offset arrangements and do not represent the amount paid by the class during periods when reimbursements or reductions occur. Expenses net of fee waivers reflect expenses after reimbursement by the investment adviser but prior to reductions from brokerage service arrangements or other expense offset arrangements. Expenses net of all reductions represent the net expenses paid by the class.
H Annualized
I Amount does not include the portfolio activity of any underlying Fidelity Central Funds.
See accompanying notes which are an integral part of the financial statements.
Notes to Financial Statements (Unaudited)
For the period ended April 30, 2018
1. Organization.
Fidelity Global Commodity Stock Fund (the Fund) is a non-diversified fund of Fidelity Investment Trust (the Trust) and is authorized to issue an unlimited number of shares. The Trust is registered under the Investment Company Act of 1940, as amended (the 1940 Act), as an open-end management investment company organized as a Massachusetts business trust. The Fund offers Class A, Class M, Class C, Global Commodity Stock and Class I shares, each of which has equal rights as to assets and voting privileges. Each class has exclusive voting rights with respect to matters that affect that class. The Fund's investments in emerging markets can be subject to social, economic, regulatory, and political uncertainties and can be extremely volatile.
2. Investments in Fidelity Central Funds.
The Fund invests in Fidelity Central Funds, which are open-end investment companies generally available only to other investment companies and accounts managed by the investment adviser and its affiliates. The Fund's Schedule of Investments lists each of the Fidelity Central Funds held as of period end, if any, as an investment of the Fund, but does not include the underlying holdings of each Fidelity Central Fund. As an Investing Fund, the Fund indirectly bears its proportionate share of the expenses of the underlying Fidelity Central Funds.
The Money Market Central Funds seek preservation of capital and current income and are managed by Fidelity Investments Money Management, Inc. (FIMM), an affiliate of the investment adviser. Annualized expenses of the Money Market Central Funds as of their most recent shareholder report date are less than .005%.
A complete unaudited list of holdings for each Fidelity Central Fund is available upon request or at the Securities and Exchange Commission (the SEC) website at www.sec.gov. In addition, the financial statements of the Fidelity Central Funds are available on the SEC website or upon request.
3. Significant Accounting Policies.
The Fund is an investment company and applies the accounting and reporting guidance of the Financial Accounting Standards Board (FASB) Accounting Standards Codification Topic 946 Financial Services – Investments Companies. The financial statements have been prepared in conformity with accounting principles generally accepted in the United States of America (GAAP), which require management to make certain estimates and assumptions at the date of the financial statements. Actual results could differ from those estimates. Subsequent events, if any, through the date that the financial statements were issued have been evaluated in the preparation of the financial statements. The following summarizes the significant accounting policies of the Fund:
Investment Valuation. Investments are valued as of 4:00 p.m. Eastern time on the last calendar day of the period. The Board of Trustees (the Board) has delegated the day to day responsibility for the valuation of the Fund's investments to the Fair Value Committee (the Committee) established by the Fund's investment adviser. In accordance with valuation policies and procedures approved by the Board, the Fund attempts to obtain prices from one or more third party pricing vendors or brokers to value its investments. When current market prices, quotations or currency exchange rates are not readily available or reliable, investments will be fair valued in good faith by the Committee, in accordance with procedures adopted by the Board. Factors used in determining fair value vary by investment type and may include market or investment specific events. The frequency with which these procedures are used cannot be predicted and they may be utilized to a significant extent. The Committee oversees the Fund's valuation policies and procedures and reports to the Board on the Committee's activities and fair value determinations. The Board monitors the appropriateness of the procedures used in valuing the Fund's investments and ratifies the fair value determinations of the Committee.
The Fund categorizes the inputs to valuation techniques used to value its investments into a disclosure hierarchy consisting of three levels as shown below:
- Level 1 – quoted prices in active markets for identical investments
- Level 2 – other significant observable inputs (including quoted prices for similar investments, interest rates, prepayment speeds, etc.)
- Level 3 – unobservable inputs (including the Fund's own assumptions based on the best information available)
Valuation techniques used to value the Fund's investments by major category are as follows:
Equity securities, including restricted securities, for which market quotations are readily available, are valued at the last reported sale price or official closing price as reported by a third party pricing vendor on the primary market or exchange on which they are traded and are categorized as Level 1 in the hierarchy. In the event there were no sales during the day or closing prices are not available, securities are valued at the last quoted bid price or may be valued using the last available price and are generally categorized as Level 2 in the hierarchy. For foreign equity securities, when market or security specific events arise, comparisons to the valuation of American Depositary Receipts (ADRs), futures contracts, Exchange-Traded Funds (ETFs) and certain indexes as well as quoted prices for similar securities may be used and would be categorized as Level 2 in the hierarchy. Utilizing these techniques may result in transfers between Level 1 and Level 2. For equity securities, including restricted securities, where observable inputs are limited, assumptions about market activity and risk are used and these securities may be categorized as Level 3 in the hierarchy.
Investments in open-end mutual funds, including the Fidelity Central Funds, are valued at their closing net asset value (NAV) each business day and are categorized as Level 1 in the hierarchy.
Changes in valuation techniques may result in transfers in or out of an assigned level within the disclosure hierarchy. The aggregate value of investments by input level as of April 30, 2018, including information on transfers between Levels 1 and 2, is included at the end of the Fund's Schedule of Investments.
Foreign Currency. The Fund may use foreign currency contracts to facilitate transactions in foreign-denominated securities. Gains and losses from these transactions may arise from changes in the value of the foreign currency or if the counterparties do not perform under the contracts' terms.
Foreign-denominated assets, including investment securities, and liabilities are translated into U.S. dollars at the exchange rates at period end. Purchases and sales of investment securities, income and dividends received and expenses denominated in foreign currencies are translated into U.S. dollars at the exchange rate in effect on the transaction date.
The effects of exchange rate fluctuations on investments are included with the net realized and unrealized gain (loss) on investment securities. Other foreign currency transactions resulting in realized and unrealized gain (loss) are disclosed separately.
Investment Transactions and Income. For financial reporting purposes, the Fund's investment holdings and NAV include trades executed through the end of the last business day of the period. The NAV per share for processing shareholder transactions is calculated as of the close of business of the New York Stock Exchange (NYSE), normally 4:00 p.m. Eastern time and includes trades executed through the end of the prior business day. Gains and losses on securities sold are determined on the basis of identified cost and include proceeds received from litigation. Dividend income is recorded on the ex-dividend date, except for certain dividends from foreign securities where the ex-dividend date may have passed, which are recorded as soon as the Fund is informed of the ex-dividend date. Non-cash dividends included in dividend income, if any, are recorded at the fair market value of the securities received. Income and capital gain distributions from Fidelity Central Funds, if any, are recorded on the ex-dividend date. Certain distributions received by the Fund represent a return of capital or capital gain. The Fund determines the components of these distributions subsequent to the ex-dividend date, based upon receipt of tax filings or other correspondence relating to the underlying investment. These distributions are recorded as a reduction of cost of investments and/or as a realized gain. Investment income is recorded net of foreign taxes withheld where recovery of such taxes is uncertain.
Class Allocations and Expenses. Investment income, realized and unrealized capital gains and losses, common expenses of the Fund, and certain fund-level expense reductions, if any, are allocated daily on a pro-rata basis to each class based on the relative net assets of each class to the total net assets of the Fund. Each class differs with respect to transfer agent and distribution and service plan fees incurred. Certain expense reductions may also differ by class. For the reporting period, the allocated portion of income and expenses to each class as a percent of its average net assets may vary due to the timing of recording these transactions in relation to fluctuating net assets of the classes. Expenses directly attributable to a fund are charged to that fund. Expenses attributable to more than one fund are allocated among the respective funds on the basis of relative net assets or other appropriate methods. Expense estimates are accrued in the period to which they relate and adjustments are made when actual amounts are known.
Income Tax Information and Distributions to Shareholders. Each year, the Fund intends to qualify as a regulated investment company under Subchapter M of the Internal Revenue Code, including distributing substantially all of its taxable income and realized gains. As a result, no provision for U.S. Federal income taxes is required. The Fund files a U.S. federal tax return, in addition to state and local tax returns as required. The Fund's federal income tax returns are subject to examination by the Internal Revenue Service (IRS) for a period of three fiscal years after they are filed. State and local tax returns may be subject to examination for an additional fiscal year depending on the jurisdiction. Foreign taxes are provided for based on the Fund's understanding of the tax rules and rates that exist in the foreign markets in which it invests.
Distributions are declared and recorded on the ex-dividend date. Income and capital gain distributions are declared separately for each class. Income and capital gain distributions are determined in accordance with income tax regulations, which may differ from GAAP.
Capital accounts within the financial statements are adjusted for permanent book-tax differences. These adjustments have no impact on net assets or the results of operations. Capital accounts are not adjusted for temporary book-tax differences which will reverse in a subsequent period.
Book-tax differences are primarily due to foreign currency transactions, passive foreign investment companies (PFIC), partnerships, capital loss carryforwards and losses deferred due to wash sales.
As of period end, the cost and unrealized appreciation (depreciation) in securities, and derivatives if applicable, for federal income tax purposes were as follows:
| Gross unrealized appreciation | $46,327,115 |
| Gross unrealized depreciation | (74,679,689) |
| Net unrealized appreciation (depreciation) | $(28,352,574) |
| Tax cost | $642,945,673 |
Capital loss carryforwards are only available to offset future capital gains of the Fund to the extent provided by regulations and may be limited. Under the Regulated Investment Company Modernization Act of 2010 (the Act), the Fund is permitted to carry forward capital losses incurred in taxable years beginning after December 22, 2010 for an unlimited period and such capital losses are required to be used prior to any losses that expire. The capital loss carryforward information presented below, including any applicable limitation, is estimated as of prior fiscal period end and is subject to adjustment.
| Fiscal year of expiration | |
| 2019 | $(6,952,413) |
| No expiration | |
| Long-term | (51,094,968) |
| Total capital loss carryforward | $(58,047,381) |
Short-Term Trading (Redemption) Fees. During the period, shares held by investors in the Fund less than 30 days may have been subject to a redemption fee equal to 1.00% of the NAV of shares redeemed. All redemption fees, which reduce the proceeds of the shareholder redemption, are retained by the Fund and accounted for as an addition to paid in capital. In November 2017, the Board of Trustees approved the elimination of these redemption fees effective December 18, 2017.
Restricted Securities. The Fund may invest in securities that are subject to legal or contractual restrictions on resale. These securities generally may be resold in transactions exempt from registration or to the public if the securities are registered. Disposal of these securities may involve time-consuming negotiations and expense, and prompt sale at an acceptable price may be difficult. Information regarding restricted securities is included at the end of the Fund's Schedule of Investments.
4. Purchases and Sales of Investments.
Purchases and sales of securities, other than short-term securities, aggregated $310,879,576 and $171,088,831, respectively.
5. Fees and Other Transactions with Affiliates.
Management Fee. Fidelity Management & Research Company (the investment adviser) and its affiliates provide the Fund with investment management related services for which the Fund pays a monthly management fee. The management fee is the sum of an individual fund fee rate that is based on an annual rate of .45% of the Fund's average net assets and an annualized group fee rate that averaged .24% during the period. The group fee rate is based upon the average net assets of all the mutual funds advised by the investment adviser, including any mutual funds previously advised by the investment adviser that are currently advised by Fidelity SelectCo, LLC, an affiliate of the investment adviser. The group fee rate decreases as assets under management increase and increases as assets under management decrease. For the reporting period, the total annualized management fee rate was .69% of the Fund's average net assets.
Distribution and Service Plan Fees. In accordance with Rule 12b-1 of the 1940 Act, the Fund has adopted separate Distribution and Service Plans for each class of shares. Certain classes pay Fidelity Distributors Corporation (FDC), an affiliate of the investment adviser, separate Distribution and Service Fees, each of which is based on an annual percentage of each class' average net assets. In addition, FDC may pay financial intermediaries for selling shares of the Fund and providing shareholder support services. For the period, the Distribution and Service Fee rates, total fees and amounts retained by FDC were as follows:
| Distribution Fee | Service Fee | Total Fees | Retained by FDC | |
| Class A | -% | .25% | $39,158 | $1,147 |
| Class M | .25% | .25% | 18,456 | 156 |
| Class C | .75% | .25% | 98,445 | 12,671 |
| $156,059 | $13,974 |
Sales Load. FDC may receive a front-end sales charge of up to 5.75% for selling Class A shares and 3.50% for selling Class M shares, some of which is paid to financial intermediaries for selling shares of the Fund. Depending on the holding period, FDC may receive contingent deferred sales charges levied on Class A, Class M and Class C redemptions. The deferred sales charges are 1.00% for Class C shares, 1.00% for certain purchases of Class A shares and .25% for certain purchases of Class M shares.
For the period, sales charge amounts retained by FDC were as follows:
| Retained by FDC | |
| Class A | $10,335 |
| Class M | 935 |
| Class C(a) | 1,012 |
| $12,282 |
(a) When Class C shares are initially sold, FDC pays commissions from its own resources to financial intermediaries through which the sales are made.
Transfer Agent Fees. Fidelity Investments Institutional Operations Company, Inc., (FIIOC), an affiliate of the investment adviser, is the transfer, dividend disbursing and shareholder servicing agent for each class of the Fund. FIIOC receives account fees and asset-based fees that vary according to the account size and type of account of the shareholders of the respective classes of the Fund. FIIOC pays for typesetting, printing and mailing of shareholder reports, except proxy statements.
For the period, transfer agent fees for each class were as follows:
| Amount | % of Class-Level Average Net Assets(a) | |
| Class A | $40,346 | .26 |
| Class M | 11,570 | .31 |
| Class C | 22,090 | .22 |
| Global Commodity Stock | 598,930 | .30 |
| Class I | 92,114 | .15 |
| $765,050 |
(a) Annualized
Accounting and Security Lending Fees. Fidelity Service Company, Inc. (FSC), an affiliate of the investment adviser, maintains the Fund's accounting records. The accounting fee is based on the level of average net assets for each month. Under a separate contract, FSC administers the security lending program. The security lending fee is based on the number and duration of lending transactions. For the period, the fees were equivalent to an annualized rate of .05%.
Brokerage Commissions. The Fund placed a portion of its portfolio transactions with brokerage firms which are affiliates of the investment adviser. Brokerage commissions are included in net realized gain (loss) and change in net unrealized appreciation (depreciation) in the Statement of Operations. The commissions paid to these affiliated firms were $2,620 for the period.
Interfund Lending Program. Pursuant to an Exemptive Order issued by the SEC, the Fund, along with other registered investment companies having management contracts with Fidelity Management & Research Company (FMR) or other affiliated entities of FMR, may participate in an interfund lending program. This program provides an alternative credit facility allowing the funds to borrow from, or lend money to, other participating affiliated funds. At period end, there were no interfund loans outstanding. The Fund's activity in this program during the period for which loans were outstanding was as follows:
| Borrower or Lender | Average Loan Balance | Weighted Average Interest Rate | Interest Expense |
| Borrower | $8,883,750 | 1.95% | $1,921 |
Interfund Trades. The Fund may purchase from or sell securities to other Fidelity Funds under procedures adopted by the Board. The procedures have been designed to ensure these interfund trades are executed in accordance with Rule 17a-7 of the 1940 Act. Interfund trades are included within the respective purchases and sales amounts shown in the Purchases and Sales of Investments note.
6. Committed Line of Credit.
The Fund participates with other funds managed by the investment adviser or an affiliate in a $4.25 billion credit facility (the "line of credit") to be utilized for temporary or emergency purposes to fund shareholder redemptions or for other short-term liquidity purposes. The Fund has agreed to pay commitment fees on its pro-rata portion of the line of credit, which amounted to $770 and is reflected in Miscellaneous expenses on the Statement of Operations. During the period, the Fund did not borrow on this line of credit.
7. Security Lending.
The Fund lends portfolio securities through a lending agent from time to time in order to earn additional income. For equity securities, a lending agent is used and may loan securities to certain qualified borrowers, including Fidelity Capital Markets (FCM), a broker-dealer affiliated with the Fund. On the settlement date of the loan, the Fund receives collateral (in the form of U.S. Treasury obligations, letters of credit and/or cash) against the loaned securities and maintains collateral in an amount not less than 100% of the market value of the loaned securities during the period of the loan. The market value of the loaned securities is determined at the close of business of the Fund and any additional required collateral is delivered to the Fund on the next business day. The Fund or borrower may terminate the loan at any time, and if the borrower defaults on its obligation to return the securities loaned because of insolvency or other reasons, the Fund may apply collateral received from the borrower against the obligation. The Fund may experience delays and costs in recovering the securities loaned. Any cash collateral received is invested in the Fidelity Securities Lending Cash Central Fund. The value of loaned securities and cash collateral at period end are disclosed on the Fund's Statement of Assets and Liabilities. At period end, there were no security loans outstanding with FCM. Security lending income represents the income earned on investing cash collateral, less rebates paid to borrowers and any lending agent fees associated with the loan, plus any premium payments received for lending certain types of securities. Security lending income is presented in the Statement of Operations as a component of income from Fidelity Central Funds. Total security lending income during the period amounted to $125,488, including $12 from securities loaned to FCM.
8. Expense Reductions.
Commissions paid to certain brokers with whom the investment adviser, or its affiliates, places trades on behalf of the Fund include an amount in addition to trade execution, which may be rebated back to the Fund to offset certain expenses. This amount totaled $31,352 for the period.
In addition, during the period the investment adviser reimbursed and/or waived a portion of fund-level operating expenses in the amount of $2,750.
9. Distributions to Shareholders.
Distributions to shareholders of each class were as follows:
| Six months ended April 30, 2018 | Year ended October 31, 2017 | |
| From net investment income | ||
| Class A | $200,164 | $252,767 |
| Class M | 29,988 | 29,683 |
| Class C | – | 14,849 |
| Global Commodity Stock | 3,910,788 | 2,329,358 |
| Class I | 1,247,754 | 884,379 |
| Total | $5,388,694 | $3,511,036 |
| From net realized gain | ||
| Class A | $109,392 | $220,361 |
| Class M | 25,627 | 39,578 |
| Class C | 53,428 | 84,142 |
| Global Commodity Stock | 1,403,107 | 1,508,537 |
| Class I | 421,903 | 509,642 |
| Total | $2,013,457 | $2,362,260 |
10. Share Transactions.
Share transactions for each class were as follows and may contain automatic conversions between classes or exchanges between affiliated funds:
| Shares | Shares | Dollars | Dollars | |
| Six months ended April 30, 2018 | Year ended October 31, 2017 | Six months ended April 30, 2018 | Year ended October 31, 2017 | |
| Class A | ||||
| Shares sold | 623,347 | 651,469 | $8,284,893 | $7,552,817 |
| Reinvestment of distributions | 24,771 | 39,394 | 306,172 | 455,002 |
| Shares redeemed | (373,735) | (1,549,520) | (4,907,588) | (18,059,878) |
| Net increase (decrease) | 274,383 | (858,657) | $3,683,477 | $(10,052,059) |
| Class M | ||||
| Shares sold | 120,719 | 139,490 | $1,588,532 | $1,612,955 |
| Reinvestment of distributions | 4,488 | 5,865 | 55,468 | 67,801 |
| Shares redeemed | (65,479) | (162,841) | (867,969) | (1,893,807) |
| Net increase (decrease) | 59,728 | (17,486) | $776,031 | $(213,051) |
| Class C | ||||
| Shares sold | 791,082 | 316,655 | $10,651,169 | $3,641,065 |
| Reinvestment of distributions | 4,237 | 8,150 | 52,034 | 93,566 |
| Shares redeemed | (147,326) | (361,056) | (1,924,632) | (4,124,666) |
| Net increase (decrease) | 647,993 | (36,251) | $8,778,571 | $(390,035) |
| Global Commodity Stock | ||||
| Shares sold | 13,872,352 | 7,707,102 | $180,441,775 | $89,805,053 |
| Reinvestment of distributions | 414,534 | 315,142 | 5,123,639 | 3,643,039 |
| Shares redeemed | (3,921,482) | (8,286,656) | (51,378,848) | (96,347,286) |
| Net increase (decrease) | 10,365,404 | (264,412) | $134,186,566 | $(2,899,194) |
| Class I | ||||
| Shares sold | 1,609,952 | 4,738,302 | $21,622,289 | $54,914,110 |
| Reinvestment of distributions | 65,617 | 58,242 | 810,368 | 672,698 |
| Shares redeemed | (1,779,948) | (2,283,691) | (23,059,979) | (26,192,412) |
| Net increase (decrease) | (104,379) | 2,512,853 | $(627,322) | $29,394,396 |
11. Other.
The Fund's organizational documents provide former and current trustees and officers with a limited indemnification against liabilities arising in connection with the performance of their duties to the Fund. In the normal course of business, the Fund may also enter into contracts that provide general indemnifications. The Fund's maximum exposure under these arrangements is unknown as this would be dependent on future claims that may be made against the Fund. The risk of material loss from such claims is considered remote.
At the end of the period, VIP FundsManager 50% Portfolio and VIP FundsManager 60% Portfolio were the owners of record of approximately 12% and 11%, respectively, of the total outstanding shares of the Fund. Mutual funds managed by the investment adviser or its affiliates were the owners of record, in the aggregate, of approximately 28% of the total outstanding shares of the Fund.
Shareholder Expense Example
As a shareholder of the Fund, you incur two types of costs: (1) transaction costs, including sales charges (loads) on purchase payments or redemption proceeds, redemption fees and (2) ongoing costs, including management fees, distribution and/or service (12b-1) fees and other Fund expenses. This Example is intended to help you understand your ongoing costs (in dollars) of investing in the Fund and to compare these costs with the ongoing costs of investing in other mutual funds.
The Example is based on an investment of $1,000 invested at the beginning of the period and held for the entire period (November 1, 2017 to April 30, 2018).
Actual Expenses
The first line of the accompanying table for each class of the Fund provides information about actual account values and actual expenses. You may use the information in this line, together with the amount you invested, to estimate the expenses that you paid over the period. Simply divide your account value by $1,000.00 (for example, an $8,600 account value divided by $1,000.00 = 8.6), then multiply the result by the number in the first line for a class of the Fund under the heading entitled "Expenses Paid During Period" to estimate the expenses you paid on your account during this period. A small balance maintenance fee of $12.00 that is charged once a year may apply for certain accounts with a value of less than $2,000. This fee is not included in the table below. If it was, the estimate of expenses you paid during the period would be higher, and your ending account value lower, by this amount. In addition, the Fund, as a shareholder in the underlying Fidelity Central Funds, will indirectly bear its pro-rata share of the fees and expenses incurred by the underlying Fidelity Central Funds. These fees and expenses are not included in the Fund's annualized expense ratio used to calculate the expense estimate in the table below.
Hypothetical Example for Comparison Purposes
The second line of the accompanying table for each class of the Fund provides information about hypothetical account values and hypothetical expenses based on a Class' actual expense ratio and an assumed rate of return of 5% per year before expenses, which is not the Class' actual return. The hypothetical account values and expenses may not be used to estimate the actual ending account balance or expenses you paid for the period. You may use this information to compare the ongoing costs of investing in the Fund and other funds. To do so, compare this 5% hypothetical example with the 5% hypothetical examples that appear in the shareholder reports of the other funds. A small balance maintenance fee of $12.00 that is charged once a year may apply for certain accounts with a value of less than $2,000. This fee is not included in the table below. If it was, the estimate of expenses you paid during the period would be higher, and your ending account value lower, by this amount. In addition, the Fund, as a shareholder in the underlying Fidelity Central Funds, will indirectly bear its pro-rata share of the fees and expenses incurred by the underlying Fidelity Central Funds. These fees and expenses are not included in the Fund's annualized expense ratio used to calculate the expense estimate in the table below.
Please note that the expenses shown in the table are meant to highlight your ongoing costs only and do not reflect any transaction costs. Therefore, the second line of the table is useful in comparing ongoing costs only, and will not help you determine the relative total costs of owning different funds. In addition, if these transactional costs were included, your costs would have been higher.
| Annualized Expense Ratio-A | Beginning Account Value November 1, 2017 | Ending Account Value April 30, 2018 | Expenses Paid During Period-B November 1, 2017 to April 30, 2018 | |
| Class A | 1.30% | |||
| Actual | $1,000.00 | $1,082.40 | $6.71 | |
| Hypothetical-C | $1,000.00 | $1,018.35 | $6.51 | |
| Class M | 1.60% | |||
| Actual | $1,000.00 | $1,081.50 | $8.26 | |
| Hypothetical-C | $1,000.00 | $1,016.86 | $8.00 | |
| Class C | 2.01% | |||
| Actual | $1,000.00 | $1,079.20 | $10.36 | |
| Hypothetical-C | $1,000.00 | $1,014.83 | $10.04 | |
| Global Commodity Stock | 1.09% | |||
| Actual | $1,000.00 | $1,084.50 | $5.63 | |
| Hypothetical-C | $1,000.00 | $1,019.39 | $5.46 | |
| Class I | .94% | |||
| Actual | $1,000.00 | $1,084.30 | $4.86 | |
| Hypothetical-C | $1,000.00 | $1,020.13 | $4.71 |
A Annualized expense ratio reflects expenses net of applicable fee waivers.
B Expenses are equal to each Class' annualized expense ratio, multiplied by the average account value over the period, multiplied by 181/365 (to reflect the one-half year period).
C 5% return per year before expenses
![]()
Corporate Headquarters
245 Summer St.
Boston, MA 02210
www.fidelity.com
GCS-SANN-0618
1.879383.109
Fidelity Advisor® Total Emerging Markets Fund - Semi-Annual Report April 30, 2018 Class A, Class M, Class C and Class I are classes of Fidelity® Total Emerging Markets Fund |
|
Contents
To view a fund's proxy voting guidelines and proxy voting record for the 12-month period ended June 30, visit http://www.fidelity.com/proxyvotingresults or visit the Securities and Exchange Commission's (SEC) web site at http://www.sec.gov.
You may also call 1-877-208-0098 to request a free copy of the proxy voting guidelines.
Standard & Poor's, S&P and S&P 500 are registered service marks of The McGraw-Hill Companies, Inc. and have been licensed for use by Fidelity Distributors Corporation.
Other third-party marks appearing herein are the property of their respective owners.
All other marks appearing herein are registered or unregistered trademarks or service marks of FMR LLC or an affiliated company. © 2018 FMR LLC. All rights reserved.
This report and the financial statements contained herein are submitted for the general information of the shareholders of the Fund. This report is not authorized for distribution to prospective investors in the Fund unless preceded or accompanied by an effective prospectus.
A fund files its complete schedule of portfolio holdings with the SEC for the first and third quarters of each fiscal year on Form N-Q. Forms N-Q are available on the SEC’s web site at http://www.sec.gov. A fund's Forms N-Q may be reviewed and copied at the SEC’s Public Reference Room in Washington, DC. Information regarding the operation of the SEC's Public Reference Room may be obtained by calling 1-800-SEC-0330.
For a complete list of a fund's portfolio holdings, view the most recent holdings listing, semiannual report, or annual report on Fidelity's web site at http://www.fidelity.com, http://www.institutional.fidelity.com, or http://www.401k.com, as applicable.
NOT FDIC INSURED •MAY LOSE VALUE •NO BANK GUARANTEE
Neither the Fund nor Fidelity Distributors Corporation is a bank.
Investment Summary (Unaudited)
Top Five Stocks as of April 30, 2018
| % of fund's net assets | |
| Tencent Holdings Ltd. (Cayman Islands, Internet Software & Services) | 4.7 |
| Alibaba Group Holding Ltd. sponsored ADR (Cayman Islands, Internet Software & Services) | 3.0 |
| Taiwan Semiconductor Manufacturing Co. Ltd. (Taiwan, Semiconductors & Semiconductor Equipment) | 2.2 |
| Naspers Ltd. Class N (South Africa, Media) | 2.2 |
| Industrial & Commercial Bank of China Ltd. (H Shares) (China, Banks) | 2.0 |
| 14.1 |
Top Five Market Sectors as of April 30, 2018
| % of fund's net assets | |
| Financials | 18.5 |
| Information Technology | 16.7 |
| Consumer Discretionary | 11.2 |
| Energy | 8.3 |
| Materials | 6.3 |
Top Five Countries as of April 30, 2018
| (excluding cash equivalents) | % of fund's net assets |
| Cayman Islands | 13.9 |
| Korea (South) | 8.5 |
| Brazil | 6.9 |
| South Africa | 6.7 |
| India | 6.5 |
Percentages are adjusted for the effect of futures contracts, if applicable.
Asset Allocation (% of fund's net assets)
| As of April 30, 2018 | ||
| Stocks and Equity Futures | 74.7% | |
| Bonds | 22.2% | |
| Short-Term Investments and Net Other Assets (Liabilities) | 3.1% | |

Schedule of Investments April 30, 2018 (Unaudited)
Showing Percentage of Net Assets
| Common Stocks - 68.1% | |||
| Shares | Value | ||
| Argentina - 0.6% | |||
| Central Puerto SA sponsored ADR (a) | 56,760 | $878,077 | |
| Grupo Superveille SA sponsored ADR | 57,900 | 1,617,726 | |
| Telecom Argentina SA Class B sponsored ADR | 31,734 | 953,289 | |
| YPF SA Class D sponsored ADR | 80,740 | 1,767,399 | |
| TOTAL ARGENTINA | 5,216,491 | ||
| Australia - 0.0% | |||
| Frontier Digital Ventures Ltd. (a) | 659,236 | 321,951 | |
| Bermuda - 0.8% | |||
| AGTech Holdings Ltd. (a) | 2,284,000 | 248,833 | |
| China Resource Gas Group Ltd. | 432,000 | 1,588,726 | |
| Credicorp Ltd. (United States) | 11,900 | 2,766,631 | |
| GP Investments Ltd. Class A (depositary receipt) (a) | 22,922 | 32,781 | |
| Shangri-La Asia Ltd. | 1,142,000 | 2,222,464 | |
| TOTAL BERMUDA | 6,859,435 | ||
| Brazil - 3.0% | |||
| Azul SA sponsored ADR | 57,700 | 1,788,700 | |
| B2W Companhia Global do Varejo (a) | 614,117 | 5,066,220 | |
| Banco do Brasil SA | 327,700 | 3,433,030 | |
| BTG Pactual Participations Ltd. unit | 231,100 | 1,476,370 | |
| Companhia de Saneamento de Minas Gerais | 126,636 | 1,821,893 | |
| Cosan SA Industria e Comercio | 32,455 | 368,537 | |
| Direcional Engenharia SA (a) | 556,800 | 967,947 | |
| Localiza Rent A Car SA | 208,085 | 1,656,626 | |
| Petrobras Distribuidora SA | 218,300 | 1,430,740 | |
| Vale SA sponsored ADR | 622,768 | 8,619,109 | |
| TOTAL BRAZIL | 26,629,172 | ||
| British Virgin Islands - 0.6% | |||
| Despegar.com Corp. | 30,400 | 892,544 | |
| Mail.Ru Group Ltd. GDR (Reg. S) (a) | 126,700 | 4,003,720 | |
| TOTAL BRITISH VIRGIN ISLANDS | 4,896,264 | ||
| Canada - 0.2% | |||
| Pan American Silver Corp. | 120,300 | 1,939,236 | |
| Cayman Islands - 13.9% | |||
| 58.com, Inc. ADR (a) | 60,950 | 5,326,421 | |
| Alibaba Group Holding Ltd. sponsored ADR (a) | 151,300 | 27,013,102 | |
| Bilibili, Inc. ADR (a) | 21,479 | 234,551 | |
| BizLink Holding, Inc. | 56,587 | 417,121 | |
| China Biologic Products Holdings, Inc. | 11,300 | 981,631 | |
| China Literature Ltd. (a)(b) | 1,326,639 | 10,686,216 | |
| China Resources Land Ltd. | 684,800 | 2,571,923 | |
| ENN Energy Holdings Ltd. | 114,500 | 1,070,750 | |
| Haitian International Holdings Ltd. | 547,000 | 1,455,732 | |
| JD.com, Inc. sponsored ADR (a) | 435,100 | 15,885,501 | |
| Kingsoft Corp. Ltd. | 834,000 | 2,476,459 | |
| Momo, Inc. ADR (a) | 65,100 | 2,271,990 | |
| NetEase, Inc. ADR | 18,800 | 4,832,916 | |
| Ping An Healthcare and Technology Co. Ltd. (a) | 27,500 | 192,008 | |
| Secoo Holding Ltd. ADR | 16,200 | 168,156 | |
| Shimao Property Holdings Ltd. | 732,700 | 1,938,040 | |
| Tencent Holdings Ltd. | 845,550 | 41,569,700 | |
| Uni-President China Holdings Ltd. | 3,608,600 | 3,411,327 | |
| Vipshop Holdings Ltd. ADR (a) | 23,600 | 365,328 | |
| Yirendai Ltd. sponsored ADR (c) | 28,200 | 994,614 | |
| TOTAL CAYMAN ISLANDS | 123,863,486 | ||
| Chile - 0.7% | |||
| Compania Cervecerias Unidas SA sponsored ADR | 96,800 | 2,673,616 | |
| Enersis SA | 4,110,392 | 938,201 | |
| Inversiones La Construccion SA | 50,571 | 1,001,757 | |
| Sociedad Quimica y Minera de Chile SA (PN-B) sponsored ADR | 12,900 | 708,081 | |
| Vina Concha y Toro SA | 567,835 | 1,296,089 | |
| TOTAL CHILE | 6,617,744 | ||
| China - 6.5% | |||
| Anhui Conch Cement Co. Ltd. (H Shares) | 187,000 | 1,167,157 | |
| BBMG Corp. (H Shares) | 3,136,000 | 1,430,356 | |
| China International Travel Service Corp. Ltd. (A Shares) | 241,700 | 1,975,951 | |
| China Life Insurance Co. Ltd. (H Shares) | 2,278,834 | 6,462,682 | |
| China Longyuan Power Grid Corp. Ltd. (H Shares) | 3,768,960 | 3,701,949 | |
| China Oilfield Services Ltd. (H Shares) | 1,676,000 | 1,672,138 | |
| China Pacific Insurance (Group) Co. Ltd. (H Shares) | 933,706 | 4,120,144 | |
| China Petroleum & Chemical Corp. (H Shares) | 4,714,000 | 4,590,773 | |
| China Telecom Corp. Ltd. (H Shares) | 6,741,949 | 3,268,038 | |
| Hangzhou Hikvision Digital Technology Co. Ltd. Class A | 146,500 | 887,333 | |
| Industrial & Commercial Bank of China Ltd. (H Shares) | 20,317,160 | 17,836,061 | |
| PICC Property & Casualty Co. Ltd. (H Shares) | 898,580 | 1,608,610 | |
| Qingdao Haier Co. Ltd. | 652,151 | 1,761,640 | |
| Shanghai International Airport Co. Ltd. (A Shares) | 282,082 | 2,215,513 | |
| Shenzhen Inovance Technology Co. Ltd. Class A | 149,700 | 774,673 | |
| Tsingtao Brewery Co. Ltd. (H Shares) | 516,000 | 2,671,536 | |
| Zhengzhou Yutong Bus Co. Ltd. | 398,890 | 1,288,674 | |
| TOTAL CHINA | 57,433,228 | ||
| Cyprus - 0.0% | |||
| Etalon Group PLC GDR (Reg. S) | 44,588 | 127,076 | |
| Egypt - 0.0% | |||
| Six of October Development & Investment Co. (a) | 149,100 | 225,571 | |
| Greece - 0.4% | |||
| Titan Cement Co. SA (Reg.) | 132,700 | 3,501,430 | |
| Hong Kong - 3.7% | |||
| China Overseas Land and Investment Ltd. | 1,263,800 | 4,234,528 | |
| China Resources Beer Holdings Co. Ltd. | 1,302,666 | 5,610,489 | |
| China Resources Power Holdings Co. Ltd. | 651,709 | 1,250,052 | |
| China Unicom Ltd. | 1,212,900 | 1,715,100 | |
| China Unicom Ltd. sponsored ADR (a) | 217,620 | 3,053,209 | |
| CNOOC Ltd. | 3,141,000 | 5,313,673 | |
| CSPC Pharmaceutical Group Ltd. | 1,736,000 | 4,421,694 | |
| Far East Horizon Ltd. | 4,862,980 | 4,825,475 | |
| Techtronic Industries Co. Ltd. | 265,000 | 1,552,421 | |
| Yuexiu Property Co. Ltd. | 3,396,000 | 764,039 | |
| TOTAL HONG KONG | 32,740,680 | ||
| India - 6.5% | |||
| Adani Ports & Special Economic Zone Ltd. | 364,712 | 2,230,975 | |
| Axis Bank Ltd. | 386,394 | 2,995,503 | |
| Bharat Petroleum Corp. Ltd. | 380,260 | 2,209,472 | |
| Bharti Airtel Ltd. | 287,390 | 1,764,832 | |
| Bharti Infratel Ltd. | 256,699 | 1,208,130 | |
| Federal Bank Ltd. | 1,703,445 | 2,508,706 | |
| Future Retail Ltd. | 82,201 | 742,736 | |
| ICICI Bank Ltd. | 378,092 | 1,615,849 | |
| ICICI Bank Ltd. sponsored ADR | 405,540 | 3,451,145 | |
| Indraprastha Gas Ltd. | 321,583 | 1,386,948 | |
| InterGlobe Aviation Ltd. (b) | 60,919 | 1,282,642 | |
| ITC Ltd. | 637,313 | 2,693,288 | |
| JK Cement Ltd. | 105,665 | 1,587,270 | |
| Larsen & Toubro Ltd. | 133,138 | 2,798,784 | |
| LIC Housing Finance Ltd. | 631,590 | 5,170,992 | |
| Lupin Ltd. (a) | 243,314 | 2,963,566 | |
| Manappuram General Finance & Leasing Ltd. | 867,769 | 1,587,795 | |
| Petronet LNG Ltd. | 374,159 | 1,273,898 | |
| Phoenix Mills Ltd. (a) | 232,863 | 2,183,827 | |
| Power Grid Corp. of India Ltd. | 366,482 | 1,143,689 | |
| Reliance Industries Ltd. | 515,804 | 7,447,384 | |
| SREI Infrastructure Finance Ltd. | 116,223 | 148,878 | |
| State Bank of India | 798,416 | 2,950,056 | |
| Sun Pharmaceutical Industries Ltd. | 534,875 | 4,243,296 | |
| Tejas Networks Ltd. (b) | 43,354 | 217,505 | |
| TOTAL INDIA | 57,807,166 | ||
| Indonesia - 1.7% | |||
| PT Astra International Tbk | 4,917,300 | 2,516,807 | |
| PT Bank Mandiri (Persero) Tbk | 4,668,200 | 2,364,698 | |
| PT Bank Rakyat Indonesia Tbk | 16,273,000 | 3,752,041 | |
| PT Indocement Tunggal Prakarsa Tbk | 699,500 | 885,225 | |
| PT Kalbe Farma Tbk | 9,595,000 | 1,035,824 | |
| PT Link Net Tbk | 576,000 | 224,358 | |
| PT Media Nusantara Citra Tbk | 14,034,000 | 1,327,708 | |
| PT Perusahaan Gas Negara Tbk Series B | 1,564,500 | 221,461 | |
| PT Semen Gresik (Persero) Tbk | 2,533,900 | 1,750,127 | |
| PT Telekomunikasi Indonesia Tbk Series B | 5,150,500 | 1,405,441 | |
| TOTAL INDONESIA | 15,483,690 | ||
| Israel - 0.1% | |||
| Bezeq The Israel Telecommunication Corp. Ltd. | 924,855 | 1,167,199 | |
| Italy - 0.4% | |||
| Prada SpA | 729,700 | 3,702,429 | |
| Japan - 0.5% | |||
| GMO Internet, Inc. | 15,162 | 279,468 | |
| Panasonic Corp. | 87,700 | 1,298,587 | |
| Renesas Electronics Corp. (a) | 55,100 | 578,621 | |
| SoftBank Corp. | 14,230 | 1,087,296 | |
| Sumco Corp. | 46,100 | 1,139,427 | |
| TOTAL JAPAN | 4,383,399 | ||
| Korea (South) - 7.0% | |||
| AMOREPACIFIC Group, Inc. | 30,584 | 4,083,864 | |
| BS Financial Group, Inc. | 690,653 | 6,739,336 | |
| Coway Co. Ltd. | 18,389 | 1,502,475 | |
| Daou Technology, Inc. | 97,211 | 2,192,166 | |
| Hanon Systems | 122,443 | 1,246,239 | |
| Hyundai Fire & Marine Insurance Co. Ltd. | 58,730 | 2,097,647 | |
| Hyundai Mobis | 23,645 | 5,475,603 | |
| Iljin Materials Co. Ltd. | 24,542 | 766,562 | |
| InterPark INT Corp. | 29,545 | 243,329 | |
| KB Financial Group, Inc. | 121,485 | 6,883,650 | |
| KEPCO Plant Service & Engineering Co. Ltd. | 19,627 | 929,186 | |
| Korea Electric Power Corp. | 13,372 | 466,521 | |
| Korean Reinsurance Co. | 89,944 | 991,049 | |
| KT Corp. | 12,432 | 315,245 | |
| KT Corp. sponsored ADR | 14,390 | 193,258 | |
| LG Chemical Ltd. | 12,183 | 4,095,413 | |
| LG Corp. | 26,031 | 1,971,300 | |
| NAVER Corp. | 1,694 | 1,132,576 | |
| POSCO | 11,279 | 3,875,869 | |
| Samsung Electronics Co. Ltd. | 774 | 1,917,972 | |
| Samsung Life Insurance Co. Ltd. | 18,851 | 2,059,497 | |
| Samsung SDI Co. Ltd. | 24,651 | 4,223,880 | |
| Shinhan Financial Group Co. Ltd. | 137,063 | 6,086,575 | |
| SK Hynix, Inc. | 36,714 | 2,896,872 | |
| TOTAL KOREA (SOUTH) | 62,386,084 | ||
| Luxembourg - 0.4% | |||
| Samsonite International SA | 743,100 | 3,351,897 | |
| Mauritius - 0.1% | |||
| MakeMyTrip Ltd. (a) | 24,400 | 900,360 | |
| Mexico - 1.3% | |||
| America Movil S.A.B. de CV Series L sponsored ADR | 55,600 | 1,028,044 | |
| Grupo Aeroportuario del Pacifico S.A.B. de CV Series B | 134,200 | 1,395,958 | |
| Grupo Financiero Banorte S.A.B. de CV Series O | 446,629 | 2,794,588 | |
| Macquarie Mexican (REIT) (b) | 1,790,370 | 1,910,795 | |
| Promotora y Operadora de Infraestructura S.A.B. de CV | 110,395 | 1,131,218 | |
| Wal-Mart de Mexico SA de CV Series V | 1,297,400 | 3,605,267 | |
| TOTAL MEXICO | 11,865,870 | ||
| Netherlands - 0.8% | |||
| VEON Ltd. sponsored ADR | 506,060 | 1,391,665 | |
| Yandex NV Series A (a) | 183,287 | 6,114,454 | |
| TOTAL NETHERLANDS | 7,506,119 | ||
| Nigeria - 0.4% | |||
| Guaranty Trust Bank PLC | 3,465,183 | 433,148 | |
| Guaranty Trust Bank PLC GDR (Reg. S) | 124,480 | 778,000 | |
| Transnational Corp. of Nigeria PLC | 41,804,033 | 197,408 | |
| Zenith Bank PLC | 25,199,714 | 1,921,478 | |
| TOTAL NIGERIA | 3,330,034 | ||
| Pakistan - 0.2% | |||
| Habib Bank Ltd. | 1,221,800 | 2,058,358 | |
| Panama - 0.2% | |||
| Copa Holdings SA Class A | 14,649 | 1,716,423 | |
| Peru - 0.3% | |||
| Compania de Minas Buenaventura SA sponsored ADR | 168,500 | 2,687,575 | |
| Philippines - 0.7% | |||
| International Container Terminal Services, Inc. | 440,740 | 719,961 | |
| Metro Pacific Investments Corp. | 4,170,000 | 410,758 | |
| Metropolitan Bank & Trust Co. | 2,202,852 | 3,613,488 | |
| Robinsons Land Corp. | 3,586,960 | 1,238,952 | |
| TOTAL PHILIPPINES | 5,983,159 | ||
| Russia - 3.2% | |||
| Lukoil PJSC sponsored ADR | 83,200 | 5,557,760 | |
| MMC Norilsk Nickel PJSC sponsored ADR | 264,700 | 4,551,517 | |
| Mobile TeleSystems OJSC | 77,402 | 365,645 | |
| Mobile TeleSystems OJSC sponsored ADR | 17,700 | 185,850 | |
| NOVATEK OAO GDR (Reg. S) | 19,700 | 2,501,900 | |
| RusHydro PJSC | 40,112,900 | 474,558 | |
| Sberbank of Russia | 1,443,230 | 5,144,386 | |
| Sberbank of Russia sponsored ADR | 472,584 | 7,041,502 | |
| Tatneft PAO | 159,600 | 1,700,736 | |
| Unipro PJSC | 22,668,700 | 999,298 | |
| TOTAL RUSSIA | 28,523,152 | ||
| Singapore - 0.2% | |||
| First Resources Ltd. | 1,178,200 | 1,498,159 | |
| South Africa - 6.3% | |||
| Aspen Pharmacare Holdings Ltd. | 137,306 | 2,960,546 | |
| Barclays Africa Group Ltd. | 298,074 | 4,365,972 | |
| Bidvest Group Ltd. | 131,156 | 2,569,236 | |
| FirstRand Ltd. | 725,000 | 3,882,757 | |
| Imperial Holdings Ltd. | 303,164 | 5,831,692 | |
| Life Healthcare Group Holdings Ltd. | 924,000 | 2,178,130 | |
| Mr Price Group Ltd. | 108,300 | 2,376,520 | |
| MTN Group Ltd. | 253,820 | 2,547,516 | |
| Naspers Ltd. Class N | 78,445 | 19,110,737 | |
| Nedbank Group Ltd. | 92,080 | 2,195,925 | |
| Sasol Ltd. | 102,100 | 3,649,806 | |
| Tiger Brands Ltd. | 131,600 | 4,112,947 | |
| TOTAL SOUTH AFRICA | 55,781,784 | ||
| Taiwan - 4.2% | |||
| Advantech Co. Ltd. | 67,897 | 465,287 | |
| Chroma ATE, Inc. | 189,000 | 948,654 | |
| GlobalWafers Co. Ltd. | 188,300 | 3,032,377 | |
| King's Town Bank | 561,600 | 671,497 | |
| LandMark Optoelectronics Corp. | 119,000 | 1,107,923 | |
| Largan Precision Co. Ltd. | 29,403 | 3,413,754 | |
| MediaTek, Inc. | 47,000 | 533,613 | |
| Nanya Technology Corp. | 410,000 | 1,274,021 | |
| PChome Online, Inc. | 70,032 | 323,828 | |
| Taiwan Semiconductor Manufacturing Co. Ltd. | 2,088,000 | 15,876,838 | |
| Taiwan Semiconductor Manufacturing Co. Ltd. sponsored ADR | 97,142 | 3,735,110 | |
| Unified-President Enterprises Corp. | 1,642,000 | 3,944,745 | |
| United Microelectronics Corp. | 2,930,000 | 1,577,269 | |
| TOTAL TAIWAN | 36,904,916 | ||
| Thailand - 0.8% | |||
| PTT Global Chemical PCL (For. Reg.) | 1,370,300 | 4,233,719 | |
| Siam Cement PCL (For. Reg.) | 183,100 | 2,707,530 | |
| TOTAL THAILAND | 6,941,249 | ||
| Turkey - 1.0% | |||
| Bim Birlesik Magazalar A/S JSC | 126,000 | 2,138,721 | |
| Tupras Turkiye Petrol Rafinerileri A/S | 96,200 | 2,451,121 | |
| Turkcell Iletisim Hizmet A/S | 608,300 | 2,090,512 | |
| Turkcell Iletisim Hizmet A/S sponsored ADR | 22,300 | 192,895 | |
| Turkiye Garanti Bankasi A/S | 1,036,000 | 2,348,923 | |
| TOTAL TURKEY | 9,222,172 | ||
| United Arab Emirates - 0.9% | |||
| DP World Ltd. | 84,146 | 1,872,249 | |
| Emaar Properties PJSC | 2,053,422 | 3,236,817 | |
| National Bank of Abu Dhabi PJSC | 828,009 | 2,795,233 | |
| TOTAL UNITED ARAB EMIRATES | 7,904,299 | ||
| United Kingdom - 0.2% | |||
| Fresnillo PLC | 76,100 | 1,335,778 | |
| United States of America - 0.3% | |||
| MercadoLibre, Inc. | 8,301 | 2,819,103 | |
| TOTAL COMMON STOCKS | |||
| (Cost $539,412,497) | 605,632,138 | ||
| Nonconvertible Preferred Stocks - 5.2% | |||
| Brazil - 3.7% | |||
| Ambev SA sponsored ADR | 746,600 | 4,942,492 | |
| Banco do Estado Rio Grande do Sul SA | 278,720 | 1,598,391 | |
| Companhia Paranaense de Energia-Copel: | |||
| (PN-B) | 4,815 | 36,822 | |
| (PN-B) sponsored ADR | 266,052 | 2,040,619 | |
| Fibria Celulose SA sponsored ADR | 182,000 | 3,559,920 | |
| Itau Unibanco Holding SA sponsored ADR | 597,441 | 8,680,818 | |
| Metalurgica Gerdau SA (PN) | 1,103,070 | 2,462,322 | |
| Petroleo Brasileiro SA - Petrobras (PN) sponsored ADR (non-vtg.) (a) | 593,606 | 7,805,919 | |
| Telefonica Brasil SA | 159,843 | 2,242,146 | |
| TOTAL BRAZIL | 33,369,449 | ||
| Korea (South) - 1.5% | |||
| Hyundai Motor Co. Series 2 | 60,525 | 6,499,405 | |
| Samsung Electronics Co. Ltd. | 2,469 | 4,873,806 | |
| Samsung Fire & Marine Insurance Co. Ltd. | 10,998 | 1,884,477 | |
| TOTAL KOREA (SOUTH) | 13,257,688 | ||
| TOTAL NONCONVERTIBLE PREFERRED STOCKS | |||
| (Cost $37,036,050) | 46,627,137 | ||
| Principal Amount(d) | Value | ||
| Nonconvertible Bonds - 5.4% | |||
| Azerbaijan - 0.8% | |||
| Southern Gas Corridor CJSC 6.875% 3/24/26 (b) | 2,330,000 | 2,545,525 | |
| State Oil Co. of Azerbaijan Republic 6.95% 3/18/30 (Reg. S) | 3,975,000 | 4,270,661 | |
| TOTAL AZERBAIJAN | 6,816,186 | ||
| Bahrain - 0.1% | |||
| The Oil and Gas Holding Co. 7.5% 10/25/27 (b) | 655,000 | 635,940 | |
| Georgia - 0.6% | |||
| Georgian Oil & Gas Corp. 6.75% 4/26/21 (b) | 2,300,000 | 2,364,492 | |
| JSC BGEO Group 6% 7/26/23 (b) | 850,000 | 855,270 | |
| JSC Georgian Railway 7.75% 7/11/22 (b) | 2,000,000 | 2,144,936 | |
| TOTAL GEORGIA | 5,364,698 | ||
| Ireland - 0.4% | |||
| Vnesheconombank Via VEB Finance PLC: | |||
| 6.025% 7/5/22 (b) | 1,400,000 | 1,449,280 | |
| 6.8% 11/22/25 (b) | 2,025,000 | 2,188,215 | |
| TOTAL IRELAND | 3,637,495 | ||
| Israel - 0.0% | |||
| Israel Electric Corp. Ltd. 7.75% 12/15/27 (Reg. S) | 275,000 | 336,188 | |
| Mexico - 1.2% | |||
| Pemex Project Funding Master Trust: | |||
| 6.625% 6/15/35 | 3,875,000 | 3,849,813 | |
| 8.625% 2/1/22 | 300,000 | 338,010 | |
| Petroleos Mexicanos: | |||
| 6.5% 3/13/27 | 1,505,000 | 1,558,593 | |
| 6.5% 6/2/41 | 3,950,000 | 3,782,125 | |
| 6.875% 8/4/26 | 1,200,000 | 1,285,200 | |
| TOTAL MEXICO | 10,813,741 | ||
| Mongolia - 0.1% | |||
| Trade and Development Bank of Mongolia LLC 9.375% 5/19/20 (Reg. S) | 850,000 | 905,264 | |
| Netherlands - 0.0% | |||
| Metinvest BV: | |||
| 7.75% 4/23/23 (b) | 200,000 | 194,440 | |
| 8.5% 4/23/26 (b) | 265,000 | 254,983 | |
| TOTAL NETHERLANDS | 449,423 | ||
| Oman - 0.1% | |||
| Oman Sovereign Sukuk SAOC 4.397% 6/1/24 (b) | 1,000,000 | 934,436 | |
| South Africa - 0.4% | |||
| Eskom Holdings SOC Ltd.: | |||
| 5.75% 1/26/21 (Reg. S) | 500,000 | 498,570 | |
| 6.75% 8/6/23 (b) | 2,825,000 | 2,860,313 | |
| TOTAL SOUTH AFRICA | 3,358,883 | ||
| Trinidad & Tobago - 0.1% | |||
| Petroleum Co. of Trinidad & Tobago Ltd.: | |||
| 6% 5/8/22 (b) | 256,875 | 257,132 | |
| 9.75% 8/14/19 (b) | 750,000 | 789,375 | |
| TOTAL TRINIDAD & TOBAGO | 1,046,507 | ||
| Tunisia - 0.1% | |||
| Banque Centrale de Tunisie 5.75% 1/30/25 (b) | 525,000 | 486,152 | |
| Turkey - 0.1% | |||
| Export Credit Bank of Turkey 5% 9/23/21 (b) | 400,000 | 394,000 | |
| Turkiye Ihracat Kredi Bankasi A/S 6.125% 5/3/24 (b) | 305,000 | 304,085 | |
| TOTAL TURKEY | 698,085 | ||
| United Arab Emirates - 0.4% | |||
| Abu Dhabi Crude Oil Pipeline 4.6% 11/2/47 (b) | 2,170,000 | 2,042,673 | |
| Dolphin Energy Ltd. 5.5% 12/15/21 (b) | 340,000 | 359,652 | |
| DP World Ltd. 6.85% 7/2/37 (Reg. S) | 500,000 | 594,048 | |
| Oztel Holdings SPC Ltd.: | |||
| 5.625% 10/24/23 (b) | 120,000 | 117,750 | |
| 6.625% 4/24/28 (b) | 180,000 | 174,938 | |
| TOTAL UNITED ARAB EMIRATES | 3,289,061 | ||
| United Kingdom - 0.5% | |||
| Biz Finance PLC 9.625% 4/27/22 (b) | 3,950,000 | 4,088,250 | |
| Venezuela - 0.5% | |||
| Petroleos de Venezuela SA: | |||
| 5.375% 4/12/27 (e) | 1,750,000 | 457,625 | |
| 5.5% 4/12/37 (e) | 1,000,000 | 265,000 | |
| 6% 5/16/24 (b)(e) | 3,600,000 | 909,000 | |
| 6% 11/15/26 (Reg. S) (e) | 2,450,000 | 614,705 | |
| 8.5% 10/27/20 (Reg. S) (e) | 3,000,000 | 2,598,000 | |
| TOTAL VENEZUELA | 4,844,330 | ||
| TOTAL NONCONVERTIBLE BONDS | |||
| (Cost $49,745,118) | 47,704,639 | ||
| Government Obligations - 16.9% | |||
| Argentina - 2.1% | |||
| Argentine Republic: | |||
| 5.875% 1/11/28 | 1,730,000 | 1,584,680 | |
| 6.875% 1/26/27 | 1,800,000 | 1,792,818 | |
| 6.875% 1/11/48 | 2,615,000 | 2,323,428 | |
| 7.125% 7/6/36 | 3,200,000 | 3,043,200 | |
| 7.5% 4/22/26 | 7,385,000 | 7,739,480 | |
| 7.82% 12/31/33 | EUR | 1,685,727 | 2,241,789 |
| TOTAL ARGENTINA | 18,725,395 | ||
| Armenia - 0.2% | |||
| Republic of Armenia 7.15% 3/26/25 (b) | 1,820,000 | 1,953,315 | |
| Belarus - 0.1% | |||
| Belarus Republic 7.625% 6/29/27 (b) | 515,000 | 553,831 | |
| Brazil - 0.2% | �� | ||
| Brazilian Federative Republic: | |||
| 8.25% 1/20/34 | 1,350,000 | 1,672,664 | |
| 12.25% 3/6/30 | 100,000 | 160,250 | |
| TOTAL BRAZIL | 1,832,914 | ||
| Cameroon - 0.3% | |||
| Cameroon Republic 9.5% 11/19/25 (b) | 2,050,000 | 2,352,703 | |
| Dominican Republic - 0.1% | |||
| Dominican Republic 5.95% 1/25/27 (b) | 400,000 | 409,000 | |
| Ecuador - 0.5% | |||
| Ecuador Republic: | |||
| 7.95% 6/20/24 (b) | 520,000 | 488,800 | |
| 8.75% 6/2/23 (b) | 1,700,000 | 1,666,000 | |
| 8.875% 10/23/27 (b) | 710,000 | 669,175 | |
| 9.625% 6/2/27 (b) | 200,000 | 196,000 | |
| 9.65% 12/13/26 (b) | 850,000 | 837,250 | |
| 10.75% 3/28/22 (b) | 450,000 | 474,750 | |
| TOTAL ECUADOR | 4,331,975 | ||
| Egypt - 1.2% | |||
| Arab Republic of Egypt: | |||
| , yield at date of purchase 18.0995% 10/16/18 | EGP | 12,000,000 | 630,114 |
| 4.75% 4/16/26 (b) | EUR | 105,000 | 126,411 |
| 5.577% 2/21/23 (b) | 945,000 | 948,308 | |
| 5.625% 4/16/30 (b) | EUR | 105,000 | 125,276 |
| 6.125% 1/31/22 (b) | 1,200,000 | 1,231,440 | |
| 7.5% 1/31/27 (b) | 1,950,000 | 2,057,835 | |
| 7.903% 2/21/48 (b) | 2,025,000 | 2,052,301 | |
| 8.5% 1/31/47 (b) | 3,000,000 | 3,214,068 | |
| TOTAL EGYPT | 10,385,753 | ||
| El Salvador - 1.1% | |||
| El Salvador Republic: | |||
| 6.375% 1/18/27 (b) | 1,250,000 | 1,234,375 | |
| 7.375% 12/1/19 | 1,375,000 | 1,418,491 | |
| 7.625% 2/1/41 (b) | 2,050,000 | 2,132,390 | |
| 7.65% 6/15/35 (Reg. S) | 1,800,000 | 1,872,000 | |
| 8.625% 2/28/29 (b) | 2,960,000 | 3,381,800 | |
| TOTAL EL SALVADOR | 10,039,056 | ||
| Ethiopia - 0.2% | |||
| Federal Democratic Republic of Ethiopia 6.625% 12/11/24 (b) | 1,740,000 | 1,758,479 | |
| Gabon - 0.1% | |||
| Gabonese Republic: | |||
| 6.375% 12/12/24 (b) | 850,000 | 828,403 | |
| 6.95% 6/16/25 (b) | 300,000 | 298,985 | |
| TOTAL GABON | 1,127,388 | ||
| Ghana - 0.7% | |||
| Ghana Republic: | |||
| 7.875% 8/7/23 (Reg.S) | 2,350,000 | 2,549,045 | |
| 8.125% 1/18/26 (b) | 1,200,000 | 1,282,594 | |
| 9.25% 9/15/22 (b) | 1,350,000 | 1,535,625 | |
| 10.75% 10/14/30 (b) | 600,000 | 775,620 | |
| TOTAL GHANA | 6,142,884 | ||
| Honduras - 0.1% | |||
| Republic of Honduras 6.25% 1/19/27 | 750,000 | 773,430 | |
| Iraq - 0.3% | |||
| Republic of Iraq: | |||
| 5.8% 1/15/28 (Reg. S) | 2,600,000 | 2,452,372 | |
| 6.752% 3/9/23 (b) | 385,000 | 384,718 | |
| TOTAL IRAQ | 2,837,090 | ||
| Ivory Coast - 0.3% | |||
| Ivory Coast 5.75% 12/31/32 | 2,504,250 | 2,395,566 | |
| Jordan - 0.7% | |||
| Jordanian Kingdom: | |||
| 5.75% 1/31/27 (b) | 1,050,000 | 997,059 | |
| 6.125% 1/29/26 (b) | 2,650,000 | 2,594,191 | |
| 7.375% 10/10/47 (b) | 2,710,000 | 2,639,052 | |
| TOTAL JORDAN | 6,230,302 | ||
| Kuwait - 0.4% | |||
| State of Kuwait 3.5% 3/20/27 (b) | 4,090,000 | 3,934,408 | |
| Lebanon - 2.0% | |||
| Lebanese Republic: | |||
| 5.15% 11/12/18 | 1,000,000 | 996,600 | |
| 5.45% 11/28/19 | 4,000,000 | 3,938,504 | |
| 6% 5/20/19 | 4,075,000 | 4,073,778 | |
| 6.1% 10/4/22 | 3,135,000 | 2,982,545 | |
| 6.375% 3/9/20 | 5,525,000 | 5,505,143 | |
| TOTAL LEBANON | 17,496,570 | ||
| Mongolia - 0.1% | |||
| Mongolian People's Republic 8.75% 3/9/24 (b) | 850,000 | 941,368 | |
| Nigeria - 0.3% | |||
| Republic of Nigeria: | |||
| , yield at date of purchase 11.2564% to 15.189% 8/16/18 | NGN | 795,000,000 | 2,141,525 |
| 6.5% 11/28/27 (b) | 395,000 | 397,632 | |
| TOTAL NIGERIA | 2,539,157 | ||
| Oman - 0.3% | |||
| Sultanate of Oman: | |||
| 6.5% 3/8/47 (b) | 780,000 | 719,238 | |
| 6.75% 1/17/48 (b) | 2,000,000 | 1,882,796 | |
| TOTAL OMAN | 2,602,034 | ||
| Pakistan - 0.1% | |||
| Islamic Republic of Pakistan 6.875% 12/5/27 (b) | 750,000 | 701,472 | |
| Paraguay - 0.1% | |||
| Republic of Paraguay 4.7% 3/27/27 (b) | 535,000 | 532,325 | |
| Qatar - 0.9% | |||
| State of Qatar: | |||
| 2.375% 6/2/21 | 850,000 | 819,196 | |
| 3.25% 6/2/26 | 950,000 | 887,870 | |
| 3.875% 4/23/23 (b) | 335,000 | 333,610 | |
| 4.5% 4/23/28 (b) | 955,000 | 953,189 | |
| 5.103% 4/23/48 (b) | 2,075,000 | 2,056,636 | |
| 9.75% 6/15/30 (Reg. S) | 2,180,000 | 3,196,490 | |
| TOTAL QATAR | 8,246,991 | ||
| Russia - 0.6% | |||
| Ministry of Finance Russian Federation: | |||
| 4.75% 5/27/26 (b) | 600,000 | 609,486 | |
| 4.75% 5/27/26 | 400,000 | 406,324 | |
| Russian Federation: | |||
| 4.25% 6/23/27 (b) | 800,000 | 780,754 | |
| 5.25% 6/23/47 (b) | 3,200,000 | 3,100,557 | |
| 5.625% 4/4/42 (b) | 600,000 | 628,800 | |
| Russian Federation Ministry of Finance 4.375% 3/21/29 (b) | 200,000 | 193,703 | |
| TOTAL RUSSIA | 5,719,624 | ||
| Rwanda - 0.2% | |||
| Rwanda Republic 6.625% 5/2/23 (b) | 1,625,000 | 1,662,294 | |
| Saudi Arabia - 0.3% | |||
| Kingdom of Saudi Arabia: | |||
| 3.625% 3/4/28 (b) | 1,625,000 | 1,520,074 | |
| 4.5% 10/26/46 (b) | 1,410,000 | 1,274,124 | |
| TOTAL SAUDI ARABIA | 2,794,198 | ||
| Sri Lanka - 0.1% | |||
| Democratic Socialist Republic of Sri Lanka: | |||
| 6.2% 5/11/27 (b) | 750,000 | 723,617 | |
| 6.85% 11/3/25 (b) | 500,000 | 510,678 | |
| TOTAL SRI LANKA | 1,234,295 | ||
| Suriname - 0.4% | |||
| Republic of Suriname: | |||
| 9.25% 10/26/26 | 200,000 | 206,000 | |
| 9.25% 10/26/26 (b) | 3,550,000 | 3,656,500 | |
| TOTAL SURINAME | 3,862,500 | ||
| TAJIKISTAN - 0.1% | |||
| Tajikistan Republic 7.125% 9/14/27 (b) | 875,000 | 810,381 | |
| Turkey - 1.4% | |||
| Turkish Republic: | |||
| 4.875% 10/9/26 | 400,000 | 373,600 | |
| 5.125% 2/17/28 | 1,295,000 | 1,210,178 | |
| 5.75% 3/22/24 | 550,000 | 557,574 | |
| 5.75% 5/11/47 | 650,000 | 567,607 | |
| 6% 3/25/27 | 2,150,000 | 2,157,869 | |
| 6.25% 9/26/22 | 850,000 | 893,573 | |
| 6.875% 3/17/36 | 1,975,000 | 2,028,349 | |
| 7.25% 3/5/38 | 1,300,000 | 1,387,859 | |
| 7.375% 2/5/25 | 350,000 | 383,576 | |
| 8% 2/14/34 | 1,205,000 | 1,383,950 | |
| 11.875% 1/15/30 | 165,000 | 242,138 | |
| Turkiye Ihracat Kredi Bankasi A/S 5.375% 2/8/21 (b) | 1,500,000 | 1,503,159 | |
| TOTAL TURKEY | 12,689,432 | ||
| Ukraine - 1.1% | |||
| Ukraine Government: | |||
| 7.75% 9/1/20 (b) | 1,275,000 | 1,325,363 | |
| 7.75% 9/1/21 (b) | 3,555,000 | 3,671,249 | |
| 7.75% 9/1/22 (b) | 4,950,000 | 5,047,812 | |
| TOTAL UKRAINE | 10,044,424 | ||
| United States of America - 0.1% | |||
| U.S. Treasury Bills, yield at date of purchase 1.41% to 1.8% 5/3/18 to 7/26/18 (f) | 590,000 | 588,040 | |
| Venezuela - 0.2% | |||
| Venezuelan Republic: | |||
| 7.65% 4/21/25 (e) | 500,000 | 141,250 | |
| 9% 5/7/23 (Reg. S) (e) | 625,000 | 178,125 | |
| 9.25% 9/15/27(e) | 2,150,000 | 666,500 | |
| 9.25% 5/7/28 (Reg. S) (e) | 2,500,000 | 706,250 | |
| TOTAL VENEZUELA | 1,692,125 | ||
| Zambia - 0.0% | |||
| Republic of Zambia 8.97% 7/30/27 (b) | 400,000 | 402,000 | |
| TOTAL GOVERNMENT OBLIGATIONS | |||
| (Cost $153,233,833) | 150,342,719 | ||
| Shares | Value | ||
| Money Market Funds - 4.5% | |||
| Fidelity Cash Central Fund, 1.74% (g) | 39,056,935 | 39,064,746 | |
| Fidelity Securities Lending Cash Central Fund 1.74% (g)(h) | 1,011,515 | 1,011,616 | |
| TOTAL MONEY MARKET FUNDS | |||
| (Cost $40,074,625) | 40,076,362 | ||
| TOTAL INVESTMENT IN SECURITIES - 100.1% | |||
| (Cost $819,502,123) | 890,382,995 | ||
| NET OTHER ASSETS (LIABILITIES) - (0.1)% | (562,280) | ||
| NET ASSETS - 100% | $889,820,715 |
| Futures Contracts | |||||
| Number of contracts | Expiration Date | Notional Amount | Value | Unrealized Appreciation/(Depreciation) | |
| Purchased | |||||
| Equity Index Contracts | |||||
| ICE E-mini MSCI Emerging Markets Index Contracts (United States) | 211 | June 2018 | $12,155,710 | $(142,199) | $(142,199) |
The notional amount of futures purchased as a percentage of Net Assets is 1.4%
For the period, the average monthly underlying face amount at value for futures contracts in the aggregate was $9,955,367.
Currency Abbreviations
EGP – Egyptian pound
EUR – European Monetary Unit
NGN – Nigerian naira
Categorizations in the Schedule of Investments are based on country or territory of incorporation.
Legend
(a) Non-income producing
(b) Security exempt from registration under Rule 144A of the Securities Act of 1933. These securities may be resold in transactions exempt from registration, normally to qualified institutional buyers. At the end of the period, the value of these securities amounted to $119,520,974 or 13.4% of net assets.
(c) Security or a portion of the security is on loan at period end.
(d) Amount is stated in United States dollars unless otherwise noted.
(e) Non-income producing - Security is in default.
(f) Security or a portion of the security was pledged to cover margin requirements for futures contracts. At period end, the value of securities pledged amounted to $588,040.
(g) Affiliated fund that is generally available only to investment companies and other accounts managed by Fidelity Investments. The rate quoted is the annualized seven-day yield of the fund at period end. A complete unaudited listing of the fund's holdings as of its most recent quarter end is available upon request. In addition, each Fidelity Central Fund's financial statements are available on the SEC's website or upon request.
(h) Investment made with cash collateral received from securities on loan.
Affiliated Central Funds
Information regarding fiscal year to date income earned by the Fund from investments in Fidelity Central Funds is as follows:
| Fund | Income earned |
| Fidelity Cash Central Fund | $234,090 |
| Fidelity Securities Lending Cash Central Fund | 12,065 |
| Total | $246,155 |
Amounts in the income column in the above table include any capital gain distributions from underlying funds, which are presented in the corresponding line-item in the Statement of Operations if applicable.
Investment Valuation
The following is a summary of the inputs used, as of April 30, 2018, involving the Fund's assets and liabilities carried at fair value. The inputs or methodology used for valuing securities may not be an indication of the risk associated with investing in those securities. For more information on valuation inputs, and their aggregation into the levels used below, please refer to the Investment Valuation section in the accompanying Notes to Financial Statements.
| Valuation Inputs at Reporting Date: | ||||
| Description | Total | Level 1 | Level 2 | Level 3 |
| Investments in Securities: | ||||
| Equities: | ||||
| Consumer Discretionary | $99,641,108 | $40,643,847 | $58,997,261 | $-- |
| Consumer Staples | 42,682,540 | 18,740,049 | 23,942,491 | -- |
| Energy | 44,660,710 | 22,153,372 | 22,507,338 | -- |
| Financials | 151,396,549 | 60,194,051 | 91,202,498 | -- |
| Health Care | 18,976,695 | 981,631 | 17,995,064 | -- |
| Industrials | 28,214,971 | 12,461,660 | 15,753,311 | -- |
| Information Technology | 148,891,054 | 75,155,165 | 73,735,889 | -- |
| Materials | 54,747,440 | 33,460,381 | 21,287,059 | -- |
| Real Estate | 18,431,568 | 5,500,259 | 12,931,309 | -- |
| Telecommunication Services | 26,399,668 | 12,498,067 | 13,901,601 | -- |
| Utilities | 18,216,972 | 7,386,876 | 10,830,096 | -- |
| Corporate Bonds | 47,704,639 | -- | 47,704,639 | -- |
| Government Obligations | 150,342,719 | -- | 150,342,719 | -- |
| Money Market Funds | 40,076,362 | 40,076,362 | -- | -- |
| Total Investments in Securities: | $890,382,995 | $329,251,720 | $561,131,275 | $-- |
| Derivative Instruments: | ||||
| Liabilities | ||||
| Futures Contracts | $(142,199) | $(142,199) | $-- | $-- |
| Total Liabilities | $(142,199) | $(142,199) | $-- | $-- |
| Total Derivative Instruments: | $(142,199) | $(142,199) | $-- | $-- |
The following is a summary of transfers between Level 1 and Level 2 for the period ended April 30, 2018. Transfers are assumed to have occurred at the beginning of the period, and are primarily attributable to the valuation techniques used for foreign equity securities, as discussed in the accompanying Notes to Financial Statements:
| Transfers | Total |
| Level 1 to Level 2 | $168,008,172 |
| Level 2 to Level 1 | $1,722,477 |
Value of Derivative Instruments
The following table is a summary of the Fund's value of derivative instruments by primary risk exposure as of April 30, 2018. For additional information on derivative instruments, please refer to the Derivative Instruments section in the accompanying Notes to Financial Statements.
| Primary Risk Exposure / Derivative Type | Value | |
| Asset | Liability | |
| Equity Risk | ||
| Futures Contracts(a) | $0 | $(142,199) |
| Total Equity Risk | 0 | (142,199) |
| Total Value of Derivatives | $0 | $(142,199) |
(a) Reflects gross cumulative appreciation (depreciation) on futures contracts as presented in the Schedule of Investments. In the Statement of Assets and Liabilities, the period end daily variation margin is included in receivable or payable for daily variation margin on futures contracts, and the net cumulative appreciation (depreciation) is included in net unrealized appreciation (depreciation).
Other Information
The composition of credit quality ratings as a percentage of Total Net Assets is as follows (Unaudited):
| AAA,AA,A | 1.9% |
| BBB | 2.1% |
| BB | 2.9% |
| B | 11.1% |
| CCC,CC,C | 2.1% |
| D | 0.2% |
| Not Rated | 1.6% |
| Equities | 73.3% |
| Short-Term Investments and Net Other Assets | 4.8% |
| 100% |
We have used ratings from Moody's Investors Service, Inc. Where Moody's® ratings are not available, we have used S&P® ratings. All ratings are as of the date indicated and do not reflect subsequent changes.
See accompanying notes which are an integral part of the financial statements.
Financial Statements
Statement of Assets and Liabilities
| April 30, 2018 (Unaudited) | ||
| Assets | ||
| Investment in securities, at value (including securities loaned of $991,087) — See accompanying schedule: Unaffiliated issuers (cost $779,427,498) | $850,306,633 | |
| Fidelity Central Funds (cost $40,074,625) | 40,076,362 | |
| Total Investment in Securities (cost $819,502,123) | $890,382,995 | |
| Foreign currency held at value (cost $1,618,085) | 1,618,123 | |
| Receivable for investments sold | 2,766,197 | |
| Receivable for fund shares sold | 1,442,524 | |
| Dividends receivable | 567,946 | |
| Interest receivable | 3,106,967 | |
| Distributions receivable from Fidelity Central Funds | 54,329 | |
| Prepaid expenses | 295 | |
| Other receivables | 160,331 | |
| Total assets | 900,099,707 | |
| Liabilities | ||
| Payable to custodian bank | $286,337 | |
| Payable for investments purchased | 6,148,128 | |
| Payable for fund shares redeemed | 1,542,475 | |
| Accrued management fee | 587,798 | |
| Distribution and service plan fees payable | 52,483 | |
| Payable for daily variation margin on futures contracts | 100,225 | |
| Other affiliated payables | 172,920 | |
| Other payables and accrued expenses | 377,026 | |
| Collateral on securities loaned | 1,011,600 | |
| Total liabilities | 10,278,992 | |
| Net Assets | $889,820,715 | |
| Net Assets consist of: | ||
| Paid in capital | $812,467,172 | |
| Undistributed net investment income | 4,020,470 | |
| Accumulated undistributed net realized gain (loss) on investments and foreign currency transactions | 2,808,263 | |
| Net unrealized appreciation (depreciation) on investments and assets and liabilities in foreign currencies | 70,524,810 | |
| Net Assets | $889,820,715 | |
| Calculation of Maximum Offering Price | ||
| Class A: | ||
| Net Asset Value and redemption price per share ($49,758,270 ÷ 3,732,946 shares) | $13.33 | |
| Maximum offering price per share (100/94.25 of $13.33) | $14.14 | |
| Class M: | ||
| Net Asset Value and redemption price per share ($10,177,475 ÷ 763,612 shares) | $13.33 | |
| Maximum offering price per share (100/96.50 of $13.33) | $13.81 | |
| Class C: | ||
| Net Asset Value and offering price per share ($45,585,320 ÷ 3,445,331 shares)(a) | $13.23 | |
| Total Emerging Markets: | ||
| Net Asset Value, offering price and redemption price per share ($317,289,699 ÷ 23,758,433 shares) | $13.35 | |
| Class I: | ||
| Net Asset Value, offering price and redemption price per share ($467,009,951 ÷ 35,013,439 shares) | $13.34 |
(a) Redemption price per share is equal to net asset value less any applicable contingent deferred sales charge.
See accompanying notes which are an integral part of the financial statements.
Statement of Operations
| Six months ended April 30, 2018 (Unaudited) | ||
| Investment Income | ||
| Dividends | $5,615,105 | |
| Interest | 5,373,621 | |
| Income from Fidelity Central Funds | 246,155 | |
| Income before foreign taxes withheld | 11,234,881 | |
| Less foreign taxes withheld | (673,906) | |
| Total income | 10,560,975 | |
| Expenses | ||
| Management fee | $3,319,473 | |
| Transfer agent fees | 773,104 | |
| Distribution and service plan fees | 293,796 | |
| Accounting and security lending fees | 200,026 | |
| Custodian fees and expenses | 276,403 | |
| Independent trustees' fees and expenses | 1,596 | |
| Registration fees | 68,467 | |
| Audit | 39,734 | |
| Legal | 1,561 | |
| Miscellaneous | 2,178 | |
| Total expenses before reductions | 4,976,338 | |
| Expense reductions | (91,097) | 4,885,241 |
| Net investment income (loss) | 5,675,734 | |
| Realized and Unrealized Gain (Loss) | ||
| Net realized gain (loss) on: | ||
| Investment securities: | ||
| Unaffiliated issuers | 6,106,347 | |
| Fidelity Central Funds | 18 | |
| Foreign currency transactions | (125,392) | |
| Futures contracts | 740,961 | |
| Total net realized gain (loss) | 6,721,934 | |
| Change in net unrealized appreciation (depreciation) on: | ||
| Investment securities: | ||
| Unaffiliated issuers (net of decrease in deferred foreign taxes of $460,015) | (10,078,136) | |
| Fidelity Central Funds | 17 | |
| Assets and liabilities in foreign currencies | (23,671) | |
| Futures contracts | (142,199) | |
| Total change in net unrealized appreciation (depreciation) | (10,243,989) | |
| Net gain (loss) | (3,522,055) | |
| Net increase (decrease) in net assets resulting from operations | $2,153,679 |
See accompanying notes which are an integral part of the financial statements.
Statement of Changes in Net Assets
| Six months ended April 30, 2018 (Unaudited) | Year ended October 31, 2017 | |
| Increase (Decrease) in Net Assets | ||
| Operations | ||
| Net investment income (loss) | $5,675,734 | $9,051,354 |
| Net realized gain (loss) | 6,721,934 | 10,774,070 |
| Change in net unrealized appreciation (depreciation) | (10,243,989) | 71,398,614 |
| Net increase (decrease) in net assets resulting from operations | 2,153,679 | 91,224,038 |
| Distributions to shareholders from net investment income | (9,831,547) | (1,957,793) |
| Distributions to shareholders from net realized gain | (10,441,996) | (138,064) |
| Total distributions | (20,273,543) | (2,095,857) |
| Share transactions - net increase (decrease) | 178,463,572 | 485,742,909 |
| Redemption fees | 23,777 | 215,914 |
| Total increase (decrease) in net assets | 160,367,485 | 575,087,004 |
| Net Assets | ||
| Beginning of period | 729,453,230 | 154,366,226 |
| End of period | $889,820,715 | $729,453,230 |
| Other Information | ||
| Undistributed net investment income end of period | $4,020,470 | $8,176,283 |
See accompanying notes which are an integral part of the financial statements.
Financial Highlights
Fidelity Total Emerging Markets Fund Class A
| Six months ended (Unaudited) April 30, | Years endedOctober 31, | |||||
| 2018 | 2017 | 2016 | 2015 | 2014 | 2013 | |
| Selected Per–Share Data | ||||||
| Net asset value, beginning of period | $13.56 | $11.33 | $10.35 | $11.56 | $11.37 | $10.86 |
| Income from Investment Operations | ||||||
| Net investment income (loss)A | .08 | .24 | .26 | .28 | .18 | .18 |
| Net realized and unrealized gain (loss) | .03B | 2.11 | .96 | (1.30) | .19 | .48 |
| Total from investment operations | .11 | 2.35 | 1.22 | (1.02) | .37 | .66 |
| Distributions from net investment income | (.16) | (.12) | (.24) | (.17) | (.18) | (.15) |
| Distributions from net realized gain | (.19) | (.01) | – | (.02) | – | (.01) |
| Total distributions | (.34)C | (.13) | (.24) | (.19) | (.18) | (.16) |
| Redemption fees added to paid in capitalA | –D | .01 | –D | –D | –D | .01 |
| Net asset value, end of period | $13.33 | $13.56 | $11.33 | $10.35 | $11.56 | $11.37 |
| Total ReturnE,F,G | .85% | 21.13% | 12.13% | (8.92)% | 3.30% | 6.23% |
| Ratios to Average Net AssetsH,I | ||||||
| Expenses before reductions | 1.38%J | 1.47% | 1.87% | 1.93% | 1.98% | 1.89% |
| Expenses net of fee waivers, if any | 1.38%J | 1.47% | 1.65% | 1.65% | 1.65% | 1.65% |
| Expenses net of all reductions | 1.36%J | 1.46% | 1.64% | 1.64% | 1.65% | 1.62% |
| Net investment income (loss) | 1.15%J | 1.97% | 2.47% | 2.58% | 1.61% | 1.61% |
| Supplemental Data | ||||||
| Net assets, end of period (000 omitted) | $49,758 | $42,213 | $15,206 | $10,164 | $13,627 | $18,837 |
| Portfolio turnover rateK | 56%J | 59% | 57% | 80% | 102% | 120% |
A Calculated based on average shares outstanding during the period.
B The amount shown for a share outstanding does not correspond with the aggregate net gain (loss) on investments for the period due to the timing of sales and repurchases of shares in relation to fluctuating market values of the investments of the Fund.
C Total distributions of $.34 per share is comprised of distributions from net investment income of $.157 and distributions from net realized gain of $.185 per share.
D Amount represents less than $.005 per share.
E Total returns for periods of less than one year are not annualized.
F Total returns would have been lower if certain expenses had not been reduced during the applicable periods shown.
G Total returns do not include the effect of the sales charges.
H Fees and expenses of any underlying Fidelity Central Funds are not included in the Fund's expense ratio. The Fund indirectly bears its proportionate share of the expenses of any underlying Fidelity Central Funds.
I Expense ratios reflect operating expenses of the class. Expenses before reductions do not reflect amounts reimbursed by the investment adviser or reductions from brokerage service arrangements or reductions from other expense offset arrangements and do not represent the amount paid by the class during periods when reimbursements or reductions occur. Expenses net of fee waivers reflect expenses after reimbursement by the investment adviser but prior to reductions from brokerage service arrangements or other expense offset arrangements. Expenses net of all reductions represent the net expenses paid by the class.
J Annualized
K Amount does not include the portfolio activity of any underlying Fidelity Central Funds.
See accompanying notes which are an integral part of the financial statements.
Fidelity Total Emerging Markets Fund Class M
| Six months ended (Unaudited) April 30, | Years endedOctober 31, | |||||
| 2018 | 2017 | 2016 | 2015 | 2014 | 2013 | |
| Selected Per–Share Data | ||||||
| Net asset value, beginning of period | $13.55 | $11.33 | $10.33 | $11.54 | $11.34 | $10.84 |
| Income from Investment Operations | ||||||
| Net investment income (loss)A | .06 | .20 | .23 | .25 | .15 | .15 |
| Net realized and unrealized gain (loss) | .04B | 2.11 | .97 | (1.30) | .19 | .48 |
| Total from investment operations | .10 | 2.31 | 1.20 | (1.05) | .34 | .63 |
| Distributions from net investment income | (.13) | (.09) | (.20) | (.14) | (.14) | (.12) |
| Distributions from net realized gain | (.19) | (.01) | – | (.02) | – | (.01) |
| Total distributions | (.32) | (.10) | (.20) | (.16) | (.14) | (.14)C |
| Redemption fees added to paid in capitalA | –D | .01 | –D | –D | –D | .01 |
| Net asset value, end of period | $13.33 | $13.55 | $11.33 | $10.33 | $11.54 | $11.34 |
| Total ReturnE,F,G | .72% | 20.66% | 11.92% | (9.18)% | 3.04% | 5.93% |
| Ratios to Average Net AssetsH,I | ||||||
| Expenses before reductions | 1.73%J | 1.82% | 2.22% | 2.27% | 2.32% | 2.13% |
| Expenses net of fee waivers, if any | 1.73%J | 1.82% | 1.90% | 1.90% | 1.90% | 1.90% |
| Expenses net of all reductions | 1.70%J | 1.81% | 1.90% | 1.89% | 1.90% | 1.88% |
| Net investment income (loss) | .81%J | 1.62% | 2.22% | 2.33% | 1.36% | 1.36% |
| Supplemental Data | ||||||
| Net assets, end of period (000 omitted) | $10,177 | $8,751 | $3,019 | $3,331 | $5,277 | $5,967 |
| Portfolio turnover rateK | 56 %J | 59% | 57% | 80% | 102% | 120% |
A Calculated based on average shares outstanding during the period.
B The amount shown for a share outstanding does not correspond with the aggregate net gain (loss) on investments for the period due to the timing of sales and repurchases of shares in relation to fluctuating market values of the investments of the Fund.
C Total distributions of $.14 per share is comprised of distributions from net investment income of $.124 and distributions from net realized gain of $.014 per share.
D Amount represents less than $.005 per share.
E Total returns for periods of less than one year are not annualized.
F Total returns would have been lower if certain expenses had not been reduced during the applicable periods shown.
G Total returns do not include the effect of the sales charges.
H Fees and expenses of any underlying Fidelity Central Funds are not included in the Fund's expense ratio. The Fund indirectly bears its proportionate share of the expenses of any underlying Fidelity Central Funds.
I Expense ratios reflect operating expenses of the class. Expenses before reductions do not reflect amounts reimbursed by the investment adviser or reductions from brokerage service arrangements or reductions from other expense offset arrangements and do not represent the amount paid by the class during periods when reimbursements or reductions occur. Expenses net of fee waivers reflect expenses after reimbursement by the investment adviser but prior to reductions from brokerage service arrangements or other expense offset arrangements. Expenses net of all reductions represent the net expenses paid by the class.
J Annualized
K Amount does not include the portfolio activity of any underlying Fidelity Central Funds.
See accompanying notes which are an integral part of the financial statements.
Fidelity Total Emerging Markets Fund Class C
| Six months ended (Unaudited) April 30, | Years endedOctober 31, | |||||
| 2018 | 2017 | 2016 | 2015 | 2014 | 2013 | |
| Selected Per–Share Data | ||||||
| Net asset value, beginning of period | $13.45 | $11.25 | $10.25 | $11.47 | $11.29 | $10.80 |
| Income from Investment Operations | ||||||
| Net investment income (loss)A | .03 | .15 | .18 | .20 | .10 | .09 |
| Net realized and unrealized gain (loss) | .03B | 2.11 | .97 | (1.30) | .19 | .47 |
| Total from investment operations | .06 | 2.26 | 1.15 | (1.10) | .29 | .56 |
| Distributions from net investment income | (.09) | (.06) | (.15) | (.10) | (.11) | (.07) |
| Distributions from net realized gain | (.19) | (.01) | – | (.02) | – | (.01) |
| Total distributions | (.28) | (.07) | (.15) | (.12) | (.11) | (.08) |
| Redemption fees added to paid in capitalA | –C | .01 | –C | –C | –C | .01 |
| Net asset value, end of period | $13.23 | $13.45 | $11.25 | $10.25 | $11.47 | $11.29 |
| Total ReturnD,E,F | .45% | 20.29% | 11.36% | (9.68)% | 2.56% | 5.31% |
| Ratios to Average Net AssetsG,H | ||||||
| Expenses before reductions | 2.13%I | 2.21% | 2.62% | 2.68% | 2.72% | 2.65% |
| Expenses net of fee waivers, if any | 2.13%I | 2.21% | 2.40% | 2.40% | 2.40% | 2.40% |
| Expenses net of all reductions | 2.11%I | 2.20% | 2.39% | 2.39% | 2.40% | 2.37% |
| Net investment income (loss) | .41%I | 1.23% | 1.72% | 1.83% | .86% | .86% |
| Supplemental Data | ||||||
| Net assets, end of period (000 omitted) | $45,585 | $34,869 | $10,710 | $7,736 | $10,104 | $7,436 |
| Portfolio turnover rateJ | 56%I | 59% | 57% | 80% | 102% | 120% |
A Calculated based on average shares outstanding during the period.
B The amount shown for a share outstanding does not correspond with the aggregate net gain (loss) on investments for the period due to the timing of sales and repurchases of shares in relation to fluctuating market values of the investments of the Fund.
C Amount represents less than $.005 per share.
D Total returns for periods of less than one year are not annualized.
E Total returns would have been lower if certain expenses had not been reduced during the applicable periods shown.
F Total returns do not include the effect of the contingent deferred sales charge.
G Fees and expenses of any underlying Fidelity Central Funds are not included in the Fund's expense ratio. The Fund indirectly bears its proportionate share of the expenses of any underlying Fidelity Central Funds.
H Expense ratios reflect operating expenses of the class. Expenses before reductions do not reflect amounts reimbursed by the investment adviser or reductions from brokerage service arrangements or reductions from other expense offset arrangements and do not represent the amount paid by the class during periods when reimbursements or reductions occur. Expenses net of fee waivers reflect expenses after reimbursement by the investment adviser but prior to reductions from brokerage service arrangements or other expense offset arrangements. Expenses net of all reductions represent the net expenses paid by the class.
I Annualized
J Amount does not include the portfolio activity of any underlying Fidelity Central Funds.
See accompanying notes which are an integral part of the financial statements.
Fidelity Total Emerging Markets Fund
| Six months ended (Unaudited) April 30, | Years endedOctober 31, | |||||
| 2018 | 2017 | 2016 | 2015 | 2014 | 2013 | |
| Selected Per–Share Data | ||||||
| Net asset value, beginning of period | $13.58 | $11.34 | $10.38 | $11.60 | $11.40 | $10.89 |
| Income from Investment Operations | ||||||
| Net investment income (loss)A | .10 | .27 | .28 | .31 | .21 | .21 |
| Net realized and unrealized gain (loss) | .03B | 2.10 | .97 | (1.31) | .19 | .47 |
| Total from investment operations | .13 | 2.37 | 1.25 | (1.00) | .40 | .68 |
| Distributions from net investment income | (.17) | (.14) | (.29) | (.20) | (.20) | (.17) |
| Distributions from net realized gain | (.19) | (.01) | – | (.02) | – | (.01) |
| Total distributions | (.36) | (.14)C | (.29) | (.22) | (.20) | (.18) |
| Redemption fees added to paid in capitalA | –D | .01 | –D | –D | –D | .01 |
| Net asset value, end of period | $13.35 | $13.58 | $11.34 | $10.38 | $11.60 | $11.40 |
| Total ReturnE,F | .98% | 21.37% | 12.44% | (8.74)% | 3.56% | 6.44% |
| Ratios to Average Net AssetsG,H | ||||||
| Expenses before reductions | 1.12%I | 1.26% | 1.62% | 1.72% | 1.73% | 1.56% |
| Expenses net of fee waivers, if any | 1.12%I | 1.26% | 1.40% | 1.40% | 1.40% | 1.40% |
| Expenses net of all reductions | 1.09%I | 1.24% | 1.39% | 1.39% | 1.40% | 1.38% |
| Net investment income (loss) | 1.42%I | 2.18% | 2.72% | 2.83% | 1.86% | 1.85% |
| Supplemental Data | ||||||
| Net assets, end of period (000 omitted) | $317,290 | $272,002 | $104,332 | $37,918 | $45,763 | $49,959 |
| Portfolio turnover rateJ | 56%I | 59% | 57% | 80% | 102% | 120% |
A Calculated based on average shares outstanding during the period.
B The amount shown for a share outstanding does not correspond with the aggregate net gain (loss) on investments for the period due to the timing of sales and repurchases of shares in relation to fluctuating market values of the investments of the Fund.
C Total distributions of $.14 per share is comprised of distributions from net investment income of $.135 and distributions from net realized gain of $.009 per share.
D Amount represents less than $.005 per share.
E Total returns for periods of less than one year are not annualized.
F Total returns would have been lower if certain expenses had not been reduced during the applicable periods shown.
G Fees and expenses of any underlying Fidelity Central Funds are not included in the Fund's expense ratio. The Fund indirectly bears its proportionate share of the expenses of any underlying Fidelity Central Funds.
H Expense ratios reflect operating expenses of the class. Expenses before reductions do not reflect amounts reimbursed by the investment adviser or reductions from brokerage service arrangements or reductions from other expense offset arrangements and do not represent the amount paid by the class during periods when reimbursements or reductions occur. Expenses net of fee waivers reflect expenses after reimbursement by the investment adviser but prior to reductions from brokerage service arrangements or other expense offset arrangements. Expenses net of all reductions represent the net expenses paid by the class.
I Annualized
J Amount does not include the portfolio activity of any underlying Fidelity Central Funds.
See accompanying notes which are an integral part of the financial statements.
Fidelity Total Emerging Markets Fund Class I
| Six months ended (Unaudited) April 30, | Years endedOctober 31, | |||||
| 2018 | 2017 | 2016 | 2015 | 2014 | 2013 | |
| Selected Per–Share Data | ||||||
| Net asset value, beginning of period | $13.58 | $11.33 | $10.37 | $11.59 | $11.40 | $10.89 |
| Income from Investment Operations | ||||||
| Net investment income (loss)A | .10 | .28 | .29 | .31 | .21 | .20 |
| Net realized and unrealized gain (loss) | .03B | 2.11 | .96 | (1.31) | .18 | .48 |
| Total from investment operations | .13 | 2.39 | 1.25 | (1.00) | .39 | .68 |
| Distributions from net investment income | (.19) | (.14) | (.29) | (.20) | (.20) | (.17) |
| Distributions from net realized gain | (.19) | (.01) | – | (.02) | – | (.01) |
| Total distributions | (.37)C | (.15) | (.29) | (.22) | (.20) | (.18) |
| Redemption fees added to paid in capitalA | –D | .01 | –D | –D | –D | .01 |
| Net asset value, end of period | $13.34 | $13.58 | $11.33 | $10.37 | $11.59 | $11.40 |
| Total ReturnE,F | .99% | 21.51% | 12.48% | (8.74)% | 3.51% | 6.44% |
| Ratios to Average Net AssetsG,H | ||||||
| Expenses before reductions | 1.11%I | 1.19% | 1.54% | 1.58% | 1.71% | 1.63% |
| Expenses net of fee waivers, if any | 1.11%I | 1.19% | 1.40% | 1.40% | 1.40% | 1.40% |
| Expenses net of all reductions | 1.09%I | 1.17% | 1.39% | 1.39% | 1.40% | 1.37% |
| Net investment income (loss) | 1.43%I | 2.25% | 2.72% | 2.83% | 1.86% | 1.86% |
| Supplemental Data | ||||||
| Net assets, end of period (000 omitted) | $467,010 | $371,617 | $21,099 | $6,343 | $4,773 | $5,354 |
| Portfolio turnover rateJ | 56%I | 59% | 57% | 80% | 102% | 120% |
A Calculated based on average shares outstanding during the period.
B The amount shown for a share outstanding does not correspond with the aggregate net gain (loss) on investments for the period due to the timing of sales and repurchases of shares in relation to fluctuating market values of the investments of the Fund.
C Total distributions of $.37 per share is comprised of distributions from net investment income of $.185 and distributions from net realized gain of $.185 per share.
D Amount represents less than $.005 per share.
E Total returns for periods of less than one year are not annualized.
F Total returns would have been lower if certain expenses had not been reduced during the applicable periods shown.
G Fees and expenses of any underlying Fidelity Central Funds are not included in the Fund's expense ratio. The Fund indirectly bears its proportionate share of the expenses of any underlying Fidelity Central Funds.
H Expense ratios reflect operating expenses of the class. Expenses before reductions do not reflect amounts reimbursed by the investment adviser or reductions from brokerage service arrangements or reductions from other expense offset arrangements and do not represent the amount paid by the class during periods when reimbursements or reductions occur. Expenses net of fee waivers reflect expenses after reimbursement by the investment adviser but prior to reductions from brokerage service arrangements or other expense offset arrangements. Expenses net of all reductions represent the net expenses paid by the class.
I Annualized
J Amount does not include the portfolio activity of any underlying Fidelity Central Funds.
See accompanying notes which are an integral part of the financial statements.
Notes to Financial Statements (Unaudited)
For the period ended April 30, 2018
1. Organization.
Fidelity Total Emerging Markets Fund (the Fund) is a fund of Fidelity Investment Trust (the Trust) and is authorized to issue an unlimited number of shares. The Trust is registered under the Investment Company Act of 1940, as amended (the 1940 Act), as an open-end management investment company organized as a Massachusetts business trust. The Fund offers Class A, Class M, Class C, Total Emerging Markets and Class I shares, each of which has equal rights as to assets and voting privileges. Each class has exclusive voting rights with respect to matters that affect that class. The Fund's investments in emerging markets can be subject to social, economic, regulatory, and political uncertainties and can be extremely volatile.
2. Investments in Fidelity Central Funds.
The Fund invests in Fidelity Central Funds, which are open-end investment companies generally available only to other investment companies and accounts managed by the investment adviser and its affiliates. The Fund's Schedule of Investments lists each of the Fidelity Central Funds held as of period end, if any, as an investment of the Fund, but does not include the underlying holdings of each Fidelity Central Fund. As an Investing Fund, the Fund indirectly bears its proportionate share of the expenses of the underlying Fidelity Central Funds.
The Money Market Central Funds seek preservation of capital and current income and are managed by Fidelity Investments Money Management, Inc. (FIMM), an affiliate of the investment adviser. Annualized expenses of the Money Market Central Funds as of their most recent shareholder report date are less than .005%.
A complete unaudited list of holdings for each Fidelity Central Fund is available upon request or at the Securities and Exchange Commission (the SEC) website at www.sec.gov. In addition, the financial statements of the Fidelity Central Funds are available on the SEC website or upon request.
3. Significant Accounting Policies.
The Fund is an investment company and applies the accounting and reporting guidance of the Financial Accounting Standards Board (FASB) Accounting Standards Codification Topic 946 Financial Services – Investments Companies. The financial statements have been prepared in conformity with accounting principles generally accepted in the United States of America (GAAP), which require management to make certain estimates and assumptions at the date of the financial statements. Actual results could differ from those estimates. Subsequent events, if any, through the date that the financial statements were issued have been evaluated in the preparation of the financial statements. The following summarizes the significant accounting policies of the Fund:
Investment Valuation. Investments are valued as of 4:00 p.m. Eastern time on the last calendar day of the period. The Board of Trustees (the Board) has delegated the day to day responsibility for the valuation of the Fund's investments to the Fair Value Committee (the Committee) established by the Fund's investment adviser. In accordance with valuation policies and procedures approved by the Board, the Fund attempts to obtain prices from one or more third party pricing vendors or brokers to value its investments. When current market prices, quotations or currency exchange rates are not readily available or reliable, investments will be fair valued in good faith by the Committee, in accordance with procedures adopted by the Board. Factors used in determining fair value vary by investment type and may include market or investment specific events, changes in interest rates and credit quality. The frequency with which these procedures are used cannot be predicted and they may be utilized to a significant extent. The Committee oversees the Fund's valuation policies and procedures and reports to the Board on the Committee's activities and fair value determinations. The Board monitors the appropriateness of the procedures used in valuing the Fund's investments and ratifies the fair value determinations of the Committee.
The Fund categorizes the inputs to valuation techniques used to value its investments into a disclosure hierarchy consisting of three levels as shown below:
- Level 1 – quoted prices in active markets for identical investments
- Level 2 – other significant observable inputs (including quoted prices for similar investments, interest rates, prepayment speeds, etc.)
- Level 3 – unobservable inputs (including the Fund's own assumptions based on the best information available)
Valuation techniques used to value the Fund's investments by major category are as follows:
Equity securities, including restricted securities, for which market quotations are readily available, are valued at the last reported sale price or official closing price as reported by a third party pricing vendor on the primary market or exchange on which they are traded and are categorized as Level 1 in the hierarchy. In the event there were no sales during the day or closing prices are not available, securities are valued at the last quoted bid price or may be valued using the last available price and are generally categorized as Level 2 in the hierarchy. For foreign equity securities, when market or security specific events arise, comparisons to the valuation of American Depositary Receipts (ADRs), futures contracts, Exchange-Traded Funds (ETFs) and certain indexes as well as quoted prices for similar securities may be used and would be categorized as Level 2 in the hierarchy. Utilizing these techniques may result in transfers between Level 1 and Level 2. For equity securities, including restricted securities, where observable inputs are limited, assumptions about market activity and risk are used and these securities may be categorized as Level 3 in the hierarchy.
Debt securities, including restricted securities, are valued based on evaluated prices received from third party pricing vendors or from brokers who make markets in such securities. Corporate bonds, foreign government and government agency obligations and U.S. government and government agency obligations are valued by pricing vendors who utilize matrix pricing which considers yield or price of bonds of comparable quality, coupon, maturity and type or by broker-supplied prices. When independent prices are unavailable or unreliable, debt securities may be valued utilizing pricing methodologies which consider similar factors that would be used by third party pricing vendors. Debt securities are generally categorized as Level 2 in the hierarchy but may be Level 3 depending on the circumstances.
Futures contracts are valued at the settlement price established each day by the board of trade or exchange on which they are traded and are categorized as Level 1 in the hierarchy.
Investments in open-end mutual funds, including the Fidelity Central Funds, are valued at their closing net asset value (NAV) each business day and are categorized as Level 1 in the hierarchy.
Changes in valuation techniques may result in transfers in or out of an assigned level within the disclosure hierarchy. The aggregate value of investments by input level as of April 30, 2018, including information on transfers between Levels 1 and 2, is included at the end of the Fund's Schedule of Investments.
Foreign Currency. The Fund may use foreign currency contracts to facilitate transactions in foreign-denominated securities. Gains and losses from these transactions may arise from changes in the value of the foreign currency or if the counterparties do not perform under the contracts' terms.
Foreign-denominated assets, including investment securities, and liabilities are translated into U.S. dollars at the exchange rates at period end. Purchases and sales of investment securities, income and dividends received and expenses denominated in foreign currencies are translated into U.S. dollars at the exchange rate in effect on the transaction date.
The effects of exchange rate fluctuations on investments are included with the net realized and unrealized gain (loss) on investment securities. Other foreign currency transactions resulting in realized and unrealized gain (loss) are disclosed separately.
Investment Transactions and Income. For financial reporting purposes, the Fund's investment holdings and NAV include trades executed through the end of the last business day of the period. The NAV per share for processing shareholder transactions is calculated as of the close of business of the New York Stock Exchange (NYSE), normally 4:00 p.m. Eastern time and includes trades executed through the end of the prior business day. Gains and losses on securities sold are determined on the basis of identified cost. Dividend income is recorded on the ex-dividend date, except for certain dividends from foreign securities where the ex-dividend date may have passed, which are recorded as soon as the Fund is informed of the ex-dividend date. Non-cash dividends included in dividend income, if any, are recorded at the fair market value of the securities received. Income and capital gain distributions from Fidelity Central Funds, if any, are recorded on the ex-dividend date. Certain distributions received by the Fund represent a return of capital or capital gain. The Fund determines the components of these distributions subsequent to the ex-dividend date, based upon receipt of tax filings or other correspondence relating to the underlying investment. These distributions are recorded as a reduction of cost of investments and/or as a realized gain. Interest income is accrued as earned and includes coupon interest and amortization of premium and accretion of discount on debt securities as applicable. Paid in Kind (PIK) income is recorded at the fair market value of the securities received. Investment income is recorded net of foreign taxes withheld where recovery of such taxes is uncertain. Debt obligations may be placed on non-accrual status and related interest income may be reduced by ceasing current accruals and writing off interest receivables when the collection of all or a portion of interest has become doubtful based on consistently applied procedures. A debt obligation is removed from non-accrual status when the issuer resumes interest payments or when collectability of interest is reasonably assured.
Class Allocations and Expenses. Investment income, realized and unrealized capital gains and losses, common expenses of the Fund, and certain fund-level expense reductions, if any, are allocated daily on a pro-rata basis to each class based on the relative net assets of each class to the total net assets of the Fund. Each class differs with respect to transfer agent and distribution and service plan fees incurred. Certain expense reductions may also differ by class. For the reporting period, the allocated portion of income and expenses to each class as a percent of its average net assets may vary due to the timing of recording these transactions in relation to fluctuating net assets of the classes. Expenses directly attributable to a fund are charged to that fund. Expenses attributable to more than one fund are allocated among the respective funds on the basis of relative net assets or other appropriate methods. Expense estimates are accrued in the period to which they relate and adjustments are made when actual amounts are known.
Income Tax Information and Distributions to Shareholders. Each year, the Fund intends to qualify as a regulated investment company under Subchapter M of the Internal Revenue Code, including distributing substantially all of its taxable income and realized gains. As a result, no provision for U.S. Federal income taxes is required. The Fund files a U.S. federal tax return, in addition to state and local tax returns as required. The Fund's federal income tax returns are subject to examination by the Internal Revenue Service (IRS) for a period of three fiscal years after they are filed. State and local tax returns may be subject to examination for an additional fiscal year depending on the jurisdiction. Foreign taxes are provided for based on the Fund's understanding of the tax rules and rates that exist in the foreign markets in which it invests. The Fund is subject to a tax imposed on capital gains by certain countries in which it invests. An estimated deferred tax liability for net unrealized appreciation on the applicable securities is included in Other payables and accrued expenses on the Statement of Assets & Liabilities.
Distributions are declared and recorded on the ex-dividend date. Income and capital gain distributions are declared separately for each class. Income and capital gain distributions are determined in accordance with income tax regulations, which may differ from GAAP.
Capital accounts within the financial statements are adjusted for permanent book-tax differences. These adjustments have no impact on net assets or the results of operations. Capital accounts are not adjusted for temporary book-tax differences which will reverse in a subsequent period.
Book-tax differences are primarily due to foreign currency transactions, futures contracts, certain foreign taxes, market discount, passive foreign investment companies (PFIC), capital loss carryforwards and losses deferred due to wash sales.
As of period end, the cost and unrealized appreciation (depreciation) in securities, and derivatives if applicable, for federal income tax purposes were as follows:
| Gross unrealized appreciation | $105,395,389 |
| Gross unrealized depreciation | (36,425,511) |
| Net unrealized appreciation (depreciation) | $68,969,878 |
| Tax cost | $821,270,918 |
Short-Term Trading (Redemption) Fees. Shares held by investors in the Fund less than 90 days may have been subject to a redemption fee equal to 1.50% of the NAV of shares redeemed. All redemption fees, which reduce the proceeds of the shareholder redemption, are retained by the Fund and accounted for as an addition to paid in capital. In November 2017, the Board of Trustees approved the elimination of these redemption fees effective December 18, 2017.
Restricted Securities. The Fund may invest in securities that are subject to legal or contractual restrictions on resale. These securities generally may be resold in transactions exempt from registration or to the public if the securities are registered. Disposal of these securities may involve time-consuming negotiations and expense, and prompt sale at an acceptable price may be difficult. Information regarding restricted securities is included at the end of the Fund's Schedule of Investments.
4. Derivative Instruments.
Risk Exposures and the Use of Derivative Instruments. The Fund's investment objective allows the Fund to enter into various types of derivative contracts, including futures contracts. Derivatives are investments whose value is primarily derived from underlying assets, indices or reference rates and may be transacted on an exchange or over-the-counter (OTC). Derivatives may involve a future commitment to buy or sell a specified asset based on specified terms, to exchange future cash flows at periodic intervals based on a notional principal amount, or for one party to make one or more payments upon the occurrence of specified events in exchange for periodic payments from the other party.
The Fund used derivatives to increase returns and to manage exposure to certain risks as defined below. The success of any strategy involving derivatives depends on analysis of numerous economic factors, and if the strategies for investment do not work as intended, the Fund may not achieve its objectives.
The Fund's use of derivatives increased or decreased its exposure to the following risk:
| Equity Risk | Equity risk relates to the fluctuations in the value of financial instruments as a result of changes in market prices (other than those arising from interest rate risk or foreign exchange risk), whether caused by factors specific to an individual investment, its issuer, or all factors affecting all instruments traded in a market or market segment. |
The Fund is also exposed to additional risks from investing in derivatives, such as liquidity risk and counterparty credit risk. Liquidity risk is the risk that the Fund will be unable to close out the derivative in the open market in a timely manner. Counterparty credit risk is the risk that the counterparty will not be able to fulfill its obligation to the Fund. Counterparty credit risk related to exchange-traded futures contracts may be mitigated by the protection provided by the exchange on which they trade.
Investing in derivatives may involve greater risks than investing in the underlying assets directly and, to varying degrees, may involve risk of loss in excess of any initial investment and collateral received and amounts recognized in the Statement of Assets and Liabilities. In addition, there may be the risk that the change in value of the derivative contract does not correspond to the change in value of the underlying instrument.
Futures Contracts. A futures contract is an agreement between two parties to buy or sell a specified underlying instrument for a fixed price at a specified future date. The Fund used futures contracts to manage its exposure to the stock market.
Upon entering into a futures contract, a fund is required to deposit either cash or securities (initial margin) with a clearing broker in an amount equal to a certain percentage of the face value of the contract. Futures contracts are marked-to-market daily and subsequent daily payments (variation margin) are made or received by a fund depending on the daily fluctuations in the value of the futures contracts and are recorded as unrealized appreciation or (depreciation). This receivable and/or payable, if any, is included in daily variation margin on futures contracts in the Statement of Assets and Liabilities. Realized gain or (loss) is recorded upon the expiration or closing of a futures contract. The net realized gain (loss) and change in net unrealized appreciation (depreciation) on futures contracts during the period is presented in the Statement of Operations.
Any open futures contracts at period end are presented in the Schedule of Investments under the caption "Futures Contracts". The notional amount at value reflects each contract's exposure to the underlying instrument or index at period end. Securities deposited to meet initial margin requirements are identified in the Schedule of Investments.
5. Purchases and Sales of Investments.
Purchases and sales of securities, other than short-term securities and U.S. government securities, aggregated $367,396,490 and $223,127,089, respectively.
6. Fees and Other Transactions with Affiliates.
Management Fee. Fidelity Management & Research Company (the investment adviser) and its affiliates provide the Fund with investment management related services for which the Fund pays a monthly management fee. The management fee is the sum of an individual fund fee rate that is based on an annual rate of .55% of the Fund's average net assets and an annualized group fee rate that averaged .24% during the period. The group fee rate is based upon the average net assets of all the mutual funds advised by the investment adviser, including any mutual funds previously advised by the investment adviser that are currently advised by Fidelity SelectCo, LLC, an affiliate of the investment adviser. The group fee rate decreases as assets under management increase and increases as assets under management decrease. For the reporting period, the total annualized management fee rate was .79% of the Fund's average net assets.
Distribution and Service Plan Fees. In accordance with Rule 12b-1 of the 1940 Act, the Fund has adopted separate Distribution and Service Plans for each class of shares. Certain classes pay Fidelity Distributors Corporation (FDC), an affiliate of the investment adviser, separate Distribution and Service Fees, each of which is based on an annual percentage of each class' average net assets. In addition, FDC may pay financial intermediaries for selling shares of the Fund and providing shareholder support services. For the period, the Distribution and Service Fee rates, total fees and amounts retained by FDC were as follows:
| Distribution Fee | Service Fee | Total Fees | Retained by FDC | |
| Class A | -% | .25% | $61,249 | $4,880 |
| Class M | .25% | .25% | 23,636 | 179 |
| Class C | .75% | .25% | 208,911 | 96,484 |
| $293,796 | $101,543 |
Sales Load. FDC may receive a front-end sales charge of up to 5.75% for selling Class A shares and 3.50% for selling Class M shares, some of which is paid to financial intermediaries for selling shares of the Fund. Depending on the holding period, FDC may receive contingent deferred sales charges levied on Class A, Class M and Class C redemptions. The deferred sales charges are 1.00% for Class C shares, 1.00% for certain purchases of Class A shares and .25% for certain purchases of Class M shares.
For the period, sales charge amounts retained by FDC were as follows:
| Retained by FDC | |
| Class A | $42,561 |
| Class M | 5,884 |
| Class C(a) | 4,092 |
| $52,537 |
(a) When Class C shares are initially sold, FDC pays commissions from its own resources to financial intermediaries through which the sales are made.
Transfer Agent Fees. Fidelity Investments Institutional Operations Company, Inc., (FIIOC), an affiliate of the investment adviser, is the transfer, dividend disbursing and shareholder servicing agent for each class of the Fund. FIIOC receives account fees and asset-based fees that vary according to the account size and type of account of the shareholders of the respective classes of the Fund. FIIOC pays for typesetting, printing and mailing of shareholder reports, except proxy statements.
For the period, transfer agent fees for each class were as follows:
| Amount | % of Class-Level Average Net Assets(a) | |
| Class A | $49,808 | .20 |
| Class M | 13,938 | .29 |
| Class C | 41,916 | .20 |
| Total Emerging Markets | 285,436 | .18 |
| Class I | 382,006 | .18 |
| $773,104 |
(a) Annualized
Accounting and Security Lending Fees. Fidelity Service Company, Inc. (FSC), an affiliate of the investment adviser, maintains the Fund's accounting records. The accounting fee is based on the level of average net assets for each month. Under a separate contract, FSC administers the security lending program. The security lending fee is based on the number and duration of lending transactions. For the period, the fees were equivalent to an annualized rate of .05%.
Brokerage Commissions. The Fund placed a portion of its portfolio transactions with brokerage firms which are affiliates of the investment adviser. Brokerage commissions are included in net realized gain (loss) and change in net unrealized appreciation (depreciation) in the Statement of Operations. The commissions paid to these affiliated firms were $1,394 for the period.
Interfund Trades. The Fund may purchase from or sell securities to other Fidelity Funds under procedures adopted by the Board. The procedures have been designed to ensure these interfund trades are executed in accordance with Rule 17a-7 of the 1940 Act. Interfund trades are included within the respective purchases and sales amounts shown in the Purchases and Sales of Investments note.
7. Committed Line of Credit.
The Fund participates with other funds managed by the investment adviser or an affiliate in a $4.25 billion credit facility (the "line of credit") to be utilized for temporary or emergency purposes to fund shareholder redemptions or for other short-term liquidity purposes. The Fund has agreed to pay commitment fees on its pro-rata portion of the line of credit, which amounted to $1,144 and is reflected in Miscellaneous expenses on the Statement of Operations. During the period, the Fund did not borrow on this line of credit.
8. Security Lending.
The Fund lends portfolio securities through a lending agent from time to time in order to earn additional income. For equity securities, a lending agent is used and may loan securities to certain qualified borrowers, including Fidelity Capital Markets (FCM), a broker-dealer affiliated with the Fund. On the settlement date of the loan, the Fund receives collateral (in the form of U.S. Treasury obligations, letters of credit and/or cash) against the loaned securities and maintains collateral in an amount not less than 100% of the market value of the loaned securities during the period of the loan. The market value of the loaned securities is determined at the close of business of the Fund and any additional required collateral is delivered to the Fund on the next business day. The Fund or borrower may terminate the loan at any time, and if the borrower defaults on its obligation to return the securities loaned because of insolvency or other reasons, the Fund may apply collateral received from the borrower against the obligation. The Fund may experience delays and costs in recovering the securities loaned. Any cash collateral received is invested in the Fidelity Securities Lending Cash Central Fund. The value of loaned securities and cash collateral at period end are disclosed on the Fund's Statement of Assets and Liabilities. Security lending income represents the income earned on investing cash collateral, less rebates paid to borrowers and any lending agent fees associated with the loan, plus any premium payments received for lending certain types of securities. Security lending income is presented in the Statement of Operations as a component of income from Fidelity Central Funds. Total security lending income during the period amounted to $12,065. During the period, there were no securities loaned to FCM.
9. Expense Reductions.
Commissions paid to certain brokers with whom the investment adviser, or its affiliates, places trades on behalf of the Fund include an amount in addition to trade execution, which may be rebated back to the Fund to offset certain expenses. This amount totaled $86,707 for the period. Through arrangements with the Fund's custodian, credits realized as a result of certain uninvested cash balances were used to reduce the Fund's expenses. During the period, these credits reduced the Fund's custody expenses by $571.
In addition, during the period the investment adviser reimbursed and/or waived a portion of fund-level operating expenses in the amount of $3,819.
10. Distributions to Shareholders.
Distributions to shareholders of each class were as follows:
| Six months ended April 30, 2018 | Year ended October 31, 2017 | |
| From net investment income | ||
| Class A | $539,474 | $195,255 |
| Class M | 85,818 | 23,027 |
| Class C | 262,508 | 57,828 |
| Total Emerging Markets | 3,522,023 | 1,274,142 |
| Class I | 5,421,724 | 407,541 |
| Total | $9,831,547 | $1,957,793 |
| From net realized gain | ||
| Class A | $633,778 | $14,644 |
| Class M | 122,125 | 2,410 |
| Class C | 519,690 | 9,294 |
| Total Emerging Markets | 3,744,679 | 84,943 |
| Class I | 5,421,724 | 26,773 |
| Total | $10,441,996 | $138,064 |
11. Share Transactions.
Share transactions for each class were as follows and may contain automatic conversions between classes or exchanges between affiliated funds:
| Shares | Shares | Dollars | Dollars | |
| Six months ended April 30, 2018 | Year ended October 31, 2017 | Six months ended April 30, 2018 | Year ended October 31, 2017 | |
| Class A | ||||
| Shares sold | 1,418,677 | 3,615,728 | $19,542,590 | $43,198,307 |
| Reinvestment of distributions | 88,408 | 19,523 | 1,166,980 | 207,918 |
| Shares redeemed | (887,665) | (1,863,978) | (12,256,114) | (21,909,724) |
| Net increase (decrease) | 619,420 | 1,771,273 | $8,453,456 | $21,496,501 |
| Class M | ||||
| Shares sold | 204,308 | 451,431 | $2,817,255 | $5,673,545 |
| Reinvestment of distributions | 15,634 | 2,361 | 206,523 | 25,216 |
| Shares redeemed | (102,047) | (74,567) | (1,396,873) | (886,466) |
| Net increase (decrease) | 117,895 | 379,225 | $1,626,905 | $4,812,295 |
| Class C | ||||
| Shares sold | 1,065,073 | 1,907,365 | $14,566,948 | $23,252,010 |
| Reinvestment of distributions | 59,490 | 6,299 | 781,699 | 66,954 |
| Shares redeemed | (272,393) | (272,258) | (3,706,534) | (3,283,907) |
| Net increase (decrease) | 852,170 | 1,641,406 | $11,642,113 | $20,035,057 |
| Total Emerging Markets | ||||
| Shares sold | 6,685,597 | 17,602,916 | $92,899,253 | $212,356,677 |
| Reinvestment of distributions | 522,036 | 124,771 | 6,896,099 | 1,328,813 |
| Shares redeemed | (3,475,003) | (6,900,916) | (47,731,993) | (84,713,141) |
| Net increase (decrease) | 3,732,630 | 10,826,771 | $52,063,359 | $128,972,349 |
| Class I | ||||
| Shares sold | 10,196,615 | 29,232,950 | $140,358,949 | $357,207,778 |
| Reinvestment of distributions | 792,863 | 38,174 | 10,457,863 | 405,784 |
| Shares redeemed | (3,348,167) | (3,761,001) | (46,139,073) | (47,186,855) |
| Net increase (decrease) | 7,641,311 | 25,510,123 | $104,677,739 | $310,426,707 |
12. Other.
The Fund's organizational documents provide former and current trustees and officers with a limited indemnification against liabilities arising in connection with the performance of their duties to the Fund. In the normal course of business, the Fund may also enter into contracts that provide general indemnifications. The Fund's maximum exposure under these arrangements is unknown as this would be dependent on future claims that may be made against the Fund. The risk of material loss from such claims is considered remote.
Shareholder Expense Example
As a shareholder of the Fund, you incur two types of costs: (1) transaction costs, including sales charges (loads) on purchase payments or redemption proceeds, redemption fees and (2) ongoing costs, including management fees, distribution and/or service (12b-1) fees and other Fund expenses. This Example is intended to help you understand your ongoing costs (in dollars) of investing in the Fund and to compare these costs with the ongoing costs of investing in other mutual funds.
The Example is based on an investment of $1,000 invested at the beginning of the period and held for the entire period (November 1, 2017 to April 30, 2018).
Actual Expenses
The first line of the accompanying table for each class of the Fund provides information about actual account values and actual expenses. You may use the information in this line, together with the amount you invested, to estimate the expenses that you paid over the period. Simply divide your account value by $1,000.00 (for example, an $8,600 account value divided by $1,000.00 = 8.6), then multiply the result by the number in the first line for a class of the Fund under the heading entitled "Expenses Paid During Period" to estimate the expenses you paid on your account during this period. A small balance maintenance fee of $12.00 that is charged once a year may apply for certain accounts with a value of less than $2,000. This fee is not included in the table below. If it was, the estimate of expenses you paid during the period would be higher, and your ending account value lower, by this amount. In addition, the Fund, as a shareholder in the underlying Fidelity Central Funds, will indirectly bear its pro-rata share of the fees and expenses incurred by the underlying Fidelity Central Funds. These fees and expenses are not included in the Fund's annualized expense ratio used to calculate the expense estimate in the table below.
Hypothetical Example for Comparison Purposes
The second line of the accompanying table for each class of the Fund provides information about hypothetical account values and hypothetical expenses based on a Class' actual expense ratio and an assumed rate of return of 5% per year before expenses, which is not the Class' actual return. The hypothetical account values and expenses may not be used to estimate the actual ending account balance or expenses you paid for the period. You may use this information to compare the ongoing costs of investing in the Fund and other funds. To do so, compare this 5% hypothetical example with the 5% hypothetical examples that appear in the shareholder reports of the other funds. A small balance maintenance fee of $12.00 that is charged once a year may apply for certain accounts with a value of less than $2,000. This fee is not included in the table below. If it was, the estimate of expenses you paid during the period would be higher, and your ending account value lower, by this amount. In addition, the Fund, as a shareholder in the underlying Fidelity Central Funds, will indirectly bear its pro-rata share of the fees and expenses incurred by the underlying Fidelity Central Funds. These fees and expenses are not included in the Fund's annualized expense ratio used to calculate the expense estimate in the table below.
Please note that the expenses shown in the table are meant to highlight your ongoing costs only and do not reflect any transaction costs. Therefore, the second line of the table is useful in comparing ongoing costs only, and will not help you determine the relative total costs of owning different funds. In addition, if these transactional costs were included, your costs would have been higher.
| Annualized Expense Ratio-A | Beginning Account Value November 1, 2017 | Ending Account Value April 30, 2018 | Expenses Paid During Period-B November 1, 2017 to April 30, 2018 | |
| Class A | 1.38% | |||
| Actual | $1,000.00 | $1,008.50 | $6.87 | |
| Hypothetical-C | $1,000.00 | $1,017.95 | $6.90 | |
| Class M | 1.73% | |||
| Actual | $1,000.00 | $1,007.20 | $8.61 | |
| Hypothetical-C | $1,000.00 | $1,016.22 | $8.65 | |
| Class C | 2.13% | |||
| Actual | $1,000.00 | $1,004.50 | $10.59 | |
| Hypothetical-C | $1,000.00 | $1,014.23 | $10.64 | |
| Total Emerging Markets | 1.12% | |||
| Actual | $1,000.00 | $1,009.80 | $5.58 | |
| Hypothetical-C | $1,000.00 | $1,019.24 | $5.61 | |
| Class I | 1.11% | |||
| Actual | $1,000.00 | $1,009.90 | $5.53 | |
| Hypothetical-C | $1,000.00 | $1,019.29 | $5.56 |
A Annualized expense ratio reflects expenses net of applicable fee waivers.
B Expenses are equal to each Class' annualized expense ratio, multiplied by the average account value over the period, multiplied by 181/365 (to reflect the one-half year period).
C 5% return per year before expenses
![]()
ATEK-SANN-0618
1.931271.106
Fidelity® Emerging Markets Discovery Fund Fidelity® Total Emerging Markets Fund Semi-Annual Report April 30, 2018 |
|
Contents
Fidelity® Emerging Markets Discovery Fund | |
Fidelity® Total Emerging Markets Fund | |
To view a fund's proxy voting guidelines and proxy voting record for the 12-month period ended June 30, visit http://www.fidelity.com/proxyvotingresults or visit the Securities and Exchange Commission's (SEC) web site at http://www.sec.gov.
You may also call 1-800-544-8544 to request a free copy of the proxy voting guidelines.
Standard & Poor's, S&P and S&P 500 are registered service marks of The McGraw-Hill Companies, Inc. and have been licensed for use by Fidelity Distributors Corporation.
Other third-party marks appearing herein are the property of their respective owners.
All other marks appearing herein are registered or unregistered trademarks or service marks of FMR LLC or an affiliated company. © 2018 FMR LLC. All rights reserved.
This report and the financial statements contained herein are submitted for the general information of the shareholders of the Funds. This report is not authorized for distribution to prospective investors in the Funds unless preceded or accompanied by an effective prospectus.
A fund files its complete schedule of portfolio holdings with the SEC for the first and third quarters of each fiscal year on Form N-Q. Forms N-Q are available on the SEC’s web site at http://www.sec.gov. A fund's Forms N-Q may be reviewed and copied at the SEC’s Public Reference Room in Washington, DC. Information regarding the operation of the SEC's Public Reference Room may be obtained by calling 1-800-SEC-0330.
For a complete list of a fund's portfolio holdings, view the most recent holdings listing, semiannual report, or annual report on Fidelity's web site at http://www.fidelity.com, http://www.institutional.fidelity.com, or http://www.401k.com, as applicable.
NOT FDIC INSURED •MAY LOSE VALUE •NO BANK GUARANTEE
Neither the Funds nor Fidelity Distributors Corporation is a bank.
Fidelity® Emerging Markets Discovery Fund
Investment Summary (Unaudited)
Top Five Stocks as of April 30, 2018
| % of fund's net assets | |
| CSPC Pharmaceutical Group Ltd. (Hong Kong, Pharmaceuticals) | 1.5 |
| Top Glove Corp. Bhd (Malaysia, Health Care Equipment & Supplies) | 1.4 |
| Sunny Optical Technology Group Co. Ltd. (Cayman Islands, Electronic Equipment & Components) | 1.4 |
| Imperial Holdings Ltd. (South Africa, Distributors) | 1.2 |
| Yandex NV Series A (Netherlands, Internet Software & Services) | 1.2 |
| 6.7 |
Top Five Market Sectors as of April 30, 2018
| % of fund's net assets | |
| Information Technology | 16.0 |
| Consumer Discretionary | 14.3 |
| Industrials | 11.4 |
| Financials | 11.0 |
| Materials | 10.2 |
Top Five Countries as of April 30, 2018
| (excluding cash equivalents) | % of fund's net assets |
| Cayman Islands | 12.7 |
| Brazil | 8.5 |
| India | 7.8 |
| Korea (South) | 7.6 |
| Taiwan | 6.4 |
Percentages are adjusted for the effect of futures contracts, if applicable.
Asset Allocation (% of fund's net assets)
| As of April 30, 2018 | ||
| Stocks and Equity Futures | 96.1% | |
| Short-Term Investments and Net Other Assets (Liabilities) | 3.9% | |

Fidelity® Emerging Markets Discovery Fund
Schedule of Investments April 30, 2018 (Unaudited)
Showing Percentage of Net Assets
| Common Stocks - 88.9% | |||
| Shares | Value | ||
| Argentina - 1.4% | |||
| BBVA Banco Frances SA sponsored ADR | 69,900 | $1,555,275 | |
| Central Puerto SA sponsored ADR (a) | 78,900 | 1,220,583 | |
| Inversiones y Representaciones SA ADR (b) | 73,510 | 1,687,055 | |
| Telecom Argentina SA Class B sponsored ADR | 16,600 | 498,664 | |
| YPF SA Class D sponsored ADR | 74,600 | 1,632,994 | |
| TOTAL ARGENTINA | 6,594,571 | ||
| Bailiwick of Jersey - 0.2% | |||
| WNS Holdings Ltd. sponsored ADR (a) | 17,800 | 870,954 | |
| Bangladesh - 0.2% | |||
| BRAC Bank Ltd. | 895,500 | 945,924 | |
| Bermuda - 2.1% | |||
| Joy City Property Ltd. | 14,069,000 | 2,206,985 | |
| Pacific Basin Shipping Ltd. (a) | 11,311,000 | 3,007,532 | |
| PAX Global Technology Ltd. | 1,409,000 | 637,353 | |
| Shangri-La Asia Ltd. | 2,202,000 | 4,285,347 | |
| TOTAL BERMUDA | 10,137,217 | ||
| Brazil - 6.6% | |||
| Azul SA sponsored ADR | 104,245 | 3,231,595 | |
| BTG Pactual Participations Ltd. unit | 274,200 | 1,751,712 | |
| Cia. Hering SA | 365,100 | 1,990,583 | |
| Companhia de Saneamento de Minas Gerais | 96,020 | 1,381,425 | |
| Construtora Tenda SA (a) | 183,200 | 1,334,047 | |
| Cyrela Brazil Realty SA | 254,800 | 1,010,996 | |
| Direcional Engenharia SA (a) | 463,300 | 805,406 | |
| Fibria Celulose SA | 211,100 | 4,146,435 | |
| Hypermarcas SA | 351,938 | 3,164,549 | |
| Instituto Hermes Pardini SA | 161,800 | 1,200,383 | |
| Localiza Rent A Car SA | 420,385 | 3,346,808 | |
| Petrobras Distribuidora SA | 114,500 | 750,434 | |
| QGEP Participacoes SA | 1,417,200 | 5,166,032 | |
| Tegma Gestao Logistica SA | 441,600 | 2,900,553 | |
| TOTAL BRAZIL | 32,180,958 | ||
| British Virgin Islands - 0.7% | |||
| Dolphin Capital Investors Ltd. (a) | 8,361,857 | 834,603 | |
| Mail.Ru Group Ltd. GDR (Reg. S) (a) | 85,800 | 2,711,280 | |
| TOTAL BRITISH VIRGIN ISLANDS | 3,545,883 | ||
| Canada - 1.1% | |||
| First Quantum Minerals Ltd. | 195,600 | 2,818,334 | |
| Pan American Silver Corp. | 149,600 | 2,411,552 | |
| TOTAL CANADA | 5,229,886 | ||
| Cayman Islands - 12.7% | |||
| 58.com, Inc. ADR (a) | 66,900 | 5,846,391 | |
| ASM Pacific Technology Ltd. | 188,000 | 2,576,227 | |
| Changyou.com Ltd. (A Shares) ADR (b) | 49,700 | 945,791 | |
| Cheetah Mobile, Inc. ADR (a)(b) | 65,200 | 874,332 | |
| China Medical System Holdings Ltd. | 1,734,000 | 4,246,178 | |
| Daqo New Energy Corp. ADR (a) | 20,200 | 1,077,670 | |
| ENN Energy Holdings Ltd. | 328,000 | 3,067,302 | |
| Fu Shou Yuan International Group Ltd. (c) | 5,808,000 | 5,540,234 | |
| General Interface Solution Holding Ltd. | 266,000 | 1,589,470 | |
| Haitian International Holdings Ltd. | 1,516,000 | 4,034,534 | |
| IGG, Inc. | 1,579,000 | 2,374,654 | |
| JA Solar Holdings Co. Ltd. ADR (a)(b) | 75,900 | 535,854 | |
| Lee's Pharmaceutical Holdings Ltd. | 1,009,000 | 1,304,561 | |
| Longfor Properties Co. Ltd. | 563,000 | 1,683,783 | |
| Shimao Property Holdings Ltd. | 1,171,500 | 3,098,694 | |
| Silicon Motion Technology Corp. sponsored ADR | 13,300 | 601,293 | |
| SITC International Holdings Co. Ltd. | 4,295,500 | 4,576,623 | |
| Sunny Optical Technology Group Co. Ltd. | 406,700 | 6,636,383 | |
| TPK Holding Co. Ltd. (a) | 454,000 | 988,467 | |
| Uni-President China Holdings Ltd. | 3,179,000 | 3,005,212 | |
| Yirendai Ltd. sponsored ADR (b) | 53,620 | 1,891,177 | |
| Yuzhou Properties Co. | 3,041,000 | 2,212,117 | |
| YY, Inc. ADR (a) | 33,700 | 3,248,343 | |
| TOTAL CAYMAN ISLANDS | 61,955,290 | ||
| Chile - 0.6% | |||
| Compania Cervecerias Unidas SA sponsored ADR (b) | 111,400 | 3,076,868 | |
| China - 4.7% | |||
| BBMG Corp. (H Shares) | 3,182,000 | 1,451,337 | |
| China Longyuan Power Grid Corp. Ltd. (H Shares) | 5,774,200 | 5,671,536 | |
| China Suntien Green Energy Corp. Ltd. (H Shares) | 4,917,000 | 1,644,024 | |
| Qingdao Haier Co. Ltd. | 906,960 | 2,449,949 | |
| Shanghai International Airport Co. Ltd. (A Shares) | 293,841 | 2,307,869 | |
| Suofeiya Home Collection Co. Ltd. Class A | 432,220 | 2,190,707 | |
| TravelSky Technology Ltd. (H Shares) | 680,000 | 1,986,299 | |
| Tsingtao Brewery Co. Ltd. (H Shares) | 442,000 | 2,288,409 | |
| Zhengzhou Yutong Bus Co. Ltd. | 958,862 | 3,097,746 | |
| TOTAL CHINA | 23,087,876 | ||
| Colombia - 0.2% | |||
| Bancolombia SA sponsored ADR | 17,600 | 838,816 | |
| Cyprus - 0.6% | |||
| Globaltrans Investment PLC GDR (Reg. S) | 287,200 | 3,021,344 | |
| Egypt - 1.5% | |||
| Credit Agricole Egypt | 346,080 | 891,908 | |
| Egyptian Kuwaiti Holding | 2,135,200 | 2,412,776 | |
| Six of October Development & Investment Co. (a) | 2,569,600 | 3,887,512 | |
| TOTAL EGYPT | 7,192,196 | ||
| Greece - 2.0% | |||
| Alpha Bank AE (a) | 979,300 | 2,589,900 | |
| Fourlis Holdings SA | 492,200 | 3,506,846 | |
| Titan Cement Co. SA (Reg.) | 146,600 | 3,868,196 | |
| TOTAL GREECE | 9,964,942 | ||
| Hong Kong - 5.1% | |||
| China Resources Beer Holdings Co. Ltd. | 856,000 | 3,686,731 | |
| China Travel International Investment HK Ltd. | 6,926,000 | 2,582,328 | |
| CSPC Pharmaceutical Group Ltd. | 2,792,000 | 7,111,383 | |
| Far East Horizon Ltd. | 1,786,584 | 1,772,805 | |
| Techtronic Industries Co. Ltd. | 514,000 | 3,011,111 | |
| Winteam Pharmaceutical Group Ltd. | 5,132,000 | 4,412,918 | |
| Yuexiu Property Co. Ltd. | 9,374,000 | 2,108,980 | |
| TOTAL HONG KONG | 24,686,256 | ||
| India - 7.8% | |||
| Adani Ports & Special Economic Zone Ltd. | 647,392 | 3,960,153 | |
| Arvind Mills Ltd. | 315,101 | 1,998,550 | |
| CESC Ltd. GDR | 78,139 | 1,243,823 | |
| Deccan Cements Ltd. | 208,246 | 1,661,301 | |
| EIH Ltd. (a) | 745,548 | 1,962,291 | |
| Federal Bank Ltd. | 1,431,618 | 2,108,379 | |
| InterGlobe Aviation Ltd. (c) | 153,130 | 3,224,134 | |
| JK Cement Ltd. | 127,371 | 1,913,332 | |
| LIC Housing Finance Ltd. | 217,310 | 1,779,174 | |
| Manappuram General Finance & Leasing Ltd. | 1,310,688 | 2,398,223 | |
| Oberoi Realty Ltd. | 299,038 | 2,463,727 | |
| Phoenix Mills Ltd. (a) | 210,941 | 1,978,239 | |
| Shriram Transport Finance Co. Ltd. | 84,800 | 2,047,114 | |
| Solar Industries India Ltd. (a) | 67,845 | 1,084,685 | |
| South Indian Bank Ltd. (a) | 2,662,871 | 1,054,380 | |
| The Jammu & Kashmir Bank Ltd. (a) | 430,480 | 367,204 | |
| The Ramco Cements Ltd. | 198,311 | 2,449,964 | |
| Torrent Pharmaceuticals Ltd. | 176,740 | 3,758,365 | |
| Yes Bank Ltd. | 156,948 | 851,135 | |
| TOTAL INDIA | 38,304,173 | ||
| Indonesia - 1.9% | |||
| PT Cikarang Listrindo Tbk (c) | 8,154,600 | 669,031 | |
| PT Holcim Indonesia Tbk (a) | 25,671,900 | 1,474,671 | |
| PT Lippo Karawaci Tbk | 22,109,400 | 706,205 | |
| PT Media Nusantara Citra Tbk | 8,796,900 | 832,244 | |
| PT Pakuwon Jati Tbk | 39,885,500 | 1,685,950 | |
| PT Panin Life Tbk (a) | 49,455,200 | 835,538 | |
| PT Perusahaan Gas Negara Tbk Series B | 2,951,300 | 417,769 | |
| PT Semen Gresik (Persero) Tbk | 3,231,900 | 2,232,225 | |
| PT XL Axiata Tbk (a) | 3,341,200 | 506,410 | |
| TOTAL INDONESIA | 9,360,043 | ||
| Italy - 0.8% | |||
| Prada SpA | 764,300 | 3,877,986 | |
| Korea (South) - 6.7% | |||
| AMOREPACIFIC Group, Inc. | 33,724 | 4,503,146 | |
| BS Financial Group, Inc. | 301,254 | 2,939,612 | |
| Com2uS Corp. | 16,097 | 2,404,949 | |
| Daou Technology, Inc. | 44,357 | 1,000,277 | |
| Dongbu HiTek Co. Ltd. | 133,078 | 1,671,358 | |
| DOUBLEUGAMES Co. Ltd. | 20,760 | 1,211,569 | |
| HB Technology Co. Ltd. | 327,948 | 846,722 | |
| Hyundai Fire & Marine Insurance Co. Ltd. | 42,872 | 1,531,250 | |
| Hyundai HCN | 91,406 | 371,283 | |
| Hyundai Wia Corp. | 42,718 | 2,142,033 | |
| KEPCO Plant Service & Engineering Co. Ltd. | 44,872 | 2,124,341 | |
| Korean Reinsurance Co. | 98,067 | 1,080,552 | |
| Minwise Co. Ltd. | 68,403 | 1,548,916 | |
| NCSOFT Corp. | 3,612 | 1,214,203 | |
| Samjin Pharmaceutical Co. Ltd. | 85,328 | 3,565,542 | |
| Silicon Works Co. Ltd. | 38,896 | 1,363,816 | |
| Tera Semicon Co. Ltd. | 78,085 | 1,443,689 | |
| Toptec Co. Ltd. | 76,550 | 1,904,949 | |
| TOTAL KOREA (SOUTH) | 32,868,207 | ||
| Luxembourg - 1.0% | |||
| Samsonite International SA | 1,132,200 | 5,107,008 | |
| Malaysia - 1.6% | |||
| Matrix Concepts Holdings Bhd | 2,127,700 | 1,092,268 | |
| Top Glove Corp. Bhd | 2,770,100 | 6,690,573 | |
| TOTAL MALAYSIA | 7,782,841 | ||
| Mexico - 1.1% | |||
| Credito Real S.A.B. de CV | 667,000 | 978,635 | |
| Industrias Penoles SA de CV | 169,350 | 3,554,511 | |
| Qualitas Controladora S.A.B. de CV | 388,100 | 1,083,448 | |
| TOTAL MEXICO | 5,616,594 | ||
| Netherlands - 1.3% | |||
| VEON Ltd. sponsored ADR | 123,400 | 339,350 | |
| Yandex NV Series A (a) | 176,444 | 5,886,172 | |
| TOTAL NETHERLANDS | 6,225,522 | ||
| Pakistan - 0.4% | |||
| Habib Bank Ltd. | 687,500 | 1,158,227 | |
| Hub Power Co. Ltd. | 731,500 | 652,318 | |
| TOTAL PAKISTAN | 1,810,545 | ||
| Panama - 0.7% | |||
| Copa Holdings SA Class A | 29,700 | 3,479,949 | |
| Peru - 0.7% | |||
| Compania de Minas Buenaventura SA sponsored ADR | 215,200 | 3,432,440 | |
| Philippines - 1.9% | |||
| International Container Terminal Services, Inc. | 1,012,220 | 1,653,490 | |
| Metro Pacific Investments Corp. | 26,870,300 | 2,646,808 | |
| Metropolitan Bank & Trust Co. | 770,898 | 1,264,557 | |
| Philippine Seven Corp. | 625,700 | 1,539,503 | |
| Pilipinas Shell Petroleum Corp. | 922,340 | 927,975 | |
| Robinsons Land Corp. | 3,270,408 | 1,129,613 | |
| TOTAL PHILIPPINES | 9,161,946 | ||
| Poland - 0.1% | |||
| Asseco Poland SA | 33,900 | 424,975 | |
| Russia - 1.1% | |||
| Bank St. Petersburg PJSC (a) | 1,478,500 | 1,197,404 | |
| LSR Group OJSC | 119,764 | 1,589,943 | |
| PhosAgro OJSC GDR (Reg. S) | 186,100 | 2,683,562 | |
| TOTAL RUSSIA | 5,470,909 | ||
| Singapore - 0.6% | |||
| First Resources Ltd. | 1,851,300 | 2,354,050 | |
| Yoma Strategic Holdings Ltd. | 2,457,700 | 791,719 | |
| TOTAL SINGAPORE | 3,145,769 | ||
| South Africa - 6.2% | |||
| Bidvest Group Ltd. | 248,600 | 4,869,865 | |
| Discovery Ltd. | 58,900 | 817,819 | |
| EOH Holdings Ltd. | 90,500 | 275,081 | |
| Imperial Holdings Ltd. | 309,600 | 5,955,496 | |
| Kumba Iron Ore Ltd. | 86,900 | 1,856,398 | |
| Mr Price Group Ltd. | 175,200 | 3,844,564 | |
| Nampak Ltd. (a) | 932,238 | 1,037,312 | |
| Pick 'n Pay Stores Ltd. | 142,700 | 923,800 | |
| Redefine Properties Ltd. | 2,375,700 | 2,283,081 | |
| Remgro Ltd. | 87,900 | 1,582,519 | |
| Reunert Ltd. | 385,100 | 2,399,177 | |
| Sanlam Ltd. | 219,200 | 1,384,691 | |
| Tiger Brands Ltd. | 103,600 | 3,237,852 | |
| TOTAL SOUTH AFRICA | 30,467,655 | ||
| Sri Lanka - 0.3% | |||
| Dialog Axiata PLC | 7,841,111 | 706,048 | |
| Hatton National Bank PLC | 640,233 | 978,416 | |
| TOTAL SRI LANKA | 1,684,464 | ||
| Taiwan - 6.4% | |||
| Advantech Co. Ltd. | 179,693 | 1,231,407 | |
| Alpha Networks, Inc. | 1,415,000 | 947,523 | |
| Chipbond Technology Corp. | 478,000 | 945,527 | |
| Cleanaway Co. Ltd. | 357,000 | 2,288,661 | |
| CTCI Corp. | 1,449,000 | 2,436,587 | |
| Elite Advanced Laser Corp. | 285,200 | 997,507 | |
| Everlight Electronics Co. Ltd. | 504,000 | 705,110 | |
| FLEXium Interconnect, Inc. | 371,256 | 968,437 | |
| Innolux Corp. | 1,963,000 | 729,190 | |
| Inventec Corp. | 2,245,000 | 1,697,896 | |
| Largan Precision Co. Ltd. | 11,000 | 1,277,125 | |
| Lite-On Technology Corp. | 1,734,220 | 2,284,445 | |
| Powertech Technology, Inc. | 448,000 | 1,280,186 | |
| Radiant Opto-Electronics Corp. | 1,040,000 | 2,142,917 | |
| St.Shine Optical Co. Ltd. | 41,000 | 1,097,277 | |
| Sunrex Technology Corp. | 907,680 | 473,985 | |
| Synnex Technology International Corp. | 1,261,100 | 1,807,985 | |
| TCI Co. Ltd. | 336,851 | 4,933,354 | |
| Tong Hsing Electronics Industries Ltd. | 243,000 | 851,793 | |
| Tripod Technology Corp. | 505,000 | 1,524,867 | |
| Vanguard International Semiconductor Corp. | 360,000 | 728,432 | |
| TOTAL TAIWAN | 31,350,211 | ||
| Thailand - 3.5% | |||
| Beauty Community PCL | 3,724,100 | 2,735,534 | |
| Com7 PCL | 4,216,000 | 2,491,385 | |
| Delta Electronics PCL (For. Reg.) | 319,400 | 679,638 | |
| PTT Global Chemical PCL (For. Reg.) | 1,114,600 | 3,443,700 | |
| Siam Cement PCL (For. Reg.) | 240,600 | 3,557,792 | |
| Star Petroleum Refining PCL | 8,043,400 | 3,988,410 | |
| TOTAL THAILAND | 16,896,459 | ||
| Turkey - 2.6% | |||
| Aksa Akrilik Kimya Sanayii | 1,218,000 | 3,987,937 | |
| Bim Birlesik Magazalar A/S JSC | 108,000 | 1,833,190 | |
| Mavi Jeans Class B (c) | 190,000 | 2,282,563 | |
| Tupras Turkiye Petrol Rafinerileri A/S | 123,828 | 3,155,067 | |
| Turkcell Iletisim Hizmet A/S sponsored ADR | 66,600 | 576,090 | |
| Turkiye Garanti Bankasi A/S | 322,000 | 730,071 | |
| TOTAL TURKEY | 12,564,918 | ||
| United Arab Emirates - 0.5% | |||
| Aldar Properties PJSC | 2,380,226 | 1,360,814 | |
| Emaar Properties PJSC | 737,080 | 1,161,862 | |
| TOTAL UNITED ARAB EMIRATES | 2,522,676 | ||
| United Kingdom - 1.8% | |||
| BGEO Group PLC | 17,640 | 845,118 | |
| NMC Health PLC | 86,800 | 4,263,673 | |
| Samba Financial Group ELS (HSBC Bank Warrant Program) warrants 5/6/20 (a)(c) | 140,000 | 1,084,461 | |
| Shanghai International Airport Co. Ltd. ELS (UBS Warrant Programme) warrants 5/11/18 (a)(c) | 181,300 | 1,415,346 | |
| TBC Bank Group PLC | 48,253 | 1,220,982 | |
| TOTAL UNITED KINGDOM | 8,829,580 | ||
| United States of America - 0.1% | |||
| Net 1 UEPS Technologies, Inc. (a)(b) | 47,100 | 388,104 | |
| Vietnam - 0.1% | |||
| FTP Corp. | 188,588 | 472,226 | |
| TOTAL COMMON STOCKS | |||
| (Cost $377,163,014) | 434,574,181 | ||
| Nonconvertible Preferred Stocks - 3.0% | |||
| Brazil - 1.9% | |||
| Banco ABC Brasil SA | 315,452 | 1,689,278 | |
| Bradespar SA (PN) | 236,600 | 2,401,660 | |
| Companhia Paranaense de Energia-Copel (PN-B) sponsored ADR (b) | 414,560 | 3,179,675 | |
| Metalurgica Gerdau SA (PN) | 1,023,700 | 2,285,149 | |
| TOTAL BRAZIL | 9,555,762 | ||
| Korea (South) - 0.9% | |||
| Hyundai Motor Co. Series 2 | 29,959 | 3,217,111 | |
| Samsung Fire & Marine Insurance Co. Ltd. | 5,958 | 1,020,887 | |
| TOTAL KOREA (SOUTH) | 4,237,998 | ||
| Russia - 0.2% | |||
| Sberbank of Russia | 323,600 | 1,008,326 | |
| TOTAL NONCONVERTIBLE PREFERRED STOCKS | |||
| (Cost $13,424,058) | 14,802,086 | ||
| Principal Amount | Value | ||
| Government Obligations - 0.2% | |||
| United States of America - 0.2% | |||
| U.S. Treasury Bills, yield at date of purchase 1.79% to 1.82% 7/19/18 to 7/26/18 (Cost $936,287)(d) | 940,000 | 936,339 | |
| Shares | Value | ||
| Money Market Funds - 9.0% | |||
| Fidelity Cash Central Fund, 1.74% (e) | 36,007,331 | 36,014,532 | |
| Fidelity Securities Lending Cash Central Fund 1.74% (e)(f) | 7,757,899 | 7,758,675 | |
| TOTAL MONEY MARKET FUNDS | |||
| (Cost $43,772,199) | 43,773,207 | ||
| TOTAL INVESTMENT IN SECURITIES - 101.1% | |||
| (Cost $435,295,558) | 494,085,813 | ||
| NET OTHER ASSETS (LIABILITIES) - (1.1)% | (5,438,720) | ||
| NET ASSETS - 100% | $488,647,093 |
| Futures Contracts | |||||
| Number of contracts | Expiration Date | Notional Amount | Value | Unrealized Appreciation/(Depreciation) | |
| Purchased | |||||
| Equity Index Contracts | |||||
| ICE E-mini MSCI Emerging Markets Index Contracts (United States) | 357 | June 2018 | $20,566,770 | $(419,504) | $(419,504) |
The notional amount of futures purchased as a percentage of Net Assets is 4.2%
Security Type Abbreviations
ELS – Equity-Linked Security
Categorizations in the Schedule of Investments are based on country or territory of incorporation.
Legend
(a) Non-income producing
(b) Security or a portion of the security is on loan at period end.
(c) Security exempt from registration under Rule 144A of the Securities Act of 1933. These securities may be resold in transactions exempt from registration, normally to qualified institutional buyers. At the end of the period, the value of these securities amounted to $14,215,769 or 2.9% of net assets.
(d) Security or a portion of the security was pledged to cover margin requirements for futures contracts. At period end, the value of securities pledged amounted to $926,381.
(e) Affiliated fund that is generally available only to investment companies and other accounts managed by Fidelity Investments. The rate quoted is the annualized seven-day yield of the fund at period end. A complete unaudited listing of the fund's holdings as of its most recent quarter end is available upon request. In addition, each Fidelity Central Fund's financial statements are available on the SEC's website or upon request.
(f) Investment made with cash collateral received from securities on loan.
Affiliated Central Funds
Information regarding fiscal year to date income earned by the Fund from investments in Fidelity Central Funds is as follows:
| Fund | Income earned |
| Fidelity Cash Central Fund | $145,960 |
| Fidelity Securities Lending Cash Central Fund | 84,610 |
| Total | $230,570 |
Amounts in the income column in the above table include any capital gain distributions from underlying funds, which are presented in the corresponding line-item in the Statement of Operations if applicable.
Investment Valuation
The following is a summary of the inputs used, as of April 30, 2018, involving the Fund's assets and liabilities carried at fair value. The inputs or methodology used for valuing securities may not be an indication of the risk associated with investing in those securities. For more information on valuation inputs, and their aggregation into the levels used below, please refer to the Investment Valuation section in the accompanying Notes to Financial Statements.
| Valuation Inputs at Reporting Date: | ||||
| Description | Total | Level 1 | Level 2 | Level 3 |
| Investments in Securities: | ||||
| Equities: | ||||
| Consumer Discretionary | $70,263,973 | $21,399,239 | $48,864,734 | $-- |
| Consumer Staples | 31,382,115 | 9,413,204 | 21,968,911 | -- |
| Energy | 16,514,502 | 9,954,093 | 6,560,409 | -- |
| Financials | 52,858,947 | 29,448,794 | 23,410,153 | -- |
| Health Care | 40,815,402 | 12,194,147 | 28,621,255 | -- |
| Industrials | 55,960,961 | 18,104,590 | 37,856,371 | -- |
| Information Technology | 77,722,637 | 39,384,733 | 38,337,904 | -- |
| Materials | 49,764,556 | 27,601,839 | 22,162,717 | -- |
| Real Estate | 33,963,150 | 10,521,789 | 23,441,361 | -- |
| Telecommunication Services | 2,626,562 | 2,120,152 | 506,410 | -- |
| Utilities | 17,503,462 | 6,434,001 | 11,069,461 | -- |
| Government Obligations | 936,339 | -- | 936,339 | -- |
| Money Market Funds | 43,773,207 | 43,773,207 | -- | -- |
| Total Investments in Securities: | $494,085,813 | $230,349,788 | $263,736,025 | $-- |
| Derivative Instruments: | ||||
| Liabilities | ||||
| Futures Contracts | $(419,504) | $(419,504) | $-- | $-- |
| Total Liabilities | $(419,504) | $(419,504) | $-- | $-- |
| Total Derivative Instruments: | $(419,504) | $(419,504) | $-- | $-- |
The following is a summary of transfers between Level 1 and Level 2 for the period ended April 30, 2018. Transfers are assumed to have occurred at the beginning of the period, and are primarily attributable to the valuation techniques used for foreign equity securities, as discussed in the accompanying Notes to Financial Statements:
| Transfers | Total |
| Level 1 to Level 2 | $179,478,865 |
| Level 2 to Level 1 | $0 |
Value of Derivative Instruments
The following table is a summary of the Fund's value of derivative instruments by primary risk exposure as of April 30, 2018. For additional information on derivative instruments, please refer to the Derivative Instruments section in the accompanying Notes to Financial Statements.
| Primary Risk Exposure / Derivative Type | Value | |
| Asset | Liability | |
| Equity Risk | ||
| Futures Contracts(a) | $0 | $(419,504) |
| Total Equity Risk | 0 | (419,504) |
| Total Value of Derivatives | $0 | $(419,504) |
(a) Reflects gross cumulative appreciation (depreciation) on futures contracts as presented in the Schedule of Investments. In the Statement of Assets and Liabilities, the period end daily variation margin is included in receivable or payable for daily variation margin on futures contracts, and the net cumulative appreciation (depreciation) is included in net unrealized appreciation (depreciation).
See accompanying notes which are an integral part of the financial statements.
Fidelity® Emerging Markets Discovery Fund
Financial Statements
Statement of Assets and Liabilities
| April 30, 2018 (Unaudited) | ||
| Assets | ||
| Investment in securities, at value (including securities loaned of $7,538,037) — See accompanying schedule: Unaffiliated issuers (cost $391,523,359) | $450,312,606 | |
| Fidelity Central Funds (cost $43,772,199) | 43,773,207 | |
| Total Investment in Securities (cost $435,295,558) | $494,085,813 | |
| Foreign currency held at value (cost $1,298,719) | 1,301,663 | |
| Receivable for investments sold | 3,274,837 | |
| Receivable for fund shares sold | 1,940,740 | |
| Dividends receivable | 934,750 | |
| Distributions receivable from Fidelity Central Funds | 58,136 | |
| Prepaid expenses | 157 | |
| Other receivables | 107,959 | |
| Total assets | 501,704,055 | |
| Liabilities | ||
| Payable to custodian bank | $16,422 | |
| Payable for investments purchased | 2,991,856 | |
| Payable for fund shares redeemed | 1,032,956 | |
| Accrued management fee | 342,843 | |
| Distribution and service plan fees payable | 24,301 | |
| Payable for daily variation margin on futures contracts | 166,897 | |
| Other affiliated payables | 95,837 | |
| Other payables and accrued expenses | 627,150 | |
| Collateral on securities loaned | 7,758,700 | |
| Total liabilities | 13,056,962 | |
| Net Assets | $488,647,093 | |
| Net Assets consist of: | ||
| Paid in capital | $426,500,375 | |
| Undistributed net investment income | 2,097,198 | |
| Accumulated undistributed net realized gain (loss) on investments and foreign currency transactions | 2,197,793 | |
| Net unrealized appreciation (depreciation) on investments and assets and liabilities in foreign currencies | 57,851,727 | |
| Net Assets | $488,647,093 | |
| Calculation of Maximum Offering Price | ||
| Class A: | ||
| Net Asset Value and redemption price per share ($22,564,755 ÷ 1,453,058 shares) | $15.53 | |
| Maximum offering price per share (100/94.25 of $15.53) | $16.48 | |
| Class M: | ||
| Net Asset Value and redemption price per share ($12,001,310 ÷ 776,676 shares) | $15.45 | |
| Maximum offering price per share (100/96.50 of $15.45) | $16.01 | |
| Class C: | ||
| Net Asset Value and offering price per share ($17,431,552 ÷ 1,152,043 shares)(a) | $15.13 | |
| Emerging Markets Discovery: | ||
| Net Asset Value, offering price and redemption price per share ($322,770,027 ÷ 20,669,364 shares) | $15.62 | |
| Class I: | ||
| Net Asset Value, offering price and redemption price per share ($113,879,449 ÷ 7,276,841 shares) | $15.65 |
(a) Redemption price per share is equal to net asset value less any applicable contingent deferred sales charge.
See accompanying notes which are an integral part of the financial statements.
Statement of Operations
| Six months ended April 30, 2018 (Unaudited) | ||
| Investment Income | ||
| Dividends | $5,791,288 | |
| Interest | 4,729 | |
| Income from Fidelity Central Funds | 230,570 | |
| Income before foreign taxes withheld | 6,026,587 | |
| Less foreign taxes withheld | (541,895) | |
| Total income | 5,484,692 | |
| Expenses | ||
| Management fee | $1,951,546 | |
| Transfer agent fees | 425,192 | |
| Distribution and service plan fees | 131,761 | |
| Accounting and security lending fees | 121,067 | |
| Custodian fees and expenses | 211,473 | |
| Independent trustees' fees and expenses | 877 | |
| Registration fees | 44,377 | |
| Audit | 36,155 | |
| Legal | 662 | |
| Miscellaneous | 1,180 | |
| Total expenses before reductions | 2,924,290 | |
| Expense reductions | (49,976) | 2,874,314 |
| Net investment income (loss) | 2,610,378 | |
| Realized and Unrealized Gain (Loss) | ||
| Net realized gain (loss) on: | ||
| Investment securities: | ||
| Unaffiliated issuers (net of foreign taxes of $86,391) | 4,877,596 | |
| Fidelity Central Funds | (142) | |
| Foreign currency transactions | (207,446) | |
| Futures contracts | 883,780 | |
| Total net realized gain (loss) | 5,553,788 | |
| Change in net unrealized appreciation (depreciation) on: | ||
| Investment securities: | ||
| Unaffiliated issuers (net of decrease in deferred foreign taxes of $132,329) | 15,650,741 | |
| Fidelity Central Funds | (3) | |
| Assets and liabilities in foreign currencies | (25,688) | |
| Futures contracts | (419,504) | |
| Total change in net unrealized appreciation (depreciation) | 15,205,546 | |
| Net gain (loss) | 20,759,334 | |
| Net increase (decrease) in net assets resulting from operations | $23,369,712 |
See accompanying notes which are an integral part of the financial statements.
Statement of Changes in Net Assets
| Six months ended April 30, 2018 (Unaudited) | Year ended October 31, 2017 | |
| Increase (Decrease) in Net Assets | ||
| Operations | ||
| Net investment income (loss) | $2,610,378 | $2,767,445 |
| Net realized gain (loss) | 5,553,788 | 9,091,626 |
| Change in net unrealized appreciation (depreciation) | 15,205,546 | 38,838,325 |
| Net increase (decrease) in net assets resulting from operations | 23,369,712 | 50,697,396 |
| Distributions to shareholders from net investment income | (3,081,841) | (659,806) |
| Distributions to shareholders from net realized gain | (6,543,392) | (485,420) |
| Total distributions | (9,625,233) | (1,145,226) |
| Share transactions - net increase (decrease) | 89,919,953 | 249,358,868 |
| Redemption fees | 66,641 | 166,495 |
| Total increase (decrease) in net assets | 103,731,073 | 299,077,533 |
| Net Assets | ||
| Beginning of period | 384,916,020 | 85,838,487 |
| End of period | $488,647,093 | $384,916,020 |
| Other Information | ||
| Undistributed net investment income end of period | $2,097,198 | $2,568,661 |
See accompanying notes which are an integral part of the financial statements.
Financial Highlights
Fidelity Emerging Markets Discovery Fund Class A
| Six months ended (Unaudited) April 30, | Years endedOctober 31, | |||||
| 2018 | 2017 | 2016 | 2015 | 2014 | 2013 | |
| Selected Per–Share Data | ||||||
| Net asset value, beginning of period | $15.03 | $12.27 | $10.92 | $12.17 | $12.49 | $11.89 |
| Income from Investment Operations | ||||||
| Net investment income (loss)A | .07 | .14 | .09 | .09B | .04 | .08 |
| Net realized and unrealized gain (loss) | .74 | 2.74 | 1.30 | (1.34) | (.01) | .75 |
| Total from investment operations | .81 | 2.88 | 1.39 | (1.25) | .03 | .83 |
| Distributions from net investment income | (.08) | (.07) | (.05) | – | (.06) | (.04) |
| Distributions from net realized gain | (.23) | (.06) | – | – | (.30) | (.20) |
| Total distributions | (.31) | (.13) | (.05) | – | (.36) | (.25)C |
| Redemption fees added to paid in capitalA | –D | .01 | .01 | –D | .01 | .02 |
| Net asset value, end of period | $15.53 | $15.03 | $12.27 | $10.92 | $12.17 | $12.49 |
| Total ReturnE,F,G | 5.52% | 23.89% | 12.93% | (10.27)% | .31% | 7.20% |
| Ratios to Average Net AssetsH,I | ||||||
| Expenses before reductions | 1.49%J | 1.63% | 1.89% | 1.88% | 1.82% | 1.87% |
| Expenses net of fee waivers, if any | 1.49%J | 1.63% | 1.70% | 1.70% | 1.70% | 1.70% |
| Expenses net of all reductions | 1.47%J | 1.62% | 1.70% | 1.69% | 1.70% | 1.64% |
| Net investment income (loss) | .89%J | 1.03% | .85% | .76%B | .29% | .62% |
| Supplemental Data | ||||||
| Net assets, end of period (000 omitted) | $22,565 | $16,062 | $5,252 | $4,660 | $4,362 | $5,065 |
| Portfolio turnover rateK | 61%J | 58% | 60% | 103% | 148% | 179% |
A Calculated based on average shares outstanding during the period.
B Net Investment income per share reflects a large, non-recurring dividend which amounted to $.06 per share. Excluding this non-recurring dividend, the ratio of net investment income (loss) to average net assets would have been .22%.
C Total distributions of $.25 per share is comprised of distributions from net investment income of $.044 and distributions from net realized gain of $.203 per share.
D Amount represents less than $.005 per share.
E Total returns for periods of less than one year are not annualized.
F Total returns would have been lower if certain expenses had not been reduced during the applicable periods shown.
G Total returns do not include the effect of the sales charges.
H Fees and expenses of any underlying Fidelity Central Funds are not included in the Fund's expense ratio. The Fund indirectly bears its proportionate share of the expenses of any underlying Fidelity Central Funds.
I Expense ratios reflect operating expenses of the class. Expenses before reductions do not reflect amounts reimbursed by the investment adviser or reductions from brokerage service arrangements or reductions from other expense offset arrangements and do not represent the amount paid by the class during periods when reimbursements or reductions occur. Expense ratios before reductions for start-up periods may not be representative of longer-term operating periods. Expenses net of fee waivers reflect expenses after reimbursement by the investment adviser but prior to reductions from brokerage service arrangements or other expense offset arrangements. Expenses net of all reductions represent the net expenses paid by the class.
J Annualized
K Amount does not include the portfolio activity of any underlying Fidelity Central Funds.
See accompanying notes which are an integral part of the financial statements.
Fidelity Emerging Markets Discovery Fund Class M
| Six months ended (Unaudited) April 30, | Years endedOctober 31, | |||||
| 2018 | 2017 | 2016 | 2015 | 2014 | 2013 | |
| Selected Per–Share Data | ||||||
| Net asset value, beginning of period | $14.94 | $12.20 | $10.86 | $12.13 | $12.44 | $11.87 |
| Income from Investment Operations | ||||||
| Net investment income (loss)A | .05 | .10 | .07 | .06B | –C | .05 |
| Net realized and unrealized gain (loss) | .73 | 2.74 | 1.28 | (1.33) | –C | .74 |
| Total from investment operations | .78 | 2.84 | 1.35 | (1.27) | –C | .79 |
| Distributions from net investment income | (.04) | (.04) | (.02) | – | (.02) | (.03) |
| Distributions from net realized gain | (.23) | (.06) | – | – | (.30) | (.20) |
| Total distributions | (.27) | (.11)D | (.02) | – | (.32) | (.24)E |
| Redemption fees added to paid in capitalA | –C | .01 | .01 | –C | .01 | .02 |
| Net asset value, end of period | $15.45 | $14.94 | $12.20 | $10.86 | $12.13 | $12.44 |
| Total ReturnF,G,H | 5.35% | 23.63% | 12.58% | (10.47)% | .05% | 6.87% |
| Ratios to Average Net AssetsI,J | ||||||
| Expenses before reductions | 1.76%K | 1.92% | 2.17% | 2.16% | 2.10% | 2.19% |
| Expenses net of fee waivers, if any | 1.76%K | 1.92% | 1.95% | 1.95% | 1.95% | 1.95% |
| Expenses net of all reductions | 1.74%K | 1.90% | 1.94% | 1.94% | 1.95% | 1.89% |
| Net investment income (loss) | .62%K | .74% | .60% | .51%B | .04% | .37% |
| Supplemental Data | ||||||
| Net assets, end of period (000 omitted) | $12,001 | $9,393 | $2,868 | $2,015 | $2,031 | $1,914 |
| Portfolio turnover rateL | 61%K | 58% | 60% | 103% | 148% | 179% |
A Calculated based on average shares outstanding during the period.
B Net Investment income per share reflects a large, non-recurring dividend which amounted to $.06 per share. Excluding this non-recurring dividend, the ratio of net investment income (loss) to average net assets would have been (.03) %.
C Amount represents less than $.005 per share.
D Total distributions of $.11 per share is comprised of distributions from net investment income of $.044 and distributions from net realized gain of $.064 per share.
E Total distributions of $.24 per share is comprised of distributions from net investment income of $.034 and distributions from net realized gain of $.203 per share.
F Total returns for periods of less than one year are not annualized.
G Total returns would have been lower if certain expenses had not been reduced during the applicable periods shown.
H Total returns do not include the effect of the sales charges.
I Fees and expenses of any underlying Fidelity Central Funds are not included in the Fund's expense ratio. The Fund indirectly bears its proportionate share of the expenses of any underlying Fidelity Central Funds.
J Expense ratios reflect operating expenses of the class. Expenses before reductions do not reflect amounts reimbursed by the investment adviser or reductions from brokerage service arrangements or reductions from other expense offset arrangements and do not represent the amount paid by the class during periods when reimbursements or reductions occur. Expenses net of fee waivers reflect expenses after reimbursement by the investment adviser but prior to reductions from brokerage service arrangements or other expense offset arrangements. Expenses net of all reductions represent the net expenses paid by the class.
K Annualized
L Amount does not include the portfolio activity of any underlying Fidelity Central Funds.
See accompanying notes which are an integral part of the financial statements.
Fidelity Emerging Markets Discovery Fund Class C
| Six months ended (Unaudited) April 30, | Years endedOctober 31, | |||||
| 2018 | 2017 | 2016 | 2015 | 2014 | 2013 | |
| Selected Per–Share Data | ||||||
| Net asset value, beginning of period | $14.64 | $11.97 | $10.69 | $12.00 | $12.35 | $11.82 |
| Income from Investment Operations | ||||||
| Net investment income (loss)A | .01 | .04 | .01 | –B,C | (.06) | (.02) |
| Net realized and unrealized gain (loss) | .73 | 2.69 | 1.26 | (1.31) | –C | .74 |
| Total from investment operations | .74 | 2.73 | 1.27 | (1.31) | (.06) | .72 |
| Distributions from net investment income | (.02) | (.01) | – | – | – | (.01) |
| Distributions from net realized gain | (.23) | (.06) | – | – | (.30) | (.20) |
| Total distributions | (.25) | (.07) | – | – | (.30) | (.21) |
| Redemption fees added to paid in capitalA | –C | .01 | .01 | –C | .01 | .02 |
| Net asset value, end of period | $15.13 | $14.64 | $11.97 | $10.69 | $12.00 | $12.35 |
| Total ReturnD,E,F | 5.15% | 23.02% | 11.97% | (10.92)% | (.42)% | 6.32% |
| Ratios to Average Net AssetsG,H | ||||||
| Expenses before reductions | 2.24%I | 2.38% | 2.63% | 2.64% | 2.58% | 2.70% |
| Expenses net of fee waivers, if any | 2.24%I | 2.38% | 2.45% | 2.45% | 2.45% | 2.45% |
| Expenses net of all reductions | 2.22%I | 2.37% | 2.44% | 2.44% | 2.45% | 2.39% |
| Net investment income (loss) | .14%I | .28% | .10% | .01%B | (.46)% | (.13)% |
| Supplemental Data | ||||||
| Net assets, end of period (000 omitted) | $17,432 | $14,168 | $2,203 | $1,675 | $1,750 | $2,082 |
| Portfolio turnover rateJ | 61%I | 58% | 60% | 103% | 148% | 179% |
A Calculated based on average shares outstanding during the period.
B Net Investment income per share reflects a large, non-recurring dividend which amounted to $.06 per share. Excluding this non-recurring dividend, the ratio of net investment income (loss) to average net assets would have been (.52) %.
C Amount represents less than $.005 per share.
D Total returns for periods of less than one year are not annualized.
E Total returns would have been lower if certain expenses had not been reduced during the applicable periods shown.
F Total returns do not include the effect of the contingent deferred sales charge.
G Fees and expenses of any underlying Fidelity Central Funds are not included in the Fund's expense ratio. The Fund indirectly bears its proportionate share of the expenses of any underlying Fidelity Central Funds.
H Expense ratios reflect operating expenses of the class. Expenses before reductions do not reflect amounts reimbursed by the investment adviser or reductions from brokerage service arrangements or reductions from other expense offset arrangements and do not represent the amount paid by the class during periods when reimbursements or reductions occur. Expenses net of fee waivers reflect expenses after reimbursement by the investment adviser but prior to reductions from brokerage service arrangements or other expense offset arrangements. Expenses net of all reductions represent the net expenses paid by the class.
I Annualized
J Amount does not include the portfolio activity of any underlying Fidelity Central Funds.
See accompanying notes which are an integral part of the financial statements.
Fidelity Emerging Markets Discovery Fund
| Six months ended (Unaudited) April 30, | Years endedOctober 31, | |||||
| 2018 | 2017 | 2016 | 2015 | 2014 | 2013 | |
| Selected Per–Share Data | ||||||
| Net asset value, beginning of period | $15.12 | $12.33 | $10.98 | $12.21 | $12.52 | $11.92 |
| Income from Investment Operations | ||||||
| Net investment income (loss)A | .09 | .18 | .12 | .12B | .07 | .11 |
| Net realized and unrealized gain (loss) | .75 | 2.76 | 1.31 | (1.35) | –C | .74 |
| Total from investment operations | .84 | 2.94 | 1.43 | (1.23) | .07 | .85 |
| Distributions from net investment income | (.11) | (.09) | (.09) | – | (.09) | (.07) |
| Distributions from net realized gain | (.23) | (.06) | – | – | (.30) | (.20) |
| Total distributions | (.34) | (.16)D | (.09) | – | (.39) | (.27) |
| Redemption fees added to paid in capitalA | –C | .01 | .01 | –C | .01 | .02 |
| Net asset value, end of period | $15.62 | $15.12 | $12.33 | $10.98 | $12.21 | $12.52 |
| Total ReturnE,F | 5.72% | 24.30% | 13.19% | (10.07)% | .61% | 7.37% |
| Ratios to Average Net AssetsG,H | ||||||
| Expenses before reductions | 1.20%I | 1.35% | 1.55% | 1.56% | 1.48% | 1.57% |
| Expenses net of fee waivers, if any | 1.20%I | 1.35% | 1.45% | 1.45% | 1.45% | 1.45% |
| Expenses net of all reductions | 1.18%I | 1.34% | 1.44% | 1.44% | 1.45% | 1.39% |
| Net investment income (loss) | 1.19%I | 1.31% | 1.10% | 1.01%B | .54% | .87% |
| Supplemental Data | ||||||
| Net assets, end of period (000 omitted) | $322,770 | $248,124 | $67,178 | $61,601 | $78,377 | $96,731 |
| Portfolio turnover rateJ | 61%I | 58% | 60% | 103% | 148% | 179% |
A Calculated based on average shares outstanding during the period.
B Net Investment income per share reflects a large, non-recurring dividend which amounted to $.06 per share. Excluding this non-recurring dividend, the ratio of net investment income (loss) to average net assets would have been .48%.
C Amount represents less than $.005 per share.
D Total distributions of $.16 per share is comprised of distributions from net investment income of $.091 and distributions from net realized gain of $.064 per share.
E Total returns for periods of less than one year are not annualized.
F Total returns would have been lower if certain expenses had not been reduced during the applicable periods shown.
G Fees and expenses of any underlying Fidelity Central Funds are not included in the Fund's expense ratio. The Fund indirectly bears its proportionate share of the expenses of any underlying Fidelity Central Funds.
H Expense ratios reflect operating expenses of the class. Expenses before reductions do not reflect amounts reimbursed by the investment adviser or reductions from brokerage service arrangements or reductions from other expense offset arrangements and do not represent the amount paid by the class during periods when reimbursements or reductions occur. Expenses net of fee waivers reflect expenses after reimbursement by the investment adviser but prior to reductions from brokerage service arrangements or other expense offset arrangements. Expenses net of all reductions represent the net expenses paid by the class.
I Annualized
J Amount does not include the portfolio activity of any underlying Fidelity Central Funds.
See accompanying notes which are an integral part of the financial statements.
Fidelity Emerging Markets Discovery Fund Class I
| Six months ended (Unaudited) April 30, | Years endedOctober 31, | |||||
| 2018 | 2017 | 2016 | 2015 | 2014 | 2013 | |
| Selected Per–Share Data | ||||||
| Net asset value, beginning of period | $15.15 | $12.37 | $11.02 | $12.25 | $12.53 | $11.92 |
| Income from Investment Operations | ||||||
| Net investment income (loss)A | .09 | .19 | .13 | .12B | .07 | .11 |
| Net realized and unrealized gain (loss) | .76 | 2.75 | 1.30 | (1.35) | –C | .75 |
| Total from investment operations | .85 | 2.94 | 1.43 | (1.23) | .07 | .86 |
| Distributions from net investment income | (.12) | (.10) | (.09) | – | (.06) | (.07) |
| Distributions from net realized gain | (.23) | (.06) | – | – | (.30) | (.20) |
| Total distributions | (.35) | (.17)D | (.09) | – | (.36) | (.27) |
| Redemption fees added to paid in capitalA | –C | .01 | .01 | –C | .01 | .02 |
| Net asset value, end of period | $15.65 | $15.15 | $12.37 | $11.02 | $12.25 | $12.53 |
| Total ReturnE,F | 5.72% | 24.25% | 13.16% | (10.04)% | .61% | 7.45% |
| Ratios to Average Net AssetsG,H | ||||||
| Expenses before reductions | 1.20%I | 1.32% | 1.59% | 1.54% | 1.56% | 1.60% |
| Expenses net of fee waivers, if any | 1.20%I | 1.32% | 1.45% | 1.45% | 1.45% | 1.45% |
| Expenses net of all reductions | 1.18%I | 1.30% | 1.44% | 1.43% | 1.45% | 1.39% |
| Net investment income (loss) | 1.18%I | 1.34% | 1.10% | 1.01%B | .54% | .87% |
| Supplemental Data | ||||||
| Net assets, end of period (000 omitted) | $113,879 | $97,170 | $8,337 | $1,410 | $481 | $1,076 |
| Portfolio turnover rateJ | 61%I | 58% | 60% | 103% | 148% | 179% |
A Calculated based on average shares outstanding during the period.
B Net Investment income per share reflects a large, non-recurring dividend which amounted to $.06 per share. Excluding this non-recurring dividend, the ratio of net investment income (loss) to average net assets would have been .48%.
C Amount represents less than $.005 per share.
D Total distributions of $.17 per share is comprised of distributions from net investment income of $.101 and distributions from net realized gain of $.064 per share.
E Total returns for periods of less than one year are not annualized.
F Total returns would have been lower if certain expenses had not been reduced during the applicable periods shown.
G Fees and expenses of any underlying Fidelity Central Funds are not included in the Fund's expense ratio. The Fund indirectly bears its proportionate share of the expenses of any underlying Fidelity Central Funds.
H Expense ratios reflect operating expenses of the class. Expenses before reductions do not reflect amounts reimbursed by the investment adviser or reductions from brokerage service arrangements or reductions from other expense offset arrangements and do not represent the amount paid by the class during periods when reimbursements or reductions occur. Expenses net of fee waivers reflect expenses after reimbursement by the investment adviser but prior to reductions from brokerage service arrangements or other expense offset arrangements. Expenses net of all reductions represent the net expenses paid by the class.
I Annualized
J Amount does not include the portfolio activity of any underlying Fidelity Central Funds.
See accompanying notes which are an integral part of the financial statements.
Notes to Financial Statements (Unaudited)
For the period ended April 30, 2018
1. Organization.
Fidelity Emerging Markets Discovery Fund (the Fund) is a fund of Fidelity Investment Trust (the Trust) and is authorized to issue an unlimited number of shares. The Trust is registered under the Investment Company Act of 1940, as amended (the 1940 Act), as an open-end management investment company organized as a Massachusetts business trust. The Fund offers Class A, Class M, Class C, Emerging Markets Discovery, and Class I shares, each of which has equal rights as to assets and voting privileges. Each class has exclusive voting rights with respect to matters that affect that class. The Fund's investments in emerging markets can be subject to social, economic, regulatory, and political uncertainties and can be extremely volatile.
2. Investments in Fidelity Central Funds.
The Fund invests in Fidelity Central Funds, which are open-end investment companies generally available only to other investment companies and accounts managed by the investment adviser and its affiliates. The Fund's Schedule of Investments lists each of the Fidelity Central Funds held as of period end, if any, as an investment of the Fund, but does not include the underlying holdings of each Fidelity Central Fund. As an Investing Fund, the Fund indirectly bears its proportionate share of the expenses of the underlying Fidelity Central Funds.
The Money Market Central Funds seek preservation of capital and current income and are managed by Fidelity Investments Money Management, Inc. (FIMM), an affiliate of the investment adviser. Annualized expenses of the Money Market Central Funds as of their most recent shareholder report date are less than .005%.
A complete unaudited list of holdings for each Fidelity Central Fund is available upon request or at the Securities and Exchange Commission (the SEC) website at www.sec.gov. In addition, the financial statements of the Fidelity Central Funds are available on the SEC website or upon request.
3. Significant Accounting Policies.
The Fund is an investment company and applies the accounting and reporting guidance of the Financial Accounting Standards Board (FASB) Accounting Standards Codification Topic 946 Financial Services – Investments Companies. The financial statements have been prepared in conformity with accounting principles generally accepted in the United States of America (GAAP), which require management to make certain estimates and assumptions at the date of the financial statements. Actual results could differ from those estimates. Subsequent events, if any, through the date that the financial statements were issued have been evaluated in the preparation of the financial statements. The following summarizes the significant accounting policies of the Fund:
Investment Valuation. Investments are valued as of 4:00 p.m. Eastern time on the last calendar day of the period. The Board of Trustees (the Board) has delegated the day to day responsibility for the valuation of the Fund's investments to the Fair Value Committee (the Committee) established by the Fund's investment adviser. In accordance with valuation policies and procedures approved by the Board, the Fund attempts to obtain prices from one or more third party pricing vendors or brokers to value its investments. When current market prices, quotations or currency exchange rates are not readily available or reliable, investments will be fair valued in good faith by the Committee, in accordance with procedures adopted by the Board. Factors used in determining fair value vary by investment type and may include market or investment specific events, changes in interest rates and credit quality. The frequency with which these procedures are used cannot be predicted and they may be utilized to a significant extent. The Committee oversees the Fund's valuation policies and procedures and reports to the Board on the Committee's activities and fair value determinations. The Board monitors the appropriateness of the procedures used in valuing the Fund's investments and ratifies the fair value determinations of the Committee.
The Fund categorizes the inputs to valuation techniques used to value its investments into a disclosure hierarchy consisting of three levels as shown below:
- Level 1 – quoted prices in active markets for identical investments
- Level 2 – other significant observable inputs (including quoted prices for similar investments, interest rates, prepayment speeds, etc.)
- Level 3 – unobservable inputs (including the Fund's own assumptions based on the best information available)
Valuation techniques used to value the Fund's investments by major category are as follows:
Equity securities, including restricted securities, for which market quotations are readily available, are valued at the last reported sale price or official closing price as reported by a third party pricing vendor on the primary market or exchange on which they are traded and are categorized as Level 1 in the hierarchy. In the event there were no sales during the day or closing prices are not available, securities are valued at the last quoted bid price or may be valued using the last available price and are generally categorized as Level 2 in the hierarchy. For foreign equity securities, when market or security specific events arise, comparisons to the valuation of American Depositary Receipts (ADRs), futures contracts, Exchange-Traded Funds (ETFs) and certain indexes as well as quoted prices for similar securities may be used and would be categorized as Level 2 in the hierarchy. Utilizing these techniques may result in transfers between Level 1 and Level 2. For equity securities, including restricted securities, where observable inputs are limited, assumptions about market activity and risk are used and these securities may be categorized as Level 3 in the hierarchy.
Debt securities, including restricted securities, are valued based on evaluated prices received from third party pricing vendors or from brokers who make markets in such securities. U.S. government and government agency obligations are valued by pricing vendors who utilize matrix pricing which considers yield or price of bonds of comparable quality, coupon, maturity and type or by broker-supplied prices. When independent prices are unavailable or unreliable, debt securities may be valued utilizing pricing methodologies which consider similar factors that would be used by third party pricing vendors. Debt securities are generally categorized as Level 2 in the hierarchy but may be Level 3 depending on the circumstances.
Futures contracts are valued at the settlement price established each day by the board of trade or exchange on which they are traded and are categorized as Level 1 in the hierarchy.
Investments in open-end mutual funds, including the Fidelity Central Funds, are valued at their closing net asset value (NAV) each business day and are categorized as Level 1 in the hierarchy.
Changes in valuation techniques may result in transfers in or out of an assigned level within the disclosure hierarchy. The aggregate value of investments by input level as of April 30, 2018, including information on transfers between Levels 1 and 2, is included at the end of the Fund's Schedule of Investments.
Foreign Currency. The Fund may use foreign currency contracts to facilitate transactions in foreign-denominated securities. Gains and losses from these transactions may arise from changes in the value of the foreign currency or if the counterparties do not perform under the contracts' terms.
Foreign-denominated assets, including investment securities, and liabilities are translated into U.S. dollars at the exchange rates at period end. Purchases and sales of investment securities, income and dividends received and expenses denominated in foreign currencies are translated into U.S. dollars at the exchange rate in effect on the transaction date.
The effects of exchange rate fluctuations on investments are included with the net realized and unrealized gain (loss) on investment securities. Other foreign currency transactions resulting in realized and unrealized gain (loss) are disclosed separately.
Investment Transactions and Income. For financial reporting purposes, the Fund's investment holdings and NAV include trades executed through the end of the last business day of the period. The NAV per share for processing shareholder transactions is calculated as of the close of business of the New York Stock Exchange (NYSE), normally 4:00 p.m. Eastern time and includes trades executed through the end of the prior business day. Gains and losses on securities sold are determined on the basis of identified cost. Dividend income is recorded on the ex-dividend date, except for certain dividends from foreign securities where the ex-dividend date may have passed, which are recorded as soon as the Fund is informed of the ex-dividend date. Non-cash dividends included in dividend income, if any, are recorded at the fair market value of the securities received. Income and capital gain distributions from Fidelity Central Funds, if any, are recorded on the ex-dividend date. Certain distributions received by the Fund represent a return of capital or capital gain. The Fund determines the components of these distributions subsequent to the ex-dividend date, based upon receipt of tax filings or other correspondence relating to the underlying investment. These distributions are recorded as a reduction of cost of investments and/or as a realized gain. Interest income is accrued as earned and includes coupon interest and amortization of premium and accretion of discount on debt securities as applicable. Investment income is recorded net of foreign taxes withheld where recovery of such taxes is uncertain.
Class Allocations and Expenses. Investment income, realized and unrealized capital gains and losses, common expenses of the Fund, and certain fund-level expense reductions, if any, are allocated daily on a pro-rata basis to each class based on the relative net assets of each class to the total net assets of the Fund. Each class differs with respect to transfer agent and distribution and service plan fees incurred. Certain expense reductions may also differ by class. For the reporting period, the allocated portion of income and expenses to each class as a percent of its average net assets may vary due to the timing of recording these transactions in relation to fluctuating net assets of the classes. Expenses directly attributable to a fund are charged to that fund. Expenses attributable to more than one fund are allocated among the respective funds on the basis of relative net assets or other appropriate methods. Expense estimates are accrued in the period to which they relate and adjustments are made when actual amounts are known.
Income Tax Information and Distributions to Shareholders. Each year, the Fund intends to qualify as a regulated investment company under Subchapter M of the Internal Revenue Code, including distributing substantially all of its taxable income and realized gains. As a result, no provision for U.S. Federal income taxes is required. The Fund files a U.S. federal tax return, in addition to state and local tax returns as required. The Fund's federal income tax returns are subject to examination by the Internal Revenue Service (IRS) for a period of three fiscal years after they are filed. State and local tax returns may be subject to examination for an additional fiscal year depending on the jurisdiction. Foreign taxes are provided for based on the Fund's understanding of the tax rules and rates that exist in the foreign markets in which it invests. The Fund is subject to a tax imposed on capital gains by certain countries in which it invests. An estimated deferred tax liability for net unrealized appreciation on the applicable securities is included in Other payables and accrued expenses on the Statement of Assets & Liabilities.
Distributions are declared and recorded on the ex-dividend date. Income and capital gain distributions are declared separately for each class. Income and capital gain distributions are determined in accordance with income tax regulations, which may differ from GAAP.
Capital accounts within the financial statements are adjusted for permanent book-tax differences. These adjustments have no impact on net assets or the results of operations. Capital accounts are not adjusted for temporary book-tax differences which will reverse in a subsequent period.
Book-tax differences are primarily due to foreign currency transactions, futures contracts, certain foreign taxes, passive foreign investment companies (PFIC), market discount, capital loss carryforwards and losses deferred due to wash sales.
As of period end, the cost and unrealized appreciation (depreciation) in securities, and derivatives if applicable, for federal income tax purposes were as follows:
| Gross unrealized appreciation | $75,304,663 |
| Gross unrealized depreciation | (20,103,814) |
| Net unrealized appreciation (depreciation) | $55,200,849 |
| Tax cost | $438,465,460 |
Short-Term Trading (Redemption) Fees. Shares held by investors in the Fund less than 90 days may have been subject to a redemption fee equal to 2.00% of the NAV of shares redeemed. All redemption fees, which reduce the proceeds of the shareholder redemption, are retained by the Fund and accounted for as an addition to paid in capital. In November 2017, the Board of Trustees approved the elimination of these redemption fees effective December 18, 2017.
Restricted Securities. The Fund may invest in securities that are subject to legal or contractual restrictions on resale. These securities generally may be resold in transactions exempt from registration or to the public if the securities are registered. Disposal of these securities may involve time-consuming negotiations and expense, and prompt sale at an acceptable price may be difficult. Information regarding restricted securities is included at the end of the Fund's Schedule of Investments.
4. Derivative Instruments.
Risk Exposures and the Use of Derivative Instruments. The Fund's investment objective allows the Fund to enter into various types of derivative contracts, including futures contracts. Derivatives are investments whose value is primarily derived from underlying assets, indices or reference rates and may be transacted on an exchange or over-the-counter (OTC). Derivatives may involve a future commitment to buy or sell a specified asset based on specified terms, to exchange future cash flows at periodic intervals based on a notional principal amount, or for one party to make one or more payments upon the occurrence of specified events in exchange for periodic payments from the other party.
The Fund used derivatives to increase returns and to manage exposure to certain risks as defined below. The success of any strategy involving derivatives depends on analysis of numerous economic factors, and if the strategies for investment do not work as intended, the Fund may not achieve its objectives.
The Fund's use of derivatives increased or decreased its exposure to the following risk:
| Equity Risk | Equity risk relates to the fluctuations in the value of financial instruments as a result of changes in market prices (other than those arising from interest rate risk or foreign exchange risk), whether caused by factors specific to an individual investment, its issuer, or all factors affecting all instruments traded in a market or market segment. |
The Fund is also exposed to additional risks from investing in derivatives, such as liquidity risk and counterparty credit risk. Liquidity risk is the risk that the Fund will be unable to close out the derivative in the open market in a timely manner. Counterparty credit risk is the risk that the counterparty will not be able to fulfill its obligation to the Fund. Counterparty credit risk related to exchange-traded futures contracts may be mitigated by the protection provided by the exchange on which they trade.
Investing in derivatives may involve greater risks than investing in the underlying assets directly and, to varying degrees, may involve risk of loss in excess of any initial investment and collateral received and amounts recognized in the Statement of Assets and Liabilities. In addition, there may be the risk that the change in value of the derivative contract does not correspond to the change in value of the underlying instrument.
Futures Contracts. A futures contract is an agreement between two parties to buy or sell a specified underlying instrument for a fixed price at a specified future date. The Fund used futures contracts to manage its exposure to the stock market.
Upon entering into a futures contract, a fund is required to deposit either cash or securities (initial margin) with a clearing broker in an amount equal to a certain percentage of the face value of the contract. Futures contracts are marked-to-market daily and subsequent daily payments (variation margin) are made or received by a fund depending on the daily fluctuations in the value of the futures contracts and are recorded as unrealized appreciation or (depreciation). This receivable and/or payable, if any, is included in daily variation margin on futures contracts in the Statement of Assets and Liabilities. Realized gain or (loss) is recorded upon the expiration or closing of a futures contract. The net realized gain (loss) and change in net unrealized appreciation (depreciation) on futures contracts during the period is presented in the Statement of Operations.
Any open futures contracts at period end are presented in the Schedule of Investments under the caption "Futures Contracts". The notional amount at value reflects each contract's exposure to the underlying instrument or index at period end and is representative of volume of activity during the period. Securities deposited to meet initial margin requirements are identified in the Schedule of Investments.
5. Purchases and Sales of Investments.
Purchases and sales of securities, other than short-term securities, aggregated $185,366,920 and $133,961,938, respectively.
6. Fees and Other Transactions with Affiliates.
Management Fee. Fidelity Management & Research Company (the investment adviser) and its affiliates provide the Fund with investment management related services for which the Fund pays a monthly management fee. The management fee is the sum of an individual fund fee rate that is based on an annual rate of .60% of the Fund's average net assets and an annualized group fee rate that averaged .24% during the period. The group fee rate is based upon the average net assets of all the mutual funds advised by the investment adviser, including any mutual funds previously advised by the investment adviser that are currently advised by Fidelity SelectCo, LLC, an affiliate of the investment adviser. The group fee rate decreases as assets under management increase and increases as assets under management decrease. For the reporting period, the total annualized management fee rate was .84% of the Fund's average net assets.
Distribution and Service Plan Fees. In accordance with Rule 12b-1 of the 1940 Act, the Fund has adopted separate Distribution and Service Plans for each class of shares. Certain classes pay Fidelity Distributors Corporation (FDC), an affiliate of the investment adviser, separate Distribution and Service Fees, each of which is based on an annual percentage of each class' average net assets. In addition, FDC may pay financial intermediaries for selling shares of the Fund and providing shareholder support services. For the period, the Distribution and Service Fee rates, total fees and amounts retained by FDC were as follows:
| Distribution Fee | Service Fee | Total Fees | Retained by FDC | |
| Class A | -% | .25% | $24,011 | $2,062 |
| Class M | .25% | .25% | 27,010 | 210 |
| Class C | .75% | .25% | 80,740 | 31,635 |
| $131,761 | $33,907 |
Sales Load. FDC may receive a front-end sales charge of up to 5.75% for selling Class A shares and 3.50% for selling Class M shares, some of which is paid to financial intermediaries for selling shares of the Fund. Depending on the holding period, FDC may receive contingent deferred sales charges levied on Class A, Class M and Class C redemptions. The deferred sales charges are 1.00% for Class C shares, 1.00% for certain purchases of Class A shares and .25% for certain purchases of Class M shares.
For the period, sales charge amounts retained by FDC were as follows:
| Retained by FDC | |
| Class A | $24,541 |
| Class M | 3,114 |
| Class C(a) | 2,571 |
| $30,226 |
(a) When Class C shares are initially sold, FDC pays commissions from its own resources to financial intermediaries through which the sales are made.
Transfer Agent Fees. Fidelity Investments Institutional Operations Company, Inc., (FIIOC), an affiliate of the investment adviser, is the transfer, dividend disbursing and shareholder servicing agent for each class of the Fund. FIIOC receives account fees and asset-based fees that vary according to the account size and type of account of the shareholders of the respective classes of the Fund. FIIOC pays for typesetting, printing and mailing of shareholder reports, except proxy statements.
For the period, transfer agent fees for each class were as follows:
| Amount | % of Class-Level Average Net Assets(a) | |
| Class A | $21,208 | .22 |
| Class M | 13,159 | .24 |
| Class C | 18,022 | .22 |
| Emerging Markets Discovery | 277,252 | .18 |
| Class I | 95,551 | .18 |
| $425,192 |
(a) Annualized
Accounting and Security Lending Fees. Fidelity Service Company, Inc. (FSC), an affiliate of the investment adviser, maintains the Fund's accounting records. The accounting fee is based on the level of average net assets for each month. Under a separate contract, FSC administers the security lending program. The security lending fee is based on the number and duration of lending transactions. For the period, the fees were equivalent to an annualized rate of .05%.
Brokerage Commissions. The Fund placed a portion of its portfolio transactions with brokerage firms which are affiliates of the investment adviser. Brokerage commissions are included in net realized gain (loss) and change in net unrealized appreciation (depreciation) in the Statement of Operations. The commissions paid to these affiliated firms were $416 for the period.
Interfund Trades. The Fund may purchase from or sell securities to other Fidelity Funds under procedures adopted by the Board. The procedures have been designed to ensure these interfund trades are executed in accordance with Rule 17a-7 of the 1940 Act. Interfund trades are included within the respective purchases and sales amounts shown in the Purchases and Sales of Investments note.
7. Committed Line of Credit.
The Fund participates with other funds managed by the investment adviser or an affiliate in a $4.25 billion credit facility (the "line of credit") to be utilized for temporary or emergency purposes to fund shareholder redemptions or for other short-term liquidity purposes. The Fund has agreed to pay commitment fees on its pro-rata portion of the line of credit, which amounted to $630 and is reflected in Miscellaneous expenses on the Statement of Operations. During the period, the Fund did not borrow on this line of credit.
8. Security Lending.
The Fund lends portfolio securities through a lending agent from time to time in order to earn additional income. For equity securities, a lending agent is used and may loan securities to certain qualified borrowers, including Fidelity Capital Markets (FCM), a broker-dealer affiliated with the Fund. On the settlement date of the loan, the Fund receives collateral (in the form of U.S. Treasury obligations, letters of credit and/or cash) against the loaned securities and maintains collateral in an amount not less than 100% of the market value of the loaned securities during the period of the loan. The market value of the loaned securities is determined at the close of business of the Fund and any additional required collateral is delivered to the Fund on the next business day. The Fund or borrower may terminate the loan at any time, and if the borrower defaults on its obligation to return the securities loaned because of insolvency or other reasons, the Fund may apply collateral received from the borrower against the obligation. The Fund may experience delays and costs in recovering the securities loaned. Any cash collateral received is invested in the Fidelity Securities Lending Cash Central Fund. The value of loaned securities and cash collateral at period end are disclosed on the Fund's Statement of Assets and Liabilities. At period end, there were no security loans outstanding with FCM. Security lending income represents the income earned on investing cash collateral, less rebates paid to borrowers and any lending agent fees associated with the loan, plus any premium payments received for lending certain types of securities. Security lending income is presented in the Statement of Operations as a component of income from Fidelity Central Funds. Total security lending income during the period amounted to $84,610. During the period, there were no securities loaned to FCM.
9. Expense Reductions.
Commissions paid to certain brokers with whom the investment adviser, or its affiliates, places trades on behalf of the Fund include an amount in addition to trade execution, which may be rebated back to the Fund to offset certain expenses. This amount totaled $47,822 for the period.
In addition, during the period the investment adviser reimbursed and/or waived a portion of fund-level operating expenses in the amount of $2,154.
10. Distributions to Shareholders.
Distributions to shareholders of each class were as follows:
| Six months ended April 30, 2018 | Year ended October 31, 2017 | |
| From net investment income | ||
| Class A | $92,921 | $29,900 |
| Class M | 27,822 | 10,789 |
| Class C | 20,272 | 1,070 |
| Emerging Markets Discovery | 2,195,902 | 534,294 |
| Class I | 744,924 | 83,753 |
| Total | $3,081,841 | $659,806 |
| From net realized gain | ||
| Class A | $259,988 | $29,370 |
| Class M | 145,433 | 15,653 |
| Class C | 230,640 | 12,406 |
| Emerging Markets Discovery | 4,430,326 | 375,874 |
| Class I | 1,477,005 | 52,117 |
| Total | $6,543,392 | $485,420 |
11. Share Transactions.
Share transactions for each class were as follows and may contain automatic conversions between classes or exchanges between affiliated funds:
| Shares | Shares | Dollars | Dollars | |
| Six months ended April 30, 2018 | Year ended October 31, 2017 | Six months ended April 30, 2018 | Year ended October 31, 2017 | |
| Class A | ||||
| Shares sold | 528,719 | 938,873 | $8,259,782 | $12,644,829 |
| Reinvestment of distributions | 23,808 | 4,936 | 349,501 | 55,853 |
| Shares redeemed | (168,405) | (303,068) | (2,599,328) | (4,070,793) |
| Net increase (decrease) | 384,122 | 640,741 | $6,009,955 | $8,629,889 |
| Class M | ||||
| Shares sold | 172,925 | 451,879 | $2,753,615 | $5,910,208 |
| Reinvestment of distributions | 11,842 | 2,312 | 173,255 | 26,067 |
| Shares redeemed | (36,980) | (60,393) | (575,283) | (796,878) |
| Net increase (decrease) | 147,787 | 393,798 | $2,351,587 | $5,139,397 |
| Class C | ||||
| Shares sold | 237,730 | 856,704 | $3,636,449 | $11,379,958 |
| Reinvestment of distributions | 17,447 | 1,203 | 250,359 | 13,340 |
| Shares redeemed | (70,835) | (74,143) | (1,082,998) | (999,641) |
| Net increase (decrease) | 184,342 | 783,764 | $2,803,810 | $10,393,657 |
| Emerging Markets Discovery | ||||
| Shares sold | 8,529,995 | 14,972,932 | $132,775,274 | $202,173,147 |
| Reinvestment of distributions | 427,373 | 74,929 | 6,303,758 | 850,905 |
| Shares redeemed | (4,700,390) | (4,082,672) | (73,819,563) | (56,381,917) |
| Net increase (decrease) | 4,256,978 | 10,965,189 | $65,259,469 | $146,642,135 |
| Class I | ||||
| Shares sold | 1,639,474 | 6,604,470 | $25,756,533 | $89,627,624 |
| Reinvestment of distributions | 148,725 | 11,894 | 2,198,156 | 135,413 |
| Shares redeemed | (924,178) | (877,747) | (14,459,557) | (11,209,247) |
| Net increase (decrease) | 864,021 | 5,738,617 | $13,495,132 | $78,553,790 |
12. Other.
The Fund's organizational documents provide former and current trustees and officers with a limited indemnification against liabilities arising in connection with the performance of their duties to the Fund. In the normal course of business, the Fund may also enter into contracts that provide general indemnifications. The Fund's maximum exposure under these arrangements is unknown as this would be dependent on future claims that may be made against the Fund. The risk of material loss from such claims is considered remote.
Fidelity® Total Emerging Markets Fund
Investment Summary (Unaudited)
Top Five Stocks as of April 30, 2018
| % of fund's net assets | |
| Tencent Holdings Ltd. (Cayman Islands, Internet Software & Services) | 4.7 |
| Alibaba Group Holding Ltd. sponsored ADR (Cayman Islands, Internet Software & Services) | 3.0 |
| Taiwan Semiconductor Manufacturing Co. Ltd. (Taiwan, Semiconductors & Semiconductor Equipment) | 2.2 |
| Naspers Ltd. Class N (South Africa, Media) | 2.2 |
| Industrial & Commercial Bank of China Ltd. (H Shares) (China, Banks) | 2.0 |
| 14.1 |
Top Five Market Sectors as of April 30, 2018
| % of fund's net assets | |
| Financials | 18.5 |
| Information Technology | 16.7 |
| Consumer Discretionary | 11.2 |
| Energy | 8.3 |
| Materials | 6.3 |
Top Five Countries as of April 30, 2018
| (excluding cash equivalents) | % of fund's net assets |
| Cayman Islands | 13.9 |
| Korea (South) | 8.5 |
| Brazil | 6.9 |
| South Africa | 6.7 |
| India | 6.5 |
Percentages are adjusted for the effect of futures contracts, if applicable.
Asset Allocation (% of fund's net assets)
| As of April 30, 2018 | ||
| Stocks and Equity Futures | 74.7% | |
| Bonds | 22.2% | |
| Short-Term Investments and Net Other Assets (Liabilities) | 3.1% | |

Fidelity® Total Emerging Markets Fund
Schedule of Investments April 30, 2018 (Unaudited)
Showing Percentage of Net Assets
| Common Stocks - 68.1% | |||
| Shares | Value | ||
| Argentina - 0.6% | |||
| Central Puerto SA sponsored ADR (a) | 56,760 | $878,077 | |
| Grupo Superveille SA sponsored ADR | 57,900 | 1,617,726 | |
| Telecom Argentina SA Class B sponsored ADR | 31,734 | 953,289 | |
| YPF SA Class D sponsored ADR | 80,740 | 1,767,399 | |
| TOTAL ARGENTINA | 5,216,491 | ||
| Australia - 0.0% | |||
| Frontier Digital Ventures Ltd. (a) | 659,236 | 321,951 | |
| Bermuda - 0.8% | |||
| AGTech Holdings Ltd. (a) | 2,284,000 | 248,833 | |
| China Resource Gas Group Ltd. | 432,000 | 1,588,726 | |
| Credicorp Ltd. (United States) | 11,900 | 2,766,631 | |
| GP Investments Ltd. Class A (depositary receipt) (a) | 22,922 | 32,781 | |
| Shangri-La Asia Ltd. | 1,142,000 | 2,222,464 | |
| TOTAL BERMUDA | 6,859,435 | ||
| Brazil - 3.0% | |||
| Azul SA sponsored ADR | 57,700 | 1,788,700 | |
| B2W Companhia Global do Varejo (a) | 614,117 | 5,066,220 | |
| Banco do Brasil SA | 327,700 | 3,433,030 | |
| BTG Pactual Participations Ltd. unit | 231,100 | 1,476,370 | |
| Companhia de Saneamento de Minas Gerais | 126,636 | 1,821,893 | |
| Cosan SA Industria e Comercio | 32,455 | 368,537 | |
| Direcional Engenharia SA (a) | 556,800 | 967,947 | |
| Localiza Rent A Car SA | 208,085 | 1,656,626 | |
| Petrobras Distribuidora SA | 218,300 | 1,430,740 | |
| Vale SA sponsored ADR | 622,768 | 8,619,109 | |
| TOTAL BRAZIL | 26,629,172 | ||
| British Virgin Islands - 0.6% | |||
| Despegar.com Corp. | 30,400 | 892,544 | |
| Mail.Ru Group Ltd. GDR (Reg. S) (a) | 126,700 | 4,003,720 | |
| TOTAL BRITISH VIRGIN ISLANDS | 4,896,264 | ||
| Canada - 0.2% | |||
| Pan American Silver Corp. | 120,300 | 1,939,236 | |
| Cayman Islands - 13.9% | |||
| 58.com, Inc. ADR (a) | 60,950 | 5,326,421 | |
| Alibaba Group Holding Ltd. sponsored ADR (a) | 151,300 | 27,013,102 | |
| Bilibili, Inc. ADR (a) | 21,479 | 234,551 | |
| BizLink Holding, Inc. | 56,587 | 417,121 | |
| China Biologic Products Holdings, Inc. | 11,300 | 981,631 | |
| China Literature Ltd. (a)(b) | 1,326,639 | 10,686,216 | |
| China Resources Land Ltd. | 684,800 | 2,571,923 | |
| ENN Energy Holdings Ltd. | 114,500 | 1,070,750 | |
| Haitian International Holdings Ltd. | 547,000 | 1,455,732 | |
| JD.com, Inc. sponsored ADR (a) | 435,100 | 15,885,501 | |
| Kingsoft Corp. Ltd. | 834,000 | 2,476,459 | |
| Momo, Inc. ADR (a) | 65,100 | 2,271,990 | |
| NetEase, Inc. ADR | 18,800 | 4,832,916 | |
| Ping An Healthcare and Technology Co. Ltd. (a) | 27,500 | 192,008 | |
| Secoo Holding Ltd. ADR | 16,200 | 168,156 | |
| Shimao Property Holdings Ltd. | 732,700 | 1,938,040 | |
| Tencent Holdings Ltd. | 845,550 | 41,569,700 | |
| Uni-President China Holdings Ltd. | 3,608,600 | 3,411,327 | |
| Vipshop Holdings Ltd. ADR (a) | 23,600 | 365,328 | |
| Yirendai Ltd. sponsored ADR (c) | 28,200 | 994,614 | |
| TOTAL CAYMAN ISLANDS | 123,863,486 | ||
| Chile - 0.7% | |||
| Compania Cervecerias Unidas SA sponsored ADR | 96,800 | 2,673,616 | |
| Enersis SA | 4,110,392 | 938,201 | |
| Inversiones La Construccion SA | 50,571 | 1,001,757 | |
| Sociedad Quimica y Minera de Chile SA (PN-B) sponsored ADR | 12,900 | 708,081 | |
| Vina Concha y Toro SA | 567,835 | 1,296,089 | |
| TOTAL CHILE | 6,617,744 | ||
| China - 6.5% | |||
| Anhui Conch Cement Co. Ltd. (H Shares) | 187,000 | 1,167,157 | |
| BBMG Corp. (H Shares) | 3,136,000 | 1,430,356 | |
| China International Travel Service Corp. Ltd. (A Shares) | 241,700 | 1,975,951 | |
| China Life Insurance Co. Ltd. (H Shares) | 2,278,834 | 6,462,682 | |
| China Longyuan Power Grid Corp. Ltd. (H Shares) | 3,768,960 | 3,701,949 | |
| China Oilfield Services Ltd. (H Shares) | 1,676,000 | 1,672,138 | |
| China Pacific Insurance (Group) Co. Ltd. (H Shares) | 933,706 | 4,120,144 | |
| China Petroleum & Chemical Corp. (H Shares) | 4,714,000 | 4,590,773 | |
| China Telecom Corp. Ltd. (H Shares) | 6,741,949 | 3,268,038 | |
| Hangzhou Hikvision Digital Technology Co. Ltd. Class A | 146,500 | 887,333 | |
| Industrial & Commercial Bank of China Ltd. (H Shares) | 20,317,160 | 17,836,061 | |
| PICC Property & Casualty Co. Ltd. (H Shares) | 898,580 | 1,608,610 | |
| Qingdao Haier Co. Ltd. | 652,151 | 1,761,640 | |
| Shanghai International Airport Co. Ltd. (A Shares) | 282,082 | 2,215,513 | |
| Shenzhen Inovance Technology Co. Ltd. Class A | 149,700 | 774,673 | |
| Tsingtao Brewery Co. Ltd. (H Shares) | 516,000 | 2,671,536 | |
| Zhengzhou Yutong Bus Co. Ltd. | 398,890 | 1,288,674 | |
| TOTAL CHINA | 57,433,228 | ||
| Cyprus - 0.0% | |||
| Etalon Group PLC GDR (Reg. S) | 44,588 | 127,076 | |
| Egypt - 0.0% | |||
| Six of October Development & Investment Co. (a) | 149,100 | 225,571 | |
| Greece - 0.4% | |||
| Titan Cement Co. SA (Reg.) | 132,700 | 3,501,430 | |
| Hong Kong - 3.7% | |||
| China Overseas Land and Investment Ltd. | 1,263,800 | 4,234,528 | |
| China Resources Beer Holdings Co. Ltd. | 1,302,666 | 5,610,489 | |
| China Resources Power Holdings Co. Ltd. | 651,709 | 1,250,052 | |
| China Unicom Ltd. | 1,212,900 | 1,715,100 | |
| China Unicom Ltd. sponsored ADR (a) | 217,620 | 3,053,209 | |
| CNOOC Ltd. | 3,141,000 | 5,313,673 | |
| CSPC Pharmaceutical Group Ltd. | 1,736,000 | 4,421,694 | |
| Far East Horizon Ltd. | 4,862,980 | 4,825,475 | |
| Techtronic Industries Co. Ltd. | 265,000 | 1,552,421 | |
| Yuexiu Property Co. Ltd. | 3,396,000 | 764,039 | |
| TOTAL HONG KONG | 32,740,680 | ||
| India - 6.5% | |||
| Adani Ports & Special Economic Zone Ltd. | 364,712 | 2,230,975 | |
| Axis Bank Ltd. | 386,394 | 2,995,503 | |
| Bharat Petroleum Corp. Ltd. | 380,260 | 2,209,472 | |
| Bharti Airtel Ltd. | 287,390 | 1,764,832 | |
| Bharti Infratel Ltd. | 256,699 | 1,208,130 | |
| Federal Bank Ltd. | 1,703,445 | 2,508,706 | |
| Future Retail Ltd. | 82,201 | 742,736 | |
| ICICI Bank Ltd. | 378,092 | 1,615,849 | |
| ICICI Bank Ltd. sponsored ADR | 405,540 | 3,451,145 | |
| Indraprastha Gas Ltd. | 321,583 | 1,386,948 | |
| InterGlobe Aviation Ltd. (b) | 60,919 | 1,282,642 | |
| ITC Ltd. | 637,313 | 2,693,288 | |
| JK Cement Ltd. | 105,665 | 1,587,270 | |
| Larsen & Toubro Ltd. | 133,138 | 2,798,784 | |
| LIC Housing Finance Ltd. | 631,590 | 5,170,992 | |
| Lupin Ltd. (a) | 243,314 | 2,963,566 | |
| Manappuram General Finance & Leasing Ltd. | 867,769 | 1,587,795 | |
| Petronet LNG Ltd. | 374,159 | 1,273,898 | |
| Phoenix Mills Ltd. (a) | 232,863 | 2,183,827 | |
| Power Grid Corp. of India Ltd. | 366,482 | 1,143,689 | |
| Reliance Industries Ltd. | 515,804 | 7,447,384 | |
| SREI Infrastructure Finance Ltd. | 116,223 | 148,878 | |
| State Bank of India | 798,416 | 2,950,056 | |
| Sun Pharmaceutical Industries Ltd. | 534,875 | 4,243,296 | |
| Tejas Networks Ltd. (b) | 43,354 | 217,505 | |
| TOTAL INDIA | 57,807,166 | ||
| Indonesia - 1.7% | |||
| PT Astra International Tbk | 4,917,300 | 2,516,807 | |
| PT Bank Mandiri (Persero) Tbk | 4,668,200 | 2,364,698 | |
| PT Bank Rakyat Indonesia Tbk | 16,273,000 | 3,752,041 | |
| PT Indocement Tunggal Prakarsa Tbk | 699,500 | 885,225 | |
| PT Kalbe Farma Tbk | 9,595,000 | 1,035,824 | |
| PT Link Net Tbk | 576,000 | 224,358 | |
| PT Media Nusantara Citra Tbk | 14,034,000 | 1,327,708 | |
| PT Perusahaan Gas Negara Tbk Series B | 1,564,500 | 221,461 | |
| PT Semen Gresik (Persero) Tbk | 2,533,900 | 1,750,127 | |
| PT Telekomunikasi Indonesia Tbk Series B | 5,150,500 | 1,405,441 | |
| TOTAL INDONESIA | 15,483,690 | ||
| Israel - 0.1% | |||
| Bezeq The Israel Telecommunication Corp. Ltd. | 924,855 | 1,167,199 | |
| Italy - 0.4% | |||
| Prada SpA | 729,700 | 3,702,429 | |
| Japan - 0.5% | |||
| GMO Internet, Inc. | 15,162 | 279,468 | |
| Panasonic Corp. | 87,700 | 1,298,587 | |
| Renesas Electronics Corp. (a) | 55,100 | 578,621 | |
| SoftBank Corp. | 14,230 | 1,087,296 | |
| Sumco Corp. | 46,100 | 1,139,427 | |
| TOTAL JAPAN | 4,383,399 | ||
| Korea (South) - 7.0% | |||
| AMOREPACIFIC Group, Inc. | 30,584 | 4,083,864 | |
| BS Financial Group, Inc. | 690,653 | 6,739,336 | |
| Coway Co. Ltd. | 18,389 | 1,502,475 | |
| Daou Technology, Inc. | 97,211 | 2,192,166 | |
| Hanon Systems | 122,443 | 1,246,239 | |
| Hyundai Fire & Marine Insurance Co. Ltd. | 58,730 | 2,097,647 | |
| Hyundai Mobis | 23,645 | 5,475,603 | |
| Iljin Materials Co. Ltd. | 24,542 | 766,562 | |
| InterPark INT Corp. | 29,545 | 243,329 | |
| KB Financial Group, Inc. | 121,485 | 6,883,650 | |
| KEPCO Plant Service & Engineering Co. Ltd. | 19,627 | 929,186 | |
| Korea Electric Power Corp. | 13,372 | 466,521 | |
| Korean Reinsurance Co. | 89,944 | 991,049 | |
| KT Corp. | 12,432 | 315,245 | |
| KT Corp. sponsored ADR | 14,390 | 193,258 | |
| LG Chemical Ltd. | 12,183 | 4,095,413 | |
| LG Corp. | 26,031 | 1,971,300 | |
| NAVER Corp. | 1,694 | 1,132,576 | |
| POSCO | 11,279 | 3,875,869 | |
| Samsung Electronics Co. Ltd. | 774 | 1,917,972 | |
| Samsung Life Insurance Co. Ltd. | 18,851 | 2,059,497 | |
| Samsung SDI Co. Ltd. | 24,651 | 4,223,880 | |
| Shinhan Financial Group Co. Ltd. | 137,063 | 6,086,575 | |
| SK Hynix, Inc. | 36,714 | 2,896,872 | |
| TOTAL KOREA (SOUTH) | 62,386,084 | ||
| Luxembourg - 0.4% | |||
| Samsonite International SA | 743,100 | 3,351,897 | |
| Mauritius - 0.1% | |||
| MakeMyTrip Ltd. (a) | 24,400 | 900,360 | |
| Mexico - 1.3% | |||
| America Movil S.A.B. de CV Series L sponsored ADR | 55,600 | 1,028,044 | |
| Grupo Aeroportuario del Pacifico S.A.B. de CV Series B | 134,200 | 1,395,958 | |
| Grupo Financiero Banorte S.A.B. de CV Series O | 446,629 | 2,794,588 | |
| Macquarie Mexican (REIT) (b) | 1,790,370 | 1,910,795 | |
| Promotora y Operadora de Infraestructura S.A.B. de CV | 110,395 | 1,131,218 | |
| Wal-Mart de Mexico SA de CV Series V | 1,297,400 | 3,605,267 | |
| TOTAL MEXICO | 11,865,870 | ||
| Netherlands - 0.8% | |||
| VEON Ltd. sponsored ADR | 506,060 | 1,391,665 | |
| Yandex NV Series A (a) | 183,287 | 6,114,454 | |
| TOTAL NETHERLANDS | 7,506,119 | ||
| Nigeria - 0.4% | |||
| Guaranty Trust Bank PLC | 3,465,183 | 433,148 | |
| Guaranty Trust Bank PLC GDR (Reg. S) | 124,480 | 778,000 | |
| Transnational Corp. of Nigeria PLC | 41,804,033 | 197,408 | |
| Zenith Bank PLC | 25,199,714 | 1,921,478 | |
| TOTAL NIGERIA | 3,330,034 | ||
| Pakistan - 0.2% | |||
| Habib Bank Ltd. | 1,221,800 | 2,058,358 | |
| Panama - 0.2% | |||
| Copa Holdings SA Class A | 14,649 | 1,716,423 | |
| Peru - 0.3% | |||
| Compania de Minas Buenaventura SA sponsored ADR | 168,500 | 2,687,575 | |
| Philippines - 0.7% | |||
| International Container Terminal Services, Inc. | 440,740 | 719,961 | |
| Metro Pacific Investments Corp. | 4,170,000 | 410,758 | |
| Metropolitan Bank & Trust Co. | 2,202,852 | 3,613,488 | |
| Robinsons Land Corp. | 3,586,960 | 1,238,952 | |
| TOTAL PHILIPPINES | 5,983,159 | ||
| Russia - 3.2% | |||
| Lukoil PJSC sponsored ADR | 83,200 | 5,557,760 | |
| MMC Norilsk Nickel PJSC sponsored ADR | 264,700 | 4,551,517 | |
| Mobile TeleSystems OJSC | 77,402 | 365,645 | |
| Mobile TeleSystems OJSC sponsored ADR | 17,700 | 185,850 | |
| NOVATEK OAO GDR (Reg. S) | 19,700 | 2,501,900 | |
| RusHydro PJSC | 40,112,900 | 474,558 | |
| Sberbank of Russia | 1,443,230 | 5,144,386 | |
| Sberbank of Russia sponsored ADR | 472,584 | 7,041,502 | |
| Tatneft PAO | 159,600 | 1,700,736 | |
| Unipro PJSC | 22,668,700 | 999,298 | |
| TOTAL RUSSIA | 28,523,152 | ||
| Singapore - 0.2% | |||
| First Resources Ltd. | 1,178,200 | 1,498,159 | |
| South Africa - 6.3% | |||
| Aspen Pharmacare Holdings Ltd. | 137,306 | 2,960,546 | |
| Barclays Africa Group Ltd. | 298,074 | 4,365,972 | |
| Bidvest Group Ltd. | 131,156 | 2,569,236 | |
| FirstRand Ltd. | 725,000 | 3,882,757 | |
| Imperial Holdings Ltd. | 303,164 | 5,831,692 | |
| Life Healthcare Group Holdings Ltd. | 924,000 | 2,178,130 | |
| Mr Price Group Ltd. | 108,300 | 2,376,520 | |
| MTN Group Ltd. | 253,820 | 2,547,516 | |
| Naspers Ltd. Class N | 78,445 | 19,110,737 | |
| Nedbank Group Ltd. | 92,080 | 2,195,925 | |
| Sasol Ltd. | 102,100 | 3,649,806 | |
| Tiger Brands Ltd. | 131,600 | 4,112,947 | |
| TOTAL SOUTH AFRICA | 55,781,784 | ||
| Taiwan - 4.2% | |||
| Advantech Co. Ltd. | 67,897 | 465,287 | |
| Chroma ATE, Inc. | 189,000 | 948,654 | |
| GlobalWafers Co. Ltd. | 188,300 | 3,032,377 | |
| King's Town Bank | 561,600 | 671,497 | |
| LandMark Optoelectronics Corp. | 119,000 | 1,107,923 | |
| Largan Precision Co. Ltd. | 29,403 | 3,413,754 | |
| MediaTek, Inc. | 47,000 | 533,613 | |
| Nanya Technology Corp. | 410,000 | 1,274,021 | |
| PChome Online, Inc. | 70,032 | 323,828 | |
| Taiwan Semiconductor Manufacturing Co. Ltd. | 2,088,000 | 15,876,838 | |
| Taiwan Semiconductor Manufacturing Co. Ltd. sponsored ADR | 97,142 | 3,735,110 | |
| Unified-President Enterprises Corp. | 1,642,000 | 3,944,745 | |
| United Microelectronics Corp. | 2,930,000 | 1,577,269 | |
| TOTAL TAIWAN | 36,904,916 | ||
| Thailand - 0.8% | |||
| PTT Global Chemical PCL (For. Reg.) | 1,370,300 | 4,233,719 | |
| Siam Cement PCL (For. Reg.) | 183,100 | 2,707,530 | |
| TOTAL THAILAND | 6,941,249 | ||
| Turkey - 1.0% | |||
| Bim Birlesik Magazalar A/S JSC | 126,000 | 2,138,721 | |
| Tupras Turkiye Petrol Rafinerileri A/S | 96,200 | 2,451,121 | |
| Turkcell Iletisim Hizmet A/S | 608,300 | 2,090,512 | |
| Turkcell Iletisim Hizmet A/S sponsored ADR | 22,300 | 192,895 | |
| Turkiye Garanti Bankasi A/S | 1,036,000 | 2,348,923 | |
| TOTAL TURKEY | 9,222,172 | ||
| United Arab Emirates - 0.9% | |||
| DP World Ltd. | 84,146 | 1,872,249 | |
| Emaar Properties PJSC | 2,053,422 | 3,236,817 | |
| National Bank of Abu Dhabi PJSC | 828,009 | 2,795,233 | |
| TOTAL UNITED ARAB EMIRATES | 7,904,299 | ||
| United Kingdom - 0.2% | |||
| Fresnillo PLC | 76,100 | 1,335,778 | |
| United States of America - 0.3% | |||
| MercadoLibre, Inc. | 8,301 | 2,819,103 | |
| TOTAL COMMON STOCKS | |||
| (Cost $539,412,497) | 605,632,138 | ||
| Nonconvertible Preferred Stocks - 5.2% | |||
| Brazil - 3.7% | |||
| Ambev SA sponsored ADR | 746,600 | 4,942,492 | |
| Banco do Estado Rio Grande do Sul SA | 278,720 | 1,598,391 | |
| Companhia Paranaense de Energia-Copel: | |||
| (PN-B) | 4,815 | 36,822 | |
| (PN-B) sponsored ADR | 266,052 | 2,040,619 | |
| Fibria Celulose SA sponsored ADR | 182,000 | 3,559,920 | |
| Itau Unibanco Holding SA sponsored ADR | 597,441 | 8,680,818 | |
| Metalurgica Gerdau SA (PN) | 1,103,070 | 2,462,322 | |
| Petroleo Brasileiro SA - Petrobras (PN) sponsored ADR (non-vtg.) (a) | 593,606 | 7,805,919 | |
| Telefonica Brasil SA | 159,843 | 2,242,146 | |
| TOTAL BRAZIL | 33,369,449 | ||
| Korea (South) - 1.5% | |||
| Hyundai Motor Co. Series 2 | 60,525 | 6,499,405 | |
| Samsung Electronics Co. Ltd. | 2,469 | 4,873,806 | |
| Samsung Fire & Marine Insurance Co. Ltd. | 10,998 | 1,884,477 | |
| TOTAL KOREA (SOUTH) | 13,257,688 | ||
| TOTAL NONCONVERTIBLE PREFERRED STOCKS | |||
| (Cost $37,036,050) | 46,627,137 | ||
| Principal Amount(d) | Value | ||
| Nonconvertible Bonds - 5.4% | |||
| Azerbaijan - 0.8% | |||
| Southern Gas Corridor CJSC 6.875% 3/24/26 (b) | 2,330,000 | 2,545,525 | |
| State Oil Co. of Azerbaijan Republic 6.95% 3/18/30 (Reg. S) | 3,975,000 | 4,270,661 | |
| TOTAL AZERBAIJAN | 6,816,186 | ||
| Bahrain - 0.1% | |||
| The Oil and Gas Holding Co. 7.5% 10/25/27 (b) | 655,000 | 635,940 | |
| Georgia - 0.6% | |||
| Georgian Oil & Gas Corp. 6.75% 4/26/21 (b) | 2,300,000 | 2,364,492 | |
| JSC BGEO Group 6% 7/26/23 (b) | 850,000 | 855,270 | |
| JSC Georgian Railway 7.75% 7/11/22 (b) | 2,000,000 | 2,144,936 | |
| TOTAL GEORGIA | 5,364,698 | ||
| Ireland - 0.4% | |||
| Vnesheconombank Via VEB Finance PLC: | |||
| 6.025% 7/5/22 (b) | 1,400,000 | 1,449,280 | |
| 6.8% 11/22/25 (b) | 2,025,000 | 2,188,215 | |
| TOTAL IRELAND | 3,637,495 | ||
| Israel - 0.0% | |||
| Israel Electric Corp. Ltd. 7.75% 12/15/27 (Reg. S) | 275,000 | 336,188 | |
| Mexico - 1.2% | |||
| Pemex Project Funding Master Trust: | |||
| 6.625% 6/15/35 | 3,875,000 | 3,849,813 | |
| 8.625% 2/1/22 | 300,000 | 338,010 | |
| Petroleos Mexicanos: | |||
| 6.5% 3/13/27 | 1,505,000 | 1,558,593 | |
| 6.5% 6/2/41 | 3,950,000 | 3,782,125 | |
| 6.875% 8/4/26 | 1,200,000 | 1,285,200 | |
| TOTAL MEXICO | 10,813,741 | ||
| Mongolia - 0.1% | |||
| Trade and Development Bank of Mongolia LLC 9.375% 5/19/20 (Reg. S) | 850,000 | 905,264 | |
| Netherlands - 0.0% | |||
| Metinvest BV: | |||
| 7.75% 4/23/23 (b) | 200,000 | 194,440 | |
| 8.5% 4/23/26 (b) | 265,000 | 254,983 | |
| TOTAL NETHERLANDS | 449,423 | ||
| Oman - 0.1% | |||
| Oman Sovereign Sukuk SAOC 4.397% 6/1/24 (b) | 1,000,000 | 934,436 | |
| South Africa - 0.4% | |||
| Eskom Holdings SOC Ltd.: | |||
| 5.75% 1/26/21 (Reg. S) | 500,000 | 498,570 | |
| 6.75% 8/6/23 (b) | 2,825,000 | 2,860,313 | |
| TOTAL SOUTH AFRICA | 3,358,883 | ||
| Trinidad & Tobago - 0.1% | |||
| Petroleum Co. of Trinidad & Tobago Ltd.: | |||
| 6% 5/8/22 (b) | 256,875 | 257,132 | |
| 9.75% 8/14/19 (b) | 750,000 | 789,375 | |
| TOTAL TRINIDAD & TOBAGO | 1,046,507 | ||
| Tunisia - 0.1% | |||
| Banque Centrale de Tunisie 5.75% 1/30/25 (b) | 525,000 | 486,152 | |
| Turkey - 0.1% | |||
| Export Credit Bank of Turkey 5% 9/23/21 (b) | 400,000 | 394,000 | |
| Turkiye Ihracat Kredi Bankasi A/S 6.125% 5/3/24 (b) | 305,000 | 304,085 | |
| TOTAL TURKEY | 698,085 | ||
| United Arab Emirates - 0.4% | |||
| Abu Dhabi Crude Oil Pipeline 4.6% 11/2/47 (b) | 2,170,000 | 2,042,673 | |
| Dolphin Energy Ltd. 5.5% 12/15/21 (b) | 340,000 | 359,652 | |
| DP World Ltd. 6.85% 7/2/37 (Reg. S) | 500,000 | 594,048 | |
| Oztel Holdings SPC Ltd.: | |||
| 5.625% 10/24/23 (b) | 120,000 | 117,750 | |
| 6.625% 4/24/28 (b) | 180,000 | 174,938 | |
| TOTAL UNITED ARAB EMIRATES | 3,289,061 | ||
| United Kingdom - 0.5% | |||
| Biz Finance PLC 9.625% 4/27/22 (b) | 3,950,000 | 4,088,250 | |
| Venezuela - 0.5% | |||
| Petroleos de Venezuela SA: | |||
| 5.375% 4/12/27 (e) | 1,750,000 | 457,625 | |
| 5.5% 4/12/37 (e) | 1,000,000 | 265,000 | |
| 6% 5/16/24 (b)(e) | 3,600,000 | 909,000 | |
| 6% 11/15/26 (Reg. S) (e) | 2,450,000 | 614,705 | |
| 8.5% 10/27/20 (Reg. S) (e) | 3,000,000 | 2,598,000 | |
| TOTAL VENEZUELA | 4,844,330 | ||
| TOTAL NONCONVERTIBLE BONDS | |||
| (Cost $49,745,118) | 47,704,639 | ||
| Government Obligations - 16.9% | |||
| Argentina - 2.1% | |||
| Argentine Republic: | |||
| 5.875% 1/11/28 | 1,730,000 | 1,584,680 | |
| 6.875% 1/26/27 | 1,800,000 | 1,792,818 | |
| 6.875% 1/11/48 | 2,615,000 | 2,323,428 | |
| 7.125% 7/6/36 | 3,200,000 | 3,043,200 | |
| 7.5% 4/22/26 | 7,385,000 | 7,739,480 | |
| 7.82% 12/31/33 | EUR | 1,685,727 | 2,241,789 |
| TOTAL ARGENTINA | 18,725,395 | ||
| Armenia - 0.2% | |||
| Republic of Armenia 7.15% 3/26/25 (b) | 1,820,000 | 1,953,315 | |
| Belarus - 0.1% | |||
| Belarus Republic 7.625% 6/29/27 (b) | 515,000 | 553,831 | |
| Brazil - 0.2% | |||
| Brazilian Federative Republic: | |||
| 8.25% 1/20/34 | 1,350,000 | 1,672,664 | |
| 12.25% 3/6/30 | 100,000 | 160,250 | |
| TOTAL BRAZIL | 1,832,914 | ||
| Cameroon - 0.3% | |||
| Cameroon Republic 9.5% 11/19/25 (b) | 2,050,000 | 2,352,703 | |
| Dominican Republic - 0.1% | |||
| Dominican Republic 5.95% 1/25/27 (b) | 400,000 | 409,000 | |
| Ecuador - 0.5% | |||
| Ecuador Republic: | |||
| 7.95% 6/20/24 (b) | 520,000 | 488,800 | |
| 8.75% 6/2/23 (b) | 1,700,000 | 1,666,000 | |
| 8.875% 10/23/27 (b) | 710,000 | 669,175 | |
| 9.625% 6/2/27 (b) | 200,000 | 196,000 | |
| 9.65% 12/13/26 (b) | 850,000 | 837,250 | |
| 10.75% 3/28/22 (b) | 450,000 | 474,750 | |
| TOTAL ECUADOR | 4,331,975 | ||
| Egypt - 1.2% | |||
| Arab Republic of Egypt: | |||
| , yield at date of purchase 18.0995% 10/16/18 | EGP | 12,000,000 | 630,114 |
| 4.75% 4/16/26 (b) | EUR | 105,000 | 126,411 |
| 5.577% 2/21/23 (b) | 945,000 | 948,308 | |
| 5.625% 4/16/30 (b) | EUR | 105,000 | 125,276 |
| 6.125% 1/31/22 (b) | 1,200,000 | 1,231,440 | |
| 7.5% 1/31/27 (b) | 1,950,000 | 2,057,835 | |
| 7.903% 2/21/48 (b) | 2,025,000 | 2,052,301 | |
| 8.5% 1/31/47 (b) | 3,000,000 | 3,214,068 | |
| TOTAL EGYPT | 10,385,753 | ||
| El Salvador - 1.1% | |||
| El Salvador Republic: | |||
| 6.375% 1/18/27 (b) | 1,250,000 | 1,234,375 | |
| 7.375% 12/1/19 | 1,375,000 | 1,418,491 | |
| 7.625% 2/1/41 (b) | 2,050,000 | 2,132,390 | |
| 7.65% 6/15/35 (Reg. S) | 1,800,000 | 1,872,000 | |
| 8.625% 2/28/29 (b) | 2,960,000 | 3,381,800 | |
| TOTAL EL SALVADOR | 10,039,056 | ||
| Ethiopia - 0.2% | |||
| Federal Democratic Republic of Ethiopia 6.625% 12/11/24 (b) | 1,740,000 | 1,758,479 | |
| Gabon - 0.1% | |||
| Gabonese Republic: | |||
| 6.375% 12/12/24 (b) | 850,000 | 828,403 | |
| 6.95% 6/16/25 (b) | 300,000 | 298,985 | |
| TOTAL GABON | 1,127,388 | ||
| Ghana - 0.7% | |||
| Ghana Republic: | |||
| 7.875% 8/7/23 (Reg.S) | 2,350,000 | 2,549,045 | |
| 8.125% 1/18/26 (b) | 1,200,000 | 1,282,594 | |
| 9.25% 9/15/22 (b) | 1,350,000 | 1,535,625 | |
| 10.75% 10/14/30 (b) | 600,000 | 775,620 | |
| TOTAL GHANA | 6,142,884 | ||
| Honduras - 0.1% | |||
| Republic of Honduras 6.25% 1/19/27 | 750,000 | 773,430 | |
| Iraq - 0.3% | |||
| Republic of Iraq: | |||
| 5.8% 1/15/28 (Reg. S) | 2,600,000 | 2,452,372 | |
| 6.752% 3/9/23 (b) | 385,000 | 384,718 | |
| TOTAL IRAQ | 2,837,090 | ||
| Ivory Coast - 0.3% | |||
| Ivory Coast 5.75% 12/31/32 | 2,504,250 | 2,395,566 | |
| Jordan - 0.7% | |||
| Jordanian Kingdom: | |||
| 5.75% 1/31/27 (b) | 1,050,000 | 997,059 | |
| 6.125% 1/29/26 (b) | 2,650,000 | 2,594,191 | |
| 7.375% 10/10/47 (b) | 2,710,000 | 2,639,052 | |
| TOTAL JORDAN | 6,230,302 | ||
| Kuwait - 0.4% | |||
| State of Kuwait 3.5% 3/20/27 (b) | 4,090,000 | 3,934,408 | |
| Lebanon - 2.0% | |||
| Lebanese Republic: | |||
| 5.15% 11/12/18 | 1,000,000 | 996,600 | |
| 5.45% 11/28/19 | 4,000,000 | 3,938,504 | |
| 6% 5/20/19 | 4,075,000 | 4,073,778 | |
| 6.1% 10/4/22 | 3,135,000 | 2,982,545 | |
| 6.375% 3/9/20 | 5,525,000 | 5,505,143 | |
| TOTAL LEBANON | 17,496,570 | ||
| Mongolia - 0.1% | |||
| Mongolian People's Republic 8.75% 3/9/24 (b) | 850,000 | 941,368 | |
| Nigeria - 0.3% | |||
| Republic of Nigeria: | |||
| , yield at date of purchase 11.2564% to 15.189% 8/16/18 | NGN | 795,000,000 | 2,141,525 |
| 6.5% 11/28/27 (b) | 395,000 | 397,632 | |
| TOTAL NIGERIA | 2,539,157 | ||
| Oman - 0.3% | |||
| Sultanate of Oman: | |||
| 6.5% 3/8/47 (b) | 780,000 | 719,238 | |
| 6.75% 1/17/48 (b) | 2,000,000 | 1,882,796 | |
| TOTAL OMAN | 2,602,034 | ||
| Pakistan - 0.1% | |||
| Islamic Republic of Pakistan 6.875% 12/5/27 (b) | 750,000 | 701,472 | |
| Paraguay - 0.1% | |||
| Republic of Paraguay 4.7% 3/27/27 (b) | 535,000 | 532,325 | |
| Qatar - 0.9% | |||
| State of Qatar: | |||
| 2.375% 6/2/21 | 850,000 | 819,196 | |
| 3.25% 6/2/26 | 950,000 | 887,870 | |
| 3.875% 4/23/23 (b) | 335,000 | 333,610 | |
| 4.5% 4/23/28 (b) | 955,000 | 953,189 | |
| 5.103% 4/23/48 (b) | 2,075,000 | 2,056,636 | |
| 9.75% 6/15/30 (Reg. S) | 2,180,000 | 3,196,490 | |
| TOTAL QATAR | 8,246,991 | ||
| Russia - 0.6% | |||
| Ministry of Finance Russian Federation: | |||
| 4.75% 5/27/26 (b) | 600,000 | 609,486 | |
| 4.75% 5/27/26 | 400,000 | 406,324 | |
| Russian Federation: | |||
| 4.25% 6/23/27 (b) | 800,000 | 780,754 | |
| 5.25% 6/23/47 (b) | 3,200,000 | 3,100,557 | |
| 5.625% 4/4/42 (b) | 600,000 | 628,800 | |
| Russian Federation Ministry of Finance 4.375% 3/21/29 (b) | 200,000 | 193,703 | |
| TOTAL RUSSIA | 5,719,624 | ||
| Rwanda - 0.2% | |||
| Rwanda Republic 6.625% 5/2/23 (b) | 1,625,000 | 1,662,294 | |
| Saudi Arabia - 0.3% | |||
| Kingdom of Saudi Arabia: | |||
| 3.625% 3/4/28 (b) | 1,625,000 | 1,520,074 | |
| 4.5% 10/26/46 (b) | 1,410,000 | 1,274,124 | |
| TOTAL SAUDI ARABIA | 2,794,198 | ||
| Sri Lanka - 0.1% | |||
| Democratic Socialist Republic of Sri Lanka: | |||
| 6.2% 5/11/27 (b) | 750,000 | 723,617 | |
| 6.85% 11/3/25 (b) | 500,000 | 510,678 | |
| TOTAL SRI LANKA | 1,234,295 | ||
| Suriname - 0.4% | |||
| Republic of Suriname: | |||
| 9.25% 10/26/26 | 200,000 | 206,000 | |
| 9.25% 10/26/26 (b) | 3,550,000 | 3,656,500 | |
| TOTAL SURINAME | 3,862,500 | ||
| TAJIKISTAN - 0.1% | |||
| Tajikistan Republic 7.125% 9/14/27 (b) | 875,000 | 810,381 | |
| Turkey - 1.4% | |||
| Turkish Republic: | |||
| 4.875% 10/9/26 | 400,000 | 373,600 | |
| 5.125% 2/17/28 | 1,295,000 | 1,210,178 | |
| 5.75% 3/22/24 | 550,000 | 557,574 | |
| 5.75% 5/11/47 | 650,000 | 567,607 | |
| 6% 3/25/27 | 2,150,000 | 2,157,869 | |
| 6.25% 9/26/22 | 850,000 | 893,573 | |
| 6.875% 3/17/36 | 1,975,000 | 2,028,349 | |
| 7.25% 3/5/38 | 1,300,000 | 1,387,859 | |
| 7.375% 2/5/25 | 350,000 | 383,576 | |
| 8% 2/14/34 | 1,205,000 | 1,383,950 | |
| 11.875% 1/15/30 | 165,000 | 242,138 | |
| Turkiye Ihracat Kredi Bankasi A/S 5.375% 2/8/21 (b) | 1,500,000 | 1,503,159 | |
| TOTAL TURKEY | 12,689,432 | ||
| Ukraine - 1.1% | |||
| Ukraine Government: | |||
| 7.75% 9/1/20 (b) | 1,275,000 | 1,325,363 | |
| 7.75% 9/1/21 (b) | 3,555,000 | 3,671,249 | |
| 7.75% 9/1/22 (b) | 4,950,000 | 5,047,812 | |
| TOTAL UKRAINE | 10,044,424 | ||
| United States of America - 0.1% | |||
| U.S. Treasury Bills, yield at date of purchase 1.41% to 1.8% 5/3/18 to 7/26/18 (f) | 590,000 | 588,040 | |
| Venezuela - 0.2% | |||
| Venezuelan Republic: | |||
| 7.65% 4/21/25 (e) | 500,000 | 141,250 | |
| 9% 5/7/23 (Reg. S) (e) | 625,000 | 178,125 | |
| 9.25% 9/15/27(e) | 2,150,000 | 666,500 | |
| 9.25% 5/7/28 (Reg. S) (e) | 2,500,000 | 706,250 | |
| TOTAL VENEZUELA | 1,692,125 | ||
| Zambia - 0.0% | |||
| Republic of Zambia 8.97% 7/30/27 (b) | 400,000 | 402,000 | |
| TOTAL GOVERNMENT OBLIGATIONS | |||
| (Cost $153,233,833) | 150,342,719 | ||
| Shares | Value | ||
| Money Market Funds - 4.5% | |||
| Fidelity Cash Central Fund, 1.74% (g) | 39,056,935 | 39,064,746 | |
| Fidelity Securities Lending Cash Central Fund 1.74% (g)(h) | 1,011,515 | 1,011,616 | |
| TOTAL MONEY MARKET FUNDS | |||
| (Cost $40,074,625) | 40,076,362 | ||
| TOTAL INVESTMENT IN SECURITIES - 100.1% | |||
| (Cost $819,502,123) | 890,382,995 | ||
| NET OTHER ASSETS (LIABILITIES) - (0.1)% | (562,280) | ||
| NET ASSETS - 100% | $889,820,715 |
| Futures Contracts | |||||
| Number of contracts | Expiration Date | Notional Amount | Value | Unrealized Appreciation/(Depreciation) | |
| Purchased | |||||
| Equity Index Contracts | |||||
| ICE E-mini MSCI Emerging Markets Index Contracts (United States) | 211 | June 2018 | $12,155,710 | $(142,199) | $(142,199) |
The notional amount of futures purchased as a percentage of Net Assets is 1.4%
For the period, the average monthly underlying face amount at value for futures contracts in the aggregate was $9,955,367.
Currency Abbreviations
EGP – Egyptian pound
EUR – European Monetary Unit
NGN – Nigerian naira
Categorizations in the Schedule of Investments are based on country or territory of incorporation.
Legend
(a) Non-income producing
(b) Security exempt from registration under Rule 144A of the Securities Act of 1933. These securities may be resold in transactions exempt from registration, normally to qualified institutional buyers. At the end of the period, the value of these securities amounted to $119,520,974 or 13.4% of net assets.
(c) Security or a portion of the security is on loan at period end.
(d) Amount is stated in United States dollars unless otherwise noted.
(e) Non-income producing - Security is in default.
(f) Security or a portion of the security was pledged to cover margin requirements for futures contracts. At period end, the value of securities pledged amounted to $588,040.
(g) Affiliated fund that is generally available only to investment companies and other accounts managed by Fidelity Investments. The rate quoted is the annualized seven-day yield of the fund at period end. A complete unaudited listing of the fund's holdings as of its most recent quarter end is available upon request. In addition, each Fidelity Central Fund's financial statements are available on the SEC's website or upon request.
(h) Investment made with cash collateral received from securities on loan.
Affiliated Central Funds
Information regarding fiscal year to date income earned by the Fund from investments in Fidelity Central Funds is as follows:
| Fund | Income earned |
| Fidelity Cash Central Fund | $234,090 |
| Fidelity Securities Lending Cash Central Fund | 12,065 |
| Total | $246,155 |
Amounts in the income column in the above table include any capital gain distributions from underlying funds, which are presented in the corresponding line-item in the Statement of Operations if applicable.
Investment Valuation
The following is a summary of the inputs used, as of April 30, 2018, involving the Fund's assets and liabilities carried at fair value. The inputs or methodology used for valuing securities may not be an indication of the risk associated with investing in those securities. For more information on valuation inputs, and their aggregation into the levels used below, please refer to the Investment Valuation section in the accompanying Notes to Financial Statements.
| Valuation Inputs at Reporting Date: | ||||
| Description | Total | Level 1 | Level 2 | Level 3 |
| Investments in Securities: | ||||
| Equities: | ||||
| Consumer Discretionary | $99,641,108 | $40,643,847 | $58,997,261 | $-- |
| Consumer Staples | 42,682,540 | 18,740,049 | 23,942,491 | -- |
| Energy | 44,660,710 | 22,153,372 | 22,507,338 | -- |
| Financials | 151,396,549 | 60,194,051 | 91,202,498 | -- |
| Health Care | 18,976,695 | 981,631 | 17,995,064 | -- |
| Industrials | 28,214,971 | 12,461,660 | 15,753,311 | -- |
| Information Technology | 148,891,054 | 75,155,165 | 73,735,889 | -- |
| Materials | 54,747,440 | 33,460,381 | 21,287,059 | -- |
| Real Estate | 18,431,568 | 5,500,259 | 12,931,309 | -- |
| Telecommunication Services | 26,399,668 | 12,498,067 | 13,901,601 | -- |
| Utilities | 18,216,972 | 7,386,876 | 10,830,096 | -- |
| Corporate Bonds | 47,704,639 | -- | 47,704,639 | -- |
| Government Obligations | 150,342,719 | -- | 150,342,719 | -- |
| Money Market Funds | 40,076,362 | 40,076,362 | -- | -- |
| Total Investments in Securities: | $890,382,995 | $329,251,720 | $561,131,275 | $-- |
| Derivative Instruments: | ||||
| Liabilities | ||||
| Futures Contracts | $(142,199) | $(142,199) | $-- | $-- |
| Total Liabilities | $(142,199) | $(142,199) | $-- | $-- |
| Total Derivative Instruments: | $(142,199) | $(142,199) | $-- | $-- |
The following is a summary of transfers between Level 1 and Level 2 for the period ended April 30, 2018. Transfers are assumed to have occurred at the beginning of the period, and are primarily attributable to the valuation techniques used for foreign equity securities, as discussed in the accompanying Notes to Financial Statements:
| Transfers | Total |
| Level 1 to Level 2 | $168,008,172 |
| Level 2 to Level 1 | $1,722,477 |
Value of Derivative Instruments
The following table is a summary of the Fund's value of derivative instruments by primary risk exposure as of April 30, 2018. For additional information on derivative instruments, please refer to the Derivative Instruments section in the accompanying Notes to Financial Statements.
| Primary Risk Exposure / Derivative Type | Value | |
| Asset | Liability | |
| Equity Risk | ||
| Futures Contracts(a) | $0 | $(142,199) |
| Total Equity Risk | 0 | (142,199) |
| Total Value of Derivatives | $0 | $(142,199) |
(a) Reflects gross cumulative appreciation (depreciation) on futures contracts as presented in the Schedule of Investments. In the Statement of Assets and Liabilities, the period end daily variation margin is included in receivable or payable for daily variation margin on futures contracts, and the net cumulative appreciation (depreciation) is included in net unrealized appreciation (depreciation).
Other Information
The composition of credit quality ratings as a percentage of Total Net Assets is as follows (Unaudited):
| AAA,AA,A | 1.9% |
| BBB | 2.1% |
| BB | 2.9% |
| B | 11.1% |
| CCC,CC,C | 2.1% |
| D | 0.2% |
| Not Rated | 1.6% |
| Equities | 73.3% |
| Short-Term Investments and Net Other Assets | 4.8% |
| 100% |
We have used ratings from Moody's Investors Service, Inc. Where Moody's® ratings are not available, we have used S&P® ratings. All ratings are as of the date indicated and do not reflect subsequent changes.
See accompanying notes which are an integral part of the financial statements.
Fidelity® Total Emerging Markets Fund
Financial Statements
Statement of Assets and Liabilities
| April 30, 2018 (Unaudited) | ||
| Assets | ||
| Investment in securities, at value (including securities loaned of $991,087) — See accompanying schedule: Unaffiliated issuers (cost $779,427,498) | $850,306,633 | |
| Fidelity Central Funds (cost $40,074,625) | 40,076,362 | |
| Total Investment in Securities (cost $819,502,123) | $890,382,995 | |
| Foreign currency held at value (cost $1,618,085) | 1,618,123 | |
| Receivable for investments sold | 2,766,197 | |
| Receivable for fund shares sold | 1,442,524 | |
| Dividends receivable | 567,946 | |
| Interest receivable | 3,106,967 | |
| Distributions receivable from Fidelity Central Funds | 54,329 | |
| Prepaid expenses | 295 | |
| Other receivables | 160,331 | |
| Total assets | 900,099,707 | |
| Liabilities | ||
| Payable to custodian bank | $286,337 | |
| Payable for investments purchased | 6,148,128 | |
| Payable for fund shares redeemed | 1,542,475 | |
| Accrued management fee | 587,798 | |
| Distribution and service plan fees payable | 52,483 | |
| Payable for daily variation margin on futures contracts | 100,225 | |
| Other affiliated payables | 172,920 | |
| Other payables and accrued expenses | 377,026 | |
| Collateral on securities loaned | 1,011,600 | |
| Total liabilities | 10,278,992 | |
| Net Assets | $889,820,715 | |
| Net Assets consist of: | ||
| Paid in capital | $812,467,172 | |
| Undistributed net investment income | 4,020,470 | |
| Accumulated undistributed net realized gain (loss) on investments and foreign currency transactions | 2,808,263 | |
| Net unrealized appreciation (depreciation) on investments and assets and liabilities in foreign currencies | 70,524,810 | |
| Net Assets | $889,820,715 | |
| Calculation of Maximum Offering Price | ||
| Class A: | ||
| Net Asset Value and redemption price per share ($49,758,270 ÷ 3,732,946 shares) | $13.33 | |
| Maximum offering price per share (100/94.25 of $13.33) | $14.14 | |
| Class M: | ||
| Net Asset Value and redemption price per share ($10,177,475 ÷ 763,612 shares) | $13.33 | |
| Maximum offering price per share (100/96.50 of $13.33) | $13.81 | |
| Class C: | ||
| Net Asset Value and offering price per share ($45,585,320 ÷ 3,445,331 shares)(a) | $13.23 | |
| Total Emerging Markets: | ||
| Net Asset Value, offering price and redemption price per share ($317,289,699 ÷ 23,758,433 shares) | $13.35 | |
| Class I: | ||
| Net Asset Value, offering price and redemption price per share ($467,009,951 ÷ 35,013,439 shares) | $13.34 |
(a) Redemption price per share is equal to net asset value less any applicable contingent deferred sales charge.
See accompanying notes which are an integral part of the financial statements.
Statement of Operations
| Six months ended April 30, 2018 (Unaudited) | ||
| Investment Income | ||
| Dividends | $5,615,105 | |
| Interest | 5,373,621 | |
| Income from Fidelity Central Funds | 246,155 | |
| Income before foreign taxes withheld | 11,234,881 | |
| Less foreign taxes withheld | (673,906) | |
| Total income | 10,560,975 | |
| Expenses | ||
| Management fee | $3,319,473 | |
| Transfer agent fees | 773,104 | |
| Distribution and service plan fees | 293,796 | |
| Accounting and security lending fees | 200,026 | |
| Custodian fees and expenses | 276,403 | |
| Independent trustees' fees and expenses | 1,596 | |
| Registration fees | 68,467 | |
| Audit | 39,734 | |
| Legal | 1,561 | |
| Miscellaneous | 2,178 | |
| Total expenses before reductions | 4,976,338 | |
| Expense reductions | (91,097) | 4,885,241 |
| Net investment income (loss) | 5,675,734 | |
| Realized and Unrealized Gain (Loss) | ||
| Net realized gain (loss) on: | ||
| Investment securities: | ||
| Unaffiliated issuers | 6,106,347 | |
| Fidelity Central Funds | 18 | |
| Foreign currency transactions | (125,392) | |
| Futures contracts | 740,961 | |
| Total net realized gain (loss) | 6,721,934 | |
| Change in net unrealized appreciation (depreciation) on: | ||
| Investment securities: | ||
| Unaffiliated issuers (net of decrease in deferred foreign taxes of $460,015) | (10,078,136) | |
| Fidelity Central Funds | 17 | |
| Assets and liabilities in foreign currencies | (23,671) | |
| Futures contracts | (142,199) | |
| Total change in net unrealized appreciation (depreciation) | (10,243,989) | |
| Net gain (loss) | (3,522,055) | |
| Net increase (decrease) in net assets resulting from operations | $2,153,679 |
See accompanying notes which are an integral part of the financial statements.
Statement of Changes in Net Assets
| Six months ended April 30, 2018 (Unaudited) | Year ended October 31, 2017 | |
| Increase (Decrease) in Net Assets | ||
| Operations | ||
| Net investment income (loss) | $5,675,734 | $9,051,354 |
| Net realized gain (loss) | 6,721,934 | 10,774,070 |
| Change in net unrealized appreciation (depreciation) | (10,243,989) | 71,398,614 |
| Net increase (decrease) in net assets resulting from operations | 2,153,679 | 91,224,038 |
| Distributions to shareholders from net investment income | (9,831,547) | (1,957,793) |
| Distributions to shareholders from net realized gain | (10,441,996) | (138,064) |
| Total distributions | (20,273,543) | (2,095,857) |
| Share transactions - net increase (decrease) | 178,463,572 | 485,742,909 |
| Redemption fees | 23,777 | 215,914 |
| Total increase (decrease) in net assets | 160,367,485 | 575,087,004 |
| Net Assets | ||
| Beginning of period | 729,453,230 | 154,366,226 |
| End of period | $889,820,715 | $729,453,230 |
| Other Information | ||
| Undistributed net investment income end of period | $4,020,470 | $8,176,283 |
See accompanying notes which are an integral part of the financial statements.
Financial Highlights
Fidelity Total Emerging Markets Fund Class A
| Six months ended (Unaudited) April 30, | Years endedOctober 31, | |||||
| 2018 | 2017 | 2016 | 2015 | 2014 | 2013 | |
| Selected Per–Share Data | ||||||
| Net asset value, beginning of period | $13.56 | $11.33 | $10.35 | $11.56 | $11.37 | $10.86 |
| Income from Investment Operations | ||||||
| Net investment income (loss)A | .08 | .24 | .26 | .28 | .18 | .18 |
| Net realized and unrealized gain (loss) | .03B | 2.11 | .96 | (1.30) | .19 | .48 |
| Total from investment operations | .11 | 2.35 | 1.22 | (1.02) | .37 | .66 |
| Distributions from net investment income | (.16) | (.12) | (.24) | (.17) | (.18) | (.15) |
| Distributions from net realized gain | (.19) | (.01) | – | (.02) | – | (.01) |
| Total distributions | (.34)C | (.13) | (.24) | (.19) | (.18) | (.16) |
| Redemption fees added to paid in capitalA | –D | .01 | –D | –D | –D | .01 |
| Net asset value, end of period | $13.33 | $13.56 | $11.33 | $10.35 | $11.56 | $11.37 |
| Total ReturnE,F,G | .85% | 21.13% | 12.13% | (8.92)% | 3.30% | 6.23% |
| Ratios to Average Net AssetsH,I | ||||||
| Expenses before reductions | 1.38%J | 1.47% | 1.87% | 1.93% | 1.98% | 1.89% |
| Expenses net of fee waivers, if any | 1.38%J | 1.47% | 1.65% | 1.65% | 1.65% | 1.65% |
| Expenses net of all reductions | 1.36%J | 1.46% | 1.64% | 1.64% | 1.65% | 1.62% |
| Net investment income (loss) | 1.15%J | 1.97% | 2.47% | 2.58% | 1.61% | 1.61% |
| Supplemental Data | ||||||
| Net assets, end of period (000 omitted) | $49,758 | $42,213 | $15,206 | $10,164 | $13,627 | $18,837 |
| Portfolio turnover rateK | 56%J | 59% | 57% | 80% | 102% | 120% |
A Calculated based on average shares outstanding during the period.
B The amount shown for a share outstanding does not correspond with the aggregate net gain (loss) on investments for the period due to the timing of sales and repurchases of shares in relation to fluctuating market values of the investments of the Fund.
C Total distributions of $.34 per share is comprised of distributions from net investment income of $.157 and distributions from net realized gain of $.185 per share.
D Amount represents less than $.005 per share.
E Total returns for periods of less than one year are not annualized.
F Total returns would have been lower if certain expenses had not been reduced during the applicable periods shown.
G Total returns do not include the effect of the sales charges.
H Fees and expenses of any underlying Fidelity Central Funds are not included in the Fund's expense ratio. The Fund indirectly bears its proportionate share of the expenses of any underlying Fidelity Central Funds.
I Expense ratios reflect operating expenses of the class. Expenses before reductions do not reflect amounts reimbursed by the investment adviser or reductions from brokerage service arrangements or reductions from other expense offset arrangements and do not represent the amount paid by the class during periods when reimbursements or reductions occur. Expenses net of fee waivers reflect expenses after reimbursement by the investment adviser but prior to reductions from brokerage service arrangements or other expense offset arrangements. Expenses net of all reductions represent the net expenses paid by the class.
J Annualized
K Amount does not include the portfolio activity of any underlying Fidelity Central Funds.
See accompanying notes which are an integral part of the financial statements.
Fidelity Total Emerging Markets Fund Class M
| Six months ended (Unaudited) April 30, | Years endedOctober 31, | |||||
| 2018 | 2017 | 2016 | 2015 | 2014 | 2013 | |
| Selected Per–Share Data | ||||||
| Net asset value, beginning of period | $13.55 | $11.33 | $10.33 | $11.54 | $11.34 | $10.84 |
| Income from Investment Operations | ||||||
| Net investment income (loss)A | .06 | .20 | .23 | .25 | .15 | .15 |
| Net realized and unrealized gain (loss) | .04B | 2.11 | .97 | (1.30) | .19 | .48 |
| Total from investment operations | .10 | 2.31 | 1.20 | (1.05) | .34 | .63 |
| Distributions from net investment income | (.13) | (.09) | (.20) | (.14) | (.14) | (.12) |
| Distributions from net realized gain | (.19) | (.01) | – | (.02) | – | (.01) |
| Total distributions | (.32) | (.10) | (.20) | (.16) | (.14) | (.14)C |
| Redemption fees added to paid in capitalA | –D | .01 | –D | –D | –D | .01 |
| Net asset value, end of period | $13.33 | $13.55 | $11.33 | $10.33 | $11.54 | $11.34 |
| Total ReturnE,F,G | .72% | 20.66% | 11.92% | (9.18)% | 3.04% | 5.93% |
| Ratios to Average Net AssetsH,I | ||||||
| Expenses before reductions | 1.73%J | 1.82% | 2.22% | 2.27% | 2.32% | 2.13% |
| Expenses net of fee waivers, if any | 1.73%J | 1.82% | 1.90% | 1.90% | 1.90% | 1.90% |
| Expenses net of all reductions | 1.70%J | 1.81% | 1.90% | 1.89% | 1.90% | 1.88% |
| Net investment income (loss) | .81%J | 1.62% | 2.22% | 2.33% | 1.36% | 1.36% |
| Supplemental Data | ||||||
| Net assets, end of period (000 omitted) | $10,177 | $8,751 | $3,019 | $3,331 | $5,277 | $5,967 |
| Portfolio turnover rateK | 56 %J | 59% | 57% | 80% | 102% | 120% |
A Calculated based on average shares outstanding during the period.
B The amount shown for a share outstanding does not correspond with the aggregate net gain (loss) on investments for the period due to the timing of sales and repurchases of shares in relation to fluctuating market values of the investments of the Fund.
C Total distributions of $.14 per share is comprised of distributions from net investment income of $.124 and distributions from net realized gain of $.014 per share.
D Amount represents less than $.005 per share.
E Total returns for periods of less than one year are not annualized.
F Total returns would have been lower if certain expenses had not been reduced during the applicable periods shown.
G Total returns do not include the effect of the sales charges.
H Fees and expenses of any underlying Fidelity Central Funds are not included in the Fund's expense ratio. The Fund indirectly bears its proportionate share of the expenses of any underlying Fidelity Central Funds.
I Expense ratios reflect operating expenses of the class. Expenses before reductions do not reflect amounts reimbursed by the investment adviser or reductions from brokerage service arrangements or reductions from other expense offset arrangements and do not represent the amount paid by the class during periods when reimbursements or reductions occur. Expenses net of fee waivers reflect expenses after reimbursement by the investment adviser but prior to reductions from brokerage service arrangements or other expense offset arrangements. Expenses net of all reductions represent the net expenses paid by the class.
J Annualized
K Amount does not include the portfolio activity of any underlying Fidelity Central Funds.
See accompanying notes which are an integral part of the financial statements.
Fidelity Total Emerging Markets Fund Class C
| Six months ended (Unaudited) April 30, | Years endedOctober 31, | |||||
| 2018 | 2017 | 2016 | 2015 | 2014 | 2013 | |
| Selected Per–Share Data | ||||||
| Net asset value, beginning of period | $13.45 | $11.25 | $10.25 | $11.47 | $11.29 | $10.80 |
| Income from Investment Operations | ||||||
| Net investment income (loss)A | .03 | .15 | .18 | .20 | .10 | .09 |
| Net realized and unrealized gain (loss) | .03B | 2.11 | .97 | (1.30) | .19 | .47 |
| Total from investment operations | .06 | 2.26 | 1.15 | (1.10) | .29 | .56 |
| Distributions from net investment income | (.09) | (.06) | (.15) | (.10) | (.11) | (.07) |
| Distributions from net realized gain | (.19) | (.01) | – | (.02) | – | (.01) |
| Total distributions | (.28) | (.07) | (.15) | (.12) | (.11) | (.08) |
| Redemption fees added to paid in capitalA | –C | .01 | –C | –C | –C | .01 |
| Net asset value, end of period | $13.23 | $13.45 | $11.25 | $10.25 | $11.47 | $11.29 |
| Total ReturnD,E,F | .45% | 20.29% | 11.36% | (9.68)% | 2.56% | 5.31% |
| Ratios to Average Net AssetsG,H | ||||||
| Expenses before reductions | 2.13%I | 2.21% | 2.62% | 2.68% | 2.72% | 2.65% |
| Expenses net of fee waivers, if any | 2.13%I | 2.21% | 2.40% | 2.40% | 2.40% | 2.40% |
| Expenses net of all reductions | 2.11%I | 2.20% | 2.39% | 2.39% | 2.40% | 2.37% |
| Net investment income (loss) | .41%I | 1.23% | 1.72% | 1.83% | .86% | .86% |
| Supplemental Data | ||||||
| Net assets, end of period (000 omitted) | $45,585 | $34,869 | $10,710 | $7,736 | $10,104 | $7,436 |
| Portfolio turnover rateJ | 56%I | 59% | 57% | 80% | 102% | 120% |
A Calculated based on average shares outstanding during the period.
B The amount shown for a share outstanding does not correspond with the aggregate net gain (loss) on investments for the period due to the timing of sales and repurchases of shares in relation to fluctuating market values of the investments of the Fund.
C Amount represents less than $.005 per share.
D Total returns for periods of less than one year are not annualized.
E Total returns would have been lower if certain expenses had not been reduced during the applicable periods shown.
F Total returns do not include the effect of the contingent deferred sales charge.
G Fees and expenses of any underlying Fidelity Central Funds are not included in the Fund's expense ratio. The Fund indirectly bears its proportionate share of the expenses of any underlying Fidelity Central Funds.
H Expense ratios reflect operating expenses of the class. Expenses before reductions do not reflect amounts reimbursed by the investment adviser or reductions from brokerage service arrangements or reductions from other expense offset arrangements and do not represent the amount paid by the class during periods when reimbursements or reductions occur. Expenses net of fee waivers reflect expenses after reimbursement by the investment adviser but prior to reductions from brokerage service arrangements or other expense offset arrangements. Expenses net of all reductions represent the net expenses paid by the class.
I Annualized
J Amount does not include the portfolio activity of any underlying Fidelity Central Funds.
See accompanying notes which are an integral part of the financial statements.
Fidelity Total Emerging Markets Fund
| Six months ended (Unaudited) April 30, | Years endedOctober 31, | |||||
| 2018 | 2017 | 2016 | 2015 | 2014 | 2013 | |
| Selected Per–Share Data | ||||||
| Net asset value, beginning of period | $13.58 | $11.34 | $10.38 | $11.60 | $11.40 | $10.89 |
| Income from Investment Operations | ||||||
| Net investment income (loss)A | .10 | .27 | .28 | .31 | .21 | .21 |
| Net realized and unrealized gain (loss) | .03B | 2.10 | .97 | (1.31) | .19 | .47 |
| Total from investment operations | .13 | 2.37 | 1.25 | (1.00) | .40 | .68 |
| Distributions from net investment income | (.17) | (.14) | (.29) | (.20) | (.20) | (.17) |
| Distributions from net realized gain | (.19) | (.01) | – | (.02) | – | (.01) |
| Total distributions | (.36) | (.14)C | (.29) | (.22) | (.20) | (.18) |
| Redemption fees added to paid in capitalA | –D | .01 | –D | –D | –D | .01 |
| Net asset value, end of period | $13.35 | $13.58 | $11.34 | $10.38 | $11.60 | $11.40 |
| Total ReturnE,F | .98% | 21.37% | 12.44% | (8.74)% | 3.56% | 6.44% |
| Ratios to Average Net AssetsG,H | ||||||
| Expenses before reductions | 1.12%I | 1.26% | 1.62% | 1.72% | 1.73% | 1.56% |
| Expenses net of fee waivers, if any | 1.12%I | 1.26% | 1.40% | 1.40% | 1.40% | 1.40% |
| Expenses net of all reductions | 1.09%I | 1.24% | 1.39% | 1.39% | 1.40% | 1.38% |
| Net investment income (loss) | 1.42%I | 2.18% | 2.72% | 2.83% | 1.86% | 1.85% |
| Supplemental Data | ||||||
| Net assets, end of period (000 omitted) | $317,290 | $272,002 | $104,332 | $37,918 | $45,763 | $49,959 |
| Portfolio turnover rateJ | 56%I | 59% | 57% | 80% | 102% | 120% |
A Calculated based on average shares outstanding during the period.
B The amount shown for a share outstanding does not correspond with the aggregate net gain (loss) on investments for the period due to the timing of sales and repurchases of shares in relation to fluctuating market values of the investments of the Fund.
C Total distributions of $.14 per share is comprised of distributions from net investment income of $.135 and distributions from net realized gain of $.009 per share.
D Amount represents less than $.005 per share.
E Total returns for periods of less than one year are not annualized.
F Total returns would have been lower if certain expenses had not been reduced during the applicable periods shown.
G Fees and expenses of any underlying Fidelity Central Funds are not included in the Fund's expense ratio. The Fund indirectly bears its proportionate share of the expenses of any underlying Fidelity Central Funds.
H Expense ratios reflect operating expenses of the class. Expenses before reductions do not reflect amounts reimbursed by the investment adviser or reductions from brokerage service arrangements or reductions from other expense offset arrangements and do not represent the amount paid by the class during periods when reimbursements or reductions occur. Expenses net of fee waivers reflect expenses after reimbursement by the investment adviser but prior to reductions from brokerage service arrangements or other expense offset arrangements. Expenses net of all reductions represent the net expenses paid by the class.
I Annualized
J Amount does not include the portfolio activity of any underlying Fidelity Central Funds.
See accompanying notes which are an integral part of the financial statements.
Fidelity Total Emerging Markets Fund Class I
| Six months ended (Unaudited) April 30, | Years endedOctober 31, | |||||
| 2018 | 2017 | 2016 | 2015 | 2014 | 2013 | |
| Selected Per–Share Data | ||||||
| Net asset value, beginning of period | $13.58 | $11.33 | $10.37 | $11.59 | $11.40 | $10.89 |
| Income from Investment Operations | ||||||
| Net investment income (loss)A | .10 | .28 | .29 | .31 | .21 | .20 |
| Net realized and unrealized gain (loss) | .03B | 2.11 | .96 | (1.31) | .18 | .48 |
| Total from investment operations | .13 | 2.39 | 1.25 | (1.00) | .39 | .68 |
| Distributions from net investment income | (.19) | (.14) | (.29) | (.20) | (.20) | (.17) |
| Distributions from net realized gain | (.19) | (.01) | – | (.02) | – | (.01) |
| Total distributions | (.37)C | (.15) | (.29) | (.22) | (.20) | (.18) |
| Redemption fees added to paid in capitalA | –D | .01 | –D | –D | –D | .01 |
| Net asset value, end of period | $13.34 | $13.58 | $11.33 | $10.37 | $11.59 | $11.40 |
| Total ReturnE,F | .99% | 21.51% | 12.48% | (8.74)% | 3.51% | 6.44% |
| Ratios to Average Net AssetsG,H | ||||||
| Expenses before reductions | 1.11%I | 1.19% | 1.54% | 1.58% | 1.71% | 1.63% |
| Expenses net of fee waivers, if any | 1.11%I | 1.19% | 1.40% | 1.40% | 1.40% | 1.40% |
| Expenses net of all reductions | 1.09%I | 1.17% | 1.39% | 1.39% | 1.40% | 1.37% |
| Net investment income (loss) | 1.43%I | 2.25% | 2.72% | 2.83% | 1.86% | 1.86% |
| Supplemental Data | ||||||
| Net assets, end of period (000 omitted) | $467,010 | $371,617 | $21,099 | $6,343 | $4,773 | $5,354 |
| Portfolio turnover rateJ | 56%I | 59% | 57% | 80% | 102% | 120% |
A Calculated based on average shares outstanding during the period.
B The amount shown for a share outstanding does not correspond with the aggregate net gain (loss) on investments for the period due to the timing of sales and repurchases of shares in relation to fluctuating market values of the investments of the Fund.
C Total distributions of $.37 per share is comprised of distributions from net investment income of $.185 and distributions from net realized gain of $.185 per share.
D Amount represents less than $.005 per share.
E Total returns for periods of less than one year are not annualized.
F Total returns would have been lower if certain expenses had not been reduced during the applicable periods shown.
G Fees and expenses of any underlying Fidelity Central Funds are not included in the Fund's expense ratio. The Fund indirectly bears its proportionate share of the expenses of any underlying Fidelity Central Funds.
H Expense ratios reflect operating expenses of the class. Expenses before reductions do not reflect amounts reimbursed by the investment adviser or reductions from brokerage service arrangements or reductions from other expense offset arrangements and do not represent the amount paid by the class during periods when reimbursements or reductions occur. Expenses net of fee waivers reflect expenses after reimbursement by the investment adviser but prior to reductions from brokerage service arrangements or other expense offset arrangements. Expenses net of all reductions represent the net expenses paid by the class.
I Annualized
J Amount does not include the portfolio activity of any underlying Fidelity Central Funds.
See accompanying notes which are an integral part of the financial statements.
Notes to Financial Statements (Unaudited)
For the period ended April 30, 2018
1. Organization.
Fidelity Total Emerging Markets Fund (the Fund) is a fund of Fidelity Investment Trust (the Trust) and is authorized to issue an unlimited number of shares. The Trust is registered under the Investment Company Act of 1940, as amended (the 1940 Act), as an open-end management investment company organized as a Massachusetts business trust. The Fund offers Class A, Class M, Class C, Total Emerging Markets and Class I shares, each of which has equal rights as to assets and voting privileges. Each class has exclusive voting rights with respect to matters that affect that class. The Fund's investments in emerging markets can be subject to social, economic, regulatory, and political uncertainties and can be extremely volatile.
2. Investments in Fidelity Central Funds.
The Fund invests in Fidelity Central Funds, which are open-end investment companies generally available only to other investment companies and accounts managed by the investment adviser and its affiliates. The Fund's Schedule of Investments lists each of the Fidelity Central Funds held as of period end, if any, as an investment of the Fund, but does not include the underlying holdings of each Fidelity Central Fund. As an Investing Fund, the Fund indirectly bears its proportionate share of the expenses of the underlying Fidelity Central Funds.
The Money Market Central Funds seek preservation of capital and current income and are managed by Fidelity Investments Money Management, Inc. (FIMM), an affiliate of the investment adviser. Annualized expenses of the Money Market Central Funds as of their most recent shareholder report date are less than .005%.
A complete unaudited list of holdings for each Fidelity Central Fund is available upon request or at the Securities and Exchange Commission (the SEC) website at www.sec.gov. In addition, the financial statements of the Fidelity Central Funds are available on the SEC website or upon request.
3. Significant Accounting Policies.
The Fund is an investment company and applies the accounting and reporting guidance of the Financial Accounting Standards Board (FASB) Accounting Standards Codification Topic 946 Financial Services – Investments Companies. The financial statements have been prepared in conformity with accounting principles generally accepted in the United States of America (GAAP), which require management to make certain estimates and assumptions at the date of the financial statements. Actual results could differ from those estimates. Subsequent events, if any, through the date that the financial statements were issued have been evaluated in the preparation of the financial statements. The following summarizes the significant accounting policies of the Fund:
Investment Valuation. Investments are valued as of 4:00 p.m. Eastern time on the last calendar day of the period. The Board of Trustees (the Board) has delegated the day to day responsibility for the valuation of the Fund's investments to the Fair Value Committee (the Committee) established by the Fund's investment adviser. In accordance with valuation policies and procedures approved by the Board, the Fund attempts to obtain prices from one or more third party pricing vendors or brokers to value its investments. When current market prices, quotations or currency exchange rates are not readily available or reliable, investments will be fair valued in good faith by the Committee, in accordance with procedures adopted by the Board. Factors used in determining fair value vary by investment type and may include market or investment specific events, changes in interest rates and credit quality. The frequency with which these procedures are used cannot be predicted and they may be utilized to a significant extent. The Committee oversees the Fund's valuation policies and procedures and reports to the Board on the Committee's activities and fair value determinations. The Board monitors the appropriateness of the procedures used in valuing the Fund's investments and ratifies the fair value determinations of the Committee.
The Fund categorizes the inputs to valuation techniques used to value its investments into a disclosure hierarchy consisting of three levels as shown below:
- Level 1 – quoted prices in active markets for identical investments
- Level 2 – other significant observable inputs (including quoted prices for similar investments, interest rates, prepayment speeds, etc.)
- Level 3 – unobservable inputs (including the Fund's own assumptions based on the best information available)
Valuation techniques used to value the Fund's investments by major category are as follows:
Equity securities, including restricted securities, for which market quotations are readily available, are valued at the last reported sale price or official closing price as reported by a third party pricing vendor on the primary market or exchange on which they are traded and are categorized as Level 1 in the hierarchy. In the event there were no sales during the day or closing prices are not available, securities are valued at the last quoted bid price or may be valued using the last available price and are generally categorized as Level 2 in the hierarchy. For foreign equity securities, when market or security specific events arise, comparisons to the valuation of American Depositary Receipts (ADRs), futures contracts, Exchange-Traded Funds (ETFs) and certain indexes as well as quoted prices for similar securities may be used and would be categorized as Level 2 in the hierarchy. Utilizing these techniques may result in transfers between Level 1 and Level 2. For equity securities, including restricted securities, where observable inputs are limited, assumptions about market activity and risk are used and these securities may be categorized as Level 3 in the hierarchy.
Debt securities, including restricted securities, are valued based on evaluated prices received from third party pricing vendors or from brokers who make markets in such securities. Corporate bonds, foreign government and government agency obligations and U.S. government and government agency obligations are valued by pricing vendors who utilize matrix pricing which considers yield or price of bonds of comparable quality, coupon, maturity and type or by broker-supplied prices. When independent prices are unavailable or unreliable, debt securities may be valued utilizing pricing methodologies which consider similar factors that would be used by third party pricing vendors. Debt securities are generally categorized as Level 2 in the hierarchy but may be Level 3 depending on the circumstances.
Futures contracts are valued at the settlement price established each day by the board of trade or exchange on which they are traded and are categorized as Level 1 in the hierarchy.
Investments in open-end mutual funds, including the Fidelity Central Funds, are valued at their closing net asset value (NAV) each business day and are categorized as Level 1 in the hierarchy.
Changes in valuation techniques may result in transfers in or out of an assigned level within the disclosure hierarchy. The aggregate value of investments by input level as of April 30, 2018, including information on transfers between Levels 1 and 2, is included at the end of the Fund's Schedule of Investments.
Foreign Currency. The Fund may use foreign currency contracts to facilitate transactions in foreign-denominated securities. Gains and losses from these transactions may arise from changes in the value of the foreign currency or if the counterparties do not perform under the contracts' terms.
Foreign-denominated assets, including investment securities, and liabilities are translated into U.S. dollars at the exchange rates at period end. Purchases and sales of investment securities, income and dividends received and expenses denominated in foreign currencies are translated into U.S. dollars at the exchange rate in effect on the transaction date.
The effects of exchange rate fluctuations on investments are included with the net realized and unrealized gain (loss) on investment securities. Other foreign currency transactions resulting in realized and unrealized gain (loss) are disclosed separately.
Investment Transactions and Income. For financial reporting purposes, the Fund's investment holdings and NAV include trades executed through the end of the last business day of the period. The NAV per share for processing shareholder transactions is calculated as of the close of business of the New York Stock Exchange (NYSE), normally 4:00 p.m. Eastern time and includes trades executed through the end of the prior business day. Gains and losses on securities sold are determined on the basis of identified cost. Dividend income is recorded on the ex-dividend date, except for certain dividends from foreign securities where the ex-dividend date may have passed, which are recorded as soon as the Fund is informed of the ex-dividend date. Non-cash dividends included in dividend income, if any, are recorded at the fair market value of the securities received. Income and capital gain distributions from Fidelity Central Funds, if any, are recorded on the ex-dividend date. Certain distributions received by the Fund represent a return of capital or capital gain. The Fund determines the components of these distributions subsequent to the ex-dividend date, based upon receipt of tax filings or other correspondence relating to the underlying investment. These distributions are recorded as a reduction of cost of investments and/or as a realized gain. Interest income is accrued as earned and includes coupon interest and amortization of premium and accretion of discount on debt securities as applicable. Paid in Kind (PIK) income is recorded at the fair market value of the securities received. Investment income is recorded net of foreign taxes withheld where recovery of such taxes is uncertain. Debt obligations may be placed on non-accrual status and related interest income may be reduced by ceasing current accruals and writing off interest receivables when the collection of all or a portion of interest has become doubtful based on consistently applied procedures. A debt obligation is removed from non-accrual status when the issuer resumes interest payments or when collectability of interest is reasonably assured.
Class Allocations and Expenses. Investment income, realized and unrealized capital gains and losses, common expenses of the Fund, and certain fund-level expense reductions, if any, are allocated daily on a pro-rata basis to each class based on the relative net assets of each class to the total net assets of the Fund. Each class differs with respect to transfer agent and distribution and service plan fees incurred. Certain expense reductions may also differ by class. For the reporting period, the allocated portion of income and expenses to each class as a percent of its average net assets may vary due to the timing of recording these transactions in relation to fluctuating net assets of the classes. Expenses directly attributable to a fund are charged to that fund. Expenses attributable to more than one fund are allocated among the respective funds on the basis of relative net assets or other appropriate methods. Expense estimates are accrued in the period to which they relate and adjustments are made when actual amounts are known.
Income Tax Information and Distributions to Shareholders. Each year, the Fund intends to qualify as a regulated investment company under Subchapter M of the Internal Revenue Code, including distributing substantially all of its taxable income and realized gains. As a result, no provision for U.S. Federal income taxes is required. The Fund files a U.S. federal tax return, in addition to state and local tax returns as required. The Fund's federal income tax returns are subject to examination by the Internal Revenue Service (IRS) for a period of three fiscal years after they are filed. State and local tax returns may be subject to examination for an additional fiscal year depending on the jurisdiction. Foreign taxes are provided for based on the Fund's understanding of the tax rules and rates that exist in the foreign markets in which it invests. The Fund is subject to a tax imposed on capital gains by certain countries in which it invests. An estimated deferred tax liability for net unrealized appreciation on the applicable securities is included in Other payables and accrued expenses on the Statement of Assets & Liabilities.
Distributions are declared and recorded on the ex-dividend date. Income and capital gain distributions are declared separately for each class. Income and capital gain distributions are determined in accordance with income tax regulations, which may differ from GAAP.
Capital accounts within the financial statements are adjusted for permanent book-tax differences. These adjustments have no impact on net assets or the results of operations. Capital accounts are not adjusted for temporary book-tax differences which will reverse in a subsequent period.
Book-tax differences are primarily due to foreign currency transactions, futures contracts, certain foreign taxes, market discount, passive foreign investment companies (PFIC), capital loss carryforwards and losses deferred due to wash sales.
As of period end, the cost and unrealized appreciation (depreciation) in securities, and derivatives if applicable, for federal income tax purposes were as follows:
| Gross unrealized appreciation | $105,395,389 |
| Gross unrealized depreciation | (36,425,511) |
| Net unrealized appreciation (depreciation) | $68,969,878 |
| Tax cost | $821,270,918 |
Short-Term Trading (Redemption) Fees. Shares held by investors in the Fund less than 90 days may have been subject to a redemption fee equal to 1.50% of the NAV of shares redeemed. All redemption fees, which reduce the proceeds of the shareholder redemption, are retained by the Fund and accounted for as an addition to paid in capital. In November 2017, the Board of Trustees approved the elimination of these redemption fees effective December 18, 2017.
Restricted Securities. The Fund may invest in securities that are subject to legal or contractual restrictions on resale. These securities generally may be resold in transactions exempt from registration or to the public if the securities are registered. Disposal of these securities may involve time-consuming negotiations and expense, and prompt sale at an acceptable price may be difficult. Information regarding restricted securities is included at the end of the Fund's Schedule of Investments.
4. Derivative Instruments.
Risk Exposures and the Use of Derivative Instruments. The Fund's investment objective allows the Fund to enter into various types of derivative contracts, including futures contracts. Derivatives are investments whose value is primarily derived from underlying assets, indices or reference rates and may be transacted on an exchange or over-the-counter (OTC). Derivatives may involve a future commitment to buy or sell a specified asset based on specified terms, to exchange future cash flows at periodic intervals based on a notional principal amount, or for one party to make one or more payments upon the occurrence of specified events in exchange for periodic payments from the other party.
The Fund used derivatives to increase returns and to manage exposure to certain risks as defined below. The success of any strategy involving derivatives depends on analysis of numerous economic factors, and if the strategies for investment do not work as intended, the Fund may not achieve its objectives.
The Fund's use of derivatives increased or decreased its exposure to the following risk:
| Equity Risk | Equity risk relates to the fluctuations in the value of financial instruments as a result of changes in market prices (other than those arising from interest rate risk or foreign exchange risk), whether caused by factors specific to an individual investment, its issuer, or all factors affecting all instruments traded in a market or market segment. |
The Fund is also exposed to additional risks from investing in derivatives, such as liquidity risk and counterparty credit risk. Liquidity risk is the risk that the Fund will be unable to close out the derivative in the open market in a timely manner. Counterparty credit risk is the risk that the counterparty will not be able to fulfill its obligation to the Fund. Counterparty credit risk related to exchange-traded futures contracts may be mitigated by the protection provided by the exchange on which they trade.
Investing in derivatives may involve greater risks than investing in the underlying assets directly and, to varying degrees, may involve risk of loss in excess of any initial investment and collateral received and amounts recognized in the Statement of Assets and Liabilities. In addition, there may be the risk that the change in value of the derivative contract does not correspond to the change in value of the underlying instrument.
Futures Contracts. A futures contract is an agreement between two parties to buy or sell a specified underlying instrument for a fixed price at a specified future date. The Fund used futures contracts to manage its exposure to the stock market.
Upon entering into a futures contract, a fund is required to deposit either cash or securities (initial margin) with a clearing broker in an amount equal to a certain percentage of the face value of the contract. Futures contracts are marked-to-market daily and subsequent daily payments (variation margin) are made or received by a fund depending on the daily fluctuations in the value of the futures contracts and are recorded as unrealized appreciation or (depreciation). This receivable and/or payable, if any, is included in daily variation margin on futures contracts in the Statement of Assets and Liabilities. Realized gain or (loss) is recorded upon the expiration or closing of a futures contract. The net realized gain (loss) and change in net unrealized appreciation (depreciation) on futures contracts during the period is presented in the Statement of Operations.
Any open futures contracts at period end are presented in the Schedule of Investments under the caption "Futures Contracts". The notional amount at value reflects each contract's exposure to the underlying instrument or index at period end. Securities deposited to meet initial margin requirements are identified in the Schedule of Investments.
5. Purchases and Sales of Investments.
Purchases and sales of securities, other than short-term securities and U.S. government securities, aggregated $367,396,490 and $223,127,089, respectively.
6. Fees and Other Transactions with Affiliates.
Management Fee. Fidelity Management & Research Company (the investment adviser) and its affiliates provide the Fund with investment management related services for which the Fund pays a monthly management fee. The management fee is the sum of an individual fund fee rate that is based on an annual rate of .55% of the Fund's average net assets and an annualized group fee rate that averaged .24% during the period. The group fee rate is based upon the average net assets of all the mutual funds advised by the investment adviser, including any mutual funds previously advised by the investment adviser that are currently advised by Fidelity SelectCo, LLC, an affiliate of the investment adviser. The group fee rate decreases as assets under management increase and increases as assets under management decrease. For the reporting period, the total annualized management fee rate was .79% of the Fund's average net assets.
Distribution and Service Plan Fees. In accordance with Rule 12b-1 of the 1940 Act, the Fund has adopted separate Distribution and Service Plans for each class of shares. Certain classes pay Fidelity Distributors Corporation (FDC), an affiliate of the investment adviser, separate Distribution and Service Fees, each of which is based on an annual percentage of each class' average net assets. In addition, FDC may pay financial intermediaries for selling shares of the Fund and providing shareholder support services. For the period, the Distribution and Service Fee rates, total fees and amounts retained by FDC were as follows:
| Distribution Fee | Service Fee | Total Fees | Retained by FDC | |
| Class A | -% | .25% | $61,249 | $4,880 |
| Class M | .25% | .25% | 23,636 | 179 |
| Class C | .75% | .25% | 208,911 | 96,484 |
| $293,796 | $101,543 |
Sales Load. FDC may receive a front-end sales charge of up to 5.75% for selling Class A shares and 3.50% for selling Class M shares, some of which is paid to financial intermediaries for selling shares of the Fund. Depending on the holding period, FDC may receive contingent deferred sales charges levied on Class A, Class M and Class C redemptions. The deferred sales charges are 1.00% for Class C shares, 1.00% for certain purchases of Class A shares and .25% for certain purchases of Class M shares.
For the period, sales charge amounts retained by FDC were as follows:
| Retained by FDC | |
| Class A | $42,561 |
| Class M | 5,884 |
| Class C(a) | 4,092 |
| $52,537 |
(a) When Class C shares are initially sold, FDC pays commissions from its own resources to financial intermediaries through which the sales are made.
Transfer Agent Fees. Fidelity Investments Institutional Operations Company, Inc., (FIIOC), an affiliate of the investment adviser, is the transfer, dividend disbursing and shareholder servicing agent for each class of the Fund. FIIOC receives account fees and asset-based fees that vary according to the account size and type of account of the shareholders of the respective classes of the Fund. FIIOC pays for typesetting, printing and mailing of shareholder reports, except proxy statements.
For the period, transfer agent fees for each class were as follows:
| Amount | % of Class-Level Average Net Assets(a) | |
| Class A | $49,808 | .20 |
| Class M | 13,938 | .29 |
| Class C | 41,916 | .20 |
| Total Emerging Markets | 285,436 | .18 |
| Class I | 382,006 | .18 |
| $773,104 |
(a) Annualized
Accounting and Security Lending Fees. Fidelity Service Company, Inc. (FSC), an affiliate of the investment adviser, maintains the Fund's accounting records. The accounting fee is based on the level of average net assets for each month. Under a separate contract, FSC administers the security lending program. The security lending fee is based on the number and duration of lending transactions. For the period, the fees were equivalent to an annualized rate of .05%.
Brokerage Commissions. The Fund placed a portion of its portfolio transactions with brokerage firms which are affiliates of the investment adviser. Brokerage commissions are included in net realized gain (loss) and change in net unrealized appreciation (depreciation) in the Statement of Operations. The commissions paid to these affiliated firms were $1,394 for the period.
Interfund Trades. The Fund may purchase from or sell securities to other Fidelity Funds under procedures adopted by the Board. The procedures have been designed to ensure these interfund trades are executed in accordance with Rule 17a-7 of the 1940 Act. Interfund trades are included within the respective purchases and sales amounts shown in the Purchases and Sales of Investments note.
7. Committed Line of Credit.
The Fund participates with other funds managed by the investment adviser or an affiliate in a $4.25 billion credit facility (the "line of credit") to be utilized for temporary or emergency purposes to fund shareholder redemptions or for other short-term liquidity purposes. The Fund has agreed to pay commitment fees on its pro-rata portion of the line of credit, which amounted to $1,144 and is reflected in Miscellaneous expenses on the Statement of Operations. During the period, the Fund did not borrow on this line of credit.
8. Security Lending.
The Fund lends portfolio securities through a lending agent from time to time in order to earn additional income. For equity securities, a lending agent is used and may loan securities to certain qualified borrowers, including Fidelity Capital Markets (FCM), a broker-dealer affiliated with the Fund. On the settlement date of the loan, the Fund receives collateral (in the form of U.S. Treasury obligations, letters of credit and/or cash) against the loaned securities and maintains collateral in an amount not less than 100% of the market value of the loaned securities during the period of the loan. The market value of the loaned securities is determined at the close of business of the Fund and any additional required collateral is delivered to the Fund on the next business day. The Fund or borrower may terminate the loan at any time, and if the borrower defaults on its obligation to return the securities loaned because of insolvency or other reasons, the Fund may apply collateral received from the borrower against the obligation. The Fund may experience delays and costs in recovering the securities loaned. Any cash collateral received is invested in the Fidelity Securities Lending Cash Central Fund. The value of loaned securities and cash collateral at period end are disclosed on the Fund's Statement of Assets and Liabilities. Security lending income represents the income earned on investing cash collateral, less rebates paid to borrowers and any lending agent fees associated with the loan, plus any premium payments received for lending certain types of securities. Security lending income is presented in the Statement of Operations as a component of income from Fidelity Central Funds. Total security lending income during the period amounted to $12,065. During the period, there were no securities loaned to FCM.
9. Expense Reductions.
Commissions paid to certain brokers with whom the investment adviser, or its affiliates, places trades on behalf of the Fund include an amount in addition to trade execution, which may be rebated back to the Fund to offset certain expenses. This amount totaled $86,707 for the period. Through arrangements with the Fund's custodian, credits realized as a result of certain uninvested cash balances were used to reduce the Fund's expenses. During the period, these credits reduced the Fund's custody expenses by $571.
In addition, during the period the investment adviser reimbursed and/or waived a portion of fund-level operating expenses in the amount of $3,819.
10. Distributions to Shareholders.
Distributions to shareholders of each class were as follows:
| Six months ended April 30, 2018 | Year ended October 31, 2017 | |
| From net investment income | ||
| Class A | $539,474 | $195,255 |
| Class M | 85,818 | 23,027 |
| Class C | 262,508 | 57,828 |
| Total Emerging Markets | 3,522,023 | 1,274,142 |
| Class I | 5,421,724 | 407,541 |
| Total | $9,831,547 | $1,957,793 |
| From net realized gain | ||
| Class A | $633,778 | $14,644 |
| Class M | 122,125 | 2,410 |
| Class C | 519,690 | 9,294 |
| Total Emerging Markets | 3,744,679 | 84,943 |
| Class I | 5,421,724 | 26,773 |
| Total | $10,441,996 | $138,064 |
11. Share Transactions.
Share transactions for each class were as follows and may contain automatic conversions between classes or exchanges between affiliated funds:
| Shares | Shares | Dollars | Dollars | |
| Six months ended April 30, 2018 | Year ended October 31, 2017 | Six months ended April 30, 2018 | Year ended October 31, 2017 | |
| Class A | ||||
| Shares sold | 1,418,677 | 3,615,728 | $19,542,590 | $43,198,307 |
| Reinvestment of distributions | 88,408 | 19,523 | 1,166,980 | 207,918 |
| Shares redeemed | (887,665) | (1,863,978) | (12,256,114) | (21,909,724) |
| Net increase (decrease) | 619,420 | 1,771,273 | $8,453,456 | $21,496,501 |
| Class M | ||||
| Shares sold | 204,308 | 451,431 | $2,817,255 | $5,673,545 |
| Reinvestment of distributions | 15,634 | 2,361 | 206,523 | 25,216 |
| Shares redeemed | (102,047) | (74,567) | (1,396,873) | (886,466) |
| Net increase (decrease) | 117,895 | 379,225 | $1,626,905 | $4,812,295 |
| Class C | ||||
| Shares sold | 1,065,073 | 1,907,365 | $14,566,948 | $23,252,010 |
| Reinvestment of distributions | 59,490 | 6,299 | 781,699 | 66,954 |
| Shares redeemed | (272,393) | (272,258) | (3,706,534) | (3,283,907) |
| Net increase (decrease) | 852,170 | 1,641,406 | $11,642,113 | $20,035,057 |
| Total Emerging Markets | ||||
| Shares sold | 6,685,597 | 17,602,916 | $92,899,253 | $212,356,677 |
| Reinvestment of distributions | 522,036 | 124,771 | 6,896,099 | 1,328,813 |
| Shares redeemed | (3,475,003) | (6,900,916) | (47,731,993) | (84,713,141) |
| Net increase (decrease) | 3,732,630 | 10,826,771 | $52,063,359 | $128,972,349 |
| Class I | ||||
| Shares sold | 10,196,615 | 29,232,950 | $140,358,949 | $357,207,778 |
| Reinvestment of distributions | 792,863 | 38,174 | 10,457,863 | 405,784 |
| Shares redeemed | (3,348,167) | (3,761,001) | (46,139,073) | (47,186,855) |
| Net increase (decrease) | 7,641,311 | 25,510,123 | $104,677,739 | $310,426,707 |
12. Other.
The Fund's organizational documents provide former and current trustees and officers with a limited indemnification against liabilities arising in connection with the performance of their duties to the Fund. In the normal course of business, the Fund may also enter into contracts that provide general indemnifications. The Fund's maximum exposure under these arrangements is unknown as this would be dependent on future claims that may be made against the Fund. The risk of material loss from such claims is considered remote.
Shareholder Expense Example
As a shareholder of a Fund, you incur two types of costs: (1) transaction costs, including sales charges (loads) on purchase payments or redemption proceeds, redemption fees and (2) ongoing costs, including management fees, distribution and/or service (12b-1) fees and other Fund expenses. This Example is intended to help you understand your ongoing costs (in dollars) of investing in the Funds and to compare these costs with the ongoing costs of investing in other mutual funds.
The Example is based on an investment of $1,000 invested at the beginning of the period and held for the entire period (November 1, 2017 to April 30, 2018).
Actual Expenses
The first line of the accompanying table for each Class of each fund provides information about actual account values and actual expenses. You may use the information in this line, together with the amount you invested, to estimate the expenses that you paid over the period. Simply divide your account value by $1,000.00 (for example, an $8,600 account value divided by $1,000.00 = 8.6), then multiply the result by the number in the first line for a Class of the fund under the heading entitled "Expenses Paid During Period" to estimate the expenses you paid on your account during this period. A small balance maintenance fee of $12.00 that is charged once a year may apply for certain accounts with a value of less than $2,000. This fee is not included in the table below. If it was, the estimate of expenses you paid during the period would be higher, and your ending account value lower, by this amount. In addition, each Fund, as a shareholder in the underlying Fidelity Central Funds, will indirectly bear its pro-rata share of the fees and expenses incurred by the underlying Fidelity Central Funds. These fees and expenses are not included in the Fund's annualized expense ratio used to calculate the expense estimate in the table below.
Hypothetical Example for Comparison Purposes
The second line of the accompanying table for each Class of each fund provides information about hypothetical account values and hypothetical expenses based on a Class' actual expense ratio and an assumed rate of return of 5% per year before expenses, which is not the Class' actual return. The hypothetical account values and expenses may not be used to estimate the actual ending account balance or expenses you paid for the period. You may use this information to compare the ongoing costs of investing in the Fund and other funds. To do so, compare this 5% hypothetical example with the 5% hypothetical examples that appear in the shareholder reports of the other funds. A small balance maintenance fee of $12.00 that is charged once a year may apply for certain accounts with a value of less than $2,000. This fee is not included in the table below. If it was, the estimate of expenses you paid during the period would be higher, and your ending account value lower, by this amount. In addition, each Fund, as a shareholder in the underlying Fidelity Central Funds, will indirectly bear its pro-rata share of the fees and expenses incurred by the underlying Fidelity Central Funds. These fees and expenses are not included in the Fund's annualized expense ratio used to calculate the expense estimate in the table below.
Please note that the expenses shown in the table are meant to highlight your ongoing costs only and do not reflect any transaction costs. Therefore, the second line of the table is useful in comparing ongoing costs only, and will not help you determine the relative total costs of owning different funds. In addition, if these transactional costs were included, your costs would have been higher.
| Annualized Expense Ratio-A | Beginning Account Value November 1, 2017 | Ending Account Value April 30, 2018 | Expenses Paid During Period-B November 1, 2017 to April 30, 2018 | |
| Fidelity Emerging Markets Discovery Fund | ||||
| Class A | 1.49% | |||
| Actual | $1,000.00 | $1,055.20 | $7.59 | |
| Hypothetical-C | $1,000.00 | $1,017.41 | $7.45 | |
| Class M | 1.76% | |||
| Actual | $1,000.00 | $1,053.50 | $8.96 | |
| Hypothetical-C | $1,000.00 | $1,016.07 | $8.80 | |
| Class C | 2.24% | |||
| Actual | $1,000.00 | $1,051.50 | $11.39 | |
| Hypothetical-C | $1,000.00 | $1,013.69 | $11.18 | |
| Emerging Markets Discovery | 1.20% | |||
| Actual | $1,000.00 | $1,057.20 | $6.12 | |
| Hypothetical-C | $1,000.00 | $1,018.84 | $6.01 | |
| Class I | 1.20% | |||
| Actual | $1,000.00 | $1,057.20 | $6.12 | |
| Hypothetical-C | $1,000.00 | $1,018.84 | $6.01 | |
| Fidelity Total Emerging Markets Fund | ||||
| Class A | 1.38% | |||
| Actual | $1,000.00 | $1,008.50 | $6.87 | |
| Hypothetical-C | $1,000.00 | $1,017.95 | $6.90 | |
| Class M | 1.73% | |||
| Actual | $1,000.00 | $1,007.20 | $8.61 | |
| Hypothetical-C | $1,000.00 | $1,016.22 | $8.65 | |
| Class C | 2.13% | |||
| Actual | $1,000.00 | $1,004.50 | $10.59 | |
| Hypothetical-C | $1,000.00 | $1,014.23 | $10.64 | |
| Total Emerging Markets | 1.12% | |||
| Actual | $1,000.00 | $1,009.80 | $5.58 | |
| Hypothetical-C | $1,000.00 | $1,019.24 | $5.61 | |
| Class I | 1.11% | |||
| Actual | $1,000.00 | $1,009.90 | $5.53 | |
| Hypothetical-C | $1,000.00 | $1,019.29 | $5.56 |
A Annualized expense ratio reflects expenses net of applicable fee waivers.
B Expenses are equal to each Class' annualized expense ratio, multiplied by the average account value over the period, multiplied by 181/ 365 (to reflect the one-half year period).
C 5% return per year before expenses
![]()
Corporate Headquarters
245 Summer St.
Boston, MA 02210
www.fidelity.com
EMD-TEK-SANN-0618
1.931240.106
Fidelity Advisor® Emerging Markets Discovery Fund - Semi-Annual Report April 30, 2018 Class A, Class M, Class C and Class I are classes of Fidelity® Emerging Markets Discovery Fund |
|
Contents
To view a fund's proxy voting guidelines and proxy voting record for the 12-month period ended June 30, visit http://www.fidelity.com/proxyvotingresults or visit the Securities and Exchange Commission's (SEC) web site at http://www.sec.gov.
You may also call 1-877-208-0098 to request a free copy of the proxy voting guidelines.
Standard & Poor's, S&P and S&P 500 are registered service marks of The McGraw-Hill Companies, Inc. and have been licensed for use by Fidelity Distributors Corporation.
Other third-party marks appearing herein are the property of their respective owners.
All other marks appearing herein are registered or unregistered trademarks or service marks of FMR LLC or an affiliated company. © 2018 FMR LLC. All rights reserved.
This report and the financial statements contained herein are submitted for the general information of the shareholders of the Fund. This report is not authorized for distribution to prospective investors in the Fund unless preceded or accompanied by an effective prospectus.
A fund files its complete schedule of portfolio holdings with the SEC for the first and third quarters of each fiscal year on Form N-Q. Forms N-Q are available on the SEC’s web site at http://www.sec.gov. A fund's Forms N-Q may be reviewed and copied at the SEC’s Public Reference Room in Washington, DC. Information regarding the operation of the SEC's Public Reference Room may be obtained by calling 1-800-SEC-0330.
For a complete list of a fund's portfolio holdings, view the most recent holdings listing, semiannual report, or annual report on Fidelity's web site at http://www.fidelity.com, http://www.institutional.fidelity.com, or http://www.401k.com, as applicable.
NOT FDIC INSURED •MAY LOSE VALUE •NO BANK GUARANTEE
Neither the Fund nor Fidelity Distributors Corporation is a bank.
Investment Summary (Unaudited)
Top Five Stocks as of April 30, 2018
| % of fund's net assets | |
| CSPC Pharmaceutical Group Ltd. (Hong Kong, Pharmaceuticals) | 1.5 |
| Top Glove Corp. Bhd (Malaysia, Health Care Equipment & Supplies) | 1.4 |
| Sunny Optical Technology Group Co. Ltd. (Cayman Islands, Electronic Equipment & Components) | 1.4 |
| Imperial Holdings Ltd. (South Africa, Distributors) | 1.2 |
| Yandex NV Series A (Netherlands, Internet Software & Services) | 1.2 |
| 6.7 |
Top Five Market Sectors as of April 30, 2018
| % of fund's net assets | |
| Information Technology | 16.0 |
| Consumer Discretionary | 14.3 |
| Industrials | 11.4 |
| Financials | 11.0 |
| Materials | 10.2 |
Top Five Countries as of April 30, 2018
| (excluding cash equivalents) | % of fund's net assets |
| Cayman Islands | 12.7 |
| Brazil | 8.5 |
| India | 7.8 |
| Korea (South) | 7.6 |
| Taiwan | 6.4 |
Percentages are adjusted for the effect of futures contracts, if applicable.
Asset Allocation (% of fund's net assets)
| As of April 30, 2018 | ||
| Stocks and Equity Futures | 96.1% | |
| Short-Term Investments and Net Other Assets (Liabilities) | 3.9% | |

Schedule of Investments April 30, 2018 (Unaudited)
Showing Percentage of Net Assets
| Common Stocks - 88.9% | |||
| Shares | Value | ||
| Argentina - 1.4% | |||
| BBVA Banco Frances SA sponsored ADR | 69,900 | $1,555,275 | |
| Central Puerto SA sponsored ADR (a) | 78,900 | 1,220,583 | |
| Inversiones y Representaciones SA ADR (b) | 73,510 | 1,687,055 | |
| Telecom Argentina SA Class B sponsored ADR | 16,600 | 498,664 | |
| YPF SA Class D sponsored ADR | 74,600 | 1,632,994 | |
| TOTAL ARGENTINA | 6,594,571 | ||
| Bailiwick of Jersey - 0.2% | |||
| WNS Holdings Ltd. sponsored ADR (a) | 17,800 | 870,954 | |
| Bangladesh - 0.2% | |||
| BRAC Bank Ltd. | 895,500 | 945,924 | |
| Bermuda - 2.1% | |||
| Joy City Property Ltd. | 14,069,000 | 2,206,985 | |
| Pacific Basin Shipping Ltd. (a) | 11,311,000 | 3,007,532 | |
| PAX Global Technology Ltd. | 1,409,000 | 637,353 | |
| Shangri-La Asia Ltd. | 2,202,000 | 4,285,347 | |
| TOTAL BERMUDA | 10,137,217 | ||
| Brazil - 6.6% | |||
| Azul SA sponsored ADR | 104,245 | 3,231,595 | |
| BTG Pactual Participations Ltd. unit | 274,200 | 1,751,712 | |
| Cia. Hering SA | 365,100 | 1,990,583 | |
| Companhia de Saneamento de Minas Gerais | 96,020 | 1,381,425 | |
| Construtora Tenda SA (a) | 183,200 | 1,334,047 | |
| Cyrela Brazil Realty SA | 254,800 | 1,010,996 | |
| Direcional Engenharia SA (a) | 463,300 | 805,406 | |
| Fibria Celulose SA | 211,100 | 4,146,435 | |
| Hypermarcas SA | 351,938 | 3,164,549 | |
| Instituto Hermes Pardini SA | 161,800 | 1,200,383 | |
| Localiza Rent A Car SA | 420,385 | 3,346,808 | |
| Petrobras Distribuidora SA | 114,500 | 750,434 | |
| QGEP Participacoes SA | 1,417,200 | 5,166,032 | |
| Tegma Gestao Logistica SA | 441,600 | 2,900,553 | |
| TOTAL BRAZIL | 32,180,958 | ||
| British Virgin Islands - 0.7% | |||
| Dolphin Capital Investors Ltd. (a) | 8,361,857 | 834,603 | |
| Mail.Ru Group Ltd. GDR (Reg. S) (a) | 85,800 | 2,711,280 | |
| TOTAL BRITISH VIRGIN ISLANDS | 3,545,883 | ||
| Canada - 1.1% | |||
| First Quantum Minerals Ltd. | 195,600 | 2,818,334 | |
| Pan American Silver Corp. | 149,600 | 2,411,552 | |
| TOTAL CANADA | 5,229,886 | ||
| Cayman Islands - 12.7% | |||
| 58.com, Inc. ADR (a) | 66,900 | 5,846,391 | |
| ASM Pacific Technology Ltd. | 188,000 | 2,576,227 | |
| Changyou.com Ltd. (A Shares) ADR (b) | 49,700 | 945,791 | |
| Cheetah Mobile, Inc. ADR (a)(b) | 65,200 | 874,332 | |
| China Medical System Holdings Ltd. | 1,734,000 | 4,246,178 | |
| Daqo New Energy Corp. ADR (a) | 20,200 | 1,077,670 | |
| ENN Energy Holdings Ltd. | 328,000 | 3,067,302 | |
| Fu Shou Yuan International Group Ltd. (c) | 5,808,000 | 5,540,234 | |
| General Interface Solution Holding Ltd. | 266,000 | 1,589,470 | |
| Haitian International Holdings Ltd. | 1,516,000 | 4,034,534 | |
| IGG, Inc. | 1,579,000 | 2,374,654 | |
| JA Solar Holdings Co. Ltd. ADR (a)(b) | 75,900 | 535,854 | |
| Lee's Pharmaceutical Holdings Ltd. | 1,009,000 | 1,304,561 | |
| Longfor Properties Co. Ltd. | 563,000 | 1,683,783 | |
| Shimao Property Holdings Ltd. | 1,171,500 | 3,098,694 | |
| Silicon Motion Technology Corp. sponsored ADR | 13,300 | 601,293 | |
| SITC International Holdings Co. Ltd. | 4,295,500 | 4,576,623 | |
| Sunny Optical Technology Group Co. Ltd. | 406,700 | 6,636,383 | |
| TPK Holding Co. Ltd. (a) | 454,000 | 988,467 | |
| Uni-President China Holdings Ltd. | 3,179,000 | 3,005,212 | |
| Yirendai Ltd. sponsored ADR (b) | 53,620 | 1,891,177 | |
| Yuzhou Properties Co. | 3,041,000 | 2,212,117 | |
| YY, Inc. ADR (a) | 33,700 | 3,248,343 | |
| TOTAL CAYMAN ISLANDS | 61,955,290 | ||
| Chile - 0.6% | |||
| Compania Cervecerias Unidas SA sponsored ADR (b) | 111,400 | 3,076,868 | |
| China - 4.7% | |||
| BBMG Corp. (H Shares) | 3,182,000 | 1,451,337 | |
| China Longyuan Power Grid Corp. Ltd. (H Shares) | 5,774,200 | 5,671,536 | |
| China Suntien Green Energy Corp. Ltd. (H Shares) | 4,917,000 | 1,644,024 | |
| Qingdao Haier Co. Ltd. | 906,960 | 2,449,949 | |
| Shanghai International Airport Co. Ltd. (A Shares) | 293,841 | 2,307,869 | |
| Suofeiya Home Collection Co. Ltd. Class A | 432,220 | 2,190,707 | |
| TravelSky Technology Ltd. (H Shares) | 680,000 | 1,986,299 | |
| Tsingtao Brewery Co. Ltd. (H Shares) | 442,000 | 2,288,409 | |
| Zhengzhou Yutong Bus Co. Ltd. | 958,862 | 3,097,746 | |
| TOTAL CHINA | 23,087,876 | ||
| Colombia - 0.2% | |||
| Bancolombia SA sponsored ADR | 17,600 | 838,816 | |
| Cyprus - 0.6% | |||
| Globaltrans Investment PLC GDR (Reg. S) | 287,200 | 3,021,344 | |
| Egypt - 1.5% | |||
| Credit Agricole Egypt | 346,080 | 891,908 | |
| Egyptian Kuwaiti Holding | 2,135,200 | 2,412,776 | |
| Six of October Development & Investment Co. (a) | 2,569,600 | 3,887,512 | |
| TOTAL EGYPT | 7,192,196 | ||
| Greece - 2.0% | |||
| Alpha Bank AE (a) | 979,300 | 2,589,900 | |
| Fourlis Holdings SA | 492,200 | 3,506,846 | |
| Titan Cement Co. SA (Reg.) | 146,600 | 3,868,196 | |
| TOTAL GREECE | 9,964,942 | ||
| Hong Kong - 5.1% | |||
| China Resources Beer Holdings Co. Ltd. | 856,000 | 3,686,731 | |
| China Travel International Investment HK Ltd. | 6,926,000 | 2,582,328 | |
| CSPC Pharmaceutical Group Ltd. | 2,792,000 | 7,111,383 | |
| Far East Horizon Ltd. | 1,786,584 | 1,772,805 | |
| Techtronic Industries Co. Ltd. | 514,000 | 3,011,111 | |
| Winteam Pharmaceutical Group Ltd. | 5,132,000 | 4,412,918 | |
| Yuexiu Property Co. Ltd. | 9,374,000 | 2,108,980 | |
| TOTAL HONG KONG | 24,686,256 | ||
| India - 7.8% | |||
| Adani Ports & Special Economic Zone Ltd. | 647,392 | 3,960,153 | |
| Arvind Mills Ltd. | 315,101 | 1,998,550 | |
| CESC Ltd. GDR | 78,139 | 1,243,823 | |
| Deccan Cements Ltd. | 208,246 | 1,661,301 | |
| EIH Ltd. (a) | 745,548 | 1,962,291 | |
| Federal Bank Ltd. | 1,431,618 | 2,108,379 | |
| InterGlobe Aviation Ltd. (c) | 153,130 | 3,224,134 | |
| JK Cement Ltd. | 127,371 | 1,913,332 | |
| LIC Housing Finance Ltd. | 217,310 | 1,779,174 | |
| Manappuram General Finance & Leasing Ltd. | 1,310,688 | 2,398,223 | |
| Oberoi Realty Ltd. | 299,038 | 2,463,727 | |
| Phoenix Mills Ltd. (a) | 210,941 | 1,978,239 | |
| Shriram Transport Finance Co. Ltd. | 84,800 | 2,047,114 | |
| Solar Industries India Ltd. (a) | 67,845 | 1,084,685 | |
| South Indian Bank Ltd. (a) | 2,662,871 | 1,054,380 | |
| The Jammu & Kashmir Bank Ltd. (a) | 430,480 | 367,204 | |
| The Ramco Cements Ltd. | 198,311 | 2,449,964 | |
| Torrent Pharmaceuticals Ltd. | 176,740 | 3,758,365 | |
| Yes Bank Ltd. | 156,948 | 851,135 | |
| TOTAL INDIA | 38,304,173 | ||
| Indonesia - 1.9% | |||
| PT Cikarang Listrindo Tbk (c) | 8,154,600 | 669,031 | |
| PT Holcim Indonesia Tbk (a) | 25,671,900 | 1,474,671 | |
| PT Lippo Karawaci Tbk | 22,109,400 | 706,205 | |
| PT Media Nusantara Citra Tbk | 8,796,900 | 832,244 | |
| PT Pakuwon Jati Tbk | 39,885,500 | 1,685,950 | |
| PT Panin Life Tbk (a) | 49,455,200 | 835,538 | |
| PT Perusahaan Gas Negara Tbk Series B | 2,951,300 | 417,769 | |
| PT Semen Gresik (Persero) Tbk | 3,231,900 | 2,232,225 | |
| PT XL Axiata Tbk (a) | 3,341,200 | 506,410 | |
| TOTAL INDONESIA | 9,360,043 | ||
| Italy - 0.8% | |||
| Prada SpA | 764,300 | 3,877,986 | |
| Korea (South) - 6.7% | |||
| AMOREPACIFIC Group, Inc. | 33,724 | 4,503,146 | |
| BS Financial Group, Inc. | 301,254 | 2,939,612 | |
| Com2uS Corp. | 16,097 | 2,404,949 | |
| Daou Technology, Inc. | 44,357 | 1,000,277 | |
| Dongbu HiTek Co. Ltd. | 133,078 | 1,671,358 | |
| DOUBLEUGAMES Co. Ltd. | 20,760 | 1,211,569 | |
| HB Technology Co. Ltd. | 327,948 | 846,722 | |
| Hyundai Fire & Marine Insurance Co. Ltd. | 42,872 | 1,531,250 | |
| Hyundai HCN | 91,406 | 371,283 | |
| Hyundai Wia Corp. | 42,718 | 2,142,033 | |
| KEPCO Plant Service & Engineering Co. Ltd. | 44,872 | 2,124,341 | |
| Korean Reinsurance Co. | 98,067 | 1,080,552 | |
| Minwise Co. Ltd. | 68,403 | 1,548,916 | |
| NCSOFT Corp. | 3,612 | 1,214,203 | |
| Samjin Pharmaceutical Co. Ltd. | 85,328 | 3,565,542 | |
| Silicon Works Co. Ltd. | 38,896 | 1,363,816 | |
| Tera Semicon Co. Ltd. | 78,085 | 1,443,689 | |
| Toptec Co. Ltd. | 76,550 | 1,904,949 | |
| TOTAL KOREA (SOUTH) | 32,868,207 | ||
| Luxembourg - 1.0% | |||
| Samsonite International SA | 1,132,200 | 5,107,008 | |
| Malaysia - 1.6% | |||
| Matrix Concepts Holdings Bhd | 2,127,700 | 1,092,268 | |
| Top Glove Corp. Bhd | 2,770,100 | 6,690,573 | |
| TOTAL MALAYSIA | 7,782,841 | ||
| Mexico - 1.1% | |||
| Credito Real S.A.B. de CV | 667,000 | 978,635 | |
| Industrias Penoles SA de CV | 169,350 | 3,554,511 | |
| Qualitas Controladora S.A.B. de CV | 388,100 | 1,083,448 | |
| TOTAL MEXICO | 5,616,594 | ||
| Netherlands - 1.3% | |||
| VEON Ltd. sponsored ADR | 123,400 | 339,350 | |
| Yandex NV Series A (a) | 176,444 | 5,886,172 | |
| TOTAL NETHERLANDS | 6,225,522 | ||
| Pakistan - 0.4% | |||
| Habib Bank Ltd. | 687,500 | 1,158,227 | |
| Hub Power Co. Ltd. | 731,500 | 652,318 | |
| TOTAL PAKISTAN | 1,810,545 | ||
| Panama - 0.7% | |||
| Copa Holdings SA Class A | 29,700 | 3,479,949 | |
| Peru - 0.7% | |||
| Compania de Minas Buenaventura SA sponsored ADR | 215,200 | 3,432,440 | |
| Philippines - 1.9% | |||
| International Container Terminal Services, Inc. | 1,012,220 | 1,653,490 | |
| Metro Pacific Investments Corp. | 26,870,300 | 2,646,808 | |
| Metropolitan Bank & Trust Co. | 770,898 | 1,264,557 | |
| Philippine Seven Corp. | 625,700 | 1,539,503 | |
| Pilipinas Shell Petroleum Corp. | 922,340 | 927,975 | |
| Robinsons Land Corp. | 3,270,408 | 1,129,613 | |
| TOTAL PHILIPPINES | 9,161,946 | ||
| Poland - 0.1% | |||
| Asseco Poland SA | 33,900 | 424,975 | |
| Russia - 1.1% | |||
| Bank St. Petersburg PJSC (a) | 1,478,500 | 1,197,404 | |
| LSR Group OJSC | 119,764 | 1,589,943 | |
| PhosAgro OJSC GDR (Reg. S) | 186,100 | 2,683,562 | |
| TOTAL RUSSIA | 5,470,909 | ||
| Singapore - 0.6% | |||
| First Resources Ltd. | 1,851,300 | 2,354,050 | |
| Yoma Strategic Holdings Ltd. | 2,457,700 | 791,719 | |
| TOTAL SINGAPORE | 3,145,769 | ||
| South Africa - 6.2% | |||
| Bidvest Group Ltd. | 248,600 | 4,869,865 | |
| Discovery Ltd. | 58,900 | 817,819 | |
| EOH Holdings Ltd. | 90,500 | 275,081 | |
| Imperial Holdings Ltd. | 309,600 | 5,955,496 | |
| Kumba Iron Ore Ltd. | 86,900 | 1,856,398 | |
| Mr Price Group Ltd. | 175,200 | 3,844,564 | |
| Nampak Ltd. (a) | 932,238 | 1,037,312 | |
| Pick 'n Pay Stores Ltd. | 142,700 | 923,800 | |
| Redefine Properties Ltd. | 2,375,700 | 2,283,081 | |
| Remgro Ltd. | 87,900 | 1,582,519 | |
| Reunert Ltd. | 385,100 | 2,399,177 | |
| Sanlam Ltd. | 219,200 | 1,384,691 | |
| Tiger Brands Ltd. | 103,600 | 3,237,852 | |
| TOTAL SOUTH AFRICA | 30,467,655 | ||
| Sri Lanka - 0.3% | |||
| Dialog Axiata PLC | 7,841,111 | 706,048 | |
| Hatton National Bank PLC | 640,233 | 978,416 | |
| TOTAL SRI LANKA | 1,684,464 | ||
| Taiwan - 6.4% | |||
| Advantech Co. Ltd. | 179,693 | 1,231,407 | |
| Alpha Networks, Inc. | 1,415,000 | 947,523 | |
| Chipbond Technology Corp. | 478,000 | 945,527 | |
| Cleanaway Co. Ltd. | 357,000 | 2,288,661 | |
| CTCI Corp. | 1,449,000 | 2,436,587 | |
| Elite Advanced Laser Corp. | 285,200 | 997,507 | |
| Everlight Electronics Co. Ltd. | 504,000 | 705,110 | |
| FLEXium Interconnect, Inc. | 371,256 | 968,437 | |
| Innolux Corp. | 1,963,000 | 729,190 | |
| Inventec Corp. | 2,245,000 | 1,697,896 | |
| Largan Precision Co. Ltd. | 11,000 | 1,277,125 | |
| Lite-On Technology Corp. | 1,734,220 | 2,284,445 | |
| Powertech Technology, Inc. | 448,000 | 1,280,186 | |
| Radiant Opto-Electronics Corp. | 1,040,000 | 2,142,917 | |
| St.Shine Optical Co. Ltd. | 41,000 | 1,097,277 | |
| Sunrex Technology Corp. | 907,680 | 473,985 | |
| Synnex Technology International Corp. | 1,261,100 | 1,807,985 | |
| TCI Co. Ltd. | 336,851 | 4,933,354 | |
| Tong Hsing Electronics Industries Ltd. | 243,000 | 851,793 | |
| Tripod Technology Corp. | 505,000 | 1,524,867 | |
| Vanguard International Semiconductor Corp. | 360,000 | 728,432 | |
| TOTAL TAIWAN | 31,350,211 | ||
| Thailand - 3.5% | |||
| Beauty Community PCL | 3,724,100 | 2,735,534 | |
| Com7 PCL | 4,216,000 | 2,491,385 | |
| Delta Electronics PCL (For. Reg.) | 319,400 | 679,638 | |
| PTT Global Chemical PCL (For. Reg.) | 1,114,600 | 3,443,700 | |
| Siam Cement PCL (For. Reg.) | 240,600 | 3,557,792 | |
| Star Petroleum Refining PCL | 8,043,400 | 3,988,410 | |
| TOTAL THAILAND | 16,896,459 | ||
| Turkey - 2.6% | |||
| Aksa Akrilik Kimya Sanayii | 1,218,000 | 3,987,937 | |
| Bim Birlesik Magazalar A/S JSC | 108,000 | 1,833,190 | |
| Mavi Jeans Class B (c) | 190,000 | 2,282,563 | |
| Tupras Turkiye Petrol Rafinerileri A/S | 123,828 | 3,155,067 | |
| Turkcell Iletisim Hizmet A/S sponsored ADR | 66,600 | 576,090 | |
| Turkiye Garanti Bankasi A/S | 322,000 | 730,071 | |
| TOTAL TURKEY | 12,564,918 | ||
| United Arab Emirates - 0.5% | |||
| Aldar Properties PJSC | 2,380,226 | 1,360,814 | |
| Emaar Properties PJSC | 737,080 | 1,161,862 | |
| TOTAL UNITED ARAB EMIRATES | 2,522,676 | ||
| United Kingdom - 1.8% | |||
| BGEO Group PLC | 17,640 | 845,118 | |
| NMC Health PLC | 86,800 | 4,263,673 | |
| Samba Financial Group ELS (HSBC Bank Warrant Program) warrants 5/6/20 (a)(c) | 140,000 | 1,084,461 | |
| Shanghai International Airport Co. Ltd. ELS (UBS Warrant Programme) warrants 5/11/18 (a)(c) | 181,300 | 1,415,346 | |
| TBC Bank Group PLC | 48,253 | 1,220,982 | |
| TOTAL UNITED KINGDOM | 8,829,580 | ||
| United States of America - 0.1% | |||
| Net 1 UEPS Technologies, Inc. (a)(b) | 47,100 | 388,104 | |
| Vietnam - 0.1% | |||
| FTP Corp. | 188,588 | 472,226 | |
| TOTAL COMMON STOCKS | |||
| (Cost $377,163,014) | 434,574,181 | ||
| Nonconvertible Preferred Stocks - 3.0% | |||
| Brazil - 1.9% | |||
| Banco ABC Brasil SA | 315,452 | 1,689,278 | |
| Bradespar SA (PN) | 236,600 | 2,401,660 | |
| Companhia Paranaense de Energia-Copel (PN-B) sponsored ADR (b) | 414,560 | 3,179,675 | |
| Metalurgica Gerdau SA (PN) | 1,023,700 | 2,285,149 | |
| TOTAL BRAZIL | 9,555,762 | ||
| Korea (South) - 0.9% | |||
| Hyundai Motor Co. Series 2 | 29,959 | 3,217,111 | |
| Samsung Fire & Marine Insurance Co. Ltd. | 5,958 | 1,020,887 | |
| TOTAL KOREA (SOUTH) | 4,237,998 | ||
| Russia - 0.2% | |||
| Sberbank of Russia | 323,600 | 1,008,326 | |
| TOTAL NONCONVERTIBLE PREFERRED STOCKS | |||
| (Cost $13,424,058) | 14,802,086 | ||
| Principal Amount | Value | ||
| Government Obligations - 0.2% | |||
| United States of America - 0.2% | |||
| U.S. Treasury Bills, yield at date of purchase 1.79% to 1.82% 7/19/18 to 7/26/18 (Cost $936,287)(d) | 940,000 | 936,339 | |
| Shares | Value | ||
| Money Market Funds - 9.0% | |||
| Fidelity Cash Central Fund, 1.74% (e) | 36,007,331 | 36,014,532 | |
| Fidelity Securities Lending Cash Central Fund 1.74% (e)(f) | 7,757,899 | 7,758,675 | |
| TOTAL MONEY MARKET FUNDS | |||
| (Cost $43,772,199) | 43,773,207 | ||
| TOTAL INVESTMENT IN SECURITIES - 101.1% | |||
| (Cost $435,295,558) | 494,085,813 | ||
| NET OTHER ASSETS (LIABILITIES) - (1.1)% | (5,438,720) | ||
| NET ASSETS - 100% | $488,647,093 |
| Futures Contracts | |||||
| Number of contracts | Expiration Date | Notional Amount | Value | Unrealized Appreciation/(Depreciation) | |
| Purchased | |||||
| Equity Index Contracts | |||||
| ICE E-mini MSCI Emerging Markets Index Contracts (United States) | 357 | June 2018 | $20,566,770 | $(419,504) | $(419,504) |
The notional amount of futures purchased as a percentage of Net Assets is 4.2%
Security Type Abbreviations
ELS – Equity-Linked Security
Categorizations in the Schedule of Investments are based on country or territory of incorporation.
Legend
(a) Non-income producing
(b) Security or a portion of the security is on loan at period end.
(c) Security exempt from registration under Rule 144A of the Securities Act of 1933. These securities may be resold in transactions exempt from registration, normally to qualified institutional buyers. At the end of the period, the value of these securities amounted to $14,215,769 or 2.9% of net assets.
(d) Security or a portion of the security was pledged to cover margin requirements for futures contracts. At period end, the value of securities pledged amounted to $926,381.
(e) Affiliated fund that is generally available only to investment companies and other accounts managed by Fidelity Investments. The rate quoted is the annualized seven-day yield of the fund at period end. A complete unaudited listing of the fund's holdings as of its most recent quarter end is available upon request. In addition, each Fidelity Central Fund's financial statements are available on the SEC's website or upon request.
(f) Investment made with cash collateral received from securities on loan.
Affiliated Central Funds
Information regarding fiscal year to date income earned by the Fund from investments in Fidelity Central Funds is as follows:
| Fund | Income earned |
| Fidelity Cash Central Fund | $145,960 |
| Fidelity Securities Lending Cash Central Fund | 84,610 |
| Total | $230,570 |
Amounts in the income column in the above table include any capital gain distributions from underlying funds, which are presented in the corresponding line-item in the Statement of Operations if applicable.
Investment Valuation
The following is a summary of the inputs used, as of April 30, 2018, involving the Fund's assets and liabilities carried at fair value. The inputs or methodology used for valuing securities may not be an indication of the risk associated with investing in those securities. For more information on valuation inputs, and their aggregation into the levels used below, please refer to the Investment Valuation section in the accompanying Notes to Financial Statements.
| Valuation Inputs at Reporting Date: | ||||
| Description | Total | Level 1 | Level 2 | Level 3 |
| Investments in Securities: | ||||
| Equities: | ||||
| Consumer Discretionary | $70,263,973 | $21,399,239 | $48,864,734 | $-- |
| Consumer Staples | 31,382,115 | 9,413,204 | 21,968,911 | -- |
| Energy | 16,514,502 | 9,954,093 | 6,560,409 | -- |
| Financials | 52,858,947 | 29,448,794 | 23,410,153 | -- |
| Health Care | 40,815,402 | 12,194,147 | 28,621,255 | -- |
| Industrials | 55,960,961 | 18,104,590 | 37,856,371 | -- |
| Information Technology | 77,722,637 | 39,384,733 | 38,337,904 | -- |
| Materials | 49,764,556 | 27,601,839 | 22,162,717 | -- |
| Real Estate | 33,963,150 | 10,521,789 | 23,441,361 | -- |
| Telecommunication Services | 2,626,562 | 2,120,152 | 506,410 | -- |
| Utilities | 17,503,462 | 6,434,001 | 11,069,461 | -- |
| Government Obligations | 936,339 | -- | 936,339 | -- |
| Money Market Funds | 43,773,207 | 43,773,207 | -- | -- |
| Total Investments in Securities: | $494,085,813 | $230,349,788 | $263,736,025 | $-- |
| Derivative Instruments: | ||||
| Liabilities | ||||
| Futures Contracts | $(419,504) | $(419,504) | $-- | $-- |
| Total Liabilities | $(419,504) | $(419,504) | $-- | $-- |
| Total Derivative Instruments: | $(419,504) | $(419,504) | $-- | $-- |
The following is a summary of transfers between Level 1 and Level 2 for the period ended April 30, 2018. Transfers are assumed to have occurred at the beginning of the period, and are primarily attributable to the valuation techniques used for foreign equity securities, as discussed in the accompanying Notes to Financial Statements:
| Transfers | Total |
| Level 1 to Level 2 | $179,478,865 |
| Level 2 to Level 1 | $0 |
Value of Derivative Instruments
The following table is a summary of the Fund's value of derivative instruments by primary risk exposure as of April 30, 2018. For additional information on derivative instruments, please refer to the Derivative Instruments section in the accompanying Notes to Financial Statements.
| Primary Risk Exposure / Derivative Type | Value | |
| Asset | Liability | |
| Equity Risk | ||
| Futures Contracts(a) | $0 | $(419,504) |
| Total Equity Risk | 0 | (419,504) |
| Total Value of Derivatives | $0 | $(419,504) |
(a) Reflects gross cumulative appreciation (depreciation) on futures contracts as presented in the Schedule of Investments. In the Statement of Assets and Liabilities, the period end daily variation margin is included in receivable or payable for daily variation margin on futures contracts, and the net cumulative appreciation (depreciation) is included in net unrealized appreciation (depreciation).
See accompanying notes which are an integral part of the financial statements.
Financial Statements
Statement of Assets and Liabilities
| April 30, 2018 (Unaudited) | ||
| Assets | ||
| Investment in securities, at value (including securities loaned of $7,538,037) — See accompanying schedule: Unaffiliated issuers (cost $391,523,359) | $450,312,606 | |
| Fidelity Central Funds (cost $43,772,199) | 43,773,207 | |
| Total Investment in Securities (cost $435,295,558) | $494,085,813 | |
| Foreign currency held at value (cost $1,298,719) | 1,301,663 | |
| Receivable for investments sold | 3,274,837 | |
| Receivable for fund shares sold | 1,940,740 | |
| Dividends receivable | 934,750 | |
| Distributions receivable from Fidelity Central Funds | 58,136 | |
| Prepaid expenses | 157 | |
| Other receivables | 107,959 | |
| Total assets | 501,704,055 | |
| Liabilities | ||
| Payable to custodian bank | $16,422 | |
| Payable for investments purchased | 2,991,856 | |
| Payable for fund shares redeemed | 1,032,956 | |
| Accrued management fee | 342,843 | |
| Distribution and service plan fees payable | 24,301 | |
| Payable for daily variation margin on futures contracts | 166,897 | |
| Other affiliated payables | 95,837 | |
| Other payables and accrued expenses | 627,150 | |
| Collateral on securities loaned | 7,758,700 | |
| Total liabilities | 13,056,962 | |
| Net Assets | $488,647,093 | |
| Net Assets consist of: | ||
| Paid in capital | $426,500,375 | |
| Undistributed net investment income | 2,097,198 | |
| Accumulated undistributed net realized gain (loss) on investments and foreign currency transactions | 2,197,793 | |
| Net unrealized appreciation (depreciation) on investments and assets and liabilities in foreign currencies | 57,851,727 | |
| Net Assets | $488,647,093 | |
| Calculation of Maximum Offering Price | ||
| Class A: | ||
| Net Asset Value and redemption price per share ($22,564,755 ÷ 1,453,058 shares) | $15.53 | |
| Maximum offering price per share (100/94.25 of $15.53) | $16.48 | |
| Class M: | ||
| Net Asset Value and redemption price per share ($12,001,310 ÷ 776,676 shares) | $15.45 | |
| Maximum offering price per share (100/96.50 of $15.45) | $16.01 | |
| Class C: | ||
| Net Asset Value and offering price per share ($17,431,552 ÷ 1,152,043 shares)(a) | $15.13 | |
| Emerging Markets Discovery: | ||
| Net Asset Value, offering price and redemption price per share ($322,770,027 ÷ 20,669,364 shares) | $15.62 | |
| Class I: | ||
| Net Asset Value, offering price and redemption price per share ($113,879,449 ÷ 7,276,841 shares) | $15.65 |
(a) Redemption price per share is equal to net asset value less any applicable contingent deferred sales charge.
See accompanying notes which are an integral part of the financial statements.
Statement of Operations
| Six months ended April 30, 2018 (Unaudited) | ||
| Investment Income | ||
| Dividends | $5,791,288 | |
| Interest | 4,729 | |
| Income from Fidelity Central Funds | 230,570 | |
| Income before foreign taxes withheld | 6,026,587 | |
| Less foreign taxes withheld | (541,895) | |
| Total income | 5,484,692 | |
| Expenses | ||
| Management fee | $1,951,546 | |
| Transfer agent fees | 425,192 | |
| Distribution and service plan fees | 131,761 | |
| Accounting and security lending fees | 121,067 | |
| Custodian fees and expenses | 211,473 | |
| Independent trustees' fees and expenses | 877 | |
| Registration fees | 44,377 | |
| Audit | 36,155 | |
| Legal | 662 | |
| Miscellaneous | 1,180 | |
| Total expenses before reductions | 2,924,290 | |
| Expense reductions | (49,976) | 2,874,314 |
| Net investment income (loss) | 2,610,378 | |
| Realized and Unrealized Gain (Loss) | ||
| Net realized gain (loss) on: | ||
| Investment securities: | ||
| Unaffiliated issuers (net of foreign taxes of $86,391) | 4,877,596 | |
| Fidelity Central Funds | (142) | |
| Foreign currency transactions | (207,446) | |
| Futures contracts | 883,780 | |
| Total net realized gain (loss) | 5,553,788 | |
| Change in net unrealized appreciation (depreciation) on: | ||
| Investment securities: | ||
| Unaffiliated issuers (net of decrease in deferred foreign taxes of $132,329) | 15,650,741 | |
| Fidelity Central Funds | (3) | |
| Assets and liabilities in foreign currencies | (25,688) | |
| Futures contracts | (419,504) | |
| Total change in net unrealized appreciation (depreciation) | 15,205,546 | |
| Net gain (loss) | 20,759,334 | |
| Net increase (decrease) in net assets resulting from operations | $23,369,712 |
See accompanying notes which are an integral part of the financial statements.
Statement of Changes in Net Assets
| Six months ended April 30, 2018 (Unaudited) | Year ended October 31, 2017 | |
| Increase (Decrease) in Net Assets | ||
| Operations | ||
| Net investment income (loss) | $2,610,378 | $2,767,445 |
| Net realized gain (loss) | 5,553,788 | 9,091,626 |
| Change in net unrealized appreciation (depreciation) | 15,205,546 | 38,838,325 |
| Net increase (decrease) in net assets resulting from operations | 23,369,712 | 50,697,396 |
| Distributions to shareholders from net investment income | (3,081,841) | (659,806) |
| Distributions to shareholders from net realized gain | (6,543,392) | (485,420) |
| Total distributions | (9,625,233) | (1,145,226) |
| Share transactions - net increase (decrease) | 89,919,953 | 249,358,868 |
| Redemption fees | 66,641 | 166,495 |
| Total increase (decrease) in net assets | 103,731,073 | 299,077,533 |
| Net Assets | ||
| Beginning of period | 384,916,020 | 85,838,487 |
| End of period | $488,647,093 | $384,916,020 |
| Other Information | ||
| Undistributed net investment income end of period | $2,097,198 | $2,568,661 |
See accompanying notes which are an integral part of the financial statements.
Financial Highlights
Fidelity Emerging Markets Discovery Fund Class A
| Six months ended (Unaudited) April 30, | Years endedOctober 31, | |||||
| 2018 | 2017 | 2016 | 2015 | 2014 | 2013 | |
| Selected Per–Share Data | ||||||
| Net asset value, beginning of period | $15.03 | $12.27 | $10.92 | $12.17 | $12.49 | $11.89 |
| Income from Investment Operations | ||||||
| Net investment income (loss)A | .07 | .14 | .09 | .09B | .04 | .08 |
| Net realized and unrealized gain (loss) | .74 | 2.74 | 1.30 | (1.34) | (.01) | .75 |
| Total from investment operations | .81 | 2.88 | 1.39 | (1.25) | .03 | .83 |
| Distributions from net investment income | (.08) | (.07) | (.05) | – | (.06) | (.04) |
| Distributions from net realized gain | (.23) | (.06) | – | – | (.30) | (.20) |
| Total distributions | (.31) | (.13) | (.05) | – | (.36) | (.25)C |
| Redemption fees added to paid in capitalA | –D | .01 | .01 | –D | .01 | .02 |
| Net asset value, end of period | $15.53 | $15.03 | $12.27 | $10.92 | $12.17 | $12.49 |
| Total ReturnE,F,G | 5.52% | 23.89% | 12.93% | (10.27)% | .31% | 7.20% |
| Ratios to Average Net AssetsH,I | ||||||
| Expenses before reductions | 1.49%J | 1.63% | 1.89% | 1.88% | 1.82% | 1.87% |
| Expenses net of fee waivers, if any | 1.49%J | 1.63% | 1.70% | 1.70% | 1.70% | 1.70% |
| Expenses net of all reductions | 1.47%J | 1.62% | 1.70% | 1.69% | 1.70% | 1.64% |
| Net investment income (loss) | .89%J | 1.03% | .85% | .76%B | .29% | .62% |
| Supplemental Data | ||||||
| Net assets, end of period (000 omitted) | $22,565 | $16,062 | $5,252 | $4,660 | $4,362 | $5,065 |
| Portfolio turnover rateK | 61%J | 58% | 60% | 103% | 148% | 179% |
A Calculated based on average shares outstanding during the period.
B Net Investment income per share reflects a large, non-recurring dividend which amounted to $.06 per share. Excluding this non-recurring dividend, the ratio of net investment income (loss) to average net assets would have been .22%.
C Total distributions of $.25 per share is comprised of distributions from net investment income of $.044 and distributions from net realized gain of $.203 per share.
D Amount represents less than $.005 per share.
E Total returns for periods of less than one year are not annualized.
F Total returns would have been lower if certain expenses had not been reduced during the applicable periods shown.
G Total returns do not include the effect of the sales charges.
H Fees and expenses of any underlying Fidelity Central Funds are not included in the Fund's expense ratio. The Fund indirectly bears its proportionate share of the expenses of any underlying Fidelity Central Funds.
I Expense ratios reflect operating expenses of the class. Expenses before reductions do not reflect amounts reimbursed by the investment adviser or reductions from brokerage service arrangements or reductions from other expense offset arrangements and do not represent the amount paid by the class during periods when reimbursements or reductions occur. Expense ratios before reductions for start-up periods may not be representative of longer-term operating periods. Expenses net of fee waivers reflect expenses after reimbursement by the investment adviser but prior to reductions from brokerage service arrangements or other expense offset arrangements. Expenses net of all reductions represent the net expenses paid by the class.
J Annualized
K Amount does not include the portfolio activity of any underlying Fidelity Central Funds.
See accompanying notes which are an integral part of the financial statements.
Fidelity Emerging Markets Discovery Fund Class M
| Six months ended (Unaudited) April 30, | Years endedOctober 31, | |||||
| 2018 | 2017 | 2016 | 2015 | 2014 | 2013 | |
| Selected Per–Share Data | ||||||
| Net asset value, beginning of period | $14.94 | $12.20 | $10.86 | $12.13 | $12.44 | $11.87 |
| Income from Investment Operations | ||||||
| Net investment income (loss)A | .05 | .10 | .07 | .06B | –C | .05 |
| Net realized and unrealized gain (loss) | .73 | 2.74 | 1.28 | (1.33) | –C | .74 |
| Total from investment operations | .78 | 2.84 | 1.35 | (1.27) | –C | .79 |
| Distributions from net investment income | (.04) | (.04) | (.02) | – | (.02) | (.03) |
| Distributions from net realized gain | (.23) | (.06) | – | – | (.30) | (.20) |
| Total distributions | (.27) | (.11)D | (.02) | – | (.32) | (.24)E |
| Redemption fees added to paid in capitalA | –C | .01 | .01 | –C | .01 | .02 |
| Net asset value, end of period | $15.45 | $14.94 | $12.20 | $10.86 | $12.13 | $12.44 |
| Total ReturnF,G,H | 5.35% | 23.63% | 12.58% | (10.47)% | .05% | 6.87% |
| Ratios to Average Net AssetsI,J | ||||||
| Expenses before reductions | 1.76%K | 1.92% | 2.17% | 2.16% | 2.10% | 2.19% |
| Expenses net of fee waivers, if any | 1.76%K | 1.92% | 1.95% | 1.95% | 1.95% | 1.95% |
| Expenses net of all reductions | 1.74%K | 1.90% | 1.94% | 1.94% | 1.95% | 1.89% |
| Net investment income (loss) | .62%K | .74% | .60% | .51%B | .04% | .37% |
| Supplemental Data | ||||||
| Net assets, end of period (000 omitted) | $12,001 | $9,393 | $2,868 | $2,015 | $2,031 | $1,914 |
| Portfolio turnover rateL | 61%K | 58% | 60% | 103% | 148% | 179% |
A Calculated based on average shares outstanding during the period.
B Net Investment income per share reflects a large, non-recurring dividend which amounted to $.06 per share. Excluding this non-recurring dividend, the ratio of net investment income (loss) to average net assets would have been (.03) %.
C Amount represents less than $.005 per share.
D Total distributions of $.11 per share is comprised of distributions from net investment income of $.044 and distributions from net realized gain of $.064 per share.
E Total distributions of $.24 per share is comprised of distributions from net investment income of $.034 and distributions from net realized gain of $.203 per share.
F Total returns for periods of less than one year are not annualized.
G Total returns would have been lower if certain expenses had not been reduced during the applicable periods shown.
H Total returns do not include the effect of the sales charges.
I Fees and expenses of any underlying Fidelity Central Funds are not included in the Fund's expense ratio. The Fund indirectly bears its proportionate share of the expenses of any underlying Fidelity Central Funds.
J Expense ratios reflect operating expenses of the class. Expenses before reductions do not reflect amounts reimbursed by the investment adviser or reductions from brokerage service arrangements or reductions from other expense offset arrangements and do not represent the amount paid by the class during periods when reimbursements or reductions occur. Expenses net of fee waivers reflect expenses after reimbursement by the investment adviser but prior to reductions from brokerage service arrangements or other expense offset arrangements. Expenses net of all reductions represent the net expenses paid by the class.
K Annualized
L Amount does not include the portfolio activity of any underlying Fidelity Central Funds.
See accompanying notes which are an integral part of the financial statements.
Fidelity Emerging Markets Discovery Fund Class C
| Six months ended (Unaudited) April 30, | Years endedOctober 31, | |||||
| 2018 | 2017 | 2016 | 2015 | 2014 | 2013 | |
| Selected Per–Share Data | ||||||
| Net asset value, beginning of period | $14.64 | $11.97 | $10.69 | $12.00 | $12.35 | $11.82 |
| Income from Investment Operations | ||||||
| Net investment income (loss)A | .01 | .04 | .01 | –B,C | (.06) | (.02) |
| Net realized and unrealized gain (loss) | .73 | 2.69 | 1.26 | (1.31) | –C | .74 |
| Total from investment operations | .74 | 2.73 | 1.27 | (1.31) | (.06) | .72 |
| Distributions from net investment income | (.02) | (.01) | – | – | – | (.01) |
| Distributions from net realized gain | (.23) | (.06) | – | – | (.30) | (.20) |
| Total distributions | (.25) | (.07) | – | – | (.30) | (.21) |
| Redemption fees added to paid in capitalA | –C | .01 | .01 | –C | .01 | .02 |
| Net asset value, end of period | $15.13 | $14.64 | $11.97 | $10.69 | $12.00 | $12.35 |
| Total ReturnD,E,F | 5.15% | 23.02% | 11.97% | (10.92)% | (.42)% | 6.32% |
| Ratios to Average Net AssetsG,H | ||||||
| Expenses before reductions | 2.24%I | 2.38% | 2.63% | 2.64% | 2.58% | 2.70% |
| Expenses net of fee waivers, if any | 2.24%I | 2.38% | 2.45% | 2.45% | 2.45% | 2.45% |
| Expenses net of all reductions | 2.22%I | 2.37% | 2.44% | 2.44% | 2.45% | 2.39% |
| Net investment income (loss) | .14%I | .28% | .10% | .01%B | (.46)% | (.13)% |
| Supplemental Data | ||||||
| Net assets, end of period (000 omitted) | $17,432 | $14,168 | $2,203 | $1,675 | $1,750 | $2,082 |
| Portfolio turnover rateJ | 61%I | 58% | 60% | 103% | 148% | 179% |
A Calculated based on average shares outstanding during the period.
B Net Investment income per share reflects a large, non-recurring dividend which amounted to $.06 per share. Excluding this non-recurring dividend, the ratio of net investment income (loss) to average net assets would have been (.52) %.
C Amount represents less than $.005 per share.
D Total returns for periods of less than one year are not annualized.
E Total returns would have been lower if certain expenses had not been reduced during the applicable periods shown.
F Total returns do not include the effect of the contingent deferred sales charge.
G Fees and expenses of any underlying Fidelity Central Funds are not included in the Fund's expense ratio. The Fund indirectly bears its proportionate share of the expenses of any underlying Fidelity Central Funds.
H Expense ratios reflect operating expenses of the class. Expenses before reductions do not reflect amounts reimbursed by the investment adviser or reductions from brokerage service arrangements or reductions from other expense offset arrangements and do not represent the amount paid by the class during periods when reimbursements or reductions occur. Expenses net of fee waivers reflect expenses after reimbursement by the investment adviser but prior to reductions from brokerage service arrangements or other expense offset arrangements. Expenses net of all reductions represent the net expenses paid by the class.
I Annualized
J Amount does not include the portfolio activity of any underlying Fidelity Central Funds.
See accompanying notes which are an integral part of the financial statements.
Fidelity Emerging Markets Discovery Fund
| Six months ended (Unaudited) April 30, | Years endedOctober 31, | |||||
| 2018 | 2017 | 2016 | 2015 | 2014 | 2013 | |
| Selected Per–Share Data | ||||||
| Net asset value, beginning of period | $15.12 | $12.33 | $10.98 | $12.21 | $12.52 | $11.92 |
| Income from Investment Operations | ||||||
| Net investment income (loss)A | .09 | .18 | .12 | .12B | .07 | .11 |
| Net realized and unrealized gain (loss) | .75 | 2.76 | 1.31 | (1.35) | –C | .74 |
| Total from investment operations | .84 | 2.94 | 1.43 | (1.23) | .07 | .85 |
| Distributions from net investment income | (.11) | (.09) | (.09) | – | (.09) | (.07) |
| Distributions from net realized gain | (.23) | (.06) | – | – | (.30) | (.20) |
| Total distributions | (.34) | (.16)D | (.09) | – | (.39) | (.27) |
| Redemption fees added to paid in capitalA | –C | .01 | .01 | –C | .01 | .02 |
| Net asset value, end of period | $15.62 | $15.12 | $12.33 | $10.98 | $12.21 | $12.52 |
| Total ReturnE,F | 5.72% | 24.30% | 13.19% | (10.07)% | .61% | 7.37% |
| Ratios to Average Net AssetsG,H | ||||||
| Expenses before reductions | 1.20%I | 1.35% | 1.55% | 1.56% | 1.48% | 1.57% |
| Expenses net of fee waivers, if any | 1.20%I | 1.35% | 1.45% | 1.45% | 1.45% | 1.45% |
| Expenses net of all reductions | 1.18%I | 1.34% | 1.44% | 1.44% | 1.45% | 1.39% |
| Net investment income (loss) | 1.19%I | 1.31% | 1.10% | 1.01%B | .54% | .87% |
| Supplemental Data | ||||||
| Net assets, end of period (000 omitted) | $322,770 | $248,124 | $67,178 | $61,601 | $78,377 | $96,731 |
| Portfolio turnover rateJ | 61%I | 58% | 60% | 103% | 148% | 179% |
A Calculated based on average shares outstanding during the period.
B Net Investment income per share reflects a large, non-recurring dividend which amounted to $.06 per share. Excluding this non-recurring dividend, the ratio of net investment income (loss) to average net assets would have been .48%.
C Amount represents less than $.005 per share.
D Total distributions of $.16 per share is comprised of distributions from net investment income of $.091 and distributions from net realized gain of $.064 per share.
E Total returns for periods of less than one year are not annualized.
F Total returns would have been lower if certain expenses had not been reduced during the applicable periods shown.
G Fees and expenses of any underlying Fidelity Central Funds are not included in the Fund's expense ratio. The Fund indirectly bears its proportionate share of the expenses of any underlying Fidelity Central Funds.
H Expense ratios reflect operating expenses of the class. Expenses before reductions do not reflect amounts reimbursed by the investment adviser or reductions from brokerage service arrangements or reductions from other expense offset arrangements and do not represent the amount paid by the class during periods when reimbursements or reductions occur. Expenses net of fee waivers reflect expenses after reimbursement by the investment adviser but prior to reductions from brokerage service arrangements or other expense offset arrangements. Expenses net of all reductions represent the net expenses paid by the class.
I Annualized
J Amount does not include the portfolio activity of any underlying Fidelity Central Funds.
See accompanying notes which are an integral part of the financial statements.
Fidelity Emerging Markets Discovery Fund Class I
| Six months ended (Unaudited) April 30, | Years endedOctober 31, | |||||
| 2018 | 2017 | 2016 | 2015 | 2014 | 2013 | |
| Selected Per–Share Data | ||||||
| Net asset value, beginning of period | $15.15 | $12.37 | $11.02 | $12.25 | $12.53 | $11.92 |
| Income from Investment Operations | ||||||
| Net investment income (loss)A | .09 | .19 | .13 | .12B | .07 | .11 |
| Net realized and unrealized gain (loss) | .76 | 2.75 | 1.30 | (1.35) | –C | .75 |
| Total from investment operations | .85 | 2.94 | 1.43 | (1.23) | .07 | .86 |
| Distributions from net investment income | (.12) | (.10) | (.09) | – | (.06) | (.07) |
| Distributions from net realized gain | (.23) | (.06) | – | – | (.30) | (.20) |
| Total distributions | (.35) | (.17)D | (.09) | – | (.36) | (.27) |
| Redemption fees added to paid in capitalA | –C | .01 | .01 | –C | .01 | .02 |
| Net asset value, end of period | $15.65 | $15.15 | $12.37 | $11.02 | $12.25 | $12.53 |
| Total ReturnE,F | 5.72% | 24.25% | 13.16% | (10.04)% | .61% | 7.45% |
| Ratios to Average Net AssetsG,H | ||||||
| Expenses before reductions | 1.20%I | 1.32% | 1.59% | 1.54% | 1.56% | 1.60% |
| Expenses net of fee waivers, if any | 1.20%I | 1.32% | 1.45% | 1.45% | 1.45% | 1.45% |
| Expenses net of all reductions | 1.18%I | 1.30% | 1.44% | 1.43% | 1.45% | 1.39% |
| Net investment income (loss) | 1.18%I | 1.34% | 1.10% | 1.01%B | .54% | .87% |
| Supplemental Data | ||||||
| Net assets, end of period (000 omitted) | $113,879 | $97,170 | $8,337 | $1,410 | $481 | $1,076 |
| Portfolio turnover rateJ | 61%I | 58% | 60% | 103% | 148% | 179% |
A Calculated based on average shares outstanding during the period.
B Net Investment income per share reflects a large, non-recurring dividend which amounted to $.06 per share. Excluding this non-recurring dividend, the ratio of net investment income (loss) to average net assets would have been .48%.
C Amount represents less than $.005 per share.
D Total distributions of $.17 per share is comprised of distributions from net investment income of $.101 and distributions from net realized gain of $.064 per share.
E Total returns for periods of less than one year are not annualized.
F Total returns would have been lower if certain expenses had not been reduced during the applicable periods shown.
G Fees and expenses of any underlying Fidelity Central Funds are not included in the Fund's expense ratio. The Fund indirectly bears its proportionate share of the expenses of any underlying Fidelity Central Funds.
H Expense ratios reflect operating expenses of the class. Expenses before reductions do not reflect amounts reimbursed by the investment adviser or reductions from brokerage service arrangements or reductions from other expense offset arrangements and do not represent the amount paid by the class during periods when reimbursements or reductions occur. Expenses net of fee waivers reflect expenses after reimbursement by the investment adviser but prior to reductions from brokerage service arrangements or other expense offset arrangements. Expenses net of all reductions represent the net expenses paid by the class.
I Annualized
J Amount does not include the portfolio activity of any underlying Fidelity Central Funds.
See accompanying notes which are an integral part of the financial statements.
Notes to Financial Statements (Unaudited)
For the period ended April 30, 2018
1. Organization.
Fidelity Emerging Markets Discovery Fund (the Fund) is a fund of Fidelity Investment Trust (the Trust) and is authorized to issue an unlimited number of shares. The Trust is registered under the Investment Company Act of 1940, as amended (the 1940 Act), as an open-end management investment company organized as a Massachusetts business trust. The Fund offers Class A, Class M, Class C, Emerging Markets Discovery, and Class I shares, each of which has equal rights as to assets and voting privileges. Each class has exclusive voting rights with respect to matters that affect that class. The Fund's investments in emerging markets can be subject to social, economic, regulatory, and political uncertainties and can be extremely volatile.
2. Investments in Fidelity Central Funds.
The Fund invests in Fidelity Central Funds, which are open-end investment companies generally available only to other investment companies and accounts managed by the investment adviser and its affiliates. The Fund's Schedule of Investments lists each of the Fidelity Central Funds held as of period end, if any, as an investment of the Fund, but does not include the underlying holdings of each Fidelity Central Fund. As an Investing Fund, the Fund indirectly bears its proportionate share of the expenses of the underlying Fidelity Central Funds.
The Money Market Central Funds seek preservation of capital and current income and are managed by Fidelity Investments Money Management, Inc. (FIMM), an affiliate of the investment adviser. Annualized expenses of the Money Market Central Funds as of their most recent shareholder report date are less than .005%.
A complete unaudited list of holdings for each Fidelity Central Fund is available upon request or at the Securities and Exchange Commission (the SEC) website at www.sec.gov. In addition, the financial statements of the Fidelity Central Funds are available on the SEC website or upon request.
3. Significant Accounting Policies.
The Fund is an investment company and applies the accounting and reporting guidance of the Financial Accounting Standards Board (FASB) Accounting Standards Codification Topic 946 Financial Services – Investments Companies. The financial statements have been prepared in conformity with accounting principles generally accepted in the United States of America (GAAP), which require management to make certain estimates and assumptions at the date of the financial statements. Actual results could differ from those estimates. Subsequent events, if any, through the date that the financial statements were issued have been evaluated in the preparation of the financial statements. The following summarizes the significant accounting policies of the Fund:
Investment Valuation. Investments are valued as of 4:00 p.m. Eastern time on the last calendar day of the period. The Board of Trustees (the Board) has delegated the day to day responsibility for the valuation of the Fund's investments to the Fair Value Committee (the Committee) established by the Fund's investment adviser. In accordance with valuation policies and procedures approved by the Board, the Fund attempts to obtain prices from one or more third party pricing vendors or brokers to value its investments. When current market prices, quotations or currency exchange rates are not readily available or reliable, investments will be fair valued in good faith by the Committee, in accordance with procedures adopted by the Board. Factors used in determining fair value vary by investment type and may include market or investment specific events, changes in interest rates and credit quality. The frequency with which these procedures are used cannot be predicted and they may be utilized to a significant extent. The Committee oversees the Fund's valuation policies and procedures and reports to the Board on the Committee's activities and fair value determinations. The Board monitors the appropriateness of the procedures used in valuing the Fund's investments and ratifies the fair value determinations of the Committee.
The Fund categorizes the inputs to valuation techniques used to value its investments into a disclosure hierarchy consisting of three levels as shown below:
- Level 1 – quoted prices in active markets for identical investments
- Level 2 – other significant observable inputs (including quoted prices for similar investments, interest rates, prepayment speeds, etc.)
- Level 3 – unobservable inputs (including the Fund's own assumptions based on the best information available)
Valuation techniques used to value the Fund's investments by major category are as follows:
Equity securities, including restricted securities, for which market quotations are readily available, are valued at the last reported sale price or official closing price as reported by a third party pricing vendor on the primary market or exchange on which they are traded and are categorized as Level 1 in the hierarchy. In the event there were no sales during the day or closing prices are not available, securities are valued at the last quoted bid price or may be valued using the last available price and are generally categorized as Level 2 in the hierarchy. For foreign equity securities, when market or security specific events arise, comparisons to the valuation of American Depositary Receipts (ADRs), futures contracts, Exchange-Traded Funds (ETFs) and certain indexes as well as quoted prices for similar securities may be used and would be categorized as Level 2 in the hierarchy. Utilizing these techniques may result in transfers between Level 1 and Level 2. For equity securities, including restricted securities, where observable inputs are limited, assumptions about market activity and risk are used and these securities may be categorized as Level 3 in the hierarchy.
Debt securities, including restricted securities, are valued based on evaluated prices received from third party pricing vendors or from brokers who make markets in such securities. U.S. government and government agency obligations are valued by pricing vendors who utilize matrix pricing which considers yield or price of bonds of comparable quality, coupon, maturity and type or by broker-supplied prices. When independent prices are unavailable or unreliable, debt securities may be valued utilizing pricing methodologies which consider similar factors that would be used by third party pricing vendors. Debt securities are generally categorized as Level 2 in the hierarchy but may be Level 3 depending on the circumstances.
Futures contracts are valued at the settlement price established each day by the board of trade or exchange on which they are traded and are categorized as Level 1 in the hierarchy.
Investments in open-end mutual funds, including the Fidelity Central Funds, are valued at their closing net asset value (NAV) each business day and are categorized as Level 1 in the hierarchy.
Changes in valuation techniques may result in transfers in or out of an assigned level within the disclosure hierarchy. The aggregate value of investments by input level as of April 30, 2018, including information on transfers between Levels 1 and 2, is included at the end of the Fund's Schedule of Investments.
Foreign Currency. The Fund may use foreign currency contracts to facilitate transactions in foreign-denominated securities. Gains and losses from these transactions may arise from changes in the value of the foreign currency or if the counterparties do not perform under the contracts' terms.
Foreign-denominated assets, including investment securities, and liabilities are translated into U.S. dollars at the exchange rates at period end. Purchases and sales of investment securities, income and dividends received and expenses denominated in foreign currencies are translated into U.S. dollars at the exchange rate in effect on the transaction date.
The effects of exchange rate fluctuations on investments are included with the net realized and unrealized gain (loss) on investment securities. Other foreign currency transactions resulting in realized and unrealized gain (loss) are disclosed separately.
Investment Transactions and Income. For financial reporting purposes, the Fund's investment holdings and NAV include trades executed through the end of the last business day of the period. The NAV per share for processing shareholder transactions is calculated as of the close of business of the New York Stock Exchange (NYSE), normally 4:00 p.m. Eastern time and includes trades executed through the end of the prior business day. Gains and losses on securities sold are determined on the basis of identified cost. Dividend income is recorded on the ex-dividend date, except for certain dividends from foreign securities where the ex-dividend date may have passed, which are recorded as soon as the Fund is informed of the ex-dividend date. Non-cash dividends included in dividend income, if any, are recorded at the fair market value of the securities received. Income and capital gain distributions from Fidelity Central Funds, if any, are recorded on the ex-dividend date. Certain distributions received by the Fund represent a return of capital or capital gain. The Fund determines the components of these distributions subsequent to the ex-dividend date, based upon receipt of tax filings or other correspondence relating to the underlying investment. These distributions are recorded as a reduction of cost of investments and/or as a realized gain. Interest income is accrued as earned and includes coupon interest and amortization of premium and accretion of discount on debt securities as applicable. Investment income is recorded net of foreign taxes withheld where recovery of such taxes is uncertain.
Class Allocations and Expenses. Investment income, realized and unrealized capital gains and losses, common expenses of the Fund, and certain fund-level expense reductions, if any, are allocated daily on a pro-rata basis to each class based on the relative net assets of each class to the total net assets of the Fund. Each class differs with respect to transfer agent and distribution and service plan fees incurred. Certain expense reductions may also differ by class. For the reporting period, the allocated portion of income and expenses to each class as a percent of its average net assets may vary due to the timing of recording these transactions in relation to fluctuating net assets of the classes. Expenses directly attributable to a fund are charged to that fund. Expenses attributable to more than one fund are allocated among the respective funds on the basis of relative net assets or other appropriate methods. Expense estimates are accrued in the period to which they relate and adjustments are made when actual amounts are known.
Income Tax Information and Distributions to Shareholders. Each year, the Fund intends to qualify as a regulated investment company under Subchapter M of the Internal Revenue Code, including distributing substantially all of its taxable income and realized gains. As a result, no provision for U.S. Federal income taxes is required. The Fund files a U.S. federal tax return, in addition to state and local tax returns as required. The Fund's federal income tax returns are subject to examination by the Internal Revenue Service (IRS) for a period of three fiscal years after they are filed. State and local tax returns may be subject to examination for an additional fiscal year depending on the jurisdiction. Foreign taxes are provided for based on the Fund's understanding of the tax rules and rates that exist in the foreign markets in which it invests. The Fund is subject to a tax imposed on capital gains by certain countries in which it invests. An estimated deferred tax liability for net unrealized appreciation on the applicable securities is included in Other payables and accrued expenses on the Statement of Assets & Liabilities.
Distributions are declared and recorded on the ex-dividend date. Income and capital gain distributions are declared separately for each class. Income and capital gain distributions are determined in accordance with income tax regulations, which may differ from GAAP.
Capital accounts within the financial statements are adjusted for permanent book-tax differences. These adjustments have no impact on net assets or the results of operations. Capital accounts are not adjusted for temporary book-tax differences which will reverse in a subsequent period.
Book-tax differences are primarily due to foreign currency transactions, futures contracts, certain foreign taxes, passive foreign investment companies (PFIC), market discount, capital loss carryforwards and losses deferred due to wash sales.
As of period end, the cost and unrealized appreciation (depreciation) in securities, and derivatives if applicable, for federal income tax purposes were as follows:
| Gross unrealized appreciation | $75,304,663 |
| Gross unrealized depreciation | (20,103,814) |
| Net unrealized appreciation (depreciation) | $55,200,849 |
| Tax cost | $438,465,460 |
Short-Term Trading (Redemption) Fees. Shares held by investors in the Fund less than 90 days may have been subject to a redemption fee equal to 2.00% of the NAV of shares redeemed. All redemption fees, which reduce the proceeds of the shareholder redemption, are retained by the Fund and accounted for as an addition to paid in capital. In November 2017, the Board of Trustees approved the elimination of these redemption fees effective December 18, 2017.
Restricted Securities. The Fund may invest in securities that are subject to legal or contractual restrictions on resale. These securities generally may be resold in transactions exempt from registration or to the public if the securities are registered. Disposal of these securities may involve time-consuming negotiations and expense, and prompt sale at an acceptable price may be difficult. Information regarding restricted securities is included at the end of the Fund's Schedule of Investments.
4. Derivative Instruments.
Risk Exposures and the Use of Derivative Instruments. The Fund's investment objective allows the Fund to enter into various types of derivative contracts, including futures contracts. Derivatives are investments whose value is primarily derived from underlying assets, indices or reference rates and may be transacted on an exchange or over-the-counter (OTC). Derivatives may involve a future commitment to buy or sell a specified asset based on specified terms, to exchange future cash flows at periodic intervals based on a notional principal amount, or for one party to make one or more payments upon the occurrence of specified events in exchange for periodic payments from the other party.
The Fund used derivatives to increase returns and to manage exposure to certain risks as defined below. The success of any strategy involving derivatives depends on analysis of numerous economic factors, and if the strategies for investment do not work as intended, the Fund may not achieve its objectives.
The Fund's use of derivatives increased or decreased its exposure to the following risk:
| Equity Risk | Equity risk relates to the fluctuations in the value of financial instruments as a result of changes in market prices (other than those arising from interest rate risk or foreign exchange risk), whether caused by factors specific to an individual investment, its issuer, or all factors affecting all instruments traded in a market or market segment. |
The Fund is also exposed to additional risks from investing in derivatives, such as liquidity risk and counterparty credit risk. Liquidity risk is the risk that the Fund will be unable to close out the derivative in the open market in a timely manner. Counterparty credit risk is the risk that the counterparty will not be able to fulfill its obligation to the Fund. Counterparty credit risk related to exchange-traded futures contracts may be mitigated by the protection provided by the exchange on which they trade.
Investing in derivatives may involve greater risks than investing in the underlying assets directly and, to varying degrees, may involve risk of loss in excess of any initial investment and collateral received and amounts recognized in the Statement of Assets and Liabilities. In addition, there may be the risk that the change in value of the derivative contract does not correspond to the change in value of the underlying instrument.
Futures Contracts. A futures contract is an agreement between two parties to buy or sell a specified underlying instrument for a fixed price at a specified future date. The Fund used futures contracts to manage its exposure to the stock market.
Upon entering into a futures contract, a fund is required to deposit either cash or securities (initial margin) with a clearing broker in an amount equal to a certain percentage of the face value of the contract. Futures contracts are marked-to-market daily and subsequent daily payments (variation margin) are made or received by a fund depending on the daily fluctuations in the value of the futures contracts and are recorded as unrealized appreciation or (depreciation). This receivable and/or payable, if any, is included in daily variation margin on futures contracts in the Statement of Assets and Liabilities. Realized gain or (loss) is recorded upon the expiration or closing of a futures contract. The net realized gain (loss) and change in net unrealized appreciation (depreciation) on futures contracts during the period is presented in the Statement of Operations.
Any open futures contracts at period end are presented in the Schedule of Investments under the caption "Futures Contracts". The notional amount at value reflects each contract's exposure to the underlying instrument or index at period end and is representative of volume of activity during the period. Securities deposited to meet initial margin requirements are identified in the Schedule of Investments.
5. Purchases and Sales of Investments.
Purchases and sales of securities, other than short-term securities, aggregated $185,366,920 and $133,961,938, respectively.
6. Fees and Other Transactions with Affiliates.
Management Fee. Fidelity Management & Research Company (the investment adviser) and its affiliates provide the Fund with investment management related services for which the Fund pays a monthly management fee. The management fee is the sum of an individual fund fee rate that is based on an annual rate of .60% of the Fund's average net assets and an annualized group fee rate that averaged .24% during the period. The group fee rate is based upon the average net assets of all the mutual funds advised by the investment adviser, including any mutual funds previously advised by the investment adviser that are currently advised by Fidelity SelectCo, LLC, an affiliate of the investment adviser. The group fee rate decreases as assets under management increase and increases as assets under management decrease. For the reporting period, the total annualized management fee rate was .84% of the Fund's average net assets.
Distribution and Service Plan Fees. In accordance with Rule 12b-1 of the 1940 Act, the Fund has adopted separate Distribution and Service Plans for each class of shares. Certain classes pay Fidelity Distributors Corporation (FDC), an affiliate of the investment adviser, separate Distribution and Service Fees, each of which is based on an annual percentage of each class' average net assets. In addition, FDC may pay financial intermediaries for selling shares of the Fund and providing shareholder support services. For the period, the Distribution and Service Fee rates, total fees and amounts retained by FDC were as follows:
| Distribution Fee | Service Fee | Total Fees | Retained by FDC | |
| Class A | -% | .25% | $24,011 | $2,062 |
| Class M | .25% | .25% | 27,010 | 210 |
| Class C | .75% | .25% | 80,740 | 31,635 |
| $131,761 | $33,907 |
Sales Load. FDC may receive a front-end sales charge of up to 5.75% for selling Class A shares and 3.50% for selling Class M shares, some of which is paid to financial intermediaries for selling shares of the Fund. Depending on the holding period, FDC may receive contingent deferred sales charges levied on Class A, Class M and Class C redemptions. The deferred sales charges are 1.00% for Class C shares, 1.00% for certain purchases of Class A shares and .25% for certain purchases of Class M shares.
For the period, sales charge amounts retained by FDC were as follows:
| Retained by FDC | |
| Class A | $24,541 |
| Class M | 3,114 |
| Class C(a) | 2,571 |
| $30,226 |
(a) When Class C shares are initially sold, FDC pays commissions from its own resources to financial intermediaries through which the sales are made.
Transfer Agent Fees. Fidelity Investments Institutional Operations Company, Inc., (FIIOC), an affiliate of the investment adviser, is the transfer, dividend disbursing and shareholder servicing agent for each class of the Fund. FIIOC receives account fees and asset-based fees that vary according to the account size and type of account of the shareholders of the respective classes of the Fund. FIIOC pays for typesetting, printing and mailing of shareholder reports, except proxy statements.
For the period, transfer agent fees for each class were as follows:
| Amount | % of Class-Level Average Net Assets(a) | |
| Class A | $21,208 | .22 |
| Class M | 13,159 | .24 |
| Class C | 18,022 | .22 |
| Emerging Markets Discovery | 277,252 | .18 |
| Class I | 95,551 | .18 |
| $425,192 |
(a) Annualized
Accounting and Security Lending Fees. Fidelity Service Company, Inc. (FSC), an affiliate of the investment adviser, maintains the Fund's accounting records. The accounting fee is based on the level of average net assets for each month. Under a separate contract, FSC administers the security lending program. The security lending fee is based on the number and duration of lending transactions. For the period, the fees were equivalent to an annualized rate of .05%.
Brokerage Commissions. The Fund placed a portion of its portfolio transactions with brokerage firms which are affiliates of the investment adviser. Brokerage commissions are included in net realized gain (loss) and change in net unrealized appreciation (depreciation) in the Statement of Operations. The commissions paid to these affiliated firms were $416 for the period.
Interfund Trades. The Fund may purchase from or sell securities to other Fidelity Funds under procedures adopted by the Board. The procedures have been designed to ensure these interfund trades are executed in accordance with Rule 17a-7 of the 1940 Act. Interfund trades are included within the respective purchases and sales amounts shown in the Purchases and Sales of Investments note.
7. Committed Line of Credit.
The Fund participates with other funds managed by the investment adviser or an affiliate in a $4.25 billion credit facility (the "line of credit") to be utilized for temporary or emergency purposes to fund shareholder redemptions or for other short-term liquidity purposes. The Fund has agreed to pay commitment fees on its pro-rata portion of the line of credit, which amounted to $630 and is reflected in Miscellaneous expenses on the Statement of Operations. During the period, the Fund did not borrow on this line of credit.
8. Security Lending.
The Fund lends portfolio securities through a lending agent from time to time in order to earn additional income. For equity securities, a lending agent is used and may loan securities to certain qualified borrowers, including Fidelity Capital Markets (FCM), a broker-dealer affiliated with the Fund. On the settlement date of the loan, the Fund receives collateral (in the form of U.S. Treasury obligations, letters of credit and/or cash) against the loaned securities and maintains collateral in an amount not less than 100% of the market value of the loaned securities during the period of the loan. The market value of the loaned securities is determined at the close of business of the Fund and any additional required collateral is delivered to the Fund on the next business day. The Fund or borrower may terminate the loan at any time, and if the borrower defaults on its obligation to return the securities loaned because of insolvency or other reasons, the Fund may apply collateral received from the borrower against the obligation. The Fund may experience delays and costs in recovering the securities loaned. Any cash collateral received is invested in the Fidelity Securities Lending Cash Central Fund. The value of loaned securities and cash collateral at period end are disclosed on the Fund's Statement of Assets and Liabilities. At period end, there were no security loans outstanding with FCM. Security lending income represents the income earned on investing cash collateral, less rebates paid to borrowers and any lending agent fees associated with the loan, plus any premium payments received for lending certain types of securities. Security lending income is presented in the Statement of Operations as a component of income from Fidelity Central Funds. Total security lending income during the period amounted to $84,610. During the period, there were no securities loaned to FCM.
9. Expense Reductions.
Commissions paid to certain brokers with whom the investment adviser, or its affiliates, places trades on behalf of the Fund include an amount in addition to trade execution, which may be rebated back to the Fund to offset certain expenses. This amount totaled $47,822 for the period.
In addition, during the period the investment adviser reimbursed and/or waived a portion of fund-level operating expenses in the amount of $2,154.
10. Distributions to Shareholders.
Distributions to shareholders of each class were as follows:
| Six months ended April 30, 2018 | Year ended October 31, 2017 | |
| From net investment income | ||
| Class A | $92,921 | $29,900 |
| Class M | 27,822 | 10,789 |
| Class C | 20,272 | 1,070 |
| Emerging Markets Discovery | 2,195,902 | 534,294 |
| Class I | 744,924 | 83,753 |
| Total | $3,081,841 | $659,806 |
| From net realized gain | ||
| Class A | $259,988 | $29,370 |
| Class M | 145,433 | 15,653 |
| Class C | 230,640 | 12,406 |
| Emerging Markets Discovery | 4,430,326 | 375,874 |
| Class I | 1,477,005 | 52,117 |
| Total | $6,543,392 | $485,420 |
11. Share Transactions.
Share transactions for each class were as follows and may contain automatic conversions between classes or exchanges between affiliated funds:
| Shares | Shares | Dollars | Dollars | |
| Six months ended April 30, 2018 | Year ended October 31, 2017 | Six months ended April 30, 2018 | Year ended October 31, 2017 | |
| Class A | ||||
| Shares sold | 528,719 | 938,873 | $8,259,782 | $12,644,829 |
| Reinvestment of distributions | 23,808 | 4,936 | 349,501 | 55,853 |
| Shares redeemed | (168,405) | (303,068) | (2,599,328) | (4,070,793) |
| Net increase (decrease) | 384,122 | 640,741 | $6,009,955 | $8,629,889 |
| Class M | ||||
| Shares sold | 172,925 | 451,879 | $2,753,615 | $5,910,208 |
| Reinvestment of distributions | 11,842 | 2,312 | 173,255 | 26,067 |
| Shares redeemed | (36,980) | (60,393) | (575,283) | (796,878) |
| Net increase (decrease) | 147,787 | 393,798 | $2,351,587 | $5,139,397 |
| Class C | ||||
| Shares sold | 237,730 | 856,704 | $3,636,449 | $11,379,958 |
| Reinvestment of distributions | 17,447 | 1,203 | 250,359 | 13,340 |
| Shares redeemed | (70,835) | (74,143) | (1,082,998) | (999,641) |
| Net increase (decrease) | 184,342 | 783,764 | $2,803,810 | $10,393,657 |
| Emerging Markets Discovery | ||||
| Shares sold | 8,529,995 | 14,972,932 | $132,775,274 | $202,173,147 |
| Reinvestment of distributions | 427,373 | 74,929 | 6,303,758 | 850,905 |
| Shares redeemed | (4,700,390) | (4,082,672) | (73,819,563) | (56,381,917) |
| Net increase (decrease) | 4,256,978 | 10,965,189 | $65,259,469 | $146,642,135 |
| Class I | ||||
| Shares sold | 1,639,474 | 6,604,470 | $25,756,533 | $89,627,624 |
| Reinvestment of distributions | 148,725 | 11,894 | 2,198,156 | 135,413 |
| Shares redeemed | (924,178) | (877,747) | (14,459,557) | (11,209,247) |
| Net increase (decrease) | 864,021 | 5,738,617 | $13,495,132 | $78,553,790 |
12. Other.
The Fund's organizational documents provide former and current trustees and officers with a limited indemnification against liabilities arising in connection with the performance of their duties to the Fund. In the normal course of business, the Fund may also enter into contracts that provide general indemnifications. The Fund's maximum exposure under these arrangements is unknown as this would be dependent on future claims that may be made against the Fund. The risk of material loss from such claims is considered remote.
Shareholder Expense Example
As a shareholder of the Fund, you incur two types of costs: (1) transaction costs, including sales charges (loads) on purchase payments or redemption proceeds, redemption fees and (2) ongoing costs, including management fees, distribution and/or service (12b-1) fees and other Fund expenses. This Example is intended to help you understand your ongoing costs (in dollars) of investing in the Fund and to compare these costs with the ongoing costs of investing in other mutual funds.
The Example is based on an investment of $1,000 invested at the beginning of the period and held for the entire period (November 1, 2017 to April 30, 2018).
Actual Expenses
The first line of the accompanying table for each class of the Fund provides information about actual account values and actual expenses. You may use the information in this line, together with the amount you invested, to estimate the expenses that you paid over the period. Simply divide your account value by $1,000.00 (for example, an $8,600 account value divided by $1,000.00 = 8.6), then multiply the result by the number in the first line for a class of the Fund under the heading entitled "Expenses Paid During Period" to estimate the expenses you paid on your account during this period. A small balance maintenance fee of $12.00 that is charged once a year may apply for certain accounts with a value of less than $2,000. This fee is not included in the table below. If it was, the estimate of expenses you paid during the period would be higher, and your ending account value lower, by this amount. In addition, the Fund, as a shareholder in the underlying Fidelity Central Funds, will indirectly bear its pro-rata share of the fees and expenses incurred by the underlying Fidelity Central Funds. These fees and expenses are not included in the Fund's annualized expense ratio used to calculate the expense estimate in the table below.
Hypothetical Example for Comparison Purposes
The second line of the accompanying table for each class of the Fund provides information about hypothetical account values and hypothetical expenses based on a Class' actual expense ratio and an assumed rate of return of 5% per year before expenses, which is not the Class' actual return. The hypothetical account values and expenses may not be used to estimate the actual ending account balance or expenses you paid for the period. You may use this information to compare the ongoing costs of investing in the Fund and other funds. To do so, compare this 5% hypothetical example with the 5% hypothetical examples that appear in the shareholder reports of the other funds. A small balance maintenance fee of $12.00 that is charged once a year may apply for certain accounts with a value of less than $2,000. This fee is not included in the table below. If it was, the estimate of expenses you paid during the period would be higher, and your ending account value lower, by this amount. In addition, the Fund, as a shareholder in the underlying Fidelity Central Funds, will indirectly bear its pro-rata share of the fees and expenses incurred by the underlying Fidelity Central Funds. These fees and expenses are not included in the Fund's annualized expense ratio used to calculate the expense estimate in the table below.
Please note that the expenses shown in the table are meant to highlight your ongoing costs only and do not reflect any transaction costs. Therefore, the second line of the table is useful in comparing ongoing costs only, and will not help you determine the relative total costs of owning different funds. In addition, if these transactional costs were included, your costs would have been higher.
| Annualized Expense Ratio-A | Beginning Account Value November 1, 2017 | Ending Account Value April 30, 2018 | Expenses Paid During Period-B November 1, 2017 to April 30, 2018 | |
| Class A | 1.49% | |||
| Actual | $1,000.00 | $1,055.20 | $7.59 | |
| Hypothetical-C | $1,000.00 | $1,017.41 | $7.45 | |
| Class M | 1.76% | |||
| Actual | $1,000.00 | $1,053.50 | $8.96 | |
| Hypothetical-C | $1,000.00 | $1,016.07 | $8.80 | |
| Class C | 2.24% | |||
| Actual | $1,000.00 | $1,051.50 | $11.39 | |
| Hypothetical-C | $1,000.00 | $1,013.69 | $11.18 | |
| Emerging Markets Discovery | 1.20% | |||
| Actual | $1,000.00 | $1,057.20 | $6.12 | |
| Hypothetical-C | $1,000.00 | $1,018.84 | $6.01 | |
| Class I | 1.20% | |||
| Actual | $1,000.00 | $1,057.20 | $6.12 | |
| Hypothetical-C | $1,000.00 | $1,018.84 | $6.01 |
A Annualized expense ratio reflects expenses net of applicable fee waivers.
B Expenses are equal to each Class' annualized expense ratio, multiplied by the average account value over the period, multiplied by 181/365 (to reflect the one-half year period).
C 5% return per year before expenses
![]()
AEMD-SANN-0618
1.931253.106
Fidelity® Global Equity Income Fund Semi-Annual Report April 30, 2018 |
|
Contents
To view a fund's proxy voting guidelines and proxy voting record for the 12-month period ended June 30, visit http://www.fidelity.com/proxyvotingresults or visit the Securities and Exchange Commission's (SEC) web site at http://www.sec.gov.
You may also call 1-800-544-8544 to request a free copy of the proxy voting guidelines.
Standard & Poor's, S&P and S&P 500 are registered service marks of The McGraw-Hill Companies, Inc. and have been licensed for use by Fidelity Distributors Corporation.
Other third-party marks appearing herein are the property of their respective owners.
All other marks appearing herein are registered or unregistered trademarks or service marks of FMR LLC or an affiliated company. © 2018 FMR LLC. All rights reserved.
This report and the financial statements contained herein are submitted for the general information of the shareholders of the Fund. This report is not authorized for distribution to prospective investors in the Fund unless preceded or accompanied by an effective prospectus.
A fund files its complete schedule of portfolio holdings with the SEC for the first and third quarters of each fiscal year on Form N-Q. Forms N-Q are available on the SEC’s web site at http://www.sec.gov. A fund's Forms N-Q may be reviewed and copied at the SEC’s Public Reference Room in Washington, DC. Information regarding the operation of the SEC's Public Reference Room may be obtained by calling 1-800-SEC-0330.
For a complete list of a fund's portfolio holdings, view the most recent holdings listing, semiannual report, or annual report on Fidelity's web site at http://www.fidelity.com, http://www.institutional.fidelity.com, or http://www.401k.com, as applicable.
NOT FDIC INSURED •MAY LOSE VALUE •NO BANK GUARANTEE
Neither the Fund nor Fidelity Distributors Corporation is a bank.
Investment Summary (Unaudited)
Geographic Diversification (% of fund's net assets)
| As of April 30, 2018 | ||
| United States of America* | 49.4% | |
| United Kingdom | 10.6% | |
| Japan | 7.4% | |
| Canada | 4.1% | |
| Switzerland | 4.1% | |
| Germany | 3.0% | |
| Netherlands | 2.9% | |
| Spain | 1.7% | |
| France | 1.7% | |
| Other | 15.1% | |
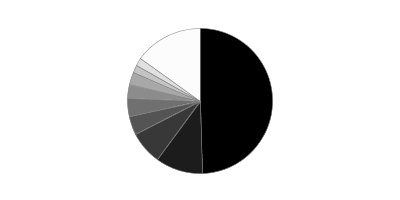
* Includes Short-Term investments and Net Other Assets (Liabilities).
Percentages are based on country or territory of incorporation and are adjusted for the effect of futures contracts, if applicable.
Asset Allocation as of April 30, 2018
| % of fund's net assets | |
| Stocks | 92.8 |
| Short-Term Investments and Net Other Assets (Liabilities) | 7.2 |
Top Ten Stocks as of April 30, 2018
| % of fund's net assets | |
| Microsoft Corp. (United States of America, Software) | 2.5 |
| Apple, Inc. (United States of America, Technology Hardware, Storage & Peripherals) | 2.5 |
| British American Tobacco PLC (United Kingdom) (United Kingdom, Tobacco) | 2.3 |
| JPMorgan Chase & Co. (United States of America, Banks) | 2.1 |
| Bank of America Corp. (United States of America, Banks) | 1.9 |
| Chevron Corp. (United States of America, Oil, Gas & Consumable Fuels) | 1.8 |
| Daiichikosho Co. Ltd. (Japan, Media) | 1.6 |
| American Tower Corp. (United States of America, Equity Real Estate Investment Trusts (REITs)) | 1.5 |
| Nestle SA (Reg. S) (Switzerland, Food Products) | 1.5 |
| Wells Fargo & Co. (United States of America, Banks) | 1.5 |
| 19.2 |
Top Market Sectors as of April 30, 2018
| % of fund's net assets | |
| Financials | 17.2 |
| Consumer Staples | 14.7 |
| Information Technology | 12.7 |
| Consumer Discretionary | 11.6 |
| Health Care | 10.9 |
| Energy | 8.6 |
| Industrials | 7.5 |
| Telecommunication Services | 4.2 |
| Materials | 3.9 |
| Real Estate | 1.5 |
Schedule of Investments April 30, 2018 (Unaudited)
Showing Percentage of Net Assets
| Common Stocks - 91.8% | |||
| Shares | Value | ||
| Australia - 0.1% | |||
| Inghams Group Ltd. | 15,042 | $42,442 | |
| Bailiwick of Jersey - 1.3% | |||
| Shire PLC | 4,500 | 239,625 | |
| Wolseley PLC | 6,362 | 488,728 | |
| WPP PLC | 15,500 | 265,982 | |
| TOTAL BAILIWICK OF JERSEY | 994,335 | ||
| Belgium - 1.6% | |||
| Anheuser-Busch InBev SA NV | 5,000 | 499,463 | |
| KBC Groep NV | 6,145 | 537,259 | |
| Telenet Group Holding NV (a) | 3,000 | 175,923 | |
| TOTAL BELGIUM | 1,212,645 | ||
| Bermuda - 0.6% | |||
| Hiscox Ltd. | 12,200 | 250,089 | |
| IHS Markit Ltd. (a) | 5,000 | 245,650 | |
| TOTAL BERMUDA | 495,739 | ||
| Canada - 4.1% | |||
| Alimentation Couche-Tard, Inc. Class B (sub. vtg.) | 8,300 | 358,840 | |
| Constellation Software, Inc. | 1,300 | 929,101 | |
| Fairfax Financial Holdings Ltd. (sub. vtg.) | 541 | 299,512 | |
| Imperial Oil Ltd. | 17,300 | 538,019 | |
| Suncor Energy, Inc. | 27,900 | 1,066,934 | |
| TOTAL CANADA | 3,192,406 | ||
| Cayman Islands - 0.8% | |||
| Best Pacific International Holdings Ltd. | 138,000 | 54,352 | |
| SITC International Holdings Co. Ltd. | 539,000 | 574,275 | |
| TOTAL CAYMAN ISLANDS | 628,627 | ||
| China - 0.5% | |||
| Shanghai International Airport Co. Ltd. (A Shares) | 46,668 | 366,537 | |
| Zhengzhou Yutong Bus Co. Ltd. | 11,600 | 37,476 | |
| TOTAL CHINA | 404,013 | ||
| France - 1.7% | |||
| Compagnie de St. Gobain | 8,500 | 446,459 | |
| Edenred SA | 3,000 | 103,250 | |
| Maisons du Monde SA (b) | 7,400 | 300,973 | |
| VINCI SA (c) | 4,700 | 469,923 | |
| TOTAL FRANCE | 1,320,605 | ||
| Germany - 3.0% | |||
| adidas AG | 1,781 | 438,535 | |
| AURELIUS AG | 405 | 30,739 | |
| Deutsche Post AG | 8,809 | 382,350 | |
| Deutsche Telekom AG | 11,000 | 192,540 | |
| Hannover Reuck SE | 1,500 | 211,209 | |
| Linde AG | 2,000 | 444,518 | |
| SAP SE | 5,519 | 613,192 | |
| TOTAL GERMANY | 2,313,083 | ||
| Hong Kong - 0.5% | |||
| Techtronic Industries Co. Ltd. | 70,500 | 413,003 | |
| Ireland - 1.7% | |||
| Accenture PLC Class A | 4,640 | 701,568 | |
| Greencore Group PLC | 46,870 | 102,435 | |
| Johnson Controls International PLC | 4,000 | 135,480 | |
| Paddy Power Betfair PLC (Ireland) | 2,700 | 267,200 | |
| Smurfit Kappa Group PLC | 2,500 | 106,752 | |
| TOTAL IRELAND | 1,313,435 | ||
| Isle of Man - 0.6% | |||
| Playtech Ltd. | 38,858 | 433,637 | |
| Italy - 0.4% | |||
| Prada SpA | 52,700 | 267,395 | |
| Japan - 7.4% | |||
| A/S One Corp. | 6,700 | 455,982 | |
| Aucnet, Inc. | 9,500 | 123,312 | |
| Broadleaf Co. Ltd. | 43,200 | 206,279 | |
| Daiichikosho Co. Ltd. | 22,900 | 1,204,491 | |
| Hoya Corp. | 16,400 | 879,407 | |
| Inaba Denki Sangyo Co. Ltd. | 8,000 | 342,847 | |
| Japan Meat Co. Ltd. | 18,600 | 332,799 | |
| Mitani Shoji Co. Ltd. | 1,900 | 90,377 | |
| Morinaga & Co. Ltd. | 8,300 | 404,674 | |
| Nippon Telegraph & Telephone Corp. | 13,100 | 621,663 | |
| Sacs Bar Holdings, Inc. | 6,000 | 64,325 | |
| Sony Corp. | 8,400 | 392,331 | |
| Tsuruha Holdings, Inc. | 4,300 | 618,725 | |
| TOTAL JAPAN | 5,737,212 | ||
| Kenya - 0.8% | |||
| Safaricom Ltd. | 2,287,800 | 644,370 | |
| Korea (South) - 0.2% | |||
| Coway Co. Ltd. | 1,789 | 146,170 | |
| Cuckoo Holdings Co. Ltd. | 232 | 25,780 | |
| TOTAL KOREA (SOUTH) | 171,950 | ||
| Luxembourg - 1.1% | |||
| B&M European Value Retail S.A. | 149,446 | 833,874 | |
| Multi-National - 0.6% | |||
| HKT Trust/HKT Ltd. unit | 351,600 | 462,595 | |
| Netherlands - 2.9% | |||
| Koninklijke Philips Electronics NV | 10,754 | 455,176 | |
| LyondellBasell Industries NV Class A | 5,900 | 623,807 | |
| Unilever NV (Certificaten Van Aandelen) (Bearer) | 20,079 | 1,151,101 | |
| TOTAL NETHERLANDS | 2,230,084 | ||
| Norway - 0.7% | |||
| Statoil ASA (c) | 21,463 | 548,867 | |
| Panama - 0.4% | |||
| Carnival Corp. | 5,000 | 315,300 | |
| Spain - 1.2% | |||
| Amadeus IT Holding SA Class A | 4,500 | 329,856 | |
| CaixaBank SA | 50,000 | 243,144 | |
| Prosegur Cash SA (b) | 127,800 | 373,482 | |
| TOTAL SPAIN | 946,482 | ||
| Sweden - 1.1% | |||
| Essity AB Class B | 15,000 | 381,995 | |
| HEXPOL AB (B Shares) | 9,300 | 96,647 | |
| Loomis AB (B Shares) | 10,597 | 387,495 | |
| TOTAL SWEDEN | 866,137 | ||
| Switzerland - 4.1% | |||
| Banque Cantonale Vaudoise | 470 | 375,621 | |
| Chubb Ltd. | 3,600 | 488,412 | |
| Nestle SA (Reg. S) | 15,345 | 1,188,779 | |
| Roche Holding AG (participation certificate) | 3,000 | 666,562 | |
| Swatch Group AG (Bearer) | 870 | 420,076 | |
| TOTAL SWITZERLAND | 3,139,450 | ||
| Taiwan - 1.2% | |||
| Taiwan Semiconductor Manufacturing Co. Ltd. | 94,000 | 714,762 | |
| United Microelectronics Corp. | 363,000 | 195,409 | |
| TOTAL TAIWAN | 910,171 | ||
| Thailand - 0.4% | |||
| Star Petroleum Refining PCL | 571,800 | 283,533 | |
| United Kingdom - 10.6% | |||
| AstraZeneca PLC sponsored ADR | 14,200 | 504,526 | |
| British American Tobacco PLC (United Kingdom) | 31,978 | 1,753,914 | |
| Bunzl PLC | 8,500 | 247,028 | |
| Cineworld Group PLC | 75,000 | 268,870 | |
| Compass Group PLC | 15,500 | 332,886 | |
| Conviviality PLC (d) | 62,820 | 43,761 | |
| GlaxoSmithKline PLC | 27,653 | 554,641 | |
| Hastings Group Holdings PLC (b) | 71,432 | 271,420 | |
| Hilton Food Group PLC | 58,600 | 714,777 | |
| Imperial Tobacco Group PLC | 11,756 | 421,525 | |
| Melrose Industries PLC | 63,154 | 198,233 | |
| Micro Focus International PLC | 54,158 | 933,854 | |
| Moneysupermarket.com Group PLC | 92,244 | 380,596 | |
| Reckitt Benckiser Group PLC | 2,600 | 203,965 | |
| St. James's Place Capital PLC | 25,521 | 399,307 | |
| Standard Life PLC | 76,561 | 385,032 | |
| Victrex PLC | 7,300 | 263,509 | |
| Vodafone Group PLC | 111,200 | 324,506 | |
| TOTAL UNITED KINGDOM | 8,202,350 | ||
| United States of America - 42.2% | |||
| Altria Group, Inc. | 11,100 | 622,821 | |
| American Tower Corp. | 8,760 | 1,194,514 | |
| AMETEK, Inc. | 11,200 | 781,760 | |
| Amgen, Inc. | 6,620 | 1,155,058 | |
| Apple, Inc. | 11,650 | 1,925,279 | |
| Ball Corp. | 5,400 | 216,486 | |
| Bank of America Corp. | 49,080 | 1,468,474 | |
| Becton, Dickinson & Co. | 2,900 | 672,423 | |
| Bluegreen Vacations Corp. (c) | 16,100 | 374,647 | |
| Bristol-Myers Squibb Co. | 6,100 | 317,993 | |
| Capital One Financial Corp. | 9,100 | 824,642 | |
| Cedar Fair LP (depositary unit) | 4,100 | 277,734 | |
| Charter Communications, Inc. Class A (a) | 1,200 | 325,548 | |
| Chevron Corp. | 11,065 | 1,384,342 | |
| Citigroup, Inc. | 15,700 | 1,071,839 | |
| Comcast Corp. Class A | 18,700 | 586,993 | |
| ConocoPhillips Co. | 16,500 | 1,080,750 | |
| Danaher Corp. | 4,900 | 491,568 | |
| Diamond Hill Investment Group, Inc. | 1,800 | 351,756 | |
| DowDuPont, Inc. | 10,640 | 672,874 | |
| Dr. Pepper Snapple Group, Inc. | 4,841 | 580,726 | |
| Enterprise Products Partners LP | 2,900 | 77,836 | |
| Exxon Mobil Corp. | 9,630 | 748,733 | |
| Fortive Corp. | 4,200 | 295,302 | |
| General Electric Co. | 20,200 | 284,214 | |
| Interpublic Group of Companies, Inc. | 10,700 | 252,413 | |
| Johnson & Johnson | 7,600 | 961,324 | |
| JPMorgan Chase & Co. | 14,730 | 1,602,329 | |
| Lowe's Companies, Inc. | 3,700 | 304,991 | |
| Microsoft Corp. | 20,664 | 1,932,490 | |
| Monsanto Co. | 3,200 | 401,184 | |
| MSCI, Inc. | 2,400 | 359,592 | |
| Packaging Corp. of America | 1,800 | 208,242 | |
| PepsiCo, Inc. | 6,300 | 635,922 | |
| Philip Morris International, Inc. | 3,100 | 254,200 | |
| Phillips 66 Co. | 3,500 | 389,585 | |
| Qualcomm, Inc. | 15,900 | 811,059 | |
| S&P Global, Inc. | 2,140 | 403,604 | |
| SunTrust Banks, Inc. | 12,400 | 828,320 | |
| The Coca-Cola Co. | 16,400 | 708,644 | |
| The J.M. Smucker Co. | 3,500 | 399,280 | |
| U.S. Bancorp | 17,580 | 886,911 | |
| UnitedHealth Group, Inc. | 3,100 | 732,840 | |
| Valero Energy Corp. | 3,900 | 432,627 | |
| Verizon Communications, Inc. | 22,600 | 1,115,310 | |
| Wells Fargo & Co. | 22,657 | 1,177,258 | |
| TOTAL UNITED STATES OF AMERICA | 32,582,437 | ||
| TOTAL COMMON STOCKS | |||
| (Cost $57,156,686) | 70,906,177 | ||
| Nonconvertible Preferred Stocks - 1.0% | |||
| Brazil - 0.5% | |||
| Itau Unibanco Holding SA | 27,200 | 396,058 | |
| Spain - 0.5% | |||
| Grifols SA Class B | 18,900 | 389,574 | |
| TOTAL NONCONVERTIBLE PREFERRED STOCKS | |||
| (Cost $679,637) | 785,632 | ||
| Principal Amount(e) | Value | ||
| Nonconvertible Bonds - 0.0% | |||
| Canada - 0.0% | |||
| Constellation Software, Inc. Canada Consumer Price Index + 6.500% 8.1% 3/31/40 (f)(g) | |||
| (Cost $2,060) | CAD 2,400 | 2,280 | |
| Shares | Value | ||
| Money Market Funds - 1.2% | |||
| Fidelity Securities Lending Cash Central Fund 1.74% (h)(i) | |||
| (Cost $940,494) | 940,374 | 940,468 | |
| TOTAL INVESTMENT IN SECURITIES - 94.0% | |||
| (Cost $58,778,877) | 72,634,557 | ||
| NET OTHER ASSETS (LIABILITIES) - 6.0% | 4,625,923 | ||
| NET ASSETS - 100% | $77,260,480 |
Currency Abbreviations
CAD – Canadian dollar
Categorizations in the Schedule of Investments are based on country or territory of incorporation.
Legend
(a) Non-income producing
(b) Security exempt from registration under Rule 144A of the Securities Act of 1933. These securities may be resold in transactions exempt from registration, normally to qualified institutional buyers. At the end of the period, the value of these securities amounted to $945,875 or 1.2% of net assets.
(c) Security or a portion of the security is on loan at period end.
(d) Level 3 security
(e) Amount is stated in United States dollars unless otherwise noted.
(f) Coupon rates for floating and adjustable rate securities reflect the rates in effect at period end.
(g) Coupon is indexed to a floating interest rate which may be multiplied by a specified factor and/or subject to caps or floors.
(h) Affiliated fund that is generally available only to investment companies and other accounts managed by Fidelity Investments. The rate quoted is the annualized seven-day yield of the fund at period end. A complete unaudited listing of the fund's holdings as of its most recent quarter end is available upon request. In addition, each Fidelity Central Fund's financial statements are available on the SEC's website or upon request.
(i) Investment made with cash collateral received from securities on loan.
Affiliated Central Funds
Information regarding fiscal year to date income earned by the Fund from investments in Fidelity Central Funds is as follows:
| Fund | Income earned |
| Fidelity Cash Central Fund | $10,612 |
| Fidelity Securities Lending Cash Central Fund | 3,176 |
| Total | $13,788 |
Amounts in the income column in the above table include any capital gain distributions from underlying funds, which are presented in the corresponding line-item in the Statement of Operations if applicable.
Investment Valuation
The following is a summary of the inputs used, as of April 30, 2018, involving the Fund's assets and liabilities carried at fair value. The inputs or methodology used for valuing securities may not be an indication of the risk associated with investing in those securities. For more information on valuation inputs, and their aggregation into the levels used below, please refer to the Investment Valuation section in the accompanying Notes to Financial Statements.
| Valuation Inputs at Reporting Date: | ||||
| Description | Total | Level 1 | Level 2 | Level 3 |
| Investments in Securities: | ||||
| Equities: | ||||
| Consumer Discretionary | $8,743,429 | $7,350,366 | $1,393,063 | $-- |
| Consumer Staples | 11,420,788 | 7,036,826 | 4,340,201 | 43,761 |
| Energy | 6,551,226 | 5,718,826 | 832,400 | -- |
| Financials | 13,236,009 | 12,992,865 | 243,144 | -- |
| Health Care | 8,476,699 | 6,171,121 | 2,305,578 | -- |
| Industrials | 5,877,384 | 4,046,823 | 1,830,561 | -- |
| Information Technology | 9,796,757 | 7,339,540 | 2,457,217 | -- |
| Materials | 3,034,019 | 3,034,019 | -- | -- |
| Real Estate | 1,194,514 | 1,194,514 | -- | -- |
| Telecommunication Services | 3,360,984 | 1,759,680 | 1,601,304 | -- |
| Corporate Bonds | 2,280 | -- | 2,280 | -- |
| Money Market Funds | 940,468 | 940,468 | -- | -- |
| Total Investments in Securities: | $72,634,557 | $57,585,048 | $15,005,748 | $43,761 |
The following is a summary of transfers between Level 1 and Level 2 for the period ended April 30, 2018. Transfers are assumed to have occurred at the beginning of the period, and are primarily attributable to the valuation techniques used for foreign equity securities, as discussed in the accompanying Notes to Financial Statements:
| Transfers | Total |
| Level 1 to Level 2 | $5,165,477 |
| Level 2 to Level 1 | $5,211,246 |
See accompanying notes which are an integral part of the financial statements.
Financial Statements
Statement of Assets and Liabilities
| April 30, 2018 (Unaudited) | ||
| Assets | ||
| Investment in securities, at value (including securities loaned of $883,343) — See accompanying schedule: Unaffiliated issuers (cost $57,838,383) | $71,694,089 | |
| Fidelity Central Funds (cost $940,494) | 940,468 | |
| Total Investment in Securities (cost $58,778,877) | $72,634,557 | |
| Receivable for investments sold | 7,892,141 | |
| Receivable for fund shares sold | 77,091 | |
| Dividends receivable | 254,828 | |
| Interest receivable | 135 | |
| Distributions receivable from Fidelity Central Funds | 1,011 | |
| Prepaid expenses | 40 | |
| Other receivables | 437 | |
| Total assets | 80,860,240 | |
| Liabilities | ||
| Payable to custodian bank | $74,990 | |
| Payable for investments purchased | 2,419,451 | |
| Payable for fund shares redeemed | 70,545 | |
| Accrued management fee | 45,095 | |
| Other affiliated payables | 15,618 | |
| Other payables and accrued expenses | 33,566 | |
| Collateral on securities loaned | 940,495 | |
| Total liabilities | 3,599,760 | |
| Net Assets | $77,260,480 | |
| Net Assets consist of: | ||
| Paid in capital | $60,948,304 | |
| Undistributed net investment income | 193,610 | |
| Accumulated undistributed net realized gain (loss) on investments and foreign currency transactions | 2,265,748 | |
| Net unrealized appreciation (depreciation) on investments and assets and liabilities in foreign currencies | 13,852,818 | |
| Net Assets, for 5,506,679 shares outstanding | $77,260,480 | |
| Net Asset Value, offering price and redemption price per share ($77,260,480 ÷ 5,506,679 shares) | $14.03 |
See accompanying notes which are an integral part of the financial statements.
Statement of Operations
| Six months ended April 30, 2018 (Unaudited) | ||
| Investment Income | ||
| Dividends | $1,021,418 | |
| Interest | 196 | |
| Income from Fidelity Central Funds | 13,788 | |
| Income before foreign taxes withheld | 1,035,402 | |
| Less foreign taxes withheld | (49,602) | |
| Total income | 985,800 | |
| Expenses | ||
| Management fee | $283,292 | |
| Transfer agent fees | 74,158 | |
| Accounting and security lending fees | 21,303 | |
| Custodian fees and expenses | 3,780 | |
| Independent trustees' fees and expenses | 162 | |
| Registration fees | 20,899 | |
| Audit | 32,099 | |
| Legal | 1,088 | |
| Miscellaneous | 262 | |
| Total expenses before reductions | 437,043 | |
| Expense reductions | (2,336) | 434,707 |
| Net investment income (loss) | 551,093 | |
| Realized and Unrealized Gain (Loss) | ||
| Net realized gain (loss) on: | ||
| Investment securities: | ||
| Unaffiliated issuers | 2,401,554 | |
| Fidelity Central Funds | (85) | |
| Foreign currency transactions | 12,770 | |
| Total net realized gain (loss) | 2,414,239 | |
| Change in net unrealized appreciation (depreciation) on: | ||
| Investment securities: | ||
| Unaffiliated issuers (net of decrease in deferred foreign taxes of $1,361) | (2,520,433) | |
| Fidelity Central Funds | (84) | |
| Assets and liabilities in foreign currencies | (3,806) | |
| Total change in net unrealized appreciation (depreciation) | (2,524,323) | |
| Net gain (loss) | (110,084) | |
| Net increase (decrease) in net assets resulting from operations | $441,009 |
See accompanying notes which are an integral part of the financial statements.
Statement of Changes in Net Assets
| Six months ended April 30, 2018 (Unaudited) | Year ended October 31, 2017 | |
| Increase (Decrease) in Net Assets | ||
| Operations | ||
| Net investment income (loss) | $551,093 | $977,143 |
| Net realized gain (loss) | 2,414,239 | 2,279,736 |
| Change in net unrealized appreciation (depreciation) | (2,524,323) | 10,160,125 |
| Net increase (decrease) in net assets resulting from operations | 441,009 | 13,417,004 |
| Distributions to shareholders from net investment income | (424,016) | (949,348) |
| Distributions to shareholders from net realized gain | (1,015,983) | – |
| Total distributions | (1,439,999) | (949,348) |
| Share transactions | ||
| Proceeds from sales of shares | 9,071,107 | 22,414,620 |
| Reinvestment of distributions | 1,358,912 | 891,642 |
| Cost of shares redeemed | (13,178,352) | (26,444,504) |
| Net increase (decrease) in net assets resulting from share transactions | (2,748,333) | (3,138,242) |
| Redemption fees | 1,273 | 2,427 |
| Total increase (decrease) in net assets | (3,746,050) | 9,331,841 |
| Net Assets | ||
| Beginning of period | 81,006,530 | 71,674,689 |
| End of period | $77,260,480 | $81,006,530 |
| Other Information | ||
| Undistributed net investment income end of period | $193,610 | $66,533 |
| Shares | ||
| Sold | 626,541 | 1,724,355 |
| Issued in reinvestment of distributions | 95,348 | 67,744 |
| Redeemed | (914,282) | (2,036,720) |
| Net increase (decrease) | (192,393) | (244,621) |
See accompanying notes which are an integral part of the financial statements.
Financial Highlights
Fidelity Global Equity Income Fund
| Six months ended (Unaudited) April 30, | Years endedOctober 31, | |||||
| 2018 | 2017 | 2016 | 2015 | 2014 | 2013 | |
| Selected Per–Share Data | ||||||
| Net asset value, beginning of period | $14.21 | $12.06 | $12.12 | $12.87 | $12.20 | $10.16 |
| Income from Investment Operations | ||||||
| Net investment income (loss)A | .10 | .17 | .15 | .16 | .28B | .22 |
| Net realized and unrealized gain (loss) | (.03) | 2.15 | .11 | .21 | .92 | 2.06 |
| Total from investment operations | .07 | 2.32 | .26 | .37 | 1.20 | 2.28 |
| Distributions from net investment income | (.08) | (.17) | (.15) | (.16) | (.25) | (.21) |
| Distributions from net realized gain | (.18) | – | (.16) | (.95) | (.28) | (.03) |
| Total distributions | (.25)C | (.17) | (.32)D | (1.12)E | (.53) | (.24) |
| Redemption fees added to paid in capitalA,F | – | – | – | – | – | – |
| Net asset value, end of period | $14.03 | $14.21 | $12.06 | $12.12�� | $12.87 | $12.20 |
| Total ReturnG,H | .49% | 19.31% | 2.13% | 2.93% | 10.10% | 22.73% |
| Ratios to Average Net AssetsI,J | ||||||
| Expenses before reductions | 1.07%K | 1.13% | 1.18% | 1.15% | 1.16% | 1.28% |
| Expenses net of fee waivers, if any | 1.06%K | 1.13% | 1.18% | 1.15% | 1.16% | 1.20% |
| Expenses net of all reductions | 1.06%K | 1.13% | 1.18% | 1.14% | 1.16% | 1.19% |
| Net investment income (loss) | 1.34%K | 1.29% | 1.24% | 1.27% | 2.21%B | 1.94% |
| Supplemental Data | ||||||
| Net assets, end of period (000 omitted) | $77,260 | $81,007 | $71,675 | $67,926 | $52,038 | $42,271 |
| Portfolio turnover rateL | 40%K | 37% | 40% | 64% | 92% | 66% |
A Calculated based on average shares outstanding during the period.
B Net Investment income per share reflects a large, non-recurring dividend which amounted to $.08 per share. Excluding this non-recurring dividend, the ratio of net investment income (loss) to average net assets would have been 1.56%.
C Total distributions of $.25 per share is comprised of distributions from net investment income of $.075 and distributions from net realized gain of $.178 per share.
D Total distributions of $.32 per share is comprised of distributions from net investment income of $.153 and distributions from net realized gain of $.162 per share.
E Total distributions of $1.12 per share is comprised of distributions from net investment income of $.164 and distributions from net realized gain of $.954 per share.
F Amount represents less than $.005 per share.
G Total returns for periods of less than one year are not annualized.
H Total returns would have been lower if certain expenses had not been reduced during the applicable periods shown.
I Fees and expenses of any underlying Fidelity Central Funds are not included in the Fund's expense ratio. The Fund indirectly bears its proportionate share of the expenses of any underlying Fidelity Central Funds.
J Expense ratios reflect operating expenses of the Fund. Expenses before reductions do not reflect amounts reimbursed by the investment adviser or reductions from brokerage service arrangements or reductions from other expense offset arrangements and do not represent the amount paid by the Fund during periods when reimbursements or reductions occur. Expenses net of fee waivers reflect expenses after reimbursement by the investment adviser but prior to reductions from brokerage service arrangements or other expense offset arrangements. Expenses net of all reductions represent the net expenses paid by the Fund.
K Annualized
L Amount does not include the portfolio activity of any underlying Fidelity Central Funds.
See accompanying notes which are an integral part of the financial statements.
Notes to Financial Statements (Unaudited)
For the period ended April 30, 2018
1. Organization.
Fidelity Global Equity Income Fund (the Fund) is a fund of Fidelity Investment Trust (the Trust) and is authorized to issue an unlimited number of shares. Share transactions on the Statement of Changes in Net Assets may contain exchanges between affiliated funds. The Trust is registered under the Investment Company Act of 1940, as amended (the 1940 Act), as an open-end management investment company organized as a Massachusetts business trust.
2. Investments in Fidelity Central Funds.
The Fund invests in Fidelity Central Funds, which are open-end investment companies generally available only to other investment companies and accounts managed by the investment adviser and its affiliates. The Fund's Schedule of Investments lists each of the Fidelity Central Funds held as of period end, if any, as an investment of the Fund, but does not include the underlying holdings of each Fidelity Central Fund. As an Investing Fund, the Fund indirectly bears its proportionate share of the expenses of the underlying Fidelity Central Funds.
The Money Market Central Funds seek preservation of capital and current income and are managed by Fidelity Investments Money Management, Inc. (FIMM), an affiliate of the investment adviser. Annualized expenses of the Money Market Central Funds as of their most recent shareholder report date are less than .005%.
A complete unaudited list of holdings for each Fidelity Central Fund is available upon request or at the Securities and Exchange Commission (the SEC) website at www.sec.gov. In addition, the financial statements of the Fidelity Central Funds are available on the SEC website or upon request.
3. Significant Accounting Policies.
The Fund is an investment company and applies the accounting and reporting guidance of the Financial Accounting Standards Board (FASB) Accounting Standards Codification Topic 946 Financial Services – Investments Companies. The financial statements have been prepared in conformity with accounting principles generally accepted in the United States of America (GAAP), which require management to make certain estimates and assumptions at the date of the financial statements. Actual results could differ from those estimates. Subsequent events, if any, through the date that the financial statements were issued have been evaluated in the preparation of the financial statements. The following summarizes the significant accounting policies of the Fund:
Investment Valuation. Investments are valued as of 4:00 p.m. Eastern time on the last calendar day of the period. The Board of Trustees (the Board) has delegated the day to day responsibility for the valuation of the Fund's investments to the Fair Value Committee (the Committee) established by the Fund's investment adviser. In accordance with valuation policies and procedures approved by the Board, the Fund attempts to obtain prices from one or more third party pricing vendors or brokers to value its investments. When current market prices, quotations or currency exchange rates are not readily available or reliable, investments will be fair valued in good faith by the Committee, in accordance with procedures adopted by the Board. Factors used in determining fair value vary by investment type and may include market or investment specific events, changes in interest rates and credit quality. The frequency with which these procedures are used cannot be predicted and they may be utilized to a significant extent. The Committee oversees the Fund's valuation policies and procedures and reports to the Board on the Committee's activities and fair value determinations. The Board monitors the appropriateness of the procedures used in valuing the Fund's investments and ratifies the fair value determinations of the Committee.
The Fund categorizes the inputs to valuation techniques used to value its investments into a disclosure hierarchy consisting of three levels as shown below:
- Level 1 – quoted prices in active markets for identical investments
- Level 2 – other significant observable inputs (including quoted prices for similar investments, interest rates, prepayment speeds, etc.)
- Level 3 – unobservable inputs (including the Fund's own assumptions based on the best information available)
Valuation techniques used to value the Fund's investments by major category are as follows:
Equity securities, including restricted securities, for which market quotations are readily available, are valued at the last reported sale price or official closing price as reported by a third party pricing vendor on the primary market or exchange on which they are traded and are categorized as Level 1 in the hierarchy. In the event there were no sales during the day or closing prices are not available, securities are valued at the last quoted bid price or may be valued using the last available price and are generally categorized as Level 2 in the hierarchy. For foreign equity securities, when market or security specific events arise, comparisons to the valuation of American Depositary Receipts (ADRs), futures contracts, Exchange-Traded Funds (ETFs) and certain indexes as well as quoted prices for similar securities may be used and would be categorized as Level 2 in the hierarchy. Utilizing these techniques may result in transfers between Level 1 and Level 2. For equity securities, including restricted securities, where observable inputs are limited, assumptions about market activity and risk are used and these securities may be categorized as Level 3 in the hierarchy.
Debt securities, including restricted securities, are valued based on evaluated prices received from third party pricing vendors or from brokers who make markets in such securities. Corporate bonds are valued by pricing vendors who utilize matrix pricing which considers yield or price of bonds of comparable quality, coupon, maturity and type or by broker-supplied prices. When independent prices are unavailable or unreliable, debt securities may be valued utilizing pricing methodologies which consider similar factors that would be used by third party pricing vendors. Debt securities are generally categorized as Level 2 in the hierarchy but may be Level 3 depending on the circumstances.
Investments in open-end mutual funds, including the Fidelity Central Funds, are valued at their closing net asset value (NAV) each business day and are categorized as Level 1 in the hierarchy.
Changes in valuation techniques may result in transfers in or out of an assigned level within the disclosure hierarchy. The aggregate value of investments by input level as of April 30, 2018, including information on transfers between Levels 1 and 2, is included at the end of the Fund's Schedule of Investments.
Foreign Currency. The Fund may use foreign currency contracts to facilitate transactions in foreign-denominated securities. Gains and losses from these transactions may arise from changes in the value of the foreign currency or if the counterparties do not perform under the contracts' terms.
Foreign-denominated assets, including investment securities, and liabilities are translated into U.S. dollars at the exchange rates at period end. Purchases and sales of investment securities, income and dividends received and expenses denominated in foreign currencies are translated into U.S. dollars at the exchange rate in effect on the transaction date.
The effects of exchange rate fluctuations on investments are included with the net realized and unrealized gain (loss) on investment securities. Other foreign currency transactions resulting in realized and unrealized gain (loss) are disclosed separately.
Investment Transactions and Income. For financial reporting purposes, the Fund's investment holdings and NAV include trades executed through the end of the last business day of the period. The NAV per share for processing shareholder transactions is calculated as of the close of business of the New York Stock Exchange (NYSE), normally 4:00 p.m. Eastern time and includes trades executed through the end of the prior business day. Gains and losses on securities sold are determined on the basis of identified cost and includes proceeds received from litigation. Dividend income is recorded on the ex-dividend date, except for certain dividends from foreign securities where the ex-dividend date may have passed, which are recorded as soon as the Fund is informed of the ex-dividend date. Non-cash dividends included in dividend income, if any, are recorded at the fair market value of the securities received. Income and capital gain distributions from Fidelity Central Funds, if any, are recorded on the ex-dividend date. Certain distributions received by the Fund represent a return of capital or capital gain. The Fund determines the components of these distributions subsequent to the ex-dividend date, based upon receipt of tax filings or other correspondence relating to the underlying investment. These distributions are recorded as a reduction of cost of investments and/or as a realized gain. Interest income is accrued as earned and includes coupon interest and amortization of premium and accretion of discount on debt securities as applicable. Investment income is recorded net of foreign taxes withheld where recovery of such taxes is uncertain.
Expenses. Expenses directly attributable to a fund are charged to that fund. Expenses attributable to more than one fund are allocated among the respective funds on the basis of relative net assets or other appropriate methods. Expense estimates are accrued in the period to which they relate and adjustments are made when actual amounts are known.
Income Tax Information and Distributions to Shareholders. Each year, the Fund intends to qualify as a regulated investment company under Subchapter M of the Internal Revenue Code, including distributing substantially all of its taxable income and realized gains. As a result, no provision for U.S. Federal income taxes is required. The Fund files a U.S. federal tax return, in addition to state and local tax returns as required. The Fund's federal income tax returns are subject to examination by the Internal Revenue Service (IRS) for a period of three fiscal years after they are filed. State and local tax returns may be subject to examination for an additional fiscal year depending on the jurisdiction. Foreign taxes are provided for based on the Fund's understanding of the tax rules and rates that exist in the foreign markets in which it invests.
Distributions are declared and recorded on the ex-dividend date. Income and capital gain distributions are determined in accordance with income tax regulations, which may differ from GAAP.
Capital accounts within the financial statements are adjusted for permanent book-tax differences. These adjustments have no impact on net assets or the results of operations. Capital accounts are not adjusted for temporary book-tax differences which will reverse in a subsequent period.
Book-tax differences are primarily due to foreign currency transactions, passive foreign investment companies (PFIC), partnerships, capital loss carryforwards and losses deferred due to wash sales.
As of period end, the cost and unrealized appreciation (depreciation) in securities, and derivatives if applicable, for federal income tax purposes were as follows:
| Gross unrealized appreciation | $16,336,619 |
| Gross unrealized depreciation | (2,506,997) |
| Net unrealized appreciation (depreciation) | $13,829,622 |
| Tax cost | $58,804,935 |
Short-Term Trading (Redemption) Fees. Shares held by investors in the Fund less than 30 days may have been subject to a redemption fee equal to 1.00% of the NAV of shares redeemed. All redemption fees, which reduce the proceeds of the shareholder redemption, are retained by the Fund and accounted for as an addition to paid in capital. In November 2017, the Board of Trustees approved the elimination of these redemption fees effective December 18, 2017.
Restricted Securities. The Fund may invest in securities that are subject to legal or contractual restrictions on resale. These securities generally may be resold in transactions exempt from registration or to the public if the securities are registered. Disposal of these securities may involve time-consuming negotiations and expense, and prompt sale at an acceptable price may be difficult. Information regarding restricted securities is included at the end of the Fund's Schedule of Investments.
4. Purchases and Sales of Investments.
Purchases and sales of securities, other than short-term securities, aggregated $16,024,753 and $22,582,784, respectively.
5. Fees and Other Transactions with Affiliates.
Management Fee. Fidelity Management & Research Company (the investment adviser) and its affiliates provide the Fund with investment management related services for which the Fund pays a monthly management fee. The management fee is the sum of an individual fund fee rate that is based on an annual rate of .45% of the Fund's average net assets and an annualized group fee rate that averaged .24% during the period. The group fee rate is based upon the average net assets of all the mutual funds advised by the investment adviser, including any mutual funds previously advised by the investment adviser that are currently advised by Fidelity SelectCo, LLC, an affiliate of the investment adviser. The group fee rate decreases as assets under management increase and increases as assets under management decrease. For the reporting period, the total annualized management fee rate was .69% of the Fund's average net assets.
Transfer Agent Fees. Fidelity Investments Institutional Operations Company, Inc. (FIIOC), an affiliate of the investment adviser, is the Fund's transfer, dividend disbursing and shareholder servicing agent. FIIOC receives account fees and asset-based fees that vary according to account size and type of account. FIIOC pays for typesetting, printing and mailing of shareholder reports, except proxy statements. For the period, the transfer agent fees were equivalent to an annualized rate of .18% of average net assets.
Accounting and Security Lending Fees. Fidelity Service Company, Inc. (FSC), an affiliate of the investment adviser, maintains the Fund's accounting records. The accounting fee is based on the level of average net assets for each month. Under a separate contract, FSC administers the security lending program. The security lending fee is based on the number and duration of lending transactions. For the period, the fees were equivalent to an annualized rate of .05%.
Brokerage Commissions. The Fund placed a portion of its portfolio transactions with brokerage firms which are affiliates of the investment adviser. Brokerage commissions are included in net realized gain (loss) and change in net unrealized appreciation (depreciation) in the Statement of Operations. The commissions paid to these affiliated firms were $154 for the period.
Interfund Trades. The Fund may purchase from or sell securities to other Fidelity Funds under procedures adopted by the Board. The procedures have been designed to ensure these interfund trades are executed in accordance with Rule 17a-7 of the 1940 Act. Interfund trades are included within the respective purchases and sales amounts shown in the Purchases and Sales of Investments note.
6. Committed Line of Credit.
The Fund participates with other funds managed by the investment adviser or an affiliate in a $4.25 billion credit facility (the "line of credit") to be utilized for temporary or emergency purposes to fund shareholder redemptions or for other short-term liquidity purposes. The Fund has agreed to pay commitment fees on its pro-rata portion of the line of credit, which amounted to $117 and is reflected in Miscellaneous expenses on the Statement of Operations. During the period, the Fund did not borrow on this line of credit.
7. Security Lending.
The Fund lends portfolio securities through a lending agent from time to time in order to earn additional income. For equity securities, a lending agent is used and may loan securities to certain qualified borrowers, including Fidelity Capital Markets (FCM), a broker-dealer affiliated with the Fund. On the settlement date of the loan, the Fund receives collateral (in the form of U.S. Treasury obligations, letters of credit and/or cash) against the loaned securities and maintains collateral in an amount not less than 100% of the market value of the loaned securities during the period of the loan. The market value of the loaned securities is determined at the close of business of the Fund and any additional required collateral is delivered to the Fund on the next business day. The Fund or borrower may terminate the loan at any time, and if the borrower defaults on its obligation to return the securities loaned because of insolvency or other reasons, the Fund may apply collateral received from the borrower against the obligation. The Fund may experience delays and costs in recovering the securities loaned. Any cash collateral received is invested in the Fidelity Securities Lending Cash Central Fund. The value of loaned securities and cash collateral at period end are disclosed on the Fund's Statement of Assets and Liabilities. Security lending income represents the income earned on investing cash collateral, less rebates paid to borrowers and any lending agent fees associated with the loan, plus any premium payments received for lending certain types of securities. Security lending income is presented in the Statement of Operations as a component of income from Fidelity Central Funds. Total security lending income during the period amounted to $3,176. During the period, there were no securities loaned to FCM.
8. Expense Reductions.
Commissions paid to certain brokers with whom the investment adviser, or its affiliates, places trades on behalf of the Fund include an amount in addition to trade execution, which may be rebated back to the Fund to offset certain expenses. This amount totaled $1,921 for the period.
In addition, during the period the investment adviser reimbursed and/or waived a portion of operating expenses in the amount of $415.
9. Other.
The Fund's organizational documents provide former and current trustees and officers with a limited indemnification against liabilities arising in connection with the performance of their duties to the Fund. In the normal course of business, the Fund may also enter into contracts that provide general indemnifications. The Fund's maximum exposure under these arrangements is unknown as this would be dependent on future claims that may be made against the Fund. The risk of material loss from such claims is considered remote.
Shareholder Expense Example
As a shareholder of the Fund, you incur two types of costs: (1) transaction costs, including redemption fees and (2) ongoing costs, including management fees and other Fund expenses. This Example is intended to help you understand your ongoing costs (in dollars) of investing in the Fund and to compare these costs with the ongoing costs of investing in other mutual funds.
The Example is based on an investment of $1,000 invested at the beginning of the period and held for the entire period (November 1, 2017 to April 30, 2018).
Actual Expenses
The first line of the accompanying table provides information about actual account values and actual expenses. You may use the information in this line, together with the amount you invested, to estimate the expenses that you paid over the period. Simply divide your account value by $1,000.00 (for example, an $8,600 account value divided by $1,000.00 = 8.6), then multiply the result by the number in the first line under the heading entitled "Expenses Paid During Period" to estimate the expenses you paid on your account during this period. A small balance maintenance fee of $12.00 that is charged once a year may apply for certain accounts with a value of less than $2,000. This fee is not included in the table below. If it was, the estimate of expenses you paid during the period would be higher, and your ending account value lower, by this amount. In addition, the Fund, as a shareholder in the underlying Fidelity Central Funds, will indirectly bear its pro-rata share of the fees and expenses incurred by the underlying Fidelity Central Funds. These fees and expenses are not included in the Fund's annualized expense ratio used to calculate the expense estimate in the table below.
Hypothetical Example for Comparison Purposes
The second line of the accompanying table provides information about hypothetical account values and hypothetical expenses based on the Fund's actual expense ratio and an assumed rate of return of 5% per year before expenses, which is not the Fund's actual return. The hypothetical account values and expenses may not be used to estimate the actual ending account balance or expenses you paid for the period. You may use this information to compare the ongoing costs of investing in the Fund and other funds. To do so, compare this 5% hypothetical example with the 5% hypothetical examples that appear in the shareholder reports of the other funds. A small balance maintenance fee of $12.00 that is charged once a year may apply for certain accounts with a value of less than $2,000. This fee is not included in the table below. If it was, the estimate of expenses you paid during the period would be higher, and your ending account value lower, by this amount. In addition, the Fund, as a shareholder in the underlying Fidelity Central Funds, will indirectly bear its pro-rata share of the fees and expenses incurred by the underlying Fidelity Central Funds. These fees and expenses are not included in the Fund's annualized expense ratio used to calculate the expense estimate in the table below.
Please note that the expenses shown in the table are meant to highlight your ongoing costs only and do not reflect any transaction costs. Therefore, the second line of the table is useful in comparing ongoing costs only, and will not help you determine the relative total costs of owning different funds. In addition, if these transactional costs were included, your costs would have been higher.
| Annualized Expense Ratio-A | Beginning Account Value November 1, 2017 | Ending Account Value April 30, 2018 | Expenses Paid During Period-B November 1, 2017 to April 30, 2018 | |
| Actual | 1.06% | $1,000.00 | $1,004.90 | $5.27 |
| Hypothetical-C | $1,000.00 | $1,019.54 | $5.31 |
A Annualized expense ratio reflects expenses net of applicable fee waivers.
B Expenses are equal to the Fund's annualized expense ratio, multiplied by the average account value over the period, multiplied by 181/365 (to reflect the one-half year period).
C 5% return per year before expenses
![]()
Corporate Headquarters
245 Summer St.
Boston, MA 02210
www.fidelity.com
GED-SANN-0618
1.938166.105
Fidelity Flex℠ Funds Fidelity Flex℠ International Fund Semi-Annual Report April 30, 2018 |
|
Contents
To view a fund's proxy voting guidelines and proxy voting record for the 12-month period ended June 30, visit http://www.fidelity.com/proxyvotingresults or visit the Securities and Exchange Commission's (SEC) web site at http://www.sec.gov.
You may also call 1-800-835-5092 to request a free copy of the proxy voting guidelines.
Standard & Poor's, S&P and S&P 500 are registered service marks of The McGraw-Hill Companies, Inc. and have been licensed for use by Fidelity Distributors Corporation.
Other third-party marks appearing herein are the property of their respective owners.
All other marks appearing herein are registered or unregistered trademarks or service marks of FMR LLC or an affiliated company. © 2018 FMR LLC. All rights reserved.
This report and the financial statements contained herein are submitted for the general information of the shareholders of the Fund. This report is not authorized for distribution to prospective investors in the Fund unless preceded or accompanied by an effective prospectus.
A fund files its complete schedule of portfolio holdings with the SEC for the first and third quarters of each fiscal year on Form N-Q. Forms N-Q are available on the SEC’s web site at http://www.sec.gov. A fund's Forms N-Q may be reviewed and copied at the SEC’s Public Reference Room in Washington, DC. Information regarding the operation of the SEC's Public Reference Room may be obtained by calling 1-800-SEC-0330.
For a complete list of a fund's portfolio holdings, view the most recent holdings listing, semiannual report, or annual report on Fidelity's web site at http://www.fidelity.com, http://www.institutional.fidelity.com, or http://www.401k.com, as applicable.
NOT FDIC INSURED •MAY LOSE VALUE •NO BANK GUARANTEE
Neither the Fund nor Fidelity Distributors Corporation is a bank.
Investment Summary (Unaudited)
Geographic Diversification (% of fund's net assets)
| As of April 30, 2018 | ||
| Japan | 13.7% | |
| United States of America* | 12.3% | |
| United Kingdom | 9.8% | |
| France | 6.5% | |
| Germany | 5.5% | |
| Switzerland | 4.9% | |
| Canada | 4.7% | |
| Cayman Islands | 4.4% | |
| India | 3.6% | |
| Other | 34.6% | |
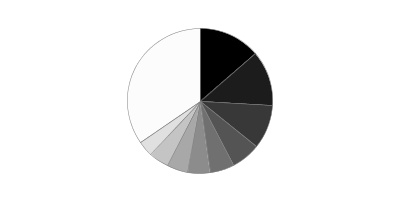
* Includes Short-Term investments and Net Other Assets (Liabilities).
Percentages are based on country or territory of incorporation and include the effect of futures contracts, as applicable.
Asset Allocation as of April 30, 2018
| % of fund's net assets | |
| Stocks | 96.2 |
| Short-Term Investments and Net Other Assets (Liabilities) | 3.8 |
Top Ten Stocks as of April 30, 2018
| % of fund's net assets | |
| Alibaba Group Holding Ltd. sponsored ADR (Cayman Islands, Internet Software & Services) | 1.6 |
| Tencent Holdings Ltd. (Cayman Islands, Internet Software & Services) | 1.5 |
| Samsung Electronics Co. Ltd. (Korea (South), Technology Hardware, Storage & Peripherals) | 1.5 |
| Taiwan Semiconductor Manufacturing Co. Ltd. (Taiwan, Semiconductors & Semiconductor Equipment) | 1.4 |
| Nestle SA (Reg. S) (Switzerland, Food Products) | 1.3 |
| SAP SE (Germany, Software) | 1.2 |
| Naspers Ltd. Class N (South Africa, Media) | 1.2 |
| AIA Group Ltd. (Hong Kong, Insurance) | 1.1 |
| Keyence Corp. (Japan, Electronic Equipment & Components) | 1.1 |
| CSL Ltd. (Australia, Biotechnology) | 1.1 |
| 13.0 |
Top Market Sectors as of April 30, 2018
| % of fund's net assets | |
| Financials | 22.3 |
| Information Technology | 17.2 |
| Industrials | 14.5 |
| Consumer Discretionary | 10.4 |
| Materials | 8.0 |
| Consumer Staples | 7.8 |
| Health Care | 7.6 |
| Energy | 4.8 |
| Real Estate | 1.5 |
| Telecommunication Services | 1.6 |
Schedule of Investments April 30, 2018 (Unaudited)
Showing Percentage of Net Assets
| Common Stocks - 94.7% | |||
| Shares | Value | ||
| Argentina - 0.3% | |||
| Banco Macro SA sponsored ADR | 744 | $72,108 | |
| Telecom Argentina SA Class B sponsored ADR | 2,474 | 74,319 | |
| TOTAL ARGENTINA | 146,427 | ||
| Australia - 2.4% | |||
| Accent Group Ltd. | 9,615 | 9,035 | |
| Adelaide Brighton Ltd. | 3,158 | 15,236 | |
| Amcor Ltd. | 6,794 | 70,012 | |
| Beacon Lighting Group Ltd. | 7,175 | 7,947 | |
| Commonwealth Bank of Australia | 5,549 | 298,783 | |
| CSL Ltd. | 4,728 | 605,605 | |
| DuluxGroup Ltd. | 4,535 | 26,367 | |
| Imdex Ltd. (a) | 10,528 | 9,817 | |
| Insurance Australia Group Ltd. | 21,315 | 126,183 | |
| Macquarie Group Ltd. | 1,812 | 147,566 | |
| Magellan Financial Group Ltd. | 3,414 | 59,644 | |
| TOTAL AUSTRALIA | 1,376,195 | ||
| Austria - 0.7% | |||
| Andritz AG | 4,106 | 220,947 | |
| Erste Group Bank AG | 3,573 | 175,179 | |
| TOTAL AUSTRIA | 396,126 | ||
| Bailiwick of Jersey - 0.2% | |||
| Integrated Diagnostics Holdings PLC | 3,965 | 18,834 | |
| Wolseley PLC | 1,497 | 114,999 | |
| TOTAL BAILIWICK OF JERSEY | 133,833 | ||
| Belgium - 1.4% | |||
| Anheuser-Busch InBev SA NV | 2,644 | 264,116 | |
| KBC Ancora | 70 | 4,248 | |
| KBC Groep NV | 4,815 | 420,977 | |
| Umicore SA | 1,443 | 80,611 | |
| TOTAL BELGIUM | 769,952 | ||
| Bermuda - 0.1% | |||
| Credicorp Ltd. (United States) | 294 | 68,352 | |
| Vostok New Ventures Ltd. (depositary receipt) (a) | 1,875 | 15,717 | |
| TOTAL BERMUDA | 84,069 | ||
| Brazil - 1.6% | |||
| BM&F BOVESPA SA | 16,100 | 116,274 | |
| BTG Pactual Participations Ltd. unit | 11,500 | 73,467 | |
| CVC Brasil Operadora e Agencia de Viagens SA | 5,100 | 84,423 | |
| Equatorial Energia SA | 4,100 | 83,271 | |
| Hapvida Participacoes e Investimentos SA | 9,900 | 78,139 | |
| IRB Brasil Resseguros SA | 6,100 | 82,362 | |
| Itau Unibanco Holding SA | 1,900 | 23,918 | |
| Itausa-Investimentos Itau SA | 617 | 2,378 | |
| Localiza Rent A Car SA | 10,300 | 82,001 | |
| Lojas Renner SA | 9,500 | 88,432 | |
| Notre Dame Intermedica Participacoes SA | 15,400 | 89,678 | |
| Suzano Papel e Celulose SA | 8,500 | 99,626 | |
| TOTAL BRAZIL | 903,969 | ||
| Canada - 4.7% | |||
| Alimentation Couche-Tard, Inc. Class B (sub. vtg.) | 7,131 | 308,300 | |
| Canadian National Railway Co. | 4,201 | 324,478 | |
| Canadian Pacific Railway Ltd. | 1,669 | 304,539 | |
| CCL Industries, Inc. Class B | 5,573 | 270,327 | |
| Constellation Software, Inc. | 434 | 310,177 | |
| Franco-Nevada Corp. | 3,964 | 281,165 | |
| McCoy Global, Inc. (a) | 50 | 50 | |
| New Look Vision Group, Inc. | 554 | 14,023 | |
| Nutrien Ltd. | 7,162 | 326,040 | |
| Pason Systems, Inc. | 9,406 | 131,499 | |
| PrairieSky Royalty Ltd. | 6,513 | 144,418 | |
| ShawCor Ltd. Class A | 350 | 6,771 | |
| Suncor Energy, Inc. | 6,122 | 234,114 | |
| TOTAL CANADA | 2,655,901 | ||
| Cayman Islands - 4.4% | |||
| 58.com, Inc. ADR (a) | 2,362 | 206,415 | |
| Alibaba Group Holding Ltd. sponsored ADR (a) | 4,977 | 888,587 | |
| JD.com, Inc. sponsored ADR (a) | 3,900 | 142,389 | |
| Melco Crown Entertainment Ltd. sponsored ADR | 2,806 | 87,575 | |
| New Oriental Education & Technology Group, Inc. sponsored ADR | 1,188 | 106,730 | |
| Ping An Healthcare and Technology Co. Ltd. (a) | 1,200 | 8,379 | |
| Sands China Ltd. | 14,200 | 82,067 | |
| Shenzhou International Group Holdings Ltd. | 10,000 | 109,162 | |
| Tencent Holdings Ltd. | 17,600 | 865,268 | |
| Value Partners Group Ltd. | 10,000 | 9,459 | |
| TOTAL CAYMAN ISLANDS | 2,506,031 | ||
| Chile - 0.2% | |||
| Banco Santander Chile sponsored ADR | 2,663 | 87,959 | |
| China - 2.1% | |||
| China International Travel Service Corp. Ltd. (A Shares) | 9,100 | 74,395 | |
| China Merchants Bank Co. Ltd. (H Shares) | 28,500 | 124,271 | |
| Dong E-E-Jiao Co. Ltd. Class A | 7,800 | 72,590 | |
| Gree Electric Appliances, Inc. of Zhuhai Class A | 10,200 | 70,741 | |
| Hangzhou Hikvision Digital Technology Co. Ltd. Class A | 12,267 | 74,300 | |
| Inner Mongoli Yili Industries Co. Ltd. (A Shares) | 18,300 | 75,770 | |
| Jiangsu Yanghe Brewery Joint-Stock Co. Ltd. Class A | 4,512 | 79,503 | |
| Kweichow Moutai Co. Ltd. (A Shares) | 700 | 72,890 | |
| Midea Group Co. Ltd. Class A | 9,400 | 76,427 | |
| Ping An Insurance (Group) Co. of China Ltd. (H Shares) | 22,000 | 214,971 | |
| Shanghai International Airport Co. Ltd. (A Shares) | 10,700 | 84,039 | |
| Shenzhen Inovance Technology Co. Ltd. Class A | 16,900 | 87,455 | |
| Yunnan Baiyao Group Co. Ltd. | 5,300 | 79,148 | |
| TOTAL CHINA | 1,186,500 | ||
| Denmark - 0.5% | |||
| Jyske Bank A/S (Reg.) | 2,214 | 133,098 | |
| Novo Nordisk A/S Series B sponsored ADR | 2,332 | 109,464 | |
| Scandinavian Tobacco Group A/S (b) | 792 | 13,248 | |
| SimCorp A/S | 200 | 14,561 | |
| Spar Nord Bank A/S | 2,048 | 23,469 | |
| TOTAL DENMARK | 293,840 | ||
| Finland - 0.3% | |||
| Sampo Oyj (A Shares) | 2,942 | 158,986 | |
| Tikkurila Oyj | 651 | 11,776 | |
| TOTAL FINLAND | 170,762 | ||
| France - 6.5% | |||
| Accor SA | 1,761 | 99,673 | |
| Atos Origin SA | 1,310 | 177,021 | |
| AXA SA (c) | 9,906 | 283,298 | |
| Bouygues SA | 2,382 | 121,532 | |
| Capgemini SA | 1,195 | 164,511 | |
| Compagnie de St. Gobain | 1,784 | 93,704 | |
| Edenred SA | 3,118 | 107,311 | |
| Elis SA | 5,073 | 121,420 | |
| Kering SA | 163 | 94,404 | |
| Laurent-Perrier Group SA | 137 | 17,289 | |
| Legrand SA | 1,585 | 123,456 | |
| LVMH Moet Hennessy - Louis Vuitton SA | 255 | 88,743 | |
| Natixis SA | 19,132 | 157,383 | |
| Pernod Ricard SA | 468 | 77,737 | |
| Rubis | 1,102 | 85,835 | |
| Safran SA | 1,585 | 185,905 | |
| Sanofi SA | 3,746 | 296,167 | |
| Societe Generale Series A | 4,949 | 270,853 | |
| SR Teleperformance SA | 882 | 141,552 | |
| Total SA (c) | 8,666 | 544,673 | |
| Vetoquinol SA | 284 | 18,040 | |
| VINCI SA | 2,420 | 241,961 | |
| Virbac SA (a) | 87 | 13,574 | |
| Vivendi SA | 5,636 | 148,984 | |
| TOTAL FRANCE | 3,675,026 | ||
| Germany - 5.2% | |||
| adidas AG | 328 | 80,763 | |
| BASF AG | 3,143 | 327,009 | |
| Bayer AG | 2,558 | 305,731 | |
| Brenntag AG | 1,560 | 89,521 | |
| CompuGroup Medical AG | 967 | 50,493 | |
| CTS Eventim AG | 902 | 42,307 | |
| Deutsche Post AG | 2,802 | 121,619 | |
| Deutsche Telekom AG | 12,959 | 226,829 | |
| Fielmann AG | 184 | 15,132 | |
| Fresenius SE & Co. KGaA | 954 | 72,971 | |
| Hannover Reuck SE | 1,084 | 152,634 | |
| HeidelbergCement Finance AG | 902 | 88,513 | |
| Linde AG | 1,285 | 285,603 | |
| MTU Aero Engines Holdings AG | 513 | 88,588 | |
| Nexus AG | 419 | 14,016 | |
| SAP SE | 6,079 | 675,411 | |
| Vonovia SE | 3,927 | 197,325 | |
| WashTec AG | 157 | 15,149 | |
| Wirecard AG | 662 | 90,416 | |
| TOTAL GERMANY | 2,940,030 | ||
| Greece - 0.0% | |||
| Motor Oil (HELLAS) Corinth Refineries SA | 400 | 9,555 | |
| Hong Kong - 1.6% | |||
| AIA Group Ltd. | 71,160 | 635,971 | |
| CSPC Pharmaceutical Group Ltd. | 42,000 | 106,976 | |
| Galaxy Entertainment Group Ltd. | 9,000 | 78,774 | |
| Techtronic Industries Co. Ltd. | 13,500 | 79,086 | |
| TOTAL HONG KONG | 900,807 | ||
| Hungary - 0.2% | |||
| OTP Bank PLC | 2,400 | 104,855 | |
| India - 3.6% | |||
| Adani Ports & Special Economic Zone Ltd. | 16,252 | 99,415 | |
| Asian Paints Ltd. | 5,257 | 94,862 | |
| Eicher Motors Ltd. | 223 | 104,191 | |
| Godrej Consumer Products Ltd. | 5,371 | 90,003 | |
| HDFC Bank Ltd. | 2,615 | 78,816 | |
| Hero Motocorp Ltd. | 1,620 | 90,748 | |
| Housing Development Finance Corp. Ltd. | 14,168 | 400,856 | |
| Indraprastha Gas Ltd. | 17,369 | 74,910 | |
| IndusInd Bank Ltd. | 3,103 | 88,268 | |
| Jyothy Laboratories Ltd. | 1,338 | 7,290 | |
| Kotak Mahindra Bank Ltd. (a) | 4,880 | 88,737 | |
| Larsen & Toubro Ltd. | 5,333 | 112,109 | |
| LIC Housing Finance Ltd. | 10,191 | 83,436 | |
| Maruti Suzuki India Ltd. | 868 | 114,752 | |
| Motherson Sumi Systems Ltd. | 16,847 | 89,260 | |
| PC Jeweller Ltd. | 4,241 | 9,182 | |
| Pidilite Industries Ltd. (a) | 5,479 | 89,349 | |
| Reliance Industries Ltd. | 13,535 | 195,424 | |
| Ultratech Cemco Ltd. | 1,423 | 87,732 | |
| TOTAL INDIA | 1,999,340 | ||
| Indonesia - 0.5% | |||
| PT Bank Central Asia Tbk | 71,300 | 112,745 | |
| PT Bank Rakyat Indonesia Tbk | 709,470 | 163,581 | |
| TOTAL INDONESIA | 276,326 | ||
| Ireland - 1.5% | |||
| Accenture PLC Class A | 520 | 78,624 | |
| Allergan PLC | 210 | 32,267 | |
| CRH PLC | 3,177 | 112,820 | |
| CRH PLC sponsored ADR | 9,473 | 334,965 | |
| James Hardie Industries PLC CDI | 15,848 | 279,867 | |
| TOTAL IRELAND | 838,543 | ||
| Isle of Man - 0.2% | |||
| Playtech Ltd. | 9,885 | 110,312 | |
| Israel - 0.2% | |||
| Azrieli Group | 158 | 7,248 | |
| Frutarom Industries Ltd. | 745 | 71,520 | |
| Ituran Location & Control Ltd. | 1,043 | 32,698 | |
| Strauss Group Ltd. | 1,292 | 26,648 | |
| TOTAL ISRAEL | 138,114 | ||
| Italy - 1.3% | |||
| Assicurazioni Generali SpA | 6,600 | 133,420 | |
| Azimut Holding SpA | 493 | 10,377 | |
| Beni Stabili SpA SIIQ | 16,580 | 15,707 | |
| Interpump Group SpA | 6,040 | 192,413 | |
| Intesa Sanpaolo SpA | 69,910 | 265,935 | |
| Mediobanca SpA | 9,796 | 119,065 | |
| TOTAL ITALY | 736,917 | ||
| Japan - 13.7% | |||
| AEON Financial Service Co. Ltd. | 3,052 | 71,638 | |
| Ai Holdings Corp. | 500 | 13,387 | |
| Aoki Super Co. Ltd. | 1,000 | 11,919 | |
| Artnature, Inc. | 1,400 | 9,605 | |
| Asahi Co. Ltd. | 500 | 6,138 | |
| Aucnet, Inc. | 500 | 6,490 | |
| Azbil Corp. | 2,300 | 107,300 | |
| Broadleaf Co. Ltd. | 1,800 | 8,595 | |
| Central Automotive Products Ltd. | 100 | 1,560 | |
| Century21 Real Estate Japan Ltd. | 200 | 2,472 | |
| Coca-Cola West Co. Ltd. | 400 | 17,234 | |
| Daiichikosho Co. Ltd. | 600 | 31,559 | |
| Daikin Industries Ltd. | 700 | 81,993 | |
| Daikokutenbussan Co. Ltd. | 500 | 25,842 | |
| DENSO Corp. | 3,680 | 193,762 | |
| East Japan Railway Co. | 2,927 | 280,866 | |
| Fanuc Corp. | 800 | 171,369 | |
| Funai Soken Holdings, Inc. | 900 | 21,092 | |
| GCA Savvian Group Corp. | 1,500 | 13,323 | |
| Goldcrest Co. Ltd. | 1,400 | 29,801 | |
| Honda Motor Co. Ltd. | 8,261 | 284,062 | |
| Hoya Corp. | 3,543 | 189,984 | |
| Idemitsu Kosan Co. Ltd. | 2,057 | 80,628 | |
| Itochu Corp. | 11,388 | 228,552 | |
| Iwatsuka Confectionary Co. Ltd. | 100 | 4,784 | |
| Japan Tobacco, Inc. | 3,787 | 101,725 | |
| Kao Corp. | 1,644 | 118,127 | |
| Keyence Corp. | 1,000 | 612,605 | |
| Kobayashi Pharmaceutical Co. Ltd. | 600 | 50,659 | |
| Komatsu Ltd. | 6,400 | 218,168 | |
| Koshidaka Holdings Co. Ltd. | 500 | 30,370 | |
| Kusuri No Aoki Holdings Co. Ltd. | 400 | 27,479 | |
| Lasertec Corp. | 1,200 | 40,066 | |
| Makita Corp. | 2,812 | 126,555 | |
| Medikit Co. Ltd. | 300 | 16,493 | |
| Miroku Jyoho Service Co., Ltd. | 400 | 11,416 | |
| Misumi Group, Inc. | 11,800 | 327,058 | |
| Mitsubishi UFJ Financial Group, Inc. | 49,358 | 330,765 | |
| Mitsuboshi Belting Ltd. | 1,000 | 11,443 | |
| Mitsui Fudosan Co. Ltd. | 4,939 | 127,022 | |
| Nabtesco Corp. | 3,300 | 119,388 | |
| Nagaileben Co. Ltd. | 1,400 | 37,100 | |
| Nakano Refrigerators Co. Ltd. | 400 | 18,807 | |
| ND Software Co. Ltd. | 100 | 943 | |
| Nihon Parkerizing Co. Ltd. | 3,300 | 52,374 | |
| Nintendo Co. Ltd. | 431 | 181,096 | |
| Nomura Holdings, Inc. | 20,746 | 119,488 | |
| NS Tool Co. Ltd. | 300 | 8,178 | |
| OBIC Co. Ltd. | 2,547 | 213,648 | |
| Olympus Corp. | 2,197 | 82,096 | |
| Oracle Corp. Japan | 1,056 | 86,937 | |
| ORIX Corp. | 11,976 | 210,774 | |
| OSG Corp. | 6,500 | 144,365 | |
| Panasonic Corp. | 8,727 | 129,222 | |
| Paramount Bed Holdings Co. Ltd. | 800 | 39,810 | |
| ProNexus, Inc. | 1,287 | 16,670 | |
| Recruit Holdings Co. Ltd. | 4,508 | 104,205 | |
| San-Ai Oil Co. Ltd. | 2,100 | 33,117 | |
| Shin-Etsu Chemical Co. Ltd. | 1,489 | 149,894 | |
| Shinsei Bank Ltd. | 6,396 | 99,930 | |
| SHO-BOND Holdings Co. Ltd. | 2,260 | 171,175 | |
| Shoei Co. Ltd. | 900 | 33,466 | |
| SoftBank Corp. | 1,829 | 139,752 | |
| Sony Corp. | 2,287 | 106,817 | |
| Sony Financial Holdings, Inc. | 6,733 | 123,118 | |
| Subaru Corp. | 3,784 | 127,345 | |
| Sumitomo Mitsui Financial Group, Inc. | 5,214 | 217,310 | |
| T&D Holdings, Inc. | 7,134 | 121,315 | |
| Taiheiyo Cement Corp. | 2,351 | 89,141 | |
| The Monogatari Corp. | 200 | 21,808 | |
| TKC Corp. | 500 | 20,010 | |
| Tokio Marine Holdings, Inc. | 3,878 | 183,471 | |
| USS Co. Ltd. | 16,700 | 351,507 | |
| Welcia Holdings Co. Ltd. | 500 | 25,750 | |
| Workman Co. Ltd. | 600 | 23,930 | |
| Yamada Consulting Group Co. Ltd. | 1,100 | 31,293 | |
| Yamato Kogyo Co. Ltd. | 400 | 11,892 | |
| TOTAL JAPAN | 7,691,048 | ||
| Kenya - 0.4% | |||
| Safaricom Ltd. | 721,000 | 203,073 | |
| Korea (South) - 2.2% | |||
| BGF Retail Co. Ltd. | 548 | 97,736 | |
| Leeno Industrial, Inc. | 139 | 7,437 | |
| LG Chemical Ltd. | 355 | 119,336 | |
| LG Household & Health Care Ltd. | 100 | 127,927 | |
| NAVER Corp. | 107 | 71,538 | |
| Samsung Electronics Co. Ltd. | 339 | 840,042 | |
| TOTAL KOREA (SOUTH) | 1,264,016 | ||
| Mexico - 1.2% | |||
| Consorcio ARA S.A.B. de CV | 23,614 | 8,914 | |
| Embotelladoras Arca S.A.B. de CV | 12,300 | 85,012 | |
| Fomento Economico Mexicano S.A.B. de CV: | |||
| unit | 12,800 | 123,729 | |
| sponsored ADR | 855 | 82,644 | |
| Grupo Aeroportuario del Pacifico S.A.B. de CV Series B | 8,600 | 89,458 | |
| Grupo Aeroportuario del Sureste S.A.B. de CV Series B | 4,890 | 87,940 | |
| Grupo Mexico SA de CV Series B | 23,400 | 77,787 | |
| Wal-Mart de Mexico SA de CV Series V | 35,500 | 98,649 | |
| TOTAL MEXICO | 654,133 | ||
| Netherlands - 2.1% | |||
| Aalberts Industries NV | 854 | 42,118 | |
| ASML Holding NV (Netherlands) | 2,525 | 480,247 | |
| ING Groep NV (Certificaten Van Aandelen) | 14,218 | 239,581 | |
| Koninklijke Philips Electronics NV | 2,308 | 97,689 | |
| RELX NV | 4,549 | 96,766 | |
| Takeaway.com Holding BV (a)(b) | 240 | 13,970 | |
| VastNed Retail NV | 305 | 15,267 | |
| Wolters Kluwer NV | 2,248 | 121,699 | |
| Yandex NV Series A (a) | 2,309 | 77,028 | |
| TOTAL NETHERLANDS | 1,184,365 | ||
| New Zealand - 0.1% | |||
| Auckland International Airport Ltd. | 12,619 | 56,646 | |
| Norway - 0.6% | |||
| Kongsberg Gruppen ASA | 985 | 24,188 | |
| Schibsted ASA (B Shares) | 1,896 | 51,050 | |
| Skandiabanken ASA (b) | 1,398 | 12,634 | |
| Statoil ASA | 9,766 | 249,743 | |
| TOTAL NORWAY | 337,615 | ||
| Philippines - 0.7% | |||
| Ayala Corp. | 4,880 | 90,912 | |
| Ayala Land, Inc. | 118,500 | 93,259 | |
| Jollibee Food Corp. | 3,500 | 19,264 | |
| SM Investments Corp. | 5,305 | 96,077 | |
| SM Prime Holdings, Inc. | 142,400 | 93,986 | |
| TOTAL PHILIPPINES | 393,498 | ||
| Portugal - 0.2% | |||
| Galp Energia SGPS SA Class B | 6,135 | 117,908 | |
| Russia - 0.3% | |||
| Sberbank of Russia | 52,030 | 185,461 | |
| South Africa - 2.4% | |||
| Capitec Bank Holdings Ltd. | 1,265 | 90,060 | |
| Clicks Group Ltd. | 10,920 | 186,698 | |
| Discovery Ltd. | 6,276 | 87,141 | |
| FirstRand Ltd. | 23,217 | 124,339 | |
| Mondi Ltd. | 3,081 | 89,888 | |
| Naspers Ltd. Class N | 2,727 | 664,351 | |
| Sanlam Ltd. | 15,424 | 97,434 | |
| TOTAL SOUTH AFRICA | 1,339,911 | ||
| Spain - 2.6% | |||
| Amadeus IT Holding SA Class A | 5,572 | 408,435 | |
| Banco Bilbao Vizcaya Argentaria SA | 8,440 | 68,297 | |
| Banco Santander SA (Spain) | 63,973 | 415,085 | |
| CaixaBank SA | 32,014 | 155,680 | |
| Hispania Activos Inmobiliarios SA | 3,943 | 83,804 | |
| Masmovil Ibercom SA (a) | 369 | 53,294 | |
| Merlin Properties Socimi SA | 4,861 | 75,138 | |
| Prosegur Compania de Seguridad SA (Reg.) | 18,328 | 138,995 | |
| Unicaja Banco SA | 27,649 | 50,117 | |
| TOTAL SPAIN | 1,448,845 | ||
| Sweden - 2.8% | |||
| Addlife AB | 60 | 1,257 | |
| AddTech AB (B Shares) | 1,426 | 29,736 | |
| Alfa Laval AB | 4,141 | 102,950 | |
| ASSA ABLOY AB (B Shares) | 17,021 | 358,044 | |
| Atlas Copco AB (A Shares) | 7,102 | 279,079 | |
| Fagerhult AB | 10,015 | 102,361 | |
| Investor AB (B Shares) | 2,803 | 122,630 | |
| Lagercrantz Group AB (B Shares) | 2,070 | 19,479 | |
| Loomis AB (B Shares) | 1,926 | 70,427 | |
| Nordea Bank AB | 22,077 | 225,342 | |
| Saab AB (B Shares) | 573 | 23,524 | |
| Svenska Handelsbanken AB (A Shares) | 10,440 | 116,430 | |
| Swedbank AB (A Shares) | 6,938 | 151,292 | |
| TOTAL SWEDEN | 1,602,551 | ||
| Switzerland - 4.9% | |||
| Credit Suisse Group AG | 11,035 | 186,119 | |
| Lafargeholcim Ltd. (Reg.) | 1,826 | 102,005 | |
| Nestle SA (Reg. S) | 9,661 | 748,439 | |
| Novartis AG | 6,313 | 485,939 | |
| Roche Holding AG (participation certificate) | 2,035 | 452,151 | |
| Schindler Holding AG: | |||
| (participation certificate) | 704 | 146,057 | |
| (Reg.) | 151 | 30,337 | |
| Sika AG | 10 | 72,957 | |
| Tecan Group AG | 100 | 22,099 | |
| UBS Group AG | 16,640 | 279,552 | |
| Zurich Insurance Group AG | 720 | 229,994 | |
| TOTAL SWITZERLAND | 2,755,649 | ||
| Taiwan - 1.4% | |||
| Addcn Technology Co. Ltd. | 2,000 | 17,289 | |
| Taiwan Semiconductor Manufacturing Co. Ltd. | 100,000 | 760,385 | |
| TOTAL TAIWAN | 777,674 | ||
| Thailand - 0.4% | |||
| Airports of Thailand PCL (For. Reg.) | 49,000 | 110,219 | |
| C.P. ALL PCL (For. Reg.) | 43,500 | 119,647 | |
| TOTAL THAILAND | 229,866 | ||
| Turkey - 0.5% | |||
| Tofas Turk Otomobil Fabrikasi A/S | 10,702 | 65,918 | |
| Tupras Turkiye Petrol Rafinerileri A/S | 4,865 | 123,957 | |
| Turkcell Iletisim Hizmet A/S | 25,000 | 85,916 | |
| TOTAL TURKEY | 275,791 | ||
| United Arab Emirates - 0.2% | |||
| DP World Ltd. | 3,870 | 86,108 | |
| United Kingdom - 9.8% | |||
| Alliance Pharma PLC | 9,192 | 10,250 | |
| Ascential PLC | 4,289 | 24,882 | |
| AstraZeneca PLC (United Kingdom) | 2,727 | 190,896 | |
| Aviva PLC | 27,697 | 201,237 | |
| Avon Rubber PLC | 758 | 14,036 | |
| BAE Systems PLC | 34,941 | 293,163 | |
| BHP Billiton PLC | 10,781 | 229,877 | |
| BP PLC | 56,330 | 418,417 | |
| British American Tobacco PLC (United Kingdom) | 8,685 | 476,351 | |
| Bunzl PLC | 3,961 | 115,115 | |
| Cineworld Group PLC | 3,947 | 14,150 | |
| Compass Group PLC | 4,646 | 99,780 | |
| Dechra Pharmaceuticals PLC | 1,714 | 64,702 | |
| DP Poland PLC (a) | 18,857 | 7,918 | |
| Elementis PLC | 19,667 | 76,786 | |
| GlaxoSmithKline PLC | 5,691 | 114,145 | |
| Great Portland Estates PLC | 2,542 | 24,406 | |
| Hilton Food Group PLC | 368 | 4,489 | |
| Howden Joinery Group PLC | 2,383 | 15,639 | |
| HSBC Holdings PLC sponsored ADR | 3,653 | 183,600 | |
| Imperial Tobacco Group PLC | 4,326 | 155,114 | |
| Informa PLC | 37,552 | 382,047 | |
| InterContinental Hotel Group PLC ADR | 4,152 | 264,233 | |
| ITE Group PLC | 8,231 | 17,224 | |
| Liberty Global PLC Class A (a) | 2,798 | 84,332 | |
| Melrose Industries PLC | 17,867 | 56,082 | |
| Micro Focus International PLC | 3,138 | 54,109 | |
| NMC Health PLC | 1,657 | 81,393 | |
| Prudential PLC | 17,724 | 455,756 | |
| Reckitt Benckiser Group PLC | 2,495 | 195,728 | |
| Rightmove PLC | 1,167 | 73,342 | |
| Royal Dutch Shell PLC Class B sponsored ADR | 5,000 | 362,100 | |
| Shaftesbury PLC | 6,191 | 86,169 | |
| Spectris PLC | 4,749 | 175,871 | |
| Spirax-Sarco Engineering PLC | 887 | 70,398 | |
| Standard Chartered PLC (United Kingdom) | 14,065 | 148,516 | |
| Standard Life PLC | 28,904 | 145,361 | |
| The Weir Group PLC | 3,524 | 103,628 | |
| Ultra Electronics Holdings PLC | 253 | 4,904 | |
| TOTAL UNITED KINGDOM | 5,496,146 | ||
| United States of America - 8.5% | |||
| A.O. Smith Corp. | 1,253 | 76,872 | |
| Alphabet, Inc. Class A (a) | 348 | 354,466 | |
| Amgen, Inc. | 489 | 85,321 | |
| Amphenol Corp. Class A | 883 | 73,916 | |
| Autoliv, Inc. | 1,659 | 222,389 | |
| Berkshire Hathaway, Inc. Class B (a) | 1,120 | 216,978 | |
| Black Knight, Inc. (a) | 979 | 47,628 | |
| ConocoPhillips Co. | 1,952 | 127,856 | |
| Facebook, Inc. Class A (a) | 500 | 86,000 | |
| Hilton Worldwide Holdings, Inc. | 900 | 70,956 | |
| Martin Marietta Materials, Inc. | 857 | 166,918 | |
| MasterCard, Inc. Class A | 2,861 | 510,030 | |
| Mettler-Toledo International, Inc. (a) | 172 | 96,308 | |
| Mohawk Industries, Inc. (a) | 688 | 144,397 | |
| Moody's Corp. | 1,249 | 202,588 | |
| MSCI, Inc. | 1,819 | 272,541 | |
| NVIDIA Corp. | 300 | 67,470 | |
| PayPal Holdings, Inc. (a) | 2,026 | 151,160 | |
| Philip Morris International, Inc. | 2,385 | 195,570 | |
| PriceSmart, Inc. | 1,117 | 97,849 | |
| ResMed, Inc. | 2,047 | 193,728 | |
| S&P Global, Inc. | 1,911 | 360,415 | |
| Sherwin-Williams Co. | 798 | 293,393 | |
| Visa, Inc. Class A | 4,372 | 554,719 | |
| Yum China Holdings, Inc. | 2,887 | 123,448 | |
| TOTAL UNITED STATES OF AMERICA | 4,792,916 | ||
| TOTAL COMMON STOCKS | |||
| (Cost $51,957,904) | 53,334,609 | ||
| Nonconvertible Preferred Stocks - 1.5% | |||
| Brazil - 1.1% | |||
| Ambev SA sponsored ADR | 23,699 | 156,887 | |
| Itau Unibanco Holding SA | 21,800 | 317,429 | |
| Itausa-Investimentos Itau SA (PN) | 30,000 | 116,551 | |
| TOTAL BRAZIL | 590,867 | ||
| Germany - 0.3% | |||
| Porsche Automobil Holding SE (Germany) | 1,542 | 131,838 | |
| Sartorius AG (non-vtg.) | 379 | 58,492 | |
| TOTAL GERMANY | 190,330 | ||
| Spain - 0.1% | |||
| Grifols SA Class B | 2,852 | 58,786 | |
| TOTAL NONCONVERTIBLE PREFERRED STOCKS | |||
| (Cost $806,127) | 839,983 | ||
| Money Market Funds - 3.8% | |||
| Fidelity Cash Central Fund, 1.74% (d) | 1,816,268 | 1,816,631 | |
| Fidelity Securities Lending Cash Central Fund 1.74% (d)(e) | 301,787 | 301,817 | |
| TOTAL MONEY MARKET FUNDS | |||
| (Cost $2,118,448) | 2,118,448 | ||
| TOTAL INVESTMENT IN SECURITIES - 100.0% | |||
| (Cost $54,882,479) | 56,293,040 | ||
| NET OTHER ASSETS (LIABILITIES) - 0.0% | 6,871 | ||
| NET ASSETS - 100% | $56,299,911 |
Categorizations in the Schedule of Investments are based on country or territory of incorporation.
Legend
(a) Non-income producing
(b) Security exempt from registration under Rule 144A of the Securities Act of 1933. These securities may be resold in transactions exempt from registration, normally to qualified institutional buyers. At the end of the period, the value of these securities amounted to $39,852 or 0.1% of net assets.
(c) Security or a portion of the security is on loan at period end.
(d) Affiliated fund that is generally available only to investment companies and other accounts managed by Fidelity Investments. The rate quoted is the annualized seven-day yield of the fund at period end. A complete unaudited listing of the fund's holdings as of its most recent quarter end is available upon request. In addition, each Fidelity Central Fund's financial statements are available on the SEC's website or upon request.
(e) Investment made with cash collateral received from securities on loan.
Affiliated Central Funds
Information regarding fiscal year to date income earned by the Fund from investments in Fidelity Central Funds is as follows:
| Fund | Income earned |
| Fidelity Cash Central Fund | $8,362 |
| Fidelity Securities Lending Cash Central Fund | 1,019 |
| Total | $9,381 |
Amounts in the income column in the above table include any capital gain distributions from underlying funds, which are presented in the corresponding line-item in the Statement of Operations if applicable.
Investment Valuation
The following is a summary of the inputs used, as of April 30, 2018, involving the Fund's assets and liabilities carried at fair value. The inputs or methodology used for valuing securities may not be an indication of the risk associated with investing in those securities. For more information on valuation inputs, and their aggregation into the levels used below, please refer to the Investment Valuation section in the accompanying Notes to Financial Statements.
| Valuation Inputs at Reporting Date: | ||||
| Description | Total | Level 1 | Level 2 | Level 3 |
| Investments in Securities: | ||||
| Equities: | ||||
| Consumer Discretionary | $5,848,073 | $3,664,038 | $2,184,035 | $-- |
| Consumer Staples | 4,365,139 | 2,312,820 | 2,052,319 | -- |
| Energy | 2,780,230 | 1,371,973 | 1,408,257 | -- |
| Financials | 12,721,190 | 6,271,813 | 6,449,377 | -- |
| Health Care | 4,273,515 | 1,399,313 | 2,874,202 | -- |
| Industrials | 8,102,047 | 6,176,357 | 1,925,690 | -- |
| Information Technology | 9,710,130 | 7,082,272 | 2,627,858 | -- |
| Materials | 4,495,465 | 3,062,629 | 1,432,836 | -- |
| Real Estate | 851,604 | 664,359 | 187,245 | -- |
| Telecommunication Services | 783,183 | 416,602 | 366,581 | -- |
| Utilities | 244,016 | 169,106 | 74,910 | -- |
| Money Market Funds | 2,118,448 | 2,118,448 | -- | -- |
| Total Investments in Securities: | $56,293,040 | $34,709,730 | $21,583,310 | $-- |
The following is a summary of transfers between Level 1 and Level 2 for the period ended April 30, 2018. Transfers are assumed to have occurred at the beginning of the period, and are primarily attributable to the valuation techniques used for foreign equity securities, as discussed in the accompanying Notes to Financial Statements:
| Transfers | Total |
| Level 1 to Level 2 | $1,754,710 |
| Level 2 to Level 1 | $1,872,273 |
See accompanying notes which are an integral part of the financial statements.
Financial Statements
Statement of Assets and Liabilities
| April 30, 2018 (Unaudited) | ||
| Assets | ||
| Investment in securities, at value (including securities loaned of $288,777) — See accompanying schedule: Unaffiliated issuers (cost $52,764,031) | $54,174,592 | |
| Fidelity Central Funds (cost $2,118,448) | 2,118,448 | |
| Total Investment in Securities (cost $54,882,479) | $56,293,040 | |
| Cash | 31,601 | |
| Foreign currency held at value (cost $21,967) | 21,963 | |
| Receivable for investments sold | 172,085 | |
| Receivable for fund shares sold | 10,874 | |
| Dividends receivable | 193,712 | |
| Distributions receivable from Fidelity Central Funds | 2,024 | |
| Other receivables | 2,120 | |
| Total assets | 56,727,419 | |
| Liabilities | ||
| Payable for investments purchased | $100,771 | |
| Payable for fund shares redeemed | 6,643 | |
| Other payables and accrued expenses | 18,289 | |
| Collateral on securities loaned | 301,805 | |
| Total liabilities | 427,508 | |
| Net Assets | $56,299,911 | |
| Net Assets consist of: | ||
| Paid in capital | $54,710,602 | |
| Undistributed net investment income | 446,515 | |
| Accumulated undistributed net realized gain (loss) on investments and foreign currency transactions | (246,332) | |
| Net unrealized appreciation (depreciation) on investments and assets and liabilities in foreign currencies | 1,389,126 | |
| Net Assets, for 4,610,119 shares outstanding | $56,299,911 | |
| Net Asset Value, offering price and redemption price per share ($56,299,911 ÷ 4,610,119 shares) | $12.21 |
See accompanying notes which are an integral part of the financial statements.
Statement of Operations
| Six months ended April 30, 2018 (Unaudited) | ||
| Investment Income | ||
| Dividends | $547,536 | |
| Income from Fidelity Central Funds | 9,381 | |
| Income before foreign taxes withheld | 556,917 | |
| Less foreign taxes withheld | (54,888) | |
| Total income | 502,029 | |
| Expenses | ||
| Independent trustees' fees and expenses | $58 | |
| Miscellaneous | 40 | |
| Total expenses | 98 | |
| Net investment income (loss) | 501,931 | |
| Realized and Unrealized Gain (Loss) | ||
| Net realized gain (loss) on: | ||
| Investment securities: | ||
| Unaffiliated issuers (net of foreign taxes of $68) | (194,873) | |
| Fidelity Central Funds | 12 | |
| Foreign currency transactions | (11,707) | |
| Total net realized gain (loss) | (206,568) | |
| Change in net unrealized appreciation (depreciation) on: | ||
| Investment securities: | ||
| Unaffiliated issuers (net of increase in deferred foreign taxes of $18,288) | 261,849 | |
| Assets and liabilities in foreign currencies | (3,042) | |
| Total change in net unrealized appreciation (depreciation) | 258,807 | |
| Net gain (loss) | 52,239 | |
| Net increase (decrease) in net assets resulting from operations | $554,170 |
See accompanying notes which are an integral part of the financial statements.
Statement of Changes in Net Assets
| Six months ended April 30, 2018 (Unaudited) | For the period March 7, 2017 (commencement of operations) to October 31, 2017 | |
| Increase (Decrease) in Net Assets | ||
| Operations | ||
| Net investment income (loss) | $501,931 | $113,865 |
| Net realized gain (loss) | (206,568) | 34,417 |
| Change in net unrealized appreciation (depreciation) | 258,807 | 1,130,319 |
| Net increase (decrease) in net assets resulting from operations | 554,170 | 1,278,601 |
| Distributions to shareholders from net investment income | (169,263) | – |
| Distributions to shareholders from net realized gain | (74,198) | – |
| Total distributions | (243,461) | – |
| Share transactions | ||
| Proceeds from sales of shares | 49,499,241 | 14,011,215 |
| Reinvestment of distributions | 243,461 | – |
| Cost of shares redeemed | (8,364,709) | (678,607) |
| Net increase (decrease) in net assets resulting from share transactions | 41,377,993 | 13,332,608 |
| Total increase (decrease) in net assets | 41,688,702 | 14,611,209 |
| Net Assets | ||
| Beginning of period | 14,611,209 | – |
| End of period | $56,299,911 | $14,611,209 |
| Other Information | ||
| Undistributed net investment income end of period | $446,515 | $113,847 |
| Shares | ||
| Sold | 4,049,030 | 1,281,107 |
| Issued in reinvestment of distributions | 20,407 | – |
| Redeemed | (681,728) | (58,697) |
| Net increase (decrease) | 3,387,709 | 1,222,410 |
See accompanying notes which are an integral part of the financial statements.
Financial Highlights
Fidelity Flex International Fund
| Six months ended (Unaudited) April 30, | Years endedOctober 31, | |
| 2018 | 2017 A | |
| Selected Per–Share Data | ||
| Net asset value, beginning of period | $11.95 | $10.00 |
| Income from Investment Operations | ||
| Net investment income (loss)B | .16 | .16 |
| Net realized and unrealized gain (loss) | .21 | 1.79 |
| Total from investment operations | .37 | 1.95 |
| Distributions from net investment income | (.07) | – |
| Distributions from net realized gain | (.03) | – |
| Total distributions | (.11)C | – |
| Net asset value, end of period | $12.21 | $11.95 |
| Total ReturnD | 3.08% | 19.50% |
| Ratios to Average Net AssetsE,F | ||
| Expenses before reductionsG | - %H | - %H |
| Expenses net of fee waivers, if anyG | - %H | - %H |
| Expenses net of all reductionsG | - %H | - %H |
| Net investment income (loss) | 2.69%H | 2.24%H |
| Supplemental Data | ||
| Net assets, end of period (000 omitted) | $56,300 | $14,611 |
| Portfolio turnover rateI | 58%H | 35%H |
A For the period March 7, 2017 (commencement of operations) to October 31, 2017.
B Calculated based on average shares outstanding during the period.
C Total distributions of $.11 per share is comprised of distributions from net investment income of $.073 and distributions from net realized gain of $.032 per share.
D Total returns for periods of less than one year are not annualized.
E Fees and expenses of any underlying Fidelity Central Funds are not included in the Fund's expense ratio. The Fund indirectly bears its proportionate share of the expenses of any underlying Fidelity Central Funds.
F Expense ratios reflect operating expenses of the Fund. Expenses before reductions do not reflect amounts reimbursed by the investment adviser or reductions from brokerage service arrangements or reductions from other expense offset arrangements and do not represent the amount paid by the Fund during periods when reimbursements or reductions occur. Expense ratios before reductions for start-up periods may not be representative of longer term operating periods. Expenses net of fee waivers reflect expenses after reimbursement by the investment adviser but prior to reductions from brokerage service arrangements or other expense offset arrangements. Expenses net of all reductions represent the net expenses paid by the Fund.
G Amount represents less than .005%.
H Annualized
I Amount does not include the portfolio activity of any underlying Fidelity Central Funds.
See accompanying notes which are an integral part of the financial statements.
Notes to Financial Statements (Unaudited)
For the period ended April 30, 2018
1. Organization.
Fidelity Flex International Fund (the Fund) is a fund of Fidelity Investment Trust (the Trust) and is authorized to issue an unlimited number of shares. Share transactions on the Statement of Changes in Net Assets may contain exchanges between affiliated funds. The Trust is registered under the Investment Company Act of 1940, as amended (the 1940 Act), as an open-end management investment company organized as a Massachusetts business trust. The Fund is available only to certain fee-based accounts offered by Fidelity. The Fund's investments in emerging markets can be subject to social, economic, regulatory, and political uncertainties and can be extremely volatile.
2. Investments in Fidelity Central Funds.
The Fund invests in Fidelity Central Funds, which are open-end investment companies generally available only to other investment companies and accounts managed by the investment adviser and its affiliates. The Fund's Schedule of Investments lists each of the Fidelity Central Funds held as of period end, if any, as an investment of the Fund, but does not include the underlying holdings of each Fidelity Central Fund. As an Investing Fund, the Fund indirectly bears its proportionate share of the expenses of the underlying Fidelity Central Funds.
The Money Market Central Funds seek preservation of capital and current income and are managed by Fidelity Investments Money Management, Inc. (FIMM), an affiliate of the investment adviser. Annualized expenses of the Money Market Central Funds as of their most recent shareholder report date are less than .005%.
A complete unaudited list of holdings for each Fidelity Central Fund is available upon request or at the Securities and Exchange Commission (the SEC) website at www.sec.gov. In addition, the financial statements of the Fidelity Central Funds are available on the SEC website or upon request.
3. Significant Accounting Policies.
The Fund is an investment company and applies the accounting and reporting guidance of the Financial Accounting Standards Board (FASB) Accounting Standards Codification Topic 946 Financial Services – Investments Companies. The financial statements have been prepared in conformity with accounting principles generally accepted in the United States of America (GAAP), which require management to make certain estimates and assumptions at the date of the financial statements. Actual results could differ from those estimates. Subsequent events, if any, through the date that the financial statements were issued have been evaluated in the preparation of the financial statements. The following summarizes the significant accounting policies of the Fund:
Investment Valuation. Investments are valued as of 4:00 p.m. Eastern time on the last calendar day of the period. The Board of Trustees (the Board) has delegated the day to day responsibility for the valuation of the Fund's investments to the Fair Value Committee (the Committee) established by the Fund's investment adviser. In accordance with valuation policies and procedures approved by the Board, the Fund attempts to obtain prices from one or more third party pricing vendors or brokers to value its investments. When current market prices, quotations or currency exchange rates are not readily available or reliable, investments will be fair valued in good faith by the Committee, in accordance with procedures adopted by the Board. Factors used in determining fair value vary by investment type and may include market or investment specific events. The frequency with which these procedures are used cannot be predicted and they may be utilized to a significant extent. The Committee oversees the Fund's valuation policies and procedures and reports to the Board on the Committee's activities and fair value determinations. The Board monitors the appropriateness of the procedures used in valuing the Fund's investments and ratifies the fair value determinations of the Committee.
The Fund categorizes the inputs to valuation techniques used to value its investments into a disclosure hierarchy consisting of three levels as shown below:
- Level 1 – quoted prices in active markets for identical investments
- Level 2 – other significant observable inputs (including quoted prices for similar investments, interest rates, prepayment speeds, etc.)
- Level 3 – unobservable inputs (including the Fund's own assumptions based on the best information available)
Valuation techniques used to value the Fund's investments by major category are as follows:
Equity securities, including restricted securities, for which market quotations are readily available, are valued at the last reported sale price or official closing price as reported by a third party pricing vendor on the primary market or exchange on which they are traded and are categorized as Level 1 in the hierarchy. In the event there were no sales during the day or closing prices are not available, securities are valued at the last quoted bid price or may be valued using the last available price and are generally categorized as Level 2 in the hierarchy. For foreign equity securities, when market or security specific events arise, comparisons to the valuation of American Depositary Receipts (ADRs), futures contracts, Exchange-Traded Funds (ETFs) and certain indexes as well as quoted prices for similar securities may be used and would be categorized as Level 2 in the hierarchy. Utilizing these techniques may result in transfers between Level 1 and Level 2. For equity securities, including restricted securities, where observable inputs are limited, assumptions about market activity and risk are used and these securities may be categorized as Level 3 in the hierarchy.
Investments in open-end mutual funds, including the Fidelity Central Funds, are valued at their closing net asset value (NAV) each business day and are categorized as Level 1 in the hierarchy.
Changes in valuation techniques may result in transfers in or out of an assigned level within the disclosure hierarchy. The aggregate value of investments by input level as of April 30, 2018, including information on transfers between Levels 1 and 2, is included at the end of the Fund's Schedule of Investments.
Foreign Currency. The Fund may use foreign currency contracts to facilitate transactions in foreign-denominated securities. Gains and losses from these transactions may arise from changes in the value of the foreign currency or if the counterparties do not perform under the contracts' terms.
Foreign-denominated assets, including investment securities, and liabilities are translated into U.S. dollars at the exchange rates at period end. Purchases and sales of investment securities, income and dividends received and expenses denominated in foreign currencies are translated into U.S. dollars at the exchange rate in effect on the transaction date.
The effects of exchange rate fluctuations on investments are included with the net realized and unrealized gain (loss) on investment securities. Other foreign currency transactions resulting in realized and unrealized gain (loss) are disclosed separately.
Investment Transactions and Income. For financial reporting purposes, the Fund's investment holdings and NAV include trades executed through the end of the last business day of the period. The NAV per share for processing shareholder transactions is calculated as of the close of business of the New York Stock Exchange (NYSE), normally 4:00 p.m. Eastern time and includes trades executed through the end of the prior business day. Gains and losses on securities sold are determined on the basis of identified cost. Dividend income is recorded on the ex-dividend date, except for certain dividends from foreign securities where the ex-dividend date may have passed, which are recorded as soon as the Fund is informed of the ex-dividend date. Non-cash dividends included in dividend income, if any, are recorded at the fair market value of the securities received. Income and capital gain distributions from Fidelity Central Funds, if any, are recorded on the ex-dividend date. Certain distributions received by the Fund represent a return of capital or capital gain. The Fund determines the components of these distributions subsequent to the ex-dividend date, based upon receipt of tax filings or other correspondence relating to the underlying investment. These distributions are recorded as a reduction of cost of investments and/or as a realized gain. Investment income is recorded net of foreign taxes withheld where recovery of such taxes is uncertain.
Expenses. Expenses directly attributable to a fund are charged to that fund. Expenses attributable to more than one fund are allocated among the respective funds on the basis of relative net assets or other appropriate methods. Expense estimates are accrued in the period to which they relate and adjustments are made when actual amounts are known.
Income Tax Information and Distributions to Shareholders. Each year, the Fund intends to qualify as a regulated investment company under Subchapter M of the Internal Revenue Code, including distributing substantially all of its taxable income and realized gains. As a result, no provision for U.S. Federal income taxes is required. The Fund files a U.S. federal tax return, in addition to state and local tax returns as required. The Fund's federal income tax returns are subject to examination by the Internal Revenue Service (IRS) for a period of three fiscal years after they are filed. State and local tax returns may be subject to examination for an additional fiscal year depending on the jurisdiction. Foreign taxes are provided for based on the Fund's understanding of the tax rules and rates that exist in the foreign markets in which it invests. The Fund is subject to a tax imposed on capital gains by certain countries in which it invests. An estimated deferred tax liability for net unrealized appreciation on the applicable securities is included in Other payables and accrued expenses on the Statement of Assets & Liabilities.
Distributions are declared and recorded on the ex-dividend date. Income and capital gain distributions are determined in accordance with income tax regulations, which may differ from GAAP.
Capital accounts within the financial statements are adjusted for permanent book-tax differences. These adjustments have no impact on net assets or the results of operations. Capital accounts are not adjusted for temporary book-tax differences which will reverse in a subsequent period.
Book-tax differences are primarily due to foreign currency transactions, passive foreign investment companies (PFIC) and losses deferred due to wash sales.
As of period end, the cost and unrealized appreciation (depreciation) in securities, and derivatives if applicable, for federal income tax purposes were as follows:
| Gross unrealized appreciation | $3,136,945 |
| Gross unrealized depreciation | (1,909,711) |
| Net unrealized appreciation (depreciation) | $1,227,234 |
| Tax cost | $55,065,806 |
Restricted Securities. The Fund may invest in securities that are subject to legal or contractual restrictions on resale. These securities generally may be resold in transactions exempt from registration or to the public if the securities are registered. Disposal of these securities may involve time-consuming negotiations and expense, and prompt sale at an acceptable price may be difficult. Information regarding restricted securities is included at the end of the Fund's Schedule of Investments.
4. Purchases and Sales of Investments.
Purchases and sales of securities, other than short-term securities, aggregated $50,042,685 and $10,410,827, respectively.
5. Fees and Other Transactions with Affiliates.
Management Fee. Fidelity Management & Research Company (the investment adviser) and its affiliates provide the Fund with investment management related services and the Fund does not pay any fees for these services. Under the management contract, the investment adviser or an affiliate pays all other expenses of the Fund, excluding fees and expenses of the independent Trustees, and certain miscellaneous expenses such as proxy and shareholder meeting expenses.
Brokerage Commissions. The Fund placed a portion of its portfolio transactions with brokerage firms which are affiliates of the investment adviser. Brokerage commissions are included in net realized gain (loss) and change in net unrealized appreciation (depreciation) in the Statement of Operations. The commissions paid to these affiliated firms were $163 for the period.
Interfund Trades. The Fund may purchase from or sell securities to other Fidelity Funds under procedures adopted by the Board. The procedures have been designed to ensure these interfund trades are executed in accordance with Rule 17a-7 of the 1940 Act. Interfund trades are included within the respective purchases and sales amounts shown in the Purchases and Sales of Investments note.
6. Committed Line of Credit.
The Fund participates with other funds managed by the investment adviser or an affiliate in a $4.25 billion credit facility (the "line of credit") to be utilized for temporary or emergency purposes to fund shareholder redemptions or for other short-term liquidity purposes. The Fund has agreed to pay commitment fees on its pro-rata portion of the line of credit, which amounted to $40 and is reflected in Miscellaneous expenses on the Statement of Operations. During the period, the Fund did not borrow on this line of credit.
7. Security Lending.
The Fund lends portfolio securities through a lending agent from time to time in order to earn additional income. For equity securities, a lending agent is used and may loan securities to certain qualified borrowers, including Fidelity Capital Markets (FCM), a broker-dealer affiliated with the Fund. On the settlement date of the loan, the Fund receives collateral (in the form of U.S. Treasury obligations, letters of credit and/or cash) against the loaned securities and maintains collateral in an amount not less than 100% of the market value of the loaned securities during the period of the loan. The market value of the loaned securities is determined at the close of business of the Fund and any additional required collateral is delivered to the Fund on the next business day. The Fund or borrower may terminate the loan at any time, and if the borrower defaults on its obligation to return the securities loaned because of insolvency or other reasons, the Fund may apply collateral received from the borrower against the obligation. The Fund may experience delays and costs in recovering the securities loaned. Any cash collateral received is invested in the Fidelity Securities Lending Cash Central Fund. The value of loaned securities and cash collateral at period end are disclosed on the Fund's Statement of Assets and Liabilities. Security lending income represents the income earned on investing cash collateral, less rebates paid to borrowers and any lending agent fees associated with the loan, plus any premium payments received for lending certain types of securities. Security lending income is presented in the Statement of Operations as a component of income from Fidelity Central Funds. Total security lending income during the period amounted to $1,019. During the period, there were no securities loaned to FCM.
8. Other.
The Fund's organizational documents provide former and current trustees and officers with a limited indemnification against liabilities arising in connection with the performance of their duties to the Fund. In the normal course of business, the Fund may also enter into contracts that provide general indemnifications. The Fund's maximum exposure under these arrangements is unknown as this would be dependent on future claims that may be made against the Fund. The risk of material loss from such claims is considered remote.
At the end of the period, the investment adviser or its affiliates were the owners of record of 11% of the total outstanding shares of the Fund.
Shareholder Expense Example
As a shareholder of the Fund, you incur two types of costs: (1) transaction costs, and (2) ongoing costs, including other Fund expenses. This Example is intended to help you understand your ongoing costs (in dollars) of investing in the Fund and to compare these costs with the ongoing costs of investing in other mutual funds.
The Example is based on an investment of $1,000 invested at the beginning of the period and held for the entire period (November 1, 2017 to April 30, 2018).
Actual Expenses
The first line of the accompanying table provides information about actual account values and actual expenses. You may use the information in this line, together with the amount you invested, to estimate the expenses that you paid over the period. Simply divide your account value by $1,000.00 (for example, an $8,600 account value divided by $1,000.00 = 8.6), then multiply the result by the number in the first line under the heading entitled "Expenses Paid During Period" to estimate the expenses you paid on your account during this period. In addition, the Fund, as a shareholder in the underlying Fidelity Central Funds, will indirectly bear its pro-rata share of the fees and expenses incurred by the underlying Fidelity Central Funds. These fees and expenses are not included in the Fund's annualized expense ratio used to calculate the expense estimate in the table below.
Hypothetical Example for Comparison Purposes
The second line of the accompanying table provides information about hypothetical account values and hypothetical expenses based on the Fund's actual expense ratio and an assumed rate of return of 5% per year before expenses, which is not the Fund's actual return. The hypothetical account values and expenses may not be used to estimate the actual ending account balance or expenses you paid for the period. You may use this information to compare the ongoing costs of investing in the Fund and other funds. To do so, compare this 5% hypothetical example with the 5% hypothetical examples that appear in the shareholder reports of the other funds. In addition, the Fund, as a shareholder in the underlying Fidelity Central Funds, will indirectly bear its pro-rata share of the fees and expenses incurred by the underlying Fidelity Central Funds. These fees and expenses are not included in the Fund's annualized expense ratio used to calculate the expense estimate in the table below.
Please note that the expenses shown in the table are meant to highlight your ongoing costs only and do not reflect any transaction costs. Therefore, the second line of the table is useful in comparing ongoing costs only, and will not help you determine the relative total costs of owning different funds.
| Annualized Expense Ratio-A | Beginning Account Value November 1, 2017 | Ending Account Value April 30, 2018 | Expenses Paid During Period-B November 1, 2017 to April 30, 2018 | |
| Actual | - %-C | $1,000.00 | $1,030.80 | $--D |
| Hypothetical-E | $1,000.00 | $1,024.79 | $--D |
A Annualized expense ratio reflects expenses net of applicable fee waivers.
B Expenses are equal to the Fund's annualized expense ratio, multiplied by the average account value over the period, multiplied by 181/365 (to reflect the one-half year period).
C Amount represents less than .005%.
D Amount represents less than $.005.
E 5% return per year before expenses
![]()
Corporate Headquarters
245 Summer St.
Boston, MA 02210
www.fidelity.com
ZNL-SANN-0618
1.9881586.101
Fidelity® Diversified International K6 Fund Semi-Annual Report April 30, 2018 |
|
Contents
To view a fund's proxy voting guidelines and proxy voting record for the 12-month period ended June 30, visit http://www.fidelity.com/proxyvotingresults or visit the Securities and Exchange Commission's (SEC) web site at http://www.sec.gov.
You may also call 1-800-835-5092 to request a free copy of the proxy voting guidelines.
Standard & Poor's, S&P and S&P 500 are registered service marks of The McGraw-Hill Companies, Inc. and have been licensed for use by Fidelity Distributors Corporation.
Other third-party marks appearing herein are the property of their respective owners.
All other marks appearing herein are registered or unregistered trademarks or service marks of FMR LLC or an affiliated company. © 2018 FMR LLC. All rights reserved.
This report and the financial statements contained herein are submitted for the general information of the shareholders of the Fund. This report is not authorized for distribution to prospective investors in the Fund unless preceded or accompanied by an effective prospectus.
A fund files its complete schedule of portfolio holdings with the SEC for the first and third quarters of each fiscal year on Form N-Q. Forms N-Q are available on the SEC’s web site at http://www.sec.gov. A fund's Forms N-Q may be reviewed and copied at the SEC’s Public Reference Room in Washington, DC. Information regarding the operation of the SEC's Public Reference Room may be obtained by calling 1-800-SEC-0330.
For a complete list of a fund's portfolio holdings, view the most recent holdings listing, semiannual report, or annual report on Fidelity's web site at http://www.fidelity.com, http://www.institutional.fidelity.com, or http://www.401k.com, as applicable.
NOT FDIC INSURED •MAY LOSE VALUE •NO BANK GUARANTEE
Neither the Fund nor Fidelity Distributors Corporation is a bank.
Investment Summary (Unaudited)
Geographic Diversification (% of fund's net assets)
| As of April 30, 2018 | ||
| Japan | 16.9% | |
| United Kingdom | 14.8% | |
| United States of America* | 10.9% | |
| France | 7.6% | |
| Germany | 7.3% | |
| Netherlands | 5.4% | |
| Switzerland | 4.1% | |
| India | 3.6% | |
| Canada | 3.4% | |
| Other | 26.0% | |
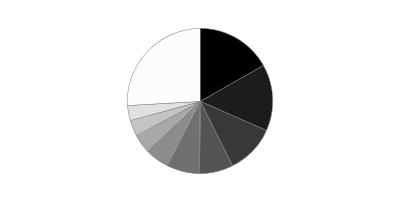
* Includes Short-Term investments and Net Other Assets (Liabilities).
Percentages are based on country or territory of incorporation and include the effect of futures contracts, options and swaps, as applicable. Foreign currency contracts and other assets and liabilities are included within United States of America, as applicable.
Asset Allocation as of April 30, 2018
| % of fund's net assets | |
| Stocks | 94.6 |
| Short-Term Investments and Net Other Assets (Liabilities) | 5.4 |
Top Ten Stocks as of April 30, 2018
| % of fund's net assets | |
| Prudential PLC (United Kingdom, Insurance) | 1.6 |
| ORIX Corp. (Japan, Diversified Financial Services) | 1.6 |
| Keyence Corp. (Japan, Electronic Equipment & Components) | 1.4 |
| British American Tobacco PLC sponsored ADR (United Kingdom, Tobacco) | 1.4 |
| Statoil ASA (Norway, Oil, Gas & Consumable Fuels) | 1.4 |
| Unilever NV (Certificaten Van Aandelen) (Bearer) (Netherlands, Personal Products) | 1.3 |
| AIA Group Ltd. (Hong Kong, Insurance) | 1.2 |
| Wolseley PLC (Bailiwick of Jersey, Trading Companies & Distributors) | 1.2 |
| SAP SE (Germany, Software) | 1.2 |
| Suncor Energy, Inc. (Canada, Oil, Gas & Consumable Fuels) | 1.1 |
| 13.4 |
Top Market Sectors as of April 30, 2018
| % of fund's net assets | |
| Financials | 24.8 |
| Industrials | 15.4 |
| Information Technology | 11.9 |
| Consumer Staples | 10.7 |
| Consumer Discretionary | 10.7 |
| Health Care | 9.7 |
| Materials | 5.5 |
| Energy | 4.6 |
| Telecommunication Services | 1.0 |
| Utilities | 0.2 |
Schedule of Investments April 30, 2018 (Unaudited)
Showing Percentage of Net Assets
| Common Stocks - 93.8% | |||
| Shares | Value | ||
| Australia - 1.0% | |||
| Amcor Ltd. | 511,250 | $5,268,418 | |
| Bapcor Ltd. | 70,875 | 312,700 | |
| CSL Ltd. | 51,818 | 6,637,318 | |
| Link Administration Holdings Ltd. | 120,725 | 751,192 | |
| Magellan Financial Group Ltd. | 297,694 | 5,200,854 | |
| Technology One Ltd. | 55,298 | 205,403 | |
| TOTAL AUSTRALIA | 18,375,885 | ||
| Austria - 0.1% | |||
| Andritz AG | 38,078 | 2,049,002 | |
| Bailiwick of Jersey - 2.4% | |||
| Glencore Xstrata PLC | 1,745,811 | 8,428,927 | |
| Shire PLC | 205,113 | 10,922,253 | |
| Wolseley PLC | 290,756 | 22,335,835 | |
| WPP PLC | 117,429 | 2,015,097 | |
| TOTAL BAILIWICK OF JERSEY | 43,702,112 | ||
| Belgium - 1.1% | |||
| KBC Groep NV | 194,551 | 17,009,641 | |
| Umicore SA | 50,716 | 2,833,177 | |
| TOTAL BELGIUM | 19,842,818 | ||
| Bermuda - 1.1% | |||
| Credicorp Ltd. (United States) | 34,493 | 8,019,278 | |
| Hiscox Ltd. | 366,851 | 7,520,102 | |
| IHS Markit Ltd. (a) | 112,560 | 5,530,073 | |
| TOTAL BERMUDA | 21,069,453 | ||
| Canada - 3.4% | |||
| Alimentation Couche-Tard, Inc. Class B (sub. vtg.) | 403,617 | 17,449,885 | |
| CCL Industries, Inc. Class B | 36,582 | 1,774,467 | |
| Cenovus Energy, Inc. | 955,653 | 9,571,788 | |
| Constellation Software, Inc. | 7,074 | 5,055,738 | |
| Fairfax India Holdings Corp. (a) | 432,977 | 7,577,098 | |
| Imperial Oil Ltd. | 900 | 27,989 | |
| PrairieSky Royalty Ltd. | 74,975 | 1,662,478 | |
| Suncor Energy, Inc. | 508,326 | 19,439,080 | |
| TOTAL CANADA | 62,558,523 | ||
| Cayman Islands - 1.2% | |||
| Alibaba Group Holding Ltd. sponsored ADR (a) | 51,270 | 9,153,746 | |
| ENN Energy Holdings Ltd. | 315,877 | 2,953,934 | |
| JD.com, Inc. sponsored ADR (a) | 134,149 | 4,897,780 | |
| NetEase, Inc. ADR | 15,747 | 4,048,081 | |
| Zai Lab Ltd. ADR | 55,828 | 1,042,309 | |
| TOTAL CAYMAN ISLANDS | 22,095,850 | ||
| China - 0.7% | |||
| Hangzhou Hikvision Digital Technology Co. Ltd. Class A | 147,143 | 891,228 | |
| Kweichow Moutai Co. Ltd. (A Shares) | 46,777 | 4,870,843 | |
| Shanghai International Airport Co. Ltd. (A Shares) | 575,113 | 4,517,020 | |
| Tonghua Dongbao Pharmaceutical Co. Ltd. Class A | 412,091 | 1,864,200 | |
| TOTAL CHINA | 12,143,291 | ||
| Curacao - 0.3% | |||
| Schlumberger Ltd. | 80,179 | 5,497,072 | |
| Denmark - 0.3% | |||
| NNIT A/S (b) | 35,040 | 973,444 | |
| Novozymes A/S Series B | 91,031 | 4,279,629 | |
| SimCorp A/S | 2,657 | 193,449 | |
| TOTAL DENMARK | 5,446,522 | ||
| Finland - 0.4% | |||
| Sampo Oyj (A Shares) | 137,637 | 7,437,917 | |
| France - 7.6% | |||
| Aeroports de Paris | 24,843 | 5,472,074 | |
| Amundi SA (b) | 183,433 | 15,612,285 | |
| BNP Paribas SA | 245,115 | 18,938,136 | |
| Capgemini SA | 54,328 | 7,479,140 | |
| Compagnie de St. Gobain | 171,619 | 9,014,213 | |
| Eiffage SA | 32,099 | 3,825,884 | |
| Elis SA | 198,583 | 4,753,011 | |
| Iliad SA | 8,590 | 1,721,446 | |
| Kering SA (c) | 14,060 | 8,143,059 | |
| LVMH Moet Hennessy - Louis Vuitton SA | 48,315 | 16,814,207 | |
| Maisons du Monde SA (b) | 74,683 | 3,037,505 | |
| Sanofi SA | 215,302 | 17,022,276 | |
| Societe Generale Series A | 186,693 | 10,217,481 | |
| SR Teleperformance SA | 18,056 | 2,897,808 | |
| Thales SA | 20,986 | 2,660,983 | |
| VINCI SA (c) | 131,753 | 13,173,153 | |
| TOTAL FRANCE | 140,782,661 | ||
| Germany - 6.6% | |||
| adidas AG | 60,496 | 14,895,908 | |
| Aumann AG (b) | 29,335 | 1,774,790 | |
| Axel Springer Verlag AG | 77,717 | 6,367,794 | |
| Bayer AG | 150,478 | 17,985,072 | |
| Brenntag AG | 14,600 | 837,823 | |
| Deutsche Borse AG | 33,374 | 4,488,439 | |
| Deutsche Post AG | 250,148 | 10,857,536 | |
| Fresenius SE & Co. KGaA | 168,738 | 12,906,666 | |
| Hannover Reuck SE | 39,033 | 5,496,087 | |
| Linde AG | 48,544 | 10,789,330 | |
| Morphosys AG sponsored ADR (c) | 75,600 | 1,979,208 | |
| Rational AG | 2,945 | 1,847,540 | |
| SAP SE | 194,878 | 21,652,053 | |
| Scout24 AG (b) | 75,200 | 3,899,447 | |
| Symrise AG | 87,322 | 7,075,698 | |
| TOTAL GERMANY | 122,853,391 | ||
| Hong Kong - 1.6% | |||
| AIA Group Ltd. | 2,544,046 | 22,736,648 | |
| Techtronic Industries Co. Ltd. | 1,109,111 | 6,497,385 | |
| TOTAL HONG KONG | 29,234,033 | ||
| Hungary - 0.0% | |||
| OTP Bank PLC | 22,080 | 964,663 | |
| India - 3.6% | |||
| Adani Ports & Special Economic Zone Ltd. | 526,097 | 3,218,181 | |
| Axis Bank Ltd. | 572,115 | 4,435,298 | |
| Future Retail Ltd. | 61,660 | 557,135 | |
| Godrej Consumer Products Ltd. | 74,263 | 1,244,440 | |
| HDFC Bank Ltd. | 568,163 | 17,124,326 | |
| Housing Development Finance Corp. Ltd. | 591,343 | 16,730,881 | |
| ICICI Bank Ltd. | 857,199 | 3,663,406 | |
| Kajaria Ceramics Ltd. | 116,470 | 953,633 | |
| Kotak Mahindra Bank Ltd. (a) | 212,919 | 3,871,697 | |
| LIC Housing Finance Ltd. | 311,603 | 2,551,175 | |
| Motherson Sumi Systems Ltd. | 142,734 | 756,246 | |
| PC Jeweller Ltd. | 86,585 | 187,456 | |
| Reliance Industries Ltd. | 815,330 | 11,772,060 | |
| TOTAL INDIA | 67,065,934 | ||
| Indonesia - 0.9% | |||
| PT Bank Central Asia Tbk | 4,779,550 | 7,557,820 | |
| PT Bank Rakyat Indonesia Tbk | 38,406,500 | 8,855,328 | |
| TOTAL INDONESIA | 16,413,148 | ||
| Ireland - 3.2% | |||
| Allergan PLC | 22,085 | 3,393,360 | |
| CRH PLC | 248,950 | 8,835,506 | |
| DCC PLC (United Kingdom) | 69,475 | 6,695,236 | |
| Kerry Group PLC Class A | 95,131 | 9,707,377 | |
| Kingspan Group PLC (Ireland) | 156,049 | 7,066,679 | |
| Paddy Power Betfair PLC (Ireland) | 59,520 | 5,890,267 | |
| Ryanair Holdings PLC sponsored ADR (a) | 154,222 | 16,959,793 | |
| TOTAL IRELAND | 58,548,218 | ||
| Israel - 0.6% | |||
| Check Point Software Technologies Ltd. (a) | 89,072 | 8,596,339 | |
| Frutarom Industries Ltd. | 13,341 | 1,280,739 | |
| SodaStream International Ltd. (a) | 19,786 | 1,869,579 | |
| TOTAL ISRAEL | 11,746,657 | ||
| Italy - 1.0% | |||
| Buzzi Unicem SpA | 26,516 | 671,154 | |
| Intesa Sanpaolo SpA | 3,638,757 | 13,841,677 | |
| Prada SpA | 968,391 | 4,913,524 | |
| TOTAL ITALY | 19,426,355 | ||
| Japan - 16.9% | |||
| Bandai Namco Holdings, Inc. | 33,080 | 1,124,151 | |
| Bridgestone Corp. | 234,154 | 9,829,242 | |
| Daikin Industries Ltd. | 102,471 | 12,002,755 | |
| East Japan Railway Co. | 51,381 | 4,930,358 | |
| GMO Internet, Inc. | 24,600 | 453,430 | |
| Hoya Corp. | 343,430 | 18,415,538 | |
| Itochu Corp. | 162,636 | 3,264,027 | |
| Kao Corp. | 112,364 | 8,073,721 | |
| Keyence Corp. | 42,698 | 26,157,017 | |
| Minebea Mitsumi, Inc. | 684,279 | 13,751,930 | |
| Misumi Group, Inc. | 206,026 | 5,710,380 | |
| Mitsubishi UFJ Financial Group, Inc. | 2,650,082 | 17,759,109 | |
| Morinaga & Co. Ltd. | 119,064 | 5,805,078 | |
| Nabtesco Corp. | 72,155 | 2,610,437 | |
| Nidec Corp. | 60,677 | 9,513,390 | |
| Nintendo Co. Ltd. | 4,400 | 1,848,777 | |
| Nissan Chemical Industries Co. Ltd. | 12,700 | 566,342 | |
| Nitori Holdings Co. Ltd. | 90,127 | 15,235,519 | |
| Olympus Corp. | 167,862 | 6,272,560 | |
| ORIX Corp. | 1,636,432 | 28,800,724 | |
| Outsourcing, Inc. | 167,877 | 2,831,734 | |
| PALTAC Corp. | 62,250 | 3,120,472 | |
| Panasonic Corp. | 375,835 | 5,565,045 | |
| Recruit Holdings Co. Ltd. | 568,824 | 13,148,722 | |
| Renesas Electronics Corp. (a)(c) | 911,301 | 9,569,828 | |
| Seria Co. Ltd. | 41,118 | 2,016,031 | |
| Shin-Etsu Chemical Co. Ltd. | 54,253 | 5,461,528 | |
| Shiseido Co. Ltd. | 29,051 | 1,889,963 | |
| SMC Corp. | 22,827 | 8,711,512 | |
| SoftBank Corp. | 162,918 | 12,448,354 | |
| Sohgo Security Services Co., Ltd. | 42,081 | 2,082,494 | |
| Sony Corp. | 254,435 | 11,883,671 | |
| Start Today Co. Ltd. | 130,514 | 3,772,633 | |
| Subaru Corp. | 143,243 | 4,820,627 | |
| Sundrug Co. Ltd. | 65,471 | 3,371,768 | |
| Tsubaki Nakashima Co. Ltd. | 61,610 | 1,457,405 | |
| Tsuruha Holdings, Inc. | 127,209 | 18,304,039 | |
| Welcia Holdings Co. Ltd. | 212,849 | 10,961,762 | |
| TOTAL JAPAN | 313,542,073 | ||
| Korea (South) - 0.3% | |||
| LG Chemical Ltd. | 14,604 | 4,909,251 | |
| Liberia - 0.1% | |||
| Royal Caribbean Cruises Ltd. | 9,100 | 984,529 | |
| Luxembourg - 1.0% | |||
| B&M European Value Retail S.A. | 2,884,928 | 16,097,221 | |
| Eurofins Scientific SA | 278 | 150,332 | |
| Samsonite International SA | 399,040 | 1,799,947 | |
| TOTAL LUXEMBOURG | 18,047,500 | ||
| Netherlands - 5.4% | |||
| ASML Holding NV | 80,335 | 15,139,131 | |
| ING Groep NV (Certificaten Van Aandelen) | 759,164 | 12,792,310 | |
| Koninklijke Philips Electronics NV | 270,592 | 11,453,139 | |
| LyondellBasell Industries NV Class A | 85,539 | 9,044,038 | |
| Philips Lighting NV (b) | 56,919 | 1,734,881 | |
| RELX NV | 555,604 | 11,818,738 | |
| Unilever NV (Certificaten Van Aandelen) (Bearer) | 409,679 | 23,486,319 | |
| Wolters Kluwer NV | 205,648 | 11,133,106 | |
| Yandex NV Series A (a) | 91,751 | 3,060,813 | |
| TOTAL NETHERLANDS | 99,662,475 | ||
| New Zealand - 0.2% | |||
| Ryman Healthcare Group Ltd. | 516,848 | 3,854,735 | |
| Norway - 1.6% | |||
| Schibsted ASA (A Shares) | 138,387 | 4,046,918 | |
| Statoil ASA | 1,016,854 | 26,003,712 | |
| TOTAL NORWAY | 30,050,630 | ||
| Philippines - 0.0% | |||
| Alliance Global Group, Inc. (a) | 15,200 | 3,834 | |
| South Africa - 0.8% | |||
| Capitec Bank Holdings Ltd. | 17,017 | 1,211,509 | |
| Naspers Ltd. Class N | 55,621 | 13,550,364 | |
| TOTAL SOUTH AFRICA | 14,761,873 | ||
| Spain - 2.3% | |||
| Aedas Homes SAU (b) | 49,821 | 1,774,833 | |
| Amadeus IT Holding SA Class A | 220,154 | 16,137,579 | |
| CaixaBank SA | 2,637,840 | 12,827,484 | |
| Masmovil Ibercom SA (a) | 27,084 | 3,911,714 | |
| Neinor Homes SLU (a)(b) | 98,978 | 1,919,585 | |
| Prosegur Cash SA (b) | 2,078,207 | 6,073,336 | |
| TOTAL SPAIN | 42,644,531 | ||
| Sweden - 2.3% | |||
| Alfa Laval AB (c) | 94,051 | 2,338,212 | |
| ASSA ABLOY AB (B Shares) | 498,200 | 10,479,857 | |
| Coor Service Management Holding AB | 404,100 | 2,810,400 | |
| Essity AB Class B | 281,601 | 7,171,352 | |
| HEXPOL AB (B Shares) | 302,188 | 3,140,369 | |
| Indutrade AB | 69,700 | 1,650,835 | |
| Nordea Bank AB | 1,434,927 | 14,646,443 | |
| TOTAL SWEDEN | 42,237,468 | ||
| Switzerland - 4.1% | |||
| Credit Suisse Group AG | 794,819 | 13,405,610 | |
| Julius Baer Group Ltd. | 120,343 | 7,142,161 | |
| Lonza Group AG | 24,782 | 6,106,725 | |
| Roche Holding AG (participation certificate) | 75,241 | 16,717,607 | |
| Sika AG | 1,757 | 12,818,476 | |
| Swatch Group AG (Bearer) | 13,770 | 6,648,784 | |
| TE Connectivity Ltd. | 18,535 | 1,700,586 | |
| UBS Group AG | 683,745 | 11,570,539 | |
| TOTAL SWITZERLAND | 76,110,488 | ||
| Taiwan - 1.2% | |||
| Taiwan Semiconductor Manufacturing Co. Ltd. sponsored ADR | 431,020 | 16,572,719 | |
| Tripod Technology Corp. | 425,000 | 1,283,304 | |
| United Microelectronics Corp. | 8,631,045 | 4,646,239 | |
| TOTAL TAIWAN | 22,502,262 | ||
| Thailand - 0.2% | |||
| Kasikornbank PCL (For. Reg.) | 665,106 | 4,215,487 | |
| United Kingdom - 14.8% | |||
| Admiral Group PLC | 170,111 | 4,667,443 | |
| Aon PLC | 21,460 | 3,057,406 | |
| Ascential PLC | 640,138 | 3,713,705 | |
| Ashtead Group PLC | 132,123 | 3,697,900 | |
| AstraZeneca PLC (United Kingdom) | 186,708 | 13,070,003 | |
| Beazley PLC | 224,300 | 1,826,515 | |
| British American Tobacco PLC sponsored ADR | 477,446 | 26,078,101 | |
| Bunzl PLC | 335,209 | 9,741,890 | |
| Coca-Cola European Partners PLC | 115,891 | 4,542,927 | |
| Compass Group PLC | 449,164 | 9,646,480 | |
| Cranswick PLC | 41,398 | 1,660,765 | |
| DS Smith PLC | 421,035 | 3,028,034 | |
| Essentra PLC | 317,742 | 1,929,090 | |
| Halma PLC | 197,192 | 3,320,130 | |
| Hastings Group Holdings PLC (b) | 1,418,871 | 5,391,273 | |
| Imperial Tobacco Group PLC | 151,024 | 5,415,139 | |
| Indivior PLC (a) | 1,117,884 | 6,973,168 | |
| Informa PLC | 302,081 | 3,073,316 | |
| ITV PLC | 458,900 | 958,076 | |
| John Wood Group PLC | 464,444 | 3,635,629 | |
| Liberty Global PLC Class A (a) | 1,200 | 36,168 | |
| LivaNova PLC (a) | 28,185 | 2,502,264 | |
| Lloyds Banking Group PLC | 14,846,651 | 13,168,204 | |
| London Stock Exchange Group PLC | 201,870 | 11,950,321 | |
| Melrose Industries PLC | 4,510,368 | 14,157,486 | |
| Micro Focus International PLC | 439,579 | 7,579,719 | |
| Prudential PLC | 1,169,632 | 30,075,985 | |
| Reckitt Benckiser Group PLC | 225,914 | 17,722,520 | |
| Spectris PLC | 181,646 | 6,726,938 | |
| St. James's Place Capital PLC | 997,868 | 15,612,838 | |
| Standard Chartered PLC (United Kingdom) | 863,099 | 9,113,712 | |
| Standard Life PLC | 1,674,165 | 8,419,518 | |
| Tesco PLC | 4,039,828 | 13,084,756 | |
| The Weir Group PLC | 307,300 | 9,036,560 | |
| TOTAL UNITED KINGDOM | 274,613,979 | ||
| United States of America - 5.5% | |||
| Alphabet, Inc. Class C (a) | 10,781 | 10,967,835 | |
| Amgen, Inc. | 63,324 | 11,048,772 | |
| Becton, Dickinson & Co. | 12,368 | 2,867,768 | |
| Boston Scientific Corp. (a) | 31,800 | 913,296 | |
| Citigroup, Inc. | 117,392 | 8,014,352 | |
| Coty, Inc. Class A | 502,477 | 8,717,976 | |
| DocuSign, Inc. | 5,300 | 204,739 | |
| DowDuPont, Inc. | 84,607 | 5,350,547 | |
| FleetCor Technologies, Inc. (a) | 7,800 | 1,616,784 | |
| MasterCard, Inc. Class A | 84,190 | 15,008,551 | |
| nLIGHT, Inc. (a) | 2,300 | 57,339 | |
| Oceaneering International, Inc. | 102,591 | 2,179,033 | |
| Quintiles Transnational Holdings, Inc. (a) | 17,284 | 1,655,116 | |
| S&P Global, Inc. | 71,648 | 13,512,813 | |
| Smartsheet, Inc. | 4,300 | 82,990 | |
| Valero Energy Corp. | 52,744 | 5,850,892 | |
| Visa, Inc. Class A | 113,668 | 14,422,196 | |
| TOTAL UNITED STATES OF AMERICA | 102,470,999 | ||
| TOTAL COMMON STOCKS | |||
| (Cost $1,732,710,882) | 1,737,865,619 | ||
| Nonconvertible Preferred Stocks - 0.8% | |||
| Brazil - 0.1% | |||
| Itau Unibanco Holding SA | 138,600 | 2,018,151 | |
| Germany - 0.7% | |||
| Henkel AG & Co. KGaA | 64,505 | 8,210,264 | |
| Jungheinrich AG | 37,751 | 1,597,407 | |
| Sartorius AG (non-vtg.) | 21,716 | 3,351,458 | |
| TOTAL GERMANY | 13,159,129 | ||
| TOTAL NONCONVERTIBLE PREFERRED STOCKS | |||
| (Cost $14,727,842) | 15,177,280 | ||
| Money Market Funds - 6.6% | |||
| Fidelity Cash Central Fund, 1.74% (d) | 93,212,083 | 93,230,725 | |
| Fidelity Securities Lending Cash Central Fund 1.74% (d)(e) | 29,428,505 | 29,431,448 | |
| TOTAL MONEY MARKET FUNDS | |||
| (Cost $122,662,173) | 122,662,173 | ||
| TOTAL INVESTMENT IN SECURITIES - 101.2% | |||
| (Cost $1,870,100,897) | 1,875,705,072 | ||
| NET OTHER ASSETS (LIABILITIES) - (1.2)% | (22,925,832) | ||
| NET ASSETS - 100% | $1,852,779,240 |
Legend
(a) Non-income producing
(b) Security exempt from registration under Rule 144A of the Securities Act of 1933. These securities may be resold in transactions exempt from registration, normally to qualified institutional buyers. At the end of the period, the value of these securities amounted to $42,191,379 or 2.3% of net assets.
(c) Security or a portion of the security is on loan at period end.
(d) Affiliated fund that is generally available only to investment companies and other accounts managed by Fidelity Investments. The rate quoted is the annualized seven-day yield of the fund at period end. A complete unaudited listing of the fund's holdings as of its most recent quarter end is available upon request. In addition, each Fidelity Central Fund's financial statements are available on the SEC's website or upon request.
(e) Investment made with cash collateral received from securities on loan.
Affiliated Central Funds
Information regarding fiscal year to date income earned by the Fund from investments in Fidelity Central Funds is as follows:
| Fund | Income earned |
| Fidelity Cash Central Fund | $328,272 |
| Fidelity Securities Lending Cash Central Fund | 142,970 |
| Total | $471,242 |
Amounts in the income column in the above table include any capital gain distributions from underlying funds, which are presented in the corresponding line-item in the Statement of Operations if applicable.
Investment Valuation
The following is a summary of the inputs used, as of April 30, 2018, involving the Fund's assets and liabilities carried at fair value. The inputs or methodology used for valuing securities may not be an indication of the risk associated with investing in those securities. For more information on valuation inputs, and their aggregation into the levels used below, please refer to the Investment Valuation section in the accompanying Notes to Financial Statements.
| Valuation Inputs at Reporting Date: | ||||
| Description | Total | Level 1 | Level 2 | Level 3 |
| Investments in Securities: | ||||
| Equities: | ||||
| Consumer Discretionary | $196,998,126 | $132,145,349 | $64,852,777 | $-- |
| Consumer Staples | 197,826,334 | 137,417,456 | 60,408,878 | -- |
| Energy | 85,639,733 | 47,863,961 | 37,775,772 | -- |
| Financials | 467,123,480 | 233,250,591 | 233,872,889 | -- |
| Health Care | 180,078,587 | 84,406,719 | 95,671,868 | -- |
| Industrials | 284,921,636 | 252,198,279 | 32,723,357 | -- |
| Information Technology | 220,160,002 | 181,302,087 | 38,857,915 | -- |
| Materials | 97,484,720 | 79,101,167 | 18,383,553 | -- |
| Real Estate | 1,774,833 | 1,774,833 | -- | -- |
| Telecommunication Services | 18,081,514 | 5,633,160 | 12,448,354 | -- |
| Utilities | 2,953,934 | -- | 2,953,934 | -- |
| Money Market Funds | 122,662,173 | 122,662,173 | -- | -- |
| Total Investments in Securities: | $1,875,705,072 | $1,277,755,775 | $597,949,297 | $-- |
The following is a summary of transfers between Level 1 and Level 2 for the period ended April 30, 2018. Transfers are assumed to have occurred at the beginning of the period, and are primarily attributable to the valuation techniques used for foreign equity securities, as discussed in the accompanying Notes to Financial Statements:
| Transfers | Total |
| Level 1 to Level 2 | $23,383,952 |
| Level 2 to Level 1 | $40,539,446 |
See accompanying notes which are an integral part of the financial statements.
Financial Statements
Statement of Assets and Liabilities
| April 30, 2018 (Unaudited) | ||
| Assets | ||
| Investment in securities, at value (including securities loaned of $28,045,753) — See accompanying schedule: Unaffiliated issuers (cost $1,747,438,724) | $1,753,042,899 | |
| Fidelity Central Funds (cost $122,662,173) | 122,662,173 | |
| Total Investment in Securities (cost $1,870,100,897) | $1,875,705,072 | |
| Foreign currency held at value (cost $817,837) | 817,382 | |
| Receivable for investments sold | 5,612,259 | |
| Receivable for fund shares sold | 3,872,420 | |
| Dividends receivable | 6,728,246 | |
| Distributions receivable from Fidelity Central Funds | 171,258 | |
| Other receivables | 53,667 | |
| Total assets | 1,892,960,304 | |
| Liabilities | ||
| Payable for investments purchased | $8,544,637 | |
| Payable for fund shares redeemed | 1,030,597 | |
| Accrued management fee | 894,614 | |
| Other payables and accrued expenses | 280,991 | |
| Collateral on securities loaned | 29,430,225 | |
| Total liabilities | 40,181,064 | |
| Net Assets | $1,852,779,240 | |
| Net Assets consist of: | ||
| Paid in capital | $1,857,271,460 | |
| Undistributed net investment income | 9,862,496 | |
| Accumulated undistributed net realized gain (loss) on investments and foreign currency transactions | (19,572,020) | |
| Net unrealized appreciation (depreciation) on investments and assets and liabilities in foreign currencies | 5,217,304 | |
| Net Assets, for 172,556,760 shares outstanding | $1,852,779,240 | |
| Net Asset Value, offering price and redemption price per share ($1,852,779,240 ÷ 172,556,760 shares) | $10.74 |
See accompanying notes which are an integral part of the financial statements.
Statement of Operations
| Six months ended April 30, 2018 (Unaudited) | ||
| Investment Income | ||
| Dividends | $13,914,544 | |
| Income from Fidelity Central Funds | 471,242 | |
| Total income | 14,385,786 | |
| Expenses | ||
| Management fee | $3,834,162 | |
| Independent trustees' fees and expenses | 1,916 | |
| Interest | 2,103 | |
| Miscellaneous | 308 | |
| Total expenses before reductions | 3,838,489 | |
| Expense reductions | (94,525) | 3,743,964 |
| Net investment income (loss) | 10,641,822 | |
| Realized and Unrealized Gain (Loss) | ||
| Net realized gain (loss) on: | ||
| Investment securities: | ||
| Unaffiliated issuers (net of foreign taxes of $13,786) | (18,339,436) | |
| Fidelity Central Funds | 1,223 | |
| Foreign currency transactions | (179,639) | |
| Total net realized gain (loss) | (18,517,852) | |
| Change in net unrealized appreciation (depreciation) on: | ||
| Investment securities: | ||
| Unaffiliated issuers (net of increase in deferred foreign taxes of $280,720) | (488,201) | |
| Assets and liabilities in foreign currencies | (107,600) | |
| Total change in net unrealized appreciation (depreciation) | (595,801) | |
| Net gain (loss) | (19,113,653) | |
| Net increase (decrease) in net assets resulting from operations | $(8,471,831) |
See accompanying notes which are an integral part of the financial statements.
Statement of Changes in Net Assets
| Six months ended April 30, 2018 (Unaudited) | For the period May 25, 2017 (commencement of operations) to October 31, 2017 | |
| Increase (Decrease) in Net Assets | ||
| Operations | ||
| Net investment income (loss) | $10,641,822 | $305,203 |
| Net realized gain (loss) | (18,517,852) | (717,555) |
| Change in net unrealized appreciation (depreciation) | (595,801) | 5,813,105 |
| Net increase (decrease) in net assets resulting from operations | (8,471,831) | 5,400,753 |
| Distributions to shareholders from net investment income | (1,082,775) | – |
| Distributions to shareholders from net realized gain | (338,367) | – |
| Total distributions | (1,421,142) | – |
| Share transactions | ||
| Proceeds from sales of shares | 1,714,953,099 | 299,172,907 |
| Reinvestment of distributions | 1,421,142 | – |
| Cost of shares redeemed | (149,847,674) | (8,428,014) |
| Net increase (decrease) in net assets resulting from share transactions | 1,566,526,567 | 290,744,893 |
| Total increase (decrease) in net assets | 1,556,633,594 | 296,145,646 |
| Net Assets | ||
| Beginning of period | 296,145,646 | – |
| End of period | $1,852,779,240 | $296,145,646 |
| Other Information | ||
| Undistributed net investment income end of period | $9,862,496 | $303,449 |
| Shares | ||
| Sold | 158,437,301 | 28,621,106 |
| Issued in reinvestment of distributions | 133,315 | – |
| Redeemed | (13,822,702) | (812,260) |
| Net increase (decrease) | 144,747,914 | 27,808,846 |
See accompanying notes which are an integral part of the financial statements.
Financial Highlights
Fidelity Diversified International K6 Fund
| Six months ended (Unaudited) April 30, | Years endedOctober 31, | |
| 2018 | 2017 A | |
| Selected Per–Share Data | ||
| Net asset value, beginning of period | $10.65 | $10.00 |
| Income from Investment Operations | ||
| Net investment income (loss)B | .09 | .03C |
| Net realized and unrealized gain (loss) | .02D | .62 |
| Total from investment operations | .11 | .65 |
| Distributions from net investment income | (.02) | – |
| Distributions from net realized gain | (.01) | – |
| Total distributions | (.02)E | – |
| Net asset value, end of period | $10.74 | $10.65 |
| Total ReturnF,G | 1.04% | 6.50% |
| Ratios to Average Net AssetsH,I | ||
| Expenses before reductions | .60%J | .60%J |
| Expenses net of fee waivers, if any | .60%J | .60%J |
| Expenses net of all reductions | .59%J | .60%J |
| Net investment income (loss) | 1.66%J | .64%C,J |
| Supplemental Data | ||
| Net assets, end of period (000 omitted) | $1,852,779 | $296,146 |
| Portfolio turnover rateK | 55%J,L | 27%L,M |
A For the period May 25, 2017 (commencement of operations) to October 31, 2017.
B Calculated based on average shares outstanding during the period.
C Net Investment income per share reflects a large, non-recurring dividend which amounted to $.01 per share. Excluding this non-recurring dividend, the ratio of net investment income (loss) to average net assets would have been .58%.
D The amount shown for a share outstanding does not correspond with the aggregate net gain (loss) on investments for the period due to the timing of sales and repurchases of shares in relation to fluctuating market values of the investments of the Fund.
E Total distributions of $.02 per share is comprised of distributions from net investment income of $.016 and distributions from net realized gain of $.005 per share.
F Total returns for periods of less than one year are not annualized.
G Total returns would have been lower if certain expenses had not been reduced during the applicable periods shown.
H Fees and expenses of any underlying Fidelity Central Funds are not included in the Fund's expense ratio. The Fund indirectly bears its proportionate share of the expenses of any underlying Fidelity Central Funds.
I Expense ratios reflect operating expenses of the Fund. Expenses before reductions do not reflect amounts reimbursed by the investment adviser or reductions from brokerage service arrangements or reductions from other expense offset arrangements and do not represent the amount paid by the Fund during periods when reimbursements or reductions occur. Expenses net of fee waivers reflect expenses after reimbursement by the investment adviser but prior to reductions from brokerage service arrangements or other expense offset arrangements. Expenses net of all reductions represent the net expenses paid by the Fund.
J Annualized
K Amount does not include the portfolio activity of any underlying Fidelity Central Funds.
L Portfolio turnover rate excludes securities received or delivered in-kind.
M Amount not annualized.
See accompanying notes which are an integral part of the financial statements.
Notes to Financial Statements (Unaudited)
For the period ended April 30, 2018
1. Organization.
Fidelity Diversified International K6 Fund (the Fund) is a fund of Fidelity Investment Trust (the Trust) and is authorized to issue an unlimited number of shares. Share transactions on the Statement of Changes in Net Assets may contain exchanges between affiliated funds. The Trust is registered under the Investment Company Act of 1940, as amended (the 1940 Act), as an open-end management investment company organized as a Massachusetts business trust. Shares generally are available only to employer-sponsored retirement plans that are recordkept by Fidelity, or to certain employer-sponsored retirement plans that are not recordkept by Fidelity. The Fund's investments in emerging markets can be subject to social, economic, regulatory, and political uncertainties and can be extremely volatile.
2. Investments in Fidelity Central Funds.
The Fund invests in Fidelity Central Funds, which are open-end investment companies generally available only to other investment companies and accounts managed by the investment adviser and its affiliates. The Fund's Schedule of Investments lists each of the Fidelity Central Funds held as of period end, if any, as an investment of the Fund, but does not include the underlying holdings of each Fidelity Central Fund. As an Investing Fund, the Fund indirectly bears its proportionate share of the expenses of the underlying Fidelity Central Funds.
The Money Market Central Funds seek preservation of capital and current income and are managed by Fidelity Investments Money Management, Inc. (FIMM), an affiliate of the investment adviser. Annualized expenses of the Money Market Central Funds as of their most recent shareholder report date are less than .005%.
A complete unaudited list of holdings for each Fidelity Central Fund is available upon request or at the Securities and Exchange Commission (the SEC) website at www.sec.gov. In addition, the financial statements of the Fidelity Central Funds are available on the SEC website or upon request.
3. Significant Accounting Policies.
The Fund is an investment company and applies the accounting and reporting guidance of the Financial Accounting Standards Board (FASB) Accounting Standards Codification Topic 946 Financial Services – Investments Companies. The financial statements have been prepared in conformity with accounting principles generally accepted in the United States of America (GAAP), which require management to make certain estimates and assumptions at the date of the financial statements. Actual results could differ from those estimates. Subsequent events, if any, through the date that the financial statements were issued have been evaluated in the preparation of the financial statements. The following summarizes the significant accounting policies of the Fund:
Investment Valuation. Investments are valued as of 4:00 p.m. Eastern time on the last calendar day of the period. The Board of Trustees (the Board) has delegated the day to day responsibility for the valuation of the Fund's investments to the Fair Value Committee (the Committee) established by the Fund's investment adviser. In accordance with valuation policies and procedures approved by the Board, the Fund attempts to obtain prices from one or more third party pricing vendors or brokers to value its investments. When current market prices, quotations or currency exchange rates are not readily available or reliable, investments will be fair valued in good faith by the Committee, in accordance with procedures adopted by the Board. Factors used in determining fair value vary by investment type and may include market or investment specific events. The frequency with which these procedures are used cannot be predicted and they may be utilized to a significant extent. The Committee oversees the Fund's valuation policies and procedures and reports to the Board on the Committee's activities and fair value determinations. The Board monitors the appropriateness of the procedures used in valuing the Fund's investments and ratifies the fair value determinations of the Committee.
The Fund categorizes the inputs to valuation techniques used to value its investments into a disclosure hierarchy consisting of three levels as shown below:
- Level 1 – quoted prices in active markets for identical investments
- Level 2 – other significant observable inputs (including quoted prices for similar investments, interest rates, prepayment speeds, etc.)
- Level 3 – unobservable inputs (including the Fund's own assumptions based on the best information available)
Valuation techniques used to value the Fund's investments by major category are as follows:
Equity securities, including restricted securities, for which market quotations are readily available, are valued at the last reported sale price or official closing price as reported by a third party pricing vendor on the primary market or exchange on which they are traded and are categorized as Level 1 in the hierarchy. In the event there were no sales during the day or closing prices are not available, securities are valued at the last quoted bid price or may be valued using the last available price and are generally categorized as Level 2 in the hierarchy. For foreign equity securities, when market or security specific events arise, comparisons to the valuation of American Depositary Receipts (ADRs), futures contracts, Exchange-Traded Funds (ETFs) and certain indexes as well as quoted prices for similar securities may be used and would be categorized as Level 2 in the hierarchy. Utilizing these techniques may result in transfers between Level 1 and Level 2. For equity securities, including restricted securities, where observable inputs are limited, assumptions about market activity and risk are used and these securities may be categorized as Level 3 in the hierarchy.
ETFs are valued at their last sale price or official closing price as reported by a third party pricing vendor on the primary market or exchange on which they are traded and are categorized as Level 1 in the hierarchy. In the event there were no sales during the day but the exchange reports a closing bid level, ETFs are valued at the closing bid and would be categorized as Level 1 in the hierarchy. In the event there was no closing bid, ETFs may be valued by another method that the Board believes reflects fair value in accordance with the Board's fair value pricing policies and may be categorized as Level 2 in the hierarchy.
Investments in open-end mutual funds, including the Fidelity Central Funds, are valued at their closing net asset value (NAV) each business day and are categorized as Level 1 in the hierarchy.
Changes in valuation techniques may result in transfers in or out of an assigned level within the disclosure hierarchy. The aggregate value of investments by input level as of April 30, 2018, including information on transfers between Levels 1 and 2, is included at the end of the Fund's Schedule of Investments.
Foreign Currency. The Fund may use foreign currency contracts to facilitate transactions in foreign-denominated securities. Gains and losses from these transactions may arise from changes in the value of the foreign currency or if the counterparties do not perform under the contracts' terms.
Foreign-denominated assets, including investment securities, and liabilities are translated into U.S. dollars at the exchange rates at period end. Purchases and sales of investment securities, income and dividends received and expenses denominated in foreign currencies are translated into U.S. dollars at the exchange rate in effect on the transaction date.
The effects of exchange rate fluctuations on investments are included with the net realized and unrealized gain (loss) on investment securities. Other foreign currency transactions resulting in realized and unrealized gain (loss) are disclosed separately.
Investment Transactions and Income. For financial reporting purposes, the Fund's investment holdings and NAV include trades executed through the end of the last business day of the period. The NAV per share for processing shareholder transactions is calculated as of the close of business of the New York Stock Exchange (NYSE), normally 4:00 p.m. Eastern time and includes trades executed through the end of the prior business day. Gains and losses on securities sold are determined on the basis of identified cost. Dividend income is recorded on the ex-dividend date, except for certain dividends from foreign securities where the ex-dividend date may have passed, which are recorded as soon as the Fund is informed of the ex-dividend date. Non-cash dividends included in dividend income, if any, are recorded at the fair market value of the securities received. Income and capital gain distributions from Fidelity Central Funds, if any, are recorded on the ex-dividend date. Certain distributions received by the Fund represent a return of capital or capital gain. The Fund determines the components of these distributions subsequent to the ex-dividend date, based upon receipt of tax filings or other correspondence relating to the underlying investment. These distributions are recorded as a reduction of cost of investments and/or as a realized gain. Investment income is recorded net of foreign taxes withheld where recovery of such taxes is uncertain.
Expenses. Expenses directly attributable to a fund are charged to that fund. Expenses attributable to more than one fund are allocated among the respective funds on the basis of relative net assets or other appropriate methods. Expense estimates are accrued in the period to which they relate and adjustments are made when actual amounts are known.
Income Tax Information and Distributions to Shareholders. Each year, the Fund intends to qualify as a regulated investment company under Subchapter M of the Internal Revenue Code, including distributing substantially all of its taxable income and realized gains. As a result, no provision for U.S. Federal income taxes is required. The Fund files a U.S. federal tax return, in addition to state and local tax returns as required. The Fund's federal income tax returns are subject to examination by the Internal Revenue Service (IRS) for a period of three fiscal years after they are filed. State and local tax returns may be subject to examination for an additional fiscal year depending on the jurisdiction. Foreign taxes are provided for based on the Fund's understanding of the tax rules and rates that exist in the foreign markets in which it invests. The Fund is subject to a tax imposed on capital gains by certain countries in which it invests. An estimated deferred tax liability for net unrealized appreciation on the applicable securities is included in Other payables and accrued expenses on the Statement of Assets & Liabilities.
Distributions are declared and recorded on the ex-dividend date. Income and capital gain distributions are determined in accordance with income tax regulations, which may differ from GAAP.
Capital accounts within the financial statements are adjusted for permanent book-tax differences. These adjustments have no impact on net assets or the results of operations. Capital accounts are not adjusted for temporary book-tax differences which will reverse in a subsequent period.
Book-tax differences are primarily due to foreign currency transactions, passive foreign investment companies (PFIC), capital loss carryforwards and losses deferred due to wash sales.
As of period end, the cost and unrealized appreciation (depreciation) in securities, and derivatives if applicable, for federal income tax purposes were as follows:
| Gross unrealized appreciation | $72,910,873 |
| Gross unrealized depreciation | (68,739,877) |
| Net unrealized appreciation (depreciation) | $4,170,996 |
| Tax cost | $1,871,534,076 |
Capital loss carryforwards are only available to offset future capital gains of the Fund to the extent provided by regulations and may be limited. Under the Regulated Investment Company Modernization Act of 2010 (the Act), the Fund is permitted to carry forward capital losses incurred in taxable years beginning after December 22, 2010 for an unlimited period and such capital losses are required to be used prior to any losses that expire. The capital loss carryforward information presented below, including any applicable limitation, is estimated as of prior fiscal period end and is subject to adjustment.
| No expiration | |
| Short-term | $(545,142) |
| Total capital loss carryforward | $(545,142) |
Restricted Securities. The Fund may invest in securities that are subject to legal or contractual restrictions on resale. These securities generally may be resold in transactions exempt from registration or to the public if the securities are registered. Disposal of these securities may involve time-consuming negotiations and expense, and prompt sale at an acceptable price may be difficult. Information regarding restricted securities is included at the end of the Fund's Schedule of Investments.
4. Purchases and Sales of Investments.
Purchases and sales of securities, other than short-term securities and in-kind transactions, aggregated $524,187,517 and $329,040,045, respectively.
Exchanges In-Kind. Investments and cash received in-kind through subscriptions totaled $1,324,963,689 in exchange for 122,380,109 shares of the Fund. The amount of in-kind exchanges is included in share transactions in the accompanying Statement of Changes in Net Assets. The Fund recognized no gain or loss for federal income tax purposes.
5. Fees and Other Transactions with Affiliates.
Management Fee. Fidelity Management & Research Company (the investment adviser) and its affiliates provide the Fund with investment management related services for which the Fund pays a monthly management fee that is based on an annual rate of .60% of average net assets. Under the management contract, the investment adviser or an affiliate pays all other expenses of the Fund, excluding fees and expenses of the independent Trustees, and certain miscellaneous expenses such as proxy and shareholder meeting expenses.
Brokerage Commissions. The Fund placed a portion of its portfolio transactions with brokerage firms which are affiliates of the investment adviser. Brokerage commissions are included in net realized gain (loss) and change in net unrealized appreciation (depreciation) in the Statement of Operations. The commissions paid to these affiliated firms were $2,237 for the period.
Interfund Lending Program. Pursuant to an Exemptive Order issued by the SEC, the Fund, along with other registered investment companies having management contracts with Fidelity Management & Research Company (FMR) or other affiliated entities of FMR, may participate in an interfund lending program. This program provides an alternative credit facility allowing the funds to borrow from, or lend money to, other participating affiliated funds. The Fund's activity in this program during the period for which loans were outstanding was as follows:
| Borrower or Lender | Average Loan Balance | Weighted Average Interest Rate | Interest Expense |
| Borrower | $11,508,000 | 1.65% | $2,103 |
Interfund Trades. The Funds may purchase from or sell securities to other Fidelity Funds under procedures adopted by the Board. The procedures have been designed to ensure these interfund trades are executed in accordance with Rule 17a-7 of the 1940 Act. Interfund trades are included within the respective purchases and sales amounts shown in the Purchases and Sales of Investments note.
Prior Fiscal Year Exchanges In-Kind. During the prior period, an affiliated entity completed an exchange in-kind with the Fund. The affiliated entity delivered investments and cash, including accrued interest, valued at $252,875,067 in exchange for 24,179,719 shares of the Fund. The amount of in-kind exchanges is included in share transactions in the accompanying Statement of Changes in Net Assets. The Fund recognized no gain or loss for federal income tax purposes.
6. Committed Line of Credit.
The Fund participates with other funds managed by the investment adviser or an affiliate in a $4.25 billion credit facility (the "line of credit") to be utilized for temporary or emergency purposes to fund shareholder redemptions or for other short-term liquidity purposes. The Fund has agreed to pay commitment fees on its pro-rata portion of the line of credit, which amounted to $308 and is reflected in Miscellaneous expenses on the Statement of Operations. During the period, the Fund did not borrow on this line of credit.
7. Security Lending.
The Fund lends portfolio securities through a lending agent from time to time in order to earn additional income. For equity securities, a lending agent is used and may loan securities to certain qualified borrowers, including Fidelity Capital Markets (FCM), a broker-dealer affiliated with the Fund. On the settlement date of the loan, the Fund receives collateral (in the form of U.S. Treasury obligations, letters of credit and/or cash) against the loaned securities and maintains collateral in an amount not less than 100% of the market value of the loaned securities during the period of the loan. The market value of the loaned securities is determined at the close of business of the Fund and any additional required collateral is delivered to the Fund on the next business day. The Fund or borrower may terminate the loan at any time, and if the borrower defaults on its obligation to return the securities loaned because of insolvency or other reasons, the Fund may apply collateral received from the borrower against the obligation. The Fund may experience delays and costs in recovering the securities loaned. Any cash collateral received is invested in the Fidelity Securities Lending Cash Central Fund. The value of loaned securities and cash collateral at period end are disclosed on the Fund's Statement of Assets and Liabilities. Security lending income represents the income earned on investing cash collateral, less rebates paid to borrowers and any lending agent fees associated with the loan, plus any premium payments received for lending certain types of securities. Security lending income is presented in the Statement of Operations as a component of income from Fidelity Central Funds. Total security lending income during the period amounted to $142,970. During the period, there were no securities loaned to FCM.
8. Expense Reductions.
Commissions paid to certain brokers with whom the investment adviser, or its affiliates, places trades on behalf of the Fund include an amount in addition to trade execution, which may be rebated back to the Fund to offset certain expenses. This amount totaled $94,488 for the period. In addition, through arrangements with the Fund's custodian, credits realized as a result of certain uninvested cash balances were used to reduce the Fund's expenses. During the period, these credits reduced the Fund's management expenses by $37.
9. Other.
The Fund's organizational documents provide former and current trustees and officers with a limited indemnification against liabilities arising in connection with the performance of their duties to the Fund. In the normal course of business, the Fund may also enter into contracts that provide general indemnifications. The Fund's maximum exposure under these arrangements is unknown as this would be dependent on future claims that may be made against the Fund. The risk of material loss from such claims is considered remote.
Shareholder Expense Example
As a shareholder of the Fund, you incur two types of costs: (1) transaction costs and (2) ongoing costs, including management fees and other Fund expenses. This Example is intended to help you understand your ongoing costs (in dollars) of investing in the Fund and to compare these costs with the ongoing costs of investing in other mutual funds.
The Example is based on an investment of $1,000 invested at the beginning of the period and held for the entire period (November 1, 2017 to April 30, 2018).
Actual Expenses
The first line of the accompanying table provides information about actual account values and actual expenses. You may use the information in this line, together with the amount you invested, to estimate the expenses that you paid over the period. Simply divide your account value by $1,000.00 (for example, an $8,600 account value divided by $1,000.00 = 8.6), then multiply the result by the number in the first line under the heading entitled "Expenses Paid During Period" to estimate the expenses you paid on your account during this period. In addition, the Fund, as a shareholder in the underlying Fidelity Central Funds, will indirectly bear its pro-rata share of the fees and expenses incurred by the underlying Fidelity Central Funds. These fees and expenses are not included in the Fund's annualized expense ratio used to calculate the expense estimate in the table below.
Hypothetical Example for Comparison Purposes
The second line of the accompanying table provides information about hypothetical account values and hypothetical expenses based on the Fund's actual expense ratio and an assumed rate of return of 5% per year before expenses, which is not the Fund's actual return. The hypothetical account values and expenses may not be used to estimate the actual ending account balance or expenses you paid for the period. You may use this information to compare the ongoing costs of investing in the Fund and other funds. To do so, compare this 5% hypothetical example with the 5% hypothetical examples that appear in the shareholder reports of the other funds. In addition, the Fund, as a shareholder in the underlying Fidelity Central Funds, will indirectly bear its pro-rata share of the fees and expenses incurred by the underlying Fidelity Central Funds. These fees and expenses are not included in the Fund's annualized expense ratio used to calculate the expense estimate in the table below.
Please note that the expenses shown in the table are meant to highlight your ongoing costs only and do not reflect any transaction costs. Therefore, the second line of the table is useful in comparing ongoing costs only, and will not help you determine the relative total costs of owning different funds.
| Annualized Expense Ratio-A | Beginning Account Value November 1, 2017 | Ending Account Value April 30, 2018 | Expenses Paid During Period-B November 1, 2017 to April 30, 2018 | |
| Actual | .60% | $1,000.00 | $1,010.40 | $2.99 |
| Hypothetical-C | $1,000.00 | $1,021.82 | $3.01 |
A Annualized expense ratio reflects expenses net of applicable fee waivers.
B Expenses are equal to the Fund's annualized expense ratio, multiplied by the average account value over the period, multiplied by 181/365 (to reflect the one-half year period).
C 5% return per year before expenses
![]()
DIFK6-SANN-0618
1.9883986.100
Fidelity® International Capital Appreciation K6 Fund Semi-Annual Report April 30, 2018 |
|
Contents
To view a fund's proxy voting guidelines and proxy voting record for the 12-month period ended June 30, visit http://www.fidelity.com/proxyvotingresults or visit the Securities and Exchange Commission's (SEC) web site at http://www.sec.gov.
You may also call 1-800-835-5092 to request a free copy of the proxy voting guidelines.
Standard & Poor's, S&P and S&P 500 are registered service marks of The McGraw-Hill Companies, Inc. and have been licensed for use by Fidelity Distributors Corporation.
Other third-party marks appearing herein are the property of their respective owners.
All other marks appearing herein are registered or unregistered trademarks or service marks of FMR LLC or an affiliated company. © 2018 FMR LLC. All rights reserved.
This report and the financial statements contained herein are submitted for the general information of the shareholders of the Fund. This report is not authorized for distribution to prospective investors in the Fund unless preceded or accompanied by an effective prospectus.
A fund files its complete schedule of portfolio holdings with the SEC for the first and third quarters of each fiscal year on Form N-Q. Forms N-Q are available on the SEC’s web site at http://www.sec.gov. A fund's Forms N-Q may be reviewed and copied at the SEC’s Public Reference Room in Washington, DC. Information regarding the operation of the SEC's Public Reference Room may be obtained by calling 1-800-SEC-0330.
For a complete list of a fund's portfolio holdings, view the most recent holdings listing, semiannual report, or annual report on Fidelity's web site at http://www.fidelity.com, http://www.institutional.fidelity.com, or http://www.401k.com, as applicable.
NOT FDIC INSURED •MAY LOSE VALUE •NO BANK GUARANTEE
Neither the Fund nor Fidelity Distributors Corporation is a bank.
Investment Summary (Unaudited)
Geographic Diversification (% of fund's net assets)
| As of April 30, 2018 | ||
| United States of America* | 16.1% | |
| France | 8.7% | |
| United Kingdom | 8.0% | |
| Japan | 7.6% | |
| Germany | 6.3% | |
| Cayman Islands | 6.1% | |
| India | 4.7% | |
| Netherlands | 4.4% | |
| China | 4.4% | |
| Other | 33.7% | |
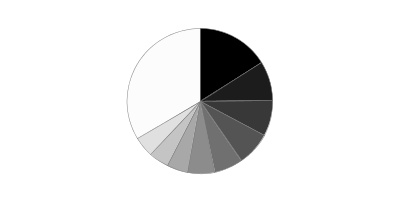
* Includes Short-Term investments and Net Other Assets (Liabilities).
Percentages are based on country or territory of incorporation and are adjusted for the effect of futures contracts, if applicable.
Asset Allocation as of April 30, 2018
| % of fund's net assets | |
| Stocks | 98.6 |
| Short-Term Investments and Net Other Assets (Liabilities) | 1.4 |
Top Ten Stocks as of April 30, 2018
| % of fund's net assets | |
| Tencent Holdings Ltd. (Cayman Islands, Internet Software & Services) | 1.8 |
| Alibaba Group Holding Ltd. sponsored ADR (Cayman Islands, Internet Software & Services) | 1.5 |
| Taiwan Semiconductor Manufacturing Co. Ltd. sponsored ADR (Taiwan, Semiconductors & Semiconductor Equipment) | 1.4 |
| AIA Group Ltd. (Hong Kong, Insurance) | 1.0 |
| Naspers Ltd. Class N (South Africa, Media) | 1.0 |
| LVMH Moet Hennessy - Louis Vuitton SA (France, Textiles, Apparel & Luxury Goods) | 1.0 |
| Allianz SE (Germany, Insurance) | 1.0 |
| Prudential PLC (United Kingdom, Insurance) | 0.8 |
| ASML Holding NV (Netherlands) (Netherlands, Semiconductors & Semiconductor Equipment) | 0.8 |
| Keyence Corp. (Japan, Electronic Equipment & Components) | 0.8 |
| 11.1 |
Top Market Sectors as of April 30, 2018
| % of fund's net assets | |
| Financials | 21.1 |
| Industrials | 20.0 |
| Information Technology | 19.9 |
| Consumer Discretionary | 15.5 |
| Materials | 6.5 |
| Consumer Staples | 6.5 |
| Health Care | 4.0 |
| Real Estate | 2.8 |
| Utilities | 1.0 |
| Energy | 0.7 |
Schedule of Investments April 30, 2018 (Unaudited)
Showing Percentage of Net Assets
| Common Stocks - 97.4% | |||
| Shares | Value | ||
| Argentina - 0.5% | |||
| Banco Macro SA sponsored ADR | 13,633 | $1,321,310 | |
| Australia - 2.9% | |||
| Amcor Ltd. | 131,932 | 1,359,556 | |
| Aristocrat Leisure Ltd. | 81,021 | 1,625,328 | |
| Challenger Ltd. | 164,917 | 1,333,349 | |
| CSL Ltd. | 16,149 | 2,068,510 | |
| realestate.com.au Ltd. | 22,656 | 1,371,634 | |
| TOTAL AUSTRALIA | 7,758,377 | ||
| Bailiwick of Jersey - 0.6% | |||
| Wolseley PLC | 20,768 | 1,595,395 | |
| Belgium - 1.7% | |||
| Ageas | 25,500 | 1,368,784 | |
| KBC Groep NV | 17,575 | 1,536,586 | |
| Umicore SA | 26,873 | 1,501,222 | |
| TOTAL BELGIUM | 4,406,592 | ||
| Bermuda - 1.0% | |||
| Credicorp Ltd. (United States) | 6,087 | 1,415,167 | |
| Hiscox Ltd. | 64,162 | 1,315,261 | |
| TOTAL BERMUDA | 2,730,428 | ||
| Brazil - 1.6% | |||
| BM&F BOVESPA SA | 206,700 | 1,492,781 | |
| CVC Brasil Operadora e Agencia de Viagens SA | 75,100 | 1,243,163 | |
| Equatorial Energia SA | 69,200 | 1,405,452 | |
| Itausa-Investimentos Itau SA | 6,845 | 26,378 | |
| TOTAL BRAZIL | 4,167,774 | ||
| Canada - 3.6% | |||
| Brookfield Asset Management, Inc. Class A | 42,386 | 1,679,990 | |
| Canadian National Railway Co. | 26,629 | 2,056,776 | |
| Canadian Pacific Railway Ltd. | 8,856 | 1,615,938 | |
| CCL Industries, Inc. Class B | 28,565 | 1,385,590 | |
| Constellation Software, Inc. | 2,124 | 1,518,008 | |
| Waste Connection, Inc. (Canada) | 18,243 | 1,318,549 | |
| TOTAL CANADA | 9,574,851 | ||
| Cayman Islands - 6.1% | |||
| Alibaba Group Holding Ltd. sponsored ADR (a) | 21,646 | 3,864,677 | |
| JD.com, Inc. sponsored ADR (a) | 44,583 | 1,627,725 | |
| Melco Crown Entertainment Ltd. sponsored ADR | 44,617 | 1,392,497 | |
| New Oriental Education & Technology Group, Inc. sponsored ADR | 15,983 | 1,435,913 | |
| Sands China Ltd. | 276,400 | 1,597,421 | |
| Shenzhou International Group Holdings Ltd. | 138,000 | 1,506,441 | |
| Tencent Holdings Ltd. | 97,000 | 4,768,799 | |
| TOTAL CAYMAN ISLANDS | 16,193,473 | ||
| Chile - 0.5% | |||
| Banco Santander Chile sponsored ADR | 39,185 | 1,294,281 | |
| China - 4.4% | |||
| China International Travel Service Corp. Ltd. (A Shares) | 164,085 | 1,341,431 | |
| Hangzhou Hikvision Digital Technology Co. Ltd. Class A | 211,791 | 1,282,793 | |
| Inner Mongoli Yili Industries Co. Ltd. (A Shares) | 334,615 | 1,385,448 | |
| Jiangsu Yanghe Brewery Joint-Stock Co. Ltd. Class A | 81,100 | 1,429,011 | |
| Kweichow Moutai Co. Ltd. (A Shares) | 12,933 | 1,346,701 | |
| Midea Group Co. Ltd. Class A | 168,300 | 1,368,372 | |
| Ping An Insurance (Group) Co. of China Ltd. (H Shares) | 203,000 | 1,983,594 | |
| Shanghai International Airport Co. Ltd. (A Shares) | 173,933 | 1,366,095 | |
| TOTAL CHINA | 11,503,445 | ||
| Denmark - 0.6% | |||
| DSV de Sammensluttede Vognmaend A/S | 19,500 | 1,549,646 | |
| Finland - 0.6% | |||
| Sampo Oyj (A Shares) | 29,600 | 1,599,587 | |
| France - 8.7% | |||
| Aeroports de Paris | 6,158 | 1,356,400 | |
| Capgemini SA | 11,700 | 1,610,697 | |
| Dassault Systemes SA | 10,966 | 1,420,263 | |
| Eiffage SA | 12,754 | 1,520,151 | |
| Kering SA | 3,221 | 1,865,490 | |
| Legrand SA | 20,134 | 1,568,241 | |
| LVMH Moet Hennessy - Louis Vuitton SA | 7,418 | 2,581,554 | |
| Orpea | 10,878 | 1,397,043 | |
| Pernod Ricard SA | 10,515 | 1,746,598 | |
| Rubis | 17,563 | 1,367,986 | |
| Safran SA | 14,000 | 1,642,062 | |
| SR Teleperformance SA | 9,101 | 1,460,620 | |
| Thales SA | 11,467 | 1,453,993 | |
| VINCI SA (b) | 19,372 | 1,936,884 | |
| TOTAL FRANCE | 22,927,982 | ||
| Germany - 6.3% | |||
| adidas AG | 7,258 | 1,787,135 | |
| Allianz SE | 10,716 | 2,534,590 | |
| CTS Eventim AG | 27,628 | 1,295,841 | |
| Deutsche Borse AG | 12,100 | 1,627,318 | |
| Deutsche Wohnen AG (Bearer) | 33,443 | 1,580,699 | |
| Hannover Reuck SE | 9,700 | 1,365,820 | |
| Infineon Technologies AG | 63,100 | 1,615,721 | |
| Symrise AG | 18,508 | 1,499,703 | |
| Vonovia SE | 32,700 | 1,643,117 | |
| Wirecard AG | 11,761 | 1,606,312 | |
| TOTAL GERMANY | 16,556,256 | ||
| Hong Kong - 2.2% | |||
| AIA Group Ltd. | 300,400 | 2,684,735 | |
| Galaxy Entertainment Group Ltd. | 181,000 | 1,584,226 | |
| Techtronic Industries Co. Ltd. | 251,500 | 1,473,335 | |
| TOTAL HONG KONG | 5,742,296 | ||
| India - 4.7% | |||
| Adani Ports & Special Economic Zone Ltd. | 232,449 | 1,421,911 | |
| Eicher Motors Ltd. | 3,193 | 1,491,854 | |
| HDFC Bank Ltd. | 9,052 | 272,826 | |
| HDFC Bank Ltd. sponsored ADR | 10,810 | 1,035,706 | |
| Housing Development Finance Corp. Ltd. | 66,651 | 1,885,758 | |
| IndusInd Bank Ltd. | 48,246 | 1,372,401 | |
| Kotak Mahindra Bank Ltd. (a) | 79,093 | 1,438,219 | |
| Maruti Suzuki India Ltd. | 11,097 | 1,467,056 | |
| Reliance Industries Ltd. | 131,474 | 1,898,274 | |
| TOTAL INDIA | 12,284,005 | ||
| Indonesia - 1.1% | |||
| PT Bank Central Asia Tbk | 995,300 | 1,573,851 | |
| PT Bank Rakyat Indonesia Tbk | 6,065,100 | 1,398,421 | |
| TOTAL INDONESIA | 2,972,272 | ||
| Ireland - 2.2% | |||
| Accenture PLC Class A | 9,025 | 1,364,580 | |
| DCC PLC (United Kingdom) | 15,688 | 1,511,837 | |
| Kerry Group PLC Class A | 15,400 | 1,571,450 | |
| Kingspan Group PLC (Ireland) | 31,100 | 1,408,364 | |
| TOTAL IRELAND | 5,856,231 | ||
| Israel - 0.5% | |||
| Frutarom Industries Ltd. | 14,080 | 1,351,683 | |
| Italy - 0.5% | |||
| Pirelli & C. S.p.A. (c) | 152,800 | 1,329,291 | |
| Japan - 7.6% | |||
| Daikin Industries Ltd. | 15,226 | 1,783,470 | |
| Kansai Paint Co. Ltd. | 54,600 | 1,230,648 | |
| Kao Corp. | 24,718 | 1,776,069 | |
| Keyence Corp. | 3,432 | 2,102,461 | |
| Makita Corp. | 32,900 | 1,480,681 | |
| Misumi Group, Inc. | 51,000 | 1,413,557 | |
| Nidec Corp. | 11,200 | 1,756,019 | |
| Nissan Chemical Industries Co. Ltd. | 31,200 | 1,391,328 | |
| Nitori Holdings Co. Ltd. | 8,200 | 1,386,169 | |
| Recruit Holdings Co. Ltd. | 66,912 | 1,546,713 | |
| Relo Group, Inc. | 55,230 | 1,245,858 | |
| Sundrug Co. Ltd. | 29,400 | 1,514,105 | |
| Tsuruha Holdings, Inc. | 9,205 | 1,324,503 | |
| TOTAL JAPAN | 19,951,581 | ||
| Kenya - 0.5% | |||
| Safaricom Ltd. | 4,674,000 | 1,316,456 | |
| Korea (South) - 1.2% | |||
| LG Chemical Ltd. | 4,628 | 1,555,739 | |
| LG Household & Health Care Ltd. | 1,312 | 1,678,400 | |
| TOTAL KOREA (SOUTH) | 3,234,139 | ||
| Luxembourg - 0.6% | |||
| Eurofins Scientific SA | 2,689 | 1,454,112 | |
| Mexico - 0.5% | |||
| Grupo Aeroportuario del Sureste S.A.B. de CV Series B | 78,835 | 1,417,736 | |
| Netherlands - 4.4% | |||
| ASML Holding NV (Netherlands) | 11,300 | 2,149,226 | |
| Ferrari NV | 12,400 | 1,528,121 | |
| Heineken NV (Bearer) | 16,300 | 1,718,403 | |
| Interxion Holding N.V. (a) | 21,367 | 1,389,282 | |
| RELX NV | 89,057 | 1,894,409 | |
| Wolters Kluwer NV | 28,300 | 1,532,069 | |
| Yandex NV Series A (a) | 39,100 | 1,304,376 | |
| TOTAL NETHERLANDS | 11,515,886 | ||
| Philippines - 1.6% | |||
| Ayala Land, Inc. | 1,818,600 | 1,431,225 | |
| SM Investments Corp. | 78,475 | 1,421,235 | |
| SM Prime Holdings, Inc. | 2,108,100 | 1,391,378 | |
| TOTAL PHILIPPINES | 4,243,838 | ||
| South Africa - 2.6% | |||
| Capitec Bank Holdings Ltd. | 19,103 | 1,360,019 | |
| FirstRand Ltd. | 277,000 | 1,483,481 | |
| Naspers Ltd. Class N | 10,841 | 2,641,080 | |
| Sanlam Ltd. | 210,100 | 1,327,206 | |
| TOTAL SOUTH AFRICA | 6,811,786 | ||
| Spain - 0.6% | |||
| Amadeus IT Holding SA Class A | 22,624 | 1,658,369 | |
| Sweden - 0.5% | |||
| Hexagon AB (B Shares) | 24,559 | 1,424,743 | |
| Switzerland - 2.9% | |||
| Givaudan SA | 672 | 1,504,710 | |
| Julius Baer Group Ltd. | 24,390 | 1,447,507 | |
| Lonza Group AG | 6,558 | 1,616,008 | |
| Partners Group Holding AG | 2,010 | 1,473,527 | |
| Sika AG | 206 | 1,502,906 | |
| TOTAL SWITZERLAND | 7,544,658 | ||
| Taiwan - 1.4% | |||
| Taiwan Semiconductor Manufacturing Co. Ltd. sponsored ADR | 95,625 | 3,676,781 | |
| United Kingdom - 8.0% | |||
| Ashtead Group PLC | 51,800 | 1,449,795 | |
| Beazley PLC | 157,600 | 1,283,365 | |
| Bunzl PLC | 48,089 | 1,397,569 | |
| Compass Group PLC | 81,579 | 1,752,033 | |
| Croda International PLC | 22,700 | 1,394,111 | |
| Halma PLC | 82,505 | 1,389,140 | |
| Hargreaves Lansdown PLC | 59,200 | 1,458,454 | |
| InterContinental Hotel Group PLC | 24,296 | 1,534,943 | |
| Intertek Group PLC | 22,321 | 1,506,044 | |
| London Stock Exchange Group PLC | 26,847 | 1,589,291 | |
| Prudential PLC | 85,758 | 2,205,186 | |
| Rentokil Initial PLC | 337,890 | 1,428,082 | |
| Rightmove PLC | 20,599 | 1,294,572 | |
| St. James's Place Capital PLC | 90,754 | 1,419,955 | |
| TOTAL UNITED KINGDOM | 21,102,540 | ||
| United States of America - 14.7% | |||
| A.O. Smith Corp. | 21,357 | 1,310,252 | |
| Adobe Systems, Inc. (a) | 5,851 | 1,296,582 | |
| Alphabet, Inc. Class A (a) | 1,311 | 1,335,358 | |
| Amazon.com, Inc. (a) | 800 | 1,252,904 | |
| Amphenol Corp. Class A | 15,688 | 1,313,242 | |
| Cintas Corp. | 7,544 | 1,284,743 | |
| Constellation Brands, Inc. Class A (sub. vtg.) | 6,019 | 1,403,209 | |
| Danaher Corp. | 13,270 | 1,331,246 | |
| Facebook, Inc. Class A (a) | 7,473 | 1,285,356 | |
| Fiserv, Inc. (a) | 18,621 | 1,319,484 | |
| Global Payments, Inc. | 11,896 | 1,344,843 | |
| HEICO Corp. Class A | 17,808 | 1,284,847 | |
| Hilton Worldwide Holdings, Inc. | 16,994 | 1,339,807 | |
| Intuit, Inc. | 7,439 | 1,374,653 | |
| Marriott International, Inc. Class A | 10,084 | 1,378,281 | |
| MasterCard, Inc. Class A | 7,480 | 1,333,460 | |
| Mettler-Toledo International, Inc. (a) | 2,357 | 1,319,755 | |
| Microsoft Corp. | 14,200 | 1,327,984 | |
| Moody's Corp. | 8,019 | 1,300,682 | |
| MSCI, Inc. | 8,759 | 1,312,361 | |
| Northrop Grumman Corp. | 4,152 | 1,337,110 | |
| NVIDIA Corp. | 6,200 | 1,394,380 | |
| PayPal Holdings, Inc. (a) | 18,100 | 1,350,441 | |
| S&P Global, Inc. | 7,138 | 1,346,227 | |
| Sherwin-Williams Co. | 3,510 | 1,290,487 | |
| The Booking Holdings, Inc. (a) | 636 | 1,385,208 | |
| TransDigm Group, Inc. | 4,342 | 1,391,915 | |
| UnitedHealth Group, Inc. | 5,602 | 1,324,313 | |
| Visa, Inc. Class A | 10,927 | 1,386,418 | |
| TOTAL UNITED STATES OF AMERICA | 38,655,548 | ||
| TOTAL COMMON STOCKS | |||
| (Cost $242,050,977) | 256,723,348 | ||
| Nonconvertible Preferred Stocks - 1.2% | |||
| Brazil - 1.2% | |||
| Itau Unibanco Holding SA sponsored ADR | 124,892 | 1,814,681 | |
| Itausa-Investimentos Itau SA (PN) | 376,700 | 1,463,487 | |
| TOTAL NONCONVERTIBLE PREFERRED STOCKS | |||
| (Cost $3,050,259) | 3,278,168 | ||
| Money Market Funds - 1.5% | |||
| Fidelity Cash Central Fund, 1.74% (d) | 1,955,070 | 1,955,461 | |
| Fidelity Securities Lending Cash Central Fund 1.74% (d)(e) | 1,893,562 | 1,893,751 | |
| TOTAL MONEY MARKET FUNDS | |||
| (Cost $3,849,212) | 3,849,212 | ||
| TOTAL INVESTMENT IN SECURITIES - 100.1% | |||
| (Cost $248,950,448) | 263,850,728 | ||
| NET OTHER ASSETS (LIABILITIES) - (0.1)% | (140,549) | ||
| NET ASSETS - 100% | $263,710,179 |
Categorizations in the Schedule of Investments are based on country or territory of incorporation.
Legend
(a) Non-income producing
(b) Security or a portion of the security is on loan at period end.
(c) Security exempt from registration under Rule 144A of the Securities Act of 1933. These securities may be resold in transactions exempt from registration, normally to qualified institutional buyers. At the end of the period, the value of these securities amounted to $1,329,291 or 0.5% of net assets.
(d) Affiliated fund that is generally available only to investment companies and other accounts managed by Fidelity Investments. The rate quoted is the annualized seven-day yield of the fund at period end. A complete unaudited listing of the fund's holdings as of its most recent quarter end is available upon request. In addition, each Fidelity Central Fund's financial statements are available on the SEC's website or upon request.
(e) Investment made with cash collateral received from securities on loan.
Affiliated Central Funds
Information regarding fiscal year to date income earned by the Fund from investments in Fidelity Central Funds is as follows:
| Fund | Income earned |
| Fidelity Cash Central Fund | $22,036 |
| Fidelity Securities Lending Cash Central Fund | 9,157 |
| Total | $31,193 |
Amounts in the income column in the above table include any capital gain distributions from underlying funds, which are presented in the corresponding line-item in the Statement of Operations if applicable.
Investment Valuation
The following is a summary of the inputs used, as of April 30, 2018, involving the Fund's assets and liabilities carried at fair value. The inputs or methodology used for valuing securities may not be an indication of the risk associated with investing in those securities. For more information on valuation inputs, and their aggregation into the levels used below, please refer to the Investment Valuation section in the accompanying Notes to Financial Statements.
| Valuation Inputs at Reporting Date: | ||||
| Description | Total | Level 1 | Level 2 | Level 3 |
| Investments in Securities: | ||||
| Equities: | ||||
| Consumer Discretionary | $40,720,765 | $23,534,521 | $17,186,244 | $-- |
| Consumer Staples | 16,893,897 | 12,732,737 | 4,161,160 | -- |
| Energy | 1,898,274 | -- | 1,898,274 | -- |
| Financials | 55,842,142 | 29,913,681 | 25,928,461 | -- |
| Health Care | 10,510,987 | 8,442,477 | 2,068,510 | -- |
| Industrials | 52,910,962 | 43,630,921 | 9,280,041 | -- |
| Information Technology | 52,874,635 | 43,835,688 | 9,038,947 | -- |
| Materials | 16,967,683 | 15,608,127 | 1,359,556 | -- |
| Real Estate | 7,292,277 | 4,469,674 | 2,822,603 | -- |
| Telecommunication Services | 1,316,456 | 1,316,456 | -- | -- |
| Utilities | 2,773,438 | 2,773,438 | -- | -- |
| Money Market Funds | 3,849,212 | 3,849,212 | -- | -- |
| Total Investments in Securities: | $263,850,728 | $190,106,932 | $73,743,796 | $-- |
The following is a summary of transfers between Level 1 and Level 2 for the period ended April 30, 2018. Transfers are assumed to have occurred at the beginning of the period, and are primarily attributable to the valuation techniques used for foreign equity securities, as discussed in the accompanying Notes to Financial Statements:
| Transfers | Total |
| Level 1 to Level 2 | $15,479,790 |
| Level 2 to Level 1 | $14,743,626 |
See accompanying notes which are an integral part of the financial statements.
Financial Statements
Statement of Assets and Liabilities
| April 30, 2018 (Unaudited) | ||
| Assets | ||
| Investment in securities, at value (including securities loaned of $1,807,225) — See accompanying schedule: Unaffiliated issuers (cost $245,101,236) | $260,001,516 | |
| Fidelity Central Funds (cost $3,849,212) | 3,849,212 | |
| Total Investment in Securities (cost $248,950,448) | $263,850,728 | |
| Foreign currency held at value (cost $73,791) | 74,202 | |
| Receivable for investments sold | 4,945,411 | |
| Receivable for fund shares sold | 1,641,799 | |
| Dividends receivable | 623,274 | |
| Distributions receivable from Fidelity Central Funds | 9,633 | |
| Other receivables | 28,338 | |
| Total assets | 271,173,385 | |
| Liabilities | ||
| Payable for investments purchased | $4,992,096 | |
| Payable for fund shares redeemed | 348,924 | |
| Accrued management fee | 135,590 | |
| Other payables and accrued expenses | 92,996 | |
| Collateral on securities loaned | 1,893,600 | |
| Total liabilities | 7,463,206 | |
| Net Assets | $263,710,179 | |
| Net Assets consist of: | ||
| Paid in capital | $249,945,452 | |
| Undistributed net investment income | 775,236 | |
| Accumulated undistributed net realized gain (loss) on investments and foreign currency transactions | (1,809,829) | |
| Net unrealized appreciation (depreciation) on investments and assets and liabilities in foreign currencies | 14,799,320 | |
| Net Assets, for 23,400,934 shares outstanding | $263,710,179 | |
| Net Asset Value, offering price and redemption price per share ($263,710,179 ÷ 23,400,934 shares) | $11.27 |
See accompanying notes which are an integral part of the financial statements.
Statement of Operations
| Six months ended April 30, 2018 (Unaudited) | ||
| Investment Income | ||
| Dividends | $1,701,249 | |
| Income from Fidelity Central Funds | 31,193 | |
| Income before foreign taxes withheld | 1,732,442 | |
| Less foreign taxes withheld | (147,800) | |
| Total income | 1,584,642 | |
| Expenses | ||
| Management fee | $718,926 | |
| Independent trustees' fees and expenses | 409 | |
| Miscellaneous | 48 | |
| Total expenses before reductions | 719,383 | |
| Expense reductions | (59,336) | 660,047 |
| Net investment income (loss) | 924,595 | |
| Realized and Unrealized Gain (Loss) | ||
| Net realized gain (loss) on: | ||
| Investment securities: | ||
| Unaffiliated issuers (net of foreign taxes of $37) | (1,784,370) | |
| Fidelity Central Funds | 758 | |
| Foreign currency transactions | 9,887 | |
| Total net realized gain (loss) | (1,773,725) | |
| Change in net unrealized appreciation (depreciation) on: | ||
| Investment securities: | ||
| Unaffiliated issuers (net of increase in deferred foreign taxes of $92,996) | 4,384,324 | |
| Assets and liabilities in foreign currencies | (5,078) | |
| Total change in net unrealized appreciation (depreciation) | 4,379,246 | |
| Net gain (loss) | 2,605,521 | |
| Net increase (decrease) in net assets resulting from operations | $3,530,116 |
See accompanying notes which are an integral part of the financial statements.
Statement of Changes in Net Assets
| Six months ended April 30, 2018 (Unaudited) | For the period May 25, 2017 (commencement of operations) to October 31, 2017 | |
| Increase (Decrease) in Net Assets | ||
| Operations | ||
| Net investment income (loss) | $924,595 | $223,392 |
| Net realized gain (loss) | (1,773,725) | 147,544 |
| Change in net unrealized appreciation (depreciation) | 4,379,246 | 10,420,074 |
| Net increase (decrease) in net assets resulting from operations | 3,530,116 | 10,791,010 |
| Distributions to shareholders from net investment income | (365,189) | – |
| Distributions to shareholders from net realized gain | (191,290) | – |
| Total distributions | (556,479) | – |
| Share transactions | ||
| Proceeds from sales of shares | 114,471,657 | 174,806,251 |
| Reinvestment of distributions | 556,479 | – |
| Cost of shares redeemed | (29,695,240) | (10,193,615) |
| Net increase (decrease) in net assets resulting from share transactions | 85,332,896 | 164,612,636 |
| Total increase (decrease) in net assets | 88,306,533 | 175,403,646 |
| Net Assets | ||
| Beginning of period | 175,403,646 | – |
| End of period | $263,710,179 | $175,403,646 |
| Other Information | ||
| Undistributed net investment income end of period | $775,236 | $215,830 |
| Shares | ||
| Sold | 10,026,589 | 16,893,772 |
| Issued in reinvestment of distributions | 50,133 | – |
| Redeemed | (2,609,457) | (960,103) |
| Net increase (decrease) | 7,467,265 | 15,933,669 |
See accompanying notes which are an integral part of the financial statements.
Financial Highlights
Fidelity International Capital Appreciation K6 Fund
| Six months ended (Unaudited) April 30, | Years endedOctober 31, | |
| 2018 | 2017 A | |
| Selected Per–Share Data | ||
| Net asset value, beginning of period | $11.01 | $10.00 |
| Income from Investment Operations | ||
| Net investment income (loss)B | .05 | .02 |
| Net realized and unrealized gain (loss) | .24 | .99 |
| Total from investment operations | .29 | 1.01 |
| Distributions from net investment income | (.02) | – |
| Distributions from net realized gain | (.01) | – |
| Total distributions | (.03) | – |
| Net asset value, end of period | $11.27 | $11.01 |
| Total ReturnC,D | 2.66% | 10.10% |
| Ratios to Average Net AssetsE,F | ||
| Expenses before reductions | .65%G | .65%G |
| Expenses net of fee waivers, if any | .65%G | .65%G |
| Expenses net of all reductions | .60%G | .65%G |
| Net investment income (loss) | .84%G | .51%G |
| Supplemental Data | ||
| Net assets, end of period (000 omitted) | $263,710 | $175,404 |
| Portfolio turnover rateH | 178%G,I | 81%I,J |
A For the period May 25, 2017 (commencement of operations) to October 31, 2017.
B Calculated based on average shares outstanding during the period.
C Total returns for periods of less than one year are not annualized.
D Total returns would have been lower if certain expenses had not been reduced during the applicable periods shown.
E Fees and expenses of any underlying Fidelity Central Funds are not included in the Fund's expense ratio. The Fund indirectly bears its proportionate share of the expenses of any underlying Fidelity Central Funds.
F Expense ratios reflect operating expenses of the Fund. Expenses before reductions do not reflect amounts reimbursed by the investment adviser or reductions from brokerage service arrangements or reductions from other expense offset arrangements and do not represent the amount paid by the Fund during periods when reimbursements or reductions occur. Expense ratios before reductions for start-up periods may not be representative of longer term operating periods. Expenses net of fee waivers reflect expenses after reimbursement by the investment adviser but prior to reductions from brokerage service arrangements or other expense offset arrangements. Expenses net of all reductions represent the net expenses paid by the Fund.
G Annualized
H Amount does not include the portfolio activity of any underlying Fidelity Central Funds.
I Portfolio turnover rate excludes securities received or delivered in-kind.
J Amount not annualized.
See accompanying notes which are an integral part of the financial statements.
Notes to Financial Statements (Unaudited)
For the period ended April 30, 2018
1. Organization.
Fidelity International Capital Appreciation K6 Fund (the Fund) is a fund of Fidelity Investment Trust (the Trust) and is authorized to issue an unlimited number of shares. Share transactions on the Statement of Changes in Net Assets may contain exchanges between affiliated funds. The Trust is registered under the Investment Company Act of 1940, as amended (the 1940 Act), as an open-end management investment company organized as a Massachusetts business trust. Shares generally are available only to employer-sponsored retirement plans that are recordkept by Fidelity, or to certain employer-sponsored retirement plans that are not recordkept by Fidelity. The Fund's investments in emerging markets can be subject to social, economic, regulatory, and political uncertainties and can be extremely volatile.
2. Investments in Fidelity Central Funds.
The Fund invests in Fidelity Central Funds, which are open-end investment companies generally available only to other investment companies and accounts managed by the investment adviser and its affiliates. The Fund's Schedule of Investments lists each of the Fidelity Central Funds held as of period end, if any, as an investment of the Fund, but does not include the underlying holdings of each Fidelity Central Fund. As an Investing Fund, the Fund indirectly bears its proportionate share of the expenses of the underlying Fidelity Central Funds.
The Money Market Central Funds seek preservation of capital and current income and are managed by Fidelity Investments Money Management, Inc. (FIMM), an affiliate of the investment adviser. Annualized expenses of the Money Market Central Funds as of their most recent shareholder report date are less than .005%.
A complete unaudited list of holdings for each Fidelity Central Fund is available upon request or at the Securities and Exchange Commission (the SEC) website at www.sec.gov. In addition, the financial statements of the Fidelity Central Funds are available on the SEC website or upon request.
3. Significant Accounting Policies.
The Fund is an investment company and applies the accounting and reporting guidance of the Financial Accounting Standards Board (FASB) Accounting Standards Codification Topic 946 Financial Services – Investments Companies. The financial statements have been prepared in conformity with accounting principles generally accepted in the United States of America (GAAP), which require management to make certain estimates and assumptions at the date of the financial statements. Actual results could differ from those estimates. Subsequent events, if any, through the date that the financial statements were issued have been evaluated in the preparation of the financial statements. The following summarizes the significant accounting policies of the Fund:
Investment Valuation. Investments are valued as of 4:00 p.m. Eastern time on the last calendar day of the period. The Board of Trustees (the Board) has delegated the day to day responsibility for the valuation of the Fund's investments to the Fair Value Committee (the Committee) established by the Fund's investment adviser. In accordance with valuation policies and procedures approved by the Board, the Fund attempts to obtain prices from one or more third party pricing vendors or brokers to value its investments. When current market prices, quotations or currency exchange rates are not readily available or reliable, investments will be fair valued in good faith by the Committee, in accordance with procedures adopted by the Board. Factors used in determining fair value vary by investment type and may include market or investment specific events. The frequency with which these procedures are used cannot be predicted and they may be utilized to a significant extent. The Committee oversees the Fund's valuation policies and procedures and reports to the Board on the Committee's activities and fair value determinations. The Board monitors the appropriateness of the procedures used in valuing the Fund's investments and ratifies the fair value determinations of the Committee.
The Fund categorizes the inputs to valuation techniques used to value its investments into a disclosure hierarchy consisting of three levels as shown below:
- Level 1 – quoted prices in active markets for identical investments
- Level 2 – other significant observable inputs (including quoted prices for similar investments, interest rates, prepayment speeds, etc.)
- Level 3 – unobservable inputs (including the Fund's own assumptions based on the best information available)
Valuation techniques used to value the Fund's investments by major category are as follows:
Equity securities, including restricted securities, for which market quotations are readily available, are valued at the last reported sale price or official closing price as reported by a third party pricing vendor on the primary market or exchange on which they are traded and are categorized as Level 1 in the hierarchy. In the event there were no sales during the day or closing prices are not available, securities are valued at the last quoted bid price or may be valued using the last available price and are generally categorized as Level 2 in the hierarchy. For foreign equity securities, when market or security specific events arise, comparisons to the valuation of American Depositary Receipts (ADRs), futures contracts, Exchange-Traded Funds (ETFs) and certain indexes as well as quoted prices for similar securities may be used and would be categorized as Level 2 in the hierarchy. Utilizing these techniques may result in transfers between Level 1 and Level 2. For equity securities, including restricted securities, where observable inputs are limited, assumptions about market activity and risk are used and these securities may be categorized as Level 3 in the hierarchy.
Investments in open-end mutual funds, including the Fidelity Central Funds, are valued at their closing net asset value (NAV) each business day and are categorized as Level 1 in the hierarchy.
Changes in valuation techniques may result in transfers in or out of an assigned level within the disclosure hierarchy. The aggregate value of investments by input level as of April 30, 2018 including information on transfers between Levels 1 and 2 is included at the end of the Fund's Schedule of Investments.
Foreign Currency. The Fund may use foreign currency contracts to facilitate transactions in foreign-denominated securities. Gains and losses from these transactions may arise from changes in the value of the foreign currency or if the counterparties do not perform under the contracts' terms.
Foreign-denominated assets, including investment securities, and liabilities are translated into U.S. dollars at the exchange rates at period end. Purchases and sales of investment securities, income and dividends received and expenses denominated in foreign currencies are translated into U.S. dollars at the exchange rate in effect on the transaction date.
The effects of exchange rate fluctuations on investments are included with the net realized and unrealized gain (loss) on investment securities. Other foreign currency transactions resulting in realized and unrealized gain (loss) are disclosed separately.
Investment Transactions and Income. For financial reporting purposes, the Fund's investment holdings and NAV include trades executed through the end of the last business day of the period. The NAV per share for processing shareholder transactions is calculated as of the close of business of the New York Stock Exchange (NYSE), normally 4:00 p.m. Eastern time and includes trades executed through the end of the prior business day. Gains and losses on securities sold are determined on the basis of identified cost. Dividend income is recorded on the ex-dividend date, except for certain dividends from foreign securities where the ex-dividend date may have passed, which are recorded as soon as the Fund is informed of the ex-dividend date. Non-cash dividends included in dividend income, if any, are recorded at the fair market value of the securities received. Income and capital gain distributions from Fidelity Central Funds, if any, are recorded on the ex-dividend date. Certain distributions received by the Fund represent a return of capital or capital gain. The Fund determines the components of these distributions subsequent to the ex-dividend date, based upon receipt of tax filings or other correspondence relating to the underlying investment. These distributions are recorded as a reduction of cost of investments and/or as a realized gain. Investment income is recorded net of foreign taxes withheld where recovery of such taxes is uncertain.
Expenses. Expenses directly attributable to a fund are charged to that fund. Expenses attributable to more than one fund are allocated among the respective funds on the basis of relative net assets or other appropriate methods. Expense estimates are accrued in the period to which they relate and adjustments are made when actual amounts are known.
Income Tax Information and Distributions to Shareholders. Each year, the Fund intends to qualify as a regulated investment company under Subchapter M of the Internal Revenue Code, including distributing substantially all of its taxable income and realized gains. As a result, no provision for U.S. Federal income taxes is required. The Fund files a U.S. federal tax return, in addition to state and local tax returns as required. The Fund's federal income tax returns are subject to examination by the Internal Revenue Service (IRS) for a period of three fiscal years after they are filed. State and local tax returns may be subject to examination for an additional fiscal year depending on the jurisdiction. Foreign taxes are provided for based on the Fund's understanding of the tax rules and rates that exist in the foreign markets in which it invests. The Fund is subject to a tax imposed on capital gains by certain countries in which it invests. An estimated deferred tax liability for net unrealized appreciation on the applicable securities is included in Other payables and accrued expenses on the Statement of Assets & Liabilities.
Distributions are declared and recorded on the ex-dividend date. Income and capital gain distributions are determined in accordance with income tax regulations, which may differ from GAAP.
Capital accounts within the financial statements are adjusted for permanent book-tax differences. These adjustments have no impact on net assets or the results of operations. Capital accounts are not adjusted for temporary book-tax differences which will reverse in a subsequent period.
Book-tax differences are primarily due to foreign currency transactions, passive foreign investment companies (PFIC) and losses deferred due to wash sales.
As of period end, the cost and unrealized appreciation (depreciation) in securities, and derivatives if applicable, for federal income tax purposes were as follows:
| Gross unrealized appreciation | $19,504,395 |
| Gross unrealized depreciation | (5,103,841) |
| Net unrealized appreciation (depreciation) | $14,400,554 |
| Tax cost | $249,450,174 |
Restricted Securities. The Fund may invest in securities that are subject to legal or contractual restrictions on resale. These securities generally may be resold in transactions exempt from registration or to the public if the securities are registered. Disposal of these securities may involve time-consuming negotiations and expense, and prompt sale at an acceptable price may be difficult. Information regarding restricted securities is included at the end of the Fund's Schedule of Investments.
4. Purchases and Sales of Investments.
Purchases and sales of securities, other than short-term securities and in-kind transactions, aggregated $245,034,239 and $190,442,433, respectively.
Exchanges In-Kind. Investments and cash received in-kind through subscriptions totaled $29,374,572 in exchange for 2,605,896 shares of the Fund. The amount of in-kind exchanges is included in share transactions in the accompanying Statement of Changes in Net Assets. The Fund recognized no gain or loss for federal income tax purposes.
5. Fees and Other Transactions with Affiliates.
Management Fee. Fidelity Management & Research Company (the investment adviser) and its affiliates provide the Fund with investment management related services for which the Fund pays a monthly management fee that is based on an annual rate of .65% of average net assets. Under the management contract, the investment adviser or an affiliate pays all other expenses of the Fund, excluding fees and expenses of the independent Trustees, and certain miscellaneous expenses such as proxy and shareholder meeting expenses.
Brokerage Commissions. The Fund placed a portion of its portfolio transactions with brokerage firms which are affiliates of the investment adviser. Brokerage commissions are included in net realized gain (loss) and change in net unrealized appreciation (depreciation) in the Statement of Operations. The commissions paid to these affiliated firms were $1,031 for the period.
Interfund Trades. The Fund may purchase from or sell securities to other Fidelity Funds under procedures adopted by the Board. The procedures have been designed to ensure these interfund trades are executed in accordance with Rule 17a-7 of the 1940 Act. Interfund trades are included within the respective purchases and sales amounts shown in the Purchases and Sales of Investments note.
Prior Fiscal Year Exchanges In-Kind. During the prior period, an affiliated entity completed an exchange in-kind with the Fund. The affiliated entity delivered investments and cash valued at $165,479,456 in exchange for 16,003,816 shares of the Fund. The amount of in-kind exchanges is included in share transactions in the accompanying Statement of Changes in Net Assets. The Fund recognized no gain or loss for federal income tax purposes.
6. Committed Line of Credit.
The Fund participates with other funds managed by the investment adviser or an affiliate in a $4.25 billion credit facility (the "line of credit") to be utilized for temporary or emergency purposes to fund shareholder redemptions or for other short-term liquidity purposes. The Fund has agreed to pay commitment fees on its pro-rata portion of the line of credit, which amounted to $48 and is reflected in Miscellaneous expenses on the Statement of Operations. During the period, the Fund did not borrow on this line of credit.
7. Security Lending.
The Fund lends portfolio securities through a lending agent from time to time in order to earn additional income. For equity securities, a lending agent is used and may loan securities to certain qualified borrowers, including Fidelity Capital Markets (FCM), a broker-dealer affiliated with the Fund. On the settlement date of the loan, the Fund receives collateral (in the form of U.S. Treasury obligations, letters of credit and/or cash) against the loaned securities and maintains collateral in an amount not less than 100% of the market value of the loaned securities during the period of the loan. The market value of the loaned securities is determined at the close of business of the Fund and any additional required collateral is delivered to the Fund on the next business day. The Fund or borrower may terminate the loan at any time, and if the borrower defaults on its obligation to return the securities loaned because of insolvency or other reasons, the Fund may apply collateral received from the borrower against the obligation. The Fund may experience delays and costs in recovering the securities loaned. Any cash collateral received is invested in the Fidelity Securities Lending Cash Central Fund. The value of loaned securities and cash collateral at period end are disclosed on the Fund's Statement of Assets and Liabilities. Security lending income represents the income earned on investing cash collateral, less rebates paid to borrowers and any lending agent fees associated with the loan, plus any premium payments received for lending certain types of securities. Security lending income is presented in the Statement of Operations as a component of income from Fidelity Central Funds. Total security lending income during the period amounted to $9,157. During the period, there were no securities loaned to FCM.
8. Expense Reductions.
Commissions paid to certain brokers with whom the investment adviser, or its affiliates, places trades on behalf of the Fund include an amount in addition to trade execution, which may be rebated back to the Fund to offset certain expenses. This amount totaled $59,314 for the period. In addition, through arrangements with the Fund's custodian, credits realized as a result of certain uninvested cash balances were used to reduce the Fund's management fee. During the period, these credits reduced the Fund's management fee by $22.
9. Other.
The Fund's organizational documents provide former and current trustees and officers with a limited indemnification against liabilities arising in connection with the performance of their duties to the Fund. In the normal course of business, the Fund may also enter into contracts that provide general indemnifications. The Fund's maximum exposure under these arrangements is unknown as this would be dependent on future claims that may be made against the Fund. The risk of material loss from such claims is considered remote.
Shareholder Expense Example
As a shareholder of the Fund, you incur two types of costs: (1) transaction costs and (2) ongoing costs, including management fees and other Fund expenses. This Example is intended to help you understand your ongoing costs (in dollars) of investing in the Fund and to compare these costs with the ongoing costs of investing in other mutual funds.
The Example is based on an investment of $1,000 invested at the beginning of the period and held for the entire period (November 1, 2017 to April 30, 2018).
Actual Expenses
The first line of the accompanying table provides information about actual account values and actual expenses. You may use the information in this line, together with the amount you invested, to estimate the expenses that you paid over the period. Simply divide your account value by $1,000.00 (for example, an $8,600 account value divided by $1,000.00 = 8.6), then multiply the result by the number in the first line under the heading entitled "Expenses Paid During Period" to estimate the expenses you paid on your account during this period. In addition, the Fund, as a shareholder in the underlying Fidelity Central Funds, will indirectly bear its pro-rata share of the fees and expenses incurred by the underlying Fidelity Central Funds. These fees and expenses are not included in the Fund's annualized expense ratio used to calculate the expense estimate in the table below.
Hypothetical Example for Comparison Purposes
The second line of the accompanying table provides information about hypothetical account values and hypothetical expenses based on the Fund's actual expense ratio and an assumed rate of return of 5% per year before expenses, which is not the Fund's actual return. The hypothetical account values and expenses may not be used to estimate the actual ending account balance or expenses you paid for the period. You may use this information to compare the ongoing costs of investing in the Fund and other funds. To do so, compare this 5% hypothetical example with the 5% hypothetical examples that appear in the shareholder reports of the other funds. In addition, the Fund, as a shareholder in the underlying Fidelity Central Funds, will indirectly bear its pro-rata share of the fees and expenses incurred by the underlying Fidelity Central Funds. These fees and expenses are not included in the Fund's annualized expense ratio used to calculate the expense estimate in the table below.
Please note that the expenses shown in the table are meant to highlight your ongoing costs only and do not reflect any transaction costs. Therefore, the second line of the table is useful in comparing ongoing costs only, and will not help you determine the relative total costs of owning different funds.
| Annualized Expense Ratio-A | Beginning Account Value November 1, 2017 | Ending Account Value April 30, 2018 | Expenses Paid During Period-B November 1, 2017 to April 30, 2018 | |
| Actual | .65% | $1,000.00 | $1,026.60 | $3.27 |
| Hypothetical-C | $1,000.00 | $1,021.57 | $3.26 |
A Annualized expense ratio reflects expenses net of applicable fee waivers.
B Expenses are equal to the Fund's annualized expense ratio, multiplied by the average account value over the period, multiplied by 181/365 (to reflect the one-half year period).
C 5% return per year before expenses
![]()
IVFK6-SANN-0618
1.9883990.100
Fidelity® Series Canada Fund Semi-Annual Report April 30, 2018 |
|
Contents
To view a fund's proxy voting guidelines and proxy voting record for the 12-month period ended June 30, visit http://www.fidelity.com/proxyvotingresults or visit the Securities and Exchange Commission's (SEC) web site at http://www.sec.gov.
You may also call 1-800-544-8544 to request a free copy of the proxy voting guidelines.
Standard & Poor's, S&P and S&P 500 are registered service marks of The McGraw-Hill Companies, Inc. and have been licensed for use by Fidelity Distributors Corporation.
Other third-party marks appearing herein are the property of their respective owners.
All other marks appearing herein are registered or unregistered trademarks or service marks of FMR LLC or an affiliated company. © 2018 FMR LLC. All rights reserved.
This report and the financial statements contained herein are submitted for the general information of the shareholders of the Fund. This report is not authorized for distribution to prospective investors in the Fund unless preceded or accompanied by an effective prospectus.
A fund files its complete schedule of portfolio holdings with the SEC for the first and third quarters of each fiscal year on Form N-Q. Forms N-Q are available on the SEC’s web site at http://www.sec.gov. A fund's Forms N-Q may be reviewed and copied at the SEC’s Public Reference Room in Washington, DC. Information regarding the operation of the SEC's Public Reference Room may be obtained by calling 1-800-SEC-0330.
For a complete list of a fund's portfolio holdings, view the most recent holdings listing, semiannual report, or annual report on Fidelity's web site at http://www.fidelity.com, http://www.institutional.fidelity.com, or http://www.401k.com, as applicable.
NOT FDIC INSURED •MAY LOSE VALUE •NO BANK GUARANTEE
Neither the Fund nor Fidelity Distributors Corporation is a bank.
Investment Summary (Unaudited)
Geographic Diversification (% of fund's net assets)
| As of April 30, 2018 | ||
| Canada | 96.8% | |
| United States of America* | 3.2% | |

* Includes Short-Term investments and Net Other Assets (Liabilities).
Percentages are based on country or territory of incorporation and are adjusted for the effect of futures contracts, if applicable.
Asset Allocation as of April 30, 2018
| % of fund's net assets | |
| Stocks | 96.8 |
| Short-Term Investments and Net Other Assets (Liabilities) | 3.2 |
Top Ten Stocks as of April 30, 2018
| % of fund's net assets | |
| The Toronto-Dominion Bank (Banks) | 10.3 |
| Suncor Energy, Inc. (Oil, Gas & Consumable Fuels) | 7.0 |
| Bank of Nova Scotia (Banks) | 5.0 |
| Royal Bank of Canada (Banks) | 4.9 |
| Sun Life Financial, Inc. (Insurance) | 4.4 |
| Canadian Pacific Railway Ltd. (Road & Rail) | 4.2 |
| National Bank of Canada (Banks) | 4.0 |
| Canadian Natural Resources Ltd. (Oil, Gas & Consumable Fuels) | 3.8 |
| Canadian National Railway Co. (Road & Rail) | 3.4 |
| Nutrien Ltd. (Chemicals) | 3.4 |
| 50.4 |
Top Market Sectors as of April 30, 2018
| % of fund's net assets | |
| Financials | 38.4 |
| Energy | 19.5 |
| Materials | 11.0 |
| Industrials | 9.2 |
| Consumer Staples | 6.2 |
| Information Technology | 4.7 |
| Consumer Discretionary | 3.4 |
| Telecommunication Services | 3.2 |
| Utilities | 0.7 |
| Real Estate | 0.5 |
Market Sectors may include more than one industry category.
The Fund may invest up to 35% of its total assets in any industry that represents more than 20% of the Canadian market. As of April 30, 2018, 26.4% of the Fund’s total assets were invested in the Diversified Banks industry, which accounts for more than 20% of the Canadian market.
Schedule of Investments April 30, 2018 (Unaudited)
Showing Percentage of Net Assets
| Common Stocks - 96.8% | |||
| Shares | Value | ||
| CONSUMER DISCRETIONARY - 3.4% | |||
| Auto Components - 1.1% | |||
| Magna International, Inc. Class A (sub. vtg.) | 265,400 | $15,674,506 | |
| Hotels, Restaurants & Leisure - 0.4% | |||
| Cara Operations Ltd. | 253,200 | 5,269,289 | |
| Leisure Products - 0.2% | |||
| BRP, Inc. | 92,500 | 3,741,929 | |
| Media - 1.1% | |||
| Cogeco Communications, Inc. | 174,000 | 9,270,875 | |
| Quebecor, Inc. Class B (sub. vtg.) | 379,800 | 7,081,594 | |
| 16,352,469 | |||
| Specialty Retail - 0.4% | |||
| AutoCanada, Inc. | 330,300 | 5,613,261 | |
| Textiles, Apparel & Luxury Goods - 0.2% | |||
| ERO Copper Corp. | 541,700 | 3,375,209 | |
| TOTAL CONSUMER DISCRETIONARY | 50,026,663 | ||
| CONSUMER STAPLES - 6.2% | |||
| Food & Staples Retailing - 6.2% | |||
| Alimentation Couche-Tard, Inc. Class B (sub. vtg.) | 1,129,300 | 48,823,897 | |
| George Weston Ltd. | 442,900 | 36,285,409 | |
| North West Co., Inc. | 339,500 | 7,300,592 | |
| 92,409,898 | |||
| ENERGY - 19.5% | |||
| Energy Equipment & Services - 1.0% | |||
| Canadian Energy Services & Technology Corp. | 2,405,100 | 11,782,452 | |
| ShawCor Ltd. Class A | 144,147 | 2,788,747 | |
| 14,571,199 | |||
| Oil, Gas & Consumable Fuels - 18.5% | |||
| Canadian Natural Resources Ltd. | 1,556,200 | 56,141,738 | |
| Cenovus Energy, Inc. | 1,893,400 | 18,964,231 | |
| Enbridge, Inc. | 961,000 | 29,108,057 | |
| Kinder Morgan Canada Ltd. (a)(b) | 244,100 | 3,150,229 | |
| NuVista Energy Ltd. (c) | 751,900 | 4,936,732 | |
| Parkland Fuel Corp. | 299,600 | 6,955,938 | |
| Peyto Exploration & Development Corp. | 760,300 | 7,188,786 | |
| Pinnacle Renewable Holds, Inc. | 521,900 | 5,808,599 | |
| PrairieSky Royalty Ltd. | 1,459,200 | 32,355,952 | |
| Suncor Energy, Inc. | 2,696,200 | 103,106,367 | |
| Whitecap Resources, Inc. | 847,400 | 6,137,949 | |
| 273,854,578 | |||
| TOTAL ENERGY | 288,425,777 | ||
| FINANCIALS - 38.4% | |||
| Banks - 26.4% | |||
| Bank of Montreal | 419,600 | 31,866,658 | |
| Bank of Nova Scotia | 1,193,000 | 73,329,616 | |
| National Bank of Canada | 1,252,800 | 59,500,560 | |
| Royal Bank of Canada | 960,900 | 73,073,154 | |
| The Toronto-Dominion Bank | 2,710,500 | 152,228,788 | |
| 389,998,776 | |||
| Capital Markets - 3.5% | |||
| Brookfield Asset Management, Inc. Class A | 448,800 | 17,788,412 | |
| CI Financial Corp. | 977,600 | 20,573,038 | |
| Gluskin Sheff + Associates, Inc. | 266,400 | 3,222,238 | |
| TMX Group Ltd. | 165,700 | 9,994,009 | |
| 51,577,697 | |||
| Insurance - 8.5% | |||
| Intact Financial Corp. | 293,700 | 22,394,353 | |
| Power Corp. of Canada (sub. vtg.) | 1,617,800 | 38,443,147 | |
| Sun Life Financial, Inc. | 1,585,900 | 65,464,154 | |
| 126,301,654 | |||
| TOTAL FINANCIALS | 567,878,127 | ||
| INDUSTRIALS - 9.2% | |||
| Professional Services - 0.4% | |||
| Stantec, Inc. | 248,500 | 6,323,062 | |
| Road & Rail - 8.4% | |||
| Canadian National Railway Co. | 650,400 | 50,235,732 | |
| Canadian Pacific Railway Ltd. | 341,400 | 62,294,631 | |
| TransForce, Inc. | 396,800 | 11,487,251 | |
| 124,017,614 | |||
| Trading Companies & Distributors - 0.4% | |||
| Toromont Industries Ltd. | 131,600 | 5,763,362 | |
| TOTAL INDUSTRIALS | 136,104,038 | ||
| INFORMATION TECHNOLOGY - 4.7% | |||
| IT Services - 1.8% | |||
| CGI Group, Inc. Class A (sub. vtg.) (c) | 470,400 | 27,257,884 | |
| Software - 2.9% | |||
| Constellation Software, Inc. | 32,900 | 23,513,398 | |
| Open Text Corp. | 534,500 | 18,870,583 | |
| 42,383,981 | |||
| TOTAL INFORMATION TECHNOLOGY | 69,641,865 | ||
| MATERIALS - 11.0% | |||
| Chemicals - 3.5% | |||
| Methanex Corp. | 24,300 | 1,464,681 | |
| Nutrien Ltd. | 1,089,578 | 49,601,491 | |
| 51,066,172 | |||
| Containers & Packaging - 1.2% | |||
| CCL Industries, Inc. Class B | 374,600 | 18,170,558 | |
| Metals & Mining - 5.8% | |||
| Agnico Eagle Mines Ltd. (Canada) | 434,700 | 18,292,645 | |
| Barrick Gold Corp. | 413,700 | 5,567,768 | |
| Franco-Nevada Corp. | 341,800 | 24,243,721 | |
| HudBay Minerals, Inc. | 711,200 | 4,968,623 | |
| Lundin Mining Corp. | 2,148,300 | 14,222,166 | |
| Premier Gold Mines Ltd. (c) | 1,375,600 | 2,914,157 | |
| Wheaton Precious Metals Corp. | 756,700 | 15,706,262 | |
| 85,915,342 | |||
| Paper & Forest Products - 0.5% | |||
| Western Forest Products, Inc. | 3,557,900 | 7,675,831 | |
| TOTAL MATERIALS | 162,827,903 | ||
| REAL ESTATE - 0.5% | |||
| Equity Real Estate Investment Trusts (REITs) - 0.5% | |||
| Allied Properties (REIT) | 229,900 | 7,427,277 | |
| TELECOMMUNICATION SERVICES - 3.2% | |||
| Diversified Telecommunication Services - 1.6% | |||
| TELUS Corp. | 673,400 | 24,099,638 | |
| Wireless Telecommunication Services - 1.6% | |||
| Rogers Communications, Inc. Class B (non-vtg.) | 483,100 | 22,805,165 | |
| TOTAL TELECOMMUNICATION SERVICES | 46,904,803 | ||
| UTILITIES - 0.7% | |||
| Electric Utilities - 0.7% | |||
| Hydro One Ltd. (b) | 708,100 | 11,245,110 | |
| TOTAL COMMON STOCKS | |||
| (Cost $1,415,459,544) | 1,432,891,461 | ||
| Money Market Funds - 3.2% | |||
| Fidelity Cash Central Fund, 1.74% (d) | 44,034,541 | 44,043,348 | |
| Fidelity Securities Lending Cash Central Fund 1.74% (d)(e) | 2,461,104 | 2,461,350 | |
| TOTAL MONEY MARKET FUNDS | |||
| (Cost $46,504,944) | 46,504,698 | ||
| TOTAL INVESTMENT IN SECURITIES - 100.0% | |||
| (Cost $1,461,964,488) | 1,479,396,159 | ||
| NET OTHER ASSETS (LIABILITIES) - 0.0% | 237,447 | ||
| NET ASSETS - 100% | $1,479,633,606 |
Legend
(a) Security or a portion of the security is on loan at period end.
(b) Security exempt from registration under Rule 144A of the Securities Act of 1933. These securities may be resold in transactions exempt from registration, normally to qualified institutional buyers. At the end of the period, the value of these securities amounted to $14,395,339 or 1.0% of net assets.
(c) Non-income producing
(d) Affiliated fund that is generally available only to investment companies and other accounts managed by Fidelity Investments. The rate quoted is the annualized seven-day yield of the fund at period end. A complete unaudited listing of the fund's holdings as of its most recent quarter end is available upon request. In addition, each Fidelity Central Fund's financial statements are available on the SEC's website or upon request.
(e) Investment made with cash collateral received from securities on loan.
Affiliated Central Funds
Information regarding fiscal year to date income earned by the Fund from investments in Fidelity Central Funds is as follows:
| Fund | Income earned |
| Fidelity Cash Central Fund | $252,682 |
| Fidelity Securities Lending Cash Central Fund | 632 |
| Total | $253,314 |
Amounts in the income column in the above table include any capital gain distributions from underlying funds, which are presented in the corresponding line-item in the Statement of Operations if applicable.
Investment Valuation
All investments are categorized as Level 1 under the Fair Value Hierarchy. The inputs or methodology used for valuing securities may not be an indication of the risk associated with investing in those securities. For more information on valuation inputs please refer to the Investment Valuation section in the accompanying Notes to Financial Statements.
See accompanying notes which are an integral part of the financial statements.
Financial Statements
Statement of Assets and Liabilities
| April 30, 2018 (Unaudited) | ||
| Assets | ||
| Investment in securities, at value (including securities loaned of $2,339,537) — See accompanying schedule: Unaffiliated issuers (cost $1,415,459,544) | $1,432,891,461 | |
| Fidelity Central Funds (cost $46,504,944) | 46,504,698 | |
| Total Investment in Securities (cost $1,461,964,488) | $1,479,396,159 | |
| Foreign currency held at value (cost $1,330,985) | 1,330,985 | |
| Receivable for investments sold | 1,554,496 | |
| Receivable for fund shares sold | 363,907 | |
| Dividends receivable | 1,657,529 | |
| Distributions receivable from Fidelity Central Funds | 61,289 | |
| Other receivables | 30,961 | |
| Total assets | 1,484,395,326 | |
| Liabilities | ||
| Payable for investments purchased | $2,069,916 | |
| Payable for fund shares redeemed | 222,857 | |
| Other payables and accrued expenses | 7,347 | |
| Collateral on securities loaned | 2,461,600 | |
| Total liabilities | 4,761,720 | |
| Net Assets | $1,479,633,606 | |
| Net Assets consist of: | ||
| Paid in capital | $1,463,146,419 | |
| Undistributed net investment income | 10,561,435 | |
| Accumulated undistributed net realized gain (loss) on investments and foreign currency transactions | (11,505,534) | |
| Net unrealized appreciation (depreciation) on investments and assets and liabilities in foreign currencies | 17,431,286 | |
| Net Assets, for 141,845,697 shares outstanding | $1,479,633,606 | |
| Net Asset Value, offering price and redemption price per share ($1,479,633,606 ÷ 141,845,697 shares) | $10.43 |
See accompanying notes which are an integral part of the financial statements.
Statement of Operations
| Six months ended April 30, 2018 (Unaudited) | ||
| Investment Income | ||
| Dividends | $20,796,690 | |
| Income from Fidelity Central Funds | 253,314 | |
| Income before foreign taxes withheld | 21,050,004 | |
| Less foreign taxes withheld | (3,105,591) | |
| Total income | 17,944,413 | |
| Expenses | ||
| Custodian fees and expenses | $13,389 | |
| Independent trustees' fees and expenses | 2,905 | |
| Miscellaneous | 305 | |
| Total expenses | 16,599 | |
| Net investment income (loss) | 17,927,814 | |
| Realized and Unrealized Gain (Loss) | ||
| Net realized gain (loss) on: | ||
| Investment securities: | ||
| Unaffiliated issuers | (6,868,308) | |
| Fidelity Central Funds | (4) | |
| Foreign currency transactions | (108,823) | |
| Total net realized gain (loss) | (6,977,135) | |
| Change in net unrealized appreciation (depreciation) on: | ||
| Investment securities: | ||
| Unaffiliated issuers | (24,754,675) | |
| Fidelity Central Funds | (246) | |
| Assets and liabilities in foreign currencies | 24,141 | |
| Total change in net unrealized appreciation (depreciation) | (24,730,780) | |
| Net gain (loss) | (31,707,915) | |
| Net increase (decrease) in net assets resulting from operations | $(13,780,101) |
See accompanying notes which are an integral part of the financial statements.
Statement of Changes in Net Assets
| Six months ended April 30, 2018 (Unaudited) | For the period August 15, 2017 (commencement of operations) to October 31, 2017 | |
| Increase (Decrease) in Net Assets | ||
| Operations | ||
| Net investment income (loss) | $17,927,814 | $6,106,214 |
| Net realized gain (loss) | (6,977,135) | (1,889,438) |
| Change in net unrealized appreciation (depreciation) | (24,730,780) | 42,162,066 |
| Net increase (decrease) in net assets resulting from operations | (13,780,101) | 46,378,842 |
| Distributions to shareholders from net investment income | (13,472,593) | – |
| Distributions to shareholders from net realized gain | (2,638,961) | – |
| Total distributions | (16,111,554) | – |
| Share transactions | ||
| Proceeds from sales of shares | 103,599,019 | 1,473,942,687 |
| Reinvestment of distributions | 16,111,554 | – |
| Cost of shares redeemed | (87,152,522) | (43,354,319) |
| Net increase (decrease) in net assets resulting from share transactions | 32,558,051 | 1,430,588,368 |
| Total increase (decrease) in net assets | 2,666,396 | 1,476,967,210 |
| Net Assets | ||
| Beginning of period | 1,476,967,210 | – |
| End of period | $1,479,633,606 | $1,476,967,210 |
| Other Information | ||
| Undistributed net investment income end of period | $10,561,435 | $6,106,214 |
| Shares | ||
| Sold | 9,783,368 | 142,690,282 |
| Issued in reinvestment of distributions | 1,522,831 | – |
| Redeemed | (8,072,286) | (4,078,498) |
| Net increase (decrease) | 3,233,913 | 138,611,784 |
See accompanying notes which are an integral part of the financial statements.
Financial Highlights
Fidelity Series Canada Fund
| Six months ended (Unaudited) April 30, | Years endedOctober 31, | |
| 2018 | 2017 A | |
| Selected Per–Share Data | ||
| Net asset value, beginning of period | $10.66 | $10.00 |
| Income from Investment Operations | ||
| Net investment income (loss)B | .13 | .06 |
| Net realized and unrealized gain (loss) | (.24) | .60 |
| Total from investment operations | (.11) | .66 |
| Distributions from net investment income | (.10) | – |
| Distributions from net realized gain | (.02) | – |
| Total distributions | (.12) | – |
| Net asset value, end of period | $10.43 | $10.66 |
| Total ReturnC,D | (1.08)% | 6.60% |
| Ratios to Average Net AssetsE,F | ||
| Expenses before reductions | - %G,H | - %G,H |
| Expenses net of fee waivers, if any | - %G,H | - %G,H |
| Expenses net of all reductions | - %G,H | - %G,H |
| Net investment income (loss) | 2.39%G | 2.62%G |
| Supplemental Data | ||
| Net assets, end of period (000 omitted) | $1,479,634 | $1,476,967 |
| Portfolio turnover rateI | 36%G | 3%J |
A For the period August 15, 2017 (commencement of operations) to October 31, 2017.
B Calculated based on average shares outstanding during the period.
C Total returns for periods of less than one year are not annualized.
D Total returns would have been lower if certain expenses had not been reduced during the applicable periods shown.
E Fees and expenses of any underlying Fidelity Central Funds are not included in the Fund's expense ratio. The Fund indirectly bears its proportionate share of the expenses of any underlying Fidelity Central Funds.
F Expense ratios reflect operating expenses of the Fund. Expenses before reductions do not reflect amounts reimbursed by the investment adviser or reductions from brokerage service arrangements or reductions from other expense offset arrangements and do not represent the amount paid by the Fund during periods when reimbursements or reductions occur. Expense ratios before reductions for start-up periods may not be representative of longer term operating periods. Expenses net of fee waivers reflect expenses after reimbursement by the investment adviser but prior to reductions from brokerage service arrangements or other expense offset arrangements. Expenses net of all reductions represent the net expenses paid by the Fund.
G Annualized
H Amount represents less than .005%.
I Amount does not include the portfolio activity of any underlying Fidelity Central Funds.
J Amount not annualized.
See accompanying notes which are an integral part of the financial statements.
Notes to Financial Statements (Unaudited)
For the period ended April 30, 2018
1. Organization.
Fidelity Series Canada Fund (the Fund) is a fund of Fidelity Investment Trust (the Trust) and is authorized to issue an unlimited number of shares. Shares of the Fund are only available for purchase by mutual funds for which Fidelity Management & Research Company (FMR) or an affiliate serves as an investment manager. The Trust is registered under the Investment Company Act of 1940, as amended (the 1940 Act), as an open-end management investment company organized as a Massachusetts business trust.
2. Investments in Fidelity Central Funds.
The Fund invests in Fidelity Central Funds, which are open-end investment companies generally available only to other investment companies and accounts managed by the investment adviser and its affiliates. The Fund's Schedule of Investments lists each of the Fidelity Central Funds held as of period end, if any, as an investment of the Fund, but does not include the underlying holdings of each Fidelity Central Fund. As an Investing Fund, the Fund indirectly bears its proportionate share of the expenses of the underlying Fidelity Central Funds.
The Money Market Central Funds seek preservation of capital and current income and are managed by Fidelity Investments Money Management, Inc. (FIMM), an affiliate of the investment adviser. Annualized expenses of the Money Market Central Funds as of their most recent shareholder report date are less than .005%.
A complete unaudited list of holdings for each Fidelity Central Fund is available upon request or at the Securities and Exchange Commission (the SEC) website at www.sec.gov. In addition, the financial statements of the Fidelity Central Funds are available on the SEC website or upon request.
3. Significant Accounting Policies.
The Fund is an investment company and applies the accounting and reporting guidance of the Financial Accounting Standards Board (FASB) Accounting Standards Codification Topic 946 Financial Services – Investments Companies. The financial statements have been prepared in conformity with accounting principles generally accepted in the United States of America (GAAP), which require management to make certain estimates and assumptions at the date of the financial statements. Actual results could differ from those estimates. Subsequent events, if any, through the date that the financial statements were issued have been evaluated in the preparation of the financial statements. The following summarizes the significant accounting policies of the Fund:
Investment Valuation. Investments are valued as of 4:00 p.m. Eastern time on the last calendar day of the period. The Board of Trustees (the Board) has delegated the day to day responsibility for the valuation of the Fund's investments to the Fair Value Committee (the Committee) established by the Fund's investment adviser. In accordance with valuation policies and procedures approved by the Board, the Fund attempts to obtain prices from one or more third party pricing vendors or brokers to value its investments. When current market prices, quotations or currency exchange rates are not readily available or reliable, investments will be fair valued in good faith by the Committee, in accordance with procedures adopted by the Board. Factors used in determining fair value vary by investment type and may include market or investment specific events. The frequency with which these procedures are used cannot be predicted and they may be utilized to a significant extent. The Committee oversees the Fund's valuation policies and procedures and reports to the Board on the Committee's activities and fair value determinations. The Board monitors the appropriateness of the procedures used in valuing the Fund's investments and ratifies the fair value determinations of the Committee.
The Fund categorizes the inputs to valuation techniques used to value its investments into a disclosure hierarchy consisting of three levels as shown below:
- Level 1 – quoted prices in active markets for identical investments
- Level 2 – other significant observable inputs (including quoted prices for similar investments, interest rates, prepayment speeds, etc.)
- Level 3 – unobservable inputs (including the Fund's own assumptions based on the best information available)
Valuation techniques used to value the Fund's investments by major category are as follows:
Equity securities, including restricted securities, for which market quotations are readily available, are valued at the last reported sale price or official closing price as reported by a third party pricing vendor on the primary market or exchange on which they are traded and are categorized as Level 1 in the hierarchy. In the event there were no sales during the day or closing prices are not available, securities are valued at the last quoted bid price or may be valued using the last available price and are generally categorized as Level 2 in the hierarchy. For foreign equity securities, when market or security specific events arise, comparisons to the valuation of American Depositary Receipts (ADRs), futures contracts, Exchange-Traded Funds (ETFs) and certain indexes as well as quoted prices for similar securities may be used and would be categorized as Level 2 in the hierarchy. Utilizing these techniques may result in transfers between Level 1 and Level 2. For equity securities, including restricted securities, where observable inputs are limited, assumptions about market activity and risk are used and these securities may be categorized as Level 3 in the hierarchy.
Investments in open-end mutual funds, including the Fidelity Central Funds, are valued at their closing net asset value (NAV) each business day and are categorized as Level 1 in the hierarchy.
Changes in valuation techniques may result in transfers in or out of an assigned level within the disclosure hierarchy.
Foreign Currency. The Fund may use foreign currency contracts to facilitate transactions in foreign-denominated securities. Gains and losses from these transactions may arise from changes in the value of the foreign currency or if the counterparties do not perform under the contracts' terms.
Foreign-denominated assets, including investment securities, and liabilities are translated into U.S. dollars at the exchange rates at period end. Purchases and sales of investment securities, income and dividends received and expenses denominated in foreign currencies are translated into U.S. dollars at the exchange rate in effect on the transaction date.
The effects of exchange rate fluctuations on investments are included with the net realized and unrealized gain (loss) on investment securities. Other foreign currency transactions resulting in realized and unrealized gain (loss) are disclosed separately.
Investment Transactions and Income. For financial reporting purposes, the Fund's investment holdings and NAV include trades executed through the end of the last business day of the period. The NAV per share for processing shareholder transactions is calculated as of the close of business of the New York Stock Exchange (NYSE), normally 4:00 p.m. Eastern time and includes trades executed through the end of the prior business day. Gains and losses on securities sold are determined on the basis of identified cost. Dividend income is recorded on the ex-dividend date, except for certain dividends from foreign securities where the ex-dividend date may have passed, which are recorded as soon as the Fund is informed of the ex-dividend date. Non-cash dividends included in dividend income, if any, are recorded at the fair market value of the securities received. Income and capital gain distributions from Fidelity Central Funds, if any, are recorded on the ex-dividend date. Investment income is recorded net of foreign taxes withheld where recovery of such taxes is uncertain.
Expenses. Expenses directly attributable to a fund are charged to that fund. Expenses attributable to more than one fund are allocated among the respective funds on the basis of relative net assets or other appropriate methods. Expense estimates are accrued in the period to which they relate and adjustments are made when actual amounts are known.
Income Tax Information and Distributions to Shareholders. Each year, the Fund intends to qualify as a regulated investment company under Subchapter M of the Internal Revenue Code, including distributing substantially all of its taxable income and realized gains. As a result, no provision for U.S. Federal income taxes is required. The Fund files a U.S. federal tax return, in addition to state and local tax returns as required. The Fund's federal income tax returns are subject to examination by the Internal Revenue Service (IRS) for a period of three fiscal years after they are filed. State and local tax returns may be subject to examination for an additional fiscal year depending on the jurisdiction. Foreign taxes are provided for based on the Fund's understanding of the tax rules and rates that exist in the foreign markets in which it invests.
Distributions are declared and recorded on the ex-dividend date. Income and capital gain distributions are determined in accordance with income tax regulations, which may differ from GAAP.
Capital accounts within the financial statements are adjusted for permanent book-tax differences. These adjustments have no impact on net assets or the results of operations. Capital accounts are not adjusted for temporary book-tax differences which will reverse in a subsequent period.
Book-tax differences are primarily due to foreign currency transactions, passive foreign investment companies (PFIC), capital loss carryforwards and losses deferred due to wash sales.
As of period end, the cost and unrealized appreciation (depreciation) in securities, and derivatives if applicable, for federal income tax purposes were as follows:
| Gross unrealized appreciation | $72,010,274 |
| Gross unrealized depreciation | (56,019,344) |
| Net unrealized appreciation (depreciation) | $15,990,930 |
| Tax cost | $1,463,405,229 |
Capital loss carryforwards are only available to offset future capital gains of the Fund to the extent provided by regulations and may be limited. Under the Regulated Investment Company Modernization Act of 2010 (the Act), the Fund is permitted to carry forward capital losses incurred in taxable years beginning after December 22, 2010 for an unlimited period and such capital losses are required to be used prior to any losses that expire. The capital loss carryforward information presented below, including any applicable limitation, is estimated as of prior fiscal period end and is subject to adjustment.
| No expiration | |
| Short-term | $(387,362) |
| Long-term | (647) |
| Total capital loss carryforward | $(388,009) |
Restricted Securities. The Fund may invest in securities that are subject to legal or contractual restrictions on resale. These securities generally may be resold in transactions exempt from registration or to the public if the securities are registered. Disposal of these securities may involve time-consuming negotiations and expense, and prompt sale at an acceptable price may be difficult. Information regarding restricted securities is included at the end of the Fund's Schedule of Investments.
4. Purchases and Sales of Investments.
Purchases and sales of securities, other than short-term securities, aggregated $292,317,104 and $261,516,538, respectively.
5. Fees and Other Transactions with Affiliates.
Management Fee. Fidelity Management & Research Company (the investment adviser) and its affiliates provide the Fund with investment management related services for which the Fund does not pay a management fee. Under the management contract, the investment adviser or an affiliate pays all ordinary operating expenses of the Fund, except custody fees, fees and expenses of the independent Trustees, and certain miscellaneous expenses such as proxy and shareholder meeting expenses.
Interfund Trades. The Fund may purchase from or sell securities to other Fidelity Funds under procedures adopted by the Board. The procedures have been designed to ensure these interfund trades are executed in accordance with Rule 17a-7 of the 1940 Act. Interfund trades are included within the respective purchases and sales amounts shown in the Purchases and Sales of Investments note.
6. Committed Line of Credit.
The Fund participates with other funds managed by the investment adviser or an affiliate in a $4.25 billion credit facility (the "line of credit") to be utilized for temporary or emergency purposes to fund shareholder redemptions or for other short-term liquidity purposes. The Fund has agreed to pay commitment fees on its pro-rata portion of the line of credit, which amounted to $305 and is reflected in Miscellaneous expenses on the Statement of Operations. During the period, the Fund did not borrow on this line of credit.
7. Security Lending.
The Fund lends portfolio securities through a lending agent from time to time in order to earn additional income. For equity securities, a lending agent is used and may loan securities to certain qualified borrowers, including Fidelity Capital Markets (FCM), a broker-dealer affiliated with the Fund. On the settlement date of the loan, the Fund receives collateral (in the form of U.S. Treasury obligations, letters of credit and/or cash) against the loaned securities and maintains collateral in an amount not less than 100% of the market value of the loaned securities during the period of the loan. The market value of the loaned securities is determined at the close of business of the Fund and any additional required collateral is delivered to the Fund on the next business day. The Fund or borrower may terminate the loan at any time, and if the borrower defaults on its obligation to return the securities loaned because of insolvency or other reasons, the Fund may apply collateral received from the borrower against the obligation. The Fund may experience delays and costs in recovering the securities loaned. Any cash collateral received is invested in the Fidelity Securities Lending Cash Central Fund. The value of loaned securities and cash collateral at period end are disclosed on the Fund's Statement of Assets and Liabilities. Security lending income represents the income earned on investing cash collateral, less rebates paid to borrowers and any lending agent fees associated with the loan, plus any premium payments received for lending certain types of securities. Security lending income is presented in the Statement of Operations as a component of income from Fidelity Central Funds. Total security lending income during the period amounted to $632. During the period, there were no securities loaned to FCM.
8. Other.
The Fund's organizational documents provide former and current trustees and officers with a limited indemnification against liabilities arising in connection with the performance of their duties to the Fund. In the normal course of business, the Fund may also enter into contracts that provide general indemnifications. The Fund's maximum exposure under these arrangements is unknown as this would be dependent on future claims that may be made against the Fund. The risk of material loss from such claims is considered remote.
At the end of the period, mutual funds managed by the investment adviser or its affiliates were the owners of record of all of the outstanding shares of the Fund.
Shareholder Expense Example
As a shareholder of the Fund, you incur two types of costs: (1) transaction costs and (2) ongoing costs, including other Fund expenses. This Example is intended to help you understand your ongoing costs (in dollars) of investing in the Fund and to compare these costs with the ongoing costs of investing in other mutual funds.
The Example is based on an investment of $1,000 invested at the beginning of the period and held for the entire period (November 1, 2017 to April 30, 2018).
Actual Expenses
The first line of the accompanying table provides information about actual account values and actual expenses. You may use the information in this line, together with the amount you invested, to estimate the expenses that you paid over the period. Simply divide your account value by $1,000.00 (for example, an $8,600 account value divided by $1,000.00 = 8.6), then multiply the result by the number in the first line under the heading entitled "Expenses Paid During Period" to estimate the expenses you paid on your account during this period. In addition, the Fund, as a shareholder in the underlying Fidelity Central Funds, will indirectly bear its pro-rata share of the fees and expenses incurred by the underlying Fidelity Central Funds. These fees and expenses are not included in the Fund's annualized expense ratio used to calculate the expense estimate in the table below.
Hypothetical Example for Comparison Purposes
The second line of the accompanying table provides information about hypothetical account values and hypothetical expenses based on the Fund's actual expense ratio and an assumed rate of return of 5% per year before expenses, which is not the Fund's actual return. The hypothetical account values and expenses may not be used to estimate the actual ending account balance or expenses you paid for the period. You may use this information to compare the ongoing costs of investing in the Fund and other funds. To do so, compare this 5% hypothetical example with the 5% hypothetical examples that appear in the shareholder reports of the other funds. In addition, the Fund, as a shareholder in the underlying Fidelity Central Funds, will indirectly bear its pro-rata share of the fees and expenses incurred by the underlying Fidelity Central Funds. These fees and expenses are not included in the Fund's annualized expense ratio used to calculate the expense estimate in the table below.
Please note that the expenses shown in the table are meant to highlight your ongoing costs only and do not reflect any transaction costs. Therefore, the second line of the table is useful in comparing ongoing costs only, and will not help you determine the relative total costs of owning different funds.
| Annualized Expense Ratio-A | Beginning Account Value November 1, 2017 | Ending Account Value April 30, 2018 | Expenses Paid During Period-B November 1, 2017 to April 30, 2018 | |
| Actual | -%C | $1,000.00 | $989.20 | $--D |
| Hypothetical-E | $1,000.00 | $1,024.79 | $--D |
A Annualized expense ratio reflects expenses net of applicable fee waivers.
B Expenses are equal to the Fund's annualized expense ratio, multiplied by the average account value over the period, multiplied by 181/365 (to reflect the one-half year period).
C Amount represents less than .005%.
D Amount represents less than $.005.
E 5% return per year before expenses
![]()
SAD-SANN-0618
1.9883883.100
Item 2.
Code of Ethics
Not applicable.
Item 3.
Audit Committee Financial Expert
Not applicable.
Item 4.
Principal Accountant Fees and Services
Not applicable.
Item 5.
Audit Committee of Listed Registrants
Not applicable.
Item 6.
Investments
(a)
Not applicable.
(b)
Not applicable
Item 7.
Disclosure of Proxy Voting Policies and Procedures for Closed-End Management Investment Companies
Not applicable.
Item 8.
Portfolio Managers of Closed-End Management Investment Companies
Not applicable.
Item 9.
Purchase of Equity Securities by Closed-End Management Investment Company and Affiliated Purchasers
Not applicable.
Item 10.
Submission of Matters to a Vote of Security Holders
There were no material changes to the procedures by which shareholders may recommend nominees to the Fidelity Investment Trust’s Board of Trustees.
Item 11.
Controls and Procedures
(a)(i) The President and Treasurer and the Chief Financial Officer have concluded that the Fidelity Investment Trust’s (the “Trust”) disclosure controls and procedures (as defined in Rule 30a-3(c) under the Investment Company Act) provide reasonable
assurances that material information relating to the Trust is made known to them by the appropriate persons, based on their evaluation of these controls and procedures as of a date within 90 days of the filing date of this report.
(a)(ii) There was no change in the Trust’s internal control over financial reporting (as defined in Rule 30a-3(d) under the Investment Company Act) that occurred during the period covered by this report that has materially affected, or is reasonably likely to materially affect, the Trust’s internal control over financial reporting.
Item 12.
Disclosure of Securities Lending Activities for Closed-End Management
Investment Companies
Not applicable.
Item 13.
Exhibits
(a) | (1) | Not applicable. |
(a) | (2) | Certification pursuant to Rule 30a-2(a) under the Investment Company Act of 1940 (17 CFR 270.30a-2(a)) is filed and attached hereto as Exhibit 99.CERT. |
(a) | (3) | Not applicable. |
(b) | Certification pursuant to Rule 30a-2(b) under the Investment Company Act of 1940 (17 CFR 270.30a-2(b)) is furnished and attached hereto as Exhibit 99.906CERT. |
SIGNATURES
Pursuant to the requirements of the Securities Exchange Act of 1934 and the Investment Company Act of 1940, the registrant has duly caused this report to be signed on its behalf by the undersigned, thereunto duly authorized.
Fidelity Investment Trust
By: | /s/Stacie M. Smith |
Stacie M. Smith | |
President and Treasurer | |
Date: | June 27, 2018 |
Pursuant to the requirements of the Securities Exchange Act of 1934 and the Investment Company Act of 1940, this report has been signed below by the following persons on behalf of the registrant and in the capacities and on the dates indicated.
By: | /s/Stacie M. Smith |
Stacie M. Smith | |
President and Treasurer | |
Date: | June 27, 2018 |
By: | /s/Howard J. Galligan III |
Howard J. Galligan III | |
Chief Financial Officer | |
Date: | June 27, 2018 |