UNITED STATES
SECURITIES AND EXCHANGE COMMISSION
Washington, D.C. 20549
FORM N-CSR
CERTIFIED SHAREHOLDER REPORT OF REGISTERED
MANAGEMENT INVESTMENT COMPANIES
Investment Company Act file number 811-4008
Fidelity Investment Trust
(Exact name of registrant as specified in charter)
245 Summer St., Boston, Massachusetts 02210
(Address of principal executive offices) (Zip code)
William C. Coffey, Secretary
245 Summer St.
Boston, Massachusetts 02210
(Name and address of agent for service)
Registrant's telephone number, including area code:
617-563-7000
Date of fiscal year end: | October 31 |
Date of reporting period: | October 31, 2018 |
This report on Form N-CSR relates solely to the Registrant’s Fidelity Canada Fund, Fidelity China Region Fund, Fidelity Emerging Asia Fund, Fidelity Emerging Markets Fund, Fidelity Europe Fund, Fidelity Japan Fund, Fidelity Japan Smaller Companies Fund, Fidelity Latin America Fund, Fidelity Nordic Fund and Fidelity Pacific Basin Fund (each, a “Fund” and collectively, the “Funds”).
Item 1.
Reports to Stockholders
Fidelity Advisor® Canada Fund - Class A, Class M, Class C, Class I and Class Z Annual Report October 31, 2018 Class A, Class M, Class C, Class I and Class Z are classes of Fidelity® Canada Fund |
 |
Contents
To view a fund's proxy voting guidelines and proxy voting record for the 12-month period ended June 30, visit http://www.fidelity.com/proxyvotingresults or visit the Securities and Exchange Commission's (SEC) web site at http://www.sec.gov.
You may also call 1-877-208-0098 to request a free copy of the proxy voting guidelines.
Standard & Poor's, S&P and S&P 500 are registered service marks of The McGraw-Hill Companies, Inc. and have been licensed for use by Fidelity Distributors Corporation.
Other third-party marks appearing herein are the property of their respective owners.
All other marks appearing herein are registered or unregistered trademarks or service marks of FMR LLC or an affiliated company. © 2018 FMR LLC. All rights reserved.
This report and the financial statements contained herein are submitted for the general information of the shareholders of the Fund. This report is not authorized for distribution to prospective investors in the Fund unless preceded or accompanied by an effective prospectus.
A fund files its complete schedule of portfolio holdings with the SEC for the first and third quarters of each fiscal year on Form N-Q. Forms N-Q are available on the SEC’s web site at http://www.sec.gov. A fund's Forms N-Q may be reviewed and copied at the SEC’s Public Reference Room in Washington, DC. Information regarding the operation of the SEC's Public Reference Room may be obtained by calling 1-800-SEC-0330.
For a complete list of a fund's portfolio holdings, view the most recent holdings listing, semiannual report, or annual report on Fidelity's web site at http://www.fidelity.com, http://www.institutional.fidelity.com, or http://www.401k.com, as applicable.
NOT FDIC INSURED •MAY LOSE VALUE •NO BANK GUARANTEE
Neither the Fund nor Fidelity Distributors Corporation is a bank.
Performance: The Bottom Line
Average annual total return reflects the change in the value of an investment, assuming reinvestment of distributions from dividend income and capital gains (the profits earned upon the sale of securities that have grown in value, if any) and assuming a constant rate of performance each year. The hypothetical investment and the average annual total returns do not reflect the deduction of taxes that a shareholder would pay on fund distributions or the redemption of fund shares. During periods of reimbursement by Fidelity, a fund’s total return will be greater than it would be had the reimbursement not occurred. How a fund did yesterday is no guarantee of how it will do tomorrow.
Average Annual Total Returns
| For the periods ended October 31, 2018 | Past 1 year | Past 5 years | Past 10 years |
| Class A (incl. 5.75% sales charge) | (11.58)% | (0.27)% | 4.49% |
| Class M (incl. 3.50% sales charge) | (9.74)% | (0.10)% | 4.43% |
| Class C (incl. contingent deferred sales charge) | (7.77)% | 0.18% | 4.34% |
| Class I | (5.86)% | 1.25% | 5.44% |
| Class Z | (5.84)% | 1.25% | 5.44% |
Class C shares' contingent deferred sales charges included in the past one year, past five years and past ten years total return figures are 1%, 0% and 0%, respectively.
The initial offering of Class Z shares took place on October 2, 2018. Returns prior to October 2, 2018, are those of Class I.
$10,000 Over 10 Years
Let's say hypothetically that $10,000 was invested in Fidelity Advisor® Canada Fund - Class A on October 31, 2008, and the current 5.75% sales charge was paid.
The chart shows how the value of your investment would have changed, and also shows how the S&P/TSX Composite Index performed over the same period.
| Period Ending Values | ||
| $15,515 | Fidelity Advisor® Canada Fund - Class A | |
| $19,181 | S&P/TSX Composite Index | |
Management's Discussion of Fund Performance
Market Recap: International equities returned -8.08% for the 12 months ending October 31, 2018, according to the MSCI ACWI (All Country World Index) ex USA Index. A modestly positive first half of the period gave way to a confluence of overwhelmingly negative factors – including escalating trade tension, a surging U.S. dollar, tepid economic growth in Europe, global central bank tightening, concerns about Italy’s budget stalemate with the EU, and weakness in China’s stock market – that yielded a -11% second-half return. The index lost 8% in October alone, its largest monthly drop in more than six years. Among sectors, new-media-infused communications services (-15%) was hit the hardest, while economically sensitive consumer discretionary (-13%), information technology (-12%), financials (-10%), industrials (-9%) and materials (-7%) stocks also fared poorly. Even the more defensive real estate (-9%), utilities (-6%) and consumer staples (-5%) sectors weren’t spared this period. Conversely, elevated crude-oil prices fueled a positive return for energy (+7%), the top-performing sector, followed by the relatively stable-growing health care segment (+2%). Regionally, emerging markets (-12%) fared the worst, hampered by the impact of foreign exchange and concerns about economic weakness in China, India and South Korea. Sluggish growth also pressured shares in continental Europe (-9%). Stocks in Japan (-3%) and the U.K. (-4%) held up better, followed by Canada (-5%) and Asia-Pacific ex Japan (-6%).Comments from Portfolio Manager Ryan Oldham: For the fiscal year, the fund's share classes (excluding sales charges, if applicable) returned roughly -6% to -7%, trailing the -5.34% return of the benchmark S&P/TSX Composite Index. Volatile crude-oil prices dampened returns from resource-rich Canada, falling behind those in the United States, as measured by the S&P 500® Index. Versus the S&P/TSX Composite Index, stock selection in energy and materials detracted, as did positioning in health care. At the stock level, overweighted positions PrairieSky Royalty, which derives royalties from oil and gas production on its land, and oilfield services company CES Energy Solutions were the fund's most significant individual detractors. A weakened oil production outlook weighed on shares of PrairieSky, while reduced drilling in North America hindered results for CES. Conversely, stock selection in industrials and financials proved advantageous. In the transportation industry, the fund’s stake in Canadian Pacific Railway benefited from a return on equity, strong pricing power and strong volumes this period, all positive factors that encouraged investors and helped buoy its share price. An outsized position in financial media and information provider Thomson Reuters also contributed.The views expressed above reflect those of the portfolio manager(s) only through the end of the period as stated on the cover of this report and do not necessarily represent the views of Fidelity or any other person in the Fidelity organization. Any such views are subject to change at any time based upon market or other conditions and Fidelity disclaims any responsibility to update such views. These views may not be relied on as investment advice and, because investment decisions for a Fidelity fund are based on numerous factors, may not be relied on as an indication of trading intent on behalf of any Fidelity fund.
Note to Shareholders: On June 13, 2018, Ryan Oldham assumed co-management responsibilities for the fund, joining Risteard Hogan until July 30, 2018, when Risteard came off the fund, leaving Ryan Oldham as sole portfolio manager.Investment Summary (Unaudited)
Geographic Diversification (% of fund's net assets)
| As of October 31, 2018 | ||
| Canada | 98.2% | |
| United States of America* | 1.8% | |

* Includes Short-Term investments and Net Other Assets (Liabilities).
Percentages are based on country or territory of incorporation and are adjusted for the effect of futures contracts, if applicable.
Asset Allocation as of October 31, 2018
| % of fund's net assets | |
| Stocks | 99.0 |
| Short-Term Investments and Net Other Assets (Liabilities) | 1.0 |
Top Ten Stocks as of October 31, 2018
| % of fund's net assets | |
| The Toronto-Dominion Bank (Banks) | 10.5 |
| Royal Bank of Canada (Banks) | 10.1 |
| Suncor Energy, Inc. (Oil, Gas & Consumable Fuels) | 6.3 |
| Canadian Pacific Railway Ltd. (Road & Rail) | 5.5 |
| TELUS Corp. (Diversified Telecommunication Services) | 4.2 |
| Nutrien Ltd. (Chemicals) | 4.2 |
| Sun Life Financial, Inc. (Insurance) | 4.0 |
| Alimentation Couche-Tard, Inc. Class B (sub. vtg.) (Food & Staples Retailing) | 3.7 |
| Canadian National Railway Co. (Road & Rail) | 3.6 |
| Rogers Communications, Inc. Class B (non-vtg.) (Wireless Telecommunication Services) | 3.2 |
| 55.3 |
Top Market Sectors as of October 31, 2018
| % of fund's net assets | |
| Financials | 33.6 |
| Energy | 17.4 |
| Materials | 11.5 |
| Industrials | 10.5 |
| Communication Services | 9.0 |
| Consumer Staples | 7.6 |
| Information Technology | 5.3 |
| Consumer Discretionary | 2.5 |
| Real Estate | 0.8 |
| Health Care | 0.8 |
Market Sectors may include more than one industry category.
The Fund may invest up to 35% of its total assets in any industry that represents more than 20% of the Canadian market. As of October 31, 2018, the Fund did not have more than 25% of its total assets invested in any one industry.
Schedule of Investments October 31, 2018
Showing Percentage of Net Assets
| Common Stocks - 99.0% | |||
| Shares | Value | ||
| COMMUNICATION SERVICES - 9.0% | |||
| Diversified Telecommunication Services - 4.2% | |||
| TELUS Corp. | 1,215,500 | $41,623,108 | |
| Media - 1.6% | |||
| Cogeco Communications, Inc. | 160,400 | 7,864,955 | |
| Quebecor, Inc. Class B (sub. vtg.) | 404,900 | 7,941,447 | |
| 15,806,402 | |||
| Wireless Telecommunication Services - 3.2% | |||
| Rogers Communications, Inc. Class B (non-vtg.) | 599,700 | 30,881,281 | |
| TOTAL COMMUNICATION SERVICES | 88,310,791 | ||
| CONSUMER DISCRETIONARY - 2.5% | |||
| Hotels, Restaurants & Leisure - 0.5% | |||
| Recipe Unlimited Corp. | 222,000 | 4,580,136 | |
| Leisure Products - 0.8% | |||
| Spin Master Corp. (a)(b) | 234,200 | 8,332,962 | |
| Multiline Retail - 1.2% | |||
| Dollarama, Inc. | 417,600 | 11,549,862 | |
| TOTAL CONSUMER DISCRETIONARY | 24,462,960 | ||
| CONSUMER STAPLES - 7.6% | |||
| Food & Staples Retailing - 7.6% | |||
| Alimentation Couche-Tard, Inc. Class B (sub. vtg.) | 764,300 | 36,500,848 | |
| George Weston Ltd. | 256,900 | 18,685,233 | |
| Metro, Inc. Class A (sub. vtg.) | 375,295 | 11,776,700 | |
| North West Co., Inc. | 359,900 | 7,846,200 | |
| 74,808,981 | |||
| ENERGY - 17.4% | |||
| Energy Equipment & Services - 0.6% | |||
| Canadian Energy Services & Technology Corp. | 2,417,400 | 6,408,695 | |
| Oil, Gas & Consumable Fuels - 16.8% | |||
| Canadian Natural Resources Ltd. | 1,066,298 | 29,256,473 | |
| Cenovus Energy, Inc. (Canada) | 1,228,200 | 10,393,215 | |
| Enbridge, Inc. | 760,500 | 23,696,844 | |
| Peyto Exploration & Development Corp. (c) | 608,900 | 4,967,592 | |
| Pinnacle Renewable Holds, Inc. | 408,500 | 4,493,205 | |
| PrairieSky Royalty Ltd. (c) | 1,961,618 | 29,801,633 | |
| Suncor Energy, Inc. | 1,842,600 | 61,809,576 | |
| 164,418,538 | |||
| TOTAL ENERGY | 170,827,233 | ||
| FINANCIALS - 33.6% | |||
| Banks - 20.6% | |||
| Royal Bank of Canada | 1,357,700 | 98,925,583 | |
| The Toronto-Dominion Bank | 1,859,700 | 103,166,768 | |
| 202,092,351 | |||
| Capital Markets - 4.3% | |||
| Fairfax India Holdings Corp. (a)(b) | 102,000 | 1,294,380 | |
| Gluskin Sheff + Associates, Inc. | 257,900 | 2,198,061 | |
| IGM Financial, Inc. | 376,400 | 9,243,809 | |
| Thomson Reuters Corp. | 626,300 | 29,149,152 | |
| 41,885,402 | |||
| Insurance - 8.7% | |||
| Intact Financial Corp. | 302,325 | 23,886,075 | |
| Power Corp. of Canada (sub. vtg.) | 1,060,900 | 21,903,803 | |
| Sun Life Financial, Inc. | 1,061,100 | 38,858,772 | |
| 84,648,650 | |||
| TOTAL FINANCIALS | 328,626,403 | ||
| HEALTH CARE - 0.8% | |||
| Biotechnology - 0.8% | |||
| Amgen, Inc. | 38,300 | 7,383,857 | |
| INDUSTRIALS - 10.5% | |||
| Aerospace & Defense - 0.7% | |||
| CAE, Inc. | 401,100 | 7,074,740 | |
| Road & Rail - 9.8% | |||
| Canadian National Railway Co. | 406,500 | 34,750,663 | |
| Canadian Pacific Railway Ltd. | 262,500 | 53,831,991 | |
| TransForce, Inc. | 203,100 | 6,758,943 | |
| 95,341,597 | |||
| TOTAL INDUSTRIALS | 102,416,337 | ||
| INFORMATION TECHNOLOGY - 5.3% | |||
| IT Services - 2.1% | |||
| CGI Group, Inc. Class A (sub. vtg.) (a) | 338,800 | 20,923,271 | |
| Software - 3.2% | |||
| Constellation Software, Inc. | 22,300 | 15,347,353 | |
| Open Text Corp. | 461,028 | 15,563,131 | |
| 30,910,484 | |||
| TOTAL INFORMATION TECHNOLOGY | 51,833,755 | ||
| MATERIALS - 11.5% | |||
| Chemicals - 4.2% | |||
| Nutrien Ltd. | 784,581 | 41,534,012 | |
| Containers & Packaging - 1.3% | |||
| CCL Industries, Inc. Class B | 295,100 | 12,414,173 | |
| Metals & Mining - 5.5% | |||
| Franco-Nevada Corp. | 460,600 | 28,767,163 | |
| Lundin Mining Corp. | 1,694,600 | 6,964,021 | |
| OceanaGold Corp. | 524,300 | 1,509,436 | |
| Wheaton Precious Metals Corp. | 998,900 | 16,420,066 | |
| 53,660,686 | |||
| Paper & Forest Products - 0.5% | |||
| Western Forest Products, Inc. | 3,717,600 | 4,970,167 | |
| TOTAL MATERIALS | 112,579,038 | ||
| REAL ESTATE - 0.8% | |||
| Equity Real Estate Investment Trusts (REITs) - 0.8% | |||
| Allied Properties (REIT) | 252,800 | 8,122,937 | |
| TOTAL COMMON STOCKS | |||
| (Cost $749,958,585) | 969,372,292 | ||
| Money Market Funds - 2.1% | |||
| Fidelity Cash Central Fund, 2.23% (d) | 7,133,529 | 7,134,956 | |
| Fidelity Securities Lending Cash Central Fund 2.23% (d)(e) | 13,305,233 | 13,306,564 | |
| TOTAL MONEY MARKET FUNDS | |||
| (Cost $20,441,520) | 20,441,520 | ||
| TOTAL INVESTMENT IN SECURITIES - 101.1% | |||
| (Cost $770,400,105) | 989,813,812 | ||
| NET OTHER ASSETS (LIABILITIES) - (1.1)% | (10,641,430) | ||
| NET ASSETS - 100% | $979,172,382 |
Legend
(a) Non-income producing
(b) Security exempt from registration under Rule 144A of the Securities Act of 1933. These securities may be resold in transactions exempt from registration, normally to qualified institutional buyers. At the end of the period, the value of these securities amounted to $9,627,342 or 1.0% of net assets.
(c) Security or a portion of the security is on loan at period end.
(d) Affiliated fund that is generally available only to investment companies and other accounts managed by Fidelity Investments. The rate quoted is the annualized seven-day yield of the fund at period end. A complete unaudited listing of the fund's holdings as of its most recent quarter end is available upon request. In addition, each Fidelity Central Fund's financial statements, which are not covered by the Fund's Report of Independent Registered Public Accounting Firm, are available on the SEC's website or upon request.
(e) Investment made with cash collateral received from securities on loan.
Affiliated Central Funds
Information regarding fiscal year to date income earned by the Fund from investments in Fidelity Central Funds is as follows:
| Fund | Income earned |
| Fidelity Cash Central Fund | $363,826 |
| Fidelity Securities Lending Cash Central Fund | 214,540 |
| Total | $578,366 |
Amounts in the income column in the above table include any capital gain distributions from underlying funds, which are presented in the corresponding line-item in the Statement of Operations if applicable.
Investment Valuation
All investments are categorized as Level 1 under the Fair Value Hierarchy. The inputs or methodology used for valuing securities may not be an indication of the risk associated with investing in those securities. For more information on valuation inputs please refer to the Investment Valuation section in the accompanying Notes to Financial Statements.
See accompanying notes which are an integral part of the financial statements.
Financial Statements
Statement of Assets and Liabilities
| October 31, 2018 | ||
| Assets | ||
| Investment in securities, at value (including securities loaned of $12,532,599) — See accompanying schedule: Unaffiliated issuers (cost $749,958,585) | $969,372,292 | |
| Fidelity Central Funds (cost $20,441,520) | 20,441,520 | |
| Total Investment in Securities (cost $770,400,105) | $989,813,812 | |
| Foreign currency held at value (cost $28,094) | 28,094 | |
| Receivable for investments sold | 2,076,289 | |
| Receivable for fund shares sold | 1,897,756 | |
| Dividends receivable | 1,976,133 | |
| Distributions receivable from Fidelity Central Funds | 48,996 | |
| Prepaid expenses | 2,051 | |
| Other receivables | 9,065 | |
| Total assets | 995,852,196 | |
| Liabilities | ||
| Payable for investments purchased | $1,927,052 | |
| Payable for fund shares redeemed | 651,179 | |
| Accrued management fee | 490,053 | |
| Distribution and service plan fees payable | 19,576 | |
| Other affiliated payables | 223,858 | |
| Other payables and accrued expenses | 62,026 | |
| Collateral on securities loaned | 13,306,070 | |
| Total liabilities | 16,679,814 | |
| Net Assets | $979,172,382 | |
| Net Assets consist of: | ||
| Paid in capital | $703,732,664 | |
| Total distributable earnings (loss) | 275,439,718 | |
| Net Assets | $979,172,382 | |
| Net Asset Value and Maximum Offering Price | ||
| Class A: | ||
| Net Asset Value and redemption price per share ($29,419,562÷ 591,312 shares) | $49.75 | |
| Maximum offering price per share (100/94.25 of $49.75) | $52.79 | |
| Class M: | ||
| Net Asset Value and redemption price per share ($7,843,688 ÷ 158,588 shares) | $49.46 | |
| Maximum offering price per share (100/96.50 of $49.46) | $51.25 | |
| Class C: | ||
| Net Asset Value and offering price per share ($11,195,851 ÷ 230,956 shares)(a) | $48.48 | |
| Canada: | ||
| Net Asset Value, offering price and redemption price per share ($903,661,966 ÷ 18,064,442 shares) | $50.02 | |
| Class I: | ||
| Net Asset Value, offering price and redemption price per share ($26,922,861 ÷ 539,185 shares) | $49.93 | |
| Class Z: | ||
| Net Asset Value, offering price and redemption price per share ($128,454 ÷ 2,572 shares) | $49.94 |
(a) Redemption price per share is equal to net asset value less any applicable contingent deferred sales charge.
See accompanying notes which are an integral part of the financial statements.
Statement of Operations
| Year ended October 31, 2018 | ||
| Investment Income | ||
| Dividends | $30,083,685 | |
| Income from Fidelity Central Funds | 578,366 | |
| Income before foreign taxes withheld | 30,662,051 | |
| Less foreign taxes withheld | (4,449,813) | |
| Total income | 26,212,238 | |
| Expenses | ||
| Management fee | ||
| Basic fee | $7,754,853 | |
| Performance adjustment | (744,922) | |
| Transfer agent fees | 2,318,289 | |
| Distribution and service plan fees | 270,797 | |
| Accounting and security lending fees | 522,538 | |
| Custodian fees and expenses | 17,419 | |
| Independent trustees' fees and expenses | 5,663 | |
| Registration fees | 70,270 | |
| Audit | 68,519 | |
| Legal | 5,633 | |
| Miscellaneous | 8,635 | |
| Total expenses before reductions | 10,297,694 | |
| Expense reductions | (65,879) | |
| Total expenses after reductions | 10,231,815 | |
| Net investment income (loss) | 15,980,423 | |
| Realized and Unrealized Gain (Loss) | ||
| Net realized gain (loss) on: | ||
| Investment securities: | ||
| Unaffiliated issuers | 57,279,605 | |
| Fidelity Central Funds | (1,821) | |
| Foreign currency transactions | (44,913) | |
| Total net realized gain (loss) | 57,232,871 | |
| Change in net unrealized appreciation (depreciation) on: | ||
| Investment securities: | ||
| Unaffiliated issuers | (134,483,140) | |
| Assets and liabilities in foreign currencies | 1,384 | |
| Total change in net unrealized appreciation (depreciation) | (134,481,756) | |
| Net gain (loss) | (77,248,885) | |
| Net increase (decrease) in net assets resulting from operations | $(61,268,462) |
See accompanying notes which are an integral part of the financial statements.
Statement of Changes in Net Assets
| Year ended October 31, 2018 | Year ended October 31, 2017 | |
| Increase (Decrease) in Net Assets | ||
| Operations | ||
| Net investment income (loss) | $15,980,423 | $16,819,801 |
| Net realized gain (loss) | 57,232,871 | 52,938,459 |
| Change in net unrealized appreciation (depreciation) | (134,481,756) | 105,995,484 |
| Net increase (decrease) in net assets resulting from operations | (61,268,462) | 175,753,744 |
| Distributions to shareholders | (27,476,751) | – |
| Distributions to shareholders from net investment income | – | (16,443,381) |
| Distributions to shareholders from net realized gain | – | (5,168,976) |
| Total distributions | (27,476,751) | (21,612,357) |
| Share transactions - net increase (decrease) | (157,321,221) | (276,985,730) |
| Redemption fees | 5,144 | 38,887 |
| Total increase (decrease) in net assets | (246,061,290) | (122,805,456) |
| Net Assets | ||
| Beginning of period | 1,225,233,672 | 1,348,039,128 |
| End of period | $979,172,382 | $1,225,233,672 |
| Other Information | ||
| Undistributed net investment income end of period | $13,463,474 |
See accompanying notes which are an integral part of the financial statements.
Financial Highlights
Fidelity Canada Fund Class A
| Years ended October 31, | 2018 | 2017 | 2016 | 2015 | 2014 |
| Selected Per–Share Data | |||||
| Net asset value, beginning of period | $54.11 | $48.09 | $45.25 | $60.56 | $57.31 |
| Income from Investment Operations | |||||
| Net investment income (loss)A | .60 | .50 | .48 | .45 | .47 |
| Net realized and unrealized gain (loss) | (3.88) | 6.16 | 2.84 | (8.04) | 3.13 |
| Total from investment operations | (3.28) | 6.66 | 3.32 | (7.59) | 3.60 |
| Distributions from net investment income | (.59) | (.45) | (.42) | (.50) | (.03) |
| Distributions from net realized gain | (.49) | (.19) | (.06) | (7.22) | (.32) |
| Total distributions | (1.08) | (.64) | (.48) | (7.72) | (.35) |
| Redemption fees added to paid in capitalA,B | – | – | – | – | – |
| Net asset value, end of period | $49.75 | $54.11 | $48.09 | $45.25 | $60.56 |
| Total ReturnC,D | (6.19)% | 13.98% | 7.45% | (14.32)% | 6.32% |
| Ratios to Average Net AssetsE,F | |||||
| Expenses before reductions | 1.21% | 1.34% | 1.48% | 1.43% | 1.29% |
| Expenses net of fee waivers, if any | 1.21% | 1.34% | 1.48% | 1.43% | 1.29% |
| Expenses net of all reductions | 1.20% | 1.34% | 1.48% | 1.43% | 1.29% |
| Net investment income (loss) | 1.13% | .98% | 1.06% | .90% | .79% |
| Supplemental Data | |||||
| Net assets, end of period (000 omitted) | $29,420 | $37,557 | $44,144 | $58,286 | $95,004 |
| Portfolio turnover rateG | 29% | 26% | 44% | 24% | 85% |
A Calculated based on average shares outstanding during the period.
B Amount represents less than $.005 per share.
C Total returns would have been lower if certain expenses had not been reduced during the applicable periods shown.
D Total returns do not include the effect of the sales charges.
E Fees and expenses of any underlying Fidelity Central Funds are not included in the Fund's expense ratio. The Fund indirectly bears its proportionate share of the expenses of any underlying Fidelity Central Funds.
F Expense ratios reflect operating expenses of the class. Expenses before reductions do not reflect amounts reimbursed by the investment adviser or reductions from brokerage service arrangements or reductions from other expense offset arrangements and do not represent the amount paid by the class during periods when reimbursements or reductions occur. Expenses net of fee waivers reflect expenses after reimbursement by the investment adviser but prior to reductions from brokerage service arrangements or other expense offset arrangements. Expenses net of all reductions represent the net expenses paid by the class.
G Amount does not include the portfolio activity of any underlying Fidelity Central Funds.
See accompanying notes which are an integral part of the financial statements.
Fidelity Canada Fund Class M
| Years ended October 31, | 2018 | 2017 | 2016 | 2015 | 2014 |
| Selected Per–Share Data | |||||
| Net asset value, beginning of period | $53.77 | $47.82 | $44.99 | $60.22 | $57.14 |
| Income from Investment Operations | |||||
| Net investment income (loss)A | .44 | .35 | .35 | .29 | .29 |
| Net realized and unrealized gain (loss) | (3.86) | 6.13 | 2.83 | (8.00) | 3.11 |
| Total from investment operations | (3.42) | 6.48 | 3.18 | (7.71) | 3.40 |
| Distributions from net investment income | (.40) | (.34) | (.29) | (.30) | – |
| Distributions from net realized gain | (.49) | (.19) | (.06) | (7.22) | (.32) |
| Total distributions | (.89) | (.53) | (.35) | (7.52) | (.32) |
| Redemption fees added to paid in capitalA,B | – | – | – | – | – |
| Net asset value, end of period | $49.46 | $53.77 | $47.82 | $44.99 | $60.22 |
| Total ReturnC,D | (6.47)% | 13.64% | 7.14% | (14.58)% | 5.99% |
| Ratios to Average Net AssetsE,F | |||||
| Expenses before reductions | 1.51% | 1.63% | 1.77% | 1.75% | 1.59% |
| Expenses net of fee waivers, if any | 1.51% | 1.63% | 1.77% | 1.75% | 1.59% |
| Expenses net of all reductions | 1.51% | 1.63% | 1.77% | 1.75% | 1.59% |
| Net investment income (loss) | .83% | .69% | .78% | .58% | .48% |
| Supplemental Data | |||||
| Net assets, end of period (000 omitted) | $7,844 | $10,356 | $11,140 | $12,820 | $21,989 |
| Portfolio turnover rateG | 29% | 26% | 44% | 24% | 85% |
A Calculated based on average shares outstanding during the period.
B Amount represents less than $.005 per share.
C Total returns would have been lower if certain expenses had not been reduced during the applicable periods shown.
D Total returns do not include the effect of the sales charges.
E Fees and expenses of any underlying Fidelity Central Funds are not included in the Fund's expense ratio. The Fund indirectly bears its proportionate share of the expenses of any underlying Fidelity Central Funds.
F Expense ratios reflect operating expenses of the class. Expenses before reductions do not reflect amounts reimbursed by the investment adviser or reductions from brokerage service arrangements or reductions from other expense offset arrangements and do not represent the amount paid by the class during periods when reimbursements or reductions occur. Expenses net of fee waivers reflect expenses after reimbursement by the investment adviser but prior to reductions from brokerage service arrangements or other expense offset arrangements. Expenses net of all reductions represent the net expenses paid by the class.
G Amount does not include the portfolio activity of any underlying Fidelity Central Funds.
See accompanying notes which are an integral part of the financial statements.
Fidelity Canada Fund Class C
| Years ended October 31, | 2018 | 2017 | 2016 | 2015 | 2014 |
| Selected Per–Share Data | |||||
| Net asset value, beginning of period | $52.72 | $46.87 | $44.02 | $59.04 | $56.27 |
| Income from Investment Operations | |||||
| Net investment income (loss)A | .21 | .13 | .15 | .07 | .02 |
| Net realized and unrealized gain (loss) | (3.78) | 6.01 | 2.78 | (7.85) | 3.07 |
| Total from investment operations | (3.57) | 6.14 | 2.93 | (7.78) | 3.09 |
| Distributions from net investment income | (.18) | (.11) | (.02) | (.02) | – |
| Distributions from net realized gain | (.49) | (.19) | (.06) | (7.22) | (.32) |
| Total distributions | (.67) | (.29)B | (.08) | (7.24) | (.32) |
| Redemption fees added to paid in capitalA,C | – | – | – | – | – |
| Net asset value, end of period | $48.48 | $52.72 | $46.87 | $44.02 | $59.04 |
| Total ReturnD,E | (6.85)% | 13.16% | 6.67% | (14.96)% | 5.53% |
| Ratios to Average Net AssetsF,G | |||||
| Expenses before reductions | 1.94% | 2.06% | 2.21% | 2.19% | 2.03% |
| Expenses net of fee waivers, if any | 1.93% | 2.06% | 2.21% | 2.19% | 2.03% |
| Expenses net of all reductions | 1.93% | 2.06% | 2.21% | 2.18% | 2.03% |
| Net investment income (loss) | .40% | .26% | .33% | .14% | .04% |
| Supplemental Data | |||||
| Net assets, end of period (000 omitted) | $11,196 | $15,938 | $18,489 | $21,610 | $38,749 |
| Portfolio turnover rateH | 29% | 26% | 44% | 24% | 85% |
A Calculated based on average shares outstanding during the period.
B Total distributions of $.29 per share is comprised of distributions from net investment income of $.105 and distributions from net realized gain of $.188 per share.
C Amount represents less than $.005 per share.
D Total returns would have been lower if certain expenses had not been reduced during the applicable periods shown.
E Total returns do not include the effect of the contingent deferred sales charge.
F Fees and expenses of any underlying Fidelity Central Funds are not included in the Fund's expense ratio. The Fund indirectly bears its proportionate share of the expenses of any underlying Fidelity Central Funds.
G Expense ratios reflect operating expenses of the class. Expenses before reductions do not reflect amounts reimbursed by the investment adviser or reductions from brokerage service arrangements or reductions from other expense offset arrangements and do not represent the amount paid by the class during periods when reimbursements or reductions occur. Expenses net of fee waivers reflect expenses after reimbursement by the investment adviser but prior to reductions from brokerage service arrangements or other expense offset arrangements. Expenses net of all reductions represent the net expenses paid by the class.
H Amount does not include the portfolio activity of any underlying Fidelity Central Funds.
See accompanying notes which are an integral part of the financial statements.
Fidelity Canada Fund
| Years ended October 31, | 2018 | 2017 | 2016 | 2015 | 2014 |
| Selected Per–Share Data | |||||
| Net asset value, beginning of period | $54.41 | $48.35 | $45.55 | $60.95 | $57.72 |
| Income from Investment Operations | |||||
| Net investment income (loss)A | .77 | .66 | .62 | .60 | .66 |
| Net realized and unrealized gain (loss) | (3.90) | 6.20 | 2.85 | (8.09) | 3.13 |
| Total from investment operations | (3.13) | 6.86 | 3.47 | (7.49) | 3.79 |
| Distributions from net investment income | (.77) | (.61) | (.61) | (.69) | (.24) |
| Distributions from net realized gain | (.49) | (.19) | (.06) | (7.22) | (.32) |
| Total distributions | (1.26) | (.80) | (.67) | (7.91) | (.56) |
| Redemption fees added to paid in capitalA,B | – | – | – | – | – |
| Net asset value, end of period | $50.02 | $54.41 | $48.35 | $45.55 | $60.95 |
| Total ReturnC | (5.89)% | 14.35% | 7.79% | (14.08)% | 6.64% |
| Ratios to Average Net AssetsD,E | |||||
| Expenses before reductions | .89% | 1.02% | 1.17% | 1.15% | .98% |
| Expenses net of fee waivers, if any | .89% | 1.02% | 1.17% | 1.15% | .98% |
| Expenses net of all reductions | .88% | 1.02% | 1.17% | 1.14% | .98% |
| Net investment income (loss) | 1.45% | 1.30% | 1.37% | 1.18% | 1.09% |
| Supplemental Data | |||||
| Net assets, end of period (000 omitted) | $903,662 | $1,130,803 | $1,233,050 | $1,279,488 | $2,057,843 |
| Portfolio turnover rateF | 29% | 26% | 44% | 24% | 85% |
A Calculated based on average shares outstanding during the period.
B Amount represents less than $.005 per share.
C Total returns would have been lower if certain expenses had not been reduced during the applicable periods shown.
D Fees and expenses of any underlying Fidelity Central Funds are not included in the Fund's expense ratio. The Fund indirectly bears its proportionate share of the expenses of any underlying Fidelity Central Funds.
E Expense ratios reflect operating expenses of the class. Expenses before reductions do not reflect amounts reimbursed by the investment adviser or reductions from brokerage service arrangements or reductions from other expense offset arrangements and do not represent the amount paid by the class during periods when reimbursements or reductions occur. Expenses net of fee waivers reflect expenses after reimbursement by the investment adviser but prior to reductions from brokerage service arrangements or other expense offset arrangements. Expenses net of all reductions represent the net expenses paid by the class.
F Amount does not include the portfolio activity of any underlying Fidelity Central Funds.
See accompanying notes which are an integral part of the financial statements.
Fidelity Canada Fund Class I
| Years ended October 31, | 2018 | 2017 | 2016 | 2015 | 2014 |
| Selected Per–Share Data | |||||
| Net asset value, beginning of period | $54.29 | $48.28 | $45.44 | $60.80 | $57.57 |
| Income from Investment Operations | |||||
| Net investment income (loss)A | .79 | .67 | .66 | .61 | .65 |
| Net realized and unrealized gain (loss) | (3.90) | 6.19 | 2.83 | (8.07) | 3.12 |
| Total from investment operations | (3.11) | 6.86 | 3.49 | (7.46) | 3.77 |
| Distributions from net investment income | (.77) | (.66) | (.59) | (.68) | (.22) |
| Distributions from net realized gain | (.49) | (.19) | (.06) | (7.22) | (.32) |
| Total distributions | (1.25)B | (.85) | (.65) | (7.90) | (.54) |
| Redemption fees added to paid in capitalA,C | – | – | – | – | – |
| Net asset value, end of period | $49.93 | $54.29 | $48.28 | $45.44 | $60.80 |
| Total ReturnD | (5.86)% | 14.38% | 7.83% | (14.05)% | 6.62% |
| Ratios to Average Net AssetsE,F | |||||
| Expenses before reductions | .86% | 1.00% | 1.14% | 1.13% | 1.00% |
| Expenses net of fee waivers, if any | .85% | .99% | 1.13% | 1.12% | 1.00% |
| Expenses net of all reductions | .85% | .99% | 1.13% | 1.12% | 1.00% |
| Net investment income (loss) | 1.49% | 1.33% | 1.41% | 1.21% | 1.08% |
| Supplemental Data | |||||
| Net assets, end of period (000 omitted) | $26,923 | $30,581 | $41,217 | $14,846 | $30,165 |
| Portfolio turnover rateG | 29% | 26% | 44% | 24% | 85% |
A Calculated based on average shares outstanding during the period.
B Total distributions of $1.25 per share is comprised of distributions from net investment income of $.765 and distributions from net realized gain of $.487 per share.
C Amount represents less than $.005 per share.
D Total returns would have been lower if certain expenses had not been reduced during the applicable periods shown.
E Fees and expenses of any underlying Fidelity Central Funds are not included in the Fund's expense ratio. The Fund indirectly bears its proportionate share of the expenses of any underlying Fidelity Central Funds.
F Expense ratios reflect operating expenses of the class. Expenses before reductions do not reflect amounts reimbursed by the investment adviser or reductions from brokerage service arrangements or reductions from other expense offset arrangements and do not represent the amount paid by the class during periods when reimbursements or reductions occur. Expenses net of fee waivers reflect expenses after reimbursement by the investment adviser but prior to reductions from brokerage service arrangements or other expense offset arrangements. Expenses net of all reductions represent the net expenses paid by the class.
G Amount does not include the portfolio activity of any underlying Fidelity Central Funds.
See accompanying notes which are an integral part of the financial statements.
Fidelity Canada Fund Class Z
| Year ended October 31, | 2018 A |
| Selected Per–Share Data | |
| Net asset value, beginning of period | $53.92 |
| Income from Investment Operations | |
| Net investment income (loss)B | .06 |
| Net realized and unrealized gain (loss) | (4.04) |
| Total from investment operations | (3.98) |
| Net asset value, end of period | $49.94 |
| Total ReturnC,D | (7.38)% |
| Ratios to Average Net AssetsE,F | |
| Expenses before reductions | .80%G |
| Expenses net of fee waivers, if any | .80%G |
| Expenses net of all reductions | .79%G |
| Net investment income (loss) | 1.48%G |
| Supplemental Data | |
| Net assets, end of period (000 omitted) | $128 |
| Portfolio turnover rateH | 29% |
A For the period October 2, 2018 (commencement of sale of shares) to October 31, 2018.
B Calculated based on average shares outstanding during the period.
C Total returns for periods of less than one year are not annualized.
D Total returns would have been lower if certain expenses had not been reduced during the applicable periods shown.
E Fees and expenses of any underlying Fidelity Central Funds are not included in the Fund's expense ratio. The Fund indirectly bears its proportionate share of the expenses of any underlying Fidelity Central Funds.
F Expense ratios reflect operating expenses of the class. Expenses before reductions do not reflect amounts reimbursed by the investment adviser or reductions from brokerage service arrangements or reductions from other expense offset arrangements and do not represent the amount paid by the class during periods when reimbursements or reductions occur. Expense ratios before reductions for start-up periods may not be representative of longer-term operating periods. Expenses net of fee waivers reflect expenses after reimbursement by the investment adviser but prior to reductions from brokerage service arrangements or other expense offset arrangements. Expenses net of all reductions represent the net expenses paid by the class.
G Annualized
H Amount does not include the portfolio activity of any underlying Fidelity Central Funds.
See accompanying notes which are an integral part of the financial statements.
Notes to Financial Statements
For the period ended October 31, 2018
1. Organization.
Fidelity Canada Fund (the Fund) is a fund of Fidelity Investment Trust (the Trust) and is authorized to issue an unlimited number of shares. The Trust is registered under the Investment Company Act of 1940, as amended (the 1940 Act), as an open-end management investment company organized as a Massachusetts business trust. The Fund commenced sale of Class Z shares on October 2, 2018. The Fund offers Class A, Class M, Class C, Canada, Class I, and Class Z shares, each of which has equal rights as to assets and voting privileges. Each class has exclusive voting rights with respect to matters that affect that class.
2. Investments in Fidelity Central Funds.
The Fund invests in Fidelity Central Funds, which are open-end investment companies generally available only to other investment companies and accounts managed by the investment adviser and its affiliates. The Fund's Schedule of Investments lists each of the Fidelity Central Funds held as of period end, if any, as an investment of the Fund, but does not include the underlying holdings of each Fidelity Central Fund. As an Investing Fund, the Fund indirectly bears its proportionate share of the expenses of the underlying Fidelity Central Funds.
The Money Market Central Funds seek preservation of capital and current income and are managed by Fidelity Investments Money Management, Inc. (FIMM), an affiliate of the investment adviser. Annualized expenses of the Money Market Central Funds as of their most recent shareholder report date are less than .005%.
A complete unaudited list of holdings for each Fidelity Central Fund is available upon request or at the Securities and Exchange Commission (the SEC) website at www.sec.gov. In addition, the financial statements of the Fidelity Central Funds, which are not covered by the Fund's Report of Independent Registered Public Accounting Firm, are available on the SEC website or upon request.
3. Significant Accounting Policies.
The Fund is an investment company and applies the accounting and reporting guidance of the Financial Accounting Standards Board (FASB) Accounting Standards Codification Topic 946 Financial Services – Investments Companies. The financial statements have been prepared in conformity with accounting principles generally accepted in the United States of America (GAAP), which require management to make certain estimates and assumptions at the date of the financial statements. Actual results could differ from those estimates. Subsequent events, if any, through the date that the financial statements were issued have been evaluated in the preparation of the financial statements. The following summarizes the significant accounting policies of the Fund:
Investment Valuation. Investments are valued as of 4:00 p.m. Eastern time on the last calendar day of the period. The Board of Trustees (the Board) has delegated the day to day responsibility for the valuation of the Fund's investments to the Fair Value Committee (the Committee) established by the Fund's investment adviser. In accordance with valuation policies and procedures approved by the Board, the Fund attempts to obtain prices from one or more third party pricing vendors or brokers to value its investments. When current market prices, quotations or currency exchange rates are not readily available or reliable, investments will be fair valued in good faith by the Committee, in accordance with procedures adopted by the Board. Factors used in determining fair value vary by investment type and may include market or investment specific events. The frequency with which these procedures are used cannot be predicted and they may be utilized to a significant extent. The Committee oversees the Fund's valuation policies and procedures and reports to the Board on the Committee's activities and fair value determinations. The Board monitors the appropriateness of the procedures used in valuing the Fund's investments and ratifies the fair value determinations of the Committee.
The Fund categorizes the inputs to valuation techniques used to value its investments into a disclosure hierarchy consisting of three levels as shown below:
- Level 1 – quoted prices in active markets for identical investments
- Level 2 – other significant observable inputs (including quoted prices for similar investments, interest rates, prepayment speeds, etc.)
- Level 3 – unobservable inputs (including the Fund's own assumptions based on the best information available)
Valuation techniques used to value the Fund's investments by major category are as follows:
Equity securities, including restricted securities, for which market quotations are readily available, are valued at the last reported sale price or official closing price as reported by a third party pricing vendor on the primary market or exchange on which they are traded and are categorized as Level 1 in the hierarchy. In the event there were no sales during the day or closing prices are not available, securities are valued at the last quoted bid price or may be valued using the last available price and are generally categorized as Level 2 in the hierarchy. For foreign equity securities, when market or security specific events arise, comparisons to the valuation of American Depositary Receipts (ADRs), futures contracts, Exchange-Traded Funds (ETFs) and certain indexes as well as quoted prices for similar securities may be used and would be categorized as Level 2 in the hierarchy. Utilizing these techniques may result in transfers between Level 1 and Level 2. For equity securities, including restricted securities, where observable inputs are limited, assumptions about market activity and risk are used and these securities may be categorized as Level 3 in the hierarchy.
Investments in open-end mutual funds, including the Fidelity Central Funds, are valued at their closing net asset value (NAV) each business day and are categorized as Level 1 in the hierarchy.
Changes in valuation techniques may result in transfers in or out of an assigned level within the disclosure hierarchy. The aggregate value of investments by input level as of October 31, 2018 is included at the end of the Fund's Schedule of Investments.
Foreign Currency. The Fund may use foreign currency contracts to facilitate transactions in foreign-denominated securities. Gains and losses from these transactions may arise from changes in the value of the foreign currency or if the counterparties do not perform under the contracts' terms.
Foreign-denominated assets, including investment securities, and liabilities are translated into U.S. dollars at the exchange rates at period end. Purchases and sales of investment securities, income and dividends received and expenses denominated in foreign currencies are translated into U.S. dollars at the exchange rate in effect on the transaction date.
The effects of exchange rate fluctuations on investments are included with the net realized and unrealized gain (loss) on investment securities. Other foreign currency transactions resulting in realized and unrealized gain (loss) are disclosed separately.
Investment Transactions and Income. For financial reporting purposes, the Fund's investment holdings and NAV include trades executed through the end of the last business day of the period. The NAV per share for processing shareholder transactions is calculated as of the close of business of the New York Stock Exchange (NYSE), normally 4:00 p.m. Eastern time and includes trades executed through the end of the prior business day. Gains and losses on securities sold are determined on the basis of identified cost and include proceeds received from litigation. Dividend income is recorded on the ex-dividend date, except for certain dividends from foreign securities where the ex-dividend date may have passed, which are recorded as soon as the Fund is informed of the ex-dividend date. Non-cash dividends included in dividend income, if any, are recorded at the fair market value of the securities received. Income and capital gain distributions from Fidelity Central Funds, if any, are recorded on the ex-dividend date. Interest income is accrued as earned and includes coupon interest and amortization of premium and accretion of discount on debt securities as applicable. Investment income is recorded net of foreign taxes withheld where recovery of such taxes is uncertain.
Class Allocations and Expenses. Investment income, realized and unrealized capital gains and losses, common expenses of the Fund, and certain fund-level expense reductions, if any, are allocated daily on a pro-rata basis to each class based on the relative net assets of each class to the total net assets of the Fund. Each class differs with respect to transfer agent and distribution and service plan fees incurred. Certain expense reductions may also differ by class. For the reporting period, the allocated portion of income and expenses to each class as a percent of its average net assets may vary due to the timing of recording these transactions in relation to fluctuating net assets of the classes. Expenses directly attributable to a fund are charged to that fund. Expenses attributable to more than one fund are allocated among the respective funds on the basis of relative net assets or other appropriate methods. Expense estimates are accrued in the period to which they relate and adjustments are made when actual amounts are known.
Income Tax Information and Distributions to Shareholders. Each year, the Fund intends to qualify as a regulated investment company under Subchapter M of the Internal Revenue Code, including distributing substantially all of its taxable income and realized gains. As a result, no provision for U.S. Federal income taxes is required. As of October 31, 2018, the Fund did not have any unrecognized tax benefits in the financial statements; nor is the Fund aware of any tax positions for which it is reasonably possible that the total amounts of unrecognized tax benefits will significantly change in the next twelve months. The Fund files a U.S. federal tax return, in addition to state and local tax returns as required. The Fund's federal income tax returns are subject to examination by the Internal Revenue Service (IRS) for a period of three fiscal years after they are filed. State and local tax returns may be subject to examination for an additional fiscal year depending on the jurisdiction. Foreign taxes are provided for based on the Fund's understanding of the tax rules and rates that exist in the foreign markets in which it invests.
Distributions are declared and recorded on the ex-dividend date. Income and capital gain distributions are declared separately for each class. Income and capital gain distributions are determined in accordance with income tax regulations, which may differ from GAAP. In addition, the Fund claimed a portion of the payment made to redeeming shareholders as a distribution for income tax purposes.
Capital accounts within the financial statements are adjusted for permanent book-tax differences. These adjustments have no impact on net assets or the results of operations. Capital accounts are not adjusted for temporary book-tax differences which will reverse in a subsequent period.
Book-tax differences are primarily due to foreign currency transactions, passive foreign investment companies (PFIC), deferred trustees compensation and losses deferred to wash sales.
As of period end, the cost and unrealized appreciation (depreciation) in securities, and derivatives if applicable, for federal income tax purposes were as follows:
| Gross unrealized appreciation | $271,886,304 |
| Gross unrealized depreciation | (54,702,050) |
| Net unrealized appreciation (depreciation) | $217,184,254 |
| Tax Cost | $772,629,558 |
The tax-based components of distributable earnings as of period end were as follows:
| Undistributed ordinary income | $7,302,376 |
| Undistributed long-term capital gain | $50,973,304 |
| Net unrealized appreciation (depreciation) on securities and other investments | $217,164,035 |
The tax character of distributions paid was as follows:
| October 31, 2018 | October 31, 2017 | |
| Ordinary Income | $22,403,877 | $ 21,612,357 |
| Long-term Capital Gains | 5,072,874 | – |
| Total | $27,476,751 | $ 21,612,357 |
Short-Term Trading (Redemption) Fees. Shares held by investors in the Fund less than 90 days may have been subject to a redemption fee equal to 1.50% of the NAV of shares redeemed. All redemption fees, which reduce the proceeds of the shareholder redemption, are retained by the Fund and accounted for as an addition to paid in capital. In November 2017, the Board of Trustees approved the elimination of these redemption fees effective December 18, 2017.
Restricted Securities. The Fund may invest in securities that are subject to legal or contractual restrictions on resale. These securities generally may be resold in transactions exempt from registration or to the public if the securities are registered. Disposal of these securities may involve time-consuming negotiations and expense, and prompt sale at an acceptable price may be difficult. Information regarding restricted securities is included at the end of the Fund's Schedule of Investments.
New Rule Issuance. During August 2018, the U.S. Securities and Exchange Commission issued Final Rule Release No. 33-10532, Disclosure Update and Simplification. This Final Rule includes amendments specific to registered investment companies that are intended to eliminate overlap in disclosure requirements between Regulation S-X and GAAP. In accordance with these amendments, certain line-items in the Fund's financial statements have been combined or removed for the current period as outlined in the table below.
| Financial Statement | Current Line-Item Presentation | Prior Line-Item Presentation |
| Statement of Assets and Liabilities | Total distributable earnings (loss) | Undistributed/Distributions in excess of/Accumulated net investment income (loss) Accumulated/Undistributed net realized gain (loss) Net unrealized appreciation (depreciation) |
| Statement of Changes in Net Assets | N/A - removed | Undistributed/Distributions in excess of/Accumulated net investment income (loss) end of period |
| Statement of Changes in Net Assets | Distributions to shareholders | Distributions to shareholders from net investment income Distributions to shareholders from net realized gain |
| Distributions to Shareholders Note to Financial Statements | Distributions to shareholders | Distributions to shareholders from net investment income Distributions to shareholders from net realized gain |
4. Purchases and Sales of Investments.
Purchases and sales of securities, other than short-term securities, aggregated $318,501,013 and $465,414,459, respectively.
5. Fees and Other Transactions with Affiliates.
Management Fee. Fidelity Management & Research Company (the investment adviser) and its affiliates provide the Fund with investment management related services for which the Fund pays a monthly management fee. The management fee is the sum of an individual fund fee rate that is based on an annual rate of .45% of the Fund's average net assets and an annualized group fee rate that averaged .24% during the period. The group fee rate is based upon the average net assets of all the mutual funds advised by the investment adviser, including any mutual funds previously advised by the investment adviser that are currently advised by Fidelity SelectCo, LLC, an affiliate of the investment adviser. The group fee rate decreases as assets under management increase and increases as assets under management decrease. In addition, the management fee is subject to a performance adjustment (up to a maximum of +/- .20% of the Fund's average net assets over a 36 month performance period). The upward or downward adjustment to the management fee is based on the relative investment performance of Canada as compared to its benchmark index, the S&P/TSX Composite Index, over the same 36 month performance period. For the reporting period, the total annual management fee rate, including the performance adjustment, was .62% of the Fund's average net assets. The performance adjustment included in the management fee rate may be higher or lower than the maximum performance adjustment rate due to the difference between the average net assets for the reporting and performance periods.
Distribution and Service Plan Fees. In accordance with Rule 12b-1 of the 1940 Act, the Fund has adopted separate Distribution and Service Plans for each class of shares. Certain classes pay Fidelity Distributors Corporation (FDC), an affiliate of the investment adviser, separate Distribution and Service Fees, each of which is based on an annual percentage of each class' average net assets. In addition, FDC may pay financial intermediaries for selling shares of the Fund and providing shareholder support services. For the period, the Distribution and Service Fee rates, total fees and amounts retained by FDC were as follows:
| Distribution Fee | Service Fee | Total Fees | Retained by FDC | |
| Class A | -% | .25% | $85,664 | $– |
| Class M | .25% | .25% | 46,192 | – |
| Class C | .75% | .25% | 138,941 | 486 |
| $270,797 | $486 |
Sales Load. FDC may receive a front-end sales charge of up to 5.75% for selling Class A shares and 3.50% for selling Class M shares, some of which is paid to financial intermediaries for selling shares of the Fund. Depending on the holding period, FDC may receive contingent deferred sales charges levied on Class A, Class M and Class C redemptions. The deferred sales charges are 1.00% for Class C shares, 1.00% for certain purchases of Class A shares and .25% for certain purchases of Class M shares.
For the period, sales charge amounts retained by FDC were as follows:
| Retained by FDC | |
| Class A | $5,397 |
| Class M | 1,796 |
| Class C(a) | 492 |
| $7,685 |
(a) When Class C shares are initially sold, FDC pays commissions from its own resources to financial intermediaries through which the sales are made.
Transfer Agent Fees. Fidelity Investments Institutional Operations Company, Inc., (FIIOC), an affiliate of the investment adviser, is the transfer, dividend disbursing and shareholder servicing agent for each class of the Fund. FIIOC receives account fees and asset-based fees that vary according to the account size and type of account of the shareholders of the respective classes of the Fund, except for Class Z. FIIOC receives an asset-based fee of Class Z's average net assets. FIIOC pays for typesetting, printing and mailing of shareholder reports, except proxy statements.
For the period, transfer agent fees for each class were as follows:
| Amount | % of Class-Level Average Net Assets | |
| Class A | $93,758 | .27 |
| Class M | 29,866 | .32 |
| Class C | 34,242 | .25 |
| Canada | 2,112,216 | .20 |
| Class I | 48,203 | .17 |
| Class Z | 4 | .05(a) |
| $2,318,289 |
(a) Annualized
Accounting and Security Lending Fees. Fidelity Service Company, Inc. (FSC), an affiliate of the investment adviser, maintains the Fund's accounting records. The accounting fee is based on the level of average net assets for each month. Under a separate contract, FSC administers the security lending program. The security lending fee is based on the number and duration of lending transactions. For the period, the fees were equivalent to an annual rate of .05%.
Interfund Trades. The Fund may purchase from or sell securities to other Fidelity Funds under procedures adopted by the Board. The procedures have been designed to ensure these interfund trades are executed in accordance with Rule 17a-7 of the 1940 Act. Interfund trades are included within the respective purchases and sales amounts shown in the Purchases and Sales of Investments note.
6. Committed Line of Credit.
The Fund participates with other funds managed by the investment adviser or an affiliate in a $4.25 billion credit facility (the "line of credit") to be utilized for temporary or emergency purposes to fund shareholder redemptions or for other short-term liquidity purposes. The Fund has agreed to pay commitment fees on its pro-rata portion of the line of credit, which amounted to $3,145 and is reflected in Miscellaneous expenses on the Statement of Operations. During the period, the Fund did not borrow on this line of credit.
7. Security Lending.
The Fund lends portfolio securities through a lending agent from time to time in order to earn additional income. For equity securities, a lending agent is used and may loan securities to certain qualified borrowers, including Fidelity Capital Markets (FCM), a broker-dealer affiliated with the Fund. On the settlement date of the loan, the Fund receives collateral (in the form of U.S. Treasury obligations, letters of credit and/or cash) against the loaned securities and maintains collateral in an amount not less than 100% of the market value of the loaned securities during the period of the loan. The market value of the loaned securities is determined at the close of business of the Fund and any additional required collateral is delivered to the Fund on the next business day. The Fund or borrower may terminate the loan at any time, and if the borrower defaults on its obligation to return the securities loaned because of insolvency or other reasons, the Fund may apply collateral received from the borrower against the obligation. The Fund may experience delays and costs in recovering the securities loaned. Any cash collateral received is invested in the Fidelity Securities Lending Cash Central Fund. The value of loaned securities and cash collateral at period end are disclosed on the Fund's Statement of Assets and Liabilities. Security lending income represents the income earned on investing cash collateral, less rebates paid to borrowers and any lending agent fees associated with the loan, plus any premium payments received for lending certain types of securities. Security lending income is presented in the Statement of Operations as a component of income from Fidelity Central Funds. Total security lending income during the period amounted to $214,540. During the period, there were no securities loaned to FCM.
8. Expense Reductions.
Commissions paid to certain brokers with whom the investment adviser, or its affiliates, places trades on behalf of the Fund include an amount in addition to trade execution, which may be rebated back to the Fund to offset certain expenses. This amount totaled $53,821 for the period.
In addition, during the period the investment adviser reimbursed and/or waived a portion of fund-level operating expenses in the amount of $12,058.
9. Distributions to Shareholders.
Distributions to shareholders of each class were as follows:
| Year ended October 31, 2018 | Year ended October 31, 2017 | |
| Distributions to shareholders | ||
| Class A | $734,732 | $– |
| Class M | 166,749 | – |
| Class C | 198,725 | – |
| Canada | 25,679,409 | – |
| Class I | 697,136 | – |
| Total | $27,476,751 | $– |
| From net investment income | ||
| Class A | $– | $406,836 |
| Class M | – | 78,661 |
| Class C | – | 39,905 |
| Canada | – | 15,352,959 |
| Class I | – | 565,020 |
| Total | $– | $16,443,381 |
| From net realized gain | ||
| Class A | $– | $168,842 |
| Class M | – | 43,752 |
| Class C | – | 71,450 |
| Canada | – | 4,723,987 |
| Class I | – | 160,945 |
| Total | $– | $5,168,976 |
10. Share Transactions.
Share transactions for each class were as follows and may contain automatic conversions between classes or exchanges between affiliated funds:
| Shares | Shares | Dollars | Dollars | |
| Year ended October 31, 2018(a) | Year ended October 31, 2017 | Year ended October 31, 2018(a) | Year ended October 31, 2017 | |
| Class A | ||||
| Shares sold | 46,971 | 63,470 | $2,500,808 | $3,161,163 |
| Reinvestment of distributions | 12,714 | 10,631 | 672,936 | 525,595 |
| Shares redeemed | (162,467) | (297,916) | (8,569,248) | (14,925,894) |
| Net increase (decrease) | (102,782) | (223,815) | $(5,395,504) | $(11,239,136) |
| Class M | ||||
| Shares sold | 8,442 | 24,195 | $442,723 | $1,198,423 |
| Reinvestment of distributions | 3,154 | 2,464 | 166,353 | 121,397 |
| Shares redeemed | (45,613) | (67,009) | (2,414,584) | (3,403,775) |
| Net increase (decrease) | (34,017) | (40,350) | $(1,805,508) | $(2,083,955) |
| Class C | ||||
| Shares sold | 9,399 | 25,680 | $481,011 | $1,254,827 |
| Reinvestment of distributions | 3,474 | 1,995 | 180,309 | 96,717 |
| Shares redeemed | (84,247) | (119,795) | (4,355,073) | (5,862,219) |
| Net increase (decrease) | (71,374) | (92,120) | $(3,693,753) | $(4,510,675) |
| Canada | ||||
| Shares sold | 711,176 | 1,830,107 | $37,797,009 | $91,494,332 |
| Reinvestment of distributions | 457,772 | 381,896 | 24,289,363 | 18,930,598 |
| Shares redeemed | (3,887,975) | (6,928,660) | (207,409,511) | (353,430,502) |
| Net increase (decrease) | (2,719,027) | (4,716,657) | $(145,323,139) | $(243,005,572) |
| Class I | ||||
| Shares sold | 160,132 | 249,628 | $8,478,569 | $12,551,193 |
| Reinvestment of distributions | 12,538 | 14,338 | 663,882 | 709,005 |
| Shares redeemed | (196,779) | (554,299) | (10,381,577) | (29,406,590) |
| Net increase (decrease) | (24,109) | (290,333) | $(1,239,126) | $(16,146,392) |
| Class Z | ||||
| Shares sold | 2,572 | – | $135,809 | $– |
| Net increase (decrease) | 2,572 | – | $135,809 | $– |
(a) Share transactions for Class Z are for the period October 2, 2018 (commencement of sale of shares) to October 31, 2018
11. Other.
The Fund's organizational documents provide former and current trustees and officers with a limited indemnification against liabilities arising in connection with the performance of their duties to the Fund. In the normal course of business, the Fund may also enter into contracts that provide general indemnifications. The Fund's maximum exposure under these arrangements is unknown as this would be dependent on future claims that may be made against the Fund. The risk of material loss from such claims is considered remote.
Report of Independent Registered Public Accounting Firm
To the Board of Trustees of Fidelity Investment Trust and Shareholders of Fidelity Canada Fund:
Opinion on the Financial Statements
We have audited the accompanying statement of assets and liabilities, including the schedule of investments, of Fidelity Canada Fund (one of the funds constituting Fidelity Investment Trust, referred to hereafter as the "Fund") as of October 31, 2018, the related statement of operations for the year ended October 31, 2018, the statement of changes in net assets for each of the two years in the period ended October 31, 2018, including the related notes, and the financial highlights for each of the periods indicated therein (collectively referred to as the “financial statements”). In our opinion, the financial statements present fairly, in all material respects, the financial position of the Fund as of October 31, 2018, the results of its operations for the year then ended, the changes in its net assets for each of the two years in the period ended October 31, 2018 and the financial highlights for each of the periods indicated therein in conformity with accounting principles generally accepted in the United States of America.
Basis for Opinion
These financial statements are the responsibility of the Fund’s management. Our responsibility is to express an opinion on the Fund’s financial statements based on our audits. We are a public accounting firm registered with the Public Company Accounting Oversight Board (United States) (“PCAOB”) and are required to be independent with respect to the Fund in accordance with the U.S. federal securities laws and the applicable rules and regulations of the Securities and Exchange Commission and the PCAOB.
We conducted our audits of these financial statements in accordance with the standards of the PCAOB. Those standards require that we plan and perform the audit to obtain reasonable assurance about whether the financial statements are free of material misstatement, whether due to error or fraud.
Our audits included performing procedures to assess the risks of material misstatement of the financial statements, whether due to error or fraud, and performing procedures that respond to those risks. Such procedures included examining, on a test basis, evidence regarding the amounts and disclosures in the financial statements. Our audits also included evaluating the accounting principles used and significant estimates made by management, as well as evaluating the overall presentation of the financial statements. Our procedures included confirmation of securities owned as of October 31, 2018 by correspondence with the custodian and brokers; when replies were not received from brokers, we performed other auditing procedures. We believe that our audits provide a reasonable basis for our opinion.
PricewaterhouseCoopers LLP
Boston, Massachusetts
December 14, 2018
We have served as the auditor of one or more investment companies in the Fidelity group of funds since 1932.
Trustees and Officers
The Trustees, Members of the Advisory Board (if any), and officers of the trust and fund, as applicable, are listed below. The Board of Trustees governs the fund and is responsible for protecting the interests of shareholders. The Trustees are experienced executives who meet periodically throughout the year to oversee the fund's activities, review contractual arrangements with companies that provide services to the fund, oversee management of the risks associated with such activities and contractual arrangements, and review the fund's performance. Except for Jonathan Chiel, each of the Trustees oversees 283 funds. Mr. Chiel oversees 154 funds.
The Trustees hold office without limit in time except that (a) any Trustee may resign; (b) any Trustee may be removed by written instrument, signed by at least two-thirds of the number of Trustees prior to such removal; (c) any Trustee who requests to be retired or who has become incapacitated by illness or injury may be retired by written instrument signed by a majority of the other Trustees; and (d) any Trustee may be removed at any special meeting of shareholders by a two-thirds vote of the outstanding voting securities of the trust. Each Trustee who is not an interested person (as defined in the 1940 Act) of the trust and the fund is referred to herein as an Independent Trustee. Each Independent Trustee shall retire not later than the last day of the calendar year in which his or her 75th birthday occurs. The Independent Trustees may waive this mandatory retirement age policy with respect to individual Trustees. Officers and Advisory Board Members hold office without limit in time, except that any officer or Advisory Board Member may resign or may be removed by a vote of a majority of the Trustees at any regular meeting or any special meeting of the Trustees. Except as indicated, each individual has held the office shown or other offices in the same company for the past five years.
The fund’s Statement of Additional Information (SAI) includes more information about the Trustees. To request a free copy, call Fidelity at 1-877-208-0098.
Experience, Skills, Attributes, and Qualifications of the Trustees. The Governance and Nominating Committee has adopted a statement of policy that describes the experience, qualifications, attributes, and skills that are necessary and desirable for potential Independent Trustee candidates (Statement of Policy). The Board believes that each Trustee satisfied at the time he or she was initially elected or appointed a Trustee, and continues to satisfy, the standards contemplated by the Statement of Policy. The Governance and Nominating Committee also engages professional search firms to help identify potential Independent Trustee candidates who have the experience, qualifications, attributes, and skills consistent with the Statement of Policy. From time to time, additional criteria based on the composition and skills of the current Independent Trustees, as well as experience or skills that may be appropriate in light of future changes to board composition, business conditions, and regulatory or other developments, have also been considered by the professional search firms and the Governance and Nominating Committee. In addition, the Board takes into account the Trustees' commitment and participation in Board and committee meetings, as well as their leadership of standing and ad hoc committees throughout their tenure.
In determining that a particular Trustee was and continues to be qualified to serve as a Trustee, the Board has considered a variety of criteria, none of which, in isolation, was controlling. The Board believes that, collectively, the Trustees have balanced and diverse experience, qualifications, attributes, and skills, which allow the Board to operate effectively in governing the fund and protecting the interests of shareholders. Information about the specific experience, skills, attributes, and qualifications of each Trustee, which in each case led to the Board's conclusion that the Trustee should serve (or continue to serve) as a trustee of the fund, is provided below.
Board Structure and Oversight Function. James C. Curvey is an interested person and currently serves as Chairman. The Trustees have determined that an interested Chairman is appropriate and benefits shareholders because an interested Chairman has a personal and professional stake in the quality and continuity of services provided to the fund. Independent Trustees exercise their informed business judgment to appoint an individual of their choosing to serve as Chairman, regardless of whether the Trustee happens to be independent or a member of management. The Independent Trustees have determined that they can act independently and effectively without having an Independent Trustee serve as Chairman and that a key structural component for assuring that they are in a position to do so is for the Independent Trustees to constitute a substantial majority for the Board. The Independent Trustees also regularly meet in executive session. Ned C. Lautenbach serves as Chairman of the Independent Trustees and as such (i) acts as a liaison between the Independent Trustees and management with respect to matters important to the Independent Trustees and (ii) with management prepares agendas for Board meetings.
Fidelity® funds are overseen by different Boards of Trustees. The fund's Board oversees Fidelity's high income and certain equity funds, and other Boards oversee Fidelity's investment-grade bond, money market, asset allocation, and other equity funds. The asset allocation funds may invest in Fidelity® funds overseen by the fund's Board. The use of separate Boards, each with its own committee structure, allows the Trustees of each group of Fidelity® funds to focus on the unique issues of the funds they oversee, including common research, investment, and operational issues. On occasion, the separate Boards establish joint committees to address issues of overlapping consequences for the Fidelity® funds overseen by each Board.
The Trustees operate using a system of committees to facilitate the timely and efficient consideration of all matters of importance to the Trustees, the fund, and fund shareholders and to facilitate compliance with legal and regulatory requirements and oversight of the fund's activities and associated risks. The Board, acting through its committees, has charged FMR and its affiliates with (i) identifying events or circumstances the occurrence of which could have demonstrably adverse effects on the fund's business and/or reputation; (ii) implementing processes and controls to lessen the possibility that such events or circumstances occur or to mitigate the effects of such events or circumstances if they do occur; and (iii) creating and maintaining a system designed to evaluate continuously business and market conditions in order to facilitate the identification and implementation processes described in (i) and (ii) above. Because the day-to-day operations and activities of the fund are carried out by or through FMR, its affiliates, and other service providers, the fund's exposure to risks is mitigated but not eliminated by the processes overseen by the Trustees. While each of the Board's committees has responsibility for overseeing different aspects of the fund's activities, oversight is exercised primarily through the Operations, Audit, and Compliance Committees. In addition, the Independent Trustees have worked with Fidelity to enhance the Board's oversight of investment and financial risks, legal and regulatory risks, technology risks, and operational risks, including the development of additional risk reporting to the Board. Appropriate personnel, including but not limited to the fund's Chief Compliance Officer (CCO), FMR's internal auditor, the independent accountants, the fund's Treasurer and portfolio management personnel, make periodic reports to the Board's committees, as appropriate, including an annual review of Fidelity's risk management program for the Fidelity® funds. The responsibilities of each standing committee, including their oversight responsibilities, are described further under "Standing Committees of the Trustees."
Interested Trustees*:
Correspondence intended for a Trustee who is an interested person may be sent to Fidelity Investments, 245 Summer Street, Boston, Massachusetts 02210.
Name, Year of Birth; Principal Occupations and Other Relevant Experience+
Jonathan Chiel (1957)
Year of Election or Appointment: 2016
Trustee
Mr. Chiel also serves as Trustee of other Fidelity® funds. Mr. Chiel is Executive Vice President and General Counsel for FMR LLC (diversified financial services company, 2012-present). Previously, Mr. Chiel served as general counsel (2004-2012) and senior vice president and deputy general counsel (2000-2004) for John Hancock Financial Services; a partner with Choate, Hall & Stewart (1996-2000) (law firm); and an Assistant United States Attorney for the United States Attorney’s Office of the District of Massachusetts (1986-95), including Chief of the Criminal Division (1993-1995). Mr. Chiel is a director on the boards of the Boston Bar Foundation and the Maimonides School.
James C. Curvey (1935)
Year of Election or Appointment: 2007
Trustee
Chairman of the Board of Trustees
Mr. Curvey also serves as Trustee of other Fidelity® funds. Mr. Curvey is Vice Chairman (2007-present) and Director of FMR LLC (diversified financial services company). In addition, Mr. Curvey is an Overseer Emeritus for the Boston Symphony Orchestra, a Director of Artis-Naples, and a Trustee of Brewster Academy in Wolfeboro, New Hampshire. Previously, Mr. Curvey served as a Director of Fidelity Research & Analysis Co. (investment adviser firm, 2009-2018), Director of Fidelity Investments Money Management, Inc. (investment adviser firm, 2009-2014) and a Director of FMR and FMR Co., Inc. (investment adviser firms, 2007-2014).
Charles S. Morrison (1960)
Year of Election or Appointment: 2014
Trustee
Mr. Morrison also serves as Trustee of other funds. He serves as President of Fidelity SelectCo, LLC (investment adviser firm, 2017-present) and Fidelity Management & Research Company (FMR) (investment adviser firm, 2016-present), a Director of Fidelity Investments Money Management, Inc. (FIMM) (investment adviser firm, 2014-present), Director of Fidelity SelectCo, LLC (investment adviser firm, 2014-present), President, Asset Management (2014-present), and is an employee of Fidelity Investments. Previously, Mr. Morrison served as Vice President of Fidelity's Fixed Income and Asset Allocation Funds (2012-2014), President, Fixed Income (2011-2014), Vice President of Fidelity's Money Market Funds (2005-2009), President, Money Market Group Leader of FMR (investment adviser firm, 2009), and Senior Vice President, Money Market Group of FMR (2004-2009). Mr. Morrison also served as Vice President of Fidelity's Bond Funds (2002-2005), certain Balanced Funds (2002-2005), and certain Asset Allocation Funds (2002-2007), and as Senior Vice President (2002-2005) of Fidelity's Bond Division.
* Determined to be an “Interested Trustee” by virtue of, among other things, his or her affiliation with the trust or various entities under common control with FMR.
+ The information includes the Trustee's principal occupation during the last five years and other information relating to the experience, attributes, and skills relevant to the Trustee's qualifications to serve as a Trustee, which led to the conclusion that the Trustee should serve as a Trustee for the fund.
Independent Trustees:
Correspondence intended for an Independent Trustee may be sent to Fidelity Investments, P.O. Box 55235, Boston, Massachusetts 02205-5235.
Name, Year of Birth; Principal Occupations and Other Relevant Experience+
Dennis J. Dirks (1948)
Year of Election or Appointment: 2005
Trustee
Mr. Dirks also serves as Trustee of other Fidelity® funds. Prior to his retirement in May 2003, Mr. Dirks was Chief Operating Officer and a member of the Board of The Depository Trust & Clearing Corporation (DTCC). He also served as President, Chief Operating Officer, and Board member of The Depository Trust Company (DTC) and President and Board member of the National Securities Clearing Corporation (NSCC). In addition, Mr. Dirks served as Chief Executive Officer and Board member of the Government Securities Clearing Corporation, Chief Executive Officer and Board member of the Mortgage-Backed Securities Clearing Corporation, as a Trustee and a member of the Finance Committee of Manhattan College (2005-2008), as a Trustee and a member of the Finance Committee of AHRC of Nassau County (2006-2008), as a member of the Independent Directors Council (IDC) Governing Council (2010-2015), and as a member of the Board of Directors for The Brookville Center for Children’s Services, Inc. (2009-2017). Mr. Dirks is a member of the Finance Committee (2016-present), Board of Directors (2017-present) and Board of Trustees (2018-present) and is Treasurer (2018-present) of the Asolo Repertory Theatre.
Donald F. Donahue (1950)
Year of Election or Appointment: 2018
Trustee
Mr. Donahue also serves as a Trustee of other Fidelity® funds. Mr. Donahue is President and Chief Executive Officer of Miranda Partners, LLC (risk consulting for the financial services industry, 2012-present). Previously, Mr. Donahue served as a Member of the Advisory Board of certain Fidelity® funds (2015-2018) and Chief Executive Officer (2006-2012), Chief Operating Officer (2003-2006), and Managing Director, Customer Marketing and Development (1999-2003) of The Depository Trust & Clearing Corporation (financial markets infrastructure). Mr. Donahue serves as a Member (2007-present) and Co-Chairman (2016-present) of the Board of Directors of United Way of New York, Member of the Board of Directors of NYC Leadership Academy (2012-present) and Member of the Board of Advisors of Ripple Labs, Inc. (financial services, 2015-present). He also served as Chairman (2010-2012) and Member of the Board of Directors (2012-2013) of Omgeo, LLC (financial services), Treasurer of United Way of New York (2012-2016), and Member of the Board of Directors of XBRL US (financial services non-profit, 2009-2012) and the International Securities Services Association (2009-2012).
Alan J. Lacy (1953)
Year of Election or Appointment: 2008
Trustee
Mr. Lacy also serves as Trustee of other Fidelity® funds. Mr. Lacy serves as a Director of Bristol-Myers Squibb Company (global pharmaceuticals, 2008-present). He is a Trustee of the California Chapter of The Nature Conservancy (2015-present) and a Director of the Center for Advanced Study in the Behavioral Sciences at Stanford University (2015-present). In addition, Mr. Lacy served as Senior Adviser (2007-2014) of Oak Hill Capital Partners, L.P. (private equity) and also served as Chief Executive Officer (2005) and Vice Chairman (2005-2006) of Sears Holdings Corporation (retail) and Chief Executive Officer and Chairman of the Board of Sears, Roebuck and Co. (retail, 2000-2005). Previously, Mr. Lacy served as Chairman (2014-2017) and a member (2010-2017) of the Board of Directors of Dave & Buster’s Entertainment, Inc. (restaurant and entertainment complexes), as Chairman (2008-2011) and a member (2006-2015) of the Board of Trustees of the National Parks Conservation Association, and as a member of the Board of Directors for The Hillman Companies, Inc. (hardware wholesalers, 2010-2014), Earth Fare, Inc. (retail grocery, 2010-2014), and The Western Union Company (global money transfer, 2006-2011).
Ned C. Lautenbach (1944)
Year of Election or Appointment: 2000
Trustee
Chairman of the Independent Trustees
Mr. Lautenbach also serves as Trustee of other Fidelity® funds. Mr. Lautenbach currently serves as Vice Chair of the Board of Governors, State University System of Florida (2013-present) and is a member of the Council on Foreign Relations (1994-present). He is also a member and has most recently served as Chairman of the Board of Directors of Artis-Naples (2012-present). Previously, Mr. Lautenbach served as a member and then Lead Director of the Board of Directors of Eaton Corporation (diversified industrial, 1997-2016). He was also a Partner and Advisory Partner at Clayton, Dubilier & Rice, LLC (private equity investment, 1998-2010), as well as a Director of Sony Corporation (2006-2007). In addition, Mr. Lautenbach also had a 30-year career with IBM (technology company) during which time he served as Senior Vice President and a member of the Corporate Executive Committee (1968-1998).
Joseph Mauriello (1944)
Year of Election or Appointment: 2008
Trustee
Mr. Mauriello also serves as Trustee of other Fidelity® funds. Prior to his retirement in January 2006, Mr. Mauriello served in numerous senior management positions including Deputy Chairman and Chief Operating Officer (2004-2005), and Vice Chairman of Financial Services (2002-2004) of KPMG LLP US (professional services, 1965-2005). Mr. Mauriello currently serves as a member of the Independent Directors Council (IDC) Governing Council (2015-present). Previously, Mr. Mauriello served as a member of the Board of Directors of XL Group plc. (global insurance and re-insurance, 2006-2018).
Cornelia M. Small (1944)
Year of Election or Appointment: 2005
Trustee
Ms. Small also serves as Trustee of other Fidelity® funds. Ms. Small is a member of the Board of Directors (2009-present) and Chair of the Investment Committee (2010-present) of the Teagle Foundation. Ms. Small also serves on the Investment Committee of the Berkshire Taconic Community Foundation (2008-present). Previously, Ms. Small served as Chairperson (2002-2008) and a member of the Investment Committee and Chairperson (2008-2012) and a member of the Board of Trustees of Smith College. In addition, Ms. Small served as Chief Investment Officer, Director of Global Equity Investments, and a member of the Board of Directors of Scudder, Stevens & Clark and Scudder Kemper Investments.
Garnett A. Smith (1947)
Year of Election or Appointment: 2018
Trustee
Mr. Smith also serves as Trustee of other Fidelity® funds. Prior to Mr. Smith's retirement, he served as Chairman and Chief Executive Officer of Inbrand Corp. (manufacturer of personal absorbent products, 1990-1997). He also served as President (1986-1990) of Inbrand Corp. Prior to his employment with Inbrand Corp., he was employed by a retail fabric chain and North Carolina National Bank. In addition, Mr. Smith served as a Member of the Advisory Board of certain Fidelity® funds (2012-2013) and as a board member of the Jackson Hole Land Trust (2009-2012).
David M. Thomas (1949)
Year of Election or Appointment: 2008
Trustee
Mr. Thomas also serves as Trustee of other Fidelity® funds. Mr. Thomas serves as Non-Executive Chairman of the Board of Directors of Fortune Brands Home and Security (home and security products, 2011-present), as a member of the Board of Directors (2004-present) and Presiding Director (2013-present) of Interpublic Group of Companies, Inc. (marketing communication), and as a member of the Board of Trustees of the University of Florida (2013-present). Previously, Mr. Thomas served as Executive Chairman (2005-2006) and Chairman and Chief Executive Officer (2000-2005) of IMS Health, Inc. (pharmaceutical and healthcare information solutions), and a Director of Fortune Brands, Inc. (consumer products, 2000-2011).
+ The information includes the Trustee's principal occupation during the last five years and other information relating to the experience, attributes, and skills relevant to the Trustee's qualifications to serve as a Trustee, which led to the conclusion that the Trustee should serve as a Trustee for the fund.
Advisory Board Members and Officers:
Correspondence intended for a Member of the Advisory Board (if any) may be sent to Fidelity Investments, P.O. Box 55235, Boston, Massachusetts 02205-5235. Correspondence intended for an officer or Peter S. Lynch may be sent to Fidelity Investments, 245 Summer Street, Boston, Massachusetts 02210. Officers appear below in alphabetical order.
Name, Year of Birth; Principal Occupation
Vicki L. Fuller (1957)
Year of Election or Appointment: 2018
Member of the Advisory Board
Ms. Fuller also serves as Member of the Advisory Board of other Fidelity® funds. Ms. Fuller serves as a member of the Board of Directors, Audit Committee, and Nominating and Governance Committee of The Williams Companies, Inc. (natural gas infrastructure, 2018-present). Previously, Ms. Fuller served as the Chief Investment Officer of the New York State Common Retirement Fund (2012-2018) and held a variety of positions at AllianceBernstein L.P. (global asset management, 1985-2012), including Managing Director (2006-2012) and Senior Vice President and Senior Portfolio Manager (2001-2006).
Peter S. Lynch (1944)
Year of Election or Appointment: 2003
Member of the Advisory Board
Mr. Lynch also serves as Member of the Advisory Board of other Fidelity® funds. Mr. Lynch is Vice Chairman and a Director of FMR (investment adviser firm) and FMR Co., Inc. (investment adviser firm). In addition, Mr. Lynch serves as a Trustee of Boston College and as the Chairman of the Inner-City Scholarship Fund. Previously, Mr. Lynch served on the Special Olympics International Board of Directors (1997-2006).
William S. Stavropoulos (1939)
Year of Election or Appointment: 2018
Member of the Advisory Board
Mr. Stavropoulos also serves as Member of the Advisory Board of other Fidelity® funds. Mr. Stavropoulos serves as President and Founder of the Michigan Baseball Foundation, the Great Lakes Loons (2007-present). Mr. Stavropoulos is Chairman Emeritus of the Board of Directors of The Dow Chemical Company, where he previously served in numerous senior management positions, including President, CEO (1995-2000; 2002-2004), Chairman of the Executive Committee (2000-2006), and as a member of the Board of Directors (1990-2006). Currently, Mr. Stavropoulos is Chairman of the Board of Directors of Univar Inc. (global distributor of commodity and specialty chemicals), a Director of Teradata Corporation (data warehousing and technology solutions), and a member of the Advisory Board for Metalmark Capital LLC (private equity investment, 2005-present). Mr. Stavropoulos is an operating advisor to Clayton, Dubilier & Rice, LLC (private equity investment). In addition, Mr. Stavropoulos is a member of the University of Notre Dame Advisory Council for the College of Science, a Trustee of the Rollin L. Gerstacker Foundation, and a Director of Artis-Naples in Naples, Florida. Previously, Mr. Stavropoulos served as Trustee of certain Fidelity® funds (2001-2018) and as a Director of Chemical Financial Corporation (bank holding company, 1993-2012) and Tyco International, Ltd. (multinational manufacturing and services, 2007-2012).
Carol B. Tomé (1957)
Year of Election or Appointment: 2018
Member of the Advisory Board
Ms. Tomé also serves as Member of the Advisory Board of other Fidelity® funds. Ms. Tomé is Chief Financial Officer (2001-present) and Executive Vice President of Corporate Services (2007-present) of The Home Depot, Inc. (home improvement retailer) and a Director (2003-present) and Chair of the Audit Committee (2004-present) of United Parcel Service, Inc. (package delivery and supply chain management). Previously, Ms. Tomé served as Trustee of certain Fidelity® funds (2017), Senior Vice President of Finance and Accounting/Treasurer (2000-2007) and Vice President and Treasurer (1995-2000) of The Home Depot, Inc. and Chair of the Board (2010-2012), Vice Chair of the Board (2009 and 2013), and a Director (2008-2013) of the Federal Reserve Bank of Atlanta. Ms. Tomé is also a director or trustee of many community and professional organizations.
Michael E. Wiley (1950)
Year of Election or Appointment: 2018
Member of the Advisory Board
Mr. Wiley also serves as Trustee or Member of the Advisory Board of other Fidelity® funds. Mr. Wiley serves as a Director of High Point Resources (exploration and production, 2005-present). Previously, Mr. Wiley served as a Director of Andeavor Corporation (independent oil refiner and marketer, 2005-2018), a Director of Andeavor Logistics LP (natural resources logistics, 2015-2018), a Director of Post Oak Bank (privately-held bank, 2004-2018), a Director of Asia Pacific Exploration Consolidated (international oil and gas exploration and production, 2008-2013), a member of the Board of Trustees of the University of Tulsa (2000-2006; 2007-2010), a Senior Energy Advisor of Katzenbach Partners, LLC (consulting, 2006-2007), an Advisory Director of Riverstone Holdings (private investment), a Director of Spinnaker Exploration Company (exploration and production, 2001-2005) and Chairman, President, and CEO of Baker Hughes, Inc. (oilfield services, 2000-2004).
Elizabeth Paige Baumann (1968)
Year of Election or Appointment: 2017
Anti-Money Laundering (AML) Officer
Ms. Baumann also serves as AML Officer of other funds. She is Chief AML Officer (2012-present) and Senior Vice President (2014-present) of FMR LLC (diversified financial services company) and is an employee of Fidelity Investments. Previously, Ms. Baumann served as AML Officer of the funds (2012-2016), and Vice President (2007-2014) and Deputy Anti-Money Laundering Officer (2007-2012) of FMR LLC.
John J. Burke III (1964)
Year of Election or Appointment: 2018
Chief Financial Officer
Mr. Burke also serves as Chief Financial Officer of other funds. Mr. Burke serves as Head of Investment Operations for Fidelity Fund and Investment Operations (2018-present) and is an employee of Fidelity Investments (1998-present). Previously Mr. Burke served as head of Asset Management Investment Operations (2012-2018).
William C. Coffey (1969)
Year of Election or Appointment: 2018
Secretary and Chief Legal Officer (CLO)
Mr. Coffey also serves as Secretary and CLO of other funds. Mr. Coffey serves as CLO, Secretary, and Senior Vice President of Fidelity Management & Research Company and FMR Co., Inc. (investment adviser firms, 2018-present); Secretary of Fidelity SelectCo, LLC and Fidelity Investments Money Management, Inc. (investment adviser firms, 2018-present); and CLO of Fidelity Management & Research (Hong Kong) Limited, FMR Investment Management (UK) Limited, and Fidelity Management & Research (Japan) Limited (investment adviser firms, 2018-present). He is Senior Vice President and Deputy General Counsel of FMR LLC (diversified financial services company, 2010-present), and is an employee of Fidelity Investments. Previously, Mr. Coffey served as Assistant Secretary of certain funds (2009-2018) and as Vice President and Associate General Counsel of FMR LLC (2005-2009).
Timothy M. Cohen (1969)
Year of Election or Appointment: 2018
Vice President
Mr. Cohen also serves as Vice President of other funds. Mr. Cohen serves as Co-Head of Global Equity Research (2016-present), a Director of Fidelity Management & Research (Japan) Limited (investment adviser firm, 2016-present), and is an employee of Fidelity Investments. Previously, Mr. Cohen served as Chief Investment Officer - Equity and a Director of Fidelity Management & Research (U.K.) Inc. (investment adviser firm, 2013-2015) and as a Director of Fidelity Management & Research (Hong Kong) Limited (investment adviser firm, 2017).
Jonathan Davis (1968)
Year of Election or Appointment: 2010
Assistant Treasurer
Mr. Davis also serves as Assistant Treasurer of other funds. Mr. Davis serves as Assistant Treasurer of FMR Capital, Inc. (2017-present) and is an employee of Fidelity Investments. Previously, Mr. Davis served as Vice President and Associate General Counsel of FMR LLC (diversified financial services company, 2003-2010).
Adrien E. Deberghes (1967)
Year of Election or Appointment: 2016
Assistant Treasurer
Mr. Deberghes also serves as an officer of other funds. He serves as Assistant Treasurer of FMR Capital, Inc. (2017-present), Executive Vice President of Fidelity Investments Money Management, Inc. (FIMM) (investment adviser firm, 2016-present), and is an employee of Fidelity Investments (2008-present). Previously, Mr. Deberghes served as President and Treasurer of certain Fidelity® funds (2013-2018). Prior to joining Fidelity Investments, Mr. Deberghes was Senior Vice President of Mutual Fund Administration at State Street Corporation (2007-2008), Senior Director of Mutual Fund Administration at Investors Bank & Trust (2005-2007), and Director of Finance for Dunkin' Brands (2000-2005). Previously, Mr. Deberghes served in other fund officer roles.
Laura M. Del Prato (1964)
Year of Election or Appointment: 2018
Assistant Treasurer
Ms. Del Prato also serves as an officer of other funds. Ms. Del Prato is an employee of Fidelity Investments (2017-present). Prior to joining Fidelity Investments, Ms. Del Prato served as a Managing Director and Treasurer of the JPMorgan Mutual Funds (2014-2017). Prior to JPMorgan, Ms. Del Prato served as a partner at Cohen Fund Audit Services (accounting firm, 2012-2013) and KPMG LLP (accounting firm, 2004-2012).
Colm A. Hogan (1973)
Year of Election or Appointment: 2016
Deputy Treasurer
Mr. Hogan also serves as an officer of other funds. Mr. Hogan serves as Assistant Treasurer of FMR Capital, Inc. (2017-present) and is an employee of Fidelity Investments (2005-present). Previously, Mr. Hogan served as Assistant Treasurer of certain Fidelity® funds (2016-2018).
Pamela R. Holding (1964)
Year of Election or Appointment: 2018
Vice President
Ms. Holding also serves as Vice President of other funds. Ms. Holding serves as Co-Head of Global Equity Research (2018-present) and is an employee of Fidelity Investments (2013-present).
Chris Maher (1972)
Year of Election or Appointment: 2013
Assistant Treasurer
Mr. Maher serves as Assistant Treasurer of other funds. Mr. Maher is Vice President of Valuation Oversight, serves as Assistant Treasurer of FMR Capital, Inc. (2017-present), and is an employee of Fidelity Investments. Previously, Mr. Maher served as Vice President of Asset Management Compliance (2013), Vice President of the Program Management Group of FMR (investment adviser firm, 2010-2013), and Vice President of Valuation Oversight (2008-2010).
Rieco E. Mello (1969)
Year of Election or Appointment: 2017
Assistant Treasurer
Mr. Mello also serves as Assistant Treasurer of other funds. Mr. Mello serves as Assistant Treasurer of FMR Capital, Inc. (2017-present) and is an employee of Fidelity Investments (1995-present).
Kenneth B. Robins (1969)
Year of Election or Appointment: 2016
Chief Compliance Officer
Mr. Robins also serves as an officer of other funds. Mr. Robins serves as Compliance Officer of Fidelity Management & Research Company and FMR Co., Inc. (investment adviser firms, 2016-present) and is an employee of Fidelity Investments (2004-present). Previously, Mr. Robins served as Executive Vice President of Fidelity Investments Money Management, Inc. (investment adviser firm, 2013-2016) and served in other fund officer roles.
Stacie M. Smith (1974)
Year of Election or Appointment: 2016
President and Treasurer
Ms. Smith also serves as an officer of other funds. Ms. Smith serves as Assistant Treasurer of FMR Capital, Inc. (2017-present), is an employee of Fidelity Investments (2009-present), and has served in other fund officer roles. Prior to joining Fidelity Investments, Ms. Smith served as Senior Audit Manager of Ernst & Young LLP (accounting firm, 1996-2009). Previously, Ms. Smith served as Assistant Treasurer (2013-2018) and Deputy Treasurer (2013-2016) of certain Fidelity® funds.
Marc L. Spector (1972)
Year of Election or Appointment: 2016
Assistant Treasurer
Mr. Spector also serves as an officer of other funds. Mr. Spector serves as Assistant Treasurer of FMR Capital, Inc. (2017-present) and is an employee of Fidelity Investments (2016-present). Prior to joining Fidelity Investments, Mr. Spector served as Director at the Siegfried Group (accounting firm, 2013-2016), and prior to Siegfried Group as audit senior manager at Deloitte & Touche (accounting firm, 2005-2013).
Shareholder Expense Example
As a shareholder of the Fund, you incur two types of costs: (1) transaction costs, including sales charges (loads) on purchase payments or redemption proceeds, redemption fees and (2) ongoing costs, including management fees, distribution and/or service (12b-1) fees and other Fund expenses. This Example is intended to help you understand your ongoing costs (in dollars) of investing in the Fund and to compare these costs with the ongoing costs of investing in other mutual funds.
The actual expense Example is based on an investment of $1,000 invested at the beginning of the period and held for the entire period (May 1, 2018 to October 31, 2018) for each Class, except Class Z, and for the period (October 2, 2018 to October 31, 2018) for Class Z. The hypothetical expense Example is based on an investment of $1,000 invested for the one-half year period (May 1, 2018 to October 31, 2018).
Actual Expenses
The first line of the accompanying table for each class of the Fund provides information about actual account values and actual expenses. You may use the information in this line, together with the amount you invested, to estimate the expenses that you paid over the period. Simply divide your account value by $1,000.00 (for example, an $8,600 account value divided by $1,000.00 = 8.6), then multiply the result by the number in the first line for a class of the Fund under the heading entitled "Expenses Paid During Period" to estimate the expenses you paid on your account during this period. A small balance maintenance fee of $12.00 that is charged once a year may apply for certain accounts with a value of less than $2,000. This fee, which was eliminated effective August 1, 2018, is not included in the table below. If it was, the estimate of expenses you paid during the period would be higher, and your ending account value lower, by this amount. In addition, the Fund, as a shareholder in the underlying Fidelity Central Funds, will indirectly bear its pro-rata share of the fees and expenses incurred by the underlying Fidelity Central Funds. These fees and expenses are not included in the Fund's annualized expense ratio used to calculate the expense estimate in the table below.
Hypothetical Example for Comparison Purposes
The second line of the accompanying table for each class of the Fund provides information about hypothetical account values and hypothetical expenses based on a Class' actual expense ratio and an assumed rate of return of 5% per year before expenses, which is not the Class' actual return. The hypothetical account values and expenses may not be used to estimate the actual ending account balance or expenses you paid for the period. You may use this information to compare the ongoing costs of investing in the Fund and other funds. To do so, compare this 5% hypothetical example with the 5% hypothetical examples that appear in the shareholder reports of the other funds. A small balance maintenance fee of $12.00 that is charged once a year may apply for certain accounts with a value of less than $2,000. This fee, which was eliminated effective August 1, 2018, is not included in the table below. If it was, the estimate of expenses you paid during the period would be higher, and your ending account value lower, by this amount. In addition, the Fund, as a shareholder in the underlying Fidelity Central Funds, will indirectly bear its pro-rata share of the fees and expenses incurred by the underlying Fidelity Central Funds. These fees and expenses are not included in the Fund's annualized expense ratio used to calculate the expense estimate in the table below.
Please note that the expenses shown in the table are meant to highlight your ongoing costs only and do not reflect any transaction costs. Therefore, the second line of the table is useful in comparing ongoing costs only, and will not help you determine the relative total costs of owning different funds. In addition, if these transactional costs were included, your costs would have been higher.
| Annualized Expense Ratio-A | Beginning Account Value | Ending Account Value October 31, 2018 | Expenses Paid During Period | |
| Class A | 1.17% | |||
| Actual | $1,000.00 | $955.30 | $5.77-B | |
| Hypothetical-C | $1,000.00 | $1,019.31 | $5.96-D | |
| Class M | 1.47% | |||
| Actual | $1,000.00 | $953.90 | $7.24-B | |
| Hypothetical-C | $1,000.00 | $1,017.80 | $7.48-D | |
| Class C | 1.89% | |||
| Actual | $1,000.00 | $951.70 | $9.30-B | |
| Hypothetical-C | $1,000.00 | $1,015.68 | $9.60-D | |
| Canada | .85% | |||
| Actual | $1,000.00 | $956.80 | $4.19-B | |
| Hypothetical-C | $1,000.00 | $1,020.92 | $4.33-D | |
| Class I | .82% | |||
| Actual | $1,000.00 | $956.90 | $4.04-B | |
| Hypothetical-C | $1,000.00 | $1,021.07 | $4.18-D | |
| Class Z | .80% | |||
| Actual | $1,000.00 | $926.20 | $.63-E | |
| Hypothetical-C | $1,000.00 | $1,021.17 | $4.08-D |
A Annualized expense ratio reflects expenses net of applicable fee waivers.
B Actual expenses are equal to each Class' annualized expense ratio, multiplied by the average account value over the period, multiplied by 184/365 (to reflect the one-half year period).
C 5% return per year before expenses
D Hypothetical expenses are equal to each Class' annualized expense ratio, multiplied by the average account value over the period, multiplied by 184/365 (to reflect the one-half year period).
E Actual expenses are equal to the Class' annualized expense ratio, multiplied by the average account value over the period, multiplied by 30/365 (to reflect the period October 2, 2018 to October 31, 2018).
Distributions (Unaudited)
The Board of Trustees of Fidelity Canada Fund voted to pay to shareholders of record at the opening of business on record date, the following distributions per share derived from capital gains realized from sales of portfolio securities and dividends derived from net investment income:
| Pay Date | Record Date | Dividends | Capital Gains | |
| Fidelity Canada Fund | ||||
| Class A | 12/10/18 | 12/07/18 | $0.390 | $2.630 |
| Class M | 12/10/18 | 12/07/18 | $0.222 | $2.630 |
| Class C | 12/10/18 | 12/07/18 | $0.000 | $2.630 |
| Canada | 12/10/18 | 12/07/18 | $0.577 | $2.630 |
| Class I | 12/10/18 | 12/07/18 | $0.592 | $2.630 |
| Class Z | 12/10/18 | 12/07/18 | $0.688 | $2.630 |
The fund hereby designates as a capital gain dividend with respect to the taxable year ended October 31, 2018, $52,372,439, or, if subsequently determined to be different, the net capital gain of such year.
Class A, Class M and Class C designate 1% of the dividends distributed during the fiscal year as qualifying for the dividends–received deduction for corporate shareholders.
Class A designates 100%, Class M designates 100%, Class C designates 100%, Canada designates 98%, and Class I designate 98% of the dividends distributed during the fiscal year as amounts which may be taken into account as a dividend for purposes of the maximum rate under section 1(h)(11) of the Internal Revenue Code.
The amounts per share which represent income derived from sources within, and taxes paid to, foreign countries or possessions of the United States are as follows:
| Pay Date | Income | Taxes | |
| Fidelity Canada Fund | |||
| Class A | 12/11/17 | $1.0201 | $0.1731 |
| Class M | 12/11/17 | $0.8331 | $0.1731 |
| Class C | 12/11/17 | $0.6151 | $0.1731 |
| Canada | 12/11/17 | $1.2011 | $0.1731 |
| Class I | 12/11/17 | $1.1961 | $0.1731 |
The fund will notify shareholders in January 2019 of amounts for use in preparing 2018 income tax returns.
Board Approval of Investment Advisory Contracts
Fidelity Canada Fund
At its July 2018 meeting, the Board of Trustees, including the Independent Trustees (together, the Board), voted to continue the management contract with Fidelity Management & Research Company (FMR) and the sub-advisory agreements (together, the Advisory Contracts) for the fund for six months through January 31, 2019, in connection with the reunification of the Fidelity Equity High Income Funds Board, which oversees the fund, and the Sector Portfolios Board.
The Board considered that the approval of the fund's Advisory Contracts will not result in any changes in (i) the investment process or strategies employed in the management of the fund's assets; (ii) the fees and expenses paid by shareholders; (iii) the nature, extent or quality of services provided under the fund's Advisory Contracts; or (iv) the day-to-day management of the fund or the persons primarily responsible for such management. The Board concluded that the fund's Advisory Contracts are fair and reasonable, and that the fund's Advisory Contracts should be renewed, without modification, through January 31, 2019, with the understanding that the Board will consider the annual renewal for a full one year period in January 2019.
In connection with its consideration of future renewals of the fund's Advisory Contracts, the Board will consider: (i) the nature, extent and quality of services provided to the fund, including shareholder and administrative services and investment performance; (ii) the competitiveness of the management fee and total expenses for the fund; (iii) the costs of the services and profitability, including the revenues earned and the expenses incurred in conducting the business of developing, marketing, distributing, managing, administering, and servicing the fund and its shareholders, to the extent applicable, as well as potential fall-out benefits from Fidelity's non-fund businesses; and (iv) whether there have been economies of scale in respect of the Fidelity funds, whether the Fidelity funds (including the fund) have appropriately benefited from any such economies of scale, and whether there is the potential for realization of any further economies.
Based on its evaluation of all of the conclusions noted above, and after considering all factors it believed relevant, the Board ultimately concluded that the fund's management fee structure is fair and reasonable, and that the continuation of the fund's Advisory Contracts should be approved.
![]()
ACAN-ANN-1218
1.843165.111
Fidelity Advisor® China Region Fund - Class A, Class M, Class C, Class I and Class Z Annual Report October 31, 2018 Class A, Class M, Class C, Class I and Class Z are classes of Fidelity® China Region Fund |
|
Contents
To view a fund's proxy voting guidelines and proxy voting record for the 12-month period ended June 30, visit http://www.fidelity.com/proxyvotingresults or visit the Securities and Exchange Commission's (SEC) web site at http://www.sec.gov.
You may also call 1-877-208-0098 to request a free copy of the proxy voting guidelines.
Standard & Poor's, S&P and S&P 500 are registered service marks of The McGraw-Hill Companies, Inc. and have been licensed for use by Fidelity Distributors Corporation.
Other third-party marks appearing herein are the property of their respective owners.
All other marks appearing herein are registered or unregistered trademarks or service marks of FMR LLC or an affiliated company. © 2018 FMR LLC. All rights reserved.
This report and the financial statements contained herein are submitted for the general information of the shareholders of the Fund. This report is not authorized for distribution to prospective investors in the Fund unless preceded or accompanied by an effective prospectus.
A fund files its complete schedule of portfolio holdings with the SEC for the first and third quarters of each fiscal year on Form N-Q. Forms N-Q are available on the SEC’s web site at http://www.sec.gov. A fund's Forms N-Q may be reviewed and copied at the SEC’s Public Reference Room in Washington, DC. Information regarding the operation of the SEC's Public Reference Room may be obtained by calling 1-800-SEC-0330.
For a complete list of a fund's portfolio holdings, view the most recent holdings listing, semiannual report, or annual report on Fidelity's web site at http://www.fidelity.com, http://www.institutional.fidelity.com, or http://www.401k.com, as applicable.
NOT FDIC INSURED •MAY LOSE VALUE •NO BANK GUARANTEE
Neither the Fund nor Fidelity Distributors Corporation is a bank.
Performance: The Bottom Line
Average annual total return reflects the change in the value of an investment, assuming reinvestment of distributions from dividend income and capital gains (the profits earned upon the sale of securities that have grown in value, if any) and assuming a constant rate of performance each year. The hypothetical investment and the average annual total returns do not reflect the deduction of taxes that a shareholder would pay on fund distributions or the redemption of fund shares. During periods of reimbursement by Fidelity, a fund’s total return will be greater than it would be had the reimbursement not occurred. How a fund did yesterday is no guarantee of how it will do tomorrow.
Average Annual Total Returns
| For the periods ended October 31, 2018 | Past 1 year | Past 5 years | Past 10 years |
| Class A (incl. 5.75% sales charge) | (20.70)% | 2.42% | 9.84% |
| Class M (incl. 3.50% sales charge) | (19.09)% | 2.57% | 9.77% |
| Class C (incl. contingent deferred sales charge) | (17.33)% | 2.88% | 9.67% |
| Class I | (15.63)% | 3.98% | 10.84% |
| Class Z | (15.60)% | 3.98% | 10.84% |
The initial offering of Class Z shares took place on October 2, 2018. Returns prior to October 2, 2018, are those of Class I.
$10,000 Over 10 Years
Let's say hypothetically that $10,000 was invested in Fidelity Advisor® China Region Fund - Class A on October 31, 2008, and the current 5.75% sales charge was paid.
The chart shows how the value of your investment would have changed, and also shows how the MSCI Golden Dragon Index performed over the same period.
See above for additional information regarding the performance of Class A.
| Period Ending Values | ||
| $25,568 | Fidelity Advisor® China Region Fund - Class A | |
| $27,683 | MSCI Golden Dragon Index | |
Management's Discussion of Fund Performance
Market Recap: International equities returned -8.08% for the 12 months ending October 31, 2018, according to the MSCI ACWI (All Country World Index) ex USA Index. A modestly positive first half of the period gave way to a confluence of overwhelmingly negative factors – including escalating trade tensions, a surging U.S. dollar, tepid economic growth in Europe, global central bank tightening, concerns about Italy’s budget stalemate with the EU, and weakness in China’s stock market. The index lost 8% in October alone, its largest monthly drop in more than six years. Among sectors, communications services (-15%) was hit the hardest, while economically sensitive consumer discretionary (-13%), information technology (-12%), financials (-10%), industrials (-9%) and materials (-7%) stocks also fared poorly. Even the more defensive real estate (-9%), utilities (-6%) and consumer staples (-5%) sectors weren’t spared this period. Conversely, elevated crude-oil prices fueled a positive return for energy (+7%), the top-performing sector, followed by the relatively stable-growing health care segment (+2%). Regionally, emerging markets (-12%) fared the worst, hampered by the impact of foreign exchange and concerns about economic weakness in China, India and South Korea. Sluggish growth also pressured shares in continental Europe (-9%). Stocks in Japan (-3%) and the U.K. (-4%) held up better, followed by Canada (-5%) and Asia-Pacific ex Japan (-6%).Comments from Co-Portfolio Managers Stephen Lieu and Ivan Xie: For the year, the fund’s share classes (excluding sales charges, if applicable) returned roughly -16%, trailing the -13.61% return of the benchmark MSCI Golden Dragon Index. Versus the benchmark, positioning in financials and information technology detracted most from fund performance. By country, our picks in China and Taiwan were responsible for most of the shortfall. The largest relative detractor was an out-of-benchmark stake in Suofeiya Home Collection, a China-based manufacturer of customized furniture that suffered from a slowdown in the nation’s property market. Other relative detractors included Geely Automobile, a stock we added this period, and Lens Technology, which makes cover glass for smartphones – both based in China. We exited the latter position by period end. Conversely, an overweighting in health care and positioning in energy lifted our relative result, as did a cash position of about 4%, on average. CSPC Pharmaceutical Group, a China-based maker of pharmaceuticals and supplements added more value than any other fund position.The views expressed above reflect those of the portfolio manager(s) only through the end of the period as stated on the cover of this report and do not necessarily represent the views of Fidelity or any other person in the Fidelity organization. Any such views are subject to change at any time based upon market or other conditions and Fidelity disclaims any responsibility to update such views. These views may not be relied on as investment advice and, because investment decisions for a Fidelity fund are based on numerous factors, may not be relied on as an indication of trading intent on behalf of any Fidelity fund.
Note to shareholders: On April 3, 2018, Stephen Lieu and Ivan Xie joined Lead Portfolio Manager Robert Bao as Co-Managers of the fund. On June 8, 2018, Bao assumed Co-Manager responsibilities through June 30, 2018, at which time he left the firm to pursue other opportunities.Investment Summary (Unaudited)
Geographic Diversification (% of fund's net assets)
| As of October 31, 2018 | ||
| Cayman Islands | 35.9% | |
| China | 23.5% | |
| Taiwan | 14.3% | |
| Hong Kong | 13.6% | |
| United States of America* | 5.2% | |
| Bermuda | 4.0% | |
| Bailiwick of Jersey | 1.1% | |
| Korea (South) | 1.0% | |
| British Virgin Islands | 0.9% | |
| Other | 0.5% | |

* Includes Short-Term investments and Net Other Assets (Liabilities).
Percentages are based on country or territory of incorporation and are adjusted for the effect of futures contracts, if applicable.
Asset Allocation as of October 31, 2018
| % of fund's net assets | |
| Stocks | 95.5 |
| Short-Term Investments and Net Other Assets (Liabilities) | 4.5 |
Top Ten Stocks as of October 31, 2018
| % of fund's net assets | |
| Tencent Holdings Ltd. (Interactive Media & Services) | 10.3 |
| Alibaba Group Holding Ltd. sponsored ADR (Internet & Direct Marketing Retail) | 8.4 |
| Taiwan Semiconductor Manufacturing Co. Ltd. (Semiconductors & Semiconductor Equipment) | 6.2 |
| AIA Group Ltd. (Insurance) | 4.8 |
| China Construction Bank Corp. (H Shares) (Banks) | 4.3 |
| Industrial & Commercial Bank of China Ltd. (H Shares) (Banks) | 2.9 |
| CNOOC Ltd. (Oil, Gas & Consumable Fuels) | 2.3 |
| Ping An Insurance (Group) Co. of China Ltd. (H Shares) (Insurance) | 2.2 |
| China Unicom Ltd. (Diversified Telecommunication Services) | 2.1 |
| NetEase, Inc. ADR (Entertainment) | 2.0 |
| 45.5 |
Top Market Sectors as of October 31, 2018
| % of fund's net assets | |
| Financials | 21.0 |
| Consumer Discretionary | 16.5 |
| Communication Services | 16.2 |
| Information Technology | 14.4 |
| Real Estate | 5.4 |
| Industrials | 4.8 |
| Energy | 4.6 |
| Materials | 4.1 |
| Consumer Staples | 3.5 |
| Health Care | 3.0 |
Market Sectors may include more than one industry category.
The Fund may invest up to 35% of its total assets in any industry that represents more than 20% of the Hong Kong, Taiwanese and Chinese markets. As of October 31, 2018, the Fund did not have more than 25% of its total assets invested in any one industry.
Schedule of Investments October 31, 2018
Showing Percentage of Net Assets
| Common Stocks - 95.5% | |||
| Shares | Value | ||
| COMMUNICATION SERVICES - 16.2% | |||
| Diversified Telecommunication Services - 2.8% | |||
| China Telecom Corp. Ltd. (H Shares) | 14,300,000 | $6,747,046 | |
| China Unicom Ltd. | 20,936,000 | 21,897,987 | |
| China Unicom Ltd. sponsored ADR | 65 | 678 | |
| 28,645,711 | |||
| Entertainment - 2.0% | |||
| NetEase, Inc. ADR | 100,300 | 20,847,355 | |
| Interactive Media & Services - 11.0% | |||
| 58.com, Inc. ADR (a) | 38,300 | 2,512,097 | |
| Momo, Inc. ADR (a) | 144,000 | 4,834,080 | |
| Tencent Holdings Ltd. | 3,101,100 | 106,241,403 | |
| 113,587,580 | |||
| Wireless Telecommunication Services - 0.4% | |||
| SmarTone Telecommunications Holdings Ltd. | 3,208,000 | 4,450,811 | |
| TOTAL COMMUNICATION SERVICES | 167,531,457 | ||
| CONSUMER DISCRETIONARY - 16.5% | |||
| Automobiles - 1.6% | |||
| Geely Automobile Holdings Ltd. | 8,862,000 | 16,951,141 | |
| Diversified Consumer Services - 1.3% | |||
| New Oriental Education & Technology Group, Inc. sponsored ADR | 229,800 | 13,445,598 | |
| Hotels, Restaurants & Leisure - 0.7% | |||
| Yum China Holdings, Inc. | 194,500 | 7,017,560 | |
| Household Durables - 2.1% | |||
| Gree Electric Appliances, Inc. of Zhuhai Class A (a) | 1,120,748 | 6,114,938 | |
| Midea Group Co. Ltd. Class A | 995,500 | 5,286,005 | |
| Sundart Holdings Ltd. | 15,954,000 | 9,561,882 | |
| Suofeiya Home Collection Co. Ltd. Class A | 231,121 | 596,054 | |
| 21,558,879 | |||
| Internet & Direct Marketing Retail - 9.5% | |||
| Alibaba Group Holding Ltd. sponsored ADR (a) | 610,500 | 86,861,940 | |
| Meituan Dianping Class B | 1,983,088 | 11,539,006�� | |
| 98,400,946 | |||
| Specialty Retail - 0.2% | |||
| China Yongda Automobiles Services Holdings Ltd. | 3,718,000 | 1,986,549 | |
| Textiles, Apparel & Luxury Goods - 1.1% | |||
| Pinduoduo, Inc. ADR (b) | 142,638 | 2,517,561 | |
| Shenzhou International Group Holdings Ltd. | 786,000 | 8,679,933 | |
| 11,197,494 | |||
| TOTAL CONSUMER DISCRETIONARY | 170,558,167 | ||
| CONSUMER STAPLES - 3.5% | |||
| Beverages - 1.3% | |||
| Jiangsu Yanghe Brewery Joint-Stock Co. Ltd. Class A | 444,921 | 5,637,692 | |
| Kweichow Moutai Co. Ltd. (A Shares) | 100,882 | 7,938,204 | |
| 13,575,896 | |||
| Food & Staples Retailing - 0.1% | |||
| Taiwan FamilyMart Co. Ltd. | 159,000 | 1,078,471 | |
| Food Products - 1.0% | |||
| Inner Mongoli Yili Industries Co. Ltd. (A Shares) | 3,374,869 | 10,682,461 | |
| Personal Products - 1.1% | |||
| Grape King Bio Ltd. | 1,756,000 | 11,059,899 | |
| TOTAL CONSUMER STAPLES | 36,396,727 | ||
| ENERGY - 4.6% | |||
| Energy Equipment & Services - 1.8% | |||
| China Oilfield Services Ltd. (H Shares) | 17,392,000 | 16,300,946 | |
| Yantai Jereh Oilfield Services Class A | 966,517 | 2,819,611 | |
| 19,120,557 | |||
| Oil, Gas & Consumable Fuels - 2.8% | |||
| CNOOC Ltd. | 13,702,000 | 23,334,231 | |
| PetroChina Co. Ltd. (H Shares) | 7,332,000 | 5,271,882 | |
| 28,606,113 | |||
| TOTAL ENERGY | 47,726,670 | ||
| FINANCIALS - 21.0% | |||
| Banks - 10.3% | |||
| BOC Hong Kong (Holdings) Ltd. | 3,422,000 | 12,785,672 | |
| China Construction Bank Corp. (H Shares) | 55,877,000 | 44,341,034 | |
| Dah Sing Banking Group Ltd. | 1,549,600 | 2,944,298 | |
| Dah Sing Financial Holdings Ltd. | 277,200 | 1,486,398 | |
| E.SUN Financial Holdings Co. Ltd. | 21,812,109 | 14,442,539 | |
| Industrial & Commercial Bank of China Ltd. (H Shares) | 44,569,000 | 30,238,866 | |
| 106,238,807 | |||
| Capital Markets - 1.4% | |||
| China Petroleum Engineering Corp. ELS (UBS Bank Warrant Program) warrants 10/28/19 (a)(c) | 7,356,276 | 5,009,184 | |
| CITIC Securities Co. Ltd. (H Shares) | 4,092,500 | 7,201,844 | |
| Value Partners Group Ltd. | 3,137,000 | 2,328,163 | |
| 14,539,191 | |||
| Consumer Finance - 0.2% | |||
| LexinFintech Holdings Ltd. ADR | 97,100 | 949,638 | |
| PPDAI Group, Inc. ADR (a) | 188,594 | 1,076,872 | |
| 2,026,510 | |||
| Insurance - 9.1% | |||
| AIA Group Ltd. | 6,469,200 | 48,960,656 | |
| China Life Insurance Co. Ltd. (H Shares) | 3,749,000 | 7,512,240 | |
| China Pacific Insurance (Group) Co. Ltd. (H Shares) | 1,333,000 | 4,963,510 | |
| PICC Property & Casualty Co. Ltd. (H Shares) | 9,825,000 | 9,521,866 | |
| Ping An Insurance (Group) Co. of China Ltd. (H Shares) | 2,401,000 | 22,610,939 | |
| 93,569,211 | |||
| TOTAL FINANCIALS | 216,373,719 | ||
| HEALTH CARE - 3.0% | |||
| Biotechnology - 0.9% | |||
| China Biologic Products Holdings, Inc. (a)(b) | 142,200 | 9,447,768 | |
| Health Care Equipment & Supplies - 0.3% | |||
| Ginko International Co. Ltd. | 460,000 | 2,614,945 | |
| Health Care Providers & Services - 0.1% | |||
| China Resources Medical Holdin | 1,879,000 | 1,291,491 | |
| Pharmaceuticals - 1.7% | |||
| Ascletis Pharma, Inc. (a) | 3,506,000 | 2,543,900 | |
| Tonghua Dongbao Pharmaceutical Co. Ltd. Class A | 6,155,220 | 11,806,333 | |
| Yunnan Baiyao Group Co. Ltd. (d) | 286,245 | 2,881,880 | |
| 17,232,113 | |||
| TOTAL HEALTH CARE | 30,586,317 | ||
| INDUSTRIALS - 4.8% | |||
| Construction & Engineering - 1.0% | |||
| Sinopec Engineering Group Co. Ltd. (H Shares) | 11,310,500 | 10,514,419 | |
| Electrical Equipment - 0.3% | |||
| BizLink Holding, Inc. | 618,000 | 3,293,551 | |
| Industrial Conglomerates - 1.9% | |||
| CK Hutchison Holdings Ltd. | 1,903,500 | 19,163,770 | |
| Machinery - 0.6% | |||
| Cimc Enric Holdings Ltd. | 5,798,000 | 4,450,929 | |
| Zhengzhou Yutong Bus Co. Ltd. | 1,399,918 | 2,139,317 | |
| 6,590,246 | |||
| Marine - 0.5% | |||
| Pacific Basin Shipping Ltd. | 24,796,000 | 5,406,966 | |
| Professional Services - 0.2% | |||
| Sporton International, Inc. | 556,000 | 2,065,212 | |
| Transportation Infrastructure - 0.3% | |||
| Shanghai International Airport Co. Ltd. (A Shares) | 402,741 | 2,860,782 | |
| TOTAL INDUSTRIALS | 49,894,946 | ||
| INFORMATION TECHNOLOGY - 14.4% | |||
| Communications Equipment - 0.9% | |||
| Nanfang Communication Holdings Ltd. | 14,428,000 | 9,291,235 | |
| Electronic Equipment & Components - 2.2% | |||
| Chroma ATE, Inc. | 862,000 | 3,020,849 | |
| FLEXium Interconnect, Inc. | 1,800,000 | 4,517,369 | |
| Hangzhou Hikvision Digital Technology Co. Ltd. Class A | 1,656,944 | 5,748,288 | |
| Hon Hai Precision Industry Co. Ltd. (Foxconn) | 1,219,520 | 3,103,896 | |
| Largan Precision Co. Ltd. | 27,000 | 2,921,464 | |
| Sunny Optical Technology Group Co. Ltd. | 324,600 | 2,814,708 | |
| 22,126,574 | |||
| Semiconductors & Semiconductor Equipment - 10.4% | |||
| Himax Technologies, Inc. sponsored ADR | 240,562 | 1,277,384 | |
| Nanya Technology Corp. | 4,276,000 | 7,098,929 | |
| Parade Technologies Ltd. | 641,000 | 8,488,558 | |
| Phison Electronics Corp. | 740,000 | 4,851,989 | |
| Semiconductor Manufacturing International Corp. (a) | 4,142,500 | 3,421,861 | |
| Silergy Corp. | 457,000 | 5,815,733 | |
| Taiwan Semiconductor Manufacturing Co. Ltd. | 8,533,000 | 64,024,283 | |
| United Microelectronics Corp. | 18,963,000 | 7,222,366 | |
| Win Semiconductors Corp. | 1,698,000 | 5,210,187 | |
| 107,411,290 | |||
| Technology Hardware, Storage & Peripherals - 0.9% | |||
| ADLINK Technology, Inc. | 1,920,844 | 2,177,666 | |
| Ennoconn Corp. | 1,103,000 | 7,303,338 | |
| 9,481,004 | |||
| TOTAL INFORMATION TECHNOLOGY | 148,310,103 | ||
| MATERIALS - 4.1% | |||
| Chemicals - 1.7% | |||
| Formosa Plastics Corp. | 1,188,000 | 3,875,519 | |
| LG Chemical Ltd. | 36,138 | 10,990,259 | |
| Nan Ya Plastics Corp. | 1,216,000 | 3,020,313 | |
| 17,886,091 | |||
| Construction Materials - 1.3% | |||
| BBMG Corp. (H Shares) (b) | 9,772,000 | 2,691,616 | |
| West China Cement Ltd. | 76,304,000 | 11,287,070 | |
| 13,978,686 | |||
| Metals & Mining - 1.1% | |||
| Zijin Mng Group Co. Ltd. (H Shares) | 29,330,000 | 10,883,811 | |
| TOTAL MATERIALS | 42,748,588 | ||
| REAL ESTATE - 5.4% | |||
| Real Estate Management & Development - 5.4% | |||
| Cheung Kong Property Holdings Ltd. | 982,500 | 6,377,145 | |
| China Overseas Land and Investment Ltd. | 4,074,000 | 12,754,060 | |
| Hongkong Land Holdings Ltd. | 1,955,000 | 11,573,600 | |
| Longfor Properties Co. Ltd. | 4,308,500 | 10,460,898 | |
| Sino Land Ltd. | 8,938,000 | 14,019,141 | |
| 55,184,844 | |||
| UTILITIES - 2.0% | |||
| Gas Utilities - 2.0% | |||
| China Gas Holdings Ltd. | 3,081,600 | 9,745,494 | |
| China Resource Gas Group Ltd. | 2,954,000 | 11,300,761 | |
| 21,046,255 | |||
| TOTAL COMMON STOCKS | |||
| (Cost $928,790,429) | 986,357,793 | ||
| Money Market Funds - 3.9% | |||
| Fidelity Cash Central Fund, 2.23% (e) | 37,255,581 | 37,263,032 | |
| Fidelity Securities Lending Cash Central Fund 2.23% (e)(f) | 3,037,419 | 3,037,722 | |
| TOTAL MONEY MARKET FUNDS | |||
| (Cost $40,300,754) | 40,300,754 | ||
| TOTAL INVESTMENT IN SECURITIES - 99.4% | |||
| (Cost $969,091,183) | 1,026,658,547 | ||
| NET OTHER ASSETS (LIABILITIES) - 0.6% | 5,891,194 | ||
| NET ASSETS - 100% | $1,032,549,741 |
Security Type Abbreviations
ELS – Equity-Linked Security
Legend
(a) Non-income producing
(b) Security or a portion of the security is on loan at period end.
(c) Security exempt from registration under Rule 144A of the Securities Act of 1933. These securities may be resold in transactions exempt from registration, normally to qualified institutional buyers. At the end of the period, the value of these securities amounted to $5,009,184 or 0.5% of net assets.
(d) Level 3 security
(e) Affiliated fund that is generally available only to investment companies and other accounts managed by Fidelity Investments. The rate quoted is the annualized seven-day yield of the fund at period end. A complete unaudited listing of the fund's holdings as of its most recent quarter end is available upon request. In addition, each Fidelity Central Fund's financial statements, which are not covered by the Fund's Report of Independent Registered Public Accounting Firm, are available on the SEC's website or upon request.
(f) Investment made with cash collateral received from securities on loan.
Affiliated Central Funds
Information regarding fiscal year to date income earned by the Fund from investments in Fidelity Central Funds is as follows:
| Fund | Income earned |
| Fidelity Cash Central Fund | $832,298 |
| Fidelity Securities Lending Cash Central Fund | 181,809 |
| Total | $1,014,107 |
Amounts in the income column in the above table include any capital gain distributions from underlying funds, which are presented in the corresponding line-item in the Statement of Operations if applicable.
Investment Valuation
The following is a summary of the inputs used, as of October 31, 2018, involving the Fund's assets and liabilities carried at fair value. The inputs or methodology used for valuing securities may not be an indication of the risk associated with investing in those securities. For more information on valuation inputs, and their aggregation into the levels used below, please refer to the Investment Valuation section in the accompanying Notes to Financial Statements.
| Valuation Inputs at Reporting Date: | ||||
| Description | Total | Level 1 | Level 2 | Level 3 |
| Investments in Securities: | ||||
| Equities: | ||||
| Communication Services | $167,531,457 | $39,392,067 | $128,139,390 | $-- |
| Consumer Discretionary | 170,558,167 | 159,019,161 | 11,539,006 | -- |
| Consumer Staples | 36,396,727 | 36,396,727 | -- | -- |
| Energy | 47,726,670 | 19,120,557 | 28,606,113 | -- |
| Financials | 216,373,719 | 129,272,395 | 87,101,324 | -- |
| Health Care | 30,586,317 | 27,704,437 | -- | 2,881,880 |
| Industrials | 49,894,946 | 49,894,946 | -- | -- |
| Information Technology | 148,310,103 | 73,641,593 | 74,668,510 | -- |
| Materials | 42,748,588 | 42,748,588 | -- | -- |
| Real Estate | 55,184,844 | 55,184,844 | -- | -- |
| Utilities | 21,046,255 | 21,046,255 | -- | -- |
| Money Market Funds | 40,300,754 | 40,300,754 | -- | -- |
| Total Investments in Securities: | $1,026,658,547 | $693,722,324 | $330,054,343 | $2,881,880 |
The following is a summary of transfers between Level 1 and Level 2 for the period ended October 31, 2018. Transfers are assumed to have occurred at the beginning of the period, and are primarily attributable to the valuation techniques used for foreign equity securities, as discussed in the accompanying Notes to Financial Statements:
| Transfers | Total |
| Level 1 to Level 2 | $53,713,026 |
| Level 2 to Level 1 | $0 |
The following are reconciliations of Investments in Securities for which Level 3 inputs were used in determining value:
| Consumer Discretionary: | |
| Beginning Balance | $11,083,598 |
| Net Realized Gain (Loss) on Investment Securities | -- |
| Net Unrealized Gain (Loss) on Investment Securities | (4,815,354) |
| Cost of Purchases | -- |
| Proceeds of Sales | (6,268,244) |
| Amortization/Accretion | -- |
| Transfers into Level 3 | -- |
| Transfers out of Level 3 | -- |
| Ending Balance | $-- |
| The change in unrealized gain (loss) for the period attributable to Level 3 securities held at October 31, 2018 | $-- |
| Other Investments in Securities: | |
| Beginning Balance | $-- |
| Net Realized Gain (Loss) on Investment Securities | 2,190,445 |
| Net Unrealized Gain (Loss) on Investment Securities | (2,976,464) |
| Cost of Purchases | 2,956,846 |
| Proceeds of Sales | (8,128,190) |
| Amortization/Accretion | -- |
| Transfers into Level 3 | 8,839,243 |
| Transfers out of Level 3 | -- |
| Ending Balance | $2,881,880 |
| The change in unrealized gain (loss) for the period attributable to Level 3 securities held at October 31, 2018 | $(2,976,465) |
The information used in the above reconciliations represent fiscal year to date activity for any Investments in Securities identified as using Level 3 inputs at either the beginning or the end of the current fiscal period. Transfers in or out of Level 3 represent the beginning value of any Security or Instrument where a change in the pricing level occurred from the beginning to the end of the period. The cost of purchases and the proceeds of sales may include securities received or delivered through corporate actions or exchanges. Realized and unrealized gains (losses) disclosed in the reconciliations are included in Net Gain (Loss) on the Fund's Statement of Operations.
See accompanying notes which are an integral part of the financial statements.
Financial Statements
Statement of Assets and Liabilities
| October 31, 2018 | ||
| Assets | ||
| Investment in securities, at value (including securities loaned of $2,982,644) — See accompanying schedule: Unaffiliated issuers (cost $928,790,429) | $986,357,793 | |
| Fidelity Central Funds (cost $40,300,754) | 40,300,754 | |
| Total Investment in Securities (cost $969,091,183) | $1,026,658,547 | |
| Foreign currency held at value (cost $10,025) | 10,030 | |
| Receivable for investments sold | 9,556,495 | |
| Receivable for fund shares sold | 510,423 | |
| Dividends receivable | 581,142 | |
| Distributions receivable from Fidelity Central Funds | 65,909 | |
| Prepaid expenses | 2,812 | |
| Other receivables | 248,562 | |
| Total assets | 1,037,633,920 | |
| Liabilities | ||
| Payable for investments purchased | $263,111 | |
| Payable for fund shares redeemed | 641,491 | |
| Accrued management fee | 623,821 | |
| Distribution and service plan fees payable | 17,704 | |
| Other affiliated payables | 228,018 | |
| Other payables and accrued expenses | 272,149 | |
| Collateral on securities loaned | 3,037,885 | |
| Total liabilities | 5,084,179 | |
| Net Assets | $1,032,549,741 | |
| Net Assets consist of: | ||
| Paid in capital | $1,012,934,286 | |
| Total distributable earnings (loss) | 19,615,455 | |
| Net Assets | $1,032,549,741 | |
| Net Asset Value and Maximum Offering Price | ||
| Class A: | ||
| Net Asset Value and redemption price per share ($23,423,957 ÷ 815,415 shares) | $28.73 | |
| Maximum offering price per share (100/94.25 of $28.73) | $30.48 | |
| Class M: | ||
| Net Asset Value and redemption price per share ($8,131,547 ÷ 284,850 shares) | $28.55 | |
| Maximum offering price per share (100/96.50 of $28.55) | $29.59 | |
| Class C: | ||
| Net Asset Value and offering price per share ($10,138,026 ÷ 363,375 shares)(a) | $27.90 | |
| China Region: | ||
| Net Asset Value, offering price and redemption price per share ($969,679,165 ÷ 33,308,224 shares) | $29.11 | |
| Class I: | ||
| Net Asset Value, offering price and redemption price per share ($20,853,800 ÷ 721,533 shares) | $28.90 | |
| Class Z: | ||
| Net Asset Value, offering price and redemption price per share ($323,246 ÷ 11,182 shares) | $28.91 |
(a) Redemption price per share is equal to net asset value less any applicable contingent deferred sales charge.
See accompanying notes which are an integral part of the financial statements.
Statement of Operations
| Year ended October 31, 2018 | ||
| Investment Income | ||
| Dividends | $25,434,201 | |
| Income from Fidelity Central Funds | 1,014,107 | |
| Income before foreign taxes withheld | 26,448,308 | |
| Less foreign taxes withheld | (2,663,955) | |
| Total income | 23,784,353 | |
| Expenses | ||
| Management fee | $9,871,085 | |
| Transfer agent fees | 2,555,372 | |
| Distribution and service plan fees | 280,341 | |
| Accounting and security lending fees | 646,400 | |
| Custodian fees and expenses | 442,271 | |
| Independent trustees' fees and expenses | 7,222 | |
| Registration fees | 124,049 | |
| Audit | 85,132 | |
| Legal | 3,697 | |
| Interest | 4,514 | |
| Miscellaneous | 9,469 | |
| Total expenses before reductions | 14,029,552 | |
| Expense reductions | (473,186) | |
| Total expenses after reductions | 13,556,366 | |
| Net investment income (loss) | 10,227,987 | |
| Realized and Unrealized Gain (Loss) | ||
| Net realized gain (loss) on: | ||
| Investment securities: | ||
| Unaffiliated issuers | 94,518,556 | |
| Fidelity Central Funds | (856) | |
| Foreign currency transactions | (502,302) | |
| Total net realized gain (loss) | 94,015,398 | |
| Change in net unrealized appreciation (depreciation) on: | ||
| Investment securities: | ||
| Unaffiliated issuers | (301,943,119) | |
| Fidelity Central Funds | (365) | |
| Assets and liabilities in foreign currencies | (3,121) | |
| Total change in net unrealized appreciation (depreciation) | (301,946,605) | |
| Net gain (loss) | (207,931,207) | |
| Net increase (decrease) in net assets resulting from operations | $(197,703,220) |
See accompanying notes which are an integral part of the financial statements.
Statement of Changes in Net Assets
| Year ended October 31, 2018 | Year ended October 31, 2017 | |
| Increase (Decrease) in Net Assets | ||
| Operations | ||
| Net investment income (loss) | $10,227,987 | $6,291,196 |
| Net realized gain (loss) | 94,015,398 | 78,315,721 |
| Change in net unrealized appreciation (depreciation) | (301,946,605) | 266,749,225 |
| Net increase (decrease) in net assets resulting from operations | (197,703,220) | 351,356,142 |
| Distributions to shareholders | (5,632,793) | – |
| Distributions to shareholders from net investment income | – | (10,635,865) |
| Distributions to shareholders from net realized gain | – | (1,988,966) |
| Total distributions | (5,632,793) | (12,624,831) |
| Share transactions - net increase (decrease) | (145,112,080) | (22,198,615) |
| Redemption fees | 88,494 | 258,175 |
| Total increase (decrease) in net assets | (348,359,599) | 316,790,871 |
| Net Assets | ||
| Beginning of period | 1,380,909,340 | 1,064,118,469 |
| End of period | $1,032,549,741 | $1,380,909,340 |
| Other Information | ||
| Undistributed net investment income end of period | $5,536,153 |
See accompanying notes which are an integral part of the financial statements.
Financial Highlights
Fidelity China Region Fund Class A
| Years ended October 31, | 2018 | 2017 | 2016 | 2015 | 2014 |
| Selected Per–Share Data | |||||
| Net asset value, beginning of period | $34.22 | $25.46 | $29.34 | $34.18 | $35.56 |
| Income from Investment Operations | |||||
| Net investment income (loss)A | .15 | .08 | .18 | .40B | .21 |
| Net realized and unrealized gain (loss) | (5.56) | 8.90 | (.20) | (.83) | 2.01C |
| Total from investment operations | (5.41) | 8.98 | (.02) | (.43) | 2.22 |
| Distributions from net investment income | (.08) | (.18) | (.27) | (.22) | (.30) |
| Distributions from net realized gain | – | (.05) | (3.59) | (4.24) | (3.31) |
| Total distributions | (.08) | (.23) | (3.86) | (4.46) | (3.61) |
| Redemption fees added to paid in capitalA | –D | .01 | –D | .05 | .01 |
| Net asset value, end of period | $28.73 | $34.22 | $25.46 | $29.34 | $34.18 |
| Total ReturnE,F | (15.86)% | 35.67% | (.13)% | (1.45)% | 6.45%C |
| Ratios to Average Net AssetsG,H | |||||
| Expenses before reductions | 1.27% | 1.30% | 1.33% | 1.28% | 1.35% |
| Expenses net of fee waivers, if any | 1.27% | 1.30% | 1.33% | 1.28% | 1.35% |
| Expenses net of all reductions | 1.24% | 1.29% | 1.32% | 1.26% | 1.35% |
| Net investment income (loss) | .43% | .28% | .75% | 1.26%B | .64% |
| Supplemental Data | |||||
| Net assets, end of period (000 omitted) | $23,424 | $35,539 | $22,937 | $32,761 | $21,728 |
| Portfolio turnover rateI | 60% | 68% | 70% | 151% | 87% |
A Calculated based on average shares outstanding during the period.
B Net investment income per share reflects large, non-recurring dividend which amounted to $.13 per share. Excluding this non-recurring dividend, the ratio of net investment income (loss) to average net assets would have been .85%.
C Amount includes a reimbursement from the investment adviser for an operational error which amounted to less than $.01 per share. Excluding this reimbursement, the total return would have been 6.42%.
D Amount represents less than $.005 per share.
E Total returns would have been lower if certain expenses had not been reduced during the applicable periods shown.
F Total returns do not include the effect of the sales charges.
G Fees and expenses of any underlying Fidelity Central Funds are not included in the Fund's expense ratio. The Fund indirectly bears its proportionate share of the expenses of any underlying Fidelity Central Funds.
H Expense ratios reflect operating expenses of the class. Expenses before reductions do not reflect amounts reimbursed by the investment adviser or reductions from brokerage service arrangements or reductions from other expense offset arrangements and do not represent the amount paid by the class during periods when reimbursements or reductions occur. Expenses net of fee waivers reflect expenses after reimbursement by the investment adviser but prior to reductions from brokerage service arrangements or other expense offset arrangements. Expenses net of all reductions represent the net expenses paid by the class.
I Amount does not include the portfolio activity of any underlying Fidelity Central Funds.
See accompanying notes which are an integral part of the financial statements.
Fidelity China Region Fund Class M
| Years ended October 31, | 2018 | 2017 | 2016 | 2015 | 2014 |
| Selected Per–Share Data | |||||
| Net asset value, beginning of period | $34.05 | $25.34 | $29.18 | $34.02 | $35.40 |
| Income from Investment Operations | |||||
| Net investment income (loss)A | .03 | (.02) | .10 | .30B | .12 |
| Net realized and unrealized gain (loss) | (5.53) | 8.88 | (.22) | (.83) | 1.99C |
| Total from investment operations | (5.50) | 8.86 | (.12) | (.53) | 2.11 |
| Distributions from net investment income | – | (.11) | (.13) | (.12) | (.19) |
| Distributions from net realized gain | – | (.05) | (3.59) | (4.24) | (3.31) |
| Total distributions | – | (.16) | (3.72) | (4.36) | (3.50) |
| Redemption fees added to paid in capitalA | –D | .01 | –D | .05 | .01 |
| Net asset value, end of period | $28.55 | $34.05 | $25.34 | $29.18 | $34.02 |
| Total ReturnE,F | (16.15)% | 35.25% | (.50)% | (1.79)% | 6.15%C |
| Ratios to Average Net AssetsG,H | |||||
| Expenses before reductions | 1.62% | 1.65% | 1.67% | 1.62% | 1.65% |
| Expenses net of fee waivers, if any | 1.62% | 1.65% | 1.67% | 1.62% | 1.65% |
| Expenses net of all reductions | 1.58% | 1.64% | 1.67% | 1.60% | 1.65% |
| Net investment income (loss) | .08% | (.07)% | .40% | .92%B | .35% |
| Supplemental Data | |||||
| Net assets, end of period (000 omitted) | $8,132 | $9,763 | $5,644 | $6,409 | $6,305 |
| Portfolio turnover rateI | 60% | 68% | 70% | 151% | 87% |
A Calculated based on average shares outstanding during the period.
B Net investment income per share reflects large, non-recurring dividend which amounted to $.13 per share. Excluding this non-recurring dividend, the ratio of net investment income (loss) to average net assets would have been .51%.
C Amount includes a reimbursement from the investment adviser for an operational error which amounted to less than $.01 per share. Excluding this reimbursement, the total return would have been 6.12%.
D Amount represents less than $.005 per share.
E Total returns would have been lower if certain expenses had not been reduced during the applicable periods shown.
F Total returns do not include the effect of the sales charges.
G Fees and expenses of any underlying Fidelity Central Funds are not included in the Fund's expense ratio. The Fund indirectly bears its proportionate share of the expenses of any underlying Fidelity Central Funds.
H Expense ratios reflect operating expenses of the class. Expenses before reductions do not reflect amounts reimbursed by the investment adviser or reductions from brokerage service arrangements or reductions from other expense offset arrangements and do not represent the amount paid by the class during periods when reimbursements or reductions occur. Expenses net of fee waivers reflect expenses after reimbursement by the investment adviser but prior to reductions from brokerage service arrangements or other expense offset arrangements. Expenses net of all reductions represent the net expenses paid by the class.
I Amount does not include the portfolio activity of any underlying Fidelity Central Funds.
See accompanying notes which are an integral part of the financial statements.
Fidelity China Region Fund Class C
| Years ended October 31, | 2018 | 2017 | 2016 | 2015 | 2014 |
| Selected Per–Share Data | |||||
| Net asset value, beginning of period | $33.41 | $24.82 | $28.68 | $33.56 | $34.99 |
| Income from Investment Operations | |||||
| Net investment income (loss)A | (.11) | (.13) | –B | .15C | (.02) |
| Net realized and unrealized gain (loss) | (5.40) | 8.73 | (.21) | (.80) | 1.97D |
| Total from investment operations | (5.51) | 8.60 | (.21) | (.65) | 1.95 |
| Distributions from net investment income | – | – | (.06) | (.04) | (.08) |
| Distributions from net realized gain | – | (.02) | (3.59) | (4.24) | (3.31) |
| Total distributions | – | (.02) | (3.65) | (4.28) | (3.39) |
| Redemption fees added to paid in capitalA | –B | .01 | –B | .05 | .01 |
| Net asset value, end of period | $27.90 | $33.41 | $24.82 | $28.68 | $33.56 |
| Total ReturnE,F | (16.49)% | 34.71% | (.88)% | (2.21)% | 5.71%D |
| Ratios to Average Net AssetsG,H | |||||
| Expenses before reductions | 2.01% | 2.05% | 2.07% | 2.05% | 2.07% |
| Expenses net of fee waivers, if any | 2.01% | 2.05% | 2.07% | 2.05% | 2.07% |
| Expenses net of all reductions | 1.98% | 2.03% | 2.06% | 2.02% | 2.07% |
| Net investment income (loss) | (.31)% | (.46)% | .01% | .49%C | (.07)% |
| Supplemental Data | |||||
| Net assets, end of period (000 omitted) | $10,138 | $12,952 | $11,218 | $14,355 | $10,445 |
| Portfolio turnover rateI | 60% | 68% | 70% | 151% | 87% |
A Calculated based on average shares outstanding during the period.
B Amount represents less than $.005 per share.
C Net investment income per share reflects large, non-recurring dividend which amounted to $.13 per share. Excluding this non-recurring dividend, the ratio of net investment income (loss) to average net assets would have been .09%.
D Amount includes a reimbursement from the investment adviser for an operational error which amounted to less than $.01 per share. Excluding this reimbursement, the total return would have been 5.68%.
E Total returns would have been lower if certain expenses had not been reduced during the applicable periods shown.
F Total returns do not include the effect of the contingent deferred sales charge.
G Fees and expenses of any underlying Fidelity Central Funds are not included in the Fund's expense ratio. The Fund indirectly bears its proportionate share of the expenses of any underlying Fidelity Central Funds.
H Expense ratios reflect operating expenses of the class. Expenses before reductions do not reflect amounts reimbursed by the investment adviser or reductions from brokerage service arrangements or reductions from other expense offset arrangements and do not represent the amount paid by the class during periods when reimbursements or reductions occur. Expenses net of fee waivers reflect expenses after reimbursement by the investment adviser but prior to reductions from brokerage service arrangements or other expense offset arrangements. Expenses net of all reductions represent the net expenses paid by the class.
I Amount does not include the portfolio activity of any underlying Fidelity Central Funds.
See accompanying notes which are an integral part of the financial statements.
Fidelity China Region Fund
| Years ended October 31, | 2018 | 2017 | 2016 | 2015 | 2014 |
| Selected Per–Share Data | |||||
| Net asset value, beginning of period | $34.64 | $25.78 | $29.66 | $34.51 | $35.83 |
| Income from Investment Operations | |||||
| Net investment income (loss)A | .26 | .17 | .26 | .51B | .33 |
| Net realized and unrealized gain (loss) | (5.65) | 9.00 | (.21) | (.84) | 2.03C |
| Total from investment operations | (5.39) | 9.17 | .05 | (.33) | 2.36 |
| Distributions from net investment income | (.14) | (.27) | (.35) | (.33) | (.38) |
| Distributions from net realized gain | – | (.05) | (3.59) | (4.24) | (3.31) |
| Total distributions | (.14) | (.32) | (3.93)D | (4.57) | (3.69) |
| Redemption fees added to paid in capitalA | –E | .01 | –E | .05 | .01 |
| Net asset value, end of period | $29.11 | $34.64 | $25.78 | $29.66 | $34.51 |
| Total ReturnF | (15.62)% | 36.10% | .15% | (1.14)% | 6.83%C |
| Ratios to Average Net AssetsG,H | |||||
| Expenses before reductions | .96% | 1.00% | 1.02% | .99% | 1.01% |
| Expenses net of fee waivers, if any | .96% | 1.00% | 1.02% | .98% | 1.01% |
| Expenses net of all reductions | .93% | .99% | 1.01% | .96% | 1.01% |
| Net investment income (loss) | .74% | .58% | 1.06% | 1.55%B | .99% |
| Supplemental Data | |||||
| Net assets, end of period (000 omitted) | $969,679 | $1,294,775 | $1,004,985 | $1,262,274 | $1,352,761 |
| Portfolio turnover rateI | 60% | 68% | 70% | 151% | 87% |
A Calculated based on average shares outstanding during the period.
B Net investment income per share reflects large, non-recurring dividend which amounted to $.13 per share. Excluding this non-recurring dividend, the ratio of net investment income (loss) to average net assets would have been 1.15%.
C Amount includes a reimbursement from the investment adviser for an operational error which amounted to less than $.01 per share. Excluding this reimbursement, the total return would have been 6.80%.
D Total distributions of $3.93 per share is comprised of distributions from net investment income of $.345 and distributions from net realized gain of $3.588 per share.
E Amount represents less than $.005 per share.
F Total returns would have been lower if certain expenses had not been reduced during the applicable periods shown.
G Fees and expenses of any underlying Fidelity Central Funds are not included in the Fund's expense ratio. The Fund indirectly bears its proportionate share of the expenses of any underlying Fidelity Central Funds.
H Expense ratios reflect operating expenses of the class. Expenses before reductions do not reflect amounts reimbursed by the investment adviser or reductions from brokerage service arrangements or reductions from other expense offset arrangements and do not represent the amount paid by the class during periods when reimbursements or reductions occur. Expenses net of fee waivers reflect expenses after reimbursement by the investment adviser but prior to reductions from brokerage service arrangements or other expense offset arrangements. Expenses net of all reductions represent the net expenses paid by the class.
I Amount does not include the portfolio activity of any underlying Fidelity Central Funds.
See accompanying notes which are an integral part of the financial statements.
Fidelity China Region Fund Class I
| Years ended October 31, | 2018 | 2017 | 2016 | 2015 | 2014 |
| Selected Per–Share Data | |||||
| Net asset value, beginning of period | $34.41 | $25.62 | $29.51 | $34.39 | $35.75 |
| Income from Investment Operations | |||||
| Net investment income (loss)A | .26 | .16 | .26 | .51B | .34 |
| Net realized and unrealized gain (loss) | (5.61) | 8.95 | (.20) | (.84) | 2.02C |
| Total from investment operations | (5.35) | 9.11 | .06 | (.33) | 2.36 |
| Distributions from net investment income | (.16) | (.28) | (.36) | (.36) | (.43) |
| Distributions from net realized gain | – | (.05) | (3.59) | (4.24) | (3.31) |
| Total distributions | (.16) | (.33) | (3.95) | (4.60) | (3.73)D |
| Redemption fees added to paid in capitalA | –E | .01 | –E | .05 | .01 |
| Net asset value, end of period | $28.90 | $34.41 | $25.62 | $29.51 | $34.39 |
| Total ReturnF | (15.63)% | 36.11% | .16% | (1.14)% | 6.87%C |
| Ratios to Average Net AssetsG,H | |||||
| Expenses before reductions | .98% | 1.01% | 1.00% | .97% | .98% |
| Expenses net of fee waivers, if any | .98% | 1.01% | 1.00% | .97% | .98% |
| Expenses net of all reductions | .95% | .99% | .99% | .95% | .98% |
| Net investment income (loss) | .72% | .57% | 1.07% | 1.57%B | 1.01% |
| Supplemental Data | |||||
| Net assets, end of period (000 omitted) | $20,854 | $27,880 | $19,334 | $26,961 | $19,404 |
| Portfolio turnover rateI | 60% | 68% | 70% | 151% | 87% |
A Calculated based on average shares outstanding during the period.
B Net investment income per share reflects large, non-recurring dividend which amounted to $.13 per share. Excluding this non-recurring dividend, the ratio of net investment income (loss) to average net assets would have been 1.16%.
C Amount includes a reimbursement from the investment adviser for an operational error which amounted to less than $.01 per share. Excluding this reimbursement, the total return would have been 6.84%.
D Total distributions of $3.73 per share is comprised of distributions from net investment income of $.425 and distributions from net realized gain of $3.306 per share.
E Amount represents less than $.005 per share.
F Total returns would have been lower if certain expenses had not been reduced during the applicable periods shown.
G Fees and expenses of any underlying Fidelity Central Funds are not included in the Fund's expense ratio. The Fund indirectly bears its proportionate share of the expenses of any underlying Fidelity Central Funds.
H Expense ratios reflect operating expenses of the class. Expenses before reductions do not reflect amounts reimbursed by the investment adviser or reductions from brokerage service arrangements or reductions from other expense offset arrangements and do not represent the amount paid by the class during periods when reimbursements or reductions occur. Expenses net of fee waivers reflect expenses after reimbursement by the investment adviser but prior to reductions from brokerage service arrangements or other expense offset arrangements. Expenses net of all reductions represent the net expenses paid by the class.
I Amount does not include the portfolio activity of any underlying Fidelity Central Funds.
See accompanying notes which are an integral part of the financial statements.
Fidelity China Region Fund Class Z
| Year ended October 31, | 2018 A |
| Selected Per–Share Data | |
| Net asset value, beginning of period | $32.63 |
| Income from Investment Operations | |
| Net investment income (loss)B | .01 |
| Net realized and unrealized gain (loss) | (3.73) |
| Total from investment operations | (3.72) |
| Net asset value, end of period | $28.91 |
| Total ReturnC,D | (11.40)% |
| Ratios to Average Net AssetsE,F | |
| Expenses before reductions | .91%G |
| Expenses net of fee waivers, if any | .90%G |
| Expenses net of all reductions | .87%G |
| Net investment income (loss) | .57%G |
| Supplemental Data | |
| Net assets, end of period (000 omitted) | $323 |
| Portfolio turnover rateH | 60% |
A For the period October 2, 2018 (commencement of sale of shares) to October 31, 2018.
B Calculated based on average shares outstanding during the period.
C Total returns for periods of less than one year are not annualized.
D Total returns would have been lower if certain expenses had not been reduced during the applicable periods shown.
E Fees and expenses of any underlying Fidelity Central Funds are not included in the Fund's expense ratio. The Fund indirectly bears its proportionate share of the expenses of any underlying Fidelity Central Funds.
F Expense ratios reflect operating expenses of the class. Expenses before reductions do not reflect amounts reimbursed by the investment adviser or reductions from brokerage service arrangements or reductions from other expense offset arrangements and do not represent the amount paid by the class during periods when reimbursements or reductions occur. Expense ratios before reductions for start-up periods may not be representative of longer-term operating periods. Expenses net of fee waivers reflect expenses after reimbursement by the investment adviser but prior to reductions from brokerage service arrangements or other expense offset arrangements. Expenses net of all reductions represent the net expenses paid by the class.
G Annualized
H Amount does not include the portfolio activity of any underlying Fidelity Central Funds.
See accompanying notes which are an integral part of the financial statements.
Notes to Financial Statements
For the period ended October 31, 2018
1. Organization.
Fidelity China Region Fund (the Fund) is a fund of Fidelity Investment Trust (the Trust) and is authorized to issue an unlimited number of shares. The Trust is registered under the Investment Company Act of 1940, as amended (the 1940 Act), as an open-end management investment company organized as a Massachusetts business trust. The Fund commenced sale of Class Z shares on October 2, 2018. The Fund offers Class A, Class M, Class C, China Region, Class I and Class Z shares, each of which has equal rights as to assets and voting privileges. Each class has exclusive voting rights with respect to matters that affect that class. The Fund's investments in emerging markets can be subject to social, economic, regulatory, and political uncertainties and can be extremely volatile.
2. Investments in Fidelity Central Funds.
The Fund invests in Fidelity Central Funds, which are open-end investment companies generally available only to other investment companies and accounts managed by the investment adviser and its affiliates. The Fund's Schedule of Investments lists each of the Fidelity Central Funds held as of period end, if any, as an investment of the Fund, but does not include the underlying holdings of each Fidelity Central Fund. As an Investing Fund, the Fund indirectly bears its proportionate share of the expenses of the underlying Fidelity Central Funds.
The Money Market Central Funds seek preservation of capital and current income and are managed by Fidelity Investments Money Management, Inc. (FIMM), an affiliate of the investment adviser. Annualized expenses of the Money Market Central Funds as of their most recent shareholder report date are less than .005%.
A complete unaudited list of holdings for each Fidelity Central Fund is available upon request or at the Securities and Exchange Commission (the SEC) website at www.sec.gov. In addition, the financial statements of the Fidelity Central Funds, which are not covered by the Fund's Report of Independent Registered Public Accounting Firm, are available on the SEC website or upon request.
3. Significant Accounting Policies.
The Fund is an investment company and applies the accounting and reporting guidance of the Financial Accounting Standards Board (FASB) Accounting Standards Codification Topic 946 Financial Services – Investments Companies. The financial statements have been prepared in conformity with accounting principles generally accepted in the United States of America (GAAP), which require management to make certain estimates and assumptions at the date of the financial statements. Actual results could differ from those estimates. Subsequent events, if any, through the date that the financial statements were issued have been evaluated in the preparation of the financial statements. The following summarizes the significant accounting policies of the Fund:
Investment Valuation. Investments are valued as of 4:00 p.m. Eastern time on the last calendar day of the period. The Board of Trustees (the Board) has delegated the day to day responsibility for the valuation of the Fund's investments to the Fair Value Committee (the Committee) established by the Fund's investment adviser. In accordance with valuation policies and procedures approved by the Board, the Fund attempts to obtain prices from one or more third party pricing vendors or brokers to value its investments. When current market prices, quotations or currency exchange rates are not readily available or reliable, investments will be fair valued in good faith by the Committee, in accordance with procedures adopted by the Board. Factors used in determining fair value vary by investment type and may include market or investment specific events. The frequency with which these procedures are used cannot be predicted and they may be utilized to a significant extent. The Committee oversees the Fund's valuation policies and procedures and reports to the Board on the Committee's activities and fair value determinations. The Board monitors the appropriateness of the procedures used in valuing the Fund's investments and ratifies the fair value determinations of the Committee.
The Fund categorizes the inputs to valuation techniques used to value its investments into a disclosure hierarchy consisting of three levels as shown below:
- Level 1 – quoted prices in active markets for identical investments
- Level 2 – other significant observable inputs (including quoted prices for similar investments, interest rates, prepayment speeds, etc.)
- Level 3 – unobservable inputs (including the Fund's own assumptions based on the best information available)
Valuation techniques used to value the Fund's investments by major category are as follows:
Equity securities, including restricted securities, for which market quotations are readily available, are valued at the last reported sale price or official closing price as reported by a third party pricing vendor on the primary market or exchange on which they are traded and are categorized as Level 1 in the hierarchy. In the event there were no sales during the day or closing prices are not available, securities are valued at the last quoted bid price or may be valued using the last available price and are generally categorized as Level 2 in the hierarchy. For foreign equity securities, when market or security specific events arise, comparisons to the valuation of American Depositary Receipts (ADRs), futures contracts, Exchange-Traded Funds (ETFs) and certain indexes as well as quoted prices for similar securities may be used and would be categorized as Level 2 in the hierarchy. Utilizing these techniques may result in transfers between Level 1 and Level 2. For equity securities, including restricted securities, where observable inputs are limited, assumptions about market activity and risk are used and these securities may be categorized as Level 3 in the hierarchy.
Investments in open-end mutual funds, including the Fidelity Central Funds, are valued at their closing net asset value (NAV) each business day and are categorized as Level 1 in the hierarchy.
Changes in valuation techniques may result in transfers in or out of an assigned level within the disclosure hierarchy. The aggregate value of investments by input level as of October 31, 2018, including information on transfers between Levels 1 and 2, as well as a roll forward of Level 3 investments, is included at the end of the Fund's Schedule of Investments.
Foreign Currency. The Fund may use foreign currency contracts to facilitate transactions in foreign-denominated securities. Gains and losses from these transactions may arise from changes in the value of the foreign currency or if the counterparties do not perform under the contracts' terms.
Foreign-denominated assets, including investment securities, and liabilities are translated into U.S. dollars at the exchange rates at period end. Purchases and sales of investment securities, income and dividends received and expenses denominated in foreign currencies are translated into U.S. dollars at the exchange rate in effect on the transaction date.
The effects of exchange rate fluctuations on investments are included with the net realized and unrealized gain (loss) on investment securities. Other foreign currency transactions resulting in realized and unrealized gain (loss) are disclosed separately.
Investment Transactions and Income. For financial reporting purposes, the Fund's investment holdings and NAV include trades executed through the end of the last business day of the period. The NAV per share for processing shareholder transactions is calculated as of the close of business of the New York Stock Exchange (NYSE), normally 4:00 p.m. Eastern time and includes trades executed through the end of the prior business day. Gains and losses on securities sold are determined on the basis of identified cost. Dividend income is recorded on the ex-dividend date, except for certain dividends from foreign securities where the ex-dividend date may have passed, which are recorded as soon as the Fund is informed of the ex-dividend date. Non-cash dividends included in dividend income, if any, are recorded at the fair market value of the securities received. Income and capital gain distributions from Fidelity Central Funds, if any, are recorded on the ex-dividend date. Investment income is recorded net of foreign taxes withheld where recovery of such taxes is uncertain.
Class Allocations and Expenses. Investment income, realized and unrealized capital gains and losses, common expenses of the Fund, and certain fund-level expense reductions, if any, are allocated daily on a pro-rata basis to each class based on the relative net assets of each class to the total net assets of the Fund. Each class differs with respect to transfer agent and distribution and service plan fees incurred. Certain expense reductions may also differ by class. For the reporting period, the allocated portion of income and expenses to each class as a percent of its average net assets may vary due to the timing of recording these transactions in relation to fluctuating net assets of the classes. Expenses directly attributable to a fund are charged to that fund. Expenses attributable to more than one fund are allocated among the respective funds on the basis of relative net assets or other appropriate methods. Expense estimates are accrued in the period to which they relate and adjustments are made when actual amounts are known.
Income Tax Information and Distributions to Shareholders. Each year, the Fund intends to qualify as a regulated investment company under Subchapter M of the Internal Revenue Code, including distributing substantially all of its taxable income and realized gains. As a result, no provision for U.S. Federal income taxes is required. As of October 31, 2018, the Fund did not have any unrecognized tax benefits in the financial statements; nor is the Fund aware of any tax positions for which it is reasonably possible that the total amounts of unrecognized tax benefits will significantly change in the next twelve months. The Fund files a U.S. federal tax return, in addition to state and local tax returns as required. The Fund's federal income tax returns are subject to examination by the Internal Revenue Service (IRS) for a period of three fiscal years after they are filed. State and local tax returns may be subject to examination for an additional fiscal year depending on the jurisdiction. Foreign taxes are provided for based on the Fund's understanding of the tax rules and rates that exist in the foreign markets in which it invests.
Distributions are declared and recorded on the ex-dividend date. Income and capital gain distributions are declared separately for each class. Income and capital gain distributions are determined in accordance with income tax regulations, which may differ from GAAP. In addition, the Fund claimed a portion of the payment made to redeeming shareholders as a distribution for income tax purposes.
Capital accounts within the financial statements are adjusted for permanent book-tax differences. These adjustments have no impact on net assets or the results of operations. Capital accounts are not adjusted for temporary book-tax differences which will reverse in a subsequent period.
Book-tax differences are primarily due to foreign currency transactions, deferred trustees compensation, capital loss carryforwards and losses deferred due to wash sales.
As of period end, the cost and unrealized appreciation (depreciation) in securities, and derivatives if applicable, for federal income tax purposes were as follows:
| Gross unrealized appreciation | $166,885,742 |
| Gross unrealized depreciation | (110,613,277) |
| Net unrealized appreciation (depreciation) | $56,272,465 |
| Tax Cost | $970,386,082 |
The tax-based components of distributable earnings as of period end were as follows:
| Undistributed ordinary income | $8,370,452 |
| Capital loss carryforward | $(45,021,541) |
| Net unrealized appreciation (depreciation) on securities and other investments | $56,266,545 |
Capital loss carryforwards are only available to offset future capital gains of the Fund to the extent provided by regulations and may be limited. Under the Regulated Investment Company Modernization Act of 2010 (the Act), the Fund is permitted to carry forward capital losses incurred in taxable years beginning after December 22, 2010 for an unlimited period and such capital losses are required to be used prior to any losses that expire. The capital loss carryforward information presented below, including any applicable limitation, is estimated as of fiscal period end and is subject to adjustment.
| No expiration | |
| Short-term | $(45,021,541) |
The tax character of distributions paid was as follows:
| October 31, 2018 | October 31, 2017 | |
| Ordinary Income | $5,632,793 | $ 12,624,831 |
Short-Term Trading (Redemption) Fees. Shares held by investors in the Fund less than 90 days may have been subject to a redemption fee equal to 1.50% of the NAV of shares redeemed. All redemption fees, which reduce the proceeds of the shareholder redemption, are retained by the Fund and accounted for as an addition to paid in capital. In November 2017, the Board of Trustees approved the elimination of these redemption fees effective December 18, 2017.
Restricted Securities. The Fund may invest in securities that are subject to legal or contractual restrictions on resale. These securities generally may be resold in transactions exempt from registration or to the public if the securities are registered. Disposal of these securities may involve time-consuming negotiations and expense, and prompt sale at an acceptable price may be difficult. Information regarding restricted securities is included at the end of the Fund's Schedule of Investments.
New Rule Issuance. During August 2018, the U.S. Securities and Exchange Commission issued Final Rule Release No. 33-10532, Disclosure Update and Simplification. This Final Rule includes amendments specific to registered investment companies that are intended to eliminate overlap in disclosure requirements between Regulation S-X and GAAP. In accordance with these amendments, certain line-items in the Fund's financial statements have been combined or removed for the current period as outlined in the table below.
| Financial Statement | Current Line-Item Presentation | Prior Line-Item Presentation |
| Statement of Assets and Liabilities | Total distributable earnings (loss) | Undistributed/Distributions in excess of/Accumulated net investment income (loss) Accumulated/Undistributed net realized gain (loss) Net unrealized appreciation (depreciation) |
| Statement of Changes in Net Assets | N/A - removed | Undistributed/Distributions in excess of/Accumulated net investment income (loss) end of period |
| Statement of Changes in Net Assets | Distributions to shareholders | Distributions to shareholders from net investment income Distributions to shareholders from net realized gain |
| Distributions to Shareholders Note to Financial Statements | Distributions to shareholders | Distributions to shareholders from net investment income Distributions to shareholders from net realized gain |
4. Purchases and Sales of Investments.
Purchases and sales of securities, other than short-term securities, aggregated $816,777,335 and $996,955,433, respectively.
5. Fees and Other Transactions with Affiliates.
Management Fee. Fidelity Management & Research Company (the investment adviser) and its affiliates provide the Fund with investment management related services for which the Fund pays a monthly management fee. The management fee is the sum of an individual fund fee rate that is based on an annual rate of .45% of the Fund's average net assets and an annualized group fee rate that averaged .24% during the period. The group fee rate is based upon the average net assets of all the mutual funds advised by the investment adviser, including any mutual funds previously advised by the investment adviser that are currently advised by Fidelity SelectCo, LLC, an affiliate of the investment adviser. The group fee rate decreases as assets under management increase and increases as assets under management decrease. For the reporting period, the total annual management fee rate was .69% of the Fund's average net assets.
Distribution and Service Plan Fees. In accordance with Rule 12b-1 of the 1940 Act, the Fund has adopted separate Distribution and Service Plans for each class of shares. Certain classes pay Fidelity Distributors Corporation (FDC), an affiliate of the investment adviser, separate Distribution and Service Fees, each of which is based on an annual percentage of each class' average net assets. In addition, FDC may pay financial intermediaries for selling shares of the Fund and providing shareholder support services. For the period, the Distribution and Service Fee rates, total fees and amounts retained by FDC were as follows:
| Distribution Fee | Service Fee | Total Fees | Retained by FDC | |
| Class A | -% | .25% | $83,334 | $3,672 |
| Class M | .25% | .25% | 55,510 | 2,032 |
| Class C | .75% | .25% | 141,497 | 30,723 |
| $280,341 | $36,427 |
Sales Load. FDC may receive a front-end sales charge of up to 5.75% for selling Class A shares and 3.50% for selling Class M shares, some of which is paid to financial intermediaries for selling shares of the Fund. Depending on the holding period, FDC may receive contingent deferred sales charges levied on Class A, Class M and Class C redemptions. The deferred sales charges are 1.00% for Class C shares, 1.00% for certain purchases of Class A shares and .25% for certain purchases of Class M shares.
For the period, sales charge amounts retained by FDC were as follows:
| Retained by FDC | |
| Class A | $33,964 |
| Class M | 4,476 |
| Class C(a) | 5,834 |
| $44,274 |
(a) When Class C shares are initially sold, FDC pays commissions from its own resources to financial intermediaries through which the sales are made.
Transfer Agent Fees. Fidelity Investments Institutional Operations Company, Inc., (FIIOC), an affiliate of the investment adviser, is the transfer, dividend disbursing and shareholder servicing agent for each class of the Fund. FIIOC receives account fees and asset-based fees that vary according to the account size and type of account of the shareholders of the respective classes of the Fund, except for Class Z. FIIOC receives an asset-based fee of Class Z's average net assets. FIIOC pays for typesetting, printing and mailing of shareholder reports, except proxy statements.
For the period, transfer agent fees for each class were as follows:
| Amount | % of Class-Level Average Net Assets | |
| Class A | $78,350 | .24 |
| Class M | 36,702 | .33 |
| Class C | 31,843 | .23 |
| China Region | 2,346,421 | .18 |
| Class I | 62,051 | .20 |
| Class Z | 5 | .05(a) |
| $2,555,372 |
(a) Annualized
Accounting and Security Lending Fees. Fidelity Service Company, Inc. (FSC), an affiliate of the investment adviser, maintains the Fund's accounting records. The accounting fee is based on the level of average net assets for each month. Under a separate contract, FSC administers the security lending program. The security lending fee is based on the number and duration of lending transactions. For the period, the fees were equivalent to an annual rate of .05%.
Brokerage Commissions. The Fund placed a portion of its portfolio transactions with brokerage firms which are affiliates of the investment adviser. Brokerage commissions are included in net realized gain (loss) and change in net unrealized appreciation (depreciation) in the Statement of Operations. The commissions paid to these affiliated firms were $5,192 for the period.
Interfund Lending Program. Pursuant to an Exemptive Order issued by the SEC, the Fund, along with other registered investment companies having management contracts with Fidelity Management & Research Company (FMR) or other affiliated entities of FMR, may participate in an interfund lending program. This program provides an alternative credit facility allowing the funds to borrow from, or lend money to, other participating affiliated funds. At period end, there were no interfund loans outstanding. The Fund's activity in this program during the period for which loans were outstanding was as follows:
| Borrower or Lender | Average Loan Balance | Weighted Average Interest Rate | Interest Expense |
| Borrower | $6,541,333 | 1.66% | $4,514 |
Interfund Trades. The Fund may purchase from or sell securities to other Fidelity Funds under procedures adopted by the Board. The procedures have been designed to ensure these interfund trades are executed in accordance with Rule 17a-7 of the 1940 Act. Interfund trades are included within the respective purchases and sales amounts shown in the Purchases and Sales of Investments note.
Other. During the period, the investment adviser reimbursed the Fund for certain losses in the amount of $31,697.
6. Committed Line of Credit.
The Fund participates with other funds managed by the investment adviser or an affiliate in a $4.25 billion credit facility (the "line of credit") to be utilized for temporary or emergency purposes to fund shareholder redemptions or for other short-term liquidity purposes. The Fund has agreed to pay commitment fees on its pro-rata portion of the line of credit, which amounted to $3,988 and is reflected in Miscellaneous expenses on the Statement of Operations. During the period, the Fund did not borrow on this line of credit.
7. Security Lending.
The Fund lends portfolio securities through a lending agent from time to time in order to earn additional income. For equity securities, a lending agent is used and may loan securities to certain qualified borrowers, including Fidelity Capital Markets (FCM), a broker-dealer affiliated with the Fund. On the settlement date of the loan, the Fund receives collateral (in the form of U.S. Treasury obligations, letters of credit and/or cash) against the loaned securities and maintains collateral in an amount not less than 100% of the market value of the loaned securities during the period of the loan. The market value of the loaned securities is determined at the close of business of the Fund and any additional required collateral is delivered to the Fund on the next business day. The Fund or borrower may terminate the loan at any time, and if the borrower defaults on its obligation to return the securities loaned because of insolvency or other reasons, the Fund may apply collateral received from the borrower against the obligation. The Fund may experience delays and costs in recovering the securities loaned. Any cash collateral received is invested in the Fidelity Securities Lending Cash Central Fund. The value of loaned securities and cash collateral at period end are disclosed on the Fund's Statement of Assets and Liabilities. Security lending income represents the income earned on investing cash collateral, less rebates paid to borrowers and any lending agent fees associated with the loan, plus any premium payments received for lending certain types of securities. Security lending income is presented in the Statement of Operations as a component of income from Fidelity Central Funds. Total security lending income during the period amounted to $181,809. During the period, there were no securities loaned to FCM.
8. Expense Reductions.
Commissions paid to certain brokers with whom the investment adviser, or its affiliates, places trades on behalf of the Fund include an amount in addition to trade execution, which may be rebated back to the Fund to offset certain expenses. This amount totaled $458,804 for the period. Through arrangements with the Fund's custodian, credits realized as a result of certain uninvested cash balances were used to reduce the Fund's expenses. During the period, credits reduced each class' transfer agent expense as noted in the table below.
| Transfer Agent expense reduction | |
| China Region | $17 |
In addition, during the period the investment adviser reimbursed and/or waived a portion of fund-level operating expenses in the amount of $14,365.
9. Distributions to Shareholders.
Distributions to shareholders of each class were as follows:
| Year ended October 31, 2018 | Year ended October 31, 2017 | |
| Distributions to shareholders | ||
| Class A | $79,937 | $– |
| China Region | 5,380,060 | – |
| Class I | 172,796 | – |
| Total | $5,632,793 | $– |
| From net investment income | ||
| Class A | $– | $157,254 |
| Class M | – | 24,256 |
| China Region | – | 10,242,046 |
| Class I | – | 212,309 |
| Total | $– | $10,635,865 |
| From net realized gain | ||
| Class A | $– | $43,202 |
| Class M | – | 10,926 |
| Class C | – | 7,384 |
| China Region | – | 1,889,677 |
| Class I | – | 37,777 |
| Total | $– | $1,988,966 |
10. Share Transactions.
Share transactions for each class were as follows and may contain automatic conversions between classes or exchanges between affiliated funds:
| Shares | Shares | Dollars | Dollars | |
| Year ended October 31, 2018(a) | Year ended October 31, 2017 | Year ended October 31, 2018(a) | Year ended October 31, 2017 | |
| Class A | ||||
| Shares sold | 281,109 | 484,746 | $9,945,540 | $14,218,284 |
| Reinvestment of distributions | 2,311 | 7,951 | 78,690 | 195,750 |
| Shares redeemed | (506,416) | (355,316) | (18,191,086) | (9,896,035) |
| Net increase (decrease) | (222,996) | 137,381 | $(8,166,856) | $4,517,999 |
| Class M | ||||
| Shares sold | 116,652 | 114,104 | $4,199,988 | $3,376,139 |
| Reinvestment of distributions | – | 1,419 | – | 34,859 |
| Shares redeemed | (118,515) | (51,513) | (4,110,606) | (1,446,359) |
| Net increase (decrease) | (1,863) | 64,010 | $89,382 | $1,964,639 |
| Class C | ||||
| Shares sold | 141,748 | 123,999 | $4,961,864 | $3,531,382 |
| Reinvestment of distributions | – | 254 | – | 6,148 |
| Shares redeemed | (166,005) | (188,578) | (5,613,368) | (4,895,729) |
| Net increase (decrease) | (24,257) | (64,325) | $(651,504) | $(1,358,199) |
| China Region | ||||
| Shares sold | 9,405,338 | 7,507,787 | $342,970,076 | $224,773,166 |
| Reinvestment of distributions | 150,399 | 469,834 | 5,175,224 | 11,675,364 |
| Shares redeemed | (13,622,290) | (9,588,795) | (481,771,408) | (265,714,287) |
| Net increase (decrease) | (4,066,553) | (1,611,174) | $(133,626,108) | $(29,265,757) |
| Class I | ||||
| Shares sold | 748,387 | 659,273 | $26,698,679 | $19,707,002 |
| Reinvestment of distributions | 4,532 | 8,728 | 154,844 | 215,492 |
| Shares redeemed | (841,495) | (612,455) | (29,947,068) | (17,979,791) |
| Net increase (decrease) | (88,576) | 55,546 | $(3,093,545) | $1,942,703 |
| Class Z | ||||
| Shares sold | 11,185 | – | $336,639 | $– |
| Shares redeemed | (3) | – | (88) | – |
| Net increase (decrease) | 11,182 | – | $336,551 | $– |
(a) Share transactions for Class Z are for the period October 2, 2018 (commencement of sale of shares) to October 31, 2018.
11. Other.
The Fund's organizational documents provide former and current trustees and officers with a limited indemnification against liabilities arising in connection with the performance of their duties to the Fund. In the normal course of business, the Fund may also enter into contracts that provide general indemnifications. The Fund's maximum exposure under these arrangements is unknown as this would be dependent on future claims that may be made against the Fund. The risk of material loss from such claims is considered remote.
Report of Independent Registered Public Accounting Firm
To the Board of Trustees of Fidelity Investment Trust and Shareholders of Fidelity China Region Fund:
Opinion on the Financial Statements
We have audited the accompanying statement of assets and liabilities, including the schedule of investments, of Fidelity China Region Fund (one of the funds constituting Fidelity Investment Trust, referred to hereafter as the "Fund") as of October 31, 2018, the related statement of operations for the year ended October 31, 2018, the statement of changes in net assets for each of the two years in the period ended October 31, 2018, including the related notes, and the financial highlights for each of the periods indicated therein (collectively referred to as the “financial statements”). In our opinion, the financial statements present fairly, in all material respects, the financial position of the Fund as of October 31, 2018, the results of its operations for the year then ended, the changes in its net assets for each of the two years in the period ended October 31, 2018 and the financial highlights for each of the periods indicated therein in conformity with accounting principles generally accepted in the United States of America.
Basis for Opinion
These financial statements are the responsibility of the Fund’s management. Our responsibility is to express an opinion on the Fund’s financial statements based on our audits. We are a public accounting firm registered with the Public Company Accounting Oversight Board (United States) (“PCAOB”) and are required to be independent with respect to the Fund in accordance with the U.S. federal securities laws and the applicable rules and regulations of the Securities and Exchange Commission and the PCAOB.
We conducted our audits of these financial statements in accordance with the standards of the PCAOB. Those standards require that we plan and perform the audit to obtain reasonable assurance about whether the financial statements are free of material misstatement, whether due to error or fraud.
Our audits included performing procedures to assess the risks of material misstatement of the financial statements, whether due to error or fraud, and performing procedures that respond to those risks. Such procedures included examining, on a test basis, evidence regarding the amounts and disclosures in the financial statements. Our audits also included evaluating the accounting principles used and significant estimates made by management, as well as evaluating the overall presentation of the financial statements. Our procedures included confirmation of securities owned as of October 31, 2018 by correspondence with the custodian and brokers; when replies were not received from brokers, we performed other auditing procedures. We believe that our audits provide a reasonable basis for our opinion.
PricewaterhouseCoopers LLP
Boston, Massachusetts
December 14, 2018
We have served as the auditor of one or more investment companies in the Fidelity group of funds since 1932.
Trustees and Officers
The Trustees, Members of the Advisory Board (if any), and officers of the trust and fund, as applicable, are listed below. The Board of Trustees governs the fund and is responsible for protecting the interests of shareholders. The Trustees are experienced executives who meet periodically throughout the year to oversee the fund's activities, review contractual arrangements with companies that provide services to the fund, oversee management of the risks associated with such activities and contractual arrangements, and review the fund's performance. Except for Jonathan Chiel, each of the Trustees oversees 283 funds. Mr. Chiel oversees 154 funds.
The Trustees hold office without limit in time except that (a) any Trustee may resign; (b) any Trustee may be removed by written instrument, signed by at least two-thirds of the number of Trustees prior to such removal; (c) any Trustee who requests to be retired or who has become incapacitated by illness or injury may be retired by written instrument signed by a majority of the other Trustees; and (d) any Trustee may be removed at any special meeting of shareholders by a two-thirds vote of the outstanding voting securities of the trust. Each Trustee who is not an interested person (as defined in the 1940 Act) of the trust and the fund is referred to herein as an Independent Trustee. Each Independent Trustee shall retire not later than the last day of the calendar year in which his or her 75th birthday occurs. The Independent Trustees may waive this mandatory retirement age policy with respect to individual Trustees. Officers and Advisory Board Members hold office without limit in time, except that any officer or Advisory Board Member may resign or may be removed by a vote of a majority of the Trustees at any regular meeting or any special meeting of the Trustees. Except as indicated, each individual has held the office shown or other offices in the same company for the past five years.
The fund’s Statement of Additional Information (SAI) includes more information about the Trustees. To request a free copy, call Fidelity at 1-877-208-0098.
Experience, Skills, Attributes, and Qualifications of the Trustees. The Governance and Nominating Committee has adopted a statement of policy that describes the experience, qualifications, attributes, and skills that are necessary and desirable for potential Independent Trustee candidates (Statement of Policy). The Board believes that each Trustee satisfied at the time he or she was initially elected or appointed a Trustee, and continues to satisfy, the standards contemplated by the Statement of Policy. The Governance and Nominating Committee also engages professional search firms to help identify potential Independent Trustee candidates who have the experience, qualifications, attributes, and skills consistent with the Statement of Policy. From time to time, additional criteria based on the composition and skills of the current Independent Trustees, as well as experience or skills that may be appropriate in light of future changes to board composition, business conditions, and regulatory or other developments, have also been considered by the professional search firms and the Governance and Nominating Committee. In addition, the Board takes into account the Trustees' commitment and participation in Board and committee meetings, as well as their leadership of standing and ad hoc committees throughout their tenure.
In determining that a particular Trustee was and continues to be qualified to serve as a Trustee, the Board has considered a variety of criteria, none of which, in isolation, was controlling. The Board believes that, collectively, the Trustees have balanced and diverse experience, qualifications, attributes, and skills, which allow the Board to operate effectively in governing the fund and protecting the interests of shareholders. Information about the specific experience, skills, attributes, and qualifications of each Trustee, which in each case led to the Board's conclusion that the Trustee should serve (or continue to serve) as a trustee of the fund, is provided below.
Board Structure and Oversight Function. James C. Curvey is an interested person and currently serves as Chairman. The Trustees have determined that an interested Chairman is appropriate and benefits shareholders because an interested Chairman has a personal and professional stake in the quality and continuity of services provided to the fund. Independent Trustees exercise their informed business judgment to appoint an individual of their choosing to serve as Chairman, regardless of whether the Trustee happens to be independent or a member of management. The Independent Trustees have determined that they can act independently and effectively without having an Independent Trustee serve as Chairman and that a key structural component for assuring that they are in a position to do so is for the Independent Trustees to constitute a substantial majority for the Board. The Independent Trustees also regularly meet in executive session. Ned C. Lautenbach serves as Chairman of the Independent Trustees and as such (i) acts as a liaison between the Independent Trustees and management with respect to matters important to the Independent Trustees and (ii) with management prepares agendas for Board meetings.
Fidelity® funds are overseen by different Boards of Trustees. The fund's Board oversees Fidelity's high income and certain equity funds, and other Boards oversee Fidelity's investment-grade bond, money market, asset allocation, and other equity funds. The asset allocation funds may invest in Fidelity® funds overseen by the fund's Board. The use of separate Boards, each with its own committee structure, allows the Trustees of each group of Fidelity® funds to focus on the unique issues of the funds they oversee, including common research, investment, and operational issues. On occasion, the separate Boards establish joint committees to address issues of overlapping consequences for the Fidelity® funds overseen by each Board.
The Trustees operate using a system of committees to facilitate the timely and efficient consideration of all matters of importance to the Trustees, the fund, and fund shareholders and to facilitate compliance with legal and regulatory requirements and oversight of the fund's activities and associated risks. The Board, acting through its committees, has charged FMR and its affiliates with (i) identifying events or circumstances the occurrence of which could have demonstrably adverse effects on the fund's business and/or reputation; (ii) implementing processes and controls to lessen the possibility that such events or circumstances occur or to mitigate the effects of such events or circumstances if they do occur; and (iii) creating and maintaining a system designed to evaluate continuously business and market conditions in order to facilitate the identification and implementation processes described in (i) and (ii) above. Because the day-to-day operations and activities of the fund are carried out by or through FMR, its affiliates, and other service providers, the fund's exposure to risks is mitigated but not eliminated by the processes overseen by the Trustees. While each of the Board's committees has responsibility for overseeing different aspects of the fund's activities, oversight is exercised primarily through the Operations, Audit, and Compliance Committees. In addition, the Independent Trustees have worked with Fidelity to enhance the Board's oversight of investment and financial risks, legal and regulatory risks, technology risks, and operational risks, including the development of additional risk reporting to the Board. Appropriate personnel, including but not limited to the fund's Chief Compliance Officer (CCO), FMR's internal auditor, the independent accountants, the fund's Treasurer and portfolio management personnel, make periodic reports to the Board's committees, as appropriate, including an annual review of Fidelity's risk management program for the Fidelity® funds. The responsibilities of each standing committee, including their oversight responsibilities, are described further under "Standing Committees of the Trustees."
Interested Trustees*:
Correspondence intended for a Trustee who is an interested person may be sent to Fidelity Investments, 245 Summer Street, Boston, Massachusetts 02210.
Name, Year of Birth; Principal Occupations and Other Relevant Experience+
Jonathan Chiel (1957)
Year of Election or Appointment: 2016
Trustee
Mr. Chiel also serves as Trustee of other Fidelity® funds. Mr. Chiel is Executive Vice President and General Counsel for FMR LLC (diversified financial services company, 2012-present). Previously, Mr. Chiel served as general counsel (2004-2012) and senior vice president and deputy general counsel (2000-2004) for John Hancock Financial Services; a partner with Choate, Hall & Stewart (1996-2000) (law firm); and an Assistant United States Attorney for the United States Attorney’s Office of the District of Massachusetts (1986-95), including Chief of the Criminal Division (1993-1995). Mr. Chiel is a director on the boards of the Boston Bar Foundation and the Maimonides School.
James C. Curvey (1935)
Year of Election or Appointment: 2007
Trustee
Chairman of the Board of Trustees
Mr. Curvey also serves as Trustee of other Fidelity® funds. Mr. Curvey is Vice Chairman (2007-present) and Director of FMR LLC (diversified financial services company). In addition, Mr. Curvey is an Overseer Emeritus for the Boston Symphony Orchestra, a Director of Artis-Naples, and a Trustee of Brewster Academy in Wolfeboro, New Hampshire. Previously, Mr. Curvey served as a Director of Fidelity Research & Analysis Co. (investment adviser firm, 2009-2018), Director of Fidelity Investments Money Management, Inc. (investment adviser firm, 2009-2014) and a Director of FMR and FMR Co., Inc. (investment adviser firms, 2007-2014).
Charles S. Morrison (1960)
Year of Election or Appointment: 2014
Trustee
Mr. Morrison also serves as Trustee of other funds. He serves as President of Fidelity SelectCo, LLC (investment adviser firm, 2017-present) and Fidelity Management & Research Company (FMR) (investment adviser firm, 2016-present), a Director of Fidelity Investments Money Management, Inc. (FIMM) (investment adviser firm, 2014-present), Director of Fidelity SelectCo, LLC (investment adviser firm, 2014-present), President, Asset Management (2014-present), and is an employee of Fidelity Investments. Previously, Mr. Morrison served as Vice President of Fidelity's Fixed Income and Asset Allocation Funds (2012-2014), President, Fixed Income (2011-2014), Vice President of Fidelity's Money Market Funds (2005-2009), President, Money Market Group Leader of FMR (investment adviser firm, 2009), and Senior Vice President, Money Market Group of FMR (2004-2009). Mr. Morrison also served as Vice President of Fidelity's Bond Funds (2002-2005), certain Balanced Funds (2002-2005), and certain Asset Allocation Funds (2002-2007), and as Senior Vice President (2002-2005) of Fidelity's Bond Division.
* Determined to be an “Interested Trustee” by virtue of, among other things, his or her affiliation with the trust or various entities under common control with FMR.
+ The information includes the Trustee's principal occupation during the last five years and other information relating to the experience, attributes, and skills relevant to the Trustee's qualifications to serve as a Trustee, which led to the conclusion that the Trustee should serve as a Trustee for the fund.
Independent Trustees:
Correspondence intended for an Independent Trustee may be sent to Fidelity Investments, P.O. Box 55235, Boston, Massachusetts 02205-5235.
Name, Year of Birth; Principal Occupations and Other Relevant Experience+
Dennis J. Dirks (1948)
Year of Election or Appointment: 2005
Trustee
Mr. Dirks also serves as Trustee of other Fidelity® funds. Prior to his retirement in May 2003, Mr. Dirks was Chief Operating Officer and a member of the Board of The Depository Trust & Clearing Corporation (DTCC). He also served as President, Chief Operating Officer, and Board member of The Depository Trust Company (DTC) and President and Board member of the National Securities Clearing Corporation (NSCC). In addition, Mr. Dirks served as Chief Executive Officer and Board member of the Government Securities Clearing Corporation, Chief Executive Officer and Board member of the Mortgage-Backed Securities Clearing Corporation, as a Trustee and a member of the Finance Committee of Manhattan College (2005-2008), as a Trustee and a member of the Finance Committee of AHRC of Nassau County (2006-2008), as a member of the Independent Directors Council (IDC) Governing Council (2010-2015), and as a member of the Board of Directors for The Brookville Center for Children’s Services, Inc. (2009-2017). Mr. Dirks is a member of the Finance Committee (2016-present), Board of Directors (2017-present) and Board of Trustees (2018-present) and is Treasurer (2018-present) of the Asolo Repertory Theatre.
Donald F. Donahue (1950)
Year of Election or Appointment: 2018
Trustee
Mr. Donahue also serves as a Trustee of other Fidelity® funds. Mr. Donahue is President and Chief Executive Officer of Miranda Partners, LLC (risk consulting for the financial services industry, 2012-present). Previously, Mr. Donahue served as a Member of the Advisory Board of certain Fidelity® funds (2015-2018) and Chief Executive Officer (2006-2012), Chief Operating Officer (2003-2006), and Managing Director, Customer Marketing and Development (1999-2003) of The Depository Trust & Clearing Corporation (financial markets infrastructure). Mr. Donahue serves as a Member (2007-present) and Co-Chairman (2016-present) of the Board of Directors of United Way of New York, Member of the Board of Directors of NYC Leadership Academy (2012-present) and Member of the Board of Advisors of Ripple Labs, Inc. (financial services, 2015-present). He also served as Chairman (2010-2012) and Member of the Board of Directors (2012-2013) of Omgeo, LLC (financial services), Treasurer of United Way of New York (2012-2016), and Member of the Board of Directors of XBRL US (financial services non-profit, 2009-2012) and the International Securities Services Association (2009-2012).
Alan J. Lacy (1953)
Year of Election or Appointment: 2008
Trustee
Mr. Lacy also serves as Trustee of other Fidelity® funds. Mr. Lacy serves as a Director of Bristol-Myers Squibb Company (global pharmaceuticals, 2008-present). He is a Trustee of the California Chapter of The Nature Conservancy (2015-present) and a Director of the Center for Advanced Study in the Behavioral Sciences at Stanford University (2015-present). In addition, Mr. Lacy served as Senior Adviser (2007-2014) of Oak Hill Capital Partners, L.P. (private equity) and also served as Chief Executive Officer (2005) and Vice Chairman (2005-2006) of Sears Holdings Corporation (retail) and Chief Executive Officer and Chairman of the Board of Sears, Roebuck and Co. (retail, 2000-2005). Previously, Mr. Lacy served as Chairman (2014-2017) and a member (2010-2017) of the Board of Directors of Dave & Buster’s Entertainment, Inc. (restaurant and entertainment complexes), as Chairman (2008-2011) and a member (2006-2015) of the Board of Trustees of the National Parks Conservation Association, and as a member of the Board of Directors for The Hillman Companies, Inc. (hardware wholesalers, 2010-2014), Earth Fare, Inc. (retail grocery, 2010-2014), and The Western Union Company (global money transfer, 2006-2011).
Ned C. Lautenbach (1944)
Year of Election or Appointment: 2000
Trustee
Chairman of the Independent Trustees
Mr. Lautenbach also serves as Trustee of other Fidelity® funds. Mr. Lautenbach currently serves as Vice Chair of the Board of Governors, State University System of Florida (2013-present) and is a member of the Council on Foreign Relations (1994-present). He is also a member and has most recently served as Chairman of the Board of Directors of Artis-Naples (2012-present). Previously, Mr. Lautenbach served as a member and then Lead Director of the Board of Directors of Eaton Corporation (diversified industrial, 1997-2016). He was also a Partner and Advisory Partner at Clayton, Dubilier & Rice, LLC (private equity investment, 1998-2010), as well as a Director of Sony Corporation (2006-2007). In addition, Mr. Lautenbach also had a 30-year career with IBM (technology company) during which time he served as Senior Vice President and a member of the Corporate Executive Committee (1968-1998).
Joseph Mauriello (1944)
Year of Election or Appointment: 2008
Trustee
Mr. Mauriello also serves as Trustee of other Fidelity® funds. Prior to his retirement in January 2006, Mr. Mauriello served in numerous senior management positions including Deputy Chairman and Chief Operating Officer (2004-2005), and Vice Chairman of Financial Services (2002-2004) of KPMG LLP US (professional services, 1965-2005). Mr. Mauriello currently serves as a member of the Independent Directors Council (IDC) Governing Council (2015-present). Previously, Mr. Mauriello served as a member of the Board of Directors of XL Group plc. (global insurance and re-insurance, 2006-2018).
Cornelia M. Small (1944)
Year of Election or Appointment: 2005
Trustee
Ms. Small also serves as Trustee of other Fidelity® funds. Ms. Small is a member of the Board of Directors (2009-present) and Chair of the Investment Committee (2010-present) of the Teagle Foundation. Ms. Small also serves on the Investment Committee of the Berkshire Taconic Community Foundation (2008-present). Previously, Ms. Small served as Chairperson (2002-2008) and a member of the Investment Committee and Chairperson (2008-2012) and a member of the Board of Trustees of Smith College. In addition, Ms. Small served as Chief Investment Officer, Director of Global Equity Investments, and a member of the Board of Directors of Scudder, Stevens & Clark and Scudder Kemper Investments.
Garnett A. Smith (1947)
Year of Election or Appointment: 2018
Trustee
Mr. Smith also serves as Trustee of other Fidelity® funds. Prior to Mr. Smith's retirement, he served as Chairman and Chief Executive Officer of Inbrand Corp. (manufacturer of personal absorbent products, 1990-1997). He also served as President (1986-1990) of Inbrand Corp. Prior to his employment with Inbrand Corp., he was employed by a retail fabric chain and North Carolina National Bank. In addition, Mr. Smith served as a Member of the Advisory Board of certain Fidelity® funds (2012-2013) and as a board member of the Jackson Hole Land Trust (2009-2012).
David M. Thomas (1949)
Year of Election or Appointment: 2008
Trustee
Mr. Thomas also serves as Trustee of other Fidelity® funds. Mr. Thomas serves as Non-Executive Chairman of the Board of Directors of Fortune Brands Home and Security (home and security products, 2011-present), as a member of the Board of Directors (2004-present) and Presiding Director (2013-present) of Interpublic Group of Companies, Inc. (marketing communication), and as a member of the Board of Trustees of the University of Florida (2013-present). Previously, Mr. Thomas served as Executive Chairman (2005-2006) and Chairman and Chief Executive Officer (2000-2005) of IMS Health, Inc. (pharmaceutical and healthcare information solutions), and a Director of Fortune Brands, Inc. (consumer products, 2000-2011).
+ The information includes the Trustee's principal occupation during the last five years and other information relating to the experience, attributes, and skills relevant to the Trustee's qualifications to serve as a Trustee, which led to the conclusion that the Trustee should serve as a Trustee for the fund.
Advisory Board Members and Officers:
Correspondence intended for a Member of the Advisory Board (if any) may be sent to Fidelity Investments, P.O. Box 55235, Boston, Massachusetts 02205-5235. Correspondence intended for an officer or Peter S. Lynch may be sent to Fidelity Investments, 245 Summer Street, Boston, Massachusetts 02210. Officers appear below in alphabetical order.
Name, Year of Birth; Principal Occupation
Vicki L. Fuller (1957)
Year of Election or Appointment: 2018
Member of the Advisory Board
Ms. Fuller also serves as Member of the Advisory Board of other Fidelity® funds. Ms. Fuller serves as a member of the Board of Directors, Audit Committee, and Nominating and Governance Committee of The Williams Companies, Inc. (natural gas infrastructure, 2018-present). Previously, Ms. Fuller served as the Chief Investment Officer of the New York State Common Retirement Fund (2012-2018) and held a variety of positions at AllianceBernstein L.P. (global asset management, 1985-2012), including Managing Director (2006-2012) and Senior Vice President and Senior Portfolio Manager (2001-2006).
Peter S. Lynch (1944)
Year of Election or Appointment: 2003
Member of the Advisory Board
Mr. Lynch also serves as Member of the Advisory Board of other Fidelity® funds. Mr. Lynch is Vice Chairman and a Director of FMR (investment adviser firm) and FMR Co., Inc. (investment adviser firm). In addition, Mr. Lynch serves as a Trustee of Boston College and as the Chairman of the Inner-City Scholarship Fund. Previously, Mr. Lynch served on the Special Olympics International Board of Directors (1997-2006).
William S. Stavropoulos (1939)
Year of Election or Appointment: 2018
Member of the Advisory Board
Mr. Stavropoulos also serves as Member of the Advisory Board of other Fidelity® funds. Mr. Stavropoulos serves as President and Founder of the Michigan Baseball Foundation, the Great Lakes Loons (2007-present). Mr. Stavropoulos is Chairman Emeritus of the Board of Directors of The Dow Chemical Company, where he previously served in numerous senior management positions, including President, CEO (1995-2000; 2002-2004), Chairman of the Executive Committee (2000-2006), and as a member of the Board of Directors (1990-2006). Currently, Mr. Stavropoulos is Chairman of the Board of Directors of Univar Inc. (global distributor of commodity and specialty chemicals), a Director of Teradata Corporation (data warehousing and technology solutions), and a member of the Advisory Board for Metalmark Capital LLC (private equity investment, 2005-present). Mr. Stavropoulos is an operating advisor to Clayton, Dubilier & Rice, LLC (private equity investment). In addition, Mr. Stavropoulos is a member of the University of Notre Dame Advisory Council for the College of Science, a Trustee of the Rollin L. Gerstacker Foundation, and a Director of Artis-Naples in Naples, Florida. Previously, Mr. Stavropoulos served as Trustee of certain Fidelity® funds (2001-2018) and as a Director of Chemical Financial Corporation (bank holding company, 1993-2012) and Tyco International, Ltd. (multinational manufacturing and services, 2007-2012).
Carol B. Tomé (1957)
Year of Election or Appointment: 2018
Member of the Advisory Board
Ms. Tomé also serves as Member of the Advisory Board of other Fidelity® funds. Ms. Tomé is Chief Financial Officer (2001-present) and Executive Vice President of Corporate Services (2007-present) of The Home Depot, Inc. (home improvement retailer) and a Director (2003-present) and Chair of the Audit Committee (2004-present) of United Parcel Service, Inc. (package delivery and supply chain management). Previously, Ms. Tomé served as Trustee of certain Fidelity® funds (2017), Senior Vice President of Finance and Accounting/Treasurer (2000-2007) and Vice President and Treasurer (1995-2000) of The Home Depot, Inc. and Chair of the Board (2010-2012), Vice Chair of the Board (2009 and 2013), and a Director (2008-2013) of the Federal Reserve Bank of Atlanta. Ms. Tomé is also a director or trustee of many community and professional organizations.
Michael E. Wiley (1950)
Year of Election or Appointment: 2018
Member of the Advisory Board
Mr. Wiley also serves as Trustee or Member of the Advisory Board of other Fidelity® funds. Mr. Wiley serves as a Director of High Point Resources (exploration and production, 2005-present). Previously, Mr. Wiley served as a Director of Andeavor Corporation (independent oil refiner and marketer, 2005-2018), a Director of Andeavor Logistics LP (natural resources logistics, 2015-2018), a Director of Post Oak Bank (privately-held bank, 2004-2018), a Director of Asia Pacific Exploration Consolidated (international oil and gas exploration and production, 2008-2013), a member of the Board of Trustees of the University of Tulsa (2000-2006; 2007-2010), a Senior Energy Advisor of Katzenbach Partners, LLC (consulting, 2006-2007), an Advisory Director of Riverstone Holdings (private investment), a Director of Spinnaker Exploration Company (exploration and production, 2001-2005) and Chairman, President, and CEO of Baker Hughes, Inc. (oilfield services, 2000-2004).
Elizabeth Paige Baumann (1968)
Year of Election or Appointment: 2017
Anti-Money Laundering (AML) Officer
Ms. Baumann also serves as AML Officer of other funds. She is Chief AML Officer (2012-present) and Senior Vice President (2014-present) of FMR LLC (diversified financial services company) and is an employee of Fidelity Investments. Previously, Ms. Baumann served as AML Officer of the funds (2012-2016), and Vice President (2007-2014) and Deputy Anti-Money Laundering Officer (2007-2012) of FMR LLC.
John J. Burke III (1964)
Year of Election or Appointment: 2018
Chief Financial Officer
Mr. Burke also serves as Chief Financial Officer of other funds. Mr. Burke serves as Head of Investment Operations for Fidelity Fund and Investment Operations (2018-present) and is an employee of Fidelity Investments (1998-present). Previously Mr. Burke served as head of Asset Management Investment Operations (2012-2018).
William C. Coffey (1969)
Year of Election or Appointment: 2018
Secretary and Chief Legal Officer (CLO)
Mr. Coffey also serves as Secretary and CLO of other funds. Mr. Coffey serves as CLO, Secretary, and Senior Vice President of Fidelity Management & Research Company and FMR Co., Inc. (investment adviser firms, 2018-present); Secretary of Fidelity SelectCo, LLC and Fidelity Investments Money Management, Inc. (investment adviser firms, 2018-present); and CLO of Fidelity Management & Research (Hong Kong) Limited, FMR Investment Management (UK) Limited, and Fidelity Management & Research (Japan) Limited (investment adviser firms, 2018-present). He is Senior Vice President and Deputy General Counsel of FMR LLC (diversified financial services company, 2010-present), and is an employee of Fidelity Investments. Previously, Mr. Coffey served as Assistant Secretary of certain funds (2009-2018) and as Vice President and Associate General Counsel of FMR LLC (2005-2009).
Timothy M. Cohen (1969)
Year of Election or Appointment: 2018
Vice President
Mr. Cohen also serves as Vice President of other funds. Mr. Cohen serves as Co-Head of Global Equity Research (2016-present), a Director of Fidelity Management & Research (Japan) Limited (investment adviser firm, 2016-present), and is an employee of Fidelity Investments. Previously, Mr. Cohen served as Chief Investment Officer - Equity and a Director of Fidelity Management & Research (U.K.) Inc. (investment adviser firm, 2013-2015) and as a Director of Fidelity Management & Research (Hong Kong) Limited (investment adviser firm, 2017).
Jonathan Davis (1968)
Year of Election or Appointment: 2010
Assistant Treasurer
Mr. Davis also serves as Assistant Treasurer of other funds. Mr. Davis serves as Assistant Treasurer of FMR Capital, Inc. (2017-present) and is an employee of Fidelity Investments. Previously, Mr. Davis served as Vice President and Associate General Counsel of FMR LLC (diversified financial services company, 2003-2010).
Adrien E. Deberghes (1967)
Year of Election or Appointment: 2016
Assistant Treasurer
Mr. Deberghes also serves as an officer of other funds. He serves as Assistant Treasurer of FMR Capital, Inc. (2017-present), Executive Vice President of Fidelity Investments Money Management, Inc. (FIMM) (investment adviser firm, 2016-present), and is an employee of Fidelity Investments (2008-present). Previously, Mr. Deberghes served as President and Treasurer of certain Fidelity® funds (2013-2018). Prior to joining Fidelity Investments, Mr. Deberghes was Senior Vice President of Mutual Fund Administration at State Street Corporation (2007-2008), Senior Director of Mutual Fund Administration at Investors Bank & Trust (2005-2007), and Director of Finance for Dunkin' Brands (2000-2005). Previously, Mr. Deberghes served in other fund officer roles.
Laura M. Del Prato (1964)
Year of Election or Appointment: 2018
Assistant Treasurer
Ms. Del Prato also serves as an officer of other funds. Ms. Del Prato is an employee of Fidelity Investments (2017-present). Prior to joining Fidelity Investments, Ms. Del Prato served as a Managing Director and Treasurer of the JPMorgan Mutual Funds (2014-2017). Prior to JPMorgan, Ms. Del Prato served as a partner at Cohen Fund Audit Services (accounting firm, 2012-2013) and KPMG LLP (accounting firm, 2004-2012).
Colm A. Hogan (1973)
Year of Election or Appointment: 2016
Deputy Treasurer
Mr. Hogan also serves as an officer of other funds. Mr. Hogan serves as Assistant Treasurer of FMR Capital, Inc. (2017-present) and is an employee of Fidelity Investments (2005-present). Previously, Mr. Hogan served as Assistant Treasurer of certain Fidelity® funds (2016-2018).
Pamela R. Holding (1964)
Year of Election or Appointment: 2018
Vice President
Ms. Holding also serves as Vice President of other funds. Ms. Holding serves as Co-Head of Global Equity Research (2018-present) and is an employee of Fidelity Investments (2013-present).
Chris Maher (1972)
Year of Election or Appointment: 2013
Assistant Treasurer
Mr. Maher serves as Assistant Treasurer of other funds. Mr. Maher is Vice President of Valuation Oversight, serves as Assistant Treasurer of FMR Capital, Inc. (2017-present), and is an employee of Fidelity Investments. Previously, Mr. Maher served as Vice President of Asset Management Compliance (2013), Vice President of the Program Management Group of FMR (investment adviser firm, 2010-2013), and Vice President of Valuation Oversight (2008-2010).
Rieco E. Mello (1969)
Year of Election or Appointment: 2017
Assistant Treasurer
Mr. Mello also serves as Assistant Treasurer of other funds. Mr. Mello serves as Assistant Treasurer of FMR Capital, Inc. (2017-present) and is an employee of Fidelity Investments (1995-present).
Kenneth B. Robins (1969)
Year of Election or Appointment: 2016
Chief Compliance Officer
Mr. Robins also serves as an officer of other funds. Mr. Robins serves as Compliance Officer of Fidelity Management & Research Company and FMR Co., Inc. (investment adviser firms, 2016-present) and is an employee of Fidelity Investments (2004-present). Previously, Mr. Robins served as Executive Vice President of Fidelity Investments Money Management, Inc. (investment adviser firm, 2013-2016) and served in other fund officer roles.
Stacie M. Smith (1974)
Year of Election or Appointment: 2016
President and Treasurer
Ms. Smith also serves as an officer of other funds. Ms. Smith serves as Assistant Treasurer of FMR Capital, Inc. (2017-present), is an employee of Fidelity Investments (2009-present), and has served in other fund officer roles. Prior to joining Fidelity Investments, Ms. Smith served as Senior Audit Manager of Ernst & Young LLP (accounting firm, 1996-2009). Previously, Ms. Smith served as Assistant Treasurer (2013-2018) and Deputy Treasurer (2013-2016) of certain Fidelity® funds.
Marc L. Spector (1972)
Year of Election or Appointment: 2016
Assistant Treasurer
Mr. Spector also serves as an officer of other funds. Mr. Spector serves as Assistant Treasurer of FMR Capital, Inc. (2017-present) and is an employee of Fidelity Investments (2016-present). Prior to joining Fidelity Investments, Mr. Spector served as Director at the Siegfried Group (accounting firm, 2013-2016), and prior to Siegfried Group as audit senior manager at Deloitte & Touche (accounting firm, 2005-2013).
Shareholder Expense Example
As a shareholder of the Fund, you incur two types of costs: (1) transaction costs, including sales charges (loads) on purchase payments or redemption proceeds, redemption fees and (2) ongoing costs, including management fees, distribution and/or service (12b-1) fees and other Fund expenses. This Example is intended to help you understand your ongoing costs (in dollars) of investing in the Fund and to compare these costs with the ongoing costs of investing in other mutual funds.
The actual expense Example is based on an investment of $1,000 invested at the beginning of the period and held for the entire period (May 1, 2018 to October 31, 2018) for each Class, except Class Z, and for the period (October 2, 2018 to October 31, 2018) for Class Z. The hypothetical expense Example is based on an investment of $1,000 invested for the one-half year period (May 1, 2018 to October 31, 2018).
Actual Expenses
The first line of the accompanying table for each class of the Fund provides information about actual account values and actual expenses. You may use the information in this line, together with the amount you invested, to estimate the expenses that you paid over the period. Simply divide your account value by $1,000.00 (for example, an $8,600 account value divided by $1,000.00 = 8.6), then multiply the result by the number in the first line for a class of the Fund under the heading entitled "Expenses Paid During Period" to estimate the expenses you paid on your account during this period. A small balance maintenance fee of $12.00 that is charged once a year may apply for certain accounts with a value of less than $2,000. This fee, which was eliminated effective August 1, 2018, is not included in the table below. If it was, the estimate of expenses you paid during the period would be higher, and your ending account value lower, by this amount. In addition, the Fund, as a shareholder in the underlying Fidelity Central Funds, will indirectly bear its pro-rata share of the fees and expenses incurred by the underlying Fidelity Central Funds. These fees and expenses are not included in the Fund's annualized expense ratio used to calculate the expense estimate in the table below.
Hypothetical Example for Comparison Purposes
The second line of the accompanying table for each class of the Fund provides information about hypothetical account values and hypothetical expenses based on a Class' actual expense ratio and an assumed rate of return of 5% per year before expenses, which is not the Class' actual return. The hypothetical account values and expenses may not be used to estimate the actual ending account balance or expenses you paid for the period. You may use this information to compare the ongoing costs of investing in the Fund and other funds. To do so, compare this 5% hypothetical example with the 5% hypothetical examples that appear in the shareholder reports of the other funds. A small balance maintenance fee of $12.00 that is charged once a year may apply for certain accounts with a value of less than $2,000. This fee, which was eliminated effective August 1, 2018, is not included in the table below. If it was, the estimate of expenses you paid during the period would be higher, and your ending account value lower, by this amount. In addition, the Fund, as a shareholder in the underlying Fidelity Central Funds, will indirectly bear its pro-rata share of the fees and expenses incurred by the underlying Fidelity Central Funds. These fees and expenses are not included in the Fund's annualized expense ratio used to calculate the expense estimate in the table below.
Please note that the expenses shown in the table are meant to highlight your ongoing costs only and do not reflect any transaction costs. Therefore, the second line of the table is useful in comparing ongoing costs only, and will not help you determine the relative total costs of owning different funds. In addition, if these transactional costs were included, your costs would have been higher.
| Annualized Expense Ratio-A | Beginning Account Value | Ending Account Value October 31, 2018 | Expenses Paid During Period | |
| Class A | 1.27% | |||
| Actual | $1,000.00 | $806.80 | $5.78-B | |
| Hypothetical-C | $1,000.00 | $1,018.50 | $6.46-D | |
| Class M | 1.62% | |||
| Actual | $1,000.00 | $805.40 | $7.37-B | |
| Hypothetical-C | $1,000.00 | $1,017.04 | $8.24-D | |
| Class C | 2.01% | |||
| Actual | $1,000.00 | $803.60 | $9.14-B | |
| Hypothetical-C | $1,000.00 | $1,015.07 | $10.21-D | |
| China Region | .96% | |||
| Actual | $1,000.00 | $807.70 | $4.37-B | |
| Hypothetical-C | $1,000.00 | $1,020.37 | $4.89-D | |
| Class I | .98% | |||
| Actual | $1,000.00 | $807.70 | $4.47-B | |
| Hypothetical-C | $1,000.00 | $1,020.27 | $4.99-D | |
| Class Z | .90% | |||
| Actual | $1,000.00 | $886.00 | $.70-E | |
| Hypothetical-C | $1,000.00 | $1,020.67 | $4.58-D |
A Annualized expense ratio reflects expenses net of applicable fee waivers.
B Actual expenses are equal to each Class' annualized expense ratio, multiplied by the average account value over the period, multiplied by 184/365 (to reflect the one-half year period).
C 5% return per year before expenses
D Hypothetical expenses are equal to each Class' annualized expense ratio, multiplied by the average account value over the period, multiplied by 184/365 (to reflect the one-half year period).
E Actual expenses are equal to the Class' annualized expense ratio, multiplied by the average account value over the period, multiplied by 30/365 (to reflect the period October 2, 2018 to October 31, 2018).
Distributions (Unaudited)
Class A designates 100%; Retail Class designates 100%; and Class I designates 94%; of the dividend distributed in December, 2017, respectively during the fiscal year as amounts which may be taken into account as a dividend for purposes of the maximum rate under section 1(h)(11) of the Internal Revenue Code.
The amounts per share which represent income derived from sources within, and taxes paid to, foreign countries or possessions of the United States are as follows:
| Pay Date | Income | Taxes | |
| Fidelity China Region | |||
| Class A | 12/11/17 | $0.1269 | $0.0519 |
| Class M | 12/11/17 | $0.0000 | $0.0000 |
| Class C | 12/11/17 | $0.0000 | $0.0000 |
| China Region | 12/11/17 | $0.1939 | $0.0519 |
| Class I | 12/11/17 | $0.2079 | $0.0519 |
The fund will notify shareholders in January 2019 of amounts for use in preparing 2018 income tax returns.
Board Approval of Investment Advisory Contracts
Fidelity China Region Fund
At its July 2018 meeting, the Board of Trustees, including the Independent Trustees (together, the Board), voted to continue the management contract with Fidelity Management & Research Company (FMR) and the sub-advisory agreements (together, the Advisory Contracts) for the fund for six months through January 31, 2019, in connection with the reunification of the Fidelity Equity High Income Funds Board, which oversees the fund, and the Sector Portfolios Board.
The Board considered that the approval of the fund's Advisory Contracts will not result in any changes in (i) the investment process or strategies employed in the management of the fund's assets; (ii) the fees and expenses paid by shareholders; (iii) the nature, extent or quality of services provided under the fund's Advisory Contracts; or (iv) the day-to-day management of the fund or the persons primarily responsible for such management. The Board concluded that the fund's Advisory Contracts are fair and reasonable, and that the fund's Advisory Contracts should be renewed, without modification, through January 31, 2019, with the understanding that the Board will consider the annual renewal for a full one year period in January 2019.
In connection with its consideration of future renewals of the fund's Advisory Contracts, the Board will consider: (i) the nature, extent and quality of services provided to the fund, including shareholder and administrative services and investment performance; (ii) the competitiveness of the management fee and total expenses for the fund; (iii) the costs of the services and profitability, including the revenues earned and the expenses incurred in conducting the business of developing, marketing, distributing, managing, administering, and servicing the fund and its shareholders, to the extent applicable, as well as potential fall-out benefits from Fidelity's non-fund businesses; and (iv) whether there have been economies of scale in respect of the Fidelity funds, whether the Fidelity funds (including the fund) have appropriately benefited from any such economies of scale, and whether there is the potential for realization of any further economies.
Based on its evaluation of all of the conclusions noted above, and after considering all factors it believed relevant, the Board ultimately concluded that the fund's management fee structure is fair and reasonable, and that the continuation of the fund's Advisory Contracts should be approved.
![]()
AHKC-ANN-1218
1.861459.110
Fidelity® Emerging Markets Fund Class K Annual Report October 31, 2018 |
|
Contents
To view a fund's proxy voting guidelines and proxy voting record for the 12-month period ended June 30, visit http://www.fidelity.com/proxyvotingresults or visit the Securities and Exchange Commission's (SEC) web site at http://www.sec.gov.
You may also call 1-800-835-5092 to request a free copy of the proxy voting guidelines.
Standard & Poor's, S&P and S&P 500 are registered service marks of The McGraw-Hill Companies, Inc. and have been licensed for use by Fidelity Distributors Corporation.
Other third-party marks appearing herein are the property of their respective owners.
All other marks appearing herein are registered or unregistered trademarks or service marks of FMR LLC or an affiliated company. © 2018 FMR LLC. All rights reserved.
This report and the financial statements contained herein are submitted for the general information of the shareholders of the Fund. This report is not authorized for distribution to prospective investors in the Fund unless preceded or accompanied by an effective prospectus.
A fund files its complete schedule of portfolio holdings with the SEC for the first and third quarters of each fiscal year on Form N-Q. Forms N-Q are available on the SEC’s web site at http://www.sec.gov. A fund's Forms N-Q may be reviewed and copied at the SEC’s Public Reference Room in Washington, DC. Information regarding the operation of the SEC's Public Reference Room may be obtained by calling 1-800-SEC-0330.
For a complete list of a fund's portfolio holdings, view the most recent holdings listing, semiannual report, or annual report on Fidelity's web site at http://www.fidelity.com, http://www.institutional.fidelity.com, or http://www.401k.com, as applicable.
NOT FDIC INSURED •MAY LOSE VALUE •NO BANK GUARANTEE
Neither the Fund nor Fidelity Distributors Corporation is a bank.
Performance: The Bottom Line
Average annual total return reflects the change in the value of an investment, assuming reinvestment of distributions from dividend income and capital gains (the profits earned upon the sale of securities that have grown in value, if any) and assuming a constant rate of performance each year. The hypothetical investment and the average annual total returns do not reflect the deduction of taxes that a shareholder would pay on fund distributions or the redemption of fund shares. During periods of reimbursement by Fidelity, a fund’s total return will be greater than it would be had the reimbursement not occurred. How a fund did yesterday is no guarantee of how it will do tomorrow.
Average Annual Total Returns
| For the periods ended October 31, 2018 | Past 1 year | Past 5 years | Past 10 years |
| Class K | (14.39)% | 2.46% | 8.15% |
The initial offering of Class K shares took place on May 9, 2008. Returns prior to May 9, 2008 are those of Fidelity® Emerging Markets Fund, the original class of the fund.
$10,000 Over 10 Years
Let's say hypothetically that $10,000 was invested in Fidelity® Emerging Markets Fund - Class K on October 31, 2008.
The chart shows how the value of your investment would have changed, and also shows how the MSCI Emerging Markets Index performed over the same period.
See above for additional information regarding the performance of Class K.
| Period Ending Values | ||
| $21,893 | Fidelity® Emerging Markets Fund - Class K | |
| $21,968 | MSCI Emerging Markets Index | |
Management's Discussion of Fund Performance
Market Recap: International equities returned -8.08% for the 12 months ending October 31, 2018, according to the MSCI ACWI (All Country World Index) ex USA Index. A modestly positive first half of the period gave way to a confluence of overwhelmingly negative factors – including escalating trade tensions, a surging U.S. dollar, tepid economic growth in Europe, global central bank tightening, concerns about Italy’s budget stalemate with the EU, and weakness in China’s stock market – that yielded a -11% second-half return. The index lost 8% in October alone, its largest monthly drop in more than six years. Among sectors, new-media-infused communications services (-15%) was hit the hardest, while economically sensitive consumer discretionary (-13%), information technology (-12%), financials (-10%), industrials (-9%) and materials (-7%) stocks also fared poorly. Even the more defensive real estate (-9%), utilities (-6%) and consumer staples (-5%) sectors weren’t spared this period. Conversely, elevated crude-oil prices fueled a positive return for energy (+7%), the top-performing sector, followed by the relatively stable-growing health care segment (+2%). Regionally, emerging markets (-12%) fared the worst, hampered by the impact of foreign exchange and concerns about economic weakness in China, India and South Korea. Sluggish growth also pressured shares in continental Europe (-9%). Stocks in Japan (-3%) and the U.K. (-4%) held up better, followed by Canada (-5%) and Asia-Pacific ex Japan (-6%).Comments from Portfolio Manager Sammy Simnegar: For the fiscal year, the fund’s share classes returned roughly returned roughly-14% to -15%, trailing the -12.49% return of the benchmark MSCI Emerging Markets Index. Versus the benchmark, positioning in energy was the biggest detractor, along with security selection within communication services and consumer staples. Geographically, stock picks in China and India detracted the most by far. Among individual stocks, avoiding strong-performing, Brazil-based metals miner Vale hampered relative performance the most. Avoiding a trio of state-run energy giants, Brazil’s Petroleo Brasileiro (aka Petrobras), Russia’s Lukoil, and China’s CNOOC, also worked against us. Additionally, Argentine bank Banco Macro detracted but was not held in the fund at period end. Turning to sectors, stock selection in information technology was the largest relative contributor. I'll note that the fund's small cash position – representing about 1% of assets, on average – helped our relative result considerably in a down market. Regionally, out-of-benchmark exposure to the United States and continental Europe aided relative results. The top individual contributor was an overweight stake in Brazil-based reinsurance provider IRB Brasil Resseguros due to the stock’s strong showing and timely positioning on our part. Another contributor was an out-of-benchmark stake in Wirecard, a Germany-based provider of online payment processing purchased during the period. Lastly, avoiding weak-performing benchmark name Hon Hai Precision also proved beneficial.The views expressed above reflect those of the portfolio manager(s) only through the end of the period as stated on the cover of this report and do not necessarily represent the views of Fidelity or any other person in the Fidelity organization. Any such views are subject to change at any time based upon market or other conditions and Fidelity disclaims any responsibility to update such views. These views may not be relied on as investment advice and, because investment decisions for a Fidelity fund are based on numerous factors, may not be relied on as an indication of trading intent on behalf of any Fidelity fund.
Investment Summary (Unaudited)
Geographic Diversification (% of fund's net assets)
| As of October 31, 2018 | ||
| Cayman Islands | 15.6% | |
| India | 11.8% | |
| United States of America* | 9.0% | |
| China | 8.5% | |
| Brazil | 8.3% | |
| Taiwan | 7.1% | |
| Korea (South) | 6.6% | |
| South Africa | 5.2% | |
| Russia | 3.0% | |
| Other | 24.9% | |

* Includes Short-Term investments and Net Other Assets (Liabilities).
Percentages are based on country or territory of incorporation and are adjusted for the effect of futures contracts, if applicable.
Asset Allocation as of October 31, 2018
| % of fund's net assets | |
| Stocks | 98.4 |
| Short-Term Investments and Net Other Assets (Liabilities) | 1.6 |
Top Ten Stocks as of October 31, 2018
| % of fund's net assets | |
| Samsung Electronics Co. Ltd. (Korea (South), Technology Hardware, Storage & Peripherals) | 4.9 |
| Tencent Holdings Ltd. (Cayman Islands, Interactive Media & Services) | 4.8 |
| Taiwan Semiconductor Manufacturing Co. Ltd. (Taiwan, Semiconductors & Semiconductor Equipment) | 4.6 |
| Alibaba Group Holding Ltd. sponsored ADR (Cayman Islands, Internet & Direct Marketing Retail) | 4.1 |
| Naspers Ltd. Class N (South Africa, Media) | 2.2 |
| Itau Unibanco Holding SA (Brazil, Banks) | 1.7 |
| Ping An Insurance (Group) Co. of China Ltd. (H Shares) (China, Insurance) | 1.7 |
| Baidu.com, Inc. sponsored ADR (Cayman Islands, Interactive Media & Services) | 1.6 |
| Reliance Industries Ltd. (India, Oil, Gas & Consumable Fuels) | 1.4 |
| Housing Development Finance Corp. Ltd. (India, Thrifts & Mortgage Finance) | 1.4 |
| 28.4 |
Top Market Sectors as of October 31, 2018
| % of fund's net assets | |
| Financials | 20.7 |
| Consumer Discretionary | 17.5 |
| Information Technology | 16.8 |
| Consumer Staples | 10.6 |
| Communication Services | 10.4 |
| Materials | 8.5 |
| Industrials | 6.8 |
| Energy | 2.4 |
| Real Estate | 2.1 |
| Health Care | 2.0 |
Schedule of Investments October 31, 2018
Showing Percentage of Net Assets
| Common Stocks - 95.8% | |||
| Shares | Value | ||
| Belgium - 0.6% | |||
| Umicore SA | 573,738 | $27,027,026 | |
| Bermuda - 1.0% | |||
| Credicorp Ltd. (United States) | 198,832 | 44,878,371 | |
| Brazil - 5.7% | |||
| BM&F BOVESPA SA | 5,551,900 | 39,593,558 | |
| CVC Brasil Operadora e Agencia de Viagens SA | 1,818,200 | 27,652,860 | |
| IRB Brasil Resseguros SA | 1,595,600 | 31,067,359 | |
| Localiza Rent A Car SA | 4,890,900 | 37,784,059 | |
| Lojas Renner SA | 3,464,000 | 34,998,361 | |
| Notre Dame Intermedica Participacoes SA | 4,813,100 | 31,207,874 | |
| Rumo SA (a) | 4,527,400 | 20,255,599 | |
| Suzano Papel e Celulose SA | 2,741,700 | 27,884,817 | |
| TOTAL BRAZIL | 250,444,487 | ||
| Cayman Islands - 15.6% | |||
| 58.com, Inc. ADR (a) | 481,400 | 31,575,026 | |
| Alibaba Group Holding Ltd. sponsored ADR (a) | 1,265,700 | 180,083,796 | |
| Baidu.com, Inc. sponsored ADR (a) | 375,500 | 71,367,530 | |
| Baozun, Inc. sponsored ADR (a)(b) | 683,300 | 27,202,173 | |
| Huazhu Group Ltd. ADR | 1,064,400 | 27,844,704 | |
| New Oriental Education & Technology Group, Inc. sponsored ADR | 641,983 | 37,562,425 | |
| Shenzhou International Group Holdings Ltd. | 2,953,000 | 32,610,486 | |
| Sunny Optical Technology Group Co. Ltd. | 3,216,400 | 27,890,410 | |
| TAL Education Group ADR (a) | 1,322,800 | 38,334,744 | |
| Tencent Holdings Ltd. | 6,071,300 | 207,998,267 | |
| TOTAL CAYMAN ISLANDS | 682,469,561 | ||
| Chile - 1.4% | |||
| Banco Santander Chile sponsored ADR | 1,078,100 | 31,760,826 | |
| Sociedad Quimica y Minera de Chile SA (PN-B) sponsored ADR (b) | 707,500 | 30,995,575 | |
| TOTAL CHILE | 62,756,401 | ||
| China - 8.5% | |||
| China International Travel Service Corp. Ltd. (A Shares) | 3,781,271 | 29,098,167 | |
| Gree Electric Appliances, Inc. of Zhuhai Class A (a) | 4,288,035 | 23,396,044 | |
| Hangzhou Hikvision Digital Technology Co. Ltd. Class A | 7,402,760 | 25,681,735 | |
| Inner Mongoli Yili Industries Co. Ltd. (A Shares) | 8,441,746 | 26,720,628 | |
| Jiangsu Yanghe Brewery Joint-Stock Co. Ltd. Class A | 2,165,394 | 27,438,185 | |
| Kweichow Moutai Co. Ltd. (A Shares) | 387,984 | 30,529,688 | |
| Midea Group Co. Ltd. Class A | 5,333,848 | 28,322,196 | |
| Ping An Insurance (Group) Co. of China Ltd. (H Shares) | 7,847,500 | 73,902,266 | |
| Shanghai International Airport Co. Ltd. (A Shares) | 4,000,604 | 28,417,413 | |
| Shenzhen Inovance Technology Co. Ltd. Class A | 7,845,981 | 25,059,809 | |
| Wuliangye Yibin Co. Ltd. Class A | 3,744,749 | 25,848,439 | |
| Yunnan Baiyao Group Co. Ltd. (c) | 2,592,537 | 26,101,349 | |
| TOTAL CHINA | 370,515,919 | ||
| France - 2.9% | |||
| Hermes International SCA | 45,401 | 25,968,839 | |
| Kering SA | 59,505 | 26,527,986 | |
| LVMH Moet Hennessy - Louis Vuitton SA | 82,558 | 25,048,545 | |
| Pernod Ricard SA | 169,200 | 25,833,662 | |
| Thales SA | 179,100 | 22,922,910 | |
| TOTAL FRANCE | 126,301,942 | ||
| Germany - 1.2% | |||
| adidas AG | 115,943 | 27,315,150 | |
| Wirecard AG | 134,400 | 25,178,538 | |
| TOTAL GERMANY | 52,493,688 | ||
| Hong Kong - 1.8% | |||
| AIA Group Ltd. | 3,526,600 | 26,690,263 | |
| China Resources Beer Holdings Co. Ltd. | 8,206,000 | 28,515,038 | |
| Techtronic Industries Co. Ltd. | 5,167,500 | 24,183,685 | |
| TOTAL HONG KONG | 79,388,986 | ||
| India - 11.8% | |||
| Adani Ports & Special Economic Zone Ltd. | 3,047,827 | 13,139,530 | |
| Asian Paints Ltd. | 1,828,345 | 30,416,383 | |
| Dabur India Ltd. | 4,840,700 | 25,181,981 | |
| Eicher Motors Ltd. | 91,902 | 27,168,746 | |
| Godrej Consumer Products Ltd. | 2,965,096 | 29,059,625 | |
| HDFC Bank Ltd. | 1,005,397 | 26,100,372 | |
| Hindustan Unilever Ltd. | 1,739,000 | 38,130,561 | |
| Housing Development Finance Corp. Ltd. | 2,595,046 | 62,077,949 | |
| Indraprastha Gas Ltd. | 7,397,561 | 26,735,642 | |
| IndusInd Bank Ltd. | 1,298,822 | 25,026,382 | |
| ITC Ltd. | 9,395,700 | 35,583,228 | |
| Kotak Mahindra Bank Ltd. | 1,650,248 | 24,971,269 | |
| Maruti Suzuki India Ltd. | 381,295 | 34,110,333 | |
| Pidilite Industries Ltd. | 1,859,927 | 24,112,912 | |
| Reliance Industries Ltd. | 4,430,318 | 63,570,511 | |
| Titan Co. Ltd. | 2,614,381 | 29,855,411 | |
| TOTAL INDIA | 515,240,835 | ||
| Indonesia - 1.8% | |||
| PT Bank Central Asia Tbk | 25,428,800 | 39,558,699 | |
| PT Bank Rakyat Indonesia Tbk | 185,489,300 | 38,433,895 | |
| TOTAL INDONESIA | 77,992,594 | ||
| Ireland - 0.6% | |||
| Accenture PLC Class A | 165,600 | 26,101,872 | |
| Japan - 0.6% | |||
| Keyence Corp. | 52,200 | 25,583,019 | |
| Kenya - 0.5% | |||
| Safaricom Ltd. | 97,837,300 | 22,279,307 | |
| Korea (South) - 6.6% | |||
| LG Chemical Ltd. | 133,227 | 40,516,888 | |
| LG Household & Health Care Ltd. | 37,634 | 34,434,615 | |
| Samsung Electronics Co. Ltd. | 5,742,227 | 213,383,372 | |
| TOTAL KOREA (SOUTH) | 288,334,875 | ||
| Mexico - 2.5% | |||
| Embotelladoras Arca S.A.B. de CV | 3,740,900 | 18,812,004 | |
| Grupo Aeroportuario del Pacifico S.A.B. de CV Series B | 3,067,657 | 25,378,497 | |
| Grupo Aeroportuario del Sureste S.A.B. de CV Series B | 1,748,120 | 29,056,662 | |
| Wal-Mart de Mexico SA de CV Series V | 14,901,600 | 38,058,657 | |
| TOTAL MEXICO | 111,305,820 | ||
| Netherlands - 1.8% | |||
| ASML Holding NV (Netherlands) | 151,100 | 26,026,088 | |
| Ferrari NV | 220,300 | 25,825,609 | |
| Yandex NV Series A (a) | 944,800 | 28,466,824 | |
| TOTAL NETHERLANDS | 80,318,521 | ||
| Philippines - 2.8% | |||
| Ayala Corp. | 1,699,845 | 29,265,442 | |
| Ayala Land, Inc. | 41,229,600 | 30,592,167 | |
| SM Investments Corp. | 1,843,793 | 31,053,646 | |
| SM Prime Holdings, Inc. | 49,490,400 | 31,303,694 | |
| TOTAL PHILIPPINES | 122,214,949 | ||
| Russia - 3.0% | |||
| Alrosa Co. Ltd. | 19,248,600 | 29,191,220 | |
| NOVATEK OAO GDR (Reg. S) | 258,022 | 43,734,729 | |
| Sberbank of Russia | 19,591,110 | 56,310,443 | |
| TOTAL RUSSIA | 129,236,392 | ||
| South Africa - 5.2% | |||
| Capitec Bank Holdings Ltd. | 440,000 | 29,547,182 | |
| Discovery Ltd. | 2,747,985 | 29,418,015 | |
| FirstRand Ltd. | 9,344,300 | 40,734,244 | |
| Mondi Ltd. | 1,238,966 | 29,636,084 | |
| Naspers Ltd. Class N | 545,712 | 95,906,225 | |
| TOTAL SOUTH AFRICA | 225,241,750 | ||
| Spain - 0.6% | |||
| Amadeus IT Holding SA Class A | 319,400 | 25,750,675 | |
| Sweden - 0.6% | |||
| Hexagon AB (B Shares) | 523,000 | 25,638,067 | |
| Switzerland - 0.7% | |||
| Sika AG | 222,619 | 28,558,184 | |
| Taiwan - 7.1% | |||
| E.SUN Financial Holdings Co. Ltd. | 47,252,000 | 31,287,156 | |
| Formosa Chemicals & Fibre Corp. | 10,897,000 | 39,420,035 | |
| Formosa Plastics Corp. | 12,358,000 | 40,314,530 | |
| Taiwan Semiconductor Manufacturing Co. Ltd. | 26,654,000 | 199,988,659 | |
| TOTAL TAIWAN | 311,010,380 | ||
| Thailand - 1.6% | |||
| Airports of Thailand PCL (For. Reg.) | 17,046,300 | 32,899,976 | |
| C.P. ALL PCL (For. Reg.) | 17,195,400 | 34,873,059 | |
| TOTAL THAILAND | 67,773,035 | ||
| United Arab Emirates - 0.7% | |||
| National Bank of Abu Dhabi PJSC | 7,579,300 | 28,516,648 | |
| United Kingdom - 1.2% | |||
| British American Tobacco PLC (United Kingdom) | 541,200 | 23,461,165 | |
| NMC Health PLC | 646,200 | 29,173,361 | |
| TOTAL UNITED KINGDOM | 52,634,526 | ||
| United States of America - 7.4% | |||
| American Tower Corp. | 186,700 | 29,089,727 | |
| Amphenol Corp. Class A | 315,600 | 28,246,200 | |
| Constellation Brands, Inc. Class A (sub. vtg.) | 121,900 | 24,286,137 | |
| MasterCard, Inc. Class A | 133,200 | 26,329,644 | |
| MercadoLibre, Inc. | 94,800 | 30,762,600 | |
| Moody's Corp. | 168,100 | 24,455,188 | |
| MSCI, Inc. | 175,300 | 26,361,614 | |
| NVIDIA Corp. | 116,300 | 24,519,529 | |
| S&P Global, Inc. | 145,000 | 26,436,400 | |
| Sherwin-Williams Co. | 67,300 | 26,480,531 | |
| TransDigm Group, Inc. (a) | 75,900 | 25,065,975 | |
| Visa, Inc. Class A | 215,900 | 29,761,815 | |
| TOTAL UNITED STATES OF AMERICA | 321,795,360 | ||
| TOTAL COMMON STOCKS | |||
| (Cost $3,427,002,516) | 4,181,803,190 | ||
| Nonconvertible Preferred Stocks - 2.6% | |||
| Brazil - 2.6% | |||
| Itau Unibanco Holding SA | 5,601,610 | 74,131,209 | |
| Itausa-Investimentos Itau SA (PN) | 13,660,100 | 41,257,430 | |
| TOTAL BRAZIL | 115,388,639 | ||
| TOTAL NONCONVERTIBLE PREFERRED STOCKS | |||
| (Cost $86,779,526) | 115,388,639 | ||
| Money Market Funds - 2.7% | |||
| Fidelity Cash Central Fund, 2.23% (d) | 66,563,248 | 66,576,561 | |
| Fidelity Securities Lending Cash Central Fund 2.23% (d)(e) | 50,689,171 | 50,694,240 | |
| TOTAL MONEY MARKET FUNDS | |||
| (Cost $117,270,801) | 117,270,801 | ||
| TOTAL INVESTMENT IN SECURITIES - 101.1% | |||
| (Cost $3,631,052,843) | 4,414,462,630 | ||
| NET OTHER ASSETS (LIABILITIES) - (1.1)% | (50,020,167) | ||
| NET ASSETS - 100% | $4,364,442,463 |
Categorizations in the Schedule of Investments are based on country or territory of incorporation.
Legend
(a) Non-income producing
(b) Security or a portion of the security is on loan at period end.
(c) Level 3 security
(d) Affiliated fund that is generally available only to investment companies and other accounts managed by Fidelity Investments. The rate quoted is the annualized seven-day yield of the fund at period end. A complete unaudited listing of the fund's holdings as of its most recent quarter end is available upon request. In addition, each Fidelity Central Fund's financial statements, which are not covered by the Fund's Report of Independent Registered Public Accounting Firm, are available on the SEC's website or upon request.
(e) Investment made with cash collateral received from securities on loan.
Affiliated Central Funds
Information regarding fiscal year to date income earned by the Fund from investments in Fidelity Central Funds is as follows:
| Fund | Income earned |
| Fidelity Cash Central Fund | $1,111,045 |
| Fidelity Securities Lending Cash Central Fund | 406,557 |
| Total | $1,517,602 |
Amounts in the income column in the above table include any capital gain distributions from underlying funds, which are presented in the corresponding line-item in the Statement of Operations if applicable.
Investment Valuation
The following is a summary of the inputs used, as of October 31, 2018, involving the Fund's assets and liabilities carried at fair value. The inputs or methodology used for valuing securities may not be an indication of the risk associated with investing in those securities. For more information on valuation inputs, and their aggregation into the levels used below, please refer to the Investment Valuation section in the accompanying Notes to Financial Statements.
| Valuation Inputs at Reporting Date: | ||||
| Description | Total | Level 1 | Level 2 | Level 3 |
| Investments in Securities: | ||||
| Equities: | ||||
| Communication Services | $457,593,179 | $249,594,912 | $207,998,267 | $-- |
| Consumer Discretionary | 763,872,860 | 738,824,315 | 25,048,545 | -- |
| Consumer Staples | 466,766,672 | 443,305,507 | 23,461,165 | -- |
| Energy | 107,305,240 | 107,305,240 | -- | -- |
| Financials | 901,782,180 | 819,371,365 | 82,410,815 | -- |
| Health Care | 86,482,584 | 60,381,235 | -- | 26,101,349 |
| Industrials | 291,034,076 | 291,034,076 | -- | -- |
| Information Technology | 730,079,623 | 504,064,876 | 226,014,747 | -- |
| Materials | 374,554,185 | 374,554,185 | -- | -- |
| Real Estate | 90,985,588 | 90,985,588 | -- | -- |
| Utilities | 26,735,642 | 26,735,642 | -- | -- |
| Money Market Funds | 117,270,801 | 117,270,801 | -- | -- |
| Total Investments in Securities: | $4,414,462,630 | $3,823,427,742 | $564,933,539 | $26,101,349 |
See accompanying notes which are an integral part of the financial statements.
Financial Statements
Statement of Assets and Liabilities
| October 31, 2018 | ||
| Assets | ||
| Investment in securities, at value (including securities loaned of $51,529,613) — See accompanying schedule: Unaffiliated issuers (cost $3,513,782,042) | $4,297,191,829 | |
| Fidelity Central Funds (cost $117,270,801) | 117,270,801 | |
| Total Investment in Securities (cost $3,631,052,843) | $4,414,462,630 | |
| Cash | 2,192 | |
| Foreign currency held at value (cost $12,042,587) | 11,979,768 | |
| Receivable for investments sold | 67,655,064 | |
| Receivable for fund shares sold | 27,032,216 | |
| Dividends receivable | 4,319,121 | |
| Distributions receivable from Fidelity Central Funds | 221,141 | |
| Prepaid expenses | 9,467 | |
| Other receivables | 2,013,803 | |
| Total assets | 4,527,695,402 | |
| Liabilities | ||
| Payable for investments purchased | $102,709,520 | |
| Payable for fund shares redeemed | 5,766,040 | |
| Accrued management fee | 2,524,440 | |
| Other affiliated payables | 750,553 | |
| Other payables and accrued expenses | 816,431 | |
| Collateral on securities loaned | 50,685,955 | |
| Total liabilities | 163,252,939 | |
| Net Assets | $4,364,442,463 | |
| Net Assets consist of: | ||
| Paid in capital | $3,851,282,396 | |
| Total distributable earnings (loss) | 513,160,067 | |
| Net Assets | $4,364,442,463 | |
| Net Asset Value and Maximum Offering Price | ||
| Emerging Markets: | ||
| Net Asset Value, offering price and redemption price per share ($3,493,583,427 ÷ 131,038,172 shares) | $26.66 | |
| Class K: | ||
| Net Asset Value, offering price and redemption price per share ($870,859,036 ÷ 32,617,794 shares) | $26.70 |
See accompanying notes which are an integral part of the financial statements.
Statement of Operations
| Year ended October 31, 2018 | ||
| Investment Income | ||
| Dividends | $93,408,401 | |
| Income from Fidelity Central Funds | 1,517,602 | |
| Income before foreign taxes withheld | 94,926,003 | |
| Less foreign taxes withheld | (9,498,462) | |
| Total income | 85,427,541 | |
| Expenses | ||
| Management fee | $35,319,356 | |
| Transfer agent fees | 8,111,400 | |
| Accounting and security lending fees | 1,574,293 | |
| Custodian fees and expenses | 1,975,496 | |
| Independent trustees' fees and expenses | 25,592 | |
| Registration fees | 188,568 | |
| Audit | 174,577 | |
| Legal | 13,856 | |
| Interest | 67,176 | |
| Miscellaneous | 33,251 | |
| Total expenses before reductions | 47,483,565 | |
| Expense reductions | (1,820,359) | |
| Total expenses after reductions | 45,663,206 | |
| Net investment income (loss) | 39,764,335 | |
| Realized and Unrealized Gain (Loss) | ||
| Net realized gain (loss) on: | ||
| Investment securities: | ||
| Unaffiliated issuers | (46,893,348) | |
| Fidelity Central Funds | 11,976 | |
| Foreign currency transactions | 639,248 | |
| Total net realized gain (loss) | (46,242,124) | |
| Change in net unrealized appreciation (depreciation) on: | ||
| Investment securities: | ||
| Unaffiliated issuers (net of decrease in deferred foreign taxes of $8,307,470) | (732,652,567) | |
| Assets and liabilities in foreign currencies | (336,190) | |
| Total change in net unrealized appreciation (depreciation) | (732,988,757) | |
| Net gain (loss) | (779,230,881) | |
| Net increase (decrease) in net assets resulting from operations | $(739,466,546) |
See accompanying notes which are an integral part of the financial statements.
Statement of Changes in Net Assets
| Year ended October 31, 2018 | Year ended October 31, 2017 | |
| Increase (Decrease) in Net Assets | ||
| Operations | ||
| Net investment income (loss) | $39,764,335 | $34,645,276 |
| Net realized gain (loss) | (46,242,124) | 212,503,902 |
| Change in net unrealized appreciation (depreciation) | (732,988,757) | 865,316,825 |
| Net increase (decrease) in net assets resulting from operations | (739,466,546) | 1,112,466,003 |
| Distributions to shareholders | (31,488,954) | – |
| Distributions to shareholders from net investment income | – | (23,974,554) |
| Total distributions | (31,488,954) | (23,974,554) |
| Share transactions - net increase (decrease) | 277,115,896 | 96,080,893 |
| Redemption fees | 97,832 | 379,582 |
| Total increase (decrease) in net assets | (493,741,772) | 1,184,951,924 |
| Net Assets | ||
| Beginning of period | 4,858,184,235 | 3,673,232,311 |
| End of period | $4,364,442,463 | $4,858,184,235 |
| Other Information | ||
| Undistributed net investment income end of period | $25,936,057 |
See accompanying notes which are an integral part of the financial statements.
Financial Highlights
Fidelity Emerging Markets Fund
| Years ended October 31, | 2018 | 2017 | 2016 | 2015 | 2014 |
| Selected Per–Share Data | |||||
| Net asset value, beginning of period | $31.37 | $24.25 | $22.55 | $25.44 | $24.43 |
| Income from Investment Operations | |||||
| Net investment income (loss)A | .24 | .22 | .14 | .19 | .17 |
| Net realized and unrealized gain (loss) | (4.76) | 7.05 | 1.66 | (2.91) | .86 |
| Total from investment operations | (4.52) | 7.27 | 1.80 | (2.72) | 1.03 |
| Distributions from net investment income | (.16) | (.15) | (.11) | (.14) | (.02) |
| Distributions from net realized gain | (.03) | – | – | (.03) | – |
| Total distributions | (.19) | (.15) | (.11) | (.17) | (.02) |
| Redemption fees added to paid in capitalA | –B | –B | .01 | –B | –B |
| Net asset value, end of period | $26.66 | $31.37 | $24.25 | $22.55 | $25.44 |
| Total ReturnC | (14.51)% | 30.21% | 8.07% | (10.76)% | 4.22% |
| Ratios to Average Net AssetsD,E | |||||
| Expenses before reductions | .96% | .97% | 1.01% | 1.05% | 1.07% |
| Expenses net of fee waivers, if any | .96% | .97% | 1.01% | 1.05% | 1.07% |
| Expenses net of all reductions | .92% | .96% | 1.00% | 1.03% | 1.07% |
| Net investment income (loss) | .75% | .83% | .61% | .78% | .71% |
| Supplemental Data | |||||
| Net assets, end of period (000 omitted) | $3,493,583 | $3,933,401 | $3,014,957 | $2,738,934 | $2,370,927 |
| Portfolio turnover rateF | 86% | 81% | 79% | 107% | 94% |
A Calculated based on average shares outstanding during the period.
B Amount represents less than $.005 per share.
C Total returns would have been lower if certain expenses had not been reduced during the applicable periods shown.
D Fees and expenses of any underlying Fidelity Central Funds are not included in the Fund's expense ratio. The Fund indirectly bears its proportionate share of the expenses of any underlying Fidelity Central Funds.
E Expense ratios reflect operating expenses of the class. Expenses before reductions do not reflect amounts reimbursed by the investment adviser or reductions from brokerage service arrangements or reductions from other expense offset arrangements and do not represent the amount paid by the class during periods when reimbursements or reductions occur. Expenses net of fee waivers reflect expenses after reimbursement by the investment adviser but prior to reductions from brokerage service arrangements or other expense offset arrangements. Expenses net of all reductions represent the net expenses paid by the class.
F Amount does not include the portfolio activity of any underlying Fidelity Central Funds.
See accompanying notes which are an integral part of the financial statements.
Fidelity Emerging Markets Fund Class K
| Years ended October 31, | 2018 | 2017 | 2016 | 2015 | 2014 |
| Selected Per–Share Data | |||||
| Net asset value, beginning of period | $31.41 | $24.28 | $22.58 | $25.48 | $24.42 |
| Income from Investment Operations | |||||
| Net investment income (loss)A | .28 | .26 | .18 | .24 | .23 |
| Net realized and unrealized gain (loss) | (4.76) | 7.06 | 1.66 | (2.92) | .86 |
| Total from investment operations | (4.48) | 7.32 | 1.84 | (2.68) | 1.09 |
| Distributions from net investment income | (.20) | (.19) | (.15) | (.20) | (.03) |
| Distributions from net realized gain | (.03) | – | – | (.03) | – |
| Total distributions | (.23) | (.19) | (.15) | (.22)B | (.03) |
| Redemption fees added to paid in capitalA | –C | –C | .01 | –C | –C |
| Net asset value, end of period | $26.70 | $31.41 | $24.28 | $22.58 | $25.48 |
| Total ReturnD | (14.39)% | 30.44% | 8.27% | (10.60)% | 4.47% |
| Ratios to Average Net AssetsE,F | |||||
| Expenses before reductions | .82% | .83% | .84% | .85% | .86% |
| Expenses net of fee waivers, if any | .82% | .82% | .84% | .85% | .85% |
| Expenses net of all reductions | .78% | .81% | .83% | .83% | .85% |
| Net investment income (loss) | .89% | .98% | .78% | .98% | .92% |
| Supplemental Data | |||||
| Net assets, end of period (000 omitted) | $870,859 | $924,783 | $658,276 | $554,041 | $623,430 |
| Portfolio turnover rateG | 86% | 81% | 79% | 107% | 94% |
A Calculated based on average shares outstanding during the period.
B Total distributions of $.22 per share is comprised of distributions from net investment income of $.195 and distributions from net realized gain of $.025 per share.
C Amount represents less than $.005 per share.
D Total returns would have been lower if certain expenses had not been reduced during the applicable periods shown.
E Fees and expenses of any underlying Fidelity Central Funds are not included in the Fund's expense ratio. The Fund indirectly bears its proportionate share of the expenses of any underlying Fidelity Central Funds.
F Expense ratios reflect operating expenses of the class. Expenses before reductions do not reflect amounts reimbursed by the investment adviser or reductions from brokerage service arrangements or reductions from other expense offset arrangements and do not represent the amount paid by the class during periods when reimbursements or reductions occur. Expenses net of fee waivers reflect expenses after reimbursement by the investment adviser but prior to reductions from brokerage service arrangements or other expense offset arrangements. Expenses net of all reductions represent the net expenses paid by the class.
G Amount does not include the portfolio activity of any underlying Fidelity Central Funds.
See accompanying notes which are an integral part of the financial statements.
Notes to Financial Statements
For the period ended October 31, 2018
1. Organization.
Fidelity Emerging Markets Fund (the Fund) is a fund of Fidelity Investment Trust (the Trust) and is authorized to issue an unlimited number of shares. The Trust is registered under the Investment Company Act of 1940, as amended (the 1940 Act), as an open-end management investment company organized as a Massachusetts business trust. The Fund offers Emerging Markets and Class K shares, each of which has equal rights as to assets and voting privileges. Each class has exclusive voting rights with respect to matters that affect that class. The Fund's investments in emerging markets can be subject to social, economic, regulatory, and political uncertainties and can be extremely volatile.
2. Investments in Fidelity Central Funds.
The Fund invests in Fidelity Central Funds, which are open-end investment companies generally available only to other investment companies and accounts managed by the investment adviser and its affiliates. The Fund's Schedule of Investments lists each of the Fidelity Central Funds held as of period end, if any, as an investment of the Fund, but does not include the underlying holdings of each Fidelity Central Fund. As an Investing Fund, the Fund indirectly bears its proportionate share of the expenses of the underlying Fidelity Central Funds.
The Money Market Central Funds seek preservation of capital and current income and are managed by Fidelity Investments Money Management, Inc. (FIMM), an affiliate of the investment adviser. Annualized expenses of the Money Market Central Funds as of their most recent shareholder report date are less than .005%.
A complete unaudited list of holdings for each Fidelity Central Fund is available upon request or at the Securities and Exchange Commission (the SEC) website at www.sec.gov. In addition, the financial statements of the Fidelity Central Funds, which are not covered by the Fund's Report of Independent Registered Public Accounting Firm, are available on the SEC website or upon request.
3. Significant Accounting Policies.
The Fund is an investment company and applies the accounting and reporting guidance of the Financial Accounting Standards Board (FASB) Accounting Standards Codification Topic 946 Financial Services – Investments Companies. The financial statements have been prepared in conformity with accounting principles generally accepted in the United States of America (GAAP), which require management to make certain estimates and assumptions at the date of the financial statements. Actual results could differ from those estimates. Subsequent events, if any, through the date that the financial statements were issued have been evaluated in the preparation of the financial statements. The following summarizes the significant accounting policies of the Fund:
Investment Valuation. Investments are valued as of 4:00 p.m. Eastern time on the last calendar day of the period. The Board of Trustees (the Board) has delegated the day to day responsibility for the valuation of the Fund's investments to the Fair Value Committee (the Committee) established by the Fund's investment adviser. In accordance with valuation policies and procedures approved by the Board, the Fund attempts to obtain prices from one or more third party pricing vendors or brokers to value its investments. When current market prices, quotations or currency exchange rates are not readily available or reliable, investments will be fair valued in good faith by the Committee, in accordance with procedures adopted by the Board. Factors used in determining fair value vary by investment type and may include market or investment specific events. The frequency with which these procedures are used cannot be predicted and they may be utilized to a significant extent. The Committee oversees the Fund's valuation policies and procedures and reports to the Board on the Committee's activities and fair value determinations. The Board monitors the appropriateness of the procedures used in valuing the Fund's investments and ratifies the fair value determinations of the Committee.
The Fund categorizes the inputs to valuation techniques used to value its investments into a disclosure hierarchy consisting of three levels as shown below:
- Level 1 – quoted prices in active markets for identical investments
- Level 2 – other significant observable inputs (including quoted prices for similar investments, interest rates, prepayment speeds, etc.)
- Level 3 – unobservable inputs (including the Fund's own assumptions based on the best information available)
Valuation techniques used to value the Fund's investments by major category are as follows:
Equity securities, including restricted securities, for which market quotations are readily available, are valued at the last reported sale price or official closing price as reported by a third party pricing vendor on the primary market or exchange on which they are traded and are categorized as Level 1 in the hierarchy. In the event there were no sales during the day or closing prices are not available, securities are valued at the last quoted bid price or may be valued using the last available price and are generally categorized as Level 2 in the hierarchy. For foreign equity securities, when market or security specific events arise, comparisons to the valuation of American Depositary Receipts (ADRs), futures contracts, Exchange-Traded Funds (ETFs) and certain indexes as well as quoted prices for similar securities may be used and would be categorized as Level 2 in the hierarchy. Utilizing these techniques may result in transfers between Level 1 and Level 2. For equity securities, including restricted securities, where observable inputs are limited, assumptions about market activity and risk are used and these securities may be categorized as Level 3 in the hierarchy. Equity securities, including restricted securities, for which observable inputs are not available are valued using alternate valuation approaches, including the market approach and the income approach and are categorized as Level 3 in the hierarchy.
Investments in open-end mutual funds, including the Fidelity Central Funds, are valued at their closing net asset value (NAV) each business day and are categorized as Level 1 in the hierarchy.
Changes in valuation techniques may result in transfers in or out of an assigned level within the disclosure hierarchy. The aggregate value of investments by input level as of October 31, 2018 is included at the end of the Fund's Schedule of Investments.
Foreign Currency. The Fund may use foreign currency contracts to facilitate transactions in foreign-denominated securities. Gains and losses from these transactions may arise from changes in the value of the foreign currency or if the counterparties do not perform under the contracts' terms.
Foreign-denominated assets, including investment securities, and liabilities are translated into U.S. dollars at the exchange rates at period end. Purchases and sales of investment securities, income and dividends received and expenses denominated in foreign currencies are translated into U.S. dollars at the exchange rate in effect on the transaction date.
The effects of exchange rate fluctuations on investments are included with the net realized and unrealized gain (loss) on investment securities. Other foreign currency transactions resulting in realized and unrealized gain (loss) are disclosed separately.
Investment Transactions and Income. For financial reporting purposes, the Fund's investment holdings and NAV include trades executed through the end of the last business day of the period. The NAV per share for processing shareholder transactions is calculated as of the close of business of the New York Stock Exchange (NYSE), normally 4:00 p.m. Eastern time and includes trades executed through the end of the prior business day. Gains and losses on securities sold are determined on the basis of identified cost and include proceeds received from litigation. Dividend income is recorded on the ex-dividend date, except for certain dividends from foreign securities where the ex-dividend date may have passed, which are recorded as soon as the Fund is informed of the ex-dividend date. Non-cash dividends included in dividend income, if any, are recorded at the fair market value of the securities received. Income and capital gain distributions from Fidelity Central Funds, if any, are recorded on the ex-dividend date. Certain distributions received by the Fund represent a return of capital or capital gain. The Fund determines the components of these distributions subsequent to the ex-dividend date, based upon receipt of tax filings or other correspondence relating to the underlying investment. These distributions are recorded as a reduction of cost of investments and/or as a realized gain. Investment income is recorded net of foreign taxes withheld where recovery of such taxes is uncertain.
Class Allocations and Expenses. Investment income, realized and unrealized capital gains and losses, common expenses of the Fund, and certain fund-level expense reductions, if any, are allocated daily on a pro-rata basis to each class based on the relative net assets of each class to the total net assets of the Fund. Each class differs with respect to transfer agent fees incurred. Certain expense reductions may also differ by class. For the reporting period, the allocated portion of income and expenses to each class as a percent of its average net assets may vary due to the timing of recording these transactions in relation to fluctuating net assets of the classes. Expenses directly attributable to a fund are charged to that fund. Expenses attributable to more than one fund are allocated among the respective funds on the basis of relative net assets or other appropriate methods. Expense estimates are accrued in the period to which they relate and adjustments are made when actual amounts are known.
Income Tax Information and Distributions to Shareholders. Each year, the Fund intends to qualify as a regulated investment company under Subchapter M of the Internal Revenue Code, including distributing substantially all of its taxable income and realized gains. As a result, no provision for U.S. Federal income taxes is required. As of October 31, 2018, the Fund did not have any unrecognized tax benefits in the financial statements; nor is the Fund aware of any tax positions for which it is reasonably possible that the total amounts of unrecognized tax benefits will significantly change in the next twelve months. The Fund files a U.S. federal tax return, in addition to state and local tax returns as required. The Fund's federal income tax returns are subject to examination by the Internal Revenue Service (IRS) for a period of three fiscal years after they are filed. State and local tax returns may be subject to examination for an additional fiscal year depending on the jurisdiction. Foreign taxes are provided for based on the Fund's understanding of the tax rules and rates that exist in the foreign markets in which it invests.
Distributions are declared and recorded on the ex-dividend date. Income and capital gain distributions are declared separately for each class. Income and capital gain distributions are determined in accordance with income tax regulations, which may differ from GAAP. In addition, the Fund claimed a portion of the payment made to redeeming shareholders as a distribution for income tax purposes.
Capital accounts within the financial statements are adjusted for permanent book-tax differences. These adjustments have no impact on net assets or the results of operations. Capital accounts are not adjusted for temporary book-tax differences which will reverse in a subsequent period.
Book-tax differences are primarily due to foreign currency transactions, passive foreign investments companies (PFIC), capital loss carryforwards, deferred trustees compensation and losses deferred due to wash sales.
As of period end, the cost and unrealized appreciation (depreciation) in securities, and derivatives if applicable, for federal income tax purposes were as follows:
| Gross unrealized appreciation | $965,821,208 |
| Gross unrealized depreciation | (202,039,818) |
| Net unrealized appreciation (depreciation) | $763,781,390 |
| Tax Cost | $3,650,681,240 |
The tax-based components of distributable earnings as of period end were as follows:
| Undistributed ordinary income | $33,270,963 |
| Capital loss carryforward | $(283,030,927) |
| Net unrealized appreciation (depreciation) on securities and other investments | $762,920,030 |
Capital loss carryforwards are only available to offset future capital gains of the Fund to the extent provided by regulations and may be limited. Under the Regulated Investment Company Modernization Act of 2010 (the Act), the Fund is permitted to carry forward capital losses incurred in taxable years beginning after December 22, 2010 for an unlimited period and such capital losses are required to be used prior to any losses that expire. The capital loss carryforward information presented below, including any applicable limitation, is estimated as of fiscal period end and is subject to adjustment.
| No expiration | |
| Short-term | $(283,030,927) |
The tax character of distributions paid was as follows:
| October 31, 2018 | October 31, 2017 | |
| Ordinary Income | $31,488,954 | $ 23,974,554 |
Short-Term Trading (Redemption) Fees. Shares held by investors in the Fund less than 90 days may have been subject to a redemption fee equal to 1.50% of the NAV of shares redeemed. All redemption fees, which reduce the proceeds of the shareholder redemption, are retained by the Fund and accounted for as an addition to paid in capital. In November 2017, the Board of Trustees approved the elimination of these redemption fees effective December 18, 2017.
New Rule Issuance. During August 2018, the U.S. Securities and Exchange Commission issued Final Rule Release No. 33-10532, Disclosure Update and Simplification. This Final Rule includes amendments specific to registered investment companies that are intended to eliminate overlap in disclosure requirements between Regulation S-X and GAAP. In accordance with these amendments, certain line-items in the Fund's financial statements have been combined or removed for the current period as outlined in the table below.
| Financial Statement | Current Line-Item Presentation | Prior Line-Item Presentation |
| Statement of Assets and Liabilities | Total distributable earnings (loss) | Undistributed/Distributions in excess of/Accumulated net investment income (loss) Accumulated/Undistributed net realized gain (loss) Net unrealized appreciation (depreciation) |
| Statement of Changes in Net Assets | N/A - removed | Undistributed/Distributions in excess of/Accumulated net investment income (loss) end of period |
| Statement of Changes in Net Assets | Distributions to shareholders | Distributions to shareholders from net investment income Distributions to shareholders from net realized gain |
| Distributions to Shareholders Note to Financial Statements | Distributions to shareholders | Distributions to shareholders from net investment income Distributions to shareholders from net realized gain |
4. Purchases and Sales of Investments.
Purchases and sales of securities, other than short-term securities, aggregated $4,656,310,271 and $4,329,509,065, respectively.
5. Fees and Other Transactions with Affiliates.
Management Fee. Fidelity Management & Research Company (the investment adviser) and its affiliates provide the Fund with investment management related services for which the Fund pays a monthly management fee. The management fee is the sum of an individual fund fee rate that is based on an annual rate of .45% of the Fund's average net assets and an annualized group fee rate that averaged .24% during the period. The group fee rate is based upon the average net assets of all the mutual funds advised by the investment adviser, including any mutual funds previously advised by the investment adviser that are currently advised by Fidelity SelectCo, LLC, an affiliate of the investment adviser. The group fee rate decreases as assets under management increase and increases as assets under management decrease. For the reporting period, the total annual management fee rate was .69% of the Fund's average net assets.
Transfer Agent Fees. Fidelity Investments Institutional Operations Company, Inc., (FIIOC), an affiliate of the investment adviser, is the transfer, dividend disbursing and shareholder servicing agent for each class of the Fund. FIIOC receives account fees and asset-based fees that vary according to the account size and type of account of the shareholders of Emerging Markets, except for Class K. FIIOC receives an asset-based fee of Class K's average net assets. FIIOC pays for typesetting, printing and mailing of shareholder reports, except proxy statements.
For the period, transfer agent fees for each class were as follows:
| Amount | % of Class-Level Average Net Assets | |
| Emerging Markets | $7,663,973 | .19 |
| Class K | 447,427 | .05 |
| $8,111,400 |
Accounting and Security Lending Fees. Fidelity Service Company, Inc. (FSC), an affiliate of the investment adviser, maintains the Fund's accounting records. The accounting fee is based on the level of average net assets for each month. Under a separate contract, FSC administers the security lending program. The security lending fee is based on the number and duration of lending transactions. For the period, the fees were equivalent to an annual rate of .03%.
Brokerage Commissions. The Fund placed a portion of its portfolio transactions with brokerage firms which are affiliates of the investment adviser. Brokerage commissions are included in net realized gain (loss) and change in net unrealized appreciation (depreciation) in the Statement of Operations. The commissions paid to these affiliated firms were $25,480 for the period.
Interfund Lending Program. Pursuant to an Exemptive Order issued by the SEC, the Fund, along with other registered investment companies having management contracts with Fidelity Management & Research Company (FMR) or other affiliated entities of FMR, may participate in an interfund lending program. This program provides an alternative credit facility allowing the funds to borrow from, or lend money to, other participating affiliated funds. At period end, there were no interfund loans outstanding. The Fund's activity in this program during the period for which loans were outstanding was as follows:
| Borrower or Lender | Average Loan Balance | Weighted Average Interest Rate | Interest Expense |
| Borrower | $31,180,000 | 1.74% | $54,365 |
Interfund Trades. The Fund may purchase from or sell securities to other Fidelity Funds under procedures adopted by the Board. The procedures have been designed to ensure these interfund trades are executed in accordance with Rule 17a-7 of the 1940 Act. Interfund trades are included within the respective purchases and sales amounts shown in the Purchases and Sales of Investments note.
Other. During the period, the investment adviser reimbursed the Fund for certain losses in the amount of $12,988.
6. Committed Line of Credit.
The Fund participates with other funds managed by the investment adviser or an affiliate in a $4.25 billion credit facility (the "line of credit") to be utilized for temporary or emergency purposes to fund shareholder redemptions or for other short-term liquidity purposes. The Fund has agreed to pay commitment fees on its pro-rata portion of the line of credit, which amounted to $14,093 and is reflected in Miscellaneous expenses on the Statement of Operations. During the period, the Fund did not borrow on this line of credit.
7. Security Lending.
The Fund lends portfolio securities through a lending agent from time to time in order to earn additional income. For equity securities, a lending agent is used and may loan securities to certain qualified borrowers, including Fidelity Capital Markets (FCM), a broker-dealer affiliated with the Fund. On the settlement date of the loan, the Fund receives collateral (in the form of U.S. Treasury obligations, letters of credit and/or cash) against the loaned securities and maintains collateral in an amount not less than 100% of the market value of the loaned securities during the period of the loan. The market value of the loaned securities is determined at the close of business of the Fund and any additional required collateral is delivered to the Fund on the next business day. The Fund or borrower may terminate the loan at any time, and if the borrower defaults on its obligation to return the securities loaned because of insolvency or other reasons, the Fund may apply collateral received from the borrower against the obligation. The Fund may experience delays and costs in recovering the securities loaned. Any cash collateral received is invested in the Fidelity Securities Lending Cash Central Fund. The value of loaned securities and cash collateral at period end are disclosed on the Fund's Statement of Assets and Liabilities. The value of securities loaned to FCM at period end was $4,039,282. Security lending income represents the income earned on investing cash collateral, less rebates paid to borrowers and any lending agent fees associated with the loan, plus any premium payments received for lending certain types of securities. Security lending income is presented in the Statement of Operations as a component of income from Fidelity Central Funds. Total security lending income during the period amounted to $406,557, including $10,939 from securities loaned to FCM.
8. Bank Borrowings.
The Fund is permitted to have bank borrowings for temporary or emergency purposes to fund shareholder redemptions or for other short-term liquidity requirements. The Fund has established borrowing arrangements with certain banks. The interest rate on the borrowings is the bank's base rate, as revised from time to time. The average loan balance during the period for which loans were outstanding amounted to $48,041,600. The weighted average interest rate was 1.92%. The interest expense amounted to $12,811 under the bank borrowing program. At period end, there were no bank borrowings outstanding.
9. Expense Reductions.
Commissions paid to certain brokers with whom the investment adviser, or its affiliates, places trades on behalf of the Fund include an amount in addition to trade execution, which may be rebated back to the Fund to offset certain expenses. This amount totaled $1,759,743 for the period. In addition, through arrangements with the Fund's custodian, credits realized as a result of certain uninvested cash balances were used to reduce the Fund's expenses. During the period, these credits reduced the Fund's custody expenses by $9,179.
In addition, during the period the investment adviser reimbursed and/or waived a portion of fund-level operating expenses in the amount of $51,437.
10. Distributions to Shareholders.
Distributions to shareholders of each class were as follows:
| Year ended October 31, 2018 | Year ended October 31, 2017 | |
| Distributions to shareholders | ||
| Emerging Markets | $24,827,626 | $– |
| Class K | 6,661,328 | – |
| Total | $31,488,954 | $– |
| From net investment income | ||
| Emerging Markets | $– | $18,744,412 |
| Class K | – | 5,230,142 |
| Total | $– | $23,974,554 |
11. Share Transactions.
Share transactions for each class were as follows and may contain automatic conversions between classes or exchanges between affiliated funds:
| Shares | Shares | Dollars | Dollars | |
| Year ended October 31, 2018 | Year ended October 31, 2017 | Year ended October 31, 2018 | Year ended October 31, 2017 | |
| Emerging Markets | ||||
| Shares sold | 49,869,535 | 35,833,343 | $1,579,168,818 | $958,972,147 |
| Reinvestment of distributions | 746,970 | 790,787 | 23,634,137 | 17,864,538 |
| Shares redeemed | (44,964,469) | (35,588,763) | (1,422,584,142) | (943,601,756) |
| Net increase (decrease) | 5,652,036 | 1,035,367 | $180,218,813 | $33,234,929 |
| Class K | ||||
| Shares sold | 12,153,123 | 9,726,562 | $380,393,513 | $257,288,456 |
| Reinvestment of distributions | 210,535 | 231,437 | 6,661,328 | 5,230,142 |
| Shares redeemed | (9,189,434) | (7,627,038) | (290,157,758) | (199,672,634) |
| Net increase (decrease) | 3,174,224 | 2,330,961 | $96,897,083 | $62,845,964 |
12. Other.
The Fund's organizational documents provide former and current trustees and officers with a limited indemnification against liabilities arising in connection with the performance of their duties to the Fund. In the normal course of business, the Fund may also enter into contracts that provide general indemnifications. The Fund's maximum exposure under these arrangements is unknown as this would be dependent on future claims that may be made against the Fund. The risk of material loss from such claims is considered remote.
Report of Independent Registered Public Accounting Firm
To the Board of Trustees of Fidelity Investment Trust and Shareholders of Fidelity Emerging Markets Fund:
Opinion on the Financial Statements
We have audited the accompanying statement of assets and liabilities, including the schedule of investments, of Fidelity Emerging Markets Fund (one of the funds constituting Fidelity Investment Trust, referred to hereafter as the "Fund") as of October 31, 2018, the related statement of operations for the year ended October 31, 2018, the statement of changes in net assets for each of the two years in the period ended October 31, 2018, including the related notes, and the financial highlights for each of the periods indicated therein (collectively referred to as the “financial statements”). In our opinion, the financial statements present fairly, in all material respects, the financial position of the Fund as of October 31, 2018, the results of its operations for the year then ended, the changes in its net assets for each of the two years in the period ended October 31, 2018 and the financial highlights for each of the periods indicated therein in conformity with accounting principles generally accepted in the United States of America.
Basis for Opinion
These financial statements are the responsibility of the Fund’s management. Our responsibility is to express an opinion on the Fund’s financial statements based on our audits. We are a public accounting firm registered with the Public Company Accounting Oversight Board (United States) (“PCAOB”) and are required to be independent with respect to the Fund in accordance with the U.S. federal securities laws and the applicable rules and regulations of the Securities and Exchange Commission and the PCAOB.
We conducted our audits of these financial statements in accordance with the standards of the PCAOB. Those standards require that we plan and perform the audit to obtain reasonable assurance about whether the financial statements are free of material misstatement, whether due to error or fraud.
Our audits included performing procedures to assess the risks of material misstatement of the financial statements, whether due to error or fraud, and performing procedures that respond to those risks. Such procedures included examining, on a test basis, evidence regarding the amounts and disclosures in the financial statements. Our audits also included evaluating the accounting principles used and significant estimates made by management, as well as evaluating the overall presentation of the financial statements. Our procedures included confirmation of securities owned as of October 31, 2018 by correspondence with the custodian and brokers; when replies were not received from brokers, we performed other auditing procedures. We believe that our audits provide a reasonable basis for our opinion.
PricewaterhouseCoopers LLP
Boston, Massachusetts
December 14, 2018
We have served as the auditor of one or more investment companies in the Fidelity group of funds since 1932.
Trustees and Officers
The Trustees, Members of the Advisory Board (if any), and officers of the trust and fund, as applicable, are listed below. The Board of Trustees governs the fund and is responsible for protecting the interests of shareholders. The Trustees are experienced executives who meet periodically throughout the year to oversee the fund's activities, review contractual arrangements with companies that provide services to the fund, oversee management of the risks associated with such activities and contractual arrangements, and review the fund's performance. Except for Jonathan Chiel, each of the Trustees oversees 283 funds. Mr. Chiel oversees 154 funds.
The Trustees hold office without limit in time except that (a) any Trustee may resign; (b) any Trustee may be removed by written instrument, signed by at least two-thirds of the number of Trustees prior to such removal; (c) any Trustee who requests to be retired or who has become incapacitated by illness or injury may be retired by written instrument signed by a majority of the other Trustees; and (d) any Trustee may be removed at any special meeting of shareholders by a two-thirds vote of the outstanding voting securities of the trust. Each Trustee who is not an interested person (as defined in the 1940 Act) of the trust and the fund is referred to herein as an Independent Trustee. Each Independent Trustee shall retire not later than the last day of the calendar year in which his or her 75th birthday occurs. The Independent Trustees may waive this mandatory retirement age policy with respect to individual Trustees. Officers and Advisory Board Members hold office without limit in time, except that any officer or Advisory Board Member may resign or may be removed by a vote of a majority of the Trustees at any regular meeting or any special meeting of the Trustees. Except as indicated, each individual has held the office shown or other offices in the same company for the past five years.
The fund’s Statement of Additional Information (SAI) includes more information about the Trustees. To request a free copy, call Fidelity at 1-877-208-0098.
Experience, Skills, Attributes, and Qualifications of the Trustees. The Governance and Nominating Committee has adopted a statement of policy that describes the experience, qualifications, attributes, and skills that are necessary and desirable for potential Independent Trustee candidates (Statement of Policy). The Board believes that each Trustee satisfied at the time he or she was initially elected or appointed a Trustee, and continues to satisfy, the standards contemplated by the Statement of Policy. The Governance and Nominating Committee also engages professional search firms to help identify potential Independent Trustee candidates who have the experience, qualifications, attributes, and skills consistent with the Statement of Policy. From time to time, additional criteria based on the composition and skills of the current Independent Trustees, as well as experience or skills that may be appropriate in light of future changes to board composition, business conditions, and regulatory or other developments, have also been considered by the professional search firms and the Governance and Nominating Committee. In addition, the Board takes into account the Trustees' commitment and participation in Board and committee meetings, as well as their leadership of standing and ad hoc committees throughout their tenure.
In determining that a particular Trustee was and continues to be qualified to serve as a Trustee, the Board has considered a variety of criteria, none of which, in isolation, was controlling. The Board believes that, collectively, the Trustees have balanced and diverse experience, qualifications, attributes, and skills, which allow the Board to operate effectively in governing the fund and protecting the interests of shareholders. Information about the specific experience, skills, attributes, and qualifications of each Trustee, which in each case led to the Board's conclusion that the Trustee should serve (or continue to serve) as a trustee of the fund, is provided below.
Board Structure and Oversight Function. James C. Curvey is an interested person and currently serves as Chairman. The Trustees have determined that an interested Chairman is appropriate and benefits shareholders because an interested Chairman has a personal and professional stake in the quality and continuity of services provided to the fund. Independent Trustees exercise their informed business judgment to appoint an individual of their choosing to serve as Chairman, regardless of whether the Trustee happens to be independent or a member of management. The Independent Trustees have determined that they can act independently and effectively without having an Independent Trustee serve as Chairman and that a key structural component for assuring that they are in a position to do so is for the Independent Trustees to constitute a substantial majority for the Board. The Independent Trustees also regularly meet in executive session. Ned C. Lautenbach serves as Chairman of the Independent Trustees and as such (i) acts as a liaison between the Independent Trustees and management with respect to matters important to the Independent Trustees and (ii) with management prepares agendas for Board meetings.
Fidelity® funds are overseen by different Boards of Trustees. The fund's Board oversees Fidelity's high income and certain equity funds, and other Boards oversee Fidelity's investment-grade bond, money market, asset allocation, and other equity funds. The asset allocation funds may invest in Fidelity® funds overseen by the fund's Board. The use of separate Boards, each with its own committee structure, allows the Trustees of each group of Fidelity® funds to focus on the unique issues of the funds they oversee, including common research, investment, and operational issues. On occasion, the separate Boards establish joint committees to address issues of overlapping consequences for the Fidelity® funds overseen by each Board.
The Trustees operate using a system of committees to facilitate the timely and efficient consideration of all matters of importance to the Trustees, the fund, and fund shareholders and to facilitate compliance with legal and regulatory requirements and oversight of the fund's activities and associated risks. The Board, acting through its committees, has charged FMR and its affiliates with (i) identifying events or circumstances the occurrence of which could have demonstrably adverse effects on the fund's business and/or reputation; (ii) implementing processes and controls to lessen the possibility that such events or circumstances occur or to mitigate the effects of such events or circumstances if they do occur; and (iii) creating and maintaining a system designed to evaluate continuously business and market conditions in order to facilitate the identification and implementation processes described in (i) and (ii) above. Because the day-to-day operations and activities of the fund are carried out by or through FMR, its affiliates, and other service providers, the fund's exposure to risks is mitigated but not eliminated by the processes overseen by the Trustees. While each of the Board's committees has responsibility for overseeing different aspects of the fund's activities, oversight is exercised primarily through the Operations, Audit, and Compliance Committees. In addition, the Independent Trustees have worked with Fidelity to enhance the Board's oversight of investment and financial risks, legal and regulatory risks, technology risks, and operational risks, including the development of additional risk reporting to the Board. Appropriate personnel, including but not limited to the fund's Chief Compliance Officer (CCO), FMR's internal auditor, the independent accountants, the fund's Treasurer and portfolio management personnel, make periodic reports to the Board's committees, as appropriate, including an annual review of Fidelity's risk management program for the Fidelity® funds. The responsibilities of each standing committee, including their oversight responsibilities, are described further under "Standing Committees of the Trustees."
Interested Trustees*:
Correspondence intended for a Trustee who is an interested person may be sent to Fidelity Investments, 245 Summer Street, Boston, Massachusetts 02210.
Name, Year of Birth; Principal Occupations and Other Relevant Experience+
Jonathan Chiel (1957)
Year of Election or Appointment: 2016
Trustee
Mr. Chiel also serves as Trustee of other Fidelity® funds. Mr. Chiel is Executive Vice President and General Counsel for FMR LLC (diversified financial services company, 2012-present). Previously, Mr. Chiel served as general counsel (2004-2012) and senior vice president and deputy general counsel (2000-2004) for John Hancock Financial Services; a partner with Choate, Hall & Stewart (1996-2000) (law firm); and an Assistant United States Attorney for the United States Attorney’s Office of the District of Massachusetts (1986-95), including Chief of the Criminal Division (1993-1995). Mr. Chiel is a director on the boards of the Boston Bar Foundation and the Maimonides School.
James C. Curvey (1935)
Year of Election or Appointment: 2007
Trustee
Chairman of the Board of Trustees
Mr. Curvey also serves as Trustee of other Fidelity® funds. Mr. Curvey is Vice Chairman (2007-present) and Director of FMR LLC (diversified financial services company). In addition, Mr. Curvey is an Overseer Emeritus for the Boston Symphony Orchestra, a Director of Artis-Naples, and a Trustee of Brewster Academy in Wolfeboro, New Hampshire. Previously, Mr. Curvey served as a Director of Fidelity Research & Analysis Co. (investment adviser firm, 2009-2018), Director of Fidelity Investments Money Management, Inc. (investment adviser firm, 2009-2014) and a Director of FMR and FMR Co., Inc. (investment adviser firms, 2007-2014).
Charles S. Morrison (1960)
Year of Election or Appointment: 2014
Trustee
Mr. Morrison also serves as Trustee of other funds. He serves as President of Fidelity SelectCo, LLC (investment adviser firm, 2017-present) and Fidelity Management & Research Company (FMR) (investment adviser firm, 2016-present), a Director of Fidelity Investments Money Management, Inc. (FIMM) (investment adviser firm, 2014-present), Director of Fidelity SelectCo, LLC (investment adviser firm, 2014-present), President, Asset Management (2014-present), and is an employee of Fidelity Investments. Previously, Mr. Morrison served as Vice President of Fidelity's Fixed Income and Asset Allocation Funds (2012-2014), President, Fixed Income (2011-2014), Vice President of Fidelity's Money Market Funds (2005-2009), President, Money Market Group Leader of FMR (investment adviser firm, 2009), and Senior Vice President, Money Market Group of FMR (2004-2009). Mr. Morrison also served as Vice President of Fidelity's Bond Funds (2002-2005), certain Balanced Funds (2002-2005), and certain Asset Allocation Funds (2002-2007), and as Senior Vice President (2002-2005) of Fidelity's Bond Division.
* Determined to be an “Interested Trustee” by virtue of, among other things, his or her affiliation with the trust or various entities under common control with FMR.
+ The information includes the Trustee's principal occupation during the last five years and other information relating to the experience, attributes, and skills relevant to the Trustee's qualifications to serve as a Trustee, which led to the conclusion that the Trustee should serve as a Trustee for the fund.
Independent Trustees:
Correspondence intended for an Independent Trustee may be sent to Fidelity Investments, P.O. Box 55235, Boston, Massachusetts 02205-5235.
Name, Year of Birth; Principal Occupations and Other Relevant Experience+
Dennis J. Dirks (1948)
Year of Election or Appointment: 2005
Trustee
Mr. Dirks also serves as Trustee of other Fidelity® funds. Prior to his retirement in May 2003, Mr. Dirks was Chief Operating Officer and a member of the Board of The Depository Trust & Clearing Corporation (DTCC). He also served as President, Chief Operating Officer, and Board member of The Depository Trust Company (DTC) and President and Board member of the National Securities Clearing Corporation (NSCC). In addition, Mr. Dirks served as Chief Executive Officer and Board member of the Government Securities Clearing Corporation, Chief Executive Officer and Board member of the Mortgage-Backed Securities Clearing Corporation, as a Trustee and a member of the Finance Committee of Manhattan College (2005-2008), as a Trustee and a member of the Finance Committee of AHRC of Nassau County (2006-2008), as a member of the Independent Directors Council (IDC) Governing Council (2010-2015), and as a member of the Board of Directors for The Brookville Center for Children’s Services, Inc. (2009-2017). Mr. Dirks is a member of the Finance Committee (2016-present), Board of Directors (2017-present) and Board of Trustees (2018-present) and is Treasurer (2018-present) of the Asolo Repertory Theatre.
Donald F. Donahue (1950)
Year of Election or Appointment: 2018
Trustee
Mr. Donahue also serves as a Trustee of other Fidelity® funds. Mr. Donahue is President and Chief Executive Officer of Miranda Partners, LLC (risk consulting for the financial services industry, 2012-present). Previously, Mr. Donahue served as a Member of the Advisory Board of certain Fidelity® funds (2015-2018) and Chief Executive Officer (2006-2012), Chief Operating Officer (2003-2006), and Managing Director, Customer Marketing and Development (1999-2003) of The Depository Trust & Clearing Corporation (financial markets infrastructure). Mr. Donahue serves as a Member (2007-present) and Co-Chairman (2016-present) of the Board of Directors of United Way of New York, Member of the Board of Directors of NYC Leadership Academy (2012-present) and Member of the Board of Advisors of Ripple Labs, Inc. (financial services, 2015-present). He also served as Chairman (2010-2012) and Member of the Board of Directors (2012-2013) of Omgeo, LLC (financial services), Treasurer of United Way of New York (2012-2016), and Member of the Board of Directors of XBRL US (financial services non-profit, 2009-2012) and the International Securities Services Association (2009-2012).
Alan J. Lacy (1953)
Year of Election or Appointment: 2008
Trustee
Mr. Lacy also serves as Trustee of other Fidelity® funds. Mr. Lacy serves as a Director of Bristol-Myers Squibb Company (global pharmaceuticals, 2008-present). He is a Trustee of the California Chapter of The Nature Conservancy (2015-present) and a Director of the Center for Advanced Study in the Behavioral Sciences at Stanford University (2015-present). In addition, Mr. Lacy served as Senior Adviser (2007-2014) of Oak Hill Capital Partners, L.P. (private equity) and also served as Chief Executive Officer (2005) and Vice Chairman (2005-2006) of Sears Holdings Corporation (retail) and Chief Executive Officer and Chairman of the Board of Sears, Roebuck and Co. (retail, 2000-2005). Previously, Mr. Lacy served as Chairman (2014-2017) and a member (2010-2017) of the Board of Directors of Dave & Buster’s Entertainment, Inc. (restaurant and entertainment complexes), as Chairman (2008-2011) and a member (2006-2015) of the Board of Trustees of the National Parks Conservation Association, and as a member of the Board of Directors for The Hillman Companies, Inc. (hardware wholesalers, 2010-2014), Earth Fare, Inc. (retail grocery, 2010-2014), and The Western Union Company (global money transfer, 2006-2011).
Ned C. Lautenbach (1944)
Year of Election or Appointment: 2000
Trustee
Chairman of the Independent Trustees
Mr. Lautenbach also serves as Trustee of other Fidelity® funds. Mr. Lautenbach currently serves as Vice Chair of the Board of Governors, State University System of Florida (2013-present) and is a member of the Council on Foreign Relations (1994-present). He is also a member and has most recently served as Chairman of the Board of Directors of Artis-Naples (2012-present). Previously, Mr. Lautenbach served as a member and then Lead Director of the Board of Directors of Eaton Corporation (diversified industrial, 1997-2016). He was also a Partner and Advisory Partner at Clayton, Dubilier & Rice, LLC (private equity investment, 1998-2010), as well as a Director of Sony Corporation (2006-2007). In addition, Mr. Lautenbach also had a 30-year career with IBM (technology company) during which time he served as Senior Vice President and a member of the Corporate Executive Committee (1968-1998).
Joseph Mauriello (1944)
Year of Election or Appointment: 2008
Trustee
Mr. Mauriello also serves as Trustee of other Fidelity® funds. Prior to his retirement in January 2006, Mr. Mauriello served in numerous senior management positions including Deputy Chairman and Chief Operating Officer (2004-2005), and Vice Chairman of Financial Services (2002-2004) of KPMG LLP US (professional services, 1965-2005). Mr. Mauriello currently serves as a member of the Independent Directors Council (IDC) Governing Council (2015-present). Previously, Mr. Mauriello served as a member of the Board of Directors of XL Group plc. (global insurance and re-insurance, 2006-2018).
Cornelia M. Small (1944)
Year of Election or Appointment: 2005
Trustee
Ms. Small also serves as Trustee of other Fidelity® funds. Ms. Small is a member of the Board of Directors (2009-present) and Chair of the Investment Committee (2010-present) of the Teagle Foundation. Ms. Small also serves on the Investment Committee of the Berkshire Taconic Community Foundation (2008-present). Previously, Ms. Small served as Chairperson (2002-2008) and a member of the Investment Committee and Chairperson (2008-2012) and a member of the Board of Trustees of Smith College. In addition, Ms. Small served as Chief Investment Officer, Director of Global Equity Investments, and a member of the Board of Directors of Scudder, Stevens & Clark and Scudder Kemper Investments.
Garnett A. Smith (1947)
Year of Election or Appointment: 2018
Trustee
Mr. Smith also serves as Trustee of other Fidelity® funds. Prior to Mr. Smith's retirement, he served as Chairman and Chief Executive Officer of Inbrand Corp. (manufacturer of personal absorbent products, 1990-1997). He also served as President (1986-1990) of Inbrand Corp. Prior to his employment with Inbrand Corp., he was employed by a retail fabric chain and North Carolina National Bank. In addition, Mr. Smith served as a Member of the Advisory Board of certain Fidelity® funds (2012-2013) and as a board member of the Jackson Hole Land Trust (2009-2012).
David M. Thomas (1949)
Year of Election or Appointment: 2008
Trustee
Mr. Thomas also serves as Trustee of other Fidelity® funds. Mr. Thomas serves as Non-Executive Chairman of the Board of Directors of Fortune Brands Home and Security (home and security products, 2011-present), as a member of the Board of Directors (2004-present) and Presiding Director (2013-present) of Interpublic Group of Companies, Inc. (marketing communication), and as a member of the Board of Trustees of the University of Florida (2013-present). Previously, Mr. Thomas served as Executive Chairman (2005-2006) and Chairman and Chief Executive Officer (2000-2005) of IMS Health, Inc. (pharmaceutical and healthcare information solutions), and a Director of Fortune Brands, Inc. (consumer products, 2000-2011).
+ The information includes the Trustee's principal occupation during the last five years and other information relating to the experience, attributes, and skills relevant to the Trustee's qualifications to serve as a Trustee, which led to the conclusion that the Trustee should serve as a Trustee for the fund.
Advisory Board Members and Officers:
Correspondence intended for a Member of the Advisory Board (if any) may be sent to Fidelity Investments, P.O. Box 55235, Boston, Massachusetts 02205-5235. Correspondence intended for an officer or Peter S. Lynch may be sent to Fidelity Investments, 245 Summer Street, Boston, Massachusetts 02210. Officers appear below in alphabetical order.
Name, Year of Birth; Principal Occupation
Vicki L. Fuller (1957)
Year of Election or Appointment: 2018
Member of the Advisory Board
Ms. Fuller also serves as Member of the Advisory Board of other Fidelity® funds. Ms. Fuller serves as a member of the Board of Directors, Audit Committee, and Nominating and Governance Committee of The Williams Companies, Inc. (natural gas infrastructure, 2018-present). Previously, Ms. Fuller served as the Chief Investment Officer of the New York State Common Retirement Fund (2012-2018) and held a variety of positions at AllianceBernstein L.P. (global asset management, 1985-2012), including Managing Director (2006-2012) and Senior Vice President and Senior Portfolio Manager (2001-2006).
Peter S. Lynch (1944)
Year of Election or Appointment: 2003
Member of the Advisory Board
Mr. Lynch also serves as Member of the Advisory Board of other Fidelity® funds. Mr. Lynch is Vice Chairman and a Director of FMR (investment adviser firm) and FMR Co., Inc. (investment adviser firm). In addition, Mr. Lynch serves as a Trustee of Boston College and as the Chairman of the Inner-City Scholarship Fund. Previously, Mr. Lynch served on the Special Olympics International Board of Directors (1997-2006).
William S. Stavropoulos (1939)
Year of Election or Appointment: 2018
Member of the Advisory Board
Mr. Stavropoulos also serves as Member of the Advisory Board of other Fidelity® funds. Mr. Stavropoulos serves as President and Founder of the Michigan Baseball Foundation, the Great Lakes Loons (2007-present). Mr. Stavropoulos is Chairman Emeritus of the Board of Directors of The Dow Chemical Company, where he previously served in numerous senior management positions, including President, CEO (1995-2000; 2002-2004), Chairman of the Executive Committee (2000-2006), and as a member of the Board of Directors (1990-2006). Currently, Mr. Stavropoulos is Chairman of the Board of Directors of Univar Inc. (global distributor of commodity and specialty chemicals), a Director of Teradata Corporation (data warehousing and technology solutions), and a member of the Advisory Board for Metalmark Capital LLC (private equity investment, 2005-present). Mr. Stavropoulos is an operating advisor to Clayton, Dubilier & Rice, LLC (private equity investment). In addition, Mr. Stavropoulos is a member of the University of Notre Dame Advisory Council for the College of Science, a Trustee of the Rollin L. Gerstacker Foundation, and a Director of Artis-Naples in Naples, Florida. Previously, Mr. Stavropoulos served as Trustee of certain Fidelity® funds (2001-2018) and as a Director of Chemical Financial Corporation (bank holding company, 1993-2012) and Tyco International, Ltd. (multinational manufacturing and services, 2007-2012).
Carol B. Tomé (1957)
Year of Election or Appointment: 2018
Member of the Advisory Board
Ms. Tomé also serves as Member of the Advisory Board of other Fidelity® funds. Ms. Tomé is Chief Financial Officer (2001-present) and Executive Vice President of Corporate Services (2007-present) of The Home Depot, Inc. (home improvement retailer) and a Director (2003-present) and Chair of the Audit Committee (2004-present) of United Parcel Service, Inc. (package delivery and supply chain management). Previously, Ms. Tomé served as Trustee of certain Fidelity® funds (2017), Senior Vice President of Finance and Accounting/Treasurer (2000-2007) and Vice President and Treasurer (1995-2000) of The Home Depot, Inc. and Chair of the Board (2010-2012), Vice Chair of the Board (2009 and 2013), and a Director (2008-2013) of the Federal Reserve Bank of Atlanta. Ms. Tomé is also a director or trustee of many community and professional organizations.
Michael E. Wiley (1950)
Year of Election or Appointment: 2018
Member of the Advisory Board
Mr. Wiley also serves as Trustee or Member of the Advisory Board of other Fidelity® funds. Mr. Wiley serves as a Director of High Point Resources (exploration and production, 2005-present). Previously, Mr. Wiley served as a Director of Andeavor Corporation (independent oil refiner and marketer, 2005-2018), a Director of Andeavor Logistics LP (natural resources logistics, 2015-2018), a Director of Post Oak Bank (privately-held bank, 2004-2018), a Director of Asia Pacific Exploration Consolidated (international oil and gas exploration and production, 2008-2013), a member of the Board of Trustees of the University of Tulsa (2000-2006; 2007-2010), a Senior Energy Advisor of Katzenbach Partners, LLC (consulting, 2006-2007), an Advisory Director of Riverstone Holdings (private investment), a Director of Spinnaker Exploration Company (exploration and production, 2001-2005) and Chairman, President, and CEO of Baker Hughes, Inc. (oilfield services, 2000-2004).
Elizabeth Paige Baumann (1968)
Year of Election or Appointment: 2017
Anti-Money Laundering (AML) Officer
Ms. Baumann also serves as AML Officer of other funds. She is Chief AML Officer (2012-present) and Senior Vice President (2014-present) of FMR LLC (diversified financial services company) and is an employee of Fidelity Investments. Previously, Ms. Baumann served as AML Officer of the funds (2012-2016), and Vice President (2007-2014) and Deputy Anti-Money Laundering Officer (2007-2012) of FMR LLC.
John J. Burke III (1964)
Year of Election or Appointment: 2018
Chief Financial Officer
Mr. Burke also serves as Chief Financial Officer of other funds. Mr. Burke serves as Head of Investment Operations for Fidelity Fund and Investment Operations (2018-present) and is an employee of Fidelity Investments (1998-present). Previously Mr. Burke served as head of Asset Management Investment Operations (2012-2018).
William C. Coffey (1969)
Year of Election or Appointment: 2018
Secretary and Chief Legal Officer (CLO)
Mr. Coffey also serves as Secretary and CLO of other funds. Mr. Coffey serves as CLO, Secretary, and Senior Vice President of Fidelity Management & Research Company and FMR Co., Inc. (investment adviser firms, 2018-present); Secretary of Fidelity SelectCo, LLC and Fidelity Investments Money Management, Inc. (investment adviser firms, 2018-present); and CLO of Fidelity Management & Research (Hong Kong) Limited, FMR Investment Management (UK) Limited, and Fidelity Management & Research (Japan) Limited (investment adviser firms, 2018-present). He is Senior Vice President and Deputy General Counsel of FMR LLC (diversified financial services company, 2010-present), and is an employee of Fidelity Investments. Previously, Mr. Coffey served as Assistant Secretary of certain funds (2009-2018) and as Vice President and Associate General Counsel of FMR LLC (2005-2009).
Timothy M. Cohen (1969)
Year of Election or Appointment: 2018
Vice President
Mr. Cohen also serves as Vice President of other funds. Mr. Cohen serves as Co-Head of Global Equity Research (2016-present), a Director of Fidelity Management & Research (Japan) Limited (investment adviser firm, 2016-present), and is an employee of Fidelity Investments. Previously, Mr. Cohen served as Chief Investment Officer - Equity and a Director of Fidelity Management & Research (U.K.) Inc. (investment adviser firm, 2013-2015) and as a Director of Fidelity Management & Research (Hong Kong) Limited (investment adviser firm, 2017).
Jonathan Davis (1968)
Year of Election or Appointment: 2010
Assistant Treasurer
Mr. Davis also serves as Assistant Treasurer of other funds. Mr. Davis serves as Assistant Treasurer of FMR Capital, Inc. (2017-present) and is an employee of Fidelity Investments. Previously, Mr. Davis served as Vice President and Associate General Counsel of FMR LLC (diversified financial services company, 2003-2010).
Adrien E. Deberghes (1967)
Year of Election or Appointment: 2016
Assistant Treasurer
Mr. Deberghes also serves as an officer of other funds. He serves as Assistant Treasurer of FMR Capital, Inc. (2017-present), Executive Vice President of Fidelity Investments Money Management, Inc. (FIMM) (investment adviser firm, 2016-present), and is an employee of Fidelity Investments (2008-present). Previously, Mr. Deberghes served as President and Treasurer of certain Fidelity® funds (2013-2018). Prior to joining Fidelity Investments, Mr. Deberghes was Senior Vice President of Mutual Fund Administration at State Street Corporation (2007-2008), Senior Director of Mutual Fund Administration at Investors Bank & Trust (2005-2007), and Director of Finance for Dunkin' Brands (2000-2005). Previously, Mr. Deberghes served in other fund officer roles.
Laura M. Del Prato (1964)
Year of Election or Appointment: 2018
Assistant Treasurer
Ms. Del Prato also serves as an officer of other funds. Ms. Del Prato is an employee of Fidelity Investments (2017-present). Prior to joining Fidelity Investments, Ms. Del Prato served as a Managing Director and Treasurer of the JPMorgan Mutual Funds (2014-2017). Prior to JPMorgan, Ms. Del Prato served as a partner at Cohen Fund Audit Services (accounting firm, 2012-2013) and KPMG LLP (accounting firm, 2004-2012).
Colm A. Hogan (1973)
Year of Election or Appointment: 2016
Deputy Treasurer
Mr. Hogan also serves as an officer of other funds. Mr. Hogan serves as Assistant Treasurer of FMR Capital, Inc. (2017-present) and is an employee of Fidelity Investments (2005-present). Previously, Mr. Hogan served as Assistant Treasurer of certain Fidelity® funds (2016-2018).
Pamela R. Holding (1964)
Year of Election or Appointment: 2018
Vice President
Ms. Holding also serves as Vice President of other funds. Ms. Holding serves as Co-Head of Global Equity Research (2018-present) and is an employee of Fidelity Investments (2013-present).
Chris Maher (1972)
Year of Election or Appointment: 2013
Assistant Treasurer
Mr. Maher serves as Assistant Treasurer of other funds. Mr. Maher is Vice President of Valuation Oversight, serves as Assistant Treasurer of FMR Capital, Inc. (2017-present), and is an employee of Fidelity Investments. Previously, Mr. Maher served as Vice President of Asset Management Compliance (2013), Vice President of the Program Management Group of FMR (investment adviser firm, 2010-2013), and Vice President of Valuation Oversight (2008-2010).
Rieco E. Mello (1969)
Year of Election or Appointment: 2017
Assistant Treasurer
Mr. Mello also serves as Assistant Treasurer of other funds. Mr. Mello serves as Assistant Treasurer of FMR Capital, Inc. (2017-present) and is an employee of Fidelity Investments (1995-present).
Kenneth B. Robins (1969)
Year of Election or Appointment: 2016
Chief Compliance Officer
Mr. Robins also serves as an officer of other funds. Mr. Robins serves as Compliance Officer of Fidelity Management & Research Company and FMR Co., Inc. (investment adviser firms, 2016-present) and is an employee of Fidelity Investments (2004-present). Previously, Mr. Robins served as Executive Vice President of Fidelity Investments Money Management, Inc. (investment adviser firm, 2013-2016) and served in other fund officer roles.
Stacie M. Smith (1974)
Year of Election or Appointment: 2016
President and Treasurer
Ms. Smith also serves as an officer of other funds. Ms. Smith serves as Assistant Treasurer of FMR Capital, Inc. (2017-present), is an employee of Fidelity Investments (2009-present), and has served in other fund officer roles. Prior to joining Fidelity Investments, Ms. Smith served as Senior Audit Manager of Ernst & Young LLP (accounting firm, 1996-2009). Previously, Ms. Smith served as Assistant Treasurer (2013-2018) and Deputy Treasurer (2013-2016) of certain Fidelity® funds.
Marc L. Spector (1972)
Year of Election or Appointment: 2016
Assistant Treasurer
Mr. Spector also serves as an officer of other funds. Mr. Spector serves as Assistant Treasurer of FMR Capital, Inc. (2017-present) and is an employee of Fidelity Investments (2016-present). Prior to joining Fidelity Investments, Mr. Spector served as Director at the Siegfried Group (accounting firm, 2013-2016), and prior to Siegfried Group as audit senior manager at Deloitte & Touche (accounting firm, 2005-2013).
Shareholder Expense Example
As a shareholder of the Fund, you incur two types of costs: (1) transaction costs and (2) ongoing costs, including management fees and other Fund expenses. This Example is intended to help you understand your ongoing costs (in dollars) of investing in the Fund and to compare these costs with the ongoing costs of investing in other mutual funds.
The Example is based on an investment of $1,000 invested at the beginning of the period and held for the entire period (May 1, 2018 to October 31, 2018).
Actual Expenses
The first line of the accompanying table for each class of the Fund provides information about actual account values and actual expenses. You may use the information in this line, together with the amount you invested, to estimate the expenses that you paid over the period. Simply divide your account value by $1,000.00 (for example, an $8,600 account value divided by $1,000.00 = 8.6), then multiply the result by the number in the first line for a class of the Fund under the heading entitled "Expenses Paid During Period" to estimate the expenses you paid on your account during this period. A small balance maintenance fee of $12.00 that is charged once a year may apply for certain accounts with a value of less than $2,000. This fee, which was eliminated effective August 1, 2018, is not included in the table below. If it was, the estimate of expenses you paid during the period would be higher, and your ending account value lower, by this amount. In addition, the Fund, as a shareholder in the underlying Fidelity Central Funds, will indirectly bear its pro-rata share of the fees and expenses incurred by the underlying Fidelity Central Funds. These fees and expenses are not included in the Fund's annualized expense ratio used to calculate the expense estimate in the table below.
Hypothetical Example for Comparison Purposes
The second line of the accompanying table for each class of the Fund provides information about hypothetical account values and hypothetical expenses based on a Class' actual expense ratio and an assumed rate of return of 5% per year before expenses, which is not the Class' actual return. The hypothetical account values and expenses may not be used to estimate the actual ending account balance or expenses you paid for the period. You may use this information to compare the ongoing costs of investing in the Fund and other funds. To do so, compare this 5% hypothetical example with the 5% hypothetical examples that appear in the shareholder reports of the other funds. A small balance maintenance fee of $12.00 that is charged once a year may apply for certain accounts with a value of less than $2,000. This fee, which was eliminated effective August 1, 2018, is not included in the table below. If it was, the estimate of expenses you paid during the period would be higher, and your ending account value lower, by this amount. In addition, the Fund, as a shareholder in the underlying Fidelity Central Funds, will indirectly bear its pro-rata share of the fees and expenses incurred by the underlying Fidelity Central Funds. These fees and expenses are not included in the Fund's annualized expense ratio used to calculate the expense estimate in the table below.
Please note that the expenses shown in the table are meant to highlight your ongoing costs only and do not reflect any transaction costs. Therefore, the second line of the table is useful in comparing ongoing costs only, and will not help you determine the relative total costs of owning different funds. In addition, if these transactional costs were included, your costs would have been higher.
| Annualized Expense Ratio-A | Beginning Account Value May 1, 2018 | Ending Account Value October 31, 2018 | Expenses Paid During Period-B May 1, 2018 to October 31, 2018 | |
| Emerging Markets | .95% | |||
| Actual | $1,000.00 | $824.90 | $4.37 | |
| Hypothetical-C | $1,000.00 | $1,020.42 | $4.84 | |
| Class K | .81% | |||
| Actual | $1,000.00 | $825.30 | $3.73 | |
| Hypothetical-C | $1,000.00 | $1,021.12 | $4.13 |
A Annualized expense ratio reflects expenses net of applicable fee waivers.
B Expenses are equal to each Class' annualized expense ratio, multiplied by the average account value over the period, multiplied by 184/365 (to reflect the one-half year period).
C 5% return per year before expenses
Distributions (Unaudited)
The Board of Trustees of Fidelity Emerging Markets Fund voted to pay to shareholders of record at the opening of business on record date, the following distributions per share derived from capital gains realized from sales of portfolio securities, and dividends derived from net investment income:
| Pay Date | Record Date | Dividends | Capital Gains | |
| Fidelity Emerging Markets Fund | ||||
| Emerging Markets | 12/10/18 | 12/07/18 | $0.217 | $0.003 |
| Class K | 12/10/18 | 12/07/18 | $0.263 | $0.003 |
A percentage of the dividends distributed during the fiscal year for the following funds qualify for the dividends–received deduction for corporate shareholders:
| Retail | Class K | |
| Fidelity Emerging Markets Fund | ||
| December, 2017 | 7% | 6% |
Emerging Markets and Class K designates 100% of the dividend distributed during the fiscal year as amounts which may be taken into account as a dividend for purposes of the maximum rate under section 1(h)(11) of the Internal Revenue Code.
The amounts per share which represent income derived from sources within, and taxes paid to, foreign countries or possessions of the United States are as follows:
| Pay Date | Income | Taxes | |
| Fidelity Emerging Markets Fund | |||
| Emerging Markets | 12/11/2017 | $0.2303 | $0.0413 |
| Class K | 12/11/2017 | $0.2683 | $0.0413 |
The fund will notify shareholders in January 2019 of amounts for use in preparing 2018 income tax returns.
Board Approval of Investment Advisory Contracts
Fidelity Emerging Markets Fund
At its July 2018 meeting, the Board of Trustees, including the Independent Trustees (together, the Board), voted to continue the management contract with Fidelity Management & Research Company (FMR) and the sub-advisory agreements (together, the Advisory Contracts) for the fund for six months through January 31, 2019, in connection with the reunification of the Fidelity Equity High Income Funds Board, which oversees the fund, and the Sector Portfolios Board.
The Board considered that the approval of the fund's Advisory Contracts will not result in any changes in (i) the investment process or strategies employed in the management of the fund's assets; (ii) the fees and expenses paid by shareholders; (iii) the nature, extent or quality of services provided under the fund's Advisory Contracts; or (iv) the day-to-day management of the fund or the persons primarily responsible for such management. The Board concluded that the fund's Advisory Contracts are fair and reasonable, and that the fund's Advisory Contracts should be renewed, without modification, through January 31, 2019, with the understanding that the Board will consider the annual renewal for a full one year period in January 2019.
In connection with its consideration of future renewals of the fund's Advisory Contracts, the Board will consider: (i) the nature, extent and quality of services provided to the fund, including shareholder and administrative services and investment performance; (ii) the competitiveness of the management fee and total expenses for the fund; (iii) the costs of the services and profitability, including the revenues earned and the expenses incurred in conducting the business of developing, marketing, distributing, managing, administering, and servicing the fund and its shareholders, to the extent applicable, as well as potential fall-out benefits from Fidelity's non-fund businesses; and (iv) whether there have been economies of scale in respect of the Fidelity funds, whether the Fidelity funds (including the fund) have appropriately benefited from any such economies of scale, and whether there is the potential for realization of any further economies.
Based on its evaluation of all of the conclusions noted above, and after considering all factors it believed relevant, the Board ultimately concluded that the fund's management fee structure is fair and reasonable, and that the continuation of the fund's Advisory Contracts should be approved.
![]()
Corporate Headquarters
245 Summer St.
Boston, MA 02210
www.fidelity.com
EMF-K-ANN-1218
1.863015.110
Fidelity Advisor® Europe Fund - Class A, Class M, Class C, Class I and Class Z Annual Report October 31, 2018 Class A, Class M, Class C, Class I and Class Z are classes of Fidelity® Europe Fund |
|
Contents
To view a fund's proxy voting guidelines and proxy voting record for the 12-month period ended June 30, visit http://www.fidelity.com/proxyvotingresults or visit the Securities and Exchange Commission's (SEC) web site at http://www.sec.gov.
You may also call 1-877-208-0098 to request a free copy of the proxy voting guidelines.
Standard & Poor's, S&P and S&P 500 are registered service marks of The McGraw-Hill Companies, Inc. and have been licensed for use by Fidelity Distributors Corporation.
Other third-party marks appearing herein are the property of their respective owners.
All other marks appearing herein are registered or unregistered trademarks or service marks of FMR LLC or an affiliated company. © 2018 FMR LLC. All rights reserved.
This report and the financial statements contained herein are submitted for the general information of the shareholders of the Fund. This report is not authorized for distribution to prospective investors in the Fund unless preceded or accompanied by an effective prospectus.
A fund files its complete schedule of portfolio holdings with the SEC for the first and third quarters of each fiscal year on Form N-Q. Forms N-Q are available on the SEC’s web site at http://www.sec.gov. A fund's Forms N-Q may be reviewed and copied at the SEC’s Public Reference Room in Washington, DC. Information regarding the operation of the SEC's Public Reference Room may be obtained by calling 1-800-SEC-0330.
For a complete list of a fund's portfolio holdings, view the most recent holdings listing, semiannual report, or annual report on Fidelity's web site at http://www.fidelity.com, http://www.institutional.fidelity.com, or http://www.401k.com, as applicable.
NOT FDIC INSURED •MAY LOSE VALUE •NO BANK GUARANTEE
Neither the Fund nor Fidelity Distributors Corporation is a bank.
Performance: The Bottom Line
Average annual total return reflects the change in the value of an investment, assuming reinvestment of distributions from dividend income and capital gains (the profits earned upon the sale of securities that have grown in value, if any) and assuming a constant rate of performance each year. The hypothetical investment and the average annual total returns do not reflect the deduction of taxes that a shareholder would pay on fund distributions or the redemption of fund shares. During periods of reimbursement by Fidelity, a fund’s total return will be greater than it would be had the reimbursement not occurred. How a fund did yesterday is no guarantee of how it will do tomorrow.
Average Annual Total Returns
| For the periods ended October 31, 2018 | Past 1 year | Past 5 years | Past 10 years |
| Class A (incl. 5.75% sales charge) | (14.53)% | 0.32% | 6.31% |
| Class M (incl. 3.50% sales charge) | (12.80)% | 0.52% | 6.41% |
| Class C (incl. contingent deferred sales charge) | (10.92)% | 0.78% | 6.56% |
| Class I | (9.02)% | 1.85% | 7.12% |
| Class Z | (9.02)% | 1.85% | 7.12% |
Class A shares bear a 0.25% 12b-1 fee. The initial offering of Class A shares took place on March 18, 2014. Returns prior to March 18, 2014, are those of Fidelity® Europe Fund, the original class of the fund, which has no 12b-1 fee. Had Class A's 12b-1 fee been reflected, returns prior to March 18, 2014, would have been lower.
Class M shares bear a 0.50% 12b-1 fee. The initial offering of Class M shares took place on March 18, 2014. Returns prior to March 18, 2014, are those of Fidelity® Europe Fund, the original class of the fund, which has no 12b-1 fee. Had Class M's 12b-1 fee been reflected, returns prior to March 18, 2014, would have been lower.
Class C shares bear a 1.00% 12b-1 fee. The initial offering of Class C shares took place on March 18, 2014. Returns prior to March 18, 2014, are those of Fidelity® Europe Fund, the original class of the fund, which has no 12b-1 fee. Had Class C's 12b-1 fee been reflected, returns prior to March 18, 2014, would have been lower.
Class C shares' contingent deferred sales charges included in the past one year, past five years and past ten years total return figures are 1%, 0% and 0%, respectively.
The initial offering of Class I shares took place on March 18, 2014. Returns prior to March 18, 2014 are those of Fidelity® Europe Fund, the original class of the fund.
The initial offering of Class Z shares took place on October 2, 2018. Returns prior to October 2, 2018, are those of Class I. Returns between March 18, 2014 and October 2, 2018, are those of Class I. Returns prior to March 18, 2014 are those of Fidelity® Europe Fund, the original class of the fund.
$10,000 Over 10 Years
Let's say hypothetically that $10,000 was invested in Fidelity Advisor® Europe Fund - Class A on October 31, 2008, and the current 5.75% sales charge was paid.
The chart shows how the value of your investment would have changed, and also shows how the MSCI Europe Index performed over the same period.
See above for additional information regarding the performance of Class A.
| Period Ending Values | ||
| $18,445 | Fidelity Advisor® Europe Fund - Class A | |
| $19,334 | MSCI Europe Index | |
Management's Discussion of Fund Performance
Market Recap: International equities returned -8.08% for the 12 months ending October 31, 2018, according to the MSCI ACWI (All Country World Index) ex USA Index. A modestly positive first half of the period gave way to a confluence of overwhelmingly negative factors – including escalating trade tension, a surging U.S. dollar, tepid economic growth in Europe, global central bank tightening, concerns about Italy’s budget stalemate with the EU, and weakness in China’s stock market – that yielded a -11% second-half return. The index lost 8% in October alone, its largest monthly drop in more than six years. Among sectors, new-media-infused communications services (-15%) was hit the hardest, while economically sensitive consumer discretionary (-13%), information technology (-12%), financials (-10%), industrials (-9%) and materials (-7%) stocks also fared poorly. Even the more defensive real estate (-9%), utilities (-6%) and consumer staples (-5%) sectors weren’t spared this period. Conversely, elevated crude-oil prices fueled a positive return for energy (+7%), the top-performing sector, followed by the relatively stable-growing health care segment (+2%). Regionally, emerging markets (-12%) fared the worst, hampered by the impact of foreign exchange and concerns about economic weakness in China, India and South Korea. Sluggish growth also pressured shares in continental Europe (-9%). Stocks in Japan (-3%) and the U.K. (-4%) held up better, followed by Canada (-5%) and Asia-Pacific ex Japan (-6%).Comments from Portfolio Manager Andrew Sergeant: For the fiscal year, the fund's share classes (excluding sales charges, if applicable) returned roughly between -9% and -10%, trailing the -8.08% decline of its benchmark, the MSCI Europe Index. The European markets experienced a significant shift this period, as a more aggressive trade stance from the U.S., coupled with an economic slowdown in China, dampened Europe's growth outlook and overall investor sentiment toward stocks. Versus the MSCI index, stock selection in health care, materials and consumer staples detracted most. An underweighting in the strong-performing energy sector, as well as positioning in the diversified financials and transportation industries, hurt to a lesser extent. The fund's biggest individual detractor was an out-of-benchmark position in Sweden's medical technology firm Getinge, which encountered challenges in its business restructuring. Also weighing on the fund's relative result was an overweighted position in Danish conglomerate A.P. Moller-Maersk. The company has a significant container-shipping business, and concerns about a global economic downturn, geopolitical risk and trade tensions weighed on the stock’s price. Conversely, stock picking in consumer discretionary and communication services boosted the fund’s relative performance. A sizable out-of-benchmark position in Kambi Group, a sports-betting infrastructure firm listed on Sweden’s First North stock exchange, with headquarters in Malta, was the fund's top contributor. Kambi's stock benefited from profit-margin and product-pipeline growth. An outsized stake in Norway-based international media group Schibsted also contributed. Litigation income received during the period also added to the fund’s return.The views expressed above reflect those of the portfolio manager(s) only through the end of the period as stated on the cover of this report and do not necessarily represent the views of Fidelity or any other person in the Fidelity organization. Any such views are subject to change at any time based upon market or other conditions and Fidelity disclaims any responsibility to update such views. These views may not be relied on as investment advice and, because investment decisions for a Fidelity fund are based on numerous factors, may not be relied on as an indication of trading intent on behalf of any Fidelity fund.
Note to Shareholders: Andrew Sergeant became Co-Manager of the fund on May 31, 2018, assuming portfolio management responsibilities while Stefan Lindblad was on a three-month leave of absence. On September 1, 2018, Stefan Lindblad left the firm, leaving Andrew Sergeant as sole manager of the fund.Investment Summary (Unaudited)
Geographic Diversification (% of fund's net assets)
| As of October 31, 2018 | ||
| United Kingdom | 28.0% | |
| Sweden | 15.3% | |
| Germany | 14.4% | |
| France | 9.4% | |
| Switzerland | 4.6% | |
| Spain | 4.1% | |
| United States of America* | 3.6% | |
| Italy | 3.3% | |
| Denmark | 2.9% | |
| Other | 14.4% | |
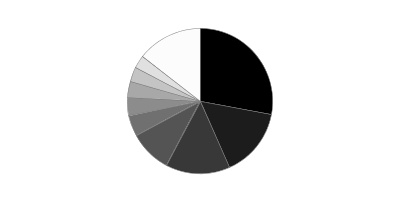
* Includes Short-Term investments and Net Other Assets (Liabilities).
Percentages are based on country or territory of incorporation and are adjusted for the effect of futures contracts, if applicable.
Asset Allocation as of October 31, 2018
| % of fund's net assets | |
| Stocks | 98.1 |
| Short-Term Investments and Net Other Assets (Liabilities) | 1.9 |
Top Ten Stocks as of October 31, 2018
| % of fund's net assets | |
| Unilever PLC (United Kingdom, Personal Products) | 3.8 |
| Roche Holding AG (participation certificate) (Switzerland, Pharmaceuticals) | 3.2 |
| SAP SE (Germany, Software) | 3.1 |
| BP PLC (United Kingdom, Oil, Gas & Consumable Fuels) | 3.0 |
| Total SA (France, Oil, Gas & Consumable Fuels) | 2.6 |
| Capgemini SA (France, IT Services) | 2.5 |
| Schibsted ASA (A Shares) (Norway, Media) | 2.3 |
| Vostok New Ventures Ltd. (depositary receipt) (Bermuda, Capital Markets) | 2.1 |
| Arjo AB (Sweden, Health Care Equipment & Supplies) | 2.0 |
| Rolls-Royce Holdings PLC (United Kingdom, Aerospace & Defense) | 2.0 |
| 26.6 |
Top Market Sectors as of October 31, 2018
| % of fund's net assets | |
| Financials | 22.6 |
| Industrials | 20.2 |
| Health Care | 11.5 |
| Consumer Staples | 10.6 |
| Information Technology | 8.7 |
| Consumer Discretionary | 7.1 |
| Energy | 6.8 |
| Materials | 3.8 |
| Real Estate | 3.4 |
| Communication Services | 3.4 |
Schedule of Investments October 31, 2018
Showing Percentage of Net Assets
| Common Stocks - 95.3% | |||
| Shares | Value | ||
| Austria - 0.8% | |||
| Mayr-Melnhof Karton AG | 58,900 | $7,458,523 | |
| Belgium - 1.2% | |||
| KBC Groep NV | 171,400 | 11,822,895 | |
| Bermuda - 2.1% | |||
| Vostok New Ventures Ltd. (depositary receipt) (a) | 2,791,131 | 21,228,230 | |
| Canada - 0.8% | |||
| Lundin Mining Corp. (Sweden) | 1,883,900 | 7,744,635 | |
| Denmark - 2.9% | |||
| A.P. Moller - Maersk A/S Series B | 14,412 | 18,190,978 | |
| Scandinavian Tobacco Group A/S (b) | 721,700 | 10,951,117 | |
| TOTAL DENMARK | 29,142,095 | ||
| Finland - 0.8% | |||
| Nokian Tyres PLC | 259,800 | 8,262,890 | |
| France - 9.4% | |||
| Altarea SCA | 47,600 | 10,470,126 | |
| Amundi SA (b) | 198,500 | 11,821,615 | |
| Capgemini SA | 198,800 | 24,318,449 | |
| Compagnie de St. Gobain | 321,100 | 12,096,294 | |
| The Vicat Group | 158,300 | 8,516,679 | |
| Total SA (c) | 436,107 | 25,588,763 | |
| TOTAL FRANCE | 92,811,926 | ||
| Germany - 14.4% | |||
| Bertrandt AG | 162,700 | 13,471,026 | |
| Deutsche Post AG | 427,500 | 13,498,428 | |
| Fresenius Medical Care AG & Co. KGaA | 167,000 | 13,112,257 | |
| Fresenius SE & Co. KGaA | 82,300 | 5,230,645 | |
| Hannover Reuck SE | 109,600 | 14,784,888 | |
| Instone Real Estate Group BV (b) | 432,200 | 10,138,194 | |
| JOST Werke AG (b) | 197,400 | 6,886,421 | |
| LEG Immobilien AG | 129,947 | 14,226,851 | |
| MTU Aero Engines Holdings AG | 85,700 | 18,229,390 | |
| SAP SE | 284,237 | 30,434,249 | |
| WashTec AG | 29,300 | 2,260,011 | |
| TOTAL GERMANY | 142,272,360 | ||
| Ireland - 2.5% | |||
| Ryanair Holdings PLC sponsored ADR (a) | 164,767 | 13,642,708 | |
| United Drug PLC (United Kingdom) | 1,420,241 | 11,473,025 | |
| TOTAL IRELAND | 25,115,733 | ||
| Italy - 2.3% | |||
| Banca Generali SpA | 540,400 | 10,423,792 | |
| Buzzi Unicem SpA | 159,884 | 3,074,047 | |
| Prada SpA | 2,537,100 | 8,961,760 | |
| TOTAL ITALY | 22,459,599 | ||
| Malta - 2.0% | |||
| Kambi Group PLC (a) | 696,109 | 19,283,219 | |
| Netherlands - 1.9% | |||
| Intertrust NV (b) | 1,165,980 | 18,819,223 | |
| Norway - 2.3% | |||
| Schibsted ASA (A Shares) | 643,050 | 22,282,249 | |
| Spain - 2.3% | |||
| Prosegur Cash SA (b) | 7,417,400 | 14,702,307 | |
| Prosegur Compania de Seguridad SA (Reg.) | 1,369,300 | 7,612,002 | |
| TOTAL SPAIN | 22,314,309 | ||
| Sweden - 15.3% | |||
| Arjo AB | 5,751,984 | 19,548,002 | |
| Essity AB Class B | 798,700 | 18,232,510 | |
| Getinge AB (B Shares) | 1,579,484 | 15,516,696 | |
| Indutrade AB | 763,100 | 18,312,098 | |
| Investor AB (B Shares) | 428,571 | 18,578,443 | |
| Securitas AB (B Shares) | 923,100 | 15,831,950 | |
| Swedbank AB (A Shares) | 744,300 | 16,762,946 | |
| Swedish Match Co. AB | 285,000 | 14,522,273 | |
| Telefonaktiebolaget LM Ericsson (B Shares) | 1,564,600 | 13,622,594 | |
| TOTAL SWEDEN | 150,927,512 | ||
| Switzerland - 4.6% | |||
| Julius Baer Group Ltd. | 300,090 | 13,685,539 | |
| Roche Holding AG (participation certificate) | 128,900 | 31,369,415 | |
| TOTAL SWITZERLAND | 45,054,954 | ||
| United Kingdom - 28.0% | |||
| Admiral Group PLC | 433,600 | 11,156,600 | |
| BCA Marketplace PLC | 4,012,800 | 10,335,259 | |
| BP PLC | 4,090,400 | 29,547,906 | |
| British American Tobacco PLC (United Kingdom) | 394,200 | 17,088,676 | |
| Close Brothers Group PLC | 527,400 | 9,923,086 | |
| Cranswick PLC | 178,900 | 6,608,562 | |
| John Wood Group PLC | 1,301,400 | 11,880,356 | |
| Lloyds Banking Group PLC | 25,862,500 | 18,872,902 | |
| Melrose Industries PLC | 4,530,100 | 9,765,465 | |
| Micro Focus International PLC | 1,056,358 | 16,375,890 | |
| Prudential PLC | 779,405 | 15,606,513 | |
| Rightmove PLC | 1,808,000 | 10,449,121 | |
| Rolls-Royce Holdings PLC | 1,807,300 | 19,381,833 | |
| Rotork PLC | 2,224,100 | 8,522,848 | |
| Sabre Insurance Group PLC (b) | 3,300,000 | 11,135,678 | |
| St. James's Place Capital PLC | 944,900 | 12,240,761 | |
| Standard Life PLC | 3,073,175 | 10,625,598 | |
| The Weir Group PLC | 452,900 | 9,181,303 | |
| Unilever PLC | 704,500 | 37,317,108 | |
| TOTAL UNITED KINGDOM | 276,015,465 | ||
| United States of America - 1.7% | |||
| Autoliv, Inc. (depositary receipt) | 126,400 | 10,489,191 | |
| Veoneer, Inc. unit (a) | 187,300 | 6,282,460 | |
| TOTAL UNITED STATES OF AMERICA | 16,771,651 | ||
| TOTAL COMMON STOCKS | |||
| (Cost $938,765,127) | 939,787,468 | ||
| Nonconvertible Preferred Stocks - 2.8% | |||
| Italy - 1.0% | |||
| Buzzi Unicem SpA (Risparmio Shares) | 889,200 | 9,990,952 | |
| Spain - 1.8% | |||
| Grifols SA Class B | 850,250 | 17,669,517 | |
| United Kingdom - 0.0% | |||
| Rolls-Royce Holdings PLC Series C (a) | 83,135,800 | 106,264 | |
| TOTAL NONCONVERTIBLE PREFERRED STOCKS | |||
| (Cost $23,650,077) | 27,766,733 | ||
| Money Market Funds - 0.7% | |||
| Fidelity Cash Central Fund, 2.23% (d) | 6,484,554 | 6,485,851 | |
| Fidelity Securities Lending Cash Central Fund 2.23% (d)(e) | 431 | 431 | |
| TOTAL MONEY MARKET FUNDS | |||
| (Cost $6,486,282) | 6,486,282 | ||
| TOTAL INVESTMENT IN SECURITIES - 98.8% | |||
| (Cost $968,901,486) | 974,040,483 | ||
| NET OTHER ASSETS (LIABILITIES) - 1.2% | 11,899,866 | ||
| NET ASSETS - 100% | $985,940,349 |
Categorizations in the Schedule of Investments are based on country or territory of incorporation.
Legend
(a) Non-income producing
(b) Security exempt from registration under Rule 144A of the Securities Act of 1933. These securities may be resold in transactions exempt from registration, normally to qualified institutional buyers. At the end of the period, the value of these securities amounted to $84,454,555 or 8.6% of net assets.
(c) Security or a portion of the security is on loan at period end.
(d) Affiliated fund that is generally available only to investment companies and other accounts managed by Fidelity Investments. The rate quoted is the annualized seven-day yield of the fund at period end. A complete unaudited listing of the fund's holdings as of its most recent quarter end is available upon request. In addition, each Fidelity Central Fund's financial statements, which are not covered by the Fund's Report of Independent Registered Public Accounting Firm, are available on the SEC's website or upon request.
(e) Investment made with cash collateral received from securities on loan.
Affiliated Central Funds
Information regarding fiscal year to date income earned by the Fund from investments in Fidelity Central Funds is as follows:
| Fund | Income earned |
| Fidelity Cash Central Fund | $127,127 |
| Fidelity Securities Lending Cash Central Fund | 322,082 |
| Total | $449,209 |
Amounts in the income column in the above table include any capital gain distributions from underlying funds, which are presented in the corresponding line-item in the Statement of Operations if applicable.
Other Affiliated Issuers
An affiliated company is a company in which the Fund has ownership of at least 5% of the voting securities. Fiscal year to date transactions with companies which are or were affiliates are as follows:
| Affiliate | Value, beginning of period | Purchases | Sales Proceeds | Dividend Income | Realized Gain (loss) | Change in Unrealized appreciation (depreciation) | Value, end of period |
| Vostok Emerging Finance Ltd. (depository receipt) | $11,714,677 | $-- | $11,078,143 | $-- | $4,218,176 | $(4,854,710) | $-- |
| Total | $11,714,677 | $-- | $11,078,143 | $-- | $4,218,176 | $(4,854,710) | $-- |
Investment Valuation
The following is a summary of the inputs used, as of October 31, 2018, involving the Fund's assets and liabilities carried at fair value. The inputs or methodology used for valuing securities may not be an indication of the risk associated with investing in those securities. For more information on valuation inputs, and their aggregation into the levels used below, please refer to the Investment Valuation section in the accompanying Notes to Financial Statements.
| Valuation Inputs at Reporting Date: | ||||
| Description | Total | Level 1 | Level 2 | Level 3 |
| Investments in Securities: | ||||
| Equities: | ||||
| Communication Services | $32,731,370 | $32,731,370 | $-- | $-- |
| Consumer Discretionary | 70,501,200 | 70,501,200 | -- | -- |
| Consumer Staples | 104,720,246 | 50,314,462 | 54,405,784 | -- |
| Energy | 67,017,025 | 11,880,356 | 55,136,669 | -- |
| Financials | 223,371,793 | 175,206,839 | 48,164,954 | -- |
| Health Care | 113,919,557 | 46,537,723 | 67,381,834 | -- |
| Industrials | 198,921,821 | 135,754,288 | 63,167,533 | -- |
| Information Technology | 84,751,182 | 24,318,449 | 60,432,733 | -- |
| Materials | 36,784,836 | 36,784,836 | -- | -- |
| Real Estate | 34,835,171 | 34,835,171 | -- | -- |
| Money Market Funds | 6,486,282 | 6,486,282 | -- | -- |
| Total Investments in Securities: | $974,040,483 | $625,350,976 | $348,689,507 | $-- |
The following is a summary of transfers between Level 1 and Level 2 for the period ended October 31, 2018. Transfers are assumed to have occurred at the beginning of the period, and are primarily attributable to the valuation techniques used for foreign equity securities, as discussed in the accompanying Notes to Financial Statements:
| Transfers | Total |
| Level 1 to Level 2 | $47,154,143 |
| Level 2 to Level 1 | $0 |
See accompanying notes which are an integral part of the financial statements.
Financial Statements
Statement of Assets and Liabilities
| October 31, 2018 | ||
| Assets | ||
| Investment in securities, at value (including securities loaned of $59) — See accompanying schedule: Unaffiliated issuers (cost $962,415,204) | $967,554,201 | |
| Fidelity Central Funds (cost $6,486,282) | 6,486,282 | |
| Total Investment in Securities (cost $968,901,486) | $974,040,483 | |
| Receivable for investments sold | 5,149,724 | |
| Receivable for fund shares sold | 5,215,718 | |
| Dividends receivable | 3,624,073 | |
| Distributions receivable from Fidelity Central Funds | 8,641 | |
| Prepaid expenses | 2,183 | |
| Other receivables | 92,906 | |
| Total assets | 988,133,728 | |
| Liabilities | ||
| Payable to custodian bank | $40,218 | |
| Payable for fund shares redeemed | 1,282,276 | |
| Accrued management fee | 556,138 | |
| Transfer agent fee payable | 157,241 | |
| Distribution and service plan fees payable | 16,082 | |
| Other affiliated payables | 39,315 | |
| Other payables and accrued expenses | 102,048 | |
| Collateral on securities loaned | 61 | |
| Total liabilities | 2,193,379 | |
| Net Assets | $985,940,349 | |
| Net Assets consist of: | ||
| Paid in capital | $893,800,915 | |
| Total distributable earnings (loss) | 92,139,434 | |
| Net Assets | $985,940,349 | |
| Net Asset Value and Maximum Offering Price | ||
| Class A: | ||
| Net Asset Value and redemption price per share ($19,530,990 ÷ 519,368 shares) | $37.61 | |
| Maximum offering price per share (100/94.25 of $37.61) | $39.90 | |
| Class M: | ||
| Net Asset Value and redemption price per share ($7,257,145 ÷ 193,183 shares) | $37.57 | |
| Maximum offering price per share (100/96.50 of $37.57) | $38.93 | |
| Class C: | ||
| Net Asset Value and offering price per share ($10,060,437 ÷ 270,212 shares)(a) | $37.23 | |
| Europe: | ||
| Net Asset Value, offering price and redemption price per share ($941,670,053 ÷ 24,976,209 shares) | $37.70 | |
| Class I: | ||
| Net Asset Value, offering price and redemption price per share ($7,317,649 ÷ 194,171 shares) | $37.69 | |
| Class Z: | ||
| Net Asset Value, offering price and redemption price per share ($104,075 ÷ 2,761 shares) | $37.69 |
(a) Redemption price per share is equal to net asset value less any applicable contingent deferred sales charge.
See accompanying notes which are an integral part of the financial statements.
Statement of Operations
| Year ended October 31, 2018 | ||
| Investment Income | ||
| Dividends | $27,128,135 | |
| Income from Fidelity Central Funds | 449,209 | |
| Income before foreign taxes withheld | 27,577,344 | |
| Less foreign taxes withheld | (2,504,065) | |
| Total income | 25,073,279 | |
| Expenses | ||
| Management fee | ||
| Basic fee | $8,243,879 | |
| Performance adjustment | 274,992 | |
| Transfer agent fees | 2,047,572 | |
| Distribution and service plan fees | 215,981 | |
| Accounting and security lending fees | 550,471 | |
| Custodian fees and expenses | 127,237 | |
| Independent trustees' fees and expenses | 5,950 | |
| Registration fees | 85,513 | |
| Audit | 81,012 | |
| Legal | 3,081 | |
| Interest | 2,196 | |
| Miscellaneous | 57,483 | |
| Total expenses before reductions | 11,695,367 | |
| Expense reductions | (12,551) | |
| Total expenses after reductions | 11,682,816 | |
| Net investment income (loss) | 13,390,463 | |
| Realized and Unrealized Gain (Loss) | ||
| Net realized gain (loss) on: | ||
| Investment securities: | ||
| Unaffiliated issuers | 92,840,506 | |
| Fidelity Central Funds | (1,043) | |
| Other affiliated issuers | 4,218,176 | |
| Foreign currency transactions | (293,773) | |
| Total net realized gain (loss) | 96,763,866 | |
| Change in net unrealized appreciation (depreciation) on: | ||
| Investment securities: | ||
| Unaffiliated issuers | (203,717,400) | |
| Fidelity Central Funds | 1,261 | |
| Other affiliated issuers | (4,854,710) | |
| Assets and liabilities in foreign currencies | 7,709 | |
| Total change in net unrealized appreciation (depreciation) | (208,563,140) | |
| Net gain (loss) | (111,799,274) | |
| Net increase (decrease) in net assets resulting from operations | $(98,408,811) |
See accompanying notes which are an integral part of the financial statements.
Statement of Changes in Net Assets
| Year ended October 31, 2018 | Year ended October 31, 2017 | |
| Increase (Decrease) in Net Assets | ||
| Operations | ||
| Net investment income (loss) | $13,390,463 | $12,136,756 |
| Net realized gain (loss) | 96,763,866 | 23,964,986 |
| Change in net unrealized appreciation (depreciation) | (208,563,140) | 241,642,484 |
| Net increase (decrease) in net assets resulting from operations | (98,408,811) | 277,744,226 |
| Distributions to shareholders | (31,260,216) | – |
| Distributions to shareholders from net investment income | – | (11,727,868) |
| Distributions to shareholders from net realized gain | – | (3,911,466) |
| Total distributions | (31,260,216) | (15,639,334) |
| Share transactions - net increase (decrease) | (276,592,457) | 25,014,944 |
| Redemption fees | – | 434 |
| Total increase (decrease) in net assets | (406,261,484) | 287,120,270 |
| Net Assets | ||
| Beginning of period | 1,392,201,833 | 1,105,081,563 |
| End of period | $985,940,349 | $1,392,201,833 |
| Other Information | ||
| Undistributed net investment income end of period | $11,925,792 |
See accompanying notes which are an integral part of the financial statements.
Financial Highlights
Fidelity Europe Fund Class A
| Years ended October 31, | 2018 | 2017 | 2016 | 2015 | 2014 A |
| Selected Per–Share Data | |||||
| Net asset value, beginning of period | $42.47 | $34.17 | $37.06 | $36.24 | $39.45 |
| Income from Investment Operations | |||||
| Net investment income (loss)B | .34 | .26 | .22 | .37 | .47 |
| Net realized and unrealized gain (loss) | (4.21)C | 8.39 | (2.67) | 1.29 | (3.68) |
| Total from investment operations | (3.87) | 8.65 | (2.45) | 1.66 | (3.21) |
| Distributions from net investment income | (.33) | (.22) | (.29) | (.84) | – |
| Distributions from net realized gain | (.66) | (.13) | (.15) | – | – |
| Total distributions | (.99) | (.35) | (.44) | (.84) | – |
| Redemption fees added to paid in capitalB | – | –D | –D | –D | –D |
| Net asset value, end of period | $37.61 | $42.47 | $34.17 | $37.06 | $36.24 |
| Total ReturnE,F,G | (9.31)%C | 25.61% | (6.69)% | 4.63% | (8.14)% |
| Ratios to Average Net AssetsH,I | |||||
| Expenses before reductions | 1.28% | 1.32% | 1.39% | 1.33% | 1.35%J |
| Expenses net of fee waivers, if any | 1.28% | 1.32% | 1.39% | 1.33% | 1.35%J |
| Expenses net of all reductions | 1.28% | 1.28% | 1.38% | 1.31% | 1.35%J |
| Net investment income (loss) | .82% | .70% | .62% | .98% | 1.94%J |
| Supplemental Data | |||||
| Net assets, end of period (000 omitted) | $19,531 | $20,925 | $17,267 | $23,381 | $23,633 |
| Portfolio turnover rateK | 57% | 73% | 62% | 87% | 80%L |
A For the period March 18, 2014 (commencement of sale of shares) to October 31, 2014.
B Calculated based on average shares outstanding during the period.
C Net realized and unrealized gain (loss) per share reflects proceeds received from litigation which amounted to $.18 per share. Excluding these litigation proceeds, the total return would have been (9.74)%.
D Amount represents less than $.005 per share.
E Total returns for periods of less than one year are not annualized.
F Total returns would have been lower if certain expenses had not been reduced during the applicable periods shown.
G Total returns do not include the effect of the sales charges.
H Fees and expenses of any underlying Fidelity Central Funds are not included in the Fund's expense ratio. The Fund indirectly bears its proportionate share of the expenses of any underlying Fidelity Central Funds.
I Expense ratios reflect operating expenses of the class. Expenses before reductions do not reflect amounts reimbursed by the investment adviser or reductions from brokerage service arrangements or reductions from other expense offset arrangements and do not represent the amount paid by the class during periods when reimbursements or reductions occur. Expense ratios before reductions for start-up periods may not be representative of longer-term operating periods. Expenses net of fee waivers reflect expenses after reimbursement by the investment adviser but prior to reductions from brokerage service arrangements or other expense offset arrangements. Expenses net of all reductions represent the net expenses paid by the class.
J Annualized
K Amount does not include the portfolio activity of any underlying Fidelity Central Funds.
L The portfolio turnover rate does not include the assets acquired in the merger.
See accompanying notes which are an integral part of the financial statements.
Fidelity Europe Fund Class M
| Years ended October 31, | 2018 | 2017 | 2016 | 2015 | 2014 A |
| Selected Per–Share Data | |||||
| Net asset value, beginning of period | $42.47 | $34.13 | $36.94 | $36.18 | $39.45 |
| Income from Investment Operations | |||||
| Net investment income (loss)B | .21 | .15 | .11 | .26 | .40 |
| Net realized and unrealized gain (loss) | (4.23)C | 8.41 | (2.67) | 1.29 | (3.67) |
| Total from investment operations | (4.02) | 8.56 | (2.56) | 1.55 | (3.27) |
| Distributions from net investment income | (.23) | (.09) | (.09) | (.79) | – |
| Distributions from net realized gain | (.66) | (.13) | (.15) | – | – |
| Total distributions | (.88)D | (.22) | (.25)E | (.79) | – |
| Redemption fees added to paid in capitalB | – | –F | –F | –F | –F |
| Net asset value, end of period | $37.57 | $42.47 | $34.13 | $36.94 | $36.18 |
| Total ReturnG,H,I | (9.63)%C | 25.25% | (6.99)% | 4.33% | (8.29)% |
| Ratios to Average Net AssetsJ,K | |||||
| Expenses before reductions | 1.61% | 1.63% | 1.70% | 1.61% | 1.62%L |
| Expenses net of fee waivers, if any | 1.61% | 1.63% | 1.70% | 1.61% | 1.61%L |
| Expenses net of all reductions | 1.61% | 1.59% | 1.68% | 1.59% | 1.61%L |
| Net investment income (loss) | .50% | .39% | .31% | .70% | 1.68%L |
| Supplemental Data | |||||
| Net assets, end of period (000 omitted) | $7,257 | $8,874 | $6,980 | $9,632 | $13,679 |
| Portfolio turnover rateM | 57% | 73% | 62% | 87% | 80%N |
A For the period March 18, 2014 (commencement of sale of shares) to October 31, 2014.
B Calculated based on average shares outstanding during the period.
C Net realized and unrealized gain (loss) per share reflects proceeds received from litigation which amounted to $.18 per share. Excluding these litigation proceeds, the total return would have been (10.06)%.
D Total distributions of $.88 per share is comprised of distributions from net investment income of $.227 and distributions from net realized gain of $.657 per share.
E Total distributions of $.25 per share is comprised of distributions from net investment income of $.092 and distributions from net realized gain of $.154 per share.
F Amount represents less than $.005 per share.
G Total returns for periods of less than one year are not annualized.
H Total returns would have been lower if certain expenses had not been reduced during the applicable periods shown.
I Total returns do not include the effect of the sales charges.
J Fees and expenses of any underlying Fidelity Central Funds are not included in the Fund's expense ratio. The Fund indirectly bears its proportionate share of the expenses of any underlying Fidelity Central Funds.
K Expense ratios reflect operating expenses of the class. Expenses before reductions do not reflect amounts reimbursed by the investment adviser or reductions from brokerage service arrangements or reductions from other expense offset arrangements and do not represent the amount paid by the class during periods when reimbursements or reductions occur. Expense ratios before reductions for start-up periods may not be representative of longer-term operating periods. Expenses net of fee waivers reflect expenses after reimbursement by the investment adviser but prior to reductions from brokerage service arrangements or other expense offset arrangements. Expenses net of all reductions represent the net expenses paid by the class.
L Annualized
M Amount does not include the portfolio activity of any underlying Fidelity Central Funds.
N The portfolio turnover rate does not include the assets acquired in the merger.
See accompanying notes which are an integral part of the financial statements.
Fidelity Europe Fund Class C
| Years ended October 31, | 2018 | 2017 | 2016 | 2015 | 2014 A |
| Selected Per–Share Data | |||||
| Net asset value, beginning of period | $42.15 | $33.82 | $36.81 | $36.07 | $39.45 |
| Income from Investment Operations | |||||
| Net investment income (loss)B | .02 | (.03) | (.06) | .07 | .29 |
| Net realized and unrealized gain (loss) | (4.18)C | 8.36 | (2.65) | 1.29 | (3.67) |
| Total from investment operations | (4.16) | 8.33 | (2.71) | 1.36 | (3.38) |
| Distributions from net investment income | (.10) | – | (.12) | (.62) | – |
| Distributions from net realized gain | (.66) | – | (.15) | – | – |
| Total distributions | (.76) | – | (.28)D | (.62) | – |
| Redemption fees added to paid in capitalB | – | –E | –E | –E | –E |
| Net asset value, end of period | $37.23 | $42.15 | $33.82 | $36.81 | $36.07 |
| Total ReturnF,G,H | (10.04)%C | 24.63% | (7.43)% | 3.79% | (8.57)% |
| Ratios to Average Net AssetsI,J | |||||
| Expenses before reductions | 2.06% | 2.11% | 2.18% | 2.13% | 2.10%K |
| Expenses net of fee waivers, if any | 2.06% | 2.11% | 2.18% | 2.13% | 2.10%K |
| Expenses net of all reductions | 2.06% | 2.07% | 2.17% | 2.11% | 2.10%K |
| Net investment income (loss) | .04% | (.09)% | (.17)% | .18% | 1.19%K |
| Supplemental Data | |||||
| Net assets, end of period (000 omitted) | $10,060 | $10,721 | $9,007 | $11,151 | $6,818 |
| Portfolio turnover rateL | 57% | 73% | 62% | 87% | 80%M |
A For the period March 18, 2014 (commencement of sale of shares) to October 31, 2014.
B Calculated based on average shares outstanding during the period.
C Net realized and unrealized gain (loss) per share reflects proceeds received from litigation which amounted to $.18 per share. Excluding these litigation proceeds, the total return would have been (10.47)%.
D Total distributions of $.28 per share is comprised of distributions from net investment income of $.123 and distributions from net realized gain of $.154 per share.
E Amount represents less than $.005 per share.
F Total returns for periods of less than one year are not annualized.
G Total returns would have been lower if certain expenses had not been reduced during the applicable periods shown.
H Total returns do not include the effect of the contingent deferred sales charge.
I Fees and expenses of any underlying Fidelity Central Funds are not included in the Fund's expense ratio. The Fund indirectly bears its proportionate share of the expenses of any underlying Fidelity Central Funds.
J Expense ratios reflect operating expenses of the class. Expenses before reductions do not reflect amounts reimbursed by the investment adviser or reductions from brokerage service arrangements or reductions from other expense offset arrangements and do not represent the amount paid by the class during periods when reimbursements or reductions occur. Expense ratios before reductions for start-up periods may not be representative of longer-term operating periods. Expenses net of fee waivers reflect expenses after reimbursement by the investment adviser but prior to reductions from brokerage service arrangements or other expense offset arrangements. Expenses net of all reductions represent the net expenses paid by the class.
K Annualized
L Amount does not include the portfolio activity of any underlying Fidelity Central Funds.
M The portfolio turnover rate does not include the assets acquired in the merger.
See accompanying notes which are an integral part of the financial statements.
Fidelity Europe Fund
| Years ended October 31, | 2018 | 2017 | 2016 | 2015 | 2014 |
| Selected Per–Share Data | |||||
| Net asset value, beginning of period | $42.53 | $34.26 | $37.19 | $36.32 | $37.92 |
| Income from Investment Operations | |||||
| Net investment income (loss)A | .48 | .38 | .33 | .48 | .94B |
| Net realized and unrealized gain (loss) | (4.24)C | 8.40 | (2.68) | 1.30 | (2.00) |
| Total from investment operations | (3.76) | 8.78 | (2.35) | 1.78 | (1.06) |
| Distributions from net investment income | (.41) | (.38) | (.43) | (.91) | (.52) |
| Distributions from net realized gain | (.66) | (.13) | (.15) | – | (.02) |
| Total distributions | (1.07) | (.51) | (.58) | (.91) | (.54) |
| Redemption fees added to paid in capitalA | – | –D | –D | –D | –D |
| Net asset value, end of period | $37.70 | $42.53 | $34.26 | $37.19 | $36.32 |
| Total ReturnE | (9.05)%C | 26.05% | (6.42)% | 4.97% | (2.82)% |
| Ratios to Average Net AssetsF,G | |||||
| Expenses before reductions | .96% | 1.00% | 1.07% | 1.03% | .97% |
| Expenses net of fee waivers, if any | .96% | 1.00% | 1.07% | 1.03% | .97% |
| Expenses net of all reductions | .96% | .96% | 1.06% | 1.01% | .96% |
| Net investment income (loss) | 1.14% | 1.02% | .94% | 1.28% | 2.43%B |
| Supplemental Data | |||||
| Net assets, end of period (000 omitted) | $941,670 | $1,343,213 | $1,066,488 | $1,384,134 | $1,237,047 |
| Portfolio turnover rateH | 57% | 73% | 62% | 87% | 80%I |
A Calculated based on average shares outstanding during the period.
B Net investment income per share reflects a large, non-recurring dividend which amounted to $.19 per share. Excluding this dividend the ratio would have been 1.93%.
C Net realized and unrealized gain (loss) per share reflects proceeds received from litigation which amounted to $.18 per share. Excluding these litigation proceeds, the total return would have been (9.48)%.
D Amount represents less than $.005 per share.
E Total returns would have been lower if certain expenses had not been reduced during the applicable periods shown.
F Fees and expenses of any underlying Fidelity Central Funds are not included in the Fund's expense ratio. The Fund indirectly bears its proportionate share of the expenses of any underlying Fidelity Central Funds.
G Expense ratios reflect operating expenses of the class. Expenses before reductions do not reflect amounts reimbursed by the investment adviser or reductions from brokerage service arrangements or reductions from other expense offset arrangements and do not represent the amount paid by the class during periods when reimbursements or reductions occur. Expenses net of fee waivers reflect expenses after reimbursement by the investment adviser but prior to reductions from brokerage service arrangements or other expense offset arrangements. Expenses net of all reductions represent the net expenses paid by the class.
H Amount does not include the portfolio activity of any underlying Fidelity Central Funds.
I The portfolio turnover rate does not include the assets acquired in the merger.
See accompanying notes which are an integral part of the financial statements.
Fidelity Europe Fund Class I
| Years ended October 31, | 2018 | 2017 | 2016 | 2015 | 2014 A |
| Selected Per–Share Data | |||||
| Net asset value, beginning of period | $42.53 | $34.29 | $37.21 | $36.32 | $39.45 |
| Income from Investment Operations | |||||
| Net investment income (loss)B | .48 | .39 | .35 | .50 | .56 |
| Net realized and unrealized gain (loss) | (4.23)C | 8.38 | (2.67) | 1.30 | (3.69) |
| Total from investment operations | (3.75) | 8.77 | (2.32) | 1.80 | (3.13) |
| Distributions from net investment income | (.43) | (.41) | (.45) | (.91) | – |
| Distributions from net realized gain | (.66) | (.13) | (.15) | – | – |
| Total distributions | (1.09) | (.53)D | (.60) | (.91) | – |
| Redemption fees added to paid in capitalB | – | –E | –E | –E | –E |
| Net asset value, end of period | $37.69 | $42.53 | $34.29 | $37.21 | $36.32 |
| Total ReturnF,G | (9.02)%C | 26.04% | (6.33)% | 5.02% | (7.93)% |
| Ratios to Average Net AssetsH,I | |||||
| Expenses before reductions | .95% | .98% | 1.01% | .98% | .97%J |
| Expenses net of fee waivers, if any | .95% | .98% | 1.01% | .98% | .97%J |
| Expenses net of all reductions | .95% | .94% | 1.00% | .96% | .96%J |
| Net investment income (loss) | 1.16% | 1.04% | 1.00% | 1.33% | 2.33%J |
| Supplemental Data | |||||
| Net assets, end of period (000 omitted) | $7,318 | $8,469 | $5,340 | $6,552 | $5,666 |
| Portfolio turnover rateK | 57% | 73% | 62% | 87% | 80%L |
A For the period March 18, 2014 (commencement of sale of shares) to October 31, 2014.
B Calculated based on average shares outstanding during the period.
C Net realized and unrealized gain (loss) per share reflects proceeds received from litigation which amounted to $.18 per share. Excluding these litigation proceeds, the total return would have been (9.45)%.
D Total distributions of $.53 per share is comprised of distributions from net investment income of $.408 and distributions from net realized gain of $.126 per share.
E Amount represents less than $.005 per share.
F Total returns for periods of less than one year are not annualized.
G Total returns would have been lower if certain expenses had not been reduced during the applicable periods shown.
H Fees and expenses of any underlying Fidelity Central Funds are not included in the Fund's expense ratio. The Fund indirectly bears its proportionate share of the expenses of any underlying Fidelity Central Funds.
I Expense ratios reflect operating expenses of the class. Expenses before reductions do not reflect amounts reimbursed by the investment adviser or reductions from brokerage service arrangements or reductions from other expense offset arrangements and do not represent the amount paid by the class during periods when reimbursements or reductions occur. Expense ratios before reductions for start-up periods may not be representative of longer-term operating periods. Expenses net of fee waivers reflect expenses after reimbursement by the investment adviser but prior to reductions from brokerage service arrangements or other expense offset arrangements. Expenses net of all reductions represent the net expenses paid by the class.
J Annualized
K Amount does not include the portfolio activity of any underlying Fidelity Central Funds.
L The portfolio turnover rate does not include the assets acquired in the merger.
See accompanying notes which are an integral part of the financial statements.
Fidelity Europe Fund Class Z
| Year ended October 31, | 2018 A |
| Selected Per–Share Data | |
| Net asset value, beginning of period | $41.00 |
| Income from Investment Operations | |
| Net investment income (loss)B | .06 |
| Net realized and unrealized gain (loss) | (3.37)C |
| Total from investment operations | (3.31) |
| Net asset value, end of period | $37.69 |
| Total ReturnD,E | (8.07)%C |
| Ratios to Average Net AssetsF,G | |
| Expenses before reductions | .91%H |
| Expenses net of fee waivers, if any | .90%H |
| Expenses net of all reductions | .90%H |
| Net investment income (loss) | 2.04%H |
| Supplemental Data | |
| Net assets, end of period (000 omitted) | $104 |
| Portfolio turnover rateI | 57% |
A For the period October 2, 2018 (commencement of sale of shares) to October 31, 2018.
B Calculated based on average shares outstanding during the period.
C Net realized and unrealized gain (loss) per share reflects proceeds received from litigation which amounted to $.16 per share. Excluding these litigation proceeds, the total return would have been (8.50)%.
D Total returns for periods of less than one year are not annualized.
E Total returns would have been lower if certain expenses had not been reduced during the applicable periods shown.
F Fees and expenses of any underlying Fidelity Central Funds are not included in the Fund's expense ratio. The Fund indirectly bears its proportionate share of the expenses of any underlying Fidelity Central Funds.
G Expense ratios reflect operating expenses of the class. Expenses before reductions do not reflect amounts reimbursed by the investment adviser or reductions from brokerage service arrangements or reductions from other expense offset arrangements and do not represent the amount paid by the class during periods when reimbursements or reductions occur. Expense ratios before reductions for start-up periods may not be representative of longer-term operating periods. Expenses net of fee waivers reflect expenses after reimbursement by the investment adviser but prior to reductions from brokerage service arrangements or other expense offset arrangements. Expenses net of all reductions represent the net expenses paid by the class.
H Annualized
I Amount does not include the portfolio activity of any underlying Fidelity Central Funds.
See accompanying notes which are an integral part of the financial statements.
Notes to Financial Statements
For the period ended October 31, 2018
1. Organization.
Fidelity Europe Fund (the Fund) is a fund of Fidelity Investment Trust (the Trust) and is authorized to issue an unlimited number of shares. The Trust is registered under the Investment Company Act of 1940, as amended (the 1940 Act), as an open-end management investment company organized as a Massachusetts business trust. The Fund commenced sale of Class Z shares on October 2, 2018. The Fund offers Class A, Class M, Class C, Europe, Class I, and Class Z shares, each of which has equal rights as to assets and voting privileges. Each class has exclusive voting rights with respect to matters that affect that class.
2. Investments in Fidelity Central Funds.
The Fund may invest in Fidelity Central Funds, which are open-end investment companies generally available only to other investment companies and accounts managed by the investment adviser and its affiliates. The Fund's Schedule of Investments lists each of the Fidelity Central Funds held as of period end, if any, as an investment of the Fund, but does not include the underlying holdings of each Fidelity Central Fund. As an Investing Fund, the Fund indirectly bears its proportionate share of the expenses of the underlying Fidelity Central Funds.
The Money Market Central Funds seek preservation of capital and current income and are managed by Fidelity Investments Money Management, Inc. (FIMM), an affiliate of the investment adviser. Annualized expenses of the Money Market Central Funds as of their most recent shareholder report date are less than .005%.
A complete unaudited list of holdings for each Fidelity Central Fund is available upon request or at the Securities and Exchange Commission (the SEC) website at www.sec.gov. In addition, the financial statements of the Fidelity Central Funds, which are not covered by the Fund's Report of Independent Registered Public Accounting Firm, are available on the SEC website or upon request.
3. Significant Accounting Policies.
The Fund is an investment company and applies the accounting and reporting guidance of the Financial Accounting Standards Board (FASB) Accounting Standards Codification Topic 946 Financial Services – Investments Companies. The financial statements have been prepared in conformity with accounting principles generally accepted in the United States of America (GAAP), which require management to make certain estimates and assumptions at the date of the financial statements. Actual results could differ from those estimates. Subsequent events, if any, through the date that the financial statements were issued have been evaluated in the preparation of the financial statements. The following summarizes the significant accounting policies of the Fund:
Investment Valuation. Investments are valued as of 4:00 p.m. Eastern time on the last calendar day of the period. The Board of Trustees (the Board) has delegated the day to day responsibility for the valuation of the Fund's investments to the Fair Value Committee (the Committee) established by the Fund's investment adviser. In accordance with valuation policies and procedures approved by the Board, the Fund attempts to obtain prices from one or more third party pricing vendors or brokers to value its investments. When current market prices, quotations or currency exchange rates are not readily available or reliable, investments will be fair valued in good faith by the Committee, in accordance with procedures adopted by the Board. Factors used in determining fair value vary by investment type and may include market or investment specific events. The frequency with which these procedures are used cannot be predicted and they may be utilized to a significant extent. The Committee oversees the Fund's valuation policies and procedures and reports to the Board on the Committee's activities and fair value determinations. The Board monitors the appropriateness of the procedures used in valuing the Fund's investments and ratifies the fair value determinations of the Committee.
The Fund categorizes the inputs to valuation techniques used to value its investments into a disclosure hierarchy consisting of three levels as shown below:
- Level 1 – quoted prices in active markets for identical investments
- Level 2 – other significant observable inputs (including quoted prices for similar investments, interest rates, prepayment speeds, etc.)
- Level 3 – unobservable inputs (including the Fund's own assumptions based on the best information available)
Valuation techniques used to value the Fund's investments by major category are as follows:
Equity securities, including restricted securities, for which market quotations are readily available, are valued at the last reported sale price or official closing price as reported by a third party pricing vendor on the primary market or exchange on which they are traded and are categorized as Level 1 in the hierarchy. In the event there were no sales during the day or closing prices are not available, securities are valued at the last quoted bid price or may be valued using the last available price and are generally categorized as Level 2 in the hierarchy. For foreign equity securities, when market or security specific events arise, comparisons to the valuation of American Depositary Receipts (ADRs), futures contracts, Exchange-Traded Funds (ETFs)and certain indexes as well as quoted prices for similar securities may be used and would be categorized as Level 2 in the hierarchy. Utilizing these techniques may result in transfers between Level 1 and Level 2. For equity securities, including restricted securities, where observable inputs are limited, assumptions about market activity and risk are used and these securities may be categorized as Level 3 in the hierarchy.
Investments in open-end mutual funds, including the Fidelity Central Funds, are valued at their closing net asset value (NAV) each business day and are categorized as Level 1 in the hierarchy.
Changes in valuation techniques may result in transfers in or out of an assigned level within the disclosure hierarchy. The aggregate value of investments by input level as of October 31, 2018, including information on transfers between Levels 1 and 2, is included at the end of the applicable Fund's Schedule of Investments.
Foreign Currency. The Fund may use foreign currency contracts to facilitate transactions in foreign-denominated securities. Gains and losses from these transactions may arise from changes in the value of the foreign currency or if the counterparties do not perform under the contracts' terms.
Foreign-denominated assets, including investment securities, and liabilities are translated into U.S. dollars at the exchange rates at period end. Purchases and sales of investment securities, income and dividends received and expenses denominated in foreign currencies are translated into U.S. dollars at the exchange rate in effect on the transaction date.
The effects of exchange rate fluctuations on investments are included with the net realized and unrealized gain (loss) on investment securities. Other foreign currency transactions resulting in realized and unrealized gain (loss) are disclosed separately.
Investment Transactions and Income. For financial reporting purposes, the Fund's investment holdings and NAV include trades executed through the end of the last business day of the period. The NAV per share for processing shareholder transactions is calculated as of the close of business of the New York Stock Exchange (NYSE), normally 4:00 p.m. Eastern time and includes trades executed through the end of the prior business day. Gains and losses on securities sold are determined on the basis of identified cost and include proceeds received from litigation. Dividend income is recorded on the ex-dividend date, except for certain dividends from foreign securities where the ex-dividend date may have passed, which are recorded as soon as the Fund is informed of the ex-dividend date. Non-cash dividends included in dividend income, if any, are recorded at the fair market value of the securities received. Income and capital gain distributions from Fidelity Central Funds, if any, are recorded on the ex-dividend date. Investment income is recorded net of foreign taxes withheld where recovery of such taxes is uncertain.
Class Allocations and Expenses. Investment income, realized and unrealized capital gains and losses, common expenses of the Fund, and certain fund-level expense reductions, if any, are allocated daily on a pro-rata basis to each class based on the relative net assets of each class to the total net assets of the Fund. Each class differs with respect to transfer agent and distribution and service plan fees incurred. Certain expense reductions may also differ by class. For the reporting period, the allocated portion of income and expenses to each class as a percent of its average net assets may vary due to the timing of recording these transactions in relation to fluctuating net assets of the classes. Expenses directly attributable to a fund are charged to that fund. Expenses attributable to more than one fund are allocated among the respective funds on the basis of relative net assets or other appropriate methods. Expense estimates are accrued in the period to which they relate and adjustments are made when actual amounts are known.
Income Tax Information and Distributions to Shareholders. Each year, the Fund intends to qualify as a regulated investment company under Subchapter M of the Internal Revenue Code, including distributing substantially all of its taxable income and realized gains. As a result, no provision for U.S. Federal income taxes is required. As of October 31, 2018, the Fund did not have any unrecognized tax benefits in the financial statements; nor is the Fund aware of any tax positions for which it is reasonably possible that the total amounts of unrecognized tax benefits will significantly change in the next twelve months. The Fund files a U.S. federal tax return, in addition to state and local tax returns as required. The Fund's federal income tax returns are subject to examination by the Internal Revenue Service (IRS) for a period of three fiscal years after they are filed. State and local tax returns may be subject to examination for an additional fiscal year depending on the jurisdiction. Foreign taxes are provided for based on the Fund's understanding of the tax rules and rates that exist in the foreign markets in which it invests.
Distributions are declared and recorded on the ex-dividend date. Income and capital gain distributions are declared separately for each class. Income and capital gain distributions are determined in accordance with income tax regulations, which may differ from GAAP.
Capital accounts within the financial statements are adjusted for permanent book-tax differences. These adjustments have no impact on net assets or the results of operations. Capital accounts are not adjusted for temporary book-tax differences which will reverse in a subsequent period.
Book-tax differences are primarily due to foreign currency transactions, passive foreign investment companies (PFIC), deferred trustees compensation and losses deferred due to wash sales.
As of period end, the cost and unrealized appreciation (depreciation) in securities, and derivatives if applicable, for federal income tax purposes were as follows:
| Gross unrealized appreciation | $90,866,441 |
| Gross unrealized depreciation | (93,744,309) |
| Net unrealized appreciation (depreciation) | $(2,877,868) |
| Tax Cost | $976,918,351 |
The tax-based components of distributable earnings as of period end were as follows:
| Undistributed ordinary income | $32,158,544 |
| Undistributed long-term capital gain | $62,888,387 |
| Net unrealized appreciation (depreciation) on securities and other investments | $(2,934,498) |
The tax character of distributions paid was as follows:
| October 31, 2018 | October 31, 2017 | |
| Ordinary Income | $31,260,216 | $ 15,639,334 |
Restricted Securities. The Fund may invest in securities that are subject to legal or contractual restrictions on resale. These securities generally may be resold in transactions exempt from registration or to the public if the securities are registered. Disposal of these securities may involve time-consuming negotiations and expense, and prompt sale at an acceptable price may be difficult. Information regarding restricted securities is included at the end of the Fund's Schedule of Investments.
New Rule Issuance. During August 2018, the U.S. Securities and Exchange Commission issued Final Rule Release No. 33-10532, Disclosure Update and Simplification. This Final Rule includes amendments specific to registered investment companies that are intended to eliminate overlap in disclosure requirements between Regulation S-X and GAAP. In accordance with these amendments, certain line-items in the Fund's financial statements have been combined or removed for the current period as outlined in the table below.
| Financial Statement | Current Line-Item Presentation | Prior Line-Item Presentation |
| Statement of Assets and Liabilities | Total distributable earnings (loss) | Undistributed/Distributions in excess of/Accumulated net investment income (loss) Accumulated/Undistributed net realized gain (loss) Net unrealized appreciation (depreciation) |
| Statement of Changes in Net Assets | N/A - removed | Undistributed/Distributions in excess of/Accumulated net investment income (loss) end of period |
| Statement of Changes in Net Assets | Distributions to shareholders | Distributions to shareholders from net investment income Distributions to shareholders from net realized gain |
| Distributions to Shareholders Note to Financial Statements | Distributions to shareholders | Distributions to shareholders from net investment income Distributions to shareholders from net realized gain |
4. Purchases and Sales of Investments.
Purchases and sales of securities, other than short-term securities, aggregated $673,239,181 and $891,757,645, respectively.
5. Fees and Other Transactions with Affiliates.
Management Fee. Fidelity Management & Research Company (the investment adviser) and its affiliates provide the Fund with investment management related services for which the Fund pays a monthly management fee. The management fee is the sum of an individual fund fee rate that is based on an annual rate of .45% of the Fund's average net assets and an annualized group fee rate that averaged .24% during the period. The group fee rate is based upon the average net assets of all the mutual funds advised by the investment adviser, including any mutual funds previously advised by the investment adviser that are currently advised by Fidelity SelectCo, LLC, an affiliate of the investment adviser. The group fee rate decreases as assets under management increase and increases as assets under management decrease. In addition, the management fee is subject to a performance adjustment (up to a maximum of +/- .20% of the Fund's average net assets over a 36 month performance period). The upward or downward adjustment to the management fee is based on the relative investment performance of Europe as compared to its benchmark index, the MSCI Europe Index, over the same 36 month performance period. For the reporting period, the total annual management fee rate, including the performance adjustment, was .71% of the Fund's average net assets. The performance adjustment included in the management fee rate may be higher or lower than the maximum performance adjustment rate due to the difference between the average net assets for the reporting and performance periods.
Distribution and Service Plan Fees. In accordance with Rule 12b-1 of the 1940 Act, the Fund has adopted separate Distribution and Service Plans for each class of shares. Certain classes pay Fidelity Distributors Corporation (FDC), an affiliate of the investment adviser, separate Distribution and Service Fees, each of which is based on an annual percentage of each class' average net assets. In addition, FDC may pay financial intermediaries for selling shares of the Fund and providing shareholder support services. For the period, the Distribution and Service Fee rates, total fees and amounts retained by FDC were as follows:
| Distribution Fee | Service Fee | Total Fees | Retained by FDC | |
| Class A | -% | .25% | $54,231 | $6,260 |
| Class M | .25% | .25% | 44,642 | 1,000 |
| Class C | .75% | .25% | 117,108 | 24,428 |
| $215,981 | $31,688 |
Sales Load. FDC may receive a front-end sales charge of up to 5.75% for selling Class A shares and 3.50% for selling Class M shares, some of which is paid to financial intermediaries for selling shares of the Fund. Depending on the holding period, FDC may receive contingent deferred sales charges levied on Class A, Class M and Class C redemptions. The deferred sales charges are 1.00% for Class C shares, 1.00% for certain purchases of Class A shares and .25% for certain purchases of Class M shares.
For the period, sales charge amounts retained by FDC were as follows:
| Retained by FDC | |
| Class A | $12,915 |
| Class M | 1,411 |
| Class C(a) | 3,162 |
| $17,488 |
(a) When Class C shares are initially sold, FDC pays commissions from its own resources to financial intermediaries through which the sales are made.
Transfer Agent Fees. Fidelity Investments Institutional Operations Company, Inc., (FIIOC), an affiliate of the investment adviser, is the transfer, dividend disbursing and shareholder servicing agent for each class of the Fund. FIIOC receives account fees and asset-based fees that vary according to the account size and type of account of the shareholders of the respective classes of the Fund, except for Class Z. FIIOC receives an asset-based fee of Class Z's average net assets. FIIOC pays for typesetting, printing and mailing of shareholder reports, except proxy statements.
For the period, transfer agent fees for each class were as follows:
| Amount | % of Class-Level Average Net Assets | |
| Class A | $51,667 | .24 |
| Class M | 28,026 | .31 |
| Class C | 31,388 | .27 |
| Europe | 1,922,471 | .17 |
| Class I | 14,017 | .16 |
| Class Z | 3 | .04(a) |
| $2,047,572 |
(a) Annualized
Accounting and Security Lending Fees. Fidelity Service Company, Inc. (FSC), an affiliate of the investment adviser, maintains the Fund's accounting records. The accounting fee is based on the level of average net assets for each month. Under a separate contract, FSC administers the security lending program. The security lending fee is based on the number and duration of lending transactions. For the period, the fees were equivalent to an annual rate of .05%.
Interfund Lending Program. Pursuant to an Exemptive Order issued by the SEC, the Fund, along with other registered investment companies having management contracts with Fidelity Management & Research Company (FMR) or other affiliated entities of FMR, may participate in an interfund lending program. This program provides an alternative credit facility allowing the funds to borrow from, or lend money to, other participating affiliated funds. At period end, there were no interfund loans outstanding. The Fund's activity in this program during the period for which loans were outstanding was as follows:
| Borrower or Lender | Average Loan Balance | Weighted Average Interest Rate | Interest Expense |
| Borrower | $6,686,400 | 2.36% | $2,196 |
Interfund Trades. The Fund may purchase from or sell securities to other Fidelity Funds under procedures adopted by the Board. The procedures have been designed to ensure these interfund trades are executed in accordance with Rule 17a-7 of the 1940 Act. Interfund trades are included within the respective purchases and sales amounts shown in the Purchases and Sales of Investments note.
Other. During the period, the investment adviser reimbursed the Fund for certain losses in the amount of $92,117.
6. Committed Line of Credit.
The Fund participates with other funds managed by the investment adviser or an affiliate in a $4.25 billion credit facility (the "line of credit") to be utilized for temporary or emergency purposes to fund shareholder redemptions or for other short-term liquidity purposes. The Fund has agreed to pay commitment fees on its pro-rata portion of the line of credit, which amounted to $3,384 and is reflected in Miscellaneous expenses on the Statement of Operations. During the period, the Fund did not borrow on this line of credit.
7. Security Lending.
The Fund lends portfolio securities through a lending agent from time to time in order to earn additional income. For equity securities, a lending agent is used and may loan securities to certain qualified borrowers, including Fidelity Capital Markets (FCM), a broker-dealer affiliated with the Fund. On the settlement date of the loan, the Fund receives collateral (in the form of U.S. Treasury obligations, letters of credit and/or cash) against the loaned securities and maintains collateral in an amount not less than 100% of the market value of the loaned securities during the period of the loan. The market value of the loaned securities is determined at the close of business of the Fund and any additional required collateral is delivered to the Fund on the next business day. The Fund or borrower may terminate the loan at any time, and if the borrower defaults on its obligation to return the securities loaned because of insolvency or other reasons, the Fund may apply collateral received from the borrower against the obligation. The Fund may experience delays and costs in recovering the securities loaned. Any cash collateral received is invested in the Fidelity Securities Lending Cash Central Fund. The value of loaned securities and cash collateral at period end are disclosed on the Fund's Statement of Assets and Liabilities. Security lending income represents the income earned on investing cash collateral, less rebates paid to borrowers and any lending agent fees associated with the loan, plus any premium payments received for lending certain types of securities. Security lending income is presented in the Statement of Operations as a component of income from Fidelity Central Funds. Total security lending income during the period amounted to $322,082. During the period, there were no securities loaned to FCM.
8. Expense Reductions.
During the period the investment adviser reimbursed and/or waived a portion of fund-level operating expenses in the amount of $12,551.
9. Distributions to Shareholders.
Distributions to shareholders of each class were as follows:
| Year ended October 31, 2018 | Year ended October 31, 2017 | |
| Distributions to shareholders | ||
| Class A | $501,208 | $– |
| Class M | 186,202 | – |
| Class C | 200,227 | – |
| Europe | 30,143,621 | – |
| Class I | 228,958 | – |
| Total | $31,260,216 | $– |
| From net investment income | ||
| Class A | $– | $107,755 |
| Class M | – | 18,342 |
| Europe | – | 11,539,715 |
| Class I | – | 62,056 |
| Total | $– | $11,727,868 |
| From net realized gain | ||
| Class A | $– | $60,612 |
| Class M | – | 25,396 |
| Europe | – | 3,806,294 |
| Class I | – | 19,164 |
| Total | $– | $3,911,466 |
10. Share Transactions.
Share transactions for each class were as follows and may contain automatic conversions between classes or exchanges between affiliated funds:
| Shares | Shares | Dollars | Dollars | |
| Year ended October 31, 2018(a) | Year ended October 31, 2017 | Year ended October 31, 2018(a) | Year ended October 31, 2017 | |
| Class A | ||||
| Shares sold | 219,725 | 183,985 | $9,120,083 | $7,204,193 |
| Reinvestment of distributions | 11,776 | 4,870 | 482,917 | 160,602 |
| Shares redeemed | (204,787) | (201,553) | (8,469,723) | (7,350,664) |
| Net increase (decrease) | 26,714 | (12,698) | $1,133,277 | $14,131 |
| Class M | ||||
| Shares sold | 32,492 | 58,824 | $1,375,839 | $2,231,944 |
| Reinvestment of distributions | 4,513 | 1,308 | 185,442 | 43,252 |
| Shares redeemed | (52,789) | (55,679) | (2,166,691) | (2,027,896) |
| Net increase (decrease) | (15,784) | 4,453 | $(605,410) | $247,300 |
| Class C | ||||
| Shares sold | 79,985 | 65,577 | $3,363,120 | $2,522,918 |
| Reinvestment of distributions | 4,833 | – | 197,576 | – |
| Shares redeemed | (68,943) | (77,588) | (2,831,033) | (2,798,078) |
| Net increase (decrease) | 15,875 | (12,011) | $729,663 | $(275,160) |
| Europe | ||||
| Shares sold | 2,475,476 | 6,873,387 | $104,461,482 | $263,271,628 |
| Reinvestment of distributions | 696,409 | 443,969 | 28,552,790 | 14,619,907 |
| Shares redeemed | (9,777,479) | (6,861,890) | (410,827,963) | (254,648,472) |
| Net increase (decrease) | (6,605,594) | 455,466 | $(277,813,691) | $23,243,063 |
| Class I | ||||
| Shares sold | 129,107 | 152,572 | $5,438,702 | $5,796,106 |
| Reinvestment of distributions | 5,434 | 2,369 | 222,682 | 78,022 |
| Shares redeemed | (139,490) | (111,570) | (5,809,512) | (4,088,518) |
| Net increase (decrease) | (4,949) | 43,371 | $(148,128) | $1,785,610 |
| Class Z | ||||
| Shares sold | 2,761 | – | $111,832 | $– |
| Net increase (decrease) | 2,761 | – | $111,832 | $– |
(a) Share transactions for Class Z are for the period October 2, 2018 (commencement of sale of shares) to October 31, 2018.
11. Other.
The Fund's organizational documents provide former and current trustees and officers with a limited indemnification against liabilities arising in connection with the performance of their duties to the Fund. In the normal course of business, the Fund may also enter into contracts that provide general indemnifications. The Fund's maximum exposure under these arrangements is unknown as this would be dependent on future claims that may be made against the Fund. The risk of material loss from such claims is considered remote.
Report of Independent Registered Public Accounting Firm
To the Board of Trustees of Fidelity Investment Trust and Shareholders of Fidelity Europe Fund:
Opinion on the Financial Statements
We have audited the accompanying statement of assets and liabilities, including the schedule of investments, of Fidelity Europe Fund (one of the funds constituting Fidelity Investment Trust, referred to hereafter as the "Fund") as of October 31, 2018, the related statement of operations for the year ended October 31, 2018, the statement of changes in net assets for each of the two years in the period ended October 31, 2018, including the related notes, and the financial highlights for each of the periods indicated therein (collectively referred to as the “financial statements”). In our opinion, the financial statements present fairly, in all material respects, the financial position of the Fund as of October 31, 2018, the results of its operations for the year then ended, the changes in its net assets for each of the two years in the period ended October 31, 2018 and the financial highlights for each of the periods indicated therein in conformity with accounting principles generally accepted in the United States of America.
Basis for Opinion
These financial statements are the responsibility of the Fund’s management. Our responsibility is to express an opinion on the Fund’s financial statements based on our audits. We are a public accounting firm registered with the Public Company Accounting Oversight Board (United States) (“PCAOB”) and are required to be independent with respect to the Fund in accordance with the U.S. federal securities laws and the applicable rules and regulations of the Securities and Exchange Commission and the PCAOB.
We conducted our audits of these financial statements in accordance with the standards of the PCAOB. Those standards require that we plan and perform the audit to obtain reasonable assurance about whether the financial statements are free of material misstatement, whether due to error or fraud.
Our audits included performing procedures to assess the risks of material misstatement of the financial statements, whether due to error or fraud, and performing procedures that respond to those risks. Such procedures included examining, on a test basis, evidence regarding the amounts and disclosures in the financial statements. Our audits also included evaluating the accounting principles used and significant estimates made by management, as well as evaluating the overall presentation of the financial statements. Our procedures included confirmation of securities owned as of October 31, 2018 by correspondence with the custodian. We believe that our audits provide a reasonable basis for our opinion.
PricewaterhouseCoopers LLP
Boston, Massachusetts
December 14, 2018
We have served as the auditor of one or more investment companies in the Fidelity group of funds since 1932.
Trustees and Officers
The Trustees, Members of the Advisory Board (if any), and officers of the trust and fund, as applicable, are listed below. The Board of Trustees governs the fund and is responsible for protecting the interests of shareholders. The Trustees are experienced executives who meet periodically throughout the year to oversee the fund's activities, review contractual arrangements with companies that provide services to the fund, oversee management of the risks associated with such activities and contractual arrangements, and review the fund's performance. Except for Jonathan Chiel, each of the Trustees oversees 283 funds. Mr. Chiel oversees 154 funds.
The Trustees hold office without limit in time except that (a) any Trustee may resign; (b) any Trustee may be removed by written instrument, signed by at least two-thirds of the number of Trustees prior to such removal; (c) any Trustee who requests to be retired or who has become incapacitated by illness or injury may be retired by written instrument signed by a majority of the other Trustees; and (d) any Trustee may be removed at any special meeting of shareholders by a two-thirds vote of the outstanding voting securities of the trust. Each Trustee who is not an interested person (as defined in the 1940 Act) of the trust and the fund is referred to herein as an Independent Trustee. Each Independent Trustee shall retire not later than the last day of the calendar year in which his or her 75th birthday occurs. The Independent Trustees may waive this mandatory retirement age policy with respect to individual Trustees. Officers and Advisory Board Members hold office without limit in time, except that any officer or Advisory Board Member may resign or may be removed by a vote of a majority of the Trustees at any regular meeting or any special meeting of the Trustees. Except as indicated, each individual has held the office shown or other offices in the same company for the past five years.
The fund’s Statement of Additional Information (SAI) includes more information about the Trustees. To request a free copy, call Fidelity at 1-877-208-0098.
Experience, Skills, Attributes, and Qualifications of the Trustees. The Governance and Nominating Committee has adopted a statement of policy that describes the experience, qualifications, attributes, and skills that are necessary and desirable for potential Independent Trustee candidates (Statement of Policy). The Board believes that each Trustee satisfied at the time he or she was initially elected or appointed a Trustee, and continues to satisfy, the standards contemplated by the Statement of Policy. The Governance and Nominating Committee also engages professional search firms to help identify potential Independent Trustee candidates who have the experience, qualifications, attributes, and skills consistent with the Statement of Policy. From time to time, additional criteria based on the composition and skills of the current Independent Trustees, as well as experience or skills that may be appropriate in light of future changes to board composition, business conditions, and regulatory or other developments, have also been considered by the professional search firms and the Governance and Nominating Committee. In addition, the Board takes into account the Trustees' commitment and participation in Board and committee meetings, as well as their leadership of standing and ad hoc committees throughout their tenure.
In determining that a particular Trustee was and continues to be qualified to serve as a Trustee, the Board has considered a variety of criteria, none of which, in isolation, was controlling. The Board believes that, collectively, the Trustees have balanced and diverse experience, qualifications, attributes, and skills, which allow the Board to operate effectively in governing the fund and protecting the interests of shareholders. Information about the specific experience, skills, attributes, and qualifications of each Trustee, which in each case led to the Board's conclusion that the Trustee should serve (or continue to serve) as a trustee of the fund, is provided below.
Board Structure and Oversight Function. James C. Curvey is an interested person and currently serves as Chairman. The Trustees have determined that an interested Chairman is appropriate and benefits shareholders because an interested Chairman has a personal and professional stake in the quality and continuity of services provided to the fund. Independent Trustees exercise their informed business judgment to appoint an individual of their choosing to serve as Chairman, regardless of whether the Trustee happens to be independent or a member of management. The Independent Trustees have determined that they can act independently and effectively without having an Independent Trustee serve as Chairman and that a key structural component for assuring that they are in a position to do so is for the Independent Trustees to constitute a substantial majority for the Board. The Independent Trustees also regularly meet in executive session. Ned C. Lautenbach serves as Chairman of the Independent Trustees and as such (i) acts as a liaison between the Independent Trustees and management with respect to matters important to the Independent Trustees and (ii) with management prepares agendas for Board meetings.
Fidelity® funds are overseen by different Boards of Trustees. The fund's Board oversees Fidelity's high income and certain equity funds, and other Boards oversee Fidelity's investment-grade bond, money market, asset allocation, and other equity funds. The asset allocation funds may invest in Fidelity® funds overseen by the fund's Board. The use of separate Boards, each with its own committee structure, allows the Trustees of each group of Fidelity® funds to focus on the unique issues of the funds they oversee, including common research, investment, and operational issues. On occasion, the separate Boards establish joint committees to address issues of overlapping consequences for the Fidelity® funds overseen by each Board.
The Trustees operate using a system of committees to facilitate the timely and efficient consideration of all matters of importance to the Trustees, the fund, and fund shareholders and to facilitate compliance with legal and regulatory requirements and oversight of the fund's activities and associated risks. The Board, acting through its committees, has charged FMR and its affiliates with (i) identifying events or circumstances the occurrence of which could have demonstrably adverse effects on the fund's business and/or reputation; (ii) implementing processes and controls to lessen the possibility that such events or circumstances occur or to mitigate the effects of such events or circumstances if they do occur; and (iii) creating and maintaining a system designed to evaluate continuously business and market conditions in order to facilitate the identification and implementation processes described in (i) and (ii) above. Because the day-to-day operations and activities of the fund are carried out by or through FMR, its affiliates, and other service providers, the fund's exposure to risks is mitigated but not eliminated by the processes overseen by the Trustees. While each of the Board's committees has responsibility for overseeing different aspects of the fund's activities, oversight is exercised primarily through the Operations, Audit, and Compliance Committees. In addition, the Independent Trustees have worked with Fidelity to enhance the Board's oversight of investment and financial risks, legal and regulatory risks, technology risks, and operational risks, including the development of additional risk reporting to the Board. Appropriate personnel, including but not limited to the fund's Chief Compliance Officer (CCO), FMR's internal auditor, the independent accountants, the fund's Treasurer and portfolio management personnel, make periodic reports to the Board's committees, as appropriate, including an annual review of Fidelity's risk management program for the Fidelity® funds. The responsibilities of each standing committee, including their oversight responsibilities, are described further under "Standing Committees of the Trustees."
Interested Trustees*:
Correspondence intended for a Trustee who is an interested person may be sent to Fidelity Investments, 245 Summer Street, Boston, Massachusetts 02210.
Name, Year of Birth; Principal Occupations and Other Relevant Experience+
Jonathan Chiel (1957)
Year of Election or Appointment: 2016
Trustee
Mr. Chiel also serves as Trustee of other Fidelity® funds. Mr. Chiel is Executive Vice President and General Counsel for FMR LLC (diversified financial services company, 2012-present). Previously, Mr. Chiel served as general counsel (2004-2012) and senior vice president and deputy general counsel (2000-2004) for John Hancock Financial Services; a partner with Choate, Hall & Stewart (1996-2000) (law firm); and an Assistant United States Attorney for the United States Attorney’s Office of the District of Massachusetts (1986-95), including Chief of the Criminal Division (1993-1995). Mr. Chiel is a director on the boards of the Boston Bar Foundation and the Maimonides School.
James C. Curvey (1935)
Year of Election or Appointment: 2007
Trustee
Chairman of the Board of Trustees
Mr. Curvey also serves as Trustee of other Fidelity® funds. Mr. Curvey is Vice Chairman (2007-present) and Director of FMR LLC (diversified financial services company). In addition, Mr. Curvey is an Overseer Emeritus for the Boston Symphony Orchestra, a Director of Artis-Naples, and a Trustee of Brewster Academy in Wolfeboro, New Hampshire. Previously, Mr. Curvey served as a Director of Fidelity Research & Analysis Co. (investment adviser firm, 2009-2018), Director of Fidelity Investments Money Management, Inc. (investment adviser firm, 2009-2014) and a Director of FMR and FMR Co., Inc. (investment adviser firms, 2007-2014).
Charles S. Morrison (1960)
Year of Election or Appointment: 2014
Trustee
Mr. Morrison also serves as Trustee of other funds. He serves as President of Fidelity SelectCo, LLC (investment adviser firm, 2017-present) and Fidelity Management & Research Company (FMR) (investment adviser firm, 2016-present), a Director of Fidelity Investments Money Management, Inc. (FIMM) (investment adviser firm, 2014-present), Director of Fidelity SelectCo, LLC (investment adviser firm, 2014-present), President, Asset Management (2014-present), and is an employee of Fidelity Investments. Previously, Mr. Morrison served as Vice President of Fidelity's Fixed Income and Asset Allocation Funds (2012-2014), President, Fixed Income (2011-2014), Vice President of Fidelity's Money Market Funds (2005-2009), President, Money Market Group Leader of FMR (investment adviser firm, 2009), and Senior Vice President, Money Market Group of FMR (2004-2009). Mr. Morrison also served as Vice President of Fidelity's Bond Funds (2002-2005), certain Balanced Funds (2002-2005), and certain Asset Allocation Funds (2002-2007), and as Senior Vice President (2002-2005) of Fidelity's Bond Division.
* Determined to be an “Interested Trustee” by virtue of, among other things, his or her affiliation with the trust or various entities under common control with FMR.
+ The information includes the Trustee's principal occupation during the last five years and other information relating to the experience, attributes, and skills relevant to the Trustee's qualifications to serve as a Trustee, which led to the conclusion that the Trustee should serve as a Trustee for the fund.
Independent Trustees:
Correspondence intended for an Independent Trustee may be sent to Fidelity Investments, P.O. Box 55235, Boston, Massachusetts 02205-5235.
Name, Year of Birth; Principal Occupations and Other Relevant Experience+
Dennis J. Dirks (1948)
Year of Election or Appointment: 2005
Trustee
Mr. Dirks also serves as Trustee of other Fidelity® funds. Prior to his retirement in May 2003, Mr. Dirks was Chief Operating Officer and a member of the Board of The Depository Trust & Clearing Corporation (DTCC). He also served as President, Chief Operating Officer, and Board member of The Depository Trust Company (DTC) and President and Board member of the National Securities Clearing Corporation (NSCC). In addition, Mr. Dirks served as Chief Executive Officer and Board member of the Government Securities Clearing Corporation, Chief Executive Officer and Board member of the Mortgage-Backed Securities Clearing Corporation, as a Trustee and a member of the Finance Committee of Manhattan College (2005-2008), as a Trustee and a member of the Finance Committee of AHRC of Nassau County (2006-2008), as a member of the Independent Directors Council (IDC) Governing Council (2010-2015), and as a member of the Board of Directors for The Brookville Center for Children’s Services, Inc. (2009-2017). Mr. Dirks is a member of the Finance Committee (2016-present), Board of Directors (2017-present) and Board of Trustees (2018-present) and is Treasurer (2018-present) of the Asolo Repertory Theatre.
Donald F. Donahue (1950)
Year of Election or Appointment: 2018
Trustee
Mr. Donahue also serves as a Trustee of other Fidelity® funds. Mr. Donahue is President and Chief Executive Officer of Miranda Partners, LLC (risk consulting for the financial services industry, 2012-present). Previously, Mr. Donahue served as a Member of the Advisory Board of certain Fidelity® funds (2015-2018) and Chief Executive Officer (2006-2012), Chief Operating Officer (2003-2006), and Managing Director, Customer Marketing and Development (1999-2003) of The Depository Trust & Clearing Corporation (financial markets infrastructure). Mr. Donahue serves as a Member (2007-present) and Co-Chairman (2016-present) of the Board of Directors of United Way of New York, Member of the Board of Directors of NYC Leadership Academy (2012-present) and Member of the Board of Advisors of Ripple Labs, Inc. (financial services, 2015-present). He also served as Chairman (2010-2012) and Member of the Board of Directors (2012-2013) of Omgeo, LLC (financial services), Treasurer of United Way of New York (2012-2016), and Member of the Board of Directors of XBRL US (financial services non-profit, 2009-2012) and the International Securities Services Association (2009-2012).
Alan J. Lacy (1953)
Year of Election or Appointment: 2008
Trustee
Mr. Lacy also serves as Trustee of other Fidelity® funds. Mr. Lacy serves as a Director of Bristol-Myers Squibb Company (global pharmaceuticals, 2008-present). He is a Trustee of the California Chapter of The Nature Conservancy (2015-present) and a Director of the Center for Advanced Study in the Behavioral Sciences at Stanford University (2015-present). In addition, Mr. Lacy served as Senior Adviser (2007-2014) of Oak Hill Capital Partners, L.P. (private equity) and also served as Chief Executive Officer (2005) and Vice Chairman (2005-2006) of Sears Holdings Corporation (retail) and Chief Executive Officer and Chairman of the Board of Sears, Roebuck and Co. (retail, 2000-2005). Previously, Mr. Lacy served as Chairman (2014-2017) and a member (2010-2017) of the Board of Directors of Dave & Buster’s Entertainment, Inc. (restaurant and entertainment complexes), as Chairman (2008-2011) and a member (2006-2015) of the Board of Trustees of the National Parks Conservation Association, and as a member of the Board of Directors for The Hillman Companies, Inc. (hardware wholesalers, 2010-2014), Earth Fare, Inc. (retail grocery, 2010-2014), and The Western Union Company (global money transfer, 2006-2011).
Ned C. Lautenbach (1944)
Year of Election or Appointment: 2000
Trustee
Chairman of the Independent Trustees
Mr. Lautenbach also serves as Trustee of other Fidelity® funds. Mr. Lautenbach currently serves as Vice Chair of the Board of Governors, State University System of Florida (2013-present) and is a member of the Council on Foreign Relations (1994-present). He is also a member and has most recently served as Chairman of the Board of Directors of Artis-Naples (2012-present). Previously, Mr. Lautenbach served as a member and then Lead Director of the Board of Directors of Eaton Corporation (diversified industrial, 1997-2016). He was also a Partner and Advisory Partner at Clayton, Dubilier & Rice, LLC (private equity investment, 1998-2010), as well as a Director of Sony Corporation (2006-2007). In addition, Mr. Lautenbach also had a 30-year career with IBM (technology company) during which time he served as Senior Vice President and a member of the Corporate Executive Committee (1968-1998).
Joseph Mauriello (1944)
Year of Election or Appointment: 2008
Trustee
Mr. Mauriello also serves as Trustee of other Fidelity® funds. Prior to his retirement in January 2006, Mr. Mauriello served in numerous senior management positions including Deputy Chairman and Chief Operating Officer (2004-2005), and Vice Chairman of Financial Services (2002-2004) of KPMG LLP US (professional services, 1965-2005). Mr. Mauriello currently serves as a member of the Independent Directors Council (IDC) Governing Council (2015-present). Previously, Mr. Mauriello served as a member of the Board of Directors of XL Group plc. (global insurance and re-insurance, 2006-2018).
Cornelia M. Small (1944)
Year of Election or Appointment: 2005
Trustee
Ms. Small also serves as Trustee of other Fidelity® funds. Ms. Small is a member of the Board of Directors (2009-present) and Chair of the Investment Committee (2010-present) of the Teagle Foundation. Ms. Small also serves on the Investment Committee of the Berkshire Taconic Community Foundation (2008-present). Previously, Ms. Small served as Chairperson (2002-2008) and a member of the Investment Committee and Chairperson (2008-2012) and a member of the Board of Trustees of Smith College. In addition, Ms. Small served as Chief Investment Officer, Director of Global Equity Investments, and a member of the Board of Directors of Scudder, Stevens & Clark and Scudder Kemper Investments.
Garnett A. Smith (1947)
Year of Election or Appointment: 2018
Trustee
Mr. Smith also serves as Trustee of other Fidelity® funds. Prior to Mr. Smith's retirement, he served as Chairman and Chief Executive Officer of Inbrand Corp. (manufacturer of personal absorbent products, 1990-1997). He also served as President (1986-1990) of Inbrand Corp. Prior to his employment with Inbrand Corp., he was employed by a retail fabric chain and North Carolina National Bank. In addition, Mr. Smith served as a Member of the Advisory Board of certain Fidelity® funds (2012-2013) and as a board member of the Jackson Hole Land Trust (2009-2012).
David M. Thomas (1949)
Year of Election or Appointment: 2008
Trustee
Mr. Thomas also serves as Trustee of other Fidelity® funds. Mr. Thomas serves as Non-Executive Chairman of the Board of Directors of Fortune Brands Home and Security (home and security products, 2011-present), as a member of the Board of Directors (2004-present) and Presiding Director (2013-present) of Interpublic Group of Companies, Inc. (marketing communication), and as a member of the Board of Trustees of the University of Florida (2013-present). Previously, Mr. Thomas served as Executive Chairman (2005-2006) and Chairman and Chief Executive Officer (2000-2005) of IMS Health, Inc. (pharmaceutical and healthcare information solutions), and a Director of Fortune Brands, Inc. (consumer products, 2000-2011).
+ The information includes the Trustee's principal occupation during the last five years and other information relating to the experience, attributes, and skills relevant to the Trustee's qualifications to serve as a Trustee, which led to the conclusion that the Trustee should serve as a Trustee for the fund.
Advisory Board Members and Officers:
Correspondence intended for a Member of the Advisory Board (if any) may be sent to Fidelity Investments, P.O. Box 55235, Boston, Massachusetts 02205-5235. Correspondence intended for an officer or Peter S. Lynch may be sent to Fidelity Investments, 245 Summer Street, Boston, Massachusetts 02210. Officers appear below in alphabetical order.
Name, Year of Birth; Principal Occupation
Vicki L. Fuller (1957)
Year of Election or Appointment: 2018
Member of the Advisory Board
Ms. Fuller also serves as Member of the Advisory Board of other Fidelity® funds. Ms. Fuller serves as a member of the Board of Directors, Audit Committee, and Nominating and Governance Committee of The Williams Companies, Inc. (natural gas infrastructure, 2018-present). Previously, Ms. Fuller served as the Chief Investment Officer of the New York State Common Retirement Fund (2012-2018) and held a variety of positions at AllianceBernstein L.P. (global asset management, 1985-2012), including Managing Director (2006-2012) and Senior Vice President and Senior Portfolio Manager (2001-2006).
Peter S. Lynch (1944)
Year of Election or Appointment: 2003
Member of the Advisory Board
Mr. Lynch also serves as Member of the Advisory Board of other Fidelity® funds. Mr. Lynch is Vice Chairman and a Director of FMR (investment adviser firm) and FMR Co., Inc. (investment adviser firm). In addition, Mr. Lynch serves as a Trustee of Boston College and as the Chairman of the Inner-City Scholarship Fund. Previously, Mr. Lynch served on the Special Olympics International Board of Directors (1997-2006).
William S. Stavropoulos (1939)
Year of Election or Appointment: 2018
Member of the Advisory Board
Mr. Stavropoulos also serves as Member of the Advisory Board of other Fidelity® funds. Mr. Stavropoulos serves as President and Founder of the Michigan Baseball Foundation, the Great Lakes Loons (2007-present). Mr. Stavropoulos is Chairman Emeritus of the Board of Directors of The Dow Chemical Company, where he previously served in numerous senior management positions, including President, CEO (1995-2000; 2002-2004), Chairman of the Executive Committee (2000-2006), and as a member of the Board of Directors (1990-2006). Currently, Mr. Stavropoulos is Chairman of the Board of Directors of Univar Inc. (global distributor of commodity and specialty chemicals), a Director of Teradata Corporation (data warehousing and technology solutions), and a member of the Advisory Board for Metalmark Capital LLC (private equity investment, 2005-present). Mr. Stavropoulos is an operating advisor to Clayton, Dubilier & Rice, LLC (private equity investment). In addition, Mr. Stavropoulos is a member of the University of Notre Dame Advisory Council for the College of Science, a Trustee of the Rollin L. Gerstacker Foundation, and a Director of Artis-Naples in Naples, Florida. Previously, Mr. Stavropoulos served as Trustee of certain Fidelity® funds (2001-2018) and as a Director of Chemical Financial Corporation (bank holding company, 1993-2012) and Tyco International, Ltd. (multinational manufacturing and services, 2007-2012).
Carol B. Tomé (1957)
Year of Election or Appointment: 2018
Member of the Advisory Board
Ms. Tomé also serves as Member of the Advisory Board of other Fidelity® funds. Ms. Tomé is Chief Financial Officer (2001-present) and Executive Vice President of Corporate Services (2007-present) of The Home Depot, Inc. (home improvement retailer) and a Director (2003-present) and Chair of the Audit Committee (2004-present) of United Parcel Service, Inc. (package delivery and supply chain management). Previously, Ms. Tomé served as Trustee of certain Fidelity® funds (2017), Senior Vice President of Finance and Accounting/Treasurer (2000-2007) and Vice President and Treasurer (1995-2000) of The Home Depot, Inc. and Chair of the Board (2010-2012), Vice Chair of the Board (2009 and 2013), and a Director (2008-2013) of the Federal Reserve Bank of Atlanta. Ms. Tomé is also a director or trustee of many community and professional organizations.
Michael E. Wiley (1950)
Year of Election or Appointment: 2018
Member of the Advisory Board
Mr. Wiley also serves as Trustee or Member of the Advisory Board of other Fidelity® funds. Mr. Wiley serves as a Director of High Point Resources (exploration and production, 2005-present). Previously, Mr. Wiley served as a Director of Andeavor Corporation (independent oil refiner and marketer, 2005-2018), a Director of Andeavor Logistics LP (natural resources logistics, 2015-2018), a Director of Post Oak Bank (privately-held bank, 2004-2018), a Director of Asia Pacific Exploration Consolidated (international oil and gas exploration and production, 2008-2013), a member of the Board of Trustees of the University of Tulsa (2000-2006; 2007-2010), a Senior Energy Advisor of Katzenbach Partners, LLC (consulting, 2006-2007), an Advisory Director of Riverstone Holdings (private investment), a Director of Spinnaker Exploration Company (exploration and production, 2001-2005) and Chairman, President, and CEO of Baker Hughes, Inc. (oilfield services, 2000-2004).
Elizabeth Paige Baumann (1968)
Year of Election or Appointment: 2017
Anti-Money Laundering (AML) Officer
Ms. Baumann also serves as AML Officer of other funds. She is Chief AML Officer (2012-present) and Senior Vice President (2014-present) of FMR LLC (diversified financial services company) and is an employee of Fidelity Investments. Previously, Ms. Baumann served as AML Officer of the funds (2012-2016), and Vice President (2007-2014) and Deputy Anti-Money Laundering Officer (2007-2012) of FMR LLC.
John J. Burke III (1964)
Year of Election or Appointment: 2018
Chief Financial Officer
Mr. Burke also serves as Chief Financial Officer of other funds. Mr. Burke serves as Head of Investment Operations for Fidelity Fund and Investment Operations (2018-present) and is an employee of Fidelity Investments (1998-present). Previously Mr. Burke served as head of Asset Management Investment Operations (2012-2018).
William C. Coffey (1969)
Year of Election or Appointment: 2018
Secretary and Chief Legal Officer (CLO)
Mr. Coffey also serves as Secretary and CLO of other funds. Mr. Coffey serves as CLO, Secretary, and Senior Vice President of Fidelity Management & Research Company and FMR Co., Inc. (investment adviser firms, 2018-present); Secretary of Fidelity SelectCo, LLC and Fidelity Investments Money Management, Inc. (investment adviser firms, 2018-present); and CLO of Fidelity Management & Research (Hong Kong) Limited, FMR Investment Management (UK) Limited, and Fidelity Management & Research (Japan) Limited (investment adviser firms, 2018-present). He is Senior Vice President and Deputy General Counsel of FMR LLC (diversified financial services company, 2010-present), and is an employee of Fidelity Investments. Previously, Mr. Coffey served as Assistant Secretary of certain funds (2009-2018) and as Vice President and Associate General Counsel of FMR LLC (2005-2009).
Timothy M. Cohen (1969)
Year of Election or Appointment: 2018
Vice President
Mr. Cohen also serves as Vice President of other funds. Mr. Cohen serves as Co-Head of Global Equity Research (2016-present), a Director of Fidelity Management & Research (Japan) Limited (investment adviser firm, 2016-present), and is an employee of Fidelity Investments. Previously, Mr. Cohen served as Chief Investment Officer - Equity and a Director of Fidelity Management & Research (U.K.) Inc. (investment adviser firm, 2013-2015) and as a Director of Fidelity Management & Research (Hong Kong) Limited (investment adviser firm, 2017).
Jonathan Davis (1968)
Year of Election or Appointment: 2010
Assistant Treasurer
Mr. Davis also serves as Assistant Treasurer of other funds. Mr. Davis serves as Assistant Treasurer of FMR Capital, Inc. (2017-present) and is an employee of Fidelity Investments. Previously, Mr. Davis served as Vice President and Associate General Counsel of FMR LLC (diversified financial services company, 2003-2010).
Adrien E. Deberghes (1967)
Year of Election or Appointment: 2016
Assistant Treasurer
Mr. Deberghes also serves as an officer of other funds. He serves as Assistant Treasurer of FMR Capital, Inc. (2017-present), Executive Vice President of Fidelity Investments Money Management, Inc. (FIMM) (investment adviser firm, 2016-present), and is an employee of Fidelity Investments (2008-present). Previously, Mr. Deberghes served as President and Treasurer of certain Fidelity® funds (2013-2018). Prior to joining Fidelity Investments, Mr. Deberghes was Senior Vice President of Mutual Fund Administration at State Street Corporation (2007-2008), Senior Director of Mutual Fund Administration at Investors Bank & Trust (2005-2007), and Director of Finance for Dunkin' Brands (2000-2005). Previously, Mr. Deberghes served in other fund officer roles.
Laura M. Del Prato (1964)
Year of Election or Appointment: 2018
Assistant Treasurer
Ms. Del Prato also serves as an officer of other funds. Ms. Del Prato is an employee of Fidelity Investments (2017-present). Prior to joining Fidelity Investments, Ms. Del Prato served as a Managing Director and Treasurer of the JPMorgan Mutual Funds (2014-2017). Prior to JPMorgan, Ms. Del Prato served as a partner at Cohen Fund Audit Services (accounting firm, 2012-2013) and KPMG LLP (accounting firm, 2004-2012).
Colm A. Hogan (1973)
Year of Election or Appointment: 2016
Deputy Treasurer
Mr. Hogan also serves as an officer of other funds. Mr. Hogan serves as Assistant Treasurer of FMR Capital, Inc. (2017-present) and is an employee of Fidelity Investments (2005-present). Previously, Mr. Hogan served as Assistant Treasurer of certain Fidelity® funds (2016-2018).
Pamela R. Holding (1964)
Year of Election or Appointment: 2018
Vice President
Ms. Holding also serves as Vice President of other funds. Ms. Holding serves as Co-Head of Global Equity Research (2018-present) and is an employee of Fidelity Investments (2013-present).
Chris Maher (1972)
Year of Election or Appointment: 2013
Assistant Treasurer
Mr. Maher serves as Assistant Treasurer of other funds. Mr. Maher is Vice President of Valuation Oversight, serves as Assistant Treasurer of FMR Capital, Inc. (2017-present), and is an employee of Fidelity Investments. Previously, Mr. Maher served as Vice President of Asset Management Compliance (2013), Vice President of the Program Management Group of FMR (investment adviser firm, 2010-2013), and Vice President of Valuation Oversight (2008-2010).
Rieco E. Mello (1969)
Year of Election or Appointment: 2017
Assistant Treasurer
Mr. Mello also serves as Assistant Treasurer of other funds. Mr. Mello serves as Assistant Treasurer of FMR Capital, Inc. (2017-present) and is an employee of Fidelity Investments (1995-present).
Kenneth B. Robins (1969)
Year of Election or Appointment: 2016
Chief Compliance Officer
Mr. Robins also serves as an officer of other funds. Mr. Robins serves as Compliance Officer of Fidelity Management & Research Company and FMR Co., Inc. (investment adviser firms, 2016-present) and is an employee of Fidelity Investments (2004-present). Previously, Mr. Robins served as Executive Vice President of Fidelity Investments Money Management, Inc. (investment adviser firm, 2013-2016) and served in other fund officer roles.
Stacie M. Smith (1974)
Year of Election or Appointment: 2016
President and Treasurer
Ms. Smith also serves as an officer of other funds. Ms. Smith serves as Assistant Treasurer of FMR Capital, Inc. (2017-present), is an employee of Fidelity Investments (2009-present), and has served in other fund officer roles. Prior to joining Fidelity Investments, Ms. Smith served as Senior Audit Manager of Ernst & Young LLP (accounting firm, 1996-2009). Previously, Ms. Smith served as Assistant Treasurer (2013-2018) and Deputy Treasurer (2013-2016) of certain Fidelity® funds.
Marc L. Spector (1972)
Year of Election or Appointment: 2016
Assistant Treasurer
Mr. Spector also serves as an officer of other funds. Mr. Spector serves as Assistant Treasurer of FMR Capital, Inc. (2017-present) and is an employee of Fidelity Investments (2016-present). Prior to joining Fidelity Investments, Mr. Spector served as Director at the Siegfried Group (accounting firm, 2013-2016), and prior to Siegfried Group as audit senior manager at Deloitte & Touche (accounting firm, 2005-2013).
Shareholder Expense Example
As a shareholder of the Fund, you incur two types of costs: (1) transaction costs, including sales charges (loads) on purchase payments or redemption proceeds, and (2) ongoing costs, including management fees, distribution and/or service (12b-1) fees and other Fund expenses. This Example is intended to help you understand your ongoing costs (in dollars) of investing in the Fund and to compare these costs with the ongoing costs of investing in other mutual funds.
The actual expense Example is based on an investment of $1,000 invested at the beginning of the period and held for the entire period (May 1, 2018 to October 31, 2018) for each Class, except Class Z, and for the period (October 2, 2018 to October 31, 2018) for Class Z. The hypothetical expense Example is based on an investment of $1,000 invested for the one-half year period (May 1, 2018 to October 31, 2018).
Actual Expenses
The first line of the accompanying table for each class of the Fund provides information about actual account values and actual expenses. You may use the information in this line, together with the amount you invested, to estimate the expenses that you paid over the period. Simply divide your account value by $1,000.00 (for example, an $8,600 account value divided by $1,000.00 = 8.6), then multiply the result by the number in the first line for a class of the Fund under the heading entitled "Expenses Paid During Period" to estimate the expenses you paid on your account during this period. A small balance maintenance fee of $12.00 that is charged once a year may apply for certain accounts with a value of less than $2,000. This fee, which was eliminated effective August 1, 2018, is not included in the table below. If it was, the estimate of expenses you paid during the period would be higher, and your ending account value lower, by this amount. In addition, the Fund, as a shareholder in the underlying Fidelity Central Funds, will indirectly bear its pro-rata share of the fees and expenses incurred by the underlying Fidelity Central Funds. These fees and expenses are not included in the Fund's annualized expense ratio used to calculate the expense estimate in the table below.
Hypothetical Example for Comparison Purposes
The second line of the accompanying table for each class of the Fund provides information about hypothetical account values and hypothetical expenses based on a Class' actual expense ratio and an assumed rate of return of 5% per year before expenses, which is not the Class' actual return. The hypothetical account values and expenses may not be used to estimate the actual ending account balance or expenses you paid for the period. You may use this information to compare the ongoing costs of investing in the Fund and other funds. To do so, compare this 5% hypothetical example with the 5% hypothetical examples that appear in the shareholder reports of the other funds. A small balance maintenance fee of $12.00 that is charged once a year may apply for certain accounts with a value of less than $2,000. This fee, which was eliminated effective August 1, 2018, is not included in the table below. If it was, the estimate of expenses you paid during the period would be higher, and your ending account value lower, by this amount. In addition, the Fund, as a shareholder in the underlying Fidelity Central Funds, will indirectly bear its pro-rata share of the fees and expenses incurred by the underlying Fidelity Central Funds. These fees and expenses are not included in the Fund's annualized expense ratio used to calculate the expense estimate in the table below.
Please note that the expenses shown in the table are meant to highlight your ongoing costs only and do not reflect any transaction costs. Therefore, the second line of the table is useful in comparing ongoing costs only, and will not help you determine the relative total costs of owning different funds. In addition, if these transactional costs were included, your costs would have been higher.
| Annualized Expense Ratio-A | Beginning Account Value | Ending Account Value October 31, 2018 | Expenses Paid During Period | |
| Class A | 1.23% | |||
| Actual | $1,000.00 | $907.60 | $5.91-B | |
| Hypothetical-C | $1,000.00 | $1,019.00 | $6.26-D | |
| Class M | 1.56% | |||
| Actual | $1,000.00 | $906.00 | $7.49-B | |
| Hypothetical-C | $1,000.00 | $1,017.34 | $7.93-D | |
| Class C | 2.02% | |||
| Actual | $1,000.00 | $903.90 | $9.69-B | |
| Hypothetical-C | $1,000.00 | $1,015.02 | $10.26-D | |
| Europe | .91% | |||
| Actual | $1,000.00 | $908.90 | $4.38-B | |
| Hypothetical-C | $1,000.00 | $1,020.62 | $4.63-D | |
| Class I | .89% | |||
| Actual | $1,000.00 | $909.10 | $4.28-B | |
| Hypothetical-C | $1,000.00 | $1,020.72 | $4.53-D | |
| Class Z | .90% | |||
| Actual | $1,000.00 | $919.30 | $.71-E | |
| Hypothetical-C | $1,000.00 | $1,020.67 | $4.58-D |
A Annualized expense ratio reflects expenses net of applicable fee waivers.
B Actual expenses are equal to each Class' annualized expense ratio, multiplied by the average account value over the period, multiplied by 184/365 (to reflect the one-half year period).
C 5% return per year before expenses
D Hypothetical expenses are equal to each Class' annualized expense ratio, multiplied by the average account value over the period, multiplied by 184/365 (to reflect the one-half year period).
E Actual expenses are equal to the Class' annualized expense ratio, multiplied by the average account value over the period, multiplied by 30/365 (to reflect the period October 2, 2018 to October 31, 2018).
Distributions (Unaudited)
The Board of Trustees of Fidelity Europe Fund voted to pay to shareholders of record at the opening of business on record date, the following distributions per share derived from capital gains realized from sales of portfolio securities and dividends derived from net investment income:
| Pay Date | Record Date | Dividends | Capital Gains | |
| Fidelity Europe Fund | ||||
| Class A | 12/17/18 | 12/14/18 | $0.108 | $3.427 |
| Class M | 12/17/18 | 12/14/18 | $0.000 | $3.381 |
| Class C | 12/17/18 | 12/14/18 | $0.000 | $3.298 |
| Europe | 12/17/18 | 12/14/18 | $0.318 | $3.427 |
| Class I | 12/17/18 | 12/14/18 | $0.323 | $3.427 |
| Class Z | 12/17/18 | 12/14/18 | $0.405 | $3.427 |
The fund hereby designates as a capital gain dividend with respect to the taxable year ended October 31, 2018, $62,888,387, or, if subsequently determined to be different, the net capital gain of such year.
Class A, Class M, Class C, Europe, and Class I designate 2% of the dividends distributed during the fiscal year as qualifying for the dividends–received deduction for corporate shareholders.
Class A designates 69%; Class M designates 77%; Class C designates 89%; Europe designates 64% and Class I designates 63% of the dividends distributed during the fiscal year as amounts which may be taken into account as a dividend for purposes of the maximum rate under section 1(h)(11) of the Internal Revenue Code.
The amounts per share which represent income derived from sources within, and taxes paid to, foreign countries or possessions of the United States are as follows:
| Pay Date | Income | Taxes | |
| Fidelity Europe Fund | |||
| Class A | 12/18/2017 | $0.7405 | $0.0616 |
| Class M | 12/18/2017 | $0.6684 | $0.0616 |
| Class C | 12/18/2017 | $0.5779 | $0.0616 |
| Europe | 12/18/2017 | $0.7977 | $0.0616 |
| Class I | 12/18/2017 | $0.8140 | $0.0616 |
The fund will notify shareholders in January 2019 of amounts for use in preparing 2018 income tax returns.
Board Approval of Investment Advisory Contracts
Fidelity Europe Fund
At its July 2018 meeting, the Board of Trustees, including the Independent Trustees (together, the Board), voted to continue the management contract with Fidelity Management & Research Company (FMR) and the sub-advisory agreements (together, the Advisory Contracts) for the fund for six months through January 31, 2019, in connection with the reunification of the Fidelity Equity High Income Funds Board, which oversees the fund, and the Sector Portfolios Board.
The Board considered that the approval of the fund's Advisory Contracts will not result in any changes in (i) the investment process or strategies employed in the management of the fund's assets; (ii) the fees and expenses paid by shareholders; (iii) the nature, extent or quality of services provided under the fund's Advisory Contracts; or (iv) the day-to-day management of the fund or the persons primarily responsible for such management. The Board concluded that the fund's Advisory Contracts are fair and reasonable, and that the fund's Advisory Contracts should be renewed, without modification, through January 31, 2019, with the understanding that the Board will consider the annual renewal for a full one year period in January 2019.
In connection with its consideration of future renewals of the fund's Advisory Contracts, the Board will consider: (i) the nature, extent and quality of services provided to the fund, including shareholder and administrative services and investment performance; (ii) the competitiveness of the management fee and total expenses for the fund; (iii) the costs of the services and profitability, including the revenues earned and the expenses incurred in conducting the business of developing, marketing, distributing, managing, administering, and servicing the fund and its shareholders, to the extent applicable, as well as potential fall-out benefits from Fidelity's non-fund businesses; and (iv) whether there have been economies of scale in respect of the Fidelity funds, whether the Fidelity funds (including the fund) have appropriately benefited from any such economies of scale, and whether there is the potential for realization of any further economies.
Based on its evaluation of all of the conclusions noted above, and after considering all factors it believed relevant, the Board ultimately concluded that the fund's management fee structure is fair and reasonable, and that the continuation of the fund's Advisory Contracts should be approved.
![]()
AEUF-ANN-1218
1.9585993.104
Fidelity Advisor® Japan Fund - Class A, Class M, Class C, Class I and Class Z Annual Report October 31, 2018 Class A, Class M, Class C, Class I and Class Z are classes of Fidelity® Japan Fund |
|
Contents
To view a fund's proxy voting guidelines and proxy voting record for the 12-month period ended June 30, visit http://www.fidelity.com/proxyvotingresults or visit the Securities and Exchange Commission's (SEC) web site at http://www.sec.gov.
You may also call 1-877-208-0098 to request a free copy of the proxy voting guidelines.
Standard & Poor's, S&P and S&P 500 are registered service marks of The McGraw-Hill Companies, Inc. and have been licensed for use by Fidelity Distributors Corporation.
Other third-party marks appearing herein are the property of their respective owners.
All other marks appearing herein are registered or unregistered trademarks or service marks of FMR LLC or an affiliated company. © 2018 FMR LLC. All rights reserved.
This report and the financial statements contained herein are submitted for the general information of the shareholders of the Fund. This report is not authorized for distribution to prospective investors in the Fund unless preceded or accompanied by an effective prospectus.
A fund files its complete schedule of portfolio holdings with the SEC for the first and third quarters of each fiscal year on Form N-Q. Forms N-Q are available on the SEC’s web site at http://www.sec.gov. A fund's Forms N-Q may be reviewed and copied at the SEC’s Public Reference Room in Washington, DC. Information regarding the operation of the SEC's Public Reference Room may be obtained by calling 1-800-SEC-0330.
For a complete list of a fund's portfolio holdings, view the most recent holdings listing, semiannual report, or annual report on Fidelity's web site at http://www.fidelity.com, http://www.institutional.fidelity.com, or http://www.401k.com, as applicable.
NOT FDIC INSURED •MAY LOSE VALUE •NO BANK GUARANTEE
Neither the Fund nor Fidelity Distributors Corporation is a bank.
Performance: The Bottom Line
Average annual total return reflects the change in the value of an investment, assuming reinvestment of distributions from dividend income and capital gains (the profits earned upon the sale of securities that have grown in value, if any) and assuming a constant rate of performance each year. The hypothetical investment and the average annual total returns do not reflect the deduction of taxes that a shareholder would pay on fund distributions or the redemption of fund shares. During periods of reimbursement by Fidelity, a fund’s total return will be greater than it would be had the reimbursement not occurred. How a fund did yesterday is no guarantee of how it will do tomorrow.
Average Annual Total Returns
| For the periods ended October 31, 2018 | Past 1 year | Past 5 years | Past 10 years |
| Class A (incl. 5.75% sales charge) | (10.91)% | 2.77% | 5.44% |
| Class M (incl. 3.50% sales charge) | (9.10)% | 2.91% | 5.42% |
| Class C (incl. contingent deferred sales charge) | (7.07)% | 3.27% | 5.47% |
| Class I | (5.18)% | 4.34% | 6.36% |
| Class Z | (5.11)% | 4.36% | 6.37% |
Class A shares bear a 0.25% 12b-1 fee. The initial offering of Class A shares took place on December 14, 2010. Returns prior to December 14, 2010, are those of Fidelity® Japan Fund, the original class of the fund, which has no 12b-1 fee. Had Class A's 12b-1 fee been reflected, returns prior to December 14, 2010, would have been lower.
Class M shares bear a 0.50% 12b-1 fee. The initial offering of Class M shares took place on December 14, 2010. Returns prior to December 14, 2010, are those of Fidelity® Japan Fund, the original class of the fund, which has no 12b-1 fee. Had Class M's 12b-1 fee been reflected, returns prior to December 14, 2010, would have been lower.
Class C shares bear a 1.00% 12b-1 fee. The initial offering of Class C shares took place on December 14, 2010. Returns prior to December 14, 2010, are those of Fidelity® Japan Fund, the original class of the fund, which has no 12b-1 fee. Had Class C's 12b-1 fee been reflected, returns prior to December 14, 2010, would have been lower.
Class C shares' contingent deferred sales charges included in the past one year, past five years and past ten years total return figures are 1%, 0% and 0%, respectively.
The initial offering of Class I shares took place on December 14, 2010. Returns prior to December 14, 2010 are those of Fidelity® Japan Fund, the original class of the fund.
The initial offering of Class Z shares took place on October 2, 2018. Returns prior to October 2, 2018, are those of Class I. Returns between December 14, 2010 and October 2, 2018, are those of Class I. Returns prior to December 14, 2010 are those of Fidelity Japan Fund, the original class of the fund.
$10,000 Over 10 Years
Let's say hypothetically that $10,000 was invested in Fidelity Advisor® Japan Fund - Class A on October 31, 2008, and the current 5.75% sales charge was paid.
The chart shows how the value of your investment would have changed, and also shows how the Tokyo Stock Price Index (TOPIX) performed over the same period.
See above for additional information regarding the performance of Class A.
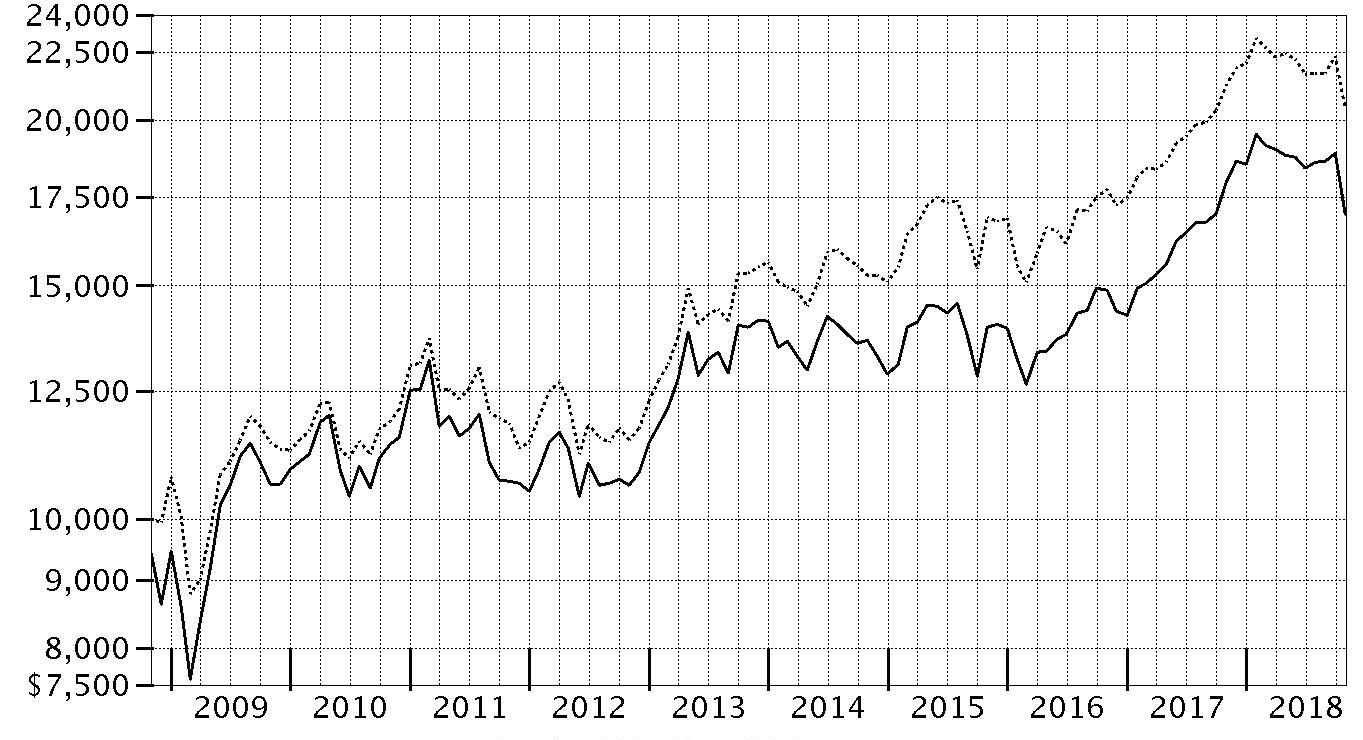
| Period Ending Values | ||
| $16,981 | Fidelity Advisor® Japan Fund - Class A | |
| $20,365 | Tokyo Stock Price Index (TOPIX) | |
Management's Discussion of Fund Performance
Market Recap: International equities returned -8.08% for the 12 months ending October 31, 2018, according to the MSCI ACWI (All Country World Index) ex USA Index. A modestly positive first half of the period gave way to a confluence of overwhelmingly negative factors – including escalating trade tensions, a surging U.S. dollar, tepid economic growth in Europe, global central bank tightening, concerns about Italy’s budget stalemate with the EU, and weakness in China’s stock market. The index lost 8% in October alone, its largest monthly drop in more than six years. Among sectors, communications services (-15%) was hit the hardest, while economically sensitive consumer discretionary (-13%), information technology (-12%), financials (-10%), industrials (-9%) and materials (-7%) stocks also fared poorly. Even the more defensive real estate (-9%), utilities (-6%) and consumer staples (-5%) sectors weren’t spared this period. Conversely, elevated crude-oil prices fueled a positive return for energy (+7%), the top-performing sector, followed by the relatively stable-growing health care segment (+2%). Regionally, emerging markets (-12%) fared the worst, hampered by the impact of foreign exchange and concerns about economic weakness in China, India and South Korea. Sluggish growth also pressured shares in continental Europe (-9%). Stocks in Japan (-3%) and the U.K. (-4%) held up better, followed by Canada (-5%) and Asia-Pacific ex Japan (-6%).Comments from Portfolio Manager Kirk Neureiter: For the year, the fund’s share classes (excluding sales charges, if applicable) returned about -5% to -6%, trailing the -4.13% return of the benchmark Tokyo Stock Price Index (TOPIX). Versus the benchmark, stock selection and an overweighting in materials – the benchmark’s weakest-performing sector by far – detracted from fund performance. In addition, the fund’s result reflects a downward fair-value pricing adjustment of 1.06 percentage points. At the stock level, an overweighting, on average, in Renesas Electronics was the biggest negative versus the benchmark. Shares of the semiconductor-products maker were hurt by a slowdown in Japan’s automobile market, among other factors. Overweighting Misumi Group, which operates factory automation and die components businesses worldwide, also detracted this period, as did overweighted exposure to Kansai Paint, Japan’s second-largest paint manufacturer. Conversely, picks in industrials, information technology and consumer discretionary lifted the fund’s relative result. Sony, one of the fund’s major long-term positions, contributed more than any other holding. A notably outsized stake in Shimadzu, a manufacturer measuring equipment of various kinds, added value. China’s rapidly growing middle class drove demand for Shimadzu's products.The views expressed above reflect those of the portfolio manager(s) only through the end of the period as stated on the cover of this report and do not necessarily represent the views of Fidelity or any other person in the Fidelity organization. Any such views are subject to change at any time based upon market or other conditions and Fidelity disclaims any responsibility to update such views. These views may not be relied on as investment advice and, because investment decisions for a Fidelity fund are based on numerous factors, may not be relied on as an indication of trading intent on behalf of any Fidelity fund.
Investment Summary (Unaudited)
Geographic Diversification (% of fund's net assets)
| As of October 31, 2018 | ||
| Japan | 95.3% | |
| United States of America* | 3.2% | |
| Bailiwick of Jersey | 1.0% | |
| Bermuda | 0.5% | |

* Includes Short-Term investments and Net Other Assets (Liabilities).
Percentages are based on country or territory of incorporation and are adjusted for the effect of futures contracts, if applicable.
Asset Allocation as of October 31, 2018
| % of fund's net assets | |
| Stocks | 96.8 |
| Short-Term Investments and Net Other Assets (Liabilities) | 3.2 |
Top Ten Stocks as of October 31, 2018
| % of fund's net assets | |
| SoftBank Corp. (Wireless Telecommunication Services) | 5.9 |
| Sony Corp. (Household Durables) | 4.6 |
| Mitsubishi UFJ Financial Group, Inc. (Banks) | 4.3 |
| ORIX Corp. (Diversified Financial Services) | 3.4 |
| Shimadzu Corp. (Electronic Equipment & Components) | 3.0 |
| Hoya Corp. (Health Care Equipment & Supplies) | 2.8 |
| Nidec Corp. (Electrical Equipment) | 2.4 |
| Suzuki Motor Corp. (Automobiles) | 2.3 |
| Seven & i Holdings Co. Ltd. (Food & Staples Retailing) | 2.1 |
| Tokio Marine Holdings, Inc. (Insurance) | 2.1 |
| 32.9 |
Top Market Sectors as of October 31, 2018
| % of fund's net assets | |
| Consumer Discretionary | 18.1 |
| Industrials | 16.4 |
| Financials | 13.2 |
| Information Technology | 10.7 |
| Communication Services | 10.2 |
| Consumer Staples | 10.1 |
| Health Care | 9.0 |
| Materials | 8.3 |
| Real Estate | 0.8 |
Schedule of Investments October 31, 2018
Showing Percentage of Net Assets
| Common Stocks - 96.8% | |||
| Shares | Value | ||
| COMMUNICATION SERVICES - 10.2% | |||
| Entertainment - 2.1% | |||
| Nexon Co. Ltd. (a) | 270,600 | $3,084,075 | |
| Nintendo Co. Ltd. | 25,200 | 7,867,513 | |
| 10,951,588 | |||
| Interactive Media & Services - 0.8% | |||
| LIFULL Co. Ltd. | 617,400 | 4,180,384 | |
| Media - 1.4% | |||
| Dentsu, Inc. | 155,700 | 7,221,340 | |
| Wireless Telecommunication Services - 5.9% | |||
| SoftBank Corp. | 390,700 | 30,919,536 | |
| TOTAL COMMUNICATION SERVICES | 53,272,848 | ||
| CONSUMER DISCRETIONARY - 18.1% | |||
| Auto Components - 1.6% | |||
| Bridgestone Corp. | 173,000 | 6,670,759 | |
| DaikyoNishikawa Corp. | 159,300 | 1,524,740 | |
| 8,195,499 | |||
| Automobiles - 5.2% | |||
| Honda Motor Co. Ltd. | 269,100 | 7,681,602 | |
| Subaru Corp. | 266,300 | 7,183,362 | |
| Suzuki Motor Corp. | 247,400 | 12,337,026 | |
| 27,201,990 | |||
| Distributors - 0.8% | |||
| Arata Corp. | 86,700 | 3,934,098 | |
| Diversified Consumer Services - 0.0% | |||
| Access Group Holdings Co. Ltd. (a) | 1,000 | 11,876 | |
| Hotels, Restaurants & Leisure - 0.6% | |||
| Koshidaka Holdings Co. Ltd. | 260,800 | 3,034,789 | |
| Household Durables - 7.5% | |||
| Panasonic Corp. | 840,300 | 9,017,642 | |
| Rinnai Corp. | 49,300 | 3,591,492 | |
| Sekisui Chemical Co. Ltd. | 147,900 | 2,323,984 | |
| Sony Corp. | 446,500 | 24,163,130 | |
| 39,096,248 | |||
| Internet & Direct Marketing Retail - 0.5% | |||
| Zozo, Inc. | 107,500 | 2,590,442 | |
| Leisure Products - 0.6% | |||
| Bandai Namco Holdings, Inc. | 93,800 | 3,337,679 | |
| Specialty Retail - 1.3% | |||
| Nitori Holdings Co. Ltd. | 34,000 | 4,440,023 | |
| USS Co. Ltd. | 128,600 | 2,321,604 | |
| 6,761,627 | |||
| TOTAL CONSUMER DISCRETIONARY | 94,164,248 | ||
| CONSUMER STAPLES - 10.1% | |||
| Beverages - 0.8% | |||
| Coca-Cola West Co. Ltd. | 167,200 | 4,378,748 | |
| Food & Staples Retailing - 5.5% | |||
| Ain Holdings, Inc. | 43,100 | 3,376,647 | |
| Nishimoto Co. Ltd. | 42,900 | 1,942,828 | |
| San-A Co. Ltd. | 42,700 | 1,803,213 | |
| Seven & i Holdings Co. Ltd. | 250,700 | 10,855,310 | |
| Sundrug Co. Ltd. | 49,100 | 1,784,110 | |
| Tsuruha Holdings, Inc. | 37,900 | 3,950,051 | |
| Welcia Holdings Co. Ltd. | 92,300 | 4,711,730 | |
| 28,423,889 | |||
| Food Products - 0.6% | |||
| Morinaga & Co. Ltd. | 83,500 | 3,355,984 | |
| Personal Products - 3.2% | |||
| Kao Corp. | 136,100 | 9,053,675 | |
| Kose Corp. | 26,100 | 3,902,220 | |
| Shiseido Co. Ltd. | 57,300 | 3,615,372 | |
| 16,571,267 | |||
| TOTAL CONSUMER STAPLES | 52,729,888 | ||
| FINANCIALS - 13.2% | |||
| Banks - 5.0% | |||
| Mitsubishi UFJ Financial Group, Inc. | 3,669,700 | 22,210,833 | |
| Shinsei Bank Ltd. | 235,800 | 3,591,941 | |
| 25,802,774 | |||
| Capital Markets - 0.9% | |||
| JAFCO Co. Ltd. | 67,500 | 2,608,233 | |
| SBI Holdings, Inc. Japan | 80,400 | 2,109,845 | |
| 4,718,078 | |||
| Consumer Finance - 0.7% | |||
| AEON Financial Service Co. Ltd. | 198,400 | 3,896,436 | |
| Diversified Financial Services - 3.4% | |||
| ORIX Corp. | 1,094,500 | 17,857,708 | |
| Insurance - 3.2% | |||
| Sony Financial Holdings, Inc. | 247,800 | 5,716,613 | |
| Tokio Marine Holdings, Inc. | 229,400 | 10,807,525 | |
| 16,524,138 | |||
| TOTAL FINANCIALS | 68,799,134 | ||
| HEALTH CARE - 9.0% | |||
| Biotechnology - 1.3% | |||
| PeptiDream, Inc. (a)(b) | 39,000 | 1,280,587 | |
| Shire PLC | 87,600 | 5,286,742 | |
| 6,567,329 | |||
| Health Care Equipment & Supplies - 5.2% | |||
| Hoya Corp. | 257,800 | 14,654,400 | |
| Nakanishi, Inc. | 110,700 | 2,592,991 | |
| Olympus Corp. | 199,800 | 6,659,693 | |
| Paramount Bed Holdings Co. Ltd. | 77,500 | 3,265,941 | |
| 27,173,025 | |||
| Health Care Providers & Services - 0.6% | |||
| Ship Healthcare Holdings, Inc. | 92,000 | 3,330,704 | |
| Pharmaceuticals - 1.9% | |||
| Takeda Pharmaceutical Co. Ltd. (b) | 241,700 | 10,020,773 | |
| TOTAL HEALTH CARE | 47,091,831 | ||
| INDUSTRIALS - 16.4% | |||
| Building Products - 2.6% | |||
| Daikin Industries Ltd. | 79,100 | 9,168,633 | |
| Toto Ltd. | 129,100 | 4,618,716 | |
| 13,787,349 | |||
| Commercial Services & Supplies - 0.9% | |||
| Sohgo Security Services Co., Ltd. | 106,500 | 4,747,596 | |
| Construction & Engineering - 1.7% | |||
| Mirait Holdings Corp. (b) | 257,000 | 4,149,900 | |
| Toshiba Plant Systems & Services Corp. | 229,800 | 4,700,478 | |
| 8,850,378 | |||
| Electrical Equipment - 2.4% | |||
| Nidec Corp. | 99,000 | 12,713,342 | |
| Machinery - 2.2% | |||
| Hoshizaki Corp. | 9,200 | 742,784 | |
| Kitz Corp. | 230,900 | 1,839,669 | |
| Minebea Mitsumi, Inc. | 301,700 | 4,615,414 | |
| Misumi Group, Inc. | 221,900 | 4,456,289 | |
| 11,654,156 | |||
| Professional Services - 3.2% | |||
| Funai Soken Holdings, Inc. | 99,000 | 2,099,588 | |
| Outsourcing, Inc. | 292,600 | 3,708,229 | |
| Recruit Holdings Co. Ltd. | 163,700 | 4,393,641 | |
| SMS Co., Ltd. | 167,400 | 2,805,454 | |
| Temp Holdings Co., Ltd. | 190,200 | 3,620,770 | |
| 16,627,682 | |||
| Road & Rail - 2.6% | |||
| East Japan Railway Co. | 117,800 | 10,288,386 | |
| Hitachi Transport System Ltd. | 119,900 | 3,085,830 | |
| 13,374,216 | |||
| Trading Companies & Distributors - 0.8% | |||
| Trusco Nakayama Corp. | 154,300 | 3,890,491 | |
| TOTAL INDUSTRIALS | 85,645,210 | ||
| INFORMATION TECHNOLOGY - 10.7% | |||
| Electronic Equipment & Components - 7.1% | |||
| Azbil Corp. | 149,000 | 2,775,717 | |
| Dexerials Corp. | 415,700 | 3,577,300 | |
| Iriso Electronics Co. Ltd. | 44,400 | 1,878,938 | |
| Murata Manufacturing Co. Ltd. | 31,100 | 4,731,081 | |
| Shimadzu Corp. | 618,900 | 15,648,706 | |
| TDK Corp. | 65,400 | 5,639,447 | |
| Topcon Corp. | 189,000 | 2,750,370 | |
| 37,001,559 | |||
| IT Services - 3.0% | |||
| GMO Internet, Inc. | 182,900 | 2,612,973 | |
| IT Holdings Corp. | 82,000 | 3,677,228 | |
| ITOCHU Techno-Solutions Corp. | 204,800 | 3,884,185 | |
| NSD Co. Ltd. | 128,200 | 2,719,996 | |
| Otsuka Corp. | 77,800 | 2,585,634 | |
| 15,480,016 | |||
| Semiconductors & Semiconductor Equipment - 0.6% | |||
| Renesas Electronics Corp. (a) | 582,100 | 3,084,998 | |
| TOTAL INFORMATION TECHNOLOGY | 55,566,573 | ||
| MATERIALS - 8.3% | |||
| Chemicals - 7.8% | |||
| Axalta Coating Systems Ltd. (a) | 104,400 | 2,576,592 | |
| Hitachi Chemical Co. Ltd. | 160,700 | 2,536,506 | |
| JSR Corp. | 276,000 | 4,124,040 | |
| Kansai Paint Co. Ltd. | 311,100 | 4,607,153 | |
| KH Neochem Co. Ltd. | 81,800 | 2,319,848 | |
| Nissan Chemical Corp. | 108,100 | 5,097,054 | |
| Nitto Denko Corp. | 49,500 | 3,092,517 | |
| NOF Corp. | 109,400 | 3,107,431 | |
| Okamoto Industries, Inc. | 35,000 | 1,575,752 | |
| Shin-Etsu Chemical Co. Ltd. | 105,600 | 8,823,991 | |
| Tokyo Ohka Kogyo Co. Ltd. | 96,200 | 2,583,294 | |
| 40,444,178 | |||
| Construction Materials - 0.5% | |||
| Taiheiyo Cement Corp. | 90,400 | 2,660,173 | |
| TOTAL MATERIALS | 43,104,351 | ||
| REAL ESTATE - 0.8% | |||
| Equity Real Estate Investment Trusts (REITs) - 0.6% | |||
| Invincible Investment Corp. | 8,076 | 3,342,484 | |
| Real Estate Management & Development - 0.2% | |||
| Tateru, Inc. (b) | 191,200 | 804,892 | |
| TOTAL REAL ESTATE | 4,147,376 | ||
| TOTAL COMMON STOCKS | |||
| (Cost $455,938,682) | 504,521,459 | ||
| Money Market Funds - 3.4% | |||
| Fidelity Cash Central Fund, 2.23% (c) | 7,513,828 | 7,515,331 | |
| Fidelity Securities Lending Cash Central Fund 2.23% (c)(d) | 10,449,522 | 10,450,567 | |
| TOTAL MONEY MARKET FUNDS | |||
| (Cost $17,966,060) | 17,965,898 | ||
| TOTAL INVESTMENT IN SECURITIES - 100.2% | |||
| (Cost $473,904,742) | 522,487,357 | ||
| NET OTHER ASSETS (LIABILITIES) - (0.2)% | (1,032,551) | ||
| NET ASSETS - 100% | $521,454,806 |
Legend
(a) Non-income producing
(b) Security or a portion of the security is on loan at period end.
(c) Affiliated fund that is generally available only to investment companies and other accounts managed by Fidelity Investments. The rate quoted is the annualized seven-day yield of the fund at period end. A complete unaudited listing of the fund's holdings as of its most recent quarter end is available upon request. In addition, each Fidelity Central Fund's financial statements, which are not covered by the Fund's Report of Independent Registered Public Accounting Firm, are available on the SEC's website or upon request.
(d) Investment made with cash collateral received from securities on loan.
Affiliated Central Funds
Information regarding fiscal year to date income earned by the Fund from investments in Fidelity Central Funds is as follows:
| Fund | Income earned |
| Fidelity Cash Central Fund | $61,230 |
| Fidelity Securities Lending Cash Central Fund | 112,917 |
| Total | $174,147 |
Amounts in the income column in the above table include any capital gain distributions from underlying funds, which are presented in the corresponding line-item in the Statement of Operations if applicable.
Investment Valuation
The following is a summary of the inputs used, as of October 31, 2018, involving the Fund's assets and liabilities carried at fair value. The inputs or methodology used for valuing securities may not be an indication of the risk associated with investing in those securities. For more information on valuation inputs, and their aggregation into the levels used below, please refer to the Investment Valuation section in the accompanying Notes to Financial Statements.
| Valuation Inputs at Reporting Date: | ||||
| Description | Total | Level 1 | Level 2 | Level 3 |
| Investments in Securities: | ||||
| Equities: | ||||
| Communication Services | $53,272,848 | $7,264,459 | $46,008,389 | $-- |
| Consumer Discretionary | 94,164,248 | 27,098,851 | 67,065,397 | -- |
| Consumer Staples | 52,729,888 | 29,205,531 | 23,524,357 | -- |
| Financials | 68,799,134 | 26,472,222 | 42,326,912 | -- |
| Health Care | 47,091,831 | 25,124,623 | 21,967,208 | -- |
| Industrials | 85,645,210 | 52,560,420 | 33,084,790 | -- |
| Information Technology | 55,566,573 | 49,927,126 | 5,639,447 | -- |
| Materials | 43,104,351 | 23,430,616 | 19,673,735 | -- |
| Real Estate | 4,147,376 | 4,147,376 | -- | -- |
| Money Market Funds | 17,965,898 | 17,965,898 | -- | -- |
| Total Investments in Securities: | $522,487,357 | $263,197,122 | $259,290,235 | $-- |
The following is a summary of transfers between Level 1 and Level 2 for the period ended October 31, 2018. Transfers are assumed to have occurred at the beginning of the period, and are primarily attributable to the valuation techniques used for foreign equity securities, as discussed in the accompanying Notes to Financial Statements:
| Transfers | Total |
| Level 1 to Level 2 | $0 |
| Level 2 to Level 1 | $174,646,272 |
See accompanying notes which are an integral part of the financial statements.
Financial Statements
Statement of Assets and Liabilities
| October 31, 2018 | ||
| Assets | ||
| Investment in securities, at value (including securities loaned of $9,941,920) — See accompanying schedule: Unaffiliated issuers (cost $455,938,682) | $504,521,459 | |
| Fidelity Central Funds (cost $17,966,060) | 17,965,898 | |
| Total Investment in Securities (cost $473,904,742) | $522,487,357 | |
| Receivable for investments sold | 1,519,230 | |
| Receivable for fund shares sold | 142,935,435 | |
| Dividends receivable | 2,170,586 | |
| Distributions receivable from Fidelity Central Funds | 21,042 | |
| Prepaid expenses | 771 | |
| Other receivables | 7,699 | |
| Total assets | 669,142,120 | |
| Liabilities | ||
| Payable for investments purchased | $136,686,909 | |
| Payable for fund shares redeemed | 143,932 | |
| Accrued management fee | 237,308 | |
| Distribution and service plan fees payable | 15,894 | |
| Other affiliated payables | 76,257 | |
| Other payables and accrued expenses | 78,104 | |
| Collateral on securities loaned | 10,448,910 | |
| Total liabilities | 147,687,314 | |
| Net Assets | $521,454,806 | |
| Net Assets consist of: | ||
| Paid in capital | $574,469,362 | |
| Total distributable earnings (loss) | (53,014,556) | |
| Net Assets | $521,454,806 | |
| Net Asset Value and Maximum Offering Price | ||
| Class A: | ||
| Net Asset Value and redemption price per share ($14,587,007 ÷ 1,030,792 shares) | $14.15 | |
| Maximum offering price per share (100/94.25 of $14.15) | $15.01 | |
| Class M: | ||
| Net Asset Value and redemption price per share ($3,993,379 ÷ 282,921 shares) | $14.11 | |
| Maximum offering price per share (100/96.50 of $14.11) | $14.62 | |
| Class C: | ||
| Net Asset Value and offering price per share ($12,585,841 ÷ 901,103 shares)(a) | $13.97 | |
| Japan: | ||
| Net Asset Value, offering price and redemption price per share ($297,643,914 ÷ 20,955,089 shares) | $14.20 | |
| Class I: | ||
| Net Asset Value, offering price and redemption price per share ($192,554,711 ÷ 13,577,525 shares) | $14.18 | |
| Class Z: | ||
| Net Asset Value, offering price and redemption price per share ($89,954 ÷ 6,341 shares) | $14.19 |
(a) Redemption price per share is equal to net asset value less any applicable contingent deferred sales charge.
See accompanying notes which are an integral part of the financial statements.
Statement of Operations
| Year ended October 31, 2018 | ||
| Investment Income | ||
| Dividends | $6,600,456 | |
| Income from Fidelity Central Funds | 174,147 | |
| Income before foreign taxes withheld | 6,774,603 | |
| Less foreign taxes withheld | (659,951) | |
| Total income | 6,114,652 | |
| Expenses | ||
| Management fee | ||
| Basic fee | $2,832,913 | |
| Performance adjustment | 197,833 | |
| Transfer agent fees | 734,462 | |
| Distribution and service plan fees | 214,119 | |
| Accounting and security lending fees | 214,020 | |
| Custodian fees and expenses | 43,009 | |
| Independent trustees' fees and expenses | 2,060 | |
| Registration fees | 75,935 | |
| Audit | 78,535 | |
| Legal | 1,017 | |
| Miscellaneous | 2,723 | |
| Total expenses before reductions | 4,396,626 | |
| Expense reductions | (40,460) | |
| Total expenses after reductions | 4,356,166 | |
| Net investment income (loss) | 1,758,486 | |
| Realized and Unrealized Gain (Loss) | ||
| Net realized gain (loss) on: | ||
| Investment securities: | ||
| Unaffiliated issuers | 41,499,026 | |
| Fidelity Central Funds | (169) | |
| Foreign currency transactions | 77,952 | |
| Total net realized gain (loss) | 41,576,809 | |
| Change in net unrealized appreciation (depreciation) on: | ||
| Investment securities: | ||
| Unaffiliated issuers | (63,821,493) | |
| Fidelity Central Funds | 346 | |
| Assets and liabilities in foreign currencies | 414,016 | |
| Total change in net unrealized appreciation (depreciation) | (63,407,131) | |
| Net gain (loss) | (21,830,322) | |
| Net increase (decrease) in net assets resulting from operations | $(20,071,836) |
See accompanying notes which are an integral part of the financial statements.
Statement of Changes in Net Assets
| Year ended October 31, 2018 | Year ended October 31, 2017 | |
| Increase (Decrease) in Net Assets | ||
| Operations | ||
| Net investment income (loss) | $1,758,486 | $2,955,189 |
| Net realized gain (loss) | 41,576,809 | 11,302,131 |
| Change in net unrealized appreciation (depreciation) | (63,407,131) | 67,770,223 |
| Net increase (decrease) in net assets resulting from operations | (20,071,836) | 82,027,543 |
| Distributions to shareholders | (3,858,691) | – |
| Distributions to shareholders from net investment income | – | (3,369,067) |
| Distributions to shareholders from net realized gain | – | (1,060,540) |
| Total distributions | (3,858,691) | (4,429,607) |
| Share transactions - net increase (decrease) | 88,029,029 | (23,430,665) |
| Redemption fees | 7,512 | 33,312 |
| Total increase (decrease) in net assets | 64,106,014 | 54,200,583 |
| Net Assets | ||
| Beginning of period | 457,348,792 | 403,148,209 |
| End of period | $521,454,806 | $457,348,792 |
| Other Information | ||
| Undistributed net investment income end of period | $2,940,381 |
See accompanying notes which are an integral part of the financial statements.
Financial Highlights
Fidelity Japan Fund Class A
| Years ended October 31, | 2018 | 2017 | 2016 | 2015 | 2014 |
| Selected Per–Share Data | |||||
| Net asset value, beginning of period | $15.08 | $12.59 | $11.87 | $11.65 | $12.00 |
| Income from Investment Operations | |||||
| Net investment income (loss)A | .03 | .06 | .06 | .04 | .05 |
| Net realized and unrealized gain (loss) | (.85) | 2.52 | .72 | .23 | (.31) |
| Total from investment operations | (.82) | 2.58 | .78 | .27 | (.26) |
| Distributions from net investment income | (.08) | (.06) | (.05) | (.05) | (.08) |
| Distributions from net realized gain | (.04) | (.03) | (.01) | – | (.01) |
| Total distributions | (.11)B | (.09) | (.06) | (.05) | (.09) |
| Redemption fees added to paid in capitalA,C | – | – | – | – | – |
| Net asset value, end of period | $14.15 | $15.08 | $12.59 | $11.87 | $11.65 |
| Total ReturnD,E | (5.48)% | 20.70% | 6.56% | 2.31% | (2.18)% |
| Ratios to Average Net AssetsF,G | |||||
| Expenses before reductions | 1.33% | 1.11% | 1.08% | 1.10% | 1.23% |
| Expenses net of fee waivers, if any | 1.33% | 1.11% | 1.08% | 1.10% | 1.23% |
| Expenses net of all reductions | 1.32% | 1.11% | 1.08% | 1.09% | 1.23% |
| Net investment income (loss) | .17% | .45% | .51% | .37% | .41% |
| Supplemental Data | |||||
| Net assets, end of period (000 omitted) | $14,587 | $16,155 | $23,910 | $23,918 | $21,352 |
| Portfolio turnover rateH | 40% | 23% | 15% | 35% | 112% |
A Calculated based on average shares outstanding during the period.
B Total distributions of $.11 per share is comprised of distributions from net investment income of $.078 and distributions from net realized gain of $.035 per share.
C Amount represents less than $.005 per share.
D Total returns would have been lower if certain expenses had not been reduced during the applicable periods shown.
E Total returns do not include the effect of the sales charges.
F Fees and expenses of any underlying Fidelity Central Funds are not included in the Fund's expense ratio. The Fund indirectly bears its proportionate share of the expenses of any underlying Fidelity Central Funds.
G Expense ratios reflect operating expenses of the class. Expenses before reductions do not reflect amounts reimbursed by the investment adviser or reductions from brokerage service arrangements or reductions from other expense offset arrangements and do not represent the amount paid by the class during periods when reimbursements or reductions occur. Expenses net of fee waivers reflect expenses after reimbursement by the investment adviser but prior to reductions from brokerage service arrangements or other expense offset arrangements. Expenses net of all reductions represent the net expenses paid by the class.
H Amount does not include the portfolio activity of any underlying Fidelity Central Funds.
See accompanying notes which are an integral part of the financial statements.
Fidelity Japan Fund Class M
| Years ended October 31, | 2018 | 2017 | 2016 | 2015 | 2014 |
| Selected Per–Share Data | |||||
| Net asset value, beginning of period | $15.06 | $12.57 | $11.85 | $11.62 | $11.96 |
| Income from Investment Operations | |||||
| Net investment income (loss)A | (.03) | .01 | .02 | –B | .01 |
| Net realized and unrealized gain (loss) | (.84) | 2.52 | .71 | .23 | (.30) |
| Total from investment operations | (.87) | 2.53 | .73 | .23 | (.29) |
| Distributions from net investment income | (.05) | (.01) | –B | – | (.04) |
| Distributions from net realized gain | (.04) | (.03) | (.01) | – | (.01) |
| Total distributions | (.08)C | (.04) | (.01) | – | (.05) |
| Redemption fees added to paid in capitalA,B | – | – | – | – | – |
| Net asset value, end of period | $14.11 | $15.06 | $12.57 | $11.85 | $11.62 |
| Total ReturnD,E | (5.81)% | 20.24% | 6.15% | 1.98% | (2.42)% |
| Ratios to Average Net AssetsF,G | |||||
| Expenses before reductions | 1.67% | 1.46% | 1.44% | 1.43% | 1.54% |
| Expenses net of fee waivers, if any | 1.67% | 1.46% | 1.44% | 1.43% | 1.54% |
| Expenses net of all reductions | 1.66% | 1.46% | 1.44% | 1.42% | 1.54% |
| Net investment income (loss) | (.17)% | .10% | .16% | .04% | .10% |
| Supplemental Data | |||||
| Net assets, end of period (000 omitted) | $3,993 | $4,464 | $4,193 | $4,809 | $4,104 |
| Portfolio turnover rateH | 40% | 23% | 15% | 35% | 112% |
A Calculated based on average shares outstanding during the period.
B Amount represents less than $.005 per share.
C Total distributions of $.08 per share is comprised of distributions from net investment income of $.047 and distributions from net realized gain of $.035 per share.
D Total returns would have been lower if certain expenses had not been reduced during the applicable periods shown.
E Total returns do not include the effect of the sales charges.
F Fees and expenses of any underlying Fidelity Central Funds are not included in the Fund's expense ratio. The Fund indirectly bears its proportionate share of the expenses of any underlying Fidelity Central Funds.
G Expense ratios reflect operating expenses of the class. Expenses before reductions do not reflect amounts reimbursed by the investment adviser or reductions from brokerage service arrangements or reductions from other expense offset arrangements and do not represent the amount paid by the class during periods when reimbursements or reductions occur. Expenses net of fee waivers reflect expenses after reimbursement by the investment adviser but prior to reductions from brokerage service arrangements or other expense offset arrangements. Expenses net of all reductions represent the net expenses paid by the class.
H Amount does not include the portfolio activity of any underlying Fidelity Central Funds.
See accompanying notes which are an integral part of the financial statements.
Fidelity Japan Fund Class C
| Years ended October 31, | 2018 | 2017 | 2016 | 2015 | 2014 |
| Selected Per–Share Data | |||||
| Net asset value, beginning of period | $14.92 | $12.44 | $11.77 | $11.58 | $11.96 |
| Income from Investment Operations | |||||
| Net investment income (loss)A | (.08) | (.03) | (.02) | (.04) | (.03) |
| Net realized and unrealized gain (loss) | (.83) | 2.51 | .69 | .23 | (.32) |
| Total from investment operations | (.91) | 2.48 | .67 | .19 | (.35) |
| Distributions from net investment income | –B | – | – | – | (.03) |
| Distributions from net realized gain | (.04) | – | – | – | (.01) |
| Total distributions | (.04) | – | – | – | (.03)C |
| Redemption fees added to paid in capitalA,B | – | – | – | – | – |
| Net asset value, end of period | $13.97 | $14.92 | $12.44 | $11.77 | $11.58 |
| Total ReturnD,E | (6.13)% | 19.94% | 5.69% | 1.64% | (2.90)% |
| Ratios to Average Net AssetsF,G | |||||
| Expenses before reductions | 2.04% | 1.81% | 1.81% | 1.81% | 1.93% |
| Expenses net of fee waivers, if any | 2.03% | 1.81% | 1.81% | 1.81% | 1.93% |
| Expenses net of all reductions | 2.03% | 1.81% | 1.81% | 1.80% | 1.93% |
| Net investment income (loss) | (.53)% | (.25)% | (.21)% | (.34)% | (.29)% |
| Supplemental Data | |||||
| Net assets, end of period (000 omitted) | $12,586 | $13,542 | $15,077 | $18,491 | $13,162 |
| Portfolio turnover rateH | 40% | 23% | 15% | 35% | 112% |
A Calculated based on average shares outstanding during the period.
B Amount represents less than $.005 per share.
C Total distributions of $.03 per share is comprised of distributions from net investment income of $.025 and distributions from net realized gain of $.009 per share.
D Total returns would have been lower if certain expenses had not been reduced during the applicable periods shown.
E Total returns do not include the effect of the contingent deferred sales charge.
F Fees and expenses of any underlying Fidelity Central Funds are not included in the Fund's expense ratio. The Fund indirectly bears its proportionate share of the expenses of any underlying Fidelity Central Funds.
G Expense ratios reflect operating expenses of the class. Expenses before reductions do not reflect amounts reimbursed by the investment adviser or reductions from brokerage service arrangements or reductions from other expense offset arrangements and do not represent the amount paid by the class during periods when reimbursements or reductions occur. Expenses net of fee waivers reflect expenses after reimbursement by the investment adviser but prior to reductions from brokerage service arrangements or other expense offset arrangements. Expenses net of all reductions represent the net expenses paid by the class.
H Amount does not include the portfolio activity of any underlying Fidelity Central Funds.
See accompanying notes which are an integral part of the financial statements.
Fidelity Japan Fund
| Years ended October 31, | 2018 | 2017 | 2016 | 2015 | 2014 |
| Selected Per–Share Data | |||||
| Net asset value, beginning of period | $15.13 | $12.64 | $11.91 | $11.69 | $12.03 |
| Income from Investment Operations | |||||
| Net investment income (loss)A | .07 | .10 | .09 | .08 | .09 |
| Net realized and unrealized gain (loss) | (.86) | 2.54 | .72 | .23 | (.32) |
| Total from investment operations | (.79) | 2.64 | .81 | .31 | (.23) |
| Distributions from net investment income | (.11) | (.11) | (.07) | (.09) | (.11) |
| Distributions from net realized gain | (.04) | (.03) | (.01) | – | (.01) |
| Total distributions | (.14)B | (.15)C | (.08) | (.09) | (.11)D |
| Redemption fees added to paid in capitalA,E | – | – | – | – | – |
| Net asset value, end of period | $14.20 | $15.13 | $12.64 | $11.91 | $11.69 |
| Total ReturnF | (5.28)% | 21.13% | 6.80% | 2.66% | (1.90)% |
| Ratios to Average Net AssetsG,H | |||||
| Expenses before reductions | 1.05% | .82% | .78% | .80% | .90% |
| Expenses net of fee waivers, if any | 1.05% | .82% | .78% | .80% | .90% |
| Expenses net of all reductions | 1.04% | .82% | .78% | .79% | .90% |
| Net investment income (loss) | .45% | .74% | .81% | .67% | .74% |
| Supplemental Data | |||||
| Net assets, end of period (000 omitted) | $297,644 | $247,372 | $352,936 | $485,803 | $415,612 |
| Portfolio turnover rateI | 40% | 23% | 15% | 35% | 112% |
A Calculated based on average shares outstanding during the period.
B Total distributions of $.14 per share is comprised of distributions from net investment income of $.107 and distributions from net realized gain of $.035 per share.
C Total distributions of $.15 per share is comprised of distributions from net investment income of $.112 and distributions from net realized gain of $.034 per share.
D Total distributions of $.11 per share is comprised of distributions from net investment income of $.105 and distributions from net realized gain of $.009 per share.
E Amount represents less than $.005 per share.
F Total returns would have been lower if certain expenses had not been reduced during the applicable periods shown.
G Fees and expenses of any underlying Fidelity Central Funds are not included in the Fund's expense ratio. The Fund indirectly bears its proportionate share of the expenses of any underlying Fidelity Central Funds.
H Expense ratios reflect operating expenses of the class. Expenses before reductions do not reflect amounts reimbursed by the investment adviser or reductions from brokerage service arrangements or reductions from other expense offset arrangements and do not represent the amount paid by the class during periods when reimbursements or reductions occur. Expenses net of fee waivers reflect expenses after reimbursement by the investment adviser but prior to reductions from brokerage service arrangements or other expense offset arrangements. Expenses net of all reductions represent the net expenses paid by the class.
I Amount does not include the portfolio activity of any underlying Fidelity Central Funds.
See accompanying notes which are an integral part of the financial statements.
Fidelity Japan Fund Class I
| Years ended October 31, | 2018 | 2017 | 2016 | 2015 | 2014 |
| Selected Per–Share Data | |||||
| Net asset value, beginning of period | $15.12 | $12.62 | $11.89 | $11.67 | $12.02 |
| Income from Investment Operations | |||||
| Net investment income (loss)A | .08 | .11 | .10 | .08 | .09 |
| Net realized and unrealized gain (loss) | (.85) | 2.53 | .70 | .23 | (.32) |
| Total from investment operations | (.77) | 2.64 | .80 | .31 | (.23) |
| Distributions from net investment income | (.14) | (.11) | (.07) | (.09) | (.12) |
| Distributions from net realized gain | (.04) | (.03) | (.01) | – | (.01) |
| Total distributions | (.17)B | (.14) | (.07)C | (.09) | (.12)D |
| Redemption fees added to paid in capitalA,E | – | – | – | – | – |
| Net asset value, end of period | $14.18 | $15.12 | $12.62 | $11.89 | $11.67 |
| Total ReturnF | (5.18)% | 21.22% | 6.77% | 2.72% | (1.90)% |
| Ratios to Average Net AssetsG,H | |||||
| Expenses before reductions | .98% | .76% | .77% | .80% | .89% |
| Expenses net of fee waivers, if any | .98% | .76% | .77% | .80% | .89% |
| Expenses net of all reductions | .97% | .76% | .76% | .79% | .89% |
| Net investment income (loss) | .52% | .80% | .83% | .67% | .76% |
| Supplemental Data | |||||
| Net assets, end of period (000 omitted) | $192,555 | $175,816 | $7,032 | $13,957 | $20,253 |
| Portfolio turnover rateI | 40% | 23% | 15% | 35% | 112% |
A Calculated based on average shares outstanding during the period.
B Total distributions of $.17 per share is comprised of distributions from net investment income of $.135 and distributions from net realized gain of $.035 per share.
C Total distributions of $.07 per share is comprised of distributions from net investment income of $.065 and distributions from net realized gain of $.006 per share.
D Total distributions of $.12 per share is comprised of distributions from net investment income of $.115 and distributions from net realized gain of $.009 per share.
E Amount represents less than $.005 per share.
F Total returns would have been lower if certain expenses had not been reduced during the applicable periods shown.
G Fees and expenses of any underlying Fidelity Central Funds are not included in the Fund's expense ratio. The Fund indirectly bears its proportionate share of the expenses of any underlying Fidelity Central Funds.
H Expense ratios reflect operating expenses of the class. Expenses before reductions do not reflect amounts reimbursed by the investment adviser or reductions from brokerage service arrangements or reductions from other expense offset arrangements and do not represent the amount paid by the class during periods when reimbursements or reductions occur. Expenses net of fee waivers reflect expenses after reimbursement by the investment adviser but prior to reductions from brokerage service arrangements or other expense offset arrangements. Expenses net of all reductions represent the net expenses paid by the class.
I Amount does not include the portfolio activity of any underlying Fidelity Central Funds.
See accompanying notes which are an integral part of the financial statements.
Fidelity Japan Fund Class Z
| Year ended October 31, | 2018 A |
| Selected Per–Share Data | |
| Net asset value, beginning of period | $15.77 |
| Income from Investment Operations | |
| Net investment income (loss)B | (.01) |
| Net realized and unrealized gain (loss) | (1.57) |
| Total from investment operations | (1.58) |
| Net asset value, end of period | $14.19 |
| Total ReturnC,D | (10.02)% |
| Ratios to Average Net AssetsE,F | |
| Expenses before reductions | .96%G |
| Expenses net of fee waivers, if any | .96%G |
| Expenses net of all reductions | .95%G |
| Net investment income (loss) | (.73)%G |
| Supplemental Data | |
| Net assets, end of period (000 omitted) | $90 |
| Portfolio turnover rateH | 40% |
A For the period October 2, 2018 (commencement of sale of shares) to October 31, 2018.
B Calculated based on average shares outstanding during the period.
C Total returns for periods of less than one year are not annualized.
D Total returns would have been lower if certain expenses had not been reduced during the applicable periods shown.
E Fees and expenses of any underlying Fidelity Central Funds are not included in the Fund's expense ratio. The Fund indirectly bears its proportionate share of the expenses of any underlying Fidelity Central Funds.
F Expense ratios reflect operating expenses of the class. Expenses before reductions do not reflect amounts reimbursed by the investment adviser or reductions from brokerage service arrangements or reductions from other expense offset arrangements and do not represent the amount paid by the class during periods when reimbursements or reductions occur. Expense ratios before reductions for start-up periods may not be representative of longer-term operating periods. Expenses net of fee waivers reflect expenses after reimbursement by the investment adviser but prior to reductions from brokerage service arrangements or other expense offset arrangements. Expenses net of all reductions represent the net expenses paid by the class.
G Annualized
H Amount does not include the portfolio activity of any underlying Fidelity Central Funds.
See accompanying notes which are an integral part of the financial statements.
Notes to Financial Statements
For the period ended October 31, 2018
1. Organization.
Fidelity Japan Fund (the Fund) is a fund of Fidelity Investment Trust (the Trust) and is authorized to issue an unlimited number of shares. The Trust is registered under the Investment Company Act of 1940, as amended (the 1940 Act), as an open-end management investment company organized as a Massachusetts business trust. The Fund commenced sale of Class Z shares on October 2, 2018. The Fund offers Class A, Class M, Class C, Japan, Class I and Class Z shares, each of which has equal rights as to assets and voting privileges. Each class has exclusive voting rights with respect to matters that affect that class.
2. Investments in Fidelity Central Funds.
The Fund invests in Fidelity Central Funds, which are open-end investment companies generally available only to other investment companies and accounts managed by the investment adviser and its affiliates. The Fund's Schedule of Investments lists each of the Fidelity Central Funds held as of period end, if any, as an investment of the Fund, but does not include the underlying holdings of each Fidelity Central Fund. As an Investing Fund, the Fund indirectly bears its proportionate share of the expenses of the underlying Fidelity Central Funds.
The Money Market Central Funds seek preservation of capital and current income and are managed by Fidelity Investments Money Management, Inc. (FIMM), an affiliate of the investment adviser. Annualized expenses of the Money Market Central Funds as of their most recent shareholder report date are less than .005%.
A complete unaudited list of holdings for each Fidelity Central Fund is available upon request or at the Securities and Exchange Commission (the SEC) website at www.sec.gov. In addition, the financial statements of the Fidelity Central Funds, which are not covered by the Fund's Report of Independent Registered Public Accounting Firm, are available on the SEC website or upon request.
3. Significant Accounting Policies.
The Fund is an investment company and applies the accounting and reporting guidance of the Financial Accounting Standards Board (FASB) Accounting Standards Codification Topic 946 Financial Services – Investments Companies. The financial statements have been prepared in conformity with accounting principles generally accepted in the United States of America (GAAP), which require management to make certain estimates and assumptions at the date of the financial statements. Actual results could differ from those estimates. Subsequent events, if any, through the date that the financial statements were issued have been evaluated in the preparation of the financial statements. The following summarizes the significant accounting policies of the Fund:
Investment Valuation. Investments are valued as of 4:00 p.m. Eastern time on the last calendar day of the period. The Board of Trustees (the Board) has delegated the day to day responsibility for the valuation of the Fund's investments to the Fair Value Committee (the Committee) established by the Fund's investment adviser. In accordance with valuation policies and procedures approved by the Board, the Fund attempts to obtain prices from one or more third party pricing vendors or brokers to value its investments. When current market prices, quotations or currency exchange rates are not readily available or reliable, investments will be fair valued in good faith by the Committee, in accordance with procedures adopted by the Board. Factors used in determining fair value vary by investment type and may include market or investment specific events. The frequency with which these procedures are used cannot be predicted and they may be utilized to a significant extent. The Committee oversees the Fund's valuation policies and procedures and reports to the Board on the Committee's activities and fair value determinations. The Board monitors the appropriateness of the procedures used in valuing the Fund's investments and ratifies the fair value determinations of the Committee.
The Fund categorizes the inputs to valuation techniques used to value its investments into a disclosure hierarchy consisting of three levels as shown below:
- Level 1 – quoted prices in active markets for identical investments
- Level 2 – other significant observable inputs (including quoted prices for similar investments, interest rates, prepayment speeds, etc.)
- Level 3 – unobservable inputs (including the Fund's own assumptions based on the best information available)
Valuation techniques used to value the Fund's investments by major category are as follows:
Equity securities, including restricted securities, for which market quotations are readily available, are valued at the last reported sale price or official closing price as reported by a third party pricing vendor on the primary market or exchange on which they are traded and are categorized as Level 1 in the hierarchy. In the event there were no sales during the day or closing prices are not available, securities are valued at the last quoted bid price or may be valued using the last available price and are generally categorized as Level 2 in the hierarchy. For foreign equity securities, when market or security specific events arise, comparisons to the valuation of American Depositary Receipts (ADRs), futures contracts, Exchange-Traded Funds (ETFs) and certain indexes as well as quoted prices for similar securities may be used and would be categorized as Level 2 in the hierarchy. Utilizing these techniques may result in transfers between Level 1 and Level 2. For equity securities, including restricted securities, where observable inputs are limited, assumptions about market activity and risk are used and these securities may be categorized as Level 3 in the hierarchy.
Investments in open-end mutual funds, including the Fidelity Central Funds, are valued at their closing net asset value (NAV) each business day and are categorized as Level 1 in the hierarchy.
Changes in valuation techniques may result in transfers in or out of an assigned level within the disclosure hierarchy. The aggregate value of investments by input level as of October 31, 2018, including information on transfers between Levels 1 and 2, is included at the end of the Fund's Schedule of Investments.
Foreign Currency. The Fund may use foreign currency contracts to facilitate transactions in foreign-denominated securities. Gains and losses from these transactions may arise from changes in the value of the foreign currency or if the counterparties do not perform under the contracts' terms.
Foreign-denominated assets, including investment securities, and liabilities are translated into U.S. dollars at the exchange rates at period end. Purchases and sales of investment securities, income and dividends received and expenses denominated in foreign currencies are translated into U.S. dollars at the exchange rate in effect on the transaction date.
The effects of exchange rate fluctuations on investments are included with the net realized and unrealized gain (loss) on investment securities. Other foreign currency transactions resulting in realized and unrealized gain (loss) are disclosed separately.
Investment Transactions and Income. For financial reporting purposes, the Fund's investment holdings and NAV include trades executed through the end of the last business day of the period. The NAV per share for processing shareholder transactions is calculated as of the close of business of the New York Stock Exchange (NYSE), normally 4:00 p.m. Eastern time and includes trades executed through the end of the prior business day. Gains and losses on securities sold are determined on the basis of identified cost. Dividend income is recorded on the ex-dividend date, except for certain dividends from foreign securities where the ex-dividend date may have passed, which are recorded as soon as the Fund is informed of the ex-dividend date. Non-cash dividends included in dividend income, if any, are recorded at the fair market value of the securities received. Income and capital gain distributions from Fidelity Central Funds, if any, are recorded on the ex-dividend date. Investment income is recorded net of foreign taxes withheld where recovery of such taxes is uncertain.
Class Allocations and Expenses. Investment income, realized and unrealized capital gains and losses, common expenses of the Fund, and certain fund-level expense reductions, if any, are allocated daily on a pro-rata basis to each class based on the relative net assets of each class to the total net assets of the Fund. Each class differs with respect to transfer agent and distribution and service plan fees incurred. Certain expense reductions may also differ by class. For the reporting period, the allocated portion of income and expenses to each class as a percent of its average net assets may vary due to the timing of recording these transactions in relation to fluctuating net assets of the classes. Expenses directly attributable to a fund are charged to that fund. Expenses attributable to more than one fund are allocated among the respective funds on the basis of relative net assets or other appropriate methods. Expense estimates are accrued in the period to which they relate and adjustments are made when actual amounts are known.
Income Tax Information and Distributions to Shareholders. Each year, the Fund intends to qualify as a regulated investment company under Subchapter M of the Internal Revenue Code, including distributing substantially all of its taxable income and realized gains. As a result, no provision for U.S. Federal income taxes is required. As of October 31, 2018, the Fund did not have any unrecognized tax benefits in the financial statements; nor is the Fund aware of any tax positions for which it is reasonably possible that the total amounts of unrecognized tax benefits will significantly change in the next twelve months. The Fund files a U.S. federal tax return, in addition to state and local tax returns as required. The Fund's federal income tax returns are subject to examination by the Internal Revenue Service (IRS) for a period of three fiscal years after they are filed. State and local tax returns may be subject to examination for an additional fiscal year depending on the jurisdiction. Foreign taxes are provided for based on the Fund's understanding of the tax rules and rates that exist in the foreign markets in which it invests.
Distributions are declared and recorded on the ex-dividend date. Income and capital gain distributions are declared separately for each class. Income and capital gain distributions are determined in accordance with income tax regulations, which may differ from GAAP.
Capital accounts within the financial statements are adjusted for permanent book-tax differences. These adjustments have no impact on net assets or the results of operations. Capital accounts are not adjusted for temporary book-tax differences which will reverse in a subsequent period.
Book-tax differences are primarily due to foreign currency transactions, passive foreign investment companies (PFIC), deferred trustees compensation, capital loss carryforwards, expiring capital loss carryforwards and losses deferred due to wash sales.
As of period end, the cost and unrealized appreciation (depreciation) in securities, and derivatives if applicable, for federal income tax purposes were as follows:
| Gross unrealized appreciation | $69,850,154 |
| Gross unrealized depreciation | (25,836,712) |
| Net unrealized appreciation (depreciation) | $44,013,442 |
| Tax Cost | $478,473,915 |
The tax-based components of distributable earnings as of period end were as follows:
| Undistributed ordinary income | $1,785,468 |
| Capital loss carryforward | $(98,806,038) |
| Net unrealized appreciation (depreciation) on securities and other investments | $44,006,015 |
Capital loss carryforwards are only available to offset future capital gains of the Fund to the extent provided by regulations and may be limited. Under the Regulated Investment Company Modernization Act of 2010 (the Act), the Fund is permitted to carry forward capital losses incurred in taxable years beginning after December 22, 2010 for an unlimited period and such capital losses are required to be used prior to any losses that expire. The capital loss carryforward information presented below, including any applicable limitation, is estimated as of fiscal period end and is subject to adjustment.
| Fiscal year of expiration | |
| 2019 | $(98,806,038) |
The tax character of distributions paid was as follows:
| October 31, 2018 | October 31, 2017 | |
| Ordinary Income | $3,858,691 | $ 4,429,607 |
Short-Term Trading (Redemption) Fees. Shares held by investors in the Fund less than 90 days may have been subject to a redemption fee equal to 1.50% of the NAV of shares redeemed. All redemption fees, which reduce the proceeds of the shareholder redemption, are retained by the Fund and accounted for as an addition to paid in capital. In November 2017, the Board of Trustees approved the elimination of these redemption fees effective December 18, 2017.
New Rule Issuance. During August 2018, the U.S. Securities and Exchange Commission issued Final Rule Release No. 33-10532, Disclosure Update and Simplification. This Final Rule includes amendments specific to registered investment companies that are intended to eliminate overlap in disclosure requirements between Regulation S-X and GAAP. In accordance with these amendments, certain line-items in the Fund's financial statements have been combined or removed for the current period as outlined in the table below.
| Financial Statement | Current Line-Item Presentation | Prior Line-Item Presentation |
| Statement of Assets and Liabilities | Total distributable earnings (loss) | Undistributed/Distributions in excess of/Accumulated net investment income (loss) Accumulated/Undistributed net realized gain (loss) Net unrealized appreciation (depreciation) |
| Statement of Changes in Net Assets | N/A - removed | Undistributed/Distributions in excess of/Accumulated net investment income (loss) end of period |
| Statement of Changes in Net Assets | Distributions to shareholders | Distributions to shareholders from net investment income Distributions to shareholders from net realized gain |
| Distributions to Shareholders Note to Financial Statements | Distributions to shareholders | Distributions to shareholders from net investment income Distributions to shareholders from net realized gain |
4. Purchases and Sales of Investments.
Purchases and sales of securities, other than short-term securities, aggregated $243,350,886 and $168,807,111, respectively.
5. Fees and Other Transactions with Affiliates.
Management Fee. Fidelity Management & Research Company (the investment adviser) and its affiliates provide the Fund with investment management related services for which the Fund pays a monthly management fee. The management fee is the sum of an individual fund fee rate that is based on an annual rate of .45% of the Fund's average net assets and an annualized group fee rate that averaged .24% during the period. The group fee rate is based upon the average net assets of all the mutual funds advised by the investment adviser, including any mutual funds previously advised by the investment adviser that are currently advised by Fidelity SelectCo, LLC, an affiliate of the investment adviser. The group fee rate decreases as assets under management increase and increases as assets under management decrease. In addition, the management fee is subject to a performance adjustment (up to a maximum of +/- .20% of the Fund's average net assets over a 36 month performance period). The upward or downward adjustment to the management fee is based on the relative investment performance of Japan as compared to its benchmark index, the TOPIX, over the same 36 month performance period. For the reporting period, the total annual management fee rate, including the performance adjustment, was .74% of the Fund's average net assets. The performance adjustment included in the management fee rate may be higher or lower than the maximum performance adjustment rate due to the difference between the average net assets for the reporting and performance periods.
Distribution and Service Plan Fees. In accordance with Rule 12b-1 of the 1940 Act, the Fund has adopted separate Distribution and Service Plans for each class of shares. Certain classes pay Fidelity Distributors Corporation (FDC), an affiliate of the investment adviser, separate Distribution and Service Fees, each of which is based on an annual percentage of each class' average net assets. In addition, FDC may pay financial intermediaries for selling shares of the Fund and providing shareholder support services. For the period, the Distribution and Service Fee rates, total fees and amounts retained by FDC were as follows:
| Distribution Fee | Service Fee | Total Fees | Retained by FDC | |
| Class A | -% | .25% | $41,998 | $316 |
| Class M | .25% | .25% | 22,866 | 283 |
| Class C | .75% | .25% | 149,255 | 20,737 |
| $214,119 | $21,336 |
Sales Load. FDC may receive a front-end sales charge of up to 5.75% for selling Class A shares and 3.50% for selling Class M shares, some of which is paid to financial intermediaries for selling shares of the Fund. Depending on the holding period, FDC may receive contingent deferred sales charges levied on Class A, Class M and Class C redemptions. The deferred sales charges are 1.00% for Class C shares, 1.00% for certain purchases of Class A shares and .25% for certain purchases of Class M shares.
For the period, sales charge amounts retained by FDC were as follows:
| Retained by FDC | |
| Class A | $6,064 |
| Class M | 769 |
| Class C(a) | 8,168 |
| $15,001 |
(a) When Class C shares are initially sold, FDC pays commissions from its own resources to financial intermediaries through which the sales are made.
Transfer Agent Fees. Fidelity Investments Institutional Operations Company, Inc., (FIIOC), an affiliate of the investment adviser, is the transfer, dividend disbursing and shareholder servicing agent for each class of the Fund. FIIOC receives account fees and asset-based fees that vary according to the account size and type of account of the shareholders of the respective classes of the Fund, except for Class Z. FIIOC receives an asset-based fee of Class Z's average net assets. FIIOC pays for typesetting, printing and mailing of shareholder reports, except proxy statements.
For the period, transfer agent fees for each class were as follows:
| Amount | % of Class-Level Average Net Assets | |
| Class A | $40,307 | .24 |
| Class M | 15,160 | .33 |
| Class C | 28,897 | .19 |
| Japan | 383,893 | .21 |
| Class I | 266,202 | .14 |
| Class Z | 3 | .04(a) |
| $734,462 |
(a) Annualized
Accounting and Security Lending Fees. Fidelity Service Company, Inc. (FSC), an affiliate of the investment adviser, maintains the Fund's accounting records. The accounting fee is based on the level of average net assets for each month. Under a separate contract, FSC administers the security lending program. The security lending fee is based on the number and duration of lending transactions. For the period, the fees were equivalent to an annual rate of .05%.
Brokerage Commissions. The Fund placed a portion of its portfolio transactions with brokerage firms which are affiliates of the investment adviser. Brokerage commissions are included in net realized gain (loss) and change in net unrealized appreciation (depreciation) in the Statement of Operations. The commissions paid to these affiliated firms were $139 for the period.
Interfund Trades. The Fund may purchase from or sell securities to other Fidelity Funds under procedures adopted by the Board. The procedures have been designed to ensure these interfund trades are executed in accordance with Rule 17a-7 of the 1940 Act. Interfund trades are included within the respective purchases and sales amounts shown in the Purchases and Sales of Investments note.
6. Committed Line of Credit.
The Fund participates with other funds managed by the investment adviser or an affiliate in a $4.25 billion credit facility (the "line of credit") to be utilized for temporary or emergency purposes to fund shareholder redemptions or for other short-term liquidity purposes. The Fund has agreed to pay commitment fees on its pro-rata portion of the line of credit, which amounted to $1,138 and is reflected in Miscellaneous expenses on the Statement of Operations. During the period, the Fund did not borrow on this line of credit.
7. Security Lending.
The Fund lends portfolio securities through a lending agent from time to time in order to earn additional income. For equity securities, a lending agent is used and may loan securities to certain qualified borrowers, including Fidelity Capital Markets (FCM), a broker-dealer affiliated with the Fund. On the settlement date of the loan, the Fund receives collateral (in the form of U.S. Treasury obligations, letters of credit and/or cash) against the loaned securities and maintains collateral in an amount not less than 100% of the market value of the loaned securities during the period of the loan. The market value of the loaned securities is determined at the close of business of the Fund and any additional required collateral is delivered to the Fund on the next business day. The Fund or borrower may terminate the loan at any time, and if the borrower defaults on its obligation to return the securities loaned because of insolvency or other reasons, the Fund may apply collateral received from the borrower against the obligation. The Fund may experience delays and costs in recovering the securities loaned. Any cash collateral received is invested in the Fidelity Securities Lending Cash Central Fund. The value of loaned securities and cash collateral at period end are disclosed on the Fund's Statement of Assets and Liabilities. Security lending income represents the income earned on investing cash collateral, less rebates paid to borrowers and any lending agent fees associated with the loan, plus any premium payments received for lending certain types of securities. Security lending income is presented in the Statement of Operations as a component of income from Fidelity Central Funds. Total security lending income during the period amounted to $112,917. During the period, there were no securities loaned to FCM.
8. Expense Reductions.
Commissions paid to certain brokers with whom the investment adviser, or its affiliates, places trades on behalf of the Fund include an amount in addition to trade execution, which may be rebated back to the Fund to offset certain expenses. This amount totaled $36,374 for the period. In addition, through arrangements with the Fund's custodian, credits realized as a result of certain uninvested cash balances were used to reduce the Fund's expenses. During the period, these credits reduced the Fund's custody expenses by $50.
In addition, during the period the investment adviser reimbursed and/or waived a portion of fund-level operating expenses in the amount of $4,036.
9. Distributions to Shareholders.
Distributions to shareholders of each class were as follows:
| Year ended October 31, 2018 | Year ended October 31, 2017 | |
| Distributions to shareholders | ||
| Class A | $121,236 | $– |
| Class M | 24,538 | – |
| Class C | 35,656 | – |
| Japan | 1,679,410 | – |
| Class I | 1,997,851 | – |
| Total | $3,858,691 | $– |
| From net investment income | ||
| Class A | $– | $104,209 |
| Class M | – | 3,257 |
| Japan | – | 3,209,793 |
| Class I | – | 51,808 |
| Total | $– | $3,369,067 |
| From net realized gain | ||
| Class A | $– | $59,052 |
| Class M | – | 11,074 |
| Japan | – | 974,401 |
| Class I | – | 16,013 |
| Total | $– | $1,060,540 |
10. Share Transactions.
Share transactions for each class were as follows and may contain automatic conversions between classes or exchanges between affiliated funds:
| Shares | Shares | Dollars | Dollars | |
| Year ended October 31, 2018(a) | Year ended October 31, 2017 | Year ended October 31, 2018(a) | Year ended October 31, 2017 | |
| Class A | ||||
| Shares sold | 227,462 | 261,996 | $3,578,036 | $3,537,670 |
| Reinvestment of distributions | 7,603 | 12,680 | 116,628 | 155,198 |
| Shares redeemed | (275,394) | (1,102,972) | (4,276,195) | (14,608,137) |
| Net increase (decrease) | (40,329) | (828,296) | $(581,531) | $(10,915,269) |
| Class M | ||||
| Shares sold | 26,530 | 34,522 | $416,546 | $446,496 |
| Reinvestment of distributions | 1,589 | 1,137 | 24,389 | 13,940 |
| Shares redeemed | (41,543) | (72,947) | (648,170) | (961,323) |
| Net increase (decrease) | (13,424) | (37,288) | $(207,235) | $(500,887) |
| Class C | ||||
| Shares sold | 247,078 | 75,525 | $3,881,516 | $955,948 |
| Reinvestment of distributions | 2,227 | – | 33,918 | – |
| Shares redeemed | (255,967) | (379,339) | (3,954,581) | (4,904,728) |
| Net increase (decrease) | (6,662) | (303,814) | $(39,147) | $(3,948,780) |
| Japan | ||||
| Shares sold | 13,428,936 | 5,531,120 | $195,751,878 | $70,265,364 |
| Reinvestment of distributions | 102,752 | 332,957 | 1,578,266 | 4,075,396 |
| Shares redeemed | (8,929,520) | (17,427,207) | (137,886,513) | (225,423,617) |
| Net increase (decrease) | 4,602,168 | (11,563,130) | $59,443,631 | $(151,082,857) |
| Class I | ||||
| Shares sold | 2,319,602 | 12,120,647 | $34,952,986 | $156,870,865 |
| Reinvestment of distributions | 129,754 | 4,957 | 1,987,832 | 60,627 |
| Shares redeemed | (501,872) | (1,052,603) | (7,627,507) | (13,914,364) |
| Net increase (decrease) | 1,947,484 | 11,073,001 | $29,313,311 | $143,017,128 |
| Class Z | ||||
| Shares sold | 6,341 | – | $100,000 | $– |
| Net increase (decrease) | 6,341 | – | $100,000 | $– |
(a) Share transactions for Class Z are for the period October 2, 2018 (commencement of sale of shares) to October 31, 2018.
11. Other.
The Fund's organizational documents provide former and current trustees and officers with a limited indemnification against liabilities arising in connection with the performance of their duties to the Fund. In the normal course of business, the Fund may also enter into contracts that provide general indemnifications. The Fund's maximum exposure under these arrangements is unknown as this would be dependent on future claims that may be made against the Fund. The risk of material loss from such claims is considered remote.
At the end of the period, Strategic Advisers International Fund, VIP FundsManager 50% Portfolio and VIP FundsManager 60% Portfolio were the owners of record of approximately 26%, 11% and 11%, respectively, of the total outstanding shares of the Fund. Mutual funds managed by the investment adviser or its affiliates were the owners of record, in the aggregate, of approximately 62% of the total outstanding shares of the Fund.
Report of Independent Registered Public Accounting Firm
To the Board of Trustees of Fidelity Investment Trust and Shareholders of Fidelity Japan Fund:
Opinion on the Financial Statements
We have audited the accompanying statement of assets and liabilities, including the schedule of investments, of Fidelity Japan Fund (one of the funds constituting Fidelity Investment Trust, referred to hereafter as the "Fund") as of October 31, 2018, the related statement of operations for the year ended October 31, 2018, the statement of changes in net assets for each of the two years in the period ended October 31, 2018, including the related notes, and the financial highlights for each of the periods indicated therein (collectively referred to as the “financial statements”). In our opinion, the financial statements present fairly, in all material respects, the financial position of the Fund as of October 31, 2018, the results of its operations for the year then ended, the changes in its net assets for each of the two years in the period ended October 31, 2018 and the financial highlights for each of the periods indicated therein in conformity with accounting principles generally accepted in the United States of America.
Basis for Opinion
These financial statements are the responsibility of the Fund’s management. Our responsibility is to express an opinion on the Fund’s financial statements based on our audits. We are a public accounting firm registered with the Public Company Accounting Oversight Board (United States) (“PCAOB”) and are required to be independent with respect to the Fund in accordance with the U.S. federal securities laws and the applicable rules and regulations of the Securities and Exchange Commission and the PCAOB.
We conducted our audits of these financial statements in accordance with the standards of the PCAOB. Those standards require that we plan and perform the audit to obtain reasonable assurance about whether the financial statements are free of material misstatement, whether due to error or fraud.
Our audits included performing procedures to assess the risks of material misstatement of the financial statements, whether due to error or fraud, and performing procedures that respond to those risks. Such procedures included examining, on a test basis, evidence regarding the amounts and disclosures in the financial statements. Our audits also included evaluating the accounting principles used and significant estimates made by management, as well as evaluating the overall presentation of the financial statements. Our procedures included confirmation of securities owned as of October 31, 2018 by correspondence with the custodian and brokers; when replies were not received from brokers, we performed other auditing procedures. We believe that our audits provide a reasonable basis for our opinion.
PricewaterhouseCoopers LLP
Boston, Massachusetts
December 14, 2018
We have served as the auditor of one or more investment companies in the Fidelity group of funds since 1932.
Trustees and Officers
The Trustees, Members of the Advisory Board (if any), and officers of the trust and fund, as applicable, are listed below. The Board of Trustees governs the fund and is responsible for protecting the interests of shareholders. The Trustees are experienced executives who meet periodically throughout the year to oversee the fund's activities, review contractual arrangements with companies that provide services to the fund, oversee management of the risks associated with such activities and contractual arrangements, and review the fund's performance. Except for Jonathan Chiel, each of the Trustees oversees 283 funds. Mr. Chiel oversees 154 funds.
The Trustees hold office without limit in time except that (a) any Trustee may resign; (b) any Trustee may be removed by written instrument, signed by at least two-thirds of the number of Trustees prior to such removal; (c) any Trustee who requests to be retired or who has become incapacitated by illness or injury may be retired by written instrument signed by a majority of the other Trustees; and (d) any Trustee may be removed at any special meeting of shareholders by a two-thirds vote of the outstanding voting securities of the trust. Each Trustee who is not an interested person (as defined in the 1940 Act) of the trust and the fund is referred to herein as an Independent Trustee. Each Independent Trustee shall retire not later than the last day of the calendar year in which his or her 75th birthday occurs. The Independent Trustees may waive this mandatory retirement age policy with respect to individual Trustees. Officers and Advisory Board Members hold office without limit in time, except that any officer or Advisory Board Member may resign or may be removed by a vote of a majority of the Trustees at any regular meeting or any special meeting of the Trustees. Except as indicated, each individual has held the office shown or other offices in the same company for the past five years.
The fund’s Statement of Additional Information (SAI) includes more information about the Trustees. To request a free copy, call Fidelity at 1-877-208-0098.
Experience, Skills, Attributes, and Qualifications of the Trustees. The Governance and Nominating Committee has adopted a statement of policy that describes the experience, qualifications, attributes, and skills that are necessary and desirable for potential Independent Trustee candidates (Statement of Policy). The Board believes that each Trustee satisfied at the time he or she was initially elected or appointed a Trustee, and continues to satisfy, the standards contemplated by the Statement of Policy. The Governance and Nominating Committee also engages professional search firms to help identify potential Independent Trustee candidates who have the experience, qualifications, attributes, and skills consistent with the Statement of Policy. From time to time, additional criteria based on the composition and skills of the current Independent Trustees, as well as experience or skills that may be appropriate in light of future changes to board composition, business conditions, and regulatory or other developments, have also been considered by the professional search firms and the Governance and Nominating Committee. In addition, the Board takes into account the Trustees' commitment and participation in Board and committee meetings, as well as their leadership of standing and ad hoc committees throughout their tenure.
In determining that a particular Trustee was and continues to be qualified to serve as a Trustee, the Board has considered a variety of criteria, none of which, in isolation, was controlling. The Board believes that, collectively, the Trustees have balanced and diverse experience, qualifications, attributes, and skills, which allow the Board to operate effectively in governing the fund and protecting the interests of shareholders. Information about the specific experience, skills, attributes, and qualifications of each Trustee, which in each case led to the Board's conclusion that the Trustee should serve (or continue to serve) as a trustee of the fund, is provided below.
Board Structure and Oversight Function. James C. Curvey is an interested person and currently serves as Chairman. The Trustees have determined that an interested Chairman is appropriate and benefits shareholders because an interested Chairman has a personal and professional stake in the quality and continuity of services provided to the fund. Independent Trustees exercise their informed business judgment to appoint an individual of their choosing to serve as Chairman, regardless of whether the Trustee happens to be independent or a member of management. The Independent Trustees have determined that they can act independently and effectively without having an Independent Trustee serve as Chairman and that a key structural component for assuring that they are in a position to do so is for the Independent Trustees to constitute a substantial majority for the Board. The Independent Trustees also regularly meet in executive session. Ned C. Lautenbach serves as Chairman of the Independent Trustees and as such (i) acts as a liaison between the Independent Trustees and management with respect to matters important to the Independent Trustees and (ii) with management prepares agendas for Board meetings.
Fidelity® funds are overseen by different Boards of Trustees. The fund's Board oversees Fidelity's high income and certain equity funds, and other Boards oversee Fidelity's investment-grade bond, money market, asset allocation, and other equity funds. The asset allocation funds may invest in Fidelity® funds overseen by the fund's Board. The use of separate Boards, each with its own committee structure, allows the Trustees of each group of Fidelity® funds to focus on the unique issues of the funds they oversee, including common research, investment, and operational issues. On occasion, the separate Boards establish joint committees to address issues of overlapping consequences for the Fidelity® funds overseen by each Board.
The Trustees operate using a system of committees to facilitate the timely and efficient consideration of all matters of importance to the Trustees, the fund, and fund shareholders and to facilitate compliance with legal and regulatory requirements and oversight of the fund's activities and associated risks. The Board, acting through its committees, has charged FMR and its affiliates with (i) identifying events or circumstances the occurrence of which could have demonstrably adverse effects on the fund's business and/or reputation; (ii) implementing processes and controls to lessen the possibility that such events or circumstances occur or to mitigate the effects of such events or circumstances if they do occur; and (iii) creating and maintaining a system designed to evaluate continuously business and market conditions in order to facilitate the identification and implementation processes described in (i) and (ii) above. Because the day-to-day operations and activities of the fund are carried out by or through FMR, its affiliates, and other service providers, the fund's exposure to risks is mitigated but not eliminated by the processes overseen by the Trustees. While each of the Board's committees has responsibility for overseeing different aspects of the fund's activities, oversight is exercised primarily through the Operations, Audit, and Compliance Committees. In addition, the Independent Trustees have worked with Fidelity to enhance the Board's oversight of investment and financial risks, legal and regulatory risks, technology risks, and operational risks, including the development of additional risk reporting to the Board. Appropriate personnel, including but not limited to the fund's Chief Compliance Officer (CCO), FMR's internal auditor, the independent accountants, the fund's Treasurer and portfolio management personnel, make periodic reports to the Board's committees, as appropriate, including an annual review of Fidelity's risk management program for the Fidelity® funds. The responsibilities of each standing committee, including their oversight responsibilities, are described further under "Standing Committees of the Trustees."
Interested Trustees*:
Correspondence intended for a Trustee who is an interested person may be sent to Fidelity Investments, 245 Summer Street, Boston, Massachusetts 02210.
Name, Year of Birth; Principal Occupations and Other Relevant Experience+
Jonathan Chiel (1957)
Year of Election or Appointment: 2016
Trustee
Mr. Chiel also serves as Trustee of other Fidelity® funds. Mr. Chiel is Executive Vice President and General Counsel for FMR LLC (diversified financial services company, 2012-present). Previously, Mr. Chiel served as general counsel (2004-2012) and senior vice president and deputy general counsel (2000-2004) for John Hancock Financial Services; a partner with Choate, Hall & Stewart (1996-2000) (law firm); and an Assistant United States Attorney for the United States Attorney’s Office of the District of Massachusetts (1986-95), including Chief of the Criminal Division (1993-1995). Mr. Chiel is a director on the boards of the Boston Bar Foundation and the Maimonides School.
James C. Curvey (1935)
Year of Election or Appointment: 2007
Trustee
Chairman of the Board of Trustees
Mr. Curvey also serves as Trustee of other Fidelity® funds. Mr. Curvey is Vice Chairman (2007-present) and Director of FMR LLC (diversified financial services company). In addition, Mr. Curvey is an Overseer Emeritus for the Boston Symphony Orchestra, a Director of Artis-Naples, and a Trustee of Brewster Academy in Wolfeboro, New Hampshire. Previously, Mr. Curvey served as a Director of Fidelity Research & Analysis Co. (investment adviser firm, 2009-2018), Director of Fidelity Investments Money Management, Inc. (investment adviser firm, 2009-2014) and a Director of FMR and FMR Co., Inc. (investment adviser firms, 2007-2014).
Charles S. Morrison (1960)
Year of Election or Appointment: 2014
Trustee
Mr. Morrison also serves as Trustee of other funds. He serves as President of Fidelity SelectCo, LLC (investment adviser firm, 2017-present) and Fidelity Management & Research Company (FMR) (investment adviser firm, 2016-present), a Director of Fidelity Investments Money Management, Inc. (FIMM) (investment adviser firm, 2014-present), Director of Fidelity SelectCo, LLC (investment adviser firm, 2014-present), President, Asset Management (2014-present), and is an employee of Fidelity Investments. Previously, Mr. Morrison served as Vice President of Fidelity's Fixed Income and Asset Allocation Funds (2012-2014), President, Fixed Income (2011-2014), Vice President of Fidelity's Money Market Funds (2005-2009), President, Money Market Group Leader of FMR (investment adviser firm, 2009), and Senior Vice President, Money Market Group of FMR (2004-2009). Mr. Morrison also served as Vice President of Fidelity's Bond Funds (2002-2005), certain Balanced Funds (2002-2005), and certain Asset Allocation Funds (2002-2007), and as Senior Vice President (2002-2005) of Fidelity's Bond Division.
* Determined to be an “Interested Trustee” by virtue of, among other things, his or her affiliation with the trust or various entities under common control with FMR.
+ The information includes the Trustee's principal occupation during the last five years and other information relating to the experience, attributes, and skills relevant to the Trustee's qualifications to serve as a Trustee, which led to the conclusion that the Trustee should serve as a Trustee for the fund.
Independent Trustees:
Correspondence intended for an Independent Trustee may be sent to Fidelity Investments, P.O. Box 55235, Boston, Massachusetts 02205-5235.
Name, Year of Birth; Principal Occupations and Other Relevant Experience+
Dennis J. Dirks (1948)
Year of Election or Appointment: 2005
Trustee
Mr. Dirks also serves as Trustee of other Fidelity® funds. Prior to his retirement in May 2003, Mr. Dirks was Chief Operating Officer and a member of the Board of The Depository Trust & Clearing Corporation (DTCC). He also served as President, Chief Operating Officer, and Board member of The Depository Trust Company (DTC) and President and Board member of the National Securities Clearing Corporation (NSCC). In addition, Mr. Dirks served as Chief Executive Officer and Board member of the Government Securities Clearing Corporation, Chief Executive Officer and Board member of the Mortgage-Backed Securities Clearing Corporation, as a Trustee and a member of the Finance Committee of Manhattan College (2005-2008), as a Trustee and a member of the Finance Committee of AHRC of Nassau County (2006-2008), as a member of the Independent Directors Council (IDC) Governing Council (2010-2015), and as a member of the Board of Directors for The Brookville Center for Children’s Services, Inc. (2009-2017). Mr. Dirks is a member of the Finance Committee (2016-present), Board of Directors (2017-present) and Board of Trustees (2018-present) and is Treasurer (2018-present) of the Asolo Repertory Theatre.
Donald F. Donahue (1950)
Year of Election or Appointment: 2018
Trustee
Mr. Donahue also serves as a Trustee of other Fidelity® funds. Mr. Donahue is President and Chief Executive Officer of Miranda Partners, LLC (risk consulting for the financial services industry, 2012-present). Previously, Mr. Donahue served as a Member of the Advisory Board of certain Fidelity® funds (2015-2018) and Chief Executive Officer (2006-2012), Chief Operating Officer (2003-2006), and Managing Director, Customer Marketing and Development (1999-2003) of The Depository Trust & Clearing Corporation (financial markets infrastructure). Mr. Donahue serves as a Member (2007-present) and Co-Chairman (2016-present) of the Board of Directors of United Way of New York, Member of the Board of Directors of NYC Leadership Academy (2012-present) and Member of the Board of Advisors of Ripple Labs, Inc. (financial services, 2015-present). He also served as Chairman (2010-2012) and Member of the Board of Directors (2012-2013) of Omgeo, LLC (financial services), Treasurer of United Way of New York (2012-2016), and Member of the Board of Directors of XBRL US (financial services non-profit, 2009-2012) and the International Securities Services Association (2009-2012).
Alan J. Lacy (1953)
Year of Election or Appointment: 2008
Trustee
Mr. Lacy also serves as Trustee of other Fidelity® funds. Mr. Lacy serves as a Director of Bristol-Myers Squibb Company (global pharmaceuticals, 2008-present). He is a Trustee of the California Chapter of The Nature Conservancy (2015-present) and a Director of the Center for Advanced Study in the Behavioral Sciences at Stanford University (2015-present). In addition, Mr. Lacy served as Senior Adviser (2007-2014) of Oak Hill Capital Partners, L.P. (private equity) and also served as Chief Executive Officer (2005) and Vice Chairman (2005-2006) of Sears Holdings Corporation (retail) and Chief Executive Officer and Chairman of the Board of Sears, Roebuck and Co. (retail, 2000-2005). Previously, Mr. Lacy served as Chairman (2014-2017) and a member (2010-2017) of the Board of Directors of Dave & Buster’s Entertainment, Inc. (restaurant and entertainment complexes), as Chairman (2008-2011) and a member (2006-2015) of the Board of Trustees of the National Parks Conservation Association, and as a member of the Board of Directors for The Hillman Companies, Inc. (hardware wholesalers, 2010-2014), Earth Fare, Inc. (retail grocery, 2010-2014), and The Western Union Company (global money transfer, 2006-2011).
Ned C. Lautenbach (1944)
Year of Election or Appointment: 2000
Trustee
Chairman of the Independent Trustees
Mr. Lautenbach also serves as Trustee of other Fidelity® funds. Mr. Lautenbach currently serves as Vice Chair of the Board of Governors, State University System of Florida (2013-present) and is a member of the Council on Foreign Relations (1994-present). He is also a member and has most recently served as Chairman of the Board of Directors of Artis-Naples (2012-present). Previously, Mr. Lautenbach served as a member and then Lead Director of the Board of Directors of Eaton Corporation (diversified industrial, 1997-2016). He was also a Partner and Advisory Partner at Clayton, Dubilier & Rice, LLC (private equity investment, 1998-2010), as well as a Director of Sony Corporation (2006-2007). In addition, Mr. Lautenbach also had a 30-year career with IBM (technology company) during which time he served as Senior Vice President and a member of the Corporate Executive Committee (1968-1998).
Joseph Mauriello (1944)
Year of Election or Appointment: 2008
Trustee
Mr. Mauriello also serves as Trustee of other Fidelity® funds. Prior to his retirement in January 2006, Mr. Mauriello served in numerous senior management positions including Deputy Chairman and Chief Operating Officer (2004-2005), and Vice Chairman of Financial Services (2002-2004) of KPMG LLP US (professional services, 1965-2005). Mr. Mauriello currently serves as a member of the Independent Directors Council (IDC) Governing Council (2015-present). Previously, Mr. Mauriello served as a member of the Board of Directors of XL Group plc. (global insurance and re-insurance, 2006-2018).
Cornelia M. Small (1944)
Year of Election or Appointment: 2005
Trustee
Ms. Small also serves as Trustee of other Fidelity® funds. Ms. Small is a member of the Board of Directors (2009-present) and Chair of the Investment Committee (2010-present) of the Teagle Foundation. Ms. Small also serves on the Investment Committee of the Berkshire Taconic Community Foundation (2008-present). Previously, Ms. Small served as Chairperson (2002-2008) and a member of the Investment Committee and Chairperson (2008-2012) and a member of the Board of Trustees of Smith College. In addition, Ms. Small served as Chief Investment Officer, Director of Global Equity Investments, and a member of the Board of Directors of Scudder, Stevens & Clark and Scudder Kemper Investments.
Garnett A. Smith (1947)
Year of Election or Appointment: 2018
Trustee
Mr. Smith also serves as Trustee of other Fidelity® funds. Prior to Mr. Smith's retirement, he served as Chairman and Chief Executive Officer of Inbrand Corp. (manufacturer of personal absorbent products, 1990-1997). He also served as President (1986-1990) of Inbrand Corp. Prior to his employment with Inbrand Corp., he was employed by a retail fabric chain and North Carolina National Bank. In addition, Mr. Smith served as a Member of the Advisory Board of certain Fidelity® funds (2012-2013) and as a board member of the Jackson Hole Land Trust (2009-2012).
David M. Thomas (1949)
Year of Election or Appointment: 2008
Trustee
Mr. Thomas also serves as Trustee of other Fidelity® funds. Mr. Thomas serves as Non-Executive Chairman of the Board of Directors of Fortune Brands Home and Security (home and security products, 2011-present), as a member of the Board of Directors (2004-present) and Presiding Director (2013-present) of Interpublic Group of Companies, Inc. (marketing communication), and as a member of the Board of Trustees of the University of Florida (2013-present). Previously, Mr. Thomas served as Executive Chairman (2005-2006) and Chairman and Chief Executive Officer (2000-2005) of IMS Health, Inc. (pharmaceutical and healthcare information solutions), and a Director of Fortune Brands, Inc. (consumer products, 2000-2011).
+ The information includes the Trustee's principal occupation during the last five years and other information relating to the experience, attributes, and skills relevant to the Trustee's qualifications to serve as a Trustee, which led to the conclusion that the Trustee should serve as a Trustee for the fund.
Advisory Board Members and Officers:
Correspondence intended for a Member of the Advisory Board (if any) may be sent to Fidelity Investments, P.O. Box 55235, Boston, Massachusetts 02205-5235. Correspondence intended for an officer or Peter S. Lynch may be sent to Fidelity Investments, 245 Summer Street, Boston, Massachusetts 02210. Officers appear below in alphabetical order.
Name, Year of Birth; Principal Occupation
Vicki L. Fuller (1957)
Year of Election or Appointment: 2018
Member of the Advisory Board
Ms. Fuller also serves as Member of the Advisory Board of other Fidelity® funds. Ms. Fuller serves as a member of the Board of Directors, Audit Committee, and Nominating and Governance Committee of The Williams Companies, Inc. (natural gas infrastructure, 2018-present). Previously, Ms. Fuller served as the Chief Investment Officer of the New York State Common Retirement Fund (2012-2018) and held a variety of positions at AllianceBernstein L.P. (global asset management, 1985-2012), including Managing Director (2006-2012) and Senior Vice President and Senior Portfolio Manager (2001-2006).
Peter S. Lynch (1944)
Year of Election or Appointment: 2003
Member of the Advisory Board
Mr. Lynch also serves as Member of the Advisory Board of other Fidelity® funds. Mr. Lynch is Vice Chairman and a Director of FMR (investment adviser firm) and FMR Co., Inc. (investment adviser firm). In addition, Mr. Lynch serves as a Trustee of Boston College and as the Chairman of the Inner-City Scholarship Fund. Previously, Mr. Lynch served on the Special Olympics International Board of Directors (1997-2006).
William S. Stavropoulos (1939)
Year of Election or Appointment: 2018
Member of the Advisory Board
Mr. Stavropoulos also serves as Member of the Advisory Board of other Fidelity® funds. Mr. Stavropoulos serves as President and Founder of the Michigan Baseball Foundation, the Great Lakes Loons (2007-present). Mr. Stavropoulos is Chairman Emeritus of the Board of Directors of The Dow Chemical Company, where he previously served in numerous senior management positions, including President, CEO (1995-2000; 2002-2004), Chairman of the Executive Committee (2000-2006), and as a member of the Board of Directors (1990-2006). Currently, Mr. Stavropoulos is Chairman of the Board of Directors of Univar Inc. (global distributor of commodity and specialty chemicals), a Director of Teradata Corporation (data warehousing and technology solutions), and a member of the Advisory Board for Metalmark Capital LLC (private equity investment, 2005-present). Mr. Stavropoulos is an operating advisor to Clayton, Dubilier & Rice, LLC (private equity investment). In addition, Mr. Stavropoulos is a member of the University of Notre Dame Advisory Council for the College of Science, a Trustee of the Rollin L. Gerstacker Foundation, and a Director of Artis-Naples in Naples, Florida. Previously, Mr. Stavropoulos served as Trustee of certain Fidelity® funds (2001-2018) and as a Director of Chemical Financial Corporation (bank holding company, 1993-2012) and Tyco International, Ltd. (multinational manufacturing and services, 2007-2012).
Carol B. Tomé (1957)
Year of Election or Appointment: 2018
Member of the Advisory Board
Ms. Tomé also serves as Member of the Advisory Board of other Fidelity® funds. Ms. Tomé is Chief Financial Officer (2001-present) and Executive Vice President of Corporate Services (2007-present) of The Home Depot, Inc. (home improvement retailer) and a Director (2003-present) and Chair of the Audit Committee (2004-present) of United Parcel Service, Inc. (package delivery and supply chain management). Previously, Ms. Tomé served as Trustee of certain Fidelity® funds (2017), Senior Vice President of Finance and Accounting/Treasurer (2000-2007) and Vice President and Treasurer (1995-2000) of The Home Depot, Inc. and Chair of the Board (2010-2012), Vice Chair of the Board (2009 and 2013), and a Director (2008-2013) of the Federal Reserve Bank of Atlanta. Ms. Tomé is also a director or trustee of many community and professional organizations.
Michael E. Wiley (1950)
Year of Election or Appointment: 2018
Member of the Advisory Board
Mr. Wiley also serves as Trustee or Member of the Advisory Board of other Fidelity® funds. Mr. Wiley serves as a Director of High Point Resources (exploration and production, 2005-present). Previously, Mr. Wiley served as a Director of Andeavor Corporation (independent oil refiner and marketer, 2005-2018), a Director of Andeavor Logistics LP (natural resources logistics, 2015-2018), a Director of Post Oak Bank (privately-held bank, 2004-2018), a Director of Asia Pacific Exploration Consolidated (international oil and gas exploration and production, 2008-2013), a member of the Board of Trustees of the University of Tulsa (2000-2006; 2007-2010), a Senior Energy Advisor of Katzenbach Partners, LLC (consulting, 2006-2007), an Advisory Director of Riverstone Holdings (private investment), a Director of Spinnaker Exploration Company (exploration and production, 2001-2005) and Chairman, President, and CEO of Baker Hughes, Inc. (oilfield services, 2000-2004).
Elizabeth Paige Baumann (1968)
Year of Election or Appointment: 2017
Anti-Money Laundering (AML) Officer
Ms. Baumann also serves as AML Officer of other funds. She is Chief AML Officer (2012-present) and Senior Vice President (2014-present) of FMR LLC (diversified financial services company) and is an employee of Fidelity Investments. Previously, Ms. Baumann served as AML Officer of the funds (2012-2016), and Vice President (2007-2014) and Deputy Anti-Money Laundering Officer (2007-2012) of FMR LLC.
John J. Burke III (1964)
Year of Election or Appointment: 2018
Chief Financial Officer
Mr. Burke also serves as Chief Financial Officer of other funds. Mr. Burke serves as Head of Investment Operations for Fidelity Fund and Investment Operations (2018-present) and is an employee of Fidelity Investments (1998-present). Previously Mr. Burke served as head of Asset Management Investment Operations (2012-2018).
William C. Coffey (1969)
Year of Election or Appointment: 2018
Secretary and Chief Legal Officer (CLO)
Mr. Coffey also serves as Secretary and CLO of other funds. Mr. Coffey serves as CLO, Secretary, and Senior Vice President of Fidelity Management & Research Company and FMR Co., Inc. (investment adviser firms, 2018-present); Secretary of Fidelity SelectCo, LLC and Fidelity Investments Money Management, Inc. (investment adviser firms, 2018-present); and CLO of Fidelity Management & Research (Hong Kong) Limited, FMR Investment Management (UK) Limited, and Fidelity Management & Research (Japan) Limited (investment adviser firms, 2018-present). He is Senior Vice President and Deputy General Counsel of FMR LLC (diversified financial services company, 2010-present), and is an employee of Fidelity Investments. Previously, Mr. Coffey served as Assistant Secretary of certain funds (2009-2018) and as Vice President and Associate General Counsel of FMR LLC (2005-2009).
Timothy M. Cohen (1969)
Year of Election or Appointment: 2018
Vice President
Mr. Cohen also serves as Vice President of other funds. Mr. Cohen serves as Co-Head of Global Equity Research (2016-present), a Director of Fidelity Management & Research (Japan) Limited (investment adviser firm, 2016-present), and is an employee of Fidelity Investments. Previously, Mr. Cohen served as Chief Investment Officer - Equity and a Director of Fidelity Management & Research (U.K.) Inc. (investment adviser firm, 2013-2015) and as a Director of Fidelity Management & Research (Hong Kong) Limited (investment adviser firm, 2017).
Jonathan Davis (1968)
Year of Election or Appointment: 2010
Assistant Treasurer
Mr. Davis also serves as Assistant Treasurer of other funds. Mr. Davis serves as Assistant Treasurer of FMR Capital, Inc. (2017-present) and is an employee of Fidelity Investments. Previously, Mr. Davis served as Vice President and Associate General Counsel of FMR LLC (diversified financial services company, 2003-2010).
Adrien E. Deberghes (1967)
Year of Election or Appointment: 2016
Assistant Treasurer
Mr. Deberghes also serves as an officer of other funds. He serves as Assistant Treasurer of FMR Capital, Inc. (2017-present), Executive Vice President of Fidelity Investments Money Management, Inc. (FIMM) (investment adviser firm, 2016-present), and is an employee of Fidelity Investments (2008-present). Previously, Mr. Deberghes served as President and Treasurer of certain Fidelity® funds (2013-2018). Prior to joining Fidelity Investments, Mr. Deberghes was Senior Vice President of Mutual Fund Administration at State Street Corporation (2007-2008), Senior Director of Mutual Fund Administration at Investors Bank & Trust (2005-2007), and Director of Finance for Dunkin' Brands (2000-2005). Previously, Mr. Deberghes served in other fund officer roles.
Laura M. Del Prato (1964)
Year of Election or Appointment: 2018
Assistant Treasurer
Ms. Del Prato also serves as an officer of other funds. Ms. Del Prato is an employee of Fidelity Investments (2017-present). Prior to joining Fidelity Investments, Ms. Del Prato served as a Managing Director and Treasurer of the JPMorgan Mutual Funds (2014-2017). Prior to JPMorgan, Ms. Del Prato served as a partner at Cohen Fund Audit Services (accounting firm, 2012-2013) and KPMG LLP (accounting firm, 2004-2012).
Colm A. Hogan (1973)
Year of Election or Appointment: 2016
Deputy Treasurer
Mr. Hogan also serves as an officer of other funds. Mr. Hogan serves as Assistant Treasurer of FMR Capital, Inc. (2017-present) and is an employee of Fidelity Investments (2005-present). Previously, Mr. Hogan served as Assistant Treasurer of certain Fidelity® funds (2016-2018).
Pamela R. Holding (1964)
Year of Election or Appointment: 2018
Vice President
Ms. Holding also serves as Vice President of other funds. Ms. Holding serves as Co-Head of Global Equity Research (2018-present) and is an employee of Fidelity Investments (2013-present).
Chris Maher (1972)
Year of Election or Appointment: 2013
Assistant Treasurer
Mr. Maher serves as Assistant Treasurer of other funds. Mr. Maher is Vice President of Valuation Oversight, serves as Assistant Treasurer of FMR Capital, Inc. (2017-present), and is an employee of Fidelity Investments. Previously, Mr. Maher served as Vice President of Asset Management Compliance (2013), Vice President of the Program Management Group of FMR (investment adviser firm, 2010-2013), and Vice President of Valuation Oversight (2008-2010).
Rieco E. Mello (1969)
Year of Election or Appointment: 2017
Assistant Treasurer
Mr. Mello also serves as Assistant Treasurer of other funds. Mr. Mello serves as Assistant Treasurer of FMR Capital, Inc. (2017-present) and is an employee of Fidelity Investments (1995-present).
Kenneth B. Robins (1969)
Year of Election or Appointment: 2016
Chief Compliance Officer
Mr. Robins also serves as an officer of other funds. Mr. Robins serves as Compliance Officer of Fidelity Management & Research Company and FMR Co., Inc. (investment adviser firms, 2016-present) and is an employee of Fidelity Investments (2004-present). Previously, Mr. Robins served as Executive Vice President of Fidelity Investments Money Management, Inc. (investment adviser firm, 2013-2016) and served in other fund officer roles.
Stacie M. Smith (1974)
Year of Election or Appointment: 2016
President and Treasurer
Ms. Smith also serves as an officer of other funds. Ms. Smith serves as Assistant Treasurer of FMR Capital, Inc. (2017-present), is an employee of Fidelity Investments (2009-present), and has served in other fund officer roles. Prior to joining Fidelity Investments, Ms. Smith served as Senior Audit Manager of Ernst & Young LLP (accounting firm, 1996-2009). Previously, Ms. Smith served as Assistant Treasurer (2013-2018) and Deputy Treasurer (2013-2016) of certain Fidelity® funds.
Marc L. Spector (1972)
Year of Election or Appointment: 2016
Assistant Treasurer
Mr. Spector also serves as an officer of other funds. Mr. Spector serves as Assistant Treasurer of FMR Capital, Inc. (2017-present) and is an employee of Fidelity Investments (2016-present). Prior to joining Fidelity Investments, Mr. Spector served as Director at the Siegfried Group (accounting firm, 2013-2016), and prior to Siegfried Group as audit senior manager at Deloitte & Touche (accounting firm, 2005-2013).
Shareholder Expense Example
As a shareholder of the Fund, you incur two types of costs: (1) transaction costs, including sales charges (loads) on purchase payments or redemption proceeds, and (2) ongoing costs, including management fees, distribution and/or service (12b-1) fees and other Fund expenses. This Example is intended to help you understand your ongoing costs (in dollars) of investing in the Fund and to compare these costs with the ongoing costs of investing in other mutual funds.
The actual expense Example is based on an investment of $1,000 invested at the beginning of the period and held for the entire period (May 1, 2018 to October 31, 2018) for each Class, except Class Z, and for the period (October 2, 2018 to October 31, 2018) for Class Z. The hypothetical expense Example is based on an investment of $1,000 invested for the one-half year period (May 1, 2018 to October 31, 2018).
Actual Expenses
The first line of the accompanying table for each class of the Fund provides information about actual account values and actual expenses. You may use the information in this line, together with the amount you invested, to estimate the expenses that you paid over the period. Simply divide your account value by $1,000.00 (for example, an $8,600 account value divided by $1,000.00 = 8.6), then multiply the result by the number in the first line for a class of the Fund under the heading entitled "Expenses Paid During Period" to estimate the expenses you paid on your account during this period. A small balance maintenance fee of $12.00 that is charged once a year may apply for certain accounts with a value of less than $2,000. This fee, which was eliminated effective August 1, 2018, is not included in the table below. If it was, the estimate of expenses you paid during the period would be higher, and your ending account value lower, by this amount. In addition, the Fund, as a shareholder in the underlying Fidelity Central Funds, will indirectly bear its pro-rata share of the fees and expenses incurred by the underlying Fidelity Central Funds. These fees and expenses are not included in the Fund's annualized expense ratio used to calculate the expense estimate in the table below.
Hypothetical Example for Comparison Purposes
The second line of the accompanying table for each class of the Fund provides information about hypothetical account values and hypothetical expenses based on a Class' actual expense ratio and an assumed rate of return of 5% per year before expenses, which is not the Class' actual return. The hypothetical account values and expenses may not be used to estimate the actual ending account balance or expenses you paid for the period. You may use this information to compare the ongoing costs of investing in the Fund and other funds. To do so, compare this 5% hypothetical example with the 5% hypothetical examples that appear in the shareholder reports of the other funds. A small balance maintenance fee of $12.00 that is charged once a year may apply for certain accounts with a value of less than $2,000. This fee, which was eliminated effective August 1, 2018, is not included in the table below. If it was, the estimate of expenses you paid during the period would be higher, and your ending account value lower, by this amount. In addition, the Fund, as a shareholder in the underlying Fidelity Central Funds, will indirectly bear its pro-rata share of the fees and expenses incurred by the underlying Fidelity Central Funds. These fees and expenses are not included in the Fund's annualized expense ratio used to calculate the expense estimate in the table below.
Please note that the expenses shown in the table are meant to highlight your ongoing costs only and do not reflect any transaction costs. Therefore, the second line of the table is useful in comparing ongoing costs only, and will not help you determine the relative total costs of owning different funds. In addition, if these transactional costs were included, your costs would have been higher.
| Annualized Expense Ratio-A | Beginning Account Value | Ending Account Value October 31, 2018 | Expenses Paid During Period | |
| Class A | 1.35% | |||
| Actual | $1,000.00 | $902.40 | $6.47-B | |
| Hypothetical-C | $1,000.00 | $1,018.40 | $6.87-D | |
| Class M | 1.69% | |||
| Actual | $1,000.00 | $900.40 | $8.10-B | |
| Hypothetical-C | $1,000.00 | $1,016.69 | $8.59-D | |
| Class C | 2.06% | |||
| Actual | $1,000.00 | $899.50 | $9.86-B | |
| Hypothetical-C | $1,000.00 | $1,014.82 | $10.46-D | |
| Japan | 1.07% | |||
| Actual | $1,000.00 | $903.30 | $5.13-B | |
| Hypothetical-C | $1,000.00 | $1,019.81 | $5.45-D | |
| Class I | 1.00% | |||
| Actual | $1,000.00 | $903.80 | $4.80-B | |
| Hypothetical-C | $1,000.00 | $1,020.16 | $5.09-D | |
| Class Z | .96% | |||
| Actual | $1,000.00 | $899.80 | $.75-E | |
| Hypothetical-C | $1,000.00 | $1,020.37 | $4.89-D |
A Annualized expense ratio reflects expenses net of applicable fee waivers.
B Actual expenses are equal to each Class' annualized expense ratio, multiplied by the average account value over the period, multiplied by 184/365 (to reflect the one-half year period).
C 5% return per year before expenses
D Hypothetical expenses are equal to each Class' annualized expense ratio, multiplied by the average account value over the period, multiplied by 184/365 (to reflect the one-half year period).
E Actual expenses are equal to the Class' annualized expense ratio, multiplied by the average account value over the period, multiplied by 30/365 (to reflect the period October 2, 2018 to October 31, 2018).
Distributions (Unaudited)
Class A, Class M, Class C, Japan and Class I designate 100% of the dividend distributed during the fiscal year as amounts which may be taken into account as a dividend for purposes of the maximum rate under section 1(h)(11) of the Internal Revenue Code.
The amounts per share which represent income derived from sources within, and taxes paid to, foreign countries or possessions of the United States are as follows:
| Pay Date | Income | Taxes | |
| Fidelity Japan Fund | |||
| Class A | 12/11/17 | $0.140 | $0.027 |
| Class M | 12/11/17 | $0.109 | $0.027 |
| Class C | 12/11/17 | $0.065 | $0.027 |
| Japan | 12/11/17 | $0.169 | $0.027 |
| Class I | 12/11/17 | $0.197 | $0.027 |
The fund will notify shareholders in January 2019 of amounts for use in preparing 2018 income tax returns.
Board Approval of Investment Advisory Contracts
Fidelity Japan Fund
At its July 2018 meeting, the Board of Trustees, including the Independent Trustees (together, the Board), voted to continue the management contract with Fidelity Management & Research Company (FMR) and the sub-advisory agreements (together, the Advisory Contracts) for the fund for six months through January 31, 2019, in connection with the reunification of the Fidelity Equity High Income Funds Board, which oversees the fund, and the Sector Portfolios Board.
The Board considered that the approval of the fund's Advisory Contracts will not result in any changes in (i) the investment process or strategies employed in the management of the fund's assets; (ii) the fees and expenses paid by shareholders; (iii) the nature, extent or quality of services provided under the fund's Advisory Contracts; or (iv) the day-to-day management of the fund or the persons primarily responsible for such management. The Board concluded that the fund's Advisory Contracts are fair and reasonable, and that the fund's Advisory Contracts should be renewed, without modification, through January 31, 2019, with the understanding that the Board will consider the annual renewal for a full one year period in January 2019.
In connection with its consideration of future renewals of the fund's Advisory Contracts, the Board will consider: (i) the nature, extent and quality of services provided to the fund, including shareholder and administrative services and investment performance; (ii) the competitiveness of the management fee and total expenses for the fund; (iii) the costs of the services and profitability, including the revenues earned and the expenses incurred in conducting the business of developing, marketing, distributing, managing, administering, and servicing the fund and its shareholders, to the extent applicable, as well as potential fall-out benefits from Fidelity's non-fund businesses; and (iv) whether there have been economies of scale in respect of the Fidelity funds, whether the Fidelity funds (including the fund) have appropriately benefited from any such economies of scale, and whether there is the potential for realization of any further economies.
Based on its evaluation of all of the conclusions noted above, and after considering all factors it believed relevant, the Board ultimately concluded that the fund's management fee structure is fair and reasonable, and that the continuation of the fund's Advisory Contracts should be approved.
![]()
AJPNA-ANN-1218
1.917389.107
Fidelity Advisor® Latin America Fund - Class A, Class M, Class C, Class I and Class Z Annual Report October 31, 2018 Class A, Class M, Class C, Class I and Class Z are classes of Fidelity® Latin America Fund |
|
Contents
To view a fund's proxy voting guidelines and proxy voting record for the 12-month period ended June 30, visit http://www.fidelity.com/proxyvotingresults or visit the Securities and Exchange Commission's (SEC) web site at http://www.sec.gov.
You may also call 1-877-208-0098 to request a free copy of the proxy voting guidelines.
Standard & Poor's, S&P and S&P 500 are registered service marks of The McGraw-Hill Companies, Inc. and have been licensed for use by Fidelity Distributors Corporation.
Other third-party marks appearing herein are the property of their respective owners.
All other marks appearing herein are registered or unregistered trademarks or service marks of FMR LLC or an affiliated company. © 2018 FMR LLC. All rights reserved.
This report and the financial statements contained herein are submitted for the general information of the shareholders of the Fund. This report is not authorized for distribution to prospective investors in the Fund unless preceded or accompanied by an effective prospectus.
A fund files its complete schedule of portfolio holdings with the SEC for the first and third quarters of each fiscal year on Form N-Q. Forms N-Q are available on the SEC’s web site at http://www.sec.gov. A fund's Forms N-Q may be reviewed and copied at the SEC’s Public Reference Room in Washington, DC. Information regarding the operation of the SEC's Public Reference Room may be obtained by calling 1-800-SEC-0330.
For a complete list of a fund's portfolio holdings, view the most recent holdings listing, semiannual report, or annual report on Fidelity's web site at http://www.fidelity.com, http://www.institutional.fidelity.com, or http://www.401k.com, as applicable.
NOT FDIC INSURED •MAY LOSE VALUE •NO BANK GUARANTEE
Neither the Fund nor Fidelity Distributors Corporation is a bank.
Performance: The Bottom Line
Average annual total return reflects the change in the value of an investment, assuming reinvestment of distributions from dividend income and capital gains (the profits earned upon the sale of securities that have grown in value, if any) and assuming a constant rate of performance each year. The hypothetical investment and the average annual total returns do not reflect the deduction of taxes that a shareholder would pay on fund distributions or the redemption of fund shares. During periods of reimbursement by Fidelity, a fund’s total return will be greater than it would be had the reimbursement not occurred. How a fund did yesterday is no guarantee of how it will do tomorrow.
Average Annual Total Returns
| For the periods ended October 31, 2018 | Past 1 year | Past 5 years | Past 10 years |
| Class A (incl. 5.75% sales charge) | (15.91)% | (6.43)% | 1.84% |
| Class M (incl. 3.50% sales charge) | (14.15)% | (6.25)% | 1.85% |
| Class C (incl. contingent deferred sales charge) | (12.31)% | (6.02)% | 1.83% |
| Class I | (10.44)% | (4.98)% | 2.73% |
| Class Z | (10.44)% | (4.98)% | 2.73% |
Class A shares bear a 0.25% 12b-1 fee. The initial offering of Class A shares took place on September 28, 2010. Returns prior to September 28, 2010, are those of Fidelity® Latin America Fund, the original class of the fund, which has no 12b-1 fee. Had Class A's 12b-1 fee been reflected, returns prior to September 28, 2010, would have been lower.
Class M shares bear a 0.50% 12b-1 fee. The initial offering of Class M shares took place on September 28, 2010. Returns prior to September 28, 2010, are those of Fidelity® Latin America Fund, the original class of the fund, which has no 12b-1 fee. Had Class M's 12b-1 fee been reflected, returns prior to September 28, 2010, would have been lower.
Class C shares bear a 1.00% 12b-1 fee. The initial offering of Class C shares took place on September 28, 2010. Returns prior to September 28, 2010, are those of Fidelity® Latin America Fund, the original class of the fund, which has no 12b-1 fee. Had Class C's 12b-1 fee been reflected, returns prior to September 28, 2010, would have been lower.
Class C shares' contingent deferred sales charges included in the past one year, past five years and past ten years total return figures are 1%, 0% and 0%, respectively.
The initial offering of Class I shares took place on September 28, 2010. Returns prior to September 28, 2010 are those of Fidelity® Latin America Fund, the original class of the fund.
The initial offering of Class Z shares took place on October 2, 2018. Returns prior to October 2, 2018, are those of Class I. Returns between September 28, 2010 and October 2, 2018, are those of Class I. Returns prior to September 28, 2010 are those of Fidelity Latin America Fund, the original class of the fund.
$10,000 Over 10 Years
Let's say hypothetically that $10,000 was invested in Fidelity Advisor® Latin America Fund - Class A on October 31, 2008, and the current 5.75% sales charge was paid.
The chart shows how the value of your investment would have changed, and also shows how the MSCI EM (Emerging Markets) Latin America Index performed over the same period.
See above for additional information regarding the performance of Class A.
| Period Ending Values | ||
| $11,998 | Fidelity Advisor® Latin America Fund - Class A | |
| $16,479 | MSCI EM (Emerging Markets) Latin America Index | |
Management's Discussion of Fund Performance
Market Recap: International equities returned -8.08% for the 12 months ending October 31, 2018, according to the MSCI ACWI (All Country World Index) ex USA Index. A modestly positive first half of the period gave way to a confluence of overwhelmingly negative factors – including escalating trade tensions, a surging U.S. dollar, tepid economic growth in Europe, global central bank tightening, concerns about Italy’s budget stalemate with the EU, and weakness in China’s stock market. The index lost 8% in October alone, its largest monthly drop in more than six years. Among sectors, communications services (-15%) was hit the hardest, while economically sensitive consumer discretionary (-13%), information technology (-12%), financials (-10%), industrials (-9%) and materials (-7%) stocks also fared poorly. Even the more defensive real estate (-9%), utilities (-6%) and consumer staples (-5%) sectors weren’t spared this period. Conversely, elevated crude-oil prices fueled a positive return for energy (+7%), the top-performing sector, followed by the relatively stable-growing health care segment (+2%). Regionally, emerging markets (-12%) fared the worst, hampered by the impact of foreign exchange and concerns about economic weakness in China, India and South Korea. Sluggish growth also pressured shares in continental Europe (-9%). Stocks in Japan (-3%) and the U.K. (-4%) held up better, followed by Canada (-5%) and Asia-Pacific ex Japan (-6%).Comments from Portfolio Manager Will Pruett: For the fiscal year, the fund’s share classes (excluding sales charges, if applicable) returned roughly -10% to -11%, trailing the -2.24% result of the benchmark MSCI Emerging Markets Latin America Index. Versus the benchmark, stock picks in Brazil, which faced economic- and election-related strife, detracted the most by far, while investment choices in Mexico hurt to a lesser extent. Several unfavorable non-benchmark positions in Panama and Argentina also meaningfully weighed on the fund's relative return. Also, an overall bias for holding domestically oriented positions did not work well, nor did picks in the financials and communications services sectors. Lower-than-benchmark exposure to strong-performing energy and materials companies, and overweightings in poor-performing consumer discretionary and health care stocks, further detracted. Underweighting Brazil-based iron and nickel producer Vale hurt the most, as the company's stock rallied about 64% for the period, largely due to rising iron-ore prices. Elsewhere in Brazil, untimely ownership and an overweighted stake in health-care insurance broker Qualicorp dampened the fund's relative return, as did a non-benchmark stake in travel-loyalty company Smiles Fidelidade, which announced plans for a reorganization late in the period. Conversely, non-benchmark holdings in the U.S. added some value, as did underweightings in Chile and Mexico.The views expressed above reflect those of the portfolio manager(s) only through the end of the period as stated on the cover of this report and do not necessarily represent the views of Fidelity or any other person in the Fidelity organization. Any such views are subject to change at any time based upon market or other conditions and Fidelity disclaims any responsibility to update such views. These views may not be relied on as investment advice and, because investment decisions for a Fidelity fund are based on numerous factors, may not be relied on as an indication of trading intent on behalf of any Fidelity fund.
Investment Summary (Unaudited)
Geographic Diversification (% of fund's net assets)
| As of October 31, 2018 | ||
| Brazil | 68.7% | |
| Mexico | 17.0% | |
| Panama | 4.4% | |
| Bermuda | 3.9% | |
| Israel | 2.2% | |
| United States of America* | 1.7% | |
| Spain | 1.2% | |
| Argentina | 0.9% | |

* Includes Short-Term investments and Net Other Assets (Liabilities).
Percentages are based on country or territory of incorporation and are adjusted for the effect of futures contracts, if applicable.
Asset Allocation as of October 31, 2018
| % of fund's net assets | |
| Stocks | 99.9 |
| Short-Term Investments and Net Other Assets (Liabilities) | 0.1 |
Top Ten Stocks as of October 31, 2018
| % of fund's net assets | |
| Itausa-Investimentos Itau SA (PN) (Brazil, Banks) | 12.4 |
| Petroleo Brasileiro SA - Petrobras (PN) (non-vtg.) (Brazil, Oil, Gas & Consumable Fuels) | 10.3 |
| Itau Unibanco Holding SA (Brazil, Banks) | 5.5 |
| Suzano Papel e Celulose SA (Brazil, Paper & Forest Products) | 5.3 |
| Azul SA sponsored ADR (Brazil, Airlines) | 4.8 |
| Credicorp Ltd. (United States) (Bermuda, Banks) | 3.9 |
| Hapvida Participacoes e Investimentos SA (Brazil, Insurance) | 3.9 |
| Credito Real S.A.B. de CV (Mexico, Consumer Finance) | 3.5 |
| Qualicorp SA (Brazil, Health Care Providers & Services) | 2.9 |
| Notre Dame Intermedica Participacoes SA (Brazil, Health Care Providers & Services) | 2.9 |
| 55.4 |
Top Market Sectors as of October 31, 2018
| % of fund's net assets | |
| Financials | 40.4 |
| Industrials | 15.0 |
| Consumer Discretionary | 14.0 |
| Energy | 10.3 |
| Health Care | 10.2 |
| Materials | 7.8 |
| Information Technology | 2.2 |
Market Sectors may include more than one industry category.
The Fund may invest up to 35% of its total assets in any industry that represents more than 20% of the Latin American market. As of October 31, 2018, 26.5% of the Fund’s total assets were invested in the Diversified Banks industry, which accounts for more than 20% of the Latin American market.
Schedule of Investments October 31, 2018
Showing Percentage of Net Assets
| Common Stocks - 70.1% | |||
| Shares | Value | ||
| Argentina - 0.9% | |||
| Bolsas y Mercados Argentinos SA | 444,352 | $4,158,838 | |
| Bermuda - 3.9% | |||
| Credicorp Ltd. (United States) | 82,670 | 18,659,446 | |
| Brazil - 38.9% | |||
| Azul SA sponsored ADR (a)(b) | 927,162 | 22,604,210 | |
| B2W Companhia Global do Varejo (a) | 1,313,749 | 12,179,052 | |
| BTG Pactual Participations Ltd. unit | 1,576,808 | 8,376,594 | |
| Companhia de Locacao das Americas | 674,793 | 5,568,425 | |
| CVC Brasil Operadora e Agencia de Viagens SA | 710,011 | 10,798,501 | |
| Estacio Participacoes SA | 2,103,889 | 13,076,166 | |
| Hapvida Participacoes e Investimentos SA | 2,695,256 | 18,453,614 | |
| Hypermarcas SA | 1,315,510 | 10,526,908 | |
| Notre Dame Intermedica Participacoes SA | 2,147,781 | 13,926,093 | |
| Qualicorp SA | 3,615,771 | 13,990,891 | |
| Rumo SA (a) | 3,038,024 | 13,592,127 | |
| Ser Educacional SA (c) | 2,274,861 | 9,529,782 | |
| Suzano Papel e Celulose SA | 2,454,042 | 24,959,153 | |
| Vale SA | 423,821 | 6,458,387 | |
| TOTAL BRAZIL | 184,039,903 | ||
| Israel - 2.2% | |||
| Ituran Location & Control Ltd. | 300,444 | 10,251,149 | |
| Mexico - 17.0% | |||
| Banco del Bajio SA (c) | 6,689,681 | 13,149,986 | |
| Credito Real S.A.B. de CV | 14,635,664 | 16,744,383 | |
| Genomma Lab Internacional SA de CV (a)(b) | 16,211,884 | 10,415,127 | |
| Grupo Aeroportuario Norte S.A.B. de CV | 1,000,198 | 5,233,581 | |
| Grupo Cementos de Chihuahua S.A.B. de CV (b) | 987,185 | 5,320,032 | |
| Promotora y Operadora de Infraestructura S.A.B. de CV | 1,748,760 | 12,009,502 | |
| Qualitas Controladora S.A.B. de CV | 4,349,535 | 8,764,056 | |
| Unifin Financiera SAPI de CV | 4,624,853 | 8,740,507 | |
| TOTAL MEXICO | 80,377,174 | ||
| Panama - 4.4% | |||
| Copa Holdings SA Class A | 160,960 | 11,658,333 | |
| Intergroup Financial Services Corp. | 248,403 | 9,265,432 | |
| TOTAL PANAMA | 20,923,765 | ||
| Spain - 1.2% | |||
| Prosegur Cash SA (c) | 2,774,079 | 5,498,606 | |
| United States of America - 1.6% | |||
| First Cash Financial Services, Inc. | 95,495 | 7,677,798 | |
| TOTAL COMMON STOCKS | |||
| (Cost $316,323,805) | 331,586,679 | ||
| Nonconvertible Preferred Stocks - 29.8% | |||
| Brazil - 29.8% | |||
| Alpargatas SA (PN) | 1,841,507 | 7,516,456 | |
| Itau Unibanco Holding SA | 1,966,297 | 26,021,800 | |
| Itausa-Investimentos Itau SA (PN) | 19,422,987 | 58,663,006 | |
| Petroleo Brasileiro SA - Petrobras (PN) (non-vtg.) | 6,591,313 | 48,919,002 | |
| TOTAL BRAZIL | 141,120,264 | ||
| TOTAL NONCONVERTIBLE PREFERRED STOCKS | |||
| (Cost $84,966,501) | 141,120,264 | ||
| Money Market Funds - 2.3% | |||
| Fidelity Cash Central Fund, 2.23% (d) | 852,025 | 852,195 | |
| Fidelity Securities Lending Cash Central Fund 2.23% (d)(e) | 10,121,018 | 10,122,030 | |
| TOTAL MONEY MARKET FUNDS | |||
| (Cost $10,974,225) | 10,974,225 | ||
| TOTAL INVESTMENT IN SECURITIES - 102.2% | |||
| (Cost $412,264,531) | 483,681,168 | ||
| NET OTHER ASSETS (LIABILITIES) - (2.2)% | (10,391,913) | ||
| NET ASSETS - 100% | $473,289,255 |
Categorizations in the Schedule of Investments are based on country or territory of incorporation.
Legend
(a) Non-income producing
(b) Security or a portion of the security is on loan at period end.
(c) Security exempt from registration under Rule 144A of the Securities Act of 1933. These securities may be resold in transactions exempt from registration, normally to qualified institutional buyers. At the end of the period, the value of these securities amounted to $28,178,374 or 6.0% of net assets.
(d) Affiliated fund that is generally available only to investment companies and other accounts managed by Fidelity Investments. The rate quoted is the annualized seven-day yield of the fund at period end. A complete unaudited listing of the fund's holdings as of its most recent quarter end is available upon request. In addition, each Fidelity Central Fund's financial statements, which are not covered by the Fund's Report of Independent Registered Public Accounting Firm, are available on the SEC's website or upon request.
(e) Investment made with cash collateral received from securities on loan.
Affiliated Central Funds
Information regarding fiscal year to date income earned by the Fund from investments in Fidelity Central Funds is as follows:
| Fund | Income earned |
| Fidelity Cash Central Fund | $88,819 |
| Fidelity Securities Lending Cash Central Fund | 1,232 |
| Total | $90,051 |
Amounts in the income column in the above table include any capital gain distributions from underlying funds, which are presented in the corresponding line-item in the Statement of Operations if applicable.
Investment Valuation
All investments are categorized as Level 1 under the Fair Value Hierarchy. The inputs or methodology used for valuing securities may not be an indication of the risk associated with investing in those securities. For more information on valuation inputs please refer to the Investment Valuation section in the accompanying Notes to Financial Statements.
See accompanying notes which are an integral part of the financial statements.
Financial Statements
Statement of Assets and Liabilities
| October 31, 2018 | ||
| Assets | ||
| Investment in securities, at value (including securities loaned of $9,499,579) — See accompanying schedule: Unaffiliated issuers (cost $401,290,306) | $472,706,943 | |
| Fidelity Central Funds (cost $10,974,225) | 10,974,225 | |
| Total Investment in Securities (cost $412,264,531) | $483,681,168 | |
| Receivable for investments sold | 992,357 | |
| Receivable for fund shares sold | 860,685 | |
| Dividends receivable | 167,348 | |
| Distributions receivable from Fidelity Central Funds | 7,381 | |
| Prepaid expenses | 915 | |
| Other receivables | 48,355 | |
| Total assets | 485,758,209 | |
| Liabilities | ||
| Payable for investments purchased | $1,073,832 | |
| Payable for fund shares redeemed | 706,262 | |
| Accrued management fee | 270,473 | |
| Distribution and service plan fees payable | 8,067 | |
| Other affiliated payables | 120,841 | |
| Other payables and accrued expenses | 167,449 | |
| Collateral on securities loaned | 10,122,030 | |
| Total liabilities | 12,468,954 | |
| Net Assets | $473,289,255 | |
| Net Assets consist of: | ||
| Paid in capital | $495,760,026 | |
| Total distributable earnings (loss) | (22,470,771) | |
| Net Assets | $473,289,255 | |
| Net Asset Value and Maximum Offering Price | ||
| Class A: | ||
| Net Asset Value and redemption price per share ($14,157,164 ÷ 644,103 shares) | $21.98 | |
| Maximum offering price per share (100/94.25 of $21.98) | $23.32 | |
| Class M: | ||
| Net Asset Value and redemption price per share ($5,098,032 ÷ 231,723 shares) | $22.00 | |
| Maximum offering price per share (100/96.50 of $22.00) | $22.80 | |
| Class C: | ||
| Net Asset Value and offering price per share ($3,497,618 ÷ 157,861 shares)(a) | $22.16 | |
| Latin America: | ||
| Net Asset Value, offering price and redemption price per share ($445,845,228 ÷ 20,318,549 shares) | $21.94 | |
| Class I: | ||
| Net Asset Value, offering price and redemption price per share ($4,546,239 ÷ 207,412 shares) | $21.92 | |
| Class Z: | ||
| Net Asset Value, offering price and redemption price per share ($144,974 ÷ 6,615 shares) | $21.92 |
(a) Redemption price per share is equal to net asset value less any applicable contingent deferred sales charge.
See accompanying notes which are an integral part of the financial statements.
Statement of Operations
| Year ended October 31, 2018 | ||
| Investment Income | ||
| Dividends | $20,572,851 | |
| Income from Fidelity Central Funds | 90,051 | |
| Income before foreign taxes withheld | 20,662,902 | |
| Less foreign taxes withheld | (1,220,078) | |
| Total income | 19,442,824 | |
| Expenses | ||
| Management fee | $3,913,310 | |
| Transfer agent fees | 1,384,464 | |
| Distribution and service plan fees | 117,536 | |
| Accounting and security lending fees | 285,892 | |
| Custodian fees and expenses | 327,757 | |
| Independent trustees' fees and expenses | 2,875 | |
| Registration fees | 81,696 | |
| Audit | 77,354 | |
| Legal | 3,058 | |
| Miscellaneous | 4,226 | |
| Total expenses before reductions | 6,198,168 | |
| Expense reductions | (137,523) | |
| Total expenses after reductions | 6,060,645 | |
| Net investment income (loss) | 13,382,179 | |
| Realized and Unrealized Gain (Loss) | ||
| Net realized gain (loss) on: | ||
| Investment securities: | ||
| Unaffiliated issuers | 40,228,875 | |
| Fidelity Central Funds | 300 | |
| Foreign currency transactions | (169,717) | |
| Total net realized gain (loss) | 40,059,458 | |
| Change in net unrealized appreciation (depreciation) on: | ||
| Investment securities: | ||
| Unaffiliated issuers | (118,079,357) | |
| Assets and liabilities in foreign currencies | (4,496) | |
| Total change in net unrealized appreciation (depreciation) | (118,083,853) | |
| Net gain (loss) | (78,024,395) | |
| Net increase (decrease) in net assets resulting from operations | $(64,642,216) |
See accompanying notes which are an integral part of the financial statements.
Statement of Changes in Net Assets
| Year ended October 31, 2018 | Year ended October 31, 2017 | |
| Increase (Decrease) in Net Assets | ||
| Operations | ||
| Net investment income (loss) | $13,382,179 | $12,761,653 |
| Net realized gain (loss) | 40,059,458 | 32,325,555 |
| Change in net unrealized appreciation (depreciation) | (118,083,853) | 24,718,281 |
| Net increase (decrease) in net assets resulting from operations | (64,642,216) | 69,805,489 |
| Distributions to shareholders | (9,005,746) | – |
| Distributions to shareholders from net investment income | – | (12,697,307) |
| Total distributions | (9,005,746) | (12,697,307) |
| Share transactions - net increase (decrease) | (88,546,151) | (55,405,622) |
| Redemption fees | 87,345 | 272,096 |
| Total increase (decrease) in net assets | (162,106,768) | 1,974,656 |
| Net Assets | ||
| Beginning of period | 635,396,023 | 633,421,367 |
| End of period | $473,289,255 | $635,396,023 |
| Other Information | ||
| Undistributed net investment income end of period | $6,370,322 |
See accompanying notes which are an integral part of the financial statements.
Financial Highlights
Fidelity Latin America Fund Class A
| Years ended October 31, | 2018 | 2017 | 2016 | 2015 | 2014 |
| Selected Per–Share Data | |||||
| Net asset value, beginning of period | $24.93 | $22.45 | $18.09 | $30.31 | $40.71 |
| Income from Investment Operations | |||||
| Net investment income (loss)A | .50 | .42 | .40 | .28 | .49 |
| Net realized and unrealized gain (loss) | (3.16) | 2.48 | 4.27 | (10.11) | (4.08) |
| Total from investment operations | (2.66) | 2.90 | 4.67 | (9.83) | (3.59) |
| Distributions from net investment income | (.29) | (.43) | (.31) | (.31) | (.57) |
| Distributions from net realized gain | – | – | – | (2.08) | (6.25) |
| Total distributions | (.29) | (.43) | (.31) | (2.39) | (6.82) |
| Redemption fees added to paid in capitalA | –B | .01 | –B | –B | .01 |
| Net asset value, end of period | $21.98 | $24.93 | $22.45 | $18.09 | $30.31 |
| Total ReturnC,D | (10.78)% | 13.55% | 26.29% | (34.60)% | (9.06)% |
| Ratios to Average Net AssetsE,F | |||||
| Expenses before reductions | 1.38% | 1.39% | 1.40% | 1.40% | 1.38% |
| Expenses net of fee waivers, if any | 1.38% | 1.39% | 1.40% | 1.40% | 1.38% |
| Expenses net of all reductions | 1.36% | 1.38% | 1.39% | 1.39% | 1.38% |
| Net investment income (loss) | 2.08% | 1.90% | 2.14% | 1.26% | 1.52% |
| Supplemental Data | |||||
| Net assets, end of period (000 omitted) | $14,157 | $17,801 | $19,115 | $16,424 | $34,898 |
| Portfolio turnover rateG | 53% | 51% | 108% | 30% | 30% |
A Calculated based on average shares outstanding during the period.
B Amount represents less than $.005 per share.
C Total returns would have been lower if certain expenses had not been reduced during the applicable periods shown.
D Total returns do not include the effect of the sales charges.
E Fees and expenses of any underlying Fidelity Central Funds are not included in the Fund's expense ratio. The Fund indirectly bears its proportionate share of the expenses of any underlying Fidelity Central Funds.
F Expense ratios reflect operating expenses of the class. Expenses before reductions do not reflect amounts reimbursed by the investment adviser or reductions from brokerage service arrangements or reductions from other expense offset arrangements and do not represent the amount paid by the class during periods when reimbursements or reductions occur. Expenses net of fee waivers reflect expenses after reimbursement by the investment adviser but prior to reductions from brokerage service arrangements or other expense offset arrangements. Expenses net of all reductions represent the net expenses paid by the class.
G Amount does not include the portfolio activity of any underlying Fidelity Central Funds.
See accompanying notes which are an integral part of the financial statements.
Fidelity Latin America Fund Class M
| Years ended October 31, | 2018 | 2017 | 2016 | 2015 | 2014 |
| Selected Per–Share Data | |||||
| Net asset value, beginning of period | $24.96 | $22.47 | $18.11 | $30.33 | $40.68 |
| Income from Investment Operations | |||||
| Net investment income (loss)A | .43 | .36 | .35 | .22 | .40 |
| Net realized and unrealized gain (loss) | (3.16) | 2.49 | 4.27 | (10.13) | (4.08) |
| Total from investment operations | (2.73) | 2.85 | 4.62 | (9.91) | (3.68) |
| Distributions from net investment income | (.23) | (.37) | (.26) | (.23) | (.43) |
| Distributions from net realized gain | – | – | – | (2.08) | (6.25) |
| Total distributions | (.23) | (.37) | (.26) | (2.31) | (6.68) |
| Redemption fees added to paid in capitalA | –B | .01 | –B | –B | .01 |
| Net asset value, end of period | $22.00 | $24.96 | $22.47 | $18.11 | $30.33 |
| Total ReturnC,D | (11.04)% | 13.24% | 25.93% | (34.78)% | (9.30)% |
| Ratios to Average Net AssetsE,F | |||||
| Expenses before reductions | 1.66% | 1.66% | 1.68% | 1.67% | 1.65% |
| Expenses net of fee waivers, if any | 1.66% | 1.66% | 1.68% | 1.67% | 1.65% |
| Expenses net of all reductions | 1.63% | 1.66% | 1.68% | 1.66% | 1.65% |
| Net investment income (loss) | 1.80% | 1.62% | 1.86% | .99% | 1.25% |
| Supplemental Data | |||||
| Net assets, end of period (000 omitted) | $5,098 | $6,740 | $7,378 | $5,284 | $9,761 |
| Portfolio turnover rateG | 53% | 51% | 108% | 30% | 30% |
A Calculated based on average shares outstanding during the period.
B Amount represents less than $.005 per share.
C Total returns would have been lower if certain expenses had not been reduced during the applicable periods shown.
D Total returns do not include the effect of the sales charges.
E Fees and expenses of any underlying Fidelity Central Funds are not included in the Fund's expense ratio. The Fund indirectly bears its proportionate share of the expenses of any underlying Fidelity Central Funds.
F Expense ratios reflect operating expenses of the class. Expenses before reductions do not reflect amounts reimbursed by the investment adviser or reductions from brokerage service arrangements or reductions from other expense offset arrangements and do not represent the amount paid by the class during periods when reimbursements or reductions occur. Expenses net of fee waivers reflect expenses after reimbursement by the investment adviser but prior to reductions from brokerage service arrangements or other expense offset arrangements. Expenses net of all reductions represent the net expenses paid by the class.
G Amount does not include the portfolio activity of any underlying Fidelity Central Funds.
See accompanying notes which are an integral part of the financial statements.
Fidelity Latin America Fund Class C
| Years ended October 31, | 2018 | 2017 | 2016 | 2015 | 2014 |
| Selected Per–Share Data | |||||
| Net asset value, beginning of period | $25.12 | $22.61 | $18.18 | $30.37 | $40.59 |
| Income from Investment Operations | |||||
| Net investment income (loss)A | .32 | .26 | .26 | .11 | .25 |
| Net realized and unrealized gain (loss) | (3.18) | 2.52 | 4.30 | (10.17) | (4.07) |
| Total from investment operations | (2.86) | 2.78 | 4.56 | (10.06) | (3.82) |
| Distributions from net investment income | (.10) | (.28) | (.13) | (.05) | (.16) |
| Distributions from net realized gain | – | – | – | (2.08) | (6.25) |
| Total distributions | (.10) | (.28) | (.13) | (2.13) | (6.41) |
| Redemption fees added to paid in capitalA | –B | .01 | –B | –B | .01 |
| Net asset value, end of period | $22.16 | $25.12 | $22.61 | $18.18 | $30.37 |
| Total ReturnC,D | (11.43)% | 12.71% | 25.31% | (35.08)% | (9.74)% |
| Ratios to Average Net AssetsE,F | |||||
| Expenses before reductions | 2.13% | 2.14% | 2.15% | 2.15% | 2.13% |
| Expenses net of fee waivers, if any | 2.13% | 2.14% | 2.14% | 2.15% | 2.13% |
| Expenses net of all reductions | 2.11% | 2.14% | 2.14% | 2.15% | 2.13% |
| Net investment income (loss) | 1.33% | 1.15% | 1.39% | .51% | .77% |
| Supplemental Data | |||||
| Net assets, end of period (000 omitted) | $3,498 | $5,094 | $6,590 | $5,394 | $11,349 |
| Portfolio turnover rateG | 53% | 51% | 108% | 30% | 30% |
A Calculated based on average shares outstanding during the period.
B Amount represents less than $.005 per share.
C Total returns would have been lower if certain expenses had not been reduced during the applicable periods shown.
D Total returns do not include the effect of the contingent deferred sales charge.
E Fees and expenses of any underlying Fidelity Central Funds are not included in the Fund's expense ratio. The Fund indirectly bears its proportionate share of the expenses of any underlying Fidelity Central Funds.
F Expense ratios reflect operating expenses of the class. Expenses before reductions do not reflect amounts reimbursed by the investment adviser or reductions from brokerage service arrangements or reductions from other expense offset arrangements and do not represent the amount paid by the class during periods when reimbursements or reductions occur. Expenses net of fee waivers reflect expenses after reimbursement by the investment adviser but prior to reductions from brokerage service arrangements or other expense offset arrangements. Expenses net of all reductions represent the net expenses paid by the class.
G Amount does not include the portfolio activity of any underlying Fidelity Central Funds.
See accompanying notes which are an integral part of the financial statements.
Fidelity Latin America Fund
| Years ended October 31, | 2018 | 2017 | 2016 | 2015 | 2014 |
| Selected Per–Share Data | |||||
| Net asset value, beginning of period | $24.89 | $22.41 | $18.08 | $30.34 | $40.80 |
| Income from Investment Operations | |||||
| Net investment income (loss)A | .57 | .49 | .45 | .34 | .59 |
| Net realized and unrealized gain (loss) | (3.15) | 2.46 | 4.26 | (10.11) | (4.10) |
| Total from investment operations | (2.58) | 2.95 | 4.71 | (9.77) | (3.51) |
| Distributions from net investment income | (.37) | (.48) | (.38) | (.41) | (.71) |
| Distributions from net realized gain | – | – | – | (2.08) | (6.25) |
| Total distributions | (.37) | (.48) | (.38) | (2.49) | (6.96) |
| Redemption fees added to paid in capitalA | –B | .01 | –B | –B | .01 |
| Net asset value, end of period | $21.94 | $24.89 | $22.41 | $18.08 | $30.34 |
| Total ReturnC | (10.50)% | 13.87% | 26.65% | (34.45)% | (8.79)% |
| Ratios to Average Net AssetsD,E | |||||
| Expenses before reductions | 1.07% | 1.09% | 1.14% | 1.13% | 1.08% |
| Expenses net of fee waivers, if any | 1.07% | 1.09% | 1.14% | 1.12% | 1.08% |
| Expenses net of all reductions | 1.05% | 1.09% | 1.13% | 1.12% | 1.07% |
| Net investment income (loss) | 2.39% | 2.19% | 2.40% | 1.53% | 1.83% |
| Supplemental Data | |||||
| Net assets, end of period (000 omitted) | $445,845 | $597,161 | $596,514 | $481,005 | $933,298 |
| Portfolio turnover rateF | 53% | 51% | 108% | 30% | 30% |
A Calculated based on average shares outstanding during the period.
B Amount represents less than $.005 per share.
C Total returns would have been lower if certain expenses had not been reduced during the applicable periods shown.
D Fees and expenses of any underlying Fidelity Central Funds are not included in the Fund's expense ratio. The Fund indirectly bears its proportionate share of the expenses of any underlying Fidelity Central Funds.
E Expense ratios reflect operating expenses of the class. Expenses before reductions do not reflect amounts reimbursed by the investment adviser or reductions from brokerage service arrangements or reductions from other expense offset arrangements and do not represent the amount paid by the class during periods when reimbursements or reductions occur. Expenses net of fee waivers reflect expenses after reimbursement by the investment adviser but prior to reductions from brokerage service arrangements or other expense offset arrangements. Expenses net of all reductions represent the net expenses paid by the class.
F Amount does not include the portfolio activity of any underlying Fidelity Central Funds.
See accompanying notes which are an integral part of the financial statements.
Fidelity Latin America Fund Class I
| Years ended October 31, | 2018 | 2017 | 2016 | 2015 | 2014 |
| Selected Per–Share Data | |||||
| Net asset value, beginning of period | $24.88 | $22.40 | $18.08 | $30.35 | $40.79 |
| Income from Investment Operations | |||||
| Net investment income (loss)A | .59 | .51 | .46 | .36 | .60 |
| Net realized and unrealized gain (loss) | (3.15) | 2.45 | 4.26 | (10.13) | (4.07) |
| Total from investment operations | (2.56) | 2.96 | 4.72 | (9.77) | (3.47) |
| Distributions from net investment income | (.40) | (.49) | (.40) | (.42) | (.73) |
| Distributions from net realized gain | – | – | – | (2.08) | (6.25) |
| Total distributions | (.40) | (.49) | (.40) | (2.50) | (6.98) |
| Redemption fees added to paid in capitalA | –B | .01 | –B | –B | .01 |
| Net asset value, end of period | $21.92 | $24.88 | $22.40 | $18.08 | $30.35 |
| Total ReturnC | (10.44)% | 13.94% | 26.77% | (34.42)% | (8.69)% |
| Ratios to Average Net AssetsD,E | |||||
| Expenses before reductions | 1.01% | 1.01% | 1.07% | 1.06% | 1.04% |
| Expenses net of fee waivers, if any | 1.01% | 1.01% | 1.07% | 1.06% | 1.04% |
| Expenses net of all reductions | .98% | 1.01% | 1.06% | 1.05% | 1.04% |
| Net investment income (loss) | 2.45% | 2.27% | 2.47% | 1.60% | 1.86% |
| Supplemental Data | |||||
| Net assets, end of period (000 omitted) | $4,546 | $8,600 | $3,825 | $1,828 | $4,531 |
| Portfolio turnover rateF | 53% | 51% | 108% | 30% | 30% |
A Calculated based on average shares outstanding during the period.
B Amount represents less than $.005 per share.
C Total returns would have been lower if certain expenses had not been reduced during the applicable periods shown.
D Fees and expenses of any underlying Fidelity Central Funds are not included in the Fund's expense ratio. The Fund indirectly bears its proportionate share of the expenses of any underlying Fidelity Central Funds.
E Expense ratios reflect operating expenses of the class. Expenses before reductions do not reflect amounts reimbursed by the investment adviser or reductions from brokerage service arrangements or reductions from other expense offset arrangements and do not represent the amount paid by the class during periods when reimbursements or reductions occur. Expenses net of fee waivers reflect expenses after reimbursement by the investment adviser but prior to reductions from brokerage service arrangements or other expense offset arrangements. Expenses net of all reductions represent the net expenses paid by the class.
F Amount does not include the portfolio activity of any underlying Fidelity Central Funds.
See accompanying notes which are an integral part of the financial statements.
Fidelity Latin America Fund Class Z
| Year ended October 31, | 2018 A |
| Selected Per–Share Data | |
| Net asset value, beginning of period | $21.51 |
| Income from Investment Operations | |
| Net investment income (loss)B | (.01) |
| Net realized and unrealized gain (loss) | .42 |
| Total from investment operations | .41 |
| Net asset value, end of period | $21.92 |
| Total ReturnC,D | 1.91% |
| Ratios to Average Net AssetsE,F | |
| Expenses before reductions | .95%G |
| Expenses net of fee waivers, if any | .95%G |
| Expenses net of all reductions | .93%G |
| Net investment income (loss) | (.37)%G |
| Supplemental Data | |
| Net assets, end of period (000 omitted) | $145 |
| Portfolio turnover rateH | 53% |
A For the period October 2, 2018 (commencement of sale of shares) to October 31, 2018.
B Calculated based on average shares outstanding during the period.
C Total returns for periods of less than one year are not annualized.
D Total returns would have been lower if certain expenses had not been reduced during the applicable periods shown.
E Fees and expenses of any underlying Fidelity Central Funds are not included in the Fund's expense ratio. The Fund indirectly bears its proportionate share of the expenses of any underlying Fidelity Central Funds.
F Expense ratios reflect operating expenses of the class. Expenses before reductions do not reflect amounts reimbursed by the investment adviser or reductions from brokerage service arrangements or reductions from other expense offset arrangements and do not represent the amount paid by the class during periods when reimbursements or reductions occur. Expense ratios before reductions for start-up periods may not be representative of longer-term operating periods. Expenses net of fee waivers reflect expenses after reimbursement by the investment adviser but prior to reductions from brokerage service arrangements or other expense offset arrangements. Expenses net of all reductions represent the net expenses paid by the class.
G Annualized
H Amount does not include the portfolio activity of any underlying Fidelity Central Funds.
See accompanying notes which are an integral part of the financial statements.
Notes to Financial Statements
For the period ended October 31, 2018
1. Organization.
Fidelity Latin America Fund (the Fund) is a non-diversified fund of Fidelity Investment Trust (the Trust) and is authorized to issue an unlimited number of shares. The Trust is registered under the Investment Company Act of 1940, as amended (the 1940 Act), as an open-end management investment company organized as a Massachusetts business trust. The Fund commenced sale of Class Z shares on October 2, 2018. The Fund offers Class A, Class M, Class C, Latin America, Class I and Class Z shares, each of which has equal rights as to assets and voting privileges. Each class has exclusive voting rights with respect to matters that affect that class.
2. Investments in Fidelity Central Funds.
The Fund invests in Fidelity Central Funds, which are open-end investment companies generally available only to other investment companies and accounts managed by the investment adviser and its affiliates. The Fund's Schedule of Investments lists each of the Fidelity Central Funds held as of period end, if any, as an investment of the Fund, but does not include the underlying holdings of each Fidelity Central Fund. As an Investing Fund, the Fund indirectly bears its proportionate share of the expenses of the underlying Fidelity Central Funds.
The Money Market Central Funds seek preservation of capital and current income and are managed by Fidelity Investments Money Management, Inc. (FIMM), an affiliate of the investment adviser. Annualized expenses of the Money Market Central Funds as of their most recent shareholder report date are less than .005%.
A complete unaudited list of holdings for each Fidelity Central Fund is available upon request or at the Securities and Exchange Commission (the SEC) website at www.sec.gov. In addition, the financial statements of the Fidelity Central Funds, which are not covered by the Fund's Report of Independent Registered Public Accounting Firm, are available on the SEC website or upon request.
3. Significant Accounting Policies.
The Fund is an investment company and applies the accounting and reporting guidance of the Financial Accounting Standards Board (FASB) Accounting Standards Codification Topic 946 Financial Services – Investments Companies. The financial statements have been prepared in conformity with accounting principles generally accepted in the United States of America (GAAP), which require management to make certain estimates and assumptions at the date of the financial statements. Actual results could differ from those estimates. Subsequent events, if any, through the date that the financial statements were issued have been evaluated in the preparation of the financial statements. The following summarizes the significant accounting policies of the Fund:
Investment Valuation. Investments are valued as of 4:00 p.m. Eastern time on the last calendar day of the period. The Board of Trustees (the Board) has delegated the day to day responsibility for the valuation of the Fund's investments to the Fair Value Committee (the Committee) established by the Fund's investment adviser. In accordance with valuation policies and procedures approved by the Board, the Fund attempts to obtain prices from one or more third party pricing vendors or brokers to value its investments. When current market prices, quotations or currency exchange rates are not readily available or reliable, investments will be fair valued in good faith by the Committee, in accordance with procedures adopted by the Board. Factors used in determining fair value vary by investment type and may include market or investment specific events. The frequency with which these procedures are used cannot be predicted and they may be utilized to a significant extent. The Committee oversees the Fund's valuation policies and procedures and reports to the Board on the Committee's activities and fair value determinations. The Board monitors the appropriateness of the procedures used in valuing the Fund's investments and ratifies the fair value determinations of the Committee.
The Fund categorizes the inputs to valuation techniques used to value its investments into a disclosure hierarchy consisting of three levels as shown below:
- Level 1 – quoted prices in active markets for identical investments
- Level 2 – other significant observable inputs (including quoted prices for similar investments, interest rates, prepayment speeds, etc.)
- Level 3 – unobservable inputs (including the Fund's own assumptions based on the best information available)
Valuation techniques used to value the Fund's investments by major category are as follows:
Equity securities, including restricted securities, for which market quotations are readily available, are valued at the last reported sale price or official closing price as reported by a third party pricing vendor on the primary market or exchange on which they are traded and are categorized as Level 1 in the hierarchy. In the event there were no sales during the day or closing prices are not available, securities are valued at the last quoted bid price or may be valued using the last available price and are generally categorized as Level 2 in the hierarchy. For foreign equity securities, when market or security specific events arise, comparisons to the valuation of American Depositary Receipts (ADRs), futures contracts, Exchange-Traded Funds (ETFs) and certain indexes as well as quoted prices for similar securities may be used and would be categorized as Level 2 in the hierarchy. Utilizing these techniques may result in transfers between Level 1 and Level 2. For equity securities, including restricted securities, where observable inputs are limited, assumptions about market activity and risk are used and these securities may be categorized as Level 3 in the hierarchy.
Investments in open-end mutual funds, including the Fidelity Central Funds, are valued at their closing net asset value (NAV) each business day and are categorized as Level 1 in the hierarchy.
Changes in valuation techniques may result in transfers in or out of an assigned level within the disclosure hierarchy.
Foreign Currency. The Fund may use foreign currency contracts to facilitate transactions in foreign-denominated securities. Gains and losses from these transactions may arise from changes in the value of the foreign currency or if the counterparties do not perform under the contracts' terms.
Foreign-denominated assets, including investment securities, and liabilities are translated into U.S. dollars at the exchange rates at period end. Purchases and sales of investment securities, income and dividends received and expenses denominated in foreign currencies are translated into U.S. dollars at the exchange rate in effect on the transaction date.
The effects of exchange rate fluctuations on investments are included with the net realized and unrealized gain (loss) on investment securities. Other foreign currency transactions resulting in realized and unrealized gain (loss) are disclosed separately.
Investment Transactions and Income. For financial reporting purposes, the Fund's investment holdings and NAV include trades executed through the end of the last business day of the period. The NAV per share for processing shareholder transactions is calculated as of the close of business of the New York Stock Exchange (NYSE), normally 4:00 p.m. Eastern time and includes trades executed through the end of the prior business day. Gains and losses on securities sold are determined on the basis of identified cost. Dividend income is recorded on the ex-dividend date, except for certain dividends from foreign securities where the ex-dividend date may have passed, which are recorded as soon as the Fund is informed of the ex-dividend date. Non-cash dividends included in dividend income, if any, are recorded at the fair market value of the securities received. Income and capital gain distributions from Fidelity Central Funds, if any, are recorded on the ex-dividend date. Certain distributions received by the Fund represent a return of capital or capital gain. The Fund determines the components of these distributions subsequent to the ex-dividend date, based upon receipt of tax filings or other correspondence relating to the underlying investment. These distributions are recorded as a reduction of cost of investments and/or as a realized gain. Investment income is recorded net of foreign taxes withheld where recovery of such taxes is uncertain.
Class Allocations and Expenses. Investment income, realized and unrealized capital gains and losses, common expenses of the Fund, and certain fund-level expense reductions, if any, are allocated daily on a pro-rata basis to each class based on the relative net assets of each class to the total net assets of the Fund. Each class differs with respect to transfer agent and distribution and service plan fees incurred. Certain expense reductions may also differ by class. For the reporting period, the allocated portion of income and expenses to each class as a percent of its average net assets may vary due to the timing of recording these transactions in relation to fluctuating net assets of the classes. Expenses directly attributable to a fund are charged to that fund. Expenses attributable to more than one fund are allocated among the respective funds on the basis of relative net assets or other appropriate methods. Expense estimates are accrued in the period to which they relate and adjustments are made when actual amounts are known.
Income Tax Information and Distributions to Shareholders. Each year, the Fund intends to qualify as a regulated investment company under Subchapter M of the Internal Revenue Code, including distributing substantially all of its taxable income and realized gains. As a result, no provision for U.S. Federal income taxes is required. As of October 31, 2018, the Fund did not have any unrecognized tax benefits in the financial statements; nor is the Fund aware of any tax positions for which it is reasonably possible that the total amounts of unrecognized tax benefits will significantly change in the next twelve months. The Fund files a U.S. federal tax return, in addition to state and local tax returns as required. The Fund's federal income tax returns are subject to examination by the Internal Revenue Service (IRS) for a period of three fiscal years after they are filed. State and local tax returns may be subject to examination for an additional fiscal year depending on the jurisdiction. Foreign taxes are provided for based on the Fund's understanding of the tax rules and rates that exist in the foreign markets in which it invests.
Distributions are declared and recorded on the ex-dividend date. Income and capital gain distributions are declared separately for each class. Income and capital gain distributions are determined in accordance with income tax regulations, which may differ from GAAP. In addition, the Fund claimed a portion of the payment made to redeeming shareholders as a distribution for income tax purposes.
Capital accounts within the financial statements are adjusted for permanent book-tax differences. These adjustments have no impact on net assets or the results of operations. Capital accounts are not adjusted for temporary book-tax differences which will reverse in a subsequent period.
Book-tax differences are primarily due to foreign currency transactions, passive foreign investment companies (PFIC), deferred trustees compensation, capital loss carryforwards and losses deferred due to wash sales.
As of period end, the cost and unrealized appreciation (depreciation) in securities, and derivatives if applicable, for federal income tax purposes were as follows:
| Gross unrealized appreciation | $116,986,520 |
| Gross unrealized depreciation | (46,143,930) |
| Net unrealized appreciation (depreciation) | $70,842,590 |
| Tax Cost | $412,838,578 |
The tax-based components of distributable earnings as of period end were as follows:
| Undistributed ordinary income | $8,508,720 |
| Capital loss carryforward | $(101,811,992) |
| Net unrealized appreciation (depreciation) on securities and other investments | $70,832,500 |
Capital loss carryforwards are only available to offset future capital gains of the Fund to the extent provided by regulations and may be limited. Under the Regulated Investment Company Modernization Act of 2010 (the Act), the Fund is permitted to carry forward capital losses incurred in taxable years beginning after December 22, 2010 for an unlimited period and such capital losses are required to be used prior to any losses that expire. The capital loss carryforward information presented below, including any applicable limitation, is estimated as of fiscal period end and is subject to adjustment.
| No expiration | |
| Short-term | $(63,666,720) |
| Long-term | (38,145,272) |
| Total capital loss carryforward | $(101,811,992) |
The tax character of distributions paid was as follows:
| October 31, 2018 | October 31, 2017 | |
| Ordinary Income | $9,005,746 | $ 12,697,307 |
Short-Term Trading (Redemption) Fees. Shares held by investors in the Fund less than 90 days may have been subject to a redemption fee equal to 1.50% of the NAV of shares redeemed. All redemption fees, which reduce the proceeds of the shareholder redemption, are retained by the Fund and accounted for as an addition to paid in capital. In November 2017, the Board of Trustees approved the elimination of these redemption fees effective December 18, 2017.
Restricted Securities. The Fund may invest in securities that are subject to legal or contractual restrictions on resale. These securities generally may be resold in transactions exempt from registration or to the public if the securities are registered. Disposal of these securities may involve time-consuming negotiations and expense, and prompt sale at an acceptable price may be difficult. Information regarding restricted securities is included at the end of the Fund's Schedule of Investments.
New Rule Issuance. During August 2018, the U.S. Securities and Exchange Commission issued Final Rule Release No. 33-10532, Disclosure Update and Simplification. This Final Rule includes amendments specific to registered investment companies that are intended to eliminate overlap in disclosure requirements between Regulation S-X and GAAP. In accordance with these amendments, certain line-items in the Fund's financial statements have been combined or removed for the current period as outlined in the table below.
| Financial Statement | Current Line-Item Presentation | Prior Line-Item Presentation |
| Statement of Assets and Liabilities | Total distributable earnings (loss) | Undistributed/Distributions in excess of/Accumulated net investment income (loss) Accumulated/Undistributed net realized gain (loss) Net unrealized appreciation (depreciation) |
| Statement of Changes in Net Assets | N/A - removed | Undistributed/Distributions in excess of/Accumulated net investment income (loss) end of period |
| Statement of Changes in Net Assets | Distributions to shareholders | Distributions to shareholders from net investment income Distributions to shareholders from net realized gain |
| Distributions to Shareholders Note to Financial Statements | Distributions to shareholders | Distributions to shareholders from net investment income Distributions to shareholders from net realized gain |
4. Purchases and Sales of Investments.
Purchases and sales of securities, other than short-term securities, aggregated $297,112,360 and $371,604,371, respectively.
5. Fees and Other Transactions with Affiliates.
Management Fee. Fidelity Management & Research Company (the investment adviser) and its affiliates provide the Fund with investment management related services for which the Fund pays a monthly management fee. The management fee is the sum of an individual fund fee rate that is based on an annual rate of .45% of the Fund's average net assets and an annualized group fee rate that averaged .24% during the period. The group fee rate is based upon the average net assets of all the mutual funds advised by the investment adviser, including any mutual funds previously advised by the investment adviser that are currently advised by Fidelity SelectCo, LLC, an affiliate of the investment adviser. The group fee rate decreases as assets under management increase and increases as assets under management decrease. For the reporting period, the total annual management fee rate was .69% of the Fund's average net assets.
Distribution and Service Plan Fees. In accordance with Rule 12b-1 of the 1940 Act, the Fund has adopted separate Distribution and Service Plans for each class of shares. Certain classes pay Fidelity Distributors Corporation (FDC), an affiliate of the investment adviser, separate Distribution and Service Fees, each of which is based on an annual percentage of each class' average net assets. In addition, FDC may pay financial intermediaries for selling shares of the Fund and providing shareholder support services. For the period, the Distribution and Service Fee rates, total fees and amounts retained by FDC were as follows:
| Distribution Fee | Service Fee | Total Fees | Retained by FDC | |
| Class A | -% | .25% | $42,016 | $94 |
| Class M | .25% | .25% | 30,835 | 349 |
| Class C | .75% | .25% | 44,685 | 1,690 |
| $117,536 | $2,133 |
Sales Load. FDC may receive a front-end sales charge of up to 5.75% for selling Class A shares and 3.50% for selling Class M shares, some of which is paid to financial intermediaries for selling shares of the Fund. Depending on the holding period, FDC may receive contingent deferred sales charges levied on Class A, Class M and Class C redemptions. The deferred sales charges are 1.00% for Class C shares, 1.00% for certain purchases of Class A shares and .25% for certain purchases of Class M shares.
For the period, sales charge amounts retained by FDC were as follows:
| Retained by FDC | |
| Class A | $5,783 |
| Class M | 1,434 |
| Class C(a) | 685 |
| $7,902 |
(a) When Class C shares are initially sold, FDC pays commissions from its own resources to financial intermediaries through which the sales are made.
Transfer Agent Fees. Fidelity Investments Institutional Operations Company, Inc., (FIIOC), an affiliate of the investment adviser, is the transfer, dividend disbursing and shareholder servicing agent for each class of the Fund. FIIOC receives account fees and asset-based fees that vary according to the account size and type of account of the shareholders of the respective classes of the Fund, except for Class Z. FIIOC receives an asset-based fee of Class Z's average net assets. FIIOC pays for typesetting, printing and mailing of shareholder reports, except proxy statements.
For the period, transfer agent fees for each class were as follows:
| Amount | % of Class-Level Average Net Assets | |
| Class A | $50,661 | .30 |
| Class M | 20,143 | .33 |
| Class C | 13,454 | .30 |
| Latin America | 1,287,685 | .24 |
| Class I | 12,517 | .18 |
| Class Z | 4 | .05(a) |
| $1,384,464 |
(a) Annualized
Accounting and Security Lending Fees. Fidelity Service Company, Inc. (FSC), an affiliate of the investment adviser, maintains the Fund's accounting records. The accounting fee is based on the level of average net assets for each month. Under a separate contract, FSC administers the security lending program. The security lending fee is based on the number and duration of lending transactions. For the period, the fees were equivalent to an annual rate of .05%.
Brokerage Commissions. The Fund placed a portion of its portfolio transactions with brokerage firms which are affiliates of the investment adviser. Brokerage commissions are included in net realized gain (loss) and change in net unrealized appreciation (depreciation) in the Statement of Operations. The commissions paid to these affiliated firms were $1,553 for the period.
Interfund Trades. The Fund may purchase from or sell securities to other Fidelity Funds under procedures adopted by the Board. The procedures have been designed to ensure these interfund trades are executed in accordance with Rule 17a-7 of the 1940 Act. Interfund trades are included within the respective purchases and sales amounts shown in the Purchases and Sales of Investments note.
6. Committed Line of Credit.
The Fund participates with other funds managed by the investment adviser or an affiliate in a $4.25 billion credit facility (the "line of credit") to be utilized for temporary or emergency purposes to fund shareholder redemptions or for other short-term liquidity purposes. The Fund has agreed to pay commitment fees on its pro-rata portion of the line of credit, which amounted to $1,644 and is reflected in Miscellaneous expenses on the Statement of Operations. During the period, the Fund did not borrow on this line of credit.
7. Security Lending.
The Fund lends portfolio securities through a lending agent from time to time in order to earn additional income. For equity securities, a lending agent is used and may loan securities to certain qualified borrowers, including Fidelity Capital Markets (FCM), a broker-dealer affiliated with the Fund. On the settlement date of the loan, the Fund receives collateral (in the form of U.S. Treasury obligations, letters of credit and/or cash) against the loaned securities and maintains collateral in an amount not less than 100% of the market value of the loaned securities during the period of the loan. The market value of the loaned securities is determined at the close of business of the Fund and any additional required collateral is delivered to the Fund on the next business day. The Fund or borrower may terminate the loan at any time, and if the borrower defaults on its obligation to return the securities loaned because of insolvency or other reasons, the Fund may apply collateral received from the borrower against the obligation. The Fund may experience delays and costs in recovering the securities loaned. Any cash collateral received is invested in the Fidelity Securities Lending Cash Central Fund. The value of loaned securities and cash collateral at period end are disclosed on the Fund's Statement of Assets and Liabilities. Security lending income represents the income earned on investing cash collateral, less rebates paid to borrowers and any lending agent fees associated with the loan, plus any premium payments received for lending certain types of securities. Security lending income is presented in the Statement of Operations as a component of income from Fidelity Central Funds. Total security lending income during the period amounted to $1,232. During the period, there were no securities loaned to FCM.
8. Expense Reductions.
Commissions paid to certain brokers with whom the investment adviser, or its affiliates, places trades on behalf of the Fund include an amount in addition to trade execution, which may be rebated back to the Fund to offset certain expenses. This amount totaled $131,530 for the period.
In addition, during the period the investment adviser reimbursed and/or waived a portion of fund-level operating expenses in the amount of $5,993.
9. Distributions to Shareholders.
Distributions to shareholders of each class were as follows:
| Year ended October 31, 2018 | Year ended October 31, 2017 | |
| Distributions to shareholders | ||
| Class A | $203,267 | $– |
| Class M | 60,223 | – |
| Class C | 19,813 | – |
| Latin America | 8,592,965 | – |
| Class I | 129,478 | – |
| Total | $9,005,746 | $– |
| From net investment income | ||
| Class A | $– | $361,857 |
| Class M | – | 112,037 |
| Class C | – | 77,689 |
| Latin America | – | 12,063,200 |
| Class I | – | 82,524 |
| Total | $– | $12,697,307 |
10. Share Transactions.
Share transactions for each class were as follows and may contain automatic conversions between classes or exchanges between affiliated funds:
| Shares | Shares | Dollars | Dollars | |
| Year ended October 31, 2018(a) | Year ended October 31, 2017 | Year ended October 31, 2018(a) | Year ended October 31, 2017 | |
| Class A | ||||
| Shares sold | 132,121 | 139,205 | $3,342,334 | $3,031,500 |
| Reinvestment of distributions | 8,149 | 18,202 | 198,340 | 345,275 |
| Shares redeemed | (210,293) | (294,686) | (4,928,726) | (6,569,414) |
| Net increase (decrease) | (70,023) | (137,279) | $(1,388,052) | $(3,192,639) |
| Class M | ||||
| Shares sold | 33,058 | 33,689 | $849,708 | $739,767 |
| Reinvestment of distributions | 2,445 | 5,687 | 59,769 | 108,338 |
| Shares redeemed | (73,856) | (97,619) | (1,749,327) | (2,073,277) |
| Net increase (decrease) | (38,353) | (58,243) | $(839,850) | $(1,225,172) |
| Class C | ||||
| Shares sold | 28,227 | 20,475 | $744,605 | $450,205 |
| Reinvestment of distributions | 727 | 3,179 | 18,055 | 61,288 |
| Shares redeemed | (73,884) | (112,274) | (1,820,603) | (2,414,306) |
| Net increase (decrease) | (44,930) | (88,620) | $(1,057,943) | $(1,902,813) |
| Latin America | ||||
| Shares sold | 4,131,542 | 5,339,360 | $102,336,398 | $120,661,935 |
| Reinvestment of distributions | 339,440 | 610,988 | 8,218,379 | 11,542,194 |
| Shares redeemed | (8,141,607) | (8,575,067) | (192,899,345) | (185,420,867) |
| Net increase (decrease) | (3,670,625) | (2,624,719) | $(82,344,568) | $(53,216,738) |
| Class I | ||||
| Shares sold | 238,869 | 265,874 | $5,842,130 | $6,186,180 |
| Reinvestment of distributions | 4,501 | 3,896 | 108,773 | 73,478 |
| Shares redeemed | (381,644) | (94,860) | (9,010,302) | (2,127,918) |
| Net increase (decrease) | (138,274) | 174,910 | $(3,059,399) | $4,131,740 |
| Class Z | ||||
| Shares sold | 6,615 | – | $143,661 | $– |
| Net increase (decrease) | 6,615 | – | $143,661 | $– |
(a) Share transactions for Class Z are for the period October 2, 2018 (commencement of sale of shares) to October 31, 2018.
11. Other.
The Fund's organizational documents provide former and current trustees and officers with a limited indemnification against liabilities arising in connection with the performance of their duties to the Fund. In the normal course of business, the Fund may also enter into contracts that provide general indemnifications. The Fund's maximum exposure under these arrangements is unknown as this would be dependent on future claims that may be made against the Fund. The risk of material loss from such claims is considered remote.
Report of Independent Registered Public Accounting Firm
To the Board of Trustees of Fidelity Investment Trust and Shareholders of Fidelity Latin America Fund:
Opinion on the Financial Statements
We have audited the accompanying statement of assets and liabilities, including the schedule of investments, of Fidelity Latin America Fund (one of the funds constituting Fidelity Investment Trust, referred to hereafter as the "Fund") as of October 31, 2018, the related statement of operations for the year ended October 31, 2018, the statement of changes in net assets for each of the two years in the period ended October 31, 2018, including the related notes, and the financial highlights for each of the periods indicated therein (collectively referred to as the “financial statements”). In our opinion, the financial statements present fairly, in all material respects, the financial position of the Fund as of October 31, 2018, the results of its operations for the year then ended, the changes in its net assets for each of the two years in the period ended October 31, 2018 and the financial highlights for each of the periods indicated therein in conformity with accounting principles generally accepted in the United States of America.
Basis for Opinion
These financial statements are the responsibility of the Fund’s management. Our responsibility is to express an opinion on the Fund’s financial statements based on our audits. We are a public accounting firm registered with the Public Company Accounting Oversight Board (United States) (“PCAOB”) and are required to be independent with respect to the Fund in accordance with the U.S. federal securities laws and the applicable rules and regulations of the Securities and Exchange Commission and the PCAOB.
We conducted our audits of these financial statements in accordance with the standards of the PCAOB. Those standards require that we plan and perform the audit to obtain reasonable assurance about whether the financial statements are free of material misstatement, whether due to error or fraud.
Our audits included performing procedures to assess the risks of material misstatement of the financial statements, whether due to error or fraud, and performing procedures that respond to those risks. Such procedures included examining, on a test basis, evidence regarding the amounts and disclosures in the financial statements. Our audits also included evaluating the accounting principles used and significant estimates made by management, as well as evaluating the overall presentation of the financial statements. Our procedures included confirmation of securities owned as of October 31, 2018 by correspondence with the custodian and brokers; when replies were not received from brokers, we performed other auditing procedures. We believe that our audits provide a reasonable basis for our opinion.
PricewaterhouseCoopers LLP
Boston, Massachusetts
December 14, 2018
We have served as the auditor of one or more investment companies in the Fidelity group of funds since 1932.
Trustees and Officers
The Trustees, Members of the Advisory Board (if any), and officers of the trust fund, as applicable, are listed below. The Board of Trustees governs the fund and is responsible for protecting the interests of shareholders. The Trustees are experienced executives who meet periodically throughout the year to oversee the fund's activities, review contractual arrangements with companies that provide services to the fund, oversee management of the risks associated with such activities and contractual arrangements, and review the fund's performance. Except for Jonathan Chiel, each of the Trustees oversees 283 funds. Mr. Chiel oversees 154 funds.
The Trustees hold office without limit in time except that (a) any Trustee may resign; (b) any Trustee may be removed by written instrument, signed by at least two-thirds of the number of Trustees prior to such removal; (c) any Trustee who requests to be retired or who has become incapacitated by illness or injury may be retired by written instrument signed by a majority of the other Trustees; and (d) any Trustee may be removed at any special meeting of shareholders by a two-thirds vote of the outstanding voting securities of the trust. Each Trustee who is not an interested person (as defined in the 1940 Act) of the trust and the fund is referred to herein as an Independent Trustee. Each Independent Trustee shall retire not later than the last day of the calendar year in which his or her 75th birthday occurs. The Independent Trustees may waive this mandatory retirement age policy with respect to individual Trustees. Officers and Advisory Board Members hold office without limit in time, except that any officer or Advisory Board Member may resign or may be removed by a vote of a majority of the Trustees at any regular meeting or any special meeting of the Trustees. Except as indicated, each individual has held the office shown or other offices in the same company for the past five years.
The fund’s Statement of Additional Information (SAI) includes more information about the Trustees. To request a free copy, call Fidelity at 1-877-208-0098.
Experience, Skills, Attributes, and Qualifications of the Trustees. The Governance and Nominating Committee has adopted a statement of policy that describes the experience, qualifications, attributes, and skills that are necessary and desirable for potential Independent Trustee candidates (Statement of Policy). The Board believes that each Trustee satisfied at the time he or she was initially elected or appointed a Trustee, and continues to satisfy, the standards contemplated by the Statement of Policy. The Governance and Nominating Committee also engages professional search firms to help identify potential Independent Trustee candidates who have the experience, qualifications, attributes, and skills consistent with the Statement of Policy. From time to time, additional criteria based on the composition and skills of the current Independent Trustees, as well as experience or skills that may be appropriate in light of future changes to board composition, business conditions, and regulatory or other developments, have also been considered by the professional search firms and the Governance and Nominating Committee. In addition, the Board takes into account the Trustees' commitment and participation in Board and committee meetings, as well as their leadership of standing and ad hoc committees throughout their tenure.
In determining that a particular Trustee was and continues to be qualified to serve as a Trustee, the Board has considered a variety of criteria, none of which, in isolation, was controlling. The Board believes that, collectively, the Trustees have balanced and diverse experience, qualifications, attributes, and skills, which allow the Board to operate effectively in governing the fund and protecting the interests of shareholders. Information about the specific experience, skills, attributes, and qualifications of each Trustee, which in each case led to the Board's conclusion that the Trustee should serve (or continue to serve) as a trustee of the fund, is provided below.
Board Structure and Oversight Function. James C. Curvey is an interested person and currently serves as Chairman. The Trustees have determined that an interested Chairman is appropriate and benefits shareholders because an interested Chairman has a personal and professional stake in the quality and continuity of services provided to the fund. Independent Trustees exercise their informed business judgment to appoint an individual of their choosing to serve as Chairman, regardless of whether the Trustee happens to be independent or a member of management. The Independent Trustees have determined that they can act independently and effectively without having an Independent Trustee serve as Chairman and that a key structural component for assuring that they are in a position to do so is for the Independent Trustees to constitute a substantial majority for the Board. The Independent Trustees also regularly meet in executive session. Ned C. Lautenbach serves as Chairman of the Independent Trustees and as such (i) acts as a liaison between the Independent Trustees and management with respect to matters important to the Independent Trustees and (ii) with management prepares agendas for Board meetings.
Fidelity® funds are overseen by different Boards of Trustees. The fund's Board oversees Fidelity's high income and certain equity funds, and other Boards oversee Fidelity's investment-grade bond, money market, asset allocation, and other equity funds. The asset allocation funds may invest in Fidelity® funds overseen by the fund's Board. The use of separate Boards, each with its own committee structure, allows the Trustees of each group of Fidelity® funds to focus on the unique issues of the funds they oversee, including common research, investment, and operational issues. On occasion, the separate Boards establish joint committees to address issues of overlapping consequences for the Fidelity® funds overseen by each Board.
The Trustees operate using a system of committees to facilitate the timely and efficient consideration of all matters of importance to the Trustees, the fund, and fund shareholders and to facilitate compliance with legal and regulatory requirements and oversight of the fund's activities and associated risks. The Board, acting through its committees, has charged FMR and its affiliates with (i) identifying events or circumstances the occurrence of which could have demonstrably adverse effects on the fund's business and/or reputation; (ii) implementing processes and controls to lessen the possibility that such events or circumstances occur or to mitigate the effects of such events or circumstances if they do occur; and (iii) creating and maintaining a system designed to evaluate continuously business and market conditions in order to facilitate the identification and implementation processes described in (i) and (ii) above. Because the day-to-day operations and activities of the fund are carried out by or through FMR, its affiliates, and other service providers, the fund's exposure to risks is mitigated but not eliminated by the processes overseen by the Trustees. While each of the Board's committees has responsibility for overseeing different aspects of the fund's activities, oversight is exercised primarily through the Operations, Audit, and Compliance Committees. In addition, the Independent Trustees have worked with Fidelity to enhance the Board's oversight of investment and financial risks, legal and regulatory risks, technology risks, and operational risks, including the development of additional risk reporting to the Board. Appropriate personnel, including but not limited to the fund's Chief Compliance Officer (CCO), FMR's internal auditor, the independent accountants, the fund's Treasurer and portfolio management personnel, make periodic reports to the Board's committees, as appropriate, including an annual review of Fidelity's risk management program for the Fidelity® funds. The responsibilities of each standing committee, including their oversight responsibilities, are described further under "Standing Committees of the Trustees."
Interested Trustees*:
Correspondence intended for a Trustee who is an interested person may be sent to Fidelity Investments, 245 Summer Street, Boston, Massachusetts 02210.
Name, Year of Birth; Principal Occupations and Other Relevant Experience+
Jonathan Chiel (1957)
Year of Election or Appointment: 2016
Trustee
Mr. Chiel also serves as Trustee of other Fidelity® funds. Mr. Chiel is Executive Vice President and General Counsel for FMR LLC (diversified financial services company, 2012-present). Previously, Mr. Chiel served as general counsel (2004-2012) and senior vice president and deputy general counsel (2000-2004) for John Hancock Financial Services; a partner with Choate, Hall & Stewart (1996-2000) (law firm); and an Assistant United States Attorney for the United States Attorney’s Office of the District of Massachusetts (1986-95), including Chief of the Criminal Division (1993-1995). Mr. Chiel is a director on the boards of the Boston Bar Foundation and the Maimonides School.
James C. Curvey (1935)
Year of Election or Appointment: 2007
Trustee
Chairman of the Board of Trustees
Mr. Curvey also serves as Trustee of other Fidelity® funds. Mr. Curvey is Vice Chairman (2007-present) and Director of FMR LLC (diversified financial services company). In addition, Mr. Curvey is an Overseer Emeritus for the Boston Symphony Orchestra, a Director of Artis-Naples, and a Trustee of Brewster Academy in Wolfeboro, New Hampshire. Previously, Mr. Curvey served as a Director of Fidelity Research & Analysis Co. (investment adviser firm, 2009-2018), Director of Fidelity Investments Money Management, Inc. (investment adviser firm, 2009-2014) and a Director of FMR and FMR Co., Inc. (investment adviser firms, 2007-2014).
Charles S. Morrison (1960)
Year of Election or Appointment: 2014
Trustee
Mr. Morrison also serves as Trustee of other funds. He serves as President of Fidelity SelectCo, LLC (investment adviser firm, 2017-present) and Fidelity Management & Research Company (FMR) (investment adviser firm, 2016-present), a Director of Fidelity Investments Money Management, Inc. (FIMM) (investment adviser firm, 2014-present), Director of Fidelity SelectCo, LLC (investment adviser firm, 2014-present), President, Asset Management (2014-present), and is an employee of Fidelity Investments. Previously, Mr. Morrison served as Vice President of Fidelity's Fixed Income and Asset Allocation Funds (2012-2014), President, Fixed Income (2011-2014), Vice President of Fidelity's Money Market Funds (2005-2009), President, Money Market Group Leader of FMR (investment adviser firm, 2009), and Senior Vice President, Money Market Group of FMR (2004-2009). Mr. Morrison also served as Vice President of Fidelity's Bond Funds (2002-2005), certain Balanced Funds (2002-2005), and certain Asset Allocation Funds (2002-2007), and as Senior Vice President (2002-2005) of Fidelity's Bond Division.
* Determined to be an “Interested Trustee” by virtue of, among other things, his or her affiliation with the trust or various entities under common control with FMR.
+ The information includes the Trustee's principal occupation during the last five years and other information relating to the experience, attributes, and skills relevant to the Trustee's qualifications to serve as a Trustee, which led to the conclusion that the Trustee should serve as a Trustee for the fund.
Independent Trustees:
Correspondence intended for an Independent Trustee may be sent to Fidelity Investments, P.O. Box 55235, Boston, Massachusetts 02205-5235.
Name, Year of Birth; Principal Occupations and Other Relevant Experience+
Dennis J. Dirks (1948)
Year of Election or Appointment: 2005
Trustee
Mr. Dirks also serves as Trustee of other Fidelity® funds. Prior to his retirement in May 2003, Mr. Dirks was Chief Operating Officer and a member of the Board of The Depository Trust & Clearing Corporation (DTCC). He also served as President, Chief Operating Officer, and Board member of The Depository Trust Company (DTC) and President and Board member of the National Securities Clearing Corporation (NSCC). In addition, Mr. Dirks served as Chief Executive Officer and Board member of the Government Securities Clearing Corporation, Chief Executive Officer and Board member of the Mortgage-Backed Securities Clearing Corporation, as a Trustee and a member of the Finance Committee of Manhattan College (2005-2008), as a Trustee and a member of the Finance Committee of AHRC of Nassau County (2006-2008), as a member of the Independent Directors Council (IDC) Governing Council (2010-2015), and as a member of the Board of Directors for The Brookville Center for Children’s Services, Inc. (2009-2017). Mr. Dirks is a member of the Finance Committee (2016-present), Board of Directors (2017-present) and Board of Trustees (2018-present) and is Treasurer (2018-present) of the Asolo Repertory Theatre.
Donald F. Donahue (1950)
Year of Election or Appointment: 2018
Trustee
Mr. Donahue also serves as a Trustee of other Fidelity® funds. Mr. Donahue is President and Chief Executive Officer of Miranda Partners, LLC (risk consulting for the financial services industry, 2012-present). Previously, Mr. Donahue served as a Member of the Advisory Board of certain Fidelity® funds (2015-2018) and Chief Executive Officer (2006-2012), Chief Operating Officer (2003-2006), and Managing Director, Customer Marketing and Development (1999-2003) of The Depository Trust & Clearing Corporation (financial markets infrastructure). Mr. Donahue serves as a Member (2007-present) and Co-Chairman (2016-present) of the Board of Directors of United Way of New York, Member of the Board of Directors of NYC Leadership Academy (2012-present) and Member of the Board of Advisors of Ripple Labs, Inc. (financial services, 2015-present). He also served as Chairman (2010-2012) and Member of the Board of Directors (2012-2013) of Omgeo, LLC (financial services), Treasurer of United Way of New York (2012-2016), and Member of the Board of Directors of XBRL US (financial services non-profit, 2009-2012) and the International Securities Services Association (2009-2012).
Alan J. Lacy (1953)
Year of Election or Appointment: 2008
Trustee
Mr. Lacy also serves as Trustee of other Fidelity® funds. Mr. Lacy serves as a Director of Bristol-Myers Squibb Company (global pharmaceuticals, 2008-present). He is a Trustee of the California Chapter of The Nature Conservancy (2015-present) and a Director of the Center for Advanced Study in the Behavioral Sciences at Stanford University (2015-present). In addition, Mr. Lacy served as Senior Adviser (2007-2014) of Oak Hill Capital Partners, L.P. (private equity) and also served as Chief Executive Officer (2005) and Vice Chairman (2005-2006) of Sears Holdings Corporation (retail) and Chief Executive Officer and Chairman of the Board of Sears, Roebuck and Co. (retail, 2000-2005). Previously, Mr. Lacy served as Chairman (2014-2017) and a member (2010-2017) of the Board of Directors of Dave & Buster’s Entertainment, Inc. (restaurant and entertainment complexes), as Chairman (2008-2011) and a member (2006-2015) of the Board of Trustees of the National Parks Conservation Association, and as a member of the Board of Directors for The Hillman Companies, Inc. (hardware wholesalers, 2010-2014), Earth Fare, Inc. (retail grocery, 2010-2014), and The Western Union Company (global money transfer, 2006-2011).
Ned C. Lautenbach (1944)
Year of Election or Appointment: 2000
Trustee
Chairman of the Independent Trustees
Mr. Lautenbach also serves as Trustee of other Fidelity® funds. Mr. Lautenbach currently serves as Vice Chair of the Board of Governors, State University System of Florida (2013-present) and is a member of the Council on Foreign Relations (1994-present). He is also a member and has most recently served as Chairman of the Board of Directors of Artis-Naples (2012-present). Previously, Mr. Lautenbach served as a member and then Lead Director of the Board of Directors of Eaton Corporation (diversified industrial, 1997-2016). He was also a Partner and Advisory Partner at Clayton, Dubilier & Rice, LLC (private equity investment, 1998-2010), as well as a Director of Sony Corporation (2006-2007). In addition, Mr. Lautenbach also had a 30-year career with IBM (technology company) during which time he served as Senior Vice President and a member of the Corporate Executive Committee (1968-1998).
Joseph Mauriello (1944)
Year of Election or Appointment: 2008
Trustee
Mr. Mauriello also serves as Trustee of other Fidelity® funds. Prior to his retirement in January 2006, Mr. Mauriello served in numerous senior management positions including Deputy Chairman and Chief Operating Officer (2004-2005), and Vice Chairman of Financial Services (2002-2004) of KPMG LLP US (professional services, 1965-2005). Mr. Mauriello currently serves as a member of the Independent Directors Council (IDC) Governing Council (2015-present). Previously, Mr. Mauriello served as a member of the Board of Directors of XL Group plc. (global insurance and re-insurance, 2006-2018).
Cornelia M. Small (1944)
Year of Election or Appointment: 2005
Trustee
Ms. Small also serves as Trustee of other Fidelity® funds. Ms. Small is a member of the Board of Directors (2009-present) and Chair of the Investment Committee (2010-present) of the Teagle Foundation. Ms. Small also serves on the Investment Committee of the Berkshire Taconic Community Foundation (2008-present). Previously, Ms. Small served as Chairperson (2002-2008) and a member of the Investment Committee and Chairperson (2008-2012) and a member of the Board of Trustees of Smith College. In addition, Ms. Small served as Chief Investment Officer, Director of Global Equity Investments, and a member of the Board of Directors of Scudder, Stevens & Clark and Scudder Kemper Investments.
Garnett A. Smith (1947)
Year of Election or Appointment: 2018
Trustee
Mr. Smith also serves as Trustee of other Fidelity® funds. Prior to Mr. Smith's retirement, he served as Chairman and Chief Executive Officer of Inbrand Corp. (manufacturer of personal absorbent products, 1990-1997). He also served as President (1986-1990) of Inbrand Corp. Prior to his employment with Inbrand Corp., he was employed by a retail fabric chain and North Carolina National Bank. In addition, Mr. Smith served as a Member of the Advisory Board of certain Fidelity® funds (2012-2013) and as a board member of the Jackson Hole Land Trust (2009-2012).
David M. Thomas (1949)
Year of Election or Appointment: 2008
Trustee
Mr. Thomas also serves as Trustee of other Fidelity® funds. Mr. Thomas serves as Non-Executive Chairman of the Board of Directors of Fortune Brands Home and Security (home and security products, 2011-present), as a member of the Board of Directors (2004-present) and Presiding Director (2013-present) of Interpublic Group of Companies, Inc. (marketing communication), and as a member of the Board of Trustees of the University of Florida (2013-present). Previously, Mr. Thomas served as Executive Chairman (2005-2006) and Chairman and Chief Executive Officer (2000-2005) of IMS Health, Inc. (pharmaceutical and healthcare information solutions), and a Director of Fortune Brands, Inc. (consumer products, 2000-2011).
+ The information includes the Trustee's principal occupation during the last five years and other information relating to the experience, attributes, and skills relevant to the Trustee's qualifications to serve as a Trustee, which led to the conclusion that the Trustee should serve as a Trustee for the fund.
Advisory Board Members and Officers:
Correspondence intended for a Member of the Advisory Board (if any) may be sent to Fidelity Investments, P.O. Box 55235, Boston, Massachusetts 02205-5235. Correspondence intended for an officer or Peter S. Lynch may be sent to Fidelity Investments, 245 Summer Street, Boston, Massachusetts 02210. Officers appear below in alphabetical order.
Name, Year of Birth; Principal Occupation
Vicki L. Fuller (1957)
Year of Election or Appointment: 2018
Member of the Advisory Board
Ms. Fuller also serves as Member of the Advisory Board of other Fidelity® funds. Ms. Fuller serves as a member of the Board of Directors, Audit Committee, and Nominating and Governance Committee of The Williams Companies, Inc. (natural gas infrastructure, 2018-present). Previously, Ms. Fuller served as the Chief Investment Officer of the New York State Common Retirement Fund (2012-2018) and held a variety of positions at AllianceBernstein L.P. (global asset management, 1985-2012), including Managing Director (2006-2012) and Senior Vice President and Senior Portfolio Manager (2001-2006).
Peter S. Lynch (1944)
Year of Election or Appointment: 2003
Member of the Advisory Board
Mr. Lynch also serves as Member of the Advisory Board of other Fidelity® funds. Mr. Lynch is Vice Chairman and a Director of FMR (investment adviser firm) and FMR Co., Inc. (investment adviser firm). In addition, Mr. Lynch serves as a Trustee of Boston College and as the Chairman of the Inner-City Scholarship Fund. Previously, Mr. Lynch served on the Special Olympics International Board of Directors (1997-2006).
William S. Stavropoulos (1939)
Year of Election or Appointment: 2018
Member of the Advisory Board
Mr. Stavropoulos also serves as Member of the Advisory Board of other Fidelity® funds. Mr. Stavropoulos serves as President and Founder of the Michigan Baseball Foundation, the Great Lakes Loons (2007-present). Mr. Stavropoulos is Chairman Emeritus of the Board of Directors of The Dow Chemical Company, where he previously served in numerous senior management positions, including President, CEO (1995-2000; 2002-2004), Chairman of the Executive Committee (2000-2006), and as a member of the Board of Directors (1990-2006). Currently, Mr. Stavropoulos is Chairman of the Board of Directors of Univar Inc. (global distributor of commodity and specialty chemicals), a Director of Teradata Corporation (data warehousing and technology solutions), and a member of the Advisory Board for Metalmark Capital LLC (private equity investment, 2005-present). Mr. Stavropoulos is an operating advisor to Clayton, Dubilier & Rice, LLC (private equity investment). In addition, Mr. Stavropoulos is a member of the University of Notre Dame Advisory Council for the College of Science, a Trustee of the Rollin L. Gerstacker Foundation, and a Director of Artis-Naples in Naples, Florida. Previously, Mr. Stavropoulos served as Trustee of certain Fidelity® funds (2001-2018) and as a Director of Chemical Financial Corporation (bank holding company, 1993-2012) and Tyco International, Ltd. (multinational manufacturing and services, 2007-2012).
Carol B. Tomé (1957)
Year of Election or Appointment: 2018
Member of the Advisory Board
Ms. Tomé also serves as Member of the Advisory Board of other Fidelity® funds. Ms. Tomé is Chief Financial Officer (2001-present) and Executive Vice President of Corporate Services (2007-present) of The Home Depot, Inc. (home improvement retailer) and a Director (2003-present) and Chair of the Audit Committee (2004-present) of United Parcel Service, Inc. (package delivery and supply chain management). Previously, Ms. Tomé served as Trustee of certain Fidelity® funds (2017), Senior Vice President of Finance and Accounting/Treasurer (2000-2007) and Vice President and Treasurer (1995-2000) of The Home Depot, Inc. and Chair of the Board (2010-2012), Vice Chair of the Board (2009 and 2013), and a Director (2008-2013) of the Federal Reserve Bank of Atlanta. Ms. Tomé is also a director or trustee of many community and professional organizations.
Michael E. Wiley (1950)
Year of Election or Appointment: 2018
Member of the Advisory Board
Mr. Wiley also serves as Trustee or Member of the Advisory Board of other Fidelity® funds. Mr. Wiley serves as a Director of High Point Resources (exploration and production, 2005-present). Previously, Mr. Wiley served as a Director of Andeavor Corporation (independent oil refiner and marketer, 2005-2018), a Director of Andeavor Logistics LP (natural resources logistics, 2015-2018), a Director of Post Oak Bank (privately-held bank, 2004-2018), a Director of Asia Pacific Exploration Consolidated (international oil and gas exploration and production, 2008-2013), a member of the Board of Trustees of the University of Tulsa (2000-2006; 2007-2010), a Senior Energy Advisor of Katzenbach Partners, LLC (consulting, 2006-2007), an Advisory Director of Riverstone Holdings (private investment), a Director of Spinnaker Exploration Company (exploration and production, 2001-2005) and Chairman, President, and CEO of Baker Hughes, Inc. (oilfield services, 2000-2004).
Elizabeth Paige Baumann (1968)
Year of Election or Appointment: 2017
Anti-Money Laundering (AML) Officer
Ms. Baumann also serves as AML Officer of other funds. She is Chief AML Officer (2012-present) and Senior Vice President (2014-present) of FMR LLC (diversified financial services company) and is an employee of Fidelity Investments. Previously, Ms. Baumann served as AML Officer of the funds (2012-2016), and Vice President (2007-2014) and Deputy Anti-Money Laundering Officer (2007-2012) of FMR LLC.
John J. Burke III (1964)
Year of Election or Appointment: 2018
Chief Financial Officer
Mr. Burke also serves as Chief Financial Officer of other funds. Mr. Burke serves as Head of Investment Operations for Fidelity Fund and Investment Operations (2018-present) and is an employee of Fidelity Investments (1998-present). Previously Mr. Burke served as head of Asset Management Investment Operations (2012-2018).
William C. Coffey (1969)
Year of Election or Appointment: 2018
Secretary and Chief Legal Officer (CLO)
Mr. Coffey also serves as Secretary and CLO of other funds. Mr. Coffey serves as CLO, Secretary, and Senior Vice President of Fidelity Management & Research Company and FMR Co., Inc. (investment adviser firms, 2018-present); Secretary of Fidelity SelectCo, LLC and Fidelity Investments Money Management, Inc. (investment adviser firms, 2018-present); and CLO of Fidelity Management & Research (Hong Kong) Limited, FMR Investment Management (UK) Limited, and Fidelity Management & Research (Japan) Limited (investment adviser firms, 2018-present). He is Senior Vice President and Deputy General Counsel of FMR LLC (diversified financial services company, 2010-present), and is an employee of Fidelity Investments. Previously, Mr. Coffey served as Assistant Secretary of certain funds (2009-2018) and as Vice President and Associate General Counsel of FMR LLC (2005-2009).
Timothy M. Cohen (1969)
Year of Election or Appointment: 2018
Vice President
Mr. Cohen also serves as Vice President of other funds. Mr. Cohen serves as Co-Head of Global Equity Research (2016-present), a Director of Fidelity Management & Research (Japan) Limited (investment adviser firm, 2016-present), and is an employee of Fidelity Investments. Previously, Mr. Cohen served as Chief Investment Officer - Equity and a Director of Fidelity Management & Research (U.K.) Inc. (investment adviser firm, 2013-2015) and as a Director of Fidelity Management & Research (Hong Kong) Limited (investment adviser firm, 2017).
Jonathan Davis (1968)
Year of Election or Appointment: 2010
Assistant Treasurer
Mr. Davis also serves as Assistant Treasurer of other funds. Mr. Davis serves as Assistant Treasurer of FMR Capital, Inc. (2017-present) and is an employee of Fidelity Investments. Previously, Mr. Davis served as Vice President and Associate General Counsel of FMR LLC (diversified financial services company, 2003-2010).
Adrien E. Deberghes (1967)
Year of Election or Appointment: 2016
Assistant Treasurer
Mr. Deberghes also serves as an officer of other funds. He serves as Assistant Treasurer of FMR Capital, Inc. (2017-present), Executive Vice President of Fidelity Investments Money Management, Inc. (FIMM) (investment adviser firm, 2016-present), and is an employee of Fidelity Investments (2008-present). Previously, Mr. Deberghes served as President and Treasurer of certain Fidelity® funds (2013-2018). Prior to joining Fidelity Investments, Mr. Deberghes was Senior Vice President of Mutual Fund Administration at State Street Corporation (2007-2008), Senior Director of Mutual Fund Administration at Investors Bank & Trust (2005-2007), and Director of Finance for Dunkin' Brands (2000-2005). Previously, Mr. Deberghes served in other fund officer roles.
Laura M. Del Prato (1964)
Year of Election or Appointment: 2018
Assistant Treasurer
Ms. Del Prato also serves as an officer of other funds. Ms. Del Prato is an employee of Fidelity Investments (2017-present). Prior to joining Fidelity Investments, Ms. Del Prato served as a Managing Director and Treasurer of the JPMorgan Mutual Funds (2014-2017). Prior to JPMorgan, Ms. Del Prato served as a partner at Cohen Fund Audit Services (accounting firm, 2012-2013) and KPMG LLP (accounting firm, 2004-2012).
Colm A. Hogan (1973)
Year of Election or Appointment: 2016
Deputy Treasurer
Mr. Hogan also serves as an officer of other funds. Mr. Hogan serves as Assistant Treasurer of FMR Capital, Inc. (2017-present) and is an employee of Fidelity Investments (2005-present). Previously, Mr. Hogan served as Assistant Treasurer of certain Fidelity® funds (2016-2018).
Pamela R. Holding (1964)
Year of Election or Appointment: 2018
Vice President
Ms. Holding also serves as Vice President of other funds. Ms. Holding serves as Co-Head of Global Equity Research (2018-present) and is an employee of Fidelity Investments (2013-present).
Chris Maher (1972)
Year of Election or Appointment: 2013
Assistant Treasurer
Mr. Maher serves as Assistant Treasurer of other funds. Mr. Maher is Vice President of Valuation Oversight, serves as Assistant Treasurer of FMR Capital, Inc. (2017-present), and is an employee of Fidelity Investments. Previously, Mr. Maher served as Vice President of Asset Management Compliance (2013), Vice President of the Program Management Group of FMR (investment adviser firm, 2010-2013), and Vice President of Valuation Oversight (2008-2010).
Rieco E. Mello (1969)
Year of Election or Appointment: 2017
Assistant Treasurer
Mr. Mello also serves as Assistant Treasurer of other funds. Mr. Mello serves as Assistant Treasurer of FMR Capital, Inc. (2017-present) and is an employee of Fidelity Investments (1995-present).
Kenneth B. Robins (1969)
Year of Election or Appointment: 2016
Chief Compliance Officer
Mr. Robins also serves as an officer of other funds. Mr. Robins serves as Compliance Officer of Fidelity Management & Research Company and FMR Co., Inc. (investment adviser firms, 2016-present) and is an employee of Fidelity Investments (2004-present). Previously, Mr. Robins served as Executive Vice President of Fidelity Investments Money Management, Inc. (investment adviser firm, 2013-2016) and served in other fund officer roles.
Stacie M. Smith (1974)
Year of Election or Appointment: 2016
President and Treasurer
Ms. Smith also serves as an officer of other funds. Ms. Smith serves as Assistant Treasurer of FMR Capital, Inc. (2017-present), is an employee of Fidelity Investments (2009-present), and has served in other fund officer roles. Prior to joining Fidelity Investments, Ms. Smith served as Senior Audit Manager of Ernst & Young LLP (accounting firm, 1996-2009). Previously, Ms. Smith served as Assistant Treasurer (2013-2018) and Deputy Treasurer (2013-2016) of certain Fidelity® funds.
Marc L. Spector (1972)
Year of Election or Appointment: 2016
Assistant Treasurer
Mr. Spector also serves as an officer of other funds. Mr. Spector serves as Assistant Treasurer of FMR Capital, Inc. (2017-present) and is an employee of Fidelity Investments (2016-present). Prior to joining Fidelity Investments, Mr. Spector served as Director at the Siegfried Group (accounting firm, 2013-2016), and prior to Siegfried Group as audit senior manager at Deloitte & Touche (accounting firm, 2005-2013).
Shareholder Expense Example
As a shareholder of the Fund, you incur two types of costs: (1) transaction costs, including sales charges (loads) on purchase payments or redemption proceeds, and (2) ongoing costs, including distribution and/or service (12b-1) fees and other Fund expenses. This Example is intended to help you understand your ongoing costs (in dollars) of investing in the Fund and to compare these costs with the ongoing costs of investing in other mutual funds.
The actual expense Example is based on an investment of $1,000 invested at the beginning of the period and held for the entire period (May 1, 2018 to October 31, 2018) for each Class, except Class Z, and for the period (October 2, 2018 to October 31, 2018) for Class Z. The hypothetical expense Example is based on an investment of $1,000 invested for the one-half year period (May 1, 2018 to October 31, 2018).
Actual Expenses
The first line of the accompanying table for each class of the Fund provides information about actual account values and actual expenses. You may use the information in this line, together with the amount you invested, to estimate the expenses that you paid over the period. Simply divide your account value by $1,000.00 (for example, an $8,600 account value divided by $1,000.00 = 8.6), then multiply the result by the number in the first line for a class of the Fund under the heading entitled "Expenses Paid During Period" to estimate the expenses you paid on your account during this period. A small balance maintenance fee of $12.00 that is charged once a year may apply for certain accounts with a value of less than $2,000. This fee, which was eliminated effective August 1, 2018, is not included in the table below. If it was, the estimate of expenses you paid during the period would be higher, and your ending account value lower, by this amount. In addition, the Fund, as a shareholder in the underlying Fidelity Central Funds, will indirectly bear its pro-rata share of the fees and expenses incurred by the underlying Fidelity Central Funds. These fees and expenses are not included in the Fund's annualized expense ratio used to calculate the expense estimate in the table below.
Hypothetical Example for Comparison Purposes
The second line of the accompanying table for each class of the Fund provides information about hypothetical account values and hypothetical expenses based on a Class' actual expense ratio and an assumed rate of return of 5% per year before expenses, which is not the Class' actual return. The hypothetical account values and expenses may not be used to estimate the actual ending account balance or expenses you paid for the period. You may use this information to compare the ongoing costs of investing in the Fund and other funds. To do so, compare this 5% hypothetical example with the 5% hypothetical examples that appear in the shareholder reports of the other funds. A small balance maintenance fee of $12.00 that is charged once a year may apply for certain accounts with a value of less than $2,000. This fee, which was eliminated effective August 1, 2018, is not included in the table below. If it was, the estimate of expenses you paid during the period would be higher, and your ending account value lower, by this amount. In addition, the Fund, as a shareholder in the underlying Fidelity Central Funds, will indirectly bear its pro-rata share of the fees and expenses incurred by the underlying Fidelity Central Funds. These fees and expenses are not included in the Fund's annualized expense ratio used to calculate the expense estimate in the table below.
Please note that the expenses shown in the table are meant to highlight your ongoing costs only and do not reflect any transaction costs. Therefore, the second line of the table is useful in comparing ongoing costs only, and will not help you determine the relative total costs of owning different funds. In addition, if these transactional costs were included, your costs would have been higher.
| Annualized Expense Ratio-A | Beginning Account Value | Ending Account Value October 31, 2018 | Expenses Paid During Period | |
| Class A | 1.38% | |||
| Actual | $1,000.00 | $836.70 | $6.39-B | |
| Hypothetical-C | $1,000.00 | $1,018.25 | $7.02-D | |
| Class M | 1.65% | |||
| Actual | $1,000.00 | $835.50 | $7.63-B | |
| Hypothetical-C | $1,000.00 | $1,016.89 | $8.39-D | |
| Class C | 2.12% | |||
| Actual | $1,000.00 | $833.70 | $9.80-B | |
| Hypothetical-C | $1,000.00 | $1,014.52 | $10.76-D | |
| Latin America | 1.08% | |||
| Actual | $1,000.00 | $838.00 | $5.00-B | |
| Hypothetical-C | $1,000.00 | $1,019.76 | $5.50-D | |
| Class I | 1.00% | |||
| Actual | $1,000.00 | $838.20 | $4.63-B | |
| Hypothetical-C | $1,000.00 | $1,020.16 | $5.09-D | |
| Class Z | .95% | |||
| Actual | $1,000.00 | $1,019.10 | $.79-E | |
| Hypothetical-C | $1,000.00 | $1,020.42 | $4.84-D |
A Annualized expense ratio reflects expenses net of applicable fee waivers.
B Actual expenses are equal to each Class' annualized expense ratio, multiplied by the average account value over the period, multiplied by 184/365 (to reflect the one-half year period).
C 5% return per year before expenses
D Hypothetical expenses are equal to each Class' annualized expense ratio, multiplied by the average account value over the period, multiplied by 184/365 (to reflect the one-half year period).
E Actual expenses are equal to the Class' annualized expense ratio, multiplied by the average account value over the period, multiplied by 30/365 (to reflect the period October 2, 2018 to October 31, 2018).
Distributions (Unaudited)
Class A designates 1% and 1%; Class M designates 2% and 1%; Class C designates 5% and 1%; and Latin America designates 1% and 1%; Class I designates 1% and 1% of the dividends distributed on December 8, 2017 and December 28, 2017, respectively during the fiscal year as qualifying for the dividends–received deduction for corporate shareholders.
Class A designates 49% and 30%; Class M designates 64%, and 30%; Class C designates 100% and 30%; Latin America designates 37% and 30%, and Class I designates 34% and 30% of the dividends distributed on December 8, 2017 and December 28, 2017, respectively during the fiscal year as amounts which may be taken into account as a dividend for purposes of the maximum rate under section 1(h)(11) of the Internal Revenue Code.
The amounts per share which represent income derived from sources within, and taxes paid to, foreign countries or possessions of the United States are as follows:
| Pay Date | Income | Taxes | |
| Fidelity Latin America Fund | |||
| Class A | 12/11/17 | $0.2549 | $0.0449 |
| Class M | 12/11/17 | $0.1929 | $0.0449 |
| Class C | 12/11/17 | $0.0649 | $0.0449 |
| Latin America | 12/11/17 | $0.3359 | $0.0449 |
| Class I | 12/11/17 | $0.3629 | $0.0449 |
| Class A | 12/29/17 | $0.0800 | $0.0000 |
| Class M | 12/29/17 | $0.0800 | $0.0000 |
| Class C | 12/29/17 | $0.0800 | $0.0000 |
| Latin America | 12/29/17 | $0.0800 | $0.0000 |
| Class I | 12/29/17 | $0.0800 | $0.0000 |
The fund will notify shareholders in January 2019 of amounts for use in preparing 2018 income tax returns.
Board Approval of Investment Advisory Contracts
Fidelity Latin America Fund
At its July 2018 meeting, the Board of Trustees, including the Independent Trustees (together, the Board), voted to continue the management contract with Fidelity Management & Research Company (FMR) and the sub-advisory agreements (together, the Advisory Contracts) for the fund for six months through January 31, 2019, in connection with the reunification of the Fidelity Equity High Income Funds Board, which oversees the fund, and the Sector Portfolios Board.
The Board considered that the approval of the fund's Advisory Contracts will not result in any changes in (i) the investment process or strategies employed in the management of the fund's assets; (ii) the fees and expenses paid by shareholders; (iii) the nature, extent or quality of services provided under the fund's Advisory Contracts; or (iv) the day-to-day management of the fund or the persons primarily responsible for such management. The Board concluded that the fund's Advisory Contracts are fair and reasonable, and that the fund's Advisory Contracts should be renewed, without modification, through January 31, 2019, with the understanding that the Board will consider the annual renewal for a full one year period in January 2019.
In connection with its consideration of future renewals of the fund's Advisory Contracts, the Board will consider: (i) the nature, extent and quality of services provided to the fund, including shareholder and administrative services and investment performance; (ii) the competitiveness of the management fee and total expenses for the fund; (iii) the costs of the services and profitability, including the revenues earned and the expenses incurred in conducting the business of developing, marketing, distributing, managing, administering, and servicing the fund and its shareholders, to the extent applicable, as well as potential fall-out benefits from Fidelity's non-fund businesses; and (iv) whether there have been economies of scale in respect of the Fidelity funds, whether the Fidelity funds (including the fund) have appropriately benefited from any such economies of scale, and whether there is the potential for realization of any further economies.
Based on its evaluation of all of the conclusions noted above, and after considering all factors it believed relevant, the Board ultimately concluded that the fund's management fee structure is fair and reasonable, and that the continuation of the fund's Advisory Contracts should be approved.
![]()
FALAA-ANN-1218
1.917418.108
Fidelity's Targeted International Equity Funds® Fidelity® Canada Fund Fidelity® China Region Fund Fidelity® Emerging Asia Fund Fidelity® Emerging Markets Fund Fidelity® Europe Fund Fidelity® Japan Fund Fidelity® Japan Smaller Companies Fund Fidelity® Latin America Fund Fidelity® Nordic Fund Fidelity® Pacific Basin Fund Annual Report October 31, 2018 |
|
Contents
To view a fund's proxy voting guidelines and proxy voting record for the 12-month period ended June 30, visit http://www.fidelity.com/proxyvotingresults or visit the Securities and Exchange Commission's (SEC) web site at http://www.sec.gov.
You may also call 1-800-544-8544 to request a free copy of the proxy voting guidelines.
Standard & Poor's, S&P and S&P 500 are registered service marks of The McGraw-Hill Companies, Inc. and have been licensed for use by Fidelity Distributors Corporation.
Other third-party marks appearing herein are the property of their respective owners.
All other marks appearing herein are registered or unregistered trademarks or service marks of FMR LLC or an affiliated company. © 2018 FMR LLC. All rights reserved.
This report and the financial statements contained herein are submitted for the general information of the shareholders of the Funds. This report is not authorized for distribution to prospective investors in the Funds unless preceded or accompanied by an effective prospectus.
A fund files its complete schedule of portfolio holdings with the SEC for the first and third quarters of each fiscal year on Form N-Q. Forms N-Q are available on the SEC’s web site at http://www.sec.gov. A fund's Forms N-Q may be reviewed and copied at the SEC’s Public Reference Room in Washington, DC. Information regarding the operation of the SEC's Public Reference Room may be obtained by calling 1-800-SEC-0330.
For a complete list of a fund's portfolio holdings, view the most recent holdings listing, semiannual report, or annual report on Fidelity's web site at http://www.fidelity.com, http://www.institutional.fidelity.com, or http://www.401k.com, as applicable.
NOT FDIC INSURED •MAY LOSE VALUE •NO BANK GUARANTEE
Neither the Funds nor Fidelity Distributors Corporation is a bank.
Fidelity® Canada Fund
Performance: The Bottom Line
Average annual total return reflects the change in the value of an investment, assuming reinvestment of distributions from dividend income and capital gains (the profits earned upon the sale of securities that have grown in value, if any) and assuming a constant rate of performance each year. The hypothetical investment and the average annual total returns do not reflect the deduction of taxes that a shareholder would pay on fund distributions or the redemption of fund shares. During periods of reimbursement by Fidelity, a fund’s total return will be greater than it would be had the reimbursement not occurred. How a fund did yesterday is no guarantee of how it will do tomorrow.
Average Annual Total Returns
| For the periods ended October 31, 2018 | Past 1 year | Past 5 years | Past 10 years |
| Fidelity® Canada Fund | (5.89)% | 1.22% | 5.43% |
$10,000 Over 10 Years
Let's say hypothetically that $10,000 was invested in Fidelity® Canada Fund, a class of the fund, on October 31, 2008.
The chart shows how the value of your investment would have changed, and also shows how the S&P/TSX Composite Index performed over the same period.
| Period Ending Values | ||
| $16,967 | Fidelity® Canada Fund | |
| $19,181 | S&P/TSX Composite Index | |
Fidelity® Canada Fund
Management's Discussion of Fund Performance
Market Recap: International equities returned -8.08% for the 12 months ending October 31, 2018, according to the MSCI ACWI (All Country World Index) ex USA Index. A modestly positive first half of the period gave way to a confluence of overwhelmingly negative factors – including escalating trade tension, a surging U.S. dollar, tepid economic growth in Europe, global central bank tightening, concerns about Italy’s budget stalemate with the EU, and weakness in China’s stock market – that yielded a -11% second-half return. The index lost 8% in October alone, its largest monthly drop in more than six years. Among sectors, new-media-infused communications services (-15%) was hit the hardest, while economically sensitive consumer discretionary (-13%), information technology (-12%), financials (-10%), industrials (-9%) and materials (-7%) stocks also fared poorly. Even the more defensive real estate (-9%), utilities (-6%) and consumer staples (-5%) sectors weren’t spared this period. Conversely, elevated crude-oil prices fueled a positive return for energy (+7%), the top-performing sector, followed by the relatively stable-growing health care segment (+2%). Regionally, emerging markets (-12%) fared the worst, hampered by the impact of foreign exchange and concerns about economic weakness in China, India and South Korea. Sluggish growth also pressured shares in continental Europe (-9%). Stocks in Japan (-3%) and the U.K. (-4%) held up better, followed by Canada (-5%) and Asia-Pacific ex Japan (-6%).Comments from Portfolio Manager Ryan Oldham: For the fiscal year, the fund's share classes (excluding sales charges, if applicable) returned roughly -6% to -7%, trailing the -5.34% return of the benchmark S&P/TSX Composite Index. Volatile crude-oil prices dampened returns from resource-rich Canada, falling behind those in the United States, as measured by the S&P 500® Index. Versus the S&P/TSX Composite Index, stock selection in energy and materials detracted, as did positioning in health care. At the stock level, overweighted positions PrairieSky Royalty, which derives royalties from oil and gas production on its land, and oilfield services company CES Energy Solutions were the fund's most significant individual detractors. A weakened oil production outlook weighed on shares of PrairieSky, while reduced drilling in North America hindered results for CES. Conversely, stock selection in industrials and financials proved advantageous. In the transportation industry, the fund’s stake in Canadian Pacific Railway benefited from a return on equity, strong pricing power and strong volumes this period, all positive factors that encouraged investors and helped buoy its share price. An outsized position in financial media and information provider Thomson Reuters also contributed.The views expressed above reflect those of the portfolio manager(s) only through the end of the period as stated on the cover of this report and do not necessarily represent the views of Fidelity or any other person in the Fidelity organization. Any such views are subject to change at any time based upon market or other conditions and Fidelity disclaims any responsibility to update such views. These views may not be relied on as investment advice and, because investment decisions for a Fidelity fund are based on numerous factors, may not be relied on as an indication of trading intent on behalf of any Fidelity fund.
Note to Shareholders: On June 13, 2018, Ryan Oldham assumed co-management responsibilities for the fund, joining Risteard Hogan until July 30, 2018, when Risteard came off the fund, leaving Ryan Oldham as sole portfolio manager.Fidelity® Canada Fund
Investment Summary (Unaudited)
Geographic Diversification (% of fund's net assets)
| As of October 31, 2018 | ||
| Canada | 98.2% | |
| United States of America* | 1.8% | |

* Includes Short-Term investments and Net Other Assets (Liabilities).
Percentages are based on country or territory of incorporation and are adjusted for the effect of futures contracts, if applicable.
Asset Allocation as of October 31, 2018
| % of fund's net assets | |
| Stocks | 99.0 |
| Short-Term Investments and Net Other Assets (Liabilities) | 1.0 |
Top Ten Stocks as of October 31, 2018
| % of fund's net assets | |
| The Toronto-Dominion Bank (Banks) | 10.5 |
| Royal Bank of Canada (Banks) | 10.1 |
| Suncor Energy, Inc. (Oil, Gas & Consumable Fuels) | 6.3 |
| Canadian Pacific Railway Ltd. (Road & Rail) | 5.5 |
| TELUS Corp. (Diversified Telecommunication Services) | 4.2 |
| Nutrien Ltd. (Chemicals) | 4.2 |
| Sun Life Financial, Inc. (Insurance) | 4.0 |
| Alimentation Couche-Tard, Inc. Class B (sub. vtg.) (Food & Staples Retailing) | 3.7 |
| Canadian National Railway Co. (Road & Rail) | 3.6 |
| Rogers Communications, Inc. Class B (non-vtg.) (Wireless Telecommunication Services) | 3.2 |
| 55.3 |
Top Market Sectors as of October 31, 2018
| % of fund's net assets | |
| Financials | 33.6 |
| Energy | 17.4 |
| Materials | 11.5 |
| Industrials | 10.5 |
| Communication Services | 9.0 |
| Consumer Staples | 7.6 |
| Information Technology | 5.3 |
| Consumer Discretionary | 2.5 |
| Real Estate | 0.8 |
| Health Care | 0.8 |
Market Sectors may include more than one industry category.
The Fund may invest up to 35% of its total assets in any industry that represents more than 20% of the Canadian market. As of October 31, 2018, the Fund did not have more than 25% of its total assets invested in any one industry.
Fidelity® Canada Fund
Schedule of Investments October 31, 2018
Showing Percentage of Net Assets
| Common Stocks - 99.0% | |||
| Shares | Value | ||
| COMMUNICATION SERVICES - 9.0% | |||
| Diversified Telecommunication Services - 4.2% | |||
| TELUS Corp. | 1,215,500 | $41,623,108 | |
| Media - 1.6% | |||
| Cogeco Communications, Inc. | 160,400 | 7,864,955 | |
| Quebecor, Inc. Class B (sub. vtg.) | 404,900 | 7,941,447 | |
| 15,806,402 | |||
| Wireless Telecommunication Services - 3.2% | |||
| Rogers Communications, Inc. Class B (non-vtg.) | 599,700 | 30,881,281 | |
| TOTAL COMMUNICATION SERVICES | 88,310,791 | ||
| CONSUMER DISCRETIONARY - 2.5% | |||
| Hotels, Restaurants & Leisure - 0.5% | |||
| Recipe Unlimited Corp. | 222,000 | 4,580,136 | |
| Leisure Products - 0.8% | |||
| Spin Master Corp. (a)(b) | 234,200 | 8,332,962 | |
| Multiline Retail - 1.2% | |||
| Dollarama, Inc. | 417,600 | 11,549,862 | |
| TOTAL CONSUMER DISCRETIONARY | 24,462,960 | ||
| CONSUMER STAPLES - 7.6% | |||
| Food & Staples Retailing - 7.6% | |||
| Alimentation Couche-Tard, Inc. Class B (sub. vtg.) | 764,300 | 36,500,848 | |
| George Weston Ltd. | 256,900 | 18,685,233 | |
| Metro, Inc. Class A (sub. vtg.) | 375,295 | 11,776,700 | |
| North West Co., Inc. | 359,900 | 7,846,200 | |
| 74,808,981 | |||
| ENERGY - 17.4% | |||
| Energy Equipment & Services - 0.6% | |||
| Canadian Energy Services & Technology Corp. | 2,417,400 | 6,408,695 | |
| Oil, Gas & Consumable Fuels - 16.8% | |||
| Canadian Natural Resources Ltd. | 1,066,298 | 29,256,473 | |
| Cenovus Energy, Inc. (Canada) | 1,228,200 | 10,393,215 | |
| Enbridge, Inc. | 760,500 | 23,696,844 | |
| Peyto Exploration & Development Corp. (c) | 608,900 | 4,967,592 | |
| Pinnacle Renewable Holds, Inc. | 408,500 | 4,493,205 | |
| PrairieSky Royalty Ltd. (c) | 1,961,618 | 29,801,633 | |
| Suncor Energy, Inc. | 1,842,600 | 61,809,576 | |
| 164,418,538 | |||
| TOTAL ENERGY | 170,827,233 | ||
| FINANCIALS - 33.6% | |||
| Banks - 20.6% | |||
| Royal Bank of Canada | 1,357,700 | 98,925,583 | |
| The Toronto-Dominion Bank | 1,859,700 | 103,166,768 | |
| 202,092,351 | |||
| Capital Markets - 4.3% | |||
| Fairfax India Holdings Corp. (a)(b) | 102,000 | 1,294,380 | |
| Gluskin Sheff + Associates, Inc. | 257,900 | 2,198,061 | |
| IGM Financial, Inc. | 376,400 | 9,243,809 | |
| Thomson Reuters Corp. | 626,300 | 29,149,152 | |
| 41,885,402 | |||
| Insurance - 8.7% | |||
| Intact Financial Corp. | 302,325 | 23,886,075 | |
| Power Corp. of Canada (sub. vtg.) | 1,060,900 | 21,903,803 | |
| Sun Life Financial, Inc. | 1,061,100 | 38,858,772 | |
| 84,648,650 | |||
| TOTAL FINANCIALS | 328,626,403 | ||
| HEALTH CARE - 0.8% | |||
| Biotechnology - 0.8% | |||
| Amgen, Inc. | 38,300 | 7,383,857 | |
| INDUSTRIALS - 10.5% | |||
| Aerospace & Defense - 0.7% | |||
| CAE, Inc. | 401,100 | 7,074,740 | |
| Road & Rail - 9.8% | |||
| Canadian National Railway Co. | 406,500 | 34,750,663 | |
| Canadian Pacific Railway Ltd. | 262,500 | 53,831,991 | |
| TransForce, Inc. | 203,100 | 6,758,943 | |
| 95,341,597 | |||
| TOTAL INDUSTRIALS | 102,416,337 | ||
| INFORMATION TECHNOLOGY - 5.3% | |||
| IT Services - 2.1% | |||
| CGI Group, Inc. Class A (sub. vtg.) (a) | 338,800 | 20,923,271 | |
| Software - 3.2% | |||
| Constellation Software, Inc. | 22,300 | 15,347,353 | |
| Open Text Corp. | 461,028 | 15,563,131 | |
| 30,910,484 | |||
| TOTAL INFORMATION TECHNOLOGY | 51,833,755 | ||
| MATERIALS - 11.5% | |||
| Chemicals - 4.2% | |||
| Nutrien Ltd. | 784,581 | 41,534,012 | |
| Containers & Packaging - 1.3% | |||
| CCL Industries, Inc. Class B | 295,100 | 12,414,173 | |
| Metals & Mining - 5.5% | |||
| Franco-Nevada Corp. | 460,600 | 28,767,163 | |
| Lundin Mining Corp. | 1,694,600 | 6,964,021 | |
| OceanaGold Corp. | 524,300 | 1,509,436 | |
| Wheaton Precious Metals Corp. | 998,900 | 16,420,066 | |
| 53,660,686 | |||
| Paper & Forest Products - 0.5% | |||
| Western Forest Products, Inc. | 3,717,600 | 4,970,167 | |
| TOTAL MATERIALS | 112,579,038 | ||
| REAL ESTATE - 0.8% | |||
| Equity Real Estate Investment Trusts (REITs) - 0.8% | |||
| Allied Properties (REIT) | 252,800 | 8,122,937 | |
| TOTAL COMMON STOCKS | |||
| (Cost $749,958,585) | 969,372,292 | ||
| Money Market Funds - 2.1% | |||
| Fidelity Cash Central Fund, 2.23% (d) | 7,133,529 | 7,134,956 | |
| Fidelity Securities Lending Cash Central Fund 2.23% (d)(e) | 13,305,233 | 13,306,564 | |
| TOTAL MONEY MARKET FUNDS | |||
| (Cost $20,441,520) | 20,441,520 | ||
| TOTAL INVESTMENT IN SECURITIES - 101.1% | |||
| (Cost $770,400,105) | 989,813,812 | ||
| NET OTHER ASSETS (LIABILITIES) - (1.1)% | (10,641,430) | ||
| NET ASSETS - 100% | $979,172,382 |
Legend
(a) Non-income producing
(b) Security exempt from registration under Rule 144A of the Securities Act of 1933. These securities may be resold in transactions exempt from registration, normally to qualified institutional buyers. At the end of the period, the value of these securities amounted to $9,627,342 or 1.0% of net assets.
(c) Security or a portion of the security is on loan at period end.
(d) Affiliated fund that is generally available only to investment companies and other accounts managed by Fidelity Investments. The rate quoted is the annualized seven-day yield of the fund at period end. A complete unaudited listing of the fund's holdings as of its most recent quarter end is available upon request. In addition, each Fidelity Central Fund's financial statements, which are not covered by the Fund's Report of Independent Registered Public Accounting Firm, are available on the SEC's website or upon request.
(e) Investment made with cash collateral received from securities on loan.
Affiliated Central Funds
Information regarding fiscal year to date income earned by the Fund from investments in Fidelity Central Funds is as follows:
| Fund | Income earned |
| Fidelity Cash Central Fund | $363,826 |
| Fidelity Securities Lending Cash Central Fund | 214,540 |
| Total | $578,366 |
Amounts in the income column in the above table include any capital gain distributions from underlying funds, which are presented in the corresponding line-item in the Statement of Operations if applicable.
Investment Valuation
All investments are categorized as Level 1 under the Fair Value Hierarchy. The inputs or methodology used for valuing securities may not be an indication of the risk associated with investing in those securities. For more information on valuation inputs please refer to the Investment Valuation section in the accompanying Notes to Financial Statements.
See accompanying notes which are an integral part of the financial statements.
Fidelity® Canada Fund
Financial Statements
Statement of Assets and Liabilities
| October 31, 2018 | ||
| Assets | ||
| Investment in securities, at value (including securities loaned of $12,532,599) — See accompanying schedule: Unaffiliated issuers (cost $749,958,585) | $969,372,292 | |
| Fidelity Central Funds (cost $20,441,520) | 20,441,520 | |
| Total Investment in Securities (cost $770,400,105) | $989,813,812 | |
| Foreign currency held at value (cost $28,094) | 28,094 | |
| Receivable for investments sold | 2,076,289 | |
| Receivable for fund shares sold | 1,897,756 | |
| Dividends receivable | 1,976,133 | |
| Distributions receivable from Fidelity Central Funds | 48,996 | |
| Prepaid expenses | 2,051 | |
| Other receivables | 9,065 | |
| Total assets | 995,852,196 | |
| Liabilities | ||
| Payable for investments purchased | $1,927,052 | |
| Payable for fund shares redeemed | 651,179 | |
| Accrued management fee | 490,053 | |
| Distribution and service plan fees payable | 19,576 | |
| Other affiliated payables | 223,858 | |
| Other payables and accrued expenses | 62,026 | |
| Collateral on securities loaned | 13,306,070 | |
| Total liabilities | 16,679,814 | |
| Net Assets | $979,172,382 | |
| Net Assets consist of: | ||
| Paid in capital | $703,732,664 | |
| Total distributable earnings (loss) | 275,439,718 | |
| Net Assets | $979,172,382 | |
| Net Asset Value and Maximum Offering Price | ||
| Class A: | ||
| Net Asset Value and redemption price per share ($29,419,562÷ 591,312 shares) | $49.75 | |
| Maximum offering price per share (100/94.25 of $49.75) | $52.79 | |
| Class M: | ||
| Net Asset Value and redemption price per share ($7,843,688 ÷ 158,588 shares) | $49.46 | |
| Maximum offering price per share (100/96.50 of $49.46) | $51.25 | |
| Class C: | ||
| Net Asset Value and offering price per share ($11,195,851 ÷ 230,956 shares)(a) | $48.48 | |
| Canada: | ||
| Net Asset Value, offering price and redemption price per share ($903,661,966 ÷ 18,064,442 shares) | $50.02 | |
| Class I: | ||
| Net Asset Value, offering price and redemption price per share ($26,922,861 ÷ 539,185 shares) | $49.93 | |
| Class Z: | ||
| Net Asset Value, offering price and redemption price per share ($128,454 ÷ 2,572 shares) | $49.94 |
(a) Redemption price per share is equal to net asset value less any applicable contingent deferred sales charge.
See accompanying notes which are an integral part of the financial statements.
Statement of Operations
| Year ended October 31, 2018 | ||
| Investment Income | ||
| Dividends | $30,083,685 | |
| Income from Fidelity Central Funds | 578,366 | |
| Income before foreign taxes withheld | 30,662,051 | |
| Less foreign taxes withheld | (4,449,813) | |
| Total income | 26,212,238 | |
| Expenses | ||
| Management fee | ||
| Basic fee | $7,754,853 | |
| Performance adjustment | (744,922) | |
| Transfer agent fees | 2,318,289 | |
| Distribution and service plan fees | 270,797 | |
| Accounting and security lending fees | 522,538 | |
| Custodian fees and expenses | 17,419 | |
| Independent trustees' fees and expenses | 5,663 | |
| Registration fees | 70,270 | |
| Audit | 68,519 | |
| Legal | 5,633 | |
| Miscellaneous | 8,635 | |
| Total expenses before reductions | 10,297,694 | |
| Expense reductions | (65,879) | |
| Total expenses after reductions | 10,231,815 | |
| Net investment income (loss) | 15,980,423 | |
| Realized and Unrealized Gain (Loss) | ||
| Net realized gain (loss) on: | ||
| Investment securities: | ||
| Unaffiliated issuers | 57,279,605 | |
| Fidelity Central Funds | (1,821) | |
| Foreign currency transactions | (44,913) | |
| Total net realized gain (loss) | 57,232,871 | |
| Change in net unrealized appreciation (depreciation) on: | ||
| Investment securities: | ||
| Unaffiliated issuers | (134,483,140) | |
| Assets and liabilities in foreign currencies | 1,384 | |
| Total change in net unrealized appreciation (depreciation) | (134,481,756) | |
| Net gain (loss) | (77,248,885) | |
| Net increase (decrease) in net assets resulting from operations | $(61,268,462) |
See accompanying notes which are an integral part of the financial statements.
Statement of Changes in Net Assets
| Year ended October 31, 2018 | Year ended October 31, 2017 | |
| Increase (Decrease) in Net Assets | ||
| Operations | ||
| Net investment income (loss) | $15,980,423 | $16,819,801 |
| Net realized gain (loss) | 57,232,871 | 52,938,459 |
| Change in net unrealized appreciation (depreciation) | (134,481,756) | 105,995,484 |
| Net increase (decrease) in net assets resulting from operations | (61,268,462) | 175,753,744 |
| Distributions to shareholders | (27,476,751) | – |
| Distributions to shareholders from net investment income | – | (16,443,381) |
| Distributions to shareholders from net realized gain | – | (5,168,976) |
| Total distributions | (27,476,751) | (21,612,357) |
| Share transactions - net increase (decrease) | (157,321,221) | (276,985,730) |
| Redemption fees | 5,144 | 38,887 |
| Total increase (decrease) in net assets | (246,061,290) | (122,805,456) |
| Net Assets | ||
| Beginning of period | 1,225,233,672 | 1,348,039,128 |
| End of period | $979,172,382 | $1,225,233,672 |
| Other Information | ||
| Undistributed net investment income end of period | $13,463,474 |
See accompanying notes which are an integral part of the financial statements.
Financial Highlights
Fidelity Canada Fund Class A
| Years ended October 31, | 2018 | 2017 | 2016 | 2015 | 2014 |
| Selected Per–Share Data | |||||
| Net asset value, beginning of period | $54.11 | $48.09 | $45.25 | $60.56 | $57.31 |
| Income from Investment Operations | |||||
| Net investment income (loss)A | .60 | .50 | .48 | .45 | .47 |
| Net realized and unrealized gain (loss) | (3.88) | 6.16 | 2.84 | (8.04) | 3.13 |
| Total from investment operations | (3.28) | 6.66 | 3.32 | (7.59) | 3.60 |
| Distributions from net investment income | (.59) | (.45) | (.42) | (.50) | (.03) |
| Distributions from net realized gain | (.49) | (.19) | (.06) | (7.22) | (.32) |
| Total distributions | (1.08) | (.64) | (.48) | (7.72) | (.35) |
| Redemption fees added to paid in capitalA,B | – | – | – | – | – |
| Net asset value, end of period | $49.75 | $54.11 | $48.09 | $45.25 | $60.56 |
| Total ReturnC,D | (6.19)% | 13.98% | 7.45% | (14.32)% | 6.32% |
| Ratios to Average Net AssetsE,F | |||||
| Expenses before reductions | 1.21% | 1.34% | 1.48% | 1.43% | 1.29% |
| Expenses net of fee waivers, if any | 1.21% | 1.34% | 1.48% | 1.43% | 1.29% |
| Expenses net of all reductions | 1.20% | 1.34% | 1.48% | 1.43% | 1.29% |
| Net investment income (loss) | 1.13% | .98% | 1.06% | .90% | .79% |
| Supplemental Data | |||||
| Net assets, end of period (000 omitted) | $29,420 | $37,557 | $44,144 | $58,286 | $95,004 |
| Portfolio turnover rateG | 29% | 26% | 44% | 24% | 85% |
A Calculated based on average shares outstanding during the period.
B Amount represents less than $.005 per share.
C Total returns would have been lower if certain expenses had not been reduced during the applicable periods shown.
D Total returns do not include the effect of the sales charges.
E Fees and expenses of any underlying Fidelity Central Funds are not included in the Fund's expense ratio. The Fund indirectly bears its proportionate share of the expenses of any underlying Fidelity Central Funds.
F Expense ratios reflect operating expenses of the class. Expenses before reductions do not reflect amounts reimbursed by the investment adviser or reductions from brokerage service arrangements or reductions from other expense offset arrangements and do not represent the amount paid by the class during periods when reimbursements or reductions occur. Expenses net of fee waivers reflect expenses after reimbursement by the investment adviser but prior to reductions from brokerage service arrangements or other expense offset arrangements. Expenses net of all reductions represent the net expenses paid by the class.
G Amount does not include the portfolio activity of any underlying Fidelity Central Funds.
See accompanying notes which are an integral part of the financial statements.
Fidelity Canada Fund Class M
| Years ended October 31, | 2018 | 2017 | 2016 | 2015 | 2014 |
| Selected Per–Share Data | |||||
| Net asset value, beginning of period | $53.77 | $47.82 | $44.99 | $60.22 | $57.14 |
| Income from Investment Operations | |||||
| Net investment income (loss)A | .44 | .35 | .35 | .29 | .29 |
| Net realized and unrealized gain (loss) | (3.86) | 6.13 | 2.83 | (8.00) | 3.11 |
| Total from investment operations | (3.42) | 6.48 | 3.18 | (7.71) | 3.40 |
| Distributions from net investment income | (.40) | (.34) | (.29) | (.30) | – |
| Distributions from net realized gain | (.49) | (.19) | (.06) | (7.22) | (.32) |
| Total distributions | (.89) | (.53) | (.35) | (7.52) | (.32) |
| Redemption fees added to paid in capitalA,B | – | – | – | – | – |
| Net asset value, end of period | $49.46 | $53.77 | $47.82 | $44.99 | $60.22 |
| Total ReturnC,D | (6.47)% | 13.64% | 7.14% | (14.58)% | 5.99% |
| Ratios to Average Net AssetsE,F | |||||
| Expenses before reductions | 1.51% | 1.63% | 1.77% | 1.75% | 1.59% |
| Expenses net of fee waivers, if any | 1.51% | 1.63% | 1.77% | 1.75% | 1.59% |
| Expenses net of all reductions | 1.51% | 1.63% | 1.77% | 1.75% | 1.59% |
| Net investment income (loss) | .83% | .69% | .78% | .58% | .48% |
| Supplemental Data | |||||
| Net assets, end of period (000 omitted) | $7,844 | $10,356 | $11,140 | $12,820 | $21,989 |
| Portfolio turnover rateG | 29% | 26% | 44% | 24% | 85% |
A Calculated based on average shares outstanding during the period.
B Amount represents less than $.005 per share.
C Total returns would have been lower if certain expenses had not been reduced during the applicable periods shown.
D Total returns do not include the effect of the sales charges.
E Fees and expenses of any underlying Fidelity Central Funds are not included in the Fund's expense ratio. The Fund indirectly bears its proportionate share of the expenses of any underlying Fidelity Central Funds.
F Expense ratios reflect operating expenses of the class. Expenses before reductions do not reflect amounts reimbursed by the investment adviser or reductions from brokerage service arrangements or reductions from other expense offset arrangements and do not represent the amount paid by the class during periods when reimbursements or reductions occur. Expenses net of fee waivers reflect expenses after reimbursement by the investment adviser but prior to reductions from brokerage service arrangements or other expense offset arrangements. Expenses net of all reductions represent the net expenses paid by the class.
G Amount does not include the portfolio activity of any underlying Fidelity Central Funds.
See accompanying notes which are an integral part of the financial statements.
Fidelity Canada Fund Class C
| Years ended October 31, | 2018 | 2017 | 2016 | 2015 | 2014 |
| Selected Per–Share Data | |||||
| Net asset value, beginning of period | $52.72 | $46.87 | $44.02 | $59.04 | $56.27 |
| Income from Investment Operations | |||||
| Net investment income (loss)A | .21 | .13 | .15 | .07 | .02 |
| Net realized and unrealized gain (loss) | (3.78) | 6.01 | 2.78 | (7.85) | 3.07 |
| Total from investment operations | (3.57) | 6.14 | 2.93 | (7.78) | 3.09 |
| Distributions from net investment income | (.18) | (.11) | (.02) | (.02) | – |
| Distributions from net realized gain | (.49) | (.19) | (.06) | (7.22) | (.32) |
| Total distributions | (.67) | (.29)B | (.08) | (7.24) | (.32) |
| Redemption fees added to paid in capitalA,C | – | – | – | – | – |
| Net asset value, end of period | $48.48 | $52.72 | $46.87 | $44.02 | $59.04 |
| Total ReturnD,E | (6.85)% | 13.16% | 6.67% | (14.96)% | 5.53% |
| Ratios to Average Net AssetsF,G | |||||
| Expenses before reductions | 1.94% | 2.06% | 2.21% | 2.19% | 2.03% |
| Expenses net of fee waivers, if any | 1.93% | 2.06% | 2.21% | 2.19% | 2.03% |
| Expenses net of all reductions | 1.93% | 2.06% | 2.21% | 2.18% | 2.03% |
| Net investment income (loss) | .40% | .26% | .33% | .14% | .04% |
| Supplemental Data | |||||
| Net assets, end of period (000 omitted) | $11,196 | $15,938 | $18,489 | $21,610 | $38,749 |
| Portfolio turnover rateH | 29% | 26% | 44% | 24% | 85% |
A Calculated based on average shares outstanding during the period.
B Total distributions of $.29 per share is comprised of distributions from net investment income of $.105 and distributions from net realized gain of $.188 per share.
C Amount represents less than $.005 per share.
D Total returns would have been lower if certain expenses had not been reduced during the applicable periods shown.
E Total returns do not include the effect of the contingent deferred sales charge.
F Fees and expenses of any underlying Fidelity Central Funds are not included in the Fund's expense ratio. The Fund indirectly bears its proportionate share of the expenses of any underlying Fidelity Central Funds.
G Expense ratios reflect operating expenses of the class. Expenses before reductions do not reflect amounts reimbursed by the investment adviser or reductions from brokerage service arrangements or reductions from other expense offset arrangements and do not represent the amount paid by the class during periods when reimbursements or reductions occur. Expenses net of fee waivers reflect expenses after reimbursement by the investment adviser but prior to reductions from brokerage service arrangements or other expense offset arrangements. Expenses net of all reductions represent the net expenses paid by the class.
H Amount does not include the portfolio activity of any underlying Fidelity Central Funds.
See accompanying notes which are an integral part of the financial statements.
Fidelity Canada Fund
| Years ended October 31, | 2018 | 2017 | 2016 | 2015 | 2014 |
| Selected Per–Share Data | |||||
| Net asset value, beginning of period | $54.41 | $48.35 | $45.55 | $60.95 | $57.72 |
| Income from Investment Operations | |||||
| Net investment income (loss)A | .77 | .66 | .62 | .60 | .66 |
| Net realized and unrealized gain (loss) | (3.90) | 6.20 | 2.85 | (8.09) | 3.13 |
| Total from investment operations | (3.13) | 6.86 | 3.47 | (7.49) | 3.79 |
| Distributions from net investment income | (.77) | (.61) | (.61) | (.69) | (.24) |
| Distributions from net realized gain | (.49) | (.19) | (.06) | (7.22) | (.32) |
| Total distributions | (1.26) | (.80) | (.67) | (7.91) | (.56) |
| Redemption fees added to paid in capitalA,B | – | – | – | – | – |
| Net asset value, end of period | $50.02 | $54.41 | $48.35 | $45.55 | $60.95 |
| Total ReturnC | (5.89)% | 14.35% | 7.79% | (14.08)% | 6.64% |
| Ratios to Average Net AssetsD,E | |||||
| Expenses before reductions | .89% | 1.02% | 1.17% | 1.15% | .98% |
| Expenses net of fee waivers, if any | .89% | 1.02% | 1.17% | 1.15% | .98% |
| Expenses net of all reductions | .88% | 1.02% | 1.17% | 1.14% | .98% |
| Net investment income (loss) | 1.45% | 1.30% | 1.37% | 1.18% | 1.09% |
| Supplemental Data | |||||
| Net assets, end of period (000 omitted) | $903,662 | $1,130,803 | $1,233,050 | $1,279,488 | $2,057,843 |
| Portfolio turnover rateF | 29% | 26% | 44% | 24% | 85% |
A Calculated based on average shares outstanding during the period.
B Amount represents less than $.005 per share.
C Total returns would have been lower if certain expenses had not been reduced during the applicable periods shown.
D Fees and expenses of any underlying Fidelity Central Funds are not included in the Fund's expense ratio. The Fund indirectly bears its proportionate share of the expenses of any underlying Fidelity Central Funds.
E Expense ratios reflect operating expenses of the class. Expenses before reductions do not reflect amounts reimbursed by the investment adviser or reductions from brokerage service arrangements or reductions from other expense offset arrangements and do not represent the amount paid by the class during periods when reimbursements or reductions occur. Expenses net of fee waivers reflect expenses after reimbursement by the investment adviser but prior to reductions from brokerage service arrangements or other expense offset arrangements. Expenses net of all reductions represent the net expenses paid by the class.
F Amount does not include the portfolio activity of any underlying Fidelity Central Funds.
See accompanying notes which are an integral part of the financial statements.
Fidelity Canada Fund Class I
| Years ended October 31, | 2018 | 2017 | 2016 | 2015 | 2014 |
| Selected Per–Share Data | |||||
| Net asset value, beginning of period | $54.29 | $48.28 | $45.44 | $60.80 | $57.57 |
| Income from Investment Operations | |||||
| Net investment income (loss)A | .79 | .67 | .66 | .61 | .65 |
| Net realized and unrealized gain (loss) | (3.90) | 6.19 | 2.83 | (8.07) | 3.12 |
| Total from investment operations | (3.11) | 6.86 | 3.49 | (7.46) | 3.77 |
| Distributions from net investment income | (.77) | (.66) | (.59) | (.68) | (.22) |
| Distributions from net realized gain | (.49) | (.19) | (.06) | (7.22) | (.32) |
| Total distributions | (1.25)B | (.85) | (.65) | (7.90) | (.54) |
| Redemption fees added to paid in capitalA,C | – | – | – | – | – |
| Net asset value, end of period | $49.93 | $54.29 | $48.28 | $45.44 | $60.80 |
| Total ReturnD | (5.86)% | 14.38% | 7.83% | (14.05)% | 6.62% |
| Ratios to Average Net AssetsE,F | |||||
| Expenses before reductions | .86% | 1.00% | 1.14% | 1.13% | 1.00% |
| Expenses net of fee waivers, if any | .85% | .99% | 1.13% | 1.12% | 1.00% |
| Expenses net of all reductions | .85% | .99% | 1.13% | 1.12% | 1.00% |
| Net investment income (loss) | 1.49% | 1.33% | 1.41% | 1.21% | 1.08% |
| Supplemental Data | |||||
| Net assets, end of period (000 omitted) | $26,923 | $30,581 | $41,217 | $14,846 | $30,165 |
| Portfolio turnover rateG | 29% | 26% | 44% | 24% | 85% |
A Calculated based on average shares outstanding during the period.
B Total distributions of $1.25 per share is comprised of distributions from net investment income of $.765 and distributions from net realized gain of $.487 per share.
C Amount represents less than $.005 per share.
D Total returns would have been lower if certain expenses had not been reduced during the applicable periods shown.
E Fees and expenses of any underlying Fidelity Central Funds are not included in the Fund's expense ratio. The Fund indirectly bears its proportionate share of the expenses of any underlying Fidelity Central Funds.
F Expense ratios reflect operating expenses of the class. Expenses before reductions do not reflect amounts reimbursed by the investment adviser or reductions from brokerage service arrangements or reductions from other expense offset arrangements and do not represent the amount paid by the class during periods when reimbursements or reductions occur. Expenses net of fee waivers reflect expenses after reimbursement by the investment adviser but prior to reductions from brokerage service arrangements or other expense offset arrangements. Expenses net of all reductions represent the net expenses paid by the class.
G Amount does not include the portfolio activity of any underlying Fidelity Central Funds.
See accompanying notes which are an integral part of the financial statements.
Fidelity Canada Fund Class Z
| Year ended October 31, | 2018 A |
| Selected Per–Share Data | |
| Net asset value, beginning of period | $53.92 |
| Income from Investment Operations | |
| Net investment income (loss)B | .06 |
| Net realized and unrealized gain (loss) | (4.04) |
| Total from investment operations | (3.98) |
| Net asset value, end of period | $49.94 |
| Total ReturnC,D | (7.38)% |
| Ratios to Average Net AssetsE,F | |
| Expenses before reductions | .80%G |
| Expenses net of fee waivers, if any | .80%G |
| Expenses net of all reductions | .79%G |
| Net investment income (loss) | 1.48%G |
| Supplemental Data | |
| Net assets, end of period (000 omitted) | $128 |
| Portfolio turnover rateH | 29% |
A For the period October 2, 2018 (commencement of sale of shares) to October 31, 2018.
B Calculated based on average shares outstanding during the period.
C Total returns for periods of less than one year are not annualized.
D Total returns would have been lower if certain expenses had not been reduced during the applicable periods shown.
E Fees and expenses of any underlying Fidelity Central Funds are not included in the Fund's expense ratio. The Fund indirectly bears its proportionate share of the expenses of any underlying Fidelity Central Funds.
F Expense ratios reflect operating expenses of the class. Expenses before reductions do not reflect amounts reimbursed by the investment adviser or reductions from brokerage service arrangements or reductions from other expense offset arrangements and do not represent the amount paid by the class during periods when reimbursements or reductions occur. Expense ratios before reductions for start-up periods may not be representative of longer-term operating periods. Expenses net of fee waivers reflect expenses after reimbursement by the investment adviser but prior to reductions from brokerage service arrangements or other expense offset arrangements. Expenses net of all reductions represent the net expenses paid by the class.
G Annualized
H Amount does not include the portfolio activity of any underlying Fidelity Central Funds.
See accompanying notes which are an integral part of the financial statements.
Notes to Financial Statements
For the period ended October 31, 2018
1. Organization.
Fidelity Canada Fund (the Fund) is a fund of Fidelity Investment Trust (the Trust) and is authorized to issue an unlimited number of shares. The Trust is registered under the Investment Company Act of 1940, as amended (the 1940 Act), as an open-end management investment company organized as a Massachusetts business trust. The Fund commenced sale of Class Z shares on October 2, 2018. The Fund offers Class A, Class M, Class C, Canada, Class I, and Class Z shares, each of which has equal rights as to assets and voting privileges. Each class has exclusive voting rights with respect to matters that affect that class.
2. Investments in Fidelity Central Funds.
The Fund invests in Fidelity Central Funds, which are open-end investment companies generally available only to other investment companies and accounts managed by the investment adviser and its affiliates. The Fund's Schedule of Investments lists each of the Fidelity Central Funds held as of period end, if any, as an investment of the Fund, but does not include the underlying holdings of each Fidelity Central Fund. As an Investing Fund, the Fund indirectly bears its proportionate share of the expenses of the underlying Fidelity Central Funds.
The Money Market Central Funds seek preservation of capital and current income and are managed by Fidelity Investments Money Management, Inc. (FIMM), an affiliate of the investment adviser. Annualized expenses of the Money Market Central Funds as of their most recent shareholder report date are less than .005%.
A complete unaudited list of holdings for each Fidelity Central Fund is available upon request or at the Securities and Exchange Commission (the SEC) website at www.sec.gov. In addition, the financial statements of the Fidelity Central Funds, which are not covered by the Fund's Report of Independent Registered Public Accounting Firm, are available on the SEC website or upon request.
3. Significant Accounting Policies.
The Fund is an investment company and applies the accounting and reporting guidance of the Financial Accounting Standards Board (FASB) Accounting Standards Codification Topic 946 Financial Services – Investments Companies. The financial statements have been prepared in conformity with accounting principles generally accepted in the United States of America (GAAP), which require management to make certain estimates and assumptions at the date of the financial statements. Actual results could differ from those estimates. Subsequent events, if any, through the date that the financial statements were issued have been evaluated in the preparation of the financial statements. The following summarizes the significant accounting policies of the Fund:
Investment Valuation. Investments are valued as of 4:00 p.m. Eastern time on the last calendar day of the period. The Board of Trustees (the Board) has delegated the day to day responsibility for the valuation of the Fund's investments to the Fair Value Committee (the Committee) established by the Fund's investment adviser. In accordance with valuation policies and procedures approved by the Board, the Fund attempts to obtain prices from one or more third party pricing vendors or brokers to value its investments. When current market prices, quotations or currency exchange rates are not readily available or reliable, investments will be fair valued in good faith by the Committee, in accordance with procedures adopted by the Board. Factors used in determining fair value vary by investment type and may include market or investment specific events. The frequency with which these procedures are used cannot be predicted and they may be utilized to a significant extent. The Committee oversees the Fund's valuation policies and procedures and reports to the Board on the Committee's activities and fair value determinations. The Board monitors the appropriateness of the procedures used in valuing the Fund's investments and ratifies the fair value determinations of the Committee.
The Fund categorizes the inputs to valuation techniques used to value its investments into a disclosure hierarchy consisting of three levels as shown below:
- Level 1 – quoted prices in active markets for identical investments
- Level 2 – other significant observable inputs (including quoted prices for similar investments, interest rates, prepayment speeds, etc.)
- Level 3 – unobservable inputs (including the Fund's own assumptions based on the best information available)
Valuation techniques used to value the Fund's investments by major category are as follows:
Equity securities, including restricted securities, for which market quotations are readily available, are valued at the last reported sale price or official closing price as reported by a third party pricing vendor on the primary market or exchange on which they are traded and are categorized as Level 1 in the hierarchy. In the event there were no sales during the day or closing prices are not available, securities are valued at the last quoted bid price or may be valued using the last available price and are generally categorized as Level 2 in the hierarchy. For foreign equity securities, when market or security specific events arise, comparisons to the valuation of American Depositary Receipts (ADRs), futures contracts, Exchange-Traded Funds (ETFs) and certain indexes as well as quoted prices for similar securities may be used and would be categorized as Level 2 in the hierarchy. Utilizing these techniques may result in transfers between Level 1 and Level 2. For equity securities, including restricted securities, where observable inputs are limited, assumptions about market activity and risk are used and these securities may be categorized as Level 3 in the hierarchy.
Investments in open-end mutual funds, including the Fidelity Central Funds, are valued at their closing net asset value (NAV) each business day and are categorized as Level 1 in the hierarchy.
Changes in valuation techniques may result in transfers in or out of an assigned level within the disclosure hierarchy. The aggregate value of investments by input level as of October 31, 2018 is included at the end of the Fund's Schedule of Investments.
Foreign Currency. The Fund may use foreign currency contracts to facilitate transactions in foreign-denominated securities. Gains and losses from these transactions may arise from changes in the value of the foreign currency or if the counterparties do not perform under the contracts' terms.
Foreign-denominated assets, including investment securities, and liabilities are translated into U.S. dollars at the exchange rates at period end. Purchases and sales of investment securities, income and dividends received and expenses denominated in foreign currencies are translated into U.S. dollars at the exchange rate in effect on the transaction date.
The effects of exchange rate fluctuations on investments are included with the net realized and unrealized gain (loss) on investment securities. Other foreign currency transactions resulting in realized and unrealized gain (loss) are disclosed separately.
Investment Transactions and Income. For financial reporting purposes, the Fund's investment holdings and NAV include trades executed through the end of the last business day of the period. The NAV per share for processing shareholder transactions is calculated as of the close of business of the New York Stock Exchange (NYSE), normally 4:00 p.m. Eastern time and includes trades executed through the end of the prior business day. Gains and losses on securities sold are determined on the basis of identified cost and include proceeds received from litigation. Dividend income is recorded on the ex-dividend date, except for certain dividends from foreign securities where the ex-dividend date may have passed, which are recorded as soon as the Fund is informed of the ex-dividend date. Non-cash dividends included in dividend income, if any, are recorded at the fair market value of the securities received. Income and capital gain distributions from Fidelity Central Funds, if any, are recorded on the ex-dividend date. Interest income is accrued as earned and includes coupon interest and amortization of premium and accretion of discount on debt securities as applicable. Investment income is recorded net of foreign taxes withheld where recovery of such taxes is uncertain.
Class Allocations and Expenses. Investment income, realized and unrealized capital gains and losses, common expenses of the Fund, and certain fund-level expense reductions, if any, are allocated daily on a pro-rata basis to each class based on the relative net assets of each class to the total net assets of the Fund. Each class differs with respect to transfer agent and distribution and service plan fees incurred. Certain expense reductions may also differ by class. For the reporting period, the allocated portion of income and expenses to each class as a percent of its average net assets may vary due to the timing of recording these transactions in relation to fluctuating net assets of the classes. Expenses directly attributable to a fund are charged to that fund. Expenses attributable to more than one fund are allocated among the respective funds on the basis of relative net assets or other appropriate methods. Expense estimates are accrued in the period to which they relate and adjustments are made when actual amounts are known.
Income Tax Information and Distributions to Shareholders. Each year, the Fund intends to qualify as a regulated investment company under Subchapter M of the Internal Revenue Code, including distributing substantially all of its taxable income and realized gains. As a result, no provision for U.S. Federal income taxes is required. As of October 31, 2018, the Fund did not have any unrecognized tax benefits in the financial statements; nor is the Fund aware of any tax positions for which it is reasonably possible that the total amounts of unrecognized tax benefits will significantly change in the next twelve months. The Fund files a U.S. federal tax return, in addition to state and local tax returns as required. The Fund's federal income tax returns are subject to examination by the Internal Revenue Service (IRS) for a period of three fiscal years after they are filed. State and local tax returns may be subject to examination for an additional fiscal year depending on the jurisdiction. Foreign taxes are provided for based on the Fund's understanding of the tax rules and rates that exist in the foreign markets in which it invests.
Distributions are declared and recorded on the ex-dividend date. Income and capital gain distributions are declared separately for each class. Income and capital gain distributions are determined in accordance with income tax regulations, which may differ from GAAP. In addition, the Fund claimed a portion of the payment made to redeeming shareholders as a distribution for income tax purposes.
Capital accounts within the financial statements are adjusted for permanent book-tax differences. These adjustments have no impact on net assets or the results of operations. Capital accounts are not adjusted for temporary book-tax differences which will reverse in a subsequent period.
Book-tax differences are primarily due to foreign currency transactions, passive foreign investment companies (PFIC), deferred trustees compensation and losses deferred to wash sales.
As of period end, the cost and unrealized appreciation (depreciation) in securities, and derivatives if applicable, for federal income tax purposes were as follows:
| Gross unrealized appreciation | $271,886,304 |
| Gross unrealized depreciation | (54,702,050) |
| Net unrealized appreciation (depreciation) | $217,184,254 |
| Tax Cost | $772,629,558 |
The tax-based components of distributable earnings as of period end were as follows:
| Undistributed ordinary income | $7,302,376 |
| Undistributed long-term capital gain | $50,973,304 |
| Net unrealized appreciation (depreciation) on securities and other investments | $217,164,035 |
The tax character of distributions paid was as follows:
| October 31, 2018 | October 31, 2017 | |
| Ordinary Income | $22,403,877 | $ 21,612,357 |
| Long-term Capital Gains | 5,072,874 | – |
| Total | $27,476,751 | $ 21,612,357 |
Short-Term Trading (Redemption) Fees. Shares held by investors in the Fund less than 90 days may have been subject to a redemption fee equal to 1.50% of the NAV of shares redeemed. All redemption fees, which reduce the proceeds of the shareholder redemption, are retained by the Fund and accounted for as an addition to paid in capital. In November 2017, the Board of Trustees approved the elimination of these redemption fees effective December 18, 2017.
Restricted Securities. The Fund may invest in securities that are subject to legal or contractual restrictions on resale. These securities generally may be resold in transactions exempt from registration or to the public if the securities are registered. Disposal of these securities may involve time-consuming negotiations and expense, and prompt sale at an acceptable price may be difficult. Information regarding restricted securities is included at the end of the Fund's Schedule of Investments.
New Rule Issuance. During August 2018, the U.S. Securities and Exchange Commission issued Final Rule Release No. 33-10532, Disclosure Update and Simplification. This Final Rule includes amendments specific to registered investment companies that are intended to eliminate overlap in disclosure requirements between Regulation S-X and GAAP. In accordance with these amendments, certain line-items in the Fund's financial statements have been combined or removed for the current period as outlined in the table below.
| Financial Statement | Current Line-Item Presentation | Prior Line-Item Presentation |
| Statement of Assets and Liabilities | Total distributable earnings (loss) | Undistributed/Distributions in excess of/Accumulated net investment income (loss) Accumulated/Undistributed net realized gain (loss) Net unrealized appreciation (depreciation) |
| Statement of Changes in Net Assets | N/A - removed | Undistributed/Distributions in excess of/Accumulated net investment income (loss) end of period |
| Statement of Changes in Net Assets | Distributions to shareholders | Distributions to shareholders from net investment income Distributions to shareholders from net realized gain |
| Distributions to Shareholders Note to Financial Statements | Distributions to shareholders | Distributions to shareholders from net investment income Distributions to shareholders from net realized gain |
4. Purchases and Sales of Investments.
Purchases and sales of securities, other than short-term securities, aggregated $318,501,013 and $465,414,459, respectively.
5. Fees and Other Transactions with Affiliates.
Management Fee. Fidelity Management & Research Company (the investment adviser) and its affiliates provide the Fund with investment management related services for which the Fund pays a monthly management fee. The management fee is the sum of an individual fund fee rate that is based on an annual rate of .45% of the Fund's average net assets and an annualized group fee rate that averaged .24% during the period. The group fee rate is based upon the average net assets of all the mutual funds advised by the investment adviser, including any mutual funds previously advised by the investment adviser that are currently advised by Fidelity SelectCo, LLC, an affiliate of the investment adviser. The group fee rate decreases as assets under management increase and increases as assets under management decrease. In addition, the management fee is subject to a performance adjustment (up to a maximum of +/- .20% of the Fund's average net assets over a 36 month performance period). The upward or downward adjustment to the management fee is based on the relative investment performance of Canada as compared to its benchmark index, the S&P/TSX Composite Index, over the same 36 month performance period. For the reporting period, the total annual management fee rate, including the performance adjustment, was .62% of the Fund's average net assets. The performance adjustment included in the management fee rate may be higher or lower than the maximum performance adjustment rate due to the difference between the average net assets for the reporting and performance periods.
Distribution and Service Plan Fees. In accordance with Rule 12b-1 of the 1940 Act, the Fund has adopted separate Distribution and Service Plans for each class of shares. Certain classes pay Fidelity Distributors Corporation (FDC), an affiliate of the investment adviser, separate Distribution and Service Fees, each of which is based on an annual percentage of each class' average net assets. In addition, FDC may pay financial intermediaries for selling shares of the Fund and providing shareholder support services. For the period, the Distribution and Service Fee rates, total fees and amounts retained by FDC were as follows:
| Distribution Fee | Service Fee | Total Fees | Retained by FDC | |
| Class A | -% | .25% | $85,664 | $– |
| Class M | .25% | .25% | 46,192 | – |
| Class C | .75% | .25% | 138,941 | 486 |
| $270,797 | $486 |
Sales Load. FDC may receive a front-end sales charge of up to 5.75% for selling Class A shares and 3.50% for selling Class M shares, some of which is paid to financial intermediaries for selling shares of the Fund. Depending on the holding period, FDC may receive contingent deferred sales charges levied on Class A, Class M and Class C redemptions. The deferred sales charges are 1.00% for Class C shares, 1.00% for certain purchases of Class A shares and .25% for certain purchases of Class M shares.
For the period, sales charge amounts retained by FDC were as follows:
| Retained by FDC | |
| Class A | $5,397 |
| Class M | 1,796 |
| Class C(a) | 492 |
| $7,685 |
(a) When Class C shares are initially sold, FDC pays commissions from its own resources to financial intermediaries through which the sales are made.
Transfer Agent Fees. Fidelity Investments Institutional Operations Company, Inc., (FIIOC), an affiliate of the investment adviser, is the transfer, dividend disbursing and shareholder servicing agent for each class of the Fund. FIIOC receives account fees and asset-based fees that vary according to the account size and type of account of the shareholders of the respective classes of the Fund, except for Class Z. FIIOC receives an asset-based fee of Class Z's average net assets. FIIOC pays for typesetting, printing and mailing of shareholder reports, except proxy statements.
For the period, transfer agent fees for each class were as follows:
| Amount | % of Class-Level Average Net Assets | |
| Class A | $93,758 | .27 |
| Class M | 29,866 | .32 |
| Class C | 34,242 | .25 |
| Canada | 2,112,216 | .20 |
| Class I | 48,203 | .17 |
| Class Z | 4 | .05(a) |
| $2,318,289 |
(a) Annualized
Accounting and Security Lending Fees. Fidelity Service Company, Inc. (FSC), an affiliate of the investment adviser, maintains the Fund's accounting records. The accounting fee is based on the level of average net assets for each month. Under a separate contract, FSC administers the security lending program. The security lending fee is based on the number and duration of lending transactions. For the period, the fees were equivalent to an annual rate of .05%.
Interfund Trades. The Fund may purchase from or sell securities to other Fidelity Funds under procedures adopted by the Board. The procedures have been designed to ensure these interfund trades are executed in accordance with Rule 17a-7 of the 1940 Act. Interfund trades are included within the respective purchases and sales amounts shown in the Purchases and Sales of Investments note.
6. Committed Line of Credit.
The Fund participates with other funds managed by the investment adviser or an affiliate in a $4.25 billion credit facility (the "line of credit") to be utilized for temporary or emergency purposes to fund shareholder redemptions or for other short-term liquidity purposes. The Fund has agreed to pay commitment fees on its pro-rata portion of the line of credit, which amounted to $3,145 and is reflected in Miscellaneous expenses on the Statement of Operations. During the period, the Fund did not borrow on this line of credit.
7. Security Lending.
The Fund lends portfolio securities through a lending agent from time to time in order to earn additional income. For equity securities, a lending agent is used and may loan securities to certain qualified borrowers, including Fidelity Capital Markets (FCM), a broker-dealer affiliated with the Fund. On the settlement date of the loan, the Fund receives collateral (in the form of U.S. Treasury obligations, letters of credit and/or cash) against the loaned securities and maintains collateral in an amount not less than 100% of the market value of the loaned securities during the period of the loan. The market value of the loaned securities is determined at the close of business of the Fund and any additional required collateral is delivered to the Fund on the next business day. The Fund or borrower may terminate the loan at any time, and if the borrower defaults on its obligation to return the securities loaned because of insolvency or other reasons, the Fund may apply collateral received from the borrower against the obligation. The Fund may experience delays and costs in recovering the securities loaned. Any cash collateral received is invested in the Fidelity Securities Lending Cash Central Fund. The value of loaned securities and cash collateral at period end are disclosed on the Fund's Statement of Assets and Liabilities. Security lending income represents the income earned on investing cash collateral, less rebates paid to borrowers and any lending agent fees associated with the loan, plus any premium payments received for lending certain types of securities. Security lending income is presented in the Statement of Operations as a component of income from Fidelity Central Funds. Total security lending income during the period amounted to $214,540. During the period, there were no securities loaned to FCM.
8. Expense Reductions.
Commissions paid to certain brokers with whom the investment adviser, or its affiliates, places trades on behalf of the Fund include an amount in addition to trade execution, which may be rebated back to the Fund to offset certain expenses. This amount totaled $53,821 for the period.
In addition, during the period the investment adviser reimbursed and/or waived a portion of fund-level operating expenses in the amount of $12,058.
9. Distributions to Shareholders.
Distributions to shareholders of each class were as follows:
| Year ended October 31, 2018 | Year ended October 31, 2017 | |
| Distributions to shareholders | ||
| Class A | $734,732 | $– |
| Class M | 166,749 | – |
| Class C | 198,725 | – |
| Canada | 25,679,409 | – |
| Class I | 697,136 | – |
| Total | $27,476,751 | $– |
| From net investment income | ||
| Class A | $– | $406,836 |
| Class M | – | 78,661 |
| Class C | – | 39,905 |
| Canada | – | 15,352,959 |
| Class I | – | 565,020 |
| Total | $– | $16,443,381 |
| From net realized gain | ||
| Class A | $– | $168,842 |
| Class M | – | 43,752 |
| Class C | – | 71,450 |
| Canada | – | 4,723,987 |
| Class I | – | 160,945 |
| Total | $– | $5,168,976 |
10. Share Transactions.
Share transactions for each class were as follows and may contain automatic conversions between classes or exchanges between affiliated funds:
| Shares | Shares | Dollars | Dollars | |
| Year ended October 31, 2018(a) | Year ended October 31, 2017 | Year ended October 31, 2018(a) | Year ended October 31, 2017 | |
| Class A | ||||
| Shares sold | 46,971 | 63,470 | $2,500,808 | $3,161,163 |
| Reinvestment of distributions | 12,714 | 10,631 | 672,936 | 525,595 |
| Shares redeemed | (162,467) | (297,916) | (8,569,248) | (14,925,894) |
| Net increase (decrease) | (102,782) | (223,815) | $(5,395,504) | $(11,239,136) |
| Class M | ||||
| Shares sold | 8,442 | 24,195 | $442,723 | $1,198,423 |
| Reinvestment of distributions | 3,154 | 2,464 | 166,353 | 121,397 |
| Shares redeemed | (45,613) | (67,009) | (2,414,584) | (3,403,775) |
| Net increase (decrease) | (34,017) | (40,350) | $(1,805,508) | $(2,083,955) |
| Class C | ||||
| Shares sold | 9,399 | 25,680 | $481,011 | $1,254,827 |
| Reinvestment of distributions | 3,474 | 1,995 | 180,309 | 96,717 |
| Shares redeemed | (84,247) | (119,795) | (4,355,073) | (5,862,219) |
| Net increase (decrease) | (71,374) | (92,120) | $(3,693,753) | $(4,510,675) |
| Canada | ||||
| Shares sold | 711,176 | 1,830,107 | $37,797,009 | $91,494,332 |
| Reinvestment of distributions | 457,772 | 381,896 | 24,289,363 | 18,930,598 |
| Shares redeemed | (3,887,975) | (6,928,660) | (207,409,511) | (353,430,502) |
| Net increase (decrease) | (2,719,027) | (4,716,657) | $(145,323,139) | $(243,005,572) |
| Class I | ||||
| Shares sold | 160,132 | 249,628 | $8,478,569 | $12,551,193 |
| Reinvestment of distributions | 12,538 | 14,338 | 663,882 | 709,005 |
| Shares redeemed | (196,779) | (554,299) | (10,381,577) | (29,406,590) |
| Net increase (decrease) | (24,109) | (290,333) | $(1,239,126) | $(16,146,392) |
| Class Z | ||||
| Shares sold | 2,572 | – | $135,809 | $– |
| Net increase (decrease) | 2,572 | – | $135,809 | $– |
(a) Share transactions for Class Z are for the period October 2, 2018 (commencement of sale of shares) to October 31, 2018
11. Other.
The Fund's organizational documents provide former and current trustees and officers with a limited indemnification against liabilities arising in connection with the performance of their duties to the Fund. In the normal course of business, the Fund may also enter into contracts that provide general indemnifications. The Fund's maximum exposure under these arrangements is unknown as this would be dependent on future claims that may be made against the Fund. The risk of material loss from such claims is considered remote.
Fidelity® China Region Fund
Performance: The Bottom Line
Average annual total return reflects the change in the value of an investment, assuming reinvestment of distributions from dividend income and capital gains (the profits earned upon the sale of securities that have grown in value, if any) and assuming a constant rate of performance each year. The hypothetical investment and the average annual total returns do not reflect the deduction of taxes that a shareholder would pay on fund distributions or the redemption of fund shares. During periods of reimbursement by Fidelity, a fund’s total return will be greater than it would be had the reimbursement not occurred. How a fund did yesterday is no guarantee of how it will do tomorrow.
Average Annual Total Returns
| For the periods ended October 31, 2018 | Past 1 year | Past 5 years | Past 10 years |
| Fidelity® China Region Fund | (15.62)% | 3.97% | 10.84% |
$10,000 Over 10 Years
Let's say hypothetically that $10,000 was invested in Fidelity® China Region Fund, a class of the fund, on October 31, 2008.
The chart shows how the value of your investment would have changed, and also shows how the MSCI Golden Dragon Index performed over the same period.
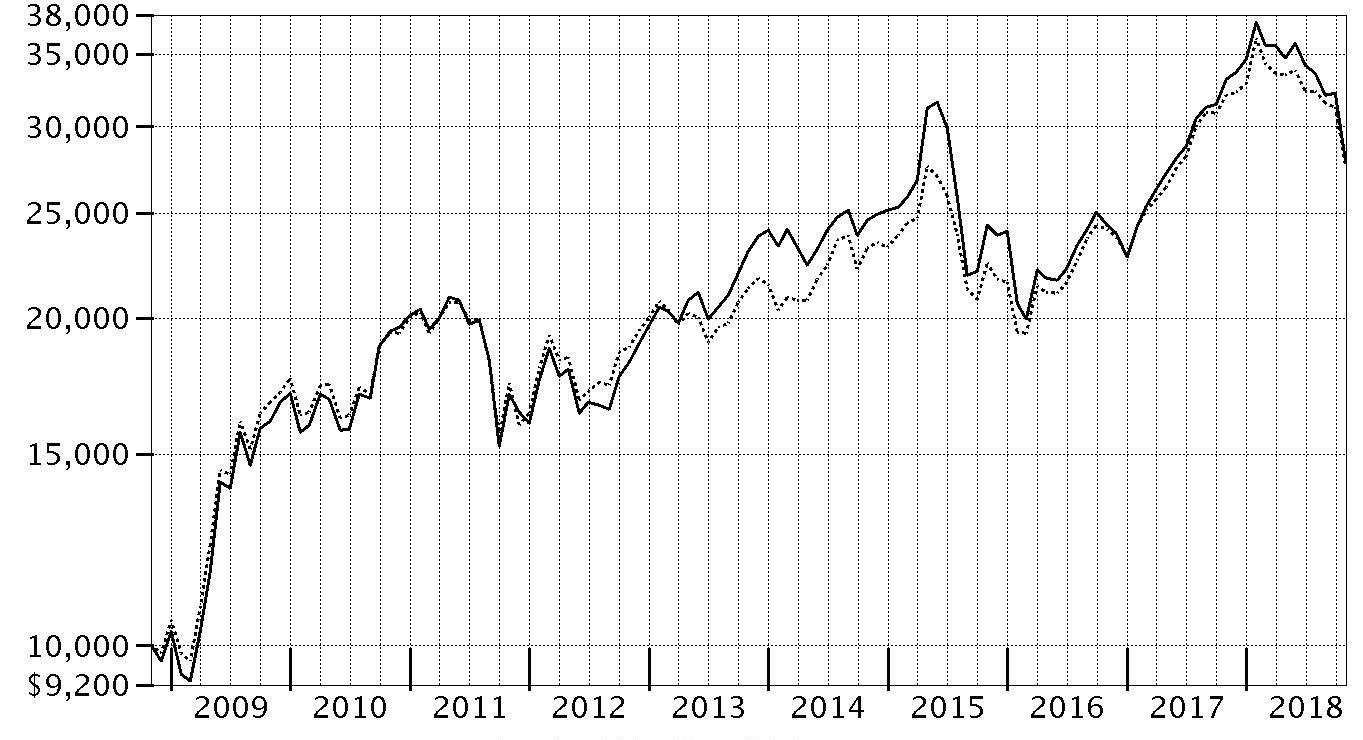
| Period Ending Values | ||
| $27,982 | Fidelity® China Region Fund | |
| $27,683 | MSCI Golden Dragon Index | |
Fidelity® China Region Fund
Management's Discussion of Fund Performance
Market Recap: International equities returned -8.08% for the 12 months ending October 31, 2018, according to the MSCI ACWI (All Country World Index) ex USA Index. A modestly positive first half of the period gave way to a confluence of overwhelmingly negative factors – including escalating trade tensions, a surging U.S. dollar, tepid economic growth in Europe, global central bank tightening, concerns about Italy’s budget stalemate with the EU, and weakness in China’s stock market. The index lost 8% in October alone, its largest monthly drop in more than six years. Among sectors, communications services (-15%) was hit the hardest, while economically sensitive consumer discretionary (-13%), information technology (-12%), financials (-10%), industrials (-9%) and materials (-7%) stocks also fared poorly. Even the more defensive real estate (-9%), utilities (-6%) and consumer staples (-5%) sectors weren’t spared this period. Conversely, elevated crude-oil prices fueled a positive return for energy (+7%), the top-performing sector, followed by the relatively stable-growing health care segment (+2%). Regionally, emerging markets (-12%) fared the worst, hampered by the impact of foreign exchange and concerns about economic weakness in China, India and South Korea. Sluggish growth also pressured shares in continental Europe (-9%). Stocks in Japan (-3%) and the U.K. (-4%) held up better, followed by Canada (-5%) and Asia-Pacific ex Japan (-6%).Comments from Co-Portfolio Managers Stephen Lieu and Ivan Xie: For the year, the fund’s share classes (excluding sales charges, if applicable) returned roughly -16%, trailing the -13.61% return of the benchmark MSCI Golden Dragon Index. Versus the benchmark, positioning in financials and information technology detracted most from fund performance. By country, our picks in China and Taiwan were responsible for most of the shortfall. The largest relative detractor was an out-of-benchmark stake in Suofeiya Home Collection, a China-based manufacturer of customized furniture that suffered from a slowdown in the nation’s property market. Other relative detractors included Geely Automobile, a stock we added this period, and Lens Technology, which makes cover glass for smartphones – both based in China. We exited the latter position by period end. Conversely, an overweighting in health care and positioning in energy lifted our relative result, as did a cash position of about 4%, on average. CSPC Pharmaceutical Group, a China-based maker of pharmaceuticals and supplements added more value than any other fund position.The views expressed above reflect those of the portfolio manager(s) only through the end of the period as stated on the cover of this report and do not necessarily represent the views of Fidelity or any other person in the Fidelity organization. Any such views are subject to change at any time based upon market or other conditions and Fidelity disclaims any responsibility to update such views. These views may not be relied on as investment advice and, because investment decisions for a Fidelity fund are based on numerous factors, may not be relied on as an indication of trading intent on behalf of any Fidelity fund.
Note to shareholders: On April 3, 2018, Stephen Lieu and Ivan Xie joined Lead Portfolio Manager Robert Bao as Co-Managers of the fund. On June 8, 2018, Bao assumed Co-Manager responsibilities through June 30, 2018, at which time he left the firm to pursue other opportunities.Fidelity® China Region Fund
Investment Summary (Unaudited)
Geographic Diversification (% of fund's net assets)
| As of October 31, 2018 | ||
| Cayman Islands | 35.9% | |
| China | 23.5% | |
| Taiwan | 14.3% | |
| Hong Kong | 13.6% | |
| United States of America* | 5.2% | |
| Bermuda | 4.0% | |
| Bailiwick of Jersey | 1.1% | |
| Korea (South) | 1.0% | |
| British Virgin Islands | 0.9% | |
| Other | 0.5% | |
* Includes Short-Term investments and Net Other Assets (Liabilities).
Percentages are based on country or territory of incorporation and are adjusted for the effect of futures contracts, if applicable.
Asset Allocation as of October 31, 2018
| % of fund's net assets | |
| Stocks | 95.5 |
| Short-Term Investments and Net Other Assets (Liabilities) | 4.5 |
Top Ten Stocks as of October 31, 2018
| % of fund's net assets | |
| Tencent Holdings Ltd. (Interactive Media & Services) | 10.3 |
| Alibaba Group Holding Ltd. sponsored ADR (Internet & Direct Marketing Retail) | 8.4 |
| Taiwan Semiconductor Manufacturing Co. Ltd. (Semiconductors & Semiconductor Equipment) | 6.2 |
| AIA Group Ltd. (Insurance) | 4.8 |
| China Construction Bank Corp. (H Shares) (Banks) | 4.3 |
| Industrial & Commercial Bank of China Ltd. (H Shares) (Banks) | 2.9 |
| CNOOC Ltd. (Oil, Gas & Consumable Fuels) | 2.3 |
| Ping An Insurance (Group) Co. of China Ltd. (H Shares) (Insurance) | 2.2 |
| China Unicom Ltd. (Diversified Telecommunication Services) | 2.1 |
| NetEase, Inc. ADR (Entertainment) | 2.0 |
| 45.5 |
Top Market Sectors as of October 31, 2018
| % of fund's net assets | |
| Financials | 21.0 |
| Consumer Discretionary | 16.5 |
| Communication Services | 16.2 |
| Information Technology | 14.4 |
| Real Estate | 5.4 |
| Industrials | 4.8 |
| Energy | 4.6 |
| Materials | 4.1 |
| Consumer Staples | 3.5 |
| Health Care | 3.0 |
Market Sectors may include more than one industry category.
The Fund may invest up to 35% of its total assets in any industry that represents more than 20% of the Hong Kong, Taiwanese and Chinese markets. As of October 31, 2018, the Fund did not have more than 25% of its total assets invested in any one industry.
Fidelity® China Region Fund
Schedule of Investments October 31, 2018
Showing Percentage of Net Assets
| Common Stocks - 95.5% | |||
| Shares | Value | ||
| COMMUNICATION SERVICES - 16.2% | |||
| Diversified Telecommunication Services - 2.8% | |||
| China Telecom Corp. Ltd. (H Shares) | 14,300,000 | $6,747,046 | |
| China Unicom Ltd. | 20,936,000 | 21,897,987 | |
| China Unicom Ltd. sponsored ADR | 65 | 678 | |
| 28,645,711 | |||
| Entertainment - 2.0% | |||
| NetEase, Inc. ADR | 100,300 | 20,847,355 | |
| Interactive Media & Services - 11.0% | |||
| 58.com, Inc. ADR (a) | 38,300 | 2,512,097 | |
| Momo, Inc. ADR (a) | 144,000 | 4,834,080 | |
| Tencent Holdings Ltd. | 3,101,100 | 106,241,403 | |
| 113,587,580 | |||
| Wireless Telecommunication Services - 0.4% | |||
| SmarTone Telecommunications Holdings Ltd. | 3,208,000 | 4,450,811 | |
| TOTAL COMMUNICATION SERVICES | 167,531,457 | ||
| CONSUMER DISCRETIONARY - 16.5% | |||
| Automobiles - 1.6% | |||
| Geely Automobile Holdings Ltd. | 8,862,000 | 16,951,141 | |
| Diversified Consumer Services - 1.3% | |||
| New Oriental Education & Technology Group, Inc. sponsored ADR | 229,800 | 13,445,598 | |
| Hotels, Restaurants & Leisure - 0.7% | |||
| Yum China Holdings, Inc. | 194,500 | 7,017,560 | |
| Household Durables - 2.1% | |||
| Gree Electric Appliances, Inc. of Zhuhai Class A (a) | 1,120,748 | 6,114,938 | |
| Midea Group Co. Ltd. Class A | 995,500 | 5,286,005 | |
| Sundart Holdings Ltd. | 15,954,000 | 9,561,882 | |
| Suofeiya Home Collection Co. Ltd. Class A | 231,121 | 596,054 | |
| 21,558,879 | |||
| Internet & Direct Marketing Retail - 9.5% | |||
| Alibaba Group Holding Ltd. sponsored ADR (a) | 610,500 | 86,861,940 | |
| Meituan Dianping Class B | 1,983,088 | 11,539,006 | |
| 98,400,946 | |||
| Specialty Retail - 0.2% | |||
| China Yongda Automobiles Services Holdings Ltd. | 3,718,000 | 1,986,549 | |
| Textiles, Apparel & Luxury Goods - 1.1% | |||
| Pinduoduo, Inc. ADR (b) | 142,638 | 2,517,561 | |
| Shenzhou International Group Holdings Ltd. | 786,000 | 8,679,933 | |
| 11,197,494 | |||
| TOTAL CONSUMER DISCRETIONARY | 170,558,167 | ||
| CONSUMER STAPLES - 3.5% | |||
| Beverages - 1.3% | |||
| Jiangsu Yanghe Brewery Joint-Stock Co. Ltd. Class A | 444,921 | 5,637,692 | |
| Kweichow Moutai Co. Ltd. (A Shares) | 100,882 | 7,938,204 | |
| 13,575,896 | |||
| Food & Staples Retailing - 0.1% | |||
| Taiwan FamilyMart Co. Ltd. | 159,000 | 1,078,471 | |
| Food Products - 1.0% | |||
| Inner Mongoli Yili Industries Co. Ltd. (A Shares) | 3,374,869 | 10,682,461 | |
| Personal Products - 1.1% | |||
| Grape King Bio Ltd. | 1,756,000 | 11,059,899 | |
| TOTAL CONSUMER STAPLES | 36,396,727 | ||
| ENERGY - 4.6% | |||
| Energy Equipment & Services - 1.8% | |||
| China Oilfield Services Ltd. (H Shares) | 17,392,000 | 16,300,946 | |
| Yantai Jereh Oilfield Services Class A | 966,517 | 2,819,611 | |
| 19,120,557 | |||
| Oil, Gas & Consumable Fuels - 2.8% | |||
| CNOOC Ltd. | 13,702,000 | 23,334,231 | |
| PetroChina Co. Ltd. (H Shares) | 7,332,000 | 5,271,882 | |
| 28,606,113 | |||
| TOTAL ENERGY | 47,726,670 | ||
| FINANCIALS - 21.0% | |||
| Banks - 10.3% | |||
| BOC Hong Kong (Holdings) Ltd. | 3,422,000 | 12,785,672 | |
| China Construction Bank Corp. (H Shares) | 55,877,000 | 44,341,034 | |
| Dah Sing Banking Group Ltd. | 1,549,600 | 2,944,298 | |
| Dah Sing Financial Holdings Ltd. | 277,200 | 1,486,398 | |
| E.SUN Financial Holdings Co. Ltd. | 21,812,109 | 14,442,539 | |
| Industrial & Commercial Bank of China Ltd. (H Shares) | 44,569,000 | 30,238,866 | |
| 106,238,807 | |||
| Capital Markets - 1.4% | |||
| China Petroleum Engineering Corp. ELS (UBS Bank Warrant Program) warrants 10/28/19 (a)(c) | 7,356,276 | 5,009,184 | |
| CITIC Securities Co. Ltd. (H Shares) | 4,092,500 | 7,201,844 | |
| Value Partners Group Ltd. | 3,137,000 | 2,328,163 | |
| 14,539,191 | |||
| Consumer Finance - 0.2% | |||
| LexinFintech Holdings Ltd. ADR | 97,100 | 949,638 | |
| PPDAI Group, Inc. ADR (a) | 188,594 | 1,076,872 | |
| 2,026,510 | |||
| Insurance - 9.1% | |||
| AIA Group Ltd. | 6,469,200 | 48,960,656 | |
| China Life Insurance Co. Ltd. (H Shares) | 3,749,000 | 7,512,240 | |
| China Pacific Insurance (Group) Co. Ltd. (H Shares) | 1,333,000 | 4,963,510 | |
| PICC Property & Casualty Co. Ltd. (H Shares) | 9,825,000 | 9,521,866 | |
| Ping An Insurance (Group) Co. of China Ltd. (H Shares) | 2,401,000 | 22,610,939 | |
| 93,569,211 | |||
| TOTAL FINANCIALS | 216,373,719 | ||
| HEALTH CARE - 3.0% | |||
| Biotechnology - 0.9% | |||
| China Biologic Products Holdings, Inc. (a)(b) | 142,200 | 9,447,768 | |
| Health Care Equipment & Supplies - 0.3% | |||
| Ginko International Co. Ltd. | 460,000 | 2,614,945 | |
| Health Care Providers & Services - 0.1% | |||
| China Resources Medical Holdin | 1,879,000 | 1,291,491 | |
| Pharmaceuticals - 1.7% | |||
| Ascletis Pharma, Inc. (a) | 3,506,000 | 2,543,900 | |
| Tonghua Dongbao Pharmaceutical Co. Ltd. Class A | 6,155,220 | 11,806,333 | |
| Yunnan Baiyao Group Co. Ltd. (d) | 286,245 | 2,881,880 | |
| 17,232,113 | |||
| TOTAL HEALTH CARE | 30,586,317 | ||
| INDUSTRIALS - 4.8% | |||
| Construction & Engineering - 1.0% | |||
| Sinopec Engineering Group Co. Ltd. (H Shares) | 11,310,500 | 10,514,419 | |
| Electrical Equipment - 0.3% | |||
| BizLink Holding, Inc. | 618,000 | 3,293,551 | |
| Industrial Conglomerates - 1.9% | |||
| CK Hutchison Holdings Ltd. | 1,903,500 | 19,163,770 | |
| Machinery - 0.6% | |||
| Cimc Enric Holdings Ltd. | 5,798,000 | 4,450,929 | |
| Zhengzhou Yutong Bus Co. Ltd. | 1,399,918 | 2,139,317 | |
| 6,590,246 | |||
| Marine - 0.5% | |||
| Pacific Basin Shipping Ltd. | 24,796,000 | 5,406,966 | |
| Professional Services - 0.2% | |||
| Sporton International, Inc. | 556,000 | 2,065,212 | |
| Transportation Infrastructure - 0.3% | |||
| Shanghai International Airport Co. Ltd. (A Shares) | 402,741 | 2,860,782 | |
| TOTAL INDUSTRIALS | 49,894,946 | ||
| INFORMATION TECHNOLOGY - 14.4% | |||
| Communications Equipment - 0.9% | |||
| Nanfang Communication Holdings Ltd. | 14,428,000 | 9,291,235 | |
| Electronic Equipment & Components - 2.2% | |||
| Chroma ATE, Inc. | 862,000 | 3,020,849 | |
| FLEXium Interconnect, Inc. | 1,800,000 | 4,517,369 | |
| Hangzhou Hikvision Digital Technology Co. Ltd. Class A | 1,656,944 | 5,748,288 | |
| Hon Hai Precision Industry Co. Ltd. (Foxconn) | 1,219,520 | 3,103,896 | |
| Largan Precision Co. Ltd. | 27,000 | 2,921,464 | |
| Sunny Optical Technology Group Co. Ltd. | 324,600 | 2,814,708 | |
| 22,126,574 | |||
| Semiconductors & Semiconductor Equipment - 10.4% | |||
| Himax Technologies, Inc. sponsored ADR | 240,562 | 1,277,384 | |
| Nanya Technology Corp. | 4,276,000 | 7,098,929 | |
| Parade Technologies Ltd. | 641,000 | 8,488,558 | |
| Phison Electronics Corp. | 740,000 | 4,851,989 | |
| Semiconductor Manufacturing International Corp. (a) | 4,142,500 | 3,421,861 | |
| Silergy Corp. | 457,000 | 5,815,733 | |
| Taiwan Semiconductor Manufacturing Co. Ltd. | 8,533,000 | 64,024,283 | |
| United Microelectronics Corp. | 18,963,000 | 7,222,366 | |
| Win Semiconductors Corp. | 1,698,000 | 5,210,187 | |
| 107,411,290 | |||
| Technology Hardware, Storage & Peripherals - 0.9% | |||
| ADLINK Technology, Inc. | 1,920,844 | 2,177,666 | |
| Ennoconn Corp. | 1,103,000 | 7,303,338 | |
| 9,481,004 | |||
| TOTAL INFORMATION TECHNOLOGY | 148,310,103 | ||
| MATERIALS - 4.1% | |||
| Chemicals - 1.7% | |||
| Formosa Plastics Corp. | 1,188,000 | 3,875,519 | |
| LG Chemical Ltd. | 36,138 | 10,990,259 | |
| Nan Ya Plastics Corp. | 1,216,000 | 3,020,313 | |
| 17,886,091 | |||
| Construction Materials - 1.3% | |||
| BBMG Corp. (H Shares) (b) | 9,772,000 | 2,691,616 | |
| West China Cement Ltd. | 76,304,000 | 11,287,070 | |
| 13,978,686 | |||
| Metals & Mining - 1.1% | |||
| Zijin Mng Group Co. Ltd. (H Shares) | 29,330,000 | 10,883,811 | |
| TOTAL MATERIALS | 42,748,588 | ||
| REAL ESTATE - 5.4% | |||
| Real Estate Management & Development - 5.4% | |||
| Cheung Kong Property Holdings Ltd. | 982,500 | 6,377,145 | |
| China Overseas Land and Investment Ltd. | 4,074,000 | 12,754,060 | |
| Hongkong Land Holdings Ltd. | 1,955,000 | 11,573,600 | |
| Longfor Properties Co. Ltd. | 4,308,500 | 10,460,898 | |
| Sino Land Ltd. | 8,938,000 | 14,019,141 | |
| 55,184,844 | |||
| UTILITIES - 2.0% | |||
| Gas Utilities - 2.0% | |||
| China Gas Holdings Ltd. | 3,081,600 | 9,745,494 | |
| China Resource Gas Group Ltd. | 2,954,000 | 11,300,761 | |
| 21,046,255 | |||
| TOTAL COMMON STOCKS | |||
| (Cost $928,790,429) | 986,357,793 | ||
| Money Market Funds - 3.9% | |||
| Fidelity Cash Central Fund, 2.23% (e) | 37,255,581 | 37,263,032 | |
| Fidelity Securities Lending Cash Central Fund 2.23% (e)(f) | 3,037,419 | 3,037,722 | |
| TOTAL MONEY MARKET FUNDS | |||
| (Cost $40,300,754) | 40,300,754 | ||
| TOTAL INVESTMENT IN SECURITIES - 99.4% | |||
| (Cost $969,091,183) | 1,026,658,547 | ||
| NET OTHER ASSETS (LIABILITIES) - 0.6% | 5,891,194 | ||
| NET ASSETS - 100% | $1,032,549,741 |
Security Type Abbreviations
ELS – Equity-Linked Security
Legend
(a) Non-income producing
(b) Security or a portion of the security is on loan at period end.
(c) Security exempt from registration under Rule 144A of the Securities Act of 1933. These securities may be resold in transactions exempt from registration, normally to qualified institutional buyers. At the end of the period, the value of these securities amounted to $5,009,184 or 0.5% of net assets.
(d) Level 3 security
(e) Affiliated fund that is generally available only to investment companies and other accounts managed by Fidelity Investments. The rate quoted is the annualized seven-day yield of the fund at period end. A complete unaudited listing of the fund's holdings as of its most recent quarter end is available upon request. In addition, each Fidelity Central Fund's financial statements, which are not covered by the Fund's Report of Independent Registered Public Accounting Firm, are available on the SEC's website or upon request.
(f) Investment made with cash collateral received from securities on loan.
Affiliated Central Funds
Information regarding fiscal year to date income earned by the Fund from investments in Fidelity Central Funds is as follows:
| Fund | Income earned |
| Fidelity Cash Central Fund | $832,298 |
| Fidelity Securities Lending Cash Central Fund | 181,809 |
| Total | $1,014,107 |
Amounts in the income column in the above table include any capital gain distributions from underlying funds, which are presented in the corresponding line-item in the Statement of Operations if applicable.
Investment Valuation
The following is a summary of the inputs used, as of October 31, 2018, involving the Fund's assets and liabilities carried at fair value. The inputs or methodology used for valuing securities may not be an indication of the risk associated with investing in those securities. For more information on valuation inputs, and their aggregation into the levels used below, please refer to the Investment Valuation section in the accompanying Notes to Financial Statements.
| Valuation Inputs at Reporting Date: | ||||
| Description | Total | Level 1 | Level 2 | Level 3 |
| Investments in Securities: | ||||
| Equities: | ||||
| Communication Services | $167,531,457 | $39,392,067 | $128,139,390 | $-- |
| Consumer Discretionary | 170,558,167 | 159,019,161 | 11,539,006 | -- |
| Consumer Staples | 36,396,727 | 36,396,727 | -- | -- |
| Energy | 47,726,670 | 19,120,557 | 28,606,113 | -- |
| Financials | 216,373,719 | 129,272,395 | 87,101,324 | -- |
| Health Care | 30,586,317 | 27,704,437 | -- | 2,881,880 |
| Industrials | 49,894,946 | 49,894,946 | -- | -- |
| Information Technology | 148,310,103 | 73,641,593 | 74,668,510 | -- |
| Materials | 42,748,588 | 42,748,588 | -- | -- |
| Real Estate | 55,184,844 | 55,184,844 | -- | -- |
| Utilities | 21,046,255 | 21,046,255 | -- | -- |
| Money Market Funds | 40,300,754 | 40,300,754 | -- | -- |
| Total Investments in Securities: | $1,026,658,547 | $693,722,324 | $330,054,343 | $2,881,880 |
The following is a summary of transfers between Level 1 and Level 2 for the period ended October 31, 2018. Transfers are assumed to have occurred at the beginning of the period, and are primarily attributable to the valuation techniques used for foreign equity securities, as discussed in the accompanying Notes to Financial Statements:
| Transfers | Total |
| Level 1 to Level 2 | $53,713,026 |
| Level 2 to Level 1 | $0 |
The following are reconciliations of Investments in Securities for which Level 3 inputs were used in determining value:
| Consumer Discretionary: | |
| Beginning Balance | $11,083,598 |
| Net Realized Gain (Loss) on Investment Securities | -- |
| Net Unrealized Gain (Loss) on Investment Securities | (4,815,354) |
| Cost of Purchases | -- |
| Proceeds of Sales | (6,268,244) |
| Amortization/Accretion | -- |
| Transfers into Level 3 | -- |
| Transfers out of Level 3 | -- |
| Ending Balance | $-- |
| The change in unrealized gain (loss) for the period attributable to Level 3 securities held at October 31, 2018 | $-- |
| Other Investments in Securities: | |
| Beginning Balance | $-- |
| Net Realized Gain (Loss) on Investment Securities | 2,190,445 |
| Net Unrealized Gain (Loss) on Investment Securities | (2,976,464) |
| Cost of Purchases | 2,956,846 |
| Proceeds of Sales | (8,128,190) |
| Amortization/Accretion | -- |
| Transfers into Level 3 | 8,839,243 |
| Transfers out of Level 3 | -- |
| Ending Balance | $2,881,880 |
| The change in unrealized gain (loss) for the period attributable to Level 3 securities held at October 31, 2018 | $(2,976,465) |
The information used in the above reconciliations represent fiscal year to date activity for any Investments in Securities identified as using Level 3 inputs at either the beginning or the end of the current fiscal period. Transfers in or out of Level 3 represent the beginning value of any Security or Instrument where a change in the pricing level occurred from the beginning to the end of the period. The cost of purchases and the proceeds of sales may include securities received or delivered through corporate actions or exchanges. Realized and unrealized gains (losses) disclosed in the reconciliations are included in Net Gain (Loss) on the Fund's Statement of Operations.
See accompanying notes which are an integral part of the financial statements.
Fidelity® China Region Fund
Financial Statements
Statement of Assets and Liabilities
| October 31, 2018 | ||
| Assets | ||
| Investment in securities, at value (including securities loaned of $2,982,644) — See accompanying schedule: Unaffiliated issuers (cost $928,790,429) | $986,357,793 | |
| Fidelity Central Funds (cost $40,300,754) | 40,300,754 | |
| Total Investment in Securities (cost $969,091,183) | $1,026,658,547 | |
| Foreign currency held at value (cost $10,025) | 10,030 | |
| Receivable for investments sold | 9,556,495 | |
| Receivable for fund shares sold | 510,423 | |
| Dividends receivable | 581,142 | |
| Distributions receivable from Fidelity Central Funds | 65,909 | |
| Prepaid expenses | 2,812 | |
| Other receivables | 248,562 | |
| Total assets | 1,037,633,920 | |
| Liabilities | ||
| Payable for investments purchased | $263,111 | |
| Payable for fund shares redeemed | 641,491 | |
| Accrued management fee | 623,821 | |
| Distribution and service plan fees payable | 17,704 | |
| Other affiliated payables | 228,018 | |
| Other payables and accrued expenses | 272,149 | |
| Collateral on securities loaned | 3,037,885 | |
| Total liabilities | 5,084,179 | |
| Net Assets | $1,032,549,741 | |
| Net Assets consist of: | ||
| Paid in capital | $1,012,934,286 | |
| Total distributable earnings (loss) | 19,615,455 | |
| Net Assets | $1,032,549,741 | |
| Net Asset Value and Maximum Offering Price | ||
| Class A: | ||
| Net Asset Value and redemption price per share ($23,423,957 ÷ 815,415 shares) | $28.73 | |
| Maximum offering price per share (100/94.25 of $28.73) | $30.48 | |
| Class M: | ||
| Net Asset Value and redemption price per share ($8,131,547 ÷ 284,850 shares) | $28.55 | |
| Maximum offering price per share (100/96.50 of $28.55) | $29.59 | |
| Class C: | ||
| Net Asset Value and offering price per share ($10,138,026 ÷ 363,375 shares)(a) | $27.90 | |
| China Region: | ||
| Net Asset Value, offering price and redemption price per share ($969,679,165 ÷ 33,308,224 shares) | $29.11 | |
| Class I: | ||
| Net Asset Value, offering price and redemption price per share ($20,853,800 ÷ 721,533 shares) | $28.90 | |
| Class Z: | ||
| Net Asset Value, offering price and redemption price per share ($323,246 ÷ 11,182 shares) | $28.91 |
(a) Redemption price per share is equal to net asset value less any applicable contingent deferred sales charge.
See accompanying notes which are an integral part of the financial statements.
Statement of Operations
| Year ended October 31, 2018 | ||
| Investment Income | ||
| Dividends | $25,434,201 | |
| Income from Fidelity Central Funds | 1,014,107 | |
| Income before foreign taxes withheld | 26,448,308 | |
| Less foreign taxes withheld | (2,663,955) | |
| Total income | 23,784,353 | |
| Expenses | ||
| Management fee | $9,871,085 | |
| Transfer agent fees | 2,555,372 | |
| Distribution and service plan fees | 280,341 | |
| Accounting and security lending fees | 646,400 | |
| Custodian fees and expenses | 442,271 | |
| Independent trustees' fees and expenses | 7,222 | |
| Registration fees | 124,049 | |
| Audit | 85,132 | |
| Legal | 3,697 | |
| Interest | 4,514 | |
| Miscellaneous | 9,469 | |
| Total expenses before reductions | 14,029,552 | |
| Expense reductions | (473,186) | |
| Total expenses after reductions | 13,556,366 | |
| Net investment income (loss) | 10,227,987 | |
| Realized and Unrealized Gain (Loss) | ||
| Net realized gain (loss) on: | ||
| Investment securities: | ||
| Unaffiliated issuers | 94,518,556 | |
| Fidelity Central Funds | (856) | |
| Foreign currency transactions | (502,302) | |
| Total net realized gain (loss) | 94,015,398 | |
| Change in net unrealized appreciation (depreciation) on: | ||
| Investment securities: | ||
| Unaffiliated issuers | (301,943,119) | |
| Fidelity Central Funds | (365) | |
| Assets and liabilities in foreign currencies | (3,121) | |
| Total change in net unrealized appreciation (depreciation) | (301,946,605) | |
| Net gain (loss) | (207,931,207) | |
| Net increase (decrease) in net assets resulting from operations | $(197,703,220) |
See accompanying notes which are an integral part of the financial statements.
Statement of Changes in Net Assets
| Year ended October 31, 2018 | Year ended October 31, 2017 | |
| Increase (Decrease) in Net Assets | ||
| Operations | ||
| Net investment income (loss) | $10,227,987 | $6,291,196 |
| Net realized gain (loss) | 94,015,398 | 78,315,721 |
| Change in net unrealized appreciation (depreciation) | (301,946,605) | 266,749,225 |
| Net increase (decrease) in net assets resulting from operations | (197,703,220) | 351,356,142 |
| Distributions to shareholders | (5,632,793) | – |
| Distributions to shareholders from net investment income | – | (10,635,865) |
| Distributions to shareholders from net realized gain | – | (1,988,966) |
| Total distributions | (5,632,793) | (12,624,831) |
| Share transactions - net increase (decrease) | (145,112,080) | (22,198,615) |
| Redemption fees | 88,494 | 258,175 |
| Total increase (decrease) in net assets | (348,359,599) | 316,790,871 |
| Net Assets | ||
| Beginning of period | 1,380,909,340 | 1,064,118,469 |
| End of period | $1,032,549,741 | $1,380,909,340 |
| Other Information | ||
| Undistributed net investment income end of period | $5,536,153 |
See accompanying notes which are an integral part of the financial statements.
Financial Highlights
Fidelity China Region Fund Class A
| Years ended October 31, | 2018 | 2017 | 2016 | 2015 | 2014 |
| Selected Per–Share Data | |||||
| Net asset value, beginning of period | $34.22 | $25.46 | $29.34 | $34.18 | $35.56 |
| Income from Investment Operations | |||||
| Net investment income (loss)A | .15 | .08 | .18 | .40B | .21 |
| Net realized and unrealized gain (loss) | (5.56) | 8.90 | (.20) | (.83) | 2.01C |
| Total from investment operations | (5.41) | 8.98 | (.02) | (.43) | 2.22 |
| Distributions from net investment income | (.08) | (.18) | (.27) | (.22) | (.30) |
| Distributions from net realized gain | – | (.05) | (3.59) | (4.24) | (3.31) |
| Total distributions | (.08) | (.23) | (3.86) | (4.46) | (3.61) |
| Redemption fees added to paid in capitalA | –D | .01 | –D | .05 | .01 |
| Net asset value, end of period | $28.73 | $34.22 | $25.46 | $29.34 | $34.18 |
| Total ReturnE,F | (15.86)% | 35.67% | (.13)% | (1.45)% | 6.45%C |
| Ratios to Average Net AssetsG,H | |||||
| Expenses before reductions | 1.27% | 1.30% | 1.33% | 1.28% | 1.35% |
| Expenses net of fee waivers, if any | 1.27% | 1.30% | 1.33% | 1.28% | 1.35% |
| Expenses net of all reductions | 1.24% | 1.29% | 1.32% | 1.26% | 1.35% |
| Net investment income (loss) | .43% | .28% | .75% | 1.26%B | .64% |
| Supplemental Data | |||||
| Net assets, end of period (000 omitted) | $23,424 | $35,539 | $22,937 | $32,761 | $21,728 |
| Portfolio turnover rateI | 60% | 68% | 70% | 151% | 87% |
A Calculated based on average shares outstanding during the period.
B Net investment income per share reflects large, non-recurring dividend which amounted to $.13 per share. Excluding this non-recurring dividend, the ratio of net investment income (loss) to average net assets would have been .85%.
C Amount includes a reimbursement from the investment adviser for an operational error which amounted to less than $.01 per share. Excluding this reimbursement, the total return would have been 6.42%.
D Amount represents less than $.005 per share.
E Total returns would have been lower if certain expenses had not been reduced during the applicable periods shown.
F Total returns do not include the effect of the sales charges.
G Fees and expenses of any underlying Fidelity Central Funds are not included in the Fund's expense ratio. The Fund indirectly bears its proportionate share of the expenses of any underlying Fidelity Central Funds.
H Expense ratios reflect operating expenses of the class. Expenses before reductions do not reflect amounts reimbursed by the investment adviser or reductions from brokerage service arrangements or reductions from other expense offset arrangements and do not represent the amount paid by the class during periods when reimbursements or reductions occur. Expenses net of fee waivers reflect expenses after reimbursement by the investment adviser but prior to reductions from brokerage service arrangements or other expense offset arrangements. Expenses net of all reductions represent the net expenses paid by the class.
I Amount does not include the portfolio activity of any underlying Fidelity Central Funds.
See accompanying notes which are an integral part of the financial statements.
Fidelity China Region Fund Class M
| Years ended October 31, | 2018 | 2017 | 2016 | 2015 | 2014 |
| Selected Per–Share Data | |||||
| Net asset value, beginning of period | $34.05 | $25.34 | $29.18 | $34.02 | $35.40 |
| Income from Investment Operations | |||||
| Net investment income (loss)A | .03 | (.02) | .10 | .30B | .12 |
| Net realized and unrealized gain (loss) | (5.53) | 8.88 | (.22) | (.83) | 1.99C |
| Total from investment operations | (5.50) | 8.86 | (.12) | (.53) | 2.11 |
| Distributions from net investment income | – | (.11) | (.13) | (.12) | (.19) |
| Distributions from net realized gain | – | (.05) | (3.59) | (4.24) | (3.31) |
| Total distributions | – | (.16) | (3.72) | (4.36) | (3.50) |
| Redemption fees added to paid in capitalA | –D | .01 | –D | .05 | .01 |
| Net asset value, end of period | $28.55 | $34.05 | $25.34 | $29.18 | $34.02 |
| Total ReturnE,F | (16.15)% | 35.25% | (.50)% | (1.79)% | 6.15%C |
| Ratios to Average Net AssetsG,H | |||||
| Expenses before reductions | 1.62% | 1.65% | 1.67% | 1.62% | 1.65% |
| Expenses net of fee waivers, if any | 1.62% | 1.65% | 1.67% | 1.62% | 1.65% |
| Expenses net of all reductions | 1.58% | 1.64% | 1.67% | 1.60% | 1.65% |
| Net investment income (loss) | .08% | (.07)% | .40% | .92%B | .35% |
| Supplemental Data | |||||
| Net assets, end of period (000 omitted) | $8,132 | $9,763 | $5,644 | $6,409 | $6,305 |
| Portfolio turnover rateI | 60% | 68% | 70% | 151% | 87% |
A Calculated based on average shares outstanding during the period.
B Net investment income per share reflects large, non-recurring dividend which amounted to $.13 per share. Excluding this non-recurring dividend, the ratio of net investment income (loss) to average net assets would have been .51%.
C Amount includes a reimbursement from the investment adviser for an operational error which amounted to less than $.01 per share. Excluding this reimbursement, the total return would have been 6.12%.
D Amount represents less than $.005 per share.
E Total returns would have been lower if certain expenses had not been reduced during the applicable periods shown.
F Total returns do not include the effect of the sales charges.
G Fees and expenses of any underlying Fidelity Central Funds are not included in the Fund's expense ratio. The Fund indirectly bears its proportionate share of the expenses of any underlying Fidelity Central Funds.
H Expense ratios reflect operating expenses of the class. Expenses before reductions do not reflect amounts reimbursed by the investment adviser or reductions from brokerage service arrangements or reductions from other expense offset arrangements and do not represent the amount paid by the class during periods when reimbursements or reductions occur. Expenses net of fee waivers reflect expenses after reimbursement by the investment adviser but prior to reductions from brokerage service arrangements or other expense offset arrangements. Expenses net of all reductions represent the net expenses paid by the class.
I Amount does not include the portfolio activity of any underlying Fidelity Central Funds.
See accompanying notes which are an integral part of the financial statements.
Fidelity China Region Fund Class C
| Years ended October 31, | 2018 | 2017 | 2016 | 2015 | 2014 |
| Selected Per–Share Data | |||||
| Net asset value, beginning of period | $33.41 | $24.82 | $28.68 | $33.56 | $34.99 |
| Income from Investment Operations | |||||
| Net investment income (loss)A | (.11) | (.13) | –B | .15C | (.02) |
| Net realized and unrealized gain (loss) | (5.40) | 8.73 | (.21) | (.80) | 1.97D |
| Total from investment operations | (5.51) | 8.60 | (.21) | (.65) | 1.95 |
| Distributions from net investment income | – | – | (.06) | (.04) | (.08) |
| Distributions from net realized gain | – | (.02) | (3.59) | (4.24) | (3.31) |
| Total distributions | – | (.02) | (3.65) | (4.28) | (3.39) |
| Redemption fees added to paid in capitalA | –B | .01 | –B | .05 | .01 |
| Net asset value, end of period | $27.90 | $33.41 | $24.82 | $28.68 | $33.56 |
| Total ReturnE,F | (16.49)% | 34.71% | (.88)% | (2.21)% | 5.71%D |
| Ratios to Average Net AssetsG,H | |||||
| Expenses before reductions | 2.01% | 2.05% | 2.07% | 2.05% | 2.07% |
| Expenses net of fee waivers, if any | 2.01% | 2.05% | 2.07% | 2.05% | 2.07% |
| Expenses net of all reductions | 1.98% | 2.03% | 2.06% | 2.02% | 2.07% |
| Net investment income (loss) | (.31)% | (.46)% | .01% | .49%C | (.07)% |
| Supplemental Data | |||||
| Net assets, end of period (000 omitted) | $10,138 | $12,952 | $11,218 | $14,355 | $10,445 |
| Portfolio turnover rateI | 60% | 68% | 70% | 151% | 87% |
A Calculated based on average shares outstanding during the period.
B Amount represents less than $.005 per share.
C Net investment income per share reflects large, non-recurring dividend which amounted to $.13 per share. Excluding this non-recurring dividend, the ratio of net investment income (loss) to average net assets would have been .09%.
D Amount includes a reimbursement from the investment adviser for an operational error which amounted to less than $.01 per share. Excluding this reimbursement, the total return would have been 5.68%.
E Total returns would have been lower if certain expenses had not been reduced during the applicable periods shown.
F Total returns do not include the effect of the contingent deferred sales charge.
G Fees and expenses of any underlying Fidelity Central Funds are not included in the Fund's expense ratio. The Fund indirectly bears its proportionate share of the expenses of any underlying Fidelity Central Funds.
H Expense ratios reflect operating expenses of the class. Expenses before reductions do not reflect amounts reimbursed by the investment adviser or reductions from brokerage service arrangements or reductions from other expense offset arrangements and do not represent the amount paid by the class during periods when reimbursements or reductions occur. Expenses net of fee waivers reflect expenses after reimbursement by the investment adviser but prior to reductions from brokerage service arrangements or other expense offset arrangements. Expenses net of all reductions represent the net expenses paid by the class.
I Amount does not include the portfolio activity of any underlying Fidelity Central Funds.
See accompanying notes which are an integral part of the financial statements.
Fidelity China Region Fund
| Years ended October 31, | 2018 | 2017 | 2016 | 2015 | 2014 |
| Selected Per–Share Data | |||||
| Net asset value, beginning of period | $34.64 | $25.78 | $29.66 | $34.51 | $35.83 |
| Income from Investment Operations | |||||
| Net investment income (loss)A | .26 | .17 | .26 | .51B | .33 |
| Net realized and unrealized gain (loss) | (5.65) | 9.00 | (.21) | (.84) | 2.03C |
| Total from investment operations | (5.39) | 9.17 | .05 | (.33) | 2.36 |
| Distributions from net investment income | (.14) | (.27) | (.35) | (.33) | (.38) |
| Distributions from net realized gain | – | (.05) | (3.59) | (4.24) | (3.31) |
| Total distributions | (.14) | (.32) | (3.93)D | (4.57) | (3.69) |
| Redemption fees added to paid in capitalA | –E | .01 | –E | .05 | .01 |
| Net asset value, end of period | $29.11 | $34.64 | $25.78 | $29.66 | $34.51 |
| Total ReturnF | (15.62)% | 36.10% | .15% | (1.14)% | 6.83%C |
| Ratios to Average Net AssetsG,H | |||||
| Expenses before reductions | .96% | 1.00% | 1.02% | .99% | 1.01% |
| Expenses net of fee waivers, if any | .96% | 1.00% | 1.02% | .98% | 1.01% |
| Expenses net of all reductions | .93% | .99% | 1.01% | .96% | 1.01% |
| Net investment income (loss) | .74% | .58% | 1.06% | 1.55%B | .99% |
| Supplemental Data | |||||
| Net assets, end of period (000 omitted) | $969,679 | $1,294,775 | $1,004,985 | $1,262,274 | $1,352,761 |
| Portfolio turnover rateI | 60% | 68% | 70% | 151% | 87% |
A Calculated based on average shares outstanding during the period.
B Net investment income per share reflects large, non-recurring dividend which amounted to $.13 per share. Excluding this non-recurring dividend, the ratio of net investment income (loss) to average net assets would have been 1.15%.
C Amount includes a reimbursement from the investment adviser for an operational error which amounted to less than $.01 per share. Excluding this reimbursement, the total return would have been 6.80%.
D Total distributions of $3.93 per share is comprised of distributions from net investment income of $.345 and distributions from net realized gain of $3.588 per share.
E Amount represents less than $.005 per share.
F Total returns would have been lower if certain expenses had not been reduced during the applicable periods shown.
G Fees and expenses of any underlying Fidelity Central Funds are not included in the Fund's expense ratio. The Fund indirectly bears its proportionate share of the expenses of any underlying Fidelity Central Funds.
H Expense ratios reflect operating expenses of the class. Expenses before reductions do not reflect amounts reimbursed by the investment adviser or reductions from brokerage service arrangements or reductions from other expense offset arrangements and do not represent the amount paid by the class during periods when reimbursements or reductions occur. Expenses net of fee waivers reflect expenses after reimbursement by the investment adviser but prior to reductions from brokerage service arrangements or other expense offset arrangements. Expenses net of all reductions represent the net expenses paid by the class.
I Amount does not include the portfolio activity of any underlying Fidelity Central Funds.
See accompanying notes which are an integral part of the financial statements.
Fidelity China Region Fund Class I
| Years ended October 31, | 2018 | 2017 | 2016 | 2015 | 2014 |
| Selected Per–Share Data | |||||
| Net asset value, beginning of period | $34.41 | $25.62 | $29.51 | $34.39 | $35.75 |
| Income from Investment Operations | |||||
| Net investment income (loss)A | .26 | .16 | .26 | .51B | .34 |
| Net realized and unrealized gain (loss) | (5.61) | 8.95 | (.20) | (.84) | 2.02C |
| Total from investment operations | (5.35) | 9.11 | .06 | (.33) | 2.36 |
| Distributions from net investment income | (.16) | (.28) | (.36) | (.36) | (.43) |
| Distributions from net realized gain | – | (.05) | (3.59) | (4.24) | (3.31) |
| Total distributions | (.16) | (.33) | (3.95) | (4.60) | (3.73)D |
| Redemption fees added to paid in capitalA | –E | .01 | –E | .05 | .01 |
| Net asset value, end of period | $28.90 | $34.41 | $25.62 | $29.51 | $34.39 |
| Total ReturnF | (15.63)% | 36.11% | .16% | (1.14)% | 6.87%C |
| Ratios to Average Net AssetsG,H | |||||
| Expenses before reductions | .98% | 1.01% | 1.00% | .97% | .98% |
| Expenses net of fee waivers, if any | .98% | 1.01% | 1.00% | .97% | .98% |
| Expenses net of all reductions | .95% | .99% | .99% | .95% | .98% |
| Net investment income (loss) | .72% | .57% | 1.07% | 1.57%B | 1.01% |
| Supplemental Data | |||||
| Net assets, end of period (000 omitted) | $20,854 | $27,880 | $19,334 | $26,961 | $19,404 |
| Portfolio turnover rateI | 60% | 68% | 70% | 151% | 87% |
A Calculated based on average shares outstanding during the period.
B Net investment income per share reflects large, non-recurring dividend which amounted to $.13 per share. Excluding this non-recurring dividend, the ratio of net investment income (loss) to average net assets would have been 1.16%.
C Amount includes a reimbursement from the investment adviser for an operational error which amounted to less than $.01 per share. Excluding this reimbursement, the total return would have been 6.84%.
D Total distributions of $3.73 per share is comprised of distributions from net investment income of $.425 and distributions from net realized gain of $3.306 per share.
E Amount represents less than $.005 per share.
F Total returns would have been lower if certain expenses had not been reduced during the applicable periods shown.
G Fees and expenses of any underlying Fidelity Central Funds are not included in the Fund's expense ratio. The Fund indirectly bears its proportionate share of the expenses of any underlying Fidelity Central Funds.
H Expense ratios reflect operating expenses of the class. Expenses before reductions do not reflect amounts reimbursed by the investment adviser or reductions from brokerage service arrangements or reductions from other expense offset arrangements and do not represent the amount paid by the class during periods when reimbursements or reductions occur. Expenses net of fee waivers reflect expenses after reimbursement by the investment adviser but prior to reductions from brokerage service arrangements or other expense offset arrangements. Expenses net of all reductions represent the net expenses paid by the class.
I Amount does not include the portfolio activity of any underlying Fidelity Central Funds.
See accompanying notes which are an integral part of the financial statements.
Fidelity China Region Fund Class Z
| Year ended October 31, | 2018 A |
| Selected Per–Share Data | |
| Net asset value, beginning of period | $32.63 |
| Income from Investment Operations | |
| Net investment income (loss)B | .01 |
| Net realized and unrealized gain (loss) | (3.73) |
| Total from investment operations | (3.72) |
| Net asset value, end of period | $28.91 |
| Total ReturnC,D | (11.40)% |
| Ratios to Average Net AssetsE,F | |
| Expenses before reductions | .91%G |
| Expenses net of fee waivers, if any | .90%G |
| Expenses net of all reductions | .87%G |
| Net investment income (loss) | .57%G |
| Supplemental Data | |
| Net assets, end of period (000 omitted) | $323 |
| Portfolio turnover rateH | 60% |
A For the period October 2, 2018 (commencement of sale of shares) to October 31, 2018.
B Calculated based on average shares outstanding during the period.
C Total returns for periods of less than one year are not annualized.
D Total returns would have been lower if certain expenses had not been reduced during the applicable periods shown.
E Fees and expenses of any underlying Fidelity Central Funds are not included in the Fund's expense ratio. The Fund indirectly bears its proportionate share of the expenses of any underlying Fidelity Central Funds.
F Expense ratios reflect operating expenses of the class. Expenses before reductions do not reflect amounts reimbursed by the investment adviser or reductions from brokerage service arrangements or reductions from other expense offset arrangements and do not represent the amount paid by the class during periods when reimbursements or reductions occur. Expense ratios before reductions for start-up periods may not be representative of longer-term operating periods. Expenses net of fee waivers reflect expenses after reimbursement by the investment adviser but prior to reductions from brokerage service arrangements or other expense offset arrangements. Expenses net of all reductions represent the net expenses paid by the class.
G Annualized
H Amount does not include the portfolio activity of any underlying Fidelity Central Funds.
See accompanying notes which are an integral part of the financial statements.
Notes to Financial Statements
For the period ended October 31, 2018
1. Organization.
Fidelity China Region Fund (the Fund) is a fund of Fidelity Investment Trust (the Trust) and is authorized to issue an unlimited number of shares. The Trust is registered under the Investment Company Act of 1940, as amended (the 1940 Act), as an open-end management investment company organized as a Massachusetts business trust. The Fund commenced sale of Class Z shares on October 2, 2018. The Fund offers Class A, Class M, Class C, China Region, Class I and Class Z shares, each of which has equal rights as to assets and voting privileges. Each class has exclusive voting rights with respect to matters that affect that class. The Fund's investments in emerging markets can be subject to social, economic, regulatory, and political uncertainties and can be extremely volatile.
2. Investments in Fidelity Central Funds.
The Fund invests in Fidelity Central Funds, which are open-end investment companies generally available only to other investment companies and accounts managed by the investment adviser and its affiliates. The Fund's Schedule of Investments lists each of the Fidelity Central Funds held as of period end, if any, as an investment of the Fund, but does not include the underlying holdings of each Fidelity Central Fund. As an Investing Fund, the Fund indirectly bears its proportionate share of the expenses of the underlying Fidelity Central Funds.
The Money Market Central Funds seek preservation of capital and current income and are managed by Fidelity Investments Money Management, Inc. (FIMM), an affiliate of the investment adviser. Annualized expenses of the Money Market Central Funds as of their most recent shareholder report date are less than .005%.
A complete unaudited list of holdings for each Fidelity Central Fund is available upon request or at the Securities and Exchange Commission (the SEC) website at www.sec.gov. In addition, the financial statements of the Fidelity Central Funds, which are not covered by the Fund's Report of Independent Registered Public Accounting Firm, are available on the SEC website or upon request.
3. Significant Accounting Policies.
The Fund is an investment company and applies the accounting and reporting guidance of the Financial Accounting Standards Board (FASB) Accounting Standards Codification Topic 946 Financial Services – Investments Companies. The financial statements have been prepared in conformity with accounting principles generally accepted in the United States of America (GAAP), which require management to make certain estimates and assumptions at the date of the financial statements. Actual results could differ from those estimates. Subsequent events, if any, through the date that the financial statements were issued have been evaluated in the preparation of the financial statements. The following summarizes the significant accounting policies of the Fund:
Investment Valuation. Investments are valued as of 4:00 p.m. Eastern time on the last calendar day of the period. The Board of Trustees (the Board) has delegated the day to day responsibility for the valuation of the Fund's investments to the Fair Value Committee (the Committee) established by the Fund's investment adviser. In accordance with valuation policies and procedures approved by the Board, the Fund attempts to obtain prices from one or more third party pricing vendors or brokers to value its investments. When current market prices, quotations or currency exchange rates are not readily available or reliable, investments will be fair valued in good faith by the Committee, in accordance with procedures adopted by the Board. Factors used in determining fair value vary by investment type and may include market or investment specific events. The frequency with which these procedures are used cannot be predicted and they may be utilized to a significant extent. The Committee oversees the Fund's valuation policies and procedures and reports to the Board on the Committee's activities and fair value determinations. The Board monitors the appropriateness of the procedures used in valuing the Fund's investments and ratifies the fair value determinations of the Committee.
The Fund categorizes the inputs to valuation techniques used to value its investments into a disclosure hierarchy consisting of three levels as shown below:
- Level 1 – quoted prices in active markets for identical investments
- Level 2 – other significant observable inputs (including quoted prices for similar investments, interest rates, prepayment speeds, etc.)
- Level 3 – unobservable inputs (including the Fund's own assumptions based on the best information available)
Valuation techniques used to value the Fund's investments by major category are as follows:
Equity securities, including restricted securities, for which market quotations are readily available, are valued at the last reported sale price or official closing price as reported by a third party pricing vendor on the primary market or exchange on which they are traded and are categorized as Level 1 in the hierarchy. In the event there were no sales during the day or closing prices are not available, securities are valued at the last quoted bid price or may be valued using the last available price and are generally categorized as Level 2 in the hierarchy. For foreign equity securities, when market or security specific events arise, comparisons to the valuation of American Depositary Receipts (ADRs), futures contracts, Exchange-Traded Funds (ETFs) and certain indexes as well as quoted prices for similar securities may be used and would be categorized as Level 2 in the hierarchy. Utilizing these techniques may result in transfers between Level 1 and Level 2. For equity securities, including restricted securities, where observable inputs are limited, assumptions about market activity and risk are used and these securities may be categorized as Level 3 in the hierarchy.
Investments in open-end mutual funds, including the Fidelity Central Funds, are valued at their closing net asset value (NAV) each business day and are categorized as Level 1 in the hierarchy.
Changes in valuation techniques may result in transfers in or out of an assigned level within the disclosure hierarchy. The aggregate value of investments by input level as of October 31, 2018, including information on transfers between Levels 1 and 2, as well as a roll forward of Level 3 investments, is included at the end of the Fund's Schedule of Investments.
Foreign Currency. The Fund may use foreign currency contracts to facilitate transactions in foreign-denominated securities. Gains and losses from these transactions may arise from changes in the value of the foreign currency or if the counterparties do not perform under the contracts' terms.
Foreign-denominated assets, including investment securities, and liabilities are translated into U.S. dollars at the exchange rates at period end. Purchases and sales of investment securities, income and dividends received and expenses denominated in foreign currencies are translated into U.S. dollars at the exchange rate in effect on the transaction date.
The effects of exchange rate fluctuations on investments are included with the net realized and unrealized gain (loss) on investment securities. Other foreign currency transactions resulting in realized and unrealized gain (loss) are disclosed separately.
Investment Transactions and Income. For financial reporting purposes, the Fund's investment holdings and NAV include trades executed through the end of the last business day of the period. The NAV per share for processing shareholder transactions is calculated as of the close of business of the New York Stock Exchange (NYSE), normally 4:00 p.m. Eastern time and includes trades executed through the end of the prior business day. Gains and losses on securities sold are determined on the basis of identified cost. Dividend income is recorded on the ex-dividend date, except for certain dividends from foreign securities where the ex-dividend date may have passed, which are recorded as soon as the Fund is informed of the ex-dividend date. Non-cash dividends included in dividend income, if any, are recorded at the fair market value of the securities received. Income and capital gain distributions from Fidelity Central Funds, if any, are recorded on the ex-dividend date. Investment income is recorded net of foreign taxes withheld where recovery of such taxes is uncertain.
Class Allocations and Expenses. Investment income, realized and unrealized capital gains and losses, common expenses of the Fund, and certain fund-level expense reductions, if any, are allocated daily on a pro-rata basis to each class based on the relative net assets of each class to the total net assets of the Fund. Each class differs with respect to transfer agent and distribution and service plan fees incurred. Certain expense reductions may also differ by class. For the reporting period, the allocated portion of income and expenses to each class as a percent of its average net assets may vary due to the timing of recording these transactions in relation to fluctuating net assets of the classes. Expenses directly attributable to a fund are charged to that fund. Expenses attributable to more than one fund are allocated among the respective funds on the basis of relative net assets or other appropriate methods. Expense estimates are accrued in the period to which they relate and adjustments are made when actual amounts are known.
Income Tax Information and Distributions to Shareholders. Each year, the Fund intends to qualify as a regulated investment company under Subchapter M of the Internal Revenue Code, including distributing substantially all of its taxable income and realized gains. As a result, no provision for U.S. Federal income taxes is required. As of October 31, 2018, the Fund did not have any unrecognized tax benefits in the financial statements; nor is the Fund aware of any tax positions for which it is reasonably possible that the total amounts of unrecognized tax benefits will significantly change in the next twelve months. The Fund files a U.S. federal tax return, in addition to state and local tax returns as required. The Fund's federal income tax returns are subject to examination by the Internal Revenue Service (IRS) for a period of three fiscal years after they are filed. State and local tax returns may be subject to examination for an additional fiscal year depending on the jurisdiction. Foreign taxes are provided for based on the Fund's understanding of the tax rules and rates that exist in the foreign markets in which it invests.
Distributions are declared and recorded on the ex-dividend date. Income and capital gain distributions are declared separately for each class. Income and capital gain distributions are determined in accordance with income tax regulations, which may differ from GAAP. In addition, the Fund claimed a portion of the payment made to redeeming shareholders as a distribution for income tax purposes.
Capital accounts within the financial statements are adjusted for permanent book-tax differences. These adjustments have no impact on net assets or the results of operations. Capital accounts are not adjusted for temporary book-tax differences which will reverse in a subsequent period.
Book-tax differences are primarily due to foreign currency transactions, deferred trustees compensation, capital loss carryforwards and losses deferred due to wash sales.
As of period end, the cost and unrealized appreciation (depreciation) in securities, and derivatives if applicable, for federal income tax purposes were as follows:
| Gross unrealized appreciation | $166,885,742 |
| Gross unrealized depreciation | (110,613,277) |
| Net unrealized appreciation (depreciation) | $56,272,465 |
| Tax Cost | $970,386,082 |
The tax-based components of distributable earnings as of period end were as follows:
| Undistributed ordinary income | $8,370,452 |
| Capital loss carryforward | $(45,021,541) |
| Net unrealized appreciation (depreciation) on securities and other investments | $56,266,545 |
Capital loss carryforwards are only available to offset future capital gains of the Fund to the extent provided by regulations and may be limited. Under the Regulated Investment Company Modernization Act of 2010 (the Act), the Fund is permitted to carry forward capital losses incurred in taxable years beginning after December 22, 2010 for an unlimited period and such capital losses are required to be used prior to any losses that expire. The capital loss carryforward information presented below, including any applicable limitation, is estimated as of fiscal period end and is subject to adjustment.
| No expiration | |
| Short-term | $(45,021,541) |
The tax character of distributions paid was as follows:
| October 31, 2018 | October 31, 2017 | |
| Ordinary Income | $5,632,793 | $ 12,624,831 |
Short-Term Trading (Redemption) Fees. Shares held by investors in the Fund less than 90 days may have been subject to a redemption fee equal to 1.50% of the NAV of shares redeemed. All redemption fees, which reduce the proceeds of the shareholder redemption, are retained by the Fund and accounted for as an addition to paid in capital. In November 2017, the Board of Trustees approved the elimination of these redemption fees effective December 18, 2017.
Restricted Securities. The Fund may invest in securities that are subject to legal or contractual restrictions on resale. These securities generally may be resold in transactions exempt from registration or to the public if the securities are registered. Disposal of these securities may involve time-consuming negotiations and expense, and prompt sale at an acceptable price may be difficult. Information regarding restricted securities is included at the end of the Fund's Schedule of Investments.
New Rule Issuance. During August 2018, the U.S. Securities and Exchange Commission issued Final Rule Release No. 33-10532, Disclosure Update and Simplification. This Final Rule includes amendments specific to registered investment companies that are intended to eliminate overlap in disclosure requirements between Regulation S-X and GAAP. In accordance with these amendments, certain line-items in the Fund's financial statements have been combined or removed for the current period as outlined in the table below.
| Financial Statement | Current Line-Item Presentation | Prior Line-Item Presentation |
| Statement of Assets and Liabilities | Total distributable earnings (loss) | Undistributed/Distributions in excess of/Accumulated net investment income (loss) Accumulated/Undistributed net realized gain (loss) Net unrealized appreciation (depreciation) |
| Statement of Changes in Net Assets | N/A - removed | Undistributed/Distributions in excess of/Accumulated net investment income (loss) end of period |
| Statement of Changes in Net Assets | Distributions to shareholders | Distributions to shareholders from net investment income Distributions to shareholders from net realized gain |
| Distributions to Shareholders Note to Financial Statements | Distributions to shareholders | Distributions to shareholders from net investment income Distributions to shareholders from net realized gain |
4. Purchases and Sales of Investments.
Purchases and sales of securities, other than short-term securities, aggregated $816,777,335 and $996,955,433, respectively.
5. Fees and Other Transactions with Affiliates.
Management Fee. Fidelity Management & Research Company (the investment adviser) and its affiliates provide the Fund with investment management related services for which the Fund pays a monthly management fee. The management fee is the sum of an individual fund fee rate that is based on an annual rate of .45% of the Fund's average net assets and an annualized group fee rate that averaged .24% during the period. The group fee rate is based upon the average net assets of all the mutual funds advised by the investment adviser, including any mutual funds previously advised by the investment adviser that are currently advised by Fidelity SelectCo, LLC, an affiliate of the investment adviser. The group fee rate decreases as assets under management increase and increases as assets under management decrease. For the reporting period, the total annual management fee rate was .69% of the Fund's average net assets.
Distribution and Service Plan Fees. In accordance with Rule 12b-1 of the 1940 Act, the Fund has adopted separate Distribution and Service Plans for each class of shares. Certain classes pay Fidelity Distributors Corporation (FDC), an affiliate of the investment adviser, separate Distribution and Service Fees, each of which is based on an annual percentage of each class' average net assets. In addition, FDC may pay financial intermediaries for selling shares of the Fund and providing shareholder support services. For the period, the Distribution and Service Fee rates, total fees and amounts retained by FDC were as follows:
| Distribution Fee | Service Fee | Total Fees | Retained by FDC | |
| Class A | -% | .25% | $83,334 | $3,672 |
| Class M | .25% | .25% | 55,510 | 2,032 |
| Class C | .75% | .25% | 141,497 | 30,723 |
| $280,341 | $36,427 |
Sales Load. FDC may receive a front-end sales charge of up to 5.75% for selling Class A shares and 3.50% for selling Class M shares, some of which is paid to financial intermediaries for selling shares of the Fund. Depending on the holding period, FDC may receive contingent deferred sales charges levied on Class A, Class M and Class C redemptions. The deferred sales charges are 1.00% for Class C shares, 1.00% for certain purchases of Class A shares and .25% for certain purchases of Class M shares.
For the period, sales charge amounts retained by FDC were as follows:
| Retained by FDC | |
| Class A | $33,964 |
| Class M | 4,476 |
| Class C(a) | 5,834 |
| $44,274 |
(a) When Class C shares are initially sold, FDC pays commissions from its own resources to financial intermediaries through which the sales are made.
Transfer Agent Fees. Fidelity Investments Institutional Operations Company, Inc., (FIIOC), an affiliate of the investment adviser, is the transfer, dividend disbursing and shareholder servicing agent for each class of the Fund. FIIOC receives account fees and asset-based fees that vary according to the account size and type of account of the shareholders of the respective classes of the Fund, except for Class Z. FIIOC receives an asset-based fee of Class Z's average net assets. FIIOC pays for typesetting, printing and mailing of shareholder reports, except proxy statements.
For the period, transfer agent fees for each class were as follows:
| Amount | % of Class-Level Average Net Assets | |
| Class A | $78,350 | .24 |
| Class M | 36,702 | .33 |
| Class C | 31,843 | .23 |
| China Region | 2,346,421 | .18 |
| Class I | 62,051 | .20 |
| Class Z | 5 | .05(a) |
| $2,555,372 |
(a) Annualized
Accounting and Security Lending Fees. Fidelity Service Company, Inc. (FSC), an affiliate of the investment adviser, maintains the Fund's accounting records. The accounting fee is based on the level of average net assets for each month. Under a separate contract, FSC administers the security lending program. The security lending fee is based on the number and duration of lending transactions. For the period, the fees were equivalent to an annual rate of .05%.
Brokerage Commissions. The Fund placed a portion of its portfolio transactions with brokerage firms which are affiliates of the investment adviser. Brokerage commissions are included in net realized gain (loss) and change in net unrealized appreciation (depreciation) in the Statement of Operations. The commissions paid to these affiliated firms were $5,192 for the period.
Interfund Lending Program. Pursuant to an Exemptive Order issued by the SEC, the Fund, along with other registered investment companies having management contracts with Fidelity Management & Research Company (FMR) or other affiliated entities of FMR, may participate in an interfund lending program. This program provides an alternative credit facility allowing the funds to borrow from, or lend money to, other participating affiliated funds. At period end, there were no interfund loans outstanding. The Fund's activity in this program during the period for which loans were outstanding was as follows:
| Borrower or Lender | Average Loan Balance | Weighted Average Interest Rate | Interest Expense |
| Borrower | $6,541,333 | 1.66% | $4,514 |
Interfund Trades. The Fund may purchase from or sell securities to other Fidelity Funds under procedures adopted by the Board. The procedures have been designed to ensure these interfund trades are executed in accordance with Rule 17a-7 of the 1940 Act. Interfund trades are included within the respective purchases and sales amounts shown in the Purchases and Sales of Investments note.
Other. During the period, the investment adviser reimbursed the Fund for certain losses in the amount of $31,697.
6. Committed Line of Credit.
The Fund participates with other funds managed by the investment adviser or an affiliate in a $4.25 billion credit facility (the "line of credit") to be utilized for temporary or emergency purposes to fund shareholder redemptions or for other short-term liquidity purposes. The Fund has agreed to pay commitment fees on its pro-rata portion of the line of credit, which amounted to $3,988 and is reflected in Miscellaneous expenses on the Statement of Operations. During the period, the Fund did not borrow on this line of credit.
7. Security Lending.
The Fund lends portfolio securities through a lending agent from time to time in order to earn additional income. For equity securities, a lending agent is used and may loan securities to certain qualified borrowers, including Fidelity Capital Markets (FCM), a broker-dealer affiliated with the Fund. On the settlement date of the loan, the Fund receives collateral (in the form of U.S. Treasury obligations, letters of credit and/or cash) against the loaned securities and maintains collateral in an amount not less than 100% of the market value of the loaned securities during the period of the loan. The market value of the loaned securities is determined at the close of business of the Fund and any additional required collateral is delivered to the Fund on the next business day. The Fund or borrower may terminate the loan at any time, and if the borrower defaults on its obligation to return the securities loaned because of insolvency or other reasons, the Fund may apply collateral received from the borrower against the obligation. The Fund may experience delays and costs in recovering the securities loaned. Any cash collateral received is invested in the Fidelity Securities Lending Cash Central Fund. The value of loaned securities and cash collateral at period end are disclosed on the Fund's Statement of Assets and Liabilities. Security lending income represents the income earned on investing cash collateral, less rebates paid to borrowers and any lending agent fees associated with the loan, plus any premium payments received for lending certain types of securities. Security lending income is presented in the Statement of Operations as a component of income from Fidelity Central Funds. Total security lending income during the period amounted to $181,809. During the period, there were no securities loaned to FCM.
8. Expense Reductions.
Commissions paid to certain brokers with whom the investment adviser, or its affiliates, places trades on behalf of the Fund include an amount in addition to trade execution, which may be rebated back to the Fund to offset certain expenses. This amount totaled $458,804 for the period. Through arrangements with the Fund's custodian, credits realized as a result of certain uninvested cash balances were used to reduce the Fund's expenses. During the period, credits reduced each class' transfer agent expense as noted in the table below.
| Transfer Agent expense reduction | |
| China Region | $17 |
In addition, during the period the investment adviser reimbursed and/or waived a portion of fund-level operating expenses in the amount of $14,365.
9. Distributions to Shareholders.
Distributions to shareholders of each class were as follows:
| Year ended October 31, 2018 | Year ended October 31, 2017 | |
| Distributions to shareholders | ||
| Class A | $79,937 | $– |
| China Region | 5,380,060 | – |
| Class I | 172,796 | – |
| Total | $5,632,793 | $– |
| From net investment income | ||
| Class A | $– | $157,254 |
| Class M | – | 24,256 |
| China Region | – | 10,242,046 |
| Class I | – | 212,309 |
| Total | $– | $10,635,865 |
| From net realized gain | ||
| Class A | $– | $43,202 |
| Class M | – | 10,926 |
| Class C | – | 7,384 |
| China Region | – | 1,889,677 |
| Class I | – | 37,777 |
| Total | $– | $1,988,966 |
10. Share Transactions.
Share transactions for each class were as follows and may contain automatic conversions between classes or exchanges between affiliated funds:
| Shares | Shares | Dollars | Dollars | |
| Year ended October 31, 2018(a) | Year ended October 31, 2017 | Year ended October 31, 2018(a) | Year ended October 31, 2017 | |
| Class A | ||||
| Shares sold | 281,109 | 484,746 | $9,945,540 | $14,218,284 |
| Reinvestment of distributions | 2,311 | 7,951 | 78,690 | 195,750 |
| Shares redeemed | (506,416) | (355,316) | (18,191,086) | (9,896,035) |
| Net increase (decrease) | (222,996) | 137,381 | $(8,166,856) | $4,517,999 |
| Class M | ||||
| Shares sold | 116,652 | 114,104 | $4,199,988 | $3,376,139 |
| Reinvestment of distributions | – | 1,419 | – | 34,859 |
| Shares redeemed | (118,515) | (51,513) | (4,110,606) | (1,446,359) |
| Net increase (decrease) | (1,863) | 64,010 | $89,382 | $1,964,639 |
| Class C | ||||
| Shares sold | 141,748 | 123,999 | $4,961,864 | $3,531,382 |
| Reinvestment of distributions | – | 254 | – | 6,148 |
| Shares redeemed | (166,005) | (188,578) | (5,613,368) | (4,895,729) |
| Net increase (decrease) | (24,257) | (64,325) | $(651,504) | $(1,358,199) |
| China Region | ||||
| Shares sold | 9,405,338 | 7,507,787 | $342,970,076 | $224,773,166 |
| Reinvestment of distributions | 150,399 | 469,834 | 5,175,224 | 11,675,364 |
| Shares redeemed | (13,622,290) | (9,588,795) | (481,771,408) | (265,714,287) |
| Net increase (decrease) | (4,066,553) | (1,611,174) | $(133,626,108) | $(29,265,757) |
| Class I | ||||
| Shares sold | 748,387 | 659,273 | $26,698,679 | $19,707,002 |
| Reinvestment of distributions | 4,532 | 8,728 | 154,844 | 215,492 |
| Shares redeemed | (841,495) | (612,455) | (29,947,068) | (17,979,791) |
| Net increase (decrease) | (88,576) | 55,546 | $(3,093,545) | $1,942,703 |
| Class Z | ||||
| Shares sold | 11,185 | – | $336,639 | $– |
| Shares redeemed | (3) | – | (88) | – |
| Net increase (decrease) | 11,182 | – | $336,551 | $– |
(a) Share transactions for Class Z are for the period October 2, 2018 (commencement of sale of shares) to October 31, 2018.
11. Other.
The Fund's organizational documents provide former and current trustees and officers with a limited indemnification against liabilities arising in connection with the performance of their duties to the Fund. In the normal course of business, the Fund may also enter into contracts that provide general indemnifications. The Fund's maximum exposure under these arrangements is unknown as this would be dependent on future claims that may be made against the Fund. The risk of material loss from such claims is considered remote.
Fidelity® Emerging Asia Fund
Performance: The Bottom Line
Average annual total return reflects the change in the value of an investment, assuming reinvestment of distributions from dividend income and capital gains (the profits earned upon the sale of securities that have grown in value, if any) and assuming a constant rate of performance each year. The hypothetical investment and the average annual total returns do not reflect the deduction of taxes that a shareholder would pay on fund distributions or the redemption of fund shares. During periods of reimbursement by Fidelity, a fund’s total return will be greater than it would be had the reimbursement not occurred. How a fund did yesterday is no guarantee of how it will do tomorrow.
Average Annual Total Returns
| For the periods ended October 31, 2018 | Past 1 year | Past 5 years | Past 10 years |
| Fidelity® Emerging Asia Fund | (15.75)% | 4.46% | 8.68% |
Prior to December 1, 2010, the fund operated under certain different investment policies and compared its performance to a different index. The fund's historical performance may not represent its current investment policies.
$10,000 Over 10 Years
Let's say hypothetically that $10,000 was invested in Fidelity® Emerging Asia Fund on October 31, 2008.
The chart shows how the value of your investment would have changed, and also shows how the MSCI AC (All Country) Asia ex Japan Index performed over the same period.
| Period Ending Values | ||
| $22,982 | Fidelity® Emerging Asia Fund | |
| $26,554 | MSCI AC (All Country) Asia ex Japan Index | |
Fidelity® Emerging Asia Fund
Management's Discussion of Fund Performance
Market Recap: International equities returned -8.08% for the 12 months ending October 31, 2018, according to the MSCI ACWI (All Country World Index) ex USA Index. A modestly positive first half of the period gave way to a confluence of overwhelmingly negative factors – including escalating trade tension, a surging U.S. dollar, tepid economic growth in Europe, global central bank tightening, concerns about Italy’s budget stalemate with the EU, and weakness in China’s stock market – that yielded a -11% second-half return. The index lost 8% in October alone, its largest monthly drop in more than six years. Among sectors, new-media-infused communications services (-15%) was hit the hardest, while economically sensitive consumer discretionary (-13%), information technology (-12%), financials (-10%), industrials (-9%) and materials (-7%) stocks also fared poorly. Even the more defensive real estate (-9%), utilities (-6%) and consumer staples (-5%) sectors weren’t spared this period. Conversely, elevated crude-oil prices fueled a positive return for energy (+7%), the top-performing sector, followed by the relatively stable-growing health care segment (+2%). Regionally, emerging markets (-12%) fared the worst, hampered by the impact of foreign exchange and concerns about economic weakness in China, India and South Korea. Sluggish growth also pressured shares in continental Europe (-9%). Stocks in Japan (-3%) and the U.K. (-4%) held up better, followed by Canada (-5%) and Asia-Pacific ex Japan (-6%).Comments from Portfolio Manager John Dance: For the year, the fund returned -15.75%, lagging the -13.62% return of the benchmark MSCI AC (All Country) Asia ex Japan Index. Stock selection primarily drove the fund’s underperformance of the benchmark, especially in the energy, utilities, financials and information technology sectors. By country, picks in India and China detracted notably. Choices in Australia hurt to a lesser extent. At the stock level, an out-of-benchmark position in Australia-based Blue Sky Alternative Investments detracted most on a relative basis. The stock dropped sharply and was suspended from trading after a report surfaced claiming the firm overvalued its fee-earning assets and overstated its investment results. We believe the accusations are without merit and continued to hold the stock in the fund at period end. The fund’s largest position, Tencent Holdings, also detracted this period. In August, Tencent reported a rare quarterly profit decline. Conversely, stock selection in the consumer discretionary sector was a bright spot, and the fund’s cash position provided some ballast in a declining market. Geographically, stock picking in Hong Kong and Indonesia contributed. The fund's top relative contributor was HKT Trust and HKT Limited Stapled Units, a Hong Kong-based wireless operator.The views expressed above reflect those of the portfolio manager(s) only through the end of the period as stated on the cover of this report and do not necessarily represent the views of Fidelity or any other person in the Fidelity organization. Any such views are subject to change at any time based upon market or other conditions and Fidelity disclaims any responsibility to update such views. These views may not be relied on as investment advice and, because investment decisions for a Fidelity fund are based on numerous factors, may not be relied on as an indication of trading intent on behalf of any Fidelity fund.
Fidelity® Emerging Asia Fund
Investment Summary (Unaudited)
Geographic Diversification (% of fund's net assets)
| As of October 31, 2018 | ||
| India | 17.9% | |
| Cayman Islands | 17.8% | |
| China | 14.8% | |
| Taiwan | 9.1% | |
| Korea (South) | 9.0% | |
| Hong Kong | 7.7% | |
| United States of America* | 6.8% | |
| Bermuda | 3.5% | |
| Indonesia | 3.0% | |
| Other | 10.4% | |

* Includes Short-Term investments and Net Other Assets (Liabilities).
Percentages are based on country or territory of incorporation and are adjusted for the effect of futures contracts, if applicable.
Asset Allocation as of October 31, 2018
| % of fund's net assets | |
| Stocks | 93.2 |
| Short-Term Investments and Net Other Assets (Liabilities) | 6.8 |
Top Ten Stocks as of October 31, 2018
| % of fund's net assets | |
| Tencent Holdings Ltd. (Cayman Islands, Interactive Media & Services) | 7.0 |
| Taiwan Semiconductor Manufacturing Co. Ltd. (Taiwan, Semiconductors & Semiconductor Equipment) | 6.5 |
| Alibaba Group Holding Ltd. sponsored ADR (Cayman Islands, Internet & Direct Marketing Retail) | 5.6 |
| AIA Group Ltd. (Hong Kong, Insurance) | 4.0 |
| Reliance Industries Ltd. (India, Oil, Gas & Consumable Fuels) | 2.8 |
| Samsung Electronics Co. Ltd. (Korea (South), Technology Hardware, Storage & Peripherals) | 2.5 |
| China Construction Bank Corp. (H Shares) (China, Banks) | 2.5 |
| Housing Development Finance Corp. Ltd. (India, Thrifts & Mortgage Finance) | 2.5 |
| HKT Trust/HKT Ltd. unit (Multi-National, Diversified Telecommunication Services) | 2.0 |
| PT Bank Central Asia Tbk (Indonesia, Banks) | 1.9 |
| 37.3 |
Top Market Sectors as of October 31, 2018
| % of fund's net assets | |
| Financials | 24.0 |
| Information Technology | 13.7 |
| Consumer Discretionary | 12.7 |
| Communication Services | 11.6 |
| Industrials | 7.4 |
| Real Estate | 5.3 |
| Consumer Staples | 4.8 |
| Energy | 4.4 |
| Utilities | 4.3 |
| Health Care | 3.5 |
Fidelity® Emerging Asia Fund
Schedule of Investments October 31, 2018
Showing Percentage of Net Assets
| Common Stocks - 92.0% | |||
| Shares | Value | ||
| Australia - 2.2% | |||
| Blue Sky Alternative Investments Ltd. (a) | 1,183,786 | $1,014,341 | |
| HUB24 Ltd. | 748,233 | 6,072,209 | |
| Netwealth Group Ltd. (b) | 120,981 | 599,709 | |
| SpeedCast International Ltd. | 1,464,414 | 3,733,289 | |
| Woodside Petroleum Ltd. | 355,014 | 8,761,400 | |
| TOTAL AUSTRALIA | 20,180,948 | ||
| Bermuda - 3.5% | |||
| China Resource Gas Group Ltd. | 2,078,000 | 7,949,553 | |
| Hongkong Land Holdings Ltd. | 1,961,200 | 11,610,304 | |
| Tai Cheung Holdings Ltd. | 4,627,000 | 4,307,232 | |
| Vtech Holdings Ltd. | 672,000 | 7,883,753 | |
| TOTAL BERMUDA | 31,750,842 | ||
| Cayman Islands - 17.8% | |||
| Alibaba Group Holding Ltd. sponsored ADR (a) | 361,800 | 51,476,904 | |
| Geely Automobile Holdings Ltd. | 3,180,000 | 6,082,671 | |
| International Housewares Retail Co. Ltd. | 12,661,400 | 2,664,045 | |
| NetEase, Inc. ADR | 38,800 | 8,064,580 | |
| Shenzhou International Group Holdings Ltd. | 1,113,000 | 12,291,050 | |
| SITC International Holdings Co. Ltd. | 4,004,000 | 2,940,983 | |
| Tencent Holdings Ltd. | 1,874,400 | 64,215,563 | |
| Value Partners Group Ltd. (b) | 8,279,000 | 6,144,362 | |
| ZTO Express (Cayman), Inc. sponsored ADR (b) | 525,500 | 8,523,610 | |
| TOTAL CAYMAN ISLANDS | 162,403,768 | ||
| China - 14.8% | |||
| China Construction Bank Corp. (H Shares) | 28,557,000 | 22,661,326 | |
| China Pacific Insurance (Group) Co. Ltd. (H Shares) | 1,897,200 | 7,064,345 | |
| Gree Electric Appliances, Inc. of Zhuhai Class A (a) | 1,284,700 | 7,009,480 | |
| Hangzhou Tigermed Consulting Co. Ltd. Class A | 1,074,798 | 6,565,287 | |
| Inner Mongoli Yili Industries Co. Ltd. (A Shares) | 1,954,922 | 6,187,908 | |
| Jiangsu Yanghe Brewery Joint-Stock Co. Ltd. Class A | 410,558 | 5,202,271 | |
| Kweichow Moutai Co. Ltd. (A Shares) | 210,181 | 16,538,724 | |
| Midea Group Co. Ltd. Class A | 1,009,100 | 5,358,220 | |
| PICC Property & Casualty Co. Ltd. (H Shares) | 6,637,680 | 6,432,886 | |
| Qingdao Port International Co. Ltd. (a)(c) | 11,238,000 | 6,592,085 | |
| Shanghai International Airport Co. Ltd. (A Shares) | 1,553,869 | 11,037,568 | |
| Shenzhen Expressway Co. (H Shares) | 11,608,000 | 10,672,560 | |
| Sinopec Engineering Group Co. Ltd. (H Shares) | 7,181,000 | 6,675,570 | |
| Tonghua Dongbao Pharmaceutical Co. Ltd. Class A | 3,659,652 | 7,019,582 | |
| Yunnan Baiyao Group Co. Ltd. (d) | 1,018,905 | 10,258,212 | |
| TOTAL CHINA | 135,276,024 | ||
| Hong Kong - 7.7% | |||
| AIA Group Ltd. | 4,853,800 | 36,734,872 | |
| Dah Sing Banking Group Ltd. | 4,246,800 | 8,069,080 | |
| Power Assets Holdings Ltd. | 1,263,500 | 8,434,665 | |
| Sino Land Ltd. | 4,580,000 | 7,183,672 | |
| Techtronic Industries Co. Ltd. | 2,054,000 | 9,612,635 | |
| TOTAL HONG KONG | 70,034,924 | ||
| India - 17.9% | |||
| Adani Ports & Special Economic Zone Ltd. | 1,355,244 | 5,842,612 | |
| Amara Raja Batteries Ltd. | 393,456 | 3,961,957 | |
| Axis Bank Ltd. (a) | 1,481,557 | 11,666,560 | |
| Bharti Infratel Ltd. | 1,273,484 | 4,636,095 | |
| CCL Products (India) Ltd. | 1,559,930 | 5,339,322 | |
| Future Retail Ltd. | 1,259,967 | 8,333,056 | |
| Havells India Ltd. (a) | 544,441 | 4,753,921 | |
| HDFC Asset Management Co. Ltd. (a) | 2,035 | 38,535 | |
| HDFC Bank Ltd. | 622,419 | 16,158,162 | |
| Housing Development Finance Corp. Ltd. | 942,964 | 22,557,316 | |
| Indraprastha Gas Ltd. | 3,396,327 | 12,274,719 | |
| Oberoi Realty Ltd. | 1,299,217 | 7,436,770 | |
| Petronet LNG Ltd. | 2,188,260 | 6,677,803 | |
| Power Grid Corp. of India Ltd. | 4,174,038 | 10,494,353 | |
| Reliance Industries Ltd. | 1,772,654 | 25,435,763 | |
| Sun Pharmaceutical Industries Ltd. | 1,054,946 | 8,276,533 | |
| TCNS Clothing Co. Ltd. (a) | 137,684 | 1,150,469 | |
| UPL Ltd. (a) | 719,232 | 6,557,789 | |
| VST Industries Ltd. (a) | 53,015 | 2,273,817 | |
| TOTAL INDIA | 163,865,552 | ||
| Indonesia - 3.0% | |||
| PT Bank Central Asia Tbk | 11,533,000 | 17,941,487 | |
| PT Bank Rakyat Indonesia Tbk | 47,377,100 | 9,816,666 | |
| TOTAL INDONESIA | 27,758,153 | ||
| Israel - 0.1% | |||
| Sarine Technologies Ltd. | 3,360,700 | 1,298,036 | |
| Japan - 1.5% | |||
| SMC Corp. | 18,600 | 5,959,055 | |
| SoftBank Corp. | 92,900 | 7,351,996 | |
| TOTAL JAPAN | 13,311,051 | ||
| Korea (South) - 7.8% | |||
| Cafe24 Corp. (a) | 39,636 | 3,838,543 | |
| Cuckoo Holdings Co. Ltd. | 31,130 | 3,314,895 | |
| Hyundai Fire & Marine Insurance Co. Ltd. | 185,021 | 6,778,158 | |
| KB Financial Group, Inc. | 288,664 | 12,005,912 | |
| LG Chemical Ltd. | 24,363 | 7,409,256 | |
| Samsung Electronics Co. Ltd. | 612,510 | 22,761,108 | |
| SK Hynix, Inc. | 251,276 | 15,019,302 | |
| TOTAL KOREA (SOUTH) | 71,127,174 | ||
| Malaysia - 0.4% | |||
| Bursa Malaysia Bhd | 2,156,100 | 3,771,694 | |
| Multi-National - 2.0% | |||
| HKT Trust/HKT Ltd. unit | 13,505,300 | 18,599,614 | |
| Philippines - 1.1% | |||
| Ayala Land, Inc. | 13,698,700 | 10,164,370 | |
| Singapore - 0.8% | |||
| Wing Tai Holdings Ltd. | 5,055,300 | 7,043,807 | |
| Taiwan - 9.1% | |||
| E.SUN Financial Holdings Co. Ltd. | 14,129,131 | 9,355,378 | |
| Taiwan Semiconductor Manufacturing Co. Ltd. | 7,851,892 | 58,913,835 | |
| United Microelectronics Corp. | 15,181,000 | 5,781,930 | |
| Voltronic Power Technology Corp. | 545,000 | 8,792,736 | |
| TOTAL TAIWAN | 82,843,879 | ||
| Thailand - 2.3% | |||
| Bangkok Bank PCL (For. Reg.) | 2,073,300 | 13,255,115 | |
| Thai Beverage PCL | 17,142,900 | 7,735,128 | |
| TOTAL THAILAND | 20,990,243 | ||
| TOTAL COMMON STOCKS | |||
| (Cost $749,147,888) | 840,420,079 | ||
| Nonconvertible Preferred Stocks - 1.2% | |||
| Korea (South) - 1.2% | |||
| Samsung Electronics Co. Ltd. | |||
| (Cost $11,948,927) | 335,850 | 10,522,908 | |
| Money Market Funds - 8.7% | |||
| Fidelity Cash Central Fund, 2.23% (e) | 76,554,324 | 76,569,635 | |
| Fidelity Securities Lending Cash Central Fund 2.23% (e)(f) | 3,392,228 | 3,392,567 | |
| TOTAL MONEY MARKET FUNDS | |||
| (Cost $79,962,202) | 79,962,202 | ||
| TOTAL INVESTMENT IN SECURITIES - 101.9% | |||
| (Cost $841,059,017) | 930,905,189 | ||
| NET OTHER ASSETS (LIABILITIES) - (1.9)% | (16,965,212) | ||
| NET ASSETS - 100% | $913,939,977 |
Categorizations in the Schedule of Investments are based on country or territory of incorporation.
Legend
(a) Non-income producing
(b) Security or a portion of the security is on loan at period end.
(c) Security exempt from registration under Rule 144A of the Securities Act of 1933. These securities may be resold in transactions exempt from registration, normally to qualified institutional buyers. At the end of the period, the value of these securities amounted to $6,592,085 or 0.7% of net assets.
(d) Level 3 security
(e) Affiliated fund that is generally available only to investment companies and other accounts managed by Fidelity Investments. The rate quoted is the annualized seven-day yield of the fund at period end. A complete unaudited listing of the fund's holdings as of its most recent quarter end is available upon request. In addition, each Fidelity Central Fund's financial statements, which are not covered by the Fund's Report of Independent Registered Public Accounting Firm, are available on the SEC's website or upon request.
(f) Investment made with cash collateral received from securities on loan.
Affiliated Central Funds
Information regarding fiscal year to date income earned by the Fund from investments in Fidelity Central Funds is as follows:
| Fund | Income earned |
| Fidelity Cash Central Fund | $564,633 |
| Fidelity Securities Lending Cash Central Fund | 17,792 |
| Total | $582,425 |
Amounts in the income column in the above table include any capital gain distributions from underlying funds, which are presented in the corresponding line-item in the Statement of Operations if applicable.
Investment Valuation
The following is a summary of the inputs used, as of October 31, 2018, involving the Fund's assets and liabilities carried at fair value. The inputs or methodology used for valuing securities may not be an indication of the risk associated with investing in those securities. For more information on valuation inputs, and their aggregation into the levels used below, please refer to the Investment Valuation section in the accompanying Notes to Financial Statements.
| Valuation Inputs at Reporting Date: | ||||
| Description | Total | Level 1 | Level 2 | Level 3 |
| Investments in Securities: | ||||
| Equities: | ||||
| Communication Services | $106,601,137 | $35,033,578 | $71,567,559 | $-- |
| Consumer Discretionary | 115,817,035 | 115,817,035 | -- | -- |
| Consumer Staples | 43,277,170 | 43,277,170 | -- | -- |
| Energy | 40,874,966 | 40,874,966 | -- | -- |
| Financials | 218,138,113 | 167,312,713 | 50,825,400 | -- |
| Health Care | 32,119,614 | 21,861,402 | -- | 10,258,212 |
| Industrials | 68,527,083 | 68,527,083 | -- | -- |
| Information Technology | 124,721,379 | 60,025,614 | 64,695,765 | -- |
| Materials | 13,967,045 | 13,967,045 | -- | -- |
| Real Estate | 47,746,155 | 47,746,155 | -- | -- |
| Utilities | 39,153,290 | 39,153,290 | -- | -- |
| Money Market Funds | 79,962,202 | 79,962,202 | -- | -- |
| Total Investments in Securities: | $930,905,189 | $733,558,253 | $187,088,724 | $10,258,212 |
The following is a summary of transfers between Level 1 and Level 2 for the period ended October 31, 2018. Transfers are assumed to have occurred at the beginning of the period, and are primarily attributable to the valuation techniques used for foreign equity securities, as discussed in the accompanying Notes to Financial Statements:
| Transfers | Total |
| Level 1 to Level 2 | $25,315,579 |
| Level 2 to Level 1 | $1,048,464 |
The following is a reconciliation of Investments in Securities for which Level 3 inputs were used in determining value:
| Investments in Securities: | |
| Equities - Health Care | |
| Beginning Balance | $-- |
| Net Realized Gain (Loss) on Investment Securities | 72,828 |
| Net Unrealized Gain (Loss) on Investment Securities | (5,922,080) |
| Cost of Purchases | 289,824 |
| Proceeds of Sales | (938,130) |
| Amortization/Accretion | -- |
| Transfers into Level 3 | 16,755,770 |
| Transfers out of Level 3 | -- |
| Ending Balance | $10,258,212 |
| The change in unrealized gain (loss) for the period attributable to Level 3 securities held at October 31, 2018 | $(5,922,080) |
The information used in the above reconciliation represents fiscal year to date activity for any Investments in Securities identified as using Level 3 inputs at either the beginning or the end of the current fiscal period. Transfers in or out of Level 3 represent the beginning value of any Security or Instrument where a change in the pricing level occurred from the beginning to the end of the period. The cost of purchases and the proceeds of sales may include securities received or delivered through corporate actions or exchanges. Realized and unrealized gains (losses) disclosed in the reconciliation are included in Net Gain (Loss) on the Fund's Statement of Operations.
See accompanying notes which are an integral part of the financial statements.
Fidelity® Emerging Asia Fund
Financial Statements
Statement of Assets and Liabilities
| October 31, 2018 | ||
| Assets | ||
| Investment in securities, at value (including securities loaned of $3,243,777) — See accompanying schedule: Unaffiliated issuers (cost $761,096,815) | $850,942,987 | |
| Fidelity Central Funds (cost $79,962,202) | 79,962,202 | |
| Total Investment in Securities (cost $841,059,017) | $930,905,189 | |
| Receivable for investments sold | 749,288 | |
| Receivable for fund shares sold | 3,121,271 | |
| Dividends receivable | 600,807 | |
| Distributions receivable from Fidelity Central Funds | 119,959 | |
| Prepaid expenses | 2,524 | |
| Other receivables | 417,397 | |
| Total assets | 935,916,435 | |
| Liabilities | ||
| Payable for investments purchased | $256,628 | |
| Payable for fund shares redeemed | 17,249,774 | |
| Accrued management fee | 570,152 | |
| Other affiliated payables | 193,540 | |
| Other payables and accrued expenses | 313,964 | |
| Collateral on securities loaned | 3,392,400 | |
| Total liabilities | 21,976,458 | |
| Net Assets | $913,939,977 | |
| Net Assets consist of: | ||
| Paid in capital | $795,879,981 | |
| Total distributable earnings (loss) | 118,059,996 | |
| Net Assets, for 24,907,212 shares outstanding | $913,939,977 | |
| Net Asset Value, offering price and redemption price per share ($913,939,977 ÷ 24,907,212 shares) | $36.69 |
See accompanying notes which are an integral part of the financial statements.
Statement of Operations
| Year ended October 31, 2018 | ||
| Investment Income | ||
| Dividends | $26,331,466 | |
| Income from Fidelity Central Funds | 582,425 | |
| Income before foreign taxes withheld | 26,913,891 | |
| Less foreign taxes withheld | (2,230,056) | |
| Total income | 24,683,835 | |
| Expenses | ||
| Management fee | ||
| Basic fee | $8,852,692 | |
| Performance adjustment | 668,265 | |
| Transfer agent fees | 2,180,038 | |
| Accounting and security lending fees | 584,268 | |
| Custodian fees and expenses | 630,344 | |
| Independent trustees' fees and expenses | 6,545 | |
| Registration fees | 65,146 | |
| Audit | 102,873 | |
| Legal | 3,769 | |
| Interest | 6,195 | |
| Miscellaneous | 8,607 | |
| Total expenses before reductions | 13,108,742 | |
| Expense reductions | (278,360) | |
| Total expenses after reductions | 12,830,382 | |
| Net investment income (loss) | 11,853,453 | |
| Realized and Unrealized Gain (Loss) | ||
| Net realized gain (loss) on: | ||
| Investment securities: | ||
| Unaffiliated issuers | 66,408,944 | |
| Fidelity Central Funds | (83) | |
| Foreign currency transactions | (801,432) | |
| Total net realized gain (loss) | 65,607,429 | |
| Change in net unrealized appreciation (depreciation) on: | ||
| Investment securities: | ||
| Unaffiliated issuers (net of decrease in deferred foreign taxes of $3,873,188) | (262,626,984) | |
| Fidelity Central Funds | 326 | |
| Assets and liabilities in foreign currencies | (61,050) | |
| Total change in net unrealized appreciation (depreciation) | (262,687,708) | |
| Net gain (loss) | (197,080,279) | |
| Net increase (decrease) in net assets resulting from operations | $(185,226,826) |
See accompanying notes which are an integral part of the financial statements.
Statement of Changes in Net Assets
| Year ended October 31, 2018 | Year ended October 31, 2017 | |
| Increase (Decrease) in Net Assets | ||
| Operations | ||
| Net investment income (loss) | $11,853,453 | $10,858,459 |
| Net realized gain (loss) | 65,607,429 | 2,628,524 |
| Change in net unrealized appreciation (depreciation) | (262,687,708) | 285,498,542 |
| Net increase (decrease) in net assets resulting from operations | (185,226,826) | 298,985,525 |
| Distributions to shareholders | (11,209,950) | – |
| Distributions to shareholders from net investment income | – | (9,245,057) |
| Distributions to shareholders from net realized gain | – | (1,418,120) |
| Total distributions | (11,209,950) | (10,663,177) |
| Share transactions | ||
| Proceeds from sales of shares | 413,143,734 | 240,731,562 |
| Reinvestment of distributions | 9,352,064 | 9,645,118 |
| Cost of shares redeemed | (598,473,348) | (174,712,854) |
| Net increase (decrease) in net assets resulting from share transactions | (175,977,550) | 75,663,826 |
| Redemption fees | 23,229 | 79,537 |
| Total increase (decrease) in net assets | (372,391,097) | 364,065,711 |
| Net Assets | ||
| Beginning of period | 1,286,331,074 | 922,265,363 |
| End of period | $913,939,977 | $1,286,331,074 |
| Other Information | ||
| Undistributed net investment income end of period | $10,490,159 | |
| Shares | ||
| Sold | 9,234,180 | 6,226,419 |
| Issued in reinvestment of distributions | 215,039 | 301,034 |
| Redeemed | (13,816,562) | (4,887,212) |
| Net increase (decrease) | (4,367,343) | 1,640,241 |
See accompanying notes which are an integral part of the financial statements.
Financial Highlights
Fidelity Emerging Asia Fund
| Years ended October 31, | 2018 | 2017 | 2016 | 2015 | 2014 |
| Selected Per–Share Data | |||||
| Net asset value, beginning of period | $43.94 | $33.37 | $31.20 | $33.03 | $30.91 |
| Income from Investment Operations | |||||
| Net investment income (loss)A | .41 | .40 | .39 | .42 | .43 |
| Net realized and unrealized gain (loss) | (7.27) | 10.56 | 1.91 | (1.96) | 2.08 |
| Total from investment operations | (6.86) | 10.96 | 2.30 | (1.54) | 2.51 |
| Distributions from net investment income | (.37) | (.34) | (.13) | (.29) | (.39) |
| Distributions from net realized gain | (.02) | (.05) | – | – | – |
| Total distributions | (.39) | (.39) | (.13) | (.29) | (.39) |
| Redemption fees added to paid in capitalA,B | – | – | – | – | – |
| Net asset value, end of period | $36.69 | $43.94 | $33.37 | $31.20 | $33.03 |
| Total ReturnC | (15.75)% | 33.28% | 7.42% | (4.69)% | 8.21% |
| Ratios to Average Net AssetsD,E | |||||
| Expenses before reductions | 1.02% | 1.10% | 1.16% | 1.09% | 1.04% |
| Expenses net of fee waivers, if any | 1.02% | 1.10% | 1.16% | 1.09% | 1.04% |
| Expenses net of all reductions | 1.00% | 1.08% | 1.16% | 1.09% | 1.04% |
| Net investment income (loss) | .93% | 1.07% | 1.25% | 1.26% | 1.36% |
| Supplemental Data | |||||
| Net assets, end of period (000 omitted) | $913,940 | $1,286,331 | $922,265 | $1,008,178 | $1,111,277 |
| Portfolio turnover rateF | 36% | 40% | 77% | 68% | 90% |
A Calculated based on average shares outstanding during the period.
B Amount represents less than $.005 per share.
C Total returns would have been lower if certain expenses had not been reduced during the applicable periods shown.
D Fees and expenses of any underlying Fidelity Central Funds are not included in the Fund's expense ratio. The Fund indirectly bears its proportionate share of the expenses of any underlying Fidelity Central Funds.
E Expense ratios reflect operating expenses of the Fund. Expenses before reductions do not reflect amounts reimbursed by the investment adviser or reductions from brokerage service arrangements or reductions from other expense offset arrangements and do not represent the amount paid by the Fund during periods when reimbursements or reductions occur. Expenses net of fee waivers reflect expenses after reimbursement by the investment adviser but prior to reductions from brokerage service arrangements or other expense offset arrangements. Expenses net of all reductions represent the net expenses paid by the Fund.
F Amount does not include the portfolio activity of any underlying Fidelity Central Funds.
See accompanying notes which are an integral part of the financial statements.
Notes to Financial Statements
For the period ended October 31, 2018
1. Organization.
Fidelity Emerging Asia Fund (the Fund) is a fund of Fidelity Investment Trust (the Trust) and is authorized to issue an unlimited number of shares. Share transactions on the Statement of Changes in Net Assets may contain exchanges between affiliated funds. The Trust is registered under the Investment Company Act of 1940, as amended (the 1940 Act), as an open-end management investment company organized as a Massachusetts business trust. The Fund's investments in emerging markets can be subject to social, economic, regulatory, and political uncertainties and can be extremely volatile.
2. Investments in Fidelity Central Funds.
The Fund invests in Fidelity Central Funds, which are open-end investment companies generally available only to other investment companies and accounts managed by the investment adviser and its affiliates. The Fund's Schedule of Investments lists each of the Fidelity Central Funds held as of period end, if any, as an investment of the Fund, but does not include the underlying holdings of each Fidelity Central Fund. As an Investing Fund, the Fund indirectly bears its proportionate share of the expenses of the underlying Fidelity Central Funds.
The Money Market Central Funds seek preservation of capital and current income and are managed by Fidelity Investments Money Management, Inc. (FIMM), an affiliate of the investment adviser. Annualized expenses of the Money Market Central Funds as of their most recent shareholder report date are less than .005%.
A complete unaudited list of holdings for each Fidelity Central Fund is available upon request or at the Securities and Exchange Commission (the SEC) website at www.sec.gov. In addition, the financial statements of the Fidelity Central Funds, which are not covered by the Fund's Report of Independent Registered Public Accounting Firm, are available on the SEC website or upon request.
3. Significant Accounting Policies.
The Fund is an investment company and applies the accounting and reporting guidance of the Financial Accounting Standards Board (FASB) Accounting Standards Codification Topic 946 Financial Services – Investments Companies. The financial statements have been prepared in conformity with accounting principles generally accepted in the United States of America (GAAP), which require management to make certain estimates and assumptions at the date of the financial statements. Actual results could differ from those estimates. Subsequent events, if any, through the date that the financial statements were issued have been evaluated in the preparation of the financial statements. The following summarizes the significant accounting policies of the Fund:
Investment Valuation. Investments are valued as of 4:00 p.m. Eastern time on the last calendar day of the period. The Board of Trustees (the Board) has delegated the day to day responsibility for the valuation of the Fund's investments to the Fair Value Committee (the Committee) established by the Fund's investment adviser. In accordance with valuation policies and procedures approved by the Board, the Fund attempts to obtain prices from one or more third party pricing vendors or brokers to value its investments. When current market prices, quotations or currency exchange rates are not readily available or reliable, investments will be fair valued in good faith by the Committee, in accordance with procedures adopted by the Board. Factors used in determining fair value vary by investment type and may include market or investment specific events. The frequency with which these procedures are used cannot be predicted and they may be utilized to a significant extent. The Committee oversees the Fund's valuation policies and procedures and reports to the Board on the Committee's activities and fair value determinations. The Board monitors the appropriateness of the procedures used in valuing the Fund's investments and ratifies the fair value determinations of the Committee.
The Fund categorizes the inputs to valuation techniques used to value its investments into a disclosure hierarchy consisting of three levels as shown below:
- Level 1 – quoted prices in active markets for identical investments
- Level 2 – other significant observable inputs (including quoted prices for similar investments, interest rates, prepayment speeds, etc.)
- Level 3– unobservable inputs (including the Fund's own assumptions based on the best information available)
Valuation techniques used to value the Fund's investments by major category are as follows:
Equity securities, including restricted securities, for which market quotations are readily available, are valued at the last reported sale price or official closing price as reported by a third party pricing vendor on the primary market or exchange on which they are traded and are categorized as Level 1 in the hierarchy. In the event there were no sales during the day or closing prices are not available, securities are valued at the last quoted bid price or may be valued using the last available price and are generally categorized as Level 2 in the hierarchy. For foreign equity securities, when market or security specific events arise, comparisons to the valuation of American Depositary Receipts (ADRs), futures contracts, Exchange-Traded Funds (ETFs) and certain indexes as well as quoted prices for similar securities may be used and would be categorized as Level 2 in the hierarchy. Utilizing these techniques may result in transfers between Level 1 and Level 2. For equity securities, including restricted securities, where observable inputs are limited, assumptions about market activity and risk are used and these securities may be categorized as Level 3 in the hierarchy.
Investments in open-end mutual funds, including the Fidelity Central Funds, are valued at their closing net asset value (NAV) each business day and are categorized as Level 1 in the hierarchy.
Changes in valuation techniques may result in transfers in or out of an assigned level within the disclosure hierarchy. The aggregate value of investments by input level as of October 31, 2018, including information on transfers between Levels 1 and 2, as well as a roll forward of Level 3 investments, is included at the end of the Fund's Schedule of Investments.
Foreign Currency. The Fund may use foreign currency contracts to facilitate transactions in foreign-denominated securities. Gains and losses from these transactions may arise from changes in the value of the foreign currency or if the counterparties do not perform under the contracts' terms.
Foreign-denominated assets, including investment securities, and liabilities are translated into U.S. dollars at the exchange rates at period end. Purchases and sales of investment securities, income and dividends received and expenses denominated in foreign currencies are translated into U.S. dollars at the exchange rate in effect on the transaction date.
The effects of exchange rate fluctuations on investments are included with the net realized and unrealized gain (loss) on investment securities. Other foreign currency transactions resulting in realized and unrealized gain (loss) are disclosed separately.
Investment Transactions and Income. For financial reporting purposes, the Fund's investment holdings and NAV include trades executed through the end of the last business day of the period. The NAV per share for processing shareholder transactions is calculated as of the close of business of the New York Stock Exchange (NYSE), normally 4:00 p.m. Eastern time and includes trades executed through the end of the prior business day. Gains and losses on securities sold are determined on the basis of identified cost and include proceeds received from litigation. Dividend income is recorded on the ex-dividend date, except for certain dividends from foreign securities where the ex-dividend date may have passed, which are recorded as soon as the Fund is informed of the ex-dividend date. Non-cash dividends included in dividend income, if any, are recorded at the fair market value of the securities received. Income and capital gain distributions from Fidelity Central Funds, if any, are recorded on the ex-dividend date. Certain distributions received by the Fund represent a return of capital or capital gain. The Fund determines the components of these distributions subsequent to the ex-dividend date, based upon receipt of tax filings or other correspondence relating to the underlying investment. These distributions are recorded as a reduction of cost of investments and/or as a realized gain. Investment income is recorded net of foreign taxes withheld where recovery of such taxes is uncertain.
Expenses. Expenses directly attributable to a fund are charged to that fund. Expenses attributable to more than one fund are allocated among the respective funds on the basis of relative net assets or other appropriate methods. Expense estimates are accrued in the period to which they relate and adjustments are made when actual amounts are known.
Income Tax Information and Distributions to Shareholders. Each year, the Fund intends to qualify as a regulated investment company under Subchapter M of the Internal Revenue Code, including distributing substantially all of its taxable income and realized gains. As a result, no provision for U.S. Federal income taxes is required. As of October 31, 2018, the Fund did not have any unrecognized tax benefits in the financial statements; nor is the Fund aware of any tax positions for which it is reasonably possible that the total amounts of unrecognized tax benefits will significantly change in the next twelve months. The Fund files a U.S. federal tax return, in addition to state and local tax returns as required. The Fund's federal income tax returns are subject to examination by the Internal Revenue Service (IRS) for a period of three fiscal years after they are filed. State and local tax returns may be subject to examination for an additional fiscal year depending on the jurisdiction. Foreign taxes are provided for based on the Fund's understanding of the tax rules and rates that exist in the foreign markets in which it invests.
Distributions are declared and recorded on the ex-dividend date. Income and capital gain distributions are determined in accordance with income tax regulations, which may differ from GAAP. In addition, the Fund claimed a portion of the payment made to redeeming shareholders as a distribution for income tax purposes.
Capital accounts within the financial statements are adjusted for permanent book-tax differences. These adjustments have no impact on net assets or the results of operations. Capital accounts are not adjusted for temporary book-tax differences which will reverse in a subsequent period.
Book-tax differences are primarily due to foreign currency transactions, passive foreign investment companies (PFIC), deferred trustees compensation, capital loss carryforwards and losses deferred due to wash sales.
As of period end, the cost and unrealized appreciation (depreciation) in securities, and derivatives if applicable, for federal income tax purposes were as follows:
| Gross unrealized appreciation | $172,451,110 |
| Gross unrealized depreciation | (83,901,791) |
| Net unrealized appreciation (depreciation) | $88,549,319 |
| Tax Cost | $842,355,870 |
The tax-based components of distributable earnings as of period end were as follows:
| Undistributed ordinary income | $8,355,785 |
| Undistributed long-term capital gain | $21,388,110 |
| Net unrealized appreciation (depreciation) on securities and other investments | $88,316,101 |
The tax character of distributions paid was as follows:
| October 31, 2018 | October 31, 2017 | |
| Ordinary Income | $11,209,950 | $ 10,663,177 |
Short-Term Trading (Redemption) Fees. Shares held by investors in the Fund less than 90 days may have been subject to a redemption fee equal to 1.50% of the NAV of shares redeemed. All redemption fees, which reduce the proceeds of the shareholder redemption, are retained by the Fund and accounted for as an addition to paid in capital. In November 2017, the Board of Trustees approved the elimination of these redemption fees effective December 18, 2017.
Restricted Securities. The Fund may invest in securities that are subject to legal or contractual restrictions on resale. These securities generally may be resold in transactions exempt from registration or to the public if the securities are registered. Disposal of these securities may involve time-consuming negotiations and expense, and prompt sale at an acceptable price may be difficult. Information regarding restricted securities is included at the end of the Fund's Schedule of Investments.
New Rule Issuance. During August 2018, the U.S. Securities and Exchange Commission issued Final Rule Release No. 33-10532, Disclosure Update and Simplification. This Final Rule includes amendments specific to registered investment companies that are intended to eliminate overlap in disclosure requirements between Regulation S-X and GAAP. In accordance with these amendments, certain line-items in the Fund's financial statements have been combined or removed for the current period as outlined in the table below.
| Financial Statement | Current Line-Item Presentation | Prior Line-Item Presentation |
| Statement of Assets and Liabilities | Total distributable earnings (loss) | Undistributed/Distributions in excess of/Accumulated net investment income (loss) Accumulated/Undistributed net realized gain (loss) Net unrealized appreciation (depreciation) |
| Statement of Changes in Net Assets | N/A - removed | Undistributed/Distributions in excess of/Accumulated net investment income (loss) end of period |
| Statement of Changes in Net Assets | Distributions to shareholders | Distributions to shareholders from net investment income Distributions to shareholders from net realized gain |
4. Purchases and Sales of Investments.
Purchases and sales of securities, other than short-term securities, aggregated $442,204,191 and $652,733,779, respectively.
5. Fees and Other Transactions with Affiliates.
Management Fee. Fidelity Management & Research Company (the investment adviser) and its affiliates provide the Fund with investment management related services for which the Fund pays a monthly management fee. The management fee is the sum of an individual fund fee rate that is based on an annual rate of .45% of the Fund's average net assets and an annualized group fee rate that averaged .24% during the period. The group fee rate is based upon the average net assets of all the mutual funds advised by the investment adviser, including any mutual funds previously advised by the investment adviser that are currently advised by Fidelity SelectCo, LLC, an affiliate of the investment adviser. The group fee rate decreases as assets under management increase and increases as assets under management decrease. In addition, the management fee is subject to a performance adjustment (up to a maximum of +/- .20% of the Fund's average net assets over a 36 month performance period). The upward or downward adjustment to the management fee is based on the Fund's relative investment performance as compared to its benchmark index, the MSCI All Country Asia ex Japan Index, over the same 36 month performance period. For the reporting period, the total annual management fee rate, including the performance adjustment, was .74% of the Fund's average net assets. The performance adjustment included in the management fee rate may be higher or lower than the maximum performance adjustment rate due to the difference between the average net assets for the reporting and performance periods.
Transfer Agent Fees. Fidelity Investments Institutional Operations Company, Inc. (FIIOC), an affiliate of the investment adviser, is the Fund's transfer, dividend disbursing and shareholder servicing agent. FIIOC receives account fees and asset-based fees that vary according to account size and type of account. FIIOC pays for typesetting, printing and mailing of shareholder reports, except proxy statements. For the period, the transfer agent fees were equivalent to an annual rate of .17% of average net assets.
Accounting and Security Lending Fees. Fidelity Service Company, Inc. (FSC), an affiliate of the investment adviser, maintains the Fund's accounting records. The accounting fee is based on the level of average net assets for each month. Under a separate contract, FSC administers the security lending program. The security lending fee is based on the number and duration of lending transactions. For the period, the fees were equivalent to an annual rate of .05%.
Brokerage Commissions. The Fund placed a portion of its portfolio transactions with brokerage firms which are affiliates of the investment adviser. Brokerage commissions are included in net realized gain (loss) and change in net unrealized appreciation (depreciation) in the Statement of Operations. The commissions paid to these affiliated firms were $590 for the period.
Interfund Lending Program. Pursuant to an Exemptive Order issued by the SEC, the Fund, along with other registered investment companies having management contracts with Fidelity Management & Research Company (FMR) or other affiliated entities of FMR, may participate in an interfund lending program. This program provides an alternative credit facility allowing the funds to borrow from, or lend money to, other participating affiliated funds. At period end, there were no interfund loans outstanding. The Fund's activity in this program during the period for which loans were outstanding was as follows:
| Borrower or Lender | Average Loan Balance | Weighted Average Interest Rate | Interest Expense |
| Borrower | $18,546,167 | 2.00% | $6,195 |
Interfund Trades. The Fund may purchase from or sell securities to other Fidelity Funds under procedures adopted by the Board. The procedures have been designed to ensure these interfund trades are executed in accordance with Rule 17a-7 of the 1940 Act. Interfund trades are included within the respective purchases and sales amounts shown in the Purchases and Sales of Investments note.
6. Committed Line of Credit.
The Fund participates with other funds managed by the investment adviser or an affiliate in a $4.25 billion credit facility (the "line of credit") to be utilized for temporary or emergency purposes to fund shareholder redemptions or for other short-term liquidity purposes. The Fund has agreed to pay commitment fees on its pro-rata portion of the line of credit, which amounted to $3,607 and is reflected in Miscellaneous expenses on the Statement of Operations. During the period, the Fund did not borrow on this line of credit.
7. Security Lending.
The Fund lends portfolio securities through a lending agent from time to time in order to earn additional income. For equity securities, a lending agent is used and may loan securities to certain qualified borrowers, including Fidelity Capital Markets (FCM), a broker-dealer affiliated with the Fund. On the settlement date of the loan, the Fund receives collateral (in the form of U.S. Treasury obligations, letters of credit and/or cash) against the loaned securities and maintains collateral in an amount not less than 100% of the market value of the loaned securities during the period of the loan. The market value of the loaned securities is determined at the close of business of the Fund and any additional required collateral is delivered to the Fund on the next business day. The Fund or borrower may terminate the loan at any time, and if the borrower defaults on its obligation to return the securities loaned because of insolvency or other reasons, the Fund may apply collateral received from the borrower against the obligation. The Fund may experience delays and costs in recovering the securities loaned. Any cash collateral received is invested in the Fidelity Securities Lending Cash Central Fund. The value of loaned securities and cash collateral at period end are disclosed on the Fund's Statement of Assets and Liabilities. Security lending income represents the income earned on investing cash collateral, less rebates paid to borrowers and any lending agent fees associated with the loan, plus any premium payments received for lending certain types of securities. Security lending income is presented in the Statement of Operations as a component of income from Fidelity Central Funds. Total security lending income during the period amounted to $17,792. During the period, there were no securities loaned to FCM.
8. Expense Reductions.
Commissions paid to certain brokers with whom the investment adviser, or its affiliates, places trades on behalf of the Fund include an amount in addition to trade execution, which may be rebated back to the Fund to offset certain expenses. This amount totaled $264,749 for the period. In addition, through arrangements with the Fund's custodian, credits realized as a result of certain uninvested cash balances were used to reduce the Fund's expenses. During the period, these credits reduced the Fund's custody expenses by $870.
In addition, during the period the investment adviser reimbursed and/or waived a portion of operating expenses in the amount of $12,741.
9. Other.
The Fund's organizational documents provide former and current trustees and officers with a limited indemnification against liabilities arising in connection with the performance of their duties to the Fund. In the normal course of business, the Fund may also enter into contracts that provide general indemnifications. The Fund's maximum exposure under these arrangements is unknown as this would be dependent on future claims that may be made against the Fund. The risk of material loss from such claims is considered remote.
Fidelity® Emerging Markets Fund
Performance: The Bottom Line
Average annual total return reflects the change in the value of an investment, assuming reinvestment of distributions from dividend income and capital gains (the profits earned upon the sale of securities that have grown in value, if any) and assuming a constant rate of performance each year. The hypothetical investment and the average annual total returns do not reflect the deduction of taxes that a shareholder would pay on fund distributions or the redemption of fund shares. During periods of reimbursement by Fidelity, a fund’s total return will be greater than it would be had the reimbursement not occurred. How a fund did yesterday is no guarantee of how it will do tomorrow.
Average Annual Total Returns
| For the periods ended October 31, 2018 | Past 1 year | Past 5 years | Past 10 years |
| Fidelity® Emerging Markets Fund | (14.51)% | 2.27% | 7.93% |
$10,000 Over 10 Years
Let's say hypothetically that $10,000 was invested in Fidelity® Emerging Markets Fund, a class of the fund, on October31, 2008.
The chart shows how the value of your investment would have changed, and also shows how the MSCI Emerging Markets Index performed over the same period.
See above for additional information regarding the performance of Fidelity® Emerging Markets Fund.

| Period Ending Values | ||
| $21,449 | Fidelity® Emerging Markets Fund | |
| $21,968 | MSCI Emerging Markets Index | |
Fidelity® Emerging Markets Fund
Management's Discussion of Fund Performance
Market Recap: International equities returned -8.08% for the 12 months ending October 31, 2018, according to the MSCI ACWI (All Country World Index) ex USA Index. A modestly positive first half of the period gave way to a confluence of overwhelmingly negative factors – including escalating trade tensions, a surging U.S. dollar, tepid economic growth in Europe, global central bank tightening, concerns about Italy’s budget stalemate with the EU, and weakness in China’s stock market – that yielded a -11% second-half return. The index lost 8% in October alone, its largest monthly drop in more than six years. Among sectors, new-media-infused communications services (-15%) was hit the hardest, while economically sensitive consumer discretionary (-13%), information technology (-12%), financials (-10%), industrials (-9%) and materials (-7%) stocks also fared poorly. Even the more defensive real estate (-9%), utilities (-6%) and consumer staples (-5%) sectors weren’t spared this period. Conversely, elevated crude-oil prices fueled a positive return for energy (+7%), the top-performing sector, followed by the relatively stable-growing health care segment (+2%). Regionally, emerging markets (-12%) fared the worst, hampered by the impact of foreign exchange and concerns about economic weakness in China, India and South Korea. Sluggish growth also pressured shares in continental Europe (-9%). Stocks in Japan (-3%) and the U.K. (-4%) held up better, followed by Canada (-5%) and Asia-Pacific ex Japan (-6%).Comments from Portfolio Manager Sammy Simnegar: For the fiscal year, the fund’s share classes returned roughly returned roughly-14% to -15%, trailing the -12.49% return of the benchmark MSCI Emerging Markets Index. Versus the benchmark, positioning in energy was the biggest detractor, along with security selection within communication services and consumer staples. Geographically, stock picks in China and India detracted the most by far. Among individual stocks, avoiding strong-performing, Brazil-based metals miner Vale hampered relative performance the most. Avoiding a trio of state-run energy giants, Brazil’s Petroleo Brasileiro (aka Petrobras), Russia’s Lukoil, and China’s CNOOC, also worked against us. Additionally, Argentine bank Banco Macro detracted but was not held in the fund at period end. Turning to sectors, stock selection in information technology was the largest relative contributor. I'll note that the fund's small cash position – representing about 1% of assets, on average – helped our relative result considerably in a down market. Regionally, out-of-benchmark exposure to the United States and continental Europe aided relative results. The top individual contributor was an overweight stake in Brazil-based reinsurance provider IRB Brasil Resseguros due to the stock’s strong showing and timely positioning on our part. Another contributor was an out-of-benchmark stake in Wirecard, a Germany-based provider of online payment processing purchased during the period. Lastly, avoiding weak-performing benchmark name Hon Hai Precision also proved beneficial.The views expressed above reflect those of the portfolio manager(s) only through the end of the period as stated on the cover of this report and do not necessarily represent the views of Fidelity or any other person in the Fidelity organization. Any such views are subject to change at any time based upon market or other conditions and Fidelity disclaims any responsibility to update such views. These views may not be relied on as investment advice and, because investment decisions for a Fidelity fund are based on numerous factors, may not be relied on as an indication of trading intent on behalf of any Fidelity fund.
Fidelity® Emerging Markets Fund
Investment Summary (Unaudited)
Geographic Diversification (% of fund's net assets)
| As of October 31, 2018 | ||
| Cayman Islands | 15.6% | |
| India | 11.8% | |
| United States of America* | 9.0% | |
| China | 8.5% | |
| Brazil | 8.3% | |
| Taiwan | 7.1% | |
| Korea (South) | 6.6% | |
| South Africa | 5.2% | |
| Russia | 3.0% | |
| Other | 24.9% | |
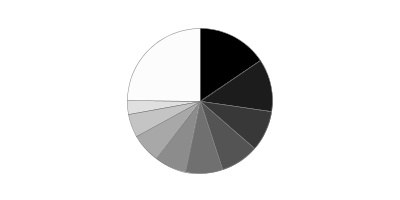
* Includes Short-Term investments and Net Other Assets (Liabilities).
Percentages are based on country or territory of incorporation and are adjusted for the effect of futures contracts, if applicable.
Asset Allocation as of October 31, 2018
| % of fund's net assets | |
| Stocks | 98.4 |
| Short-Term Investments and Net Other Assets (Liabilities) | 1.6 |
Top Ten Stocks as of October 31, 2018
| % of fund's net assets | |
| Samsung Electronics Co. Ltd. (Korea (South), Technology Hardware, Storage & Peripherals) | 4.9 |
| Tencent Holdings Ltd. (Cayman Islands, Interactive Media & Services) | 4.8 |
| Taiwan Semiconductor Manufacturing Co. Ltd. (Taiwan, Semiconductors & Semiconductor Equipment) | 4.6 |
| Alibaba Group Holding Ltd. sponsored ADR (Cayman Islands, Internet & Direct Marketing Retail) | 4.1 |
| Naspers Ltd. Class N (South Africa, Media) | 2.2 |
| Itau Unibanco Holding SA (Brazil, Banks) | 1.7 |
| Ping An Insurance (Group) Co. of China Ltd. (H Shares) (China, Insurance) | 1.7 |
| Baidu.com, Inc. sponsored ADR (Cayman Islands, Interactive Media & Services) | 1.6 |
| Reliance Industries Ltd. (India, Oil, Gas & Consumable Fuels) | 1.4 |
| Housing Development Finance Corp. Ltd. (India, Thrifts & Mortgage Finance) | 1.4 |
| 28.4 |
Top Market Sectors as of October 31, 2018
| % of fund's net assets | |
| Financials | 20.7 |
| Consumer Discretionary | 17.5 |
| Information Technology | 16.8 |
| Consumer Staples | 10.6 |
| Communication Services | 10.4 |
| Materials | 8.5 |
| Industrials | 6.8 |
| Energy | 2.4 |
| Real Estate | 2.1 |
| Health Care | 2.0 |
Fidelity® Emerging Markets Fund
Schedule of Investments October 31, 2018
Showing Percentage of Net Assets
| Common Stocks - 95.8% | |||
| Shares | Value | ||
| Belgium - 0.6% | |||
| Umicore SA | 573,738 | $27,027,026 | |
| Bermuda - 1.0% | |||
| Credicorp Ltd. (United States) | 198,832 | 44,878,371 | |
| Brazil - 5.7% | |||
| BM&F BOVESPA SA | 5,551,900 | 39,593,558 | |
| CVC Brasil Operadora e Agencia de Viagens SA | 1,818,200 | 27,652,860 | |
| IRB Brasil Resseguros SA | 1,595,600 | 31,067,359 | |
| Localiza Rent A Car SA | 4,890,900 | 37,784,059 | |
| Lojas Renner SA | 3,464,000 | 34,998,361 | |
| Notre Dame Intermedica Participacoes SA | 4,813,100 | 31,207,874 | |
| Rumo SA (a) | 4,527,400 | 20,255,599 | |
| Suzano Papel e Celulose SA | 2,741,700 | 27,884,817 | |
| TOTAL BRAZIL | 250,444,487 | ||
| Cayman Islands - 15.6% | |||
| 58.com, Inc. ADR (a) | 481,400 | 31,575,026 | |
| Alibaba Group Holding Ltd. sponsored ADR (a) | 1,265,700 | 180,083,796 | |
| Baidu.com, Inc. sponsored ADR (a) | 375,500 | 71,367,530 | |
| Baozun, Inc. sponsored ADR (a)(b) | 683,300 | 27,202,173 | |
| Huazhu Group Ltd. ADR | 1,064,400 | 27,844,704 | |
| New Oriental Education & Technology Group, Inc. sponsored ADR | 641,983 | 37,562,425 | |
| Shenzhou International Group Holdings Ltd. | 2,953,000 | 32,610,486 | |
| Sunny Optical Technology Group Co. Ltd. | 3,216,400 | 27,890,410 | |
| TAL Education Group ADR (a) | 1,322,800 | 38,334,744 | |
| Tencent Holdings Ltd. | 6,071,300 | 207,998,267 | |
| TOTAL CAYMAN ISLANDS | 682,469,561 | ||
| Chile - 1.4% | |||
| Banco Santander Chile sponsored ADR | 1,078,100 | 31,760,826 | |
| Sociedad Quimica y Minera de Chile SA (PN-B) sponsored ADR (b) | 707,500 | 30,995,575 | |
| TOTAL CHILE | 62,756,401 | ||
| China - 8.5% | |||
| China International Travel Service Corp. Ltd. (A Shares) | 3,781,271 | 29,098,167 | |
| Gree Electric Appliances, Inc. of Zhuhai Class A (a) | 4,288,035 | 23,396,044 | |
| Hangzhou Hikvision Digital Technology Co. Ltd. Class A | 7,402,760 | 25,681,735 | |
| Inner Mongoli Yili Industries Co. Ltd. (A Shares) | 8,441,746 | 26,720,628 | |
| Jiangsu Yanghe Brewery Joint-Stock Co. Ltd. Class A | 2,165,394 | 27,438,185 | |
| Kweichow Moutai Co. Ltd. (A Shares) | 387,984 | 30,529,688 | |
| Midea Group Co. Ltd. Class A | 5,333,848 | 28,322,196 | |
| Ping An Insurance (Group) Co. of China Ltd. (H Shares) | 7,847,500 | 73,902,266 | |
| Shanghai International Airport Co. Ltd. (A Shares) | 4,000,604 | 28,417,413 | |
| Shenzhen Inovance Technology Co. Ltd. Class A | 7,845,981 | 25,059,809 | |
| Wuliangye Yibin Co. Ltd. Class A | 3,744,749 | 25,848,439 | |
| Yunnan Baiyao Group Co. Ltd. (c) | 2,592,537 | 26,101,349 | |
| TOTAL CHINA | 370,515,919 | ||
| France - 2.9% | |||
| Hermes International SCA | 45,401 | 25,968,839 | |
| Kering SA | 59,505 | 26,527,986 | |
| LVMH Moet Hennessy - Louis Vuitton SA | 82,558 | 25,048,545 | |
| Pernod Ricard SA | 169,200 | 25,833,662 | |
| Thales SA | 179,100 | 22,922,910 | |
| TOTAL FRANCE | 126,301,942 | ||
| Germany - 1.2% | |||
| adidas AG | 115,943 | 27,315,150 | |
| Wirecard AG | 134,400 | 25,178,538 | |
| TOTAL GERMANY | 52,493,688 | ||
| Hong Kong - 1.8% | |||
| AIA Group Ltd. | 3,526,600 | 26,690,263 | |
| China Resources Beer Holdings Co. Ltd. | 8,206,000 | 28,515,038 | |
| Techtronic Industries Co. Ltd. | 5,167,500 | 24,183,685 | |
| TOTAL HONG KONG | 79,388,986 | ||
| India - 11.8% | |||
| Adani Ports & Special Economic Zone Ltd. | 3,047,827 | 13,139,530 | |
| Asian Paints Ltd. | 1,828,345 | 30,416,383 | |
| Dabur India Ltd. | 4,840,700 | 25,181,981 | |
| Eicher Motors Ltd. | 91,902 | 27,168,746 | |
| Godrej Consumer Products Ltd. | 2,965,096 | 29,059,625 | |
| HDFC Bank Ltd. | 1,005,397 | 26,100,372 | |
| Hindustan Unilever Ltd. | 1,739,000 | 38,130,561 | |
| Housing Development Finance Corp. Ltd. | 2,595,046 | 62,077,949 | |
| Indraprastha Gas Ltd. | 7,397,561 | 26,735,642 | |
| IndusInd Bank Ltd. | 1,298,822 | 25,026,382 | |
| ITC Ltd. | 9,395,700 | 35,583,228 | |
| Kotak Mahindra Bank Ltd. | 1,650,248 | 24,971,269 | |
| Maruti Suzuki India Ltd. | 381,295 | 34,110,333 | |
| Pidilite Industries Ltd. | 1,859,927 | 24,112,912 | |
| Reliance Industries Ltd. | 4,430,318 | 63,570,511 | |
| Titan Co. Ltd. | 2,614,381 | 29,855,411 | |
| TOTAL INDIA | 515,240,835 | ||
| Indonesia - 1.8% | |||
| PT Bank Central Asia Tbk | 25,428,800 | 39,558,699 | |
| PT Bank Rakyat Indonesia Tbk | 185,489,300 | 38,433,895 | |
| TOTAL INDONESIA | 77,992,594 | ||
| Ireland - 0.6% | |||
| Accenture PLC Class A | 165,600 | 26,101,872 | |
| Japan - 0.6% | |||
| Keyence Corp. | 52,200 | 25,583,019 | |
| Kenya - 0.5% | |||
| Safaricom Ltd. | 97,837,300 | 22,279,307 | |
| Korea (South) - 6.6% | |||
| LG Chemical Ltd. | 133,227 | 40,516,888 | |
| LG Household & Health Care Ltd. | 37,634 | 34,434,615 | |
| Samsung Electronics Co. Ltd. | 5,742,227 | 213,383,372 | |
| TOTAL KOREA (SOUTH) | 288,334,875 | ||
| Mexico - 2.5% | |||
| Embotelladoras Arca S.A.B. de CV | 3,740,900 | 18,812,004 | |
| Grupo Aeroportuario del Pacifico S.A.B. de CV Series B | 3,067,657 | 25,378,497 | |
| Grupo Aeroportuario del Sureste S.A.B. de CV Series B | 1,748,120 | 29,056,662 | |
| Wal-Mart de Mexico SA de CV Series V | 14,901,600 | 38,058,657 | |
| TOTAL MEXICO | 111,305,820 | ||
| Netherlands - 1.8% | |||
| ASML Holding NV (Netherlands) | 151,100 | 26,026,088 | |
| Ferrari NV | 220,300 | 25,825,609 | |
| Yandex NV Series A (a) | 944,800 | 28,466,824 | |
| TOTAL NETHERLANDS | 80,318,521 | ||
| Philippines - 2.8% | |||
| Ayala Corp. | 1,699,845 | 29,265,442 | |
| Ayala Land, Inc. | 41,229,600 | 30,592,167 | |
| SM Investments Corp. | 1,843,793 | 31,053,646 | |
| SM Prime Holdings, Inc. | 49,490,400 | 31,303,694 | |
| TOTAL PHILIPPINES | 122,214,949 | ||
| Russia - 3.0% | |||
| Alrosa Co. Ltd. | 19,248,600 | 29,191,220 | |
| NOVATEK OAO GDR (Reg. S) | 258,022 | 43,734,729 | |
| Sberbank of Russia | 19,591,110 | 56,310,443 | |
| TOTAL RUSSIA | 129,236,392 | ||
| South Africa - 5.2% | |||
| Capitec Bank Holdings Ltd. | 440,000 | 29,547,182 | |
| Discovery Ltd. | 2,747,985 | 29,418,015 | |
| FirstRand Ltd. | 9,344,300 | 40,734,244 | |
| Mondi Ltd. | 1,238,966 | 29,636,084 | |
| Naspers Ltd. Class N | 545,712 | 95,906,225 | |
| TOTAL SOUTH AFRICA | 225,241,750 | ||
| Spain - 0.6% | |||
| Amadeus IT Holding SA Class A | 319,400 | 25,750,675 | |
| Sweden - 0.6% | |||
| Hexagon AB (B Shares) | 523,000 | 25,638,067 | |
| Switzerland - 0.7% | |||
| Sika AG | 222,619 | 28,558,184 | |
| Taiwan - 7.1% | |||
| E.SUN Financial Holdings Co. Ltd. | 47,252,000 | 31,287,156 | |
| Formosa Chemicals & Fibre Corp. | 10,897,000 | 39,420,035 | |
| Formosa Plastics Corp. | 12,358,000 | 40,314,530 | |
| Taiwan Semiconductor Manufacturing Co. Ltd. | 26,654,000 | 199,988,659 | |
| TOTAL TAIWAN | 311,010,380 | ||
| Thailand - 1.6% | |||
| Airports of Thailand PCL (For. Reg.) | 17,046,300 | 32,899,976 | |
| C.P. ALL PCL (For. Reg.) | 17,195,400 | 34,873,059 | |
| TOTAL THAILAND | 67,773,035 | ||
| United Arab Emirates - 0.7% | |||
| National Bank of Abu Dhabi PJSC | 7,579,300 | 28,516,648 | |
| United Kingdom - 1.2% | |||
| British American Tobacco PLC (United Kingdom) | 541,200 | 23,461,165 | |
| NMC Health PLC | 646,200 | 29,173,361 | |
| TOTAL UNITED KINGDOM | 52,634,526 | ||
| United States of America - 7.4% | |||
| American Tower Corp. | 186,700 | 29,089,727 | |
| Amphenol Corp. Class A | 315,600 | 28,246,200 | |
| Constellation Brands, Inc. Class A (sub. vtg.) | 121,900 | 24,286,137 | |
| MasterCard, Inc. Class A | 133,200 | 26,329,644 | |
| MercadoLibre, Inc. | 94,800 | 30,762,600 | |
| Moody's Corp. | 168,100 | 24,455,188 | |
| MSCI, Inc. | 175,300 | 26,361,614 | |
| NVIDIA Corp. | 116,300 | 24,519,529 | |
| S&P Global, Inc. | 145,000 | 26,436,400 | |
| Sherwin-Williams Co. | 67,300 | 26,480,531 | |
| TransDigm Group, Inc. (a) | 75,900 | 25,065,975 | |
| Visa, Inc. Class A | 215,900 | 29,761,815 | |
| TOTAL UNITED STATES OF AMERICA | 321,795,360 | ||
| TOTAL COMMON STOCKS | |||
| (Cost $3,427,002,516) | 4,181,803,190 | ||
| Nonconvertible Preferred Stocks - 2.6% | |||
| Brazil - 2.6% | |||
| Itau Unibanco Holding SA | 5,601,610 | 74,131,209 | |
| Itausa-Investimentos Itau SA (PN) | 13,660,100 | 41,257,430 | |
| TOTAL BRAZIL | 115,388,639 | ||
| TOTAL NONCONVERTIBLE PREFERRED STOCKS | |||
| (Cost $86,779,526) | 115,388,639 | ||
| Money Market Funds - 2.7% | |||
| Fidelity Cash Central Fund, 2.23% (d) | 66,563,248 | 66,576,561 | |
| Fidelity Securities Lending Cash Central Fund 2.23% (d)(e) | 50,689,171 | 50,694,240 | |
| TOTAL MONEY MARKET FUNDS | |||
| (Cost $117,270,801) | 117,270,801 | ||
| TOTAL INVESTMENT IN SECURITIES - 101.1% | |||
| (Cost $3,631,052,843) | 4,414,462,630 | ||
| NET OTHER ASSETS (LIABILITIES) - (1.1)% | (50,020,167) | ||
| NET ASSETS - 100% | $4,364,442,463 |
Categorizations in the Schedule of Investments are based on country or territory of incorporation.
Legend
(a) Non-income producing
(b) Security or a portion of the security is on loan at period end.
(c) Level 3 security
(d) Affiliated fund that is generally available only to investment companies and other accounts managed by Fidelity Investments. The rate quoted is the annualized seven-day yield of the fund at period end. A complete unaudited listing of the fund's holdings as of its most recent quarter end is available upon request. In addition, each Fidelity Central Fund's financial statements, which are not covered by the Fund's Report of Independent Registered Public Accounting Firm, are available on the SEC's website or upon request.
(e) Investment made with cash collateral received from securities on loan.
Affiliated Central Funds
Information regarding fiscal year to date income earned by the Fund from investments in Fidelity Central Funds is as follows:
| Fund | Income earned |
| Fidelity Cash Central Fund | $1,111,045 |
| Fidelity Securities Lending Cash Central Fund | 406,557 |
| Total | $1,517,602 |
Amounts in the income column in the above table include any capital gain distributions from underlying funds, which are presented in the corresponding line-item in the Statement of Operations if applicable.
Investment Valuation
The following is a summary of the inputs used, as of October 31, 2018, involving the Fund's assets and liabilities carried at fair value. The inputs or methodology used for valuing securities may not be an indication of the risk associated with investing in those securities. For more information on valuation inputs, and their aggregation into the levels used below, please refer to the Investment Valuation section in the accompanying Notes to Financial Statements.
| Valuation Inputs at Reporting Date: | ||||
| Description | Total | Level 1 | Level 2 | Level 3 |
| Investments in Securities: | ||||
| Equities: | ||||
| Communication Services | $457,593,179 | $249,594,912 | $207,998,267 | $-- |
| Consumer Discretionary | 763,872,860 | 738,824,315 | 25,048,545 | -- |
| Consumer Staples | 466,766,672 | 443,305,507 | 23,461,165 | -- |
| Energy | 107,305,240 | 107,305,240 | -- | -- |
| Financials | 901,782,180 | 819,371,365 | 82,410,815 | -- |
| Health Care | 86,482,584 | 60,381,235 | -- | 26,101,349 |
| Industrials | 291,034,076 | 291,034,076 | -- | -- |
| Information Technology | 730,079,623 | 504,064,876 | 226,014,747 | -- |
| Materials | 374,554,185 | 374,554,185 | -- | -- |
| Real Estate | 90,985,588 | 90,985,588 | -- | -- |
| Utilities | 26,735,642 | 26,735,642 | -- | -- |
| Money Market Funds | 117,270,801 | 117,270,801 | -- | -- |
| Total Investments in Securities: | $4,414,462,630 | $3,823,427,742 | $564,933,539 | $26,101,349 |
See accompanying notes which are an integral part of the financial statements.
Fidelity® Emerging Markets Fund
Financial Statements
Statement of Assets and Liabilities
| October 31, 2018 | ||
| Assets | ||
| Investment in securities, at value (including securities loaned of $51,529,613) — See accompanying schedule: Unaffiliated issuers (cost $3,513,782,042) | $4,297,191,829 | |
| Fidelity Central Funds (cost $117,270,801) | 117,270,801 | |
| Total Investment in Securities (cost $3,631,052,843) | $4,414,462,630 | |
| Cash | 2,192 | |
| Foreign currency held at value (cost $12,042,587) | 11,979,768 | |
| Receivable for investments sold | 67,655,064 | |
| Receivable for fund shares sold | 27,032,216 | |
| Dividends receivable | 4,319,121 | |
| Distributions receivable from Fidelity Central Funds | 221,141 | |
| Prepaid expenses | 9,467 | |
| Other receivables | 2,013,803 | |
| Total assets | 4,527,695,402 | |
| Liabilities | ||
| Payable for investments purchased | $102,709,520 | |
| Payable for fund shares redeemed | 5,766,040 | |
| Accrued management fee | 2,524,440 | |
| Other affiliated payables | 750,553 | |
| Other payables and accrued expenses | 816,431 | |
| Collateral on securities loaned | 50,685,955 | |
| Total liabilities | 163,252,939 | |
| Net Assets | $4,364,442,463 | |
| Net Assets consist of: | ||
| Paid in capital | $3,851,282,396 | |
| Total distributable earnings (loss) | 513,160,067 | |
| Net Assets | $4,364,442,463 | |
| Net Asset Value and Maximum Offering Price | ||
| Emerging Markets: | ||
| Net Asset Value, offering price and redemption price per share ($3,493,583,427 ÷ 131,038,172 shares) | $26.66 | |
| Class K: | ||
| Net Asset Value, offering price and redemption price per share ($870,859,036 ÷ 32,617,794 shares) | $26.70 |
See accompanying notes which are an integral part of the financial statements.
Statement of Operations
| Year ended October 31, 2018 | ||
| Investment Income | ||
| Dividends | $93,408,401 | |
| Income from Fidelity Central Funds | 1,517,602 | |
| Income before foreign taxes withheld | 94,926,003 | |
| Less foreign taxes withheld | (9,498,462) | |
| Total income | 85,427,541 | |
| Expenses | ||
| Management fee | $35,319,356 | |
| Transfer agent fees | 8,111,400 | |
| Accounting and security lending fees | 1,574,293 | |
| Custodian fees and expenses | 1,975,496 | |
| Independent trustees' fees and expenses | 25,592 | |
| Registration fees | 188,568 | |
| Audit | 174,577 | |
| Legal | 13,856 | |
| Interest | 67,176 | |
| Miscellaneous | 33,251 | |
| Total expenses before reductions | 47,483,565 | |
| Expense reductions | (1,820,359) | |
| Total expenses after reductions | 45,663,206 | |
| Net investment income (loss) | 39,764,335 | |
| Realized and Unrealized Gain (Loss) | ||
| Net realized gain (loss) on: | ||
| Investment securities: | ||
| Unaffiliated issuers | (46,893,348) | |
| Fidelity Central Funds | 11,976 | |
| Foreign currency transactions | 639,248 | |
| Total net realized gain (loss) | (46,242,124) | |
| Change in net unrealized appreciation (depreciation) on: | ||
| Investment securities: | ||
| Unaffiliated issuers (net of decrease in deferred foreign taxes of $8,307,470) | (732,652,567) | |
| Assets and liabilities in foreign currencies | (336,190) | |
| Total change in net unrealized appreciation (depreciation) | (732,988,757) | |
| Net gain (loss) | (779,230,881) | |
| Net increase (decrease) in net assets resulting from operations | $(739,466,546) |
See accompanying notes which are an integral part of the financial statements.
Statement of Changes in Net Assets
| Year ended October 31, 2018 | Year ended October 31, 2017 | |
| Increase (Decrease) in Net Assets | ||
| Operations | ||
| Net investment income (loss) | $39,764,335 | $34,645,276 |
| Net realized gain (loss) | (46,242,124) | 212,503,902 |
| Change in net unrealized appreciation (depreciation) | (732,988,757) | 865,316,825 |
| Net increase (decrease) in net assets resulting from operations | (739,466,546) | 1,112,466,003 |
| Distributions to shareholders | (31,488,954) | – |
| Distributions to shareholders from net investment income | – | (23,974,554) |
| Total distributions | (31,488,954) | (23,974,554) |
| Share transactions - net increase (decrease) | 277,115,896 | 96,080,893 |
| Redemption fees | 97,832 | 379,582 |
| Total increase (decrease) in net assets | (493,741,772) | 1,184,951,924 |
| Net Assets | ||
| Beginning of period | 4,858,184,235 | 3,673,232,311 |
| End of period | $4,364,442,463 | $4,858,184,235 |
| Other Information | ||
| Undistributed net investment income end of period | $25,936,057 |
See accompanying notes which are an integral part of the financial statements.
Financial Highlights
Fidelity Emerging Markets Fund
| Years ended October 31, | 2018 | 2017 | 2016 | 2015 | 2014 |
| Selected Per–Share Data | |||||
| Net asset value, beginning of period | $31.37 | $24.25 | $22.55 | $25.44 | $24.43 |
| Income from Investment Operations | |||||
| Net investment income (loss)A | .24 | .22 | .14 | .19 | .17 |
| Net realized and unrealized gain (loss) | (4.76) | 7.05 | 1.66 | (2.91) | .86 |
| Total from investment operations | (4.52) | 7.27 | 1.80 | (2.72) | 1.03 |
| Distributions from net investment income | (.16) | (.15) | (.11) | (.14) | (.02) |
| Distributions from net realized gain | (.03) | – | – | (.03) | – |
| Total distributions | (.19) | (.15) | (.11) | (.17) | (.02) |
| Redemption fees added to paid in capitalA | –B | –B | .01 | –B | –B |
| Net asset value, end of period | $26.66 | $31.37 | $24.25 | $22.55 | $25.44 |
| Total ReturnC | (14.51)% | 30.21% | 8.07% | (10.76)% | 4.22% |
| Ratios to Average Net AssetsD,E | |||||
| Expenses before reductions | .96% | .97% | 1.01% | 1.05% | 1.07% |
| Expenses net of fee waivers, if any | .96% | .97% | 1.01% | 1.05% | 1.07% |
| Expenses net of all reductions | .92% | .96% | 1.00% | 1.03% | 1.07% |
| Net investment income (loss) | .75% | .83% | .61% | .78% | .71% |
| Supplemental Data | |||||
| Net assets, end of period (000 omitted) | $3,493,583 | $3,933,401 | $3,014,957 | $2,738,934 | $2,370,927 |
| Portfolio turnover rateF | 86% | 81% | 79% | 107% | 94% |
A Calculated based on average shares outstanding during the period.
B Amount represents less than $.005 per share.
C Total returns would have been lower if certain expenses had not been reduced during the applicable periods shown.
D Fees and expenses of any underlying Fidelity Central Funds are not included in the Fund's expense ratio. The Fund indirectly bears its proportionate share of the expenses of any underlying Fidelity Central Funds.
E Expense ratios reflect operating expenses of the class. Expenses before reductions do not reflect amounts reimbursed by the investment adviser or reductions from brokerage service arrangements or reductions from other expense offset arrangements and do not represent the amount paid by the class during periods when reimbursements or reductions occur. Expenses net of fee waivers reflect expenses after reimbursement by the investment adviser but prior to reductions from brokerage service arrangements or other expense offset arrangements. Expenses net of all reductions represent the net expenses paid by the class.
F Amount does not include the portfolio activity of any underlying Fidelity Central Funds.
See accompanying notes which are an integral part of the financial statements.
Fidelity Emerging Markets Fund Class K
| Years ended October 31, | 2018 | 2017 | 2016 | 2015 | 2014 |
| Selected Per–Share Data | |||||
| Net asset value, beginning of period | $31.41 | $24.28 | $22.58 | $25.48 | $24.42 |
| Income from Investment Operations | |||||
| Net investment income (loss)A | .28 | .26 | .18 | .24 | .23 |
| Net realized and unrealized gain (loss) | (4.76) | 7.06 | 1.66 | (2.92) | .86 |
| Total from investment operations | (4.48) | 7.32 | 1.84 | (2.68) | 1.09 |
| Distributions from net investment income | (.20) | (.19) | (.15) | (.20) | (.03) |
| Distributions from net realized gain | (.03) | – | – | (.03) | – |
| Total distributions | (.23) | (.19) | (.15) | (.22)B | (.03) |
| Redemption fees added to paid in capitalA | –C | –C | .01 | –C | –C |
| Net asset value, end of period | $26.70 | $31.41 | $24.28 | $22.58 | $25.48 |
| Total ReturnD | (14.39)% | 30.44% | 8.27% | (10.60)% | 4.47% |
| Ratios to Average Net AssetsE,F | |||||
| Expenses before reductions | .82% | .83% | .84% | .85% | .86% |
| Expenses net of fee waivers, if any | .82% | .82% | .84% | .85% | .85% |
| Expenses net of all reductions | .78% | .81% | .83% | .83% | .85% |
| Net investment income (loss) | .89% | .98% | .78% | .98% | .92% |
| Supplemental Data | |||||
| Net assets, end of period (000 omitted) | $870,859 | $924,783 | $658,276 | $554,041 | $623,430 |
| Portfolio turnover rateG | 86% | 81% | 79% | 107% | 94% |
A Calculated based on average shares outstanding during the period.
B Total distributions of $.22 per share is comprised of distributions from net investment income of $.195 and distributions from net realized gain of $.025 per share.
C Amount represents less than $.005 per share.
D Total returns would have been lower if certain expenses had not been reduced during the applicable periods shown.
E Fees and expenses of any underlying Fidelity Central Funds are not included in the Fund's expense ratio. The Fund indirectly bears its proportionate share of the expenses of any underlying Fidelity Central Funds.
F Expense ratios reflect operating expenses of the class. Expenses before reductions do not reflect amounts reimbursed by the investment adviser or reductions from brokerage service arrangements or reductions from other expense offset arrangements and do not represent the amount paid by the class during periods when reimbursements or reductions occur. Expenses net of fee waivers reflect expenses after reimbursement by the investment adviser but prior to reductions from brokerage service arrangements or other expense offset arrangements. Expenses net of all reductions represent the net expenses paid by the class.
G Amount does not include the portfolio activity of any underlying Fidelity Central Funds.
See accompanying notes which are an integral part of the financial statements.
Notes to Financial Statements
For the period ended October 31, 2018
1. Organization.
Fidelity Emerging Markets Fund (the Fund) is a fund of Fidelity Investment Trust (the Trust) and is authorized to issue an unlimited number of shares. The Trust is registered under the Investment Company Act of 1940, as amended (the 1940 Act), as an open-end management investment company organized as a Massachusetts business trust. The Fund offers Emerging Markets and Class K shares, each of which has equal rights as to assets and voting privileges. Each class has exclusive voting rights with respect to matters that affect that class. The Fund's investments in emerging markets can be subject to social, economic, regulatory, and political uncertainties and can be extremely volatile.
2. Investments in Fidelity Central Funds.
The Fund invests in Fidelity Central Funds, which are open-end investment companies generally available only to other investment companies and accounts managed by the investment adviser and its affiliates. The Fund's Schedule of Investments lists each of the Fidelity Central Funds held as of period end, if any, as an investment of the Fund, but does not include the underlying holdings of each Fidelity Central Fund. As an Investing Fund, the Fund indirectly bears its proportionate share of the expenses of the underlying Fidelity Central Funds.
The Money Market Central Funds seek preservation of capital and current income and are managed by Fidelity Investments Money Management, Inc. (FIMM), an affiliate of the investment adviser. Annualized expenses of the Money Market Central Funds as of their most recent shareholder report date are less than .005%.
A complete unaudited list of holdings for each Fidelity Central Fund is available upon request or at the Securities and Exchange Commission (the SEC) website at www.sec.gov. In addition, the financial statements of the Fidelity Central Funds, which are not covered by the Fund's Report of Independent Registered Public Accounting Firm, are available on the SEC website or upon request.
3. Significant Accounting Policies.
The Fund is an investment company and applies the accounting and reporting guidance of the Financial Accounting Standards Board (FASB) Accounting Standards Codification Topic 946 Financial Services – Investments Companies. The financial statements have been prepared in conformity with accounting principles generally accepted in the United States of America (GAAP), which require management to make certain estimates and assumptions at the date of the financial statements. Actual results could differ from those estimates. Subsequent events, if any, through the date that the financial statements were issued have been evaluated in the preparation of the financial statements. The following summarizes the significant accounting policies of the Fund:
Investment Valuation. Investments are valued as of 4:00 p.m. Eastern time on the last calendar day of the period. The Board of Trustees (the Board) has delegated the day to day responsibility for the valuation of the Fund's investments to the Fair Value Committee (the Committee) established by the Fund's investment adviser. In accordance with valuation policies and procedures approved by the Board, the Fund attempts to obtain prices from one or more third party pricing vendors or brokers to value its investments. When current market prices, quotations or currency exchange rates are not readily available or reliable, investments will be fair valued in good faith by the Committee, in accordance with procedures adopted by the Board. Factors used in determining fair value vary by investment type and may include market or investment specific events. The frequency with which these procedures are used cannot be predicted and they may be utilized to a significant extent. The Committee oversees the Fund's valuation policies and procedures and reports to the Board on the Committee's activities and fair value determinations. The Board monitors the appropriateness of the procedures used in valuing the Fund's investments and ratifies the fair value determinations of the Committee.
The Fund categorizes the inputs to valuation techniques used to value its investments into a disclosure hierarchy consisting of three levels as shown below:
- Level 1 – quoted prices in active markets for identical investments
- Level 2 – other significant observable inputs (including quoted prices for similar investments, interest rates, prepayment speeds, etc.)
- Level 3 – unobservable inputs (including the Fund's own assumptions based on the best information available)
Valuation techniques used to value the Fund's investments by major category are as follows:
Equity securities, including restricted securities, for which market quotations are readily available, are valued at the last reported sale price or official closing price as reported by a third party pricing vendor on the primary market or exchange on which they are traded and are categorized as Level 1 in the hierarchy. In the event there were no sales during the day or closing prices are not available, securities are valued at the last quoted bid price or may be valued using the last available price and are generally categorized as Level 2 in the hierarchy. For foreign equity securities, when market or security specific events arise, comparisons to the valuation of American Depositary Receipts (ADRs), futures contracts, Exchange-Traded Funds (ETFs) and certain indexes as well as quoted prices for similar securities may be used and would be categorized as Level 2 in the hierarchy. Utilizing these techniques may result in transfers between Level 1 and Level 2. For equity securities, including restricted securities, where observable inputs are limited, assumptions about market activity and risk are used and these securities may be categorized as Level 3 in the hierarchy. Equity securities, including restricted securities, for which observable inputs are not available are valued using alternate valuation approaches, including the market approach and the income approach and are categorized as Level 3 in the hierarchy.
Investments in open-end mutual funds, including the Fidelity Central Funds, are valued at their closing net asset value (NAV) each business day and are categorized as Level 1 in the hierarchy.
Changes in valuation techniques may result in transfers in or out of an assigned level within the disclosure hierarchy. The aggregate value of investments by input level as of October 31, 2018 is included at the end of the Fund's Schedule of Investments.
Foreign Currency. The Fund may use foreign currency contracts to facilitate transactions in foreign-denominated securities. Gains and losses from these transactions may arise from changes in the value of the foreign currency or if the counterparties do not perform under the contracts' terms.
Foreign-denominated assets, including investment securities, and liabilities are translated into U.S. dollars at the exchange rates at period end. Purchases and sales of investment securities, income and dividends received and expenses denominated in foreign currencies are translated into U.S. dollars at the exchange rate in effect on the transaction date.
The effects of exchange rate fluctuations on investments are included with the net realized and unrealized gain (loss) on investment securities. Other foreign currency transactions resulting in realized and unrealized gain (loss) are disclosed separately.
Investment Transactions and Income. For financial reporting purposes, the Fund's investment holdings and NAV include trades executed through the end of the last business day of the period. The NAV per share for processing shareholder transactions is calculated as of the close of business of the New York Stock Exchange (NYSE), normally 4:00 p.m. Eastern time and includes trades executed through the end of the prior business day. Gains and losses on securities sold are determined on the basis of identified cost and include proceeds received from litigation. Dividend income is recorded on the ex-dividend date, except for certain dividends from foreign securities where the ex-dividend date may have passed, which are recorded as soon as the Fund is informed of the ex-dividend date. Non-cash dividends included in dividend income, if any, are recorded at the fair market value of the securities received. Income and capital gain distributions from Fidelity Central Funds, if any, are recorded on the ex-dividend date. Certain distributions received by the Fund represent a return of capital or capital gain. The Fund determines the components of these distributions subsequent to the ex-dividend date, based upon receipt of tax filings or other correspondence relating to the underlying investment. These distributions are recorded as a reduction of cost of investments and/or as a realized gain. Investment income is recorded net of foreign taxes withheld where recovery of such taxes is uncertain.
Class Allocations and Expenses. Investment income, realized and unrealized capital gains and losses, common expenses of the Fund, and certain fund-level expense reductions, if any, are allocated daily on a pro-rata basis to each class based on the relative net assets of each class to the total net assets of the Fund. Each class differs with respect to transfer agent fees incurred. Certain expense reductions may also differ by class. For the reporting period, the allocated portion of income and expenses to each class as a percent of its average net assets may vary due to the timing of recording these transactions in relation to fluctuating net assets of the classes. Expenses directly attributable to a fund are charged to that fund. Expenses attributable to more than one fund are allocated among the respective funds on the basis of relative net assets or other appropriate methods. Expense estimates are accrued in the period to which they relate and adjustments are made when actual amounts are known.
Income Tax Information and Distributions to Shareholders. Each year, the Fund intends to qualify as a regulated investment company under Subchapter M of the Internal Revenue Code, including distributing substantially all of its taxable income and realized gains. As a result, no provision for U.S. Federal income taxes is required. As of October 31, 2018, the Fund did not have any unrecognized tax benefits in the financial statements; nor is the Fund aware of any tax positions for which it is reasonably possible that the total amounts of unrecognized tax benefits will significantly change in the next twelve months. The Fund files a U.S. federal tax return, in addition to state and local tax returns as required. The Fund's federal income tax returns are subject to examination by the Internal Revenue Service (IRS) for a period of three fiscal years after they are filed. State and local tax returns may be subject to examination for an additional fiscal year depending on the jurisdiction. Foreign taxes are provided for based on the Fund's understanding of the tax rules and rates that exist in the foreign markets in which it invests.
Distributions are declared and recorded on the ex-dividend date. Income and capital gain distributions are declared separately for each class. Income and capital gain distributions are determined in accordance with income tax regulations, which may differ from GAAP. In addition, the Fund claimed a portion of the payment made to redeeming shareholders as a distribution for income tax purposes.
Capital accounts within the financial statements are adjusted for permanent book-tax differences. These adjustments have no impact on net assets or the results of operations. Capital accounts are not adjusted for temporary book-tax differences which will reverse in a subsequent period.
Book-tax differences are primarily due to foreign currency transactions, passive foreign investments companies (PFIC), capital loss carryforwards, deferred trustees compensation and losses deferred due to wash sales.
As of period end, the cost and unrealized appreciation (depreciation) in securities, and derivatives if applicable, for federal income tax purposes were as follows:
| Gross unrealized appreciation | $965,821,208 |
| Gross unrealized depreciation | (202,039,818) |
| Net unrealized appreciation (depreciation) | $763,781,390 |
| Tax Cost | $3,650,681,240 |
The tax-based components of distributable earnings as of period end were as follows:
| Undistributed ordinary income | $33,270,963 |
| Capital loss carryforward | $(283,030,927) |
| Net unrealized appreciation (depreciation) on securities and other investments | $762,920,030 |
Capital loss carryforwards are only available to offset future capital gains of the Fund to the extent provided by regulations and may be limited. Under the Regulated Investment Company Modernization Act of 2010 (the Act), the Fund is permitted to carry forward capital losses incurred in taxable years beginning after December 22, 2010 for an unlimited period and such capital losses are required to be used prior to any losses that expire. The capital loss carryforward information presented below, including any applicable limitation, is estimated as of fiscal period end and is subject to adjustment.
| No expiration | |
| Short-term | $(283,030,927) |
The tax character of distributions paid was as follows:
| October 31, 2018 | October 31, 2017 | |
| Ordinary Income | $31,488,954 | $ 23,974,554 |
Short-Term Trading (Redemption) Fees. Shares held by investors in the Fund less than 90 days may have been subject to a redemption fee equal to 1.50% of the NAV of shares redeemed. All redemption fees, which reduce the proceeds of the shareholder redemption, are retained by the Fund and accounted for as an addition to paid in capital. In November 2017, the Board of Trustees approved the elimination of these redemption fees effective December 18, 2017.
New Rule Issuance. During August 2018, the U.S. Securities and Exchange Commission issued Final Rule Release No. 33-10532, Disclosure Update and Simplification. This Final Rule includes amendments specific to registered investment companies that are intended to eliminate overlap in disclosure requirements between Regulation S-X and GAAP. In accordance with these amendments, certain line-items in the Fund's financial statements have been combined or removed for the current period as outlined in the table below.
| Financial Statement | Current Line-Item Presentation | Prior Line-Item Presentation |
| Statement of Assets and Liabilities | Total distributable earnings (loss) | Undistributed/Distributions in excess of/Accumulated net investment income (loss) Accumulated/Undistributed net realized gain (loss) Net unrealized appreciation (depreciation) |
| Statement of Changes in Net Assets | N/A - removed | Undistributed/Distributions in excess of/Accumulated net investment income (loss) end of period |
| Statement of Changes in Net Assets | Distributions to shareholders | Distributions to shareholders from net investment income Distributions to shareholders from net realized gain |
| Distributions to Shareholders Note to Financial Statements | Distributions to shareholders | Distributions to shareholders from net investment income Distributions to shareholders from net realized gain |
4. Purchases and Sales of Investments.
Purchases and sales of securities, other than short-term securities, aggregated $4,656,310,271 and $4,329,509,065, respectively.
5. Fees and Other Transactions with Affiliates.
Management Fee. Fidelity Management & Research Company (the investment adviser) and its affiliates provide the Fund with investment management related services for which the Fund pays a monthly management fee. The management fee is the sum of an individual fund fee rate that is based on an annual rate of .45% of the Fund's average net assets and an annualized group fee rate that averaged .24% during the period. The group fee rate is based upon the average net assets of all the mutual funds advised by the investment adviser, including any mutual funds previously advised by the investment adviser that are currently advised by Fidelity SelectCo, LLC, an affiliate of the investment adviser. The group fee rate decreases as assets under management increase and increases as assets under management decrease. For the reporting period, the total annual management fee rate was .69% of the Fund's average net assets.
Transfer Agent Fees. Fidelity Investments Institutional Operations Company, Inc., (FIIOC), an affiliate of the investment adviser, is the transfer, dividend disbursing and shareholder servicing agent for each class of the Fund. FIIOC receives account fees and asset-based fees that vary according to the account size and type of account of the shareholders of Emerging Markets, except for Class K. FIIOC receives an asset-based fee of Class K's average net assets. FIIOC pays for typesetting, printing and mailing of shareholder reports, except proxy statements.
For the period, transfer agent fees for each class were as follows:
| Amount | % of Class-Level Average Net Assets | |
| Emerging Markets | $7,663,973 | .19 |
| Class K | 447,427 | .05 |
| $8,111,400 |
Accounting and Security Lending Fees. Fidelity Service Company, Inc. (FSC), an affiliate of the investment adviser, maintains the Fund's accounting records. The accounting fee is based on the level of average net assets for each month. Under a separate contract, FSC administers the security lending program. The security lending fee is based on the number and duration of lending transactions. For the period, the fees were equivalent to an annual rate of .03%.
Brokerage Commissions. The Fund placed a portion of its portfolio transactions with brokerage firms which are affiliates of the investment adviser. Brokerage commissions are included in net realized gain (loss) and change in net unrealized appreciation (depreciation) in the Statement of Operations. The commissions paid to these affiliated firms were $25,480 for the period.
Interfund Lending Program. Pursuant to an Exemptive Order issued by the SEC, the Fund, along with other registered investment companies having management contracts with Fidelity Management & Research Company (FMR) or other affiliated entities of FMR, may participate in an interfund lending program. This program provides an alternative credit facility allowing the funds to borrow from, or lend money to, other participating affiliated funds. At period end, there were no interfund loans outstanding. The Fund's activity in this program during the period for which loans were outstanding was as follows:
| Borrower or Lender | Average Loan Balance | Weighted Average Interest Rate | Interest Expense |
| Borrower | $31,180,000 | 1.74% | $54,365 |
Interfund Trades. The Fund may purchase from or sell securities to other Fidelity Funds under procedures adopted by the Board. The procedures have been designed to ensure these interfund trades are executed in accordance with Rule 17a-7 of the 1940 Act. Interfund trades are included within the respective purchases and sales amounts shown in the Purchases and Sales of Investments note.
Other. During the period, the investment adviser reimbursed the Fund for certain losses in the amount of $12,988.
6. Committed Line of Credit.
The Fund participates with other funds managed by the investment adviser or an affiliate in a $4.25 billion credit facility (the "line of credit") to be utilized for temporary or emergency purposes to fund shareholder redemptions or for other short-term liquidity purposes. The Fund has agreed to pay commitment fees on its pro-rata portion of the line of credit, which amounted to $14,093 and is reflected in Miscellaneous expenses on the Statement of Operations. During the period, the Fund did not borrow on this line of credit.
7. Security Lending.
The Fund lends portfolio securities through a lending agent from time to time in order to earn additional income. For equity securities, a lending agent is used and may loan securities to certain qualified borrowers, including Fidelity Capital Markets (FCM), a broker-dealer affiliated with the Fund. On the settlement date of the loan, the Fund receives collateral (in the form of U.S. Treasury obligations, letters of credit and/or cash) against the loaned securities and maintains collateral in an amount not less than 100% of the market value of the loaned securities during the period of the loan. The market value of the loaned securities is determined at the close of business of the Fund and any additional required collateral is delivered to the Fund on the next business day. The Fund or borrower may terminate the loan at any time, and if the borrower defaults on its obligation to return the securities loaned because of insolvency or other reasons, the Fund may apply collateral received from the borrower against the obligation. The Fund may experience delays and costs in recovering the securities loaned. Any cash collateral received is invested in the Fidelity Securities Lending Cash Central Fund. The value of loaned securities and cash collateral at period end are disclosed on the Fund's Statement of Assets and Liabilities. The value of securities loaned to FCM at period end was $4,039,282. Security lending income represents the income earned on investing cash collateral, less rebates paid to borrowers and any lending agent fees associated with the loan, plus any premium payments received for lending certain types of securities. Security lending income is presented in the Statement of Operations as a component of income from Fidelity Central Funds. Total security lending income during the period amounted to $406,557, including $10,939 from securities loaned to FCM.
8. Bank Borrowings.
The Fund is permitted to have bank borrowings for temporary or emergency purposes to fund shareholder redemptions or for other short-term liquidity requirements. The Fund has established borrowing arrangements with certain banks. The interest rate on the borrowings is the bank's base rate, as revised from time to time. The average loan balance during the period for which loans were outstanding amounted to $48,041,600. The weighted average interest rate was 1.92%. The interest expense amounted to $12,811 under the bank borrowing program. At period end, there were no bank borrowings outstanding.
9. Expense Reductions.
Commissions paid to certain brokers with whom the investment adviser, or its affiliates, places trades on behalf of the Fund include an amount in addition to trade execution, which may be rebated back to the Fund to offset certain expenses. This amount totaled $1,759,743 for the period. In addition, through arrangements with the Fund's custodian, credits realized as a result of certain uninvested cash balances were used to reduce the Fund's expenses. During the period, these credits reduced the Fund's custody expenses by $9,179.
In addition, during the period the investment adviser reimbursed and/or waived a portion of fund-level operating expenses in the amount of $51,437.
10. Distributions to Shareholders.
Distributions to shareholders of each class were as follows:
| Year ended October 31, 2018 | Year ended October 31, 2017 | |
| Distributions to shareholders | ||
| Emerging Markets | $24,827,626 | $– |
| Class K | 6,661,328 | – |
| Total | $31,488,954 | $– |
| From net investment income | ||
| Emerging Markets | $– | $18,744,412 |
| Class K | – | 5,230,142 |
| Total | $– | $23,974,554 |
11. Share Transactions.
Share transactions for each class were as follows and may contain automatic conversions between classes or exchanges between affiliated funds:
| Shares | Shares | Dollars | Dollars | |
| Year ended October 31, 2018 | Year ended October 31, 2017 | Year ended October 31, 2018 | Year ended October 31, 2017 | |
| Emerging Markets | ||||
| Shares sold | 49,869,535 | 35,833,343 | $1,579,168,818 | $958,972,147 |
| Reinvestment of distributions | 746,970 | 790,787 | 23,634,137 | 17,864,538 |
| Shares redeemed | (44,964,469) | (35,588,763) | (1,422,584,142) | (943,601,756) |
| Net increase (decrease) | 5,652,036 | 1,035,367 | $180,218,813 | $33,234,929 |
| Class K | ||||
| Shares sold | 12,153,123 | 9,726,562 | $380,393,513 | $257,288,456 |
| Reinvestment of distributions | 210,535 | 231,437 | 6,661,328 | 5,230,142 |
| Shares redeemed | (9,189,434) | (7,627,038) | (290,157,758) | (199,672,634) |
| Net increase (decrease) | 3,174,224 | 2,330,961 | $96,897,083 | $62,845,964 |
12. Other.
The Fund's organizational documents provide former and current trustees and officers with a limited indemnification against liabilities arising in connection with the performance of their duties to the Fund. In the normal course of business, the Fund may also enter into contracts that provide general indemnifications. The Fund's maximum exposure under these arrangements is unknown as this would be dependent on future claims that may be made against the Fund. The risk of material loss from such claims is considered remote.
Fidelity® Europe Fund
Performance: The Bottom Line
Average annual total return reflects the change in the value of an investment, assuming reinvestment of distributions from dividend income and capital gains (the profits earned upon the sale of securities that have grown in value, if any) and assuming a constant rate of performance each year. The hypothetical investment and the average annual total returns do not reflect the deduction of taxes that a shareholder would pay on fund distributions or the redemption of fund shares. During periods of reimbursement by Fidelity, a fund’s total return will be greater than it would be had the reimbursement not occurred. How a fund did yesterday is no guarantee of how it will do tomorrow.
Average Annual Total Returns
| For the periods ended October 31, 2018 | Past 1 year | Past 5 years | Past 10 years |
| Fidelity® Europe Fund | (9.05)% | 1.82% | 7.10% |
$10,000 Over 10 Years
Let's say hypothetically that $10,000 was invested in Fidelity® Europe Fund, a class of the fund, on October 31, 2008.
The chart shows how the value of your investment would have changed, and also shows how the MSCI Europe Index performed over the same period.
See above for additional information regarding the performance of Fidelity® Europe Fund.

| Period Ending Values | ||
| $19,862 | Fidelity® Europe Fund | |
| $19,334 | MSCI Europe Index | |
Fidelity® Europe Fund
Management's Discussion of Fund Performance
Market Recap: International equities returned -8.08% for the 12 months ending October 31, 2018, according to the MSCI ACWI (All Country World Index) ex USA Index. A modestly positive first half of the period gave way to a confluence of overwhelmingly negative factors – including escalating trade tension, a surging U.S. dollar, tepid economic growth in Europe, global central bank tightening, concerns about Italy’s budget stalemate with the EU, and weakness in China’s stock market – that yielded a -11% second-half return. The index lost 8% in October alone, its largest monthly drop in more than six years. Among sectors, new-media-infused communications services (-15%) was hit the hardest, while economically sensitive consumer discretionary (-13%), information technology (-12%), financials (-10%), industrials (-9%) and materials (-7%) stocks also fared poorly. Even the more defensive real estate (-9%), utilities (-6%) and consumer staples (-5%) sectors weren’t spared this period. Conversely, elevated crude-oil prices fueled a positive return for energy (+7%), the top-performing sector, followed by the relatively stable-growing health care segment (+2%). Regionally, emerging markets (-12%) fared the worst, hampered by the impact of foreign exchange and concerns about economic weakness in China, India and South Korea. Sluggish growth also pressured shares in continental Europe (-9%). Stocks in Japan (-3%) and the U.K. (-4%) held up better, followed by Canada (-5%) and Asia-Pacific ex Japan (-6%).Comments from Portfolio Manager Andrew Sergeant: For the fiscal year, the fund's share classes (excluding sales charges, if applicable) returned roughly between -9% and -10%, trailing the -8.08% decline of its benchmark, the MSCI Europe Index. The European markets experienced a significant shift this period, as a more aggressive trade stance from the U.S., coupled with an economic slowdown in China, dampened Europe's growth outlook and overall investor sentiment toward stocks. Versus the MSCI index, stock selection in health care, materials and consumer staples detracted most. An underweighting in the strong-performing energy sector, as well as positioning in the diversified financials and transportation industries, hurt to a lesser extent. The fund's biggest individual detractor was an out-of-benchmark position in Sweden's medical technology firm Getinge, which encountered challenges in its business restructuring. Also weighing on the fund's relative result was an overweighted position in Danish conglomerate A.P. Moller-Maersk. The company has a significant container-shipping business, and concerns about a global economic downturn, geopolitical risk and trade tensions weighed on the stock’s price. Conversely, stock picking in consumer discretionary and communication services boosted the fund’s relative performance. A sizable out-of-benchmark position in Kambi Group, a sports-betting infrastructure firm listed on Sweden’s First North stock exchange, with headquarters in Malta, was the fund's top contributor. Kambi's stock benefited from profit-margin and product-pipeline growth. An outsized stake in Norway-based international media group Schibsted also contributed. Litigation income received during the period also added to the fund’s return.The views expressed above reflect those of the portfolio manager(s) only through the end of the period as stated on the cover of this report and do not necessarily represent the views of Fidelity or any other person in the Fidelity organization. Any such views are subject to change at any time based upon market or other conditions and Fidelity disclaims any responsibility to update such views. These views may not be relied on as investment advice and, because investment decisions for a Fidelity fund are based on numerous factors, may not be relied on as an indication of trading intent on behalf of any Fidelity fund.
Note to Shareholders: Andrew Sergeant became Co-Manager of the fund on May 31, 2018, assuming portfolio management responsibilities while Stefan Lindblad was on a three-month leave of absence. On September 1, 2018, Stefan Lindblad left the firm, leaving Andrew Sergeant as sole manager of the fund.Fidelity® Europe Fund
Investment Summary (Unaudited)
Geographic Diversification (% of fund's net assets)
| As of October 31, 2018 | ||
| United Kingdom | 28.0% | |
| Sweden | 15.3% | |
| Germany | 14.4% | |
| France | 9.4% | |
| Switzerland | 4.6% | |
| Spain | 4.1% | |
| United States of America* | 3.6% | |
| Italy | 3.3% | |
| Denmark | 2.9% | |
| Other | 14.4% | |

* Includes Short-Term investments and Net Other Assets (Liabilities).
Percentages are based on country or territory of incorporation and are adjusted for the effect of futures contracts, if applicable.
Asset Allocation as of October 31, 2018
| % of fund's net assets | |
| Stocks | 98.1 |
| Short-Term Investments and Net Other Assets (Liabilities) | 1.9 |
Top Ten Stocks as of October 31, 2018
| % of fund's net assets | |
| Unilever PLC (United Kingdom, Personal Products) | 3.8 |
| Roche Holding AG (participation certificate) (Switzerland, Pharmaceuticals) | 3.2 |
| SAP SE (Germany, Software) | 3.1 |
| BP PLC (United Kingdom, Oil, Gas & Consumable Fuels) | 3.0 |
| Total SA (France, Oil, Gas & Consumable Fuels) | 2.6 |
| Capgemini SA (France, IT Services) | 2.5 |
| Schibsted ASA (A Shares) (Norway, Media) | 2.3 |
| Vostok New Ventures Ltd. (depositary receipt) (Bermuda, Capital Markets) | 2.1 |
| Arjo AB (Sweden, Health Care Equipment & Supplies) | 2.0 |
| Rolls-Royce Holdings PLC (United Kingdom, Aerospace & Defense) | 2.0 |
| 26.6 |
Top Market Sectors as of October 31, 2018
| % of fund's net assets | |
| Financials | 22.6 |
| Industrials | 20.2 |
| Health Care | 11.5 |
| Consumer Staples | 10.6 |
| Information Technology | 8.7 |
| Consumer Discretionary | 7.1 |
| Energy | 6.8 |
| Materials | 3.8 |
| Real Estate | 3.4 |
| Communication Services | 3.4 |
Fidelity® Europe Fund
Schedule of Investments October 31, 2018
Showing Percentage of Net Assets
| Common Stocks - 95.3% | |||
| Shares | Value | ||
| Austria - 0.8% | |||
| Mayr-Melnhof Karton AG | 58,900 | $7,458,523 | |
| Belgium - 1.2% | |||
| KBC Groep NV | 171,400 | 11,822,895 | |
| Bermuda - 2.1% | |||
| Vostok New Ventures Ltd. (depositary receipt) (a) | 2,791,131 | 21,228,230 | |
| Canada - 0.8% | |||
| Lundin Mining Corp. (Sweden) | 1,883,900 | 7,744,635 | |
| Denmark - 2.9% | |||
| A.P. Moller - Maersk A/S Series B | 14,412 | 18,190,978 | |
| Scandinavian Tobacco Group A/S (b) | 721,700 | 10,951,117 | |
| TOTAL DENMARK | 29,142,095 | ||
| Finland - 0.8% | |||
| Nokian Tyres PLC | 259,800 | 8,262,890 | |
| France - 9.4% | |||
| Altarea SCA | 47,600 | 10,470,126 | |
| Amundi SA (b) | 198,500 | 11,821,615 | |
| Capgemini SA | 198,800 | 24,318,449 | |
| Compagnie de St. Gobain | 321,100 | 12,096,294 | |
| The Vicat Group | 158,300 | 8,516,679 | |
| Total SA (c) | 436,107 | 25,588,763 | |
| TOTAL FRANCE | 92,811,926 | ||
| Germany - 14.4% | |||
| Bertrandt AG | 162,700 | 13,471,026 | |
| Deutsche Post AG | 427,500 | 13,498,428 | |
| Fresenius Medical Care AG & Co. KGaA | 167,000 | 13,112,257 | |
| Fresenius SE & Co. KGaA | 82,300 | 5,230,645 | |
| Hannover Reuck SE | 109,600 | 14,784,888 | |
| Instone Real Estate Group BV (b) | 432,200 | 10,138,194 | |
| JOST Werke AG (b) | 197,400 | 6,886,421 | |
| LEG Immobilien AG | 129,947 | 14,226,851 | |
| MTU Aero Engines Holdings AG | 85,700 | 18,229,390 | |
| SAP SE | 284,237 | 30,434,249 | |
| WashTec AG | 29,300 | 2,260,011 | |
| TOTAL GERMANY | 142,272,360 | ||
| Ireland - 2.5% | |||
| Ryanair Holdings PLC sponsored ADR (a) | 164,767 | 13,642,708 | |
| United Drug PLC (United Kingdom) | 1,420,241 | 11,473,025 | |
| TOTAL IRELAND | 25,115,733 | ||
| Italy - 2.3% | |||
| Banca Generali SpA | 540,400 | 10,423,792 | |
| Buzzi Unicem SpA | 159,884 | 3,074,047 | |
| Prada SpA | 2,537,100 | 8,961,760 | |
| TOTAL ITALY | 22,459,599 | ||
| Malta - 2.0% | |||
| Kambi Group PLC (a) | 696,109 | 19,283,219 | |
| Netherlands - 1.9% | |||
| Intertrust NV (b) | 1,165,980 | 18,819,223 | |
| Norway - 2.3% | |||
| Schibsted ASA (A Shares) | 643,050 | 22,282,249 | |
| Spain - 2.3% | |||
| Prosegur Cash SA (b) | 7,417,400 | 14,702,307 | |
| Prosegur Compania de Seguridad SA (Reg.) | 1,369,300 | 7,612,002 | |
| TOTAL SPAIN | 22,314,309 | ||
| Sweden - 15.3% | |||
| Arjo AB | 5,751,984 | 19,548,002 | |
| Essity AB Class B | 798,700 | 18,232,510 | |
| Getinge AB (B Shares) | 1,579,484 | 15,516,696 | |
| Indutrade AB | 763,100 | 18,312,098 | |
| Investor AB (B Shares) | 428,571 | 18,578,443 | |
| Securitas AB (B Shares) | 923,100 | 15,831,950 | |
| Swedbank AB (A Shares) | 744,300 | 16,762,946 | |
| Swedish Match Co. AB | 285,000 | 14,522,273 | |
| Telefonaktiebolaget LM Ericsson (B Shares) | 1,564,600 | 13,622,594 | |
| TOTAL SWEDEN | 150,927,512 | ||
| Switzerland - 4.6% | |||
| Julius Baer Group Ltd. | 300,090 | 13,685,539 | |
| Roche Holding AG (participation certificate) | 128,900 | 31,369,415 | |
| TOTAL SWITZERLAND | 45,054,954 | ||
| United Kingdom - 28.0% | |||
| Admiral Group PLC | 433,600 | 11,156,600 | |
| BCA Marketplace PLC | 4,012,800 | 10,335,259 | |
| BP PLC | 4,090,400 | 29,547,906 | |
| British American Tobacco PLC (United Kingdom) | 394,200 | 17,088,676 | |
| Close Brothers Group PLC | 527,400 | 9,923,086 | |
| Cranswick PLC | 178,900 | 6,608,562 | |
| John Wood Group PLC | 1,301,400 | 11,880,356 | |
| Lloyds Banking Group PLC | 25,862,500 | 18,872,902 | |
| Melrose Industries PLC | 4,530,100 | 9,765,465 | |
| Micro Focus International PLC | 1,056,358 | 16,375,890 | |
| Prudential PLC | 779,405 | 15,606,513 | |
| Rightmove PLC | 1,808,000 | 10,449,121 | |
| Rolls-Royce Holdings PLC | 1,807,300 | 19,381,833 | |
| Rotork PLC | 2,224,100 | 8,522,848 | |
| Sabre Insurance Group PLC (b) | 3,300,000 | 11,135,678 | |
| St. James's Place Capital PLC | 944,900 | 12,240,761 | |
| Standard Life PLC | 3,073,175 | 10,625,598 | |
| The Weir Group PLC | 452,900 | 9,181,303 | |
| Unilever PLC | 704,500 | 37,317,108 | |
| TOTAL UNITED KINGDOM | 276,015,465 | ||
| United States of America - 1.7% | |||
| Autoliv, Inc. (depositary receipt) | 126,400 | 10,489,191 | |
| Veoneer, Inc. unit (a) | 187,300 | 6,282,460 | |
| TOTAL UNITED STATES OF AMERICA | 16,771,651 | ||
| TOTAL COMMON STOCKS | |||
| (Cost $938,765,127) | 939,787,468 | ||
| Nonconvertible Preferred Stocks - 2.8% | |||
| Italy - 1.0% | |||
| Buzzi Unicem SpA (Risparmio Shares) | 889,200 | 9,990,952 | |
| Spain - 1.8% | |||
| Grifols SA Class B | 850,250 | 17,669,517 | |
| United Kingdom - 0.0% | |||
| Rolls-Royce Holdings PLC Series C (a) | 83,135,800 | 106,264 | |
| TOTAL NONCONVERTIBLE PREFERRED STOCKS | |||
| (Cost $23,650,077) | 27,766,733 | ||
| Money Market Funds - 0.7% | |||
| Fidelity Cash Central Fund, 2.23% (d) | 6,484,554 | 6,485,851 | |
| Fidelity Securities Lending Cash Central Fund 2.23% (d)(e) | 431 | 431 | |
| TOTAL MONEY MARKET FUNDS | |||
| (Cost $6,486,282) | 6,486,282 | ||
| TOTAL INVESTMENT IN SECURITIES - 98.8% | |||
| (Cost $968,901,486) | 974,040,483 | ||
| NET OTHER ASSETS (LIABILITIES) - 1.2% | 11,899,866 | ||
| NET ASSETS - 100% | $985,940,349 |
Categorizations in the Schedule of Investments are based on country or territory of incorporation.
Legend
(a) Non-income producing
(b) Security exempt from registration under Rule 144A of the Securities Act of 1933. These securities may be resold in transactions exempt from registration, normally to qualified institutional buyers. At the end of the period, the value of these securities amounted to $84,454,555 or 8.6% of net assets.
(c) Security or a portion of the security is on loan at period end.
(d) Affiliated fund that is generally available only to investment companies and other accounts managed by Fidelity Investments. The rate quoted is the annualized seven-day yield of the fund at period end. A complete unaudited listing of the fund's holdings as of its most recent quarter end is available upon request. In addition, each Fidelity Central Fund's financial statements, which are not covered by the Fund's Report of Independent Registered Public Accounting Firm, are available on the SEC's website or upon request.
(e) Investment made with cash collateral received from securities on loan.
Affiliated Central Funds
Information regarding fiscal year to date income earned by the Fund from investments in Fidelity Central Funds is as follows:
| Fund | Income earned |
| Fidelity Cash Central Fund | $127,127 |
| Fidelity Securities Lending Cash Central Fund | 322,082 |
| Total | $449,209 |
Amounts in the income column in the above table include any capital gain distributions from underlying funds, which are presented in the corresponding line-item in the Statement of Operations if applicable.
Other Affiliated Issuers
An affiliated company is a company in which the Fund has ownership of at least 5% of the voting securities. Fiscal year to date transactions with companies which are or were affiliates are as follows:
| Affiliate | Value, beginning of period | Purchases | Sales Proceeds | Dividend Income | Realized Gain (loss) | Change in Unrealized appreciation (depreciation) | Value, end of period |
| Vostok Emerging Finance Ltd. (depository receipt) | $11,714,677 | $-- | $11,078,143 | $-- | $4,218,176 | $(4,854,710) | $-- |
| Total | $11,714,677 | $-- | $11,078,143 | $-- | $4,218,176 | $(4,854,710) | $-- |
Investment Valuation
The following is a summary of the inputs used, as of October 31, 2018, involving the Fund's assets and liabilities carried at fair value. The inputs or methodology used for valuing securities may not be an indication of the risk associated with investing in those securities. For more information on valuation inputs, and their aggregation into the levels used below, please refer to the Investment Valuation section in the accompanying Notes to Financial Statements.
| Valuation Inputs at Reporting Date: | ||||
| Description | Total | Level 1 | Level 2 | Level 3 |
| Investments in Securities: | ||||
| Equities: | ||||
| Communication Services | $32,731,370 | $32,731,370 | $-- | $-- |
| Consumer Discretionary | 70,501,200 | 70,501,200 | -- | -- |
| Consumer Staples | 104,720,246 | 50,314,462 | 54,405,784 | -- |
| Energy | 67,017,025 | 11,880,356 | 55,136,669 | -- |
| Financials | 223,371,793 | 175,206,839 | 48,164,954 | -- |
| Health Care | 113,919,557 | 46,537,723 | 67,381,834 | -- |
| Industrials | 198,921,821 | 135,754,288 | 63,167,533 | -- |
| Information Technology | 84,751,182 | 24,318,449 | 60,432,733 | -- |
| Materials | 36,784,836 | 36,784,836 | -- | -- |
| Real Estate | 34,835,171 | 34,835,171 | -- | -- |
| Money Market Funds | 6,486,282 | 6,486,282 | -- | -- |
| Total Investments in Securities: | $974,040,483 | $625,350,976 | $348,689,507 | $-- |
The following is a summary of transfers between Level 1 and Level 2 for the period ended October 31, 2018. Transfers are assumed to have occurred at the beginning of the period, and are primarily attributable to the valuation techniques used for foreign equity securities, as discussed in the accompanying Notes to Financial Statements:
| Transfers | Total |
| Level 1 to Level 2 | $47,154,143 |
| Level 2 to Level 1 | $0 |
See accompanying notes which are an integral part of the financial statements.
Fidelity® Europe Fund
Financial Statements
Statement of Assets and Liabilities
| October 31, 2018 | ||
| Assets | ||
| Investment in securities, at value (including securities loaned of $59) — See accompanying schedule: Unaffiliated issuers (cost $962,415,204) | $967,554,201 | |
| Fidelity Central Funds (cost $6,486,282) | 6,486,282 | |
| Total Investment in Securities (cost $968,901,486) | $974,040,483 | |
| Receivable for investments sold | 5,149,724 | |
| Receivable for fund shares sold | 5,215,718 | |
| Dividends receivable | 3,624,073 | |
| Distributions receivable from Fidelity Central Funds | 8,641 | |
| Prepaid expenses | 2,183 | |
| Other receivables | 92,906 | |
| Total assets | 988,133,728 | |
| Liabilities | ||
| Payable to custodian bank | $40,218 | |
| Payable for fund shares redeemed | 1,282,276 | |
| Accrued management fee | 556,138 | |
| Transfer agent fee payable | 157,241 | |
| Distribution and service plan fees payable | 16,082 | |
| Other affiliated payables | 39,315 | |
| Other payables and accrued expenses | 102,048 | |
| Collateral on securities loaned | 61 | |
| Total liabilities | 2,193,379 | |
| Net Assets | $985,940,349 | |
| Net Assets consist of: | ||
| Paid in capital | $893,800,915 | |
| Total distributable earnings (loss) | 92,139,434 | |
| Net Assets | $985,940,349 | |
| Net Asset Value and Maximum Offering Price | ||
| Class A: | ||
| Net Asset Value and redemption price per share ($19,530,990 ÷ 519,368 shares) | $37.61 | |
| Maximum offering price per share (100/94.25 of $37.61) | $39.90 | |
| Class M: | ||
| Net Asset Value and redemption price per share ($7,257,145 ÷ 193,183 shares) | $37.57 | |
| Maximum offering price per share (100/96.50 of $37.57) | $38.93 | |
| Class C: | ||
| Net Asset Value and offering price per share ($10,060,437 ÷ 270,212 shares)(a) | $37.23 | |
| Europe: | ||
| Net Asset Value, offering price and redemption price per share ($941,670,053 ÷ 24,976,209 shares) | $37.70 | |
| Class I: | ||
| Net Asset Value, offering price and redemption price per share ($7,317,649 ÷ 194,171 shares) | $37.69 | |
| Class Z: | ||
| Net Asset Value, offering price and redemption price per share ($104,075 ÷ 2,761 shares) | $37.69 |
(a) Redemption price per share is equal to net asset value less any applicable contingent deferred sales charge.
See accompanying notes which are an integral part of the financial statements.
Statement of Operations
| Year ended October 31, 2018 | ||
| Investment Income | ||
| Dividends | $27,128,135 | |
| Income from Fidelity Central Funds | 449,209 | |
| Income before foreign taxes withheld | 27,577,344 | |
| Less foreign taxes withheld | (2,504,065) | |
| Total income | 25,073,279 | |
| Expenses | ||
| Management fee | ||
| Basic fee | $8,243,879 | |
| Performance adjustment | 274,992 | |
| Transfer agent fees | 2,047,572 | |
| Distribution and service plan fees | 215,981 | |
| Accounting and security lending fees | 550,471 | |
| Custodian fees and expenses | 127,237 | |
| Independent trustees' fees and expenses | 5,950 | |
| Registration fees | 85,513 | |
| Audit | 81,012 | |
| Legal | 3,081 | |
| Interest | 2,196 | |
| Miscellaneous | 57,483 | |
| Total expenses before reductions | 11,695,367 | |
| Expense reductions | (12,551) | |
| Total expenses after reductions | 11,682,816 | |
| Net investment income (loss) | 13,390,463 | |
| Realized and Unrealized Gain (Loss) | ||
| Net realized gain (loss) on: | ||
| Investment securities: | ||
| Unaffiliated issuers | 92,840,506 | |
| Fidelity Central Funds | (1,043) | |
| Other affiliated issuers | 4,218,176 | |
| Foreign currency transactions | (293,773) | |
| Total net realized gain (loss) | 96,763,866 | |
| Change in net unrealized appreciation (depreciation) on: | ||
| Investment securities: | ||
| Unaffiliated issuers | (203,717,400) | |
| Fidelity Central Funds | 1,261 | |
| Other affiliated issuers | (4,854,710) | |
| Assets and liabilities in foreign currencies | 7,709 | |
| Total change in net unrealized appreciation (depreciation) | (208,563,140) | |
| Net gain (loss) | (111,799,274) | |
| Net increase (decrease) in net assets resulting from operations | $(98,408,811) |
See accompanying notes which are an integral part of the financial statements.
Statement of Changes in Net Assets
| Year ended October 31, 2018 | Year ended October 31, 2017 | |
| Increase (Decrease) in Net Assets | ||
| Operations | ||
| Net investment income (loss) | $13,390,463 | $12,136,756 |
| Net realized gain (loss) | 96,763,866 | 23,964,986 |
| Change in net unrealized appreciation (depreciation) | (208,563,140) | 241,642,484 |
| Net increase (decrease) in net assets resulting from operations | (98,408,811) | 277,744,226 |
| Distributions to shareholders | (31,260,216) | – |
| Distributions to shareholders from net investment income | – | (11,727,868) |
| Distributions to shareholders from net realized gain | – | (3,911,466) |
| Total distributions | (31,260,216) | (15,639,334) |
| Share transactions - net increase (decrease) | (276,592,457) | 25,014,944 |
| Redemption fees | – | 434 |
| Total increase (decrease) in net assets | (406,261,484) | 287,120,270 |
| Net Assets | ||
| Beginning of period | 1,392,201,833 | 1,105,081,563 |
| End of period | $985,940,349 | $1,392,201,833 |
| Other Information | ||
| Undistributed net investment income end of period | $11,925,792 |
See accompanying notes which are an integral part of the financial statements.
Financial Highlights
Fidelity Europe Fund Class A
| Years ended October 31, | 2018 | 2017 | 2016 | 2015 | 2014 A |
| Selected Per–Share Data | |||||
| Net asset value, beginning of period | $42.47 | $34.17 | $37.06 | $36.24 | $39.45 |
| Income from Investment Operations | |||||
| Net investment income (loss)B | .34 | .26 | .22 | .37 | .47 |
| Net realized and unrealized gain (loss) | (4.21)C | 8.39 | (2.67) | 1.29 | (3.68) |
| Total from investment operations | (3.87) | 8.65 | (2.45) | 1.66 | (3.21) |
| Distributions from net investment income | (.33) | (.22) | (.29) | (.84) | – |
| Distributions from net realized gain | (.66) | (.13) | (.15) | – | – |
| Total distributions | (.99) | (.35) | (.44) | (.84) | – |
| Redemption fees added to paid in capitalB | – | –D | –D | –D | –D |
| Net asset value, end of period | $37.61 | $42.47 | $34.17 | $37.06 | $36.24 |
| Total ReturnE,F,G | (9.31)%C | 25.61% | (6.69)% | 4.63% | (8.14)% |
| Ratios to Average Net AssetsH,I | |||||
| Expenses before reductions | 1.28% | 1.32% | 1.39% | 1.33% | 1.35%J |
| Expenses net of fee waivers, if any | 1.28% | 1.32% | 1.39% | 1.33% | 1.35%J |
| Expenses net of all reductions | 1.28% | 1.28% | 1.38% | 1.31% | 1.35%J |
| Net investment income (loss) | .82% | .70% | .62% | .98% | 1.94%J |
| Supplemental Data | |||||
| Net assets, end of period (000 omitted) | $19,531 | $20,925 | $17,267 | $23,381 | $23,633 |
| Portfolio turnover rateK | 57% | 73% | 62% | 87% | 80%L |
A For the period March 18, 2014 (commencement of sale of shares) to October 31, 2014.
B Calculated based on average shares outstanding during the period.
C Net realized and unrealized gain (loss) per share reflects proceeds received from litigation which amounted to $.18 per share. Excluding these litigation proceeds, the total return would have been (9.74)%.
D Amount represents less than $.005 per share.
E Total returns for periods of less than one year are not annualized.
F Total returns would have been lower if certain expenses had not been reduced during the applicable periods shown.
G Total returns do not include the effect of the sales charges.
H Fees and expenses of any underlying Fidelity Central Funds are not included in the Fund's expense ratio. The Fund indirectly bears its proportionate share of the expenses of any underlying Fidelity Central Funds.
I Expense ratios reflect operating expenses of the class. Expenses before reductions do not reflect amounts reimbursed by the investment adviser or reductions from brokerage service arrangements or reductions from other expense offset arrangements and do not represent the amount paid by the class during periods when reimbursements or reductions occur. Expense ratios before reductions for start-up periods may not be representative of longer-term operating periods. Expenses net of fee waivers reflect expenses after reimbursement by the investment adviser but prior to reductions from brokerage service arrangements or other expense offset arrangements. Expenses net of all reductions represent the net expenses paid by the class.
J Annualized
K Amount does not include the portfolio activity of any underlying Fidelity Central Funds.
L The portfolio turnover rate does not include the assets acquired in the merger.
See accompanying notes which are an integral part of the financial statements.
Fidelity Europe Fund Class M
| Years ended October 31, | 2018 | 2017 | 2016 | 2015 | 2014 A |
| Selected Per–Share Data | |||||
| Net asset value, beginning of period | $42.47 | $34.13 | $36.94 | $36.18 | $39.45 |
| Income from Investment Operations | |||||
| Net investment income (loss)B | .21 | .15 | .11 | .26 | .40 |
| Net realized and unrealized gain (loss) | (4.23)C | 8.41 | (2.67) | 1.29 | (3.67) |
| Total from investment operations | (4.02) | 8.56 | (2.56) | 1.55 | (3.27) |
| Distributions from net investment income | (.23) | (.09) | (.09) | (.79) | – |
| Distributions from net realized gain | (.66) | (.13) | (.15) | – | – |
| Total distributions | (.88)D | (.22) | (.25)E | (.79) | – |
| Redemption fees added to paid in capitalB | – | –F | –F | –F | –F |
| Net asset value, end of period | $37.57 | $42.47 | $34.13 | $36.94 | $36.18 |
| Total ReturnG,H,I | (9.63)%C | 25.25% | (6.99)% | 4.33% | (8.29)% |
| Ratios to Average Net AssetsJ,K | |||||
| Expenses before reductions | 1.61% | 1.63% | 1.70% | 1.61% | 1.62%L |
| Expenses net of fee waivers, if any | 1.61% | 1.63% | 1.70% | 1.61% | 1.61%L |
| Expenses net of all reductions | 1.61% | 1.59% | 1.68% | 1.59% | 1.61%L |
| Net investment income (loss) | .50% | .39% | .31% | .70% | 1.68%L |
| Supplemental Data | |||||
| Net assets, end of period (000 omitted) | $7,257 | $8,874 | $6,980 | $9,632 | $13,679 |
| Portfolio turnover rateM | 57% | 73% | 62% | 87% | 80%N |
A For the period March 18, 2014 (commencement of sale of shares) to October 31, 2014.
B Calculated based on average shares outstanding during the period.
C Net realized and unrealized gain (loss) per share reflects proceeds received from litigation which amounted to $.18 per share. Excluding these litigation proceeds, the total return would have been (10.06)%.
D Total distributions of $.88 per share is comprised of distributions from net investment income of $.227 and distributions from net realized gain of $.657 per share.
E Total distributions of $.25 per share is comprised of distributions from net investment income of $.092 and distributions from net realized gain of $.154 per share.
F Amount represents less than $.005 per share.
G Total returns for periods of less than one year are not annualized.
H Total returns would have been lower if certain expenses had not been reduced during the applicable periods shown.
I Total returns do not include the effect of the sales charges.
J Fees and expenses of any underlying Fidelity Central Funds are not included in the Fund's expense ratio. The Fund indirectly bears its proportionate share of the expenses of any underlying Fidelity Central Funds.
K Expense ratios reflect operating expenses of the class. Expenses before reductions do not reflect amounts reimbursed by the investment adviser or reductions from brokerage service arrangements or reductions from other expense offset arrangements and do not represent the amount paid by the class during periods when reimbursements or reductions occur. Expense ratios before reductions for start-up periods may not be representative of longer-term operating periods. Expenses net of fee waivers reflect expenses after reimbursement by the investment adviser but prior to reductions from brokerage service arrangements or other expense offset arrangements. Expenses net of all reductions represent the net expenses paid by the class.
L Annualized
M Amount does not include the portfolio activity of any underlying Fidelity Central Funds.
N The portfolio turnover rate does not include the assets acquired in the merger.
See accompanying notes which are an integral part of the financial statements.
Fidelity Europe Fund Class C
| Years ended October 31, | 2018 | 2017 | 2016 | 2015 | 2014 A |
| Selected Per–Share Data | |||||
| Net asset value, beginning of period | $42.15 | $33.82 | $36.81 | $36.07 | $39.45 |
| Income from Investment Operations | |||||
| Net investment income (loss)B | .02 | (.03) | (.06) | .07 | .29 |
| Net realized and unrealized gain (loss) | (4.18)C | 8.36 | (2.65) | 1.29 | (3.67) |
| Total from investment operations | (4.16) | 8.33 | (2.71) | 1.36 | (3.38) |
| Distributions from net investment income | (.10) | – | (.12) | (.62) | – |
| Distributions from net realized gain | (.66) | – | (.15) | – | – |
| Total distributions | (.76) | – | (.28)D | (.62) | – |
| Redemption fees added to paid in capitalB | – | –E | –E | –E | –E |
| Net asset value, end of period | $37.23 | $42.15 | $33.82 | $36.81 | $36.07 |
| Total ReturnF,G,H | (10.04)%C | 24.63% | (7.43)% | 3.79% | (8.57)% |
| Ratios to Average Net AssetsI,J | |||||
| Expenses before reductions | 2.06% | 2.11% | 2.18% | 2.13% | 2.10%K |
| Expenses net of fee waivers, if any | 2.06% | 2.11% | 2.18% | 2.13% | 2.10%K |
| Expenses net of all reductions | 2.06% | 2.07% | 2.17% | 2.11% | 2.10%K |
| Net investment income (loss) | .04% | (.09)% | (.17)% | .18% | 1.19%K |
| Supplemental Data | |||||
| Net assets, end of period (000 omitted) | $10,060 | $10,721 | $9,007 | $11,151 | $6,818 |
| Portfolio turnover rateL | 57% | 73% | 62% | 87% | 80%M |
A For the period March 18, 2014 (commencement of sale of shares) to October 31, 2014.
B Calculated based on average shares outstanding during the period.
C Net realized and unrealized gain (loss) per share reflects proceeds received from litigation which amounted to $.18 per share. Excluding these litigation proceeds, the total return would have been (10.47)%.
D Total distributions of $.28 per share is comprised of distributions from net investment income of $.123 and distributions from net realized gain of $.154 per share.
E Amount represents less than $.005 per share.
F Total returns for periods of less than one year are not annualized.
G Total returns would have been lower if certain expenses had not been reduced during the applicable periods shown.
H Total returns do not include the effect of the contingent deferred sales charge.
I Fees and expenses of any underlying Fidelity Central Funds are not included in the Fund's expense ratio. The Fund indirectly bears its proportionate share of the expenses of any underlying Fidelity Central Funds.
J Expense ratios reflect operating expenses of the class. Expenses before reductions do not reflect amounts reimbursed by the investment adviser or reductions from brokerage service arrangements or reductions from other expense offset arrangements and do not represent the amount paid by the class during periods when reimbursements or reductions occur. Expense ratios before reductions for start-up periods may not be representative of longer-term operating periods. Expenses net of fee waivers reflect expenses after reimbursement by the investment adviser but prior to reductions from brokerage service arrangements or other expense offset arrangements. Expenses net of all reductions represent the net expenses paid by the class.
K Annualized
L Amount does not include the portfolio activity of any underlying Fidelity Central Funds.
M The portfolio turnover rate does not include the assets acquired in the merger.
See accompanying notes which are an integral part of the financial statements.
Fidelity Europe Fund
| Years ended October 31, | 2018 | 2017 | 2016 | 2015 | 2014 |
| Selected Per–Share Data | |||||
| Net asset value, beginning of period | $42.53 | $34.26 | $37.19 | $36.32 | $37.92 |
| Income from Investment Operations | |||||
| Net investment income (loss)A | .48 | .38 | .33 | .48 | .94B |
| Net realized and unrealized gain (loss) | (4.24)C | 8.40 | (2.68) | 1.30 | (2.00) |
| Total from investment operations | (3.76) | 8.78 | (2.35) | 1.78 | (1.06) |
| Distributions from net investment income | (.41) | (.38) | (.43) | (.91) | (.52) |
| Distributions from net realized gain | (.66) | (.13) | (.15) | – | (.02) |
| Total distributions | (1.07) | (.51) | (.58) | (.91) | (.54) |
| Redemption fees added to paid in capitalA | – | –D | –D | –D | –D |
| Net asset value, end of period | $37.70 | $42.53 | $34.26 | $37.19 | $36.32 |
| Total ReturnE | (9.05)%C | 26.05% | (6.42)% | 4.97% | (2.82)% |
| Ratios to Average Net AssetsF,G | |||||
| Expenses before reductions | .96% | 1.00% | 1.07% | 1.03% | .97% |
| Expenses net of fee waivers, if any | .96% | 1.00% | 1.07% | 1.03% | .97% |
| Expenses net of all reductions | .96% | .96% | 1.06% | 1.01% | .96% |
| Net investment income (loss) | 1.14% | 1.02% | .94% | 1.28% | 2.43%B |
| Supplemental Data | |||||
| Net assets, end of period (000 omitted) | $941,670 | $1,343,213 | $1,066,488 | $1,384,134 | $1,237,047 |
| Portfolio turnover rateH | 57% | 73% | 62% | 87% | 80%I |
A Calculated based on average shares outstanding during the period.
B Net investment income per share reflects a large, non-recurring dividend which amounted to $.19 per share. Excluding this dividend the ratio would have been 1.93%.
C Net realized and unrealized gain (loss) per share reflects proceeds received from litigation which amounted to $.18 per share. Excluding these litigation proceeds, the total return would have been (9.48)%.
D Amount represents less than $.005 per share.
E Total returns would have been lower if certain expenses had not been reduced during the applicable periods shown.
F Fees and expenses of any underlying Fidelity Central Funds are not included in the Fund's expense ratio. The Fund indirectly bears its proportionate share of the expenses of any underlying Fidelity Central Funds.
G Expense ratios reflect operating expenses of the class. Expenses before reductions do not reflect amounts reimbursed by the investment adviser or reductions from brokerage service arrangements or reductions from other expense offset arrangements and do not represent the amount paid by the class during periods when reimbursements or reductions occur. Expenses net of fee waivers reflect expenses after reimbursement by the investment adviser but prior to reductions from brokerage service arrangements or other expense offset arrangements. Expenses net of all reductions represent the net expenses paid by the class.
H Amount does not include the portfolio activity of any underlying Fidelity Central Funds.
I The portfolio turnover rate does not include the assets acquired in the merger.
See accompanying notes which are an integral part of the financial statements.
Fidelity Europe Fund Class I
| Years ended October 31, | 2018 | 2017 | 2016 | 2015 | 2014 A |
| Selected Per–Share Data | |||||
| Net asset value, beginning of period | $42.53 | $34.29 | $37.21 | $36.32 | $39.45 |
| Income from Investment Operations | |||||
| Net investment income (loss)B | .48 | .39 | .35 | .50 | .56 |
| Net realized and unrealized gain (loss) | (4.23)C | 8.38 | (2.67) | 1.30 | (3.69) |
| Total from investment operations | (3.75) | 8.77 | (2.32) | 1.80 | (3.13) |
| Distributions from net investment income | (.43) | (.41) | (.45) | (.91) | – |
| Distributions from net realized gain | (.66) | (.13) | (.15) | – | – |
| Total distributions | (1.09) | (.53)D | (.60) | (.91) | – |
| Redemption fees added to paid in capitalB | – | –E | –E | –E | –E |
| Net asset value, end of period | $37.69 | $42.53 | $34.29 | $37.21 | $36.32 |
| Total ReturnF,G | (9.02)%C | 26.04% | (6.33)% | 5.02% | (7.93)% |
| Ratios to Average Net AssetsH,I | |||||
| Expenses before reductions | .95% | .98% | 1.01% | .98% | .97%J |
| Expenses net of fee waivers, if any | .95% | .98% | 1.01% | .98% | .97%J |
| Expenses net of all reductions | .95% | .94% | 1.00% | .96% | .96%J |
| Net investment income (loss) | 1.16% | 1.04% | 1.00% | 1.33% | 2.33%J |
| Supplemental Data | |||||
| Net assets, end of period (000 omitted) | $7,318 | $8,469 | $5,340 | $6,552 | $5,666 |
| Portfolio turnover rateK | 57% | 73% | 62% | 87% | 80%L |
A For the period March 18, 2014 (commencement of sale of shares) to October 31, 2014.
B Calculated based on average shares outstanding during the period.
C Net realized and unrealized gain (loss) per share reflects proceeds received from litigation which amounted to $.18 per share. Excluding these litigation proceeds, the total return would have been (9.45)%.
D Total distributions of $.53 per share is comprised of distributions from net investment income of $.408 and distributions from net realized gain of $.126 per share.
E Amount represents less than $.005 per share.
F Total returns for periods of less than one year are not annualized.
G Total returns would have been lower if certain expenses had not been reduced during the applicable periods shown.
H Fees and expenses of any underlying Fidelity Central Funds are not included in the Fund's expense ratio. The Fund indirectly bears its proportionate share of the expenses of any underlying Fidelity Central Funds.
I Expense ratios reflect operating expenses of the class. Expenses before reductions do not reflect amounts reimbursed by the investment adviser or reductions from brokerage service arrangements or reductions from other expense offset arrangements and do not represent the amount paid by the class during periods when reimbursements or reductions occur. Expense ratios before reductions for start-up periods may not be representative of longer-term operating periods. Expenses net of fee waivers reflect expenses after reimbursement by the investment adviser but prior to reductions from brokerage service arrangements or other expense offset arrangements. Expenses net of all reductions represent the net expenses paid by the class.
J Annualized
K Amount does not include the portfolio activity of any underlying Fidelity Central Funds.
L The portfolio turnover rate does not include the assets acquired in the merger.
See accompanying notes which are an integral part of the financial statements.
Fidelity Europe Fund Class Z
| Year ended October 31, | 2018 A |
| Selected Per–Share Data | |
| Net asset value, beginning of period | $41.00 |
| Income from Investment Operations | |
| Net investment income (loss)B | .06 |
| Net realized and unrealized gain (loss) | (3.37)C |
| Total from investment operations | (3.31) |
| Net asset value, end of period | $37.69 |
| Total ReturnD,E | (8.07)%C |
| Ratios to Average Net AssetsF,G | |
| Expenses before reductions | .91%H |
| Expenses net of fee waivers, if any | .90%H |
| Expenses net of all reductions | .90%H |
| Net investment income (loss) | 2.04%H |
| Supplemental Data | |
| Net assets, end of period (000 omitted) | $104 |
| Portfolio turnover rateI | 57% |
A For the period October 2, 2018 (commencement of sale of shares) to October 31, 2018.
B Calculated based on average shares outstanding during the period.
C Net realized and unrealized gain (loss) per share reflects proceeds received from litigation which amounted to $.16 per share. Excluding these litigation proceeds, the total return would have been (8.50)%.
D Total returns for periods of less than one year are not annualized.
E Total returns would have been lower if certain expenses had not been reduced during the applicable periods shown.
F Fees and expenses of any underlying Fidelity Central Funds are not included in the Fund's expense ratio. The Fund indirectly bears its proportionate share of the expenses of any underlying Fidelity Central Funds.
G Expense ratios reflect operating expenses of the class. Expenses before reductions do not reflect amounts reimbursed by the investment adviser or reductions from brokerage service arrangements or reductions from other expense offset arrangements and do not represent the amount paid by the class during periods when reimbursements or reductions occur. Expense ratios before reductions for start-up periods may not be representative of longer-term operating periods. Expenses net of fee waivers reflect expenses after reimbursement by the investment adviser but prior to reductions from brokerage service arrangements or other expense offset arrangements. Expenses net of all reductions represent the net expenses paid by the class.
H Annualized
I Amount does not include the portfolio activity of any underlying Fidelity Central Funds.
See accompanying notes which are an integral part of the financial statements.
Notes to Financial Statements
For the period ended October 31, 2018
1. Organization.
Fidelity Europe Fund (the Fund) is a fund of Fidelity Investment Trust (the Trust) and is authorized to issue an unlimited number of shares. The Trust is registered under the Investment Company Act of 1940, as amended (the 1940 Act), as an open-end management investment company organized as a Massachusetts business trust. The Fund commenced sale of Class Z shares on October 2, 2018. The Fund offers Class A, Class M, Class C, Europe, Class I, and Class Z shares, each of which has equal rights as to assets and voting privileges. Each class has exclusive voting rights with respect to matters that affect that class.
2. Investments in Fidelity Central Funds.
The Fund may invest in Fidelity Central Funds, which are open-end investment companies generally available only to other investment companies and accounts managed by the investment adviser and its affiliates. The Fund's Schedule of Investments lists each of the Fidelity Central Funds held as of period end, if any, as an investment of the Fund, but does not include the underlying holdings of each Fidelity Central Fund. As an Investing Fund, the Fund indirectly bears its proportionate share of the expenses of the underlying Fidelity Central Funds.
The Money Market Central Funds seek preservation of capital and current income and are managed by Fidelity Investments Money Management, Inc. (FIMM), an affiliate of the investment adviser. Annualized expenses of the Money Market Central Funds as of their most recent shareholder report date are less than .005%.
A complete unaudited list of holdings for each Fidelity Central Fund is available upon request or at the Securities and Exchange Commission (the SEC) website at www.sec.gov. In addition, the financial statements of the Fidelity Central Funds, which are not covered by the Fund's Report of Independent Registered Public Accounting Firm, are available on the SEC website or upon request.
3. Significant Accounting Policies.
The Fund is an investment company and applies the accounting and reporting guidance of the Financial Accounting Standards Board (FASB) Accounting Standards Codification Topic 946 Financial Services – Investments Companies. The financial statements have been prepared in conformity with accounting principles generally accepted in the United States of America (GAAP), which require management to make certain estimates and assumptions at the date of the financial statements. Actual results could differ from those estimates. Subsequent events, if any, through the date that the financial statements were issued have been evaluated in the preparation of the financial statements. The following summarizes the significant accounting policies of the Fund:
Investment Valuation. Investments are valued as of 4:00 p.m. Eastern time on the last calendar day of the period. The Board of Trustees (the Board) has delegated the day to day responsibility for the valuation of the Fund's investments to the Fair Value Committee (the Committee) established by the Fund's investment adviser. In accordance with valuation policies and procedures approved by the Board, the Fund attempts to obtain prices from one or more third party pricing vendors or brokers to value its investments. When current market prices, quotations or currency exchange rates are not readily available or reliable, investments will be fair valued in good faith by the Committee, in accordance with procedures adopted by the Board. Factors used in determining fair value vary by investment type and may include market or investment specific events. The frequency with which these procedures are used cannot be predicted and they may be utilized to a significant extent. The Committee oversees the Fund's valuation policies and procedures and reports to the Board on the Committee's activities and fair value determinations. The Board monitors the appropriateness of the procedures used in valuing the Fund's investments and ratifies the fair value determinations of the Committee.
The Fund categorizes the inputs to valuation techniques used to value its investments into a disclosure hierarchy consisting of three levels as shown below:
- Level 1 – quoted prices in active markets for identical investments
- Level 2 – other significant observable inputs (including quoted prices for similar investments, interest rates, prepayment speeds, etc.)
- Level 3 – unobservable inputs (including the Fund's own assumptions based on the best information available)
Valuation techniques used to value the Fund's investments by major category are as follows:
Equity securities, including restricted securities, for which market quotations are readily available, are valued at the last reported sale price or official closing price as reported by a third party pricing vendor on the primary market or exchange on which they are traded and are categorized as Level 1 in the hierarchy. In the event there were no sales during the day or closing prices are not available, securities are valued at the last quoted bid price or may be valued using the last available price and are generally categorized as Level 2 in the hierarchy. For foreign equity securities, when market or security specific events arise, comparisons to the valuation of American Depositary Receipts (ADRs), futures contracts, Exchange-Traded Funds (ETFs)and certain indexes as well as quoted prices for similar securities may be used and would be categorized as Level 2 in the hierarchy. Utilizing these techniques may result in transfers between Level 1 and Level 2. For equity securities, including restricted securities, where observable inputs are limited, assumptions about market activity and risk are used and these securities may be categorized as Level 3 in the hierarchy.
Investments in open-end mutual funds, including the Fidelity Central Funds, are valued at their closing net asset value (NAV) each business day and are categorized as Level 1 in the hierarchy.
Changes in valuation techniques may result in transfers in or out of an assigned level within the disclosure hierarchy. The aggregate value of investments by input level as of October 31, 2018, including information on transfers between Levels 1 and 2, is included at the end of the applicable Fund's Schedule of Investments.
Foreign Currency. The Fund may use foreign currency contracts to facilitate transactions in foreign-denominated securities. Gains and losses from these transactions may arise from changes in the value of the foreign currency or if the counterparties do not perform under the contracts' terms.
Foreign-denominated assets, including investment securities, and liabilities are translated into U.S. dollars at the exchange rates at period end. Purchases and sales of investment securities, income and dividends received and expenses denominated in foreign currencies are translated into U.S. dollars at the exchange rate in effect on the transaction date.
The effects of exchange rate fluctuations on investments are included with the net realized and unrealized gain (loss) on investment securities. Other foreign currency transactions resulting in realized and unrealized gain (loss) are disclosed separately.
Investment Transactions and Income. For financial reporting purposes, the Fund's investment holdings and NAV include trades executed through the end of the last business day of the period. The NAV per share for processing shareholder transactions is calculated as of the close of business of the New York Stock Exchange (NYSE), normally 4:00 p.m. Eastern time and includes trades executed through the end of the prior business day. Gains and losses on securities sold are determined on the basis of identified cost and include proceeds received from litigation. Dividend income is recorded on the ex-dividend date, except for certain dividends from foreign securities where the ex-dividend date may have passed, which are recorded as soon as the Fund is informed of the ex-dividend date. Non-cash dividends included in dividend income, if any, are recorded at the fair market value of the securities received. Income and capital gain distributions from Fidelity Central Funds, if any, are recorded on the ex-dividend date. Investment income is recorded net of foreign taxes withheld where recovery of such taxes is uncertain.
Class Allocations and Expenses. Investment income, realized and unrealized capital gains and losses, common expenses of the Fund, and certain fund-level expense reductions, if any, are allocated daily on a pro-rata basis to each class based on the relative net assets of each class to the total net assets of the Fund. Each class differs with respect to transfer agent and distribution and service plan fees incurred. Certain expense reductions may also differ by class. For the reporting period, the allocated portion of income and expenses to each class as a percent of its average net assets may vary due to the timing of recording these transactions in relation to fluctuating net assets of the classes. Expenses directly attributable to a fund are charged to that fund. Expenses attributable to more than one fund are allocated among the respective funds on the basis of relative net assets or other appropriate methods. Expense estimates are accrued in the period to which they relate and adjustments are made when actual amounts are known.
Income Tax Information and Distributions to Shareholders. Each year, the Fund intends to qualify as a regulated investment company under Subchapter M of the Internal Revenue Code, including distributing substantially all of its taxable income and realized gains. As a result, no provision for U.S. Federal income taxes is required. As of October 31, 2018, the Fund did not have any unrecognized tax benefits in the financial statements; nor is the Fund aware of any tax positions for which it is reasonably possible that the total amounts of unrecognized tax benefits will significantly change in the next twelve months. The Fund files a U.S. federal tax return, in addition to state and local tax returns as required. The Fund's federal income tax returns are subject to examination by the Internal Revenue Service (IRS) for a period of three fiscal years after they are filed. State and local tax returns may be subject to examination for an additional fiscal year depending on the jurisdiction. Foreign taxes are provided for based on the Fund's understanding of the tax rules and rates that exist in the foreign markets in which it invests.
Distributions are declared and recorded on the ex-dividend date. Income and capital gain distributions are declared separately for each class. Income and capital gain distributions are determined in accordance with income tax regulations, which may differ from GAAP.
Capital accounts within the financial statements are adjusted for permanent book-tax differences. These adjustments have no impact on net assets or the results of operations. Capital accounts are not adjusted for temporary book-tax differences which will reverse in a subsequent period.
Book-tax differences are primarily due to foreign currency transactions, passive foreign investment companies (PFIC), deferred trustees compensation and losses deferred due to wash sales.
As of period end, the cost and unrealized appreciation (depreciation) in securities, and derivatives if applicable, for federal income tax purposes were as follows:
| Gross unrealized appreciation | $90,866,441 |
| Gross unrealized depreciation | (93,744,309) |
| Net unrealized appreciation (depreciation) | $(2,877,868) |
| Tax Cost | $976,918,351 |
The tax-based components of distributable earnings as of period end were as follows:
| Undistributed ordinary income | $32,158,544 |
| Undistributed long-term capital gain | $62,888,387 |
| Net unrealized appreciation (depreciation) on securities and other investments | $(2,934,498) |
The tax character of distributions paid was as follows:
| October 31, 2018 | October 31, 2017 | |
| Ordinary Income | $31,260,216 | $ 15,639,334 |
Restricted Securities. The Fund may invest in securities that are subject to legal or contractual restrictions on resale. These securities generally may be resold in transactions exempt from registration or to the public if the securities are registered. Disposal of these securities may involve time-consuming negotiations and expense, and prompt sale at an acceptable price may be difficult. Information regarding restricted securities is included at the end of the Fund's Schedule of Investments.
New Rule Issuance. During August 2018, the U.S. Securities and Exchange Commission issued Final Rule Release No. 33-10532, Disclosure Update and Simplification. This Final Rule includes amendments specific to registered investment companies that are intended to eliminate overlap in disclosure requirements between Regulation S-X and GAAP. In accordance with these amendments, certain line-items in the Fund's financial statements have been combined or removed for the current period as outlined in the table below.
| Financial Statement | Current Line-Item Presentation | Prior Line-Item Presentation |
| Statement of Assets and Liabilities | Total distributable earnings (loss) | Undistributed/Distributions in excess of/Accumulated net investment income (loss) Accumulated/Undistributed net realized gain (loss) Net unrealized appreciation (depreciation) |
| Statement of Changes in Net Assets | N/A - removed | Undistributed/Distributions in excess of/Accumulated net investment income (loss) end of period |
| Statement of Changes in Net Assets | Distributions to shareholders | Distributions to shareholders from net investment income Distributions to shareholders from net realized gain |
| Distributions to Shareholders Note to Financial Statements | Distributions to shareholders | Distributions to shareholders from net investment income Distributions to shareholders from net realized gain |
4. Purchases and Sales of Investments.
Purchases and sales of securities, other than short-term securities, aggregated $673,239,181 and $891,757,645, respectively.
5. Fees and Other Transactions with Affiliates.
Management Fee. Fidelity Management & Research Company (the investment adviser) and its affiliates provide the Fund with investment management related services for which the Fund pays a monthly management fee. The management fee is the sum of an individual fund fee rate that is based on an annual rate of .45% of the Fund's average net assets and an annualized group fee rate that averaged .24% during the period. The group fee rate is based upon the average net assets of all the mutual funds advised by the investment adviser, including any mutual funds previously advised by the investment adviser that are currently advised by Fidelity SelectCo, LLC, an affiliate of the investment adviser. The group fee rate decreases as assets under management increase and increases as assets under management decrease. In addition, the management fee is subject to a performance adjustment (up to a maximum of +/- .20% of the Fund's average net assets over a 36 month performance period). The upward or downward adjustment to the management fee is based on the relative investment performance of Europe as compared to its benchmark index, the MSCI Europe Index, over the same 36 month performance period. For the reporting period, the total annual management fee rate, including the performance adjustment, was .71% of the Fund's average net assets. The performance adjustment included in the management fee rate may be higher or lower than the maximum performance adjustment rate due to the difference between the average net assets for the reporting and performance periods.
Distribution and Service Plan Fees. In accordance with Rule 12b-1 of the 1940 Act, the Fund has adopted separate Distribution and Service Plans for each class of shares. Certain classes pay Fidelity Distributors Corporation (FDC), an affiliate of the investment adviser, separate Distribution and Service Fees, each of which is based on an annual percentage of each class' average net assets. In addition, FDC may pay financial intermediaries for selling shares of the Fund and providing shareholder support services. For the period, the Distribution and Service Fee rates, total fees and amounts retained by FDC were as follows:
| Distribution Fee | Service Fee | Total Fees | Retained by FDC | |
| Class A | -% | .25% | $54,231 | $6,260 |
| Class M | .25% | .25% | 44,642 | 1,000 |
| Class C | .75% | .25% | 117,108 | 24,428 |
| $215,981 | $31,688 |
Sales Load. FDC may receive a front-end sales charge of up to 5.75% for selling Class A shares and 3.50% for selling Class M shares, some of which is paid to financial intermediaries for selling shares of the Fund. Depending on the holding period, FDC may receive contingent deferred sales charges levied on Class A, Class M and Class C redemptions. The deferred sales charges are 1.00% for Class C shares, 1.00% for certain purchases of Class A shares and .25% for certain purchases of Class M shares.
For the period, sales charge amounts retained by FDC were as follows:
| Retained by FDC | |
| Class A | $12,915 |
| Class M | 1,411 |
| Class C(a) | 3,162 |
| $17,488 |
(a) When Class C shares are initially sold, FDC pays commissions from its own resources to financial intermediaries through which the sales are made.
Transfer Agent Fees. Fidelity Investments Institutional Operations Company, Inc., (FIIOC), an affiliate of the investment adviser, is the transfer, dividend disbursing and shareholder servicing agent for each class of the Fund. FIIOC receives account fees and asset-based fees that vary according to the account size and type of account of the shareholders of the respective classes of the Fund, except for Class Z. FIIOC receives an asset-based fee of Class Z's average net assets. FIIOC pays for typesetting, printing and mailing of shareholder reports, except proxy statements.
For the period, transfer agent fees for each class were as follows:
| Amount | % of Class-Level Average Net Assets | |
| Class A | $51,667 | .24 |
| Class M | 28,026 | .31 |
| Class C | 31,388 | .27 |
| Europe | 1,922,471 | .17 |
| Class I | 14,017 | .16 |
| Class Z | 3 | .04(a) |
| $2,047,572 |
(a) Annualized
Accounting and Security Lending Fees. Fidelity Service Company, Inc. (FSC), an affiliate of the investment adviser, maintains the Fund's accounting records. The accounting fee is based on the level of average net assets for each month. Under a separate contract, FSC administers the security lending program. The security lending fee is based on the number and duration of lending transactions. For the period, the fees were equivalent to an annual rate of .05%.
Interfund Lending Program. Pursuant to an Exemptive Order issued by the SEC, the Fund, along with other registered investment companies having management contracts with Fidelity Management & Research Company (FMR) or other affiliated entities of FMR, may participate in an interfund lending program. This program provides an alternative credit facility allowing the funds to borrow from, or lend money to, other participating affiliated funds. At period end, there were no interfund loans outstanding. The Fund's activity in this program during the period for which loans were outstanding was as follows:
| Borrower or Lender | Average Loan Balance | Weighted Average Interest Rate | Interest Expense |
| Borrower | $6,686,400 | 2.36% | $2,196 |
Interfund Trades. The Fund may purchase from or sell securities to other Fidelity Funds under procedures adopted by the Board. The procedures have been designed to ensure these interfund trades are executed in accordance with Rule 17a-7 of the 1940 Act. Interfund trades are included within the respective purchases and sales amounts shown in the Purchases and Sales of Investments note.
Other. During the period, the investment adviser reimbursed the Fund for certain losses in the amount of $92,117.
6. Committed Line of Credit.
The Fund participates with other funds managed by the investment adviser or an affiliate in a $4.25 billion credit facility (the "line of credit") to be utilized for temporary or emergency purposes to fund shareholder redemptions or for other short-term liquidity purposes. The Fund has agreed to pay commitment fees on its pro-rata portion of the line of credit, which amounted to $3,384 and is reflected in Miscellaneous expenses on the Statement of Operations. During the period, the Fund did not borrow on this line of credit.
7. Security Lending.
The Fund lends portfolio securities through a lending agent from time to time in order to earn additional income. For equity securities, a lending agent is used and may loan securities to certain qualified borrowers, including Fidelity Capital Markets (FCM), a broker-dealer affiliated with the Fund. On the settlement date of the loan, the Fund receives collateral (in the form of U.S. Treasury obligations, letters of credit and/or cash) against the loaned securities and maintains collateral in an amount not less than 100% of the market value of the loaned securities during the period of the loan. The market value of the loaned securities is determined at the close of business of the Fund and any additional required collateral is delivered to the Fund on the next business day. The Fund or borrower may terminate the loan at any time, and if the borrower defaults on its obligation to return the securities loaned because of insolvency or other reasons, the Fund may apply collateral received from the borrower against the obligation. The Fund may experience delays and costs in recovering the securities loaned. Any cash collateral received is invested in the Fidelity Securities Lending Cash Central Fund. The value of loaned securities and cash collateral at period end are disclosed on the Fund's Statement of Assets and Liabilities. Security lending income represents the income earned on investing cash collateral, less rebates paid to borrowers and any lending agent fees associated with the loan, plus any premium payments received for lending certain types of securities. Security lending income is presented in the Statement of Operations as a component of income from Fidelity Central Funds. Total security lending income during the period amounted to $322,082. During the period, there were no securities loaned to FCM.
8. Expense Reductions.
During the period the investment adviser reimbursed and/or waived a portion of fund-level operating expenses in the amount of $12,551.
9. Distributions to Shareholders.
Distributions to shareholders of each class were as follows:
| Year ended October 31, 2018 | Year ended October 31, 2017 | |
| Distributions to shareholders | ||
| Class A | $501,208 | $– |
| Class M | 186,202 | – |
| Class C | 200,227 | – |
| Europe | 30,143,621 | – |
| Class I | 228,958 | – |
| Total | $31,260,216 | $– |
| From net investment income | ||
| Class A | $– | $107,755 |
| Class M | – | 18,342 |
| Europe | – | 11,539,715 |
| Class I | – | 62,056 |
| Total | $– | $11,727,868 |
| From net realized gain | ||
| Class A | $– | $60,612 |
| Class M | – | 25,396 |
| Europe | – | 3,806,294 |
| Class I | – | 19,164 |
| Total | $– | $3,911,466 |
10. Share Transactions.
Share transactions for each class were as follows and may contain automatic conversions between classes or exchanges between affiliated funds:
| Shares | Shares | Dollars | Dollars | |
| Year ended October 31, 2018(a) | Year ended October 31, 2017 | Year ended October 31, 2018(a) | Year ended October 31, 2017 | |
| Class A | ||||
| Shares sold | 219,725 | 183,985 | $9,120,083 | $7,204,193 |
| Reinvestment of distributions | 11,776 | 4,870 | 482,917 | 160,602 |
| Shares redeemed | (204,787) | (201,553) | (8,469,723) | (7,350,664) |
| Net increase (decrease) | 26,714 | (12,698) | $1,133,277 | $14,131 |
| Class M | ||||
| Shares sold | 32,492 | 58,824 | $1,375,839 | $2,231,944 |
| Reinvestment of distributions | 4,513 | 1,308 | 185,442 | 43,252 |
| Shares redeemed | (52,789) | (55,679) | (2,166,691) | (2,027,896) |
| Net increase (decrease) | (15,784) | 4,453 | $(605,410) | $247,300 |
| Class C | ||||
| Shares sold | 79,985 | 65,577 | $3,363,120 | $2,522,918 |
| Reinvestment of distributions | 4,833 | – | 197,576 | – |
| Shares redeemed | (68,943) | (77,588) | (2,831,033) | (2,798,078) |
| Net increase (decrease) | 15,875 | (12,011) | $729,663 | $(275,160) |
| Europe | ||||
| Shares sold | 2,475,476 | 6,873,387 | $104,461,482 | $263,271,628 |
| Reinvestment of distributions | 696,409 | 443,969 | 28,552,790 | 14,619,907 |
| Shares redeemed | (9,777,479) | (6,861,890) | (410,827,963) | (254,648,472) |
| Net increase (decrease) | (6,605,594) | 455,466 | $(277,813,691) | $23,243,063 |
| Class I | ||||
| Shares sold | 129,107 | 152,572 | $5,438,702 | $5,796,106 |
| Reinvestment of distributions | 5,434 | 2,369 | 222,682 | 78,022 |
| Shares redeemed | (139,490) | (111,570) | (5,809,512) | (4,088,518) |
| Net increase (decrease) | (4,949) | 43,371 | $(148,128) | $1,785,610 |
| Class Z | ||||
| Shares sold | 2,761 | – | $111,832 | $– |
| Net increase (decrease) | 2,761 | – | $111,832 | $– |
(a) Share transactions for Class Z are for the period October 2, 2018 (commencement of sale of shares) to October 31, 2018.
11. Other.
The Fund's organizational documents provide former and current trustees and officers with a limited indemnification against liabilities arising in connection with the performance of their duties to the Fund. In the normal course of business, the Fund may also enter into contracts that provide general indemnifications. The Fund's maximum exposure under these arrangements is unknown as this would be dependent on future claims that may be made against the Fund. The risk of material loss from such claims is considered remote.
Fidelity® Japan Fund
Performance: The Bottom Line
Average annual total return reflects the change in the value of an investment, assuming reinvestment of distributions from dividend income and capital gains (the profits earned upon the sale of securities that have grown in value, if any) and assuming a constant rate of performance each year. The hypothetical investment and the average annual total returns do not reflect the deduction of taxes that a shareholder would pay on fund distributions or the redemption of fund shares. During periods of reimbursement by Fidelity, a fund’s total return will be greater than it would be had the reimbursement not occurred. How a fund did yesterday is no guarantee of how it will do tomorrow.
Average Annual Total Returns
| For the periods ended October 31, 2018 | Past 1 year | Past 5 years | Past 10 years |
| Fidelity® Japan Fund | (5.28)% | 4.30% | 6.32% |
$10,000 Over 10 Years
Let's say hypothetically that $10,000 was invested in Fidelity® Japan Fund, a class of the fund, on October 31, 2008.
The chart shows how the value of your investment would have changed, and also shows how the Tokyo Stock Price Index (TOPIX) performed over the same period.
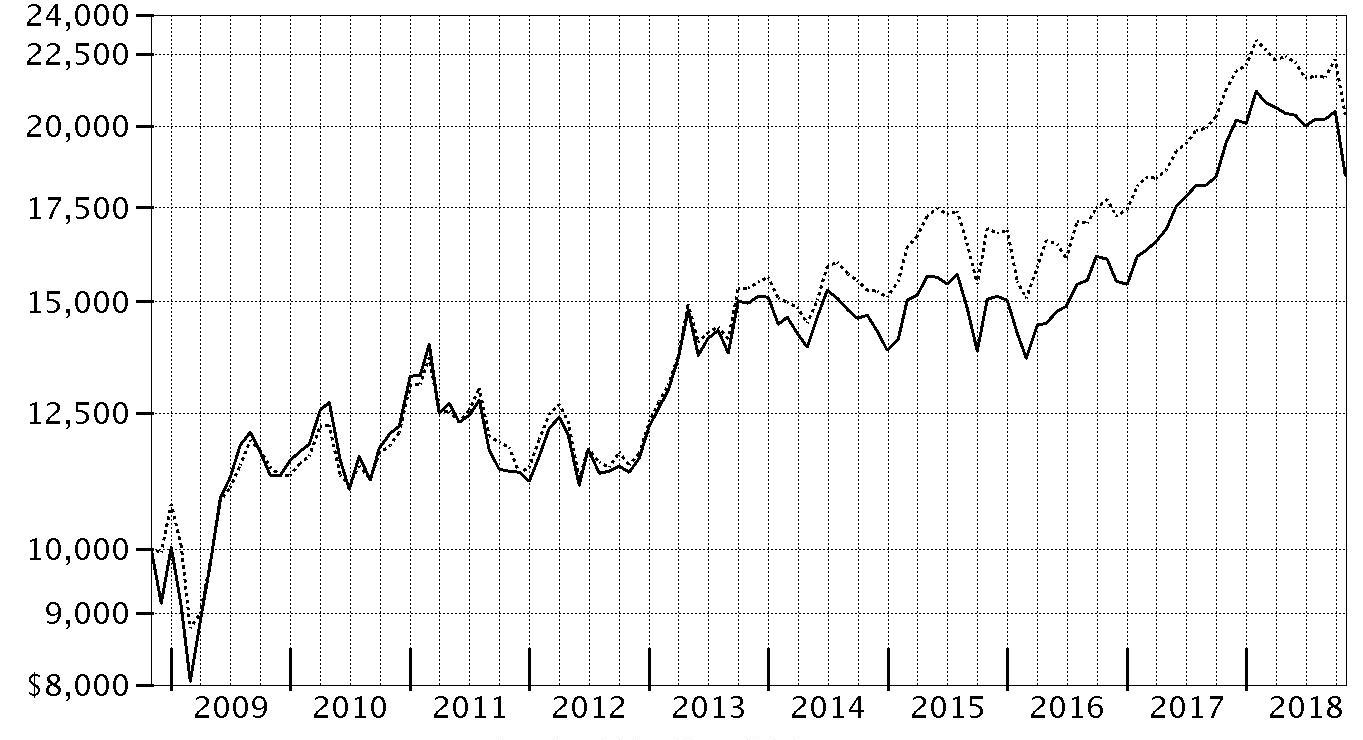
| Period Ending Values | ||
| $18,463 | Fidelity® Japan Fund | |
| $20,365 | Tokyo Stock Price Index (TOPIX) | |
Fidelity® Japan Fund
Management's Discussion of Fund Performance
Market Recap: International equities returned -8.08% for the 12 months ending October 31, 2018, according to the MSCI ACWI (All Country World Index) ex USA Index. A modestly positive first half of the period gave way to a confluence of overwhelmingly negative factors – including escalating trade tensions, a surging U.S. dollar, tepid economic growth in Europe, global central bank tightening, concerns about Italy’s budget stalemate with the EU, and weakness in China’s stock market. The index lost 8% in October alone, its largest monthly drop in more than six years. Among sectors, communications services (-15%) was hit the hardest, while economically sensitive consumer discretionary (-13%), information technology (-12%), financials (-10%), industrials (-9%) and materials (-7%) stocks also fared poorly. Even the more defensive real estate (-9%), utilities (-6%) and consumer staples (-5%) sectors weren’t spared this period. Conversely, elevated crude-oil prices fueled a positive return for energy (+7%), the top-performing sector, followed by the relatively stable-growing health care segment (+2%). Regionally, emerging markets (-12%) fared the worst, hampered by the impact of foreign exchange and concerns about economic weakness in China, India and South Korea. Sluggish growth also pressured shares in continental Europe (-9%). Stocks in Japan (-3%) and the U.K. (-4%) held up better, followed by Canada (-5%) and Asia-Pacific ex Japan (-6%).Comments from Portfolio Manager Kirk Neureiter: For the year, the fund’s share classes (excluding sales charges, if applicable) returned about -5% to -6%, trailing the -4.13% return of the benchmark Tokyo Stock Price Index (TOPIX). Versus the benchmark, stock selection and an overweighting in materials – the benchmark’s weakest-performing sector by far – detracted from fund performance. In addition, the fund’s result reflects a downward fair-value pricing adjustment of 1.06 percentage points. At the stock level, an overweighting, on average, in Renesas Electronics was the biggest negative versus the benchmark. Shares of the semiconductor-products maker were hurt by a slowdown in Japan’s automobile market, among other factors. Overweighting Misumi Group, which operates factory automation and die components businesses worldwide, also detracted this period, as did overweighted exposure to Kansai Paint, Japan’s second-largest paint manufacturer. Conversely, picks in industrials, information technology and consumer discretionary lifted the fund’s relative result. Sony, one of the fund’s major long-term positions, contributed more than any other holding. A notably outsized stake in Shimadzu, a manufacturer measuring equipment of various kinds, added value. China’s rapidly growing middle class drove demand for Shimadzu's products.The views expressed above reflect those of the portfolio manager(s) only through the end of the period as stated on the cover of this report and do not necessarily represent the views of Fidelity or any other person in the Fidelity organization. Any such views are subject to change at any time based upon market or other conditions and Fidelity disclaims any responsibility to update such views. These views may not be relied on as investment advice and, because investment decisions for a Fidelity fund are based on numerous factors, may not be relied on as an indication of trading intent on behalf of any Fidelity fund.
Fidelity® Japan Fund
Investment Summary (Unaudited)
Geographic Diversification (% of fund's net assets)
| As of October 31, 2018 | ||
| Japan | 95.3% | |
| United States of America* | 3.2% | |
| Bailiwick of Jersey | 1.0% | |
| Bermuda | 0.5% | |

* Includes Short-Term investments and Net Other Assets (Liabilities).
Percentages are based on country or territory of incorporation and are adjusted for the effect of futures contracts, if applicable.
Asset Allocation as of October 31, 2018
| % of fund's net assets | |
| Stocks | 96.8 |
| Short-Term Investments and Net Other Assets (Liabilities) | 3.2 |
Top Ten Stocks as of October 31, 2018
| % of fund's net assets | |
| SoftBank Corp. (Wireless Telecommunication Services) | 5.9 |
| Sony Corp. (Household Durables) | 4.6 |
| Mitsubishi UFJ Financial Group, Inc. (Banks) | 4.3 |
| ORIX Corp. (Diversified Financial Services) | 3.4 |
| Shimadzu Corp. (Electronic Equipment & Components) | 3.0 |
| Hoya Corp. (Health Care Equipment & Supplies) | 2.8 |
| Nidec Corp. (Electrical Equipment) | 2.4 |
| Suzuki Motor Corp. (Automobiles) | 2.3 |
| Seven & i Holdings Co. Ltd. (Food & Staples Retailing) | 2.1 |
| Tokio Marine Holdings, Inc. (Insurance) | 2.1 |
| 32.9 |
Top Market Sectors as of October 31, 2018
| % of fund's net assets | |
| Consumer Discretionary | 18.1 |
| Industrials | 16.4 |
| Financials | 13.2 |
| Information Technology | 10.7 |
| Communication Services | 10.2 |
| Consumer Staples | 10.1 |
| Health Care | 9.0 |
| Materials | 8.3 |
| Real Estate | 0.8 |
Fidelity® Japan Fund
Schedule of Investments October 31, 2018
Showing Percentage of Net Assets
| Common Stocks - 96.8% | |||
| Shares | Value | ||
| COMMUNICATION SERVICES - 10.2% | |||
| Entertainment - 2.1% | |||
| Nexon Co. Ltd. (a) | 270,600 | $3,084,075 | |
| Nintendo Co. Ltd. | 25,200 | 7,867,513 | |
| 10,951,588 | |||
| Interactive Media & Services - 0.8% | |||
| LIFULL Co. Ltd. | 617,400 | 4,180,384 | |
| Media - 1.4% | |||
| Dentsu, Inc. | 155,700 | 7,221,340 | |
| Wireless Telecommunication Services - 5.9% | |||
| SoftBank Corp. | 390,700 | 30,919,536 | |
| TOTAL COMMUNICATION SERVICES | 53,272,848 | ||
| CONSUMER DISCRETIONARY - 18.1% | |||
| Auto Components - 1.6% | |||
| Bridgestone Corp. | 173,000 | 6,670,759 | |
| DaikyoNishikawa Corp. | 159,300 | 1,524,740 | |
| 8,195,499 | |||
| Automobiles - 5.2% | |||
| Honda Motor Co. Ltd. | 269,100 | 7,681,602 | |
| Subaru Corp. | 266,300 | 7,183,362 | |
| Suzuki Motor Corp. | 247,400 | 12,337,026 | |
| 27,201,990 | |||
| Distributors - 0.8% | |||
| Arata Corp. | 86,700 | 3,934,098 | |
| Diversified Consumer Services - 0.0% | |||
| Access Group Holdings Co. Ltd. (a) | 1,000 | 11,876 | |
| Hotels, Restaurants & Leisure - 0.6% | |||
| Koshidaka Holdings Co. Ltd. | 260,800 | 3,034,789 | |
| Household Durables - 7.5% | |||
| Panasonic Corp. | 840,300 | 9,017,642 | |
| Rinnai Corp. | 49,300 | 3,591,492 | |
| Sekisui Chemical Co. Ltd. | 147,900 | 2,323,984 | |
| Sony Corp. | 446,500 | 24,163,130 | |
| 39,096,248 | |||
| Internet & Direct Marketing Retail - 0.5% | |||
| Zozo, Inc. | 107,500 | 2,590,442 | |
| Leisure Products - 0.6% | |||
| Bandai Namco Holdings, Inc. | 93,800 | 3,337,679 | |
| Specialty Retail - 1.3% | |||
| Nitori Holdings Co. Ltd. | 34,000 | 4,440,023 | |
| USS Co. Ltd. | 128,600 | 2,321,604 | |
| 6,761,627 | |||
| TOTAL CONSUMER DISCRETIONARY | 94,164,248 | ||
| CONSUMER STAPLES - 10.1% | |||
| Beverages - 0.8% | |||
| Coca-Cola West Co. Ltd. | 167,200 | 4,378,748 | |
| Food & Staples Retailing - 5.5% | |||
| Ain Holdings, Inc. | 43,100 | 3,376,647 | |
| Nishimoto Co. Ltd. | 42,900 | 1,942,828 | |
| San-A Co. Ltd. | 42,700 | 1,803,213 | |
| Seven & i Holdings Co. Ltd. | 250,700 | 10,855,310 | |
| Sundrug Co. Ltd. | 49,100 | 1,784,110 | |
| Tsuruha Holdings, Inc. | 37,900 | 3,950,051 | |
| Welcia Holdings Co. Ltd. | 92,300 | 4,711,730 | |
| 28,423,889 | |||
| Food Products - 0.6% | |||
| Morinaga & Co. Ltd. | 83,500 | 3,355,984 | |
| Personal Products - 3.2% | |||
| Kao Corp. | 136,100 | 9,053,675 | |
| Kose Corp. | 26,100 | 3,902,220 | |
| Shiseido Co. Ltd. | 57,300 | 3,615,372 | |
| 16,571,267 | |||
| TOTAL CONSUMER STAPLES | 52,729,888 | ||
| FINANCIALS - 13.2% | |||
| Banks - 5.0% | |||
| Mitsubishi UFJ Financial Group, Inc. | 3,669,700 | 22,210,833 | |
| Shinsei Bank Ltd. | 235,800 | 3,591,941 | |
| 25,802,774 | |||
| Capital Markets - 0.9% | |||
| JAFCO Co. Ltd. | 67,500 | 2,608,233 | |
| SBI Holdings, Inc. Japan | 80,400 | 2,109,845 | |
| 4,718,078 | |||
| Consumer Finance - 0.7% | |||
| AEON Financial Service Co. Ltd. | 198,400 | 3,896,436 | |
| Diversified Financial Services - 3.4% | |||
| ORIX Corp. | 1,094,500 | 17,857,708 | |
| Insurance - 3.2% | |||
| Sony Financial Holdings, Inc. | 247,800 | 5,716,613 | |
| Tokio Marine Holdings, Inc. | 229,400 | 10,807,525 | |
| 16,524,138 | |||
| TOTAL FINANCIALS | 68,799,134 | ||
| HEALTH CARE - 9.0% | |||
| Biotechnology - 1.3% | |||
| PeptiDream, Inc. (a)(b) | 39,000 | 1,280,587 | |
| Shire PLC | 87,600 | 5,286,742 | |
| 6,567,329 | |||
| Health Care Equipment & Supplies - 5.2% | |||
| Hoya Corp. | 257,800 | 14,654,400 | |
| Nakanishi, Inc. | 110,700 | 2,592,991 | |
| Olympus Corp. | 199,800 | 6,659,693 | |
| Paramount Bed Holdings Co. Ltd. | 77,500 | 3,265,941 | |
| 27,173,025 | |||
| Health Care Providers & Services - 0.6% | |||
| Ship Healthcare Holdings, Inc. | 92,000 | 3,330,704 | |
| Pharmaceuticals - 1.9% | |||
| Takeda Pharmaceutical Co. Ltd. (b) | 241,700 | 10,020,773 | |
| TOTAL HEALTH CARE | 47,091,831 | ||
| INDUSTRIALS - 16.4% | |||
| Building Products - 2.6% | |||
| Daikin Industries Ltd. | 79,100 | 9,168,633 | |
| Toto Ltd. | 129,100 | 4,618,716 | |
| 13,787,349 | |||
| Commercial Services & Supplies - 0.9% | |||
| Sohgo Security Services Co., Ltd. | 106,500 | 4,747,596 | |
| Construction & Engineering - 1.7% | |||
| Mirait Holdings Corp. (b) | 257,000 | 4,149,900 | |
| Toshiba Plant Systems & Services Corp. | 229,800 | 4,700,478 | |
| 8,850,378 | |||
| Electrical Equipment - 2.4% | |||
| Nidec Corp. | 99,000 | 12,713,342 | |
| Machinery - 2.2% | |||
| Hoshizaki Corp. | 9,200 | 742,784 | |
| Kitz Corp. | 230,900 | 1,839,669 | |
| Minebea Mitsumi, Inc. | 301,700 | 4,615,414 | |
| Misumi Group, Inc. | 221,900 | 4,456,289 | |
| 11,654,156 | |||
| Professional Services - 3.2% | |||
| Funai Soken Holdings, Inc. | 99,000 | 2,099,588 | |
| Outsourcing, Inc. | 292,600 | 3,708,229 | |
| Recruit Holdings Co. Ltd. | 163,700 | 4,393,641 | |
| SMS Co., Ltd. | 167,400 | 2,805,454 | |
| Temp Holdings Co., Ltd. | 190,200 | 3,620,770 | |
| 16,627,682 | |||
| Road & Rail - 2.6% | |||
| East Japan Railway Co. | 117,800 | 10,288,386 | |
| Hitachi Transport System Ltd. | 119,900 | 3,085,830 | |
| 13,374,216 | |||
| Trading Companies & Distributors - 0.8% | |||
| Trusco Nakayama Corp. | 154,300 | 3,890,491 | |
| TOTAL INDUSTRIALS | 85,645,210 | ||
| INFORMATION TECHNOLOGY - 10.7% | |||
| Electronic Equipment & Components - 7.1% | |||
| Azbil Corp. | 149,000 | 2,775,717 | |
| Dexerials Corp. | 415,700 | 3,577,300 | |
| Iriso Electronics Co. Ltd. | 44,400 | 1,878,938 | |
| Murata Manufacturing Co. Ltd. | 31,100 | 4,731,081 | |
| Shimadzu Corp. | 618,900 | 15,648,706 | |
| TDK Corp. | 65,400 | 5,639,447 | |
| Topcon Corp. | 189,000 | 2,750,370 | |
| 37,001,559 | |||
| IT Services - 3.0% | |||
| GMO Internet, Inc. | 182,900 | 2,612,973 | |
| IT Holdings Corp. | 82,000 | 3,677,228 | |
| ITOCHU Techno-Solutions Corp. | 204,800 | 3,884,185 | |
| NSD Co. Ltd. | 128,200 | 2,719,996 | |
| Otsuka Corp. | 77,800 | 2,585,634 | |
| 15,480,016 | |||
| Semiconductors & Semiconductor Equipment - 0.6% | |||
| Renesas Electronics Corp. (a) | 582,100 | 3,084,998 | |
| TOTAL INFORMATION TECHNOLOGY | 55,566,573 | ||
| MATERIALS - 8.3% | |||
| Chemicals - 7.8% | |||
| Axalta Coating Systems Ltd. (a) | 104,400 | 2,576,592 | |
| Hitachi Chemical Co. Ltd. | 160,700 | 2,536,506 | |
| JSR Corp. | 276,000 | 4,124,040 | |
| Kansai Paint Co. Ltd. | 311,100 | 4,607,153 | |
| KH Neochem Co. Ltd. | 81,800 | 2,319,848 | |
| Nissan Chemical Corp. | 108,100 | 5,097,054 | |
| Nitto Denko Corp. | 49,500 | 3,092,517 | |
| NOF Corp. | 109,400 | 3,107,431 | |
| Okamoto Industries, Inc. | 35,000 | 1,575,752 | |
| Shin-Etsu Chemical Co. Ltd. | 105,600 | 8,823,991 | |
| Tokyo Ohka Kogyo Co. Ltd. | 96,200 | 2,583,294 | |
| 40,444,178 | |||
| Construction Materials - 0.5% | |||
| Taiheiyo Cement Corp. | 90,400 | 2,660,173 | |
| TOTAL MATERIALS | 43,104,351 | ||
| REAL ESTATE - 0.8% | |||
| Equity Real Estate Investment Trusts (REITs) - 0.6% | |||
| Invincible Investment Corp. | 8,076 | 3,342,484 | |
| Real Estate Management & Development - 0.2% | |||
| Tateru, Inc. (b) | 191,200 | 804,892 | |
| TOTAL REAL ESTATE | 4,147,376 | ||
| TOTAL COMMON STOCKS | |||
| (Cost $455,938,682) | 504,521,459 | ||
| Money Market Funds - 3.4% | |||
| Fidelity Cash Central Fund, 2.23% (c) | 7,513,828 | 7,515,331 | |
| Fidelity Securities Lending Cash Central Fund 2.23% (c)(d) | 10,449,522 | 10,450,567 | |
| TOTAL MONEY MARKET FUNDS | |||
| (Cost $17,966,060) | 17,965,898 | ||
| TOTAL INVESTMENT IN SECURITIES - 100.2% | |||
| (Cost $473,904,742) | 522,487,357 | ||
| NET OTHER ASSETS (LIABILITIES) - (0.2)% | (1,032,551) | ||
| NET ASSETS - 100% | $521,454,806 |
Legend
(a) Non-income producing
(b) Security or a portion of the security is on loan at period end.
(c) Affiliated fund that is generally available only to investment companies and other accounts managed by Fidelity Investments. The rate quoted is the annualized seven-day yield of the fund at period end. A complete unaudited listing of the fund's holdings as of its most recent quarter end is available upon request. In addition, each Fidelity Central Fund's financial statements, which are not covered by the Fund's Report of Independent Registered Public Accounting Firm, are available on the SEC's website or upon request.
(d) Investment made with cash collateral received from securities on loan.
Affiliated Central Funds
Information regarding fiscal year to date income earned by the Fund from investments in Fidelity Central Funds is as follows:
| Fund | Income earned |
| Fidelity Cash Central Fund | $61,230 |
| Fidelity Securities Lending Cash Central Fund | 112,917 |
| Total | $174,147 |
Amounts in the income column in the above table include any capital gain distributions from underlying funds, which are presented in the corresponding line-item in the Statement of Operations if applicable.
Investment Valuation
The following is a summary of the inputs used, as of October 31, 2018, involving the Fund's assets and liabilities carried at fair value. The inputs or methodology used for valuing securities may not be an indication of the risk associated with investing in those securities. For more information on valuation inputs, and their aggregation into the levels used below, please refer to the Investment Valuation section in the accompanying Notes to Financial Statements.
| Valuation Inputs at Reporting Date: | ||||
| Description | Total | Level 1 | Level 2 | Level 3 |
| Investments in Securities: | ||||
| Equities: | ||||
| Communication Services | $53,272,848 | $7,264,459 | $46,008,389 | $-- |
| Consumer Discretionary | 94,164,248 | 27,098,851 | 67,065,397 | -- |
| Consumer Staples | 52,729,888 | 29,205,531 | 23,524,357 | -- |
| Financials | 68,799,134 | 26,472,222 | 42,326,912 | -- |
| Health Care | 47,091,831 | 25,124,623 | 21,967,208 | -- |
| Industrials | 85,645,210 | 52,560,420 | 33,084,790 | -- |
| Information Technology | 55,566,573 | 49,927,126 | 5,639,447 | -- |
| Materials | 43,104,351 | 23,430,616 | 19,673,735 | -- |
| Real Estate | 4,147,376 | 4,147,376 | -- | -- |
| Money Market Funds | 17,965,898 | 17,965,898 | -- | -- |
| Total Investments in Securities: | $522,487,357 | $263,197,122 | $259,290,235 | $-- |
The following is a summary of transfers between Level 1 and Level 2 for the period ended October 31, 2018. Transfers are assumed to have occurred at the beginning of the period, and are primarily attributable to the valuation techniques used for foreign equity securities, as discussed in the accompanying Notes to Financial Statements:
| Transfers | Total |
| Level 1 to Level 2 | $0 |
| Level 2 to Level 1 | $174,646,272 |
See accompanying notes which are an integral part of the financial statements.
Fidelity® Japan Fund
Financial Statements
Statement of Assets and Liabilities
| October 31, 2018 | ||
| Assets | ||
| Investment in securities, at value (including securities loaned of $9,941,920) — See accompanying schedule: Unaffiliated issuers (cost $455,938,682) | $504,521,459 | |
| Fidelity Central Funds (cost $17,966,060) | 17,965,898 | |
| Total Investment in Securities (cost $473,904,742) | $522,487,357 | |
| Receivable for investments sold | 1,519,230 | |
| Receivable for fund shares sold | 142,935,435 | |
| Dividends receivable | 2,170,586 | |
| Distributions receivable from Fidelity Central Funds | 21,042 | |
| Prepaid expenses | 771 | |
| Other receivables | 7,699 | |
| Total assets | 669,142,120 | |
| Liabilities | ||
| Payable for investments purchased | $136,686,909 | |
| Payable for fund shares redeemed | 143,932 | |
| Accrued management fee | 237,308 | |
| Distribution and service plan fees payable | 15,894 | |
| Other affiliated payables | 76,257 | |
| Other payables and accrued expenses | 78,104 | |
| Collateral on securities loaned | 10,448,910 | |
| Total liabilities | 147,687,314 | |
| Net Assets | $521,454,806 | |
| Net Assets consist of: | ||
| Paid in capital | $574,469,362 | |
| Total distributable earnings (loss) | (53,014,556) | |
| Net Assets | $521,454,806 | |
| Net Asset Value and Maximum Offering Price | ||
| Class A: | ||
| Net Asset Value and redemption price per share ($14,587,007 ÷ 1,030,792 shares) | $14.15 | |
| Maximum offering price per share (100/94.25 of $14.15) | $15.01 | |
| Class M: | ||
| Net Asset Value and redemption price per share ($3,993,379 ÷ 282,921 shares) | $14.11 | |
| Maximum offering price per share (100/96.50 of $14.11) | $14.62 | |
| Class C: | ||
| Net Asset Value and offering price per share ($12,585,841 ÷ 901,103 shares)(a) | $13.97 | |
| Japan: | ||
| Net Asset Value, offering price and redemption price per share ($297,643,914 ÷ 20,955,089 shares) | $14.20 | |
| Class I: | ||
| Net Asset Value, offering price and redemption price per share ($192,554,711 ÷ 13,577,525 shares) | $14.18 | |
| Class Z: | ||
| Net Asset Value, offering price and redemption price per share ($89,954 ÷ 6,341 shares) | $14.19 |
(a) Redemption price per share is equal to net asset value less any applicable contingent deferred sales charge.
See accompanying notes which are an integral part of the financial statements.
Statement of Operations
| Year ended October 31, 2018 | ||
| Investment Income | ||
| Dividends | $6,600,456 | |
| Income from Fidelity Central Funds | 174,147 | |
| Income before foreign taxes withheld | 6,774,603 | |
| Less foreign taxes withheld | (659,951) | |
| Total income | 6,114,652 | |
| Expenses | ||
| Management fee | ||
| Basic fee | $2,832,913 | |
| Performance adjustment | 197,833 | |
| Transfer agent fees | 734,462 | |
| Distribution and service plan fees | 214,119 | |
| Accounting and security lending fees | 214,020 | |
| Custodian fees and expenses | 43,009 | |
| Independent trustees' fees and expenses | 2,060 | |
| Registration fees | 75,935 | |
| Audit | 78,535 | |
| Legal | 1,017 | |
| Miscellaneous | 2,723 | |
| Total expenses before reductions | 4,396,626 | |
| Expense reductions | (40,460) | |
| Total expenses after reductions | 4,356,166 | |
| Net investment income (loss) | 1,758,486 | |
| Realized and Unrealized Gain (Loss) | ||
| Net realized gain (loss) on: | ||
| Investment securities: | ||
| Unaffiliated issuers | 41,499,026 | |
| Fidelity Central Funds | (169) | |
| Foreign currency transactions | 77,952 | |
| Total net realized gain (loss) | 41,576,809 | |
| Change in net unrealized appreciation (depreciation) on: | ||
| Investment securities: | ||
| Unaffiliated issuers | (63,821,493) | |
| Fidelity Central Funds | 346 | |
| Assets and liabilities in foreign currencies | 414,016 | |
| Total change in net unrealized appreciation (depreciation) | (63,407,131) | |
| Net gain (loss) | (21,830,322) | |
| Net increase (decrease) in net assets resulting from operations | $(20,071,836) |
See accompanying notes which are an integral part of the financial statements.
Statement of Changes in Net Assets
| Year ended October 31, 2018 | Year ended October 31, 2017 | |
| Increase (Decrease) in Net Assets | ||
| Operations | ||
| Net investment income (loss) | $1,758,486 | $2,955,189 |
| Net realized gain (loss) | 41,576,809 | 11,302,131 |
| Change in net unrealized appreciation (depreciation) | (63,407,131) | 67,770,223 |
| Net increase (decrease) in net assets resulting from operations | (20,071,836) | 82,027,543 |
| Distributions to shareholders | (3,858,691) | – |
| Distributions to shareholders from net investment income | – | (3,369,067) |
| Distributions to shareholders from net realized gain | – | (1,060,540) |
| Total distributions | (3,858,691) | (4,429,607) |
| Share transactions - net increase (decrease) | 88,029,029 | (23,430,665) |
| Redemption fees | 7,512 | 33,312 |
| Total increase (decrease) in net assets | 64,106,014 | 54,200,583 |
| Net Assets | ||
| Beginning of period | 457,348,792 | 403,148,209 |
| End of period | $521,454,806 | $457,348,792 |
| Other Information | ||
| Undistributed net investment income end of period | $2,940,381 |
See accompanying notes which are an integral part of the financial statements.
Financial Highlights
Fidelity Japan Fund Class A
| Years ended October 31, | 2018 | 2017 | 2016 | 2015 | 2014 |
| Selected Per–Share Data | |||||
| Net asset value, beginning of period | $15.08 | $12.59 | $11.87 | $11.65 | $12.00 |
| Income from Investment Operations | |||||
| Net investment income (loss)A | .03 | .06 | .06 | .04 | .05 |
| Net realized and unrealized gain (loss) | (.85) | 2.52 | .72 | .23 | (.31) |
| Total from investment operations | (.82) | 2.58 | .78 | .27 | (.26) |
| Distributions from net investment income | (.08) | (.06) | (.05) | (.05) | (.08) |
| Distributions from net realized gain | (.04) | (.03) | (.01) | – | (.01) |
| Total distributions | (.11)B | (.09) | (.06) | (.05) | (.09) |
| Redemption fees added to paid in capitalA,C | – | – | – | – | – |
| Net asset value, end of period | $14.15 | $15.08 | $12.59 | $11.87 | $11.65 |
| Total ReturnD,E | (5.48)% | 20.70% | 6.56% | 2.31% | (2.18)% |
| Ratios to Average Net AssetsF,G | |||||
| Expenses before reductions | 1.33% | 1.11% | 1.08% | 1.10% | 1.23% |
| Expenses net of fee waivers, if any | 1.33% | 1.11% | 1.08% | 1.10% | 1.23% |
| Expenses net of all reductions | 1.32% | 1.11% | 1.08% | 1.09% | 1.23% |
| Net investment income (loss) | .17% | .45% | .51% | .37% | .41% |
| Supplemental Data | |||||
| Net assets, end of period (000 omitted) | $14,587 | $16,155 | $23,910 | $23,918 | $21,352 |
| Portfolio turnover rateH | 40% | 23% | 15% | 35% | 112% |
A Calculated based on average shares outstanding during the period.
B Total distributions of $.11 per share is comprised of distributions from net investment income of $.078 and distributions from net realized gain of $.035 per share.
C Amount represents less than $.005 per share.
D Total returns would have been lower if certain expenses had not been reduced during the applicable periods shown.
E Total returns do not include the effect of the sales charges.
F Fees and expenses of any underlying Fidelity Central Funds are not included in the Fund's expense ratio. The Fund indirectly bears its proportionate share of the expenses of any underlying Fidelity Central Funds.
G Expense ratios reflect operating expenses of the class. Expenses before reductions do not reflect amounts reimbursed by the investment adviser or reductions from brokerage service arrangements or reductions from other expense offset arrangements and do not represent the amount paid by the class during periods when reimbursements or reductions occur. Expenses net of fee waivers reflect expenses after reimbursement by the investment adviser but prior to reductions from brokerage service arrangements or other expense offset arrangements. Expenses net of all reductions represent the net expenses paid by the class.
H Amount does not include the portfolio activity of any underlying Fidelity Central Funds.
See accompanying notes which are an integral part of the financial statements.
Fidelity Japan Fund Class M
| Years ended October 31, | 2018 | 2017 | 2016 | 2015 | 2014 |
| Selected Per–Share Data | |||||
| Net asset value, beginning of period | $15.06 | $12.57 | $11.85 | $11.62 | $11.96 |
| Income from Investment Operations | |||||
| Net investment income (loss)A | (.03) | .01 | .02 | –B | .01 |
| Net realized and unrealized gain (loss) | (.84) | 2.52 | .71 | .23 | (.30) |
| Total from investment operations | (.87) | 2.53 | .73 | .23 | (.29) |
| Distributions from net investment income | (.05) | (.01) | –B | – | (.04) |
| Distributions from net realized gain | (.04) | (.03) | (.01) | – | (.01) |
| Total distributions | (.08)C | (.04) | (.01) | – | (.05) |
| Redemption fees added to paid in capitalA,B | – | – | – | – | – |
| Net asset value, end of period | $14.11 | $15.06 | $12.57 | $11.85 | $11.62 |
| Total ReturnD,E | (5.81)% | 20.24% | 6.15% | 1.98% | (2.42)% |
| Ratios to Average Net AssetsF,G | |||||
| Expenses before reductions | 1.67% | 1.46% | 1.44% | 1.43% | 1.54% |
| Expenses net of fee waivers, if any | 1.67% | 1.46% | 1.44% | 1.43% | 1.54% |
| Expenses net of all reductions | 1.66% | 1.46% | 1.44% | 1.42% | 1.54% |
| Net investment income (loss) | (.17)% | .10% | .16% | .04% | .10% |
| Supplemental Data | |||||
| Net assets, end of period (000 omitted) | $3,993 | $4,464 | $4,193 | $4,809 | $4,104 |
| Portfolio turnover rateH | 40% | 23% | 15% | 35% | 112% |
A Calculated based on average shares outstanding during the period.
B Amount represents less than $.005 per share.
C Total distributions of $.08 per share is comprised of distributions from net investment income of $.047 and distributions from net realized gain of $.035 per share.
D Total returns would have been lower if certain expenses had not been reduced during the applicable periods shown.
E Total returns do not include the effect of the sales charges.
F Fees and expenses of any underlying Fidelity Central Funds are not included in the Fund's expense ratio. The Fund indirectly bears its proportionate share of the expenses of any underlying Fidelity Central Funds.
G Expense ratios reflect operating expenses of the class. Expenses before reductions do not reflect amounts reimbursed by the investment adviser or reductions from brokerage service arrangements or reductions from other expense offset arrangements and do not represent the amount paid by the class during periods when reimbursements or reductions occur. Expenses net of fee waivers reflect expenses after reimbursement by the investment adviser but prior to reductions from brokerage service arrangements or other expense offset arrangements. Expenses net of all reductions represent the net expenses paid by the class.
H Amount does not include the portfolio activity of any underlying Fidelity Central Funds.
See accompanying notes which are an integral part of the financial statements.
Fidelity Japan Fund Class C
| Years ended October 31, | 2018 | 2017 | 2016 | 2015 | 2014 |
| Selected Per–Share Data | |||||
| Net asset value, beginning of period | $14.92 | $12.44 | $11.77 | $11.58 | $11.96 |
| Income from Investment Operations | |||||
| Net investment income (loss)A | (.08) | (.03) | (.02) | (.04) | (.03) |
| Net realized and unrealized gain (loss) | (.83) | 2.51 | .69 | .23 | (.32) |
| Total from investment operations | (.91) | 2.48 | .67 | .19 | (.35) |
| Distributions from net investment income | –B | – | – | – | (.03) |
| Distributions from net realized gain | (.04) | – | – | – | (.01) |
| Total distributions | (.04) | – | – | – | (.03)C |
| Redemption fees added to paid in capitalA,B | – | – | – | – | – |
| Net asset value, end of period | $13.97 | $14.92 | $12.44 | $11.77 | $11.58 |
| Total ReturnD,E | (6.13)% | 19.94% | 5.69% | 1.64% | (2.90)% |
| Ratios to Average Net AssetsF,G | |||||
| Expenses before reductions | 2.04% | 1.81% | 1.81% | 1.81% | 1.93% |
| Expenses net of fee waivers, if any | 2.03% | 1.81% | 1.81% | 1.81% | 1.93% |
| Expenses net of all reductions | 2.03% | 1.81% | 1.81% | 1.80% | 1.93% |
| Net investment income (loss) | (.53)% | (.25)% | (.21)% | (.34)% | (.29)% |
| Supplemental Data | |||||
| Net assets, end of period (000 omitted) | $12,586 | $13,542 | $15,077 | $18,491 | $13,162 |
| Portfolio turnover rateH | 40% | 23% | 15% | 35% | 112% |
A Calculated based on average shares outstanding during the period.
B Amount represents less than $.005 per share.
C Total distributions of $.03 per share is comprised of distributions from net investment income of $.025 and distributions from net realized gain of $.009 per share.
D Total returns would have been lower if certain expenses had not been reduced during the applicable periods shown.
E Total returns do not include the effect of the contingent deferred sales charge.
F Fees and expenses of any underlying Fidelity Central Funds are not included in the Fund's expense ratio. The Fund indirectly bears its proportionate share of the expenses of any underlying Fidelity Central Funds.
G Expense ratios reflect operating expenses of the class. Expenses before reductions do not reflect amounts reimbursed by the investment adviser or reductions from brokerage service arrangements or reductions from other expense offset arrangements and do not represent the amount paid by the class during periods when reimbursements or reductions occur. Expenses net of fee waivers reflect expenses after reimbursement by the investment adviser but prior to reductions from brokerage service arrangements or other expense offset arrangements. Expenses net of all reductions represent the net expenses paid by the class.
H Amount does not include the portfolio activity of any underlying Fidelity Central Funds.
See accompanying notes which are an integral part of the financial statements.
Fidelity Japan Fund
| Years ended October 31, | 2018 | 2017 | 2016 | 2015 | 2014 |
| Selected Per–Share Data | |||||
| Net asset value, beginning of period | $15.13 | $12.64 | $11.91 | $11.69 | $12.03 |
| Income from Investment Operations | |||||
| Net investment income (loss)A | .07 | .10 | .09 | .08 | .09 |
| Net realized and unrealized gain (loss) | (.86) | 2.54 | .72 | .23 | (.32) |
| Total from investment operations | (.79) | 2.64 | .81 | .31 | (.23) |
| Distributions from net investment income | (.11) | (.11) | (.07) | (.09) | (.11) |
| Distributions from net realized gain | (.04) | (.03) | (.01) | – | (.01) |
| Total distributions | (.14)B | (.15)C | (.08) | (.09) | (.11)D |
| Redemption fees added to paid in capitalA,E | – | – | – | – | – |
| Net asset value, end of period | $14.20 | $15.13 | $12.64 | $11.91 | $11.69 |
| Total ReturnF | (5.28)% | 21.13% | 6.80% | 2.66% | (1.90)% |
| Ratios to Average Net AssetsG,H | |||||
| Expenses before reductions | 1.05% | .82% | .78% | .80% | .90% |
| Expenses net of fee waivers, if any | 1.05% | .82% | .78% | .80% | .90% |
| Expenses net of all reductions | 1.04% | .82% | .78% | .79% | .90% |
| Net investment income (loss) | .45% | .74% | .81% | .67% | .74% |
| Supplemental Data | |||||
| Net assets, end of period (000 omitted) | $297,644 | $247,372 | $352,936 | $485,803 | $415,612 |
| Portfolio turnover rateI | 40% | 23% | 15% | 35% | 112% |
A Calculated based on average shares outstanding during the period.
B Total distributions of $.14 per share is comprised of distributions from net investment income of $.107 and distributions from net realized gain of $.035 per share.
C Total distributions of $.15 per share is comprised of distributions from net investment income of $.112 and distributions from net realized gain of $.034 per share.
D Total distributions of $.11 per share is comprised of distributions from net investment income of $.105 and distributions from net realized gain of $.009 per share.
E Amount represents less than $.005 per share.
F Total returns would have been lower if certain expenses had not been reduced during the applicable periods shown.
G Fees and expenses of any underlying Fidelity Central Funds are not included in the Fund's expense ratio. The Fund indirectly bears its proportionate share of the expenses of any underlying Fidelity Central Funds.
H Expense ratios reflect operating expenses of the class. Expenses before reductions do not reflect amounts reimbursed by the investment adviser or reductions from brokerage service arrangements or reductions from other expense offset arrangements and do not represent the amount paid by the class during periods when reimbursements or reductions occur. Expenses net of fee waivers reflect expenses after reimbursement by the investment adviser but prior to reductions from brokerage service arrangements or other expense offset arrangements. Expenses net of all reductions represent the net expenses paid by the class.
I Amount does not include the portfolio activity of any underlying Fidelity Central Funds.
See accompanying notes which are an integral part of the financial statements.
Fidelity Japan Fund Class I
| Years ended October 31, | 2018 | 2017 | 2016 | 2015 | 2014 |
| Selected Per–Share Data | |||||
| Net asset value, beginning of period | $15.12 | $12.62 | $11.89 | $11.67 | $12.02 |
| Income from Investment Operations | |||||
| Net investment income (loss)A | .08 | .11 | .10 | .08 | .09 |
| Net realized and unrealized gain (loss) | (.85) | 2.53 | .70 | .23 | (.32) |
| Total from investment operations | (.77) | 2.64 | .80 | .31 | (.23) |
| Distributions from net investment income | (.14) | (.11) | (.07) | (.09) | (.12) |
| Distributions from net realized gain | (.04) | (.03) | (.01) | – | (.01) |
| Total distributions | (.17)B | (.14) | (.07)C | (.09) | (.12)D |
| Redemption fees added to paid in capitalA,E | – | – | – | – | – |
| Net asset value, end of period | $14.18 | $15.12 | $12.62 | $11.89 | $11.67 |
| Total ReturnF | (5.18)% | 21.22% | 6.77% | 2.72% | (1.90)% |
| Ratios to Average Net AssetsG,H | |||||
| Expenses before reductions | .98% | .76% | .77% | .80% | .89% |
| Expenses net of fee waivers, if any | .98% | .76% | .77% | .80% | .89% |
| Expenses net of all reductions | .97% | .76% | .76% | .79% | .89% |
| Net investment income (loss) | .52% | .80% | .83% | .67% | .76% |
| Supplemental Data | |||||
| Net assets, end of period (000 omitted) | $192,555 | $175,816 | $7,032 | $13,957 | $20,253 |
| Portfolio turnover rateI | 40% | 23% | 15% | 35% | 112% |
A Calculated based on average shares outstanding during the period.
B Total distributions of $.17 per share is comprised of distributions from net investment income of $.135 and distributions from net realized gain of $.035 per share.
C Total distributions of $.07 per share is comprised of distributions from net investment income of $.065 and distributions from net realized gain of $.006 per share.
D Total distributions of $.12 per share is comprised of distributions from net investment income of $.115 and distributions from net realized gain of $.009 per share.
E Amount represents less than $.005 per share.
F Total returns would have been lower if certain expenses had not been reduced during the applicable periods shown.
G Fees and expenses of any underlying Fidelity Central Funds are not included in the Fund's expense ratio. The Fund indirectly bears its proportionate share of the expenses of any underlying Fidelity Central Funds.
H Expense ratios reflect operating expenses of the class. Expenses before reductions do not reflect amounts reimbursed by the investment adviser or reductions from brokerage service arrangements or reductions from other expense offset arrangements and do not represent the amount paid by the class during periods when reimbursements or reductions occur. Expenses net of fee waivers reflect expenses after reimbursement by the investment adviser but prior to reductions from brokerage service arrangements or other expense offset arrangements. Expenses net of all reductions represent the net expenses paid by the class.
I Amount does not include the portfolio activity of any underlying Fidelity Central Funds.
See accompanying notes which are an integral part of the financial statements.
Fidelity Japan Fund Class Z
| Year ended October 31, | 2018 A |
| Selected Per–Share Data | |
| Net asset value, beginning of period | $15.77 |
| Income from Investment Operations | |
| Net investment income (loss)B | (.01) |
| Net realized and unrealized gain (loss) | (1.57) |
| Total from investment operations | (1.58) |
| Net asset value, end of period | $14.19 |
| Total ReturnC,D | (10.02)% |
| Ratios to Average Net AssetsE,F | |
| Expenses before reductions | .96%G |
| Expenses net of fee waivers, if any | .96%G |
| Expenses net of all reductions | .95%G |
| Net investment income (loss) | (.73)%G |
| Supplemental Data | |
| Net assets, end of period (000 omitted) | $90 |
| Portfolio turnover rateH | 40% |
A For the period October 2, 2018 (commencement of sale of shares) to October 31, 2018.
B Calculated based on average shares outstanding during the period.
C Total returns for periods of less than one year are not annualized.
D Total returns would have been lower if certain expenses had not been reduced during the applicable periods shown.
E Fees and expenses of any underlying Fidelity Central Funds are not included in the Fund's expense ratio. The Fund indirectly bears its proportionate share of the expenses of any underlying Fidelity Central Funds.
F Expense ratios reflect operating expenses of the class. Expenses before reductions do not reflect amounts reimbursed by the investment adviser or reductions from brokerage service arrangements or reductions from other expense offset arrangements and do not represent the amount paid by the class during periods when reimbursements or reductions occur. Expense ratios before reductions for start-up periods may not be representative of longer-term operating periods. Expenses net of fee waivers reflect expenses after reimbursement by the investment adviser but prior to reductions from brokerage service arrangements or other expense offset arrangements. Expenses net of all reductions represent the net expenses paid by the class.
G Annualized
H Amount does not include the portfolio activity of any underlying Fidelity Central Funds.
See accompanying notes which are an integral part of the financial statements.
Notes to Financial Statements
For the period ended October 31, 2018
1. Organization.
Fidelity Japan Fund (the Fund) is a fund of Fidelity Investment Trust (the Trust) and is authorized to issue an unlimited number of shares. The Trust is registered under the Investment Company Act of 1940, as amended (the 1940 Act), as an open-end management investment company organized as a Massachusetts business trust. The Fund commenced sale of Class Z shares on October 2, 2018. The Fund offers Class A, Class M, Class C, Japan, Class I and Class Z shares, each of which has equal rights as to assets and voting privileges. Each class has exclusive voting rights with respect to matters that affect that class.
2. Investments in Fidelity Central Funds.
The Fund invests in Fidelity Central Funds, which are open-end investment companies generally available only to other investment companies and accounts managed by the investment adviser and its affiliates. The Fund's Schedule of Investments lists each of the Fidelity Central Funds held as of period end, if any, as an investment of the Fund, but does not include the underlying holdings of each Fidelity Central Fund. As an Investing Fund, the Fund indirectly bears its proportionate share of the expenses of the underlying Fidelity Central Funds.
The Money Market Central Funds seek preservation of capital and current income and are managed by Fidelity Investments Money Management, Inc. (FIMM), an affiliate of the investment adviser. Annualized expenses of the Money Market Central Funds as of their most recent shareholder report date are less than .005%.
A complete unaudited list of holdings for each Fidelity Central Fund is available upon request or at the Securities and Exchange Commission (the SEC) website at www.sec.gov. In addition, the financial statements of the Fidelity Central Funds, which are not covered by the Fund's Report of Independent Registered Public Accounting Firm, are available on the SEC website or upon request.
3. Significant Accounting Policies.
The Fund is an investment company and applies the accounting and reporting guidance of the Financial Accounting Standards Board (FASB) Accounting Standards Codification Topic 946 Financial Services – Investments Companies. The financial statements have been prepared in conformity with accounting principles generally accepted in the United States of America (GAAP), which require management to make certain estimates and assumptions at the date of the financial statements. Actual results could differ from those estimates. Subsequent events, if any, through the date that the financial statements were issued have been evaluated in the preparation of the financial statements. The following summarizes the significant accounting policies of the Fund:
Investment Valuation. Investments are valued as of 4:00 p.m. Eastern time on the last calendar day of the period. The Board of Trustees (the Board) has delegated the day to day responsibility for the valuation of the Fund's investments to the Fair Value Committee (the Committee) established by the Fund's investment adviser. In accordance with valuation policies and procedures approved by the Board, the Fund attempts to obtain prices from one or more third party pricing vendors or brokers to value its investments. When current market prices, quotations or currency exchange rates are not readily available or reliable, investments will be fair valued in good faith by the Committee, in accordance with procedures adopted by the Board. Factors used in determining fair value vary by investment type and may include market or investment specific events. The frequency with which these procedures are used cannot be predicted and they may be utilized to a significant extent. The Committee oversees the Fund's valuation policies and procedures and reports to the Board on the Committee's activities and fair value determinations. The Board monitors the appropriateness of the procedures used in valuing the Fund's investments and ratifies the fair value determinations of the Committee.
The Fund categorizes the inputs to valuation techniques used to value its investments into a disclosure hierarchy consisting of three levels as shown below:
- Level 1 – quoted prices in active markets for identical investments
- Level 2 – other significant observable inputs (including quoted prices for similar investments, interest rates, prepayment speeds, etc.)
- Level 3 – unobservable inputs (including the Fund's own assumptions based on the best information available)
Valuation techniques used to value the Fund's investments by major category are as follows:
Equity securities, including restricted securities, for which market quotations are readily available, are valued at the last reported sale price or official closing price as reported by a third party pricing vendor on the primary market or exchange on which they are traded and are categorized as Level 1 in the hierarchy. In the event there were no sales during the day or closing prices are not available, securities are valued at the last quoted bid price or may be valued using the last available price and are generally categorized as Level 2 in the hierarchy. For foreign equity securities, when market or security specific events arise, comparisons to the valuation of American Depositary Receipts (ADRs), futures contracts, Exchange-Traded Funds (ETFs) and certain indexes as well as quoted prices for similar securities may be used and would be categorized as Level 2 in the hierarchy. Utilizing these techniques may result in transfers between Level 1 and Level 2. For equity securities, including restricted securities, where observable inputs are limited, assumptions about market activity and risk are used and these securities may be categorized as Level 3 in the hierarchy.
Investments in open-end mutual funds, including the Fidelity Central Funds, are valued at their closing net asset value (NAV) each business day and are categorized as Level 1 in the hierarchy.
Changes in valuation techniques may result in transfers in or out of an assigned level within the disclosure hierarchy. The aggregate value of investments by input level as of October 31, 2018, including information on transfers between Levels 1 and 2, is included at the end of the Fund's Schedule of Investments.
Foreign Currency. The Fund may use foreign currency contracts to facilitate transactions in foreign-denominated securities. Gains and losses from these transactions may arise from changes in the value of the foreign currency or if the counterparties do not perform under the contracts' terms.
Foreign-denominated assets, including investment securities, and liabilities are translated into U.S. dollars at the exchange rates at period end. Purchases and sales of investment securities, income and dividends received and expenses denominated in foreign currencies are translated into U.S. dollars at the exchange rate in effect on the transaction date.
The effects of exchange rate fluctuations on investments are included with the net realized and unrealized gain (loss) on investment securities. Other foreign currency transactions resulting in realized and unrealized gain (loss) are disclosed separately.
Investment Transactions and Income. For financial reporting purposes, the Fund's investment holdings and NAV include trades executed through the end of the last business day of the period. The NAV per share for processing shareholder transactions is calculated as of the close of business of the New York Stock Exchange (NYSE), normally 4:00 p.m. Eastern time and includes trades executed through the end of the prior business day. Gains and losses on securities sold are determined on the basis of identified cost. Dividend income is recorded on the ex-dividend date, except for certain dividends from foreign securities where the ex-dividend date may have passed, which are recorded as soon as the Fund is informed of the ex-dividend date. Non-cash dividends included in dividend income, if any, are recorded at the fair market value of the securities received. Income and capital gain distributions from Fidelity Central Funds, if any, are recorded on the ex-dividend date. Investment income is recorded net of foreign taxes withheld where recovery of such taxes is uncertain.
Class Allocations and Expenses. Investment income, realized and unrealized capital gains and losses, common expenses of the Fund, and certain fund-level expense reductions, if any, are allocated daily on a pro-rata basis to each class based on the relative net assets of each class to the total net assets of the Fund. Each class differs with respect to transfer agent and distribution and service plan fees incurred. Certain expense reductions may also differ by class. For the reporting period, the allocated portion of income and expenses to each class as a percent of its average net assets may vary due to the timing of recording these transactions in relation to fluctuating net assets of the classes. Expenses directly attributable to a fund are charged to that fund. Expenses attributable to more than one fund are allocated among the respective funds on the basis of relative net assets or other appropriate methods. Expense estimates are accrued in the period to which they relate and adjustments are made when actual amounts are known.
Income Tax Information and Distributions to Shareholders. Each year, the Fund intends to qualify as a regulated investment company under Subchapter M of the Internal Revenue Code, including distributing substantially all of its taxable income and realized gains. As a result, no provision for U.S. Federal income taxes is required. As of October 31, 2018, the Fund did not have any unrecognized tax benefits in the financial statements; nor is the Fund aware of any tax positions for which it is reasonably possible that the total amounts of unrecognized tax benefits will significantly change in the next twelve months. The Fund files a U.S. federal tax return, in addition to state and local tax returns as required. The Fund's federal income tax returns are subject to examination by the Internal Revenue Service (IRS) for a period of three fiscal years after they are filed. State and local tax returns may be subject to examination for an additional fiscal year depending on the jurisdiction. Foreign taxes are provided for based on the Fund's understanding of the tax rules and rates that exist in the foreign markets in which it invests.
Distributions are declared and recorded on the ex-dividend date. Income and capital gain distributions are declared separately for each class. Income and capital gain distributions are determined in accordance with income tax regulations, which may differ from GAAP.
Capital accounts within the financial statements are adjusted for permanent book-tax differences. These adjustments have no impact on net assets or the results of operations. Capital accounts are not adjusted for temporary book-tax differences which will reverse in a subsequent period.
Book-tax differences are primarily due to foreign currency transactions, passive foreign investment companies (PFIC), deferred trustees compensation, capital loss carryforwards, expiring capital loss carryforwards and losses deferred due to wash sales.
As of period end, the cost and unrealized appreciation (depreciation) in securities, and derivatives if applicable, for federal income tax purposes were as follows:
| Gross unrealized appreciation | $69,850,154 |
| Gross unrealized depreciation | (25,836,712) |
| Net unrealized appreciation (depreciation) | $44,013,442 |
| Tax Cost | $478,473,915 |
The tax-based components of distributable earnings as of period end were as follows:
| Undistributed ordinary income | $1,785,468 |
| Capital loss carryforward | $(98,806,038) |
| Net unrealized appreciation (depreciation) on securities and other investments | $44,006,015 |
Capital loss carryforwards are only available to offset future capital gains of the Fund to the extent provided by regulations and may be limited. Under the Regulated Investment Company Modernization Act of 2010 (the Act), the Fund is permitted to carry forward capital losses incurred in taxable years beginning after December 22, 2010 for an unlimited period and such capital losses are required to be used prior to any losses that expire. The capital loss carryforward information presented below, including any applicable limitation, is estimated as of fiscal period end and is subject to adjustment.
| Fiscal year of expiration | |
| 2019 | $(98,806,038) |
The tax character of distributions paid was as follows:
| October 31, 2018 | October 31, 2017 | |
| Ordinary Income | $3,858,691 | $ 4,429,607 |
Short-Term Trading (Redemption) Fees. Shares held by investors in the Fund less than 90 days may have been subject to a redemption fee equal to 1.50% of the NAV of shares redeemed. All redemption fees, which reduce the proceeds of the shareholder redemption, are retained by the Fund and accounted for as an addition to paid in capital. In November 2017, the Board of Trustees approved the elimination of these redemption fees effective December 18, 2017.
New Rule Issuance. During August 2018, the U.S. Securities and Exchange Commission issued Final Rule Release No. 33-10532, Disclosure Update and Simplification. This Final Rule includes amendments specific to registered investment companies that are intended to eliminate overlap in disclosure requirements between Regulation S-X and GAAP. In accordance with these amendments, certain line-items in the Fund's financial statements have been combined or removed for the current period as outlined in the table below.
| Financial Statement | Current Line-Item Presentation | Prior Line-Item Presentation |
| Statement of Assets and Liabilities | Total distributable earnings (loss) | Undistributed/Distributions in excess of/Accumulated net investment income (loss) Accumulated/Undistributed net realized gain (loss) Net unrealized appreciation (depreciation) |
| Statement of Changes in Net Assets | N/A - removed | Undistributed/Distributions in excess of/Accumulated net investment income (loss) end of period |
| Statement of Changes in Net Assets | Distributions to shareholders | Distributions to shareholders from net investment income Distributions to shareholders from net realized gain |
| Distributions to Shareholders Note to Financial Statements | Distributions to shareholders | Distributions to shareholders from net investment income Distributions to shareholders from net realized gain |
4. Purchases and Sales of Investments.
Purchases and sales of securities, other than short-term securities, aggregated $243,350,886 and $168,807,111, respectively.
5. Fees and Other Transactions with Affiliates.
Management Fee. Fidelity Management & Research Company (the investment adviser) and its affiliates provide the Fund with investment management related services for which the Fund pays a monthly management fee. The management fee is the sum of an individual fund fee rate that is based on an annual rate of .45% of the Fund's average net assets and an annualized group fee rate that averaged .24% during the period. The group fee rate is based upon the average net assets of all the mutual funds advised by the investment adviser, including any mutual funds previously advised by the investment adviser that are currently advised by Fidelity SelectCo, LLC, an affiliate of the investment adviser. The group fee rate decreases as assets under management increase and increases as assets under management decrease. In addition, the management fee is subject to a performance adjustment (up to a maximum of +/- .20% of the Fund's average net assets over a 36 month performance period). The upward or downward adjustment to the management fee is based on the relative investment performance of Japan as compared to its benchmark index, the TOPIX, over the same 36 month performance period. For the reporting period, the total annual management fee rate, including the performance adjustment, was .74% of the Fund's average net assets. The performance adjustment included in the management fee rate may be higher or lower than the maximum performance adjustment rate due to the difference between the average net assets for the reporting and performance periods.
Distribution and Service Plan Fees. In accordance with Rule 12b-1 of the 1940 Act, the Fund has adopted separate Distribution and Service Plans for each class of shares. Certain classes pay Fidelity Distributors Corporation (FDC), an affiliate of the investment adviser, separate Distribution and Service Fees, each of which is based on an annual percentage of each class' average net assets. In addition, FDC may pay financial intermediaries for selling shares of the Fund and providing shareholder support services. For the period, the Distribution and Service Fee rates, total fees and amounts retained by FDC were as follows:
| Distribution Fee | Service Fee | Total Fees | Retained by FDC | |
| Class A | -% | .25% | $41,998 | $316 |
| Class M | .25% | .25% | 22,866 | 283 |
| Class C | .75% | .25% | 149,255 | 20,737 |
| $214,119 | $21,336 |
Sales Load. FDC may receive a front-end sales charge of up to 5.75% for selling Class A shares and 3.50% for selling Class M shares, some of which is paid to financial intermediaries for selling shares of the Fund. Depending on the holding period, FDC may receive contingent deferred sales charges levied on Class A, Class M and Class C redemptions. The deferred sales charges are 1.00% for Class C shares, 1.00% for certain purchases of Class A shares and .25% for certain purchases of Class M shares.
For the period, sales charge amounts retained by FDC were as follows:
| Retained by FDC | |
| Class A | $6,064 |
| Class M | 769 |
| Class C(a) | 8,168 |
| $15,001 |
(a) When Class C shares are initially sold, FDC pays commissions from its own resources to financial intermediaries through which the sales are made.
Transfer Agent Fees. Fidelity Investments Institutional Operations Company, Inc., (FIIOC), an affiliate of the investment adviser, is the transfer, dividend disbursing and shareholder servicing agent for each class of the Fund. FIIOC receives account fees and asset-based fees that vary according to the account size and type of account of the shareholders of the respective classes of the Fund, except for Class Z. FIIOC receives an asset-based fee of Class Z's average net assets. FIIOC pays for typesetting, printing and mailing of shareholder reports, except proxy statements.
For the period, transfer agent fees for each class were as follows:
| Amount | % of Class-Level Average Net Assets | |
| Class A | $40,307 | .24 |
| Class M | 15,160 | .33 |
| Class C | 28,897 | .19 |
| Japan | 383,893 | .21 |
| Class I | 266,202 | .14 |
| Class Z | 3 | .04(a) |
| $734,462 |
(a) Annualized
Accounting and Security Lending Fees. Fidelity Service Company, Inc. (FSC), an affiliate of the investment adviser, maintains the Fund's accounting records. The accounting fee is based on the level of average net assets for each month. Under a separate contract, FSC administers the security lending program. The security lending fee is based on the number and duration of lending transactions. For the period, the fees were equivalent to an annual rate of .05%.
Brokerage Commissions. The Fund placed a portion of its portfolio transactions with brokerage firms which are affiliates of the investment adviser. Brokerage commissions are included in net realized gain (loss) and change in net unrealized appreciation (depreciation) in the Statement of Operations. The commissions paid to these affiliated firms were $139 for the period.
Interfund Trades. The Fund may purchase from or sell securities to other Fidelity Funds under procedures adopted by the Board. The procedures have been designed to ensure these interfund trades are executed in accordance with Rule 17a-7 of the 1940 Act. Interfund trades are included within the respective purchases and sales amounts shown in the Purchases and Sales of Investments note.
6. Committed Line of Credit.
The Fund participates with other funds managed by the investment adviser or an affiliate in a $4.25 billion credit facility (the "line of credit") to be utilized for temporary or emergency purposes to fund shareholder redemptions or for other short-term liquidity purposes. The Fund has agreed to pay commitment fees on its pro-rata portion of the line of credit, which amounted to $1,138 and is reflected in Miscellaneous expenses on the Statement of Operations. During the period, the Fund did not borrow on this line of credit.
7. Security Lending.
The Fund lends portfolio securities through a lending agent from time to time in order to earn additional income. For equity securities, a lending agent is used and may loan securities to certain qualified borrowers, including Fidelity Capital Markets (FCM), a broker-dealer affiliated with the Fund. On the settlement date of the loan, the Fund receives collateral (in the form of U.S. Treasury obligations, letters of credit and/or cash) against the loaned securities and maintains collateral in an amount not less than 100% of the market value of the loaned securities during the period of the loan. The market value of the loaned securities is determined at the close of business of the Fund and any additional required collateral is delivered to the Fund on the next business day. The Fund or borrower may terminate the loan at any time, and if the borrower defaults on its obligation to return the securities loaned because of insolvency or other reasons, the Fund may apply collateral received from the borrower against the obligation. The Fund may experience delays and costs in recovering the securities loaned. Any cash collateral received is invested in the Fidelity Securities Lending Cash Central Fund. The value of loaned securities and cash collateral at period end are disclosed on the Fund's Statement of Assets and Liabilities. Security lending income represents the income earned on investing cash collateral, less rebates paid to borrowers and any lending agent fees associated with the loan, plus any premium payments received for lending certain types of securities. Security lending income is presented in the Statement of Operations as a component of income from Fidelity Central Funds. Total security lending income during the period amounted to $112,917. During the period, there were no securities loaned to FCM.
8. Expense Reductions.
Commissions paid to certain brokers with whom the investment adviser, or its affiliates, places trades on behalf of the Fund include an amount in addition to trade execution, which may be rebated back to the Fund to offset certain expenses. This amount totaled $36,374 for the period. In addition, through arrangements with the Fund's custodian, credits realized as a result of certain uninvested cash balances were used to reduce the Fund's expenses. During the period, these credits reduced the Fund's custody expenses by $50.
In addition, during the period the investment adviser reimbursed and/or waived a portion of fund-level operating expenses in the amount of $4,036.
9. Distributions to Shareholders.
Distributions to shareholders of each class were as follows:
| Year ended October 31, 2018 | Year ended October 31, 2017 | |
| Distributions to shareholders | ||
| Class A | $121,236 | $– |
| Class M | 24,538 | – |
| Class C | 35,656 | – |
| Japan | 1,679,410 | – |
| Class I | 1,997,851 | – |
| Total | $3,858,691 | $– |
| From net investment income | ||
| Class A | $– | $104,209 |
| Class M | – | 3,257 |
| Japan | – | 3,209,793 |
| Class I | – | 51,808 |
| Total | $– | $3,369,067 |
| From net realized gain | ||
| Class A | $– | $59,052 |
| Class M | – | 11,074 |
| Japan | – | 974,401 |
| Class I | – | 16,013 |
| Total | $– | $1,060,540 |
10. Share Transactions.
Share transactions for each class were as follows and may contain automatic conversions between classes or exchanges between affiliated funds:
| Shares | Shares | Dollars | Dollars | |
| Year ended October 31, 2018(a) | Year ended October 31, 2017 | Year ended October 31, 2018(a) | Year ended October 31, 2017 | |
| Class A | ||||
| Shares sold | 227,462 | 261,996 | $3,578,036 | $3,537,670 |
| Reinvestment of distributions | 7,603 | 12,680 | 116,628 | 155,198 |
| Shares redeemed | (275,394) | (1,102,972) | (4,276,195) | (14,608,137) |
| Net increase (decrease) | (40,329) | (828,296) | $(581,531) | $(10,915,269) |
| Class M | ||||
| Shares sold | 26,530 | 34,522 | $416,546 | $446,496 |
| Reinvestment of distributions | 1,589 | 1,137 | 24,389 | 13,940 |
| Shares redeemed | (41,543) | (72,947) | (648,170) | (961,323) |
| Net increase (decrease) | (13,424) | (37,288) | $(207,235) | $(500,887) |
| Class C | ||||
| Shares sold | 247,078 | 75,525 | $3,881,516 | $955,948 |
| Reinvestment of distributions | 2,227 | – | 33,918 | – |
| Shares redeemed | (255,967) | (379,339) | (3,954,581) | (4,904,728) |
| Net increase (decrease) | (6,662) | (303,814) | $(39,147) | $(3,948,780) |
| Japan | ||||
| Shares sold | 13,428,936 | 5,531,120 | $195,751,878 | $70,265,364 |
| Reinvestment of distributions | 102,752 | 332,957 | 1,578,266 | 4,075,396 |
| Shares redeemed | (8,929,520) | (17,427,207) | (137,886,513) | (225,423,617) |
| Net increase (decrease) | 4,602,168 | (11,563,130) | $59,443,631 | $(151,082,857) |
| Class I | ||||
| Shares sold | 2,319,602 | 12,120,647 | $34,952,986 | $156,870,865 |
| Reinvestment of distributions | 129,754 | 4,957 | 1,987,832 | 60,627 |
| Shares redeemed | (501,872) | (1,052,603) | (7,627,507) | (13,914,364) |
| Net increase (decrease) | 1,947,484 | 11,073,001 | $29,313,311 | $143,017,128 |
| Class Z | ||||
| Shares sold | 6,341 | – | $100,000 | $– |
| Net increase (decrease) | 6,341 | – | $100,000 | $– |
(a) Share transactions for Class Z are for the period October 2, 2018 (commencement of sale of shares) to October 31, 2018.
11. Other.
The Fund's organizational documents provide former and current trustees and officers with a limited indemnification against liabilities arising in connection with the performance of their duties to the Fund. In the normal course of business, the Fund may also enter into contracts that provide general indemnifications. The Fund's maximum exposure under these arrangements is unknown as this would be dependent on future claims that may be made against the Fund. The risk of material loss from such claims is considered remote.
At the end of the period, Strategic Advisers International Fund, VIP FundsManager 50% Portfolio and VIP FundsManager 60% Portfolio were the owners of record of approximately 26%, 11% and 11%, respectively, of the total outstanding shares of the Fund. Mutual funds managed by the investment adviser or its affiliates were the owners of record, in the aggregate, of approximately 62% of the total outstanding shares of the Fund.
Fidelity® Japan Smaller Companies Fund
Performance: The Bottom Line
Average annual total return reflects the change in the value of an investment, assuming reinvestment of distributions from dividend income and capital gains (the profits earned upon the sale of securities that have grown in value, if any) and assuming a constant rate of performance each year. The hypothetical investment and the average annual total returns do not reflect the deduction of taxes that a shareholder would pay on fund distributions or the redemption of fund shares. During periods of reimbursement by Fidelity, a fund’s total return will be greater than it would be had the reimbursement not occurred. How a fund did yesterday is no guarantee of how it will do tomorrow.
Average Annual Total Returns
| For the periods ended October 31, 2018 | Past 1 year | Past 5 years | Past 10 years |
| Fidelity® Japan Smaller Companies Fund | (4.71)% | 7.10% | 11.69% |
$10,000 Over 10 Years
Let's say hypothetically that $10,000 was invested in Fidelity® Japan Smaller Companies Fund on October 31, 2008.
The chart shows how the value of your investment would have changed, and also shows how the Russell/Nomura Mid-Small Cap™ Index performed over the same period.
| Period Ending Values | ||
| $30,220 | Fidelity® Japan Smaller Companies Fund | |
| $23,930 | Russell/Nomura Mid-Small Cap™ Index | |
Fidelity® Japan Smaller Companies Fund
Management's Discussion of Fund Performance
Market Recap: International equities returned -8.08% for the 12 months ending October 31, 2018, according to the MSCI ACWI (All Country World Index) ex USA Index. A modestly positive first half of the period gave way to a confluence of overwhelmingly negative factors – including escalating trade tensions, a surging U.S. dollar, tepid economic growth in Europe, global central bank tightening, concerns about Italy’s budget stalemate with the EU, and weakness in China’s stock market. The index lost 8% in October alone, its largest monthly drop in more than six years. Among sectors, communications services (-15%) was hit the hardest, while economically sensitive consumer discretionary (-13%), information technology (-12%), financials (-10%), industrials (-9%) and materials (-7%) stocks also fared poorly. Even the more defensive real estate (-9%), utilities (-6%) and consumer staples (-5%) sectors weren’t spared this period. Conversely, elevated crude-oil prices fueled a positive return for energy (+7%), the top-performing sector, followed by the relatively stable-growing health care segment (+2%). Regionally, emerging markets (-12%) fared the worst, hampered by the impact of foreign exchange and concerns about economic weakness in China, India and South Korea. Sluggish growth also pressured shares in continental Europe (-9%). Stocks in Japan (-3%) and the U.K. (-4%) held up better, followed by Canada (-5%) and Asia-Pacific ex Japan (-6%).Comments from Portfolio Manager David Jenkins: For the fiscal year, the fund returned -4.71%, significantly ahead of the -5.31% result of the Russell/Nomura Mid-Small CapSM Index. By sector, stock picks within industrials helped relative performance the most, followed by choices among consumer discretionary companies. An overweighting in Yamada Consulting Group added the most value among industrials positions. In the consumer discretionary sector, workwear retailer Workman contributed more than any other individual stock held in the fund, followed by Koshidaka Holdings, owner of a karaoke chain, and the Curves fitness clubs chain. As One, Japan's largest wholesaler of research and laboratory equipment, was another top contributor. The fund's holdings Broadleaf, provider of software to auto body shops, also performed well. In contrast, semiconductor equipment maker Renesas Electronics hurt the fund's return, as did Sakata Inx, a holding that was eliminated from the portfolio in early 2018. Elsewhere, the fund's stake in confectionaries maker Morinaga disappointed. Not owning Aeon and Fast Retailing cost the fund some ground as well. Lastly, a fair-value adjustment of -0.57 percentage points didn't go the fund's way. Fair-value pricing is an adjustment process that attempts to best represent the value of the fund's securities as of the close of trading in U.S. markets, accounting for any major changes occurring after the close of foreign markets.The views expressed above reflect those of the portfolio manager(s) only through the end of the period as stated on the cover of this report and do not necessarily represent the views of Fidelity or any other person in the Fidelity organization. Any such views are subject to change at any time based upon market or other conditions and Fidelity disclaims any responsibility to update such views. These views may not be relied on as investment advice and, because investment decisions for a Fidelity fund are based on numerous factors, may not be relied on as an indication of trading intent on behalf of any Fidelity fund.
Fidelity® Japan Smaller Companies Fund
Investment Summary (Unaudited)
Geographic Diversification (% of fund's net assets)
| As of October 31, 2018 | ||
| Japan | 95.2% | |
| United States of America* | 4.8% | |

* Includes Short-Term investments and Net Other Assets (Liabilities).
Percentages are based on country or territory of incorporation and are adjusted for the effect of futures contracts, if applicable.
Asset Allocation as of October 31, 2018
| % of fund's net assets | |
| Stocks and Equity Futures | 95.2 |
| Short-Term Investments and Net Other Assets (Liabilities) | 4.8 |
Top Ten Stocks as of October 31, 2018
| % of fund's net assets | |
| Yamada Consulting Group Co. Ltd. (Professional Services) | 2.4 |
| A/S One Corp. (Health Care Providers & Services) | 2.0 |
| T&D Holdings, Inc. (Insurance) | 1.9 |
| Mitsubishi Heavy Industries Ltd. (Machinery) | 1.8 |
| Mitsubishi Chemical Holdings Corp. (Chemicals) | 1.7 |
| ORIX Corp. (Diversified Financial Services) | 1.7 |
| Central Automotive Products Ltd. (Distributors) | 1.7 |
| Amano Corp. (Electronic Equipment & Components) | 1.7 |
| Sumitomo Electric Industries Ltd. (Auto Components) | 1.7 |
| S Foods, Inc. (Food Products) | 1.6 |
| 18.2 |
Top Market Sectors as of October 31, 2018
| % of fund's net assets | |
| Industrials | 27.1 |
| Consumer Discretionary | 16.9 |
| Information Technology | 11.0 |
| Financials | 9.2 |
| Materials | 8.5 |
| Consumer Staples | 7.2 |
| Health Care | 4.4 |
| Communication Services | 3.6 |
| Utilities | 2.7 |
| Real Estate | 1.3 |
Fidelity® Japan Smaller Companies Fund
Schedule of Investments October 31, 2018
Showing Percentage of Net Assets
| Common Stocks - 93.1% | |||
| Shares | Value | ||
| COMMUNICATION SERVICES - 3.6% | |||
| Entertainment - 2.1% | |||
| Daiichikosho Co. Ltd. | 197,900 | $9,120,220 | |
| DeNA Co. Ltd. | 357,300 | 5,943,265 | |
| 15,063,485 | |||
| Media - 1.5% | |||
| Hakuhodo DY Holdings, Inc. | 650,000 | 10,864,537 | |
| TOTAL COMMUNICATION SERVICES | 25,928,022 | ||
| CONSUMER DISCRETIONARY - 16.9% | |||
| Auto Components - 3.1% | |||
| Bridgestone Corp. | 264,900 | 10,214,358 | |
| Sumitomo Electric Industries Ltd. | 869,500 | 11,857,885 | |
| 22,072,243 | |||
| Automobiles - 1.9% | |||
| Isuzu Motors Ltd. | 761,000 | 9,977,128 | |
| Subaru Corp. | 146,000 | 3,938,306 | |
| 13,915,434 | |||
| Distributors - 3.2% | |||
| Central Automotive Products Ltd. | 885,000 | 12,039,482 | |
| Chori Co. Ltd. | 196,100 | 3,241,251 | |
| PALTAC Corp. | 149,000 | 7,606,151 | |
| 22,886,884 | |||
| Hotels, Restaurants & Leisure - 1.6% | |||
| Koshidaka Holdings Co. Ltd. | 972,000 | 11,310,639 | |
| Household Durables - 0.9% | |||
| Panasonic Corp. | 570,000 | 6,116,930 | |
| Internet & Direct Marketing Retail - 0.8% | |||
| Aucnet, Inc. (a) | 575,000 | 6,028,493 | |
| Specialty Retail - 4.2% | |||
| Arc Land Sakamoto Co. Ltd. | 466,700 | 6,142,150 | |
| Fuji Corp. | 340,600 | 6,248,434 | |
| Nitori Holdings Co. Ltd. | 68,600 | 8,958,399 | |
| VT Holdings Co. Ltd. | 210,600 | 877,228 | |
| Workman Co. Ltd. (a) | 124,000 | 7,846,502 | |
| 30,072,713 | |||
| Textiles, Apparel & Luxury Goods - 1.2% | |||
| Hagihara Industries, Inc. | 565,600 | 8,386,128 | |
| TOTAL CONSUMER DISCRETIONARY | 120,789,464 | ||
| CONSUMER STAPLES - 7.2% | |||
| Food & Staples Retailing - 2.2% | |||
| Kirindo Holdings Co. Ltd. | 301,100 | 4,213,559 | |
| Mitsubishi Shokuhin Co. Ltd. | 142,300 | 3,666,115 | |
| San-A Co. Ltd. | 184,000 | 7,770,284 | |
| 15,649,958 | |||
| Food Products - 5.0% | |||
| Japan Meat Co. Ltd. | 347,400 | 6,296,211 | |
| Kotobuki Spirits Co. Ltd. | 235,000 | 8,997,208 | |
| Morinaga & Co. Ltd. | 209,700 | 8,428,143 | |
| S Foods, Inc. | 292,700 | 11,815,913 | |
| 35,537,475 | |||
| TOTAL CONSUMER STAPLES | 51,187,433 | ||
| ENERGY - 1.2% | |||
| Oil, Gas & Consumable Fuels - 1.2% | |||
| San-Ai Oil Co. Ltd. | 820,800 | 8,867,419 | |
| FINANCIALS - 9.2% | |||
| Banks - 2.4% | |||
| Mitsubishi UFJ Financial Group, Inc. | 1,374,600 | 8,319,757 | |
| Shinsei Bank Ltd. | 603,300 | 9,190,067 | |
| 17,509,824 | |||
| Consumer Finance - 0.8% | |||
| AEON Financial Service Co. Ltd. | 291,600 | 5,726,819 | |
| Diversified Financial Services - 2.9% | |||
| Fuyo General Lease Co. Ltd. | 145,300 | 8,074,011 | |
| ORIX Corp. | 756,800 | 12,347,842 | |
| 20,421,853 | |||
| Insurance - 3.1% | |||
| T&D Holdings, Inc. | 848,000 | 13,555,886 | |
| Tokio Marine Holdings, Inc. | 184,500 | 8,692,190 | |
| 22,248,076 | |||
| TOTAL FINANCIALS | 65,906,572 | ||
| HEALTH CARE - 4.4% | |||
| Health Care Equipment & Supplies - 1.9% | |||
| Medikit Co. Ltd. | 141,100 | 7,628,041 | |
| Paramount Bed Holdings Co. Ltd. | 138,900 | 5,853,410 | |
| 13,481,451 | |||
| Health Care Providers & Services - 2.0% | |||
| A/S One Corp. | 201,000 | 14,286,525 | |
| Pharmaceuticals - 0.5% | |||
| Astellas Pharma, Inc. | 223,500 | 3,453,121 | |
| TOTAL HEALTH CARE | 31,221,097 | ||
| INDUSTRIALS - 27.1% | |||
| Air Freight & Logistics - 0.7% | |||
| AIT Corp. | 573,220 | 5,384,971 | |
| Airlines - 1.5% | |||
| Japan Airlines Co. Ltd. | 309,600 | 11,021,963 | |
| Building Products - 2.5% | |||
| Sekisui Jushi Corp. | 581,300 | 10,545,674 | |
| Sinko Industries Ltd. | 492,200 | 7,023,016 | |
| 17,568,690 | |||
| Commercial Services & Supplies - 3.6% | |||
| Aeon Delight Co. Ltd. | 334,300 | 11,199,131 | |
| ProNexus, Inc. | 594,900 | 5,783,713 | |
| Secom Joshinetsu Co. Ltd. | 290,000 | 8,687,021 | |
| 25,669,865 | |||
| Construction & Engineering - 1.8% | |||
| Hokuriku Electrical Construction Co. Ltd. | 859,300 | 7,729,778 | |
| Toshiba Plant Systems & Services Corp. | 244,500 | 5,001,161 | |
| 12,730,939 | |||
| Electrical Equipment - 1.8% | |||
| Aichi Electric Co. Ltd. | 190,000 | 5,346,302 | |
| Denyo Co. Ltd. | 522,600 | 7,882,884 | |
| 13,229,186 | |||
| Machinery - 2.9% | |||
| Mitsubishi Heavy Industries Ltd. | 356,700 | 12,574,296 | |
| NGK Insulators Ltd. | 565,000 | 7,951,849 | |
| 20,526,145 | |||
| Marine - 0.9% | |||
| Nippon Concept Corp. | 617,300 | 6,182,027 | |
| Professional Services - 3.5% | |||
| Funai Soken Holdings, Inc. | 376,480 | 7,984,372 | |
| Yamada Consulting Group Co. Ltd. | 737,700 | 17,004,981 | |
| 24,989,353 | |||
| Trading Companies & Distributors - 6.5% | |||
| Inaba Denki Sangyo Co. Ltd. | 268,800 | 10,827,279 | |
| Itochu Corp. | 505,000 | 9,365,714 | |
| Mitani Shoji Co. Ltd. | 143,100 | 6,823,043 | |
| Trusco Nakayama Corp. | 387,500 | 9,770,351 | |
| Yuasa Trading Co. Ltd. | 305,800 | 10,041,113 | |
| 46,827,500 | |||
| Transportation Infrastructure - 1.4% | |||
| Kamigumi Co. Ltd. | 487,000 | 10,073,630 | |
| TOTAL INDUSTRIALS | 194,204,269 | ||
| INFORMATION TECHNOLOGY - 11.0% | |||
| Electronic Equipment & Components - 3.7% | |||
| Amano Corp. | 559,200 | 11,894,182 | |
| Dexerials Corp. | 836,500 | 7,198,489 | |
| Hitachi High-Technologies Corp. | 200,000 | 7,541,986 | |
| 26,634,657 | |||
| IT Services - 4.0% | |||
| Fujitsu Ltd. | 157,000 | 9,551,629 | |
| Otsuka Corp. | 295,000 | 9,804,139 | |
| TKC Corp. | 238,200 | 9,077,503 | |
| 28,433,271 | |||
| Semiconductors & Semiconductor Equipment - 0.8% | |||
| Renesas Electronics Corp. (b) | 1,130,000 | 5,988,745 | |
| Software - 1.3% | |||
| Broadleaf Co. Ltd. | 592,200 | 3,421,938 | |
| Oracle Corp. Japan | 85,200 | 5,783,950 | |
| 9,205,888 | |||
| Technology Hardware, Storage & Peripherals - 1.2% | |||
| Elecom Co. Ltd. | 348,500 | 8,271,219 | |
| TOTAL INFORMATION TECHNOLOGY | 78,533,780 | ||
| MATERIALS - 8.5% | |||
| Chemicals - 5.5% | |||
| C. Uyemura & Co. Ltd. | 131,400 | 8,396,278 | |
| Lintec Corp. | 408,000 | 9,661,683 | |
| Mitsubishi Chemical Holdings Corp. | 1,604,800 | 12,510,051 | |
| SK Kaken Co. Ltd. | 20,600 | 8,735,853 | |
| 39,303,865 | |||
| Construction Materials - 1.4% | |||
| Taiheiyo Cement Corp. | 328,500 | 9,666,667 | |
| Metals & Mining - 1.6% | |||
| JFE Holdings, Inc. | 617,000 | 11,594,403 | |
| TOTAL MATERIALS | 60,564,935 | ||
| REAL ESTATE - 1.3% | |||
| Real Estate Management & Development - 1.3% | |||
| Century21 Real Estate Japan Ltd. | 378,100 | 4,131,673 | |
| Daito Trust Construction Co. Ltd. | 40,400 | 5,334,870 | |
| 9,466,543 | |||
| UTILITIES - 2.7% | |||
| Electric Utilities - 1.1% | |||
| The Okinawa Electric Power Co., Inc. | 445,740 | 8,323,430 | |
| Gas Utilities - 1.6% | |||
| Tokyo Gas Co. Ltd. | 457,200 | 11,243,875 | |
| TOTAL UTILITIES | 19,567,305 | ||
| TOTAL COMMON STOCKS | |||
| (Cost $523,993,743) | 666,236,839 | ||
| Money Market Funds - 6.6% | |||
| Fidelity Cash Central Fund, 2.23% (c) | 42,736,846 | 42,745,394 | |
| Fidelity Securities Lending Cash Central Fund 2.23% (c)(d) | 4,552,971 | 4,553,426 | |
| TOTAL MONEY MARKET FUNDS | |||
| (Cost $47,298,808) | 47,298,820 | ||
| TOTAL INVESTMENT IN SECURITIES - 99.7% | |||
| (Cost $571,292,551) | 713,535,659 | ||
| NET OTHER ASSETS (LIABILITIES) - 0.3% | 1,866,446 | ||
| NET ASSETS - 100% | $715,402,105 |
| Futures Contracts | |||||
| Number of contracts | Expiration Date | Notional Amount | Value | Unrealized Appreciation/(Depreciation) | |
| Purchased | |||||
| Equity Index Contracts | |||||
| TSE TOPIX Index Contracts (Japan) | 101 | Dec. 2018 | $14,688,793 | $93,523 | $93,523 |
The notional amount of futures purchased as a percentage of Net Assets is 2.1%
Legend
(a) Security or a portion of the security is on loan at period end.
(b) Non-income producing
(c) Affiliated fund that is generally available only to investment companies and other accounts managed by Fidelity Investments. The rate quoted is the annualized seven-day yield of the fund at period end. A complete unaudited listing of the fund's holdings as of its most recent quarter end is available upon request. In addition, each Fidelity Central Fund's financial statements, which are not covered by the Fund's Report of Independent Registered Public Accounting Firm, are available on the SEC's website or upon request.
(d) Investment made with cash collateral received from securities on loan.
Affiliated Central Funds
Information regarding fiscal year to date income earned by the Fund from investments in Fidelity Central Funds is as follows:
| Fund | Income earned |
| Fidelity Cash Central Fund | $591,822 |
| Fidelity Securities Lending Cash Central Fund | 66,759 |
| Total | $658,581 |
Amounts in the income column in the above table include any capital gain distributions from underlying funds, which are presented in the corresponding line-item in the Statement of Operations if applicable.
Investment Valuation
The following is a summary of the inputs used, as of October 31, 2018, involving the Fund's assets and liabilities carried at fair value. The inputs or methodology used for valuing securities may not be an indication of the risk associated with investing in those securities. For more information on valuation inputs, and their aggregation into the levels used below, please refer to the Investment Valuation section in the accompanying Notes to Financial Statements.
| Valuation Inputs at Reporting Date: | ||||
| Description | Total | Level 1 | Level 2 | Level 3 |
| Investments in Securities: | ||||
| Equities: | ||||
| Communication Services | $25,928,022 | $19,984,757 | $5,943,265 | $-- |
| Consumer Discretionary | 120,789,464 | 78,684,857 | 42,104,607 | -- |
| Consumer Staples | 51,187,433 | 51,187,433 | -- | -- |
| Energy | 8,867,419 | 8,867,419 | -- | -- |
| Financials | 65,906,572 | 26,148,672 | 39,757,900 | -- |
| Health Care | 31,221,097 | 27,767,976 | 3,453,121 | -- |
| Industrials | 194,204,269 | 164,312,410 | 29,891,859 | -- |
| Information Technology | 78,533,780 | 68,982,151 | 9,551,629 | -- |
| Materials | 60,564,935 | 26,793,814 | 33,771,121 | -- |
| Real Estate | 9,466,543 | 9,466,543 | -- | -- |
| Utilities | 19,567,305 | 8,323,430 | 11,243,875 | -- |
| Money Market Funds | 47,298,820 | 47,298,820 | -- | -- |
| Total Investments in Securities: | $713,535,659 | $537,818,282 | $175,717,377 | $-- |
| Derivative Instruments: | ||||
| Assets | ||||
| Futures Contracts | $93,523 | $93,523 | $-- | $-- |
| Total Assets | $93,523 | $93,523 | $-- | $-- |
| Total Derivative Instruments: | $93,523 | $93,523 | $-- | $-- |
The following is a summary of transfers between Level 1 and Level 2 for the period ended October 31, 2018. Transfers are assumed to have occurred at the beginning of the period, and are primarily attributable to the valuation techniques used for foreign equity securities, as discussed in the accompanying Notes to Financial Statements:
| Transfers | Total |
| Level 1 to Level 2 | $0 |
| Level 2 to Level 1 | $501,543,754 |
Value of Derivative Instruments
The following table is a summary of the Fund's value of derivative instruments by primary risk exposure as of October 31, 2018. For additional information on derivative instruments, please refer to the Derivative Instruments section in the accompanying Notes to Financial Statements.
| Primary Risk Exposure / Derivative Type | Value | |
| Asset | Liability | |
| Equity Risk | ||
| Futures Contracts | $93,523 | $0 |
| Total Equity Risk | 93,523 | 0 |
| Total Value of Derivatives | $93,523 | $0 |
See accompanying notes which are an integral part of the financial statements.
Fidelity® Japan Smaller Companies Fund
Financial Statements
Statement of Assets and Liabilities
| October 31, 2018 | ||
| Assets | ||
| Investment in securities, at value (including securities loaned of $4,335,332) — See accompanying schedule: Unaffiliated issuers (cost $523,993,743) | $666,236,839 | |
| Fidelity Central Funds (cost $47,298,808) | 47,298,820 | |
| Total Investment in Securities (cost $571,292,551) | $713,535,659 | |
| Segregated cash with brokers for derivative instruments | 550,787 | |
| Foreign currency held at value (cost $65,366) | 65,366 | |
| Receivable for investments sold | 768,399 | |
| Receivable for fund shares sold | 50,626 | |
| Dividends receivable | 5,583,568 | |
| Distributions receivable from Fidelity Central Funds | 102,106 | |
| Receivable for daily variation margin on futures contracts | 277,485 | |
| Prepaid expenses | 1,605 | |
| Other receivables | 10,906 | |
| Total assets | 720,946,507 | |
| Liabilities | ||
| Payable for investments purchased | $103,597 | |
| Payable for fund shares redeemed | 238,737 | |
| Accrued management fee | 423,726 | |
| Other affiliated payables | 140,351 | |
| Other payables and accrued expenses | 84,601 | |
| Collateral on securities loaned | 4,553,390 | |
| Total liabilities | 5,544,402 | |
| Net Assets | $715,402,105 | |
| Net Assets consist of: | ||
| Paid in capital | $560,311,491 | |
| Total distributable earnings (loss) | 155,090,614 | |
| Net Assets, for 41,777,669 shares outstanding | $715,402,105 | |
| Net Asset Value, offering price and redemption price per share ($715,402,105 ÷ 41,777,669 shares) | $17.12 |
See accompanying notes which are an integral part of the financial statements.
Statement of Operations
| Year ended October 31, 2018 | ||
| Investment Income | ||
| Dividends | $16,016,127 | |
| Income from Fidelity Central Funds | 658,581 | |
| Income before foreign taxes withheld | 16,674,708 | |
| Less foreign taxes withheld | (1,601,613) | |
| Total income | 15,073,095 | |
| Expenses | ||
| Management fee | $5,543,535 | |
| Transfer agent fees | 1,386,737 | |
| Accounting and security lending fees | 385,659 | |
| Custodian fees and expenses | 80,930 | |
| Independent trustees' fees and expenses | 3,979 | |
| Registration fees | 36,403 | |
| Audit | 65,515 | |
| Legal | 1,757 | |
| Miscellaneous | 5,276 | |
| Total expenses before reductions | 7,509,791 | |
| Expense reductions | (38,584) | |
| Total expenses after reductions | 7,471,207 | |
| Net investment income (loss) | 7,601,888 | |
| Realized and Unrealized Gain (Loss) | ||
| Net realized gain (loss) on: | ||
| Investment securities: | ||
| Unaffiliated issuers | 32,825,516 | |
| Fidelity Central Funds | 255 | |
| Foreign currency transactions | (191,189) | |
| Futures contracts | 1,460 | |
| Total net realized gain (loss) | 32,636,042 | |
| Change in net unrealized appreciation (depreciation) on: | ||
| Investment securities: | ||
| Unaffiliated issuers | (81,149,606) | |
| Fidelity Central Funds | (245) | |
| Assets and liabilities in foreign currencies | 56,757 | |
| Futures contracts | 93,523 | |
| Total change in net unrealized appreciation (depreciation) | (80,999,571) | |
| Net gain (loss) | (48,363,529) | |
| Net increase (decrease) in net assets resulting from operations | $(40,761,641) |
See accompanying notes which are an integral part of the financial statements.
Statement of Changes in Net Assets
| Year ended October 31, 2018 | Year ended October 31, 2017 | |
| Increase (Decrease) in Net Assets | ||
| Operations | ||
| Net investment income (loss) | $7,601,888 | $6,596,533 |
| Net realized gain (loss) | 32,636,042 | 21,029,986 |
| Change in net unrealized appreciation (depreciation) | (80,999,571) | 112,645,801 |
| Net increase (decrease) in net assets resulting from operations | (40,761,641) | 140,272,320 |
| Distributions to shareholders | (35,635,448) | – |
| Distributions to shareholders from net investment income | – | (6,334,246) |
| Distributions to shareholders from net realized gain | – | (9,182,783) |
| Total distributions | (35,635,448) | (15,517,029) |
| Share transactions | ||
| Proceeds from sales of shares | 220,739,615 | 109,404,114 |
| Reinvestment of distributions | 32,808,433 | 14,528,831 |
| Cost of shares redeemed | (225,809,121) | (71,725,248) |
| Net increase (decrease) in net assets resulting from share transactions | 27,738,927 | 52,207,697 |
| Redemption fees | 8,581 | 54,565 |
| Total increase (decrease) in net assets | (48,649,581) | 177,017,553 |
| Net Assets | ||
| Beginning of period | 764,051,686 | 587,034,133 |
| End of period | $715,402,105 | $764,051,686 |
| Other Information | ||
| Undistributed net investment income end of period | $6,398,905 | |
| Shares | ||
| Sold | 11,538,209 | 6,520,288 |
| Issued in reinvestment of distributions | 1,763,894 | 984,338 |
| Redeemed | (12,068,741) | (4,442,602) |
| Net increase (decrease) | 1,233,362 | 3,062,024 |
See accompanying notes which are an integral part of the financial statements.
Financial Highlights
Fidelity Japan Smaller Companies Fund
| Years ended October 31, | 2018 | 2017 | 2016 | 2015 | 2014 |
| Selected Per–Share Data | |||||
| Net asset value, beginning of period | $18.84 | $15.66 | $13.76 | $13.10 | $13.86 |
| Income from Investment Operations | |||||
| Net investment income (loss)A | .18 | .17 | .17 | .10 | .09 |
| Net realized and unrealized gain (loss) | (1.00) | 3.42 | 1.93 | .78 | (.53) |
| Total from investment operations | (.82) | 3.59 | 2.10 | .88 | (.44) |
| Distributions from net investment income | (.16) | (.17) | (.09) | (.03) | (.02) |
| Distributions from net realized gain | (.74) | (.25) | (.11) | (.19) | (.31) |
| Total distributions | (.90) | (.41)B | (.20) | (.22) | (.33) |
| Redemption fees added to paid in capitalA | –C | –C | –C | –C | .01 |
| Net asset value, end of period | $17.12 | $18.84 | $15.66 | $13.76 | $13.10 |
| Total ReturnD | (4.71)% | 23.68% | 15.44% | 6.93% | (3.16)% |
| Ratios to Average Net AssetsE,F | |||||
| Expenses before reductions | .94% | .95% | .96% | .98% | 1.00% |
| Expenses net of fee waivers, if any | .93% | .95% | .96% | .98% | 1.00% |
| Expenses net of all reductions | .93% | .94% | .96% | .97% | 1.00% |
| Net investment income (loss) | .95% | 1.04% | 1.18% | .77% | .70% |
| Supplemental Data | |||||
| Net assets, end of period (000 omitted) | $715,402 | $764,052 | $587,034 | $502,842 | $416,052 |
| Portfolio turnover rateG | 17% | 20% | 30% | 41% | 112% |
A Calculated based on average shares outstanding during the period.
B Total distributions of $.41 per share is comprised of distributions from net investment income of $.169 and distributions from net realized gain of $.245 per share.
C Amount represents less than $.005 per share.
D Total returns would have been lower if certain expenses had not been reduced during the applicable periods shown.
E Fees and expenses of any underlying Fidelity Central Funds are not included in the Fund's expense ratio. The Fund indirectly bears its proportionate share of the expenses of any underlying Fidelity Central Funds.
F Expense ratios reflect operating expenses of the Fund. Expenses before reductions do not reflect amounts reimbursed by the investment adviser or reductions from brokerage service arrangements or reductions from other expense offset arrangements and do not represent the amount paid by the Fund during periods when reimbursements or reductions occur. Expenses net of fee waivers reflect expenses after reimbursement by the investment adviser but prior to reductions from brokerage service arrangements or other expense offset arrangements. Expenses net of all reductions represent the net expenses paid by the Fund.
G Amount does not include the portfolio activity of any underlying Fidelity Central Funds.
See accompanying notes which are an integral part of the financial statements.
Notes to Financial Statements
For the period ended October 31, 2018
1. Organization.
Fidelity Japan Smaller Companies Fund (the Fund) is a fund of Fidelity Investment Trust (the Trust) and is authorized to issue an unlimited number of shares. Share transactions on the Statement of Changes in Net Assets may contain exchanges between affiliated funds. The Trust is registered under the Investment Company Act of 1940, as amended (the 1940 Act), as an open-end management investment company organized as a Massachusetts business trust.
2. Investments in Fidelity Central Funds.
The Fund invests in Fidelity Central Funds, which are open-end investment companies generally available only to other investment companies and accounts managed by the investment adviser and its affiliates. The Fund's Schedule of Investments lists each of the Fidelity Central Funds held as of period end, if any, as an investment of the Fund, but does not include the underlying holdings of each Fidelity Central Fund. As an Investing Fund, the Fund indirectly bears its proportionate share of the expenses of the underlying Fidelity Central Funds.
The Money Market Central Funds seek preservation of capital and current income and are managed by Fidelity Investments Money Management, Inc. (FIMM), an affiliate of the investment adviser. Annualized expenses of the Money Market Central Funds as of their most recent shareholder report date are less than .005%.
A complete unaudited list of holdings for each Fidelity Central Fund is available upon request or at the Securities and Exchange Commission (the SEC) website at www.sec.gov. In addition, the financial statements of the Fidelity Central Funds, which are not covered by the Fund's Report of Independent Registered Public Accounting Firm, are available on the SEC website or upon request.
3. Significant Accounting Policies.
The Fund is an investment company and applies the accounting and reporting guidance of the Financial Accounting Standards Board (FASB) Accounting Standards Codification Topic 946 Financial Services – Investments Companies. The financial statements have been prepared in conformity with accounting principles generally accepted in the United States of America (GAAP), which require management to make certain estimates and assumptions at the date of the financial statements. Actual results could differ from those estimates. Subsequent events, if any, through the date that the financial statements were issued have been evaluated in the preparation of the financial statements. The following summarizes the significant accounting policies of the Fund:
Investment Valuation. Investments are valued as of 4:00 p.m. Eastern time on the last calendar day of the period. The Board of Trustees (the Board) has delegated the day to day responsibility for the valuation of the Fund's investments to the Fair Value Committee (the Committee) established by the Fund's investment adviser. In accordance with valuation policies and procedures approved by the Board, the Fund attempts to obtain prices from one or more third party pricing vendors or brokers to value its investments. When current market prices, quotations or currency exchange rates are not readily available or reliable, investments will be fair valued in good faith by the Committee, in accordance with procedures adopted by the Board. Factors used in determining fair value vary by investment type and may include market or investment specific events. The frequency with which these procedures are used cannot be predicted and they may be utilized to a significant extent. The Committee oversees the Fund's valuation policies and procedures and reports to the Board on the Committee's activities and fair value determinations. The Board monitors the appropriateness of the procedures used in valuing the Fund's investments and ratifies the fair value determinations of the Committee.
The Fund categorizes the inputs to valuation techniques used to value its investments into a disclosure hierarchy consisting of three levels as shown below:
- Level 1 – quoted prices in active markets for identical investments
- Level 2 – other significant observable inputs (including quoted prices for similar investments, interest rates, prepayment speeds, etc.)
- Level 3 – unobservable inputs (including the Fund's own assumptions based on the best information available)
Valuation techniques used to value the Fund's investments by major category are as follows:
Equity securities, including restricted securities, for which market quotations are readily available, are valued at the last reported sale price or official closing price as reported by a third party pricing vendor on the primary market or exchange on which they are traded and are categorized as Level 1 in the hierarchy. In the event there were no sales during the day or closing prices are not available, securities are valued at the last quoted bid price or may be valued using the last available price and are generally categorized as Level 2 in the hierarchy. For foreign equity securities, when market or security specific events arise, comparisons to the valuation of American Depositary Receipts (ADRs), futures contracts, Exchange-Traded Funds (ETFs) and certain indexes as well as quoted prices for similar securities may be used and would be categorized as Level 2 in the hierarchy. Utilizing these techniques may result in transfers between Level 1 and Level 2. For equity securities, including restricted securities, where observable inputs are limited, assumptions about market activity and risk are used and these securities may be categorized as Level 3 in the hierarchy.
Futures contracts are valued at the settlement price established each day by the board of trade or exchange on which they are traded and are categorized as Level 1 in the hierarchy.
Investments in open-end mutual funds, including the Fidelity Central Funds, are valued at their closing net asset value (NAV) each business day and are categorized as Level 1 in the hierarchy.
Changes in valuation techniques may result in transfers in or out of an assigned level within the disclosure hierarchy. The aggregate value of investments by input level as of October 31, 2018, including information on transfers between Levels 1 and 2, is included at the end of the Fund's Schedule of Investments.
Foreign Currency. The Fund may use foreign currency contracts to facilitate transactions in foreign-denominated securities. Gains and losses from these transactions may arise from changes in the value of the foreign currency or if the counterparties do not perform under the contracts' terms.
Foreign-denominated assets, including investment securities, and liabilities are translated into U.S. dollars at the exchange rates at period end. Purchases and sales of investment securities, income and dividends received and expenses denominated in foreign currencies are translated into U.S. dollars at the exchange rate in effect on the transaction date.
The effects of exchange rate fluctuations on investments are included with the net realized and unrealized gain (loss) on investment securities. Other foreign currency transactions resulting in realized and unrealized gain (loss) are disclosed separately.
Investment Transactions and Income. For financial reporting purposes, the Fund's investment holdings and NAV include trades executed through the end of the last business day of the period. The NAV per share for processing shareholder transactions is calculated as of the close of business of the New York Stock Exchange (NYSE), normally 4:00 p.m. Eastern time and includes trades executed through the end of the prior business day. Gains and losses on securities sold are determined on the basis of identified cost. Dividend income is recorded on the ex-dividend date, except for certain dividends from foreign securities where the ex-dividend date may have passed, which are recorded as soon as the Fund is informed of the ex-dividend date. Non-cash dividends included in dividend income, if any, are recorded at the fair market value of the securities received. Income and capital gain distributions from Fidelity Central Funds, if any, are recorded on the ex-dividend date. Investment income is recorded net of foreign taxes withheld where recovery of such taxes is uncertain.
Expenses. Expenses directly attributable to a fund are charged to that fund. Expenses attributable to more than one fund are allocated among the respective funds on the basis of relative net assets or other appropriate methods. Expense estimates are accrued in the period to which they relate and adjustments are made when actual amounts are known.
Income Tax Information and Distributions to Shareholders. Each year, the Fund intends to qualify as a regulated investment company under Subchapter M of the Internal Revenue Code, including distributing substantially all of its taxable income and realized gains. As a result, no provision for U.S. Federal income taxes is required. As of October 31, 2018, the Fund did not have any unrecognized tax benefits in the financial statements; nor is the Fund aware of any tax positions for which it is reasonably possible that the total amounts of unrecognized tax benefits will significantly change in the next twelve months. The Fund files a U.S. federal tax return, in addition to state and local tax returns as required. The Fund's federal income tax returns are subject to examination by the Internal Revenue Service (IRS) for a period of three fiscal years after they are filed. State and local tax returns may be subject to examination for an additional fiscal year depending on the jurisdiction. Foreign taxes are provided for based on the Fund's understanding of the tax rules and rates that exist in the foreign markets in which it invests.
Distributions are declared and recorded on the ex-dividend date. Income and capital gain distributions are determined in accordance with income tax regulations, which may differ from GAAP. In addition, the Fund claimed a portion of the payment made to redeeming shareholders as a distribution for income tax purposes.
Capital accounts within the financial statements are adjusted for permanent book-tax differences. These adjustments have no impact on net assets or the results of operations. Capital accounts are not adjusted for temporary book-tax differences which will reverse in a subsequent period.
Book-tax differences are primarily due to foreign currency transactions, passive foreign investment companies (PFIC), deferred trustees compensation and losses deferred due to wash sales.
As of period end, the cost and unrealized appreciation (depreciation) in securities, and derivatives if applicable, for federal income tax purposes were as follows:
| Gross unrealized appreciation | $150,540,592 |
| Gross unrealized depreciation | (29,421,694) |
| Net unrealized appreciation (depreciation) | $121,118,898 |
| Tax Cost | $592,510,284 |
The tax-based components of distributable earnings as of period end were as follows:
| Undistributed ordinary income | $4,505,149 |
| Undistributed long-term capital gain | $29,473,927 |
| Net unrealized appreciation (depreciation) on securities and other investments | $121,111,064 |
The tax character of distributions paid was as follows:
| October 31, 2018 | October 31, 2017 | |
| Ordinary Income | $19,317,251 | $ 15,517,029 |
| Long-term Capital Gains | 16,318,197 | – |
| Total | $35,635,448 | $ 15,517,029 |
Short-Term Trading (Redemption) Fees. Shares held by investors in the Fund less than 90 days may have been subject to a redemption fee equal to 1.50% of the NAV of shares redeemed. All redemption fees, which reduce the proceeds of the shareholder redemption, are retained by the Fund and accounted for as an addition to paid in capital. In November 2017, the Board of Trustees approved the elimination of these redemption fees effective December 18, 2017.
New Rule Issuance. During August 2018, the U.S. Securities and Exchange Commission issued Final Rule Release No. 33-10532, Disclosure Update and Simplification. This Final Rule includes amendments specific to registered investment companies that are intended to eliminate overlap in disclosure requirements between Regulation S-X and GAAP. In accordance with these amendments, certain line-items in the Fund's financial statements have been combined or removed for the current period as outlined in the table below.
| Financial Statement | Current Line-Item Presentation | Prior Line-Item Presentation |
| Statement of Assets and Liabilities | Total distributable earnings (loss) | Undistributed/Distributions in excess of/Accumulated net investment income (loss) Accumulated/Undistributed net realized gain (loss) Net unrealized appreciation (depreciation) |
| Statement of Changes in Net Assets | N/A - removed | Undistributed/Distributions in excess of/Accumulated net investment income (loss) end of period |
| Statement of Changes in Net Assets | Distributions to shareholders | Distributions to shareholders from net investment income Distributions to shareholders from net realized gain |
4. Derivative Instruments.
Risk Exposures and the Use of Derivative Instruments. The Fund's investment objective allows the Fund to enter into various types of derivative contracts, including futures contracts. Derivatives are investments whose value is primarily derived from underlying assets, indices or reference rates and may be transacted on an exchange or over-the-counter (OTC). Derivatives may involve a future commitment to buy or sell a specified asset based on specified terms, to exchange future cash flows at periodic intervals based on a notional principal amount, or for one party to make one or more payments upon the occurrence of specified events in exchange for periodic payments from the other party.
The Fund used derivatives to increase returns to manage exposure to certain risks as defined below. The success of any strategy involving derivatives depends on analysis of numerous economic factors, and if the strategies for investment do not work as intended, the Fund may not achieve its objectives.
The Fund's use of derivatives increased or decreased its exposure to the following risk:
| Equity Risk | Equity risk relates to the fluctuations in the value of financial instruments as a result of changes in market prices (other than those arising from interest rate risk or foreign exchange risk), whether caused by factors specific to an individual investment, its issuer, or all factors affecting all instruments traded in a market or market segment. |
The Fund is also exposed to additional risks from investing in derivatives, such as liquidity risk and counterparty credit risk. Liquidity risk is the risk that the Fund will be unable to close out the derivative in the open market in a timely manner. Counterparty credit risk is the risk that the counterparty will not be able to fulfill its obligation to the Fund. Counterparty credit risk related to exchange-traded futures contracts may be mitigated by the protection provided by the exchange on which they trade. A summary of the Fund's derivatives inclusive of potential netting arrangements is presented at the end of the Schedule of Investments.
Investing in derivatives may involve greater risks than investing in the underlying assets directly and, to varying degrees, may involve risk of loss in excess of any initial investment and collateral received and amounts recognized in the Statement of Assets and Liabilities. In addition, there may be the risk that the change in value of the derivative contract does not correspond to the change in value of the underlying instrument.
Futures Contracts. A futures contract is an agreement between two parties to buy or sell a specified underlying instrument for a fixed price at a specified future date. The Fund used futures contracts to manage its exposure to the stock market.
Upon entering into a futures contract, a fund is required to deposit either cash or securities (initial margin) with a clearing broker in an amount equal to a certain percentage of the face value of the contract. Futures contracts are marked-to-market daily and subsequent daily payments (variation margin) are made or received by a fund depending on the daily fluctuations in the value of the futures contracts and are recorded as unrealized appreciation or (depreciation). This receivable and/or payable, if any, is included in daily variation margin on futures contracts in the Statement of Assets and Liabilities. Realized gain or (loss) is recorded upon the expiration or closing of a futures contract. The net realized gain (loss) and change in net unrealized appreciation (depreciation) on futures contracts during the period is presented in the Statement of Operations.
Any open futures contracts at period end are presented in the Schedule of Investments under the caption "Futures Contracts". The notional amount at value reflects each contract's exposure to the underlying instrument or index at period end and is representative of volume of activity during the period. Cash deposited to meet initial margin requirements is presented as segregated cash with brokers for derivative instruments in the Statement of Assets and Liabilities.
5. Purchases and Sales of Investments.
Purchases and sales of securities, other than short-term securities, aggregated $133,572,473 and $129,097,205, respectively.
6. Fees and Other Transactions with Affiliates.
Management Fee. Fidelity Management & Research Company (the investment adviser) and its affiliates provide the Fund with investment management related services for which the Fund pays a monthly management fee. The management fee is the sum of an individual fund fee rate that is based on an annual rate of .45% of the Fund's average net assets and an annualized group fee rate that averaged .24% during the period. The group fee rate is based upon the average net assets of all the mutual funds advised by the investment adviser, including any mutual funds previously advised by the investment adviser that are currently advised by Fidelity SelectCo, LLC, an affiliate of the investment adviser. The group fee rate decreases as assets under management increase and increases as assets under management decrease. For the reporting period, the total annual management fee rate was .69% of the Fund's average net assets.
Transfer Agent Fees. Fidelity Investments Institutional Operations Company, Inc. (FIIOC), an affiliate of the investment adviser, is the Fund's transfer, dividend disbursing and shareholder servicing agent. FIIOC receives account fees and asset-based fees that vary according to account size and type of account. FIIOC pays for typesetting, printing and mailing of shareholder reports, except proxy statements. For the period, the transfer agent fees were equivalent to an annual rate of .17% of average net assets.
Accounting and Security Lending Fees. Fidelity Service Company, Inc. (FSC), an affiliate of the investment adviser, maintains the Fund's accounting records. The accounting fee is based on the level of average net assets for each month. Under a separate contract, FSC administers the security lending program. The security lending fee is based on the number and duration of lending transactions. For the period, the fees were equivalent to an annual rate of .05%.
Interfund Trades. The Fund may purchase from or sell securities to other Fidelity Funds under procedures adopted by the Board. The procedures have been designed to ensure these interfund trades are executed in accordance with Rule 17a-7 of the 1940 Act. Interfund trades are included within the respective purchases and sales amounts shown in the Purchases and Sales of Investments note.
7. Committed Line of Credit.
The Fund participates with other funds managed by the investment adviser or an affiliate in a $4.25 billion credit facility (the "line of credit") to be utilized for temporary or emergency purposes to fund shareholder redemptions or for other short-term liquidity purposes. The Fund has agreed to pay commitment fees on its pro-rata portion of the line of credit, which amounted to $2,184 and is reflected in Miscellaneous expenses on the Statement of Operations. During the period, the Fund did not borrow on this line of credit.
8. Security Lending.
The Fund lends portfolio securities through a lending agent from time to time in order to earn additional income. For equity securities, a lending agent is used and may loan securities to certain qualified borrowers, including Fidelity Capital Markets (FCM), a broker-dealer affiliated with the Fund. On the settlement date of the loan, the Fund receives collateral (in the form of U.S. Treasury obligations, letters of credit and/or cash) against the loaned securities and maintains collateral in an amount not less than 100% of the market value of the loaned securities during the period of the loan. The market value of the loaned securities is determined at the close of business of the Fund and any additional required collateral is delivered to the Fund on the next business day. The Fund or borrower may terminate the loan at any time, and if the borrower defaults on its obligation to return the securities loaned because of insolvency or other reasons, the Fund may apply collateral received from the borrower against the obligation. The Fund may experience delays and costs in recovering the securities loaned. Any cash collateral received is invested in the Fidelity Securities Lending Cash Central Fund. The value of loaned securities and cash collateral at period end are disclosed on the Fund's Statement of Assets and Liabilities. Security lending income represents the income earned on investing cash collateral, less rebates paid to borrowers and any lending agent fees associated with the loan, plus any premium payments received for lending certain types of securities. Security lending income is presented in the Statement of Operations as a component of income from Fidelity Central Funds. Total security lending income during the period amounted to $66,759. During the period, there were no securities loaned to FCM.
9. Expense Reductions.
Commissions paid to certain brokers with whom the investment adviser, or its affiliates, places trades on behalf of the Fund include an amount in addition to trade execution, which may be rebated back to the Fund to offset certain expenses. This amount totaled $30,202 for the period. Through arrangements with the Fund's custodian, credits realized as a result of certain uninvested cash balances were used to reduce the Fund's expenses. During the period, these credits reduced the Fund's custody expenses by $640.
In addition, during the period the investment adviser reimbursed and/or waived a portion of operating expenses in the amount of $7,742.
10. Other.
The Fund's organizational documents provide former and current trustees and officers with a limited indemnification against liabilities arising in connection with the performance of their duties to the Fund. In the normal course of business, the Fund may also enter into contracts that provide general indemnifications. The Fund's maximum exposure under these arrangements is unknown as this would be dependent on future claims that may be made against the Fund. The risk of material loss from such claims is considered remote.
At the end of the period, Strategic Advisers International Fund, VIP FundsManager 50% Portfolio and VIP FundsManager 60% Portfolio were the owners of record of approximately 15%, 10% and 11%, respectively, of the total outstanding shares of the Fund. Mutual funds managed by the investment adviser or its affiliates were the owners of record, in the aggregate, of approximately 47% of the total outstanding shares of the Fund.
Fidelity® Latin America Fund
Performance: The Bottom Line
Average annual total return reflects the change in the value of an investment, assuming reinvestment of distributions from dividend income and capital gains (the profits earned upon the sale of securities that have grown in value, if any) and assuming a constant rate of performance each year. The hypothetical investment and the average annual total returns do not reflect the deduction of taxes that a shareholder would pay on fund distributions or the redemption of fund shares. During periods of reimbursement by Fidelity, a fund’s total return will be greater than it would be had the reimbursement not occurred. How a fund did yesterday is no guarantee of how it will do tomorrow.
Average Annual Total Returns
| For the periods ended October 31, 2018 | Past 1 year | Past 5 years | Past 10 years |
| Fidelity® Latin America Fund | (10.50)% | (5.05)% | 2.69% |
$10,000 Over 10 Years
Let's say hypothetically that $10,000 was invested in Fidelity® Latin America Fund, a class of the fund, on October 31, 2008.
The chart shows how the value of your investment would have changed, and also shows how the MSCI EM (Emerging Markets) Latin America Index performed over the same period.
| Period Ending Values | ||
| $13,045 | Fidelity® Latin America Fund | |
| $16,479 | MSCI EM (Emerging Markets) Latin America Index | |
Fidelity® Latin America Fund
Management's Discussion of Fund Performance
Market Recap: International equities returned -8.08% for the 12 months ending October 31, 2018, according to the MSCI ACWI (All Country World Index) ex USA Index. A modestly positive first half of the period gave way to a confluence of overwhelmingly negative factors – including escalating trade tensions, a surging U.S. dollar, tepid economic growth in Europe, global central bank tightening, concerns about Italy’s budget stalemate with the EU, and weakness in China’s stock market. The index lost 8% in October alone, its largest monthly drop in more than six years. Among sectors, communications services (-15%) was hit the hardest, while economically sensitive consumer discretionary (-13%), information technology (-12%), financials (-10%), industrials (-9%) and materials (-7%) stocks also fared poorly. Even the more defensive real estate (-9%), utilities (-6%) and consumer staples (-5%) sectors weren’t spared this period. Conversely, elevated crude-oil prices fueled a positive return for energy (+7%), the top-performing sector, followed by the relatively stable-growing health care segment (+2%). Regionally, emerging markets (-12%) fared the worst, hampered by the impact of foreign exchange and concerns about economic weakness in China, India and South Korea. Sluggish growth also pressured shares in continental Europe (-9%). Stocks in Japan (-3%) and the U.K. (-4%) held up better, followed by Canada (-5%) and Asia-Pacific ex Japan (-6%).Comments from Portfolio Manager Will Pruett: For the fiscal year, the fund’s share classes (excluding sales charges, if applicable) returned roughly -10% to -11%, trailing the -2.24% result of the benchmark MSCI Emerging Markets Latin America Index. Versus the benchmark, stock picks in Brazil, which faced economic- and election-related strife, detracted the most by far, while investment choices in Mexico hurt to a lesser extent. Several unfavorable non-benchmark positions in Panama and Argentina also meaningfully weighed on the fund's relative return. Also, an overall bias for holding domestically oriented positions did not work well, nor did picks in the financials and communications services sectors. Lower-than-benchmark exposure to strong-performing energy and materials companies, and overweightings in poor-performing consumer discretionary and health care stocks, further detracted. Underweighting Brazil-based iron and nickel producer Vale hurt the most, as the company's stock rallied about 64% for the period, largely due to rising iron-ore prices. Elsewhere in Brazil, untimely ownership and an overweighted stake in health-care insurance broker Qualicorp dampened the fund's relative return, as did a non-benchmark stake in travel-loyalty company Smiles Fidelidade, which announced plans for a reorganization late in the period. Conversely, non-benchmark holdings in the U.S. added some value, as did underweightings in Chile and Mexico.The views expressed above reflect those of the portfolio manager(s) only through the end of the period as stated on the cover of this report and do not necessarily represent the views of Fidelity or any other person in the Fidelity organization. Any such views are subject to change at any time based upon market or other conditions and Fidelity disclaims any responsibility to update such views. These views may not be relied on as investment advice and, because investment decisions for a Fidelity fund are based on numerous factors, may not be relied on as an indication of trading intent on behalf of any Fidelity fund.
Fidelity® Latin America Fund
Investment Summary (Unaudited)
Geographic Diversification (% of fund's net assets)
| As of October 31, 2018 | ||
| Brazil | 68.7% | |
| Mexico | 17.0% | |
| Panama | 4.4% | |
| Bermuda | 3.9% | |
| Israel | 2.2% | |
| United States of America* | 1.7% | |
| Spain | 1.2% | |
| Argentina | 0.9% | |

* Includes Short-Term investments and Net Other Assets (Liabilities).
Percentages are based on country or territory of incorporation and are adjusted for the effect of futures contracts, if applicable.
Asset Allocation as of October 31, 2018
| % of fund's net assets | |
| Stocks | 99.9 |
| Short-Term Investments and Net Other Assets (Liabilities) | 0.1 |
Top Ten Stocks as of October 31, 2018
| % of fund's net assets | |
| Itausa-Investimentos Itau SA (PN) (Brazil, Banks) | 12.4 |
| Petroleo Brasileiro SA - Petrobras (PN) (non-vtg.) (Brazil, Oil, Gas & Consumable Fuels) | 10.3 |
| Itau Unibanco Holding SA (Brazil, Banks) | 5.5 |
| Suzano Papel e Celulose SA (Brazil, Paper & Forest Products) | 5.3 |
| Azul SA sponsored ADR (Brazil, Airlines) | 4.8 |
| Credicorp Ltd. (United States) (Bermuda, Banks) | 3.9 |
| Hapvida Participacoes e Investimentos SA (Brazil, Insurance) | 3.9 |
| Credito Real S.A.B. de CV (Mexico, Consumer Finance) | 3.5 |
| Qualicorp SA (Brazil, Health Care Providers & Services) | 2.9 |
| Notre Dame Intermedica Participacoes SA (Brazil, Health Care Providers & Services) | 2.9 |
| 55.4 |
Top Market Sectors as of October 31, 2018
| % of fund's net assets | |
| Financials | 40.4 |
| Industrials | 15.0 |
| Consumer Discretionary | 14.0 |
| Energy | 10.3 |
| Health Care | 10.2 |
| Materials | 7.8 |
| Information Technology | 2.2 |
Market Sectors may include more than one industry category.
The Fund may invest up to 35% of its total assets in any industry that represents more than 20% of the Latin American market. As of October 31, 2018, 26.5% of the Fund’s total assets were invested in the Diversified Banks industry, which accounts for more than 20% of the Latin American market.
Fidelity® Latin America Fund
Schedule of Investments October 31, 2018
Showing Percentage of Net Assets
| Common Stocks - 70.1% | |||
| Shares | Value | ||
| Argentina - 0.9% | |||
| Bolsas y Mercados Argentinos SA | 444,352 | $4,158,838 | |
| Bermuda - 3.9% | |||
| Credicorp Ltd. (United States) | 82,670 | 18,659,446 | |
| Brazil - 38.9% | |||
| Azul SA sponsored ADR (a)(b) | 927,162 | 22,604,210 | |
| B2W Companhia Global do Varejo (a) | 1,313,749 | 12,179,052 | |
| BTG Pactual Participations Ltd. unit | 1,576,808 | 8,376,594 | |
| Companhia de Locacao das Americas | 674,793 | 5,568,425 | |
| CVC Brasil Operadora e Agencia de Viagens SA | 710,011 | 10,798,501 | |
| Estacio Participacoes SA | 2,103,889 | 13,076,166 | |
| Hapvida Participacoes e Investimentos SA | 2,695,256 | 18,453,614 | |
| Hypermarcas SA | 1,315,510 | 10,526,908 | |
| Notre Dame Intermedica Participacoes SA | 2,147,781 | 13,926,093 | |
| Qualicorp SA | 3,615,771 | 13,990,891 | |
| Rumo SA (a) | 3,038,024 | 13,592,127 | |
| Ser Educacional SA (c) | 2,274,861 | 9,529,782 | |
| Suzano Papel e Celulose SA | 2,454,042 | 24,959,153 | |
| Vale SA | 423,821 | 6,458,387 | |
| TOTAL BRAZIL | 184,039,903 | ||
| Israel - 2.2% | |||
| Ituran Location & Control Ltd. | 300,444 | 10,251,149 | |
| Mexico - 17.0% | |||
| Banco del Bajio SA (c) | 6,689,681 | 13,149,986 | |
| Credito Real S.A.B. de CV | 14,635,664 | 16,744,383 | |
| Genomma Lab Internacional SA de CV (a)(b) | 16,211,884 | 10,415,127 | |
| Grupo Aeroportuario Norte S.A.B. de CV | 1,000,198 | 5,233,581 | |
| Grupo Cementos de Chihuahua S.A.B. de CV (b) | 987,185 | 5,320,032 | |
| Promotora y Operadora de Infraestructura S.A.B. de CV | 1,748,760 | 12,009,502 | |
| Qualitas Controladora S.A.B. de CV | 4,349,535 | 8,764,056 | |
| Unifin Financiera SAPI de CV | 4,624,853 | 8,740,507 | |
| TOTAL MEXICO | 80,377,174 | ||
| Panama - 4.4% | |||
| Copa Holdings SA Class A | 160,960 | 11,658,333 | |
| Intergroup Financial Services Corp. | 248,403 | 9,265,432 | |
| TOTAL PANAMA | 20,923,765 | ||
| Spain - 1.2% | |||
| Prosegur Cash SA (c) | 2,774,079 | 5,498,606 | |
| United States of America - 1.6% | |||
| First Cash Financial Services, Inc. | 95,495 | 7,677,798 | |
| TOTAL COMMON STOCKS | |||
| (Cost $316,323,805) | 331,586,679 | ||
| Nonconvertible Preferred Stocks - 29.8% | |||
| Brazil - 29.8% | |||
| Alpargatas SA (PN) | 1,841,507 | 7,516,456 | |
| Itau Unibanco Holding SA | 1,966,297 | 26,021,800 | |
| Itausa-Investimentos Itau SA (PN) | 19,422,987 | 58,663,006 | |
| Petroleo Brasileiro SA - Petrobras (PN) (non-vtg.) | 6,591,313 | 48,919,002 | |
| TOTAL BRAZIL | 141,120,264 | ||
| TOTAL NONCONVERTIBLE PREFERRED STOCKS | |||
| (Cost $84,966,501) | 141,120,264 | ||
| Money Market Funds - 2.3% | |||
| Fidelity Cash Central Fund, 2.23% (d) | 852,025 | 852,195 | |
| Fidelity Securities Lending Cash Central Fund 2.23% (d)(e) | 10,121,018 | 10,122,030 | |
| TOTAL MONEY MARKET FUNDS | |||
| (Cost $10,974,225) | 10,974,225 | ||
| TOTAL INVESTMENT IN SECURITIES - 102.2% | |||
| (Cost $412,264,531) | 483,681,168 | ||
| NET OTHER ASSETS (LIABILITIES) - (2.2)% | (10,391,913) | ||
| NET ASSETS - 100% | $473,289,255 |
Categorizations in the Schedule of Investments are based on country or territory of incorporation.
Legend
(a) Non-income producing
(b) Security or a portion of the security is on loan at period end.
(c) Security exempt from registration under Rule 144A of the Securities Act of 1933. These securities may be resold in transactions exempt from registration, normally to qualified institutional buyers. At the end of the period, the value of these securities amounted to $28,178,374 or 6.0% of net assets.
(d) Affiliated fund that is generally available only to investment companies and other accounts managed by Fidelity Investments. The rate quoted is the annualized seven-day yield of the fund at period end. A complete unaudited listing of the fund's holdings as of its most recent quarter end is available upon request. In addition, each Fidelity Central Fund's financial statements, which are not covered by the Fund's Report of Independent Registered Public Accounting Firm, are available on the SEC's website or upon request.
(e) Investment made with cash collateral received from securities on loan.
Affiliated Central Funds
Information regarding fiscal year to date income earned by the Fund from investments in Fidelity Central Funds is as follows:
| Fund | Income earned |
| Fidelity Cash Central Fund | $88,819 |
| Fidelity Securities Lending Cash Central Fund | 1,232 |
| Total | $90,051 |
Amounts in the income column in the above table include any capital gain distributions from underlying funds, which are presented in the corresponding line-item in the Statement of Operations if applicable.
Investment Valuation
All investments are categorized as Level 1 under the Fair Value Hierarchy. The inputs or methodology used for valuing securities may not be an indication of the risk associated with investing in those securities. For more information on valuation inputs please refer to the Investment Valuation section in the accompanying Notes to Financial Statements.
See accompanying notes which are an integral part of the financial statements.
Fidelity® Latin America Fund
Financial Statements
Statement of Assets and Liabilities
| October 31, 2018 | ||
| Assets | ||
| Investment in securities, at value (including securities loaned of $9,499,579) — See accompanying schedule: Unaffiliated issuers (cost $401,290,306) | $472,706,943 | |
| Fidelity Central Funds (cost $10,974,225) | 10,974,225 | |
| Total Investment in Securities (cost $412,264,531) | $483,681,168 | |
| Receivable for investments sold | 992,357 | |
| Receivable for fund shares sold | 860,685 | |
| Dividends receivable | 167,348 | |
| Distributions receivable from Fidelity Central Funds | 7,381 | |
| Prepaid expenses | 915 | |
| Other receivables | 48,355 | |
| Total assets | 485,758,209 | |
| Liabilities | ||
| Payable for investments purchased | $1,073,832 | |
| Payable for fund shares redeemed | 706,262 | |
| Accrued management fee | 270,473 | |
| Distribution and service plan fees payable | 8,067 | |
| Other affiliated payables | 120,841 | |
| Other payables and accrued expenses | 167,449 | |
| Collateral on securities loaned | 10,122,030 | |
| Total liabilities | 12,468,954 | |
| Net Assets | $473,289,255 | |
| Net Assets consist of: | ||
| Paid in capital | $495,760,026 | |
| Total distributable earnings (loss) | (22,470,771) | |
| Net Assets | $473,289,255 | |
| Net Asset Value and Maximum Offering Price | ||
| Class A: | ||
| Net Asset Value and redemption price per share ($14,157,164 ÷ 644,103 shares) | $21.98 | |
| Maximum offering price per share (100/94.25 of $21.98) | $23.32 | |
| Class M: | ||
| Net Asset Value and redemption price per share ($5,098,032 ÷ 231,723 shares) | $22.00 | |
| Maximum offering price per share (100/96.50 of $22.00) | $22.80 | |
| Class C: | ||
| Net Asset Value and offering price per share ($3,497,618 ÷ 157,861 shares)(a) | �� | $22.16 |
| Latin America: | ||
| Net Asset Value, offering price and redemption price per share ($445,845,228 ÷ 20,318,549 shares) | $21.94 | |
| Class I: | ||
| Net Asset Value, offering price and redemption price per share ($4,546,239 ÷ 207,412 shares) | $21.92 | |
| Class Z: | ||
| Net Asset Value, offering price and redemption price per share ($144,974 ÷ 6,615 shares) | $21.92 |
(a) Redemption price per share is equal to net asset value less any applicable contingent deferred sales charge.
See accompanying notes which are an integral part of the financial statements.
Statement of Operations
| Year ended October 31, 2018 | ||
| Investment Income | ||
| Dividends | $20,572,851 | |
| Income from Fidelity Central Funds | 90,051 | |
| Income before foreign taxes withheld | 20,662,902 | |
| Less foreign taxes withheld | (1,220,078) | |
| Total income | 19,442,824 | |
| Expenses | ||
| Management fee | $3,913,310 | |
| Transfer agent fees | 1,384,464 | |
| Distribution and service plan fees | 117,536 | |
| Accounting and security lending fees | 285,892 | |
| Custodian fees and expenses | 327,757 | |
| Independent trustees' fees and expenses | 2,875 | |
| Registration fees | 81,696 | |
| Audit | 77,354 | |
| Legal | 3,058 | |
| Miscellaneous | 4,226 | |
| Total expenses before reductions | 6,198,168 | |
| Expense reductions | (137,523) | |
| Total expenses after reductions | 6,060,645 | |
| Net investment income (loss) | 13,382,179 | |
| Realized and Unrealized Gain (Loss) | ||
| Net realized gain (loss) on: | ||
| Investment securities: | ||
| Unaffiliated issuers | 40,228,875 | |
| Fidelity Central Funds | 300 | |
| Foreign currency transactions | (169,717) | |
| Total net realized gain (loss) | 40,059,458 | |
| Change in net unrealized appreciation (depreciation) on: | ||
| Investment securities: | ||
| Unaffiliated issuers | (118,079,357) | |
| Assets and liabilities in foreign currencies | (4,496) | |
| Total change in net unrealized appreciation (depreciation) | (118,083,853) | |
| Net gain (loss) | (78,024,395) | |
| Net increase (decrease) in net assets resulting from operations | $(64,642,216) |
See accompanying notes which are an integral part of the financial statements.
Statement of Changes in Net Assets
| Year ended October 31, 2018 | Year ended October 31, 2017 | |
| Increase (Decrease) in Net Assets | ||
| Operations | ||
| Net investment income (loss) | $13,382,179 | $12,761,653 |
| Net realized gain (loss) | 40,059,458 | 32,325,555 |
| Change in net unrealized appreciation (depreciation) | (118,083,853) | 24,718,281 |
| Net increase (decrease) in net assets resulting from operations | (64,642,216) | 69,805,489 |
| Distributions to shareholders | (9,005,746) | – |
| Distributions to shareholders from net investment income | – | (12,697,307) |
| Total distributions | (9,005,746) | (12,697,307) |
| Share transactions - net increase (decrease) | (88,546,151) | (55,405,622) |
| Redemption fees | 87,345 | 272,096 |
| Total increase (decrease) in net assets | (162,106,768) | 1,974,656 |
| Net Assets | ||
| Beginning of period | 635,396,023 | 633,421,367 |
| End of period | $473,289,255 | $635,396,023 |
| Other Information | ||
| Undistributed net investment income end of period | $6,370,322 |
See accompanying notes which are an integral part of the financial statements.
Financial Highlights
Fidelity Latin America Fund Class A
| Years ended October 31, | 2018 | 2017 | 2016 | 2015 | 2014 |
| Selected Per–Share Data | |||||
| Net asset value, beginning of period | $24.93 | $22.45 | $18.09 | $30.31 | $40.71 |
| Income from Investment Operations | |||||
| Net investment income (loss)A | .50 | .42 | .40 | .28 | .49 |
| Net realized and unrealized gain (loss) | (3.16) | 2.48 | 4.27 | (10.11) | (4.08) |
| Total from investment operations | (2.66) | 2.90 | 4.67 | (9.83) | (3.59) |
| Distributions from net investment income | (.29) | (.43) | (.31) | (.31) | (.57) |
| Distributions from net realized gain | – | – | – | (2.08) | (6.25) |
| Total distributions | (.29) | (.43) | (.31) | (2.39) | (6.82) |
| Redemption fees added to paid in capitalA | –B | .01 | –B | –B | .01 |
| Net asset value, end of period | $21.98 | $24.93 | $22.45 | $18.09 | $30.31 |
| Total ReturnC,D | (10.78)% | 13.55% | 26.29% | (34.60)% | (9.06)% |
| Ratios to Average Net AssetsE,F | |||||
| Expenses before reductions | 1.38% | 1.39% | 1.40% | 1.40% | 1.38% |
| Expenses net of fee waivers, if any | 1.38% | 1.39% | 1.40% | 1.40% | 1.38% |
| Expenses net of all reductions | 1.36% | 1.38% | 1.39% | 1.39% | 1.38% |
| Net investment income (loss) | 2.08% | 1.90% | 2.14% | 1.26% | 1.52% |
| Supplemental Data | |||||
| Net assets, end of period (000 omitted) | $14,157 | $17,801 | $19,115 | $16,424 | $34,898 |
| Portfolio turnover rateG | 53% | 51% | 108% | 30% | 30% |
A Calculated based on average shares outstanding during the period.
B Amount represents less than $.005 per share.
C Total returns would have been lower if certain expenses had not been reduced during the applicable periods shown.
D Total returns do not include the effect of the sales charges.
E Fees and expenses of any underlying Fidelity Central Funds are not included in the Fund's expense ratio. The Fund indirectly bears its proportionate share of the expenses of any underlying Fidelity Central Funds.
F Expense ratios reflect operating expenses of the class. Expenses before reductions do not reflect amounts reimbursed by the investment adviser or reductions from brokerage service arrangements or reductions from other expense offset arrangements and do not represent the amount paid by the class during periods when reimbursements or reductions occur. Expenses net of fee waivers reflect expenses after reimbursement by the investment adviser but prior to reductions from brokerage service arrangements or other expense offset arrangements. Expenses net of all reductions represent the net expenses paid by the class.
G Amount does not include the portfolio activity of any underlying Fidelity Central Funds.
See accompanying notes which are an integral part of the financial statements.
Fidelity Latin America Fund Class M
| Years ended October 31, | 2018 | 2017 | 2016 | 2015 | 2014 |
| Selected Per–Share Data | |||||
| Net asset value, beginning of period | $24.96 | $22.47 | $18.11 | $30.33 | $40.68 |
| Income from Investment Operations | |||||
| Net investment income (loss)A | .43 | .36 | .35 | .22 | .40 |
| Net realized and unrealized gain (loss) | (3.16) | 2.49 | 4.27 | (10.13) | (4.08) |
| Total from investment operations | (2.73) | 2.85 | 4.62 | (9.91) | (3.68) |
| Distributions from net investment income | (.23) | (.37) | (.26) | (.23) | (.43) |
| Distributions from net realized gain | – | – | – | (2.08) | (6.25) |
| Total distributions | (.23) | (.37) | (.26) | (2.31) | (6.68) |
| Redemption fees added to paid in capitalA | –B | .01 | –B | –B | .01 |
| Net asset value, end of period | $22.00 | $24.96 | $22.47 | $18.11 | $30.33 |
| Total ReturnC,D | (11.04)% | 13.24% | 25.93% | (34.78)% | (9.30)% |
| Ratios to Average Net AssetsE,F | |||||
| Expenses before reductions | 1.66% | 1.66% | 1.68% | 1.67% | 1.65% |
| Expenses net of fee waivers, if any | 1.66% | 1.66% | 1.68% | 1.67% | 1.65% |
| Expenses net of all reductions | 1.63% | 1.66% | 1.68% | 1.66% | 1.65% |
| Net investment income (loss) | 1.80% | 1.62% | 1.86% | .99% | 1.25% |
| Supplemental Data | |||||
| Net assets, end of period (000 omitted) | $5,098 | $6,740 | $7,378 | $5,284 | $9,761 |
| Portfolio turnover rateG | 53% | 51% | 108% | 30% | 30% |
A Calculated based on average shares outstanding during the period.
B Amount represents less than $.005 per share.
C Total returns would have been lower if certain expenses had not been reduced during the applicable periods shown.
D Total returns do not include the effect of the sales charges.
E Fees and expenses of any underlying Fidelity Central Funds are not included in the Fund's expense ratio. The Fund indirectly bears its proportionate share of the expenses of any underlying Fidelity Central Funds.
F Expense ratios reflect operating expenses of the class. Expenses before reductions do not reflect amounts reimbursed by the investment adviser or reductions from brokerage service arrangements or reductions from other expense offset arrangements and do not represent the amount paid by the class during periods when reimbursements or reductions occur. Expenses net of fee waivers reflect expenses after reimbursement by the investment adviser but prior to reductions from brokerage service arrangements or other expense offset arrangements. Expenses net of all reductions represent the net expenses paid by the class.
G Amount does not include the portfolio activity of any underlying Fidelity Central Funds.
See accompanying notes which are an integral part of the financial statements.
Fidelity Latin America Fund Class C
| Years ended October 31, | 2018 | 2017 | 2016 | 2015 | 2014 |
| Selected Per–Share Data | |||||
| Net asset value, beginning of period | $25.12 | $22.61 | $18.18 | $30.37 | $40.59 |
| Income from Investment Operations | |||||
| Net investment income (loss)A | .32 | .26 | .26 | .11 | .25 |
| Net realized and unrealized gain (loss) | (3.18) | 2.52 | 4.30 | (10.17) | (4.07) |
| Total from investment operations | (2.86) | 2.78 | 4.56 | (10.06) | (3.82) |
| Distributions from net investment income | (.10) | (.28) | (.13) | (.05) | (.16) |
| Distributions from net realized gain | – | – | – | (2.08) | (6.25) |
| Total distributions | (.10) | (.28) | (.13) | (2.13) | (6.41) |
| Redemption fees added to paid in capitalA | –B | .01 | –B | –B | .01 |
| Net asset value, end of period | $22.16 | $25.12 | $22.61 | $18.18 | $30.37 |
| Total ReturnC,D | (11.43)% | 12.71% | 25.31% | (35.08)% | (9.74)% |
| Ratios to Average Net AssetsE,F | |||||
| Expenses before reductions | 2.13% | 2.14% | 2.15% | 2.15% | 2.13% |
| Expenses net of fee waivers, if any | 2.13% | 2.14% | 2.14% | 2.15% | 2.13% |
| Expenses net of all reductions | 2.11% | 2.14% | 2.14% | 2.15% | 2.13% |
| Net investment income (loss) | 1.33% | 1.15% | 1.39% | .51% | .77% |
| Supplemental Data | |||||
| Net assets, end of period (000 omitted) | $3,498 | $5,094 | $6,590 | $5,394 | $11,349 |
| Portfolio turnover rateG | 53% | 51% | 108% | 30% | 30% |
A Calculated based on average shares outstanding during the period.
B Amount represents less than $.005 per share.
C Total returns would have been lower if certain expenses had not been reduced during the applicable periods shown.
D Total returns do not include the effect of the contingent deferred sales charge.
E Fees and expenses of any underlying Fidelity Central Funds are not included in the Fund's expense ratio. The Fund indirectly bears its proportionate share of the expenses of any underlying Fidelity Central Funds.
F Expense ratios reflect operating expenses of the class. Expenses before reductions do not reflect amounts reimbursed by the investment adviser or reductions from brokerage service arrangements or reductions from other expense offset arrangements and do not represent the amount paid by the class during periods when reimbursements or reductions occur. Expenses net of fee waivers reflect expenses after reimbursement by the investment adviser but prior to reductions from brokerage service arrangements or other expense offset arrangements. Expenses net of all reductions represent the net expenses paid by the class.
G Amount does not include the portfolio activity of any underlying Fidelity Central Funds.
See accompanying notes which are an integral part of the financial statements.
Fidelity Latin America Fund
| Years ended October 31, | 2018 | 2017 | 2016 | 2015 | 2014 |
| Selected Per–Share Data | |||||
| Net asset value, beginning of period | $24.89 | $22.41 | $18.08 | $30.34 | $40.80 |
| Income from Investment Operations | |||||
| Net investment income (loss)A | .57 | .49 | .45 | .34 | .59 |
| Net realized and unrealized gain (loss) | (3.15) | 2.46 | 4.26 | (10.11) | (4.10) |
| Total from investment operations | (2.58) | 2.95 | 4.71 | (9.77) | (3.51) |
| Distributions from net investment income | (.37) | (.48) | (.38) | (.41) | (.71) |
| Distributions from net realized gain | – | – | – | (2.08) | (6.25) |
| Total distributions | (.37) | (.48) | (.38) | (2.49) | (6.96) |
| Redemption fees added to paid in capitalA | –B | .01 | –B | –B | .01 |
| Net asset value, end of period | $21.94 | $24.89 | $22.41 | $18.08 | $30.34 |
| Total ReturnC | (10.50)% | 13.87% | 26.65% | (34.45)% | (8.79)% |
| Ratios to Average Net AssetsD,E | |||||
| Expenses before reductions | 1.07% | 1.09% | 1.14% | 1.13% | 1.08% |
| Expenses net of fee waivers, if any | 1.07% | 1.09% | 1.14% | 1.12% | 1.08% |
| Expenses net of all reductions | 1.05% | 1.09% | 1.13% | 1.12% | 1.07% |
| Net investment income (loss) | 2.39% | 2.19% | 2.40% | 1.53% | 1.83% |
| Supplemental Data | |||||
| Net assets, end of period (000 omitted) | $445,845 | $597,161 | $596,514 | $481,005 | $933,298 |
| Portfolio turnover rateF | 53% | 51% | 108% | 30% | 30% |
A Calculated based on average shares outstanding during the period.
B Amount represents less than $.005 per share.
C Total returns would have been lower if certain expenses had not been reduced during the applicable periods shown.
D Fees and expenses of any underlying Fidelity Central Funds are not included in the Fund's expense ratio. The Fund indirectly bears its proportionate share of the expenses of any underlying Fidelity Central Funds.
E Expense ratios reflect operating expenses of the class. Expenses before reductions do not reflect amounts reimbursed by the investment adviser or reductions from brokerage service arrangements or reductions from other expense offset arrangements and do not represent the amount paid by the class during periods when reimbursements or reductions occur. Expenses net of fee waivers reflect expenses after reimbursement by the investment adviser but prior to reductions from brokerage service arrangements or other expense offset arrangements. Expenses net of all reductions represent the net expenses paid by the class.
F Amount does not include the portfolio activity of any underlying Fidelity Central Funds.
See accompanying notes which are an integral part of the financial statements.
Fidelity Latin America Fund Class I
| Years ended October 31, | 2018 | 2017 | 2016 | 2015 | 2014 |
| Selected Per���Share Data | |||||
| Net asset value, beginning of period | $24.88 | $22.40 | $18.08 | $30.35 | $40.79 |
| Income from Investment Operations | |||||
| Net investment income (loss)A | .59 | .51 | .46 | .36 | .60 |
| Net realized and unrealized gain (loss) | (3.15) | 2.45 | 4.26 | (10.13) | (4.07) |
| Total from investment operations | (2.56) | 2.96 | 4.72 | (9.77) | (3.47) |
| Distributions from net investment income | (.40) | (.49) | (.40) | (.42) | (.73) |
| Distributions from net realized gain | – | – | – | (2.08) | (6.25) |
| Total distributions | (.40) | (.49) | (.40) | (2.50) | (6.98) |
| Redemption fees added to paid in capitalA | –B | .01 | –B | –B | .01 |
| Net asset value, end of period | $21.92 | $24.88 | $22.40 | $18.08 | $30.35 |
| Total ReturnC | (10.44)% | 13.94% | 26.77% | (34.42)% | (8.69)% |
| Ratios to Average Net AssetsD,E | |||||
| Expenses before reductions | 1.01% | 1.01% | 1.07% | 1.06% | 1.04% |
| Expenses net of fee waivers, if any | 1.01% | 1.01% | 1.07% | 1.06% | 1.04% |
| Expenses net of all reductions | .98% | 1.01% | 1.06% | 1.05% | 1.04% |
| Net investment income (loss) | 2.45% | 2.27% | 2.47% | 1.60% | 1.86% |
| Supplemental Data | |||||
| Net assets, end of period (000 omitted) | $4,546 | $8,600 | $3,825 | $1,828 | $4,531 |
| Portfolio turnover rateF | 53% | 51% | 108% | 30% | 30% |
A Calculated based on average shares outstanding during the period.
B Amount represents less than $.005 per share.
C Total returns would have been lower if certain expenses had not been reduced during the applicable periods shown.
D Fees and expenses of any underlying Fidelity Central Funds are not included in the Fund's expense ratio. The Fund indirectly bears its proportionate share of the expenses of any underlying Fidelity Central Funds.
E Expense ratios reflect operating expenses of the class. Expenses before reductions do not reflect amounts reimbursed by the investment adviser or reductions from brokerage service arrangements or reductions from other expense offset arrangements and do not represent the amount paid by the class during periods when reimbursements or reductions occur. Expenses net of fee waivers reflect expenses after reimbursement by the investment adviser but prior to reductions from brokerage service arrangements or other expense offset arrangements. Expenses net of all reductions represent the net expenses paid by the class.
F Amount does not include the portfolio activity of any underlying Fidelity Central Funds.
See accompanying notes which are an integral part of the financial statements.
Fidelity Latin America Fund Class Z
| Year ended October 31, | 2018 A |
| Selected Per–Share Data | |
| Net asset value, beginning of period | $21.51 |
| Income from Investment Operations | |
| Net investment income (loss)B | (.01) |
| Net realized and unrealized gain (loss) | .42 |
| Total from investment operations | .41 |
| Net asset value, end of period | $21.92 |
| Total ReturnC,D | 1.91% |
| Ratios to Average Net AssetsE,F | |
| Expenses before reductions | .95%G |
| Expenses net of fee waivers, if any | .95%G |
| Expenses net of all reductions | .93%G |
| Net investment income (loss) | (.37)%G |
| Supplemental Data | |
| Net assets, end of period (000 omitted) | $145 |
| Portfolio turnover rateH | 53% |
A For the period October 2, 2018 (commencement of sale of shares) to October 31, 2018.
B Calculated based on average shares outstanding during the period.
C Total returns for periods of less than one year are not annualized.
D Total returns would have been lower if certain expenses had not been reduced during the applicable periods shown.
E Fees and expenses of any underlying Fidelity Central Funds are not included in the Fund's expense ratio. The Fund indirectly bears its proportionate share of the expenses of any underlying Fidelity Central Funds.
F Expense ratios reflect operating expenses of the class. Expenses before reductions do not reflect amounts reimbursed by the investment adviser or reductions from brokerage service arrangements or reductions from other expense offset arrangements and do not represent the amount paid by the class during periods when reimbursements or reductions occur. Expense ratios before reductions for start-up periods may not be representative of longer-term operating periods. Expenses net of fee waivers reflect expenses after reimbursement by the investment adviser but prior to reductions from brokerage service arrangements or other expense offset arrangements. Expenses net of all reductions represent the net expenses paid by the class.
G Annualized
H Amount does not include the portfolio activity of any underlying Fidelity Central Funds.
See accompanying notes which are an integral part of the financial statements.
Notes to Financial Statements
For the period ended October 31, 2018
1. Organization.
Fidelity Latin America Fund (the Fund) is a non-diversified fund of Fidelity Investment Trust (the Trust) and is authorized to issue an unlimited number of shares. The Trust is registered under the Investment Company Act of 1940, as amended (the 1940 Act), as an open-end management investment company organized as a Massachusetts business trust. The Fund commenced sale of Class Z shares on October 2, 2018. The Fund offers Class A, Class M, Class C, Latin America, Class I and Class Z shares, each of which has equal rights as to assets and voting privileges. Each class has exclusive voting rights with respect to matters that affect that class.
2. Investments in Fidelity Central Funds.
The Fund invests in Fidelity Central Funds, which are open-end investment companies generally available only to other investment companies and accounts managed by the investment adviser and its affiliates. The Fund's Schedule of Investments lists each of the Fidelity Central Funds held as of period end, if any, as an investment of the Fund, but does not include the underlying holdings of each Fidelity Central Fund. As an Investing Fund, the Fund indirectly bears its proportionate share of the expenses of the underlying Fidelity Central Funds.
The Money Market Central Funds seek preservation of capital and current income and are managed by Fidelity Investments Money Management, Inc. (FIMM), an affiliate of the investment adviser. Annualized expenses of the Money Market Central Funds as of their most recent shareholder report date are less than .005%.
A complete unaudited list of holdings for each Fidelity Central Fund is available upon request or at the Securities and Exchange Commission (the SEC) website at www.sec.gov. In addition, the financial statements of the Fidelity Central Funds, which are not covered by the Fund's Report of Independent Registered Public Accounting Firm, are available on the SEC website or upon request.
3. Significant Accounting Policies.
The Fund is an investment company and applies the accounting and reporting guidance of the Financial Accounting Standards Board (FASB) Accounting Standards Codification Topic 946 Financial Services – Investments Companies. The financial statements have been prepared in conformity with accounting principles generally accepted in the United States of America (GAAP), which require management to make certain estimates and assumptions at the date of the financial statements. Actual results could differ from those estimates. Subsequent events, if any, through the date that the financial statements were issued have been evaluated in the preparation of the financial statements. The following summarizes the significant accounting policies of the Fund:
Investment Valuation. Investments are valued as of 4:00 p.m. Eastern time on the last calendar day of the period. The Board of Trustees (the Board) has delegated the day to day responsibility for the valuation of the Fund's investments to the Fair Value Committee (the Committee) established by the Fund's investment adviser. In accordance with valuation policies and procedures approved by the Board, the Fund attempts to obtain prices from one or more third party pricing vendors or brokers to value its investments. When current market prices, quotations or currency exchange rates are not readily available or reliable, investments will be fair valued in good faith by the Committee, in accordance with procedures adopted by the Board. Factors used in determining fair value vary by investment type and may include market or investment specific events. The frequency with which these procedures are used cannot be predicted and they may be utilized to a significant extent. The Committee oversees the Fund's valuation policies and procedures and reports to the Board on the Committee's activities and fair value determinations. The Board monitors the appropriateness of the procedures used in valuing the Fund's investments and ratifies the fair value determinations of the Committee.
The Fund categorizes the inputs to valuation techniques used to value its investments into a disclosure hierarchy consisting of three levels as shown below:
- Level 1 – quoted prices in active markets for identical investments
- Level 2 – other significant observable inputs (including quoted prices for similar investments, interest rates, prepayment speeds, etc.)
- Level 3 – unobservable inputs (including the Fund's own assumptions based on the best information available)
Valuation techniques used to value the Fund's investments by major category are as follows:
Equity securities, including restricted securities, for which market quotations are readily available, are valued at the last reported sale price or official closing price as reported by a third party pricing vendor on the primary market or exchange on which they are traded and are categorized as Level 1 in the hierarchy. In the event there were no sales during the day or closing prices are not available, securities are valued at the last quoted bid price or may be valued using the last available price and are generally categorized as Level 2 in the hierarchy. For foreign equity securities, when market or security specific events arise, comparisons to the valuation of American Depositary Receipts (ADRs), futures contracts, Exchange-Traded Funds (ETFs) and certain indexes as well as quoted prices for similar securities may be used and would be categorized as Level 2 in the hierarchy. Utilizing these techniques may result in transfers between Level 1 and Level 2. For equity securities, including restricted securities, where observable inputs are limited, assumptions about market activity and risk are used and these securities may be categorized as Level 3 in the hierarchy.
Investments in open-end mutual funds, including the Fidelity Central Funds, are valued at their closing net asset value (NAV) each business day and are categorized as Level 1 in the hierarchy.
Changes in valuation techniques may result in transfers in or out of an assigned level within the disclosure hierarchy.
Foreign Currency. The Fund may use foreign currency contracts to facilitate transactions in foreign-denominated securities. Gains and losses from these transactions may arise from changes in the value of the foreign currency or if the counterparties do not perform under the contracts' terms.
Foreign-denominated assets, including investment securities, and liabilities are translated into U.S. dollars at the exchange rates at period end. Purchases and sales of investment securities, income and dividends received and expenses denominated in foreign currencies are translated into U.S. dollars at the exchange rate in effect on the transaction date.
The effects of exchange rate fluctuations on investments are included with the net realized and unrealized gain (loss) on investment securities. Other foreign currency transactions resulting in realized and unrealized gain (loss) are disclosed separately.
Investment Transactions and Income. For financial reporting purposes, the Fund's investment holdings and NAV include trades executed through the end of the last business day of the period. The NAV per share for processing shareholder transactions is calculated as of the close of business of the New York Stock Exchange (NYSE), normally 4:00 p.m. Eastern time and includes trades executed through the end of the prior business day. Gains and losses on securities sold are determined on the basis of identified cost. Dividend income is recorded on the ex-dividend date, except for certain dividends from foreign securities where the ex-dividend date may have passed, which are recorded as soon as the Fund is informed of the ex-dividend date. Non-cash dividends included in dividend income, if any, are recorded at the fair market value of the securities received. Income and capital gain distributions from Fidelity Central Funds, if any, are recorded on the ex-dividend date. Certain distributions received by the Fund represent a return of capital or capital gain. The Fund determines the components of these distributions subsequent to the ex-dividend date, based upon receipt of tax filings or other correspondence relating to the underlying investment. These distributions are recorded as a reduction of cost of investments and/or as a realized gain. Investment income is recorded net of foreign taxes withheld where recovery of such taxes is uncertain.
Class Allocations and Expenses. Investment income, realized and unrealized capital gains and losses, common expenses of the Fund, and certain fund-level expense reductions, if any, are allocated daily on a pro-rata basis to each class based on the relative net assets of each class to the total net assets of the Fund. Each class differs with respect to transfer agent and distribution and service plan fees incurred. Certain expense reductions may also differ by class. For the reporting period, the allocated portion of income and expenses to each class as a percent of its average net assets may vary due to the timing of recording these transactions in relation to fluctuating net assets of the classes. Expenses directly attributable to a fund are charged to that fund. Expenses attributable to more than one fund are allocated among the respective funds on the basis of relative net assets or other appropriate methods. Expense estimates are accrued in the period to which they relate and adjustments are made when actual amounts are known.
Income Tax Information and Distributions to Shareholders. Each year, the Fund intends to qualify as a regulated investment company under Subchapter M of the Internal Revenue Code, including distributing substantially all of its taxable income and realized gains. As a result, no provision for U.S. Federal income taxes is required. As of October 31, 2018, the Fund did not have any unrecognized tax benefits in the financial statements; nor is the Fund aware of any tax positions for which it is reasonably possible that the total amounts of unrecognized tax benefits will significantly change in the next twelve months. The Fund files a U.S. federal tax return, in addition to state and local tax returns as required. The Fund's federal income tax returns are subject to examination by the Internal Revenue Service (IRS) for a period of three fiscal years after they are filed. State and local tax returns may be subject to examination for an additional fiscal year depending on the jurisdiction. Foreign taxes are provided for based on the Fund's understanding of the tax rules and rates that exist in the foreign markets in which it invests.
Distributions are declared and recorded on the ex-dividend date. Income and capital gain distributions are declared separately for each class. Income and capital gain distributions are determined in accordance with income tax regulations, which may differ from GAAP. In addition, the Fund claimed a portion of the payment made to redeeming shareholders as a distribution for income tax purposes.
Capital accounts within the financial statements are adjusted for permanent book-tax differences. These adjustments have no impact on net assets or the results of operations. Capital accounts are not adjusted for temporary book-tax differences which will reverse in a subsequent period.
Book-tax differences are primarily due to foreign currency transactions, passive foreign investment companies (PFIC), deferred trustees compensation, capital loss carryforwards and losses deferred due to wash sales.
As of period end, the cost and unrealized appreciation (depreciation) in securities, and derivatives if applicable, for federal income tax purposes were as follows:
| Gross unrealized appreciation | $116,986,520 |
| Gross unrealized depreciation | (46,143,930) |
| Net unrealized appreciation (depreciation) | $70,842,590 |
| Tax Cost | $412,838,578 |
The tax-based components of distributable earnings as of period end were as follows:
| Undistributed ordinary income | $8,508,720 |
| Capital loss carryforward | $(101,811,992) |
| Net unrealized appreciation (depreciation) on securities and other investments | $70,832,500 |
Capital loss carryforwards are only available to offset future capital gains of the Fund to the extent provided by regulations and may be limited. Under the Regulated Investment Company Modernization Act of 2010 (the Act), the Fund is permitted to carry forward capital losses incurred in taxable years beginning after December 22, 2010 for an unlimited period and such capital losses are required to be used prior to any losses that expire. The capital loss carryforward information presented below, including any applicable limitation, is estimated as of fiscal period end and is subject to adjustment.
| No expiration | |
| Short-term | $(63,666,720) |
| Long-term | (38,145,272) |
| Total capital loss carryforward | $(101,811,992) |
The tax character of distributions paid was as follows:
| October 31, 2018 | October 31, 2017 | |
| Ordinary Income | $9,005,746 | $ 12,697,307 |
Short-Term Trading (Redemption) Fees. Shares held by investors in the Fund less than 90 days may have been subject to a redemption fee equal to 1.50% of the NAV of shares redeemed. All redemption fees, which reduce the proceeds of the shareholder redemption, are retained by the Fund and accounted for as an addition to paid in capital. In November 2017, the Board of Trustees approved the elimination of these redemption fees effective December 18, 2017.
Restricted Securities. The Fund may invest in securities that are subject to legal or contractual restrictions on resale. These securities generally may be resold in transactions exempt from registration or to the public if the securities are registered. Disposal of these securities may involve time-consuming negotiations and expense, and prompt sale at an acceptable price may be difficult. Information regarding restricted securities is included at the end of the Fund's Schedule of Investments.
New Rule Issuance. During August 2018, the U.S. Securities and Exchange Commission issued Final Rule Release No. 33-10532, Disclosure Update and Simplification. This Final Rule includes amendments specific to registered investment companies that are intended to eliminate overlap in disclosure requirements between Regulation S-X and GAAP. In accordance with these amendments, certain line-items in the Fund's financial statements have been combined or removed for the current period as outlined in the table below.
| Financial Statement | Current Line-Item Presentation | Prior Line-Item Presentation |
| Statement of Assets and Liabilities | Total distributable earnings (loss) | Undistributed/Distributions in excess of/Accumulated net investment income (loss) Accumulated/Undistributed net realized gain (loss) Net unrealized appreciation (depreciation) |
| Statement of Changes in Net Assets | N/A - removed | Undistributed/Distributions in excess of/Accumulated net investment income (loss) end of period |
| Statement of Changes in Net Assets | Distributions to shareholders | Distributions to shareholders from net investment income Distributions to shareholders from net realized gain |
| Distributions to Shareholders Note to Financial Statements | Distributions to shareholders | Distributions to shareholders from net investment income Distributions to shareholders from net realized gain |
4. Purchases and Sales of Investments.
Purchases and sales of securities, other than short-term securities, aggregated $297,112,360 and $371,604,371, respectively.
5. Fees and Other Transactions with Affiliates.
Management Fee. Fidelity Management & Research Company (the investment adviser) and its affiliates provide the Fund with investment management related services for which the Fund pays a monthly management fee. The management fee is the sum of an individual fund fee rate that is based on an annual rate of .45% of the Fund's average net assets and an annualized group fee rate that averaged .24% during the period. The group fee rate is based upon the average net assets of all the mutual funds advised by the investment adviser, including any mutual funds previously advised by the investment adviser that are currently advised by Fidelity SelectCo, LLC, an affiliate of the investment adviser. The group fee rate decreases as assets under management increase and increases as assets under management decrease. For the reporting period, the total annual management fee rate was .69% of the Fund's average net assets.
Distribution and Service Plan Fees. In accordance with Rule 12b-1 of the 1940 Act, the Fund has adopted separate Distribution and Service Plans for each class of shares. Certain classes pay Fidelity Distributors Corporation (FDC), an affiliate of the investment adviser, separate Distribution and Service Fees, each of which is based on an annual percentage of each class' average net assets. In addition, FDC may pay financial intermediaries for selling shares of the Fund and providing shareholder support services. For the period, the Distribution and Service Fee rates, total fees and amounts retained by FDC were as follows:
| Distribution Fee | Service Fee | Total Fees | Retained by FDC | |
| Class A | -% | .25% | $42,016 | $94 |
| Class M | .25% | .25% | 30,835 | 349 |
| Class C | .75% | .25% | 44,685 | 1,690 |
| $117,536 | $2,133 |
Sales Load. FDC may receive a front-end sales charge of up to 5.75% for selling Class A shares and 3.50% for selling Class M shares, some of which is paid to financial intermediaries for selling shares of the Fund. Depending on the holding period, FDC may receive contingent deferred sales charges levied on Class A, Class M and Class C redemptions. The deferred sales charges are 1.00% for Class C shares, 1.00% for certain purchases of Class A shares and .25% for certain purchases of Class M shares.
For the period, sales charge amounts retained by FDC were as follows:
| Retained by FDC | |
| Class A | $5,783 |
| Class M | 1,434 |
| Class C(a) | 685 |
| $7,902 |
(a) When Class C shares are initially sold, FDC pays commissions from its own resources to financial intermediaries through which the sales are made.
Transfer Agent Fees. Fidelity Investments Institutional Operations Company, Inc., (FIIOC), an affiliate of the investment adviser, is the transfer, dividend disbursing and shareholder servicing agent for each class of the Fund. FIIOC receives account fees and asset-based fees that vary according to the account size and type of account of the shareholders of the respective classes of the Fund, except for Class Z. FIIOC receives an asset-based fee of Class Z's average net assets. FIIOC pays for typesetting, printing and mailing of shareholder reports, except proxy statements.
For the period, transfer agent fees for each class were as follows:
| Amount | % of Class-Level Average Net Assets | |
| Class A | $50,661 | .30 |
| Class M | 20,143 | .33 |
| Class C | 13,454 | .30 |
| Latin America | 1,287,685 | .24 |
| Class I | 12,517 | .18 |
| Class Z | 4 | .05(a) |
| $1,384,464 |
(a) Annualized
Accounting and Security Lending Fees. Fidelity Service Company, Inc. (FSC), an affiliate of the investment adviser, maintains the Fund's accounting records. The accounting fee is based on the level of average net assets for each month. Under a separate contract, FSC administers the security lending program. The security lending fee is based on the number and duration of lending transactions. For the period, the fees were equivalent to an annual rate of .05%.
Brokerage Commissions. The Fund placed a portion of its portfolio transactions with brokerage firms which are affiliates of the investment adviser. Brokerage commissions are included in net realized gain (loss) and change in net unrealized appreciation (depreciation) in the Statement of Operations. The commissions paid to these affiliated firms were $1,553 for the period.
Interfund Trades. The Fund may purchase from or sell securities to other Fidelity Funds under procedures adopted by the Board. The procedures have been designed to ensure these interfund trades are executed in accordance with Rule 17a-7 of the 1940 Act. Interfund trades are included within the respective purchases and sales amounts shown in the Purchases and Sales of Investments note.
6. Committed Line of Credit.
The Fund participates with other funds managed by the investment adviser or an affiliate in a $4.25 billion credit facility (the "line of credit") to be utilized for temporary or emergency purposes to fund shareholder redemptions or for other short-term liquidity purposes. The Fund has agreed to pay commitment fees on its pro-rata portion of the line of credit, which amounted to $1,644 and is reflected in Miscellaneous expenses on the Statement of Operations. During the period, the Fund did not borrow on this line of credit.
7. Security Lending.
The Fund lends portfolio securities through a lending agent from time to time in order to earn additional income. For equity securities, a lending agent is used and may loan securities to certain qualified borrowers, including Fidelity Capital Markets (FCM), a broker-dealer affiliated with the Fund. On the settlement date of the loan, the Fund receives collateral (in the form of U.S. Treasury obligations, letters of credit and/or cash) against the loaned securities and maintains collateral in an amount not less than 100% of the market value of the loaned securities during the period of the loan. The market value of the loaned securities is determined at the close of business of the Fund and any additional required collateral is delivered to the Fund on the next business day. The Fund or borrower may terminate the loan at any time, and if the borrower defaults on its obligation to return the securities loaned because of insolvency or other reasons, the Fund may apply collateral received from the borrower against the obligation. The Fund may experience delays and costs in recovering the securities loaned. Any cash collateral received is invested in the Fidelity Securities Lending Cash Central Fund. The value of loaned securities and cash collateral at period end are disclosed on the Fund's Statement of Assets and Liabilities. Security lending income represents the income earned on investing cash collateral, less rebates paid to borrowers and any lending agent fees associated with the loan, plus any premium payments received for lending certain types of securities. Security lending income is presented in the Statement of Operations as a component of income from Fidelity Central Funds. Total security lending income during the period amounted to $1,232. During the period, there were no securities loaned to FCM.
8. Expense Reductions.
Commissions paid to certain brokers with whom the investment adviser, or its affiliates, places trades on behalf of the Fund include an amount in addition to trade execution, which may be rebated back to the Fund to offset certain expenses. This amount totaled $131,530 for the period.
In addition, during the period the investment adviser reimbursed and/or waived a portion of fund-level operating expenses in the amount of $5,993.
9. Distributions to Shareholders.
Distributions to shareholders of each class were as follows:
| Year ended October 31, 2018 | Year ended October 31, 2017 | |
| Distributions to shareholders | ||
| Class A | $203,267 | $– |
| Class M | 60,223 | – |
| Class C | 19,813 | – |
| Latin America | 8,592,965 | – |
| Class I | 129,478 | – |
| Total | $9,005,746 | $– |
| From net investment income | ||
| Class A | $– | $361,857 |
| Class M | – | 112,037 |
| Class C | – | 77,689 |
| Latin America | – | 12,063,200 |
| Class I | – | 82,524 |
| Total | $– | $12,697,307 |
10. Share Transactions.
Share transactions for each class were as follows and may contain automatic conversions between classes or exchanges between affiliated funds:
| Shares | Shares | Dollars | Dollars | |
| Year ended October 31, 2018(a) | Year ended October 31, 2017 | Year ended October 31, 2018(a) | Year ended October 31, 2017 | |
| Class A | ||||
| Shares sold | 132,121 | 139,205 | $3,342,334 | $3,031,500 |
| Reinvestment of distributions | 8,149 | 18,202 | 198,340 | 345,275 |
| Shares redeemed | (210,293) | (294,686) | (4,928,726) | (6,569,414) |
| Net increase (decrease) | (70,023) | (137,279) | $(1,388,052) | $(3,192,639) |
| Class M | ||||
| Shares sold | 33,058 | 33,689 | $849,708 | $739,767 |
| Reinvestment of distributions | 2,445 | 5,687 | 59,769 | 108,338 |
| Shares redeemed | (73,856) | (97,619) | (1,749,327) | (2,073,277) |
| Net increase (decrease) | (38,353) | (58,243) | $(839,850) | $(1,225,172) |
| Class C | ||||
| Shares sold | 28,227 | 20,475 | $744,605 | $450,205 |
| Reinvestment of distributions | 727 | 3,179 | 18,055 | 61,288 |
| Shares redeemed | (73,884) | (112,274) | (1,820,603) | (2,414,306) |
| Net increase (decrease) | (44,930) | (88,620) | $(1,057,943) | $(1,902,813) |
| Latin America | ||||
| Shares sold | 4,131,542 | 5,339,360 | $102,336,398 | $120,661,935 |
| Reinvestment of distributions | 339,440 | 610,988 | 8,218,379 | 11,542,194 |
| Shares redeemed | (8,141,607) | (8,575,067) | (192,899,345) | (185,420,867) |
| Net increase (decrease) | (3,670,625) | (2,624,719) | $(82,344,568) | $(53,216,738) |
| Class I | ||||
| Shares sold | 238,869 | 265,874 | $5,842,130 | $6,186,180 |
| Reinvestment of distributions | 4,501 | 3,896 | 108,773 | 73,478 |
| Shares redeemed | (381,644) | (94,860) | (9,010,302) | (2,127,918) |
| Net increase (decrease) | (138,274) | 174,910 | $(3,059,399) | $4,131,740 |
| Class Z | ||||
| Shares sold | 6,615 | – | $143,661 | $– |
| Net increase (decrease) | 6,615 | – | $143,661 | $– |
(a) Share transactions for Class Z are for the period October 2, 2018 (commencement of sale of shares) to October 31, 2018.
11. Other.
The Fund's organizational documents provide former and current trustees and officers with a limited indemnification against liabilities arising in connection with the performance of their duties to the Fund. In the normal course of business, the Fund may also enter into contracts that provide general indemnifications. The Fund's maximum exposure under these arrangements is unknown as this would be dependent on future claims that may be made against the Fund. The risk of material loss from such claims is considered remote.
Fidelity® Nordic Fund
Performance: The Bottom Line
Average annual total return reflects the change in the value of an investment, assuming reinvestment of distributions from dividend income and capital gains (the profits earned upon the sale of securities that have grown in value, if any) and assuming a constant rate of performance each year. The hypothetical investment and the average annual total returns do not reflect the deduction of taxes that a shareholder would pay on fund distributions or the redemption of fund shares. During periods of reimbursement by Fidelity, a fund’s total return will be greater than it would be had the reimbursement not occurred. How a fund did yesterday is no guarantee of how it will do tomorrow.
Average Annual Total Returns
| For the periods ended October 31, 2018 | Past 1 year | Past 5 years | Past 10 years |
| Fidelity® Nordic Fund | (4.80)% | 5.23% | 11.95% |
$10,000 Over 10 Years
Let's say hypothetically that $10,000 was invested in Fidelity® Nordic Fund on October 31, 2008.
The chart shows how the value of your investment would have changed, and also shows how the FTSE® Capped Nordic Index performed over the same period.
Returns for the FTSE® Capped Nordic Index for periods prior to October 1, 2009 (it's inception date) are returns of the uncapped FTSE Nordic Index.
| Period Ending Values | ||
| $30,907 | Fidelity® Nordic Fund | |
| $28,542 | FTSE® Capped Nordic Index | |
Fidelity® Nordic Fund
Management's Discussion of Fund Performance
Market Recap: International equities returned -8.08% for the 12 months ending October 31, 2018, according to the MSCI ACWI (All Country World Index) ex USA Index. A modestly positive first half of the period gave way to a confluence of overwhelmingly negative factors – including escalating trade tension, a surging U.S. dollar, tepid economic growth in Europe, global central bank tightening, concerns about Italy’s budget stalemate with the EU, and weakness in China’s stock market – that yielded a -11% second-half return. The index lost 8% in October alone, its largest monthly drop in more than six years. Among sectors, new-media-infused communications services (-15%) was hit the hardest, while economically sensitive consumer discretionary (-13%), information technology (-12%), financials (-10%), industrials (-9%) and materials (-7%) stocks also fared poorly. Even the more defensive real estate (-9%), utilities (-6%) and consumer staples (-5%) sectors weren’t spared this period. Conversely, elevated crude-oil prices fueled a positive return for energy (+7%), the top-performing sector, followed by the relatively stable-growing health care segment (+2%). Regionally, emerging markets (-12%) fared the worst, hampered by the impact of foreign exchange and concerns about economic weakness in China, India and South Korea. Sluggish growth also pressured shares in continental Europe (-9%). Stocks in Japan (-3%) and the U.K. (-4%) held up better, followed by Canada (-5%) and Asia-Pacific ex Japan (-6%).Comments from Portfolio Manager Andrew Sergeant: For the fiscal year, the fund returned -4.80%, outpacing the -8.58% decline of its sector benchmark, the FTSE Capped Nordic Index. Despite solid economies across the Nordic region, market performance varied widely by country. Norway (+6%) performed best, while Denmark (-15%) was the weakest. Overall, stock selection gave the fund an edge over its benchmark. Choices in consumer discretionary, particularly within the consumer services segment, delivered the biggest boost to the fund's relative result. Stock picks in financials and communication services also added value. The fund's most significant individual contributor on a relative basis was a sizable out-of-benchmark position in Kambi Group, a sports-betting infrastructure firm listed on Sweden's First North stock exchange, with headquarters in Malta. This period, Kambi experienced growth in its profit margins and product pipeline. Elsewhere, the fund's overweighted position in Schibsted, a Norway-based media company that owns one of the world's largest classifieds businesses, also worked out well. I exited the position before period end. Conversely, largely avoiding the top-performing energy sector dragged most on a relative basis. At the stock level, the biggest individual detractor was Sweden’s medical technology firm Getinge, which encountered challenges in its business restructuring.The views expressed above reflect those of the portfolio manager(s) only through the end of the period as stated on the cover of this report and do not necessarily represent the views of Fidelity or any other person in the Fidelity organization. Any such views are subject to change at any time based upon market or other conditions and Fidelity disclaims any responsibility to update such views. These views may not be relied on as investment advice and, because investment decisions for a Fidelity fund are based on numerous factors, may not be relied on as an indication of trading intent on behalf of any Fidelity fund.
Note to Shareholders: Andrew Sergeant became Co-Manager of the fund on May 31, 2018, assuming portfolio management responsibilities while Stefan Lindblad was on a three-month leave of absence. On September 1, 2018, Stefan Lindblad left the firm, leaving Andrew Sergeant as sole manager of the fund.Fidelity® Nordic Fund
Investment Summary (Unaudited)
Geographic Diversification (% of fund's net assets)
| As of October 31, 2018 | ||
| Sweden | 52.8% | |
| Denmark | 15.9% | |
| Finland | 10.0% | |
| Norway | 8.8% | |
| United States of America* | 5.3% | |
| Malta | 3.8% | |
| Bermuda | 2.1% | |
| Canada | 1.3% | |

* Includes Short-Term investments and Net Other Assets (Liabilities).
Percentages are based on country or territory of incorporation and are adjusted for the effect of futures contracts, if applicable.
Asset Allocation as of October 31, 2018
| % of fund's net assets | |
| Stocks | 97.0 |
| Short-Term Investments and Net Other Assets (Liabilities) | 3.0 |
Top Ten Stocks as of October 31, 2018
| % of fund's net assets | |
| Novo Nordisk A/S Series B (Denmark, Pharmaceuticals) | 9.5 |
| Swedbank AB (A Shares) (Sweden, Banks) | 7.7 |
| Telefonaktiebolaget LM Ericsson (B Shares) (Sweden, Communications Equipment) | 5.8 |
| Investor AB (B Shares) (Sweden, Diversified Financial Services) | 4.6 |
| Kambi Group PLC (Malta, Hotels, Restaurants & Leisure) | 3.8 |
| Essity AB Class B (Sweden, Household Products) | 3.6 |
| Skandinaviska Enskilda Banken AB (A Shares) (Sweden, Banks) | 3.6 |
| Equinor ASA (Norway, Oil, Gas & Consumable Fuels) | 3.6 |
| Schibsted ASA (B Shares) (Norway, Media) | 3.2 |
| Olvi PLC (A Shares) (Finland, Beverages) | 3.2 |
| 48.6 |
Top Market Sectors as of October 31, 2018
| % of fund's net assets | |
| Financials | 20.0 |
| Industrials | 18.1 |
| Health Care | 18.0 |
| Consumer Discretionary | 15.6 |
| Consumer Staples | 9.7 |
| Information Technology | 7.5 |
| Energy | 3.6 |
| Communication Services | 3.2 |
| Materials | 1.3 |
Market Sectors may include more than one industry category.
The Fund may invest up to 35% of its total assets in any industry that represents more than 20% of the Nordic market. As of October 31, 2018, the Fund did not have more than 25% of its total assets invested in any one industry.
Fidelity® Nordic Fund
Schedule of Investments October 31, 2018
Showing Percentage of Net Assets
| Common Stocks - 97.0% | |||
| Shares | Value | ||
| Bermuda - 2.1% | |||
| Vostok New Ventures Ltd. (depositary receipt) (a) | 814,271 | $6,193,021 | |
| Canada - 1.3% | |||
| Lundin Mining Corp. (Sweden) | 907,900 | 3,732,339 | |
| Denmark - 15.9% | |||
| A.P. Moller - Maersk A/S Series B | 6,974 | 8,802,656 | |
| Netcompany Group A/S | 12,227 | 404,386 | |
| NNIT A/S (b) | 176,700 | 4,989,631 | |
| Novo Nordisk A/S Series B | 636,200 | 27,475,289 | |
| Scandinavian Tobacco Group A/S (b) | 294,000 | 4,461,173 | |
| TOTAL DENMARK | 46,133,135 | ||
| Finland - 10.0% | |||
| Caverion Corp. (a)(c) | 765,835 | 4,792,512 | |
| Kamux Corp. (c) | 1,050,000 | 7,373,551 | |
| Nokian Tyres PLC | 233,000 | 7,410,521 | |
| Olvi PLC (A Shares) | 280,046 | 9,388,945 | |
| TOTAL FINLAND | 28,965,529 | ||
| Malta - 3.8% | |||
| Kambi Group PLC (a) | 395,511 | 10,956,223 | |
| Norway - 8.8% | |||
| Equinor ASA | 401,800 | 10,452,768 | |
| Schibsted ASA (B Shares) | 297,447 | 9,421,143 | |
| Skandiabanken ASA (b) | 580,091 | 5,780,403 | |
| TOTAL NORWAY | 25,654,314 | ||
| Sweden - 52.8% | |||
| AcadeMedia AB (a)(b) | 954,143 | 4,373,909 | |
| Addlife AB | 227,375 | 5,217,787 | |
| AddTech AB (B Shares) | 369,000 | 7,540,364 | |
| AF AB (B Shares) | 335,400 | 7,194,617 | |
| Arjo AB | 2,182,800 | 7,418,202 | |
| Coor Service Management Holding AB (b) | 389,400 | 2,744,606 | |
| Dustin Group AB (b) | 509,600 | 4,087,425 | |
| Eltel AB (a)(b)(c) | 2,467,623 | 5,352,586 | |
| Essity AB Class B | 461,700 | 10,539,564 | |
| Getinge AB (B Shares) | 719,500 | 7,068,297 | |
| Investor AB (B Shares) | 307,650 | 13,336,548 | |
| Lagercrantz Group AB (B Shares) | 447,800 | 4,408,930 | |
| Momentum Group AB Class B | 323,369 | 3,250,952 | |
| Nobia AB | 667,200 | 4,246,942 | |
| Saab AB (B Shares) | 149,700 | 5,866,194 | |
| Securitas AB (B Shares) | 395,600 | 6,784,876 | |
| Skandinaviska Enskilda Banken AB (A Shares) | 1,011,800 | 10,477,172 | |
| Swedbank AB (A Shares) | 995,099 | 22,411,380 | |
| Swedish Match Co. AB | 76,600 | 3,903,179 | |
| Telefonaktiebolaget LM Ericsson (B Shares) | 1,944,300 | 16,928,550 | |
| TOTAL SWEDEN | 153,152,080 | ||
| United States of America - 2.3% | |||
| Autoliv, Inc. (depositary receipt) | 57,200 | 4,746,691 | |
| Veoneer, Inc. unit (a) | 57,200 | 1,918,616 | |
| TOTAL UNITED STATES OF AMERICA | 6,665,307 | ||
| TOTAL COMMON STOCKS | |||
| (Cost $278,837,928) | 281,451,948 | ||
| Money Market Funds - 3.7% | |||
| Fidelity Cash Central Fund, 2.23% (d) | 8,276,984 | 8,278,639 | |
| Fidelity Securities Lending Cash Central Fund 2.23% (d)(e) | 2,430,931 | 2,431,174 | |
| TOTAL MONEY MARKET FUNDS | |||
| (Cost $10,709,813) | 10,709,813 | ||
| TOTAL INVESTMENT IN SECURITIES - 100.7% | |||
| (Cost $289,547,741) | 292,161,761 | ||
| NET OTHER ASSETS (LIABILITIES) - (0.7)% | (1,977,899) | ||
| NET ASSETS - 100% | $290,183,862 |
Categorizations in the Schedule of Investments are based on country or territory of incorporation.
Legend
(a) Non-income producing
(b) Security exempt from registration under Rule 144A of the Securities Act of 1933. These securities may be resold in transactions exempt from registration, normally to qualified institutional buyers. At the end of the period, the value of these securities amounted to $31,789,733 or 11.0% of net assets.
(c) Security or a portion of the security is on loan at period end.
(d) Affiliated fund that is generally available only to investment companies and other accounts managed by Fidelity Investments. The rate quoted is the annualized seven-day yield of the fund at period end. A complete unaudited listing of the fund's holdings as of its most recent quarter end is available upon request. In addition, each Fidelity Central Fund's financial statements, which are not covered by the Fund's Report of Independent Registered Public Accounting Firm, are available on the SEC's website or upon request.
(e) Investment made with cash collateral received from securities on loan.
Affiliated Central Funds
Information regarding fiscal year to date income earned by the Fund from investments in Fidelity Central Funds is as follows:
| Fund | Income earned |
| Fidelity Cash Central Fund | $60,445 |
| Fidelity Securities Lending Cash Central Fund | 246,903 |
| Total | $307,348 |
Amounts in the income column in the above table include any capital gain distributions from underlying funds, which are presented in the corresponding line-item in the Statement of Operations if applicable.
Other Affiliated Issuers
An affiliated company is a company in which the Fund has ownership of at least 5% of the voting securities. Fiscal year to date transactions with companies which are or were affiliates are as follows:
| Affiliate | Value, beginning of period | Purchases | Sales Proceeds | Dividend Income | Realized Gain (loss) | Change in Unrealized appreciation (depreciation) | Value, end of period |
| Zalaris ASA (A Shares) | $10,024,798 | $-- | $6,510,648 | $135,346 | $(14,954) | $(3,499,196) | $-- |
| Total | $10,024,798 | $-- | $6,510,648 | $135,346 | $(14,954) | $(3,499,196) | $-- |
Investment Valuation
The following is a summary of the inputs used, as of October 31, 2018, involving the Fund's assets and liabilities carried at fair value. The inputs or methodology used for valuing securities may not be an indication of the risk associated with investing in those securities. For more information on valuation inputs, and their aggregation into the levels used below, please refer to the Investment Valuation section in the accompanying Notes to Financial Statements.
| Valuation Inputs at Reporting Date: | ||||
| Description | Total | Level 1 | Level 2 | Level 3 |
| Investments in Securities: | ||||
| Equities: | ||||
| Communication Services | $9,421,143 | $9,421,143 | $-- | $-- |
| Consumer Discretionary | 45,113,878 | 45,113,878 | -- | -- |
| Consumer Staples | 28,292,861 | 28,292,861 | -- | -- |
| Energy | 10,452,768 | 10,452,768 | -- | -- |
| Financials | 58,198,524 | 58,198,524 | -- | -- |
| Health Care | 52,169,206 | 24,693,917 | 27,475,289 | -- |
| Industrials | 52,329,363 | 43,526,707 | 8,802,656 | -- |
| Information Technology | 21,741,866 | 4,813,316 | 16,928,550 | -- |
| Materials | 3,732,339 | 3,732,339 | -- | -- |
| Money Market Funds | 10,709,813 | 10,709,813 | -- | -- |
| Total Investments in Securities: | $292,161,761 | $238,955,266 | $53,206,495 | $-- |
The following is a summary of transfers between Level 1 and Level 2 for the period ended October 31, 2018. Transfers are assumed to have occurred at the beginning of the period, and are primarily attributable to the valuation techniques used for foreign equity securities, as discussed in the accompanying Notes to Financial Statements:
| Transfers | Total |
| Level 1 to Level 2 | $9,065,769 |
| Level 2 to Level 1 | $0 |
See accompanying notes which are an integral part of the financial statements.
Fidelity® Nordic Fund
Financial Statements
Statement of Assets and Liabilities
| October 31, 2018 | ||
| Assets | ||
| Investment in securities, at value (including securities loaned of $2,362,133) — See accompanying schedule: Unaffiliated issuers (cost $278,837,928) | $281,451,948 | |
| Fidelity Central Funds (cost $10,709,813) | 10,709,813 | |
| Total Investment in Securities (cost $289,547,741) | $292,161,761 | |
| Foreign currency held at value (cost $327,248) | 325,982 | |
| Receivable for fund shares sold | 16,466 | |
| Dividends receivable | 435,602 | |
| Distributions receivable from Fidelity Central Funds | 11,837 | |
| Prepaid expenses | 603 | |
| Other receivables | 88 | |
| Total assets | 292,952,339 | |
| Liabilities | ||
| Payable for fund shares redeemed | 39,276 | |
| Accrued management fee | 168,904 | |
| Other affiliated payables | 60,910 | |
| Other payables and accrued expenses | 69,839 | |
| Collateral on securities loaned | 2,429,548 | |
| Total liabilities | 2,768,477 | |
| Net Assets | $290,183,862 | |
| Net Assets consist of: | ||
| Paid in capital | $266,270,361 | |
| Total distributable earnings (loss) | 23,913,501 | |
| Net Assets, for 5,845,599 shares outstanding | $290,183,862 | |
| Net Asset Value, offering price and redemption price per share ($290,183,862 ÷ 5,845,599 shares) | $49.64 |
See accompanying notes which are an integral part of the financial statements.
Statement of Operations
| Year ended October 31, 2018 | ||
| Investment Income | ||
| Dividends | $6,761,662 | |
| Income from Fidelity Central Funds | 307,348 | |
| Income before foreign taxes withheld | 7,069,010 | |
| Less foreign taxes withheld | (944,330) | |
| Total income | 6,124,680 | |
| Expenses | ||
| Management fee | $2,271,092 | |
| Transfer agent fees | 604,952 | |
| Accounting and security lending fees | 172,377 | |
| Custodian fees and expenses | 43,174 | |
| Independent trustees' fees and expenses | 1,662 | |
| Registration fees | 19,856 | |
| Audit | 75,110 | |
| Legal | 871 | |
| Interest | 375 | |
| Miscellaneous | 17,376 | |
| Total expenses before reductions | 3,206,845 | |
| Expense reductions | (3,412) | |
| Total expenses after reductions | 3,203,433 | |
| Net investment income (loss) | 2,921,247 | |
| Realized and Unrealized Gain (Loss) | ||
| Net realized gain (loss) on: | ||
| Investment securities: | ||
| Unaffiliated issuers | 29,501,544 | |
| Fidelity Central Funds | 295 | |
| Other affiliated issuers | (14,954) | |
| Foreign currency transactions | (84,935) | |
| Total net realized gain (loss) | 29,401,950 | |
| Change in net unrealized appreciation (depreciation) on: | ||
| Investment securities: | ||
| Unaffiliated issuers | (43,125,048) | |
| Fidelity Central Funds | 629 | |
| Other affiliated issuers | (3,499,197) | |
| Assets and liabilities in foreign currencies | (3,059) | |
| Total change in net unrealized appreciation (depreciation) | (46,626,675) | |
| Net gain (loss) | (17,224,725) | |
| Net increase (decrease) in net assets resulting from operations | $(14,303,478) |
See accompanying notes which are an integral part of the financial statements.
Statement of Changes in Net Assets
| Year ended October 31, 2018 | Year ended October 31, 2017 | |
| Increase (Decrease) in Net Assets | ||
| Operations | ||
| Net investment income (loss) | $2,921,247 | $3,849,788 |
| Net realized gain (loss) | 29,401,950 | 35,196,984 |
| Change in net unrealized appreciation (depreciation) | (46,626,675) | 31,563,051 |
| Net increase (decrease) in net assets resulting from operations | (14,303,478) | 70,609,823 |
| Distributions to shareholders | (13,759,103) | – |
| Distributions to shareholders from net investment income | – | (5,594,124) |
| Distributions to shareholders from net realized gain | – | (1,032,760) |
| Total distributions | (13,759,103) | (6,626,884) |
| Share transactions | ||
| Proceeds from sales of shares | 18,566,517 | 37,566,439 |
| Reinvestment of distributions | 12,909,432 | 6,272,273 |
| Cost of shares redeemed | (90,024,441) | (161,114,580) |
| Net increase (decrease) in net assets resulting from share transactions | (58,548,492) | (117,275,868) |
| Redemption fees | 47,618 | 20,284 |
| Total increase (decrease) in net assets | (86,563,455) | (53,272,645) |
| Net Assets | ||
| Beginning of period | 376,747,317 | 430,019,962 |
| End of period | $290,183,862 | $376,747,317 |
| Other Information | ||
| Undistributed net investment income end of period | $3,189,679 | |
| Shares | ||
| Sold | 350,130 | 749,494 |
| Issued in reinvestment of distributions | 250,523 | 144,389 |
| Redeemed | (1,688,296) | (3,458,044) |
| Net increase (decrease) | (1,087,643) | (2,564,161) |
See accompanying notes which are an integral part of the financial statements.
Financial Highlights
Fidelity Nordic Fund
| Years ended October 31, | 2018 | 2017 | 2016 | 2015 | 2014 |
| Selected Per–Share Data | |||||
| Net asset value, beginning of period | $54.34 | $45.28 | $44.99 | $43.36 | $43.91 |
| Income from Investment Operations | |||||
| Net investment income (loss)A | .47 | .51 | .64 | .56 | .71 |
| Net realized and unrealized gain (loss) | (3.01) | 9.32 | .27 | 1.06 | 1.35 |
| Total from investment operations | (2.54) | 9.83 | .91 | 1.62 | 2.06 |
| Distributions from net investment income | (.50) | (.65) | (.57) | – | (.83) |
| Distributions from net realized gain | (1.67) | (.12) | (.05) | – | (1.80) |
| Total distributions | (2.17) | (.77) | (.62) | – | (2.63) |
| Redemption fees added to paid in capitalA | .01 | –B | –B | .01 | .02 |
| Net asset value, end of period | $49.64 | $54.34 | $45.28 | $44.99 | $43.36 |
| Total ReturnC | (4.80)% | 22.14% | 1.97% | 3.76% | 4.88% |
| Ratios to Average Net AssetsD,E | |||||
| Expenses before reductions | .98% | .99% | .99% | 1.00% | .99% |
| Expenses net of fee waivers, if any | .97% | .99% | .98% | 1.00% | .99% |
| Expenses net of all reductions | .97% | .96% | .98% | .99% | .98% |
| Net investment income (loss) | .89% | 1.04% | 1.37% | 1.26% | 1.56% |
| Supplemental Data | |||||
| Net assets, end of period (000 omitted) | $290,184 | $376,747 | $430,020 | $405,726 | $487,582 |
| Portfolio turnover rateF | 56% | 69% | 63% | 80% | 103% |
A Calculated based on average shares outstanding during the period.
B Amount represents less than $.005 per share.
C Total returns would have been lower if certain expenses had not been reduced during the applicable periods shown.
D Fees and expenses of any underlying Fidelity Central Funds are not included in the Fund's expense ratio. The Fund indirectly bears its proportionate share of the expenses of any underlying Fidelity Central Funds.
E Expense ratios reflect operating expenses of the Fund. Expenses before reductions do not reflect amounts reimbursed by the investment adviser or reductions from brokerage service arrangements or reductions from other expense offset arrangements and do not represent the amount paid by the Fund during periods when reimbursements or reductions occur. Expenses net of fee waivers reflect expenses after reimbursement by the investment adviser but prior to reductions from brokerage service arrangements or other expense offset arrangements. Expenses net of all reductions represent the net expenses paid by the Fund.
F Amount does not include the portfolio activity of any underlying Fidelity Central Funds.
See accompanying notes which are an integral part of the financial statements.
Notes to Financial Statements
For the period ended October 31, 2018
1. Organization.
Fidelity Nordic Fund (the Fund) is a fund of Fidelity Investment Trust (the Trust) and is authorized to issue an unlimited number of shares. Share transactions on the Statement of Changes in Net Assets may contain exchanges between affiliated funds. The Trust is registered under the Investment Company Act of 1940, as amended (the 1940 Act), as an open-end management investment company organized as a Massachusetts business trust.
2. Investments in Fidelity Central Funds.
The Fund invests in Fidelity Central Funds, which are open-end investment companies generally available only to other investment companies and accounts managed by the investment adviser and its affiliates. The Fund's Schedule of Investments lists each of the Fidelity Central Funds held as of period end, if any, as an investment of the Fund, but does not include the underlying holdings of each Fidelity Central Fund. As an Investing Fund, the Fund indirectly bears its proportionate share of the expenses of the underlying Fidelity Central Funds.
The Money Market Central Funds seek preservation of capital and current income and are managed by Fidelity Investments Money Management, Inc. (FIMM), an affiliate of the investment adviser. Annualized expenses of the Money Market Central Funds as of their most recent shareholder report date are less than .005%.
A complete unaudited list of holdings for each Fidelity Central Fund is available upon request or at the Securities and Exchange Commission (the SEC) website at www.sec.gov. In addition, the financial statements of the Fidelity Central Funds, which are not covered by the Fund's Report of Independent Registered Public Accounting Firm, are available on the SEC website or upon request.
3. Significant Accounting Policies.
The Fund is an investment company and applies the accounting and reporting guidance of the Financial Accounting Standards Board (FASB) Accounting Standards Codification Topic 946 Financial Services – Investments Companies. The financial statements have been prepared in conformity with accounting principles generally accepted in the United States of America (GAAP), which require management to make certain estimates and assumptions at the date of the financial statements. Actual results could differ from those estimates. Subsequent events, if any, through the date that the financial statements were issued have been evaluated in the preparation of the financial statements. The following summarizes the significant accounting policies of the Fund:
Investment Valuation. Investments are valued as of 4:00 p.m. Eastern time on the last calendar day of the period. The Board of Trustees (the Board) has delegated the day to day responsibility for the valuation of the Fund's investments to the Fair Value Committee (the Committee) established by the Fund's investment adviser. In accordance with valuation policies and procedures approved by the Board, the Fund attempts to obtain prices from one or more third party pricing vendors or brokers to value its investments. When current market prices, quotations or currency exchange rates are not readily available or reliable, investments will be fair valued in good faith by the Committee, in accordance with procedures adopted by the Board. Factors used in determining fair value vary by investment type and may include market or investment specific events. The frequency with which these procedures are used cannot be predicted and they may be utilized to a significant extent. The Committee oversees the Fund's valuation policies and procedures and reports to the Board on the Committee's activities and fair value determinations. The Board monitors the appropriateness of the procedures used in valuing the Fund's investments and ratifies the fair value determinations of the Committee.
The Fund categorizes the inputs to valuation techniques used to value its investments into a disclosure hierarchy consisting of three levels as shown below:
- Level 1 – quoted prices in active markets for identical investments
- Level 2 – other significant observable inputs (including quoted prices for similar investments, interest rates, prepayment speeds, etc.)
- Level 3 – unobservable inputs (including the Fund's own assumptions based on the best information available)
Valuation techniques used to value the Fund's investments by major category are as follows:
Equity securities, including restricted securities, for which market quotations are readily available, are valued at the last reported sale price or official closing price as reported by a third party pricing vendor on the primary market or exchange on which they are traded and are categorized as Level 1 in the hierarchy. In the event there were no sales during the day or closing prices are not available, securities are valued at the last quoted bid price or may be valued using the last available price and are generally categorized as Level 2 in the hierarchy. For foreign equity securities, when market or security specific events arise, comparisons to the valuation of American Depositary Receipts (ADRs), futures contracts, Exchange-Traded Funds (ETFs) and certain indexes as well as quoted prices for similar securities may be used and would be categorized as Level 2 in the hierarchy. Utilizing these techniques may result in transfers between Level 1 and Level 2. For equity securities, including restricted securities, where observable inputs are limited, assumptions about market activity and risk are used and these securities may be categorized as Level 3 in the hierarchy. Equity securities, including restricted securities, for which observable inputs are not available are valued using alternate valuation approaches, including the market approach and the income approach and are categorized as Level 3 in the hierarchy.
Investments in open-end mutual funds, including the Fidelity Central Funds, are valued at their closing net asset value (NAV) each business day and are categorized as Level 1 in the hierarchy.
Changes in valuation techniques may result in transfers in or out of an assigned level within the disclosure hierarchy. The aggregate value of investments by input level as of October 31, 2018, including information on transfers between Levels 1 and 2, is included at the end of the Fund's Schedule of Investments.
Foreign Currency. The Fund may use foreign currency contracts to facilitate transactions in foreign-denominated securities. Gains and losses from these transactions may arise from changes in the value of the foreign currency or if the counterparties do not perform under the contracts' terms.
Foreign-denominated assets, including investment securities, and liabilities are translated into U.S. dollars at the exchange rates at period end. Purchases and sales of investment securities, income and dividends received and expenses denominated in foreign currencies are translated into U.S. dollars at the exchange rate in effect on the transaction date.
The effects of exchange rate fluctuations on investments are included with the net realized and unrealized gain (loss) on investment securities. Other foreign currency transactions resulting in realized and unrealized gain (loss) are disclosed separately.
Investment Transactions and Income. For financial reporting purposes, the Fund's investment holdings and NAV include trades executed through the end of the last business day of the period. The NAV per share for processing shareholder transactions is calculated as of the close of business of the New York Stock Exchange (NYSE), normally 4:00 p.m. Eastern time and includes trades executed through the end of the prior business day. Gains and losses on securities sold are determined on the basis of identified cost. Dividend income is recorded on the ex-dividend date, except for certain dividends from foreign securities where the ex-dividend date may have passed, which are recorded as soon as the Fund is informed of the ex-dividend date. Non-cash dividends included in dividend income, if any, are recorded at the fair market value of the securities received. Income and capital gain distributions from Fidelity Central Funds, if any, are recorded on the ex-dividend date. Investment income is recorded net of foreign taxes withheld where recovery of such taxes is uncertain.
Expenses. Expenses directly attributable to a fund are charged to that fund. Expenses attributable to more than one fund are allocated among the respective funds on the basis of relative net assets or other appropriate methods. Expense estimates are accrued in the period to which they relate and adjustments are made when actual amounts are known.
Income Tax Information and Distributions to Shareholders. Each year, the Fund intends to qualify as a regulated investment company under Subchapter M of the Internal Revenue Code, including distributing substantially all of its taxable income and realized gains. As a result, no provision for U.S. Federal income taxes is required. As of October 31, 2018, the Fund did not have any unrecognized tax benefits in the financial statements; nor is the Fund aware of any tax positions for which it is reasonably possible that the total amounts of unrecognized tax benefits will significantly change in the next twelve months. The Fund files a U.S. federal tax return, in addition to state and local tax returns as required. The Fund's federal income tax returns are subject to examination by the Internal Revenue Service (IRS) for a period of three fiscal years after they are filed. State and local tax returns may be subject to examination for an additional fiscal year depending on the jurisdiction. Foreign taxes are provided for based on the Fund's understanding of the tax rules and rates that exist in the foreign markets in which it invests.
Distributions are declared and recorded on the ex-dividend date. Income and capital gain distributions are determined in accordance with income tax regulations, which may differ from GAAP. In addition, the Fund claimed a portion of the payment made to redeeming shareholders as a distribution for income tax purposes.
Capital accounts within the financial statements are adjusted for permanent book-tax differences. These adjustments have no impact on net assets or the results of operations. Capital accounts are not adjusted for temporary book-tax differences which will reverse in a subsequent period.
Book-tax differences are primarily due to foreign currency transactions, passive foreign investment companies (PFIC), deferred trustees compensation and losses deferred due to wash sales.
As of period end, the cost and unrealized appreciation (depreciation) in securities, and derivatives if applicable, for federal income tax purposes were as follows:
| Gross unrealized appreciation | $26,041,498 |
| Gross unrealized depreciation | (28,526,817) |
| Net unrealized appreciation (depreciation) | $(2,485,319) |
| Tax Cost | $294,647,080 |
The tax-based components of distributable earnings as of period end were as follows:
| Undistributed ordinary income | $5,978,827 |
| Undistributed long-term capital gain | $20,419,164 |
| Net unrealized appreciation (depreciation) on securities and other investments | $(2,484,489) |
The tax character of distributions paid was as follows:
| October 31, 2018 | October 31, 2017 | |
| Ordinary Income | $10,195,686 | $ 6,626,884 |
| Long-term Capital Gains | 3,563,417 | - |
| Total | $13,759,103 | $ 6,626,884 |
Short-Term Trading (Redemption) Fees. Shares held by investors in the Fund less than 90 days may have been subject to a redemption fee equal to 1.50% of the NAV of shares redeemed. All redemption fees, which reduce the proceeds of the shareholder redemption, are retained by the Fund and accounted for as an addition to paid in capital. In November 2017, the Board of Trustees approved the elimination of these redemption fees effective December 18, 2017.
Restricted Securities. The Fund may invest in securities that are subject to legal or contractual restrictions on resale. These securities generally may be resold in transactions exempt from registration or to the public if the securities are registered. Disposal of these securities may involve time-consuming negotiations and expense, and prompt sale at an acceptable price may be difficult. Information regarding restricted securities is included at the end of the Fund's Schedule of Investments.
New Rule Issuance. During August 2018, the U.S. Securities and Exchange Commission issued Final Rule Release No. 33-10532, Disclosure Update and Simplification. This Final Rule includes amendments specific to registered investment companies that are intended to eliminate overlap in disclosure requirements between Regulation S-X and GAAP. In accordance with these amendments, certain line-items in the Fund's financial statements have been combined or removed for the current period as outlined in the table below.
| Financial Statement | Current Line-Item Presentation | Prior Line-Item Presentation |
| Statement of Assets and Liabilities | Total distributable earnings (loss) | Undistributed/Distributions in excess of/Accumulated net investment income (loss) Accumulated/Undistributed net realized gain (loss) Net unrealized appreciation (depreciation) |
| Statement of Changes in Net Assets | N/A - removed | Undistributed/Distributions in excess of/Accumulated net investment income (loss) end of period |
| Statement of Changes in Net Assets | Distributions to shareholders | Distributions to shareholders from net investment income Distributions to shareholders from net realized gain |
4. Purchases and Sales of Investments.
Purchases and sales of securities, other than short-term securities, aggregated $182,575,413 and $241,480,448, respectively.
5. Fees and Other Transactions with Affiliates.
Management Fee. Fidelity Management & Research Company (the investment adviser) and its affiliates provide the Fund with investment management related services for which the Fund pays a monthly management fee. The management fee is the sum of an individual fund fee rate that is based on an annual rate of .45% of the Fund's average net assets and an annualized group fee rate that averaged .24% during the period. The group fee rate is based upon the average net assets of all the mutual funds advised by the investment adviser, including any mutual funds previously advised by the investment adviser that are currently advised by Fidelity SelectCo, LLC, an affiliate of the investment adviser. The group fee rate decreases as assets under management increase and increases as assets under management decrease. For the reporting period, the total annual management fee rate was .69% of the Fund's average net assets.
Transfer Agent Fees. Fidelity Investments Institutional Operations Company, Inc. (FIIOC), an affiliate of the investment adviser, is the Fund's transfer, dividend disbursing and shareholder servicing agent. FIIOC receives account fees and asset-based fees that vary according to account size and type of account. FIIOC pays for typesetting, printing and mailing of shareholder reports, except proxy statements. For the period, the transfer agent fees were equivalent to an annual rate of .18% of average net assets.
Accounting and Security Lending Fees. Fidelity Service Company, Inc. (FSC), an affiliate of the investment adviser, maintains the Fund's accounting records. The accounting fee is based on the level of average net assets for each month. Under a separate contract, FSC administers the security lending program. The security lending fee is based on the number and duration of lending transactions. For the period, the fees were equivalent to an annual rate of .05%.
Interfund Lending Program. Pursuant to an Exemptive Order issued by the SEC, the Fund, along with other registered investment companies having management contracts with Fidelity Management & Research Company (FMR) or other affiliated entities of FMR, may participate in an interfund lending program. This program provides an alternative credit facility allowing the funds to borrow from, or lend money to, other participating affiliated funds. At period end, there were no interfund loans outstanding. The Fund's activity in this program during the period for which loans were outstanding was as follows:
| Borrower or Lender | Average Loan Balance | Weighted Average Interest Rate | Interest Expense |
| Borrower | $3,132,000 | 2.16% | $375 |
Interfund Trades. The Fund may purchase from or sell securities to other Fidelity Funds under procedures adopted by the Board. The procedures have been designed to ensure these interfund trades are executed in accordance with Rule 17a-7 of the 1940 Act. Interfund trades are included within the respective purchases and sales amounts shown in the Purchases and Sales of Investments note.
6. Committed Line of Credit.
The Fund participates with other funds managed by the investment adviser or an affiliate in a $4.25 billion credit facility (the "line of credit") to be utilized for temporary or emergency purposes to fund shareholder redemptions or for other short-term liquidity purposes. The Fund has agreed to pay commitment fees on its pro-rata portion of the line of credit, which amounted to $924 and is reflected in Miscellaneous expenses on the Statement of Operations. During the period, the Fund did not borrow on this line of credit.
7. Security Lending.
The Fund lends portfolio securities through a lending agent from time to time in order to earn additional income. For equity securities, a lending agent is used and may loan securities to certain qualified borrowers, including Fidelity Capital Markets (FCM), a broker-dealer affiliated with the Fund. On the settlement date of the loan, the Fund receives collateral (in the form of U.S. Treasury obligations, letters of credit and/or cash) against the loaned securities and maintains collateral in an amount not less than 100% of the market value of the loaned securities during the period of the loan. The market value of the loaned securities is determined at the close of business of the Fund and any additional required collateral is delivered to the Fund on the next business day. The Fund or borrower may terminate the loan at any time, and if the borrower defaults on its obligation to return the securities loaned because of insolvency or other reasons, the Fund may apply collateral received from the borrower against the obligation. The Fund may experience delays and costs in recovering the securities loaned. Any cash collateral received is invested in the Fidelity Securities Lending Cash Central Fund. The value of loaned securities and cash collateral at period end are disclosed on the Fund's Statement of Assets and Liabilities. Security lending income represents the income earned on investing cash collateral, less rebates paid to borrowers and any lending agent fees associated with the loan, plus any premium payments received for lending certain types of securities. Security lending income is presented in the Statement of Operations as a component of income from Fidelity Central Funds. Total security lending income during the period amounted to $246,903. During the period, there were no securities loaned to FCM.
8. Expense Reductions.
During the period the investment adviser reimbursed and/or waived a portion of operating expenses in the amount of $3,412.
9. Other.
The Fund's organizational documents provide former and current trustees and officers with a limited indemnification against liabilities arising in connection with the performance of their duties to the Fund. In the normal course of business, the Fund may also enter into contracts that provide general indemnifications. The Fund's maximum exposure under these arrangements is unknown as this would be dependent on future claims that may be made against the Fund. The risk of material loss from such claims is considered remote.
Fidelity® Pacific Basin Fund
Performance: The Bottom Line
Average annual total return reflects the change in the value of an investment, assuming reinvestment of distributions from dividend income and capital gains (the profits earned upon the sale of securities that have grown in value, if any) and assuming a constant rate of performance each year. The hypothetical investment and the average annual total returns do not reflect the deduction of taxes that a shareholder would pay on fund distributions or the redemption of fund shares. During periods of reimbursement by Fidelity, a fund’s total return will be greater than it would be had the reimbursement not occurred. How a fund did yesterday is no guarantee of how it will do tomorrow.
Average Annual Total Returns
| For the periods ended October 31, 2018 | Past 1 year | Past 5 years | Past 10 years |
| Fidelity® Pacific Basin Fund | (13.24)% | 5.27% | 13.59% |
$10,000 Over 10 Years
Let's say hypothetically that $10,000 was invested in Fidelity® Pacific Basin Fund on October 31, 2008.
The chart shows how the value of your investment would have changed, and also shows how the MSCI AC (All Country) Pacific Index performed over the same period.
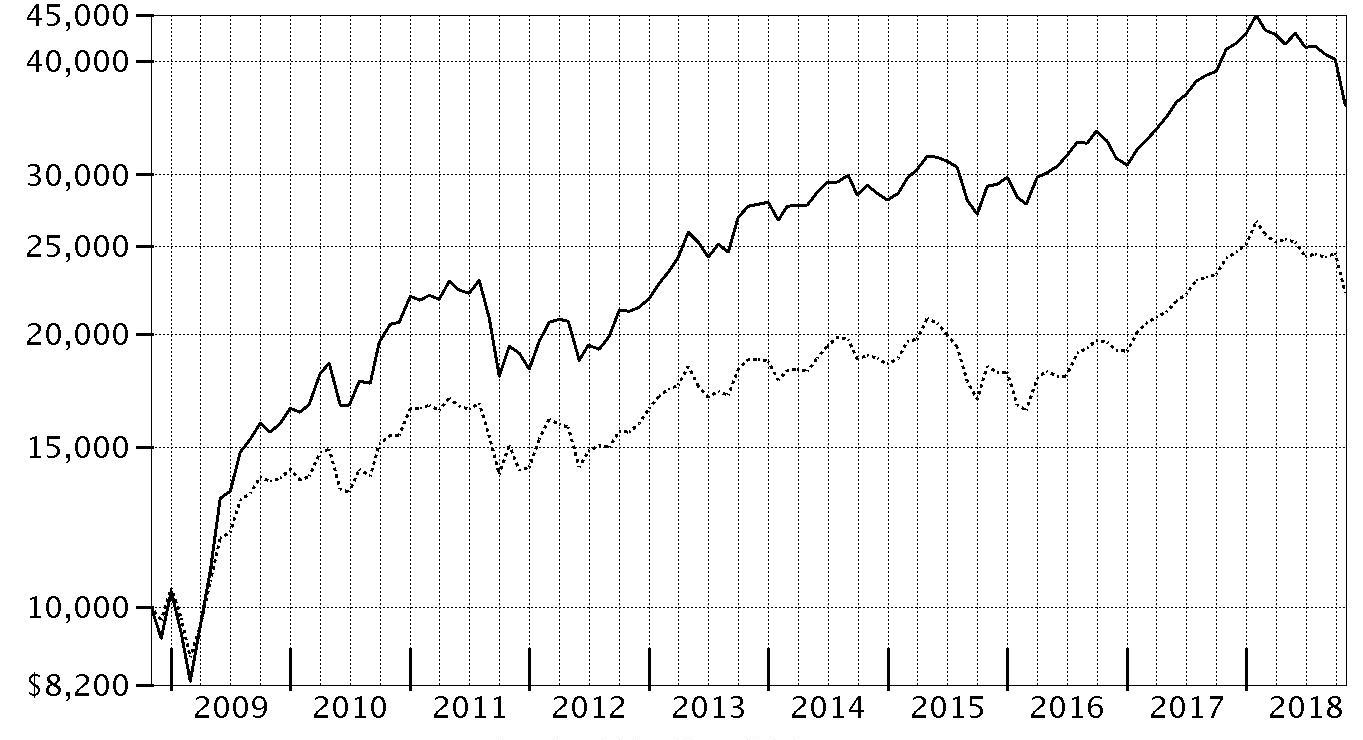
| Period Ending Values | ||
| $35,753 | Fidelity® Pacific Basin Fund | |
| $22,162 | MSCI AC (All Country) Pacific Index | |
Fidelity® Pacific Basin Fund
Management's Discussion of Fund Performance
Market Recap: International equities returned -8.08% for the 12 months ending October 31, 2018, according to the MSCI ACWI (All Country World Index) ex USA Index. A modestly positive first half of the period gave way to a confluence of overwhelmingly negative factors – including escalating trade tensions, a surging U.S. dollar, tepid economic growth in Europe, global central bank tightening, concerns about Italy’s budget stalemate with the EU, and weakness in China’s stock market. The index lost 8% in October alone, its largest monthly drop in more than six years. Among sectors, communications services (-15%) was hit the hardest, while economically sensitive consumer discretionary (-13%), information technology (-12%), financials (-10%), industrials (-9%) and materials (-7%) stocks also fared poorly. Even the more defensive real estate (-9%), utilities (-6%) and consumer staples (-5%) sectors weren’t spared this period. Conversely, elevated crude-oil prices fueled a positive return for energy (+7%), the top-performing sector, followed by the relatively stable-growing health care segment (+2%). Regionally, emerging markets (-12%) fared the worst, hampered by the impact of foreign exchange and concerns about economic weakness in China, India and South Korea. Sluggish growth also pressured shares in continental Europe (-9%). Stocks in Japan (-3%) and the U.K. (-4%) held up better, followed by Canada (-5%) and Asia-Pacific ex Japan (-6%).Comments from Portfolio Manager John Dance: For the year, the fund returned -13.24%, considerably lagging the -8.63% return of the benchmark MSCI AC (All Country) Pacific Free Index. Stock selection drove the fund’s underperformance of the benchmark, especially in the consumer staples, financials and communication services sectors. Choices in Australia, Japan and China detracted notably, as did a non-benchmark allocation to India. An out-of-benchmark position in Australia-based Blue Sky Alternative Investments detracted most on a relative basis. A non-benchmark position in BWX– an Australia-based company providing natural skin care products – also detracted, as did the fund’s largest position, China’s Tencent Holdings. Conversely, a large overweighting in the health care sector added value. Stock picking in materials also contributed, and the fund’s cash position provided some ballast in a weak market environment. A sizable underweighting in South Korea, positioning in New Zealand and out-of-benchmark exposure to the United States added to relative performance. Among individual holdings, our top relative contributor was Japan-based Nakanishi, a manufacturer of dental equipment. I considered Nakanishi a high-quality business with dominant market share and strong fundamentalsThe views expressed above reflect those of the portfolio manager(s) only through the end of the period as stated on the cover of this report and do not necessarily represent the views of Fidelity or any other person in the Fidelity organization. Any such views are subject to change at any time based upon market or other conditions and Fidelity disclaims any responsibility to update such views. These views may not be relied on as investment advice and, because investment decisions for a Fidelity fund are based on numerous factors, may not be relied on as an indication of trading intent on behalf of any Fidelity fund.
Fidelity® Pacific Basin Fund
Investment Summary (Unaudited)
Geographic Diversification (% of fund's net assets)
| As of October 31, 2018 | ||
| Japan | 36.1% | |
| Australia | 14.1% | |
| Cayman Islands | 8.6% | |
| United States of America* | 8.2% | |
| India | 7.4% | |
| China | 6.6% | |
| Taiwan | 4.8% | |
| Hong Kong | 3.2% | |
| Korea (South) | 3.0% | |
| Other | 8.0% | |
* Includes Short-Term investments and Net Other Assets (Liabilities).
Percentages are based on country or territory of incorporation and are adjusted for the effect of futures contracts, if applicable.
Asset Allocation as of October 31, 2018
| % of fund's net assets | |
| Stocks | 92.7 |
| Short-Term Investments and Net Other Assets (Liabilities) | 7.3 |
Top Ten Stocks as of October 31, 2018
| % of fund's net assets | |
| Tencent Holdings Ltd. (Cayman Islands, Interactive Media & Services) | 3.7 |
| Taiwan Semiconductor Manufacturing Co. Ltd. (Taiwan, Semiconductors & Semiconductor Equipment) | 3.6 |
| Alibaba Group Holding Ltd. sponsored ADR (Cayman Islands, Internet & Direct Marketing Retail) | 3.3 |
| SoftBank Corp. (Japan, Wireless Telecommunication Services) | 2.4 |
| AIA Group Ltd. (Hong Kong, Insurance) | 2.1 |
| Keyence Corp. (Japan, Electronic Equipment & Components) | 2.0 |
| Kweichow Moutai Co. Ltd. (A Shares) (China, Beverages) | 1.7 |
| Commonwealth Bank of Australia (Australia, Banks) | 1.6 |
| Kao Corp. (Japan, Personal Products) | 1.6 |
| Shionogi & Co. Ltd. (Japan, Pharmaceuticals) | 1.6 |
| 23.6 |
Top Market Sectors as of October 31, 2018
| % of fund's net assets | |
| Financials | 17.4 |
| Consumer Discretionary | 16.1 |
| Industrials | 11.7 |
| Health Care | 10.8 |
| Information Technology | 10.7 |
| Communication Services | 9.9 |
| Consumer Staples | 7.6 |
| Real Estate | 2.6 |
| Energy | 2.5 |
| Materials | 1.9 |
Fidelity® Pacific Basin Fund
Schedule of Investments October 31, 2018
Showing Percentage of Net Assets
| Common Stocks - 91.7% | |||
| Shares | Value | ||
| Australia - 14.1% | |||
| Amcor Ltd. | 920,628 | $8,670,838 | |
| Arena (REIT) unit | 2,521,652 | 3,874,986 | |
| Aristocrat Leisure Ltd. | 351,724 | 6,600,444 | |
| Australia & New Zealand Banking Group Ltd. | 418,760 | 7,689,409 | |
| Blue Sky Alternative Investments Ltd. (a) | 1,733,447 | 1,485,324 | |
| BWX Ltd. (b) | 2,040,551 | 3,670,341 | |
| Commonwealth Bank of Australia | 271,245 | 13,297,847 | |
| CSL Ltd. | 93,517 | 12,450,124 | |
| Hansen Technologies Ltd. | 2,942,633 | 7,210,036 | |
| HUB24 Ltd. (b) | 1,082,172 | 8,782,258 | |
| Magellan Financial Group Ltd. | 370,933 | 6,997,694 | |
| Netwealth Group Ltd. (b) | 981,833 | 4,866,995 | |
| NIB Holdings Ltd. | 1,697,835 | 6,660,863 | |
| realestate.com.au Ltd. | 164,288 | 8,332,310 | |
| SpeedCast International Ltd. | 1,171,597 | 2,986,799 | |
| Woodside Petroleum Ltd. | 418,235 | 10,321,633 | |
| TOTAL AUSTRALIA | 113,897,901 | ||
| Bermuda - 0.6% | |||
| Hongkong Land Holdings Ltd. | 875,100 | 5,180,592 | |
| Cayman Islands - 8.6% | |||
| Alibaba Group Holding Ltd. sponsored ADR (a) | 184,600 | 26,264,888 | |
| China High Precision Automation Group Ltd. (a)(c) | 1,875,000 | 2 | |
| China Metal Recycling (Holdings) Ltd. (a)(c) | 2,572,200 | 3 | |
| International Housewares Retail Co. Ltd. | 18,103,700 | 3,809,143 | |
| SITC International Holdings Co. Ltd. | 3,415,000 | 2,508,356 | |
| Tencent Holdings Ltd. | 878,500 | 30,096,763 | |
| ZTO Express (Cayman), Inc. sponsored ADR | 407,700 | 6,612,894 | |
| TOTAL CAYMAN ISLANDS | 69,292,049 | ||
| China - 6.6% | |||
| Gree Electric Appliances, Inc. of Zhuhai Class A (a) | 722,194 | 3,940,379 | |
| Hangzhou Tigermed Consulting Co. Ltd. Class A | 607,400 | 3,710,237 | |
| Jiangsu Yanghe Brewery Joint-Stock Co. Ltd. Class A | 2,454 | 31,095 | |
| Kweichow Moutai Co. Ltd. (A Shares) | 179,050 | 14,089,088 | |
| Midea Group Co. Ltd. Class A | 773,400 | 4,106,676 | |
| Shanghai International Airport Co. Ltd. (A Shares) | 951,913 | 6,761,705 | |
| Shenzhen Expressway Co. (H Shares) | 6,230,000 | 5,727,950 | |
| Sinopec Engineering Group Co. Ltd. (H Shares) | 4,098,500 | 3,810,030 | |
| Tonghua Dongbao Pharmaceutical Co. Ltd. Class A | 2,349,725 | 4,507,009 | |
| Yunnan Baiyao Group Co. Ltd. (c) | 622,433 | 6,266,580 | |
| TOTAL CHINA | 52,950,749 | ||
| Hong Kong - 3.2% | |||
| AIA Group Ltd. | 2,285,400 | 17,296,526 | |
| Dah Sing Banking Group Ltd. | 1,474,400 | 2,801,415 | |
| Techtronic Industries Co. Ltd. | 1,282,000 | 5,999,707 | |
| TOTAL HONG KONG | 26,097,648 | ||
| India - 7.4% | |||
| Axis Bank Ltd. (a) | 889,398 | 7,003,588 | |
| Bharti Infratel Ltd. | 26 | 95 | |
| CCL Products (India) Ltd. | 947,967 | 3,244,698 | |
| Future Retail Ltd. | 884,560 | 5,850,223 | |
| HDFC Asset Management Co. Ltd. (a) | 1,563 | 29,597 | |
| HDFC Bank Ltd. | 357,266 | 9,274,720 | |
| Housing Development Finance Corp. Ltd. | 400,284 | 9,575,480 | |
| Indraprastha Gas Ltd. | 1,891,000 | 6,834,293 | |
| Oberoi Realty Ltd. | 352,703 | 2,018,886 | |
| Power Grid Corp. of India Ltd. | 2,095,260 | 5,267,896 | |
| Reliance Industries Ltd. | 670,175 | 9,616,323 | |
| TCNS Clothing Co. Ltd. (a) | 118,001 | 986,001 | |
| TOTAL INDIA | 59,701,800 | ||
| Indonesia - 2.3% | |||
| PT Bank Central Asia Tbk | 6,827,600 | 10,621,460 | |
| PT Bank Rakyat Indonesia Tbk | 36,419,000 | 7,546,117 | |
| TOTAL INDONESIA | 18,167,577 | ||
| Israel - 0.2% | |||
| Sarine Technologies Ltd. | 4,391,400 | 1,696,133 | |
| Japan - 36.1% | |||
| Arata Corp. | 116,100 | 5,268,153 | |
| Bank of Kyoto Ltd. | 101,100 | 4,560,633 | |
| Coca-Cola West Co. Ltd. | 157,300 | 4,119,480 | |
| Create SD Holdings Co. Ltd. | 211,800 | 5,374,072 | |
| Fukushima Industries Corp. | 135,700 | 6,181,575 | |
| Harmonic Drive Systems, Inc. (b) | 130,000 | 3,957,549 | |
| Hoya Corp. | 202,400 | 11,505,239 | |
| Kao Corp. | 194,100 | 12,911,964 | |
| Keyence Corp. | 33,000 | 16,173,173 | |
| Minebea Mitsumi, Inc. | 428,500 | 6,555,204 | |
| Misumi Group, Inc. | 219,000 | 4,398,050 | |
| Morinaga & Co. Ltd. | 124,700 | 5,011,871 | |
| Murata Manufacturing Co. Ltd. | 43,400 | 6,602,216 | |
| Nakanishi, Inc. | 354,300 | 8,298,976 | |
| Nidec Corp. | 80,500 | 10,337,617 | |
| Nifco, Inc. | 243,500 | 5,548,265 | |
| Nihon M&A Center, Inc. | 148,700 | 3,567,429 | |
| Nintendo Co. Ltd. | 29,900 | 9,334,866 | |
| Nissan Chemical Corp. | 136,000 | 6,412,575 | |
| Nitori Holdings Co. Ltd. | 86,700 | 11,322,059 | |
| NSD Co. Ltd. | 229,200 | 4,862,895 | |
| Open House Co. Ltd. | 101,800 | 4,001,267 | |
| ORIX Corp. | 665,600 | 10,859,836 | |
| PALTAC Corp. | 140,100 | 7,151,823 | |
| Panasonic Corp. | 839,900 | 9,013,350 | |
| Paramount Bed Holdings Co. Ltd. | 91,900 | 3,872,774 | |
| Pilot Corp. | 114,300 | 6,321,017 | |
| ProNexus, Inc. | 219,200 | 2,131,098 | |
| Recruit Holdings Co. Ltd. | 253,000 | 6,790,417 | |
| Ryohin Keikaku Co. Ltd. | 27,800 | 7,344,512 | |
| Shionogi & Co. Ltd. | 200,200 | 12,801,531 | |
| SMC Corp. | 27,400 | 8,778,393 | |
| SMS Co., Ltd. | 238,800 | 4,002,045 | |
| SoftBank Corp. | 247,800 | 19,610,599 | |
| Subaru Corp. | 341,100 | 9,201,069 | |
| Terumo Corp. | 65,000 | 3,508,826 | |
| Toto Ltd. | 125,000 | 4,472,033 | |
| Tsuruha Holdings, Inc. | 75,400 | 7,858,413 | |
| Zozo, Inc. | 494,500 | 11,916,032 | |
| TOTAL JAPAN | 291,938,896 | ||
| Korea (South) - 2.0% | |||
| Cafe24 Corp. (a) | 31,045 | 3,006,549 | |
| KB Financial Group, Inc. | 120,700 | 5,020,070 | |
| SK Hynix, Inc. | 138,268 | 8,264,573 | |
| TOTAL KOREA (SOUTH) | 16,291,192 | ||
| Multi-National - 1.2% | |||
| HKT Trust/HKT Ltd. unit | 7,118,000 | 9,802,970 | |
| New Zealand - 1.6% | |||
| EBOS Group Ltd. | 408,279 | 5,552,244 | |
| Ryman Healthcare Group Ltd. | 925,540 | 7,307,930 | |
| TOTAL NEW ZEALAND | 12,860,174 | ||
| Philippines - 0.7% | |||
| Ayala Land, Inc. | 7,564,600 | 5,612,897 | |
| Taiwan - 4.8% | |||
| Taiwan Semiconductor Manufacturing Co. Ltd. | 3,882,000 | 29,127,184 | |
| United Microelectronics Corp. | 8,567,000 | 3,262,881 | |
| Voltronic Power Technology Corp. | 380,703 | 6,142,057 | |
| TOTAL TAIWAN | 38,532,122 | ||
| Thailand - 1.4% | |||
| Bangkok Bank PCL (For. Reg.) | 1,007,600 | 6,441,834 | |
| Thai Beverage PCL | 10,609,900 | 4,787,343 | |
| TOTAL THAILAND | 11,229,177 | ||
| United States of America - 0.9% | |||
| GI Dynamics, Inc. CDI (a) | 5,561,290 | 74,826 | |
| ResMed, Inc. CDI | 694,883 | 7,282,805 | |
| TOTAL UNITED STATES OF AMERICA | 7,357,631 | ||
| TOTAL COMMON STOCKS | |||
| (Cost $678,810,690) | 740,609,508 | ||
| Nonconvertible Preferred Stocks - 1.0% | |||
| Korea (South) - 1.0% | |||
| Samsung Electronics Co. Ltd. | |||
| (Cost $9,351,760) | 263,350 | 8,251,326 | |
| Money Market Funds - 8.1% | |||
| Fidelity Cash Central Fund, 2.23% (d) | 54,810,440 | 54,821,402 | |
| Fidelity Securities Lending Cash Central Fund 2.23% (d)(e) | 10,392,037 | 10,393,076 | |
| TOTAL MONEY MARKET FUNDS | |||
| (Cost $65,214,478) | 65,214,478 | ||
| TOTAL INVESTMENT IN SECURITIES - 100.8% | |||
| (Cost $753,376,928) | 814,075,312 | ||
| NET OTHER ASSETS (LIABILITIES) - (0.8)% | (6,443,509) | ||
| NET ASSETS - 100% | $807,631,803 |
Categorizations in the Schedule of Investments are based on country or territory of incorporation.
Legend
(a) Non-income producing
(b) Security or a portion of the security is on loan at period end.
(c) Level 3 security
(d) Affiliated fund that is generally available only to investment companies and other accounts managed by Fidelity Investments. The rate quoted is the annualized seven-day yield of the fund at period end. A complete unaudited listing of the fund's holdings as of its most recent quarter end is available upon request. In addition, each Fidelity Central Fund's financial statements, which are not covered by the Fund's Report of Independent Registered Public Accounting Firm, are available on the SEC's website or upon request.
(e) Investment made with cash collateral received from securities on loan.
Affiliated Central Funds
Information regarding fiscal year to date income earned by the Fund from investments in Fidelity Central Funds is as follows:
| Fund | Income earned |
| Fidelity Cash Central Fund | $259,958 |
| Fidelity Securities Lending Cash Central Fund | 165,787 |
| Total | $425,745 |
Amounts in the income column in the above table include any capital gain distributions from underlying funds, which are presented in the corresponding line-item in the Statement of Operations if applicable.
Investment Valuation
The following is a summary of the inputs used, as of October 31, 2018, involving the Fund's assets and liabilities carried at fair value. The inputs or methodology used for valuing securities may not be an indication of the risk associated with investing in those securities. For more information on valuation inputs, and their aggregation into the levels used below, please refer to the Investment Valuation section in the accompanying Notes to Financial Statements.
| Valuation Inputs at Reporting Date: | ||||
| Description | Total | Level 1 | Level 2 | Level 3 |
| Investments in Securities: | ||||
| Equities: | ||||
| Communication Services | $80,164,402 | $21,122,174 | $59,042,228 | $-- |
| Consumer Discretionary | 130,935,618 | 112,721,199 | 18,214,419 | -- |
| Consumer Staples | 61,098,365 | 48,186,401 | 12,911,964 | -- |
| Energy | 19,937,956 | 19,937,956 | -- | -- |
| Financials | 140,811,666 | 126,516,876 | 14,294,790 | -- |
| Health Care | 87,139,101 | 64,562,164 | 16,310,357 | 6,266,580 |
| Industrials | 94,138,658 | 76,321,004 | 17,817,654 | -- |
| Information Technology | 86,760,835 | 54,370,768 | 32,390,065 | 2 |
| Materials | 15,083,416 | 8,670,838 | 6,412,575 | 3 |
| Real Estate | 20,688,628 | 20,688,628 | -- | -- |
| Utilities | 12,102,189 | 12,102,189 | -- | -- |
| Money Market Funds | 65,214,478 | 65,214,478 | -- | -- |
| Total Investments in Securities: | $814,075,312 | $630,414,675 | $177,394,052 | $6,266,585 |
The following is a summary of transfers between Level 1 and Level 2 for the period ended October 31, 2018. Transfers are assumed to have occurred at the beginning of the period, and are primarily attributable to the valuation techniques used for foreign equity securities, as discussed in the accompanying Notes to Financial Statements:
| Transfers | Total |
| Level 1 to Level 2 | $0 |
| Level 2 to Level 1 | $139,856,752 |
The following are reconciliations of Investments in Securities for which Level 3 inputs were used in determining value:
| Investments in Securities: | |
| Health Care: | |
| Beginning Balance | $-- |
| Net Realized Gain (Loss) on Investment Securities | -- |
| Net Unrealized Gain (Loss) on Investment Securities | (3,564,823) |
| Cost of Purchases | 419,142 |
| Proceeds of Sales | -- |
| Amortization/Accretion | -- |
| Transfers into Level 3 | 9,412,261 |
| Transfers out of Level 3 | -- |
| Ending Balance | $6,266,580 |
| The change in unrealized gain (loss) for the period attributable to Level 3 securities held at October 31, 2018 | $(3,564,823) |
| Other Investments in Securities: | |
| Beginning Balance | $110,145 |
| Net Realized Gain (Loss) on Investment Securities | (2,597,790) |
| Net Unrealized Gain (Loss) on Investment Securities | 2,590,263 |
| Cost of Purchases | -- |
| Proceeds of Sales | (102,613) |
| Amortization/Accretion | -- |
| Transfers into Level 3 | -- |
| Transfers out of Level 3 | -- |
| Ending Balance | $5 |
| The change in unrealized gain (loss) for the period attributable to Level 3 securities held at October 31, 2018 | $-- |
The information used in the above reconciliations represents fiscal year to date activity for any Investments in Securities identified as using Level 3 inputs at either the beginning or the end of the current fiscal period. Transfers in or out of Level 3 represent the beginning value of any Security or Instrument where a change in the pricing level occurred from the beginning to the end of the period. The cost of purchases and the proceeds of sales may include securities received or delivered through corporate actions or exchanges. Realized and unrealized gains (losses) disclosed in the reconciliations are included in Net Gain (Loss) on the Fund's Statement of Operations.
See accompanying notes which are an integral part of the financial statements.
Fidelity® Pacific Basin Fund
Financial Statements
Statement of Assets and Liabilities
| October 31, 2018 | ||
| Assets | ||
| Investment in securities, at value (including securities loaned of $9,904,035) — See accompanying schedule: Unaffiliated issuers (cost $688,162,450) | $748,860,834 | |
| Fidelity Central Funds (cost $65,214,478) | 65,214,478 | |
| Total Investment in Securities (cost $753,376,928) | $814,075,312 | |
| Foreign currency held at value (cost $385,018) | 383,351 | |
| Receivable for investments sold | 1,031,319 | |
| Receivable for fund shares sold | 2,914,364 | |
| Dividends receivable | 1,498,872 | |
| Distributions receivable from Fidelity Central Funds | 105,860 | |
| Prepaid expenses | 1,886 | |
| Other receivables | 50,437 | |
| Total assets | 820,061,401 | |
| Liabilities | ||
| Payable for investments purchased | $880,079 | |
| Payable for fund shares redeemed | 331,426 | |
| Accrued management fee | 513,093 | |
| Other affiliated payables | 158,555 | |
| Other payables and accrued expenses | 154,845 | |
| Collateral on securities loaned | 10,391,600 | |
| Total liabilities | 12,429,598 | |
| Net Assets | $807,631,803 | |
| Net Assets consist of: | ||
| Paid in capital | $675,735,250 | |
| Total distributable earnings (loss) | 131,896,553 | |
| Net Assets, for 27,371,793 shares outstanding | $807,631,803 | |
| Net Asset Value, offering price and redemption price per share ($807,631,803 ÷ 27,371,793 shares) | $29.51 |
See accompanying notes which are an integral part of the financial statements.
Statement of Operations
| Year ended October 31, 2018 | ||
| Investment Income | ||
| Dividends | $17,577,691 | |
| Income from Fidelity Central Funds | 425,745 | |
| Income before foreign taxes withheld | 18,003,436 | |
| Less foreign taxes withheld | (1,348,576) | |
| Total income | 16,654,860 | |
| Expenses | ||
| Management fee | ||
| Basic fee | $6,846,507 | |
| Performance adjustment | 1,309,537 | |
| Transfer agent fees | 1,613,575 | |
| Accounting and security lending fees | 464,750 | |
| Custodian fees and expenses | 235,580 | |
| Independent trustees' fees and expenses | 5,027 | |
| Registration fees | 42,466 | |
| Audit | 85,278 | |
| Legal | 3,057 | |
| Interest | 4,848 | |
| Miscellaneous | 6,594 | |
| Total expenses before reductions | 10,617,219 | |
| Expense reductions | (126,326) | |
| Total expenses after reductions | 10,490,893 | |
| Net investment income (loss) | 6,163,967 | |
| Realized and Unrealized Gain (Loss) | ||
| Net realized gain (loss) on: | ||
| Investment securities: | ||
| Unaffiliated issuers | 81,489,658 | |
| Fidelity Central Funds | 261 | |
| Foreign currency transactions | (734,114) | |
| Total net realized gain (loss) | 80,755,805 | |
| Change in net unrealized appreciation (depreciation) on: | ||
| Investment securities: | ||
| Unaffiliated issuers (net of decrease in deferred foreign taxes of $1,732,483) | (211,673,930) | |
| Fidelity Central Funds | (188) | |
| Assets and liabilities in foreign currencies | (6,457) | |
| Total change in net unrealized appreciation (depreciation) | (211,680,575) | |
| Net gain (loss) | (130,924,770) | |
| Net increase (decrease) in net assets resulting from operations | $(124,760,803) |
See accompanying notes which are an integral part of the financial statements.
Statement of Changes in Net Assets
| Year ended October 31, 2018 | Year ended October 31, 2017 | |
| Increase (Decrease) in Net Assets | ||
| Operations | ||
| Net investment income (loss) | $6,163,967 | $6,692,443 |
| Net realized gain (loss) | 80,755,805 | 36,776,786 |
| Change in net unrealized appreciation (depreciation) | (211,680,575) | 155,633,192 |
| Net increase (decrease) in net assets resulting from operations | (124,760,803) | 199,102,421 |
| Distributions to shareholders | (42,947,398) | – |
| Distributions to shareholders from net investment income | – | (4,211,523) |
| Distributions to shareholders from net realized gain | – | (11,304,612) |
| Total distributions | (42,947,398) | (15,516,135) |
| Share transactions | ||
| Proceeds from sales of shares | 182,924,589 | 225,357,974 |
| Reinvestment of distributions | 41,121,006 | 14,752,829 |
| Cost of shares redeemed | (223,982,513) | (136,848,518) |
| Net increase (decrease) in net assets resulting from share transactions | 63,082 | 103,262,285 |
| Redemption fees | 17,913 | 92,091 |
| Total increase (decrease) in net assets | (167,627,206) | 286,940,662 |
| Net Assets | ||
| Beginning of period | 975,259,009 | 688,318,347 |
| End of period | $807,631,803 | $975,259,009 |
| Other Information | ||
| Undistributed net investment income end of period | $6,368,166 | |
| Shares | ||
| Sold | 5,193,865 | 7,627,933 |
| Issued in reinvestment of distributions | 1,184,702 | 557,552 |
| Redeemed | (6,457,678) | (4,620,784) |
| Net increase (decrease) | (79,111) | 3,564,701 |
See accompanying notes which are an integral part of the financial statements.
Financial Highlights
Fidelity Pacific Basin Fund
| Years ended October 31, | 2018 | 2017 | 2016 | 2015 | 2014 |
| Selected Per–Share Data | |||||
| Net asset value, beginning of period | $35.53 | $28.82 | $27.01 | $28.92 | $31.47 |
| Income from Investment Operations | |||||
| Net investment income (loss)A | .22 | .25 | .24 | .37B | .31 |
| Net realized and unrealized gain (loss) | (4.69) | 7.09 | 2.88 | (.49) | 1.25 |
| Total from investment operations | (4.47) | 7.34 | 3.12 | (.12) | 1.56 |
| Distributions from net investment income | (.23) | (.17) | (.36) | (.18) | (.18) |
| Distributions from net realized gain | (1.32) | (.46) | (.95) | (1.61) | (3.93) |
| Total distributions | (1.55) | (.63) | (1.31) | (1.79) | (4.11) |
| Redemption fees added to paid in capitalA,C | – | – | – | – | – |
| Net asset value, end of period | $29.51 | $35.53 | $28.82 | $27.01 | $28.92 |
| Total ReturnD | (13.24)% | 26.22% | 12.05% | (.29)% | 5.68% |
| Ratios to Average Net AssetsE,F | |||||
| Expenses before reductions | 1.07% | 1.11% | 1.19% | 1.17% | 1.18% |
| Expenses net of fee waivers, if any | 1.07% | 1.11% | 1.19% | 1.17% | 1.18% |
| Expenses net of all reductions | 1.06% | 1.10% | 1.19% | 1.17% | 1.18% |
| Net investment income (loss) | .62% | .84% | .87% | 1.34%B | 1.09% |
| Supplemental Data | |||||
| Net assets, end of period (000 omitted) | $807,632 | $975,259 | $688,318 | $654,032 | $697,202 |
| Portfolio turnover rateG | 37% | 36% | 30% | 36% | 30% |
A Calculated based on average shares outstanding during the period.
B Net investment income per share reflects a large, non-recurring dividend which amounted to $.10 per share. Excluding this non-recurring dividend, the ratio of net investment income (loss) to average net assets would have been .99%.
C Amount represents less than $.005 per share.
D Total returns would have been lower if certain expenses had not been reduced during the applicable periods shown.
E Fees and expenses of any underlying Fidelity Central Funds are not included in the Fund's expense ratio. The Fund indirectly bears its proportionate share of the expenses of any underlying Fidelity Central Funds.
F Expense ratios reflect operating expenses of the Fund. Expenses before reductions do not reflect amounts reimbursed by the investment adviser or reductions from brokerage service arrangements or reductions from other expense offset arrangements and do not represent the amount paid by the Fund during periods when reimbursements or reductions occur. Expenses net of fee waivers reflect expenses after reimbursement by the investment adviser but prior to reductions from brokerage service arrangements or other expense offset arrangements. Expenses net of all reductions represent the net expenses paid by the Fund.
G Amount does not include the portfolio activity of any underlying Fidelity Central Funds.
See accompanying notes which are an integral part of the financial statements.
Notes to Financial Statements
For the period ended October 31, 2018
1. Organization.
Fidelity Pacific Basin Fund (the Fund) is a fund of Fidelity Investment Trust (the Trust) and is authorized to issue an unlimited number of shares. Share transactions on the Statement of Changes in Net Assets may contain exchanges between affiliated funds. The Trust is registered under the Investment Company Act of 1940, as amended (the 1940 Act), as an open-end management investment company organized as a Massachusetts business trust. The Fund's investments in emerging markets can be subject to social, economic, regulatory, and political uncertainties and can be extremely volatile.
2. Investments in Fidelity Central Funds.
The Fund invests in Fidelity Central Funds, which are open-end investment companies generally available only to other investment companies and accounts managed by the investment adviser and its affiliates. The Fund's Schedule of Investments lists each of the Fidelity Central Funds held as of period end, if any, as an investment of the Fund, but does not include the underlying holdings of each Fidelity Central Fund. As an Investing Fund, the Fund indirectly bears its proportionate share of the expenses of the underlying Fidelity Central Funds.
The Money Market Central Funds seek preservation of capital and current income and are managed by Fidelity Investments Money Management, Inc. (FIMM), an affiliate of the investment adviser. Annualized expenses of the Money Market Central Funds as of their most recent shareholder report date are less than .005%.
A complete unaudited list of holdings for each Fidelity Central Fund is available upon request or at the Securities and Exchange Commission (the SEC) website at www.sec.gov. In addition, the financial statements of the Fidelity Central Funds, which are not covered by the Fund's Report of Independent Registered Public Accounting Firm, are available on the SEC website or upon request.
3. Significant Accounting Policies.
The Fund is an investment company and applies the accounting and reporting guidance of the Financial Accounting Standards Board (FASB) Accounting Standards Codification Topic 946 Financial Services – Investments Companies. The financial statements have been prepared in conformity with accounting principles generally accepted in the United States of America (GAAP), which require management to make certain estimates and assumptions at the date of the financial statements. Actual results could differ from those estimates. Subsequent events, if any, through the date that the financial statements were issued have been evaluated in the preparation of the financial statements. The following summarizes the significant accounting policies of the Fund:
Investment Valuation. Investments are valued as of 4:00 p.m. Eastern time on the last calendar day of the period. The Board of Trustees (the Board) has delegated the day to day responsibility for the valuation of the Fund's investments to the Fair Value Committee (the Committee) established by the Fund's investment adviser. In accordance with valuation policies and procedures approved by the Board, the Fund attempts to obtain prices from one or more third party pricing vendors or brokers to value its investments. When current market prices, quotations or currency exchange rates are not readily available or reliable, investments will be fair valued in good faith by the Committee, in accordance with procedures adopted by the Board. Factors used in determining fair value vary by investment type and may include market or investment specific events. The frequency with which these procedures are used cannot be predicted and they may be utilized to a significant extent. The Committee oversees the Fund's valuation policies and procedures and reports to the Board on the Committee's activities and fair value determinations. The Board monitors the appropriateness of the procedures used in valuing the Fund's investments and ratifies the fair value determinations of the Committee.
The Fund categorizes the inputs to valuation techniques used to value its investments into a disclosure hierarchy consisting of three levels as shown below:
- Level 1 – quoted prices in active markets for identical investments
- Level 2 – other significant observable inputs (including quoted prices for similar investments, interest rates, prepayment speeds, etc.)
- Level 3 – unobservable inputs (including the Fund's own assumptions based on the best information available)
Valuation techniques used to value the Fund's investments by major category are as follows:
Equity securities, including restricted securities, for which market quotations are readily available, are valued at the last reported sale price or official closing price as reported by a third party pricing vendor on the primary market or exchange on which they are traded and are categorized as Level 1 in the hierarchy. In the event there were no sales during the day or closing prices are not available, securities are valued at the last quoted bid price or may be valued using the last available price and are generally categorized as Level 2 in the hierarchy. For foreign equity securities, when market or security specific events arise, comparisons to the valuation of American Depositary Receipts (ADRs), futures contracts, Exchange-Traded Funds (ETFs)and certain indexes as well as quoted prices for similar securities may be used and would be categorized as Level 2 in the hierarchy. Utilizing these techniques may result in transfers between Level 1 and Level 2. For equity securities, including restricted securities, where observable inputs are limited, assumptions about market activity and risk are used and these securities may be categorized as Level 3 in the hierarchy.
Investments in open-end mutual funds, including the Fidelity Central Funds, are valued at their closing net asset value (NAV) each business day and are categorized as Level 1 in the hierarchy.
Changes in valuation techniques may result in transfers in or out of an assigned level within the disclosure hierarchy. The aggregate value of investments by input level as of October 31, 2018, including information on transfers between Levels 1 and 2, as well as a roll forward of Level 3 investments, is included at the end of the Fund's Schedule of Investments.
Foreign Currency. The Fund may use foreign currency contracts to facilitate transactions in foreign-denominated securities. Gains and losses from these transactions may arise from changes in the value of the foreign currency or if the counterparties do not perform under the contracts' terms.
Foreign-denominated assets, including investment securities, and liabilities are translated into U.S. dollars at the exchange rates at period end. Purchases and sales of investment securities, income and dividends received and expenses denominated in foreign currencies are translated into U.S. dollars at the exchange rate in effect on the transaction date.
The effects of exchange rate fluctuations on investments are included with the net realized and unrealized gain (loss) on investment securities. Other foreign currency transactions resulting in realized and unrealized gain (loss) are disclosed separately.
Investment Transactions and Income. For financial reporting purposes, the Fund's investment holdings and NAV include trades executed through the end of the last business day of the period. The NAV per share for processing shareholder transactions is calculated as of the close of business of the New York Stock Exchange (NYSE), normally 4:00 p.m. Eastern time and includes trades executed through the end of the prior business day. Gains and losses on securities sold are determined on the basis of identified cost. Dividend income is recorded on the ex-dividend date, except for certain dividends from foreign securities where the ex-dividend date may have passed, which are recorded as soon as the Fund is informed of the ex-dividend date. Non-cash dividends included in dividend income, if any, are recorded at the fair market value of the securities received. Income and capital gain distributions from Fidelity Central Funds, if any, are recorded on the ex-dividend date. Interest income is accrued as earned and includes coupon interest and amortization of premium and accretion of discount on debt securities as applicable. Investment income is recorded net of foreign taxes withheld where recovery of such taxes is uncertain.
Expenses. Expenses directly attributable to a fund are charged to that fund. Expenses attributable to more than one fund are allocated among the respective funds on the basis of relative net assets or other appropriate methods. Expense estimates are accrued in the period to which they relate and adjustments are made when actual amounts are known.
Income Tax Information and Distributions to Shareholders. Each year, the Fund intends to qualify as a regulated investment company under Subchapter M of the Internal Revenue Code, including distributing substantially all of its taxable income and realized gains. As a result, no provision for U.S. Federal income taxes is required. As of October 31, 2018, the Fund did not have any unrecognized tax benefits in the financial statements; nor is the Fund aware of any tax positions for which it is reasonably possible that the total amounts of unrecognized tax benefits will significantly change in the next twelve months. The Fund files a U.S. federal tax return, in addition to state and local tax returns as required. The Fund's federal income tax returns are subject to examination by the Internal Revenue Service (IRS) for a period of three fiscal years after they are filed. State and local tax returns may be subject to examination for an additional fiscal year depending on the jurisdiction. Foreign taxes are provided for based on the Fund's understanding of the tax rules and rates that exist in the foreign markets in which it invests.
Distributions are declared and recorded on the ex-dividend date. Income and capital gain distributions are determined in accordance with income tax regulations, which may differ from GAAP. In addition, the Fund claimed a portion of the payment made to redeeming shareholders as a distribution for income tax purposes.
Capital accounts within the financial statements are adjusted for permanent book-tax differences. These adjustments have no impact on net assets or the results of operations. Capital accounts are not adjusted for temporary book-tax differences which will reverse in a subsequent period.
Book-tax differences are primarily due to foreign currency transactions, passive foreign investment companies (PFIC), deferred trustees compensation and losses deferred due to wash sales.
As of period end, the cost and unrealized appreciation (depreciation) in securities, and derivatives if applicable, for federal income tax purposes were as follows:
| Gross unrealized appreciation | $152,965,913 |
| Gross unrealized depreciation | (99,001,618) |
| Net unrealized appreciation (depreciation) | $53,964,295 |
| Tax Cost | $760,111,017 |
The tax-based components of distributable earnings as of period end were as follows:
| Undistributed ordinary income | $5,309,590 |
| Undistributed long-term capital gain | $72,654,167 |
| Net unrealized appreciation (depreciation) on securities and other investments | $53,932,797 |
The tax character of distributions paid was as follows:
| October 31, 2018 | October 31, 2017 | |
| Ordinary Income | $10,743,790 | $ 7,930,470 |
| Long-term Capital Gains | 32,203,608 | 7,585,665 |
| Total | $42,947,398 | $ 15,516,135 |
Short-Term Trading (Redemption) Fees. Shares held by investors in the Fund less than 90 days may have been subject to a redemption fee equal to 1.50% of the NAV of shares redeemed. All redemption fees, which reduce the proceeds of the shareholder redemption, are retained by the Fund and accounted for as an addition to paid in capital. In November 2017, the Board of Trustees approved the elimination of these redemption fees effective December 18, 2017.
New Rule Issuance. During August 2018, the U.S. Securities and Exchange Commission issued Final Rule Release No. 33-10532, Disclosure Update and Simplification. This Final Rule includes amendments specific to registered investment companies that are intended to eliminate overlap in disclosure requirements between Regulation S-X and GAAP. In accordance with these amendments, certain line-items in the Fund's financial statements have been combined or removed for the current period as outlined in the table below.
| Financial Statement | Current Line-Item Presentation | Prior Line-Item Presentation |
| Statement of Assets and Liabilities | Total distributable earnings (loss) | Undistributed/Distributions in excess of/Accumulated net investment income (loss) Accumulated/Undistributed net realized gain (loss) Net unrealized appreciation (depreciation) |
| Statement of Changes in Net Assets | N/A - removed | Undistributed/Distributions in excess of/Accumulated net investment income (loss) end of period |
| Statement of Changes in Net Assets | Distributions to shareholders | Distributions to shareholders from net investment income Distributions to shareholders from net realized gain |
4. Purchases and Sales of Investments.
Purchases and sales of securities, other than short-term securities, aggregated $361,496,122 and $444,011,184, respectively.
5. Fees and Other Transactions with Affiliates.
Management Fee. Fidelity Management & Research Company (the investment adviser) and its affiliates provide the Fund with investment management related services for which the Fund pays a monthly management fee. The management fee is the sum of an individual fund fee rate that is based on an annual rate of .45% of the Fund's average net assets and an annualized group fee rate that averaged .24% during the period. The group fee rate is based upon the average net assets of all the mutual funds advised by the investment adviser, including any mutual funds previously advised by the investment adviser that are currently advised by Fidelity SelectCo, LLC, an affiliate of the investment adviser. The group fee rate decreases as assets under management increase and increases as assets under management decrease. In addition, the management fee is subject to a performance adjustment (up to a maximum of +/- .20% of the Fund's average net assets over a 36 month performance period). The upward or downward adjustment to the management fee is based on the Fund's relative investment performance as compared to its benchmark index, the MSCI All Country Pacific Index, over the same 36 month performance period. For the reporting period, the total annual management fee rate, including the performance adjustment, was .82% of the Fund's average net assets. The performance adjustment included in the management fee rate may be higher or lower than the maximum performance adjustment rate due to the difference between the average net assets for the reporting and performance periods.
Transfer Agent Fees. Fidelity Investments Institutional Operations Company, Inc. (FIIOC), an affiliate of the investment adviser, is the Fund's transfer, dividend disbursing and shareholder servicing agent. FIIOC receives account fees and asset-based fees that vary according to account size and type of account. FIIOC pays for typesetting, printing and mailing of shareholder reports, except proxy statements. For the period, the transfer agent fees were equivalent to an annual rate of .16% of average net assets.
Accounting and Security Lending Fees. Fidelity Service Company, Inc. (FSC), an affiliate of the investment adviser, maintains the Fund's accounting records. The accounting fee is based on the level of average net assets for each month. Under a separate contract, FSC administers the security lending program. The security lending fee is based on the number and duration of lending transactions. For the period, the fees were equivalent to an annual rate of .05%.
Brokerage Commissions. The Fund placed a portion of its portfolio transactions with brokerage firms which are affiliates of the investment adviser. Brokerage commissions are included in net realized gain (loss) and change in net unrealized appreciation (depreciation) in the Statement of Operations. The commissions paid to these affiliated firms were $516 for the period.
Interfund Lending Program. Pursuant to an Exemptive Order issued by the SEC, the Fund, along with other registered investment companies having management contracts with Fidelity Management & Research Company (FMR) or other affiliated entities of FMR, may participate in an interfund lending program. This program provides an alternative credit facility allowing the funds to borrow from, or lend money to, other participating affiliated funds. At period end, there were no interfund loans outstanding. The Fund's activity in this program during the period for which loans were outstanding was as follows:
| Borrower or Lender | Average Loan Balance | Weighted Average Interest Rate | Interest Expense |
| Borrower | $27,186,000 | 2.14% | $4,848 |
Interfund Trades. The Fund may purchase from or sell securities to other Fidelity Funds under procedures adopted by the Board. The procedures have been designed to ensure these interfund trades are executed in accordance with Rule 17a-7 of the 1940 Act. Interfund trades are included within the respective purchases and sales amounts shown in the Purchases and Sales of Investments note.
6. Committed Line of Credit.
The Fund participates with other funds managed by the investment adviser or an affiliate in a $4.25 billion credit facility (the "line of credit") to be utilized for temporary or emergency purposes to fund shareholder redemptions or for other short-term liquidity purposes. The Fund has agreed to pay commitment fees on its pro-rata portion of the line of credit, which amounted to $2,738 and is reflected in Miscellaneous expenses on the Statement of Operations. During the period, the Fund did not borrow on this line of credit.
7. Security Lending.
The Fund lends portfolio securities through a lending agent from time to time in order to earn additional income. For equity securities, a lending agent is used and may loan securities to certain qualified borrowers, including Fidelity Capital Markets (FCM), a broker-dealer affiliated with the Fund. On the settlement date of the loan, the Fund receives collateral (in the form of U.S. Treasury obligations, letters of credit and/or cash) against the loaned securities and maintains collateral in an amount not less than 100% of the market value of the loaned securities during the period of the loan. The market value of the loaned securities is determined at the close of business of the Fund and any additional required collateral is delivered to the Fund on the next business day. The Fund or borrower may terminate the loan at any time, and if the borrower defaults on its obligation to return the securities loaned because of insolvency or other reasons, the Fund may apply collateral received from the borrower against the obligation. The Fund may experience delays and costs in recovering the securities loaned. Any cash collateral received is invested in the Fidelity Securities Lending Cash Central Fund. The value of loaned securities and cash collateral at period end are disclosed on the Fund's Statement of Assets and Liabilities. Security lending income represents the income earned on investing cash collateral, less rebates paid to borrowers and any lending agent fees associated with the loan, plus any premium payments received for lending certain types of securities. Security lending income is presented in the Statement of Operations as a component of income from Fidelity Central Funds. Total security lending income during the period amounted to $165,787. During the period, there were no securities loaned to FCM.
8. Expense Reductions.
Commissions paid to certain brokers with whom the investment adviser, or its affiliates, places trades on behalf of the Fund include an amount in addition to trade execution, which may be rebated back to the Fund to offset certain expenses. This amount totaled $115,563 for the period. In addition, through arrangements with the Fund's custodian, credits realized as a result of certain uninvested cash balances were used to reduce the Fund's expenses. During the period, these credits reduced the Fund's custody expenses by $711.
In addition, during the period the investment adviser reimbursed and/or waived a portion of operating expenses in the amount of $10,052.
9. Other.
The Fund's organizational documents provide former and current trustees and officers with a limited indemnification against liabilities arising in connection with the performance of their duties to the Fund. In the normal course of business, the Fund may also enter into contracts that provide general indemnifications. The Fund's maximum exposure under these arrangements is unknown as this would be dependent on future claims that may be made against the Fund. The risk of material loss from such claims is considered remote.
At the end of the period, Strategic Advisers Fidelity International Fund was the owner of record of approximately 18% of the total outstanding shares of the Fund. Mutual funds managed by the investment adviser or its affiliates were the owners of record, in the aggregate, of approximately 24% of the total outstanding shares of the Fund.
Report of Independent Registered Public Accounting Firm
To the Board of Trustees of Fidelity Investment Trust and Shareholders of Fidelity Canada Fund, Fidelity China Region Fund, Fidelity Emerging Asia Fund, Fidelity Emerging Markets Fund, Fidelity Europe Fund, Fidelity Japan Fund, Fidelity Japan Smaller Companies Fund, Fidelity Latin America Fund, Fidelity Nordic Fund and Fidelity Pacific Basin Fund:
Opinions on the Financial Statements
We have audited the accompanying statements of assets and liabilities, including the schedules of investments, of Fidelity Canada Fund, Fidelity China Region Fund, Fidelity Emerging Asia Fund, Fidelity Emerging Markets Fund, Fidelity Europe Fund, Fidelity Japan Fund, Fidelity Japan Smaller Companies Fund, Fidelity Latin America Fund, Fidelity Nordic Fund and Fidelity Pacific Basin Fund (ten of the funds constituting Fidelity Investment Trust, hereafter collectively referred to as the "Funds") as of October 31, 2018, the related statements of operations for the year ended October 31, 2018, the statements of changes in net assets for each of the two years in the period ended October 31, 2018, including the related notes, and the financial highlights for each of the periods indicated therein (collectively referred to as the “financial statements”). In our opinion, the financial statements present fairly, in all material respects, the financial position of each of the Funds as of October 31, 2018, the results of each of their operations for the year then ended, the changes in each of their net assets for each of the two years in the period ended October 31, 2018 and each of the financial highlights for each of the periods indicated therein in conformity with accounting principles generally accepted in the United States of America.
Basis for Opinions
These financial statements are the responsibility of the Funds' management. Our responsibility is to express an opinion on the Funds' financial statements based on our audits. We are a public accounting firm registered with the Public Company Accounting Oversight Board (United States) (“PCAOB”) and are required to be independent with respect to the Funds in accordance with the U.S. federal securities laws and the applicable rules and regulations of the Securities and Exchange Commission and the PCAOB.
We conducted our audits of these financial statements in accordance with the standards of the PCAOB. Those standards require that we plan and perform the audit to obtain reasonable assurance about whether the financial statements are free of material misstatement, whether due to error or fraud.
Our audits included performing procedures to assess the risks of material misstatement of the financial statements, whether due to error or fraud, and performing procedures that respond to those risks. Such procedures included examining, on a test basis, evidence regarding the amounts and disclosures in the financial statements. Our audits also included evaluating the accounting principles used and significant estimates made by management, as well as evaluating the overall presentation of the financial statements. Our procedures included confirmation of securities owned as of October 31, 2018 by correspondence with the custodians and brokers; when replies were not received from brokers, we performed other auditing procedures. We believe that our audits provide a reasonable basis for our opinions.
PricewaterhouseCoopers LLP
Boston, Massachusetts
December 14, 2018
We have served as the auditor of one or more investment companies in the Fidelity group of funds since 1932.
Trustees and Officers
The Trustees, Members of the Advisory Board (if any), and officers of the trust and funds, as applicable, are listed below. The Board of Trustees governs each fund and is responsible for protecting the interests of shareholders. The Trustees are experienced executives who meet periodically throughout the year to oversee each fund's activities, review contractual arrangements with companies that provide services to each fund, oversee management of the risks associated with such activities and contractual arrangements, and review each fund's performance. Except for Jonathan Chiel, each of the Trustees oversees 283 funds. Mr. Chiel oversees 154 funds.
The Trustees hold office without limit in time except that (a) any Trustee may resign; (b) any Trustee may be removed by written instrument, signed by at least two-thirds of the number of Trustees prior to such removal; (c) any Trustee who requests to be retired or who has become incapacitated by illness or injury may be retired by written instrument signed by a majority of the other Trustees; and (d) any Trustee may be removed at any special meeting of shareholders by a two-thirds vote of the outstanding voting securities of the trust. Each Trustee who is not an interested person (as defined in the 1940 Act) of the trust and the funds is referred to herein as an Independent Trustee. Each Independent Trustee shall retire not later than the last day of the calendar year in which his or her 75th birthday occurs. The Independent Trustees may waive this mandatory retirement age policy with respect to individual Trustees. Officers and Advisory Board Members hold office without limit in time, except that any officer or Advisory Board Member may resign or may be removed by a vote of a majority of the Trustees at any regular meeting or any special meeting of the Trustees. Except as indicated, each individual has held the office shown or other offices in the same company for the past five years.
Each fund’s Statement of Additional Information (SAI) includes more information about the Trustees. To request a free copy, call Fidelity at 1-800-544-8544.
Experience, Skills, Attributes, and Qualifications of the Trustees. The Governance and Nominating Committee has adopted a statement of policy that describes the experience, qualifications, attributes, and skills that are necessary and desirable for potential Independent Trustee candidates (Statement of Policy). The Board believes that each Trustee satisfied at the time he or she was initially elected or appointed a Trustee, and continues to satisfy, the standards contemplated by the Statement of Policy. The Governance and Nominating Committee also engages professional search firms to help identify potential Independent Trustee candidates who have the experience, qualifications, attributes, and skills consistent with the Statement of Policy. From time to time, additional criteria based on the composition and skills of the current Independent Trustees, as well as experience or skills that may be appropriate in light of future changes to board composition, business conditions, and regulatory or other developments, have also been considered by the professional search firms and the Governance and Nominating Committee. In addition, the Board takes into account the Trustees' commitment and participation in Board and committee meetings, as well as their leadership of standing and ad hoc committees throughout their tenure.
In determining that a particular Trustee was and continues to be qualified to serve as a Trustee, the Board has considered a variety of criteria, none of which, in isolation, was controlling. The Board believes that, collectively, the Trustees have balanced and diverse experience, qualifications, attributes, and skills, which allow the Board to operate effectively in governing each fund and protecting the interests of shareholders. Information about the specific experience, skills, attributes, and qualifications of each Trustee, which in each case led to the Board's conclusion that the Trustee should serve (or continue to serve) as a trustee of the funds, is provided below.
Board Structure and Oversight Function. James C. Curvey is an interested person and currently serves as Chairman. The Trustees have determined that an interested Chairman is appropriate and benefits shareholders because an interested Chairman has a personal and professional stake in the quality and continuity of services provided to the funds. Independent Trustees exercise their informed business judgment to appoint an individual of their choosing to serve as Chairman, regardless of whether the Trustee happens to be independent or a member of management. The Independent Trustees have determined that they can act independently and effectively without having an Independent Trustee serve as Chairman and that a key structural component for assuring that they are in a position to do so is for the Independent Trustees to constitute a substantial majority for the Board. The Independent Trustees also regularly meet in executive session. Ned C. Lautenbach serves as Chairman of the Independent Trustees and as such (i) acts as a liaison between the Independent Trustees and management with respect to matters important to the Independent Trustees and (ii) with management prepares agendas for Board meetings.
Fidelity® funds are overseen by different Boards of Trustees. The funds' Board oversees Fidelity's high income and certain equity funds, and other Boards oversee Fidelity's investment-grade bond, money market, asset allocation, and other equity funds. The asset allocation funds may invest in Fidelity® funds overseen by the funds' Board. The use of separate Boards, each with its own committee structure, allows the Trustees of each group of Fidelity® funds to focus on the unique issues of the funds they oversee, including common research, investment, and operational issues. On occasion, the separate Boards establish joint committees to address issues of overlapping consequences for the Fidelity® funds overseen by each Board.
The Trustees operate using a system of committees to facilitate the timely and efficient consideration of all matters of importance to the Trustees, each fund, and fund shareholders and to facilitate compliance with legal and regulatory requirements and oversight of the funds' activities and associated risks. The Board, acting through its committees, has charged FMR and its affiliates with (i) identifying events or circumstances the occurrence of which could have demonstrably adverse effects on the funds' business and/or reputation; (ii) implementing processes and controls to lessen the possibility that such events or circumstances occur or to mitigate the effects of such events or circumstances if they do occur; and (iii) creating and maintaining a system designed to evaluate continuously business and market conditions in order to facilitate the identification and implementation processes described in (i) and (ii) above. Because the day-to-day operations and activities of the funds are carried out by or through FMR, its affiliates, and other service providers, the funds' exposure to risks is mitigated but not eliminated by the processes overseen by the Trustees. While each of the Board's committees has responsibility for overseeing different aspects of the funds' activities, oversight is exercised primarily through the Operations, Audit, and Compliance Committees. In addition, the Independent Trustees have worked with Fidelity to enhance the Board's oversight of investment and financial risks, legal and regulatory risks, technology risks, and operational risks, including the development of additional risk reporting to the Board. Appropriate personnel, including but not limited to the funds' Chief Compliance Officer (CCO), FMR's internal auditor, the independent accountants, the funds' Treasurer and portfolio management personnel, make periodic reports to the Board's committees, as appropriate, including an annual review of Fidelity's risk management program for the Fidelity® funds. The responsibilities of each standing committee, including their oversight responsibilities, are described further under "Standing Committees of the Trustees."
Interested Trustees*:
Correspondence intended for a Trustee who is an interested person may be sent to Fidelity Investments, 245 Summer Street, Boston, Massachusetts 02210.
Name, Year of Birth; Principal Occupations and Other Relevant Experience+
Jonathan Chiel (1957)
Year of Election or Appointment: 2016
Trustee
Mr. Chiel also serves as Trustee of other Fidelity® funds. Mr. Chiel is Executive Vice President and General Counsel for FMR LLC (diversified financial services company, 2012-present). Previously, Mr. Chiel served as general counsel (2004-2012) and senior vice president and deputy general counsel (2000-2004) for John Hancock Financial Services; a partner with Choate, Hall & Stewart (1996-2000) (law firm); and an Assistant United States Attorney for the United States Attorney’s Office of the District of Massachusetts (1986-95), including Chief of the Criminal Division (1993-1995). Mr. Chiel is a director on the boards of the Boston Bar Foundation and the Maimonides School.
James C. Curvey (1935)
Year of Election or Appointment: 2007
Trustee
Chairman of the Board of Trustees
Mr. Curvey also serves as Trustee of other Fidelity® funds. Mr. Curvey is Vice Chairman (2007-present) and Director of FMR LLC (diversified financial services company). In addition, Mr. Curvey is an Overseer Emeritus for the Boston Symphony Orchestra, a Director of Artis-Naples, and a Trustee of Brewster Academy in Wolfeboro, New Hampshire. Previously, Mr. Curvey served as a Director of Fidelity Research & Analysis Co. (investment adviser firm, 2009-2018), Director of Fidelity Investments Money Management, Inc. (investment adviser firm, 2009-2014) and a Director of FMR and FMR Co., Inc. (investment adviser firms, 2007-2014).
Charles S. Morrison (1960)
Year of Election or Appointment: 2014
Trustee
Mr. Morrison also serves as Trustee of other funds. He serves as President of Fidelity SelectCo, LLC (investment adviser firm, 2017-present) and Fidelity Management & Research Company (FMR) (investment adviser firm, 2016-present), a Director of Fidelity Investments Money Management, Inc. (FIMM) (investment adviser firm, 2014-present), Director of Fidelity SelectCo, LLC (investment adviser firm, 2014-present), President, Asset Management (2014-present), and is an employee of Fidelity Investments. Previously, Mr. Morrison served as Vice President of Fidelity's Fixed Income and Asset Allocation Funds (2012-2014), President, Fixed Income (2011-2014), Vice President of Fidelity's Money Market Funds (2005-2009), President, Money Market Group Leader of FMR (investment adviser firm, 2009), and Senior Vice President, Money Market Group of FMR (2004-2009). Mr. Morrison also served as Vice President of Fidelity's Bond Funds (2002-2005), certain Balanced Funds (2002-2005), and certain Asset Allocation Funds (2002-2007), and as Senior Vice President (2002-2005) of Fidelity's Bond Division.
* Determined to be an “Interested Trustee” by virtue of, among other things, his or her affiliation with the trust or various entities under common control with FMR.
+ The information includes the Trustee's principal occupation during the last five years and other information relating to the experience, attributes, and skills relevant to the Trustee's qualifications to serve as a Trustee, which led to the conclusion that the Trustee should serve as a Trustee for each fund.
Independent Trustees:
Correspondence intended for an Independent Trustee may be sent to Fidelity Investments, P.O. Box 55235, Boston, Massachusetts 02205-5235.
Name, Year of Birth; Principal Occupations and Other Relevant Experience+
Dennis J. Dirks (1948)
Year of Election or Appointment: 2005
Trustee
Mr. Dirks also serves as Trustee of other Fidelity® funds. Prior to his retirement in May 2003, Mr. Dirks was Chief Operating Officer and a member of the Board of The Depository Trust & Clearing Corporation (DTCC). He also served as President, Chief Operating Officer, and Board member of The Depository Trust Company (DTC) and President and Board member of the National Securities Clearing Corporation (NSCC). In addition, Mr. Dirks served as Chief Executive Officer and Board member of the Government Securities Clearing Corporation, Chief Executive Officer and Board member of the Mortgage-Backed Securities Clearing Corporation, as a Trustee and a member of the Finance Committee of Manhattan College (2005-2008), as a Trustee and a member of the Finance Committee of AHRC of Nassau County (2006-2008), as a member of the Independent Directors Council (IDC) Governing Council (2010-2015), and as a member of the Board of Directors for The Brookville Center for Children’s Services, Inc. (2009-2017). Mr. Dirks is a member of the Finance Committee (2016-present), Board of Directors (2017-present) and Board of Trustees (2018-present) and is Treasurer (2018-present) of the Asolo Repertory Theatre.
Donald F. Donahue (1950)
Year of Election or Appointment: 2018
Trustee
Mr. Donahue also serves as a Trustee of other Fidelity® funds. Mr. Donahue is President and Chief Executive Officer of Miranda Partners, LLC (risk consulting for the financial services industry, 2012-present). Previously, Mr. Donahue served as a Member of the Advisory Board of certain Fidelity® funds (2015-2018) and Chief Executive Officer (2006-2012), Chief Operating Officer (2003-2006), and Managing Director, Customer Marketing and Development (1999-2003) of The Depository Trust & Clearing Corporation (financial markets infrastructure). Mr. Donahue serves as a Member (2007-present) and Co-Chairman (2016-present) of the Board of Directors of United Way of New York, Member of the Board of Directors of NYC Leadership Academy (2012-present) and Member of the Board of Advisors of Ripple Labs, Inc. (financial services, 2015-present). He also served as Chairman (2010-2012) and Member of the Board of Directors (2012-2013) of Omgeo, LLC (financial services), Treasurer of United Way of New York (2012-2016), and Member of the Board of Directors of XBRL US (financial services non-profit, 2009-2012) and the International Securities Services Association (2009-2012).
Alan J. Lacy (1953)
Year of Election or Appointment: 2008
Trustee
Mr. Lacy also serves as Trustee of other Fidelity® funds. Mr. Lacy serves as a Director of Bristol-Myers Squibb Company (global pharmaceuticals, 2008-present). He is a Trustee of the California Chapter of The Nature Conservancy (2015-present) and a Director of the Center for Advanced Study in the Behavioral Sciences at Stanford University (2015-present). In addition, Mr. Lacy served as Senior Adviser (2007-2014) of Oak Hill Capital Partners, L.P. (private equity) and also served as Chief Executive Officer (2005) and Vice Chairman (2005-2006) of Sears Holdings Corporation (retail) and Chief Executive Officer and Chairman of the Board of Sears, Roebuck and Co. (retail, 2000-2005). Previously, Mr. Lacy served as Chairman (2014-2017) and a member (2010-2017) of the Board of Directors of Dave & Buster’s Entertainment, Inc. (restaurant and entertainment complexes), as Chairman (2008-2011) and a member (2006-2015) of the Board of Trustees of the National Parks Conservation Association, and as a member of the Board of Directors for The Hillman Companies, Inc. (hardware wholesalers, 2010-2014), Earth Fare, Inc. (retail grocery, 2010-2014), and The Western Union Company (global money transfer, 2006-2011).
Ned C. Lautenbach (1944)
Year of Election or Appointment: 2000
Trustee
Chairman of the Independent Trustees
Mr. Lautenbach also serves as Trustee of other Fidelity® funds. Mr. Lautenbach currently serves as Vice Chair of the Board of Governors, State University System of Florida (2013-present) and is a member of the Council on Foreign Relations (1994-present). He is also a member and has most recently served as Chairman of the Board of Directors of Artis-Naples (2012-present). Previously, Mr. Lautenbach served as a member and then Lead Director of the Board of Directors of Eaton Corporation (diversified industrial, 1997-2016). He was also a Partner and Advisory Partner at Clayton, Dubilier & Rice, LLC (private equity investment, 1998-2010), as well as a Director of Sony Corporation (2006-2007). In addition, Mr. Lautenbach also had a 30-year career with IBM (technology company) during which time he served as Senior Vice President and a member of the Corporate Executive Committee (1968-1998).
Joseph Mauriello (1944)
Year of Election or Appointment: 2008
Trustee
Mr. Mauriello also serves as Trustee of other Fidelity® funds. Prior to his retirement in January 2006, Mr. Mauriello served in numerous senior management positions including Deputy Chairman and Chief Operating Officer (2004-2005), and Vice Chairman of Financial Services (2002-2004) of KPMG LLP US (professional services, 1965-2005). Mr. Mauriello currently serves as a member of the Independent Directors Council (IDC) Governing Council (2015-present). Previously, Mr. Mauriello served as a member of the Board of Directors of XL Group plc. (global insurance and re-insurance, 2006-2018).
Cornelia M. Small (1944)
Year of Election or Appointment: 2005
Trustee
Ms. Small also serves as Trustee of other Fidelity® funds. Ms. Small is a member of the Board of Directors (2009-present) and Chair of the Investment Committee (2010-present) of the Teagle Foundation. Ms. Small also serves on the Investment Committee of the Berkshire Taconic Community Foundation (2008-present). Previously, Ms. Small served as Chairperson (2002-2008) and a member of the Investment Committee and Chairperson (2008-2012) and a member of the Board of Trustees of Smith College. In addition, Ms. Small served as Chief Investment Officer, Director of Global Equity Investments, and a member of the Board of Directors of Scudder, Stevens & Clark and Scudder Kemper Investments.
Garnett A. Smith (1947)
Year of Election or Appointment: 2018
Trustee
Mr. Smith also serves as Trustee of other Fidelity® funds. Prior to Mr. Smith's retirement, he served as Chairman and Chief Executive Officer of Inbrand Corp. (manufacturer of personal absorbent products, 1990-1997). He also served as President (1986-1990) of Inbrand Corp. Prior to his employment with Inbrand Corp., he was employed by a retail fabric chain and North Carolina National Bank. In addition, Mr. Smith served as a Member of the Advisory Board of certain Fidelity® funds (2012-2013) and as a board member of the Jackson Hole Land Trust (2009-2012).
David M. Thomas (1949)
Year of Election or Appointment: 2008
Trustee
Mr. Thomas also serves as Trustee of other Fidelity® funds. Mr. Thomas serves as Non-Executive Chairman of the Board of Directors of Fortune Brands Home and Security (home and security products, 2011-present), as a member of the Board of Directors (2004-present) and Presiding Director (2013-present) of Interpublic Group of Companies, Inc. (marketing communication), and as a member of the Board of Trustees of the University of Florida (2013-present). Previously, Mr. Thomas served as Executive Chairman (2005-2006) and Chairman and Chief Executive Officer (2000-2005) of IMS Health, Inc. (pharmaceutical and healthcare information solutions), and a Director of Fortune Brands, Inc. (consumer products, 2000-2011).
+ The information includes the Trustee's principal occupation during the last five years and other information relating to the experience, attributes, and skills relevant to the Trustee's qualifications to serve as a Trustee, which led to the conclusion that the Trustee should serve as a Trustee for each fund.
Advisory Board Members and Officers:
Correspondence intended for a Member of the Advisory Board (if any) may be sent to Fidelity Investments, P.O. Box 55235, Boston, Massachusetts 02205-5235. Correspondence intended for an officer or Peter S. Lynch may be sent to Fidelity Investments, 245 Summer Street, Boston, Massachusetts 02210. Officers appear below in alphabetical order.
Name, Year of Birth; Principal Occupation
Vicki L. Fuller (1957)
Year of Election or Appointment: 2018
Member of the Advisory Board
Ms. Fuller also serves as Member of the Advisory Board of other Fidelity® funds. Ms. Fuller serves as a member of the Board of Directors, Audit Committee, and Nominating and Governance Committee of The Williams Companies, Inc. (natural gas infrastructure, 2018-present). Previously, Ms. Fuller served as the Chief Investment Officer of the New York State Common Retirement Fund (2012-2018) and held a variety of positions at AllianceBernstein L.P. (global asset management, 1985-2012), including Managing Director (2006-2012) and Senior Vice President and Senior Portfolio Manager (2001-2006).
Peter S. Lynch (1944)
Year of Election or Appointment: 2003
Member of the Advisory Board
Mr. Lynch also serves as Member of the Advisory Board of other Fidelity® funds. Mr. Lynch is Vice Chairman and a Director of FMR (investment adviser firm) and FMR Co., Inc. (investment adviser firm). In addition, Mr. Lynch serves as a Trustee of Boston College and as the Chairman of the Inner-City Scholarship Fund. Previously, Mr. Lynch served on the Special Olympics International Board of Directors (1997-2006).
William S. Stavropoulos (1939)
Year of Election or Appointment: 2018
Member of the Advisory Board
Mr. Stavropoulos also serves as Member of the Advisory Board of other Fidelity® funds. Mr. Stavropoulos serves as President and Founder of the Michigan Baseball Foundation, the Great Lakes Loons (2007-present). Mr. Stavropoulos is Chairman Emeritus of the Board of Directors of The Dow Chemical Company, where he previously served in numerous senior management positions, including President, CEO (1995-2000; 2002-2004), Chairman of the Executive Committee (2000-2006), and as a member of the Board of Directors (1990-2006). Currently, Mr. Stavropoulos is Chairman of the Board of Directors of Univar Inc. (global distributor of commodity and specialty chemicals), a Director of Teradata Corporation (data warehousing and technology solutions), and a member of the Advisory Board for Metalmark Capital LLC (private equity investment, 2005-present). Mr. Stavropoulos is an operating advisor to Clayton, Dubilier & Rice, LLC (private equity investment). In addition, Mr. Stavropoulos is a member of the University of Notre Dame Advisory Council for the College of Science, a Trustee of the Rollin L. Gerstacker Foundation, and a Director of Artis-Naples in Naples, Florida. Previously, Mr. Stavropoulos served as Trustee of certain Fidelity® funds (2001-2018) and as a Director of Chemical Financial Corporation (bank holding company, 1993-2012) and Tyco International, Ltd. (multinational manufacturing and services, 2007-2012).
Carol B. Tomé (1957)
Year of Election or Appointment: 2018
Member of the Advisory Board
Ms. Tomé also serves as Member of the Advisory Board of other Fidelity® funds. Ms. Tomé is Chief Financial Officer (2001-present) and Executive Vice President of Corporate Services (2007-present) of The Home Depot, Inc. (home improvement retailer) and a Director (2003-present) and Chair of the Audit Committee (2004-present) of United Parcel Service, Inc. (package delivery and supply chain management). Previously, Ms. Tomé served as Trustee of certain Fidelity® funds (2017), Senior Vice President of Finance and Accounting/Treasurer (2000-2007) and Vice President and Treasurer (1995-2000) of The Home Depot, Inc. and Chair of the Board (2010-2012), Vice Chair of the Board (2009 and 2013), and a Director (2008-2013) of the Federal Reserve Bank of Atlanta. Ms. Tomé is also a director or trustee of many community and professional organizations.
Michael E. Wiley (1950)
Year of Election or Appointment: 2018
Member of the Advisory Board
Mr. Wiley also serves as Trustee or Member of the Advisory Board of other Fidelity® funds. Mr. Wiley serves as a Director of High Point Resources (exploration and production, 2005-present). Previously, Mr. Wiley served as a Director of Andeavor Corporation (independent oil refiner and marketer, 2005-2018), a Director of Andeavor Logistics LP (natural resources logistics, 2015-2018), a Director of Post Oak Bank (privately-held bank, 2004-2018), a Director of Asia Pacific Exploration Consolidated (international oil and gas exploration and production, 2008-2013), a member of the Board of Trustees of the University of Tulsa (2000-2006; 2007-2010), a Senior Energy Advisor of Katzenbach Partners, LLC (consulting, 2006-2007), an Advisory Director of Riverstone Holdings (private investment), a Director of Spinnaker Exploration Company (exploration and production, 2001-2005) and Chairman, President, and CEO of Baker Hughes, Inc. (oilfield services, 2000-2004).
Elizabeth Paige Baumann (1968)
Year of Election or Appointment: 2017
Anti-Money Laundering (AML) Officer
Ms. Baumann also serves as AML Officer of other funds. She is Chief AML Officer (2012-present) and Senior Vice President (2014-present) of FMR LLC (diversified financial services company) and is an employee of Fidelity Investments. Previously, Ms. Baumann served as AML Officer of the funds (2012-2016), and Vice President (2007-2014) and Deputy Anti-Money Laundering Officer (2007-2012) of FMR LLC.
John J. Burke III (1964)
Year of Election or Appointment: 2018
Chief Financial Officer
Mr. Burke also serves as Chief Financial Officer of other funds. Mr. Burke serves as Head of Investment Operations for Fidelity Fund and Investment Operations (2018-present) and is an employee of Fidelity Investments (1998-present). Previously Mr. Burke served as head of Asset Management Investment Operations (2012-2018).
William C. Coffey (1969)
Year of Election or Appointment: 2018
Secretary and Chief Legal Officer (CLO)
Mr. Coffey also serves as Secretary and CLO of other funds. Mr. Coffey serves as CLO, Secretary, and Senior Vice President of Fidelity Management & Research Company and FMR Co., Inc. (investment adviser firms, 2018-present); Secretary of Fidelity SelectCo, LLC and Fidelity Investments Money Management, Inc. (investment adviser firms, 2018-present); and CLO of Fidelity Management & Research (Hong Kong) Limited, FMR Investment Management (UK) Limited, and Fidelity Management & Research (Japan) Limited (investment adviser firms, 2018-present). He is Senior Vice President and Deputy General Counsel of FMR LLC (diversified financial services company, 2010-present), and is an employee of Fidelity Investments. Previously, Mr. Coffey served as Assistant Secretary of certain funds (2009-2018) and as Vice President and Associate General Counsel of FMR LLC (2005-2009).
Timothy M. Cohen (1969)
Year of Election or Appointment: 2018
Vice President
Mr. Cohen also serves as Vice President of other funds. Mr. Cohen serves as Co-Head of Global Equity Research (2016-present), a Director of Fidelity Management & Research (Japan) Limited (investment adviser firm, 2016-present), and is an employee of Fidelity Investments. Previously, Mr. Cohen served as Chief Investment Officer - Equity and a Director of Fidelity Management & Research (U.K.) Inc. (investment adviser firm, 2013-2015) and as a Director of Fidelity Management & Research (Hong Kong) Limited (investment adviser firm, 2017).
Jonathan Davis (1968)
Year of Election or Appointment: 2010
Assistant Treasurer
Mr. Davis also serves as Assistant Treasurer of other funds. Mr. Davis serves as Assistant Treasurer of FMR Capital, Inc. (2017-present) and is an employee of Fidelity Investments. Previously, Mr. Davis served as Vice President and Associate General Counsel of FMR LLC (diversified financial services company, 2003-2010).
Adrien E. Deberghes (1967)
Year of Election or Appointment: 2016
Assistant Treasurer
Mr. Deberghes also serves as an officer of other funds. He serves as Assistant Treasurer of FMR Capital, Inc. (2017-present), Executive Vice President of Fidelity Investments Money Management, Inc. (FIMM) (investment adviser firm, 2016-present), and is an employee of Fidelity Investments (2008-present). Previously, Mr. Deberghes served as President and Treasurer of certain Fidelity® funds (2013-2018). Prior to joining Fidelity Investments, Mr. Deberghes was Senior Vice President of Mutual Fund Administration at State Street Corporation (2007-2008), Senior Director of Mutual Fund Administration at Investors Bank & Trust (2005-2007), and Director of Finance for Dunkin' Brands (2000-2005). Previously, Mr. Deberghes served in other fund officer roles.
Laura M. Del Prato (1964)
Year of Election or Appointment: 2018
Assistant Treasurer
Ms. Del Prato also serves as an officer of other funds. Ms. Del Prato is an employee of Fidelity Investments (2017-present). Prior to joining Fidelity Investments, Ms. Del Prato served as a Managing Director and Treasurer of the JPMorgan Mutual Funds (2014-2017). Prior to JPMorgan, Ms. Del Prato served as a partner at Cohen Fund Audit Services (accounting firm, 2012-2013) and KPMG LLP (accounting firm, 2004-2012).
Colm A. Hogan (1973)
Year of Election or Appointment: 2016
Deputy Treasurer
Mr. Hogan also serves as an officer of other funds. Mr. Hogan serves as Assistant Treasurer of FMR Capital, Inc. (2017-present) and is an employee of Fidelity Investments (2005-present). Previously, Mr. Hogan served as Assistant Treasurer of certain Fidelity® funds (2016-2018).
Pamela R. Holding (1964)
Year of Election or Appointment: 2018
Vice President
Ms. Holding also serves as Vice President of other funds. Ms. Holding serves as Co-Head of Global Equity Research (2018-present) and is an employee of Fidelity Investments (2013-present).
Chris Maher (1972)
Year of Election or Appointment: 2013
Assistant Treasurer
Mr. Maher serves as Assistant Treasurer of other funds. Mr. Maher is Vice President of Valuation Oversight, serves as Assistant Treasurer of FMR Capital, Inc. (2017-present), and is an employee of Fidelity Investments. Previously, Mr. Maher served as Vice President of Asset Management Compliance (2013), Vice President of the Program Management Group of FMR (investment adviser firm, 2010-2013), and Vice President of Valuation Oversight (2008-2010).
Rieco E. Mello (1969)
Year of Election or Appointment: 2017
Assistant Treasurer
Mr. Mello also serves as Assistant Treasurer of other funds. Mr. Mello serves as Assistant Treasurer of FMR Capital, Inc. (2017-present) and is an employee of Fidelity Investments (1995-present).
Kenneth B. Robins (1969)
Year of Election or Appointment: 2016
Chief Compliance Officer
Mr. Robins also serves as an officer of other funds. Mr. Robins serves as Compliance Officer of Fidelity Management & Research Company and FMR Co., Inc. (investment adviser firms, 2016-present) and is an employee of Fidelity Investments (2004-present). Previously, Mr. Robins served as Executive Vice President of Fidelity Investments Money Management, Inc. (investment adviser firm, 2013-2016) and served in other fund officer roles.
Stacie M. Smith (1974)
Year of Election or Appointment: 2016
President and Treasurer
Ms. Smith also serves as an officer of other funds. Ms. Smith serves as Assistant Treasurer of FMR Capital, Inc. (2017-present), is an employee of Fidelity Investments (2009-present), and has served in other fund officer roles. Prior to joining Fidelity Investments, Ms. Smith served as Senior Audit Manager of Ernst & Young LLP (accounting firm, 1996-2009). Previously, Ms. Smith served as Assistant Treasurer (2013-2018) and Deputy Treasurer (2013-2016) of certain Fidelity® funds.
Marc L. Spector (1972)
Year of Election or Appointment: 2016
Assistant Treasurer
Mr. Spector also serves as an officer of other funds. Mr. Spector serves as Assistant Treasurer of FMR Capital, Inc. (2017-present) and is an employee of Fidelity Investments (2016-present). Prior to joining Fidelity Investments, Mr. Spector served as Director at the Siegfried Group (accounting firm, 2013-2016), and prior to Siegfried Group as audit senior manager at Deloitte & Touche (accounting firm, 2005-2013).
Shareholder Expense Example
As a shareholder of a Fund, you incur two types of costs: (1) transaction costs, including sales charges (loads) on purchase payments or redemption proceeds, redemption fees and (2) ongoing costs, including management fees, including distribution and/or service (12b-1) fees and other Fund expenses. This Example is intended to help you understand your ongoing costs (in dollars) of investing in the Funds and to compare these costs with the ongoing costs of investing in other mutual funds.
The actual expense Example is based on an investment of $1,000 invested at the beginning of the period and held for the entire period (May 1, 2018 to October 31, 2018) for each Class, except Class Z, and for the period (October 2, 2018 to October 31, 2018) for Class Z. The hypothetical expense Example is based on an investment of $1,000 invested for the one-half year period (May 1, 2018 to October 31, 2018).
Actual Expenses
The first line of the accompanying table for each Class of each Fund provides information about actual account values and actual expenses. You may use the information in this line, together with the amount you invested, to estimate the expenses that you paid over the period. Simply divide your account value by $1,000.00 (for example, an $8,600 account value divided by $1,000.00 = 8.6), then multiply the result by the number in the first line for a class of the Fund under the heading entitled "Expenses Paid During Period" to estimate the expenses you paid on your account during this period. A small balance maintenance fee of $12.00 that is charged once a year may apply for certain accounts with a value of less than $2,000. This fee, which was eliminated effective August 1, 2018, is not included in the table below. If it was, the estimate of expenses you paid during the period would be higher, and your ending account value lower, by this amount. In addition, the Fund, as a shareholder in the underlying Fidelity Central Funds, will indirectly bear its pro-rata share of the fees and expenses incurred by the underlying Fidelity Central Funds. These fees and expenses are not included in the Fund's annualized expense ratio used to calculate the expense estimate in the table below.
Hypothetical Example for Comparison Purposes
The second line of the accompanying table for each Class of each fund provides information about hypothetical account values and hypothetical expenses based on a Class' actual expense ratio and an assumed rate of return of 5% per year before expenses, which is not the Class' actual return. The hypothetical account values and expenses may not be used to estimate the actual ending account balance or expenses you paid for the period. You may use this information to compare the ongoing costs of investing in the Fund and other funds. To do so, compare this 5% hypothetical example with the 5% hypothetical examples that appear in the shareholder reports of the other funds. A small balance maintenance fee of $12.00 that is charged once a year may apply for certain accounts with a value of less than $2,000. This fee, which was eliminated effective August 1, 2018, is not included in the table below. If it was, the estimate of expenses you paid during the period would be higher, and your ending account value lower, by this amount. In addition, each Fund, as a shareholder in the underlying Fidelity Central Funds, will indirectly bear its pro-rata share of the fees and expenses incurred by the underlying Fidelity Central Funds. These fees and expenses are not included in the Fund's annualized expense ratio used to calculate the expense estimate in the table below.
Please note that the expenses shown in the table are meant to highlight your ongoing costs only and do not reflect any transaction costs. Therefore, the second line of the table is useful in comparing ongoing costs only, and will not help you determine the relative total costs of owning different funds. In addition, if these transactional costs were included, your costs would have been higher.
| Annualized Expense Ratio-A | Beginning Account Value | Ending Account Value October 31, 2018 | Expenses Paid During Period | |
| Canada | ||||
| Class A | 1.17% | |||
| Actual | $1,000.00 | $955.30 | $5.77-B | |
| Hypothetical-C | $1,000.00 | $1,019.31 | $5.96-D | |
| Class M | 1.47% | |||
| Actual | $1,000.00 | $953.90 | $7.24-B | |
| Hypothetical-C | $1,000.00 | $1,017.80 | $7.48-D | |
| Class C | 1.89% | |||
| Actual | $1,000.00 | $951.70 | $9.30-B | |
| Hypothetical-C | $1,000.00 | $1,015.68 | $9.60-D | |
| Canada | .85% | |||
| Actual | $1,000.00 | $956.80 | $4.19-B | |
| Hypothetical-C | $1,000.00 | $1,020.92 | $4.33-D | |
| Class I | .82% | |||
| Actual | $1,000.00 | $956.90 | $4.04-B | |
| Hypothetical-C | $1,000.00 | $1,021.07 | $4.18-D | |
| Class Z | .80% | |||
| Actual | $1,000.00 | $926.20 | $.63-E | |
| Hypothetical-C | $1,000.00 | $1,021.17 | $4.08-D | |
| China Region | ||||
| Class A | 1.27% | |||
| Actual | $1,000.00 | $806.80 | $5.78-B | |
| Hypothetical-C | $1,000.00 | $1,018.80 | $6.46-D | |
| Class M | 1.62% | |||
| Actual | $1,000.00 | $805.40 | $7.37-B | |
| Hypothetical-C | $1,000.00 | $1,017.04 | $8.24-D | |
| Class C | 2.01% | |||
| Actual | $1,000.00 | $803.60 | $9.14-B | |
| Hypothetical-C | $1,000.00 | $1,015.07 | $10.21-D | |
| China Region | .96% | |||
| Actual | $1,000.00 | $807.70 | $4.37-B | |
| Hypothetical-C | $1,000.00 | $1,020.37 | $4.89-D | |
| Class I | .98% | |||
| Actual | $1,000.00 | $807.70 | $4.47-B | |
| Hypothetical-C | $1,000.00 | $1,020.27 | $4.99-D | |
| Class Z | .90% | |||
| Actual | $1,000.00 | $886.00 | $.70-E | |
| Hypothetical-C | $1,000.00 | $1,020.67 | $4.58-D | |
| Emerging Asia | 1.01% | |||
| Actual | $1,000.00 | $838.20 | $4.68-B | |
| Hypothetical-C | $1,000.00 | $1,020.11 | $5.14-D | |
| Emerging Markets | ||||
| Emerging Markets | .95% | |||
| Actual | $1,000.00 | $824.90 | $4.37-B | |
| Hypothetical-C | $1,000.00 | $1,020.42 | $4.84-D | |
| Class K | .81% | |||
| Actual | $1,000.00 | $825.30 | $3.73-B | |
| Hypothetical-C | $1,000.00 | $1,021.12 | $4.13-D | |
| Europe | ||||
| Class A | 1.23% | |||
| Actual | $1,000.00 | $907.60 | $5.91-B | |
| Hypothetical-C | $1,000.00 | $1,019.00 | $6.26-D | |
| Class M | 1.56% | |||
| Actual | $1,000.00 | $906.00 | $7.49-B | |
| Hypothetical-C | $1,000.00 | $1,017.34 | $7.93-D | |
| Class C | 2.02% | |||
| Actual | $1,000.00 | $903.90 | $9.69-B | |
| Hypothetical-C | $1,000.00 | $1,015.02 | $10.26-D | |
| Europe | .91% | |||
| Actual | $1,000.00 | $908.90 | $4.38-B | |
| Hypothetical-C | $1,000.00 | $1,020.62 | $4.63-D | |
| Class I | .89% | |||
| Actual | $1,000.00 | $909.10 | $4.28-B | |
| Hypothetical-C | $1,000.00 | $1,020.72 | $4.53-D | |
| Class Z | .90% | |||
| Actual | $1,000.00 | $919.30 | $.71-E | |
| Hypothetical-C | $1,000.00 | $1,020.67 | $4.58-D | |
| Fidelity Japan Fund | ||||
| Class A | 1.35% | |||
| Actual | $1,000.00 | $902.40 | $6.47-B | |
| Hypothetical-C | $1,000.00 | $1,018.40 | $6.87-D | |
| Class M | 1.69% | |||
| Actual | $1,000.00 | $900.40 | $8.10-B | |
| Hypothetical-C | $1,000.00 | $1,016.69 | $8.59-D | |
| Class C | 2.06% | |||
| Actual | $1,000.00 | $899.50 | $9.86-B | |
| Hypothetical-C | $1,000.00 | $1,014.82 | $10.46-D | |
| Japan | 1.07% | |||
| Actual | $1,000.00 | $903.30 | $5.13-B | |
| Hypothetical-C | $1,000.00 | $1,019.81 | $5.45-D | |
| Class I | 1.00% | |||
| Actual | $1,000.00 | $903.80 | $4.80-B | |
| Hypothetical-C | $1,000.00 | $1,020.16 | $5.09-D | |
| Class Z | .96% | |||
| Actual | $1,000.00 | $899.80 | $.75-E | |
| Hypothetical-C | $1,000.00 | $1,020.37 | $4.89-D | |
| Japan Smaller Companies | .94% | |||
| Actual | $1,000.00 | $894.50 | $4.49-B | |
| Hypothetical-C | $1,000.00 | $1,020.47 | $4.79-D | |
| Fidelity Latin America Fund | ||||
| Class A | 1.38% | |||
| Actual | $1,000.00 | $836.70 | $6.39-B | |
| Hypothetical-C | $1,000.00 | $1,018.25 | $7.02-D | |
| Class M | 1.65% | |||
| Actual | $1,000.00 | $835.50 | $7.63-B | |
| Hypothetical-C | $1,000.00 | $1,016.89 | $8.39-D | |
| Class C | 2.12% | |||
| Actual | $1,000.00 | $833.70 | $9.80-B | |
| Hypothetical-C | $1,000.00 | $1,014.52 | $10.76-D | |
| Latin America | 1.08% | |||
| Actual | $1,000.00 | $838.00 | $5.00-B | |
| Hypothetical-C | $1,000.00 | $1,019.76 | $5.50-D | |
| Class I | 1.00% | |||
| Actual | $1,000.00 | $838.20 | $4.63-B | |
| Hypothetical-C | $1,000.00 | $1,020.16 | $5.09-D | |
| Class Z | .95% | |||
| Actual | $1,000.00 | $1,019.10 | $.79-E | |
| Hypothetical-C | $1,000.00 | $1,020.42 | $4.84-D | |
| Nordic | .98% | |||
| Actual | $1,000.00 | $993.40 | $4.92-B | |
| Hypothetical-C | $1,000.00 | $1,020.27 | $4.99-D | |
| Pacific Basin | 1.06% | |||
| Actual | $1,000.00 | $854.90 | $4.96-B | |
| Hypothetical-C | $1,000.00 | $1,019.86 | $5.40-D |
A Annualized expense ratio reflects expenses net of applicable fee waivers.
B Actual expenses are equal to each Class' annualized expense ratio, multiplied by the average account value over the period, multiplied by 184/365 (to reflect the one-half year period).
C 5% return per year before expenses
D Hypothetical expenses are equal to each Class' annualized expense ratio, multiplied by the average account value over the period, multiplied by 184/365 (to reflect the one-half year period).
E Actual expenses are equal to the Class' annualized expense ratio, multiplied by the average account value over the period, multiplied by 30/365 (to reflect the period October 2, 2018 to October 31, 2018).
Distributions (Unaudited)
The Board of Trustees of each fund voted to pay to shareholders of record at the opening of business on record date, the following distributions per share derived from capital gains realized from sales of portfolio securities and dividends derived from net investment income:
| Pay Date | Record Date | Dividends | Capital Gains | |
| Fidelity Canada Fund | ||||
| Class A | 12/10/18 | 12/07/18 | $0.390 | $2.630 |
| Class M | 12/10/18 | 12/07/18 | $0.222 | $2.630 |
| Class C | 12/10/18 | 12/07/18 | $0.000 | $2.630 |
| Canada | 12/10/18 | 12/07/18 | $0.577 | $2.630 |
| Class I | 12/10/18 | 12/07/18 | $0.592 | $2.630 |
| Class Z | 12/10/18 | 12/07/18 | $0.688 | $2.630 |
| Fidelity China Region Fund | ||||
| Class A | 12/10/18 | 12/07/18 | $0.115 | $0.000 |
| Class M | 12/10/18 | 12/07/18 | $0.000 | $0.000 |
| Class C | 12/10/18 | 12/07/18 | $0.000 | $0.000 |
| China Region | 12/10/18 | 12/07/18 | $0.246 | $0.000 |
| Class I | 12/10/18 | 12/07/18 | $0.232 | $0.000 |
| Class Z | 12/10/18 | 12/07/18 | $0.317 | $0.000 |
| Fidelity Emerging Asia Fund | ||||
| Emerging Asia | 12/10/18 | 12/07/18 | $0.391 | $0.880 |
| Fidelity Emerging Markets Fund | ||||
| Emerging Markets | 12/10/18 | 12/07/18 | $0.217 | $0.003 |
| Class K | 12/10/18 | 12/07/18 | $0.263 | $0.003 |
| Fidelity Europe Fund | ||||
| Class A | 12/17/18 | 12/14/18 | $0.108 | $3.427 |
| Class M | 12/17/18 | 12/14/18 | $0.000 | $3.381 |
| Class C | 12/17/18 | 12/14/18 | $0.000 | $3.298 |
| Europe | 12/17/18 | 12/14/18 | $0.318 | $3.427 |
| Class I | 12/17/18 | 12/14/18 | $0.323 | $3.427 |
| Class Z | 12/17/18 | 12/14/18 | $0.405 | $3.427 |
| Fidelity Japan Fund | ||||
| Class A | 12/10/18 | 12/07/18 | $0.000 | $0.000 |
| Class M | 12/10/18 | 12/07/18 | $0.000 | $0.000 |
| Class C | 12/10/18 | 12/07/18 | $0.000 | $0.000 |
| Japan | 12/10/18 | 12/07/18 | $0.050 | $0.000 |
| Class I | 12/10/18 | 12/07/18 | $0.042 | $0.000 |
| Class Z | 12/10/18 | 12/07/18 | $0.063 | $0.000 |
| Fidelity Japan Smaller Companies Fund | ||||
| Japan Smaller Companies | 12/10/18 | 12/07/18 | $0.112 | $0.729 |
| Fidelity Latin America Fund | ||||
| Class A | 12/10/18 | 12/07/18 | $0.403 | $0.000 |
| Class M | 12/10/18 | 12/07/18 | $0.331 | $0.000 |
| Class C | 12/10/18 | 12/07/18 | $0.188 | $0.000 |
| Latin America | 12/10/18 | 12/07/18 | $0.483 | $0.000 |
| Class I | 12/10/18 | 12/07/18 | $0.483 | $0.000 |
| Class Z | 12/10/18 | 12/07/18 | $0.543 | $0.000 |
| Fidelity Nordic Fund | ||||
| Nordic | 12/10/18 | 12/07/18 | $0.053 | $4.546 |
| Fidelity Pacific Basin Fund | ||||
| Pacific Basin | 12/17/18 | 12/14/18 | $0.195 | $2.668 |
The funds hereby designate as capital gain dividend the amounts noted below for the taxable year ended October 31, 2018, or, if subsequently determined to be different, the net capital gain of such year.
| Fidelity Canada Fund | $52,372,439 |
| Fidelity Emerging Asia Fund | $26,219,199 |
| Fidelity Europe Fund | $62,888,387 |
| Fidelity Japan Smaller Companies Fund | $31,301,992 |
| Fidelity Nordic Fund | $20,422,356 |
| Fidelity Pacific Basin Fund | $74,573,000 |
A percentage of the dividends distributed during the fiscal year for the following funds qualify for the dividends–received deduction for corporate shareholders:
| Class A | Class M | Class C | Retail Class | Class I | Class K | |
| Fidelity Canada Fund | ||||||
| December, 2017 | 1% | 1% | 1% | – | – | – |
| Fidelity Emerging Markets Fund | ||||||
| December, 2017 | – | – | – | 7% | – | 6% |
| Fidelity Europe Fund | ||||||
| December, 2017 | 2% | 2% | 2% | 2% | 2% | 2% |
| Fidelity Latin America Fund | ||||||
| December 08, 2017 | 1% | 2% | 5% | 1% | 1% | – |
| December 28, 2017 | 1% | 1% | 1% | 1% | 1% | – |
| Fidelity Nordic Fund | ||||||
| December, 2017 | – | – | – | 1% | – | – |
| Fidelity Pacific Basin Fund | ||||||
| December, 2017 | – | – | – | 1% | – | – |
A percentage of the dividends distributed during the fiscal year for the following funds may be taken into account as a dividend for purposes of the maximum rate under section 1(h)(11) of the Internal Revenue Code.
| Class A | Class M | Class C | Retail Class | Class I | Class K | |
| Fidelity Canada Fund | ||||||
| December, 2017 | 100% | 100% | 100% | 98% | 98% | – |
| Fidelity China Region Fund | ||||||
| December, 2017 | 100% | – | – | 100% | 94% | – |
| Fidelity Emerging Asia Fund | ||||||
| December, 2017 | – | – | – | 80% | – | – |
| Fidelity Emerging Markets Fund | ||||||
| December, 2017 | – | – | – | 100% | – | 100% |
| Fidelity Europe Fund | ||||||
| December, 2017 | 69% | 77% | 89% | 64% | 63% | – |
| Fidelity Japan Fund | ||||||
| December, 2017 | 100% | 100% | 100% | 100% | 100% | – |
| Fidelity Japan Smaller Companies Fund | ||||||
| December, 2017 | – | – | – | 59% | – | – |
| Fidelity Latin America Fund | ||||||
| December 08, 2017 | 49% | 64% | 100% | 37% | 34% | – |
| December 28, 2017 | 30% | 30% | 30% | 30% | 30% | – |
| Fidelity Nordic Fund | ||||||
| December, 2017 | – | – | – | 53% | – | – |
| Fidelity Pacific Basin | ||||||
| December, 2017 | – | – | – | 100% | – | – |
The amounts per share which represent income derived from sources within, and taxes paid to, foreign countries or possessions of the United States are as follows:
| Pay Date | Income | Taxes | |
| Fidelity Canada Fund | |||
| Class A | 12/11/17 | $1.0201 | $0.1731 |
| Class M | 12/11/17 | $0.8331 | $0.1731 |
| Class C | 12/11/17 | $0.6151 | $0.1731 |
| Canada | 12/11/17 | $1.2011 | $0.1731 |
| Class I | 12/11/17 | $1.1961 | $0.1731 |
| Fidelity China Region Fund | |||
| Class A | 12/11/17 | $0.1269 | $0.0519 |
| Class M | 12/11/17 | $0.0000 | $0.0000 |
| Class C | 12/11/17 | $0.0000 | $0.0000 |
| China Region | 12/11/17 | $0.1939 | $0.0519 |
| Class I | 12/11/17 | $0.2079 | $0.0519 |
| Fidelity Emerging Asia Fund | |||
| Emerging Asia | 12/11/17 | $0.4662 | $0.0752 |
| Fidelity Emerging Markets Fund | |||
| Emerging Markets | 12/11/17 | $0.2303 | $0.0413 |
| Class K | 12/11/17 | $0.2683 | $0.0413 |
| Fidelity Europe Fund | |||
| Class A | 12/18/17 | $0.7405 | $0.0616 |
| Class M | 12/18/17 | $0.6684 | $0.0616 |
| Class C | 12/18/17 | $0.5779 | $0.0616 |
| Europe | 12/18/17 | $0.7977 | $0.0616 |
| Class I | 12/18/17 | $0.8140 | $0.0616 |
| Fidelity Japan Fund | |||
| Class A | 12/11/17 | $0.1400 | $0.0270 |
| Class M | 12/11/17 | $0.1090 | $0.0270 |
| Class C | 12/11/17 | $0.0650 | $0.0270 |
| Japan | 12/11/17 | $0.1690 | $0.0270 |
| Class I | 12/11/17 | $0.1970 | $0.0270 |
| Fidelity Japan Smaller Companies Fund | |||
| Japan Smaller Companies | 12/11/17 | $0.3090 | $0.0344 |
| Fidelity Latin America Fund | |||
| Class A | 12/11/17 | $0.2549 | $0.0449 |
| Class M | 12/11/17 | $0.1929 | $0.0449 |
| Class C | 12/11/17 | $0.0649 | $0.0449 |
| Latin America | 12/11/17 | $0.3359 | $0.0449 |
| Class I | 12/11/17 | $0.3629 | $0.0449 |
| Class A | 12/29/17 | $0.0800 | $0.0000 |
| Class M | 12/29/17 | $0.0800 | $0.0000 |
| Class C | 12/29/17 | $0.0800 | $0.0000 |
| Latin America | 12/29/17 | $0.0800 | $0.0000 |
| Class I | 12/29/17 | $0.0800 | $0.0000 |
| Fidelity Nordic Fund | |||
| Nordic | 12/11/17 | $1.1936 | $0.1350 |
| Fidelity Pacific Basin Fund | |||
| Pacific Basin | 12/18/17 | $0.4348 | $0.0478 |
The funds will notify shareholders in January 2019 of amounts for use in preparing 2018 income tax returns.
Board Approval of Investment Advisory Contracts
Targeted International Funds
At its July 2018 meeting, the Board of Trustees, including the Independent Trustees (together, the Board), voted to continue the management contracts with Fidelity Management & Research Company (FMR) and the sub-advisory agreements (together, the Advisory Contracts) for the funds for six months through January 31, 2019, in connection with the reunification of the Fidelity Equity High Income Funds Board, which oversees the funds, and the Sector Portfolios Board.
The Board considered that the approval of the funds' Advisory Contracts will not result in any changes in (i) the investment process or strategies employed in the management of the funds' assets; (ii) the fees and expenses paid by shareholders; (iii) the nature, extent or quality of services provided under the funds' Advisory Contracts; or (iv) the day-to-day management of each fund or the persons primarily responsible for such management. The Board concluded that the funds' Advisory Contracts are fair and reasonable, and that the funds' Advisory Contracts should be renewed, without modification, through January 31, 2019, with the understanding that the Board will consider the annual renewal for a full one year period in January 2019.
In connection with its consideration of future renewals of the funds' Advisory Contracts, the Board will consider: (i) the nature, extent and quality of services provided to the funds, including shareholder and administrative services and investment performance; (ii) the competitiveness of the management fee and total expenses for each fund; (iii) the costs of the services and profitability, including the revenues earned and the expenses incurred in conducting the business of developing, marketing, distributing, managing, administering, and servicing each fund and its shareholders, to the extent applicable, as well as potential fall-out benefits from Fidelity's non-fund businesses; and (iv) whether there have been economies of scale in respect of the Fidelity funds, whether the Fidelity funds (including the funds) have appropriately benefited from any such economies of scale, and whether there is the potential for realization of any further economies.
Based on its evaluation of all of the conclusions noted above, and after considering all factors it believed relevant, the Board ultimately concluded that the funds' management fee structures are fair and reasonable, and that the continuation of the funds' Advisory Contracts should be approved.
![]()
Corporate Headquarters
245 Summer St.
Boston, MA 02210
www.fidelity.com
TIF-ANN-1218
1.754542.118
Item 2.
Code of Ethics
As of the end of the period, October 31, 2018, Fidelity Investment Trust (the trust) has adopted a code of ethics, as defined in Item 2 of Form N-CSR, that applies to its President and Treasurer and its Chief Financial Officer. A copy of the code of ethics is filed as an exhibit to this Form N-CSR.
Item 3.
Audit Committee Financial Expert
The Board of Trustees of the trust has determined that Joseph Mauriello is an audit committee financial expert, as defined in Item 3 of Form N-CSR. Mr. Mauriello is independent for purposes of Item 3 of Form N-CSR.
Item 4.
Principal Accountant Fees and Services
Fees and Services
The following table presents fees billed by PricewaterhouseCoopers LLP (“PwC”) in each of the last two fiscal years for services rendered to Fidelity Canada Fund, Fidelity China Region Fund, Fidelity Emerging Asia Fund, Fidelity Emerging Markets Fund, Fidelity Europe Fund, Fidelity Japan Fund, Fidelity Japan Smaller Companies Fund, Fidelity Latin America Fund, Fidelity Nordic Fund and Fidelity Pacific Basin Fund (the “Funds”):
Services Billed by PwC
October 31, 2018 FeesA
Audit Fees | Audit-Related Fees | Tax Fees | All Other Fees | |
Fidelity Canada Fund | $58,000 | $5,200 | $5,200 | $2,600 |
Fidelity China Region Fund | $69,000 | $6,000 | $5,200 | $3,000 |
Fidelity Emerging Asia Fund | $62,000 | $5,500 | $5,200 | $2,700 |
Fidelity Emerging Markets Fund | $72,000 | $6,300 | $5,400 | $3,100 |
Fidelity Europe Fund | $64,000 | $5,700 | $5,200 | $2,800 |
Fidelity Japan Fund | $63,000 | $5,500 | $5,200 | $2,700 |
Fidelity Japan Smaller Companies Fund | $52,000 | $4,600 | $5,200 | $2,300 |
Fidelity Latin America Fund | $62,000 | $5,500 | $5,200 | $2,700 |
Fidelity Nordic Fund | $51,000 | $4,600 | $5,200 | $2,300 |
Fidelity Pacific Basin Fund | $63,000 | $5,500 | $5,400 | $2,700 |
October 31, 2017 FeesA
Audit Fees | Audit-Related Fees | Tax Fees | All Other Fees | |
Fidelity Canada Fund | $57,000 | $5,900 | $5,700 | $2,800 |
Fidelity China Region Fund | $69,000 | $6,300 | $5,500 | $3,000 |
Fidelity Emerging Asia Fund | $62,000 | $5,900 | $5,500 | $2,800 |
Fidelity Emerging Markets Fund | $71,000 | $6,800 | $5,700 | $3,200 |
Fidelity Europe Fund | $64,000 | $6,100 | $7,200 | $2,900 |
Fidelity Japan Fund | $62,000 | $6,000 | $6,200 | $2,800 |
Fidelity Japan Smaller Companies Fund | $52,000 | $5,000 | $5,500 | $2,400 |
Fidelity Latin America Fund | $62,000 | $5,900 | $5,500 | $2,800 |
Fidelity Nordic Fund | $51,000 | $5,000 | $5,500 | $2,400 |
Fidelity Pacific Basin Fund | $63,000 | $6,000 | $5,700 | $2,900 |
A Amounts may reflect rounding.
The following table presents fees billed by PwC that were required to be approved by the Audit Committee for services that relate directly to the operations and financial reporting of the Funds and that are rendered on behalf of Fidelity Management & Research Company (“FMR”) and entities controlling, controlled by, or under common control with FMR (not including any sub-adviser whose role is primarily portfolio management and is subcontracted with or overseen by another investment adviser) that provide ongoing services to the Funds (“Fund Service Providers”):
Services Billed by PwC
October 31, 2018A | October 31, 2017A | |
Audit-Related Fees | $7,745,000 | $12,525,000 |
Tax Fees | $20,000 | $155,000 |
All Other Fees | $- | $- |
A Amounts may reflect rounding.
“Audit-Related Fees” represent fees billed for assurance and related services that are reasonably related to the performance of the fund audit or the review of the fund's financial statements and that are not reported under Audit Fees.
“Tax Fees” represent fees billed for tax compliance, tax advice or tax planning that relate directly to the operations and financial reporting of the fund.
“All Other Fees” represent fees billed for services provided to the fund or Fund Service Provider, a significant portion of which are assurance related, that relate directly to the operations and financial reporting of the fund, excluding those services that are reported under Audit Fees, Audit-Related Fees or Tax Fees.
Assurance services must be performed by an independent public accountant.
* * *
The aggregate non-audit fees billed by PwC for services rendered to the Funds, FMR (not including any sub-adviser whose role is primarily portfolio management and is subcontracted with or overseen by another investment adviser), and any Fund Service Provider for each of the last two fiscal years of the Funds are as follows:
Billed By | October 31, 2018A | October 31, 2017A |
PwC | $10,895,000 | $15,410,000 |
A Amounts may reflect rounding.
The trust's Audit Committee has considered non-audit services that were not pre-approved that were provided by PwC to Fund Service Providers to be compatible with maintaining the independence of PwC in its audit of the Funds, taking into account representations from PwC, in accordance with Public Company Accounting Oversight Board rules, regarding its independence from the Funds and its related entities and FMR’s review of the appropriateness and permissibility under applicable law of such non-audit services prior to their provision to the Fund Service Providers.
Audit Committee Pre-Approval Policies and Procedures
The trust’s Audit Committee must pre-approve all audit and non-audit services provided by a fund’s independent registered public accounting firm relating to the operations or financial reporting of the fund. Prior to the commencement of any audit or non-audit services to a fund, the Audit Committee reviews the services to determine whether they are appropriate and permissible under applicable law.
The Audit Committee has adopted policies and procedures to, among other purposes, provide a framework for the Committee’s consideration of non-audit services by the audit firms that audit the Fidelity funds. The policies and procedures require that any non-audit service provided by a fund audit firm to a Fidelity fund and any non-audit service provided by a fund auditor to a Fund Service Provider that relates directly to the operations and financial reporting of a Fidelity fund (“Covered Service”) are subject to approval by the Audit Committee before such service is provided.
All Covered Services must be approved in advance of provision of the service either: (i) by formal resolution of the Audit Committee, or (ii) by oral or written approval of the service by the Chair of the Audit Committee (or if the Chair is unavailable, such other member of the Audit Committee as may be designated by the Chair to act in the Chair’s absence). The approval contemplated by (ii) above is permitted where the Treasurer determines that action on such an engagement is necessary before the next meeting of the Audit Committee.
Non-audit services provided by a fund audit firm to a Fund Service Provider that do not relate directly to the operations and financial reporting of a Fidelity fund are reported to the Audit Committee periodically.
Non-Audit Services Approved Pursuant to Rule 2-01(c)(7)(i)(C) and (ii) of Regulation S-X (“De Minimis Exception”)
There were no non-audit services approved or required to be approved by the Audit Committee pursuant to the De Minimis Exception during the Funds’ last two fiscal years relating to services provided to (i) the Funds or (ii) any Fund Service Provider that relate directly to the operations and financial reporting of the Funds.
Item 5.
Audit Committee of Listed Registrants
Not applicable.
Item 6.
Investments
(a)
Not applicable.
(b)
Not applicable
Item 7.
Disclosure of Proxy Voting Policies and Procedures for Closed-End Management Investment Companies
Not applicable.
Item 8.
Portfolio Managers of Closed-End Management Investment Companies
Not applicable.
Item 9.
Purchase of Equity Securities by Closed-End Management Investment Company and Affiliated Purchasers
Not applicable.
Item 10.
Submission of Matters to a Vote of Security Holders
There were no material changes to the procedures by which shareholders may recommend nominees to the trust’s Board of Trustees.
Item 11.
Controls and Procedures
(a)(i) The President and Treasurer and the Chief Financial Officer have concluded that the trust’s disclosure controls and procedures (as defined in Rule 30a-3(c) under the Investment Company Act) provide reasonable assurances that material information relating to the trust is made known to them by the appropriate persons, based on their evaluation of these controls and procedures as of a date within 90 days of the filing date of this report.
(a)(ii) There was no change in the trust’s internal control over financial reporting (as defined in Rule 30a-3(d) under the Investment Company Act) that occurred during the period covered by this report that has materially affected, or is reasonably likely to materially affect, the trust’s internal control over financial reporting.
Item 12.
Disclosure of Securities Lending Activities for Closed-End Management
Investment Companies
Not applicable.
Item 13.
Exhibits
(a) | (1) | Code of Ethics pursuant to Item 2 of Form N-CSR is filed and attached hereto as EX-99.CODE ETH. |
(a) | (2) | Certification pursuant to Rule 30a-2(a) under the Investment Company Act of 1940 (17 CFR 270.30a-2(a)) is filed and attached hereto as Exhibit 99.CERT. |
(a) | (3) | Not applicable. |
(b) | Certification pursuant to Rule 30a-2(b) under the Investment Company Act of 1940 (17 CFR 270.30a-2(b)) is furnished and attached hereto as Exhibit 99.906CERT. |
SIGNATURES
Pursuant to the requirements of the Securities Exchange Act of 1934 and the Investment Company Act of 1940, the registrant has duly caused this report to be signed on its behalf by the undersigned, thereunto duly authorized.
Fidelity Investment Trust
By: | /s/Stacie M. Smith |
Stacie M. Smith | |
President and Treasurer | |
Date: | December 26, 2018 |
Pursuant to the requirements of the Securities Exchange Act of 1934 and the Investment Company Act of 1940, this report has been signed below by the following persons on behalf of the registrant and in the capacities and on the dates indicated.
By: | /s/Stacie M. Smith |
Stacie M. Smith | |
President and Treasurer | |
Date: | December 26, 2018 |
By: | /s/John J. Burke III |
John J. Burke III | |
Chief Financial Officer | |
Date: | December 26, 2018 |