A SELF-CONTAINED APPRAISAL REPORT OF
The “As Is” Market Value of a
128-unit apartment complex
Known as Chimney Square
Located at 3201 South 23rd Street
Abilene, Texas
File No. 06-1385
PREPARED FOR
Mr. John Werra
Univesco
2800 North Dallas Parkway, Ste 100
Dallas, TX 75093
EFFECTIVE DATE OF APPRAISAL
January 2, 2007
PREPARED BY
Deverick & Associates, Inc.
5420 LBJ Freeway, Suite 1335
Dallas, Texas 75240
PART I INTRODUCTION |
DEVERICK & ASSOCIATES, INC AUSTIN • DALLAS • HOUSTON • OKLAHOMA CITY • SAN ANTONIO • TULSA WWW.DEVERICK.COM | ||
January 4, 2007
Mr. John Werra
Univesco
2800 North Dallas Parkway, Ste 100 Dallas, TX 75093
Re: An appraisal report, File No. 06-1385 of the "As Is" Fee Simple Estate Market Value of a 128-unit apartment complex, known as Chimney Square, located at 3201 South 23rd Street, Abilene, Texas.
Dear Mr. Werra:
Per your request, we have made an investigation and analysis of the following described property and the improvements associated with the site:
Two tracts of land totaling 7.589 acres with Tract I (7.194 acres) being described as all of Lot 2, Block A and Tract I (0.395 acres) being described as the easterly 50' of Lot 3, Block A, Chimney Square Addition, City of Abilene, Taylor County, Texas
The subject appraisal has been prepared in order to estimate the market value as defined subsequently in this report, where the value reported reflects a market value for the rights in realty. Information provided by Univesco or the property owner and used in this analysis includes a site plan, floor plans, current rent roll, historic operating statements and property specific data.
The subject property was physically inspected on January 2, 2007, and the value reported is based on the date of inspection. The reported value is based on the subject's "As Is" condition, as of the date reported.
This appraisal report has been prepared and reviewed by staff appraisers associated with Deverick & Associates, Inc., each of whom is recognized and acknowledged by individual resume and by signature on the Certificate following the Correlation and Final Value Estimate.
We are unbiased with respect to the parties involved and have no present nor contemplated future interest in the property appraised. Accordingly, statements of fact are to the best of our knowledge correct, and compensation for making the appraisal has in no manner been contingent upon the value conclusions reported herein.
The appraisal assignment was drafted under Standards Rule 2-2, as defined in the Uniform Standards of Professional Practice (USPAP), and performed under Standards Rule 1 of USPAP which satisfies the requirements of Title 12 of the Federal Institutions Reform, Recovery and Enforcement Act of 1989 (FIRREA), and the regulations promulgated thereunder. This report also complies with Univesco appraisal guidelines.
COMMERCIAL REAL ESTATE APPRAISAL, BROKERAGE & CONSULTING
Dallas Office 5420 LBJ Freeway, Suite 1335, Dallas, Texas 75240 (972) 458-0001 Fax (214) 550-2594
WWW. DEVERICK.COM
Mr. John Werra
January 4, 2007
Page Two
In the case of the subject property, it is our opinion that it would require under 12 months of marketing and exposure time to realize the total market value potential of the property. This report is prepared subject to the "Certification and Final Value Estimate" and certain assumptions and limiting conditions which are delineated within the text of this report. Any use of this study should be done only after thoroughly reviewing the summary of all such assumptions and limiting conditions. The property is being appraised assuming that there are no environmental conditions nor other hazards adversely affecting the subject.
Based on our investigation and analyses, it is our opinion that the "As Is" Market Value of the subject property’s Fee Simple Estate (subject to short-term leases), as of January 2, 2007, is:
FIVE MILLION TWO HUNDRED FIFTY THOUSAND DOLLARS
$5,250,000
The following report provides an analysis of the subject property and its relationship to the neighborhood and general market conditions. The report also sets forth the methodology utilized in our analysis.
Respectfully submitted, Deverick & Associates, Inc. | ||
John D. Jordan, MAI Principal/Appraiser State Certified Appraiser TX-1321 156-G | Victor K. Thomas Inspecting Appraiser State Certified Appraiser TX-1335034-G |
TABLE OF CONTENTS
PART I - INTRODUCTION | PAGE |
Letter of Transmittal | i |
Table of Contents | iii |
PART II - NATURE OF ASSIGNMENT | |
Summary of Salient Facts & Conclusions | 1 |
| Subject Photographs | 6 |
| Assumptions & Limiting Conditions | 8 |
| Property Identification | 14 |
| Purpose and Date of Appraisal | 14 |
| Property Rights Appraised | 14 |
| Definition of Market Value | 15 |
| Scope of The Assignment | 16 |
| History of Ownership | 17 |
| Real Estate/Business Tax Information | 18 |
PART III - REGIONAL AND NEIGHBORHOOD ANALYSIS | |
Regional Map | 23 |
| Regional Analysis | 24 |
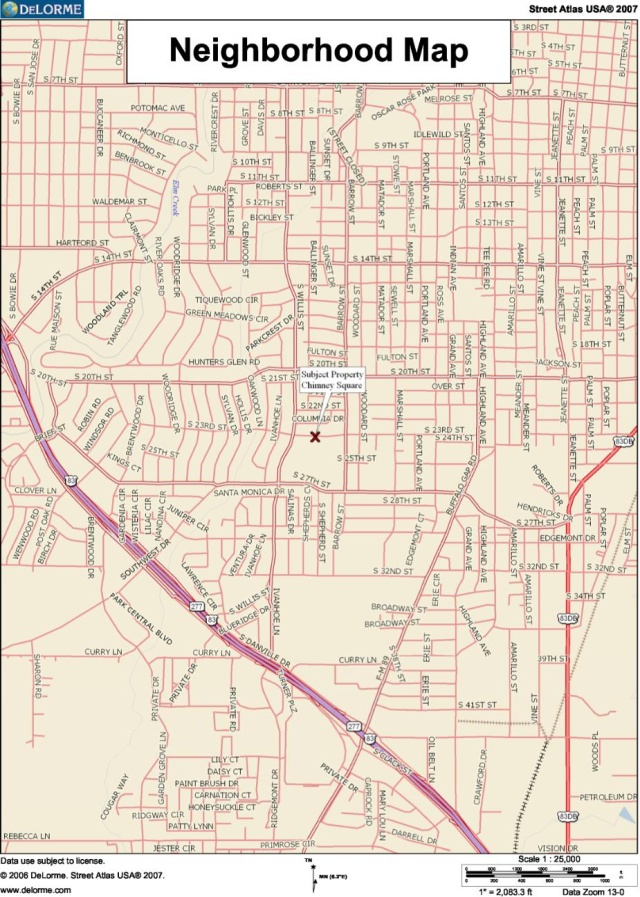
| Neighborhood Map | 31 |
| Neighborhood Analysis | 32 |
| Apartment Submarket Analysis | 36 |
PART IV - SUBJECT PROPERTY DATA | |
Site Analysis | 39 |
| Description of Improvements | 41 |
| Highest and Best Use Analysis | 44 |
PART V - VALUATION AND CONCLUSIONS | PAGE |
The Appraisal Process | 49 |
| Cost Approach | 51 |
Replacement Cost of Improvements | 51 |
Insurable Value | 55 |
| Sales Comparison Approach to Value | 56 |
Comparable Improved Sales | 58 |
Comparable Improved Sales Location Map | 68 |
Sales Comparison Approach Analysis | 69 |
NOI / Price Relationship | 75 |
EGIM | 77 |
Conclusion | 78 |
| Income Approach to Value | 80 |
Comparable Rentals | 82 |
Comparable Rentals Location Map | 94 |
Income Analysis | 95 |
Expense Analysis | 102 |
Subject's Pro-Forma | 110 |
Direct Capitalization | 111 |
Conclusions | 114 |
| Reconciliation and Final Estimate of Value | 115 |
| Marketing/Exposure Time Period | 116 |
| Certification of Value | 117 |
Qualifications of Appraisers | 119 |
ADDENDA
Addendum A - Financial Exhibits
Addendum B - Site and Improvement Exhibits Addendum C - Fee Agreement
PART II NATURE OF THE ASSIGNMENT |
Summary of Salient Facts
| Name: | Chimney Square |
| Legal Description: | Two tracts of land totaling 7.5 89 acres with Tract I (7.194 acres) being described as all of Lot 2, Block A and Tract II (0.395 acres) being described as the easterly 50' of Lot 3, Block A, Chimney Square Addition, City of Abilene, Taylor County, Texas |
| Property Type: | 128-unit apartment complex |
| Location: | The property is located along the south side of South 23rd Street, just east of South Willis Street in the south-central portion of the City of Abilene. |
| Address: | 3201 South 23rd Street |
| City: | Abilene |
| County: | Taylor |
| State: | Texas |
| Zip Code: | 79605 |
| Site Description: | The site reflects an irregular, but useable, shaped tract with level topography that appears adequate for drainage. |
| Land Area: | 7.589 acres or 330,577 square feet (per Survey) |
| Frontage/Access: | The site has adequate frontage and access with approximately 310 feet of frontage along the south side of South 23rd Street with one, double curb-cut allowing ingress and egress. The site also has a 50 foot wide exclusive easement at the southeast corner of the property that allows direct access to South 27th Street. Overall, access to the site is considered good. |
| Flood Hazard: | The site exhibits a level topography. According to FEMA Community Panel #4854500035D, dated September 5, 1990, a small portion of the site lies within Zone B and Zone A6, both of which are defined as flood hazard areas for which flood depths have been determined. Flood insurance is available and is recommended. The majority of the site is in Zone X, beyond the 100-year flood plain. We recommend that the services of a qualified professional surveyor be retained to make a determination of the impact of flood area designations. |
| Utilities: | All public utilities are available and with adequate capacity for the existing use. Electricity is individually or tenant metered and water/sewer is master-metered and paid by the property. |
Water/Sewer - City of Abilene | |
Electric - Green Mountain | |
Telephone - AT&T |
1
Summary of Salient Facts
| Zoning: | RM-2 (Multi-family residential) |
| Permitted Uses: | The site is zoned RM-2, Multi-Family District by the City of Abilene. This district is intended for medium to high density development of multi-family residences. Based on the current zoning, it appears that the subject improvements represent a legal and conforming use. |
| Soil Conditions: | In the absence of a soil survey, it is assumed that the subject soils are capable of supporting a moderate scale development. |
| Easements/Encroachments: | Upon review of the survey provided, it appears the subject is not adversely affected by any detrimental easements or encroachments. It is assumed that there are no adverse easements or encroachments. |
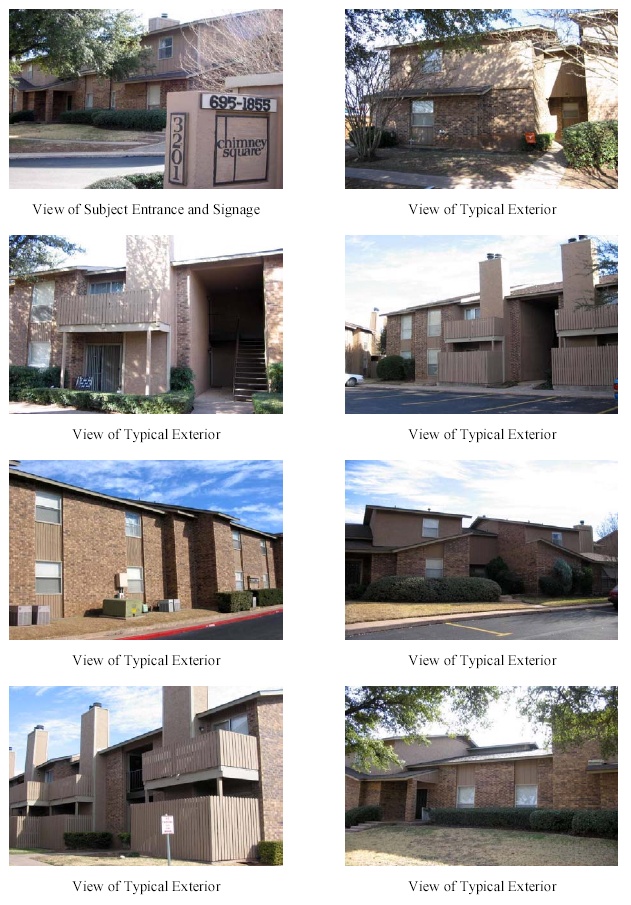
| Improvement Description: | The subject is a garden-style apartment project with 128 units contained within 17 buildings. The apartment buildings are two-story with brick veneer, stucco and wood siding exterior. Roofs are pitched with composition shingles and gutters. In addition, the property has a separate leasing office, which also includes a clubhouse and maintenance/storage area. The property appears reasonably well maintained with no apparent deferred maintenance. The parking areas are asphalt paved and in average condition. There are a total of 199 surface parking spaces, including 134 carports. In addition, each of the townhome units has double car garages with a total of 46 parking spaces. |
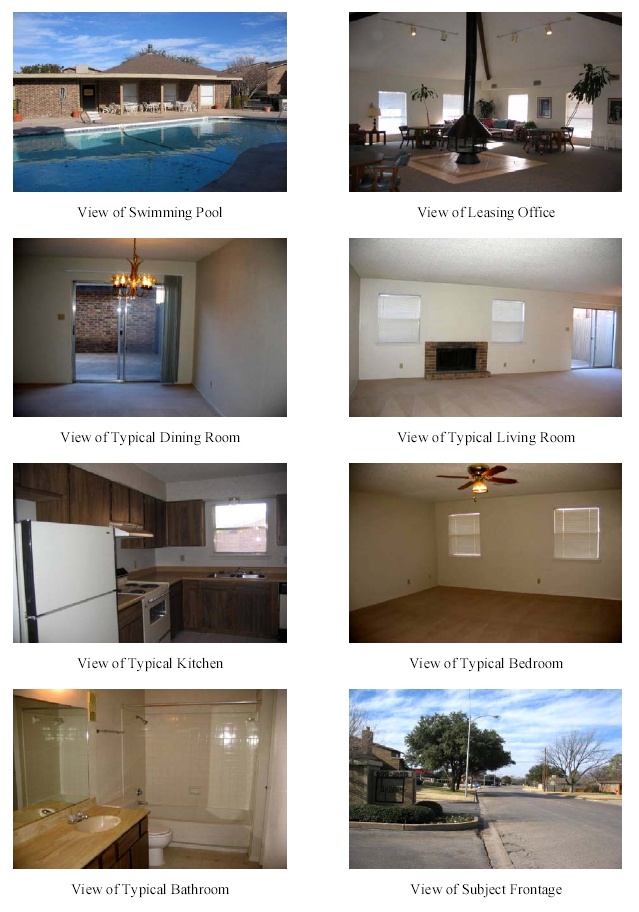
| Project Amenities: | Project amenities include a leasing office, clubhouse, swimming pool, two laundry facilities, 134 carports, attached garages and mature landscaping. |
| Unit Amenities: | Unit amenities consist of standard kitchen appliances, ceiling fans, pantries, linen closets, fireplaces, full sized washer/dryer connections in two and three bedroom units, fenced patios and double car garages in townhome units. |
| Condition: | Average |
| Total Parking: | 245 spaces or 1.91 spaces per unit |
| Covered Parking: | 177 |
| Year of Construction: | 1981 |
| Economic Life (Years): | 1981 |
| Overall Effective Age (Years): | 20 |
| Quality Class: | B+ |
| Average Unit Size: | 989 SF |
| Land to Building Ratio: | 2.58 :1 |
| Project Density: | 16.9 :units per acre |
2
Summary of Salient Facts
Floorplan | Units | SF | Total SF | Special Amenities/Comments |
| 1 Bd 1.0 Ba | 8 | 670 | 5,360 | Standard appliances, FP |
| 1 Bd 1.0 Ba | 44 | 684 | 30,096 | Standard appliances, FP |
| 2 Bd 1.0 Ba | 40 | 958 | 38,320 | Standard appliances, WDC, FP |
| 2 Bd 1.0 Ba | 12 | 964 | 11,568 | Standard appliances, WDC, FP |
| 2 Bd 2.0 Ba | 1 | 1,386 | 1,386 | Standard appliances, WDC, FP |
| 2 Bd 2.5 Ba, TH | 2 | 1,700 | 3,400 | Standard appliances, WDC, FP |
| 3 Bd 2.0 Ba, TH | 11 | 1,680 | 18,480 | Standard appliances, WDC, FP |
| 3 Bd 3.0 Ba, TH | 2 | 1,737 | 3,474 | Standard appliances, WDC, FP |
| 3 Bd 2.0 Ba, TH | 3 | 1,805 | 5,415 | Standard appliances, WDC, FP |
| 3 Bd 3.0 Ba, TH | 5 | 1,811 | 9,055 | Standard appliances, WDC, FP |
Total (Mean) | 128 | 989 | 126,554 |
Net Rentable Area (SF): | 126,554 |
Leasing Office/Common Areas (SF): | 1,500 (Leasing, Clubhouse & Maintenance space included) |
Gross Building Area (SF): | 128,054 |
Current Occupancy: | 98% |
Percent Leased: | 98% |
Stabilized Vacancy & Collection Loss: | 5.0% (plus 1% loss-to-lease) |
Current Average Rent: | $0.65 /SF/month |
Quoted Street Rent: | $0.66 /SF/month |
Proposed Gross Potential Rent: | $0.66 /SF/month |
Highest and Best Use - If Vacant: | Future apartment development |
Highest and Best Use - As Improved: | Continued use as a 128-unit apartment project |
Purpose of the Report: | To estimate the “As Is” Market Value of the subject property subject to short-term leases |
Property Rights Appraised: | Fee Simple Estate |
Intended Use of the Appraisal: | This report is intended to serve as a basis for asset evaluation |
Capital Improvements and Rent Loss: | $0 |
Effective Date of Appraisal: | January 2, 2007 |
Date of Property Inspection: | January 2, 2007 |
Date of Report: | January 4, 2007 |
3
Summary of Salient Facts
Proforma For Chimney Square
Total | $/SF | $/Unit | % of EGIM | ||||||||||
| Potential Gross Rental Income | $ | 1,002,504 | $ | 7.92 | $ | 7,832 | 103.5 | % | |||||
| Plus: Other Income | $ | 26,000 | $ | 0.21 | $ | 203 | 2.7 | % | |||||
| Less: Vacancy/Collection Loss 5.0% | ($50,125 | ) | ($0.40 | ) | ($392 | ) | (5.2 | )% | |||||
| Less: Loss-to-Lease at 1.0% | ($10,025 | ) | ($0.08 | ) | ($78 | ) | (1.0 | )% | |||||
Effective Gross Income | $ | 968,354 | $ | 7.65 | $ | 7,565 | 100.0 | % | |||||
| Less: Operating Expenses | ($494,107 | ) | ($3.90 | ) | ($3,860 | ) | (51.0 | )% | |||||
| Less: Reserves for Replacement | ($38,400 | ) | ($0.30 | ) | ($300 | ) | (4.0 | )% | |||||
Net Operating Income | $ | 435,846 | $ | 3.44 | $ | 3,405 | 45.0 | % | |||||
Value Indications | As Is | ||||||||||||
| Cost Approach: | N/A | ||||||||||||
| Insurable Value: | $ | 6,900,000 | |||||||||||
| Sales Comparison Approach: | $ | 5,200,000 | |||||||||||
| Income Approach: | $ | 5,300,000 | |||||||||||
Market Value Conclusion: | $ | 5,250,000 | |||||||||||
“As Is” Value Indicators
| EGIM by Analysis: | 6.40 | Resulting: 5.42 |
| Stabilized OAR By Analysis: | 8.25% | Resulting: 8.30% |
| Value/SF: | $41.48 | |
| Value/Unit: | $41,016 | |
| Appraisers: | Deverick & Associates, Inc. | |
| John D. Jordan, MAI | ||
| Victor K. Thomas | ||
| File Number: | 06-1385 | |
4
INTRODUCTORY PHOTOGRAPHS |
5
Subject Photographs
6
Subject Photographs
7
Assumptions and Limiting Conditions
This appraisal report is subject to the following assumptions and limiting conditions. These assumptions are considered necessary by to make a proper estimate of value in accordance with the appraisal assignment. The first 21 categories reflect standard assumptions and limiting conditions that are applicable to all appraisals performed by Deverick & Associates. Category 22 details extraordinary conditions or assumptions that is uncertain information which is presumed as fact. Category 23 details hypothetical conditions or that which is contrary to what exists for the purposes of analysis. We may also cite specific assumptions and limiting conditions elsewhere throughout the appraisal report.
| 1. | COPIES, PUBLICATION, DISTRIBUTION, USE OF REPORT - Possession of this report or any copy thereof does not carry with it the right of publication, nor may it be used for other than its intended use; the physical reports remain the property of the appraiser for the use of the client, the fee being for the analytical services only. The report may not be used for any purpose by any person or corporation other than the client and or their assignee. Please be advised that you have the right to assign the appraisal to an investor, and an assignee may rely on the appraisal as though it were addressed to the assignee. |
Neither all nor any part of the contents of this report shall be conveyed to the public through advertising, public relations efforts, news, sales or other media, without the written consent and approval of Deverick & Associates, Inc., nor may any reference be made in such a public communication to the Appraisal Institute or the MAI designation.
This appraisal is to be used only in its entirety and no part is to be used without the whole report. All conclusions and opinions set forth in the report were prepared by the appraisers whose signatures appear on the appraisal report, unless indicated as "Review Appraiser". No change of any item in the report shall be made by anyone other than the appraisers, and the appraisers and firm shall have no responsibility if any unauthorized change is made.
| 2. | CONFIDENTIALITY - The appraisers may not give a copy of the report to anyone other than the client or his designee as specified in writing. Furthermore, the appraisers will not divulge the material contents of the report, either orally or in writing, to anyone other than the client or designee. Exceptions may be made if the report is subpoenaed by a court of law with proper authority, or if requested by the Appraisal Institute to assist in ethics enforcement. |
| 3. | EXHIBITS - The sketches and maps in this report are included to assist the reader in visualizing the property and are not necessarily to scale. Various photos, if any, are included for the same purpose and are not intended to represent the property in other than actual status, as of the date of the photos. |
| 4. | TRADE SECRETS - This appraisal consists of "trade secrets and commercial or financial information" which is privileged and confidential and exempt from disclosure under 5 U.S.C. 552 (b)(4). Notify Deverick & Associates, Inc., of any request to reproduce this appraisal in whole or in part. |
8
Assumptions and Limiting Conditions
| 5. | INFORMATION USED - No responsibility is assumed for accuracy of information furnished by others, including the client, his designees, public records, published data sources, or other real estate professionals. The comparable data relied upon in this report has been confirmed with one or more parties familiar with the transaction or from affidavit, and all are considered appropriate for inclusion to the best of our knowledge and judgment. In some instances, the data may have been verified by associates who may not have worked on this particular appraisal. |
| 6. | COMPONENT VALUES - The estimated values for the entire property applies only under the current or proposed utilization. The separate value estimates for land and improvements, if any, must not be used in conjunction with any other appraisal and are invalid if so used. |
| 7. | LIMITS OF EXPERTISE (LEGAL, ENGINEERING, HIDDEN COMPONENTS) - The appraisers assume no responsibility for matters beyond their personal expertise or the scope of the assignment, including all legal issues and items related to architecture, mechanics, engineering, or soil conditions. |
No opinion is rendered as to the title, which is presumed to be good and merchantable. The property is appraised as if free and clear of encumbrances, unless otherwise stated in this report. The legal description set forth in this report is assumed to be accurate, but the appraisers make no warranty.
The appraiser has inspected, by observation, the land and the improvements thereon; however, it is usually impractical and beyond the scope of this assignment to personally observe conditions beneath the soil, hidden structures, or mechanical components within the improvements. No representations are made herein as to these matters, and the value estimates specifically assume no adverse conditions exist, unless specifically identified in this report. The soils at the subject property appear reasonably firm to the untrained eye; however, the degree of subsidence in the area is not known. The appraisers do not warrant against problems that could arise from soil conditions. The appraisal is based on there being no hidden or unapparent conditions of the property site, subsoil, or structures that would render it more or less valuable. No responsibility is assumed for any such conditions or for any expertise or engineering required to discover or correct them.
All mechanical components are assumed to be in operable condition and typical of the market and property type. Unless otherwise stated, the condition of heating, cooling, ventilating, electrical and plumbing equipment is considered to be commensurate with the overall condition of the improvements.
| 8. | TESTIMONY, CONSULTATION, COMPLETION OF CONTRACT FOR APPRAISAL SERVICES - The contract for appraisal, consultation or analytical service is fulfilled and the total fee payable upon completion of the report. The fee for this appraisal or study is for the service rendered and not for the time spent on the physical report. Neither the appraisers nor any other employees of Deverick & Associates, Inc. will be asked or required to give testimony in court or hearing because of having made the appraisal, in full or in part. Nobody associated with Deverick & Associates, Inc. will engage in post-appraisal consultation with the client or third parties except under separate arrangement and at an additional fee. |
9
Assumptions and Limiting Conditions
| 9. | AUXILIARY AND RELATED STUDIES - Unless stated within the body of the report, the appraisers have neither prepared nor been provided with auxiliary studies related to the subject property, including an environmental impact study, special market study, highest and best use analysis, or feasibility study. If any such studies are subsequently made available to Deverick & Associates, Inc., the appraisers reserve the unlimited right to alter, amend, revise or rescind any of the statements, findings, opinions, value estimates, or conclusions set forth in this appraisal report. |
| 10. | DOLLAR VALUES, PURCHASING POWER - The Market Value estimated and the costs used are as of the date of the estimate of value. All dollar amounts are based on the purchasing power and price of the dollar as of the date of the value estimate. |
| 11. | THE EXISTENCE OF HAZARDOUS SUBSTANCES - Unless otherwise stated in this report, the appraiser(s) have no knowledge of the existence of hazardous waste products or any resultant contamination, including, without limitation, asbestos, polychlorinated biphenyl, petroleum leakage, or agricultural chemicals, which may or may not be present on the property. Furthermore, the appraisers are not qualified to test for such substances or conditions. The values derived herein specifically assume no such substances or conditions exist at the property. If evidence to the contrary is subsequently revealed, the appraisers reserve the right to alter any value estimates accordingly. No responsibility is assumed for any such conditions, nor for any expertise or studies required to discover or correct them. The client is urged to retain an expert in the field of environmental conditions and hazards. |
| 12. | LEGALITY OF USE - Unless otherwise stated in this report, the appraisal is based on the specific assumption that the property is in full compliance with all applicable regulations and laws regarding environmental conditions, zoning, building codes, and use regulations. It is further assumed that all required licenses, consents, or permits from any controlling authority have been or can be obtained or renewed for any use considered in the value estimate. |
| 13. | INCLUSIONS - The value estimates derived herein consider only the real estate component. Any business value, furnishings, and equipment, except as specifically indicated and typically considered as a part of real estate, have been disregarded. |
| 14. | PROPOSED IMPROVEMENTS, CONDITIONAL VALUES - Any proposed improvements or repairs are assumed to be completed in good and workmanlike manner according to information provided or adopted by the appraisers. In cases of proposed construction, any statements or conclusion are subject to modification upon inspection of the completed property. Any such inspections or modifications will only be performed at an additional fee, unless specifically delineated in the original letter of engagement. Any estimates of value are valid only for the effective dates shown, and subject to stated assumptions regarding the operating levels and extent of completion as of those dates. |
10
Assumptions and Limiting Conditions
| 15. | FACTORS EXCLUDED FROM CONSIDERATION - Any estimates of value or other conclusions derived by the appraisers are not based in whole or in part upon the race, color, national origin, sexual preference, or familial status of the current owner or occupants of the subject property or any properties in the vicinity of the subject. |
| 16. | VALUE CHANGES, DYNAMIC MARKET INFLUENCES - Any value estimates presented herein are effective only for the dates indicated and are based on information available at the time the appraisal was prepared. Values can change significantly over time due to a variety of market forces. Furthermore, the value estimates presented herein are no guarantee that the property can actually be sold for a specific amount. Sale prices can be influenced by numerous factors, including exposure, time, promotional effort, terms, motivation, and other conditions surrounding the offering. The value estimate considers the productivity and relative attractiveness of the property in the marketplace, both physically and economically. |
In cases of appraisals involving the capitalization of income benefits, the estimate of value is a reflection of the appraisers’ estimate of current and/or future income levels, coupled with investor yield requirements and other factors derived from general and specific market information. Such estimates are made as of the date of the estimate of value, and they are subject to change over time due to dynamic market influences.
| 17. | THE AMERICANS WITH DISABILITIES ACT (ADA) - ADA became effective January 26, 1992. The appraisers have not made a specific compliance survey and analysis of this property to determine whether or not it is in conformity with the various detailed requirements of the ADA. It is possible that a compliance survey of the property, together with a detailed analysis of the requirements of the ADA, could reveal that the property is not in compliance with one or more of the requirements of the act. If so, this fact could have a negative effect upon the value of the property. Unless stated elsewhere in this report, the appraisers have no direct evidence of noncompliance, and the value estimate specifically assumes no compliance issues. The client is advised to seek a qualified expert on ADA requirements. |
| 18. | MANAGEMENT OF THE PROPERTY - It is assumed that the property will be under prudent and competent ownership and management, neither inefficient nor super-efficient. |
| 19. | VALUE CONCLUSION - The final value conclusion is of the surface estate only. No consideration has been given to value, if any, of the subsurface rights of the subject property. |
| 20. | CONTINUING EDUCATION - As of the date of this report, John D. Jordan has completed the requirements under the continuing education program of the Appraisal Institute. All appraisers signing this appraisal are current with continuing education requirements of the various states in which they may be licensed. |
| 21. | ACCEPTANCE OF THE REPORT - Acceptance of and/or use of this appraisal report constitutes acceptance of all conditions set forth herein. |
11
Assumptions and Limiting Conditions
| 22. | EXTRAORDINARY ASSUMPTIONS - An extraordinary assumption is defined as an assumption, directly related to a specific assignment, which, if found to be false, could alter the appraiser’s opinions or conclusions. This appraisal employs no extraordinary assumptions. |
| 23. | HYPOTHETICAL CONDITIONS - A hypothetical condition is defined as that which is contrary to what exists, but is supposed for the purpose of analysis. Hypothetical conditions assume conditions contrary to known facts about physical, legal, or economic characteristics of the subject property or about conditions external to the property, such as market conditions or trends, or the integrity of data used in an analysis. This appraisal employs the following hypothetical condition: |
Tax Burden - As of May 18, 2006, Governor Rick Perry signed into law House Bill 3, a legislation that provides a comprehensive business tax reform. This and other additional tax laws have been passed that will likewise change the Texas ad valorem taxing structure. As the appraisers are aware of this change, we are unaware of the direct implication resulting from this legislation. However, after reviewing the established laws, we conclude that there should be no adverse detriment from this new act. With the decrease in ad valorem property taxes, the net effect with a franchise tax should, in essence, balance out. Therefore, the appraiser assumes that the change in the taxing structure should positively impact property value after consideration of the ad valorem tax decrease and gross receipts tax increase, assuming a 70% revenue basis is utilized. The full implementation of these changes will be in effect as of January 1, 2007. For the purposes of our analysis, we will assume that full implementation of these tax changes are in effect. Please note that we are not licensed attorneys, and therefore, all new tax legislation information provided herein is for informational purposes only. We suggest that the client contact a tax attorney on the subject if additional information is needed.
12
PART II NATURE OF ASSIGNMENT |
13
Nature of the Assignment
Property Identification
The subject property consists of a 7.589-acre site improved with a 128-unit apartment complex known as Chimney Square. The property is located along the south side of South 23rd Street, just east of South Willis Street in the south-central portion of the City of Abilene. The address is 3201 South 23rd Street, Abilene, Texas 79605.
The subject is a garden-style apartment project with 128 units contained within 17 buildings. The apartment buildings are two-story with brick veneer, stucco and wood siding exterior. Roofs are pitched with composition shingles and gutters. In addition, the property has a separate leasing office, which also includes a clubhouse and maintenance/storage area. The property appears reasonably well maintained with no apparent deferred maintenance. The parking areas are asphalt paved and in average condition. There are a total of 199 surface parking spaces, including 134 carports. In addition, each of the townhome units has double car garages with a total of 46 parking spaces. The property has an estimated net rentable area (NRA) of 126,554 SF and a gross building area (GBA) of 128,054 SF.
Legal Description
The subject property is legally described as follows:
Two tracts of land totaling 7.589 acres with Tract I (7.194 acres) being described as all of Lot 2, Block A and Tract I (0.395 acres) being described as the easterly 50' of Lot 3, Block A, Chimney Square Addition, City of Abilene, Taylor County, Texas
We have not commissioned a survey or had one verified by legal counsel. It is recommended that the legal description be verified before being used in a legal document or conveyance.
Purpose of The Appraisal/Intended Use
The purpose of this appraisal is to estimate the “As Is” Market Value of the subject property’s Fee Simple Estate, as of the effective date reported, subject to short term leases. The interest appraised represents the Market Value interest directed by The Appraisal Institute & The Appraisal Foundation. This report is intended to serve as a basis for asset evaluation.
Effective Date of Appraisal
The effective date of valuation is January 2, 2007, the date of a full physical inspection by the appraiser.
Property Rights Appraised
This report addresses the subject property’s Fee Simple Estate. According to the Dictionary of Real Estate Appraisal (Third Edition, 1993), published by the Appraisal Institute, Fee Simple Estate is defined as follows:
Absolute ownership unencumbered by any other interest or estate, subject only to the limitations imposed by the governmental powers of taxation, eminent domain, police power, and escheat.
14
Nature of the Assignment
Client and Intended Users of the Appraisal
Univesco, its officers, administrators, employees, and lending participants (if any).
Definition of Market Value
Market Value is the major focus of most real estate appraisal assignments. Both economic and legal definitions of Market Value have been developed and refined. Continual refinement is essential to the growth of the appraisal profession.
Market Value - is defined as the most probable price which a property should bring in a competitive and open market under all conditions requisite to a fair sale, the buyer and seller each acting prudently, knowledgeably and assuming the price is not affected by undue stimuli. Implicit in this definition is the consummation of a sale as of a specified date and the passing of title from seller to buyer under the conditions whereby:
a. | buyer and seller are typically motivated; |
b. | both parties are well informed or well advised, and each acting in what they consider their own best interest; |
c. | a reasonable time is allowed for exposure in the open market; |
d. | payment is made in terms of cash in U.S. Dollars or in terms of financial arrangements comparable thereto; and |
e. | the price represents the normal consideration for the property sold unaffected by special or creative financing or sales concessions granted by anyone associated with the sale.1 |
"As Is" Market Value - is defined as an estimate of the market value of a property in the condition observed upon inspection and as it physically and legally exists without hypothetical conditions, assumptions, or qualifications as of the date the appraisal is prepared.2
Competency Provision
The appraiser(s), reviewer(s), and principal of Deverick and Associates have performed numerous appraisals of similar properties in the past. The appraiser(s) possess the knowledge and experience to conduct the inspection, analysis, and reasoning necessary to accurately estimate the value of the subject property.
1 Federal Regulation, 12 CFR 564, as promulgated by the OTC, effective August 23, 1990
2 Statement of Policy 12 CFR 571.27
15
Nature of the Assignment
Scope of The Assignment:
The scope of the appraisal report, as stipulated by the terms of the assignment, is to prepare the appraisal in a format which complies with the Appraisal Foundation and the Appraisal Institute. Pursuant to this goal, the property rights appraised are those of Fee Simple Estate ownership. In valuing the subject, we have narratively evaluated and described the general area, neighborhood area, site, zoning, and improvement data, if any, impacting the subject in order to analyze the highest and best use of the site as vacant. Further, we have utilized the standard appraisal methods to estimate the market value and have not omitted any of our conclusions herein.
The following Scope of Investigation more specifically describes the procedures followed in the reporting and the documentation of the collected data.
Scope of Investigation:
The following addresses the scope of the investigation inclusive of what was performed to complete the assignment.
Area and Neighborhood Analysis
For the Area and Neighborhood Analysis, the appraiser personally inspected the surrounding area and utilized published and non-published data to help draw conclusions about the affect of the area and neighborhood data impacting the subject. Information for this section of the report was published by various private and public entities. Non-published, yet public information, was obtained from the various state and other government related entities. Area real estate brokers, agents, and appraisers were also consulted for their opinions of the aforementioned.
Site Description and Analysis
The site was visually examined (including a full physical inspection) by the appraiser on January 2, 2007. Local governmental bodies and utility suppliers were consulted to secure information regarding utility availability, plat maps, zoning, flood hazards, and tax information.
Highest And Best Use
In determining the Highest and Best Use of the subject property as though vacant and/or improved, the appraiser utilized information obtained for, and reported in, the Area and Neighborhood Analyses, and the remaining sections of this appraisal. This information revealed the historic and future significance of the area to the subject, as well as the contribution of the area development in designating a proposed use for the subject.
The four criteria examined to establish the Highest and Best Use were: 1) Physically Possible, 2) Legally Permissible, 3) Financially Feasible, and 4) Maximally Productive.
16
Nature of the Assignment
Valuation Analysis
The Valuation section was performed with sales and rent comparables which were considered most similar to the subject. For the most part, the sales and rental data were of properties located within the boundaries of the subject neighborhood or alternate comparable areas. The sources of information utilized to obtain sales included local, county and state agencies, local real estate brokers/agents, local investors, and/or other appraisers. The comparable data relied upon in this report has been confirmed with one or more parties involved in or familiar with the given transaction. However, in some cases, the sales have been confirmed by appraisers other than the person who performed this report. Each party is considered reliable and the information received is considered true and factual to the best of the appraisers’ knowledge and judgment.
Marketing Time Analysis
The marketing time of the subject property is based on the length of time similar type properties were on the market before they sold. A history of any known offers for the subject was also considered, as well as opinions of area real estate brokers, agents, investors, and appraisers.
History of Ownership
According to local tax records, the subject property is owned by Chimney Square, LP (Univesco, Inc.), who has owned the complex for more than 10 years. According to the property manager, a new privacy fence was installed along the perimeter of the property in the first quarter of 2004. In addition, new flooring has been installed in several units during the current year. The parking lot was reportedly resurfaced in 2002. The roof was replaced and the entire property exterior was re-painted in early 2005. The property is currently considered to be in adequate condition with no major visible items of deferred maintenance. We are not aware of any recent offers or contracts to purchase the property, and the project is not listed for sale as of the appraisal date.
Encumbrances
Based on the personal inspection of the subject tract, there were no visible easements that would adversely affect the development of the subject property assuming a vacant tract. No study concerning deed restrictions has been conducted by the appraisers. Only a detailed search by a title company or attorney can provide positive assurance of the existence or absence of deed restrictions. This analysis specifically assumes there are no deed restrictions or liens which adversely affect the subject site.
17
Real Estate Taxes
Real estate taxes are based on the assessed value of real property, hence, the term ad valorem (according to value). For the subject property, the assessed value is calculated at 100% of the market value, as estimated by the Central Appraisal District of Taylor County. The 2006 assessment and applicable account number(s) are shown below:
Summary of 2006 Tax Assessment
ID Number | Component | Assessed Value | Ratio | Assessed Value | |||||||||
| 75761 | Land | $ | 545,213 | 100.0 | % | $ | 545,213 | ||||||
Improvements | $ | 4,087,787 | 100.0 | % | $ | 4,087,787 | |||||||
Total | Chimney Square | $ | 4,633,000 | 100.0 | % | $ | 4,633,000 | ||||||
To determine the reasonableness of the assessment and estimate the future tax burden, we have researched assessments (real estate only) for the following tax comparables, each of which is presented later as a comparable rental property.
Summary of Tax Comparables
Name | Units | Rentable Area | Avg Unit SF | YOC | 2006 Assessment | $ | /Unit | $ | /SF | |||||||||||||
| Warwick | 152 | 143,104 | 941 | 1981 | $ | 5,466,000 | $ | 35,961 | $ | 38.20 | ||||||||||||
| Mill Creek | 176 | 167,880 | 954 | 1982 | $ | 6,132,278 | $ | 34,842 | $ | 36.53 | ||||||||||||
| Newport Village | 216 | 186,592 | 864 | 1984 | $ | 7,543,000 | $ | 34,921 | $ | 40.43 | ||||||||||||
| Windsor Place | 228 | 195,544 | 858 | 1982 | $ | 6,992,000 | $ | 30,667 | $ | 35.76 | ||||||||||||
Average/Mean | 193 | 173,280 | 904 | 1982 | $ | 6,533,320 | $ | 34,098 | $ | 37.73 | ||||||||||||
| Chimney Square | 128 | 126,554 | 989 | 1981 | $ | 4,633,000 | $ | 36,195 | $ | 36.61 |
: * Based upon building area reported by the property Management.
The previous tax comparables were constructed from 1981 through 1984, while the subject property was completed in 1981. Assessments per unit vary from $30,667 to $35,961 for the comparables with a mean of $34,098. The subject’s assessment is $36,195 per unit. Furthermore, the assessments for the comparables on a per square foot basis range from $35.76 to $40.43 with a mean of $37.73. The subject’s assessment is $36.61 per square foot. The subject’s assessment is within the range and reflective of the mean on both a per unit and per square foot basis. Overall, we conclude that the subject’s recently certified assessment is supported by the comparables.
Base on recent trends in the market and considering the rate of increase at the subject and the comparables over the last two years, we conclude that some level of increase is most likely forthcoming for the next year. A majority of the commercial and multi-family residential property values in Taylor County have been increase slightly in each of the last few years. Below is the subject’s assessment value over the last five years
18
Real Estate Taxes
2006 | 2005 | 2004 | 2003 | 2002 | ||||||||||||
Market Value | $ | 4,633,000 | $ | 4,569,000 | $ | 4,213,000 | $ | 4,213,000 | $ | 4,336,000 | ||||||
Increase/Decrease | $ | 64,000 | $ | 356,000 | $ | 0 | ($123,000 | ) | N/A | |||||||
% of Increase | 1.4 | % | 8.5 | % | 0.0 | % | -2.8 | % | N/A | |||||||
Based on recent trends and changes in the tax rate, we estimate that the subject’s assessment value will be increased on the order of 2-8% over the next year and conclude that a reasonable estimate of the rate increase is 5%. Therefore, for our analysis will increase the current stabilized assessment value by roughly 5% to reflect market conditions.
The subject property lies within the taxing jurisdiction of Taylor County, Abilene I.S.D. and the City of Abilene. The 2006 applicable tax rate was set in September, 2006 and will be utilized to estimate the stabilized tax burden of the subject. Based on the preceding information, the subject’s stabilized taxes are estimated as follows:
Estimated Stabilized Property Taxes
Jurisdiction | Estimated Assessment | 2006 Tax Rate/$ 100 | Estimated Stabilized Taxes | |||||||
| Taylor County | $ | 4,865,000 | $ | 0.498000 | $ | 24,228 | ||||
| Abilene I.S.D. | $ | 4,865,000 | $ | 1.486700 | $ | 72,328 | ||||
| City of Abilene | $ | 4,865,000 | $ | 0.667800 | $ | 32,488 | ||||
ACTUAL TOTAL | $ | 4,865,000 | $ | 2.652500 | $ | 129,044 | ||||
House Bill 3
As of May 18, 2006, Governor Rick Perry signed into law House Bill 3, a legislation that provides a comprehensive business tax reform; with this new legislation (and other House Bills, such as House Bill 1, which provides for the property tax cut; House Bill 2, which mandates that all taxes raised from the five bills be used to reduce property taxes; House Bill 4, which raises money from sales tax on pre-owned cars; and, House Bill 5, which calls for a $1 tax increase on each pack of cigarettes), the largest property tax cut in the State of Texas will take place. According to the Texas Tax Reform Commission’s “Section By Section Bill Analysis,” the School District Property Tax Relief will require school districts, through tax rate calculation rollbacks, to reduce their property tax rate for maintenance and operations from $1.50 to $1.00 per $100 of valuation by the 2007 tax year; the tax reduction was phased in at 17 cents in the 2006 tax year and an additional 33 cents in the 2007 tax year. Therefore, property tax burdens should significantly decrease with the enacting of this legislation.
For the purposes of our analysis we have utilized the 2006 ISD tax rate and will further reduce this rate by $0.3 3/$ 100 to reflect the approximate stabilized tax rate that will be in effect as of January 1, 2007.
19
Real Estate Taxes
Although many taxing entities throughout the Permian Basin area have increased tax rates over the last few years as property values have remained flat or declined, we anticipate that with many property values increasing the need to increase tax rates will be diminished and many authorities may actually decrease their rate. Please note that we have increased the tax burden by $1,000 to account for personal property taxes. Based on an analysis of the historical and comparable data, we conclude the annual stabilized tax payment (based on current tax rates) is estimated as follows:
Stabilized Tax Burden
Projected Assessed Value $4,865,000 | Tax Rate / $100* 2.3225 | Total Taxes $116,990 |
*Tax rate accounts for $0.33 reduction in 2007
Gross Receipts Tax
Article 2, Franchise Tax, is being reformed by broadening the base, lowering the rate, and extending coverage to all active businesses receiving state law liability protection. A taxable entity, under the new franchise tax, is defined as, “those with state law liability protection.” Such entities include corporations, limited liability companies, partnerships, limited partnerships, limited-liability partnerships, professional and business associations, joint ventures, joint stock companies, and holding companies. There are some entities that will not be held responsible for the tax; those taxable entities that are excluded from the franchise tax include sole proprietorships, general partnerships owned entirely by natural persons, certain unincorporated passive entities, and non-profit and other organizations currently exempt from the franchise tax. Taxable entities also do not include grantor trusts, estates of natural persons, escrows, passive investment partnerships, family limited partnerships where at least 80% of the interests are held by members of the same family and that are passive investment partnerships, certain non-business passive entity trusts, real estate investment trusts (REITs) but only if the REIT does not own real estate directly (other than real estate occupied for business purposes), and real estate mortgage investment conduits (REMICs).
The main part of the act comes by increasing the number of businesses subject to the tax. In determining the tax amount, the underlying base is changed to “total revenues minus certain deductions,” rather than net income. As a result of the increased taxable entities, the primary tax rate is lowered from 4.5% to 1%. However, small businesses are exempt from paying the tax if they have $300,000 or less in total revenue. The exemption will be indexed to inflation every two years beginning on January 1, 2009 and continuing each odd-numbered year.
20
Real Estate Taxes
To calculate the new tax base, a taxable entity would start with its total revenue and choose to deduct one of the following two: 1) Employee compensation (employee compensation summarized by the act includes the deduction for wages and cash compensation, excluding benefits which is capped at $300,000 per employee [including officers, directors, owners, and partners] and includes wages, salaries, stock options, and net distributive income from entities treated as partnerships for federal income tax purposes, but only if the person receiving the distribution is a natural person. The $300,000 cap would be indexed to inflation every two years in the same manner used for the small business exemption. The compensation deduction also includes the actual cost of health coverage, retirement benefits, and workers’ compensation benefits, which is not capped); or 2) Cost of Goods Sold (COGS summarized by the act includes all direct costs of acquiring or producing goods, including the cost of labor and materials. It also includes indirect overhead costs related to the goods, but not to exceed 4% of the taxable entity’s total indirect overhead costs. Cost of goods sold does not include selling, distribution, outbound transportation costs, advertising costs, etc., nor does it include interest, income taxes, or officers’’ compensations. If the taxable entity is a lending institution, the cost of goods sold is equal to interest expense.). An entity’s taxable margin can not be greater than 70% of its total revenue. Certain exclusions from total revenue would be allowed such as for bad debt, foreign royalties and dividends, and net distributive income from certain entities treated as partnerships for federal income tax purposes.
The first annual return and payment under the reformed franchise tax would be due on May 15, 2008 for the reporting period beginning on January 1, 2007 and ending on December 31, 2007. As a result, the first revenue the State of Texas will collect under the reformed franchise tax will be in fiscal year 2008. However, certain exceptions for reporting periods are allowed for taxpayers that have accounting periods that do not correspond to the calendar year.
For the subject property we will calculate the gross receipts tax utilizing our stabilized EGI and assuming that the property will be subject to the maximum rate because the cost of goods sold is typically less than 30%. The following is our estimate of the Gross receipts tax burden for the subject:
Estimated Gross Receipts | Taxable Percentage | Tax Rate | Tax Burden |
| $968,354 | 70% | 1.0% | $6,778 |
After reviewing the established laws, we conclude that there should be no adverse detriment for the subject from the new acts. With the decrease in ad valorem property taxes, the net effect with a franchise tax should, in essence, balance out. Therefore, the appraiser assumes that the change in the taxing structure should positively impact property value after consideration of the ad valorem tax decrease and gross receipts tax increase, assuming a 70% revenue basis is utilized. For purposes of our analysis, we will consider the decrease in ad valorem taxes in our Proforma, but only present the Gross Receipts Tax calculation for informational purposes as this expense is consider a partnership expense. However, we are not licensed attorneys, and therefore, all new tax legislation information provided herein is for informational purposes only. We suggest that the client contact a tax attorney if a further assessment is needed. See Hypothetical Assumption # 23 for further clarification.
21
PART III REGIONAL & NEIGHBORHOOD ANALYSES |
Street Atlas USA® 2007
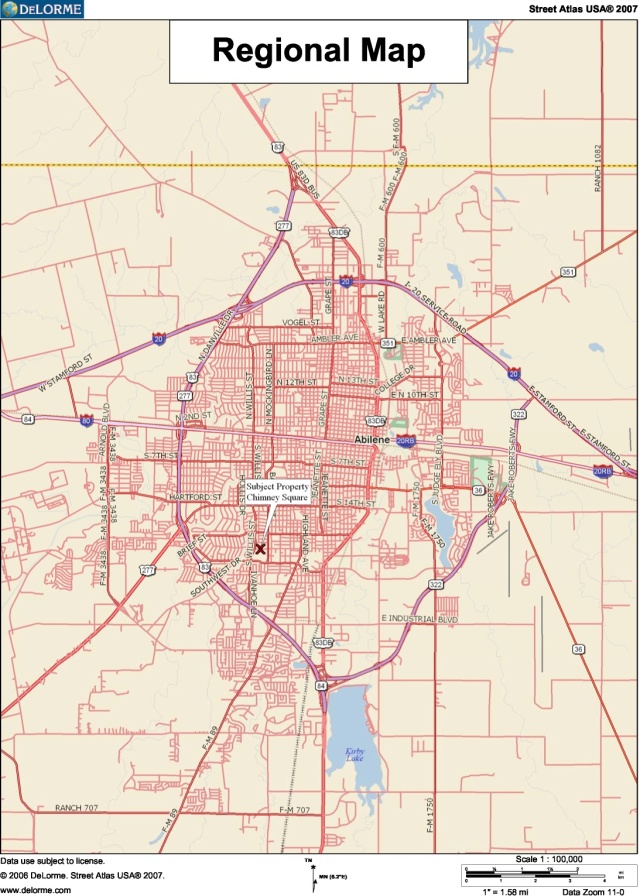
Regional Map
22
Regional Analysis
Real estate values reflect the influence of four primary forces that motivate human activity: environmental factors, social trends, economic conditions, and governmental policies. The purpose of this Regional Analysis is to describe and analyze the area within which the interactions of the four major forces influence properties similar to the subject. This section will further analyze past trends for insight into possible future trends affecting the value of real estate.
Abilene is located in central west Texas approximately 100 miles from the geographic center of the state. Interstate 20, the major highway system serving Abilene, runs east to west through north central Texas. Interstate 20 links Abilene with the Dallas-Fort Worth Metroplex (170 miles east) and Midland (150 miles west). The state capital, Austin, lies 225 miles southeast of Abilene. The Abilene Metropolitan Statistical Area (MSA) encompasses all of Taylor County. Abilene was founded in 1881 as a direct result of the building of the Texas and Pacific Railroad and was incorporated in 1882. Abilene is the county seat of Taylor County and is the center of a 22-county trade area referred to as the "Big Country.”
Overview of the Abilene Economy
Abilene's economy, like that of many West Texas cities, has long been tied to the oil and gas, agricultural and military industries. During the late 1970s and early 1980s oil prices were escalating at a rapid rate. By the end of 1982 the average price of oil was just less than $40.00 per barrel. As a result Abilene experienced unprecedented economic growth. All segments of the real estate market were booming and banks were heavily committed in real estate and energy related loans. In 1983 and again in 1986-1987, the world oil market collapsed. The collapse of the oil industry had a detrimental effect on the Abilene economy. Beginning in 1986 Abilene entered into a recession that lasted four years. This recession was compounded by a three year agricultural drought that began in 1985 and continued through 1987. During this time Abilene had a net loss in both the population and civilian labor force and experienced the collapse of both the real estate and banking industries.
By 1990 the economy reached a level of stability. Losses in both population and civilian labor force leveled-off and the unemployment rate became stable. Since 1990, population has slowly decreased and the unemployment rate has averaged approximately 4.1% for year end 2002 in comparison to the state of Texas’ unemployment rate of 6.7% for the same year. In 1990, the real estate market reached a level of stability, but real estate values remained flat with minimal appreciation until 1992 when the city experienced an increase in new home construction spurred by low interest rates. Vacancy levels in office and retail properties were atypically high in the early 1990's, but have recovered gradually since approximately 1993. Vacancy levels in multi-family and light industrial have improved over the past two to three years; However, the prevailing market rental rates remain below the level necessary to justify new multi family construction.
There has been some new construction in the light industrial and retail segments. There has been increased demand for unimproved land sites. Values of well located sites have increased significantly and values of secondary sites have increased more slowly, with retail zoning the prevalent use in demand . In the following discussions, the four forces that influence value; social, economic, governmental and environmental will be examined. An understanding of the four forces is fundamental to appraising because the interaction of these forces creates the climate in which property values increase, decrease, or remain stable.
23
Regional Analysis
Social Forces
Population Profile: The following chart summarizes population trends for the Abilene CBSA, as well as comparative data for the State of Texas and the United States.
Historical and Projected Population Trends
Growth Rate | Growth Rate | |||||||||||||||
Region | 1990 | 2006 | 1990-2006 | 2011 | 2006-2011 | |||||||||||
| Abilene | 148,010 | 158,539 | 0.43 | % | 157,168 | (0.17 | )% | |||||||||
| Texas | 16,986,524 | 23,278.274 | 1.99 | % | 25,219,040 | 1.61 | % | |||||||||
| United States | 248,710,012 | 299,088112 | 1.16 | % | 313,518,258 | 0.95 | % | |||||||||
Source: SRC LLC (www.demographicsnow.com)
Over the past 16 years, the population of the CBSA has increased at a compounded annual rate of 0.43%. During the same period, the Texas growth rate was 1.99% and the national growth rate was 1.16%. Over the next five years, the CBSA population is projected to decrease at a compounded annual rate of -0. 17%, while the State of the Texas is projected to grow at a rate of 1.61% and the nation is projected to grow at a rate of 0.95%.
Abilene experienced a large increase in population from 1950 to 1960. However, from 1960 to 1970 there was a loss in population as a result of the closure of several intercontinental ballistic missile installations and the departure of the B-47 Bomber Wing from Dyess Air Force Base. The city population increased by about 10% from 1970 to 1980. From 1980 through 1986 Abilene experienced an atypical increase in population brought about by an expanding oil and gas industry and a boom in the real estate market. The population, based on estimates prepared by the City Planning and Zoning Department, peaked in 1986 at 110,906. From 1987 through 1992, Abilene experienced a net decrease in population. The increase from 1992 to 1993 is misleading. The primary cause of the increase during this time period is the prison population at the French Robertson and John Middleton Prison Units located north of Abilene. If these inmates are not counted, there is a minimal decrease in population. From 1992 through 1994 there was an increase in population which leveled out in 1995. Over the last five years population has been trending downward very slowly and is projected to continue this trend over the next five years.
Households: The following chart summarizes trends in household growth for the region.
Historical and Projected Household Trends
Growth Rate | Growth Rate | |||||||||||||||
Region | 1990 | 2006 | 1990-2006 | 2011 | 2006-2011 | |||||||||||
| Abilene | 54,044 | 53,547 | (0.06 | )% | 49,723 | (1.47 | )% | |||||||||
| Texas | 6,070,907 | 7,977,911 | 1.72 | % | 8,445,557 | 1.15 | % | |||||||||
| United States | 91,947,641 | 111,826,380 | 1.23 | % | 117,033,680 | 0.91 | % |
Source: SRC LLC (www.demographicsnow.com)
24
Regional Analysis
Over the past 15 years, the number of households in the CBSA has decreased at a compounded annual rate of -0.06%. During the same period, the Texas growth rate was 1.72% and the national growth rate was 1.23%. Over the next five years, the number of households in the CBSA is projected to decrease at a compounded annual rate of -1.47%, while the State of the Texas is projected to grow at a rate of 1.15% and the nation is projected to grow at a rate of 0.91%.
Income Levels: The following chart summarizes trends in median household income levels.
Historical and Projected Trends in Household Income
Region | 1990 | 2006 | Growth Rate 1990-2006 | 2011 | Growth Rate 2006-2011 | ||||||||||||
Abilene | $ | 23,690 | $ | 37,406 | 2.90 | % | $ | 40,556 | 1.63 | % | |||||||
Texas | $ | 27,038 | $ | 45,956 | 3.37 | % | $ | 50,789 | 2.02 | % | |||||||
| United States | $ | 30,102 | $ | 48,271 | 3.00 | % | $ | 52,655 | 1.75 | % |
Source: SRC LLC (www.demographicsnow.com)
As of 2006, the average median household income in the CBSA was $37,406, which is 18.60% lower than the statewide average of $45,956 and 22.51% lower than the national average of $48,271. Over the past 16 years, the median income for the CBSA has grown at an annual compounded rate of 2.90%, compared to 3.37% for the State of Texas and 3.00% for the nation. Over the next 5 years, the median income for the CMSA is projected to grow at a slower rate of 1.63%, compared to 2.02% for the State of Texas and 1.75% for the nation. By 2011, the MSA median income is projected to reach $40,556, which would be 20.15% lower than the projected statewide average of $50,789 and 22.95% lower than the projected national average of $52,633.
Education:
The following chart shows the breakdown, by city, county and state of education levels.
Education Level, Persons Age 25 and Older (Percentage of Population) | ||||||||||
Level of Education | Abilene | Taylor County | Texas | |||||||
| Highschool Graduate | 30.84 | % | 29.00 | % | 27.20 | % | ||||
| Some College, No Degree | 23.89 | % | 24.87 | % | 20.26 | % | ||||
| Associate’s Degree | 5.72 | % | 5.99 | % | 6.29 | % | ||||
| Bachelor’s Degree | 13.65 | % | 15.40 | % | 16.87 | % | ||||
| Graduate or Professional Degree | 6.68 | % | 7.75 | % | 8.34 | % | ||||
| Source: SRC LLC (www.demographicsnow.com) | ||||||||||
25
Regional Analysis
A well-educated workforce is essential in a competitive global environment, and workers must be able to update and expand their knowledge as new technology and ways of working evolve. Post-secondary and higher education resources are readily available within the Abilene area to serve area residents and businesses.
Abilene has a public school system that is administered by a local board of trustees. The 2005 total enrollment for public schools was 19,804 with an average of 13 to 1 teacher/pupil ratio. In 1990 the citizens approved a bond election to construct additional facilities to meet the long term educational needs of the city. One middle school and four elementary schools were constructed and opened in the fall of 1992. In May of 2001 two-elementary schools were closed due to school district budget problems. There are three private colleges in Abilene; Abilene Christian University, Hardin-Simmons University and McMurry University, in addition to three public colleges; Cisco Junior College, Texas Tech University-Abilene and Texas State Technical College. Public parks, community theaters, a symphonic orchestra, and fine arts museums are available for public participation and enjoyment. Also, a wide variety of cultural and entertainment functions are presented each year at Abilene Civic Center and the Taylor County Expo Center.
Recreation & Cultural Attractions
Most communities in the region have staffed recreation programs. Abilene has an adequate number of parks and ample open space. Facilities offered include 29 city parks, public and private golf courses, tennis courts, hiking, jogging, bike and nature trails. Abilene a public Zoo and Expo Center.
Cost of Living
As a smaller city in a very remote location, it is not surprising that Abilene has a relatively low cost of living. In fact, the appraisers were unable to identify very few metropolitan areas in Texas with a lower cost of living, even among similarly sized cities.
Hospitals
The City of Abilene is served by two regional hospitals and an array of medical support facilities. Abilene Regional Medical Center (ARMC), provides a complete range of medical services to the community, including advanced cancer therapy and emergency/trauma treatment. In addition, Hendrick Health system operates a regional medical facility and numerous support facilities. There are also numerous small medical clinics and nursing homes throughout the area.
Transportation
Abilene is served by one railroad line, four bus lines, two airlines, and nineteen motor freight carriers. Abilene has access to one Interstate Highway and 5 major state highways. Abilene's ground transportation is considered above average compared with other West Texas cities. Air service is provided by two commuter airlines, American Eagle Airlines and Conquest Airlines. These airlines provide 10 daily flights to and from Dallas-Ft. Worth, and 2 daily flights to and from Austin. In June 2006, air service began with two direct flights per week between Abilene and Las Vegas, Nevada as provided by Allegiant Air. This new service provides the only direct connection to western destinations from the Abilene area.
26
Regional Analysis
Employment
Abilene serves as an employment and commercial hub for many west-Texas towns. Many regional area jobs are directly related to oil and gas production. The fate of this region is closely tied to oil prices. The statistics presented only reflect non-farm employment. It is noted that cattle ranching is also big business in the region.
While the importance of the petroleum industry to Abilene, the City also serves as a center for other services for much of West Texas. The area has experienced slow, but steady, growth in construction of residential and retail/commercial properties since early 2005, with the area drawing workers from all of the surrounding communities. Although the Census figures report a drop in population over the last six years, we conclude that based on employment and construction figures the area population has actually increased in 2005 and 2006.
Unemployment: The following chart summarizes recent unemployment trends for the MSA, the state, and the nation, as reported by the U.S. Bureau of Labor Statistics.
Actual Unemployment Information
Abilene MSA | Texas | United States | |||||
Employed | % Rate | Employed | % Rate | Employed | % Rate | ||
Nov-06 | 80.7 | 3.9% | 11,102 | 4.6% | 146,014 | 4.3% | |
Oct-06 | 80.5 | 3.9% | 11,088 | 4.6% | 146,125 | 4.1% | |
Nov-05 | 78.6 | 3.9% | 10,755 | 5.1% | 142,968 | 4.8% | |
Source: Texas Labor Market Information, Nov 2006, Texas Workforce Commission (http://www.tracer2.com)
Total Nonagricultural Employment in the Abilene MSA increased by 400 jobs in November and has added 1,100 positions since November 2005. Natural Resources, Mining and Construction employment showed no change in November 2006, but added 400 positions since November 2005. Retail Trade employment showed an increase of 200 jobs in November 2006 due to the start of holiday season. Education and Health Services employment showed no change in November 2006, but add 400 positions since November 2005. Leisure and Hospitality posted a small increase over the month. The annual growth rate for this group remained positive at 3.1 percent, an increase of 200 jobs since November 2005. Local Government employment increased slightly over the month. The annual growth rate rose from 1.2 percent in October, to 2.4 percent in November.
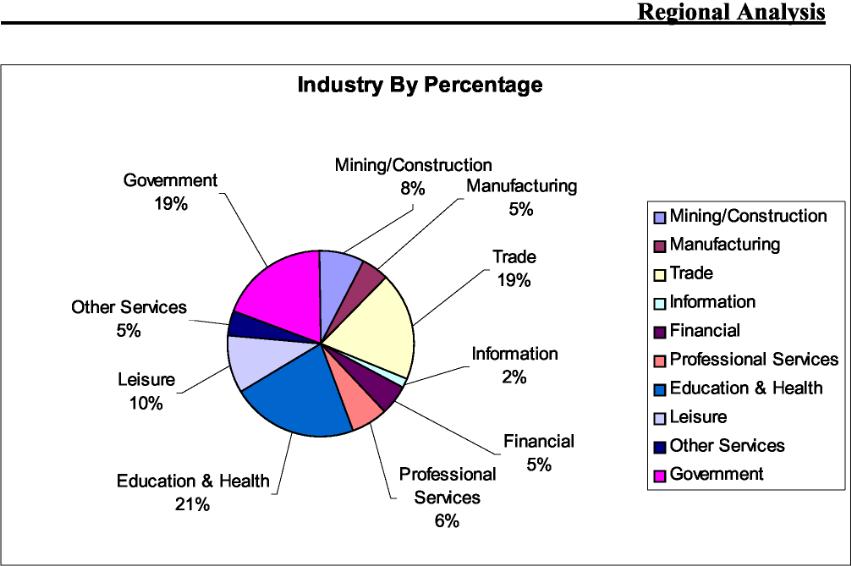
Employment by Industry: Abilene has a diverse economic bases, including large components in government, education, Trade, Transportation & Utilities, and Natural Resources. The following table identifies the number of employees by industry type.
27
Major Employers: Following is a listing of the largest private employers in the Abilene area.
Abilene
Largest Private Employers
| Abilene Christian University |
| Abilene Regional Medical Center |
| AMS Bus Solutions & Sterling Personnel |
| Bronco Drilling, Co. Inc. |
| Health Care Service Corp. |
| Hendrick Medical Center |
| Sears Methodist Centers Inc. |
| Teleperformance USA |
| United Spermarkets Ltd. |
| Wal-Mart Associates, Inc. |
Source: Texas Workforce Commission, Nov 2006 |
28
Regional Analysis
Governmental Forces
From a political standpoint, city affairs are controlled by a home rule type of government with a city manager-council form of local government. Land use and development is controlled with a master land use plan and a comprehensive zoning ordinance. Growth within the city limits is encouraged as long as the development plans conform to city requirements and zoning limitations. All structural improvements built within the city boundaries follow local and national codes. The city provides all essential services and has adequate facilities to meet the needs of the residents. The city maintains an adequate fire and police force. The city also provides water and sewer service. Electric, natural gas and telephone are supplied by private industry. Water is supplied to the city from three area lakes and two nearby reservoirs. There are two general hospitals, one state facility and a rehabilitation center. Abilene has adequate health care services and facilities.
Conclusions
The combination of the mild climatic conditions, low cost of living, recreational amenities, healthcare facilities and ample supplies of vacant land are positive factors that will contribute toward the long term stability of the area. Abilene's economy stabilized in 1990 after several years of decline. It now appears to be growing slowly, but steadily. The Comptroller's office is estimating Abilene to exhibit a population growth of 0.5% to 1% per year. The labor force has also stabilized and become more diversified. Overall, the Abilene economy can be characterized as stable with expectation of moderate growth during the next three to five years.
For the next three to five years, nonresidential rental rates and property values are expected to appreciate slightly. Values of well located sites are expected to remain stable to increasing, and values of secondary sites are expected to increase slightly.
29
30
Neighborhood Analysis
A neighborhood is generally considered to be an area with conforming characteristics. It is defined as “a group of complementary land uses.” 3 A neighborhood can be a portion of a city, a community or an entire town. It is usually considered to be an area which exhibits a fairly high degree of homogeneity as to use, tenancy and certain other characteristics. Homogeneity is a state of uniform structure or composition throughout. The value of a property is not found exclusively in its physical characteristics. Physical, economic, political and sociological forces found in the area interact to influence real estate values. In order to determine the degree of influence extended by these forces on a property, their past, present and probable future trends must be analyzed in depth. The subject’s neighborhood is determined to be the south half of the city of Abilene. The following information is presented in summary chart form to give the reader a quick overview of the subject neighborhood.
GENERAL NEIGHBORHOOD CHARACTERISTICS
LOCATION | ___ | URBAN | X | SUBURBAN | ___ | RURAL |
% DEVELOPED | X | OVER 75% | ___ | 25%-75% | ___ | UNDER 25% |
GROWTH RATE | ___ | RAPID | X | STABLE | ___ | SLOW |
SUPPLY | ___ | SHORTAGE | X | IN BALANCE | ___ | OVERSUPPLY |
MARKETING TIME | ___ | < 6 MONTHS | ___ | 6-12 MONTHS | ___ | OVER 1 YEAR |
% RETAIL | ___ | OVER 75% | ___ | 25%-75% | ___ | UNDER 25% |
VALUES | ___ | INCREASING | X | STABLE | ___ | DECLINING |
STAGE OF LIFE CYCLE
GROWTH | |
STABILITY | X |
DECLINE | |
REVITALIZATION |
The neighborhood is located in the south portion of the city of Abilene. Being a mature and established area, there have been few new commercial and residential development projects in recent years. The majority of new residential and commercial/retail development in the Abilene area has generally been located in the proximity of the Mall of Abilene, which provides the highest concentration of shopping facilities in the local area. The Mall is generally located at the intersection of Buffalo Gap Road and Highway 83, approximately three miles southeast of the subject property. A large portion of the neighborhood consists of single-family residences, with several multi-family residences as well. Much of the commercial and retail development is positioned along the major transportation routes and near the Mall of Abilene. The single-family residences in the nearby area were generally built 20 to 40 years prior to the appraisal date, and typically range between $80,000 and $130,000 in price. These homes have generally been well maintained, and thus this area remains a desirable market for single-family dwellings due to the overall upkeep and appeal.
3 Appraisal Institute, The Appraisal of Real Estate, 11th edition (Chicago: Appraisal Institute, 1996), p. 171.
31
Neighborhood Analysis
Access throughout the subject neighborhood is good with several major transportation routes. Overall, the subject property is considered to have an adequate location with convenient access to several nearby major traffic carriers.
Governmental and Environmental Forces: Governmental forces consist of zoning regulations, building codes and prevailing property tax levels within a district. The subject neighborhood is zoned mixed use with moderate commercial and residential zoning with some local and area retail, as well as limited office zoning. Existing uses in the area appear to conform to the provisions of these classifications. Furthermore, these zoning ordinances have not been a deterrent to development in the neighborhood. The quality of police and fire protection provided by the City of Abilene has been satisfactory and the property tax burden is reasonable.
Environmental forces consist of physical features that are contained in or affect the neighborhood. The majority of improvements within the neighborhood are residential subdivisions and mixed use commercial properties. The maintenance of these properties is average as exhibited by adequate upkeep. No hazards or nuisances were noted such as litter, dust, odors or smog with the exception of vehicular and air traffic. The subject neighborhood does have some designated HUD flood hazard areas, but the area is generally well drained by a network of creeks and drainage channels.
All public utilities are readily available to the neighborhood and include municipal water, sanitary sewer, storm sewer, natural gas, telephone service and electricity. These utilities have reportedly been adequate for past needs and it should be noted there appears to be no shortages.
Trends and Development: The subject neighborhood is located within an area which is experiencing stabilization with minimal new construction taking place. The neighborhood at present, is approximately 80% to 85% developed with several vacant tracts of land available for development of new residential or commercial projects. At the present time, rent levels are not quite high enough in most instances to justify new construction of most commercial, office and multi-family investment properties. As a result, the recent stabilized growth trend is anticipated to continue in the near term.
Neighborhood Apartment Overview: There are numerous nearby apartment complexes that directly compete with the subject property. Many of these complexes were built at least 20 to 40 years prior to the appraisal date. Some of these properties exhibit the effects of older age in terms of design and overall amenities; however, the majority of these complexes are fairly well maintained and exhibit steady demand with occupancies generally averaging at least 93% or more. Additional information can be found in the Apartment Market Analysis that follows this analysis.
32
Neighborhood Analysis
Demographics
The following chart summarizes population trends within 1-, 3-, and 5-mile radii of the subject, as well as comparative figures for the MSA:
Neighborhood Population Trends
1 Mile | 3 Mile | 5 Mile | MSA | |
| 1990 Census | 10,918 | 62,228 | 104,080 | 148,010 |
| 2006 Estimate | 10,087 | 60,686 | 105,728 | 158,539 |
| 2011 Projection | 9,573 | 58,795 | 103,750 | 157,168 |
| 1990-2006 Growth Rate | (0.49)% | (0.16)% | 0.10% | 0.43% |
| 2006-2011 Growth Rate | (1.04)% | (0.63)% | (0.38)% | (0.17)% |
The current year population in this selected geography is 105,728. The 2000 Census revealed a population of 108,363, and in 1990 it was 104,080 representing a 4.1% change. It is estimated that the population in this area will be 103,750 in 2011, representing a change of -1.9% from 2006. The current population is 48.4% male and 51.6% female. In 2006, the median age of the population in this area was 31.6, compared to the US median age which was 36.5. The population density in your area is 1,346.2 people per square mile.
Neighborhood Household Trends
1 Mile | 3 Mile | 5 Mile | MSA | |
| 1990 Census | 4,464 | 23,845 | 37,381 | 54,044 |
| 2006 Estimate | 3,871 | 22,152 | 36,554 | 53,547 |
| 2011 Projection | 3,438 | 20,158 | 33,639 | 49,723 |
| 1990-2006 Growth Rate | (0.89)% | (0.46)% | 0.14% | 0.06% |
| 2006-2011 Growth Rate | (2.34)% | (1.87)% | (1.65)% | (1.47)% |
Source: SRC, LLC
There are currently 36,554 households in this selected geography. The Census revealed household counts of 40,410 in 2000, up from 37,381 in 1990, representing a change of 8.1%. It is estimated that the number of households in this area will be 33,639 in 2011, representing a change of -8.0% from the current year. For the current year, the average household size in this area is 2.89 persons.
In 2006, the median number of years in residence in this geography's population is 3.21. The average household size in this geography was 2.72 people and the average family size was 3.40 people. The average number of vehicles per household in this geography was 1.8.
The median housing value in this area was $45,981 in 1990, compare this to the US median of $78,382 for the same year. The 2000 Census median housing value was $61,266, which is a 33.2% change from 1990. In 1990, there were 22,124 owner occupied housing units in this area vs. 23,468 in 2000. Also in 1990, there were 15,256 renter occupied housing units in this area vs. 16,943 in 2000. The average rent in 1990 was $292 vs. $416 in 2000.
33
Neighborhood Analysis
The following chart summarizes income trends for the neighborhood.
Median Household Income Levels
1 Mile | 3 Mile | 5 Mile | MSA | |
| 1990 Census | $31,288 | $25,595 | $24,954 | $23,690 |
| 2006 Estimate | $43,144 | $37,243 | $36,881 | $37,406 |
| 2011 Projection | $46,703 | $39,949 | $39,734 | $40,556 |
| 1990-2006 Growth Rate | 2.03% | 2.37% | 2.47% | 2.90% |
| 2006-2011 Growth Rate | 1.60% | 1.41% | 1.50% | (1.63)% |
In 2006, the median household income in this selected geography was $36,881, compared to the US median which was $48,271. The Census revealed median household incomes of $33,171 in 2000 and $24,954 in 1990 representing a change of 32.9%. It is estimated that the median household income in this area will be $39,734 in 2011, which would represent a change of 7.7% from the current year.
In 2006, the per capita income in this area was $17,313, compared to the $US per capita, which was $24,529. The 2006 average household income for this area was $47,858, compared to the US average which was $63,629.
In 2006, there were 53,405 people over the age of 16 in the labor force in your geography. Of these 88.2% were employed, 3.6% were unemployed, 31.8% were not in the labor force and 5.2% were in the Armed Forces. In 1990, unemployment in this area was 6.2% and in 2000 it was 8.2%. In 2006, there were 50,884 employees in this selected area (daytime population) and there were 5,534 establishments.
For this area in 1990, 61.2% of employees were employed in white-collar occupations and 38.9% were employed in blue-collar occupations. In 2000, white collar workers made up 59.3% of the population, and those employed in blue collar occupations made up 40.7%. In 1990, the average time traveled to work was 8 minutes and in 2000 it was 14 minutes.
Conclusions
The subject property represents a homogeneous land use within the neighborhood and has average locational attributes. Neighborhood development has a favorable mix of commercial/retail and residential property. As previously discussed, the neighborhood has generally stabilized during the past several years in terms of new development activity. In summary, the subject neighborhood is anticipated to continue recent trends of stability and slow growth in the near future, and thus real estate values should remain stable.
34
Apartment Market Analysis
Regional Overview
According to a Managers that were interviewed throughout the Abilene area, the two consistent factors are high occupancy rates that have been maintained above 95% for the last year and minor rent increases that have typically been on the order of $1 0-$20 per unit during 2006. Although we did not survey Class C properties, typical student complexes or LIHTC projects, we conclude that based on numerous discussions with area managers, the area Class B projects are very stable. It should be noted that there has been no new construction of apartment projects in the Abilene area during the past 20 years, except for several tax credit properties. The limited amount of new construction has helped to stabilize the overall average occupancy rate and demand in the local market in recent years. An additional reason for the slight upward trend in occupancy levels over the past two years is due to a recent gain in the labor force.
Direct Competition (Micro-Market Analysis)
Although the preceding information is certainly significant, of equal or greater significance is a study of the individual complexes that constitute a property’s actual competition. Along this line, we have surveyed or obtained information on several local complexes that compete directly with the subject property. The results of our survey are presented in the Income Approach section of this report and are summarized below.
Summary of Rent Comparables
No. | Name | Units | Avg Unit Size (SF) | Avg Rent Per Month | Avg Rent PSF | YOC | Occup |
Sub | Chimney Square | 128 | 989 | $652 | $0.66 | 1981 | 98% |
1 | Royale Orleans | 94 | 1,143 | $684 | $0.60 | 1972 | 100% |
2 | Mill Creek | 176 | 954 | $642 | $0.67 | 1982 | 97% |
3 | Newport Village | 216 | 864 | $577 | $0.67 | 1984 | 97% |
4 | Warwick | 152 | 941 | $687 | $0.73 | 1981 | 97% |
5 | Windsor Place | 228 | 858 | $568 | $0.66 | 1982 | 96% |
Average of Comparables | 173 | 952 | $632 | $0.67 | 1980 | 97% | |
Weighted Average | 173 | 923 | $618 | $0.67 | N/A | 97% | |
Among the properties summarized above, occupancy levels range from 96% to 100%, with an average of 97.4% and a weighted average of 97.0%. Rental rates range from $0.60/SF to $0.73/SF, with an average of $0.67/SF and a weighted average of $0.67/SF. The subject’s current quoted rents are within the range and reflective of the mean of the comparables on both a rent per square foot and rent per unit basis. Overall, the competitive market proximate to the subject appears to be performing quite well all of the properties reporting occupancies above 95%.
Summary
In summary, the subject's immediate market area appears to be fairly stable in both occupancy and rents and has experienced notable growth over the last year. The Class B properties in the subject’s immediate area of competition had experienced stable occupancies and virtually no rental rate growth for several years.
The Site Analysis is the identification and analysis of the characteristics that create, enhance, or detract from the utility and marketability of a site. Before a defined value can be estimated, the characteristics of the subject must be considered and analyzed.
The preceding "Regional" and "Neighborhood" analyses are important components of the appraisal framework or process. They provide the appraiser with required background information and market trends that identify and quantify the forces of supply and demand, which are primary determinants of value. While area and neighborhood analyses deal with external forces prevailing in the market at the time of the appraisal, the site analysis addresses the internal conditions affecting the subject under evaluation.
35
Apartment Market Analysis
In the application of many techniques of valuation analysis, the site is valued separately from existing or proposed improvements. Before a site can be identified and evaluated for purposes of comparison on the market, it must be valued as if vacant and available to be put to its highest and best use. The Site Analysis involves the identification and analysis of the characteristics that create, enhance, or detract from the utility, desirability, and marketability of a site on the market.
36
PART IV SUBJECT PROPERTY DATA |
37
Site Analysis
Location: | The property is located along the south side of South 23rd Street, just east of South Willis Street in the south-central portion of the City of Abilene. The street address is 3201 South 23rd Street, Abilene, Texas 79605. |
Dimensions, Area and Shape: | According to Tax records, the subject site measures 7.5890 acres. The site reflects an irregular, but useable, shaped tract with level topography that appears adequate for drainage. |
Easements & Encroachments: | Upon review of the survey provided, it appears the subject is not adversely affected by any detrimental easements or encroachments. It is assumed that there are no adverse easements or encroachments. |
Surrounding Land Uses: | The subject site is bordered by single family residential to the north, retail properties to the south and east and an office development and convenience store to the west. The property is located in an area that is primarily developed with single family properties and supporting retail or small office commercial developments along the major thoroughfares. The property appears to fit well into the neighborhood and its surroundings. |
Topography/Drainage/Flood: | The site exhibits a level topography. According to FEMA Community Panel #4854500035D, dated September 5, 1990, a small portion of the site lies within Zone B and Zone A6, both of which are defined as flood hazard areas for which flood depths have been determined. Flood insurance is available and is recommended. The majority of the site is in Zone X, beyond the 100-year flood plain. We recommend that the services of a qualified professional surveyor be retained to make a determination of the impact of flood area designations. |
Utilities: | All public utilities are available and with adequate capacity for the existing use. Electricity is individually or tenant metered and water/sewer is master-metered and paid by the property. The public utilities are provided by the following: Water/Sewer - City of Abilene |
| Electric - Green Mountain | |
Telephone - AT&T | |
Soil Conditions: | In the absence of a soil survey, it is assumed that the subject soils are capable of supporting a moderate scale development. |
Access/Frontage: | The site has adequate frontage and access with approximately 310 feet of frontage along the south side of South 23rd Street with one, double curb-cut allowing ingress and egress. The site also has a 50 foot wide exclusive easement at the southeast corner of the property that allows direct access to South 27th Street. Overall, access to the site is considered good. |
Zoning Classification: | RM-2 |
Permitted Uses: | The site is zoned RM-2, Multi-Family District by the City of Abilene. This district is intended for medium to high density development of multi-family residences. Based on the current zoning, it appears that the subject improvements represent a legal and conforming use. Note that a variety of exceptions, exclusions and additional provisions for signs, and other factors may apply. For complete details relative to the applicable districts, the reader should refer to the comprehensive Zoning Ordinance which is available through the City of Abilene. |
Conclusion | The subject property represents a homogeneous land use within the neighborhood. The subject is well located with convenient access to Loop 277 and US 83D Business providing good access to numerous nearby shopping and employment centers. The subject is located in the southwest portion of Abilene just inside Loop 277 in a well established portion of town. In summary, the subject neighborhood is considered in the stability stage of the life-cycle and is poised to experience stability with minimal growth in the near future, and thus real estate values should continue to slowly increase. |
38
Improvement Description
The Improvement Description is intended to provide the reader with a detailed description of any existing and/or proposed improvements located on the subject site. The description is both quantitative and qualitative in nature.
The subject is a garden-style apartment project with 128 units contained within 17 buildings. The apartment buildings are two-story with brick veneer, stucco and wood siding exterior. Roofs are pitched with composition shingles and gutters. In addition, the property has a separate leasing office, which also includes a clubhouse and maintenance/storage area. The property appears reasonably well maintained with no apparent deferred maintenance. The parking areas are asphalt paved and in average condition. There are a total of 199 surface parking spaces, including 134 carports. In addition, each of the townhome units has double car garages with a total of 46 parking spaces.
Project amenities include a leasing office, clubhouse, swimming pool, two laundry facilities, 134 carports, attached garages and mature landscaping. Unit amenities consist of standard kitchen appliances, ceiling fans, pantries, linen closets, fireplaces, full sized washer/dryer connections in two and three bedroom units, fenced patios and double car garages in townhome units.
According to the rent roll provided, the subject has a net rentable area (NRA) of 126,554 SF, indicating an average unit size of 989 SF (126,554 SF ÷ 128 units). The leasing office/clubhouse and separate maintenance building is estimated to measure approximately 1,500 SF, resulting in a gross building area (GBA) of 128,054 SF. The improvements are distributed over the site area of 7.589 acres. The subject exhibits a land-to-building ratio of 2.58:1 and an overall project density of 16.9 units per acre. The subject site has 245 parking spaces, indicating a parking ratio of 1.91 spaces per unit. Of the total available spaces available, 134 are carports and 46 are garage spaces that are provided to the tenants at no additional charge. Overall, the subject improvements are considered to be in average condition and compete well with neighboring properties. The following chart summarizes the unit mix for the subject property:
Unit Mix For Chimney Square
Type | Units | % of Total | SF/Unit | Total SF | Amenities |
| 1 Bd 1.0 Ba | 8 | 6.3% | 670 | 5,360 | Standard appliances, FP |
| 1 Bd 1.0 Ba | 44 | 34.4% | 684 | 30,096 | Standard appliances, FP |
| 2 Bd 1.0 Ba | 40 | 31.3% | 958 | 38,320 | Standard appliances, WDC, FP |
| 2 Bd 1.0 Ba | 12 | 9.4% | 964 | 11,568 | Standard appliances, WDC, FP |
| 2 Bd 2.0 Ba | 1 | 0.8% | 1,386 | 1,386 | Standard appliances, WDC, FP |
| 2 Bd 2.5 Ba, TH | 2 | 1.6% | 1,700 | 3,400 | Standard appliances, WDC, FP |
| 3 Bd 2.0 Ba, TH | 11 | 8.6% | 1,680 | 18,480 | Standard appliances, WDC, FP |
| 3 Bd 3.0 Ba, TH | 2 | 1.6% | 1,737 | 3,474 | Standard appliances, WDC, FP |
| 3 Bd 2.0 Ba, TH | 3 | 2.3% | 1,805 | 5,415 | Standard appliances, WDC, FP |
| 3 Bd 3.0 Ba, TH | 5 | 3.9% | 1,811 | 9,055 | Standard appliances, WDC, FP |
Total (Mean) | 128 | 989 | 126,554 |
39
Improvement Description
A more detailed description of the improvements is below. This description is based upon our personal observations, information provided by the on-site management, and/or what is typical within the marketplace. It should be noted that no plans or specifications of the subject property were furnished.
Foundation: | The buildings have reinforced concrete slab foundations. |
Exterior Walls: | The exterior walls are wood framed with brick, and wood siding/trim. |
Roofs: | The subject buildings contain pitched roofs with composition shingles and gutters. |
Interior Walls: | Wood studs covered with gypsum board that is taped, textured and painted. |
Ceilings: | Gypsum board that is taped, textured and painted. Generally, ceilings are 8’ high. |
Floors: | The first floor of each building features concrete subfloors, while upper levels feature plywood decking over wood joists. |
Floor Coverings: | Kitchens and baths feature vinyl flooring, while all other rooms are carpeted. |
Doors: | Wood entry doors have a locking door knob, peek hole, and deadbolt. All interior doors are hollow core wood with wood trim. |
Windows: | Windows are single-pane glass in aluminum frames. |
Restrooms: | Bathrooms feature porcelain tubs with ceramic tile enclosures, standard toilet, and laminated vanities with drop-in sinks. |
Kitchen Equipment: | Double and/or single stainless steel sink with garbage disposal, dishwasher, electric range/oven with matching vent/hood, frost-free refrigerator (some with icemakers), wood cabinets, and laminate counters. |
Plumbing and Electrical: | The plumbing system and electrical work are assumed to be in accordance with local codes. The units are individually metered for electricity Hot water is provided via individual 40 gallon hot water tanks located in each unit. |
HVAC: | The apartments are equipped with individual ground mounted HVAC units. |
Fire Protection: | All units have battery operated smoke detectors. |
40
Improvement Description
Paving/Parking: | Sidewalks are concrete paved and parking areas and driveways are asphalt paved. There are 245 parking spaces, (including 46 garage spaces and 131 carports) yielding a parking ratio of 1.91 spaces per unit. |
Laundry Facilities: | The property has two common area laundry rooms with a total of five washers and seven dryers. |
Land to Building Ratio: | 2.58:1 (on GBA) |
Economic Life: | According to the Marshall & Swift Valuation Service Guide, properties similar to the subject have an expected economic life of 55 years (Average, Class "D" construction). Considering the quality of construction and ongoing maintenance, the subject improvements are estimated to have an overall effective age of 20 year(s). Therefore, a remaining economic life of 35 years is projected. |
Deferred Maintenance: | We were not provided a Physical Needs Assessment report and therefore, have attempted to estimate the immediate needs based upon the deferred maintenance observed during our inspection. Although we are not experts in determining the condition of a property, we observed that the subject was in adequate condition with no apparent or visible deferred maintenance items observed during our inspection. From our observations, we have projected deferred maintenance items at $0. |
41
Highest & Best Use
A property must be appraised in terms of its Highest and Best Use. According to The Appraisal of Real Estate, Tenth Edition, page 275, Copyright 1992, by the Appraisal Institute. The definition of highest and best use is defined as:
The reasonable probable and legal use of vacant land or an improved property, which is physically possible, appropriately supported, financially feasible, and that results in the highest value.
When a site contains improvements, the highest and best use may be determined to be different from the existing use. Implied in this definition is that the determination of highest and best use takes into account the contribution of a specific use to the community and community development goals, as well as the benefits of that use to individual property owners. An additional implication is that the highest determination of highest and best use results from our judgment and analytical skills; that is, the use determined from analysis represents an opinion, not a fact to be found. In appraisal practice, the concept of highest and best use represents the premise upon which value is based. In the context of most probable selling price, another appropriate term to reflect highest and best use would be the most probable use.
Any determination of highest and best use includes identifying the motivations of probable purchasers. The motivations are based on perceptions of benefits that accrue to property ownership. Different motivations influence the highest and best use and are significant to an appraiser's conclusions about the highest and best uses of any parcel of real estate.
The benefits of investment properties that are not owner occupied relate to net income potential and to eventual resale or refinancing. The highest and best use decision for investment property is often influenced by the income tax and inflation hedge aspects of the existing or proposed improvements. Determination of the type and intensity of the improvement to be placed on the investor's land often requires an after-tax return analysis of various alternatives.
Land or improved property that has resale profit as its principal potential benefit is purely speculative. The price such land commands in the market reflects the real motivation of the purchaser/speculator.
This portion of the appraisal process is based on the definition of Highest and Best Use supplied previously. From this definition, it is obvious that market value of the land or site and of an improved property are both estimated under the assumption that potential purchasers will pay prices that reflect their analysis of the most profitable use of both land, as vacant, and property, as improved.
A use must meet four criteria as follows: (1) Physically Possible; (2) Legally Permissible; (3) Financially Feasible; (4) Maximally Productive.
Physically Possible: The physical characteristics of a site can affect the uses to which it can be developed. These characteristics can include size, location, shape, topography, easements, utility availability, and surrounding properties. The first constraint imposed on the possible use of the property is dictated by the physical aspects of the site itself. A tract’s size and location within a given block are two of the most important determinants of value. In general, the larger the site, the greater its potential to achieve economies of scale and flexibility in development. The key determinant in developing a site is the permitted size of the project. More land permits higher density development, higher floor to area ratios (FAR), etc. The total number of square feet allowed for a building structure tends to rise in proportion to the size of the lot. Location is important when considering a site's proximity to open plazas, retail trade areas, work force areas, public transportation, major highways (access/visibility), etc.
42
Highest & Best Use
The property is located along the south side of South 23rd Street, just east of South Willis Street in the south-central portion of the City of Abilene. The surrounding properties are reasonably well maintained and for the most part positively impact the subject site. Surrounding land uses include single and multi-family residential units scattered throughout the area. Retail, commercial, and professional offices are positioned nearby along several of the primary traffic routes in the area. The property appears to be very compatible with the neighborhood uses and surroundings. This subject location provides convenient access to major traffic routes, shopping, and major employers. The site encompasses 7.589 acres, sufficient to support a moderate-scale development. The site is relatively level, and topography is not an obstacle. The property is not adversely affected from a flood hazard zone, and all typical utilities are available to the site.
Legally Permissible: In the case of properties that are held in what is normally referred to as Fee Simple ownership, there are several restrictions on the rights of the property owner affecting the use and enjoyment of the property. These restrictions are the powers of the government: police power, eminent domain, escheat and taxation.
The influence of these restrictions lie primarily in the government police power. Police power is exercised by the imposing of restrictions on the uses of land. These restrictions may take the form of zoning codes, building codes, historic district controls or environmental regulations. The site is zoned RM-2, Multi-Family District by the City of Abilene. This district is intended for medium to high density development of multi-family residences. Based on the current zoning, it appears that the subject improvements represent a legal and conforming use.
Eminent domain also plays a part in the highest and best use of land through easements that can be created by the condemnation of a portion of property. A ready example is utility easements which are typically found along property borders in the city. While these easements are owned by the property owner, his use of these areas may be restricted.
In the case of utility easements, underground easements cannot be built over, while above-ground easements may have height restrictions imposed upon possible improvements constructed under them. The subject property was not noted to have any easements which were considered to detrimentally affect the property; however, easements are a legal covenant and the services of a competent title attorney would be required to ascertain exactly whether any detrimental easements exist. Considering the physical and legal characteristics, the subject site appears best suited to multi-family residential development.
Financially Feasible: The cost of the land and its development limit the highest and best uses of the property to only those uses which are financially feasible. Additionally, the cost of capital, loan to value ratios, forecasted revenues, and expenses, as well as current market conditions must also be considered. As previously detailed, the subject appears to be performing in-line with the immediate competitive market; however, rent increases are anticipated to be minimal in the near term as the neighborhood continues to remain fairly stable.
Due to the location and size of the site, we conclude that development of the site with uses other than multi-family would not produce the highest return or be maximally productive. Therefore, multi-family development will be the only legally permissible and physically possible use addressed further in this analysis.
In order to determine if an apartment development is a financially feasible use of the subject site, as vacant, we have estimated required market rents for new properties. We have utilized inflated expenses in the Income Approach as the probable operating level for a new apartment project. In order to estimate the rental rate required for new construction to become economically feasible, we have employed the following capital budget model. The model is based on an estimated total construction cost of $95.00 per rentable square foot (includes land and developers profit), operating expenses of $4.63 per square foot (inclusive of reserves for replacement), a stabilized occupancy rate of 94% and "going in" and overall rates of 7.00% to 7.25%, which is slightly below the rate selected in the Income Approach. Given these parameters, cost feasible rents have been estimated at $0.98 to $1.00 per square foot, calculated as follows:
43
Highest & Best Use
Feasibility Model
| Total Replacement Cost New Per SF | $95.00 | $95.00 | |||||
| Multiplied by OAR: | 7.00 | % | 7.25 | % | |||
| Required NOI Per SF: | $ | 6.65 | $ | 6.89 | |||
| Plus: Operating Expenses: | $ | 4.63 | $ | 4.63 | |||
| Required EGI per SF: | $ | 11.28 | $ | 11.52 | |||
| Divided by Stabilized Occupancy:* | 94.0 | % | 94.0 | % | |||
| Required Gross Income Per SF: | $ | 12.00 | $ | 12.25 | |||
| Less: Miscellaneous Income Per SF: | ($0.25 | ) | ($0.25 | ) | |||
| Annual Cost Feasible Rent Per SF: | $ | 11.75 | $ | 12.00 | |||
| Monthly Cost Feasible Rent Per SF: | $ | 0.98 | $ | 1.00 | |||
*Includes 1% Loss to Lease
The capital budget model presented indicates that effective monthly rents of $0.98 to $1.00 per square foot are necessary for construction of a new multi-family rental development to be cost feasible. This range is similar to the average effective rents of some of the newer apartment projects in larger metropolitan market areas, but not in secondary markets such as Abilene. It is estimated that a new project on the subject site would not be able to command rents required for a new property given the current status of the local market. As is shown in the submarket analysis, no new projects have been completed within the past 20 years in the city of Abilene except for several tax credit projects. In addition, no projects are currently under construction in the subject’s submarket because of the necessary level of income and limited rent growth over the past several years. Therefore, it is estimated that new development of the subject site with an apartment project is not feasible at the current time.
Maximally Productive: The maximally productive use is considered to be that use among all financially feasible uses that would bring the greatest return to the land. Based on the constraints and conditions outlined above, it is reasonable to conclude that the highest and best use of the subject parcel, as vacant, would be future development of an apartment facility as demand warrants.
Highest and Best Use As If Vacant
To determine the highest and best use of the subject property, as vacant, we conducted a thorough analysis. The analysis consisted of an inspection of the property and studies of the neighborhood, region, and trends. The site's physical attributes and surrounding development were also considered. Based on available evidence, multi-family development will best satisfy the preceding requirements. Nevertheless, the current market would not prove to be a financially feasible situation for new multi-family construction. Thus, the highest and best use as if vacant, would be to develop a multi-family apartment complex when demand proves to be financially feasible.
Highest and Best Use, As Improved
The subject's present improvements are of a design that meets the existing demand of the immediate marketplace. The improvements conform to the physical and economic characteristics of the neighborhood environment and represent a substantial use of the site. There are no alternative uses that could economically justify removal of the existing improvements. In that there is a positive cash flow generated before debt service, the subject property should continue being operated as an apartment complex.
44
PART V VALUATIONS AND CONCLUSIONS |
45
Appraisal Process
The following appraisal report is prepared pursuant to and in conformity with, the procedural techniques established by the nationally recognized professional real estate appraisal organizations and the federally imposed guidelines for insured institutions.
Specifically, those procedures include consideration of present market conditions, estimated future conditions, and the financial realities of the subject property and general investment markets which are inclusive of, but not limited to realty.
The appraisal process typically involves the three approaches to value. These approaches are based on the following three facets of value:
| 1. | The current cost of replacing a property less losses in value from deterioration and functional and economic obsolescence (accrued depreciation)(Cost Approach). |
| 2. | The value indicated by recent sales of comparable properties in the marketplace (Sales Comparison Approach). |
| 3. | The market value that the property's net earning power will support based upon a capitalization of net income, stabilization, and residual equity buildup (Income Approach). |
The requisites of the appraisal process call for valuations made independently of each other, specifically an Income Approach, Sales Comparison Approach, and a Cost Approach.
The Cost Approach assumes that a property's value is equivalent to its replacement cost. This falls under the theory of substitution where the rationalization of its support is premise upon the assumption that a property's optimum value cannot exceed the cost of duplicating the property on a similar site.
The Sales Comparison/Market Approach is determined by direct units of comparison where value can be converted to price per square foot, acres, rooms, units, or income multipliers and overall rates. The theory is that a prudent investor would pay no more for a given facility/property than what the typical market purchaser would pay for a comparable facility, all things being equal.
The Income Approach is derived from the rationalization of substitution, where the price one would pay for a property equals the attributable value of its earning ability where measured by the yield an investor will obtain.
The final step in the appraisal process is the reconciliation of value indications. This is the consideration of the indicated value resulting from each of the three approaches. We considers the relative applicability of each of the three approaches to arrive at the final estimate of defined value.
The individual nature of the real property leads to a question of determining the most appropriate appraisal procedure for valuation. Although this can not be easily answered, the subject is real property, and as such, market value can be estimated.
46
Appraisal Process
After examining the range between the value indications, the appraiser places major emphasis on the one, or on those, which appear to produce the most reliable and applicable solution to the specific appraisal task. One takes into account the purpose of the appraisal, the type of property, and the adequacy and relative reliability of the data processed in each of the three approaches. These considerations influence the weight to be given to each approach.
The aforementioned procedures to the appraisal process have been considered and incorporated in this narrative report with the exception of the Cost Approach. In addition, to assist the client with decisions regarding the appropriate level of insurance, we have derived an estimate of replacement cost for the subject improvements which is referred to as the “Insurable Value” which is presented in the Cost Approach.
For several reasons, the Cost Approach is not considered a valid indicator of market value for the subject and is not presented herein. First, since the subject was constructed in 1981 and is more than twenty-five years old, substantial adjustments would be required for physical depreciation. Secondly, and most important, investors for this type of property do not normally apply the Cost Approach in estimating value.
For the reasons outlined, the Cost Approach is not considered appropriate for this analysis. However, at the client’s specific request, we have estimated the replacement cost of the improvements to determine the insurable value.
47
Cost Approach
Replacement Cost of Improvements
The Cost Approach to value is based upon the assumption that an informed purchaser will pay no more than the cost of producing a substitute property with the same utility as the subject property. In other words, a buyer will typically pay no more than the subject’s reproduction cost. Reproduction cost is defined as:
"The cost of construction at current prices of an exact duplicate or replica using the same materials, construction standards, design, layout, and quality of workmanship, and embodying all deficiencies, superadequacies and obsolescence of the subject building" (Real Estate Appraisal Terminology, Revised Edition, Pg. 205).
The cost estimates utilized herein were obtained through the Marshall Valuation Service (MVS). The MVS provides an estimate of replacement cost new (rather than reproduction cost), which is defined as:
"The cost of construction at current prices of a building having utility equivalent to the building being appraised but built with modern materials and according to current standards, design, and layout." (Real Estate Appraisal Terminology, Revised Edition, Pg. 205).
As the subject’s improvements appear to have no functional problems, for the purpose of this analysis, replacement cost is considered to be very similar to the reproduction cost.
Marshall & Swift Estimate: The costs new provided by the MVS handbook include the following:
| 1) | average architect's and engineer's fees, including plans, plan check and building permits, and surveys to establish building lines and grades; |
| 2) | normal interest on building funds, excluding land, during the period of construction and processing fee or service charge; |
3) sales taxes on materials;
4) normal site preparation including excavation for foundation and backfill;
5) utilities from structure to lot line figured for typical setback;
| 6) | contractor's overhead and profit including job supervision, worker's compensation, fire and liability insurance, unemployment insurance, etc. |
Determination of Replacement Cost New: To determine the replacement cost new for the subject structures and components, the calculator method was utilized. Appropriate multipliers were applied to the indicated MVS base cost(s) to account for time and the subject’s particular location and shape.
48
Cost Approach
The subject property is best compared to an Average Quality Class “D” Multiple Residence classification, found in Section 12, Page 14 of the MVS handbook. Given the specifics of the subject, we have elected to use a base cost of $58.66 per square foot, excluding the porches and balconies. The porches and balconies are estimated to encompass approximately 3,800 SF, based upon an estimate of 30 square feet per unit average. The cost of porches/balconies reportedly runs around one-fourth to half of the final base cost of the apartments. Thus, a cost of $25.00/SF is applied to the balconies and patios. The cost of the leasing office/clubhouse and all other common area structures are estimated at $58.66/SF and is applied to the estimated 1,500 square feet of common area buildings. Based on data published in the MVS handbook, we have derived the following cost estimates and multipliers for the various components of the subject improvements:
Summary of Base Building Costs
Component | Area (SF) Base Cost Area | Multipliers | Total | |||
Local Current | ||||||
| Apartments | 126,554 | $58.66 | 1.00 | 0.89 | 1.04 | $6,871,338 |
| Balconies/Patios | 3,800 | $25.00 | 1.00 | 0.89 | 1.04 | $87,932 |
| Common/Areas | 1,500 | $58.66 | 1.00 | 0.89 | 1.04 | $81,444 |
| Garages | 10,120 | $25.00 | 1.00 | 0.89 | 1.04 | $234,177 |
Total Base Building Cost | $7,274,890 | |||||
Appliances & Amenities: Based on Marshall & Swift data, we have derived the following cost estimates for the subject’s appliances and special amenities.
Appliances and Individual Unit/ Amenities
Component | Number | Cost/Unit | Total Cost |
| Garbage Disposal | 128 | $150 | $19,200 |
| Refrigerator | 128 | $700 | $89,600 |
| Dishwasher | 128 | $550 | $70,400 |
| Oven/Range | 128 | $725 | $92,800 |
| Ceiling Fans | 200 | $ 80 | $16,000 |
| Total Appliance Cost | $288,000 |
Site Improvements: Based on Marshall & Swift data, we have derived the following cost estimates for the subject’s site improvements.
Site Improvements
Component | Quantity | Unit Cost | Total |
| Surface Parking (Includes drives, parking, sidewalks) | 205 | $900 | $184,500 |
| Carports | 131 | $900 | $117,900 |
| Pool(s) | 1 | $80,000 | $80,000 |
| Fencing (perimeter and patios) | 1 | $100,000 | $100,000 |
| Signage | 1 | $10,000 | $10,000 |
| Landscaping | 1 | $100,000 | $100,000 |
| Office Furnishings & Clubhouse Equipment | 1 | $80,000 | $80,000 |
Total Site Improvements | $672,400 | ||
Indirect Costs: The indirect costs not included in the base cost amount obtained from the Marshall Valuation Service manual include such items as property taxes during construction, escrow fees and legal fees associated with the land, interest on the land, discount points and fees paid in connection with interim financing, accounting, appraisal fees, marketing and lease-up costs (inclusive of on site payroll cost for a leasing agent during the pre-leasing and commissions paid to apartment locator companies). Indirect costs for the subject are estimated at 10% of the total hard costs, or $823,529.
49
Cost Approach
Developer’s Fee: In addition to the above, a developer’s fee should be considered. The developer’s fee, which is distinct from entrepreneurial incentive, represents compensation for the overall management of the project, i.e., the time, energy, and experience the developer invests in the project and the risks the developer takes. It is equivalent to the salary the developer might otherwise obtain. This type fee can vary significantly from developer to developer, but could generally be expected to run from 1.25% to 2.00% of the total project cost. For this analysis, we have elected to use a fee of 1.50% of the total project cost, exclusive of the land cost.
Entrepreneurial Profit: Finally, consideration must be given for entrepreneurial profit, which is the anticipated profit required to entice an entrepreneur to invest capital in a project. It is the difference between the total cost of development and marketing and the market value of a property after completion and stabilization. One means to extract entrepreneur's profit would be to analyze recently constructed properties in the same market for the difference between their sales prices and total development costs (site, direct and indirect costs, excluding developer's profit).
An attempt was made to estimate entrepreneur's profit from the market by researching sales of recently completed multi-family complexes. The certainty of this method is questionable, as it only accounts for the actual amount of profit realized and not the amount required to typically influence a developer to undertake a project. The actual profit yielded may exceed or be less than the anticipated profit. Due to this lack of data, it was necessary to contact developers and investors. Based on these conversations, allowances for entrepreneurial profit typically were in the neighborhood of 8% to 15% for properties with similar total values and utility. Based on this data, we have utilized an allowance of 15%.
Based on the preceding analyses, the subject’s replacement cost new is approximated as follows.
Summary of Replacement Cost New Via Marshall & Swift Method
Chimney Square
Component | Cost | $/Unit | $/SF NRA |
| Buildings | $7,274,890 | $56,835 | $57.48 |
| Appliances | 288,000 | $2,250 | $2.28 |
| Site Improvements | 672,400 | $5,253 | $5.31 |
| SUB-TOTAL HARD COSTS | $8,235,290 | $64,338 | $65.07 |
Soft (Indirect) Costs @ 10% | 823,529 | $6,434 | $6.51 |
| SUB-TOTAL HARD AND SOFT COSTS | $9,058,819 | $70,772 | $71.58 |
| Developer’s Fee @ 1.50% | 135,882 | $1,062 | $1.07 |
| Entrepreneurial Profit @ 15% | 1,358,823 | $10,616 | $10.74 |
| TOTAL ESTIMATED RCN | $10,553,524 | $82,449 | $83.39 |
ROUNDED | $10,550,000 | $82,422 | $83.36 |
As indicated, the total replacement cost new (RCN) of the subject improvements is estimated at $10,550,000 (rounded), which equates to $83.36/SF of NRA or $82,422/unit.
50
Cost Approach
Insurable Value
Before continuing with the Cost Approach, we will now address insurable value of the appraised property. Insurance exclusions or additions are computed on the basis of items specifically included or excluded by the policy of each property. However, for the purpose of this report general assumptions are made as to the most normal of inclusions and exclusions. We have included the base cost replacement value of the structures and appliances, but we have excluded all exterior features and furnishings. Most insurance policies may include added costs for the demolition and debris removal that must occur before the replacement or repairs can be made, we have not included these costs in our estimate due to the lack of standardization of this element. After a replacement value is determined this value may or may not be depreciated, this is a matter of underwriting policy and not a matter of valuation.4
In addition, policies will allocate a deduction from the estimated replacement cost new for those costs associated with foundation below ground and architect’s fees. The deductions are allowed because these items generally do not recur if the property is destroyed by fire or a similar cause. The following additions and exclusions are applied in determining Insurable Value (MVS, Section 96, Pages 1-2). All percentages are applied to the replacement cost before profit.
Insurable Replacement Cost | |
| Replacement Cost | $7,562,890 |
| Excluded Value @ 9.3% | ($703,349) |
| Insurable Value | $6,859,541 |
| Rounded | $6,900,000 |
Having estimated replacement cost new for the subject improvements as well as items excluded from insurance coverage, the subject’s insurable value may be approximated as follows:
Insurable Value
Chimney Square
$6,900,000
51
Sales Comparison Approach
The Sales Comparison Approach is the method of appraisal in which the value of a property is inferred from sales of comparable property. It is also known as the comparative or comparable sales approach, the comparison method, or the market data approach to value. Value is measured by observing what comparable properties are selling for in the market.
Properties subjected to the comparison process, both subject and comparables, must have at least the potential of a similar, if not identical, highest and best use if a valid value estimate is to result. In other words, all of the properties compared must have the capacity to satisfy the needs and desires of the same buyer. The market approach to value takes different forms, depending upon the type of property being appraised, but the method is essentially the same. This technique can be expressed as follows:
| 1. | Describe and classify asset: The description of the property under appraisement should only cover those attributes that are significant and relevant to value. If the asset is of a diverse nature, it should be divided into value classes. |
| 2. | Find sales involving comparable assets: This means finding comparable properties that have been sold recently in the subject community. Verification and documentation of the sales is highly important. |
| 3. | Select appropriate units of comparison: The basis of the market approach to value is a comparison of one asset to another. Before a comparison can occur, a unit of comparison must be established. Appropriate units of comparison for the assessment of apartments are established using a per unit and per net rentable square foot value. With improved property, sales are broken down into useful units so that reasonable and logical comparisons can be made. The most common three comparisons are: |
| A. | Effective Gross Income Multiplier: This is the sales price divided by the effective gross scheduled income of the investment facility at stabilized occupancy. Abbreviation: EGIM |
| B. | Net Operating Income: This is the gross scheduled income less vacancy and less operating expenses, but without consideration to interest, loan amortization, depreciation, or income taxes. Abbreviation: NOI |
| C. | Overall Rate: This is a single year's rate between net operating income and total price. It is computed by dividing the NOI by the gross selling price. Abbreviation: OAR |
| 4. | Compare each sold asset with the subject property, adjust for differences to indicate market value of the subject asset in each comparison: Every piece of real estate is unique unto itself, so there will never be a sold property that is identical in every respect to the subject property. The appraiser searches for those comparable sales that have the most in common. There will, however, be areas of difference. These areas of difference break down into two categories, namely tangible and intangible. |
Intangible differences would include terms, time, and condition of sale. Tangible differences would include location (with regard to streets, visibility, traffic patterns, and volumes, growth trends, etc.), size, zoning, age, nature, quality, and condition of improvements, etc. If a material difference is found between the sold property and the subject property under appraisement, it is necessary to adjust for the difference.
52
Sales Comparison Approach
| 5. | Find central tendency of indicated values: After making the comparisons, each sale will have provided an indicated value for the subject property. From this array of indicated prices, the appraiser must distill a single figure. Judgment is more useful than mathematics in arriving at this conclusion, because some of the comparable sales will carry more weight than others. The value indications must be reconciled into a single indicator of value for the comparative sales approach. Hopefully the value indicators will be within a narrow range. In selecting the single value estimate, it is not proper to simply average the results. Rather, the process is one of reviewing the adjustments made and placing the greatest reliance on the value indicated by the most comparable properties or property. |
A location map and several comparable improved sales are detailed on the following pages.
53
Improved Sale No. 1
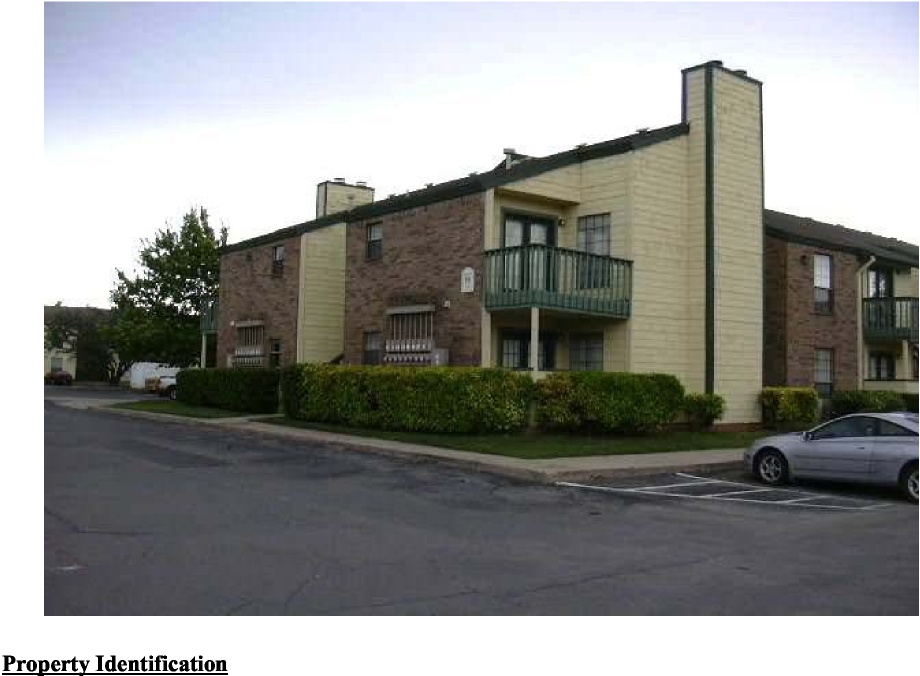
| Name: | Mill Creek |
Address: | 5429 US-277 |
Distance to Subject: | 2 miles west |
City/County/State: | Abilene, Taylor County, Texas |
Date of Sale: | 6/05 |
Grantor: | Abilene Mill Creek Associates, LP |
Grantee: | BMA Capital, LLC |
Consideration: | $6,300,000 |
Financing Adjustment: | $0 |
Renovation Cost: | $0 |
Lease-Up Costs: | $603 |
Adjusted Sale Price: | $6,300,603 |
Comments
This is a two-story apartment complex with brick and wood siding exteriors and pitched composition roofs. The property features a swimming pool, laundry facilities, office/clubroom, basketball court, tennis court, picnic area w/ BBQ, playground and carports. Amenities include standard appliances, patio/balcony, mini-blinds, ceiling fans and select units feature washer/dryer connections and/or fireplaces. The income and expenses used are based upon the actual operating statements. The property is individually metered for electricity.
54
Improved Sale No. 1
Physical Data | Absorption Assumptions | ||||||||||||
| Net Rentable Area (SF) | 167,904 | Stabilized Occupancy: | 95 | % | |||||||||
| Land Area (Acres): | 9.550 | Unites to Absorb: | 2 | ||||||||||
| Land Area (SF) | 415,998 | Months to Absorb: | 0 | ||||||||||
| Land to Building Ratio | 2.48 | Tenant Finish ($/Unit): | $ | 200 | |||||||||
| Year Built: | 1983 | Leasing Commissions: | 4.0 | % | |||||||||
| Quality/Condition: | B+ | Average | Average Term (Months): | 6 | |||||||||
| Occupancy at Sale: | 94 | % | Safe Discount Rate: | 6.0 | % | ||||||||
Income/Expense Estimates | $/SF | $/Unit | Pro-Forma Income Statement | ||||||||||
| Market Rent: | $ | 7.49 | $ | 7,143 | Gross Potential Rents: | $ | 1,257,192 | ||||||
| Other Income: | $ | 0.33 | $ | 315 | Other Income: | 55,408 | |||||||
| Operating Expenses: | $ | 4.12 | $ | 3,930 | Less: Vacancy: | (62,860 | ) | ||||||
| Reserves: | $ | 0.26 | $ | 250 | Less: Loss to Lease: | $ | (12,572 | ) | |||||
| Total Expenses: | $ | 4.38 | $ | 4,180 | Effective Gross Income: | $ | 1,237,168 | ||||||
| Stabilized Vacancy/Collection | 5 | % | Less: Operating Expenses: | (735,764 | ) | ||||||||
| Loss to Lease Factor: | 1 | % | Net Operating Income: | $ | 501,404 | ||||||||
Units of Comparison | $/SF | $/Unit | Calculation of Lease-Up Costs | ||||||||||
| Adjusted Price: | $ | 37.53 | $ | 35,799 | Rent Losses: | $ | 0 | ||||||
| NOI: | $ | 2.99 | $ | 2,849 | Tenant Finish-Out Costs: | $ | 352 | ||||||
| Indicated OAR: | 7.96 | % | Leasing Commissions: | $ | 251 | ||||||||
| Indicated EGIM: | 5.09 | Total Lease-Up Costs: | $ | 603 | |||||||||
| Operating Expense Ratio: | 59.47 | % | Present Value at Safe Rate: | $ | 603 |
Unit Type | Units | SF/Unit | Total SF | Rent | $/SF/YR | Gross Rent |
| TOTAL/AVG | 176 | 954 | 167,904 | $595 | $7.49 | $1,257,192 |
Amenities | |||||
Y | Pool | Y | Ceiling Fans | Y | Patios/balconies |
N | Hot Tub | S | W/D Connections | S | Fireplace |
Y | Clubhouse | N | Microwaves | N | Security gate |
N | Fitness Center | Y | Individual Meters | N | Alarm System |
Y | Playground | Y | Covered Parking | Y | Laundry Room |
55
Improved Sale No. 2
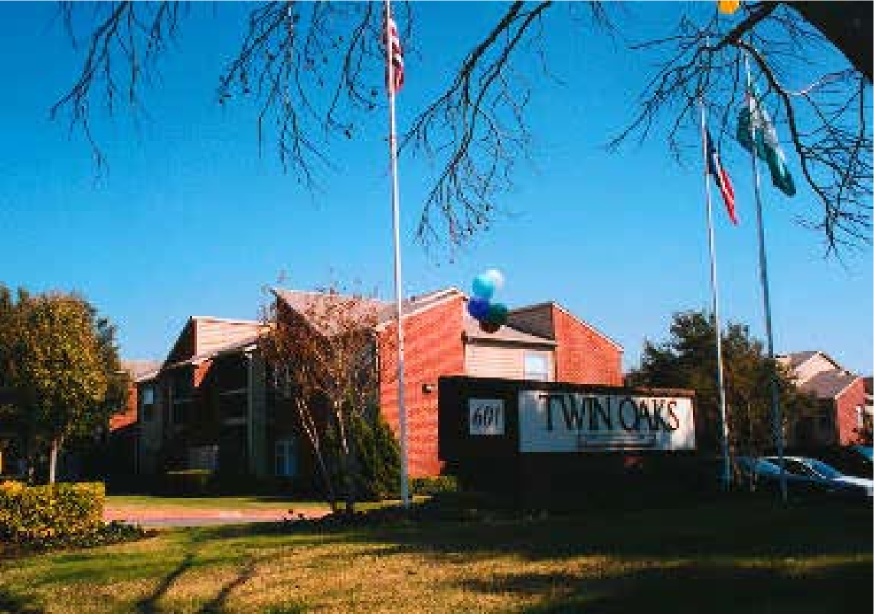
Property Identification
Name: | Twin Oaks |
Address: | 601 Twin Oaks Drive |
Distance to Subject: | 160 miles west |
City/County/State: | Temple, Bell County, Texas |
Date of Sale: | 2/23/05 |
Grantor: | MB S-Mike Smuck |
Grantee: | Twin Oaks Apartments, LP (Southern Development Inc.) |
Consideration: | $8,288,000 |
Financing Adjustment: | $0 |
Deferred Maintenance: | $0 |
| Lease-Up Costs: | $10,308 |
| Adjusted Sale Price: | $8,298,308 |
Comments
The property features two-story buildings with brick veneer and wood trim, and pitched composition roofs. Amenities include a swimming pool, fitness center, laundry facility, clubhouse, playground, and a racquetball court. Unit amenities include a standard appliance package, ceiling fans, fireplaces, W/D connections, and vaulted ceilings. There was no deferred maintenance reported at the time of sale. The property was reportedly 91% occupied at the time of sale, and has open surface parking. The income was based upon the figures at the time of sale and the expenses were based upon the reported figures and market rates in the area. The property is individually metered for electricity and master-metered for water/sewer.
56
Improved Sale No. 2
Physical Data | Absorption Assumptions | ||||||||||||
| Net Rentable Area (SF): | 183,872 | Stabilized Occupancy: | 95 | % | |||||||||
| Land Area (Acres): | 9.500 | Units to Absorb: | 9 | ||||||||||
| Land Area (SF): | 413,820 | Months to Absorb: | 2 | ||||||||||
| Land to Building Ratio: | 2.25 | Tenant Finish ($/Unit): | $ | 200 | |||||||||
| Year Built: | 1983 | Leasing Commissions: | 4.0 | % | |||||||||
| Quality/Condition: | B+ | Average | Average Term (Months): | 12 | |||||||||
| Occupancy at Sale: | 91 | % | Safe Discount Rate: | 4.0 | % | ||||||||
Income/Expense Estimates | $/SF | $/Unit | Pro-Forma Income Statement | ||||||||||
| Market Rent: | $ | 9.43 | $ | 7,737 | Gross Potential Rents: | $ | 1,733,040 | ||||||
| Other Income: | $ | 0.24 | $ | 197 | Other Income: | 44,129 | |||||||
| Operating Expenses: | $ | 4.55 | $ | 3,735 | Less: Vacancy: | (86,652 | ) | ||||||
| Reserves: | $ | 0.30 | $ | 250 | Less: Loss to Lease: | $ | (17,330 | ) | |||||
| Total Expenses: | $ | 4.85 | $ | 3,985 | Effective Gross Income: | $ | 1,673,187 | ||||||
| Stabilized Vacancy/Collection: | 5 | % | Less: Operating Expenses: | (892,618 | ) | ||||||||
| Loss to Lease Factor: | 1 | % | Net Operating Income: | $ | 780,569 | ||||||||
Units of Comparison | $/SF | $/Unit | Calculation of Lease-Up Costs | ||||||||||
| Adjusted Price: | $ | 45.13 | $ | 37,046 | Rent Losses: | $ | 5,777 | ||||||
| NOI: | $ | 4.25 | $ | 3,485 | Tenant Finish-Out Costs: | $ | 1,792 | ||||||
| Indicated OAR: | 9.41 | % | Leasing Commissions: | $ | 2,773 | ||||||||
| Indicated EGIM: | 4.96 | Total Lease-Up Costs: | $ | 10,342 | |||||||||
| Operating Expense Ratio: | 53.35 | % | Present Value at Safe Rate: | $ | 10,308 |
Unit Mix
Unit Type | Units | SF/Unit | Total SF | Rent | $/SF/YR | Gross Rent | |||||||||||||
| 1 Bd - 1 Ba | 32 | 587 | 18,784 | $ | 495 | $ | 10.12 | $ | 190,080 | ||||||||||
| 1 Bd - 1 Ba | 32 | 661 | 21,152 | $ | 530 | $ | 9.62 | $ | 203,520 | ||||||||||
| 2 Bd - 1.5 Ba | 48 | 821 | 39,408 | $ | 620 | $ | 9.06 | $ | 357,120 | ||||||||||
| 2 Bd - 2 Ba | 60 | 888 | 53,280 | $ | 650 | $ | 8.78 | $ | 468,000 | ||||||||||
| 2 Bd - 2 Ba, FP | 36 | 900 | 32,400 | $ | 775 | $ | 10.33 | $ | 334,800 | ||||||||||
| 3 Bd - 2 Ba | 16 | 1,178 | 18,848 | $ | 935 | $ | 9.52 | $ | 179,520 | ||||||||||
| TOTAL/AVG | 224 | 821 | 183,872 | $ | 645 | $ | 9.43 | $ | 1,733,040 | ||||||||||
Amenities
Y | Pool | Y | Ceiling Fans | Y | Patios/Balconies |
Y | Laundry Room | Y | W/D Connections | N | Fireplace |
Y | Clubhouse | N | Microwaves | N | Alarm System |
Y | Fitness Center | Y | Tenant Paid Electric | N | Security gate |
Y | Playground | N | Covered Parking | N | Garages |
57
Improved Sale No. 3
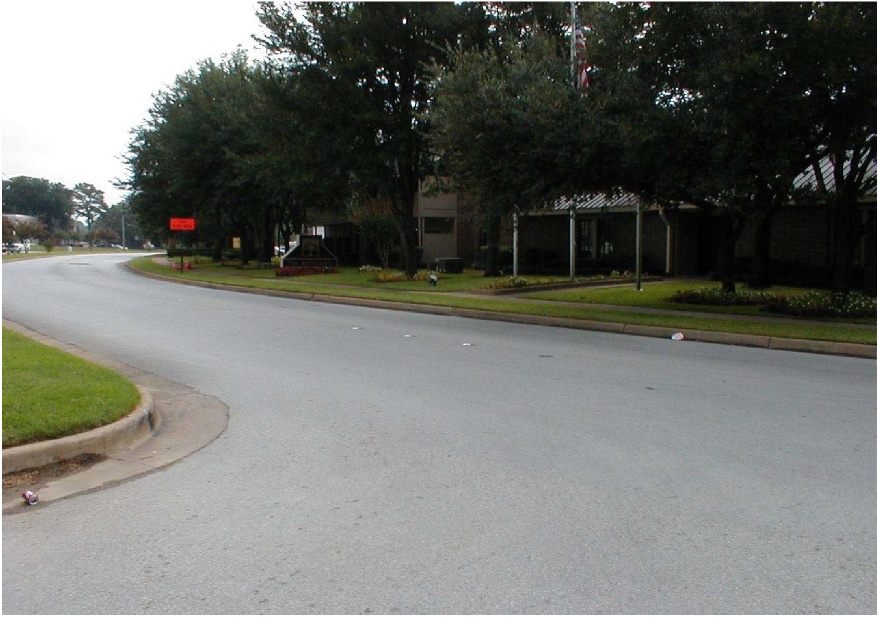
Property Identification
Name: | The Woodlands |
Address: | 400 Grande Blvd. |
Distance to Subject: | 250 miles west |
City/County/State: | Tyler, Smith County, Texas |
Date of Sale: | 8/16/05 |
Grantor: | AIMCO/ Woodlands-Tyler, LP |
Grantee: | Allmark, Inc. |
Consideration: | $11,250,000 |
Financing Adjustment: | $0 |
Deferred Maintenance: | $0 |
| Lease-Up Costs: | $0 |
Adjusted Sale Price: | $11,250,000 |
Comments
This is a two-story apartment complex with brick and stucco exteriors and pitched asphalt-tile roofs. The property was reportedly renovated in 2004. Amenities include a clubhouse, two swimming pools, fitness center, covered parking, washer/dryer connections, microwaves, ceiling fans and some fireplaces. The property is individually metered for electricity.
58
Improved Sale No. 3
Physical Data | Absorption Assumptions | ||||||||||||
| Net Rentable Area (SF): | 177,600 | Stabilized Occupancy: | 95 | % | |||||||||
| Land Area (Acres): | 10.625 | Units to Absorb: | 0 | ||||||||||
| Land Area (SF): | 462,825 | Months to Absorb: | 3 | ||||||||||
| Land to Building Ratio: | 2.61 | Tenant Finish ($/Unit): | $ | 200 | |||||||||
| Year Built: | 1984 | Leasing Commissions: | 4.0 | % | |||||||||
| Quality/Condition: | B+ | Avg-Good | Average Term (Months): | 12 | |||||||||
| Occupancy at Sale: | 96 | % | Safe Discount Rate: | 6.0 | % | ||||||||
Income/Expense Estimates | $/SF | $/Unit | Pro-Forma Income Statement | ||||||||||
| Market Rent: | $ | 9.47 | $ | 6,569 | Gross Potential Rents: | $ | 1,681,728 | ||||||
| Other Income: | $ | 0.41 | $ | 284 | Other Income: | 72,816 | |||||||
| Operating Expenses: | $ | 4.49 | $ | 3,115 | Less: Vacancy: | (84,086 | ) | ||||||
| Reserves: | $ | 0.32 | $ | 225 | Less: Loss to Lease: | $ | (16,817 | ) | |||||
| Total Expenses: | $ | 4.81 | $ | 3,340 | Effective Gross Income: | $ | 1,653,641 | ||||||
| Stabilized Vacancy/Collection: | 5 | % | Less: Operating Expenses: | (855,024 | ) | ||||||||
| Loss to Lease Factor: | 1 | % | Net Operating Income: | $ | 798,617 | ||||||||
Units of Comparison | $/SF | $/Unit | Calculation of Lease-Up Costs | ||||||||||
| Adjusted Price: | $ | 63.34 | $ | 43,945 | Rent Losses: | $ | 0 | ||||||
| NOI: | $ | 4.50 | $ | 3,120 | Tenant Finish-Out Costs: | $ | 0 | ||||||
| Indicated OAR: | 7.10 | % | Leasing Commissions: | $ | 0 | ||||||||
| Indicated EGIM: | 6.80 | Total Lease-Up Costs: | $ | 0 | |||||||||
| Operating Expense Ratio: | 51.71 | % | Present Value at Safe Rate: | $ | 0 |
Unit Mix
Unit Type | Units | SF/Unit | Total SF | Rent | $/SF/YR | Gross Rent | |||||||||||||
| 1 Bd - 1 Ba | 32 | 587 | 18,784 | $ | 495 | $ | 10.12 | $ | 190,080 | ||||||||||
| 1 Bd - 1 Ba | 32 | 661 | 21,152 | $ | 530 | $ | 9.62 | $ | 203,520 | ||||||||||
| 2 Bd - 1.5 Ba | 48 | 821 | 39,408 | $ | 620 | $ | 9.06 | $ | 357,120 | ||||||||||
| 2 Bd - 2 Ba | 60 | 888 | 53,280 | $ | 650 | $ | 8.78 | $ | 468,000 | ||||||||||
| 2 Bd - 2 Ba, FP | 36 | 900 | 32,400 | $ | 775 | $ | 10.33 | $ | 334,800 | ||||||||||
| 3 Bd - 2 Ba | 16 | 1,178 | 18,848 | $ | 935 | $ | 9.52 | $ | 179,520 | ||||||||||
| TOTAL/AVG | 224 | 821 | 183,872 | $ | 645 | $ | 9.43 | $ | 1,733,040 | ||||||||||
Amenities
Y | Pool | Y | Ceiling Fans | Y | Patios/Balconies |
Y | Hot Tub | Y | W/D Connections | S | Fireplace |
Y | Clubhouse | Y | Microwaves | N | Alarm System |
Y | Fitness Center | Y | Individual Meters | N | Security gate |
N | Playground | Y | Covered Parking/Garage | Y | Laundry Room |
59
Improved Sale No. 4
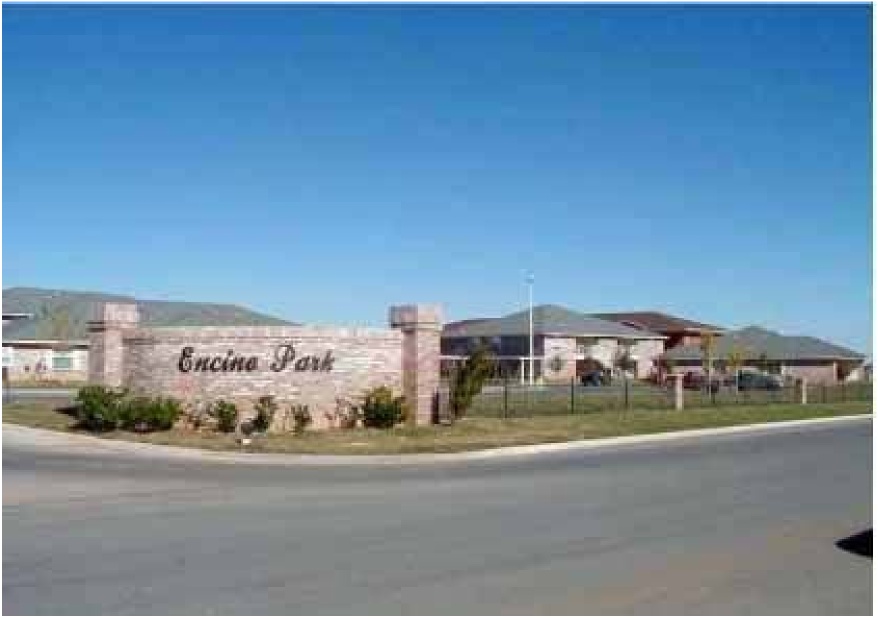
Property Identification
Name: | Encino Park |
Address: | 4022 Meadow Drive |
Distance To Subject: | 75 miles northeast |
City/State: | San Angelo, Texas |
Date of Sale: | 12/17/04 |
Grantor: | EP Acquisition Partners, LP |
Grantee: | Rose Encino Park, LP |
Consideration: | $9,050,000 |
Financing Adjustment: | $0 |
Deferred Maintenance: | $0 |
| Lease-Up Costs: | $116,243 |
Adjusted Sale Price: | $9,166,243 |
Comments:
The property consists of one and two-story buildings with brick veneer and wood trim, and pitched composition roofs. Amenities include a swimming pool, fitness center, laundry room, and 120 carports (leased for $15 per month). According to the seller, the improvements were in adequate condition at the time of sale with no significant deferred maintenance. The property previously sold in September 2002 at a reported price of $7,050,000.
60
Improved Sale No. 4
Physical Data | Absorption Assumptions | ||||||||||||
| Net Rentable Area (SF): | 164,896 | Stabilized Occupancy: | 95 | % | |||||||||
| Land Area (Acres): | 11.825 | Units to Absorb: | 2 | ||||||||||
| Land Area (SF): | 515,097 | Months to Absorb: | 6 | ||||||||||
| Land to Building Ratio: | 3.12 | Tenant Finish ($/Unit): | $ | 200 | |||||||||
| Year Built: | 1998 | Leasing Commissions: | 4.0 | % | |||||||||
| Quality/Condition: | A- | Avg-Good | Average Term (Months): | 12 | |||||||||
| Occupancy at Sale: | 94 | % | Safe Discount Rate: | 2.0 | % | ||||||||
Income/Expense Estimates | $/SF | $/Unit | Pro-Forma Income Statement | ||||||||||
| Market Rent: | $ | 8.48 | $ | 7,769 | Gross Potential Rents: | $ | 1,398,480 | ||||||
| Other Income: | $ | 0.41 | $ | 376 | Other Income: | 67,607 | |||||||
| Operating Expenses: | $ | 3.79 | $ | 3,472 | Less: Vacancy: | (69,924 | ) | ||||||
| Reserves: | $ | 0.25 | $ | 225 | Less: Loss to Lease: | $ | (13,985 | ) | |||||
| Total Expenses: | $ | 4.04 | $ | 3,697 | Effective Gross Income: | $ | 1,382,178 | ||||||
| Stabilized Vacancy/Collection: | 5 | % | Less: Operating Expenses: | (665,456 | ) | ||||||||
| Loss to Lease Factor: | 1 | % | Net Operating Income: | $ | 716,722 | ||||||||
Units of Comparison | $/SF | $/Unit | Calculation of Lease-Up Costs | ||||||||||
| Adjusted Price: | $ | 55.59 | $ | 50,924 | Rent Losses: | $ | 116,540 | ||||||
| NOI: | $ | 4.35 | $ | 3,982 | Tenant Finish-Out Costs: | $ | 0 | ||||||
| Indicated OAR: | 7.82 | % | Leasing Commissions: | $ | 280 | ||||||||
| Indicated EGIM: | 6.63 | Total Lease-Up Costs: | $ | 116,820 | |||||||||
| Operating Expense Ratio: | 48.15 | % | Present Value at Safe Rate: | $ | 116,243 |
Unit Mix
Unit Type | Units | SF/Unit | Total SF | Rent | $/SF/YR | Gross Rent | |||||||||||||
| 1 Bd - 1 Ba | 82 | 566 | 45,280 | $ | 489 | $ | 10.37 | $ | 469,440 | ||||||||||
| 1 Bd - 1 Ba | 64 | 657 | 42,048 | $ | 509 | $ | 9.30 | $ | 390,912 | ||||||||||
| 1 Bd - 1 Ba | 32 | 658 | 21,056 | $ | 519 | $ | 9.47 | $ | 199,296 | ||||||||||
| 1 Bd - 1 Ba, Den | 32 | 828 | 26,496 | $ | 609 | $ | 8.83 | $ | 233,856 | ||||||||||
| 2 Bd - 1 Ba, Den | 24 | 834 | 20,016 | $ | 629 | $ | 9.05 | $ | 181,152 | ||||||||||
| 2 Bd - 2 Ba | 24 | 946 | 22,704 | $ | 719 | $ | 9.12 | $ | 207,072 | ||||||||||
| TOTAL/AVG | 256 | 694 | 177,600 | $ | 547 | $ | 9.47 | $ | 1,681,728 | ||||||||||
Amenities
Y | Pool | Y | Ceiling Fans | Y | Patios/Balconies |
Y | Laundry Room | Y | W/D Connections | N | Fireplace |
Y | Clubhouse | N | Microwave Oven | N | Alarm System |
61
Improved Sale No. 5
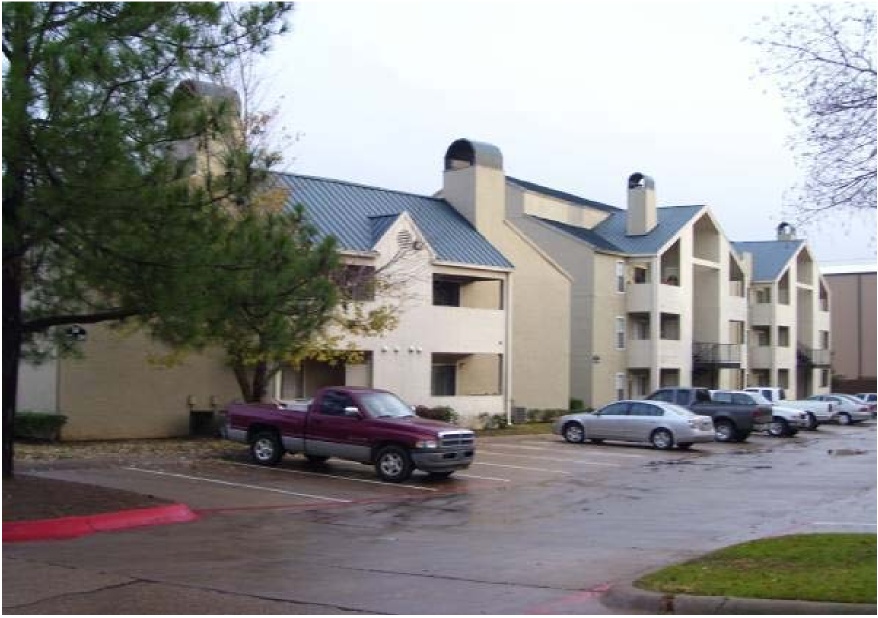
Property Identification
Name: | Stone Creek |
Address: | 6100 Hollytree Drive |
Distance To Subject: | 250 miles west |
City/State: | Tyler, Smith County, Texas 75703 |
Date of Sale: | 10/24/06 |
Grantor: | MBS Stone Creek |
Grantee: | The Lindhl Group |
Consideration: | $9,500,000 |
Financing Adjustment: | $0 |
Deferred Maintenance: | $0 |
Lease-Up Costs: | $0 |
Adjusted Sale Price: | $9,500,000 |
Comments
This is a two-story apartment complex with stucco exterior and pitched metal roofs. The property is located along Holly tree Drive in Tyler. The property was reported to be in average condition at the time of the sale with no deferred maintenance. Vacancy was reported at 5% at the time of sale.
62
Improved Sale No. 5
Physical Data | Absorption Assumptions | ||||||||||||
| Net Rentable Area (SF): | 172,488 | Stabilized Occupancy: | 95 | % | |||||||||
| Land Area (Acres): | 12.040 | Units to Absorb: | 0 | ||||||||||
| Land Area (SF): | 524,462 | Months to Absorb: | 0 | ||||||||||
| Land to Building Ratio: | 3.04 | Tenant Finish ($/Unit): | $ | 200 | |||||||||
| Year Built: | 1984 | Leasing Commissions: | 4.0 | % | |||||||||
| Quality/Condition: | B+- | Average | Average Term (Months): | 6 | |||||||||
| Occupancy at Sale: | 95 | % | Safe Discount Rate: | 6.0 | % | ||||||||
Income/Expense Estimates | $/SF | $/Unit | Pro-Forma Income Statement | ||||||||||
| Market Rent: | $ | 8.24 | $ | 5,729 | Gross Potential Rents: | $ | 1,420,704 | ||||||
| Other Income: | $ | 0.30 | $ | 209 | Other Income: | 51,746 | |||||||
| Operating Expenses: | $ | 4.05 | $ | 2,817 | Less: Vacancy: | (71,035 | ) | ||||||
| Reserves: | $ | 0.36 | $ | 250 | Less: Loss to Lease: | $ | (14,207 | ) | |||||
| Total Expenses: | $ | 4.41 | $ | 3,067 | Effective Gross Income: | $ | 1,387,208 | ||||||
| Stabilized Vacancy/Collection: | 5 | % | Less: Operating Expenses: | (760,576 | ) | ||||||||
| Loss to Lease Factor: | 1 | % | Net Operating Income: | $ | 626,632 | ||||||||
Units of Comparison | $/SF | $/Unit | Calculation of Lease-Up Costs | ||||||||||
| Adjusted Price: | $ | 55.08 | $ | 38,306 | Rent Losses: | $ | 0 | ||||||
| NOI: | $ | 3.63 | $ | 2,527 | Tenant Finish-Out Costs: | $ | 0 | ||||||
| Indicated OAR: | 6.60 | % | Leasing Commissions: | $ | 0 | ||||||||
| Indicated EGIM: | 6.85 | Total Lease-Up Costs: | $ | 0 | |||||||||
| Operating Expense Ratio: | 54.83 | % | Present Value at Safe Rate: | $ | 0 |
Unit Mix
Unit Type | Units | SF/Unit | Total SF | Rent | $/SF/YR | Gross Rent | |||||||||||||
| 1 Bd - 1 Ba | 36 | 510 | 18,360 | $ | 432 | $ | 10.16 | $ | 186,624 | ||||||||||
| 1 Bd - 1 Ba | 52 | 590 | 30,680 | $ | 450 | $ | 9.15 | $ | 280,800 | ||||||||||
| 1 Bd - 1 Ba | 56 | 603 | 33,768 | $ | 475 | $ | 9.45 | $ | 319,200 | ||||||||||
| 2 Bd - 2 Ba | 48 | 830 | 39,840 | $ | 500 | $ | 7.23 | $ | 288,000 | ||||||||||
| 2 Bd - 2 Ba | 56 | 890 | 49,840 | $ | 515 | $ | 6.94 | $ | 346,080 | ||||||||||
| TOTAL/AVG | 248 | 696 | 172,488 | $ | 477 | $ | 8.24 | $ | 1,420,704 | ||||||||||
Amenities
Y | Pool | Y | Ceiling Fans | Y | Patios |
N | Hot Tub | S | W/D Connections | Y | Balconies |
Y | Clubhouse | Y | Microwaves | S | Fireplace |
N | Fitness Center | Y | Individual Meters | N | Security gate |
Y | Sports Court | S | Covered Parking | N | Alarm System |
63

64
Improved Sales
As a review, the subject property consists of a 126,554-SF, 128-unit apartment complex developed in 1981. The improvements are in average condition with a current occupancy of 98%. The comparables presented were chosen based on their similarity to the subject with respect to size, age, location, condition, income potential, and other pertinent characteristics.
Following is a summary of the comparable sales utilized. The unit prices are based upon the cash equivalent sale price, adjusted for favorable financing, lease-up costs, and deferred maintenance, where applicable.
SUMMARY OF COMPARABLE IMPROVED SALES
# Date | Units | Avg Unit SF | YOC | Price /Unit | Price /SF | EGIM | OAR | NOI /UNIT | NOI /SF | |||||||||||||||||||
1 6/05 | 176 | 954 | 1983 | $ | 35,799 | $ | 37.53 | 5.09 | 7.96 | % | $ | 2,849 | $ | 2.99 | ||||||||||||||
2 2/23/05 | 224 | 821 | 1983 | $ | 37,046 | $ | 45.13 | 4.96 | 9.41 | % | $ | 3,485 | $ | 4.25 | ||||||||||||||
3 8/16/05 | 256 | 694 | 1984 | $ | 43,945 | $ | 63.34 | 6.80 | 7.10 | % | $ | 3,120 | $ | 4.50 | ||||||||||||||
4 12/17/04 | 180 | 916 | 1998 | $ | 50,924 | $ | 55.59 | 6.63 | 7.82 | % | $ | 3,982 | $ | 4.35 | ||||||||||||||
5 10/24/06 | 248 | 696 | 1984 | $ | 38,306 | $ | 55.08 | 6.85 | 6.60 | % | $ | 2,527 | $ | 3.63 | ||||||||||||||
AVG | 217 | 816 | 1986 | $ | 41,204 | $ | 51.33 | 6.07 | 7.78 | % | $ | 3,192 | $ | 3.94 | ||||||||||||||
SUB | 128 | 989 | 1981 | N/A | N/A | N/A | N/A | $ | 3,405 | $ | 3.44 | |||||||||||||||||
Methods of Comparison
Typically, four value indicators can be extracted which are useful and applicable in projecting a value for a multi-family project via the Market Approach/Sales Comparison Approach. These are the price per unit (total units), the price per square foot (on a rentable area basis), an effective or gross income multiplier and an overall rate (the overall rate method is employed in the forthcoming Income Approach).
The sale price per square foot indicator is applicable to each of the properties. However, it is a common element which is general in nature and takes into account all influences without specifically identifying their impact. Price variations are generally attributable to a number of factors including the project’s quality of construction, average unit size, location, amenities, and the age/condition of the improvements. The comparable sales have indicated prices on a per square foot b asis ranging from $37.53 to $63.34, after adjusting for deferred maintenance and rent loss.
The sale price per unit indicator is also applicable to each of the properties. However, like the per square foot indicator, it is a common element which is general in nature and takes into account all influences without specifically identifying their impact. Many of those same influences that affect the sale price per square foot also affect the sale price per unit.
Among the comparables presented, the sale price per unit ranges from $35,799 to $50,924. For purposes of this report, we will analyze the price per unit in detail, and then compare the estimated value via this approach to the price per square foot for additional support.
65
Improved Sales
The effective gross income multiplier (EGIM) is more indicative of the income/investment nature of a property such as the subject. However, the primary concern of an investor is the net return after expenses as opposed to the gross earning potential. Thus, this method is most useful when the expense character of the property is highly similar to the property being analyzed. Among the comparables, EGIMs range from 4.96 to 6.85, with a mean of 6.07.
We have reviewed each of the comparable sales in relationship to the subject property. Characteristics such as location, age, condition of improvements, quality of leases (when known) and motivation of purchasers have been analyzed. Note, an investor/purchaser of a multi-family facility uses the same criteria to determine value from one locale to another.
Our first analysis in this approach will focus on the price per unit. The following grid depicts how the comparables weigh against the subject. If the comparable is considered inferior to the subject, then a positive adjustment is warranted, whereas, if the property is considered superior to the subject then a downward adjustment would be reflected.
66
Improved Sales
IMPROVED SALES ADJUSTMENT GRID
Element | Subject | Sale 1 | Sale 2 | Sale 3 | Sale 4 | Sale 5 |
Economic Factors | Mill Creek | Twin Oaks | The Woodlands | Encino Park | Stone Creek | |
| Sale Price/Unit | ------ | $35,799 | $37,046 | $43,945 | $50,924 | $38,306 |
| Property Rights | Fee Simple | Similar 0% | Similar 0% | Similar 0% | Similar 0% | Similar 0% |
| Financing Terms | ------ | Typical 0% | Typical 0% | Typical 0% | Typical 0% | Typical 0% |
| Condition of Sale | ------ | Arm’s Length 0% | Arm’s Length 0% | Arm’s Length 0% | Arm’s Length 0% | Arm’s Length 0% |
| Market Conditions | ------ | Similar 0% | Similar 0% | Similar 0% | Similar 5% | Similar 0% |
Overall Adjustment | 0% | 0% | 0% | 5% | 0% | |
Adjusted Sale Price | $35,799 | $37,046 | $43,945 | $53,470 | $38,306 | |
Physical Factors | ||||||
| Location | Average Comparison | Average Similar 0% | Average Similar 0% | Avg-Good Superior -10% | Average Similar 0% | Avg-Good Superior -10% |
| Avg. Unit (SF) | 989 Comparison | 954 Similar 1% | 821 Inferior 5% | 694 Inferior 11% | 916 Inferior 2% | 696 Inferior 11% |
| Quality | B+ Comparison | B+ Similar 0% | B+ Similar 0% | B+ Similar 0% | A- Superior -10% | B+ Similar 0% |
| Age/Condition | 1981 Average Comparison | 1983 Average Similar 0% | 1983 Average Similar 0% | 1984 Avg-Good Superior -5% | 1998 Avg-Good Superior -10% | 1984 Average Similar 0% |
| Amenities | Standard Comparison | Standard Inferior 5% | Standard Inferior 5% | Standard Similar 0% | Standard Similar -5% | Standard Inferior 5% |
| Overall Comparison | ---------- | Inferior | Inferior | Superior | Superior | Inferior |
| Estimated Adjustment | ---------- | 6.0% | 10.0% | -4.0% | -23.0% | 6.0% |
| Adjusted Price | $37,947 | $40,751 | $42,188 | $41,172 | $40,605 | |
| Indicated Mean | $40,532 |
67
Improved Sales
Sale Price Per Unit
The sale price per unit comparison is derived by dividing the adjusted sale price by the number of units. Among the comparables, sales prices range from $35,799 to $50,924 per unit. The spread in pricing is attributed to the factors summarized in the preceding adjustment grid. Each factor considered is presented in the following paragraphs. First, each of the comparable sales is discussed in terms of economic factors, and then each property is examined individually in terms of physical factors.
ECONOMIC FACTORS
PROPERTY RIGHTS CONVEYED
As with the subject property, all of the comparables were sold as fee simple interests, and all were believed to be leased reasonably close to market rents, so no adjustments are made.
FINANCING TERMS
In accordance with the definition of market value, we reviewed each of the comparable sales for the effects of any special financing. A typical arrangement that requires adjustment to the sale price is financing by a seller or third party at a below-market interest rate. Inasmuch as all of the sales were transactions based on cash to the seller or typical market financing, no adjustments were warranted.
CONDITION OF SALE
The adjustment of condition of sale relates to abnormal arm’s-length transactions reflected by either the buyer or seller of a particular property. The end result is a purchase price that is higher or lower than market level caused by motivations such as assemblage sales, unusual tax considerations, eminent domain proceedings or numerous other non arm’s-length situations. Our research of the comparable sales revealed that no unusual motivational factors were involved and that all were arm’s-length transactions.
MARKET CONDITIONS
Market conditions or time adjustments relate to increases or decreases in property value, usually based on the supply/demand ratio of the market. The sales have occurred within the past six months, and all are considered reasonably indicative of current market pricing.
PHYSICAL FACTORS
Improved Sale No. 1
The locale of this property is considered to have similar locational attributes when compared to the subject, which is located approximately 2 miles west of this property. The comparable has an average unit size of 954 square feet, which is considered similar to the subject’s average unit size of 989 square feet. The sale is considered a class B+ property, which is considered similar to the subject. Sale No. 1 was built in 1983 and is in average condition. After evaluating the amenities, which are considered inferior, we conclude that when considering the economic and physical factors; this improved sale is deemed inferior overall, and thus warranted an adjustment to the sales price of 6%. Therefore, the resulting adjusted price equates to $37,947 per unit.
68
Improved Sales
Improved Sale No. 2
The locale of this property is considered to have similar locational attributes when compared to the subject, which is located approximately 160 miles west of this property. The comparable has an average unit size of 821 square feet, which is inferior as compared to the subject’s average unit size. The sale is considered a class B+ property, which is considered similar to the subject in overall terms of quality and appeal. Sale No. 2 was built in 1983 and is in average condition as compared to the subject. After evaluating the amenities, which are considered inferior, we conclude that when considering the economic and physical factors; this improved sale is deemed inferior overall in relation to the subject. After applying an overall adjustment of 10%, the adjusted price for this sale equates to $40,751 per unit.
Improved Sale No. 3
This property is considered to have superior locational attributes when compared to the subject, which is located approximately 250 miles west of this property. The comparable has an average unit size of 694 square feet, which is inferior to the subject’s average unit size of 989 square feet. The sale is considered a class B+ property, which is rated similar to the subject. Sale No. 3 was built in 1984 and is in avg-good condition, which is also rated superior when compared to the subject. After evaluating the amenities, which are considered similar, we conclude that when considering the economic and physical factors; this improved sale is deemed superior overall in relation to the subject. Applying an adjustment to the sales price of -4% results in an adjusted price of $42,188 per unit.
Improved Sale No. 4
Encino Park, located at 4022 Meadow Drive, is considered to have similar locational attributes when compared to the subject, which is located approximately 75 miles northeast of this property. The comparable sale has an average unit size of 916 square feet, which is considered inferior when compared with the subject’s average unit size of 989 square feet. The sale is considered a class A- property, which is recognized as superior to the subject. Sale No. 4 was built in 1998 and is still in avg-good condition. After evaluating the amenities, which are considered similar, we conclude that when considering the economic and physical factors; this improved sale is deemed superior overall in relation to the subject. After adjusting for economic and physical differences, the improved sale reflects an adjusted price of $41,172 per unit.
Improved Sale No. 5
Stone Creek, is considered to have superior locational attributes when compared to the subject, which is located approximately 250 miles west of this property. The comparable sale has an average unit size of 696 square feet, which is considered inferior as compared to the subject’s average unit size of 989 square feet. The sale property is considered a class B+ property, which is rated similar to the subject. Sale No. 5 was built in 1984 and is in average condition. After evaluating the amenities, which are considered inferior, we conclude that when considering the economic and physical factors; this improved sale is deemed inferior overall in relation to the subject. Applying an adjustment to the sales price of 6% produces an adjusted price of $40,605 per unit.
69
Improved Sales
CONCLUSION
After considering all of the differences, our inclination is to consider all of the comparables, with slightly greater weight given to Sales 1, 3 and 5; due to the slightly lower net adjustment to each of these comparables. Overall, the sales exhibited adjusted prices per unit ranging from $37,947 to $42,188, with a mean of $40,532. Based upon this analysis, we consider that the adjusted values of the comparables represent a fairly narrow range and thus should all be weighed equally. From this analysis, we have estimated a value of $40,500/unit for the subject.
Physical Comparison Indication
| 128 Units x $40,500/Unit | = | $ 5,184,000 |
| Less: Deductions | = | 0 |
| Net Value Indication | = | $ 5,184,000 |
ROUNDED | = | $5,200,000 |
The indicated value of $5,200,000 equates to $41.09/SF, which is considered reasonable and falls within the range of the comparable sales. The comparable sales ranged between $37.53/SF to $63.34 /SF with a mean of $51.33/SF.
70
Improved Sales
NOI/Price Relationship
There is an alternative method of analysis which often yields a more narrow conclusion of adjusted prices. As implied earlier, it is difficult to determine the influence of physical characteristics on the effect of sales prices on a per unit or per square foot basis when analyzing improved sales. An alternative to making subjective adjustments to the units of comparison is to base our adjustments on the income differences. We mentioned that investors typically rely on the income producing ability of the property, especially net income, in order to draw comparisons within the market. Net operating income is generally recognized by most as the single most important factor considered by an investor. In this methodology we convert market based income differences between the comparables of the subject property into percentage adjustments that are applied to the price per square foot method.
Stabilized operating performance of the sales is used as the basis of our analysis. The relative performance of the subject and the comparable sales in this respect is highly pertinent in the appraisal process. While this method of analysis tends to lump adjustments together, we know of no subjective method that will yield a more accurate value conclusion than this objective approach. As a result, we have utilized a ratio of net operating income between the comparable sales and the subject property in order to estimate the value of the subject property on a per square foot basis.
In this method, the net operating income of the subject property is divided by the net operating income of the comparable sale to derive a ratio of comparison between the two. The sales price per square foot of the comparable sale is then multiplied by the ratio to reach an adjusted sales price with regard to its income producing potential in comparison to the subject property.
The variables affecting the applicable value indications (date of sale, age, condition, location, etc.) are what determine the rent levels a given property can achieve. Hence, a property with a higher occupancy level, better location, and/or a favorable expense structure will typically generate a more desirable revenue level than similar type properties with inferior characteristics. Hence, the adjustments for these factors will involve one single adjustment based upon the revenue differences between the subject and each comparable. As each of these improved comparables were purchased on their individual income producing merits, this methodology appears reasonable.
The unit of comparison for these adjustments is the net operating income (NOI) per square foot. Utilizing the NOIs to derive an adjustment (rather than gross income) is the generally preferred method as this allows for potential differences in property expenses. This may include differences in reserves, management, expense structures, et cetera.
Based on our stabilized analysis in the Income Approach, the subject has a projected net operating income for the coming year of $3.44/square foot ($435,846 ÷ 126,554 Square Feet) and an operating expense ratio of 54.99% ($532,507 ÷ $968,354), including reserves for replacement. The following are the calculations utilized in adjusting the comparable sales. The following chart summarizes the per square foot price and NOI per square foot for each of the comparables:
71
Improved Sales
Recap of Price Per Square Foot and
NOI Per Square Foot for the Comparables
| # | Date | Price Per Square Foot | NOI Per Square Foot | |||||||
| 1 | 6/05 | $ | 37.53 | $ | 2.99 | |||||
| 2 | 2/23/05 | $ | 45.13 | $ | 4.25 | |||||
| 3 | 8/16/05 | $ | 63.34 | $ | 4.50 | |||||
| 4 | 12/17/04 | $ | 55.59 | $ | 4.35 | |||||
| 5 | 10/24/06 | $ | 55.08 | $ | 3.63 | |||||
Average | $ | 51.33 | $ | 3.94 | ||||||
Subject | N/A | $ | 3.44 | |||||||
The adjustments will be derived by determining the percentage of the NOI for each comparable that the subject's NOI represents. These adjustments (percentages) will then be applied to (multiplied by) the corresponding sales price for the given comparable, resulting in the adjusted price of the comparable. The NOIs, adjustments, and the corresponding adjusted prices per square foot are illustrated below:
NOI Per Square Foot Adjustments
Sale No. | Subject's NOI/SF | Comparable's NOI/SF | Adjustment Factor | Price $/SF | Adjusted Price/SF | ||||
| 1 | $3.44 | ÷ | $2.99 | = | 1.1533 | x | $37.53 | = | $43.28 |
| 2 | $3.44 | ÷ | $4.25 | = | 0.8113 | x | $45.13 | = | $36.61 |
| 3 | $3.44 | ÷ | $4.50 | = | 0.7659 | x | $63.34 | = | $48.51 |
| 4 | $3.44 | ÷ | $4.35 | = | 0.7924 | x | $55.59 | = | $44.05 |
| 5 | $3.44 | ÷ | $3.63 | = | 0.9480 | x | $55.08 | = | $52.21 |
| MEAN | $51.33 | $44.93 | |||||||
| STANDARD DEVIATION | $9.01 | $5.26 | |||||||
| CONCLUDED VALUE PER SQUARE FOOT | $42.00 | ||||||||
Before adjustment, the comparables offer prices ranging from $37.53/SF to $63.34/SF, with a mean of $51.33/SF and a standard deviation of $9.01. This same range after adjustments narrows to $36.61/SF to $52.21/SF with a mean of $44.93/SF and a lower standard deviation of $5.26. The adjustments have tightened the dispersion about the mean, thus providing a more supportable value indication. However, one must considered the current interest rate environment and the new tax law (see conclusion for Direct Capitalization). Based on a comparison of NOIs for the comparables, market value for the subject property is estimated at $42.00/SF, applied to the subject as follows:
NOI Per SF Indication
| 126,554 SF x $42.00/SF | = | $5,315,268 |
| Less: Deferred Maintenance | = | $0 |
| Net Value Indication | = | $5,315,268 |
ROUNDED | = | $5,320,000 |
72
Improved Sales
Effective Gross Income Multiplier (EGIM)
The effective gross income multiplier is also indicative of the income/investment nature of a property such as the subject. However, the primary concern of an investor is the net return after expenses as opposed to the gross earning potential. Thus, this method is most useful when the expense character of the property is highly similar to the property being analyzed.
The principal advantage of the technique is that the reflection of rental income is direct. Therefore, differences between properties which could involve adjustments, based on judgement estimates, have been resolved by the free action of the rental market. If the comparable properties have some advantage over the subject in age, condition, accessibility, location or physical characteristics, the difference in actual rental presumably reflects the extent of this advantage. The following chart summarizes the estimated EGIMs of the comparable sales.
Summary of Comparable EGIMs
Sale No. | EGIM | Expense Ratio |
| 1 | 5.09 | 59.47% |
| 2 | 4.96 | 53.35% |
| 3 | 6.80 | 51.71% |
| 4 | 6.63 | 48.15% |
| 5 | 6.85 | 54.83% |
| Average | 6.07 | 53.50% |
| Indicated | 5.80 | 54.99% |
The EGIMs of the comparable sales range from 4.96 to 6.85, with an average of 6.07. Effective gross income multipliers are typically correlated with operating expense ratios (OER). As OERs increase, the efficiency of the property's income producing capacity is diminished. Thus, those sales with the highest OERs typically indicate the lowest EGIMs, and vice versa. This general trend is demonstrated by the comparables.
As detailed later in the Income Approach section of this report, the subject has an operating expense ratio of 54.99%. This ratio is above the mean of the range (due in part to the revised tax law decreasing the tax burden), thus indicating an EGIM below the average of the comparables, before considering the recent upward movement to interest rates and cap rates. Based on an analysis of the comparables, we conclude that the data indicates an EGIM on the order of 5.80%.
Given the recent economic trends, we have relied on another method for extracting an appropriate EGIM for the subject. We have derived an EGIM via the following formula: (1-OER)/OAR = EGIM), where the OAR is the rate determined for the subject in the Income Approach section of this report. The emphasized method of analysis for determining the overall capitalization rate for the subject was the Market Extraction Method which resulted in a stabilized capitalization rate of 8.25% and which is most appropriate to utilize here.
73
Improved Sales
The subject's projected stabilized operating expense ratio is 54.99% or 0.5499. Thus, we have (1 - 0.5499)/8.25% = 5.46x. This figure provides an additional and somewhat reliable estimate of an effective gross income multiplier for the subject. We have placed somewhat equal weight on both of these methods of calculating the EGIM. Based on the data presented, an EGIM of 5.50 is considered appropriate for the subject property, resulting in the following value indication:
EGIM Indication
| STABILIZED EGI x EGIM | = | VALUE |
| $968,354 x 5.50 | = | $5,325,946 |
| Less: Deferred Maintenance | = | $0 |
| Net Value Indication | = | $5,325,946 |
ROUNDED | = | $5,33,000 |
Conclusion of Value
The following chart summarizes the value indications derived for the subject property by the various valuation techniques employed in this Sales Comparison Approach analysis:
Summary of Value Indications
Technique | Indication |
Physical Comparison/Unit | $5,200,000 |
NOI/SF | $5,320,000 |
EGIM | $5,330,000 |
While each of the preceding conclusions are considered to be representative of the subject's market value, the final value indication via this approach must be concluded. The methods of estimating the indicated value of the subject by the Sales Comparison Approach are all self-adjusting techniques which allow for the various differences between the comparables and the subject. In this instance, the methods indicated a fairly narrow range of value indications, which we primarily attribute the range to the change in tax burden from the recently enacted school tax reform. Because the sales occurred prior to the passage of this Act the NOI’s should be on the order of 3-4% lower than had the sale occurred after the recent enactment. Please see the Real Estate and Business Tax section of this report for further details.
74
Improved Sales
It is our opinion that the selling price per unit is one of the methods most often used by investors purchasing apartment complexes in the marketplace. The Physical Comparison approach is distinct and is independent of the Income Approach, and thus we have placed the most emphasis on the value indication derived through the physical comparison analysis. The estimated value for the subject property, via the Sales Comparison Approach, is concluded as follows:
Sales Comparison Approach Conclusion | $5,200,000 |
Value Per Unit | $40,625 |
Value Per Square Foot | $41.09 |
75
Income Approach
The Income Approach to value assumes a direct relationship between value and income. The two primary methods of estimating value from a property’s income are Direct Capitalization and Yield Capitalization (Discounted Cash Flow Analysis).
In Direct Capitalization, value is estimated by deducting all applicable expenses from anticipated gross income to arrive at projected net income for the coming year. This amount is then capitalized at a rate which is commensurate with the risk inherent in the ownership of the property. Direct Capitalization is most appropriate for stabilized income streams where the property being analyzed reflects occupancy rates typical of the market.
With respect to Yield Capitalization or Discounted Cash Flow Analysis, value is estimated by deducting all applicable expenses from anticipated gross income to arrive at projected net income during each year of the projection period, which is then discounted at a rate commensurate with the perceived risk. A reversion value is computed at the end of the projection period, and this amount is also discounted and added to the present value of the annual income streams to derive an estimate of value. The analysis method involves a variety of projections relative to changes in the income stream over time as a result of changes in occupancy and inflationary factors. This method is well suited to properties that are not at stabilized operating levels, or when fluctuating income streams are anticipated.
Gross Income Estimate
The potential gross income estimate is obtained by estimating the market rent for the subject property. Market rent is defined in The Appraisal of Real Estate, Tenth Edition, Copyright 1993, Appraisal Institute as:
"The total income attributable to a real property at 100% occupancy before operating expenses are deducted."
This definition is in reference to the amount of money a property should produce based on actual rents being received from similar properties with comparable amenities located in the same neighborhood or other similar areas. Therefore, research and analysis of lease rates on units considered similar to or competitive with the subject was necessary.
Information was obtained from owners, developers, managers and leasing agents, and/or other knowledgeable persons involved in lease transactions, and data concerning the properties considered generally similar to or competitive with the subject.
In addition to the analysis of the cited rent comparables, current occupancy levels, absorption rates and general market trends were discussed with active real estate professionals in the subject neighborhood. The data presented emphasizes competing facilities in the market with property types most similar to the subject.
76
Income Approach
Rent Comparison Analysis
The first step in establishing the correct market rent for the subject will be to present and analyze properties that are considered direct competition to the subject. For this analysis we will utilize a simple 10 point rating system. The subject will be assigned a baseline of 5 points for each category of comparison and any differences determined amongst the comparables will be assigned a number higher than 5 to indicate superiority and a number lower than 5 to indicate an inferiority. This 10 point rating system will be utilized for ten categories of comparison that we have deemed to have the most impact on the market rent of each property.
We will utilize adjustment factors to assign a percentage value to each rating to help determine the perceived difference between the subject and each comparable. The adjustment factors are variable and subjective to each property and will be discussed within the presentation of the adjustment grid.
The only variation from the method described will be for concessions. For this comparison category each property, including the subject, is compared to the actual market rent and a rating is assigned based on the current discount offered at each property after consideration of a stabilized loss to lease adjustment utilized for the subject. We will designate a rating for each property based on the percentage discount on the asking rent to derive a rent more similar to the effective rent after discounts for each property.
In other words, if the property offers a discount of one month free on a one year lease the calculated discount is approximately 8.3%. We will adjust this discount downward to account for a stabilized loss to lease adjustment and consideration that not every tenant will receive this discount on a new or renewing lease. For example, we may consider the impact of this discount to be more on the order of 6%. We will then determine a weighting factor, such as 3% per rating point, and determine a rating that when factored will indicate an adjustment similar to the actual rental rate discount provided. In this case the rating difference would be 2 points below the baseline of 5 points with the resulting rating of 3 points. We will adjust the subject and all comparables in a similar manner to facilitate the determination of the appropriate market rent for the subject.
77
Subject Property
 | Chimney Square 3201 South 23rd Street Abilene, Texas 79605 98% |
Property Features | Rating | |
| Year of Construction: | 1981 | 5 |
| Quality Class: | B+ | 5 |
| Condition: | Average | 5 |
| Location: | Average | 5 |
| Utilities: | Tenant pay electric | 5 |
| Project Amenities: | Pool, clubhouse, carports and garages | 5 |
| Unit Features: | Standard kitchen appliances, ceiling fans, pantries, fireplaces, patio/balcony, and select feature washer/dryer connections. | 5 |
| Laundry: | WDC in all but 1 bed units and two laundry facilities. | 5 |
| Parking: | Open/Carports/Garage | 5 |
| Concessions: | $20 off in select units | 5 |
| Amenities: | ||||||||||
| # Pools: | Y | BBQ Grills: | N | Self-Clean Oven: | Y | Ceiling Fan: | Y | |||
| # Laundry: | 2 | Playground: | N | Cont-Clean Oven: | N | Patio/Balcony: | Y | |||
| # Tennis Courts: | N | Fitness Center: | N | Double Oven: | N | Extra Storage: | Y | |||
| Water V-Ball: | N | Jogging Trail: | N | F.F. Refrigerator: | Y | Linen Closet: | Y | |||
| Volleyball: | N | Soc Activities | N | Ice Maker: | S | Mini-Blinds: | N | |||
| Basketball: | N | Access Gates | N | Dishwasher: | Y | Private Alarms: | N | |||
| Racquetball: | N | On-Site MGMT: | Y | Disposal: | Y | Vaulted Ceilings: | N | |||
| Jacuzzi: | N | Courtesy Patrol | N | Microwave: | N | Vanity: | S | |||
| Sauna: | N | Road Service: | N | Pantry: | Y | Walk-In Closet: | Y | |||
| Clubhouse: | Y | Corporate: | N | Wall-Wall Carpet: | Y |
| Amenities (Y=Yes, N=No, S=Some, E=Extra Cost) | Information provided by ALN Systems, Inc. |
| Comments: | Up to $20 off in select units | |
| Confirmation: | Management | 325-695-1855 |
78
Subject Property
RENTAL DATA
Unit Type | # Units | Size (SF) | Monthly Rent | $/SF/ Month | Total SF | Total Rent | ||||||||||||||||||||||
| 1 | Bd | 1.0 | Ba | 8 | 670 | $ | 499 | $ | 0.74 | 5,360 | $ | 3,992 | ||||||||||||||||
| 1 | Bd | 1.0 | Ba | 44 | 684 | $ | 509 | $ | 0.74 | 30,096 | $ | 22,396 | ||||||||||||||||
| 2 | Bd | 1.0 | Ba | 40 | 958 | $ | 659 | $ | 0.69 | 38,320 | $ | 26,360 | ||||||||||||||||
| 2 | Bd | 1.0 | Ba | 12 | 964 | $ | 669 | $ | 0.69 | 11,568 | $ | 8,028 | ||||||||||||||||
| 2 | Bd | 2.0 | Ba | 1 | 1,386 | $ | 829 | $ | 0.60 | 1,386 | $ | 829 | ||||||||||||||||
| 2 | Bd | 2.5 | Ba | 2 | 1,700 | $ | 929 | $ | 0.55 | 3,400 | $ | 1,858 | ||||||||||||||||
| 3 | Bd | 2.0 | Ba | 11 | 1,680 | $ | 939 | $ | 0.56 | 18,480 | $ | 10,329 | ||||||||||||||||
| 3 | Bd | 3.0 | Ba | 2 | 1,737 | $ | 949 | $ | 0.55 | 3,474 | $ | 1,898 | ||||||||||||||||
| 3 | Bd | 2.0 | Ba | 3 | 1,805 | $ | 969 | $ | 0.54 | 5,415 | $ | 2,907 | ||||||||||||||||
| 3 | Bd | 3.0 | Ba | 5 | 1,811 | $ | 979 | $ | 0.54 | 9,055 | $ | 4,895 | ||||||||||||||||
Totals & Means | 128 | 989 | $ | 652 | $ | 0.66 | 126,554 | $ | 83,492 | |||||||||||||||||||
79
Rent Comparable No. 1
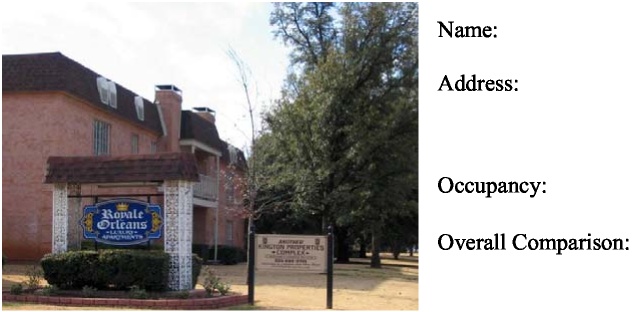 | Royale Orleans 2701 Southwest Dr. Abilene, TX 100% Inferior |
Property Features | Comparison | Rating | |
| Year of Construction: | 1972 | Similar | 5 |
| Quality Class: | B+ | Similar | 5 |
| Condition: | Average | Similar | 5 |
| Location: | ½ of a mile southwest of subject | Similar | 5 |
| Utilities: | Tenant pay electric | Similar | 5 |
| Project Amenities: | Pool, clubhouse, and carports. | Similar | 5 |
| Unit Amenities: | patio/balcony, ceiling fans, and fireplace in 2 and 3 bedroom units. | Similar | 5 |
| Laundry: | Laundry facility/WDC | Similar | 5 |
| Parking: | Open/Carports | Inferior | 4 |
| Concessions: | No Specials | Similar | 5 |
| Amenities: | ||||||||||
| # Pools: | Y | Tennis Court: | N | Washer/Dryer: | N | Vanity: | N | |||
| Jacuzzi: | N | Access Gates | N | W/D Connection: | Y | Double Bath Sinks: | N | |||
| Clubhouse: | Y | Interior Alarms: | N | Microwave: | N | Garden Tubs: | N | |||
| Fitness Center: | N | Patio/Balcony: | Y | Elec. Appliances: | Y | Walk-in Showers: | N | |||
| Sauna: | N | Garages: | N | Dishwasher: | Y | Fireplace: | S | |||
| Business Center: | N | Covered Parking: | Y | Ice-maker: | N | Ceiling Fans: | Y | |||
| Laundry: | Y | Storage: | N | Double Sinks: | N | Crown Molding: | N | |||
| Playground: | N | On-Site Mgmt: | N | Pantry: | N | Vaulted Ceilings: | N | |||
| BBQ Grills: | N | Disposal: | Y | Walk-in Closets: | N | |||||
| Sports Court: | N | Linen Closet: | Y |
Amenities (Y=Yes, N=No, S=Some)
| Comments: | $30 discount for Military or students | |
| Confirmation: | Kington Properties. | 325-697-3157 |
80
Rent Comparable No. 1
RENTAL DATA
Unit Type | #Units | Size (SF) | Monthly Rent | $/SF/Month | Total SF | Total Rent | |||||||||||||
1 Bd 1.0 Ba | 16 | 761 | $ | 545 | $ | 0.72 | 12,176 | $ | 8,720 | ||||||||||
2 Bd 1.0 Ba | 16 | 996 | $ | 625 | $ | 0.63 | 15,936 | $ | 10,000 | ||||||||||
2 Bd 2.0 Ba | 40 | 1,096 | $ | 645 | $ | 0.59 | 43,840 | $ | 25,800 | ||||||||||
3 Bd 2.0 Ba | 16 | 1,508 | $ | 845 | $ | 0.56 | 24,128 | $ | 13,520 | ||||||||||
3 Bd 2.0 Ba,TH | 6 | 1,890 | $ | 1,045 | $ | 0.55 | 11,340 | $ | 6,270 | ||||||||||
Total & Means | 94 | 1,143 | $ | 684 | $ | 0.60 | 107,420 | $ | 64,310 | ||||||||||
81
Rent Comparable No. 2
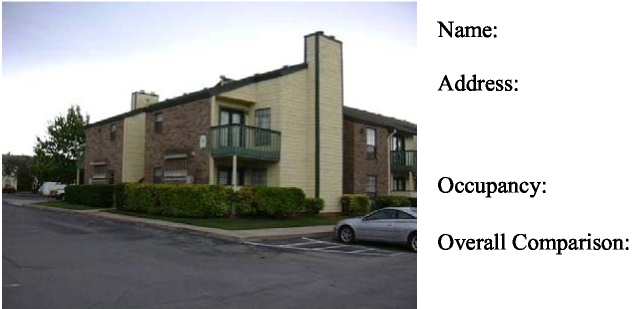 | Name: Address: Occupancy: Overall Comparison | Mill Creek 5249 Highway 277 South Abilene, TX 97% Inferior |
Property Features | Comparison | Rating | |
| Year of Construction: | 1982 | Similar | 5 |
| Quality Class: | B+ | Similar | 5 |
| Condition: | Average | Similar | 5 |
| Location: | 2 miles west of subject | Similar | 5 |
| Utilities: | Tenant pays electric | Similar | 5 |
| Project Amenities: | Pool, clubhouse, fitness center, tennis court, playground, and picnic tables. | Similar | 5 |
| Unit Amenities: | Ceiling fans, patio/balcony, and fireplaces. | Similar | 5 |
| Laundry: | Select with washer/dryer connections WDC in select and laundry facility | Similar | 5 |
| Parking: | Open and 20 carports | Inferior | 3.5 |
| Concessions: | No Specials | Similar | 5 |
| Amenities: | ||||||||||
| # Pools: | Y | Tennis Court: | Y | Washer/Dryer: | N | Vanity: | N | |||
| Jacuzzi: | N | Access Gates | N | W/D Connection: | S | Double Bath Sinks: | N | |||
| Clubhouse: | Y | Interior Alarms: | N | Microwave: | N | Garden Tubs: | N | |||
| Fitness Center: | Y | Patio/Balcony: | Y | Elec. Appliances: | Y | Walk-in Showers: | N | |||
| Sauna: | N | Garages: | N | Dishwasher: | Y | Fireplace: | Y | |||
| Business Center: | N | Covered Parking: | S | Ice-maker: | N | Ceiling Fans: | Y | |||
| Laundry: | Y | Storage: | N | Double Sinks: | Y | Crown Molding: | N | |||
| Playground: | Y | On-Site Mgmt: | N | Pantry: | N | Vaulted Ceilings: | N | |||
| BBQ Grills: | N | Disposal: | Y | Walk-in Closets: | N | |||||
| Sports Court: | N | Linen Closet: | N |
Amenities (Y=Yes, N=No, S=Some)
| Comments: | No Specials | |
| Confirmation: | Management | 325-695-0671 |
82
Rent Comparable No. 2
RENTAL DATA
Unit Type | #Units | Size (SF) | Monthly Rent | $/SF/Month | Total SF | Total Rent | |||||||||||||
1 Bd 1.0 Ba, FP | 24 | 670 | $ | 505 | $ | 0.75 | 16,080 | $ | 12,120 | ||||||||||
1 Bd 1.0 Ba, WDC, FP | 24 | 725 | $ | 540 | $ | 0.74 | 17,400 | $ | 12,960 | ||||||||||
1 Bd 1.0 Ba, WDC, FP | 24 | 800 | $ | 580 | $ | 0.73 | 19,200 | $ | 13,920 | ||||||||||
2 Bd 1.0 Ba, WDC, FP | 24 | 900 | $ | 620 | $ | 0.69 | 21,600 | $ | 14,880 | ||||||||||
2 Bd 2.0 Ba, WDC, FP | 16 | 1,020 | $ | 680 | $ | 0.67 | 16,320 | $ | 10,880 | ||||||||||
2 Bd 2.0 Ba, WDC, FP | 24 | 1,070 | $ | 685 | $ | 0.64 | 25,680 | $ | 16,440 | ||||||||||
2 Bd 2.0 Ba, WDC, FP | 24 | 1,250 | $ | 755 | $ | 0.60 | 30,000 | $ | 18,120 | ||||||||||
3 Bd 2.0 Ba, WDC, FP | 16 | 1,350 | $ | 855 | $ | 0.63 | 21,600 | $ | 13,680 | ||||||||||
Total & Means | 176 | 954 | $ | 642 | $ | 0.67 | 167,880 | $ | 113,000 | ||||||||||
83
Rent Comparable No. 3
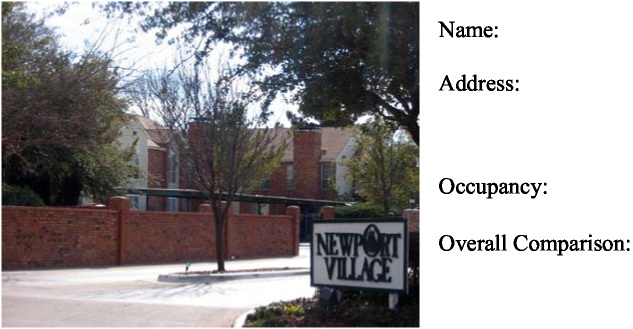 | Name: Address: Occupancy: Overall Comparison | Newport Village 3525 Rolling Green Abilene, TX 97% Inferior |
Property Features | Comparison | Rating | |
| Year of Construction: | 1984 | Similar | 5 |
| Quality Class: | B | Similar | 5 |
| Condition: | Average | Similar | 5 |
| Location: | 1 ½ miles southwest of subject | Similar | 5 |
| Utilities: | Tenant pays electric | Similar | 5 |
| Project Amenities: | Pools, hot tub, and access gate. | Similar | 5 |
| Unit Amenities: | Patio/balcony and fireplaces in most 2nd story units. | Similar | 5 |
| Laundry: | WDC in select units and laundry facility | Similar | 5 |
| Parking: | Open and carports | Inferior | 4 |
| Concessions: | No Specials | Similar | 5 |
| Amenities: | ||||||||||
| # Pools: | Y | Tennis Court: | N | Washer/Dryer: | N | Vanity: | N | |||
| Jaccuzzi: | N | Access Gates | Y | W/D Connection: | Y | Double Bath Sinks: | N | |||
| Clubhouse: | Y | Interior Alarms: | N | Microwave: | N | Garden Tubs: | N | |||
| Fitness Center: | N | Patio/Balcony: | Y | Elec. Appliances: | Y | Walk-in Showers: | N | |||
| Sauna: | N | Garages: | N | Dishwasher: | Y | Fireplace: | S | |||
| Business Center: | N | Covered Parking: | Y | Ice-maker: | N | Ceiling Fans: | Y | |||
| Laundry: | Y | Storage: | N | Double Sinks: | Y | Crown Molding: | N | |||
| Playground: | N | On-Site Mgmt: | N | Pantry: | N | Vaulted Ceilings: | N | |||
| BBQ Grills: | N | Disposal: | Y | Walk-in Closets: | N | |||||
| Sports Court: | N | Linen Closet: | N |
Amenities (Y=Yes, N=No, S=Some)
| Comments: | No Specials | |
| Confirmation: | Newport Village | 325-691-1470 |
84
Rent Comparable No. 3
RENTAL DATA
Unit Type | #Units | Size (SF) | Monthly Rent | $/SF/Month | Total SF | Total Rent | |||||||||||||
1 Bd 1.0 Ba | 48 | 511 | $ | 425 | $ | 0.83 | 24,528 | $ | 20,400 | ||||||||||
1 Bd 1.0 Ba | 24 | 620 | $ | 500 | $ | 0.81 | 14,880 | $ | 12,000 | ||||||||||
2 Bd 1.0 Ba | 24 | 856 | $ | 575 | $ | 0.67 | 20,544 | $ | 13,800 | ||||||||||
2 Bd 2.0 Ba | 72 | 1,090 | $ | 650 | $ | 0.60 | 78,480 | $ | 46,800 | ||||||||||
1 Bd 1.0 Ba | 16 | 850 | $ | 575 | $ | 0.68 | 13,600 | $ | 9,200 | ||||||||||
2 Bd 2.0 Ba | 32 | 1,080 | $ | 700 | $ | 065 | 34,560 | $ | 22,400 | ||||||||||
Total & Means | 216 | 864 | $ | 577 | $ | 0.67 | 186,592 | $ | 124,600 | ||||||||||
85
Rent Comparable No. 4
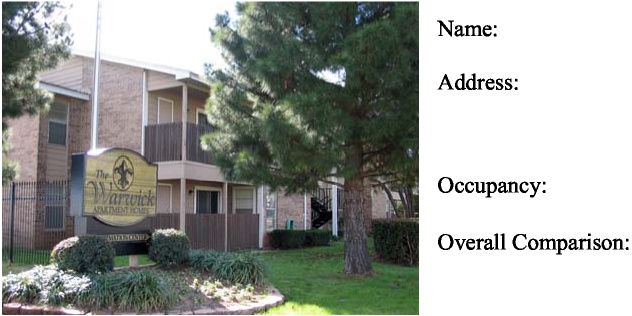 | Name: Address: Occupancy: Overall Comparison | Warwick 2400 Arrowhead Drive Abilene, TX 97% Inferior |
Property Features | Comparison | Rating | |
| Year of Construction: | 1981 | Similar | 5 |
| Quality Class: | B+ | Superior | 6 |
| Condition: | Average | Similar | 5 |
| Location: | 1 3/4 miles southeast of subject | Similar | 5 |
| Utilities: | Tenant pays electric | Similar | 5 |
| Project Amenities: | Pool, sauna, fitness center and carports. | Similar | 5 |
| Unit Amenities: | Pantry, patio/balcony, ceiling fan, and fireplaces. | Similar | 5 |
| Laundry: | WDC and laundry facilities | Similar | 5 |
| Parking: | Open and carports | Inferior | 4 |
| Concessions: | No Specials | Similar | 5 |
| Amenities: | ||||||||||
| # Pools: | Y | Tennis Court: | N | Washer/Dryer: | N | Vanity: | N | |||
| Jaccuzzi: | N | Access Gates | N | W/D Connection: | Y | Double Bath Sinks: | N | |||
| Clubhouse: | N | Interior Alarms: | N | Microwave: | N | Garden Tubs: | N | |||
| Fitness Center: | Y | Patio/Balcony: | Y | Elec. Appliances: | Y | Walk-in Showers: | N | |||
| Sauna: | Y | Garages: | N | Dishwasher: | Y | Fireplace: | Y | |||
| Business Center: | N | Covered Parking: | Y | Ice-maker: | Y | Ceiling Fans: | Y | |||
| Laundry: | Y | Storage: | N | Double Sinks: | Y | Crown Molding: | N | |||
| Playground: | Y | On-Site Mgmt: | N | Pantry: | Y | Vaulted Ceilings: | N | |||
| BBQ Grills: | N | Disposal: | Y | Walk-in Closets: | N | |||||
| Sports Court: | N | Linen Closet: | Y |
| Comments: | No Specials | |
| Confirmation: | BH Management | 325-695-6050 |
86
Rent Comparable No. 4
Unit Type | #Units | Size (SF) | Monthly Rent | $/SF/Month | Total SF | Total Rent | |||||||||||||
1 Bd 1.0 Ba, WDC, FP | 40 | 823 | $ | 629 | $ | 076 | 32,920 | $ | 25,160 | ||||||||||
2 Bd 2.0 Ba WDC, FP | 40 | 951 | $ | 670 | $ | 0.70 | 38,040 | $ | 26,800 | ||||||||||
2 Bd 2.0 Ba WDC, FP | 48 | 963 | $ | 680 | $ | 0.71 | 46,224 | $ | 32,640 | ||||||||||
3 Bd 2.0 Ba WDC, FP | 24 | 1,080 | $ | 829 | $ | 0.77 | 25,920 | $ | 19,896 | ||||||||||
Total & Means | 152 | 941 | $ | 687 | $ | 0.73 | 143,104 | $ | 104,496 | ||||||||||
87
Rent Comparable No. 5
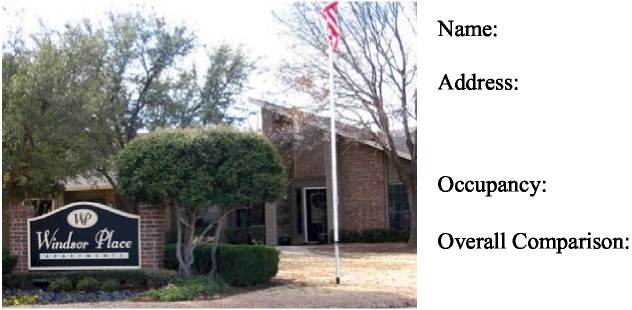 | Name: Address: Occupancy: Overall Comparison | Windsor Place 3501 Curry Lane Abilene, TX 96% Inferior |
Property Features | Comparison | Rating | |
| Year of Construction: | 1982 | Similar | 5 |
| Quality Class: | B | Similar | 5 |
| Condition: | Average | Similar | 5 |
| Location: | 1 1/4 miles southwest of subject | Similar | 5 |
| Utilities: | Tenant pays utilities | Inferior | 4 |
| Project Amenities: | Pool and clubhouse | Similar | 5 |
| Unit Amenities: | Pantries and patio/balcony. | Similar | 5 |
| Laundry: | Laundry facility | Similar | 5 |
| Parking: | Open | Inferior | 3.5 |
| Concessions: | No Specials | Similar | 5 |
| Amenities: | ||||||||||
| # Pools: | Y | Tennis Court: | N | Washer/Dryer: | N | Vanity: | N | |||
| Jaccuzzi: | N | Access Gates | N | W/D Connection: | N | Double Bath Sinks: | N | |||
| Clubhouse: | Y | Interior Alarms: | N | Microwave: | N | Garden Tubs: | N | |||
| Fitness Center: | N | Patio/Balcony: | Y | Elec. Appliances: | Y | Walk-in Showers: | N | |||
| Sauna: | N | Garages: | N | Dishwasher: | Y | Fireplace: | N | |||
| Business Center: | N | Covered Parking: | N | Ice-maker: | Y | Ceiling Fans: | N | |||
| Laundry: | Y | Storage: | N | Double Sinks: | Y | Crown Molding: | N | |||
| Playground: | N | On-Site Mgmt: | N | Pantry: | Y | Vaulted Ceilings: | N | |||
| BBQ Grills: | N | Disposal: | Y | Walk-in Closets: | N | |||||
| Sports Court: | N | Linen Closet: | N |
| Comments: | No Specials | |
| Confirmation: | Management | 325-692-4345 |
88
Rent Comparable No. 5
Unit Type | #Units | Size (SF) | Monthly Rent | $/SF/Month | Total SF | Total Rent | |||||||||||||
1 Bd 1.0 Ba | 48 | 638 | $ | 475 | $ | 0.74 | 30,624 | $ | 22,800 | ||||||||||
1 Bd 1.0 Ba | 40 | 728 | $ | 499 | $ | 0.69 | 29,120 | $ | 19,960 | ||||||||||
2 Bd 2.0 Ba | 28 | 931 | $ | 625 | $ | 0.67 | 26,068 | $ | 17,500 | ||||||||||
1 Bd 1.0 Ba, TH | 24 | 757 | $ | 525 | $ | 0.69 | 18,168 | $ | 12,600 | ||||||||||
1 Bd 1.5 Ba, TH | 24 | 844 | $ | 550 | $ | 0.65 | 20,256 | $ | 13,200 | ||||||||||
2 Bd 2.0 Ba | 36 | 1,042 | $ | 660 | $ | 0.63 | 37,512 | $ | 23,760 | ||||||||||
2 Bd 2.5 Ba, TH | 28 | 1,207 | $ | 705 | $ | 0.58 | 33,796 | $ | 19,740 | ||||||||||
Total & Means | 228 | 858 | $ | 568 | $ | 0.66 | 195,544 | $ | 129,560 | ||||||||||
89
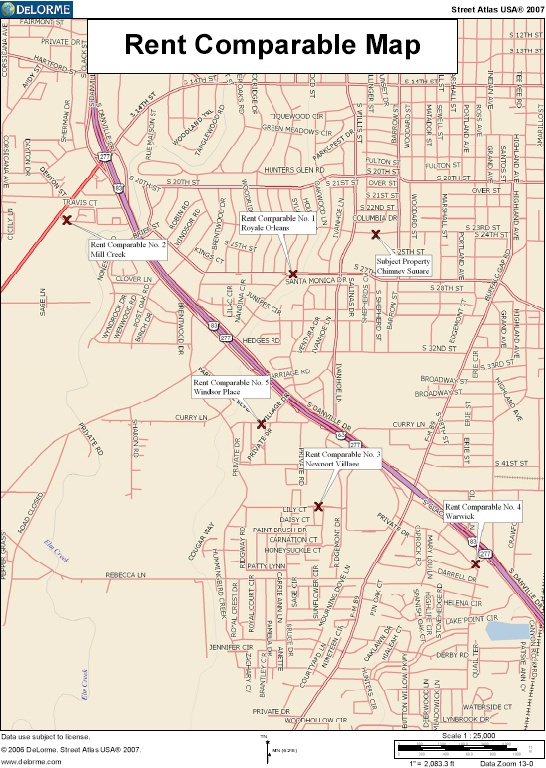
90
Income Approach
Income Analysis
Income Analysis
In this portion of the Income Approach, our objective is to determine if the present rental rates for the subject are at market. We will utilize two methods to make this determination. First we will compare the subject’s overall rental rates and attributes with competing facilities and make adjustments in regards to differences and their perceived contribution to rent disparities. And finally, we will analyze the current collections on a unit by unit basis to determine the trend of discrepancies, if any, between the current asking rents and the actual collected rents. A summary of the comparables, inclusive of the subject, is presented in the table below.
Summary of Rent Comparables
No. Name | Units | Avg. Unit Size (SF) | Avg Rent Per Month | Avg Rent PSF | YOC | Occup |
Sub Chimney Square | 128 | 989 | $652 | $0.66 | 1981 | 98% |
1 Royale Orleans | 94 | 1,143 | $684 | $0.60 | 1972 | 100% |
2 Mill Creek | 176 | 954 | $642 | $0.67 | 1982 | 97% |
3 Newport Village | 216 | 864 | $577 | $0.67 | 1984 | 97% |
4 Warwick | 152 | 941 | $687 | $0.73 | 1981 | 97% |
5 Windsor Place | 228 | 858 | $568 | $0.66 | 1982 | 96% |
Average of Comparables | 173 | 952 | $632 | $0.67 | 1980 | 97% |
On a per square foot basis, the comparables offer monthly rents ranging from $0.60 to $0.73, with an average of $0.67. The subject’s monthly rents average $0.66/SF, which is within the range of the comparables, and just slightly above the mean.
In order to determine probable market rents, we have rated each of the comparables in relation to the subject in several categories, including age, quality, condition, location, amenities, and concessions. The results are summarized in the following chart.
91
Income Approach
Overall Rating of Comparables in Relation to Subject | ||||||
Subject | Rent 1 | Rent 2 | Rent 3 | Rent 4 | Rent 5 | |
Property Name | Chimney Square | Royale Orleans | Mill Creek | Newport Village | Warwick | Windsor Place |
Avg Rent/Unit | $652 | $684 | $642 | $577 | $687 | $568 |
YOC | 1981 Comparison Adjustment | 1972 Similar 0% | 1982 Similar 0% | 1984 Similar 0% | 1981 Similar 0% | 1982 Similar 0% |
Quality Class | B+ Comparison Adjustment | B+ Similar 0% | B+ Similar 0% | B Similar 0% | B+ Superior -6% | B Similar 0% |
Condition | Average Comparison Adjustment | Average Similar 0% | Average Similar 0% | Average Similar 0% | Average Similar 0% | Average Similar 0% |
Location | Comparison Adjustment | Similar 0% | Similar 0% | Similar 0% | Similar 0% | Similar 0% |
Utilities | Tenant pay electric Comparison Adjustment | Tenant pay electric Similar 0% | Tenant pays electric Similar 0% | Tenant pays electric Similar 0% | Tenant pays electric Similar 0% | Tenant pays utilities Inferior 4% |
Project Amenities | Comparison Adjustment | Similar 0% | Similar 0% | Similar 0% | Similar 0% | Similar 0% |
Unit Features | Comparison Adjustment | Similar 0% | Similar 0% | Similar 0% | Similar 0% | Similar 0% |
Laundry | Comparison Adjustment | Similar 0% | Similar 0% | Similar 0% | Similar 0% | Similar 0% |
Parking | Comparison Adjustment | Inferior 2% | Inferior 3% | Inferior 2% | Inferior 2% | Inferior 3% |
Concessions | $20 off in select units Comparison Adjustment | No Specials Effective Rent 0% | No Specials Effective Rent 0% | No Specials Effective Rent 0% | No Specials Effective Rent 0% | No Specials Effective Rent 0% |
Avg Unit Size | 989 Comparison Adjustment | 1,143 Superior -7% | 954 Inferior 2% | 864 Inferior 7% | 941 Inferior 3% | 858 Inferior 8% |
Net Adjustment Comparison Indicated Market | -5% Superior $650 | 5% Inferior $674 | 9% Inferior $629 | -1% Superior $681 | 15% Inferior $653 | |
Average Rent | $657 | |||||
In the above chart we have summarized adjustments for our perceived differences between the subject and each of the comparables. Based on our analysis of differences among the comparables, we have determined weighting factors to conclude unbiased adjustments for each of the categories analyzed. For the comparison analysis of the subject, we have utilized adjustment factors ranging from 2% per point for the majority of the comparison categories to 6% per point for our quality adjustment.
Additionally, the size differential has been adjusted by a factor of 50% to account for the economy of scale in unit size to per square foot rental rate ratio. In other words, if the subject’s unit size is 10% greater than a comparable, then the comparable per square foot rental rate would be adjusted upward by 5%.
92
Income Approach
After applying the appropriate adjustments, the comparable s suggest average rents for the subject ranging from $629 to $681, with a mean of $657. The subject’s current quoted street rents average $652 per unit, which is within the range of the comparable adjusted rates. It should be considered that these calculated rates are reflective of current effective asking rents and may not reflect all discounts and concessions. The subject’s reported current asking rate appears reflective of market rates.
The comparables present a range of somewhat similar products in regard to location, age, quality and amenities. The net adjustments applied for differences in the factors of comparison range from -5% to 15% Throughout this analysis we have attempted to make adjustments to quantify the impact of these factors on the average rental rate at each property in respect to the subject property. We conclude that the dispersion of rental rates has tightened about the mean and provides support to the subject’s rental rate.
Upon reviewing the range of rental rates from this analysis of individual units, we conclude that many of the subject rental rates, after consideration of a stabilized loss to lease factor, are well supported by being within the range of each analysis and near the mean in many instances.
The preceding analysis leads to rent indications that must be considered in estimating the market rent, however due to the subjective nature of analyzing the attributes of the comparables less weight is given than the analysis of the actual collected rents demonstrated by the property. One the most telling indicators of the appropriate market rental rates is a review of the rent roll and the actual collected rents which are net of any concessions. The following chart summarizes the estimated PGRI for the subject, as well as current actual rents in place for each unit type.
Calculation of Potential Gross Rental Income
Actual Rents* | Quoted | Estimated Market Rents | |||||||||||
Unit Type | # of Units | # Vac | Size (SF) | Vac SF | Total | Low | High | Avg | S/SF | Rent | Monthly | $/SF | Total/YR |
| 1 Bd 1.0 Ba | 8 | 0 | 670 | 0 | $3,852 | $479 | $499 | $482 | $0.719 | $499 | $499 | $0.745 | $47,904 |
| 1 Bd 1.0 Ba | 44 | 1 | 684 | 684 | $21,277 | $489 | $559 | $495 | $0.723 | $509 | $509 | $0.744 | $268,752 |
| 2 Bd 1.0 Ba | 40 | 1 | 958 | 958 | $25,421 | $599 | $709 | $652 | $0.680 | $659 | $659 | $0.688 | $316,320 |
| 2 Bd 1.0 Ba | 12 | 0 | 964 | 0 | $8,028 | $669 | $669 | $669 | $0.694 | $669 | $669 | $0.694 | $96,336 |
| 2 Bd 2.0 Ba | 1 | 0 | 1,386 | 0 | $829 | $829 | $829 | $829 | $0.598 | $829 | $829 | $0.598 | $9,948 |
| 2 Bd 2.5 Ba | 2 | 0 | 1,700 | 0 | $1,858 | $929 | $929 | $929 | $0.546 | $929 | $929 | $0.546 | $22,296 |
| 3Bd 2.0 Ba | 11 | 1 | 1,680 | 1,680 | $9,400 | $899 | $989 | $940 | $0.560 | $939 | $939 | $0.559 | $123,948 |
| 3 Bd 3.0 Ba | 2 | 0 | 1,737 | 0 | $18,848 | $899 | $949 | $924 | $0.532 | $949 | $949 | $0.546 | $22,776 |
| 3 Bd 2.0 Ba | 3 | 0 | 1,805 | 0 | $2,907 | $969 | $969 | $969 | $0.537 | $969 | $969 | $0.537 | $34,884 |
| 3 Bd 3.0 Ba | 5 | 0 | 1,811 | 0 | $4,945 | $979 | $1,029 | $989 | $0.546 | $979 | $989 | $0.546 | $59,340 |
Total/Av | 128 | 3 | 989 | 3,322 | $80,365 | N/A | N/A | $643 | $0.650 | $652 | $653 | $0.660 | $1,002,504 |
* Vacant units are not included in averages. Discounted employee units and model are included at the quoted street rates
93
Income Approach
Based upon the current rent roll, the subject’s actual collected rents average $643/unit, which equates to $0.650/SF. The subject has a range of rental rates for each unit type because of the variations of concessions and the lack of increasing rents to the current market lease rates on renewals in an effort to retain tenants. The subject increased rental rates from $20 to $40 per unit in 2006 with the townhomes rents increased in January and the apartment rents increased in October, and thus there is a range of recently signed leases that are notably below the current asking rents, and will most likely be increased to the current level or above upon renewal. Additionally, we conclude that the subject will be able to increase rents slightly ($1 0-$30 per unit) over the next year as the competition maintains stabilized occupancy rates and continue to raise effective rents.
Concessions
Neither the subject, nor any of the competitors are offering any rental concessions on a regular basis, although many complexes, including the subject, indicated that minor discounts such as a reduced first month’s rent are offered on low-demand units.
With the subject at stabilized levels and our estimated rental rates, which consider the subject’s competition and concessions, we conclude that our projected rental income is net of discounts. Although there is some discrepancy between the projected rents and the actual collected rents demonstrated on the rent roll, we conclude that this difference is mainly attributable to the rental rate increases over the last year.
This difference will be steadily decreased at the property with the current leasing trends described. The loss of income between the actual collections and the estimated rents appears minor and will be considered in our loss to lease adjustment and selection of a capitalization rate. Our review of the rent roll revealed that rents average approximately 1.4% below market, with a range of 0-10% below market leases. In the above chart we have adjusted the subject’s market rent of the largest townhome unit upward slightly to reflect the current lease average. After this adjustment, the current actual rents are roughly 1.5% below the estimated market rent of $653/unit, or $0.660/SF. We believe that as the subject executes new leases over the next year a majority of the units will exhibit an increase in effective rents to this level. We will utilize the estimated market rents to derive our PGRI and adjust the rents to more actual collection levels through a loss to lease adjustment.
Other Income
Other income may be attributed to deposit forfeitures, non-refundable pet deposits, lost key charges, application fees, late charges, NSF charges or any other related charges. Following is a summary of other income collected over the past several years.
Historic Other Income
Income Source | 2004 Year End | 2005 Year End | November 2006 11 Mths Annualized | Appraiser’s Estimate |
| Total Other Income | $28,731 | $25,885 | $25,402 | $26,000 |
Per Unit | $224 | $202 | $198 | $203 |
Per Sq. Ft. | $0.23 | $0.20 | $0.20 | $0.21 |
94
Income Approach
Over the past few years, the subject’s reported other income has ranged from $25,402 ($ 198/unit) to $28,731 ($224/unit), with an average of $26,673 ($208/unit). Among the expense comparables, other income ranges from $71/unit to $795/unit, with a mean of $544/unit. Weighing historic and comparable data, the appraisers have projected other income at $26,000 annually, which equates to $0.2 1/SF or $203/unit.
Potential Gross Income (PGI)
Based on the projected rental income and other income described above, the subject’s potential gross income (PGI) is calculated as follows:
Calculation of Potential Gross Income
Total | $ | / Unit | $ | /SF | ||||||
| Potential Gross Rental Income: | $ | 1,002,504 | $ | 7,832 | $ | 7.92 | ||||
| Other Income: | $ | 26,000 | $ | 203 | $ | 0.21 | ||||
| Potential Gross Income: | $ | 1,028,504 | $ | 8,035 | $ | 8.13 |
Vacancy & Collection Loss
L.W. Ellwood, in his Ellwood Tables for Real Estate Appraising and Financing, provides a good example of what a vacancy rate really means. An excerpt from his discussion in this publication is presented below:
A 7% vacancy allowance, for instance, does not mean that exactly 7% of the rent roll will be lost every year by reason of vacancies. A property may enjoy virtually full occupancy for several years, then encounter a period of competition when vacancies amount to 20% or more. Naturally, the net income will be down in such periods, and so will the reversionary value of the property. However, this does not invalidate the projection of the analysis so long as a 7% annual allowance for vacancy is suficient to cover average occupancy for the projected term.
Thus, variations in vacancy do not invalidate the projection or analysis so long as the selected vacancy factor is sufficient to cover average vacancies over the life of the improvements. According to the current rent roll, the subject is currently 98% occupied and 98% leased.
Based on our discussions with the manager and a review of the operating statements, we conclude that the subject has performed typically in-line or above the market average in regards to occupancy over the last several years. Among the rent comparables presented, current occupancy levels range from 96% to 100%, with an average of 97%.
95
Income Approach
At the time of our inspection, the status of the subject was as follows:
Property Status - 1/2/07 | ||
Status | Units | Occupancy |
| Total Property | 128 | |
| Lee: Vacant Units | 3 | |
| Occupied | 125 | 97.7% |
| Less: Noticed Units | 4 | |
| Plus: Vacant Leased | 1 | |
| Plus: Noticed Leased | 0 | |
| Leased | 122 | 98.4% |
For purposes of this analysis, we have adopted a stabilized vacancy and collection loss allowance of 5.0%, allocated as ±4.0% for vacancy and ±1.0% for collection loss. This figure does not include a model unit.
Vacancy and Collection Calculation
5.0% x $1,002,504 (PGRI) = $50,125
Although we are reflecting a vacancy rate that is a few points higher than the subject’s recent performance, we conclude that our vacancy factor must address long-term operations and thus we have utilized a slightly higher rate than currently exhibited at the property.
Loss To Lease
Based upon the current rent roll, the subject’s actual collected rents average $643/unit, which equates to $0.65/SF. These current rents are 1.49% less than the estimated market rents. In making our market rent estimates we have considered the subject’s recent rental rate increase. Although we have concluded rental rates that we consider net of concessions, we conclude that several of the current leases will lag the market rents over the next year. We have concluded that this difference will decrease in the near term and our loss to lease adjustment is made in consideration of the anticipated long-term difference.
For this analysis, a stabilized loss to lease factor of 1.0% is considered reasonable for the subject, resulting in the following adjustment.
Loss to Lease Calculation
1.0% x $1,002,504 (PGRI) = $10,025
96
Income Approach
Effective Gross Income
Given the preceding assumptions regarding rental rates, other income, vacancy and collection loss, and loss to lease factors, the subject’s effective gross income (EGI) is estimated as follows:
Calculation of Effective Gross Income
| Potential Gross Rental Income (PGRI) | $1,002,504 |
| Less: Vacancy and Collection Loss @ 5.0% | ($50,125) |
| Less: Loss to Lease @ 1.0% | ($10,025) |
| Plus: Other Income | $26,000 |
| Effective Gross Income | $968,354 |
The following table illustrates the relationship between the subject’s historic EGI and the figure projected in this analysis.
Historic vs. Projected EGI
2004 Year End | 2005 Year End | November 2006 11 Mths Annualized | Appraisers’ Estimate | ||||||||||
| Effective Gross Income | $932,305 | $941,325 | $962,342 | $968,354 | |||||||||
| % Change | N/A | 1.0% | 2.2% | 0.6% | |||||||||
The projected EGI is 0.6% higher than the November 2006 Trailing 11 Month figure, which we consider consistent with the recent operations and will be very obtainable at the property over the next year. We conclude that we have been somewhat conservative in our occupancy projections and have based our Gross Potential Rent on direct competitor rental rates with a trend toward conservative rate increases, in addition to our combined 6.0% adjustment for vacancy, collection loss and loss-to-lease, as market vacancy appears to be stabile. We further conclude that if the property performs at or near the level of the immediate market in regards to occupancy and continues to implement higher effective rental rates, our EGI estimate may prove to be slightly low.
97
Income Approach
Expense Analysis
Operating expenses include the necessary expenses to maintain the subject property on a daily basis. These expenses include taxes, insurance and reserves for replacements, considered fixed expenses; management, utilities, payroll and payroll taxes, office expenses, advertising, repairs and maintenance, and other miscellaneous costs, considered variable expenses. All of these expenses are necessary in order to preserve the operations of the subject property on a daily basis.
The following charts summarize historic operating expenses for the subject property, expressed as annual totals, per square foot, and per unit. A summary of several expense comparables is presented subsequently.
Historic Operating Statements -Annual Totals
2004 Year End | 20005 Year End | November 2006 11 Mths Annualized | ||||||||
| Net Rental Revenue | $ | 903,574 | $ | 915,440 | $ | 936,940 | ||||
| Other Income | $ | 28,731 | $ | 25,885 | $ | 25,402 | ||||
| Effective Gross Income | $ | 932,305 | $ | 941,325 | $ | 962,342 | ||||
| Property Taxes | $ | 118,004 | $ | 126,231 | $ | 126,996 | ||||
| Insurance | $ | 38,183 | $ | 35,535 | $ | 40,178 | ||||
| Utilities | $ | 42,496 | $ | 44,411 | $ | 38,158 | ||||
| Maintenance | $ | 146,940 | $ | 92,768 | $ | 108,384 | ||||
| Management | $ | 46,615 | $ | 46,996 | $ | 48,104 | ||||
| Payroll | $ | 99,266 | $ | 112,634 | $ | 103,132 | ||||
| Advertising | $ | 2,122 | $ | 2,499 | $ | 1,953 | ||||
| Administrative | $ | 16,059 | $ | 18,296 | $ | 13,449 | ||||
| Reserves | $ | 0 | $ | 0 | $ | 0 | ||||
| Total Operating Expenses | $ | 509,685 | $ | 479,370 | $ | 480,354 | ||||
| Net Operating Income | $ | 422,620 | $ | 461,955 | $ | 481,988 | ||||
| Operating Expense Ratio | 54.67 | % | 50.93 | % | 49.92 | % | ||||
| Management Fee | 5.00 | % | 4.99 | % | 5.00 | % | ||||
98
Income Approach
Historic Operating Statements -Per Unit Basis
2004 Year End | 2005 Year End | November 2006 11 Mths Annualized | ||||||||
| Net Rental Revenue | $ | 7,059 | $ | 7,152 | $ | 7,320 | ||||
| Other Income | $ | 224 | $ | 202 | $ | 198 | ||||
| Effective Gross Income | $ | 7,284 | $ | 7,354 | $ | 7,518 | ||||
| Property Taxes | $ | 922 | $ | 986 | $ | 992 | ||||
| Insurance | $ | 298 | $ | 278 | $ | 314 | ||||
| Utilities | $ | 332 | $ | 347 | $ | 298 | ||||
| Maintenance | $ | 1,148 | $ | 725 | $ | 847 | ||||
| Management | $ | 364 | $ | 367 | $ | 376 | ||||
| Payroll | $ | 776 | $ | 880 | $ | 806 | ||||
| Advertising | $ | 17 | $ | 20 | $ | 15 | ||||
| Administrative | $ | 125 | $ | 143 | $ | 105 | ||||
| Reserves | $ | 0 | $ | 0 | $ | 0 | ||||
| Total Operating Expenses | $ | 3,982 | $ | 3,745 | $ | 3,753 | ||||
| Net Operating Income | $ | 3,302 | $ | 3,609 | $ | 3,766 | ||||
Historic Operating Statements - Per SF Basis
2004 Year End | 2005 Year End | November 2006 11 Mths Annualized | ||||||||
| Net Rental Revenue | $ | 7.14 | $ | 7.23 | $ | 7.40 | ||||
| Other Income | $ | 0.23 | $ | 0.20 | $ | 0.20 | ||||
| Effective Gross Income | $ | 7.37 | $ | 7.44 | $ | 7.60 | ||||
| Property Taxes | $ | 0.93 | $ | 1.00 | $ | 1.00 | ||||
| Insurance | $ | 0.30 | $ | 0.28 | $ | 0.32 | ||||
| Utilities | $ | 0.34 | $ | 0.35 | $ | 0.30 | ||||
| Maintenance | $ | 1.16 | $ | 0.73 | $ | 0.86 | ||||
| Management | $ | 0.37 | $ | 0.37 | $ | 0.38 | ||||
| Payroll | $ | 0.78 | $ | 0.89 | $ | 0.81 | ||||
| Advertising | $ | 0.02 | $ | 0.02 | $ | 0.02 | ||||
| Administrative | $ | 0.13 | $ | 0.14 | $ | 0.11 | ||||
| Reserves | $ | 0.00 | $ | 0.00 | $ | 0.00 | ||||
| Total Operating Expenses | $ | 4.03 | $ | 3.79 | $ | 3.80 | ||||
| Net Operating Income | $ | 3.34 | $ | 3.65 | $ | 3.81 | ||||
99
Income Approach
EXPENSE COMPARABLES | ||||||||||||||||
Comp 1 | Comp 2 | Comp 3 | Comp 4 | Comp 5 | ||||||||||||
| Name/Reference # | 06-250 | 05-860 | 06-710 | 06-355 | 06-010 | |||||||||||
| Units | 294 | 272 | 320 | 224 | 152 | |||||||||||
| NRA (SF) | 239,817 | 206,576 | 314,828 | 176,375 | 142,888 | |||||||||||
| Average Unit Size | 816 | 759 | 984 | 787 | 940 | |||||||||||
| Operating Year | 2005 | 2005 | 2005 | 2005 | 2005 | |||||||||||
| Operating Expense Ratio | 52.9 | % | 54.2 | % | 53.4 | % | 46.7 | % | 53.2 | % | ||||||
| Management Fee | 4.0 | % | 4.0 | % | 3.3 | % | 4.0 | % | 3.0 | % | ||||||
ANNUAL TOTALS | ||||||||||||||||
| Net Rental Revenue | $ | 2,129,720 | $ | 1,440,074 | $ | 1,728,144 | $ | 1,498,672 | $ | 997,662 | ||||||
| Other Income | $ | 154,551 | $ | 216,218 | $ | 240,076 | $ | 129,766 | $ | 10,853 | ||||||
| Effective Gross Income | $ | 2,284,271 | $ | 1,656,292 | $ | 1,968,220 | $ | 1,628,438 | $ | 1,008,515 | ||||||
| Property Taxes | $ | 274,601 | $ | 217,600 | $ | 172,314 | $ | 152,242 | $ | 143,780 | ||||||
| Insurance | $ | 50,266 | $ | 59,472 | $ | 64,290 | $ | 61,400 | $ | 51,117 | ||||||
| Utilities | $ | 275,193 | $ | 143,368 | $ | 181,024 | $ | 68,257 | $ | 137,854 | ||||||
| Maintenance | $ | 170,350 | $ | 117,290 | $ | 179,417 | $ | 146,149 | $ | 49,676 | ||||||
| Management | $ | 90,709 | $ | 66,252 | $ | 64,365 | $ | 64,892 | $ | 30,447 | ||||||
| Payroll | $ | 266,875 | $ | 221,766 | $ | 292,956 | $ | 212,786 | $ | 85,586 | ||||||
| Advertising | $ | 43,222 | $ | 32,084 | $ | 25,578 | $ | 10,433 | $ | 16,321 | ||||||
| Administrative | $ | 36,343 | $ | 40,142 | $ | 70,867 | $ | 44,858 | $ | 21,407 | ||||||
Total Expenses | $ | 1,207,559 | $ | 897,974 | $ | 1,050,811 | $ | 761,017 | $ | 536,188 | ||||||
PER UNIT | ||||||||||||||||
| Net Rental Revenue | $ | 7,244 | $ | 5,294 | $ | 5,400 | $ | 6,691 | $ | 6,564 | ||||||
| Other Income | $ | 526 | $ | 795 | $ | 750 | $ | 579 | $ | 71 | ||||||
| Effective Gross Income | $ | 7,770 | $ | 6,089 | $ | 6,151 | $ | 7,270 | $ | 6,635 | ||||||
| Property Taxes | $ | 934 | $ | 800 | $ | 538 | $ | 680 | $ | 946 | ||||||
| Insurance | $ | 171 | $ | 219 | $ | 201 | $ | 274 | $ | 336 | ||||||
| Utilities | $ | 936 | $ | 527 | $ | 566 | $ | 305 | $ | 907 | ||||||
| Maintenance | $ | 579 | $ | 431 | $ | 561 | $ | 652 | $ | 327 | ||||||
| Management | $ | 309 | $ | 244 | $ | 201 | $ | 290 | $ | 200 | ||||||
| Payroll | $ | 908 | $ | 815 | $ | 915 | $ | 950 | $ | 563 | ||||||
| Advertising | $ | 147 | $ | 118 | $ | 80 | $ | 47 | $ | 107 | ||||||
| Administrative | $ | 124 | $ | 148 | $ | 221 | $ | 200 | $ | 141 | ||||||
Total Expenses | $ | 4,107 | $ | 3,301 | $ | 3,284 | $ | 3,397 | $ | 3,528 | ||||||
PER SQUARE FOOT | ||||||||||||||||
| Net Rental Revenue | $ | 8.88 | $ | 6.97 | $ | 5.49 | $ | 8.50 | $ | 6.98 | ||||||
| Other Income | $ | 0.64 | $ | 1.05 | $ | 0.76 | $ | 0.74 | $ | 0.08 | ||||||
| Effective Gross Income | $ | 9.53 | $ | 8.02 | $ | 6.25 | $ | 9.23 | $ | 7.06 | ||||||
| Property Taxes | $ | 1.15 | $ | 1.05 | $ | 0.55 | $ | 0.86 | $ | 1.01 | ||||||
| Insurance | $ | 0.21 | $ | 0.29 | $ | 0.20 | $ | 0.35 | $ | 0.36 | ||||||
| Utilities | $ | 1.15 | $ | 0.69 | $ | 0.58 | $ | 0.39 | $ | 0.96 | ||||||
| Maintenance | $ | 0.71 | $ | 0.57 | $ | 0.57 | $ | 0.83 | $ | 0.35 | ||||||
| Management | $ | 0.38 | $ | 0.32 | $ | 0.20 | $ | 0.37 | $ | 0.21 | ||||||
| Payroll | $ | 1.11 | $ | 1.07 | $ | 0.93 | $ | 1.21 | $ | 0.60 | ||||||
| Advertising | $ | 0.18 | $ | 0.16 | $ | 0.08 | $ | 0.06 | $ | 0.11 | ||||||
| Administrative | $ | 0.15 | $ | 0.19 | $ | 0.23 | $ | 0.25 | $ | 0.15 | ||||||
Total Expenses | $ | 5.04 | $ | 4.35 | $ | 3.34 | $ | 4.31 | $ | 3.75 | ||||||
100
Income Approach
1) Property Taxes: This category includes all taxes assessed on real estate and personal property.
Expense Comps | Subject Actual | Concluded | ||||||||||||||||||||
Low | Mean | High | 2004 Year End | 2005 Year End | November 2006 11 Mths Annualized | Appraisers’ Projection | ||||||||||||||||
| Total | $ | 143,780 | $ | 192,107 | $ | 274,601 | $ | 118,004 | $ | 126,231 | $ | 126,996 | $ | 116,990 | ||||||||
| $/Unit | $ | 538 | $ | 780 | $ | 946 | $ | 922 | $ | 986 | $ | 992 | $ | 914 | ||||||||
| $/SF | $ | 0.55 | $ | 0.92 | $ | 1.15 | $ | 0.93 | $ | 1.00 | $ | 1.00 | $ | 0.92 | ||||||||
As discussed at length in the Real Estate and Business Tax section of this report, the property is expected to experience a notable decrease in the tax burden. Although the full effect of this tax burden will not be fully realized until 2007, our assumption is based on a stabilized operation of the property with the current tax laws in full effect.
2) Insurance: This category covers typical hazard, casualty, and liability insurance. Insurance benefits for employees are addressed later as a payroll expense.
Expense Comps | Subject Actual | Concluded | ||||||||||||||||||||
Low | Mean | High | 2004 Year End | 2005 Year End | November 2006 11 Mths Annualized | Appraisers’ Projection | ||||||||||||||||
| Total | $ | 50,266 | $ | 57,309 | $ | 64,290 | $ | 38,183 | $ | 35,535 | $ | 40,178 | $ | 40,600 | ||||||||
| $/Unit | $ | 171 | $ | 240 | $ | 336 | $ | 298 | $ | 278 | $ | 314 | $ | 317 | ||||||||
| $/SF | $ | 0.20 | $ | 0.28 | $ | 0.36 | $ | 0.30 | $ | 0.28 | $ | 0.32 | $ | 0.32 | ||||||||
We have based our insurance charge estimate on the most recent historical figures reported on the 2006 operating statements, and have made a minor adjustment for inflation.
3) Utilities: Utility expenses can vary significantly based on utility providers and metering methods. Therefore, whenever possible, historic expenses are weighted most heavily in projecting future utility expenses for a particular property. The subject units are individually metered for electric, and these are paid by the tenant. The owner is responsible for all water/sewer expenses, as well as exterior lighting and all unit utilities between tenants. As noted previously, the water/sewer charges for the units are the responsibility of the owner and are not reimbursed by the tenant. We have considered recent changes in utility costs in our projection, and note that recent increases do appear to be already included in the most recent operating statements, but we anticipate above inflation increases for the next year.
101
Income Approach
Expense Comps | Subject Actual | Concluded | ||||||||||||||||||||
Low | Mean | High | 2004 Year End | 2005 Year End | November 2006 11 Mths Annualized | Appraisers’ Projection | ||||||||||||||||
| Total | $ | 68,257 | $ | 161,139 | $ | 275,193 | $ | 42,496 | $ | 44,411 | $ | 38,158 | $ | 46,000 | ||||||||
| $/Unit | $ | 305 | $ | 648 | $ | 936 | $ | 332 | $ | 347 | $ | 298 | $ | 359 | ||||||||
| $/SF | $ | 0.39 | $ | 0.75 | $ | 1.15 | $ | 0.35 | $ | 0.35 | $ | 0.30 | $ | 0.36 | ||||||||
4) Maintenance: This category includes expenses for basic building maintenance, mechanical repairs, windows, doors, locks, drywall, plumbing, electrical, landscaping, pools, painting, carpet, vinyl, window coverings, and miscellaneous items associated with make ready between tenants.
Expense Comps | Subject Actual | Concluded | ||||||||||||||||||||
Low | Mean | High | 2004 Year End | 2005 Year End | November 2006 11 Mths Annualized | Appraisers’ Projection | ||||||||||||||||
| Total | $ | 49,676 | $ | 132,576 | $ | 179,417 | $ | 146,940 | $ | 92,768 | $ | 108,384 | $ | 110,000 | ||||||||
| $/Unit | $ | 327 | $ | 510 | $ | 652 | $ | 1,148 | $ | 725 | $ | 847 | $ | 859 | ||||||||
| $/SF | $ | 0.35 | $ | 0.60 | $ | 0.83 | $ | 1.16 | $ | 0.73 | $ | 0.86 | $ | 0.87 | ||||||||
We have projected a maintenance charge in-line with the most recent historical figures, and slightly above the comparable range. We conclude that the 2004 expenses may reflect some additional charges that are not typical, but we conclude that the most recent charges have been fairly consistent and that the 2005 charges could be slightly lower due to the extensive work performed at the property in 2004. We also note that the subject utilizes contract labor which lowers the overall payroll charge and indicates a higher than average maintenance charge. For the subject property, this expense category is projected at $110,000, which equates to $0.87/SF or $859/unit. When considering the charges for this category we have accounted for the current condition of the property and an allocation of replacement reserves. When the reserves figure is considered the overall maintenance charge is on the order of $148,400, which equates to $1.17/SF or $1,159/unit, which is above the average of the comparable amounts and considered adequate for the property.
5) Management Fee: The management company's duties include bookkeeping, negotiating service contracts, payroll, hiring and firing of employees, and all of the daily matters that fall beyond the scope of on-site personnel. Management expenses are typically calculated as a percentage of effective gross income (EGI), but it is also important to recognize the resultant dollar amount.
102
Income Approach
Income Approach
Expense Comps | Subject Actual | Concluded | ||||||||||||||||||||
Low | Mean | High | 2004 Year End | 2005 Year End | November 2006 11 Mths Annualized | Appraisers’ Projection | ||||||||||||||||
| Total | $ | 30,447 | $ | 63,333 | $ | 90,709 | $ | 46,615 | $ | 46,996 | $ | 48,104 | $ | 48,418 | ||||||||
| $/Unit | $ | 200 | $ | 249 | $ | 309 | $ | 364 | $ | 367 | $ | 376 | $ | 378 | ||||||||
| $/SF | $ | 0.20 | $ | 0.30 | $ | 0.38 | $ | 0.37 | $ | 0.37 | $ | 0.38 | $ | 0.38 | ||||||||
| % of EGI | 3.02 | % | 3.65 | % | 4.00 | % | 5.00 | % | 4.99 | % | 5.00 | % | 5.00 | % | ||||||||
6) Payroll: This category includes administrative salaries, maintenance salaries, contract labor, employee apartments, payroll taxes, and any other employee benefits. The following chart summarizes total projected payroll expenses for the subject property.
Hypothetical Staffing Scenario
Position | Number | Base Salary | Annual Salary | |||||||
| Manager | 1.00 | $ | 32,000 | $ | 32,000 | |||||
| Leasing Agent | 1.00 | $ | 24,000 | $ | 24,000 | |||||
| Lead Maintenance | 1.00 | $ | 32,000 | $ | 32,000 | |||||
| Make Ready | 0.00 | $ | 24,000 | $ | 0 | |||||
| Bonuses, Temporary Help, etc. | $ | 5,000 | ||||||||
| Total Salaries | $ | 93,000 | ||||||||
Payroll Taxes, Insurance, Benefits @ 20% | $ | 18,600 | ||||||||
| Total Payroll Expenses | $ | 111,600 | ||||||||
The hypothetical scenario presented above offers a reasonable breakdown of appropriate staffing and typical salaries for a property of this size and quality. The payroll projections adopted above specifically assume that no employees will receive free rent. The following chart illustrates how the appraisers’ projections compare to the expense comparables and to actual historic expenses.
Expense Comps | Subject Actual | Concluded | ||||||||||||||||||||
Low | Mean | High | 2004 Year End | 2005 Year End | November 2006 11 Mths Annualized | Appraisers’ Projection | ||||||||||||||||
| Total | $ | 85,586 | $ | 215,994 | $ | 292,956 | $ | 99,266 | $ | 112,634 | $ | 103,132 | $ | 111,600 | ||||||||
| $/Unit | $ | 563 | $ | 830 | $ | 950 | $ | 776 | $ | 880 | $ | 806 | $ | 872 | ||||||||
| $/SF | $ | 0.60 | $ | 0.98 | $ | 1.21 | $ | 0.78 | $ | 0.89 | $ | 0.81 | $ | 0.88 | ||||||||
103
Income Approach
7) Advertising: This item includes advertising and promotion costs and includes commissions paid to outside leasing agents, locator fees, tenant referral fees, and tenant relations.
Expense Comps | Subject Actual | Concluded | ||||||||||||||||||||
Low | Mean | High | 2004 Year End | 2005 Year End | November 2006 11 Mths Annualized | Appraisers’ Projection | ||||||||||||||||
| Total | $ | 143,780 | $ | 192,107 | $ | 274,601 | $ | 118,004 | $ | 126,231 | $ | 126,996 | $ | 116,990 | ||||||||
| $/Unit | $ | 538 | $ | 780 | $ | 946 | $ | 922 | $ | 986 | $ | 992 | $ | 914 | ||||||||
| $/SF | $ | 0.55 | $ | 0.92 | $ | 1.15 | $ | 0.93 | $ | 1.00 | $ | 1.00 | $ | 0.92 | ||||||||
The subject’s historical expenses appear consistent, but notably below the market comparables. Advertising expenses are dependent upon a property location and competitive market, and we conclude that the current charges are reflective of the Abilene Class B market. We have considered the subject’s high-occupancy and historical charges in making our estimate.
8) Administrative Expenses: This category includes telephone, answering service, supplies, copies, leased furniture and equipment, accounting fees, and legal fees.
Expense Comps | Subject Actual | Concluded | ||||||||||||||||||||
Low | Mean | High | 2004 Year End | 2005 Year End | November 2006 11 Mths Annualized | Appraisers’ Projection | ||||||||||||||||
| Total | $ | 143,780 | $ | 192,107 | $ | 274,601 | $ | 118,004 | $ | 126,231 | $ | 126,996 | $ | 116,990 | ||||||||
| $/Unit | $ | 538 | $ | 780 | $ | 946 | $ | 922 | $ | 986 | $ | 992 | $ | 914 | ||||||||
| $/SF | $ | 0.55 | $ | 0.92 | $ | 1.15 | $ | 0.93 | $ | 1.00 | $ | 1.00 | $ | 0.92 | ||||||||
Reserves for Replacement: Reserves for replacements typically average from $150 to $300 per unit, depending on number of units, construction type, amenities, unit size, and condition of the property. Considering the current condition, average unit size, and the typical tenancy, the appraisers have adopted a figure of $38,400 annually, which equates to $300/unit, or $0.30/SF. Our projection is toward the high-end of the range due to the large units at the subject.
104
Income Approach
Total Expenses and Summary
The following chart summarizes total expenses projected for the subject property, net of reserves.
Expense Comps | Subject Actual | Concluded | ||||||||||||||||||||
Low | Mean | High | 2004 Year End | 2005 Year End | November 2006 11 Mths Annualized | Appraisers’ Projection | ||||||||||||||||
| Total | $ | 143,780 | $ | 192,107 | $ | 274,601 | $ | 118,004 | $ | 126,231 | $ | 126,996 | $ | 116,990 | ||||||||
| $/Unit | $ | 538 | $ | 780 | $ | 946 | $ | 922 | $ | 986 | $ | 992 | $ | 914 | ||||||||
| $/SF | $ | 0.55 | $ | 0.92 | $ | 1.15 | $ | 0.93 | $ | 1.00 | $ | 1.00 | $ | 0.92 | ||||||||
| % of EGI | 46.7 | % | 52.1 | % | 54.2 | % | 54.7 | % | 50.9 | % | 49.9 | % | 51.0 | % | ||||||||
Net Operating Income
Net operating income (NOI) is the income remaining after all operating expenses have been satisfied, including reserves. Based on the preceding estimates of income and expenses, the resulting stabilized NOI is $435,846, which equates to $3,405/unit, or $3.44/SF. The following is a summary tabulation of the stabilized pro-forma for the subject property.
105
Income Approach
Stabilized Proforma for Chimney Square
Amount | $/SF | $/Unit | % of EGI | ||||||||||
| Rental Income | $ | 1,002,504 | $ | 7.92 | $ | 7,832 | 103.53 | % | |||||
| Other Income | $ | 26,000 | $ | 0.21 | $ | 203 | 2.69 | % | |||||
| Gross Potential Income | $ | 1,028,504 | $ | 8.13 | $ | 8,035 | 106.21 | % | |||||
| Less: Vacancy/Collection Loss @ 5.0% | ($50,125 | ) | ($0.40 | ) | ($392 | ) | (5.18 | )% | |||||
| Less: Loss to Lease @ 1.0% | ($10,025 | ) | ($0.08 | ) | ($78 | ) | (1.04 | )% | |||||
| Effective Gross Income | $ | 968,354 | $ | 7.65 | $ | 7,565 | 100.00 | % | |||||
| Operating Expenses | |||||||||||||
| Property Taxes | $ | 116,990 | $ | 0.92 | $ | 914 | 12.08 | % | |||||
| Insurance | $ | 40,000 | $ | 0.32 | $ | 317 | 4.19 | % | |||||
| Utilities | $ | 46,000 | $ | 0.36 | $ | 359 | 4.75 | % | |||||
| Maintenance | $ | 110,000 | $ | 0.87 | $ | 859 | 11.36 | % | |||||
| Management @ 5.00% | $ | 48,418 | $ | 0.38 | $ | 378 | 5.00 | % | |||||
| Payroll | $ | 111,600 | $ | 0.88 | $ | 872 | 11.52 | % | |||||
| Advertising | $ | 2,500 | $ | 0.02 | $ | 20 | 0.26 | % | |||||
| Administrative | $ | 18,000 | $ | 0.14 | $ | 141 | 1.86 | % | |||||
| Reserves for Replacement | $ | 38,400 | $ | 0.30 | $ | 300 | 3.97 | % | |||||
| Total | $ | 532,507 | $ | 4.21 | $ | 4,160 | 54.99 | % | |||||
| NET OPERATING INCOME | $ | 435,846 | $ | 3.44 | $ | 3,405 | 45.01 | % | |||||
106
Income Approach
Direct Capitalization
The strength of direct market capitalization is that it is derived from investors with direct market experience in which income streams are purchased on the basis of anticipated benefits to the property owner. To estimate the appropriate overall rate, four separate methods of deriving overall capitalization rates have been employed. The methods utilized consist of rates derived from recent sales of similar properties, Investment Surveys, Band of Investment, and the Debt Coverage Formula.
Overall Rates Derived From Market Sales
We have extracted capitalization rates from the sales presented in the Sales Comparison Approach. A summary of the sales is as follows:
SUMMARY OF COMPARABLE IMPROVED SALES
# Date | Units | Avg SF Per Unit | YOC | Price/Unit | Price/SF | EGIM | OAR | NOI/UNIT | NOI/SF | ||||||||||||||||||||||
1 6/05 | 176 | 954 | 1983 | $ | 35,799 | $ | 37.53 | 5.09 | 7.96 | % | $ | 2,849 | $ | 2.99 | |||||||||||||||||
2 2/23/05 | 224 | 821 | 1983 | $ | 37,046 | $ | 45.13 | 4.96 | 9.41 | % | $ | 3,485 | $ | 4.25 | |||||||||||||||||
3 8/16/05 | 256 | 694 | 1984 | $ | 43,945 | $ | 63.34 | 6.80 | 7.10 | % | $ | 3,120 | $ | 4.50 | |||||||||||||||||
4 12/17/04 | 180 | 916 | 1998 | $ | 50,924 | $ | 55.59 | 6.63 | 7.82 | % | $ | 3,982 | $ | 4.35 | |||||||||||||||||
5 10/24/06 | 248 | 696 | 1984 | $ | 38,306 | $ | 55.08 | 6.85 | 6.60 | % | $ | 2,527 | $ | 3.63 | |||||||||||||||||
AVG | 217 | 816 | 1986 | $ | 41,204 | $ | 51.33 | 6.07 | 7.78 | % | $ | 3,192 | $ | 3.94 | |||||||||||||||||
SUBJECT | 128 | 989 | 1981 | N/A | N/A | N/A | N/A | $ | 3,405 | $ | 3.44 | ||||||||||||||||||||
Among the improved sales presented, extracted OARs range from 6.60% to 9.41%, with an average of 7.78%. Several brokers and industry professionals were interviewed by the appraisers, and most suggested that rates in the Abilene market should reflect rates fro the region adjusted upward 100 to 150 points. Based on these discussions we project OARs of 6.50% - 7.50% for Class A and new construction, 7.50% - 9.00% for Class B properties and 9.00% - 10.5% for older Class C properties. Considering the specifics of the subject, especially as it relates to project size, location, overall age/condition of the improvements, the recent trends in interest rates and the potential risk associated with our assumption of a decreasing tax burden based on Legislation passed in May 2006; a rate reflective of the middle of the range for Class B properties appears appropriate. Thus, we have selected a rate of 8.25%.
Investment Surveys
The 4th Quarter 2006 Korpacz Real Estate Investor Survey indicates national overall capitalization rates ranging from 3.50% to 8.00% with an indicated mean of 5.97% for Institutional Grade Multi-Family Investment Properties. The capitalization rates were much higher one year ago in 4th Quarter 2005 with a range of 4.50% to 8.00% and overall indicated mean of 6.18%. Therefore, the survey reflects the downward trend in capitalization rates during the past 12 month period and this trend has continued since the last quarter, when the average was 5.98%. This trend has continually declined with the average rate dropping significantly since 4th Quarter of 2001.
107
Income Approach
The average OAR dipped only 1 basis points in this quarter which represents the lowest average ever reported by the Korpacz survey, but it also represents a stabilizing trend. Over the previous reporting period (3rd Quarter 2006) the average rate only declined 3 points. The survey indicates that rates may not be declining over the next quarter. The report from 2nd Quarter 2006 reported a decline of only 6 points from the previous quarter which indicates a flattening trend.
The following chart summarizes overall rates (OAR) presented in various noted publications.
Surveyed Overall Rates
Source | Property Type | Low | High | Avg |
| Korpacz | National Apartment Market | 3.50% | 8.00% | 5.97% |
| RERC | First Tier Apartments (Southern US) | 5.50% | 8.00% | 6.60% |
| Second Tier Apartments (Southern US) | 6.30% | 8.50% | 7.40% | |
| Third Tier Apartments (Southern US) | 7.00% | 9.50% | 8.20% | |
| Range/Average | 3.50% | 9.50% | 7.04% | |
The Korpacz survey reflects the investment criteria of large institutional investors, who tend to prefer Class A properties. Given its size, age, condition, and location, the subject is described herein as a Class B that is below average investment desirability due to it’s age, size and location. From the Korpacz survey we conclude that the appropriate rate is reflective of average rate, say 7.50%-8.00%.
The RERC survey classifies properties into three “tiers.” First-Tier properties are defined as “new or newer quality construction in prime to good locations.” Second-Tier properties are defined as “aging, formerly first-tier properties, in good to average locations.” The subject is best classified as being a solid second-tier property in a third tier location, so rates in the middle of the third tier category appear to be most relevant. Overall RERC indicates a rate on the order of 8.00% to 8.50%. Based upon other published data, we conclude that the recent RERC appears a little out of step with current market rates and will place less emphasis on the data.
Based on the published market data analyzed we conclude a capitalization rate of approximately 8.2 5% is supportable for the subject.
108
Income Approach
Band of Investment
Another alternative method of selecting the rate is through the band of investment. The overall rate may be divided into the rate that will return cash requirements to a debt investor (lender) and to an equity investor. The net cash flow used in this model does not account for debt service to the lender as an expense. The anticipated debt service is accounted for within the overall rate. The premise behind the band of investment method is the relationship between the loan interest rate and the equity yield rate.
It is held that the loan interest rate (yield to lender) is the lowest component of the overall yield rate, expressed as follows: Ym<Yo<Ye, where Ym represents the yield to the mortgage, Yo the overall yield, and Ye the yield to the equity position. This relationship is true because the overall rate applies to net operating income or net proceeds which are cash flows that include both debt service plus equity cash flows. The equity cash flow is the riskier cash flow, the debt service the safest of the three, and the net income is a sum of the debt and equity cash flows.
Based upon observed trends in lending for similar properties, typical market financing is represented by a loan to value ratio of 75% with a DCR of 1.25 and an interest rate of 6.50%. Amortization terms typically range from 20 to 30 years. Considering the specific attributes of the subject property (age, location, market conditions, etc.), we have selected a 30 year term and an interest rate of 6.50% for the model.
The equity dividend rate is the rate of return to the equity position and is generally higher than loan rates because the equity position has greater risk than the debt position (since the loan is paid first and the remaining income goes to the equity investor). The equity dividend is estimated to range between 1.00% to 3.00% more than the interest rate. A rate of 9.50% should be attractive to an investor interested in a high management, labor intensive investment similar to the subject.
The following assumptions were used to estimate an appropriate overall rate via the band of investment.
Band of Investment Assumptions
Term | 30 Years |
Mortgage Interest Rate | 6.50% |
Loan To Value Ratio | 75% |
Equity Yield Rate | 9.50% |
Mortgage Constant | 7.58% |
Debt Coverage Ratio | 1.25 |
Band of Investment Calculations
Component | Percentage | Rate | Contribution | ||
| Debt- | 75% | x | 7.58% | = | 5.69% |
Equity- | 25% | x | 9.50% | = | 2.38% |
| Indicated OAR | 8.06% |
109
Income Approach
Conclusion
The following chart summarizes the various rates derived in this analysis:
Summary of Overall Rates
Source | Indicated Overall Rate |
| Market Sales (Mean Rate) | 7.78% |
| Published Surveys | 8.25% |
| Band of Investment | 8.06% |
Mean Rate Derived | 8.03% |
The mean rate above is 8.03%. In general, we are of the opinion that direct market extraction derives the most reliable estimate. However, as explained previously, we must consider the subject’s current condition, vacancy and expense projections, and current costs of financing in projecting a cap rate.
After considering all relevant market factors and the specific attributes of the subject property (size, age, location, stability, etc.), we have selected an overall rate 8.25%. We conclude that this is the best supported capitalization rate for this property under the circumstances and assumptions put forth in this appraisal. Based on the assumptions regarding the tax law changes, which will notably benefit the property, and recognizing the risk associated with the implications of this new law and possible repeal and/or potential changes prior to full implementation in 2007, we consider that a risk factor must be considered when selecting a capitalization rate.
Overall, we consider that this risk associated with the tax law changes and gains in NOI projected should increase the OAR on the order of 25 to 100 basis points, which for the case of this subject we have utilized a rate approximately 47 points higher than the average of the comparable sales. However, a portion of this increase is due to the cost of funds (Band of Investment). Thus, many of the comparable sales occurred in an environment with slightly lower interest rates, which when considering the slightly higher rates of today, a bias toward an increased capitalization rate must be considered. The rate selected is effectively applied to the previously estimated NOI of $435,846 to arrive at a value estimate via direct capitalization.
DIRECT CAPITALIZATION SUMMARY
| PRO-FORMA NOI | ÷ | OAR | = | VALUE |
| $435,846 | ÷ | 8.25% | = | $5,282,987 |
110
Reconciliation and Final Value Estimate
Reconciliation is the process whereby the final value estimate is derived from the various indications of value. The procedure evaluates the quantity and quality of available data and draws a conclusion based on the most applicable indicators. We have utilized the three approaches to value and have arrived at the following conclusions:
INSURABLE VALUE | $6,900,000 |
SALES COMPARISON APPROACH | $5,200,000 |
INCOME CAPITALIZATION APPROACH | $5,300,000 |
In each of the approaches, we have attempted to thoroughly document all of the input data and have briefly explained the methodology in processing and/or analyzing this data. The data furnished is from reliable sources and has been accepted as accurate. We have also attempted to give full recognition to the inherent weaknesses in each of the approaches, and because the appraisal of real property is by no means an exact science, a great deal of our subjective judgment becomes a part of each approach.
The Cost Approach typically utilizes well documented reproduction costs for the subject improvements, then deducts an appropriate amount of accrued depreciation to arrive at a depreciated cost of improvements. A well supported land value is then added to the depreciated cost of improvements in order to produce a credible estimate of value for the whole property. We have not utilized a Cost Approach in deriving a value for the subject because of the property’s older age and difficulty in accurately estimating the amount of physical depreciation. In addition, we were requested by the Client to calculate an insurable value from the Replacement Cost New estimate, of which we concluded that the subject’s insurable value is $6,900,000.
In the Direct Sales Comparison Approach, sales of comparable properties were utilized to derive a value indication for the subject property. In determining value indications via this approach, comparisons were made based upon the sales’ physical characteristics relative to the subject’s, NOI/Price Relationships, and the Effective Gross Income Multiplier. The resulting range from the three methods was fairly narrow, and we are confident that the value indication of $5,200,000 is well supported.
In the Income Capitalization Approach, direct capitalization was utilized in deriving a value for the subject property. Income and expense projections are consistent with the subject’s historic performance and are further supported by ample market data. Overall, the Income Capitalization Approach indication of $5,300,000 is considered a reliable indicator of market value for the subject property.
In determining the final value estimate for the subject property, the Income and Sales Comparison Approaches are both given emphasis, with slightly greater weight given to the Income Approach. Based on the analysis contained in the report herein, the "As Is” Market Value of the property’s Fee Simple Estate, subject to short-term leases, as of January 2, 2007 is considered reasonable at:
FIVE MILLION TWO HUNDRED FIFTY THOUSAND DOLLARS
$5,250,000
111
Reconciliation and Final Value Estimate
MARKETING/EXPOSURE TIME PERIOD
Marketing and exposure times are important considerations in the appraisal process. While these two time frames may appear to be similar, there are distinct differences. Marketing time is an estimate of the time it might take to sell a property interest in real estate at the estimated market value level during the period immediately after the effective date of an appraisal. Conversely, exposure time is the estimated length of time the property interest being appraised would have been offered on the market prior to the hypothetical consummation of a sale at market value on the effective date of the appraisal; a retrospective estimate based upon an analysis of past events assuming a competitive and open market.
The reasonable marketing time is a function of price, time, use, and anticipated market conditions such as changes in the cost and availability of funds; not an isolated estimate of time alone. The following chart summarizes estimates of marketing time for various property types as reported by Korpacz and Real Estate Research Corporation.
Marketing Times (in months)
Korpacz | RERC | |||
| Property Type | Range | Average | Average | |
| CBD Office | 3-12 | 7.2 7.1 | 7.1 | |
| Suburban Office | 3-12 | 6.6 7.3 | 7.3 | |
| Regional Mall | 4-12 | 7.9 8.6 | 8.6 | |
| Power Center | 3-12 | 7.0 7.5 | 7.5 | |
| Strip Center | 2-12 | 6.9 7.3 | 7.3 | |
| Flex/R&D | 3-18 | 6.8 7.8 | 7.8 | |
| Warehouse | 3-12 | 7.0 7.1 | 7.1 | |
| Apartments | 1-12 | 5.4 6.3 | 6.3 | |
| Net Leased Assets | 1-6 | 3.4 N/A | N/A | |
Based on the survey data, it appears that a reasonable marketing period for the subject would be approximately six months.
Exposure time can be estimated by examining past historical sales information in the market. Research revealed that over the previous two years, exposure time frames for similar properties have been between three and twelve months. Based on this information, and emphasizing the middle of the range, it is estimated that an appropriate exposure time for the subject should be around six months. This time frame assumes reasonable marketing efforts and an asking price similar to the value estimated herein.
112
Certification of Value
CERTIFICATION OF VALUE
Per SR 2-3
We certify that, to the best of our knowledge and belief:
* The statements of fact contained in this report are true and correct.
| * | As of the date of this report, John D. Jordan has completed the requirements of the continuing education program of the Appraisal Institute. |
| * | The reported analyses, opinions, and conclusions are limited only by the reported assumptions and limiting conditions, and are our personal, unbiased professional analysis, opinions, and conclusions. |
| * | We have no present or prospective interest in the property that is the subject of this report, and we have no personal interest or bias with respect to the parties involved. |
| * | Our compensation is not contingent on an action or event resulting from the analyses, opinions, or conclusions in, or the use of, this report. |
| * | Our analyses, opinions, and conclusions were developed, and this report has been prepared, in conformity with the Uniform Standards of Professional Appraisal Practice. |
| * | John D. Jordan did not make a personal inspection of the property that is the subject of this report. Victor K. Thomas made a personal inspection of the property that is the subject of this report. |
| * | This appraisal report has been made in conformity with, and is subject to, the requirements of the Code of Professional Ethics and Standards of Professional Conduct of the Appraisal Institute and the Appraisal Foundation. |
| * | No pertinent information has knowingly been withheld. No single item of information was completely relied upon to the exclusion of the other information and all data was analyzed within the framework of our judgment, knowledge, and experience. |
| * | This appraisal was not based on a requested minimum value, or the approval of a loan. |
| * | This appraisal report is subject to peer review by duly authorized members of the Appraisal Institute. |
| * | As of the date of appraisal, John D. Jordan is certified by the State of Texas as a General Real Estate Appraiser. Victor K. Thomas is certified by the State of Texas as a General Real Estate Appraiser. |
| * | No other individual has provided professional assistance to the undersigned. |
113
Certification of Value
| * | The “As Is” Market Value of the subject’s Fee Simple Estate based on market conditions present as of January 2, 2007, is estimated to be: |
FIVE MILLION TWO HUNDRED FIFTY THOUSAND DOLLARS
$5,250,000
| Respectfully submitted, | |||
| Deverick & Associates, Inc. | |||
| John d. Jordan, MAI | Victor K. Thomas | ||
| Principal/Appraiser | Inspecting Appraiser | ||
| State Certified Appraiser | State Certified Appraiser | ||
| TX-1321156-G | TX-1335034-G | ||
114
Qualifications of John D. Jordan, MAI
EXPERIENCE Mr. Jordan has been engaged in the real estate industry in excess of twenty years. Mr. Jordan has conducted research on, and made appraisals and/or inspections of, numerous property types which include the following:
| · | Agricultural Land & Ranch properties |
| · | Aircraft Hangars |
| · | Apartment and Cond. properties (individual values in excess of $100,000,000) |
| · | Condemnations |
| · | Convalescent center & related facilities |
| · | Golf Courses |
| · | Hotel/Motel (inclusive of large convention type hotels) |
| · | Houses of Worship |
| · | Industrial manufacturing facilities |
| · | Industrial warehouse facilities |
| · | Lake and oceanfront property |
| · | Medical office buildings |
| · | Min-warehouses |
| · | Mobile home parks |
| · | Office buildings (inclusive of CBD property with values in excess of $250,000,000) |
| · | Office service centers (R&D) |
| · | Office/warehouses |
| · | Planned unit developments |
| · | Portfolio Valuations (values in excess of $300,000,000) |
| · | Residential subdivisions |
| · | Restaurants/nightclubs |
| · | Right-of-way takings |
| · | Service stations |
| · | Single-family residences and estates (estate valued in excess of $25,000,000) |
| · | Shopping centers (inclusive of malls with values in excess of $150,000,000) |
| · | Timeshare developments |
| · | Vacant land |
EDUCATION BACKGROUND
College: University of Oklahoma, Norman, Oklahoma.
Major: Finance
Appraisal Institute Courses
| · | Standards of Professional Practice (A) |
| · | Standards of Professional Practice (B) |
| · | Standards of Professional Practice (C) |
| · | Real Estate Appraisal Principles |
| · | Basic Valuation Procedures |
| · | Capitalization Theory and Techniques (A) |
| · | Capitalization Theory and Techniques (B) |
| · | Case Studies in Real Estate Valuation |
| · | Valuation Analysis and Report Writing |
| · | The Appraisal Complete Review |
| · | Advanced Sales Comparison Approach |
115
Qualifications of John D. Jordan, MAI
CONTINUING EDUCATION
Texas Real Estate Commission Courses
| · | Real Estate Law |
| · | Real Estate Marketing |
| · | Real Estate Principles |
| · | Real Estate Investments |
| · | Real Estate Contracts |
Seminars
| · | Preparation for MAI Comprehensive Exam |
| · | State Certification Workshop |
| · | Appraisal of Local Retail Properties |
| · | Analyzing Operating Expenses |
| · | Section 8/HUD Rent Comparability Studies |
| · | Appraisal Review - General |
| · | Highest & Best Use Applications |
| · | Affordable Housing Appraisal Seminar - RTC |
| · | Comprehensive Real Estate Workshop |
| · | Understanding Limited Appraisals |
| · | Rates, Ratios, & Reasonableness |
| · | Appraisal Practices For Litigation |
| · | Math Skills, Calculator & Graphical Interpretation |
| · | Attacking & Defending An Appraisal Report |
| · | Lease Abstracting & Analysis |
EXPERT TESTIMONY
Mr. Jordan has been accepted as an expert witness by courts in the following jurisdictions:
· | Federal Courts | Eastern District of Texas |
| Northern District of Texas | ||
· | State Courts | District Court State of Oklahoma |
| District Court State of Texas |
PROFESSIONAL MEMBERSHIPS & LICENSES
| · | Member of the Appraisal Institute, MAI # 10572 |
| · | Past Member and Advisor of the National Assoc. of Real Estate Appraisers |
| · | Licensed Real Estate Broker, State of Texas License Number 0365933 |
| · | Texas State Certified General Real Estate Appraiser, Certificate # TX-1321156-G |
| · | Oklahoma, New York, Colorado State Certified General Real Estate Appraiser |
| · | Past Associate Member of Mortgage Bankers Association of America |
CORPORATE AFFILIATIONS
| · | President of Deverick & Associates, Inc. |
Deverick & Associates, Inc.
5420 LBJ Freeway, Suite 1335
Dallas, Texas 75240
Mr. Jordan previously acted on behalf of Ensearch Realty as Director of Acquisitions, and in this capacity, he has enabled the purchase and financing of several investment grade properties. Further, he is an active participant in a variety of real estate entities, he consults with several publicly held corporations, and he has acted as broker on approximately $120 million in CMBS and bank loans since the latter half of 1998.
116
Qualifications of Victor K. Thomas
EXPERIENCE Mr. Jordan has been engaged in the real estate industry for more than nine years. Since entering real estate Mr. Thomas has completed over four years of appraisal review experience and has personally appraised over 600 multifamily properties. Mr. Thomas has conducted research on, and made appraisals and/or inspections of, numerous property types with individual asset values exceeding $150M and portfolio asset values exceeding $230M. His experience includes the following property types:
| · | Apartment and Condominium properties |
| · | Industrial manufacturing facilities |
| · | Industrial warehouse facilities |
| · | Min-warehouses |
| · | Office buildings (inclusive of major downtown property) |
| · | Office service centers (R&D) |
| · | Office/warehouses |
| · | Planned unit developments |
| · | Shopping centers (strip, neighborhood & community) |
| · | Vacant land |
EDUCATION BACKGROUND
| College: | Oklahoma State University |
| Major: | BS Mechanical Engineering Technology |
| College: | University of Oklahoma |
| Major: | Graduate Studies in Environmental Engineering Science |
Appraisal Institute Courses
| · | General Applications |
| · | Advanced Income Capitalization |
| · | Highest & Best Use and Market Analysis |
State Approved Appraisal Courses
| · | Income Property Valuation I |
| · | Income Property Valuation II |
| · | Investment Analysis for Appraisers |
| · | Uniform Residential Appraisal Reports |
| · | Real Estate Appraisal |
| · | Uniform Standards of Professional Appraisal Practice |
| · | Property Inspection Red Flags |
| · | Reducing Radon Risk |
| · | Mold, Mildew, and You |
PROFESSIONAL MEMBERSHIPS & LICENSES
| · | State Certified Appraiser TX-1335034-G |
CORPORATE AFFILIATIONS
| · | Vice President |
Deverick & Associates, Inc.
5420 LBJ Freeway, Suite 1335
Dallas, Texas 75240
117
ADDENDUM “A” Financial Exhibits |
| FNGL706_SY | TWELVE MONTH SPREAD SHEET Short Year | ||||||||||||||||||||||||||||||||||||||||||
| 02 | AMRECORP REALTY FUND II | SYSTEM DATE 12/18/2006 | |||||||||||||||||||||||||||||||||||||||||
| 312 | CHIMNEY SQUARE APARTMENTS | SELECT DATE 12/18/2006 | |||||||||||||||||||||||||||||||||||||||||
| Cur. Period 12/2006 | For Period Ending | ||||||||||||||||||||||||||||||||||||||||||
| Sel. Period 12/2006 | November 30, 2006 | # Units 128 Sq. Ft.126554 | |||||||||||||||||||||||||||||||||||||||||
| DESCRIPTION | JAN | FEB | MAR | APR | MAY | JUN | JUL | AUG | SEP | OCT | NOV | DEC | Total | PSF | |||||||||||||||||||||||||||||
| Income | |||||||||||||||||||||||||||||||||||||||||||
| Gross Potential Rent | 80,480 | 80,081 | 81,150 | 82,558 | 82,180 | 83,031 | 82,947 | 82,076 | 83,480 | 83,750 | 83,331 | 0 | 905,064 | ||||||||||||||||||||||||||||||
| Vacancies | (3,541 | ) | (2,848 | ) | (2,724 | ) | (4,039 | ) | (4,200 | ) | (2,818 | ) | (3,875 | ) | (1,584 | ) | (2,195 | ) | (2,766 | ) | (3,069 | ) | 0 | (33,659 | ) | ||||||||||||||||||
| Employee Units | (359 | ) | (359 | ) | (359 | ) | (359 | ) | 126 | 199 | (360 | ) | (360 | ) | (360 | ) | (360 | ) | (360 | ) | 0 | (2,911 | ) | ||||||||||||||||||||
| Net Change In Accts. | (4,625 | ) | (910 | ) | 690 | 465 | 2,057 | 2,347 | (2,901 | ) | (1,779 | ) | (1,990 | ) | 1,372 | (4,358 | ) | 0 | (9,632 | ) | |||||||||||||||||||||||
| Net Rental Income | 71,955 | 75,964 | 78,757 | 78,625 | 80,163 | 82,759 | 75,811 | 78,353 | 78,935 | 81,996 | 75,544 | 0 | 858,862 | ||||||||||||||||||||||||||||||
| Appliance Income | 0 | 0 | 0 | 0 | 0 | 0 | 0 | 0 | 0 | 0 | 100 | 0 | 100 | ||||||||||||||||||||||||||||||
| Fee Income | 140 | 689 | 25 | 1,089 | 155 | 1,563 | 427 | 1,059 | 220 | 165 | 579 | 0 | 6,111 | ||||||||||||||||||||||||||||||
| Damages | 89 | 681 | 765 | 275 | 252 | 1,211 | 539 | 2,212 | 333 | 911 | 726 | 0 | 7,994 | ||||||||||||||||||||||||||||||
| Application Fee | 290 | 330 | 280 | 115 | 140 | 280 | 400 | 355 | 165 | 390 | 410 | 0 | 3,155 | ||||||||||||||||||||||||||||||
Miscellaneous Income | 0 | 25 | 0 | 0 | 0 | 0 | 0 | 0 | 0 | 0 | 0 | 0 | 25 | ||||||||||||||||||||||||||||||
| Vending Income | 554 | 459 | 607 | 448 | 304 | 473 | 721 | 543 | 552 | 929 | 0 | 0 | 5,590 | ||||||||||||||||||||||||||||||
| Interest Income | 21 | 22 | 0 | 22 | 26 | 27 | 30 | 27 | 30 | 32 | 35 | 38 | 310 | ||||||||||||||||||||||||||||||
| Total Income | 73,049 | 78,170 | 80,434 | 80,574 | 81,040 | 86,313 | 77,928 | 82,549 | 80,235 | 84,423 | 77,394 | 38 | 882,147 | ||||||||||||||||||||||||||||||
| Direct Expenses | |||||||||||||||||||||||||||||||||||||||||||
| Utilities | |||||||||||||||||||||||||||||||||||||||||||
| Electric | 1,675 | 1,162 | 1,306 | 844 | 1,003 | 996 | 1,054 | 1,045 | 1,139 | 1,034 | 1,100 | (1,100 | ) | 11,258 | |||||||||||||||||||||||||||||
| Electric Vacant Unit | 53 | (72 | ) | 138 | 67 | 140 | 84 | (175 | ) | (373 | ) | 10 | 467 | (50 | ) | 0 | 289 | ||||||||||||||||||||||||||
| Electric Office/Mode | 530 | 268 | 302 | 215 | 241 | 251 | 414 | 482 | 593 | 303 | 300 | (300 | ) | 3,599 | |||||||||||||||||||||||||||||
| Connection Fees | 100 | 0 | 98 | 222 | 50 | 27 | 0 | 198 | 40 | 100 | 0 | 0 | 835 | ||||||||||||||||||||||||||||||
| Gas | 103 | 106 | 68 | 75 | 55 | 50 | 51 | 61 | 60 | 66 | 75 | 0 | 770 | ||||||||||||||||||||||||||||||
| Water | 1,234 | 1,066 | 1,139 | 1,054 | 1,000 | 1,063 | 1,100 | 1,103 | 1,249 | 1,211 | 1,179 | 0 | 12,398 | ||||||||||||||||||||||||||||||
| Sewer | 444 | 379 | 407 | 374 | 350 | 382 | 390 | 403 | 442 | 435 | 423 | 0 | 4,429 | ||||||||||||||||||||||||||||||
A-1
| FNGL706_SY | TWELVE MONTH SPREAD SHEET Short Year | ||||||||||||||||||||||||||||||||||||||||||
| 02 | AMRECORP REALTY FUND II | SYSTEM DATE 12/18/2006 | |||||||||||||||||||||||||||||||||||||||||
| 312 | CHIMNEY SQUARE APARTMENTS | SELECT DATE 12/18/2006 | |||||||||||||||||||||||||||||||||||||||||
| Cur. Period 12/2006 | For Period Ending | ||||||||||||||||||||||||||||||||||||||||||
| Sel. Period 12/2006 | November 30, 2006 | # Units 128 Sq. Ft.126554 | |||||||||||||||||||||||||||||||||||||||||
| DESCRIPTION | JAN | FEB | MAR | APR | MAY | JUN | JUL | AUG | SEP | OCT | NOV | DEC | Total | PSF | |||||||||||||||||||||||||||||
| Total Utilities | 4,139 | 2,909 | 3,458 | 2,851 | 2,839 | 2,853 | 2,834 | 2,919 | 3,533 | 3,616 | 3,027 | (1,400 | ) | 33,578 | |||||||||||||||||||||||||||||
| Payroll | |||||||||||||||||||||||||||||||||||||||||||
| Salary & Wages | 5,634 | 5,580 | 6,092 | 5,892 | 5,567 | 8,142 | 5,713 | 6,470 | 6,718 | 9,401 | 5,268 | 0 | 70,477 | ||||||||||||||||||||||||||||||
| Overtime Wages | 0 | 390 | 50 | 42 | 244 | 589 | 889 | 1,048 | 474 | 541 | 680 | 0 | 4,947 | ||||||||||||||||||||||||||||||
| Payroll Taxes | 529 | 564 | 662 | 638 | 623 | 937 | 717 | 822 | 782 | 1,039 | 632 | 0 | 7,945 | ||||||||||||||||||||||||||||||
| Workman's Comp Exp | 213 | 227 | 266 | 257 | 251 | 377 | 289 | 331 | 315 | 418 | 254 | 0 | 3,198 | ||||||||||||||||||||||||||||||
| Health Insurance Exp | 260 | 244 | 299 | 315 | 308 | 482 | 330 | 329 | 336 | 297 | 341 | 0 | 3,541 | ||||||||||||||||||||||||||||||
| Leasing Costs | 282 | 300 | 352 | 339 | 331 | 498 | 381 | 437 | 416 | 553 | 336 | 0 | 4,225 | ||||||||||||||||||||||||||||||
| Contract Cleaning | 0 | 0 | 0 | 0 | 70 | 135 | 0 | 0 | 0 | 0 | 0 | 0 | 205 | ||||||||||||||||||||||||||||||
| Total Payroll | 6,918 | 7,305 | 7,721 | 7,483 | 7,394 | 11,160 | 8,319 | 9,437 | 9,041 | 12,249 | 7,511 | 0 | 94,538 | ||||||||||||||||||||||||||||||
| Property Taxes | |||||||||||||||||||||||||||||||||||||||||||
| Real Estate Taxes | 10,583 | 10,583 | 10,583 | 10,583 | 10,583 | 10,583 | 10,583 | 10,583 | 10,583 | 10,583 | 10,583 | 0 | 116,413 | ||||||||||||||||||||||||||||||
| Insurance | |||||||||||||||||||||||||||||||||||||||||||
| Property Insurance | 2,821 | 2,821 | 2,821 | 2,821 | 3,492 | 3,653 | 3,653 | 3,687 | 3,687 | 3,687 | 3,687 | 0 | 36,830 | ||||||||||||||||||||||||||||||
| Total Insurance | 2,821 | 2,821 | 2,821 | 2,821 | 3,492 | 3,653 | 3,653 | 3,687 | 3,687 | 3,687 | 3,687 | 0 | 36,830 | ||||||||||||||||||||||||||||||
| Management Fees | 3,652 | 3,909 | 4,012 | 4,029 | 4,052 | 4,316 | 3,896 | 4,128 | 4,012 | 4,221 | 3,870 | 0 | 44,095 | ||||||||||||||||||||||||||||||
| Maintenance & Repairs | |||||||||||||||||||||||||||||||||||||||||||
| HVAC-Air Cond & Heat | 0 | 0 | 0 | 85 | 604 | 221 | 402 | 463 | 121 | 85 | 0 | 0 | 1,981 | ||||||||||||||||||||||||||||||
| Locks & Keys | 0 | 0 | 31 | 0 | 0 | 0 | 11 | 12 | 104 | 0 | 8 | 0 | 166 | ||||||||||||||||||||||||||||||
| Screens & Glass | 0 | 0 | 10 | 18 | 0 | 0 | 0 | 0 | 59 | 0 | 0 | 0 | 87 | ||||||||||||||||||||||||||||||
| Lumber & Carpentry | 0 | 0 | 10 | 71 | 15 | 34 | 0 | 0 | 0 | 53 | 161 | 0 | 344 | ||||||||||||||||||||||||||||||
| Interior Painting | 0 | 0 | 0 | 0 | 144 | 216 | 0 | 0 | 0 | 653 | 0 | 0 | 1,013 | ||||||||||||||||||||||||||||||
| Carpet Cleaning | 206 | 0 | 287 | 195 | 150 | 370 | 0 | 0 | 170 | 173 | 185 | 0 | 1,736 | ||||||||||||||||||||||||||||||
A-2
| FNGL706_SY | TWELVE MONTH SPREAD SHEET Short Year | ||||||||||||||||||||||||||||||||||||||||||
| 02 | AMRECORP REALTY FUND II | SYSTEM DATE 12/18/2006 | |||||||||||||||||||||||||||||||||||||||||
| 312 | CHIMNEY SQUARE APARTMENTS | SELECT DATE 12/18/2006 | |||||||||||||||||||||||||||||||||||||||||
| Cur. Period 12/2006 | For Period Ending | ||||||||||||||||||||||||||||||||||||||||||
| Sel. Period 12/2006 | November 30, 2006 | # Units 128 Sq. Ft.126554 | |||||||||||||||||||||||||||||||||||||||||
| DESCRIPTION | JAN | FEB | MAR | APR | MAY | JUN | JUL | AUG | SEP | OCT | NOV | DEC | Total | PSF | |||||||||||||||||||||||||||||
| Plumbing | 0 | 137 | 254 | 285 | 152 | 85 | 118 | 103 | 225 | 309 | 502 | 0 | 2,170 | ||||||||||||||||||||||||||||||
| Appliance Repairs-Mi | 0 | 19 | 32 | 19 | 105 | 0 | 17 | 14 | 9 | 29 | 21 | 0 | 265 | ||||||||||||||||||||||||||||||
| Electrical Repairs | 0 | 0 | 4 | 0 | 0 | 0 | 22 | 157 | 35 | 0 | 34 | 0 | 252 | ||||||||||||||||||||||||||||||
| Pool Maintenance | 0 | 0 | 19 | 0 | 73 | 306 | 0 | 0 | 0 | 0 | 0 | 0 | 398 | ||||||||||||||||||||||||||||||
| Grounds Maintenance | 0 | 11 | 0 | 0 | 236 | 0 | 0 | 0 | 0 | 0 | 406 | 0 | 653 | ||||||||||||||||||||||||||||||
| Small Tool | 0 | 0 | 0 | 27 | 0 | 0 | 0 | 0 | 16 | 0 | 0 | 0 | 43 | ||||||||||||||||||||||||||||||
| Equipment Rental | 0 | 0 | 0 | 0 | 0 | 0 | 0 | 0 | 0 | 0 | 0 | 0 | 0 | ||||||||||||||||||||||||||||||
| Small Appliance | 0 | 0 | 0 | 0 | 0 | 0 | 63 | 0 | 116 | 39 | 157 | 0 | 375 | ||||||||||||||||||||||||||||||
| Carpet Repair & Dyin | 0 | 0 | 0 | 78 | 1,420 | 74 | 0 | 0 | 25 | 0 | 37 | 0 | 1,634 | ||||||||||||||||||||||||||||||
| Laundry Equipment Re | 0 | 0 | 0 | 0 | 199 | 109 | 97 | 0 | 0 | 0 | 9 | 0 | 414 | ||||||||||||||||||||||||||||||
| Garage Carport & Gat | 0 | 0 | 0 | 38 | 43 | 136 | 103 | 181 | 96 | 0 | 0 | 0 | 597 | ||||||||||||||||||||||||||||||
| Make Ready Contract | 0 | 0 | 0 | 0 | 0 | 0 | 0 | 0 | 0 | 640 | 1,280 | 0 | 1,920 | ||||||||||||||||||||||||||||||
| Total Maintenance & Re | 206 | 167 | 647 | 816 | 3,141 | 1,551 | 833 | 930 | 976 | 1,981 | 2,800 | 0 | 14,048 | ||||||||||||||||||||||||||||||
| Major Item Repairs | |||||||||||||||||||||||||||||||||||||||||||
| Parking Lot Repair-M | 0 | 0 | 0 | 11,520 | 0 | 1,280 | 0 | 0 | 0 | 0 | 0 | 0 | 12,800 | ||||||||||||||||||||||||||||||
| Hot Water Heaters | 0 | 0 | 0 | 0 | 0 | 0 | 377 | 0 | 0 | 0 | 294 | 0 | 671 | ||||||||||||||||||||||||||||||
| HVAC Air Cond & Heat | 0 | 0 | 0 | 0 | 1,159 | 1,145 | 0 | 393 | 887 | 0 | 0 | 0 | 3,584 | ||||||||||||||||||||||||||||||
| Roof Repairs | 0 | 0 | 0 | 0 | 3,990 | 0 | 0 | 0 | 0 | 0 | 0 | 0 | 3,990 | ||||||||||||||||||||||||||||||
| Appliances | 0 | 0 | 0 | 719 | 0 | 214 | 0 | 429 | 794 | 643 | 0 | 0 | 2,799 | ||||||||||||||||||||||||||||||
| Floor Covering | 0 | 0 | 372 | 1,858 | 759 | 217 | 969 | 969 | 1,693 | 1,297 | 991 | 0 | 9,125 | ||||||||||||||||||||||||||||||
| Window Covering | 0 | 138 | 81 | 0 | 0 | 0 | 0 | 0 | 116 | 0 | 0 | 0 | 335 | ||||||||||||||||||||||||||||||
| Carpentry Repairs | 0 | 0 | 0 | 0 | 4,050 | 0 | 0 | 0 | 0 | 0 | 0 | 0 | 4,050 | ||||||||||||||||||||||||||||||
| Total Major Item Repai | 0 | 138 | 453 | 14,097 | 9,958 | 2,856 | 1,346 | 1,791 | 3,490 | 1,940 | 1,285 | 0 | 37,354 | ||||||||||||||||||||||||||||||
| Contract Services | |||||||||||||||||||||||||||||||||||||||||||
| Lawn Care | 1,299 | 1,299 | 1,299 | 1,299 | 1,299 | 1,299 | 1,299 | 1,299 | 1,299 | 1,299 | 1,299 | 0 | 14,289 | ||||||||||||||||||||||||||||||
A-3
| FNGL706_SY | TWELVE MONTH SPREAD SHEET Short Year | ||||||||||||||||||||||||||||||||||||||||||
| 02 | AMRECORP REALTY FUND II | SYSTEM DATE 12/18/2006 | |||||||||||||||||||||||||||||||||||||||||
| 312 | CHIMNEY SQUARE APARTMENTS | SELECT DATE 12/18/2006 | |||||||||||||||||||||||||||||||||||||||||
| Cur. Period 12/2006 | For Period Ending | ||||||||||||||||||||||||||||||||||||||||||
| Sel. Period 12/2006 | November 30, 2006 | # Units 128 Sq. Ft.126554 | |||||||||||||||||||||||||||||||||||||||||
| DESCRIPTION | JAN | FEB | MAR | APR | MAY | JUN | JUL | AUG | SEP | OCT | NOV | DEC | Total | PSF | |||||||||||||||||||||||||||||
| Patrol Service | 150 | 150 | 150 | 150 | 150 | 150 | 150 | 150 | 150 | 150 | 150 | 0 | 1,650 | ||||||||||||||||||||||||||||||
| Rubbish | 635 | 635 | 635 | 635 | 635 | 635 | 635 | 635 | 635 | 635 | 635 | 0 | 6,985 | ||||||||||||||||||||||||||||||
| Pest Control | 100 | 117 | 108 | 108 | 108 | 108 | 108 | 108 | 108 | 108 | 108 | (108 | ) | 1,081 | |||||||||||||||||||||||||||||
| Cable Television | 2,053 | 2,053 | 2,053 | 2,053 | 2,053 | 2,053 | 2,053 | 2,053 | 2,053 | 2,053 | 2,053 | (2,053 | ) | 20,530 | |||||||||||||||||||||||||||||
| Internet Access Fees | 63 | 63 | 63 | 63 | 63 | 63 | 63 | 48 | 165 | 91 | 25 | 0 | 770 | ||||||||||||||||||||||||||||||
| Total Contract Service | 4,300 | 4,317 | 4,308 | 4,308 | 4,308 | 4,308 | 4,308 | 4,293 | 4,410 | 4,336 | 4,270 | (2,161 | ) | 45,305 | |||||||||||||||||||||||||||||
| Supplies | |||||||||||||||||||||||||||||||||||||||||||
| Pool Supplies | 0 | 0 | 17 | 0 | 84 | 52 | 0 | 240 | 113 | 0 | 15 | 0 | 521 | ||||||||||||||||||||||||||||||
| Cleaning Supplies | 0 | 0 | 11 | 24 | 4 | 0 | 0 | 10 | 44 | 0 | 27 | 0 | 120 | ||||||||||||||||||||||||||||||
| Pest Control Supplie | 0 | 0 | 0 | 0 | 0 | 0 | 0 | 6 | 0 | 0 | 0 | 0 | 6 | ||||||||||||||||||||||||||||||
| Paint & Wallpaper Su | 0 | 378 | 5 | 0 | 146 | 0 | 151 | 181 | 151 | 151 | 151 | 0 | 1,314 | ||||||||||||||||||||||||||||||
| Filters | 0 | 59 | 0 | 0 | 39 | 0 | 0 | 79 | 0 | 0 | 178 | 0 | 355 | ||||||||||||||||||||||||||||||
| Light Bulbs | 0 | 0 | 100 | 0 | 0 | 0 | 50 | 0 | 0 | 0 | 113 | 0 | 263 | ||||||||||||||||||||||||||||||
| Mold Remediation | 0 | 0 | 0 | 0 | 0 | 0 | 0 | 66 | 0 | 0 | 0 | 0 | 66 | ||||||||||||||||||||||||||||||
| Total Supplies | 0 | 437 | 133 | 24 | 273 | 52 | 201 | 582 | 308 | 151 | 484 | 0 | 2,645 | ||||||||||||||||||||||||||||||
| Advertising & Promotio | |||||||||||||||||||||||||||||||||||||||||||
| Other Advertising | 169 | 74 | 95 | 169 | 338 | 169 | 74 | 264 | 0 | 169 | 169 | 0 | 1,690 | ||||||||||||||||||||||||||||||
| Promotion | 0 | 0 | 0 | 0 | 0 | 0 | 0 | 0 | 0 | 24 | 26 | 0 | 50 | ||||||||||||||||||||||||||||||
| Licenses | 0 | 0 | 0 | 0 | 0 | 0 | 0 | 50 | 0 | 0 | 0 | 0 | 50 | ||||||||||||||||||||||||||||||
| Total Advertising & Pr | 169 | 74 | 95 | 169 | 338 | 169 | 74 | 314 | 0 | 193 | 195 | 0 | 1,790 | ||||||||||||||||||||||||||||||
| Administration | |||||||||||||||||||||||||||||||||||||||||||
| Printed Forms & Lett | 2 | 27 | 68 | 10 | 49 | 31 | 46 | 47 | 15 | 33 | 71 | 8 | 407 | ||||||||||||||||||||||||||||||
| Office Supplies | 57 | 11 | 21 | 0 | 11 | 0 | 62 | 71 | 87 | 50 | 0 | 0 | 370 | ||||||||||||||||||||||||||||||
A-4
| FNGL706_SY | TWELVE MONTH SPREAD SHEET Short Year | ||||||||||||||||||||||||||||||||||||||||||
| 02 | AMRECORP REALTY FUND II | SYSTEM DATE 12/18/2006 | |||||||||||||||||||||||||||||||||||||||||
| 312 | CHIMNEY SQUARE APARTMENTS | SELECT DATE 12/18/2006 | |||||||||||||||||||||||||||||||||||||||||
| Cur. Period 12/2006 | For Period Ending | ||||||||||||||||||||||||||||||||||||||||||
| Sel. Period 12/2006 | November 30, 2006 | # Units 128 Sq. Ft.126554 | |||||||||||||||||||||||||||||||||||||||||
| DESCRIPTION | JAN | FEB | MAR | APR | MAY | JUN | JUL | AUG | SEP | OCT | NOV | DEC | Total | PSF | |||||||||||||||||||||||||||||
| Telephone | 168 | 268 | 88 | 152 | 283 | 160 | 160 | 385 | 227 | 172 | 226 | 0 | 2,289 | ||||||||||||||||||||||||||||||
| Answering Service | 24 | 24 | 24 | 24 | 24 | 24 | 24 | 24 | 24 | 24 | 24 | 0 | 264 | ||||||||||||||||||||||||||||||
| Credit Reporting | 0 | 51 | 310 | 161 | 209 | 74 | 119 | 298 | 247 | 204 | 156 | 204 | 2,033 | ||||||||||||||||||||||||||||||
| Computer Service | 128 | 128 | 128 | 128 | 128 | 128 | 128 | 128 | 128 | 128 | 128 | 0 | 1,408 | ||||||||||||||||||||||||||||||
| Office Equipment Rep | 81 | 0 | 0 | 0 | 0 | 0 | 130 | 53 | 2 | 0 | 31 | 0 | 297 | ||||||||||||||||||||||||||||||
| Legal | (160 | ) | 152 | 0 | 0 | 62 | 0 | 46 | 40 | (11 | ) | 164 | 28 | 0 | 321 | ||||||||||||||||||||||||||||
| Travel | 0 | 0 | 0 | 0 | 0 | 113 | 0 | 0 | 0 | 158 | 0 | 0 | 271 | ||||||||||||||||||||||||||||||
| Postage & Handling | 0 | 25 | 6 | 32 | 76 | 0 | 26 | 17 | 20 | 0 | 58 | 0 | 260 | ||||||||||||||||||||||||||||||
| Bookeeping Fees | 128 | 128 | 128 | 128 | 128 | 128 | 128 | 128 | 128 | 128 | 128 | 0 | 1,408 | ||||||||||||||||||||||||||||||
| Other Professional F | 106 | 0 | 0 | 0 | 0 | 0 | 1,195 | 0 | 0 | 0 | 0 | 0 | 1,301 | ||||||||||||||||||||||||||||||
| Database Management | 208 | 0 | 77 | 204 | 36 | 0 | 247 | 44 | 212 | 44 | 44 | 0 | 1,116 | ||||||||||||||||||||||||||||||
| Credit Card Processi | 0 | 0 | 15 | 0 | 0 | 0 | 0 | 0 | 0 | 48 | 0 | 0 | 63 | ||||||||||||||||||||||||||||||
| Meals & Entertainmen | 0 | 0 | 0 | 0 | 0 | 27 | 0 | 0 | 0 | 0 | 0 | 0 | 27 | ||||||||||||||||||||||||||||||
| Other Administrative | 13 | 13 | 13 | 26 | 16 | 13 | 17 | 14 | 13 | 19 | 18 | 0 | 175 | ||||||||||||||||||||||||||||||
| Total Administrative E | 755 | 827 | 878 | 865 | 1,022 | 698 | 2,328 | 1,249 | 1,092 | 1,172 | 912 | 212 | 12,010 | ||||||||||||||||||||||||||||||
| Miscellaneous Expense | |||||||||||||||||||||||||||||||||||||||||||
| Uniforms | 0 | 0 | 0 | 0 | 110 | 4 | 0 | 0 | 0 | 41 | 0 | 0 | 155 | ||||||||||||||||||||||||||||||
| Pagers | 0 | 98 | 0 | 0 | 0 | 0 | 0 | 60 | 5 | 0 | 0 | 0 | 163 | ||||||||||||||||||||||||||||||
| Total Miscellaneous Ex | 0 | 98 | 0 | 0 | 110 | 4 | 0 | 60 | 5 | 41 | 0 | 0 | 318 | ||||||||||||||||||||||||||||||
| Total Direct Expenses | 33,543 | 33,585 | 35,109 | 48,046 | 47,510 | 42,203 | 38,375 | 39,973 | 41,137 | 44,170 | 38,624 | (3,349 | ) | 438,926 | |||||||||||||||||||||||||||||
| Net Operating Income | 39,506 | 44,587 | 45,325 | 32,528 | 33,530 | 44,110 | 39,553 | 42,578 | 39,098 | 40,253 | 38,770 | 3,387 | 443,225 | ||||||||||||||||||||||||||||||
| Financial Expenses | |||||||||||||||||||||||||||||||||||||||||||
| First Mortgage Inter | 18,861 | 17,829 | 17,829 | 19,702 | 19,946 | 20,689 | 20,004 | 20,649 | 20,631 | 19,947 | 20,590 | (4,158 | ) | 212,519 | |||||||||||||||||||||||||||||
A-5
| FNGL706_SY | TWELVE MONTH SPREAD SHEET Short Year | ||||||||||||||||||||||||||||||||||||||||||
| 02 | AMRECORP REALTY FUND II | SYSTEM DATE 12/18/2006 | |||||||||||||||||||||||||||||||||||||||||
| 312 | CHIMNEY SQUARE APARTMENTS | SELECT DATE 12/18/2006 | |||||||||||||||||||||||||||||||||||||||||
| Cur. Period 12/2006 | For Period Ending | ||||||||||||||||||||||||||||||||||||||||||
| Sel. Period 12/2006 | November 30, 2006 | # Units 128 Sq. Ft.126554 | |||||||||||||||||||||||||||||||||||||||||
| DESCRIPTION | JAN | FEB | MAR | APR | MAY | JUN | JUL | AUG | SEP | OCT | NOV | DEC | Total | PSF | |||||||||||||||||||||||||||||
| Amortization Of Loan | 1,299 | 1,299 | 1,299 | 1,299 | 1,299 | 1,299 | 1,299 | 1,299 | 1,299 | 1,299 | 1,299 | 0 | 14,289 | ||||||||||||||||||||||||||||||
| Total Financial Expens | 20,160 | 19,128 | 19,128 | 21,001 | 21,245 | 21,988 | 21,303 | 21,948 | 21,930 | 21,246 | 21,889 | (4,158 | ) | 226,808 | |||||||||||||||||||||||||||||
| Depr Building & Impr | 2,500 | 2,500 | 2,500 | 2,500 | 2,500 | 2,500 | 2,500 | 2,500 | 2,500 | 2,500 | 2,500 | 0 | 27,500 | ||||||||||||||||||||||||||||||
| Total Depreciation Exp | 2,500 | 2,500 | 2,500 | 2,500 | 2,500 | 2,500 | 2,500 | 2,500 | 2,500 | 2,500 | 2,500 | 0 | 27,500 | ||||||||||||||||||||||||||||||
| Net Taxable Income | 16,846 | 22,959 | 23,697 | 9,027 | 9,785 | 19,622 | 15,750 | 18,130 | 14,668 | 16,507 | 14,381 | 7,545 | 188,917 | ||||||||||||||||||||||||||||||
A-6
| FNGL706 | TWELVE MONTH SPREAD SHEET | ||||||||||||||||||||||||||||||||||||||||||
| 02 | AMRECORP REALTY FUND II | SYSTEM DATE 12/18/2006 | |||||||||||||||||||||||||||||||||||||||||
| 312 | CHIMNEY SQUARE APARTMENTS | SELECT DATE 12/18/2006 | |||||||||||||||||||||||||||||||||||||||||
| Cur. Period 12/2006 | For Period Ending | ||||||||||||||||||||||||||||||||||||||||||
| Sel. Period 12/2005 | December 31, 2005 | # Units 128 Sq. Ft.126554 | |||||||||||||||||||||||||||||||||||||||||
| DESCRIPTION | JAN | FEB | MAR | APR | MAY | JUN | JUL | AUG | SEP | OCT | NOV | DEC | Total | PSF | |||||||||||||||||||||||||||||
| Income | |||||||||||||||||||||||||||||||||||||||||||
| Gross Potential Rent | 79,089 | 78,662 | 79,000 | 79,291 | 79,431 | 79,271 | 79,591 | 81,771 | 81,045 | 80,906 | 80,639 | 80,245 | 958,943 | 7.58 | |||||||||||||||||||||||||||||
| Vacancies | (3,051 | ) | (2,671 | ) | (1,307 | ) | (3,520 | ) | (2,887 | ) | (1,225 | ) | (748 | ) | (4,282 | ) | (5,074 | ) | (5,123 | ) | (3,808 | ) | (3,762 | ) | (37,461 | ) | (0.30 | ) | |||||||||||||||
| Employee Units | (180 | ) | (180 | ) | (180 | ) | (180 | ) | (180 | ) | (180 | ) | (629 | ) | 32 | (360 | ) | (1,194 | ) | (208 | ) | (530 | ) | (3,967 | ) | (0.03 | ) | ||||||||||||||||
| Allowances | (50 | ) | 0 | 0 | 0 | 0 | 0 | 0 | 0 | (44 | ) | 0 | (150 | ) | (50 | ) | (294 | ) | 0.00 | ||||||||||||||||||||||||
| Uncollectable Rent | 0 | 0 | (301 | ) | 0 | 0 | 0 | 0 | 0 | 0 | 0 | 0 | 0 | (301 | ) | 0.00 | |||||||||||||||||||||||||||
| Net Change In Accts. | (6,533 | ) | 2,974 | (144 | ) | (1,000 | ) | 787 | 4,116 | (1,351 | ) | (2,987 | ) | 3,022 | (130 | ) | (2,573 | ) | 2,340 | (1,479 | ) | (0.01 | ) | ||||||||||||||||||||
| Net Rental Income | 69,275 | 78,785 | 77,068 | 74,591 | 77,151 | 81,982 | 76,863 | 74,534 | 78,589 | 74,459 | 73,900 | 78,243 | 915,440 | 7.23 | |||||||||||||||||||||||||||||
| Fee Income | 75 | 240 | 50 | 615 | 70 | 1,598 | 597 | 95 | 240 | 924 | 125 | 245 | 4,874 | 0.04 | |||||||||||||||||||||||||||||
| Utility Billings | 89 | 370 | 110 | 27 | 180 | 272 | 85 | 151 | 117 | 0 | 0 | 0 | 1,401 | 0.01 | |||||||||||||||||||||||||||||
| Damages | 485 | 375 | 919 | 3,481 | 765 | 1,173 | 100 | 67 | 595 | 435 | 341 | 955 | 9,691 | 0.08 | |||||||||||||||||||||||||||||
| Application Fee | 250 | 220 | 265 | 280 | 300 | 375 | 190 | 265 | 305 | 315 | 140 | 50 | 2,955 | 0.02 | |||||||||||||||||||||||||||||
| Miscellaneous Income | 0 | 0 | 102 | 0 | 0 | 0 | 25 | 0 | 0 | 0 | 0 | 0 | 127 | 0.00 | |||||||||||||||||||||||||||||
| Vending Income | 607 | 314 | 393 | 1,031 | 416 | 328 | 403 | 619 | 957 | 627 | 486 | 536 | 6,716 | 0.05 | |||||||||||||||||||||||||||||
| Interest Income | 0 | 0 | 1 | 3 | 5 | 6 | 8 | 10 | 12 | 13 | 15 | 17 | 90 | 0.00 | |||||||||||||||||||||||||||||
| Total Income | 70,781 | 80,304 | 78,908 | 80,028 | 78,887 | 85,734 | 78,271 | 75,741 | 80,815 | 76,773 | 75,007 | 80,046 | 941,295 | 7.44 | |||||||||||||||||||||||||||||
| Direct Expenses | |||||||||||||||||||||||||||||||||||||||||||
| Utilities | |||||||||||||||||||||||||||||||||||||||||||
| Electric | 1,215 | 1,114 | 1,085 | 1,117 | 930 | 1,056 | 931 | 1,302 | 1,300 | 1,375 | 1,626 | 1,291 | 14,341 | 0.11 | |||||||||||||||||||||||||||||
| Electric Vacant Unit | 305 | 610 | 311 | 643 | 354 | 329 | 214 | 393 | 250 | 168 | 104 | 15 | 3,695 | 0.03 | |||||||||||||||||||||||||||||
| Electric Office/Mode | 465 | 480 | 473 | 390 | 279 | 292 | 389 | 562 | 550 | 614 | 413 | 242 | 5,148 | 0.04 | |||||||||||||||||||||||||||||
| Connection Fees | 0 | 0 | 0 | 0 | 0 | 0 | 0 | 0 | 0 | 50 | 190 | 60 | 300 | 0.00 | |||||||||||||||||||||||||||||
| Gas | 82 | 59 | 60 | 61 | 68 | 59 | 60 | 64 | 67 | 70 | 124 | 181 | 955 | 0.01 | |||||||||||||||||||||||||||||
A-7
| FNGL706 | TWELVE MONTH SPREAD SHEET | ||||||||||||||||||||||||||||||||||||||||||
| 02 | AMRECORP REALTY FUND II | SYSTEM DATE 12/18/2006 | |||||||||||||||||||||||||||||||||||||||||
| 312 | CHIMNEY SQUARE APARTMENTS | SELECT DATE 12/18/2006 | |||||||||||||||||||||||||||||||||||||||||
| Cur. Period 12/2006 | For Period Ending | ||||||||||||||||||||||||||||||||||||||||||
| Sel. Period 12/2005 | December 31, 2005 | # Units 128 Sq. Ft.126554 | |||||||||||||||||||||||||||||||||||||||||
| DESCRIPTION | JAN | FEB | MAR | APR | MAY | JUN | JUL | AUG | SEP | OCT | NOV | DEC | Total | PSF | |||||||||||||||||||||||||||||
| Water | 1,211 | 1,153 | 1,039 | 1,054 | 1,057 | 1,294 | 1,228 | 1,420 | 1,225 | 1,213 | 1,278 | 1,582 | 14,753 | 0.12 | |||||||||||||||||||||||||||||
| Sewer | 434 | 412 | 368 | 374 | 374 | 469 | 441 | 331 | 526 | 436 | 461 | 589 | 5,214 | 0.04 | |||||||||||||||||||||||||||||
| Total Utilities | 3,712 | 3,828 | 3,336 | 3,639 | 3,062 | 3,499 | 3,263 | 4,072 | 3,918 | 3,926 | 4,196 | 3,960 | 44,411 | 0.35 | |||||||||||||||||||||||||||||
| Payroll | |||||||||||||||||||||||||||||||||||||||||||
| Salary & Wages | 6,383 | 6,510 | 6,737 | 6,510 | 6,493 | 6,515 | 10,304 | 6,270 | 6,074 | 11,296 | 6,322 | 10,820 | 90,235 | 0.71 | |||||||||||||||||||||||||||||
| Overtime Wages | 0 | 4 | 51 | 46 | 14 | 120 | 151 | 221 | 119 | 511 | 59 | 191 | 1,487 | 0.01 | |||||||||||||||||||||||||||||
| Payroll Taxes | 578 | 591 | 614 | 595 | 590 | 603 | 946 | 615 | 592 | 1,086 | 605 | 1,042 | 8,459 | 0.07 | |||||||||||||||||||||||||||||
| Workman's Comp Exp | 233 | 238 | 247 | 239 | 238 | 243 | 381 | 247 | 238 | 437 | 244 | 419 | 3,403 | 0.03 | |||||||||||||||||||||||||||||
| Health Insurance Exp | 276 | 278 | 449 | 442 | 442 | 442 | 593 | 301 | 301 | 301 | 300 | 428 | 4,550 | 0.04 | |||||||||||||||||||||||||||||
| Leasing Costs | 308 | 314 | 327 | 316 | 314 | 321 | 503 | 327 | 315 | 578 | 322 | 554 | 4,499 | 0.04 | |||||||||||||||||||||||||||||
| Total Payroll | 7,778 | 7,935 | 8,425 | 8,148 | 8,091 | 8,244 | 12,878 | 7,981 | 7,639 | 14,209 | 7,852 | 13,454 | 112,634 | 0.89 | |||||||||||||||||||||||||||||
| Property Taxes | |||||||||||||||||||||||||||||||||||||||||||
| Real Estate Taxes | 9,500 | 9,500 | 9,500 | 9,500 | 9,500 | 9,500 | 9,500 | 9,500 | 10,583 | 10,583 | 10,583 | 18,482 | 126,231 | 1.00 | |||||||||||||||||||||||||||||
| Insurance | |||||||||||||||||||||||||||||||||||||||||||
| Property Insurance | 3,067 | 3,067 | 3,067 | 3,067 | 2,584 | 2,920 | 2,955 | 2,920 | 2,920 | 2,920 | 2,920 | 3,128 | 35,535 | 0.28 | |||||||||||||||||||||||||||||
| Total Insurance | 3,067 | 3,067 | 3,067 | 3,067 | 2,584 | 2,920 | 2,955 | 2,920 | 2,920 | 2,920 | 2,920 | 3,128 | 35,535 | 0.28 | |||||||||||||||||||||||||||||
| Management Fees | 3,539 | 4,015 | 3,945 | 4,001 | 3,944 | 4,287 | 3,913 | 3,787 | 4,041 | 3,839 | 3,750 | 3,933 | 46,996 | 0.37 | |||||||||||||||||||||||||||||
| Maintenance & Repairs | |||||||||||||||||||||||||||||||||||||||||||
| HVAC-Air Cond & Heat | 42 | 23 | 79 | 0 | 176 | 467 | 398 | 0 | 116 | 542 | 0 | 121 | 1,965 | 0.02 | |||||||||||||||||||||||||||||
| Locks & Keys | 29 | 0 | 15 | 112 | 28 | 87 | 0 | 8 | 0 | 2 | 4 | 117 | 403 | 0.00 | |||||||||||||||||||||||||||||
| Screens & Glass | 61 | 0 | 0 | 18 | 162 | 10 | 0 | 12 | 0 | 0 | 0 | 0 | 263 | 0.00 | |||||||||||||||||||||||||||||
A-8
| FNGL706 | TWELVE MONTH SPREAD SHEET | ||||||||||||||||||||||||||||||||||||||||||
| 02 | AMRECORP REALTY FUND II | SYSTEM DATE 12/18/2006 | |||||||||||||||||||||||||||||||||||||||||
| 312 | CHIMNEY SQUARE APARTMENTS | SELECT DATE 12/18/2006 | |||||||||||||||||||||||||||||||||||||||||
| Cur. Period 12/2006 | For Period Ending | ||||||||||||||||||||||||||||||||||||||||||
| Sel. Period 12/2005 | December 31, 2005 | # Units 128 Sq. Ft.126554 | |||||||||||||||||||||||||||||||||||||||||
| DESCRIPTION | JAN | FEB | MAR | APR | MAY | JUN | JUL | AUG | SEP | OCT | NOV | DEC | Total | PSF | |||||||||||||||||||||||||||||
| Lumber & Carpentry | 20 | 165 | 35 | 22 | 0 | 52 | 6 | 5 | 34 | 31 | 113 | 85 | 568 | 0.00 | |||||||||||||||||||||||||||||
| Carpet Cleaning | 185 | 0 | 200 | 175 | 410 | 215 | 0 | 240 | 168 | 270 | 260 | 189 | 2,312 | 0.02 | |||||||||||||||||||||||||||||
| Plumbing | 123 | 308 | 192 | 262 | 70 | 222 | 17 | 276 | 0 | 225 | 296 | 732 | 2,722 | 0.02 | |||||||||||||||||||||||||||||
| Sewer Maintenance | 0 | 0 | 0 | 0 | 0 | 140 | 0 | 210 | 0 | 0 | 0 | 0 | 350 | 0.00 | |||||||||||||||||||||||||||||
| Appliance Repairs-Mi | 14 | 19 | 15 | 0 | 0 | 32 | 16 | 3 | 23 | 71 | 2 | 193 | 386 | 0.00 | |||||||||||||||||||||||||||||
| Electrical Repairs | 40 | 40 | 3 | 0 | 0 | 31 | 70 | 6 | 0 | 0 | 7 | 33 | 229 | 0.00 | |||||||||||||||||||||||||||||
| Pool Maintenance | 0 | 0 | 0 | 0 | 0 | 0 | 32 | 53 | 77 | 23 | 0 | 0 | 186 | 0.00 | |||||||||||||||||||||||||||||
| Grounds Maintenance | 0 | 0 | 0 | 0 | 0 | 520 | 0 | 0 | 0 | 0 | 429 | 0 | 948 | 0.01 | |||||||||||||||||||||||||||||
| Parking Lot Repair-M | 0 | 0 | 0 | 0 | 49 | 91 | 0 | 0 | 0 | 0 | 19 | 0 | 160 | 0.00 | |||||||||||||||||||||||||||||
| Small Tool | 0 | 0 | 0 | 891 | 0 | 0 | 0 | 262 | 0 | 0 | 0 | 0 | 1,153 | 0.01 | |||||||||||||||||||||||||||||
| Equipment Rental | 0 | 0 | 0 | 0 | 0 | 0 | 0 | 0 | 0 | 0 | 0 | 108 | 108 | 0.00 | |||||||||||||||||||||||||||||
| Small Appliance | 0 | 0 | 38 | 38 | 0 | 38 | 38 | 0 | 0 | 113 | 32 | 151 | 448 | 0.00 | |||||||||||||||||||||||||||||
| Carpet Repair & Dyin | 37 | 0 | 71 | 161 | 131 | 74 | 0 | 52 | 0 | 66 | 54 | 0 | 645 | 0.01 | |||||||||||||||||||||||||||||
| Laundry Equipment Re | 0 | 63 | 22 | 0 | 0 | 0 | 86 | 0 | 0 | 92 | 0 | 11 | 274 | 0.00 | |||||||||||||||||||||||||||||
| Garage Carport & Gat | 0 | 0 | 158 | 0 | 0 | 0 | 0 | 12 | 115 | 0 | 0 | 290 | 576 | 0.00 | |||||||||||||||||||||||||||||
| Total Maintenance & Re | 551 | 618 | 828 | 1,679 | 1,026 | 1,979 | 663 | 1,139 | 533 | 1,435 | 1,216 | 2,030 | 13,697 | 0.11 | |||||||||||||||||||||||||||||
| Major Item Repairs | |||||||||||||||||||||||||||||||||||||||||||
| Hot Water Heaters | 286 | 0 | 0 | 0 | 0 | 0 | 0 | 0 | 287 | 268 | 296 | (1,136 | ) | 0 | 0.00 | ||||||||||||||||||||||||||||
| HVAC Air Cond & Heat | 0 | 0 | 0 | 0 | 0 | 0 | 647 | 0 | 0 | 1,629 | 0 | (2,277 | ) | 0 | 0.00 | ||||||||||||||||||||||||||||
| Roof Repairs | 41,351 | 49,664 | 6,561 | 0 | 0 | 0 | 0 | 0 | 0 | 0 | 0 | (97,576 | ) | 0 | 0.00 | ||||||||||||||||||||||||||||
| Appliances | 0 | 0 | 0 | 0 | 0 | 0 | 0 | 214 | 0 | 0 | 0 | 0 | 214 | 0.00 | |||||||||||||||||||||||||||||
| Floor Covering | 0 | 0 | 1,056 | 0 | 474 | 128 | 989 | 0 | 893 | 3,099 | 451 | (7,091 | ) | 0 | 0.00 | ||||||||||||||||||||||||||||
| Window Covering | 0 | 0 | 152 | 0 | 0 | 0 | 110 | 0 | 0 | 49 | 0 | 72 | 383 | 0.00 | |||||||||||||||||||||||||||||
| Exterior Painting | 9,755 | 0 | 0 | 0 | 0 | 0 | 0 | 0 | 0 | 0 | 0 | 0 | 9,755 | 0.08 | |||||||||||||||||||||||||||||
| Major Patio/Fence Re | 8,431 | 0 | 0 | 0 | 0 | 0 | 0 | 0 | 0 | 0 | 0 | (8,431 | ) | 0 | 0.00 | ||||||||||||||||||||||||||||
| Carpentry Repairs | 5,734 | 0 | 0 | 0 | 0 | 0 | 0 | 0 | 0 | 0 | 0 | 0 | 5,734 | 0.05 | |||||||||||||||||||||||||||||
A-9
| FNGL706 | TWELVE MONTH SPREAD SHEET | ||||||||||||||||||||||||||||||||||||||||||
| 02 | AMRECORP REALTY FUND II | SYSTEM DATE 12/18/2006 | |||||||||||||||||||||||||||||||||||||||||
| 312 | CHIMNEY SQUARE APARTMENTS | SELECT DATE 12/18/2006 | |||||||||||||||||||||||||||||||||||||||||
| Cur. Period 12/2006 | For Period Ending | ||||||||||||||||||||||||||||||||||||||||||
| Sel. Period 12/2005 | December 31, 2005 | # Units 128 Sq. Ft.126554 | |||||||||||||||||||||||||||||||||||||||||
| DESCRIPTION | JAN | FEB | MAR | APR | MAY | JUN | JUL | AUG | SEP | OCT | NOV | DEC | Total | PSF | |||||||||||||||||||||||||||||
| Floor Repair-Major | 0 | 0 | 0 | 0 | 0 | 0 | 0 | 0 | 694 | 0 | 0 | 0 | 694 | 0.01 | |||||||||||||||||||||||||||||
| Exterior Building Ma | 0 | 2,994 | 0 | 0 | 0 | 0 | 0 | 0 | 0 | 0 | 0 | 0 | 2,994 | 0.02 | |||||||||||||||||||||||||||||
| Major Pool Repairs | 0 | 0 | 0 | 0 | 0 | 0 | 0 | 2,298 | 0 | 0 | 0 | 0 | 2,298 | 0.02 | |||||||||||||||||||||||||||||
| Total Major Item Repai | 65,557 | 52,658 | 7,769 | 0 | 474 | 128 | 1,746 | 2,512 | 1,874 | 5,045 | 747 | (116,439 | ) | 22,071 | 0.17 | ||||||||||||||||||||||||||||
| Contract Services | |||||||||||||||||||||||||||||||||||||||||||
| Lawn Care | 1,299 | 1,299 | 1,299 | 1,299 | 1,299 | 1,299 | 1,299 | 1,299 | 1,299 | 1,299 | 1,299 | 1,299 | 15,588 | 0.12 | |||||||||||||||||||||||||||||
| Patrol Service | 150 | 150 | 150 | 150 | 150 | 150 | 150 | 150 | 150 | 150 | 150 | 0 | 1,650 | 0.01 | |||||||||||||||||||||||||||||
| Rubbish | 628 | 628 | 628 | 628 | 628 | 628 | 628 | 628 | 628 | 635 | 635 | 740 | 7,662 | 0.06 | |||||||||||||||||||||||||||||
| Pest Control | 108 | 108 | 2,273 | 108 | 1,191 | 217 | 108 | 100 | 117 | 108 | 1,407 | 217 | 6,062 | 0.05 | |||||||||||||||||||||||||||||
| Cable Television | 2,000 | 2,053 | 2,053 | 2,053 | 2,053 | 2,053 | 2,053 | 2,053 | 2,053 | 2,053 | 2,053 | 53 | 22,581 | 0.18 | |||||||||||||||||||||||||||||
| Internet Access Fees | 63 | 63 | 63 | 63 | 63 | 63 | 63 | 63 | 63 | 63 | 63 | 63 | 754 | 0.01 | |||||||||||||||||||||||||||||
| Total Contract Service | 4,248 | 4,301 | 6,466 | 4,301 | 5,384 | 4,410 | 4,301 | 4,293 | 4,310 | 4,308 | 5,607 | 2,372 | 54,301 | 0.43 | |||||||||||||||||||||||||||||
| Supplies | |||||||||||||||||||||||||||||||||||||||||||
| Pool Supplies | 3 | 0 | 0 | 493 | 0 | 14 | 16 | 0 | 0 | 0 | 0 | 12 | 538 | 0.00 | |||||||||||||||||||||||||||||
| Cleaning Supplies | 0 | 0 | 0 | 23 | 0 | 12 | 0 | 38 | 0 | 0 | 0 | 50 | 122 | 0.00 | |||||||||||||||||||||||||||||
| Pest Control Supplie | 0 | 0 | 14 | 11 | 0 | 0 | 0 | 20 | 0 | 0 | 18 | 0 | 64 | 0.00 | |||||||||||||||||||||||||||||
| Paint & Wallpaper Su | 100 | 67 | 148 | 256 | 0 | 13 | 213 | 187 | 0 | 284 | 0 | 149 | 1,416 | 0.01 | |||||||||||||||||||||||||||||
| Filters | 0 | 0 | 79 | 0 | 0 | 0 | 0 | 0 | 0 | 79 | 0 | 118 | 276 | 0.00 | |||||||||||||||||||||||||||||
| Light Bulbs | 0 | 49 | 0 | 63 | 34 | 0 | 18 | 3 | 0 | 0 | 0 | 115 | 280 | 0.00 | |||||||||||||||||||||||||||||
| Total Supplies | 103 | 116 | 241 | 846 | 34 | 39 | 247 | 248 | 0 | 363 | 18 | 444 | 2,699 | 0.02 | |||||||||||||||||||||||||||||
| Advertising & Promotio | |||||||||||||||||||||||||||||||||||||||||||
| Other Advertising | 69 | 164 | 164 | 164 | 164 | 95 | 169 | 169 | 169 | 264 | 169 | 169 | 1,929 | 0.02 | |||||||||||||||||||||||||||||
| On-Site Printed Mate | 2 | 0 | 0 | 0 | 0 | 0 | 0 | 0 | 0 | 0 | 0 | 0 | 2 | 0.00 | |||||||||||||||||||||||||||||
A-10
| FNGL706 | TWELVE MONTH SPREAD SHEET | ||||||||||||||||||||||||||||||||||||||||||
| 02 | AMRECORP REALTY FUND II | SYSTEM DATE 12/18/2006 | |||||||||||||||||||||||||||||||||||||||||
| 312 | CHIMNEY SQUARE APARTMENTS | SELECT DATE 12/18/2006 | |||||||||||||||||||||||||||||||||||||||||
| Cur. Period 12/2006 | For Period Ending | ||||||||||||||||||||||||||||||||||||||||||
| Sel. Period 12/2005 | December 31, 2005 | # Units 128 Sq. Ft.126554 | |||||||||||||||||||||||||||||||||||||||||
| DESCRIPTION | JAN | FEB | MAR | APR | MAY | JUN | JUL | AUG | SEP | OCT | NOV | DEC | Total | PSF | |||||||||||||||||||||||||||||
| Site Signage | 12 | 0 | 0 | 0 | 0 | 0 | 0 | 35 | 0 | 0 | 0 | 0 | 47 | 0.00 | |||||||||||||||||||||||||||||
| Promotion | 0 | 0 | 0 | 23 | 0 | 0 | 0 | 0 | 0 | 0 | 0 | 419 | 442 | 0.00 | |||||||||||||||||||||||||||||
| Licenses | 0 | 0 | 0 | 0 | 0 | 0 | 50 | 0 | 0 | 0 | 0 | 0 | 50 | 0.00 | |||||||||||||||||||||||||||||
| Film & Processing | 0 | 0 | 0 | 0 | 0 | 0 | 0 | 5 | 0 | 0 | 0 | 24 | 30 | 0.00 | |||||||||||||||||||||||||||||
| Total Advertising & Pr | 83 | 164 | 164 | 187 | 164 | 95 | 219 | 209 | 169 | 264 | 169 | 612 | 2,499 | 0.02 | |||||||||||||||||||||||||||||
| Administration | |||||||||||||||||||||||||||||||||||||||||||
| Printed Forms & Lett | 18 | 42 | 29 | 21 | 253 | 30 | 3 | 73 | 78 | 24 | 0 | 49 | 621 | 0.00 | |||||||||||||||||||||||||||||
| Office Supplies | 0 | 0 | 25 | 0 | 62 | 38 | 0 | 66 | 79 | 0 | 13 | 276 | 558 | 0.00 | |||||||||||||||||||||||||||||
| Telephone | 173 | 284 | 177 | 169 | 288 | 165 | 176 | 281 | 160 | 165 | 297 | 163 | 2,497 | 0.02 | |||||||||||||||||||||||||||||
| Answering Service | 24 | 24 | 24 | 24 | 24 | 24 | 24 | 24 | 24 | 24 | 24 | 24 | 285 | 0.00 | |||||||||||||||||||||||||||||
| Credit Reporting | 0 | 178 | 153 | 251 | 116 | 238 | 290 | 136 | 219 | 170 | 110 | 204 | 2,065 | 0.02 | |||||||||||||||||||||||||||||
| Computer Service | 128 | 128 | 128 | 128 | 128 | 128 | 128 | 128 | 128 | 128 | 128 | 128 | 1,536 | 0.01 | |||||||||||||||||||||||||||||
| Office Equipment Rep | 0 | 156 | 0 | 56 | 0 | 0 | 0 | 0 | 79 | 92 | 16 | (16 | ) | 384 | 0.00 | ||||||||||||||||||||||||||||
| Legal | 0 | 0 | 3,620 | 0 | 0 | 0 | 0 | 164 | (9 | ) | (164 | ) | 0 | 246 | 3,857 | 0.03 | |||||||||||||||||||||||||||
| Travel | 0 | 20 | 0 | 22 | 0 | 116 | 0 | 0 | 0 | 177 | 65 | 0 | 400 | 0.00 | |||||||||||||||||||||||||||||
| Postage & Handling | 0 | 6 | 25 | 9 | 0 | 10 | 0 | 203 | 6 | (5 | ) | 9 | 44 | 307 | 0.00 | ||||||||||||||||||||||||||||
| Internet Access Char | 0 | 0 | (15 | ) | 0 | 0 | 0 | 0 | 0 | 0 | 0 | 0 | 0 | (15 | ) | 0.00 | |||||||||||||||||||||||||||
| Bookeeping Fees | 128 | 128 | 128 | 128 | 128 | 128 | 128 | 128 | 128 | 128 | 128 | 128 | 1,536 | 0.01 | |||||||||||||||||||||||||||||
| Other Professional F | 0 | 8 | 0 | 50 | 0 | 1,242 | 0 | 396 | 0 | 0 | 0 | 385 | 2,081 | 0.02 | |||||||||||||||||||||||||||||
| Database Management | 0 | 0 | 257 | 0 | 21 | 206 | 21 | 21 | 288 | 120 | 120 | 146 | 1,200 | 0.01 | |||||||||||||||||||||||||||||
| Credit Card Processi | 0 | 0 | 0 | 0 | 0 | 0 | 0 | 0 | 10 | 0 | 0 | 10 | 20 | 0.00 | |||||||||||||||||||||||||||||
| Meals & Entertainmen | 0 | 0 | 0 | 0 | 0 | 28 | 7 | 0 | 0 | 8 | 0 | 100 | 144 | 0.00 | |||||||||||||||||||||||||||||
| Other Administrative | 13 | 13 | 13 | 13 | 19 | 16 | 16 | 19 | 262 | 17 | 12 | 11 | 424 | 0.00 | |||||||||||||||||||||||||||||
| Total Administrative E | 484 | 987 | 4,564 | 871 | 1,039 | 2,369 | 793 | 1,639 | 1,452 | 884 | 922 | 1,898 | 17,902 | 0.14 | |||||||||||||||||||||||||||||
| Miscellaneous Expense | |||||||||||||||||||||||||||||||||||||||||||
A-11
| FNGL706 | TWELVE MONTH SPREAD SHEET | ||||||||||||||||||||||||||||||||||||||||||
| 02 | AMRECORP REALTY FUND II | SYSTEM DATE 12/18/2006 | |||||||||||||||||||||||||||||||||||||||||
| 312 | CHIMNEY SQUARE APARTMENTS | SELECT DATE 12/18/2006 | |||||||||||||||||||||||||||||||||||||||||
| Cur. Period 12/2006 | For Period Ending | ||||||||||||||||||||||||||||||||||||||||||
| Sel. Period 12/2005 | December 31, 2005 | # Units 128 Sq. Ft.126554 | |||||||||||||||||||||||||||||||||||||||||
| DESCRIPTION | JAN | FEB | MAR | APR | MAY | JUN | JUL | AUG | SEP | OCT | NOV | DEC | Total | PSF | |||||||||||||||||||||||||||||
| Uniforms | 0 | 0 | 0 | 36 | 0 | 0 | 8 | 0 | 103 | 0 | 0 | 0 | 148 | 0.00 | |||||||||||||||||||||||||||||
| Pagers | 0 | 98 | 0 | 0 | 0 | 0 | 0 | 98 | 0 | 0 | 0 | 51 | 247 | 0.00 | |||||||||||||||||||||||||||||
| Total Miscellaneous Ex | 0 | 98 | 0 | 36 | 0 | 0 | 8 | 98 | 103 | 0 | 0 | 51 | 394 | 0.00 | |||||||||||||||||||||||||||||
| Total Direct Expenses | 98,622 | 87,287 | 48,305 | 36,275 | 35,302 | 37,470 | 40,486 | 38,398 | 37,542 | 47,776 | 37,980 | (66,075 | ) | 479,368 | 3.79 | ||||||||||||||||||||||||||||
| Net Operating Income | (27,841 | ) | (6,983 | ) | 30,603 | 43,754 | 43,586 | 48,265 | 37,785 | 37,344 | 43,274 | 28,998 | 37,027 | 146,123 | 461,935 | 3.65 | |||||||||||||||||||||||||||
| Financial Expenses | |||||||||||||||||||||||||||||||||||||||||||
| First Mortgage Inter | (5,434 | ) | 30,377 | 13,713 | 13,836 | 14,720 | 14,603 | 15,893 | 15,976 | 16,487 | 17,398 | 17,757 | 18,680 | 184,006 | 1.45 | ||||||||||||||||||||||||||||
| Amortization Of Loan | 1,228 | 1,228 | 1,228 | 1,228 | 1,228 | 1,228 | 1,228 | 1,228 | 1,228 | 1,228 | 1,228 | 2,084 | 15,590 | 0.12 | |||||||||||||||||||||||||||||
| Total Financial Expens | (4,206 | ) | 31,605 | 14,941 | 15,064 | 15,948 | 15,831 | 17,121 | 17,204 | 17,715 | 18,626 | 18,985 | 20,764 | 199,598 | 1.58 | ||||||||||||||||||||||||||||
| Depr Building & Impr | 2,500 | 2,500 | 2,500 | 2,500 | 2,500 | 2,500 | 2,500 | 2,500 | 2,500 | 2,500 | 2,500 | 1,896 | 29,396 | 0.23 | |||||||||||||||||||||||||||||
| Total Depreciation Exp | 2,500 | 2,500 | 2,500 | 2,500 | 2,500 | 2,500 | 2,500 | 2,500 | 2,500 | 2,500 | 2,500 | 1,896 | 29,396 | 0.23 | |||||||||||||||||||||||||||||
| Net Taxable Income | (26,135 | ) | (41,088 | ) | 13,162 | 26,190 | 25,138 | 29,934 | 18,164 | 17,640 | 23,059 | 7,872 | 15,542 | 123,463 | 232,941 | 1.84 | |||||||||||||||||||||||||||
A-12
| FNGL706 | TWELVE MONTH SPREAD SHEET | ||||||||||||||||||||||||||||||||||||||||||
| 02 | AMRECORP REALTY FUND II | SYSTEM DATE 12/18/2006 | |||||||||||||||||||||||||||||||||||||||||
| 312 | CHIMNEY SQUARE APARTMENTS | SELECT DATE 12/18/2006 | |||||||||||||||||||||||||||||||||||||||||
| Cur. Period 12/2006 | For Period Ending | ||||||||||||||||||||||||||||||||||||||||||
| Sel. Period 12/2004 | December 31, 2004 | # Units 128 Sq. Ft.126554 | |||||||||||||||||||||||||||||||||||||||||
| DESCRIPTION | JAN | FEB | MAR | APR | MAY | JUN | JUL | AUG | SEP | OCT | NOV | DEC | Total | PSF | |||||||||||||||||||||||||||||
| Income | |||||||||||||||||||||||||||||||||||||||||||
| Gross Potential Rent | 77,434 | 76,762 | 78,361 | 78,301 | 78,930 | 78,619 | 79,070 | 79,130 | 79,540 | 79,550 | 79,640 | 79,921 | 945,260 | 7.47 | |||||||||||||||||||||||||||||
| Vacancies | (7,697 | ) | (6,271 | ) | (4,779 | ) | (3,862 | ) | (3,554 | ) | (3,422 | ) | (2,224 | ) | (1,927 | ) | (2,278 | ) | (2,167 | ) | (2,381 | ) | (2,897 | ) | (43,461 | ) | (0.34 | ) | |||||||||||||||
| Employee Units | (108 | ) | (108 | ) | (180 | ) | (180 | ) | (180 | ) | (180 | ) | (180 | ) | (180 | ) | (180 | ) | (779 | ) | (180 | ) | (180 | ) | (2,613 | ) | (0.02 | ) | |||||||||||||||
| Allowances | 0 | 0 | 0 | 0 | 60 | 0 | 0 | 0 | 0 | 0 | 0 | 0 | 60 | 0 | |||||||||||||||||||||||||||||
| Net Change In Accts. | (186 | ) | 429 | (803 | ) | 201 | 672 | (2,289 | ) | 8,476 | (5,570 | ) | 2,079 | 1,856 | (2,300 | ) | 1,764 | 4,330 | 0.03 | ||||||||||||||||||||||||
| Net Rental Income | 69,443 | 70,812 | 72,599 | 74,460 | 75,928 | 72,728 | 85,142 | 71,453 | 79,161 | 78,460 | 74,780 | 78,608 | 903,574 | 7.14 | |||||||||||||||||||||||||||||
| Fee Income | 190 | 875 | 250 | 1,434 | 680 | 400 | 1,498 | 1,663 | 345 | 126 | 539 | 175 | 8,175 | 0.06 | |||||||||||||||||||||||||||||
| Utility Billings | 155 | 0 | 0 | 112 | 153 | 121 | 298 | 410 | 20 | 0 | 27 | 20 | 1,317 | 0.01 | |||||||||||||||||||||||||||||
| Damages | 458 | 65 | 985 | 1,385 | 65 | 0 | 1,175 | 2,010 | 573 | 1,211 | 490 | 956 | 9,373 | 0.07 | |||||||||||||||||||||||||||||
| Application Fee | 280 | 395 | 480 | 125 | 165 | 270 | 365 | 265 | 215 | 25 | 50 | 265 | 2,900 | 0.02 | |||||||||||||||||||||||||||||
| Vending Income | 518 | 377 | 278 | 645 | 625 | 489 | 903 | 676 | 475 | 959 | 304 | 718 | 6,967 | 0.06 | |||||||||||||||||||||||||||||
| Total Income | 71,044 | 72,524 | 74,592 | 78,161 | 77,616 | 74,008 | 89,381 | 76,477 | 80,789 | 80,781 | 76,190 | 80,742 | 932,305 | 7.37 | |||||||||||||||||||||||||||||
| Direct Expenses | |||||||||||||||||||||||||||||||||||||||||||
| Utilities | |||||||||||||||||||||||||||||||||||||||||||
| Electric | 895 | 628 | 590 | 553 | 499 | 550 | 3,104 | 646 | 564 | 613 | 605 | 913 | 10,160 | 0.08 | |||||||||||||||||||||||||||||
| Electric Vacant Unit | 34 | 163 | 322 | 241 | 376 | 513 | 695 | 958 | 75 | 190 | 62 | 222 | 3,851 | 0.03 | |||||||||||||||||||||||||||||
| Electric Office/Mode | 489 | 399 | 384 | 238 | 187 | 252 | 285 | 303 | 306 | 241 | 183 | -340 | 2,927 | 0.02 | |||||||||||||||||||||||||||||
| Connection Fees | 0 | 0 | 0 | 0 | 0 | 0 | 0 | 0 | 0 | 0 | 0 | 0 | 0 | 0 | |||||||||||||||||||||||||||||
| Electric Distributio | 550 | 594 | 583 | 560 | 546 | 554 | 527 | 474 | 553 | 562 | 548 | 47 | 6,097 | 0.05 | |||||||||||||||||||||||||||||
| Gas | 75 | 60 | 60 | 43 | 53 | 55 | 53 | 54 | 55 | 62 | 66 | 69 | 706 | 0.01 | |||||||||||||||||||||||||||||
| Water | 1,057 | 1,149 | 1,140 | 1,166 | 973 | 1,196 | 1,200 | 1,183 | 1,192 | 1,130 | 1,259 | 833 | 13,478 | 0.11 | |||||||||||||||||||||||||||||
| Sewer | 426 | 403 | 400 | 417 | 342 | 429 | 430 | 424 | 427 | 403 | 453 | 344 | 4,898 | 0.04 | |||||||||||||||||||||||||||||
| Other Utility Expens | 0 | 0 | 0 | 0 | 0 | 0 | 0 | 0 | 0 | 0 | 379 | 0 | 379 | 0 | |||||||||||||||||||||||||||||
A-13
| FNGL706 | TWELVE MONTH SPREAD SHEET | ||||||||||||||||||||||||||||||||||||||||||
| 02 | AMRECORP REALTY FUND II | SYSTEM DATE 12/18/2006 | |||||||||||||||||||||||||||||||||||||||||
| 312 | CHIMNEY SQUARE APARTMENTS | SELECT DATE 12/18/2006 | |||||||||||||||||||||||||||||||||||||||||
| Cur. Period 12/2006 | For Period Ending | ||||||||||||||||||||||||||||||||||||||||||
| Sel. Period 12/2004 | December 31, 2004 | # Units 128 Sq. Ft.126554 | |||||||||||||||||||||||||||||||||||||||||
| DESCRIPTION | JAN | FEB | MAR | APR | MAY | JUN | JUL | AUG | SEP | OCT | NOV | DEC | Total | PSF | |||||||||||||||||||||||||||||
| Total Utilities | 3,526 | 3,396 | 3,479 | 3,218 | 2,976 | 3,549 | 6,294 | 4,042 | 3,172 | 3,201 | 3,555 | 2,088 | 42,496 | 0.34 | |||||||||||||||||||||||||||||
| Payroll | |||||||||||||||||||||||||||||||||||||||||||
| Salary & Wages | 6,753 | 5,183 | 5,290 | 4,697 | 4,629 | 4,956 | 7,767 | 5,118 | 5,273 | 10,970 | 6,430 | 11,668 | 78,734 | 0.62 | |||||||||||||||||||||||||||||
| Overtime Wages | 0 | 0 | 0 | 0 | 0 | 118 | 120 | 345 | 49 | 98 | 71 | 19 | 819 | 0.01 | |||||||||||||||||||||||||||||
| Payroll Taxes | 631 | 442 | 436 | 388 | 382 | 440 | 687 | 478 | 463 | 932 | 580 | 952 | 6,810 | 0.05 | |||||||||||||||||||||||||||||
| Workman's Comp Exp | 692 | 404 | -860 | 329 | 324 | 177 | 276 | 192 | 186 | 375 | 233 | 383 | 2,712 | 0.02 | |||||||||||||||||||||||||||||
| Health Insurance Exp | 343 | 0 | 1,110 | 401 | 387 | 406 | 416 | 274 | 276 | 272 | 278 | 413 | 4,576 | 0.04 | |||||||||||||||||||||||||||||
| Leasing Costs | 196 | 150 | 100 | 77 | 81 | 239 | 373 | 260 | 251 | 507 | 315 | 517 | 3,065 | 0.02 | |||||||||||||||||||||||||||||
| Contract Cleaning | 266 | 154 | 280 | 170 | 270 | 260 | 290 | 260 | 60 | 160 | 30 | 40 | 2,240 | 0.02 | |||||||||||||||||||||||||||||
| Contract Labor | 0 | 0 | 0 | 0 | 0 | 0 | 0 | 0 | 308 | 0 | 0 | 0 | 308 | 0 | |||||||||||||||||||||||||||||
| Total Payroll | 8,881 | 6,333 | 6,356 | 6,062 | 6,073 | 6,596 | 9,929 | 6,927 | 6,866 | 13,314 | 7,937 | 13,992 | 99,266 | 0.78 | |||||||||||||||||||||||||||||
| Property Taxes | |||||||||||||||||||||||||||||||||||||||||||
| Real Estate Taxes | 9,750 | 9,750 | 9,750 | 9,750 | 9,750 | 9,750 | 9,750 | 9,750 | 9,500 | 9,500 | 9,500 | 11,504 | 118,004 | 0.93 | |||||||||||||||||||||||||||||
| Insurance | |||||||||||||||||||||||||||||||||||||||||||
| Insurance Settlement | 0 | 6,200 | 0 | 0 | 0 | 0 | 0 | 0 | 0 | 0 | 0 | 0 | 6,200 | 0.05 | |||||||||||||||||||||||||||||
| Property Insurance | 3,122 | 3,122 | 3,122 | 3,122 | 1,874 | 2,830 | 2,795 | 2,795 | 2,795 | 2,795 | 2,795 | 7,016 | 38,183 | 0.3 | |||||||||||||||||||||||||||||
| Total Insurance | 3,122 | 9,322 | 3,122 | 3,122 | 1,874 | 2,830 | 2,795 | 2,795 | 2,795 | 2,795 | 2,795 | 7,016 | 44,383 | 0.35 | |||||||||||||||||||||||||||||
| Management Fees | 3,552 | 3,626 | 3,730 | 3,908 | 3,881 | 3,700 | 4,469 | 3,824 | 4,039 | 4,039 | 3,809 | 4,037 | 46,615 | 0.37 | |||||||||||||||||||||||||||||
| Maintenance & Repairs | |||||||||||||||||||||||||||||||||||||||||||
| HVAC-Air Cond&Heat | 0 | 0 | 155 | 355 | 329 | 504 | 140 | 205 | 422 | 245 | 77 | 38 | 2,470 | 0.02 | |||||||||||||||||||||||||||||
| Locks & Keys | 0 | 15 | 47 | 216 | 19 | 0 | -49 | 0 | 104 | 42 | 0 | 4 | 398 | 0 | |||||||||||||||||||||||||||||
| Screens & Glass | 0 | 0 | 0 | 0 | 0 | 0 | 0 | 0 | 0 | 137 | 17 | 13 | 167 | 0 | |||||||||||||||||||||||||||||
| Lumber & Carpentry | 26 | 111 | 47 | 32 | 36 | 0 | 0 | 5 | 78 | 75 | 48 | 58 | 516 | 0 | |||||||||||||||||||||||||||||
A-14
| FNGL706 | TWELVE MONTH SPREAD SHEET | ||||||||||||||||||||||||||||||||||||||||||
| 02 | AMRECORP REALTY FUND II | SYSTEM DATE 12/18/2006 | |||||||||||||||||||||||||||||||||||||||||
| 312 | CHIMNEY SQUARE APARTMENTS | SELECT DATE 12/18/2006 | |||||||||||||||||||||||||||||||||||||||||
| Cur. Period 12/2006 | For Period Ending | ||||||||||||||||||||||||||||||||||||||||||
| Sel. Period 12/2004 | December 31, 2004 | # Units 128 Sq. Ft.126554 | |||||||||||||||||||||||||||||||||||||||||
| DESCRIPTION | JAN | FEB | MAR | APR | MAY | JUN | JUL | AUG | SEP | OCT | NOV | DEC | Total | PSF | |||||||||||||||||||||||||||||
| Interior Painting | 200 | 238 | 255 | 0 | 0 | 0 | 508 | 232 | 0 | 168 | 0 | 0 | 1,600 | 0.01 | |||||||||||||||||||||||||||||
| Carpet Cleaning | 168 | 60 | 0 | 370 | 254 | 320 | 175 | 260 | 0 | 275 | 0 | 189 | 2,071 | 0.02 | |||||||||||||||||||||||||||||
| Plumbing | 0 | 231 | 187 | 63 | 177 | 128 | 38 | 185 | 327 | 331 | 476 | 125 | 2,267 | 0.02 | |||||||||||||||||||||||||||||
| Appliance Repairs-Mi | 0 | 0 | 45 | 0 | 0 | 7 | 5 | 31 | 84 | 15 | 41 | 0 | 229 | 0 | |||||||||||||||||||||||||||||
| Electrical Repairs | 0 | 10 | 59 | 228 | 87 | 38 | 19 | 26 | 77 | 53 | 114 | 162 | 873 | 0.01 | |||||||||||||||||||||||||||||
| Pool Maintenance | 0 | 0 | 0 | 33 | 0 | 13 | 206 | 0 | 13 | 152 | -35 | 9 | 390 | 0 | |||||||||||||||||||||||||||||
| Grounds Maintenance | 0 | 21 | 0 | 4 | 0 | 487 | 0 | 0 | 0 | 140 | 429 | 0 | 1,080 | 0.01 | |||||||||||||||||||||||||||||
| Parking Lot Repair-M | 0 | 0 | 0 | 0 | 0 | 0 | 0 | 0 | 0 | 49 | 0 | 0 | 49 | 0 | |||||||||||||||||||||||||||||
| Surface Repairs | 0 | 0 | 0 | 0 | 0 | 0 | 0 | 100 | 0 | 0 | 0 | 0 | 100 | 0 | |||||||||||||||||||||||||||||
| Small Tool | 0 | 1 | 0 | 0 | 0 | 0 | 0 | 0 | 0 | 0 | 0 | 94 | 95 | 0 | |||||||||||||||||||||||||||||
| Small Appliance | 0 | 240 | 166 | 0 | 58 | 42 | 0 | 0 | 117 | 113 | 88 | 156 | 981 | 0.01 | |||||||||||||||||||||||||||||
| Carpet Repair & Dyin | 0 | 86 | 0 | 76 | 0 | 0 | 0 | 0 | 0 | 48 | 0 | 0 | 210 | 0 | |||||||||||||||||||||||||||||
| Laundry Equipment | 0 | 205 | 0 | 136 | 95 | 0 | 0 | 0 | 0 | 7 | 12 | 62 | 517 | 0 | |||||||||||||||||||||||||||||
| Garage Carport & Gat | 0 | 0 | 0 | 23 | 443 | 152 | 91 | 0 | 0 | 0 | 526 | 0 | 1,235 | 0.01 | |||||||||||||||||||||||||||||
| Make Ready Contract | 0 | 0 | 0 | 0 | 0 | 0 | 0 | 315 | 774 | 392 | 0 | 0 | 1,481 | 0.01 | |||||||||||||||||||||||||||||
| Total Maintenance & Re | 394 | 1,218 | 961 | 1,536 | 1,498 | 1,691 | 1,133 | 1,359 | 1,996 | 2,242 | 1,793 | 910 | 16,731 | 0.13 | |||||||||||||||||||||||||||||
| Major Item Repairs | |||||||||||||||||||||||||||||||||||||||||||
| Hot Water Heaters | 228 | 253 | 0 | 0 | 0 | 0 | 257 | 0 | 0 | 0 | 524 | (1,261 | ) | 0 | 0 | ||||||||||||||||||||||||||||
| HVAC Air Cond&Heat | 0 | 0 | 1,139 | 647 | 0 | 1,031 | 0 | 569 | 647 | 0 | 0 | (4,034 | ) | 0 | 0 | ||||||||||||||||||||||||||||
| Roof Repairs | 0 | 0 | 0 | 0 | 0 | 0 | 0 | 0 | 0 | 11,196 | 11,196 | (22,376 | ) | 16 | 0 | ||||||||||||||||||||||||||||
| Appliances | 0 | 247 | 0 | 0 | 0 | 429 | 0 | 1,448 | 0 | 0 | 0 | (2,123 | ) | 0 | 0 | ||||||||||||||||||||||||||||
| Floor Covering | 1,793 | 867 | 3,112 | 2,007 | 193 | 0 | 864 | 5,303 | 19 | 0 | 1,862 | (16,020 | ) | 0 | 0 | ||||||||||||||||||||||||||||
| Window Covering | 0 | 22 | 106 | 129 | 140 | 0 | 0 | 13 | 0 | 0 | 83 | 0 | 492 | 0 | |||||||||||||||||||||||||||||
| Exterior Painting | 0 | 0 | 0 | 0 | 0 | 0 | 0 | 0 | 0 | 9,755 | 9,755 | 19,510 | 39,020 | 0.31 | |||||||||||||||||||||||||||||
| Equipment Rental | 0 | 0 | 0 | 654 | 0 | 0 | 0 | 0 | 0 | 728 | 0 | 0 | 1,382 | 0.01 | |||||||||||||||||||||||||||||
| Major Patio/Fence Re | 0 | 917 | 0 | 0 | 0 | 0 | 0 | 0 | 0 | 8,431 | 8,431 | (17,779 | ) | 0 | 0 | ||||||||||||||||||||||||||||
| Carpentry Repairs | 345 | 4,529 | 2,634 | 6,820 | 4,013 | 735 | 1,771 | 1,944 | -7 | 5,734 | 5,734 | (10,330 | ) | 23,922 | 0.19 | ||||||||||||||||||||||||||||
A-15
| FNGL706 | TWELVE MONTH SPREAD SHEET | ||||||||||||||||||||||||||||||||||||||||||
| 02 | AMRECORP REALTY FUND II | SYSTEM DATE 12/18/2006 | |||||||||||||||||||||||||||||||||||||||||
| 312 | CHIMNEY SQUARE APARTMENTS | SELECT DATE 12/18/2006 | |||||||||||||||||||||||||||||||||||||||||
| Cur. Period 12/2006 | For Period Ending | ||||||||||||||||||||||||||||||||||||||||||
| Sel. Period 12/2004 | December 31, 2004 | # Units 128 Sq. Ft.126554 | |||||||||||||||||||||||||||||||||||||||||
| DESCRIPTION | JAN | FEB | MAR | APR | MAY | JUN | JUL | AUG | SEP | OCT | NOV | DEC | Total | PSF | |||||||||||||||||||||||||||||
| Floor Repair-Major | 0 | 0 | 0 | 102 | 0 | 0 | 0 | 0 | 0 | 0 | 0 | 0 | 102 | 0 | |||||||||||||||||||||||||||||
| Major Plumbing / Ele | 2,238 | 0 | 0 | 2,080 | 0 | 0 | 0 | 0 | 0 | 0 | 0 | 0 | 4,318 | 0.03 | |||||||||||||||||||||||||||||
| Total Major Item Repai | 4,604 | 6,835 | 6,991 | 12,439 | 4,346 | 2,195 | 2,892 | 9,277 | 659 | 35,844 | 37,585 | (54,413 | ) | 69,254 | 0.55 | ||||||||||||||||||||||||||||
| Contract Services | |||||||||||||||||||||||||||||||||||||||||||
| Lawn Care | 1,299 | 1,299 | 1,299 | 1,299 | 1,299 | 1,299 | 1,299 | 1,299 | 1,299 | 1,299 | 1,299 | 1,299 | 15,588 | 0.12 | |||||||||||||||||||||||||||||
| Patrol Service | 150 | 150 | 150 | 150 | 150 | 150 | 150 | 150 | 150 | 150 | 150 | 150 | 1,800 | 0.01 | |||||||||||||||||||||||||||||
| Rubbish | 581 | 581 | 581 | 581 | 581 | 581 | 581 | 581 | 581 | 628 | 628 | 603 | 7,091 | 0.06 | |||||||||||||||||||||||||||||
| Pest Control | 108 | 108 | 108 | 108 | 5,813 | 108 | 108 | 108 | 433 | 108 | 217 | 108 | 7,437 | 0.06 | |||||||||||||||||||||||||||||
| Cable Television | 1,955 | 1,955 | 1,955 | 1,955 | 1,955 | 1,955 | 1,955 | 1,955 | 2,151 | 2,053 | 2,053 | 4,106 | 26,003 | 0.21 | |||||||||||||||||||||||||||||
| Total Contract Service | 4,093 | 4,093 | 4,093 | 4,093 | 9,798 | 4,093 | 4,093 | 4,093 | 4,614 | 4,238 | 4,347 | 6,266 | 57,914 | 0.46 | |||||||||||||||||||||||||||||
| Supplies | |||||||||||||||||||||||||||||||||||||||||||
| Pool Supplies | 0 | 0 | 0 | 122 | 0 | 117 | (13 | ) | 0 | 88 | 0 | 35 | 0 | 351 | 0 | ||||||||||||||||||||||||||||
| Cleaning Supplies | 57 | 6 | 16 | 45 | 0 | 21 | 27 | 0 | 21 | 0 | 26 | 70 | 290 | 0 | |||||||||||||||||||||||||||||
| Pest Control Supplie | 0 | 0 | 0 | 24 | 0 | 0 | 0 | 0 | 0 | 0 | 11 | 0 | 35 | 0 | |||||||||||||||||||||||||||||
| Paint & Wallpaper Su | 282 | (15 | ) | 458 | 14 | 64 | 0 | 196 | 112 | 180 | 64 | 64 | 98 | 1,515 | 0.01 | ||||||||||||||||||||||||||||
| Filters | 0 | 99 | 0 | 79 | 0 | 79 | 0 | 0 | 95 | 0 | 68 | 0 | 420 | 0 | |||||||||||||||||||||||||||||
| Light Bulbs | 26 | 90 | 17 | 97 | 0 | 35 | 0 | 0 | 49 | 32 | 18 | 67 | 430 | 0 | |||||||||||||||||||||||||||||
| Total Supplies | 365 | 180 | 491 | 381 | 64 | 252 | 210 | 112 | 433 | 96 | 222 | 235 | 3,041 | 0.02 | |||||||||||||||||||||||||||||
| Advertising & Promotio | |||||||||||||||||||||||||||||||||||||||||||
| Other Advertising | 0 | 69 | 164 | 354 | 69 | 69 | 164 | 69 | 259 | 233 | 95 | 259 | 1,804 | 0.01 | |||||||||||||||||||||||||||||
| On-Site Printed Mate | 0 | 0 | 0 | 0 | 0 | 0 | 0 | 0 | 0 | 13 | 0 | 0 | 13 | 0 | |||||||||||||||||||||||||||||
| Promotion | 0 | 0 | 0 | 0 | 0 | 0 | 0 | 0 | 0 | 0 | 18 | 168 | 186 | 0 | |||||||||||||||||||||||||||||
| Licenses | 0 | 0 | 0 | 0 | 0 | 0 | 50 | 0 | 0 | 0 | 0 | 37 | 87 | 0 | |||||||||||||||||||||||||||||
| Film & Processing | 0 | 5 | 5 | 0 | 0 | 0 | 6 | 0 | 0 | 0 | 0 | 16 | 33 | 0 | |||||||||||||||||||||||||||||
A-16
| FNGL706 | TWELVE MONTH SPREAD SHEET | ||||||||||||||||||||||||||||||||||||||||||
| FNGL706 | TWELVE MONTH SPREAD SHEET | ||||||||||||||||||||||||||||||||||||||||||
| 02 | AMRECORP REALTY FUND II | SYSTEM DATE 12/18/2006 | |||||||||||||||||||||||||||||||||||||||||
| 312 | CHIMNEY SQUARE APARTMENTS | SELECT DATE 12/18/2006 | |||||||||||||||||||||||||||||||||||||||||
| Cur. Period 12/2006 | For Period Ending | ||||||||||||||||||||||||||||||||||||||||||
| Sel. Period 12/2004 | December 31, 2004 | # Units 128 Sq. Ft.126554 | |||||||||||||||||||||||||||||||||||||||||
| DESCRIPTION | JAN | FEB | MAR | APR | MAY | JUN | JUL | AUG | SEP | OCT | NOV | DEC | Total | PSF | |||||||||||||||||||||||||||||
| Total Advertising & Pr | 0 | 74 | 169 | 354 | 69 | 69 | 220 | 69 | 259 | 246 | 113 | 480 | 2,122 | 0.02 | |||||||||||||||||||||||||||||
| Administration | |||||||||||||||||||||||||||||||||||||||||||
| Printed Forms & Lett | 7 | 23 | 10 | 23 | 3 | 52 | 5 | 53 | 57 | 14 | 31 | 9 | 286 | 0 | |||||||||||||||||||||||||||||
| Office Supplies | 85 | 91 | 45 | 0 | 0 | 148 | 99 | 0 | 0 | 0 | 62 | 314 | 843 | 0.01 | |||||||||||||||||||||||||||||
| Telephone | 189 | 285 | 143 | 171 | 269 | 185 | 176 | 319 | 184 | 208 | 278 | 175 | 2,583 | 0.02 | |||||||||||||||||||||||||||||
| Answering Service | 24 | 24 | 24 | 24 | 24 | 24 | 24 | 24 | 24 | 24 | 24 | 24 | 285 | 0 | |||||||||||||||||||||||||||||
| Credit Reporting | 52 | 246 | 235 | 345 | 84 | 70 | 187 | 294 | 103 | 132 | 15 | 229 | 1,993 | 0.02 | |||||||||||||||||||||||||||||
| Computer Service | 128 | 128 | 128 | 128 | 128 | 128 | 128 | 128 | 128 | 128 | 128 | 128 | 1,536 | 0.01 | |||||||||||||||||||||||||||||
| Office Equipment Rep | 0 | 0 | 0 | 0 | 0 | 0 | 0 | 0 | 0 | 0 | 0 | 16 | 16 | 0 | |||||||||||||||||||||||||||||
| Legal | 0 | 0 | 113 | 285 | 0 | 147 | 0 | 23 | 3 | 23 | 0 | 117 | 711 | 0.01 | |||||||||||||||||||||||||||||
| Travel | 0 | 0 | 80 | 40 | 0 | 0 | 0 | 153 | 0 | 113 | 0 | 121 | 507 | 0 | |||||||||||||||||||||||||||||
| Postage & Handling | 5 | 48 | 20 | 4 | 0 | 10 | 112 | 0 | 11 | 13 | 5 | 208 | 434 | 0 | |||||||||||||||||||||||||||||
| Internet Access Char | 47 | 47 | 47 | 47 | 47 | 63 | 63 | 63 | 63 | 63 | 63 | 63 | 673 | 0.01 | |||||||||||||||||||||||||||||
| Bookeeping Fees | 128 | 128 | 128 | 128 | 128 | 128 | 128 | 128 | 128 | 128 | 128 | 128 | 1,536 | 0.01 | |||||||||||||||||||||||||||||
| Other Professional F | 0 | 0 | 0 | 154 | 1,025 | 54 | 0 | 0 | 54 | 0 | 113 | 1,724 | 3,125 | 0.02 | |||||||||||||||||||||||||||||
| Employee Training | 0 | 0 | 0 | 0 | 0 | 0 | 130 | 0 | 0 | 0 | 0 | 0 | 130 | 0 | |||||||||||||||||||||||||||||
| Meals & Entertainmen | 0 | 14 | 0 | 0 | 0 | 0 | 0 | 23 | 0 | 0 | 0 | 65 | 102 | 0 | |||||||||||||||||||||||||||||
| Other Administrative | 11 | 14 | 15 | 13 | 13 | 14 | 14 | 71 | 47 | 12 | 12 | 163 | 399 | 0 | |||||||||||||||||||||||||||||
| Total Administrative E | 676 | 1,048 | 988 | 1,362 | 1,721 | 1,023 | 1,066 | 1,279 | 802 | 858 | 859 | 3,484 | 15,166 | 0.12 | |||||||||||||||||||||||||||||
| Miscellaneous Expense | |||||||||||||||||||||||||||||||||||||||||||
| Uniforms | 0 | 0 | 0 | 0 | 0 | 0 | 0 | 135 | 12 | 0 | 26 | 0 | 172 | 0 | |||||||||||||||||||||||||||||
| Pagers | 12 | 110 | 0 | 0 | 0 | 0 | 0 | 98 | 0 | 0 | 0 | 0 | 219 | 0 | |||||||||||||||||||||||||||||
| Total Miscellaneous Ex | 12 | 110 | 0 | 0 | 0 | 0 | 0 | 233 | 12 | 0 | 26 | 0 | 393 | 0 | |||||||||||||||||||||||||||||
| Total Direct Expenses | 38,975 | 45,985 | 40,130 | 46,225 | 42,050 | 35,748 | 42,851 | 43,760 | 35,147 | 76,373 | 72,541 | (4,401 | ) | 515,384 | 4.07 | ||||||||||||||||||||||||||||
A-17
| FNGL706 | TWELVE MONTH SPREAD SHEET | ||||||||||||||||||||||||||||||||||||||||||
| 02 | AMRECORP REALTY FUND II | SYSTEM DATE 12/18/2006 | |||||||||||||||||||||||||||||||||||||||||
| 312 | CHIMNEY SQUARE APARTMENTS | SELECT DATE 12/18/2006 | |||||||||||||||||||||||||||||||||||||||||
| Cur. Period 12/2006 | For Period Ending | ||||||||||||||||||||||||||||||||||||||||||
| Sel. Period 12/2004 | December 31, 2004 | # Units 128 Sq. Ft.126554 | |||||||||||||||||||||||||||||||||||||||||
| DESCRIPTION | JAN | FEB | MAR | APR | MAY | JUN | JUL | AUG | SEP | OCT | NOV | DEC | Total | PSF | |||||||||||||||||||||||||||||
| Net Operating Income | 32,071 | 26,540 | 34,462 | 31,938 | 35,567 | 38,260 | 46,531 | 32,717 | 45,643 | 4,410 | 3,650 | 85,143 | 416,932 | 3.29 | |||||||||||||||||||||||||||||
| Financial Expenses | |||||||||||||||||||||||||||||||||||||||||||
| First Mortgage Inter | 16,574 | 16,537 | 16,500 | 16,462 | 16,425 | 16,386 | 16,348 | 16,309 | 16,270 | 16,231 | 16,192 | 14,545 | 194,780 | 1.54 | |||||||||||||||||||||||||||||
| Amortization Of Loan | 570 | 570 | 570 | 570 | 570 | 570 | 570 | 570 | 570 | 570 | 570 | 1,711 | 7,983 | 0.06 | |||||||||||||||||||||||||||||
| Total Financial Expens | 17,144 | 17,107 | 17,070 | 17,032 | 16,995 | 16,956 | 16,918 | 16,879 | 16,840 | 16,801 | 16,762 | 16,256 | 202,760 | 1.6 | |||||||||||||||||||||||||||||
| Depr Building & Impr | 2,500 | 2,500 | 2,500 | 2,500 | 2,500 | 2,500 | 2,500 | 2,500 | 2,500 | 2,500 | 2,500 | 6,891 | 34,391 | 0.27 | |||||||||||||||||||||||||||||
| Total Depreciation Exp | 2,500 | 2,500 | 2,500 | 2,500 | 2,500 | 2,500 | 2,500 | 2,500 | 2,500 | 2,500 | 2,500 | 6,891 | 34,391 | 0.27 | |||||||||||||||||||||||||||||
| Net Taxable Income | 12,427 | 6,933 | 14,892 | 12,406 | 16,072 | 18,804 | 27,113 | 13,338 | 26,303 | (14,891 | ) | (15,612 | ) | 61,996 | 179,781 | 1.42 | |||||||||||||||||||||||||||
A-18
ADDENDUM “B” Site & Improvement Exhibits |
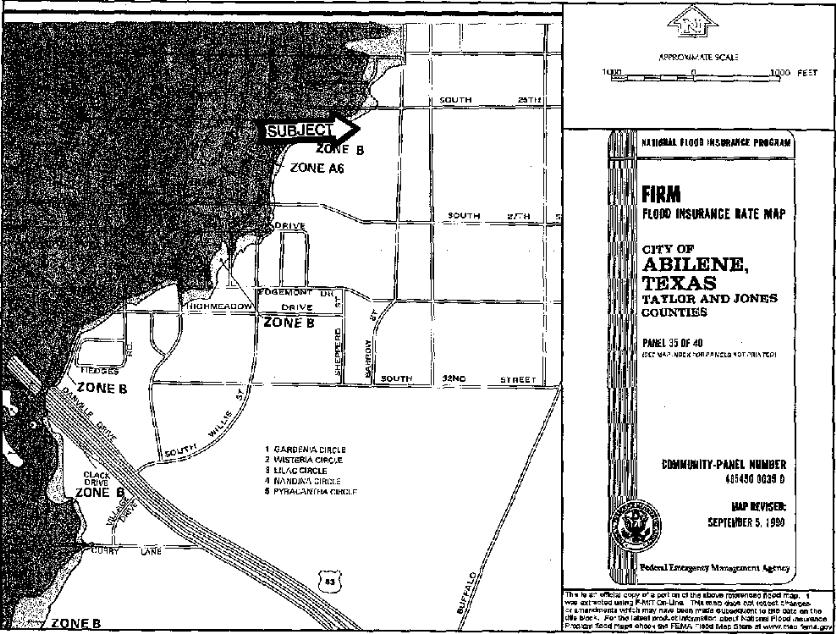
CITY OF
ABILENE, TEXAS
TAYLOR AND JONES COITNTIFis
PAMEL 35 OF 40
,oar MaPINOE% FVa aAR£LS NPTPRINTEPI
MAP REVISED: SEPTEMBER 5, 1000
SOUTH 27TH
NAIIOMAL FLOOD INSURANCE PROGRAM
FIW
FLOOD INSURANCE RATE MAP
Thla 5 &1 eScIai popy of a porllon o11FM ahaue referenced IleEd map. t
eeIracled reVng FO Um Thtnmep tlaee not select ytdnpaa
amerdmerda which may has been the suhe041ent IS ma Wle on the
55. Nark. For the latent pre(lvotiMbfinetlM] about Nadw,al Moed]naraenee
Prpgayry need maps cheek the FEMA Fleed Map Steve at wxw.m.o.fema.oev
Zs E B
ZONE. A6
32ND STREET
1 GARDENIA CIRCLE
2 WIS7ERIACIRC4E
3 LILAC CIRCLE
4 NANRINA CIRCLE
5 PYRACANTHA CIRCLE
COMMUNITY-PANEL NUMBER 495450 0035 0
SOUTH
25TH
FLOOD MAPB-1
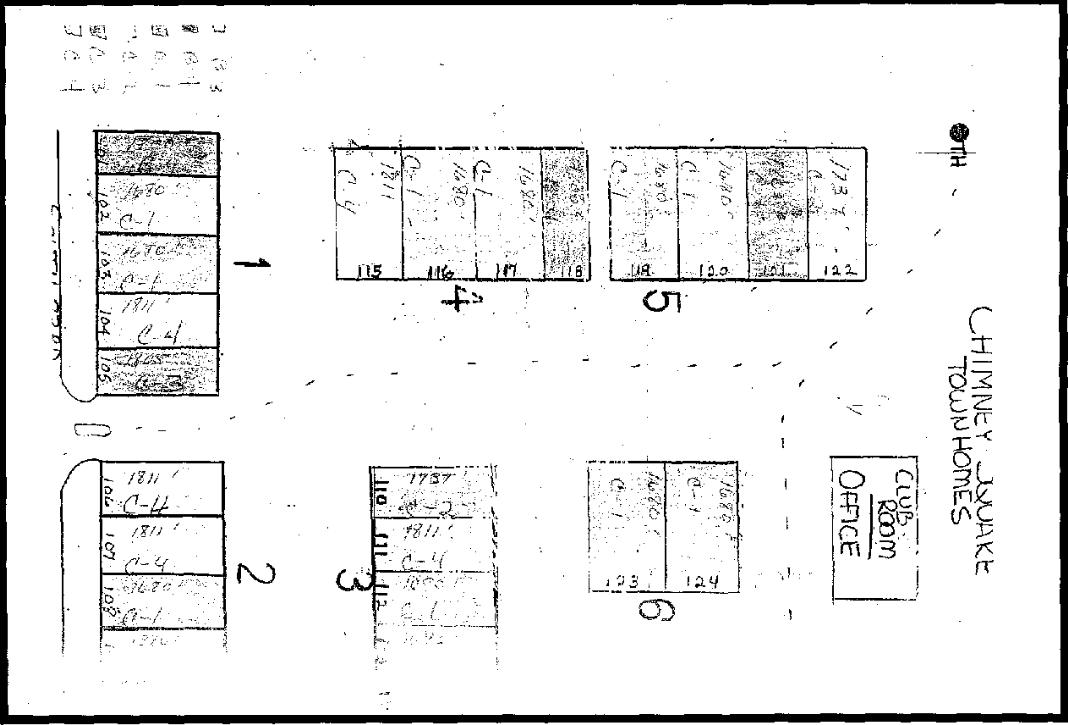
SITE PLAN
B-2
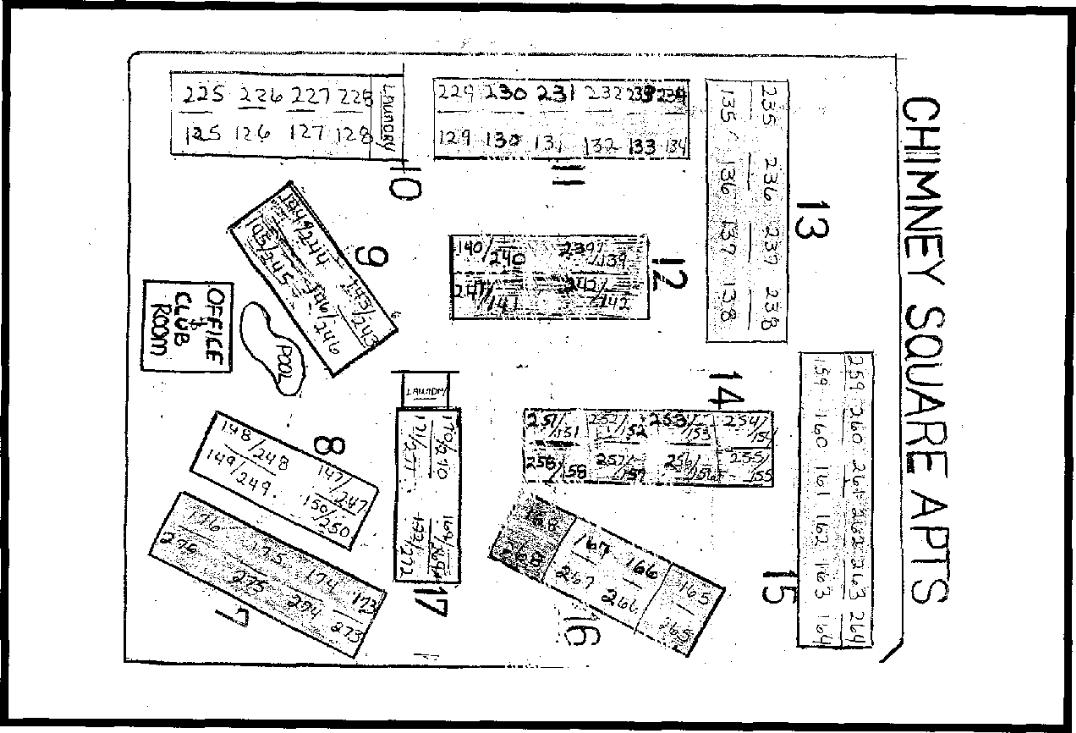
SITE PLAN
B-3
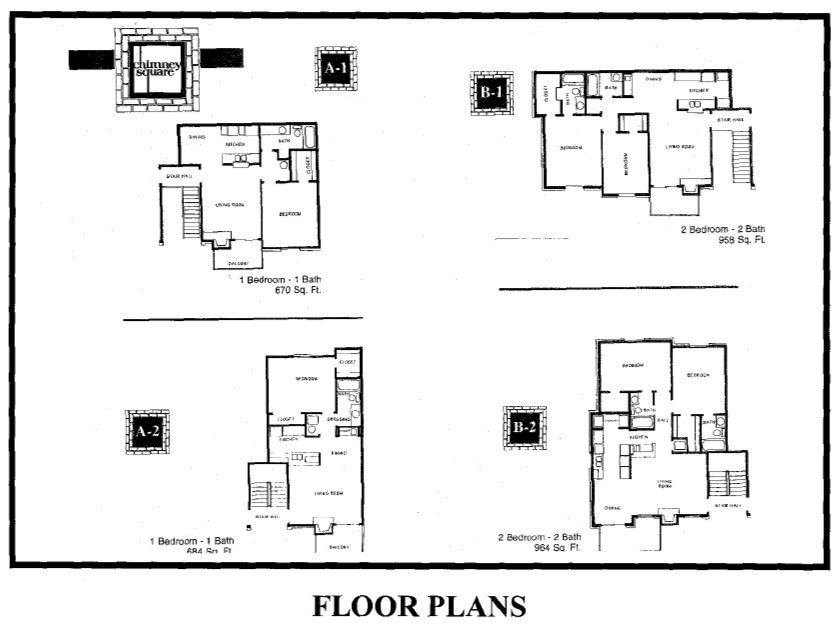
B-4
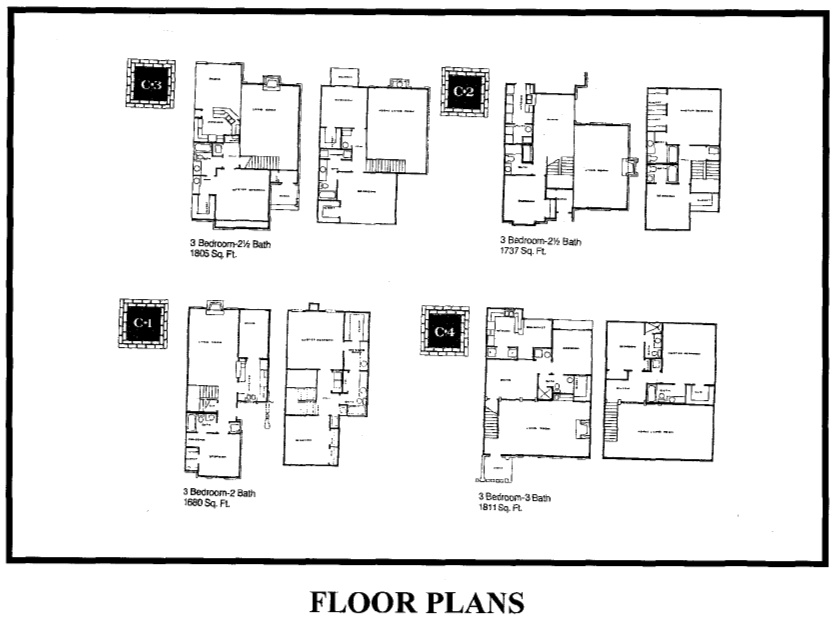
B-5
ADDENDUM “C’ Fee Agreement |
DEVERICK & ASSOCIATES, INC AUSTIN • DALLAS • HOUSTON • OKLAHOMA CITY • SAN ANTONIO • TULSA www.deverick.com | ||
December 11, 2006
Mr. David Bower
Senior Vice President Univesco
Re: Proposal to prepare a Self Contained Appraisal report of the "As Is" Market Value of an apartment complex known as Chimney Square located in Abilene, Texas.
Dear Mr. John Weir:
We are herewith confirming engagement for preparing an appraisal report on the above referenced property. The purpose of our assignment will be to estimate the Fee Simple Estate Market Value, to serve as a basis for asset evaluation and loan underwriting.
Value Definition - The value definition used in the appraisal report will be that of Market Value. Market Value is defined as the most probable price which a property should bring in a competitive and open market under all conditions requisite to a fair sale, the buyer and seller, each acting prudently, knowledgeably and assuming the price is not affected by undue stimulus. Implicit in this definition is consummation of a sale as of a specified date and passing of title from seller to buyer under conditions whereby:
| - | buyer and seller are typically motivated; |
| - | both parties are well informed or well advised, and each acting in what he considers his own best interest; |
| - | a reasonable time is allowed for exposure in the open market; |
| - | payment is made in terms of cash in U.S. dollars or in terms of financial arrangements comparable thereto; and |
| - | the price represents the normal consideration for the property sold unaffected by special or creative financing or sale concessions granted by anyone associated with the sale. |
Property Rights Appraised - The property rights appraised are those commonly referred to as Fee Simple Estate. Fee Simple Estate may be briefly defined as absolute ownership unencumbered by any other interest or estate subject only to the four powers of government.
COMMERCIAL REAL ESTATE APPRAISAL, BROKERAGE & CONSULTING
Dallas Office • 5420 LB3 Freeway, Suite 1335, Dallas, Texas 75240 • (972) 45&0001 • Fax (214) 550-2594
WWW.DEVERICK. COM
Ms. David Bower
December 11, 2006
Page 2 of 2
Regulatory Conformity - The report will be prepared in conformity with the Code of Professional Ethics and Standards of Professional Practice of the Appraisal Institute, USPAP, FIRREA and subject to our standard Statement of Basic Assumptions and Limiting Conditions (please refer to the attached pages for a copy of our Statement of Basic Assumptions and Limiting Conditions). The compensation is not subject to a requested minimum value, a specific value, or the approval of a loan, and the report is subject to peer review by duly authorized members of the Appraisal Institute.
Compensation - We propose to provide you with three (3)copies of the final appraisal report by January 2, 2006. The total fee for the appraisal is $3,500. The method of payment for the assignment is: (I) $0 to be paid as a retainer on the appraisal and (2) the balance of $3,500 is due upon your receipt of the completed report.
Should it become necessary for you to terminate this assignment during our preparation, you will be billed for our time at the rate of $1,200 per day plus expenses. Please note that the appraisal fee is inclusive of travel and other miscellaneous charges relating to the preparation of the original appraisal report. If we are notified upon your request to give a deposition and/or to testify in court, our fee for services rendered is $250 per hour.
If the terms and conditions are acceptable to you, please return a signed copy of this proposal to my Dallas office. Should there be a need for further discussion, I trust you will contact us. Thank you for considering our firm, and we look forward to undertaking the assignment and completing it to your total satisfaction.
Respectfully submitted,
John D. Jordan, MAI
President
Agreed to and Accepted this 11th day of December, 2006
By ______________________
Mr. David Bower